Attached files
| file | filename |
|---|---|
| EX-32.02 - EXHIBIT 32.02 - HARTFORD FINANCIAL SERVICES GROUP, INC. | hig3312018-10xqex3202.htm |
| EX-32.01 - EXHIBIT 32.01 - HARTFORD FINANCIAL SERVICES GROUP, INC. | hig3312018-10xqex3201.htm |
| EX-31.02 - EXHIBIT 31.02 - HARTFORD FINANCIAL SERVICES GROUP, INC. | hig3312018-10xqex3102.htm |
| EX-31.01 - EXHIBIT 31.01 - HARTFORD FINANCIAL SERVICES GROUP, INC. | hig3312018-10xqex3101.htm |
| EX-15.01 - EXHIBIT 15.01 - HARTFORD FINANCIAL SERVICES GROUP, INC. | hig3312018-10xqex1501.htm |
| EX-10.02 - EXHIBIT 10.02 - HARTFORD FINANCIAL SERVICES GROUP, INC. | hig3312018-10xqex1002.htm |
UNITED STATES
SECURITIES AND EXCHANGE COMMISSION
Washington, D.C. 20549
____________________________________
FORM 10-Q
____________________________________
(Mark One)
ý | QUARTERLY REPORT PURSUANT TO SECTION 13 OR 15(d) OF THE SECURITIES EXCHANGE ACT OF 1934 |
For the quarterly period ended March 31, 2018
or
¨ | TRANSITION REPORT PURSUANT TO SECTION 13 OR 15(d) OF THE SECURITIES EXCHANGE ACT OF 1934 |
For the transition period from ____________ to ______________
Commission file number 001-13958
____________________________________

THE HARTFORD FINANCIAL SERVICES GROUP, INC.
(Exact name of registrant as specified in its charter)
Delaware | 13-3317783 | |
(State or other jurisdiction of incorporation or organization) | (I.R.S. Employer Identification No.) | |
One Hartford Plaza, Hartford, Connecticut 06155
(Address of principal executive offices) (Zip Code)
(860) 547-5000
(Registrant’s telephone number, including area code)
Indicate by check mark: | Yes | No | |
• whether the registrant (1) has filed all reports required to be filed by Section 13 or 15(d) of the Securities Exchange Act of 1934 during the preceding 12 months (or for such shorter period that the registrant was required to file such reports), and (2) has been subject to such filing requirements for the past 90 days. | ý | ¨ | |
• whether the registrant has submitted electronically and posted on its corporate Web site, if any, every Interactive Data File required to be submitted and posted pursuant to Rule 405 of Regulation S-T during the preceding 12 months (or for such shorter period that the registrant was required to submit and post such files). | ý | ¨ | |
• whether the registrant is a large accelerated filer, an accelerated filer, a non-accelerated filer, a smaller reporting company, or an emerging growth company. See definitions of “large accelerated filer,” “accelerated filer,” “smaller reporting company” and "emerging growth company" in Rule 12b-2 of the Exchange Act. | |||
Large accelerated filer x | Accelerated filer ¨ | Non-accelerated filer ¨ | Smaller reporting company ¨ | Emerging growth company ¨ |
If an emerging growth company, indicate by check mark if the registrant has elected not to use the extended transition period for complying with any new or revised financial accounting standards provided pursuant to Section 13(a) of the Exchange Act. ¨
• whether the registrant is a shell company (as defined in Rule 12b-2 of the Exchange Act.) | ¨ | ý | |
As of April 24, 2018, there were outstanding 358,139,192 shares of Common Stock, $0.01 par value per share, of the registrant.
1
THE HARTFORD FINANCIAL SERVICES GROUP, INC.
QUARTERLY REPORT ON FORM 10-Q
FOR THE QUARTERLY PERIOD ENDED MARCH 31, 2018
TABLE OF CONTENTS
Item | Description | Page |
1. | FINANCIAL STATEMENTS | |
REPORT OF INDEPENDENT REGISTERED PUBLIC ACCOUNTING FIRM | ||
CONDENSED CONSOLIDATED STATEMENTS OF OPERATIONS - FOR THE THREE MONTHS ENDED MARCH 31, 2018 AND 2017 | ||
CONDENSED CONSOLIDATED STATEMENTS OF COMPREHENSIVE INCOME (LOSS) - FOR THE THREE MONTHS ENDED MARCH 31, 2018 AND 2017 | ||
CONDENSED CONSOLIDATED BALANCE SHEETS - AS OF MARCH 31, 2018 AND DECEMBER 31, 2017 | ||
CONDENSED CONSOLIDATED STATEMENTS OF CHANGES IN STOCKHOLDERS' EQUITY - FOR THE THREE MONTHS ENDED MARCH 31, 2018 AND 2017 | ||
CONDENSED CONSOLIDATED STATEMENTS OF CASH FLOWS - FOR THE THREE MONTHS ENDED MARCH 31, 2018 AND 2017 | ||
NOTES TO CONDENSED CONSOLIDATED FINANCIAL STATEMENTS | ||
2. | MANAGEMENT'S DISCUSSION AND ANALYSIS OF FINANCIAL CONDITION AND RESULTS OF OPERATIONS | |
3. | QUANTITATIVE AND QUALITATIVE DISCLOSURES ABOUT MARKET RISK | [a] |
4. | CONTROLS AND PROCEDURES | |
1. | LEGAL PROCEEDINGS | |
1A. | RISK FACTORS | |
2. | UNREGISTERED SALES OF EQUITY SECURITIES AND USE OF PROCEEDS | |
6. | EXHIBITS | |
EXHIBITS INDEX | ||
SIGNATURE | ||
[a]The information required by this item is set forth in the Enterprise Risk Management section of Item 2, Management's Discussion and Analysis of Financial Condition and Results of Operations and is incorporated herein by reference.
2
Forward-Looking Statements
Certain of the statements contained herein are forward-looking statements made pursuant to the safe harbor provisions of the Private Securities Litigation Reform Act of 1995. Forward-looking statements can be identified by words such as “anticipates,” “intends,” “plans,” “seeks,” “believes,” “estimates,” “expects,” “projects,” and similar references to future periods.
Forward-looking statements are based on management's current expectations and assumptions regarding future economic, competitive, legislative and other developments and their potential effect upon The Hartford Financial Services Group, Inc. and its subsidiaries (collectively, the "Company" or "The Hartford"). Because forward-looking statements relate to the future, they are subject to inherent uncertainties, risks and changes in circumstances that are difficult to predict. Actual results could differ materially from expectations, depending on the evolution of various factors, including the risks and uncertainties identified below, as well as factors described in such forward-looking statements or in Part I, Item 1A, Risk Factors in The Hartford’s 2017 Form 10-K Annual Report, and those identified from time to time in our other filings with the Securities and Exchange Commission ("SEC").
• | Risks Related to Economic, Political and Global Market Conditions: |
◦ | challenges related to the Company’s current operating environment, including global political, economic and market conditions, and the effect of financial market disruptions, economic downturns, trade tariffs or other potentially adverse macroeconomic developments on the demand for our products and returns in our investment portfolios; |
◦ | financial risk related to the continued reinvestment of our investment portfolios; |
◦ | market risks associated with our business, including changes in credit spreads, equity prices, interest rates, inflation rate, market volatility and foreign exchange rates; |
◦ | the impact on our investment portfolio if our investment portfolio is concentrated in any particular segment of the economy; |
• | Insurance Industry and Product-Related Risks: |
◦ | the possibility of unfavorable loss development, including with respect to long-tailed exposures; |
◦ | the possibility of a pandemic, earthquake, or other natural or man-made disaster that may adversely affect our businesses; |
◦ | weather and other natural physical events, including the severity and frequency of storms, hail, winter storms, hurricanes and tropical storms, as well as climate change and its potential impact on weather patterns; |
◦ | the possible occurrence of terrorist attacks and the Company’s inability to contain its exposure as a result of, among other factors, the inability to exclude coverage for terrorist attacks from workers' compensation policies and limitations on reinsurance coverage from the federal government under applicable laws; |
◦ | the Company’s ability to effectively price its property and casualty policies, including its ability to obtain regulatory consents to pricing actions or to non-renewal or withdrawal of certain product lines; |
◦ | actions by competitors that may be larger or have greater financial resources than we do; |
◦ | technology changes, such as usage-based methods of determining premiums, advancement in automotive safety features, the development of autonomous vehicles, and platforms that facilitate ride sharing, which may alter demand for the Company's products, impact the frequency or severity of losses, and/or impact the way the Company markets, distributes and underwrites its products; |
◦ | the Company’s ability to market, distribute and provide insurance products and investment advisory services through current and future distribution channels and advisory firms; |
◦ | the uncertain effects of emerging claim and coverage issues; |
• | Financial Strength, Credit and Counterparty Risks: |
◦ | risks to our business, financial position, prospects and results associated with negative rating actions or downgrades in the Company’s financial strength and credit ratings or negative rating actions or downgrades relating to our investments; |
◦ | the impact on our statutory capital of various factors, including many that are outside the Company’s control, which can in turn affect our credit and financial strength ratings, cost of capital, regulatory compliance and other aspects of our business and results; |
◦ | losses due to nonperformance or defaults by others, including sourcing partners, derivative counterparties and other third parties; |
◦ | the potential for losses due to our reinsurers’ unwillingness or inability to meet their obligations under reinsurance contracts and the availability, pricing and adequacy of reinsurance to protect the Company against losses; |
◦ | regulatory limitations on the ability of the Company and certain of its subsidiaries to declare and pay dividends; |
3
• | Risks Relating to Estimates, Assumptions and Valuations; |
◦ | risk associated with the use of analytical models in making decisions in key areas such as underwriting, capital management, hedging, reserving, and catastrophe risk management; |
◦ | the potential for differing interpretations of the methodologies, estimations and assumptions that underlie Company’s fair value estimates for its investments and the evaluation of other-than-temporary impairments on available-for-sale securities; |
◦ | the potential for further impairments of our goodwill or the potential for changes in valuation allowances against deferred tax assets |
◦ | the significant uncertainties that limit our ability to estimate the ultimate reserves necessary for asbestos and environmental claims; |
• | Strategic and Operational Risks: |
◦ | the Company’s ability to maintain the availability of its systems and safeguard the security of its data in the event of a disaster, cyber or other information security incident or other unanticipated event; |
◦ | the risks, challenges and uncertainties associated with our capital management plan, expense reduction initiatives and other actions, which may include acquisitions, divestitures or restructurings; |
◦ | the potential for difficulties arising from outsourcing and similar third-party relationships; |
◦ | the Company’s ability to protect its intellectual property and defend against claims of infringement; |
• | Regulatory and Legal Risks: |
◦ | the cost and other potential effects of increased regulatory and legislative developments, including those that could adversely impact the demand for the Company’s products, operating costs and required capital levels; |
◦ | unfavorable judicial or legislative developments; |
◦ | the impact of changes in federal or state tax laws; |
◦ | regulatory requirements that could delay, deter or prevent a takeover attempt that shareholders might consider in their best interests; |
◦ | the impact of potential changes in accounting principles and related financial reporting requirements; |
• | Risks Related to the Company's Life and Annuity Business in Discontinued Operations: |
◦ | the risks related to the Company's ability to close its previously announced sale of its life and annuity run-off book of business, which is subject to several closing conditions, including many that are outside of the Company's control; |
◦ | the risks related to political, economic and global economic conditions, including interest rate, equity and credit spread risks; |
◦ | the impact on our investment portfolio if our investment portfolio is concentrated in any particular segment of the economy; |
◦ | risks related to negative rating actions or downgrades in the financial strength and credit ratings of Hartford Life Insurance Company or Hartford Life and Annuity Insurance Company or negative rating actions or downgrades relating to our investments; |
◦ | the volatility in our statutory and United States ("U.S.") Generally Accepted Accounting Principles ("GAAP") earnings and potential material changes to our results resulting from our risk management program to emphasize protection of economic value; |
◦ | the potential for losses due to our reinsurers’ unwillingness or inability to meet their obligations under reinsurance contracts; |
◦ | the potential for differing interpretations of the methodologies, estimations and assumptions that underlie the fair value estimates for investments and the evaluation of other-than-temporary impairments on available for sale securities; |
◦ | the potential for further acceleration of deferred policy acquisition cost amortization and an increase in reserves for certain guaranteed benefits in our variable annuities; |
◦ | changes in federal or state tax laws that would impact the tax-favored status of life and annuity contracts; and |
◦ | changes in accounting and financial reporting of the liability for future policy benefits, including how the life and annuity businesses account for deferred acquisition costs and market risk benefits on variable annuity contracts and the discounting of life contingent fixed annuities. |
4
Any forward-looking statement made by the Company in this document speaks only as of the date of the filing of this Form 10-Q. Factors or events that could cause the Company’s actual results to differ may emerge from time to time, and it is not possible for the Company to predict all of them. The Company undertakes no obligation to publicly update any forward-looking statement, whether as a result of new information, future developments or otherwise.
5
Part I - Item 1. Financial Statements
Item 1. Financial Statements
REPORT OF INDEPENDENT REGISTERED PUBLIC ACCOUNTING FIRM
To the Board of Directors and Stockholders of
The Hartford Financial Services Group, Inc.
Hartford, Connecticut
Results of Review of Interim Financial Information
We have reviewed the accompanying condensed consolidated balance sheet of The Hartford Financial Services Group, Inc. and subsidiaries (the "Company ") as of March 31, 2018, the related condensed consolidated statements of operations, comprehensive income (loss), changes in stockholders’ equity, and cash flows for the three-month periods ended March 31, 2018 and 2017, and the related notes (collectively referred to as the "interim financial information"). Based on our reviews, we are not aware of any material modifications that should be made to the accompanying interim financial information for it to be in conformity with accounting principles generally accepted in the United States of America.
We have previously audited, in accordance with the standards of the Public Company Accounting Oversight Board (United States) (PCAOB), the consolidated balance sheet of the Company as of December 31, 2017, and the related consolidated statements of operations, comprehensive income, changes in stockholders' equity, and cash flows for the year then ended (not presented herein); and in our report dated February 23, 2018, we expressed an unqualified opinion on those consolidated financial statements. In our opinion, the information set forth in the accompanying condensed consolidated balance sheet as of December 31, 2017 is fairly stated, in all material respects, in relation to the consolidated balance sheet from which it has been derived.
Basis for Review Results
This interim financial information is the responsibility of the Company's management. We are a public accounting firm registered with the PCAOB and are required to be independent with respect to the Company in accordance with the U.S. federal securities laws and the applicable rules and regulations of the Securities and Exchange Commission and the PCAOB.
We conducted our reviews in accordance with standards of the PCAOB. A review of interim financial information consists principally of applying analytical procedures and making inquiries of persons responsible for financial and accounting matters. It is substantially less in scope than an audit conducted in accordance with the standards of the PCAOB, the objective of which is the expression of an opinion regarding the financial statements taken as a whole. Accordingly, we do not express such an opinion.
/s/ DELOITTE & TOUCHE LLP
Hartford, Connecticut
April 26, 2018
6
THE HARTFORD FINANCIAL SERVICES GROUP, INC.
Condensed Consolidated Statements of Operations
Three Months Ended March 31, | ||||||
(In millions, except for per share data) | 2018 | 2017 | ||||
(Unaudited) | ||||||
Revenues | ||||||
Earned premiums | $ | 3,927 | $ | 3,438 | ||
Fee income | 323 | 278 | ||||
Net investment income | 451 | 410 | ||||
Net realized capital gains (losses): | ||||||
Total other-than-temporary impairment ("OTTI") losses | (2 | ) | (3 | ) | ||
OTTI losses recognized in other comprehensive income (“OCI”) | 2 | 2 | ||||
Net OTTI losses recognized in earnings | — | (1 | ) | |||
Other net realized capital (losses) gains | (30 | ) | 25 | |||
Total net realized capital (losses) gains | (30 | ) | 24 | |||
Other revenues | 20 | 19 | ||||
Total revenues | 4,691 | 4,169 | ||||
Benefits, losses and expenses | ||||||
Benefits, losses and loss adjustment expenses | 2,695 | 2,424 | ||||
Amortization of deferred policy acquisition costs ("DAC") | 342 | 344 | ||||
Insurance operating costs and other expenses | 1,037 | 919 | ||||
Interest expense | 80 | 80 | ||||
Amortization of other intangible assets | 18 | 1 | ||||
Total benefits, losses and expenses | 4,172 | 3,768 | ||||
Income from continuing operations before income taxes | 519 | 401 | ||||
Income tax expense | 91 | 98 | ||||
Income from continuing operations, net of tax | 428 | 303 | ||||
Income from discontinued operations, net of tax | 169 | 75 | ||||
Net income | $ | 597 | $ | 378 | ||
Income from continuing operations, net of tax, per common share | ||||||
Basic | $ | 1.20 | $ | 0.82 | ||
Diluted | $ | 1.18 | $ | 0.80 | ||
Net income per common share | ||||||
Basic | $ | 1.67 | $ | 1.02 | ||
Diluted | $ | 1.64 | $ | 1.00 | ||
Cash dividends declared per common share | $ | 0.25 | $ | 0.23 | ||
See Notes to Condensed Consolidated Financial Statements.
7
THE HARTFORD FINANCIAL SERVICES GROUP, INC.
Condensed Consolidated Statements of Comprehensive Income (Loss)
Three Months Ended March 31, | ||||||
(In millions) | 2018 | 2017 | ||||
(Unaudited) | ||||||
Net income | $ | 597 | $ | 378 | ||
Other comprehensive income (loss): | ||||||
Changes in net unrealized gain on securities | (855 | ) | 137 | |||
Changes in OTTI losses recognized in other comprehensive income | (2 | ) | (1 | ) | ||
Changes in net gain on cash flow hedging instruments | (44 | ) | (18 | ) | ||
Changes in foreign currency translation adjustments | (6 | ) | 2 | |||
Changes in pension and other postretirement plan adjustments | 10 | 10 | ||||
OCI, net of tax | (897 | ) | 130 | |||
Comprehensive income (loss) | $ | (300 | ) | $ | 508 | |
See Notes to Condensed Consolidated Financial Statements.
8
(In millions, except for share and per share data) | March 31, 2018 | December 31, 2017 | ||||
(Unaudited) | ||||||
Assets | ||||||
Investments: | ||||||
Fixed maturities, available-for-sale, at fair value (amortized cost of $35,330 and $35,612) | $ | 35,924 | $ | 36,964 | ||
Fixed maturities, at fair value using the fair value option | 38 | 41 | ||||
Equity securities, at fair value | 1,123 | — | ||||
Equity securities, available-for-sale, at fair value (cost of $0 and $907) | — | 1,012 | ||||
Mortgage loans (net of allowances for loan losses of $1 and $1) | 3,221 | 3,175 | ||||
Limited partnerships and other alternative investments | 1,649 | 1,588 | ||||
Other investments | 92 | 96 | ||||
Short-term investments | 2,385 | 2,270 | ||||
Total investments | 44,432 | 45,146 | ||||
Cash | 228 | 180 | ||||
Premiums receivable and agents’ balances, net | 3,994 | 3,910 | ||||
Reinsurance recoverables, net | 4,039 | 4,061 | ||||
Deferred policy acquisition costs | 663 | 650 | ||||
Deferred income taxes, net | 1,215 | 1,164 | ||||
Goodwill | 1,290 | 1,290 | ||||
Property and equipment, net | 1,018 | 1,034 | ||||
Other intangible assets | 687 | 659 | ||||
Other assets | 2,549 | 2,230 | ||||
Assets held for sale | 156,551 | 164,936 | ||||
Total assets | $ | 216,666 | $ | 225,260 | ||
Liabilities | ||||||
Unpaid losses and loss adjustment expenses | $ | 32,213 | $ | 32,287 | ||
Reserve for future policy benefits | 678 | 713 | ||||
Other policyholder funds and benefits payable | 800 | 816 | ||||
Unearned premiums | 5,450 | 5,322 | ||||
Short-term debt | 413 | 320 | ||||
Long-term debt | 4,755 | 4,678 | ||||
Other liabilities | 5,020 | 5,188 | ||||
Liabilities held for sale | 154,194 | 162,442 | ||||
Total liabilities | $ | 203,523 | $ | 211,766 | ||
Commitments and Contingencies (Note 13) | ||||||
Stockholders’ Equity | ||||||
Common stock, $0.01 par value — 1,500,000,000 shares authorized, 384,923,222 and 384,923,222 shares issued | $ | 4 | $ | 4 | ||
Additional paid-in capital | 4,363 | 4,379 | ||||
Retained earnings | 10,156 | 9,642 | ||||
Treasury stock, at cost — 26,846,017 and 28,088,186 shares | (1,141 | ) | (1,194 | ) | ||
Accumulated other comprehensive income (loss), net of tax | (239 | ) | 663 | |||
Total stockholders’ equity | $ | 13,143 | $ | 13,494 | ||
Total liabilities and stockholders’ equity | $ | 216,666 | $ | 225,260 | ||
See Notes to Condensed Consolidated Financial Statements.
9
THE HARTFORD FINANCIAL SERVICES GROUP, INC.
Condensed Consolidated Statements of Changes in Stockholders' Equity
Three Months Ended March 31, | ||||||
(In millions, except for share data) | 2018 | 2017 | ||||
(Unaudited) | ||||||
Common Stock | $ | 4 | $ | 4 | ||
Additional Paid-in Capital | ||||||
Additional Paid-in Capital, beginning of period | 4,379 | 5,247 | ||||
Issuance of shares under incentive and stock compensation plans | (74 | ) | (66 | ) | ||
Stock-based compensation plans expense | 61 | 36 | ||||
Issuance of shares for warrant exercise | (3 | ) | (40 | ) | ||
Additional Paid-in Capital, end of period | 4,363 | 5,177 | ||||
Retained Earnings | ||||||
Retained Earnings, beginning of period | 9,642 | 13,114 | ||||
Cumulative effect of accounting changes, net of tax | 5 | — | ||||
Adjusted balance, beginning of period | 9,647 | 13,114 | ||||
Net income | 597 | 378 | ||||
Dividends declared on common stock | (88 | ) | (86 | ) | ||
Retained Earnings, end of period | 10,156 | 13,406 | ||||
Treasury Stock, at cost | ||||||
Treasury Stock, at cost, beginning of period | (1,194 | ) | (1,125 | ) | ||
Treasury stock acquired | — | (325 | ) | |||
Issuance of shares under incentive and stock compensation plans | 81 | 72 | ||||
Net shares acquired related to employee incentive and stock compensation plans | (31 | ) | (33 | ) | ||
Issuance of shares for warrant exercise | 3 | 40 | ||||
Treasury Stock, at cost, end of period | (1,141 | ) | (1,371 | ) | ||
Accumulated Other Comprehensive Income (Loss), net of tax | ||||||
Accumulated Other Comprehensive Loss, net of tax, beginning of period | 663 | (337 | ) | |||
Cumulative effect of accounting changes, net of tax | (5 | ) | — | |||
Adjusted balance, beginning of period | 658 | (337 | ) | |||
Total other comprehensive income | (897 | ) | 130 | |||
Accumulated Other Comprehensive Income, net of tax, end of period | (239 | ) | (207 | ) | ||
Total Stockholders’ Equity | $ | 13,143 | $ | 17,009 | ||
Common Shares Outstanding | ||||||
Common Shares Outstanding, beginning of period (in thousands) | 356,835 | 373,949 | ||||
Treasury stock acquired | — | (6,709 | ) | |||
Issuance of shares under incentive and stock compensation plans | 1,770 | 1,690 | ||||
Return of shares under incentive and stock compensation plans to treasury stock | (595 | ) | (674 | ) | ||
Issuance of shares for warrant exercise | 67 | 940 | ||||
Common Shares Outstanding, at end of period | 358,077 | 369,196 | ||||
See Notes to Condensed Consolidated Financial Statements.
10
THE HARTFORD FINANCIAL SERVICES GROUP, INC.
Condensed Consolidated Statements of Cash Flows
Three Months Ended March 31, | ||||||
(In millions) | 2018 | 2017 | ||||
Operating Activities | (Unaudited) | |||||
Net income | $ | 597 | $ | 378 | ||
Adjustments to reconcile net income to net cash provided by operating activities: | ||||||
Net realized capital losses | 9 | 20 | ||||
Amortization of deferred policy acquisition costs | 383 | 363 | ||||
Additions to deferred policy acquisition costs | (356 | ) | (352 | ) | ||
Depreciation and amortization | 116 | 96 | ||||
Gain on sale | (62 | ) | — | |||
Other operating activities, net | 324 | 111 | ||||
Change in assets and liabilities: | ||||||
Decrease (increase) in reinsurance recoverables | 19 | (7 | ) | |||
Increase in accrued and deferred income taxes | 122 | 256 | ||||
Increase in unpaid losses and loss adjustment expenses, reserve for future policy benefits, and unearned premiums | 58 | 293 | ||||
Net change in other assets and other liabilities | (498 | ) | (933 | ) | ||
Net cash provided by operating activities | 712 | 225 | ||||
Investing Activities | ||||||
Proceeds from the sale/maturity/prepayment of: | ||||||
Fixed maturities, available-for-sale | 6,639 | 8,020 | ||||
Fixed maturities, fair value option | 6 | 62 | ||||
Equity securities, at fair value | 185 | — | ||||
Equity securities, available-for-sale | — | 216 | ||||
Mortgage loans | 154 | 213 | ||||
Partnerships | 75 | 83 | ||||
Payments for the purchase of: | ||||||
Fixed maturities, available-for-sale | (5,874 | ) | (7,809 | ) | ||
Equity securities, at fair value | (256 | ) | — | |||
Equity securities, available-for-sale | — | (278 | ) | |||
Mortgage loans | (178 | ) | (199 | ) | ||
Partnerships | (126 | ) | (86 | ) | ||
Net payments for derivatives | (189 | ) | (56 | ) | ||
Net additions of property and equipment | (39 | ) | (41 | ) | ||
Net payments for short-term investments | (608 | ) | (1,317 | ) | ||
Other investing activities, net | (31 | ) | (16 | ) | ||
Net cash used for investing activities | (242 | ) | (1,208 | ) | ||
Financing Activities | ||||||
Deposits and other additions to investment and universal life-type contracts | 1,366 | 1,398 | ||||
Withdrawals and other deductions from investment and universal life-type contracts | (7,670 | ) | (3,773 | ) | ||
Net transfers from separate accounts related to investment and universal life-type contracts | 5,918 | 2,057 | ||||
Repayments at maturity or settlement of consumer notes | (4 | ) | (7 | ) | ||
Net increase (decrease) in securities loaned or sold under agreements to repurchase | (368 | ) | 1,115 | |||
Repayment of debt | (320 | ) | (416 | ) | ||
Proceeds from the issuance of debt | 490 | 500 | ||||
Net return of shares under incentive and stock compensation plans | 1 | (26 | ) | |||
Treasury stock acquired | — | (325 | ) | |||
Dividends paid on common stock | (90 | ) | (87 | ) | ||
Net cash provided by (used for) financing activities | (677 | ) | 436 | |||
Foreign exchange rate effect on cash | (5 | ) | 2 | |||
Net decrease in cash, including cash classified as assets held for sale | (212 | ) | (545 | ) | ||
Less: Net decrease in cash classified as assets held for sale | (260 | ) | (318 | ) | ||
Net increase (decrease) in cash | 48 | (227 | ) | |||
Cash – beginning of period | 180 | 328 | ||||
Cash – end of period | $ | 228 | $ | 101 | ||
Supplemental Disclosure of Cash Flow Information | ||||||
Income tax received (paid) | $ | (1 | ) | $ | 132 | |
Interest paid | $ | 65 | $ | 71 | ||
11
THE HARTFORD FINANCIAL SERVICES GROUP, INC.
NOTES TO CONDENSED CONSOLIDATED FINANCIAL STATEMENTS
(Dollar amounts in millions, except for per share data, unless otherwise stated)
1. Basis of Presentation and Significant Accounting Policies
Basis of Presentation
The Hartford Financial Services Group, Inc. is a holding company for insurance and financial services subsidiaries that provide property and casualty insurance, group life and disability products and mutual funds and exchange-traded products to individual and business customers in the United States (collectively, “The Hartford”, the “Company”, “we” or “our”).
On December 3, 2017, Hartford Holdings, Inc., a wholly owned subsidiary of the Company, entered into a definitive agreement to sell all of the issued and outstanding equity of Hartford Life, Inc. (“HLI”), a holding company, and its life and annuity operating subsidiaries.
On November 1, 2017, Hartford Life and Accident Insurance Company ("HLA"), a wholly owned subsidiary of the Company, completed the acquisition of Aetna's U.S. group life and disability business through a reinsurance transaction.
On May 10, 2017, the Company completed the sale of its United Kingdom ("U.K.") property and casualty run-off subsidiaries.
For further discussion of these transactions, see Note 2 - Business Acquisitions and Note 17 - Business Dispositions and Discontinued Operations of Notes to Condensed Consolidated Financial Statements.
The Condensed Consolidated Financial Statements have been prepared in accordance with accounting principles generally accepted in the United States of America (“U.S. GAAP”) for interim financial information, which differ materially from the accounting practices prescribed by various insurance regulatory authorities. These Condensed Consolidated Financial Statements and Notes should be read in conjunction with the Consolidated Financial Statements and Notes thereto included in the Company's 2017 Form 10-K Annual Report. The results of operations for interim periods are not necessarily indicative of the results that may be expected for the full year.
The accompanying Condensed Consolidated Financial Statements and Notes are unaudited. These financial statements reflect all adjustments (generally consisting only of normal accruals) which are, in the opinion of management, necessary for the fair presentation of the financial position, results of operations and cash flows for the interim periods. The Company's significant accounting policies are summarized in Note 1 - Basis of Presentation and Significant Accounting Policies of Notes to Consolidated Financial Statements included in the Company's 2017 Form 10-K Annual Report.
Consolidation
The Condensed Consolidated Financial Statements include the accounts of The Hartford Financial Services Group, Inc., and entities in which the Company directly or indirectly has a controlling financial interest. Entities in which the Company has significant influence over the operating and financing decisions but does not control are reported using the equity method. All intercompany transactions and balances between The Hartford and its subsidiaries and affiliates that are not held for sale have been eliminated.
Discontinued Operations
The results of operations of a component of the Company are reported in discontinued operations when certain criteria are met as of the date of disposal, or earlier if classified as held-for-sale. When a component is identified for discontinued operations reporting, amounts for prior periods are retrospectively reclassified as discontinued operations. Components are identified as discontinued operations if they are a major part of an entity's operations and financial results such as a separate major line of business or a separate major geographical area of operations.
Use of Estimates
The preparation of financial statements, in conformity with U.S. GAAP requires management to make estimates and assumptions that affect the reported amounts of assets and liabilities and the disclosure of contingent assets and liabilities at the date of the financial statements and the reported amounts of revenues and expenses during the reporting period. Actual results could differ from those estimates.
The most significant estimates include those used in determining property and casualty and group long-term disability insurance product reserves, net of reinsurance; evaluation of goodwill for impairment; valuation of investments and derivative instruments; valuation allowance on deferred tax assets; and contingencies relating to corporate litigation and regulatory matters.
Reclassifications
Certain reclassifications have been made to prior year financial information to conform to the current year presentation. In particular:
With respect to the Condensed Consolidated Statement of Operations:
• | Amortization of other intangible assets has been reclassified out of insurance operating costs and other expenses to a separate line item. |
• | Distribution costs within the Mutual Funds segment that were previously netted against fee income are presented gross in insurance operating costs and other expenses. |
Adoption of New Accounting Standards
Reclassification of Effect of Tax Rate Change from AOCI to Retained Earnings
In February 2018, the FASB issued new accounting guidance for the effect on deferred tax assets and liabilities related to items recorded in accumulated other comprehensive income ("AOCI") resulting from legislated tax reform enacted on December 22, 2017. The tax reform reduced the federal tax rate applied to the Company’s deferred tax balances from 35% to 21% on enactment. Under U.S. GAAP, the Company recorded the total effect of the change in enacted tax rates on deferred tax balances as a charge to income tax expense within net income, including
12
THE HARTFORD FINANCIAL SERVICES GROUP, INC.
NOTES TO CONDENSED CONSOLIDATED FINANCIAL STATEMENTS (continued)
1. Basis of Presentation and Significant Accounting Policies (continued)
the change in deferred tax balances related to components of AOCI. The new accounting guidance permits the Company to reclassify the “stranded” tax effects out of AOCI and into retained earnings that resulted from recording the tax effects of unrealized investment gains, unrecognized actuarial losses on pension and other postretirement benefit plans, and cumulative translation adjustments at a 35% tax rate because the 14 point reduction in tax rate was recognized in net income instead of other comprehensive income. On January 1, 2018, the Company adopted the new guidance and recorded a reclassification of $88 from AOCI to retained earnings. As a result of the reclassification, in the first quarter of 2018, the Company reduced the estimated loss on sale recorded in income from discontinued operations by $193, net of tax, for the increase in AOCI related to the assets held for sale. The reduction in the loss on sale resulted in a corresponding increase in assets held for sale and AOCI as of January 1, 2018 and the AOCI associated with assets held for sale will be removed from the balance sheet when the sale closes. Additionally, as of January 1, 2018, the Company reclassified $105 of stranded tax effects related to continuing operations which reduced AOCI and increased retained earnings.
Financial Instruments- Recognition and Measurement
On January 1, 2018, the Company adopted updated guidance issued by the FASB for the recognition and measurement of financial instruments through a cumulative effect adjustment to the opening balances of retained earnings and AOCI. The new guidance requires investments in equity securities to be measured at fair value with any changes in valuation reported in net income except for investments that are consolidated or are accounted for under the equity method of accounting. The new guidance also requires a deferred tax asset resulting from net unrealized losses on available-for-sale fixed maturities that are recognized in AOCI to be evaluated for recoverability in combination with the Company’s other deferred tax assets. Under prior guidance, the Company reported equity securities, available for sale ("AFS"), at fair value with changes in fair value reported in other comprehensive income. As of January 1, 2018, the Company reclassified from AOCI to retained earnings net unrealized gains of $83, after tax, related to equity securities having a fair value of $1.0 billion. In addition, $10 of net unrealized gains net of shadow DAC related to discontinued operations were reclassified from AOCI to retained earnings of the life and annuity run-off business held for sale, which increased the estimated loss on sale by the same amount. Beginning in 2018, the Company reports equity securities at fair value with changes in fair value reported in net realized capital gains and losses.
Revenue Recognition
On January 1, 2018, the Company adopted the FASB’s updated guidance for recognizing revenue from contracts with customers, which excludes insurance contracts and financial instruments. Revenue subject to the guidance is recognized when, or as, goods or services are transferred to customers in an amount that reflects the consideration that an entity is expected to receive in exchange for those goods or services. For all but certain revenues
associated with our Mutual Funds business, the updated guidance is consistent with previous guidance for the Company’s transactions and did not have an effect on the Company’s financial position, cash flows or net income. The updated guidance also updated criteria for determining when the Company acts as a principal or an agent. The Company determined that it is the principal for some of its mutual fund distribution service contracts and, upon adoption, reclassified distribution costs of $46 for the three months ended March 31, 2017, that were previously netted against fee income to insurance operating costs and other expenses.
Information about the nature, amount, timing of recognition and cash flows for the Company’s revenues subject to the updated guidance follows.
Revenue from Non-Insurance Contracts with Customers
Three months ended March 31, | |||||||
Revenue Line Item | 2018 | 2017 | |||||
Commercial Lines | |||||||
Installment billing fees | Fee income | $ | 9 | $ | 10 | ||
Personal Lines | |||||||
Installment billing fees | Fee income | 10 | 11 | ||||
Insurance servicing revenues | Other revenues | 19 | 19 | ||||
Group Benefits | |||||||
Administrative services | Fee income | 44 | 19 | ||||
Mutual Funds | |||||||
Advisor, distribution and other management fees | Fee income | 238 | 212 | ||||
Other fees | Fee income | 20 | 26 | ||||
Corporate | Fee income | 2 | 1 | ||||
Total revenues subject to updated guidance | $ | 342 | $ | 298 | |||
Installment fees are charged on property and casualty insurance contracts for billing the insurance customer in installments over the policy term. These fees are recognized in fee income as earned on collection.
Insurance servicing revenues within Personal Lines consist of up-front commissions earned for collecting premiums and processing claims on insurance policies for which The Hartford does not assume underwriting risk, predominantly related to the National Flood Insurance Plan program. These insurance servicing revenues are recognized over the period of the flood program's policy terms.
Group Benefits products earn fee income from employers for the administration of underwriting, implementation and claims processing for employer self-funded plans and for leave management services. Fees are recognized as services are provided and collected monthly.
The Company provides investment management, administrative and distribution services to mutual funds and exchange-traded
13
THE HARTFORD FINANCIAL SERVICES GROUP, INC.
NOTES TO CONDENSED CONSOLIDATED FINANCIAL STATEMENTS (continued)
1. Basis of Presentation and Significant Accounting Policies (continued)
products. The Company assesses investment advisory, distribution and other asset management fees primarily based on the average daily net asset values from mutual funds and exchange-traded products, which are recorded in the period in which the services are provided and collected monthly. Fluctuations in domestic and international markets and related investment performance, volume and mix of sales and redemptions of mutual funds or exchange-traded products, and other changes to the composition of assets under management are all factors that ultimately have a direct effect on fee income earned.
Mutual Funds other fees primarily include transfer agent fees, generally assessed as a charge per account, and are recognized as fee income in the period in which the services are provided with payments collected monthly.
14
THE HARTFORD FINANCIAL SERVICES GROUP, INC.
NOTES TO CONDENSED CONSOLIDATED FINANCIAL STATEMENTS (continued)
2. Business Acquisitions
Aetna Group Insurance
On November 1, 2017, The Hartford acquired Aetna's U.S. group life and disability business through a reinsurance transaction for total consideration of $1.452 billion. The acquisition date fair values of certain assets and liabilities, including insurance reserves and intangible assets, as well as the related estimated useful lives of intangibles, are provisional and are subject to revision within one year of the acquisition date. Under the terms of the agreement, a final balance sheet will be agreed to in 2018 and our estimates of fair values are pending finalization. There were no adjustments to the provisional amounts during the three month period ended March 31, 2018.
The following table presents supplemental pro forma amounts of revenue and net income for the Company for the three months ended March 31, 2017, as though the business was acquired on January 1, 2016.
Pro Forma Results
Three months ended March 31, 2017 [1] | |||
Total Revenue | $ | 4,739 | |
Net Income | $ | 390 | |
[1]Pro forma adjustments include the revenue and earnings of the Aetna U.S. group life and disability business as well as amortization of identifiable intangible assets acquired and the fair value adjustment to acquired insurance reserves. Pro forma adjustments do not include retrospective adjustments to defer and amortize acquisition costs as would be recorded under the Company’s accounting policy.
15
THE HARTFORD FINANCIAL SERVICES GROUP, INC.
NOTES TO CONDENSED CONSOLIDATED FINANCIAL STATEMENTS (continued)
3. Earnings Per Common Share
Computation of Basic and Diluted Earnings per Common Share | ||||||
Three Months Ended March 31, | ||||||
(In millions, except for per share data) | 2018 | 2017 | ||||
Earnings | ||||||
Income from continuing operations, net of tax | $ | 428 | $ | 303 | ||
Income from discontinued operations, net of tax | 169 | 75 | ||||
Net income | $ | 597 | $ | 378 | ||
Shares | ||||||
Weighted average common shares outstanding, basic | 357.5 | 371.4 | ||||
Dilutive effect of stock compensation plans | 4.4 | 4.2 | ||||
Dilutive effect of warrants | 2.0 | 3.0 | ||||
Weighted average common shares outstanding and dilutive potential common shares | 363.9 | 378.6 | ||||
Net income per common share | ||||||
Basic | ||||||
Income from continuing operations, net of tax | $ | 1.20 | $ | 0.82 | ||
Income from discontinued operations, net of tax | $ | 0.47 | $ | 0.20 | ||
Net income per common share | $ | 1.67 | $ | 1.02 | ||
Diluted | ||||||
Income from continuing operations, net of tax | $ | 1.18 | $ | 0.80 | ||
Income from discontinued operations, net of tax | $ | 0.46 | $ | 0.20 | ||
Net income per common share | $ | 1.64 | $ | 1.00 | ||
16
THE HARTFORD FINANCIAL SERVICES GROUP, INC.
NOTES TO CONDENSED CONSOLIDATED FINANCIAL STATEMENTS (continued)
4. Segment Information
The Company currently conducts business principally in five reporting segments including Commercial Lines, Personal Lines, Property & Casualty Other Operations, Group Benefits, and Mutual Funds, as well as a Corporate category. The Company includes in the Corporate category discontinued operations of the Company's life and annuity run-off business accounted for as held for sale, reserves for structured settlement and terminal funding agreement liabilities retained, capital raising activities (including debt financing and related interest expense), purchase accounting adjustments related to goodwill and other expenses not allocated to the reporting segments.
The Company's revenues are generated primarily in the United States ("U.S."). Any foreign sourced revenue is immaterial.
Net Income
Three Months Ended March 31, | ||||||
2018 | 2017 | |||||
Commercial Lines | $ | 298 | $ | 231 | ||
Personal Lines | 89 | 33 | ||||
Property & Casualty Other Operations | 17 | 24 | ||||
Group Benefits | 54 | 45 | ||||
Mutual Funds | 34 | 23 | ||||
Corporate | 105 | 22 | ||||
Net income | $ | 597 | $ | 378 | ||
Revenues
Three Months Ended March 31, | ||||||
2018 | 2017 | |||||
Earned premiums and fee income | ||||||
Commercial Lines | ||||||
Workers’ compensation | $ | 818 | $ | 813 | ||
Liability | 151 | 148 | ||||
Package business | 332 | 314 | ||||
Automobile | 149 | 161 | ||||
Professional liability | 62 | 60 | ||||
Bond | 58 | 55 | ||||
Property | 150 | 147 | ||||
Total Commercial Lines | 1,720 | 1,698 | ||||
Personal Lines | ||||||
Automobile | 607 | 662 | ||||
Homeowners | 262 | 283 | ||||
Total Personal Lines [1] | 869 | 945 | ||||
Group Benefits | ||||||
Group disability | 677 | 381 | ||||
Group life | 664 | 399 | ||||
Other | 60 | 55 | ||||
Total Group Benefits | 1,401 | 835 | ||||
Mutual Funds | ||||||
Mutual fund and ETP [2] | 232 | 211 | ||||
Life and annuity run-off business held for sale | 26 | 26 | ||||
Total Mutual Funds | 258 | 237 | ||||
Corporate | 2 | 1 | ||||
Total earned premiums and fee income | 4,250 | 3,716 | ||||
Net investment income | 451 | 410 | ||||
Net realized capital gains (losses) | (30 | ) | 24 | |||
Other revenues | 20 | 19 | ||||
Total revenues | $ | 4,691 | $ | 4,169 | ||
[1] | For the three months ended March 31, 2018 and 2017, AARP members accounted for earned premiums of $758 and $800, respectively. |
[2] | Excludes distribution costs of $46 for the three months ended March 31, 2017 that were previously netted against fee income and are now presented gross in insurance operating costs and other expenses. |
17
THE HARTFORD FINANCIAL SERVICES GROUP, INC.
NOTES TO CONDENSED CONSOLIDATED FINANCIAL STATEMENTS (continued)
5. Fair Value Measurements
The Company carries certain financial assets and liabilities at estimated fair value. Fair value is defined as the price that would be received to sell an asset or paid to transfer a liability in the principal or most advantageous market in an orderly transaction between market participants. Our fair value framework includes a hierarchy that gives the highest priority to the use of quoted prices in active markets, followed by the use of market observable inputs, followed by the use of unobservable inputs. The fair value hierarchy levels are as follows:
Level 1 | Fair values based primarily on unadjusted quoted prices for identical assets or liabilities, in active markets that the Company has the ability to access at the measurement date. |
Level 2 | Fair values primarily based on observable inputs, other than quoted prices included in Level 1, or based on prices for similar assets and liabilities. |
Level 3 | Fair values derived when one or more of the significant inputs are unobservable (including assumptions about risk). With little or no observable market, the determination of fair values uses considerable judgment and represents the Company’s best estimate of an amount that could be realized in a market exchange for the asset or liability. Also included are securities that are traded within illiquid markets and/or priced by independent brokers. |
The Company will classify the financial asset or liability by level based upon the lowest level input that is significant to the determination of the fair value. In most cases, both observable inputs (e.g., changes in interest rates) and unobservable inputs (e.g., changes in risk assumptions) are used to determine fair values that the Company has classified within Level 3.
Assets and (Liabilities) Carried at Fair Value by Hierarchy Level as of March 31, 2018 | ||||||||||||
Total | Quoted Prices in Active Markets for Identical Assets (Level 1) | Significant Observable Inputs (Level 2) | Significant Unobservable Inputs (Level 3) | |||||||||
Assets accounted for at fair value on a recurring basis | ||||||||||||
Fixed maturities, AFS | ||||||||||||
Asset-backed-securities ("ABS") | $ | 911 | $ | — | $ | 897 | $ | 14 | ||||
Collateralized debt obligations ("CDOs") | 1,144 | — | 1,038 | 106 | ||||||||
Commercial mortgage-backed securities ("CMBS") | 3,311 | — | 3,278 | 33 | ||||||||
Corporate | 12,634 | — | 12,119 | 515 | ||||||||
Foreign government/government agencies | 1,082 | — | 1,080 | 2 | ||||||||
Municipal | 11,544 | — | 11,528 | 16 | ||||||||
Residential mortgage-backed securities ("RMBS") | 3,086 | — | 1,853 | 1,233 | ||||||||
U.S. Treasuries | 2,212 | 458 | 1,754 | — | ||||||||
Total fixed maturities | 35,924 | 458 | 33,547 | 1,919 | ||||||||
Fixed maturities, FVO | 38 | — | 38 | — | ||||||||
Equity securities, at fair value | 1,123 | 1,009 | 49 | 65 | ||||||||
Derivative assets | ||||||||||||
Credit derivatives | 11 | — | 11 | — | ||||||||
Equity derivatives | 1 | — | — | 1 | ||||||||
Total derivative assets [1] | 12 | — | 11 | 1 | ||||||||
Short-term investments | 2,385 | 874 | 1,511 | — | ||||||||
Total assets accounted for at fair value on a recurring basis | $ | 39,482 | $ | 2,341 | $ | 35,156 | $ | 1,985 | ||||
Liabilities accounted for at fair value on a recurring basis | ||||||||||||
Derivative liabilities | ||||||||||||
Credit derivatives | 1 | — | 1 | — | ||||||||
Foreign exchange derivatives | (21 | ) | — | (21 | ) | — | ||||||
Interest rate derivatives | (66 | ) | — | (68 | ) | 2 | ||||||
Total derivative liabilities [2] | (86 | ) | — | (88 | ) | 2 | ||||||
Contingent consideration [3] | (27 | ) | — | — | (27 | ) | ||||||
Total liabilities accounted for at fair value on a recurring basis | $ | (113 | ) | $ | — | $ | (88 | ) | $ | (25 | ) | |
18
THE HARTFORD FINANCIAL SERVICES GROUP, INC.
NOTES TO CONDENSED CONSOLIDATED FINANCIAL STATEMENTS (continued)
5. Fair Value Measurements (continued)
Assets and (Liabilities) Carried at Fair Value by Hierarchy Level as of December 31, 2017 | ||||||||||||
Total | Quoted Prices in Active Markets for Identical Assets (Level 1) | Significant Observable Inputs (Level 2) | Significant Unobservable Inputs (Level 3) | |||||||||
Assets accounted for at fair value on a recurring basis | ||||||||||||
Fixed maturities, AFS | ||||||||||||
Asset-backed-securities ("ABS") | $ | 1,126 | $ | — | $ | 1,107 | $ | 19 | ||||
Collateralized debt obligations ("CDOs") | 1,260 | — | 1,165 | 95 | ||||||||
Commercial mortgage-backed securities ("CMBS") | 3,336 | — | 3,267 | 69 | ||||||||
Corporate | 12,804 | — | 12,284 | 520 | ||||||||
Foreign government/government agencies | 1,110 | — | 1,108 | 2 | ||||||||
Municipal | 12,485 | — | 12,468 | 17 | ||||||||
Residential mortgage-backed securities ("RMBS") | 3,044 | — | 1,814 | 1,230 | ||||||||
U.S. Treasuries | 1,799 | 333 | 1,466 | — | ||||||||
Total fixed maturities | 36,964 | 333 | 34,679 | 1,952 | ||||||||
Fixed maturities, FVO | 41 | — | 41 | — | ||||||||
Equity securities, AFS | 1,012 | 887 | 49 | 76 | ||||||||
Derivative assets | ||||||||||||
Credit derivatives | 9 | — | 9 | — | ||||||||
Equity derivatives | 1 | — | — | 1 | ||||||||
Foreign exchange derivatives | (1 | ) | — | (1 | ) | — | ||||||
Interest rate derivatives | 1 | — | 1 | — | ||||||||
Total derivative assets [1] | 10 | — | 9 | 1 | ||||||||
Short-term investments | 2,270 | 1,098 | 1,172 | — | ||||||||
Total assets accounted for at fair value on a recurring basis | $ | 40,297 | $ | 2,318 | $ | 35,950 | $ | 2,029 | ||||
Liabilities accounted for at fair value on a recurring basis | ||||||||||||
Derivative liabilities | ||||||||||||
Credit derivatives | (3 | ) | — | (3 | ) | — | ||||||
Foreign exchange derivatives | (13 | ) | — | (13 | ) | — | ||||||
Interest rate derivatives | (84 | ) | — | (85 | ) | 1 | ||||||
Total derivative liabilities [2] | (100 | ) | — | (101 | ) | 1 | ||||||
Contingent consideration [3] | (29 | ) | — | — | (29 | ) | ||||||
Total liabilities accounted for at fair value on a recurring basis | $ | (129 | ) | $ | — | $ | (101 | ) | $ | (28 | ) | |
[1] | Includes derivative instruments in a net positive fair value position after consideration of the accrued interest and impact of collateral posting requirements which may be imposed by agreements, clearing house rules and applicable law. See footnote 2 to this table for derivative liabilities. |
[2] | Includes derivative instruments in a net negative fair value position (derivative liability) after consideration of the accrued interest and impact of collateral posting requirements which may be imposed by agreements, clearing house rules and applicable law. |
[3] | For additional information see the Contingent Consideration section below. |
Fixed Maturities, Equity Securities, Short-term Investments, and Derivatives
Valuation Techniques
The Company generally determines fair values using valuation techniques that use prices, rates, and other relevant information evident from market transactions involving identical or similar instruments. Valuation techniques also include, where appropriate, estimates of future cash flows that are converted into a single discounted amount using current market expectations. The Company uses a "waterfall" approach
comprised of the following pricing sources and techniques, which are listed in priority order:
• | Quoted prices, unadjusted, for identical assets or liabilities in active markets, which are classified as Level 1. |
• | Prices from third-party pricing services, which primarily utilize a combination of techniques. These services utilize recently reported trades of identical, similar, or benchmark securities making adjustments for market observable inputs available through the reporting date. If there are no recently reported trades, they may use a discounted cash flow technique to develop a price using expected cash flows based upon the anticipated future performance of the underlying collateral discounted at an estimated market rate. Both |
19
THE HARTFORD FINANCIAL SERVICES GROUP, INC.
NOTES TO CONDENSED CONSOLIDATED FINANCIAL STATEMENTS (continued)
5. Fair Value Measurements (continued)
techniques develop prices that consider the time value of future cash flows and provide a margin for risk, including liquidity and credit risk. Most prices provided by third-party pricing services are classified as Level 2 because the inputs used in pricing the securities are observable. However, some securities that are less liquid or trade less actively are classified as Level 3. Additionally, certain long-dated securities, including certain municipal securities, foreign government/government agency securities, and bank loans, include benchmark interest rate or credit spread assumptions that are not observable in the marketplace and are thus classified as Level 3.
• | Internal matrix pricing, which is a valuation process internally developed for private placement securities for which the Company is unable to obtain a price from a third-party pricing service. Internal pricing matrices determine credit spreads that, when combined with risk-free rates, are applied to contractual cash flows to develop a price. The Company develops credit spreads using market based data for public securities adjusted for credit spread differentials between public and private securities, which are obtained from a survey of multiple private placement brokers. The market-based reference credit spread considers the issuer’s financial strength and term to maturity, using an independent public security index and trade information, while the credit spread differential considers the non-public nature of the security. Securities priced using internal matrix pricing are classified as Level 2 because the inputs are observable or can be corroborated with observable data. |
• | Independent broker quotes, which are typically non-binding, use inputs that can be difficult to corroborate with observable market based data. Brokers may use present value techniques using assumptions specific to the security types, or they may use recent transactions of similar securities. Due to the lack of transparency in the process that brokers use to develop prices, valuations that are based on independent broker quotes are classified as Level 3. |
The fair value of derivative instruments is determined primarily using a discounted cash flow model or option model technique and incorporate counterparty credit risk. In some cases, quoted market prices for exchange-traded and OTC-cleared derivatives may be used and in other cases independent broker quotes may be used. The pricing valuation models primarily use inputs that are observable in the market or can be corroborated by observable market data. The valuation of certain derivatives may include significant inputs that are unobservable, such as volatility levels, and reflect the Company’s view of what other market participants would use when pricing such instruments.
Valuation Controls
The fair value process for investments is monitored by the Valuation Committee, which is a cross-functional group of senior management within the Company that meets at least quarterly. The purpose of the committee is to oversee the pricing policy and procedures, as well as to approve changes to valuation methodologies and pricing sources. Controls and procedures used to assess third-party pricing services are reviewed by the Valuation Committee, including the results of annual due-diligence reviews.
There are also two working groups under the Valuation Committee: a Securities Fair Value Working Group (“Securities Working Group”) and a Derivatives Fair Value Working Group ("Derivatives Working Group"). The working groups, which include various investment, operations, accounting and risk management professionals, meet monthly to review market data trends, pricing and trading statistics and results, and any proposed pricing methodology changes.
The Securities Working Group reviews prices received from third parties to ensure that the prices represent a reasonable estimate of the fair value. The group considers trading volume, new issuance activity, market trends, new regulatory rulings and other factors to determine whether the market activity is significantly different than normal activity in an active market. A dedicated pricing unit follows up with trading and investment sector professionals and challenges prices of third-party pricing services when the estimated assumptions used differ from what the unit believes a market participant would use. If the available evidence indicates that pricing from third-party pricing services or broker quotes is based upon transactions that are stale or not from trades made in an orderly market, the Company places little, if any, weight on the third party service’s transaction price and will estimate fair value using an internal process, such as a pricing matrix.
The Derivatives Working Group reviews the inputs, assumptions and methodologies used to ensure that the prices represent a reasonable estimate of the fair value. A dedicated pricing team works directly with investment sector professionals to investigate the impacts of changes in the market environment on prices or valuations of derivatives. New models and any changes to current models are required to have detailed documentation and are validated to a second source. The model validation documentation and results of validation are presented to the Valuation Committee for approval.
The Company conducts other monitoring controls around securities and derivatives pricing including, but not limited to, the following:
• | Review of daily price changes over specific thresholds and new trade comparison to third-party pricing services. |
• | Daily comparison of OTC derivative market valuations to counterparty valuations. |
• | Review of weekly price changes compared to published bond prices of a corporate bond index. |
• | Monthly reviews of price changes over thresholds, stale prices, missing prices, and zero prices. |
• | Monthly validation of prices to a second source for securities in most sectors and for certain derivatives. |
In addition, the Company’s enterprise-wide Operational Risk Management function, led by the Chief Risk Officer, is responsible for model risk management and provides an independent review of the suitability and reliability of model inputs, as well as an analysis of significant changes to current models.
20
THE HARTFORD FINANCIAL SERVICES GROUP, INC.
NOTES TO CONDENSED CONSOLIDATED FINANCIAL STATEMENTS (continued)
5. Fair Value Measurements (continued)
Valuation Inputs
Quoted prices for identical assets in active markets are considered Level 1 and consist of on-the-run U.S. Treasuries,
money market funds, exchange-traded equity securities, open-ended mutual funds, short-term investments, and exchange traded futures and option contracts.
21
THE HARTFORD FINANCIAL SERVICES GROUP, INC.
NOTES TO CONDENSED CONSOLIDATED FINANCIAL STATEMENTS (continued)
5. Fair Value Measurements (continued)
Valuation Inputs Used in Levels 2 and 3 Measurements for Securities and Derivatives | |||
Level 2 Primary Observable Inputs | Level 3 Primary Unobservable Inputs | ||
Fixed Maturity Investments | |||
Structured securities (includes ABS, CDOs, CMBS and RMBS) | |||
• Benchmark yields and spreads • Monthly payment information • Collateral performance, which varies by vintage year and includes delinquency rates, loss severity rates and refinancing assumptions • Credit default swap indices Other inputs for ABS and RMBS: • Estimate of future principal prepayments, derived from the characteristics of the underlying structure • Prepayment speeds previously experienced at the interest rate levels projected for the collateral | • Independent broker quotes • Credit spreads beyond observable curve • Interest rates beyond observable curve Other inputs for less liquid securities or those that trade less actively, including subprime RMBS: • Estimated cash flows • Credit spreads, which include illiquidity premium • Constant prepayment rates • Constant default rates • Loss severity | ||
Corporates | |||
• Benchmark yields and spreads • Reported trades, bids, offers of the same or similar securities • Issuer spreads and credit default swap curves Other inputs for investment grade privately placed securities that utilize internal matrix pricing: • Credit spreads for public securities of similar quality, maturity, and sector, adjusted for non-public nature | • Independent broker quotes • Credit spreads beyond observable curve • Interest rates beyond observable curve Other inputs for below investment grade privately placed securities: • Independent broker quotes • Credit spreads for public securities of similar quality, maturity, and sector, adjusted for non-public nature | ||
U.S Treasuries, Municipals, and Foreign government/government agencies | |||
• Benchmark yields and spreads • Issuer credit default swap curves • Political events in emerging market economies • Municipal Securities Rulemaking Board reported trades and material event notices • Issuer financial statements | • Credit spreads beyond observable curve • Interest rates beyond observable curve | ||
Equity Securities | |||
• Quoted prices in markets that are not active | • For privately traded equity securities, internal discounted cash flow models utilizing earnings multiples or other cash flow assumptions that are not observable | ||
Short Term Investments | |||
• Benchmark yields and spreads • Reported trades, bids, offers • Issuer spreads and credit default swap curves • Material event notices and new issue money market rates | Not applicable | ||
Derivatives | |||
Credit derivatives | |||
• Swap yield curve • Credit default swap curves | Not applicable | ||
Equity derivatives | |||
• Equity index levels • Swap yield curve | • Independent broker quotes • Equity volatility | ||
Foreign exchange derivatives | |||
• Swap yield curve • Currency spot and forward rates • Cross currency basis curves | Not applicable | ||
Interest rate derivatives | |||
• Swap yield curve | • Independent broker quotes • Interest rate volatility | ||
22
THE HARTFORD FINANCIAL SERVICES GROUP, INC.
NOTES TO CONDENSED CONSOLIDATED FINANCIAL STATEMENTS (continued)
5. Fair Value Measurements (continued)
Significant Unobservable Inputs for Level 3 - Securities | |||||||||
Assets accounted for at fair value on a recurring basis | Fair Value | Predominant Valuation Technique | Significant Unobservable Input | Minimum | Maximum | Weighted Average [1] | Impact of Increase in Input on Fair Value [2] | ||
As of March 31, 2018 | |||||||||
CMBS [3] | $ | 21 | Discounted cash flows | Spread (encompasses prepayment, default risk and loss severity) | 9 bps | 1,040 bps | 389 bps | Decrease | |
Corporate [4] | $ | 277 | Discounted cash flows | Spread | 112 bps | 768 bps | 197 bps | Decrease | |
Municipal | $ | 16 | Discounted cash flows | Spread | 199 bps | 240 bps | 218 bps | Decrease | |
RMBS [3] | $ | 1,163 | Discounted cash flows | Spread | 6 bps | 335 bps | 69 bps | Decrease | |
Constant prepayment rate | 1% | 25% | 7% | Decrease [5] | |||||
Constant default rate | —% | 9% | 4% | Decrease | |||||
Loss severity | —% | 100% | 59% | Decrease | |||||
As of December 31, 2017 | |||||||||
CMBS [3] | $ | 56 | Discounted cash flows | Spread (encompasses prepayment, default risk and loss severity) | 9 bps | 1,040 bps | 400 bps | Decrease | |
Corporate [4] | $ | 251 | Discounted cash flows | Spread | 103 bps | 1,000 bps | 242 bps | Decrease | |
Municipal [3] | $ | 17 | Discounted cash flows | Spread | 192 bps | 250 bps | 219 bps | Decrease | |
RMBS [3] | $ | 1,215 | Discounted cash flows | Spread | 24 bps | 351 bps | 74 bps | Decrease | |
Constant prepayment rate | 1% | 25% | 6% | Decrease [5] | |||||
Constant default rate | —% | 9% | 4% | Decrease | |||||
Loss severity | —% | 100% | 66% | Decrease | |||||
[1] | The weighted average is determined based on the fair value of the securities. |
[2] | Conversely, the impact of a decrease in input would have the opposite impact to the fair value as that presented in the table. |
[3] | Excludes securities for which the Company based fair value on broker quotations. |
[4] | Excludes securities for which the Company bases fair value on broker quotations; however, included are broker priced lower-rated private placement securities for which the Company receives spread and yield information to corroborate the fair value. |
[5] | Decrease for above market rate coupons and increase for below market rate coupons. |
Significant Unobservable Inputs for Level 3 - Derivatives | ||||||||||
Fair Value | Predominant Valuation Technique | Significant Unobservable Input | Minimum | Maximum | Impact of Increase in Input on Fair Value [1] | |||||
As of March 31, 2018 | ||||||||||
Interest rate swaptions [2] | $ | 2 | Option model | Interest rate volatility | 3 | % | 3 | % | Increase | |
Equity Options | 1 | Option model | Equity volatility | 20 | % | 27 | % | Increase | ||
As of December 31, 2017 | ||||||||||
Interest rate swaptions [2] | $ | 1 | Option model | Interest rate volatility | 2 | % | 2 | % | Increase | |
Equity options | $ | 1 | Option model | Equity volatility | 18 | % | 22 | % | Increase | |
[1] | Conversely, the impact of a decrease in input would have the opposite impact to the fair value as that presented in the table. Changes are based on long positions, unless otherwise noted. Changes in fair value will be inversely impacted for short positions. |
[2] | The swaptions presented are purchased options that have the right to enter into a pay-fixed swap. |
23
THE HARTFORD FINANCIAL SERVICES GROUP, INC.
NOTES TO CONDENSED CONSOLIDATED FINANCIAL STATEMENTS (continued)
5. Fair Value Measurements (continued)
The tables above exclude the portion of ABS, CRE CDOs and certain corporate securities for which fair values are predominately based on independent broker quotes. While the Company does not have access to the significant unobservable inputs that independent brokers may use in their pricing process, the Company believes brokers likely use inputs similar to those used by the Company and third-party pricing services to price similar instruments. As such, in their pricing models, brokers likely use estimated loss severity rates, prepayment rates, constant default rates and credit spreads. Therefore, similar to non-broker priced securities, increases in these inputs would generally cause fair values to decrease. For the three months ended March 31, 2018, no significant adjustments were made by the Company to broker prices received.
Transfers between Levels
Transfers of securities among the levels occur at the beginning of the reporting period. The amount of transfers from Level 1 to Level 2 was $333 and $391 for three months ended March 31, 2018 and 2017, respectively, which represented previously on-the-run U.S. Treasury securities that are now off-the-run. There was an immaterial amount of transfers from Level 2 to Level 1 for the three months ended March 31, 2018, and no transfers from Level 2 to Level 1 for the same period in 2017. See the fair value rollforward tables for the three months ended March 31, 2018 and 2017, for the transfers into and out of Level 3.
Contingent Consideration
The acquisition of Lattice Strategies LLC ("Lattice") in 2016 requires the Company to make payments to former owners of
Lattice of up to $60 contingent upon growth in exchange-traded products ("ETP") AUM over a four-year period beginning on the date of acquisition. The contingent consideration is measured at fair value on a quarterly basis by projecting future eligible ETP AUM over the contingency period to estimate the amount of expected payout. The future expected payout is discounted back to the valuation date using a risk-adjusted discount rate of 16.7% The risk-adjusted discount rate is an internally generated and significant unobservable input to fair value.
Level 3 Assets and Liabilities Measured at Fair Value on a Recurring Basis Using Significant Unobservable Inputs
The Company uses derivative instruments to manage the risk associated with certain assets and liabilities. However, the derivative instrument may not be classified with the same fair value hierarchy level as the associated asset or liability. Therefore, the realized and unrealized gains and losses on derivatives reported in the Level 3 rollforward may be offset by realized and unrealized gains and losses of the associated assets and liabilities in other line items of the financial statements.
24
THE HARTFORD FINANCIAL SERVICES GROUP, INC.
NOTES TO CONDENSED CONSOLIDATED FINANCIAL STATEMENTS (continued)
5. Fair Value Measurements (continued)
Fair Value Rollforwards for Financial Instruments Classified as Level 3 for the Three Months Ended March 31, 2018 | ||||||||||||||||||||||||||||
Total realized/unrealized gains (losses) | ||||||||||||||||||||||||||||
Fair value as of January 1, 2018 | Included in net income [1] [5] | Included in OCI [2] | Purchases | Settlements | Sales | Transfers into Level 3 [3] | Transfers out of Level 3 [3] | Fair value as of March 31, 2018 | ||||||||||||||||||||
Assets | ||||||||||||||||||||||||||||
Fixed Maturities, AFS | ||||||||||||||||||||||||||||
ABS | $ | 19 | $ | — | $ | — | $ | — | $ | (2 | ) | $ | — | $ | — | $ | (3 | ) | $ | 14 | ||||||||
CDOs | 95 | — | — | 21 | — | — | — | (10 | ) | 106 | ||||||||||||||||||
CMBS | 69 | — | (1 | ) | — | (1 | ) | — | — | (34 | ) | 33 | ||||||||||||||||
Corporate | 520 | 1 | (1 | ) | 65 | (14 | ) | (23 | ) | — | (33 | ) | 515 | |||||||||||||||
Foreign Govt./Govt. Agencies | 2 | — | — | — | — | — | — | — | 2 | |||||||||||||||||||
Municipal | 17 | — | (1 | ) | — | — | — | — | — | 16 | ||||||||||||||||||
RMBS | 1,230 | — | (3 | ) | 102 | (81 | ) | — | — | (15 | ) | 1,233 | ||||||||||||||||
Total Fixed Maturities, AFS | 1,952 | 1 | (6 | ) | 188 | (98 | ) | (23 | ) | — | (95 | ) | 1,919 | |||||||||||||||
Equity Securities, at fair value | 76 | 28 | — | — | — | (39 | ) | — | — | 65 | ||||||||||||||||||
Derivatives, net [4] | ||||||||||||||||||||||||||||
Equity | 1 | 2 | — | — | — | (2 | ) | — | — | 1 | ||||||||||||||||||
Interest rate | 1 | 1 | — | — | — | — | — | — | 2 | |||||||||||||||||||
Total Derivatives, net [4] | 2 | 3 | — | — | — | (2 | ) | — | — | 3 | ||||||||||||||||||
Total Assets | $ | 2,030 | $ | 32 | $ | (6 | ) | $ | 188 | $ | (98 | ) | $ | (64 | ) | $ | — | $ | (95 | ) | $ | 1,987 | ||||||
Liabilities | ||||||||||||||||||||||||||||
Contingent Consideration [6] | (29 | ) | 2 | — | — | — | — | — | — | (27 | ) | |||||||||||||||||
Total Liabilities | $ | (29 | ) | $ | 2 | $ | — | $ | — | $ | — | $ | — | $ | — | $ | — | $ | (27 | ) | ||||||||
25
THE HARTFORD FINANCIAL SERVICES GROUP, INC.
NOTES TO CONDENSED CONSOLIDATED FINANCIAL STATEMENTS (continued)
5. Fair Value Measurements (continued)
Fair Value Rollforwards for Financial Instruments Classified as Level 3 for the Three Months Ended March 31, 2017 | ||||||||||||||||||||||||||||
Total realized/unrealized gains (losses) | ||||||||||||||||||||||||||||
Fair value as of January 1, 2017 | Included in net income [1] [5] | Included in OCI [2] | Purchases | Settlements | Sales | Transfers into Level 3 [3] | Transfers out of Level 3 [3] | Fair value as of March 31, 2017 | ||||||||||||||||||||
Assets | ||||||||||||||||||||||||||||
Fixed Maturities, AFS | ||||||||||||||||||||||||||||
ABS | $ | 45 | $ | — | $ | — | $ | 33 | $ | (3 | ) | $ | — | $ | 23 | $ | (17 | ) | $ | 81 | ||||||||
CDOs | 154 | — | 3 | — | (1 | ) | — | — | (36 | ) | 120 | |||||||||||||||||
CMBS | 59 | (1 | ) | — | 28 | (2 | ) | — | — | (12 | ) | 72 | ||||||||||||||||
Corporate | 514 | 1 | 5 | 100 | (37 | ) | (97 | ) | 35 | — | 521 | |||||||||||||||||
Foreign Govt./Govt. Agencies | 47 | — | 2 | — | — | — | — | — | 49 | |||||||||||||||||||
Municipal | 46 | — | 3 | — | — | (5 | ) | — | — | 44 | ||||||||||||||||||
RMBS | 1,261 | — | 4 | 88 | (55 | ) | (7 | ) | — | — | 1,291 | |||||||||||||||||
Total Fixed Maturities, AFS | 2,126 | — | 17 | 249 | (98 | ) | (109 | ) | 58 | (65 | ) | 2,178 | ||||||||||||||||
Fixed Maturities, FVO | 11 | — | — | 4 | (2 | ) | (13 | ) | — | — | — | |||||||||||||||||
Equity Securities, AFS | 55 | — | (2 | ) | 2 | — | — | — | — | 55 | ||||||||||||||||||
Derivatives, net [4] | ||||||||||||||||||||||||||||
Equity | — | (1 | ) | — | 5 | — | — | — | — | 4 | ||||||||||||||||||
Interest rate | 9 | (4 | ) | — | — | — | — | — | — | 5 | ||||||||||||||||||
Other contracts | 1 | (1 | ) | — | — | — | — | — | — | — | ||||||||||||||||||
Total Derivatives, net [4] | 10 | (6 | ) | — | 5 | — | — | — | — | 9 | ||||||||||||||||||
Total Assets | $ | 2,202 | $ | (6 | ) | $ | 15 | $ | 260 | $ | (100 | ) | $ | (122 | ) | $ | 58 | $ | (65 | ) | $ | 2,242 | ||||||
Liabilities | ||||||||||||||||||||||||||||
Contingent Consideration [6] | (25 | ) | (1 | ) | — | — | — | — | — | — | (26 | ) | ||||||||||||||||
Total Liabilities | $ | (25 | ) | $ | (1 | ) | $ | — | $ | — | $ | — | $ | — | $ | — | $ | — | $ | (26 | ) | |||||||
[1] | Amounts in these columns are generally reported in net realized capital gains (losses). All amounts are before income taxes. |
[2] | All amounts are before income taxes. |
[3] | Transfers in and/or (out) of Level 3 are primarily attributable to the availability of market observable information and the re-evaluation of the observability of pricing inputs. |
[4] | Derivative instruments are reported in this table on a net basis for asset (liability) positions and reported in the Condensed Consolidated Balance Sheets in other investments and other liabilities. |
[5] | Includes both market and non-market impacts in deriving realized and unrealized gains (losses). |
[6] | For additional information, see Note 2 - Business Acquisitions of Notes to Consolidated Financial Statements included in the Company's 2017 form 10-K Annual Report for discussion of the contingent consideration in connection with the acquisition of Lattice. |
26
THE HARTFORD FINANCIAL SERVICES GROUP, INC.
NOTES TO CONDENSED CONSOLIDATED FINANCIAL STATEMENTS (continued)
5. Fair Value Measurements (continued)
Changes in Unrealized Gains (Losses) Included in Net Income for Financial Instruments Classified as Level 3 Still Held at End of Period | |||||||
Three months ended March 31, | |||||||
2018 [1] [2] | 2017 [1] [2] | ||||||
Assets | |||||||
Fixed Maturities, AFS | |||||||
CMBS | $ | — | $ | (1 | ) | ||
Total Fixed Maturities, AFS | — | (1 | ) | ||||
Derivatives, net | |||||||
Equity | — | (1 | ) | ||||
Interest rate | 1 | (3 | ) | ||||
Total Derivatives, net | 1 | (4 | ) | ||||
Total Assets | $ | 1 | $ | (5 | ) | ||
Liabilities | |||||||
Contingent Consideration [3] | 2 | (1 | ) | ||||
Total Liabilities | $ | 2 | $ | (1 | ) | ||
[1] | All amounts in these rows are reported in net realized capital gains (losses). All amounts are before income taxes. |
[2] | Amounts presented are for Level 3 only and therefore may not agree to other disclosures included herein. |
[3] | For additional information, see Note 2 - Business Acquisitions of Notes to Consolidated Financial Statements included in the Company's 2017 form 10-K Annual Report for discussion of the contingent consideration in connection with the acquisition of Lattice. |
Fair Value Option
The Company has elected the fair value option for certain securities that contain embedded credit derivatives with underlying credit risk primarily related to residential real estate, and these securities are included within Fixed Maturities, FVO on the Condensed Consolidated Balance Sheets. For certain previously consolidated investment funds, the Company classified the underlying fixed maturities within Fixed Maturities, FVO as a result of the Company's management, control and significant ownership interest of the funds. The Company reported the underlying fixed maturities of these consolidated investment companies at fair value with changes in the fair value of these securities recognized in net realized capital gains and losses, which is consistent with accounting requirements for investment companies.
Changes in Fair Value of Assets using Fair Value Option | ||||||
Three Months Ended March 31, | ||||||
2018 | 2017 | |||||
Assets | ||||||
Fixed maturities, FVO | ||||||
Corporate | $ | — | $ | (1 | ) | |
Total realized capital gains (losses) | $ | — | $ | (1 | ) | |
Fair Value of Assets and Liabilities using the Fair Value Option | ||||||
March 31, 2018 | December 31, 2017 | |||||
Assets | ||||||
Fixed maturities, FVO | ||||||
RMBS | $ | 38 | $ | 41 | ||
Total fixed maturities, FVO | $ | 38 | $ | 41 | ||
27
THE HARTFORD FINANCIAL SERVICES GROUP, INC.
NOTES TO CONDENSED CONSOLIDATED FINANCIAL STATEMENTS (continued)
5. Fair Value Measurements (continued)
Financial Instruments Not Carried at Fair Value
Financial Assets and Liabilities Not Carried at Fair Value | |||||||
Fair Value Hierarchy Level | Carrying Amount | Fair Value | |||||
March 31, 2018 | |||||||
Assets | |||||||
Mortgage loans | Level 3 | $ | 3,221 | $ | 3,220 | ||
Liabilities | |||||||
Other policyholder funds and benefits payable | Level 3 | $ | 809 | $ | 811 | ||
Senior notes [1] | Level 2 | $ | 3,585 | $ | 4,097 | ||
Junior subordinated debentures [1] | Level 2 | $ | 1,583 | $ | 1,694 | ||
December 31, 2017 | |||||||
Assets | |||||||
Mortgage loans | Level 3 | $ | 3,175 | $ | 3,220 | ||
Liabilities | |||||||
Other policyholder funds and benefits payable | Level 3 | $ | 825 | $ | 827 | ||
Senior notes [1] | Level 2 | $ | 3,415 | $ | 4,054 | ||
Junior subordinated debentures [1] | Level 2 | $ | 1,583 | $ | 1,699 | ||
[1] | Included in long-term debt in the Consolidated Balance Sheets, except for current maturities, which are included in short-term debt. |
28
THE HARTFORD FINANCIAL SERVICES GROUP, INC.
NOTES TO CONDENSED CONSOLIDATED FINANCIAL STATEMENTS (continued)
6. Investments
Net Realized Capital Gains (Losses) | ||||||
Three Months Ended March 31, | ||||||
(Before tax) | 2018 | 2017 | ||||
Gross gains on sales | $ | 19 | $ | 61 | ||
Gross losses on sales | (57 | ) | (46 | ) | ||
Equity securities [1] | 16 | — | ||||
Net OTTI losses recognized in earnings | — | (1 | ) | |||
Transactional foreign currency revaluation | 1 | 6 | ||||
Non-qualifying foreign currency derivatives | (3 | ) | (7 | ) | ||
Other, net [2] | (6 | ) | 11 | |||
Net realized capital gains (losses) | $ | (30 | ) | $ | 24 | |
[1] | Effective January 1, 2018, with adoption of new accounting guidance for equity securities at fair value, includes all changes in fair value and trading gains and losses for equity securities. |
[2] | Includes gains (losses) on non-qualifying derivatives, excluding foreign currency derivatives, of $(10) and $7, respectively, for the three months ended March 31, 2018 and 2017. |
Net realized capital gains and losses from investment sales are reported as a component of revenues and are determined on a specific identification basis. Before tax, net gains (losses) on sales and impairments previously reported as unrealized gains or losses in AOCI were $(38) and $14 for the three months ended March 31, 2018 and 2017, respectively. Proceeds from sales of AFS securities totaled $4.3 billion for the three months ended March 31, 2018 and the three months ended March 31, 2017. Effective January 1, 2018, with adoption of new accounting guidance for equity securities, the proceeds from sales of AFS securities no longer includes equity securities.
The net unrealized gain (loss) on equity securities included in net realized capital gains (losses) related to equity securities still held as of March 31, 2018, was $(14) for the three months ended March 31, 2018. Prior to January 1, 2018, these amounts were included in net unrealized gains (losses) in AOCI.
Recognition and Presentation of Other-Than-Temporary Impairments
The Company will record an other-than-temporary impairment (“OTTI”) for fixed maturities if the Company intends to sell or it is more likely than not that the Company will be required to sell the security before a recovery in value. A corresponding charge is recorded in net realized capital losses equal to the difference between the fair value and amortized cost basis of the security.
The Company will also record an OTTI for those fixed maturities for which the Company does not expect to recover the entire amortized cost basis. For these securities, the excess of the amortized cost basis over its fair value is separated into the portion representing a credit OTTI, which is recorded in net realized capital losses, and the remaining non-credit amount, which is recorded in OCI. The credit OTTI amount is the excess of its amortized cost basis over the Company’s best estimate of discounted expected future cash flows. The non-credit amount is
the excess of the best estimate of the discounted expected future cash flows over the fair value. The Company’s best estimate of discounted expected future cash flows becomes the new cost basis and accretes prospectively into net investment income over the estimated remaining life of the security.
Developing the Company’s best estimate of expected future cash flows is a quantitative and qualitative process that incorporates information received from third-party sources along with certain internal assumptions regarding the future performance. The Company's considerations include, but are not limited to, (a) changes in the financial condition of the issuer and the underlying collateral, (b) whether the issuer is current on contractually obligated interest and principal payments, (c) credit ratings, (d) payment structure of the security and (e) the extent to which the fair value has been less than the amortized cost of the security.
For non-structured securities, assumptions include, but are not limited to, economic and industry-specific trends and fundamentals, security-specific developments, industry earnings multiples and the issuer’s ability to restructure and execute asset sales.
For structured securities, assumptions include, but are not limited to, various performance indicators such as historical and projected default and recovery rates, credit ratings, current and projected delinquency rates, loan-to-value ("LTV") ratios, average cumulative collateral loss rates that vary by vintage year, prepayment speeds, and property value declines. These assumptions require the use of significant management judgment and include the probability of issuer default and estimates regarding timing and amount of expected recoveries which may include estimating the underlying collateral value.
Prior to January 1, 2018, the Company recorded an OTTI for certain equity securities with debt-like characteristics if the Company intended to sell or it was more likely than not that the Company was required to sell the security before a recovery in value as well as for those equity securities for which the Company did not expect to recover the entire amortized cost basis. The Company also recorded an OTTI for equity securities where the decline in the fair value was deemed to be other-than-temporary. For further discussion of these policies, see Recognition and Presentation of Other-Than-Temporary Impairments within Note 6 - Investments of Notes to Consolidated Financial Statements included in the Company’s 2017 Form 10-K Annual Report.
Impairments in Earnings by Type | ||||||
Three Months Ended March 31, | ||||||
2018 | 2017 | |||||
Credit impairments | $ | — | $ | 1 | ||
Intent-to-sell impairments | — | — | ||||
Impairments on equity securities | — | — | ||||
Total impairments | $ | — | $ | 1 | ||
29
THE HARTFORD FINANCIAL SERVICES GROUP, INC.
NOTES TO CONDENSED CONSOLIDATED FINANCIAL STATEMENTS (continued)
6. Investments (continued)
Cumulative Credit Impairments | ||||||
Three Months Ended March 31, | ||||||
(Before tax) | 2018 | 2017 | ||||
Balance as of beginning of period | $ | (25 | ) | $ | (110 | ) |
Additions for credit impairments recognized on [1]: | ||||||
Securities not previously impaired | — | (1 | ) | |||
Reductions for credit impairments previously recognized on: | ||||||
Securities that matured or were sold during the period | 4 | 7 | ||||
Securities due to an increase in expected cash flows | — | 5 | ||||
Balance as of end of period | $ | (21 | ) | $ | (99 | ) |
[1] | These additions are included in the net OTTI losses recognized in earnings in the Condensed Consolidated Statements of Operations. |
Available-for-Sale Securities
AFS Securities by Type | ||||||||||||||||||||||||||||||
March 31, 2018 | December 31, 2017 | |||||||||||||||||||||||||||||
Cost or Amortized Cost | Gross Unrealized Gains | Gross Unrealized Losses | Fair Value | Non-Credit OTTI [1] | Cost or Amortized Cost | Gross Unrealized Gains | Gross Unrealized Losses | Fair Value | Non-Credit OTTI [1] | |||||||||||||||||||||
ABS | $ | 911 | $ | 6 | $ | (6 | ) | $ | 911 | $ | — | $ | 1,119 | $ | 9 | $ | (2 | ) | $ | 1,126 | $ | — | ||||||||
CDOs | 1,145 | 1 | (2 | ) | 1,144 | — | 1,257 | 3 | — | 1,260 | — | |||||||||||||||||||
CMBS | 3,334 | 34 | (57 | ) | 3,311 | (5 | ) | 3,304 | 58 | (26 | ) | 3,336 | (5 | ) | ||||||||||||||||
Corporate | 12,550 | 294 | (210 | ) | 12,634 | — | 12,370 | 490 | (56 | ) | 12,804 | — | ||||||||||||||||||
Foreign govt./govt. agencies | 1,076 | 22 | (16 | ) | 1,082 | — | 1,071 | 43 | (4 | ) | 1,110 | — | ||||||||||||||||||
Municipal | 11,052 | 541 | (49 | ) | 11,544 | — | 11,743 | 754 | (12 | ) | 12,485 | — | ||||||||||||||||||
RMBS | 3,064 | 54 | (32 | ) | 3,086 | — | 2,985 | 63 | (4 | ) | 3,044 | — | ||||||||||||||||||
U.S. Treasuries | 2,198 | 35 | (21 | ) | 2,212 | — | 1,763 | 46 | (10 | ) | 1,799 | — | ||||||||||||||||||
Total fixed maturities, AFS | 35,330 | 987 | (393 | ) | 35,924 | (5 | ) | 35,612 | 1,466 | (114 | ) | 36,964 | (5 | ) | ||||||||||||||||
Equity securities, AFS [2] | 907 | 121 | (16 | ) | 1,012 | — | ||||||||||||||||||||||||
Total AFS securities | $ | 35,330 | $ | 987 | $ | (393 | ) | $ | 35,924 | $ | (5 | ) | $ | 36,519 | $ | 1,587 | $ | (130 | ) | $ | 37,976 | $ | (5 | ) | ||||||
[1] | Represents the amount of cumulative non-credit OTTI losses recognized in OCI on securities that also had credit impairments. These losses are included in gross unrealized losses in AOCI as of March 31, 2018, and December 31, 2017. |
[2] | Effective January 1, 2018, with the adoption of new accounting standards for financial instruments, equity securities, AFS were reclassified to equity securities at fair value and are excluded from the table above as of March 31, 2018. |
30
THE HARTFORD FINANCIAL SERVICES GROUP, INC.
NOTES TO CONDENSED CONSOLIDATED FINANCIAL STATEMENTS (continued)
6. Investments (continued)
Fixed maturities, AFS, by Contractual Maturity Year | ||||||||||||
March 31, 2018 | December 31, 2017 | |||||||||||
Amortized Cost | Fair Value | Amortized Cost | Fair Value | |||||||||
One year or less | $ | 1,425 | $ | 1,430 | $ | 1,507 | $ | 1,513 | ||||
Over one year through five years | 5,361 | 5,414 | 5,007 | 5,119 | ||||||||
Over five years through ten years | 6,499 | 6,525 | 6,505 | 6,700 | ||||||||
Over ten years | 13,591 | 14,103 | 13,928 | 14,866 | ||||||||
Subtotal | 26,876 | 27,472 | 26,947 | 28,198 | ||||||||
Mortgage-backed and asset-backed securities | 8,454 | 8,452 | 8,665 | 8,766 | ||||||||
Total fixed maturities, AFS | $ | 35,330 | $ | 35,924 | $ | 35,612 | $ | 36,964 | ||||
Estimated maturities may differ from contractual maturities due to security call or prepayment provisions. Due to the potential for variability in payment speeds (i.e. prepayments or extensions), mortgage-backed and asset-backed securities are not categorized by contractual maturity.
Concentration of Credit Risk
The Company aims to maintain a diversified investment portfolio including issuer, sector and geographic stratification, where
applicable, and has established certain exposure limits, diversification standards and review procedures to mitigate credit risk. The Company had no investment exposure to any credit concentration risk of a single issuer greater than 10% of the Company's stockholders' equity, other than the U.S. government and certain U.S. government agencies as of March 31, 2018 or December 31, 2017.
Unrealized Losses on AFS Securities
Unrealized Loss Aging for AFS Securities by Type and Length of Time as of March 31, 2018 | |||||||||||||||||||||||||||
Less Than 12 Months | 12 Months or More | Total | |||||||||||||||||||||||||
Amortized Cost | Fair Value | Unrealized Losses | Amortized Cost | Fair Value | Unrealized Losses | Amortized Cost | Fair Value | Unrealized Losses | |||||||||||||||||||
ABS | $ | 520 | $ | 515 | $ | (5 | ) | $ | 33 | $ | 32 | $ | (1 | ) | $ | 553 | $ | 547 | $ | (6 | ) | ||||||
CDOs | 905 | 903 | (2 | ) | — | — | — | 905 | 903 | (2 | ) | ||||||||||||||||
CMBS | 1,701 | 1,662 | (39 | ) | 242 | 224 | (18 | ) | 1,943 | 1,886 | (57 | ) | |||||||||||||||
Corporate | 5,931 | 5,785 | (146 | ) | 1,066 | 1,002 | (64 | ) | 6,997 | 6,787 | (210 | ) | |||||||||||||||
Foreign govt./govt. agencies | 552 | 539 | (13 | ) | 51 | 48 | (3 | ) | 603 | 587 | (16 | ) | |||||||||||||||
Municipal | 2,077 | 2,044 | (33 | ) | 230 | 214 | (16 | ) | 2,307 | 2,258 | (49 | ) | |||||||||||||||
RMBS | 1,448 | 1,421 | (27 | ) | 132 | 127 | (5 | ) | 1,580 | 1,548 | (32 | ) | |||||||||||||||
U.S. Treasuries | 850 | 838 | (12 | ) | 272 | 263 | (9 | ) | 1,122 | 1,101 | (21 | ) | |||||||||||||||
Total fixed maturities, AFS in an unrealized loss position | 13,984 | 13,707 | (277 | ) | 2,026 | 1,910 | (116 | ) | 16,010 | 15,617 | (393 | ) | |||||||||||||||
31
THE HARTFORD FINANCIAL SERVICES GROUP, INC.
NOTES TO CONDENSED CONSOLIDATED FINANCIAL STATEMENTS (continued)
6. Investments (continued)
Unrealized Loss Aging for AFS Securities by Type and Length of Time as of December 31, 2017 | |||||||||||||||||||||||||||
Less Than 12 Months | 12 Months or More | Total | |||||||||||||||||||||||||
Amortized Cost | Fair Value | Unrealized Losses | Amortized Cost | Fair Value | Unrealized Losses | Amortized Cost | Fair Value | Unrealized Losses | |||||||||||||||||||
ABS | $ | 461 | $ | 460 | $ | (1 | ) | $ | 30 | $ | 29 | $ | (1 | ) | $ | 491 | $ | 489 | $ | (2 | ) | ||||||
CDOs | 359 | 359 | — | 1 | 1 | — | 360 | 360 | — | ||||||||||||||||||
CMBS | 1,178 | 1,167 | (11 | ) | 243 | 228 | (15 | ) | 1,421 | 1,395 | (26 | ) | |||||||||||||||
Corporate | 2,322 | 2,302 | (20 | ) | 1,064 | 1,028 | (36 | ) | 3,386 | 3,330 | (56 | ) | |||||||||||||||
Foreign govt./govt. agencies | 244 | 242 | (2 | ) | 51 | 49 | (2 | ) | 295 | 291 | (4 | ) | |||||||||||||||
Municipal | 511 | 507 | (4 | ) | 236 | 228 | (8 | ) | 747 | 735 | (12 | ) | |||||||||||||||
RMBS | 889 | 887 | (2 | ) | 137 | 135 | (2 | ) | 1,026 | 1,022 | (4 | ) | |||||||||||||||
U.S. Treasuries | 658 | 652 | (6 | ) | 254 | 250 | (4 | ) | 912 | 902 | (10 | ) | |||||||||||||||
Total fixed maturities, AFS | 6,622 | 6,576 | (46 | ) | 2,016 | 1,948 | (68 | ) | 8,638 | 8,524 | (114 | ) | |||||||||||||||
Equity securities, AFS [1] | 176 | 163 | (13 | ) | 24 | 21 | (3 | ) | 200 | 184 | (16 | ) | |||||||||||||||
Total securities in an unrealized loss position | $ | 6,798 | $ | 6,739 | $ | (59 | ) | $ | 2,040 | $ | 1,969 | $ | (71 | ) | $ | 8,838 | $ | 8,708 | $ | (130 | ) | ||||||
[1]Effective January 1, 2018, with the adoption of new accounting guidance for financial instruments, equity securities, AFS were reclassified to equity securities at fair value and are excluded from the table above as of March 31, 2018.
As of March 31, 2018, AFS securities in an unrealized loss position consisted of 2,629 securities, primarily in the corporate, municipal and commercial real estate sectors, which were depressed primarily due to an increase in interest rates and/or widening of credit spreads since the securities were purchased. As of March 31, 2018, 98% of these securities were depressed less than 20% of cost or amortized cost. The increase in unrealized losses during the three months ended March 31, 2018 was primarily attributable to higher interest rates and wider credit spreads.
Most of the securities depressed for twelve months or more relate to corporate securities and structured securities with exposure to commercial real estate. Corporate securities and commercial real estate securities were primarily depressed because current market spreads are wider than spreads at the securities' respective purchase dates. Certain other corporate securities were depressed because the securities have floating-rate coupons and have long-dated maturities, and current credit spreads are wider than when these securities were purchased. The Company neither has an intention to sell nor does it expect to be required to sell the securities outlined in the preceding discussion.
Mortgage Loans
Mortgage Loan Valuation Allowances
Commercial mortgage loans are considered to be impaired when management estimates that, based upon current information and events, it is probable that the Company will be unable to collect amounts due according to the contractual terms of the loan agreement. The Company reviews mortgage loans on a quarterly basis to identify potential credit losses. Among other factors, management reviews current and projected macroeconomic trends, such as unemployment rates and property-specific factors such as rental rates, occupancy levels, LTV ratios and debt service coverage ratios (“DSCR”). In addition, the Company considers
historical, current and projected delinquency rates and property values. Estimates of collectibility require the use of significant management judgment and include the probability and timing of borrower default and loss severity estimates. In addition, cash flow projections may change based upon new information about the borrower's ability to pay and/or the value of underlying collateral such as changes in projected property value estimates.
For mortgage loans that are deemed impaired, a valuation allowance is established for the difference between the carrying amount and estimated fair value. The mortgage loan's estimated fair value is most frequently the Company's share of the fair value of the collateral but may also be the Company’s share of either (a) the present value of the expected future cash flows discounted at the loan’s effective interest rate or (b) the loan’s observable market price. A valuation allowance may be recorded for an individual loan or for a group of loans that have an LTV ratio of 90% or greater, a low DSCR or have other lower credit quality characteristics. Changes in valuation allowances are recorded in net realized capital gains and losses. Interest income on impaired loans is accrued to the extent it is deemed collectible and the borrowers continue to make payments under the original or restructured loan terms. The Company stops accruing interest income on loans when it is probable that the Company will not receive interest and principal payments according to the contractual terms of the loan agreement. The Company resumes accruing interest income when it determines that sufficient collateral exists to satisfy the full amount of the loan principal and interest payments and when it is probable cash will be received in the foreseeable future. Interest income on defaulted loans is recognized when received.
As of both March 31, 2018 and December 31, 2017, commercial mortgage loans had an amortized cost and carrying value of $3.2 billion, with a valuation allowance of $1.
As of both March 31, 2018 and December 31, 2017, the carrying value of mortgage loans that had a valuation allowance was $24.
32
THE HARTFORD FINANCIAL SERVICES GROUP, INC.
NOTES TO CONDENSED CONSOLIDATED FINANCIAL STATEMENTS (continued)
6. Investments (continued)
There were no mortgage loans held-for-sale as of March 31, 2018 or December 31, 2017. As of March 31, 2018, the Company had an immaterial amount of mortgage loans that have had extensions or restructurings other than what is allowable under the original terms of the contract.
The following table presents the activity within the Company’s valuation allowance for mortgage loans. These loans have been evaluated both individually and collectively for impairment. Loans evaluated collectively for impairment are immaterial.
Valuation Allowance Activity | ||||||
2018 | 2017 | |||||
Balance, as of January 1 | $ | (1 | ) | $ | — | |
Reversals | — | — | ||||
Deductions | — | — | ||||
Balance, as of March 31 | $ | (1 | ) | $ | — | |
The weighted-average LTV ratio of the Company’s commercial mortgage loan portfolio was 51% as of March 31, 2018, while the weighted-average LTV ratio at origination of these loans was 61%. LTV ratios compare the loan amount to the value of the underlying property collateralizing the loan. The loan collateral values are updated no less than annually through reviews of the underlying properties. Factors considered in estimating property values include, among other things, actual and expected property cash flows, geographic market data and the ratio of the property's net operating income to its value. DSCR compares a property’s net operating income to the borrower’s principal and interest payments. As of March 31, 2018 and December 31, 2017, the Company held no delinquent commercial mortgage loans past due by 90 days or more.
Commercial Mortgage Loans Credit Quality | ||||||||
March 31, 2018 | December 31, 2017 | |||||||
Loan-to-value | Carrying Value | Avg. Debt-Service Coverage Ratio | Carrying Value | Avg. Debt-Service Coverage Ratio | ||||
Greater than 80% | $ | — | 0.00x | $ | 18 | 1.27x | ||
65% - 80% | 265 | 1.95x | 265 | 1.95x | ||||
Less than 65% | 2,956 | 2.78x | 2,892 | 2.76x | ||||
Total commercial mortgage loans | $ | 3,221 | 2.71x | $ | 3,175 | 2.69x | ||
Mortgage Loans by Region | ||||||||||
March 31, 2018 | December 31, 2017 | |||||||||
Carrying Value | Percent of Total | Carrying Value | Percent of Total | |||||||
East North Central | $ | 251 | 7.8 | % | $ | 251 | 7.9 | % | ||
Middle Atlantic | 272 | 8.4 | % | 272 | 8.6 | % | ||||
Mountain | 31 | 1.0 | % | 31 | 1.0 | % | ||||
New England | 292 | 9.1 | % | 293 | 9.2 | % | ||||
Pacific | 828 | 25.7 | % | 760 | 23.9 | % | ||||
South Atlantic | 693 | 21.5 | % | 710 | 22.4 | % | ||||
West North Central | 148 | 4.6 | % | 149 | 4.7 | % | ||||
West South Central | 277 | 8.6 | % | 278 | 8.7 | % | ||||
Other [1] | 429 | 13.3 | % | 431 | 13.6 | % | ||||
Total mortgage loans | $ | 3,221 | 100.0 | % | $ | 3,175 | 100.0 | % | ||
[1] | Primarily represents loans collateralized by multiple properties in various regions. |
Mortgage Loans by Property Type | ||||||||||
March 31, 2018 | December 31, 2017 | |||||||||
Carrying Value | Percent of Total | Carrying Value | Percent of Total | |||||||
Commercial | ||||||||||
Industrial | $ | 830 | 25.8 | % | $ | 817 | 25.7 | % | ||
Multifamily | 1,043 | 32.4 | % | 1,006 | 31.7 | % | ||||
Office | 749 | 23.3 | % | 751 | 23.7 | % | ||||
Retail | 365 | 11.2 | % | 367 | 11.5 | % | ||||
Other | 234 | 7.3 | % | 234 | 7.4 | % | ||||
Total mortgage loans | $ | 3,221 | 100.0 | % | $ | 3,175 | 100.0 | % | ||
Mortgage Servicing
The Company originates, sells and services commercial mortgage loans on behalf of third parties and recognizes servicing fees income over the period that services are performed. As of March 31, 2018, under this program, the Company serviced commercial mortgage loans with a total outstanding principal of $1.5 billion, of which $581 was serviced on behalf of third parties, $652 was retained and reported in total investments and $225 was reported in assets held for sale on the Company's Condensed Consolidated Balance Sheets . As of December 31, 2017, the Company serviced commercial mortgage loans with a total outstanding principal balance of $1.3 billion, of which $402 was serviced on behalf of third parties, $566 was retained and reported in total investments and $356 was reported in assets held for sale on the Company's Consolidated Balance Sheets. Servicing rights are carried at the lower of cost or fair value and were zero as of March 31, 2018 and December 31, 2017, because servicing fees were market-level fees at origination and remain adequate to compensate the Company for servicing the loans.
33
THE HARTFORD FINANCIAL SERVICES GROUP, INC.
NOTES TO CONDENSED CONSOLIDATED FINANCIAL STATEMENTS (continued)
6. Investments (continued)
Variable Interest Entities
The Company is engaged with various special purpose entities and other entities that are deemed to be VIEs primarily as an investor through normal investment activities but also as an investment manager.
A VIE is an entity that either has investors that lack certain essential characteristics of a controlling financial interest, such as simple majority kick-out rights, or lacks sufficient funds to finance its own activities without financial support provided by other entities. The Company performs ongoing qualitative assessments of its VIEs to determine whether the Company has a controlling financial interest in the VIE and therefore is the primary beneficiary. The Company is deemed to have a controlling financial interest when it has both the ability to direct the activities that most significantly impact the economic performance of the VIE and the obligation to absorb losses or right to receive benefits from the VIE that could potentially be significant to the VIE. Based on the Company’s assessment, if it determines it is the primary beneficiary, the Company consolidates the VIE in the Company’s Condensed Consolidated Financial Statements.
Consolidated VIEs
As of March 31, 2018 and December 31, 2017, the Company did not hold any securities for which it is the primary beneficiary.
Non-Consolidated VIEs
The Company, through normal investment activities, makes passive investments in limited partnerships and other alternative investments. For these non-consolidated VIEs, the Company has determined it is not the primary beneficiary as it has no ability to direct activities that could significantly affect the economic performance of the investments. The Company’s maximum exposure to loss as of March 31, 2018 and December 31, 2017 was limited to the total carrying value of $967 and $920 which are included in limited partnerships and other alternative investments in the Company's Condensed Consolidated Balance Sheets. As of March 31, 2018 and December 31, 2017, the Company has outstanding commitments totaling $711 and $787, respectively, whereby the Company is committed to fund these investments and may be called by the partnership during the commitment period to fund the purchase of new investments and partnership expenses. These investments are generally of a passive nature in that the Company does not take an active role in management. For further discussion of these investments, see Equity Method Investments within Note 6 - Investments of Notes to Consolidated Financial Statements included in the Company’s 2017 Form 10-K Annual Report.
In addition, the Company also makes passive investments in structured securities issued by VIEs for which the Company is not the manager. These investments are included in ABS, CDOs, CMBS and RMBS in the Available-for-Sale Securities table and fixed maturities, FVO, in the Company’s Condensed Consolidated Balance Sheets. The Company has not provided financial or other support with respect to these investments other than its original investment. For these investments, the Company determined it is not the primary beneficiary due to the relative size of the Company’s investment in comparison to the principal amount of
the structured securities issued by the VIEs, the level of credit subordination which reduces the Company’s obligation to absorb losses or right to receive benefits and the Company’s inability to direct the activities that most significantly impact the economic performance of the VIEs. The Company’s maximum exposure to loss on these investments is limited to the amount of the Company’s investment.
Securities Lending, Repurchase Agreements and Other Collateral Transactions
The Company enters into securities financing transactions as a way to earn additional income or manage liquidity, primarily through securities lending and repurchase agreements.
Securities Lending
Under a securities lending program, the Company lends certain fixed maturities within the corporate, foreign government/government agencies, and municipal sectors as well as equity securities to qualifying third-party borrowers in return for collateral in the form of cash or securities. For domestic and non-domestic loaned securities, respectively, borrowers provide collateral of 102% and 105% of the fair value of the securities lent at the time of the loan. Borrowers will return the securities to the Company for cash or securities collateral at maturity dates generally of 90 days or less. Security collateral on deposit from counterparties in connection with securities lending transactions may not be sold or re-pledged, except in the event of default by the counterparty, and is not reflected on the Company’s Condensed Consolidated Balance Sheets. Additional collateral is obtained if the fair value of the collateral falls below 100% of the fair value of the loaned securities. The agreements provide the counterparty the right to sell or re-pledge the securities loaned. If cash, rather than securities, is received as collateral, the cash is typically invested in short-term investments or fixed maturities and is reported as an asset on the Company's Condensed Consolidated Balance Sheets. Income associated with securities lending transactions is reported as a component of net investment income in the Company’s Condensed Consolidated Statements of Operations.
Repurchase Agreements
From time to time, the Company enters into repurchase agreements to manage liquidity or to earn incremental income. A repurchase agreement is a transaction in which one party (transferor) agrees to sell securities to another party (transferee) in return for cash (or securities), with a simultaneous agreement to repurchase the same securities at a specified price at a later date. These transactions generally have a contractual maturity of ninety days or less. Repurchase agreements include master netting provisions that provide both counterparties the right to offset claims and apply securities held by them with respect to their obligations in the event of a default. Although the Company has the contractual right to offset claims, the Company's current positions do not meet the specific conditions for net presentation.
Under repurchase agreements, the Company transfers collateral of U.S. government and government agency securities and
34
THE HARTFORD FINANCIAL SERVICES GROUP, INC.
NOTES TO CONDENSED CONSOLIDATED FINANCIAL STATEMENTS (continued)
6. Investments (continued)
receives cash. For repurchase agreements, the Company obtains cash in an amount equal to at least 95% of the fair value of the securities transferred. The agreements require additional collateral to be transferred when necessary and provide the counterparty the right to sell or re-pledge the securities transferred. The cash received from the repurchase program is typically invested in short-term investments or fixed maturities and is reported as an asset on the Company's Condensed Consolidated Balance Sheets. The Company accounts for the repurchase agreements as collateralized borrowings. The securities transferred under repurchase agreements are included in fixed maturities, AFS with the obligation to repurchase those securities recorded in other liabilities on the Company's Condensed Consolidated Balance Sheets.
From time to time, the Company enters into reverse repurchase agreements where the Company purchases securities and simultaneously agrees to resell the same or substantially the same securities. The agreements require additional collateral to be transferred to the Company when necessary and the Company has the right to sell or re-pledge the securities received. The Company accounts for reverse repurchase agreements as collateralized financing.
Securities Lending and Repurchase Agreements | ||||||
March 31, 2018 | December 31, 2017 | |||||
Fair Value | Fair Value | |||||
Securities Lending Transactions: | ||||||
Gross amount of securities on loan | $ | 741 | $ | 922 | ||
Gross amount of associated liability for collateral received [1] | $ | 755 | $ | 945 | ||
Repurchase agreements: | ||||||
Gross amount of recognized liabilities for repurchase agreements | $ | 171 | $ | 174 | ||
Gross amount of collateral pledged related to repurchase agreements [2] | $ | 174 | $ | 176 | ||
[1] | Cash collateral received is reinvested in fixed maturities, AFS and short term investments which are included in the Condensed Consolidated Balance Sheets. Amount includes additional securities collateral received of $4 and $0 million which are excluded from the Company's Condensed Consolidated Balance Sheets as of March 31, 2018 and December 31, 2017, respectively. |
[2] | Collateral pledged is included within fixed maturities, AFS and short term investments in the Company's Condensed Consolidated Balance Sheets. |
Other Collateral Transactions
The Company is required by law to deposit securities with government agencies in certain states in which it conducts business. As of March 31, 2018 and December 31, 2017, the fair value of securities on deposit was $2.6 billion and $2.5 billion, respectively.
As of March 31, 2018 and December 31, 2017, the Company pledged collateral of $46 and $104, respectively, of U.S. government securities and government agency securities or cash primarily related to certain bank loan participations committed to through a limited partnership agreement. These amounts also include collateral related to letters of credit.
For disclosure of collateral in support of derivative transactions, refer to the Derivative Collateral Arrangements section of Note 7 - Derivative Instruments of Notes to Condensed Consolidated Financial Statements.
35
THE HARTFORD FINANCIAL SERVICES GROUP, INC.
NOTES TO CONSOLIDATED FINANCIAL STATEMENTS (continued)
7. Derivative Instruments
The Company utilizes a variety of OTC, OTC-cleared and exchange traded derivative instruments as a part of its overall risk management strategy as well as to enter into replication transactions. Derivative instruments are used to manage risk associated with interest rate, equity market, credit spread, issuer default, price, and currency exchange rate risk or volatility. Replication transactions are used as an economical means to synthetically replicate the characteristics and performance of assets that are permissible investments under the Company’s investment policies.
Strategies that Qualify for Hedge Accounting
Some of the Company's derivatives satisfy hedge accounting requirements as outlined in Note 1 - Basis of Presentation and Significant Accounting Policies of Notes to Consolidated Financial Statements, included in The Hartford’s 2017 Form 10-K Annual Report. Typically, these hedging instruments include interest rate swaps and, to a lesser extent, foreign currency swaps where the terms or expected cash flows of the hedged item closely match the terms of the swap. The interest rate swaps are typically used to manage interest rate duration of certain fixed maturity securities. The hedge strategies by hedge accounting designation include:
Cash Flow Hedges
Interest rate swaps are predominantly used to manage portfolio duration and better match cash receipts from assets with cash disbursements required to fund liabilities. These derivatives primarily convert interest receipts on floating-rate fixed maturity securities to fixed rates. The Company has also entered into interest rate swaps to convert the variable interest payments on junior subordinated debt to fixed interest payments. For further information, see the Junior Subordinated Debentures section within Note 13 - Debt of Notes to the Consolidated Financial Statements, included in The Hartford's 2017 Form 10-K Annual Report.
The Company also enters into forward starting swap agreements to hedge the interest rate exposure related to the future purchase of fixed-rate securities, primarily to hedge interest rate risk inherent in the assumptions used to price certain group benefits liabilities.
Foreign currency swaps are used to convert foreign currency-denominated cash flows related to certain investment receipts to U.S. dollars in order to reduce cash flow fluctuations due to changes in currency rates.
Non-qualifying Strategies
Derivative relationships that do not qualify for hedge accounting (“non-qualifying strategies”) primarily include hedging and replication strategies that utilize credit default swaps. In addition, hedges of interest rate, foreign currency and equity risk of certain fixed maturities and equities do not qualify for hedge accounting. The non-qualifying strategies include:
Credit Contracts
Credit default swaps are used to purchase credit protection on an individual entity or referenced index to economically hedge against default risk and credit-related changes in the value of fixed maturity securities. Credit default swaps are also used to assume credit risk related to an individual entity or referenced index as a part of replication transactions. These contracts require the Company to pay or receive a periodic fee in exchange for compensation from the counterparty should the referenced security issuers experience a credit event, as defined in the contract. The Company also enters into credit default swaps to terminate existing credit default swaps, thereby offsetting the changes in value of the original swap going forward.
Interest Rate Swaps, Swaptions and Futures
The Company uses interest rate swaps, swaptions and futures to manage interest rate duration between assets and liabilities in certain investment portfolios. In addition, the Company enters into interest rate swaps to terminate existing swaps, thereby offsetting the changes in value of the original swap going forward. As of March 31, 2018 and December 31, 2017, the notional amount of interest rate swaps in offsetting relationships was $7.2 billion and $7.3 billion, respectively.
Foreign Currency Swaps and Forwards
The Company enters into foreign currency swaps to convert the foreign currency exposures of certain foreign currency-denominated fixed maturity investments to U.S. dollars. The Company may at times enter into foreign currency forwards to hedge non-U.S. dollar denominated cash and, previously, equity securities. The Company previously entered into foreign currency forwards to hedge currency impacts on changes in equity of the U.K. property and casualty run-off subsidiaries that were sold in May 2017. For further information on the disposition, see Note 2 - Business Acquisitions of Notes to Consolidated Financial Statements, included in The Hartford's 2017 Form 10-K Annual Report.
Equity Index Options
The Company enters into equity index options to hedge the impact of a decline in the equity markets on the investment portfolio.
Derivative Balance Sheet Classification
For reporting purposes, the Company has elected to offset within assets or liabilities based upon the net of the fair value amounts, income accruals, and related cash collateral receivables and payables of OTC derivative instruments executed in a legal entity and with the same counterparty under a master netting agreement, which provides the Company with the legal right of offset. The following fair value amounts do not include income accruals or related cash collateral receivables and payables, which are netted with derivative fair value amounts to determine balance sheet presentation. The Company’s derivative instruments are held for risk management purposes, unless
36
THE HARTFORD FINANCIAL SERVICES GROUP, INC.
NOTES TO CONDENSED CONSOLIDATED FINANCIAL STATEMENTS (continued)
7. Derivative Instruments (continued)
otherwise noted in the following table. The notional amount of derivative contracts represents the basis upon which pay or receive amounts are calculated and is presented in the table to
quantify the volume of the Company’s derivative activity. Notional amounts are not necessarily reflective of credit risk.
Derivative Balance Sheet Presentation | ||||||||||||||||||||||||
Net Derivatives | Asset Derivatives | Liability Derivatives | ||||||||||||||||||||||
Notional Amount | Fair Value | Fair Value | Fair Value | |||||||||||||||||||||
Hedge Designation/ Derivative Type | Mar. 31, 2018 | Dec. 31, 2017 | Mar. 31, 2018 | Dec. 31, 2017 | Mar. 31, 2018 | Dec. 31, 2017 | Mar. 31, 2018 | Dec. 31, 2017 | ||||||||||||||||
Cash flow hedges | ||||||||||||||||||||||||
Interest rate swaps | $ | 2,176 | $ | 2,190 | $ | — | $ | — | $ | 137 | $ | 94 | $ | (137 | ) | $ | (94 | ) | ||||||
Foreign currency swaps | 153 | 153 | (20 | ) | (13 | ) | — | — | (20 | ) | (13 | ) | ||||||||||||
Total cash flow hedges | 2,329 | 2,343 | (20 | ) | (13 | ) | 137 | 94 | (157 | ) | (107 | ) | ||||||||||||
Non-qualifying strategies | ||||||||||||||||||||||||
Interest rate contracts | ||||||||||||||||||||||||
Interest rate swaps and futures | 8,108 | 7,986 | (66 | ) | (83 | ) | 338 | 340 | (404 | ) | (423 | ) | ||||||||||||
Foreign exchange contracts | ||||||||||||||||||||||||
Foreign currency swaps and forwards | 362 | 213 | (1 | ) | (1 | ) | 1 | — | (2 | ) | (1 | ) | ||||||||||||
Credit contracts | ||||||||||||||||||||||||
Credit derivatives that purchase credit protection | 7 | 61 | — | 1 | — | 1 | — | — | ||||||||||||||||
Credit derivatives that assume credit risk [1] | 978 | 823 | 12 | 3 | 14 | 20 | (2 | ) | (17 | ) | ||||||||||||||
Credit derivatives in offsetting positions | 965 | 1,046 | — | 2 | 8 | 13 | (8 | ) | (11 | ) | ||||||||||||||
Equity contracts | ||||||||||||||||||||||||
Equity index swaps and options | 126 | 258 | 1 | 1 | 1 | 1 | — | — | ||||||||||||||||
Total non-qualifying strategies | 10,546 | 10,387 | (54 | ) | (77 | ) | 362 | 375 | (416 | ) | (452 | ) | ||||||||||||
Total cash flow hedges and non-qualifying strategies | $ | 12,875 | $ | 12,730 | $ | (74 | ) | $ | (90 | ) | $ | 499 | $ | 469 | $ | (573 | ) | $ | (559 | ) | ||||
Balance Sheet Location | ||||||||||||||||||||||||
Fixed maturities, available-for-sale | $ | 153 | $ | 153 | $ | — | $ | — | $ | — | $ | — | $ | — | $ | — | ||||||||
Other investments | 1,702 | 9,957 | 12 | 10 | 35 | 448 | (23 | ) | (438 | ) | ||||||||||||||
Other liabilities | 11,020 | 2,620 | (86 | ) | (100 | ) | 464 | 21 | (550 | ) | (121 | ) | ||||||||||||
Total derivatives | $ | 12,875 | $ | 12,730 | $ | (74 | ) | $ | (90 | ) | $ | 499 | $ | 469 | $ | (573 | ) | $ | (559 | ) | ||||
[1] | The derivative instruments related to this strategy are held for other investment purposes. |
Offsetting of Derivative Assets/Liabilities
The following tables present the gross fair value amounts, the amounts offset, and net position of derivative instruments eligible for offset in the Company's Condensed Consolidated Balance Sheets. Amounts offset include fair value amounts, income
accruals and related cash collateral receivables and payables associated with derivative instruments that are traded under a common master netting agreement, as described in the preceding discussion. Also included in the tables are financial collateral receivables and payables, which are contractually permitted to be offset upon an event of default, although are disallowed for offsetting under U.S. GAAP.
37
THE HARTFORD FINANCIAL SERVICES GROUP, INC.
NOTES TO CONDENSED CONSOLIDATED FINANCIAL STATEMENTS (continued)
7. Derivative Instruments (continued)
Offsetting Derivative Assets and Liabilities | |||||||||||||||||||||||
(i) | (ii) | (iii) = (i) - (ii) | (iv) | (v) = (iii) - (iv) | |||||||||||||||||||
Net Amounts Presented in the Statement of Financial Position | Collateral Disallowed for Offset in the Statement of Financial Position | ||||||||||||||||||||||
Gross Amounts of Recognized Assets (Liabilities) | Gross Amounts Offset in the Statement of Financial Position | Derivative Assets [1] (Liabilities) [2] | Accrued Interest and Cash Collateral (Received) [3] Pledged [2] | Financial Collateral (Received) Pledged [4] | Net Amount | ||||||||||||||||||
As of March 31, 2018 | |||||||||||||||||||||||
Other investments | $ | 499 | $ | 497 | $ | 12 | $ | (10 | ) | $ | 2 | $ | — | ||||||||||
Other liabilities | $ | (573 | ) | $ | (478 | ) | $ | (86 | ) | $ | (9 | ) | $ | (85 | ) | $ | (10 | ) | |||||
As of December 31, 2017 | |||||||||||||||||||||||
Other investments | $ | 469 | $ | 466 | $ | 10 | $ | (7 | ) | $ | 1 | $ | 2 | ||||||||||
Other liabilities | $ | (559 | ) | $ | (454 | ) | $ | (100 | ) | $ | (5 | ) | $ | (96 | ) | $ | (9 | ) | |||||
[1] | Included in other investments in the Company's Condensed Consolidated Balance Sheets. |
[2] | Included in other liabilities in the Company's Condensed Consolidated Balance Sheets and is limited to the net derivative payable associated with each counterparty. |
[3] | Included in other investments in the Company's Condensed Consolidated Balance Sheets and is limited to the net derivative receivable associated with each counterparty. |
[4] | Excludes collateral associated with exchange-traded derivative instruments. |
Cash Flow Hedges
For derivative instruments that are designated and qualify as cash flow hedges, the effective portion of the gain or loss on the derivative is reported as a component of OCI and reclassified into earnings in the same period or periods during which the hedged transaction affects earnings. Gains and losses on the derivative representing hedge ineffectiveness are recognized in current period earnings. All components of each derivative’s gain or loss were included in the assessment of hedge effectiveness.
Derivatives in Cash Flow Hedging Relationships | |||||||
Gain (Loss) Recognized in OCI on Derivative (Effective Portion) | |||||||
Three Months Ended March 31, | |||||||
2018 | 2017 | ||||||
Interest rate swaps | $ | (14 | ) | $ | (3 | ) | |
Foreign currency swaps | (7 | ) | — | ||||
Total | $ | (21 | ) | $ | (3 | ) | |
Gain (Loss) Reclassified from AOCI into Income (Effective Portion) | |||||||
Three Months Ended March 31, | |||||||
2018 | 2017 | ||||||
Interest rate swaps | |||||||
Net realized capital gains | $ | 1 | $ | 4 | |||
Net investment income | 8 | 9 | |||||
Total | $ | 9 | $ | 13 | |||
During the three months ended March 31, 2018, and March 31, 2017, the Company had no ineffectiveness recognized in income within net realized capital gains (losses).
As of March 31, 2018, the before tax deferred net gains on derivative instruments recorded in AOCI that are expected to be reclassified to earnings during the next twelve months are $28. This expectation is based on the anticipated interest payments on hedged investments in fixed maturity securities that will occur over the next twelve months, at which time the Company will recognize the deferred net gains (losses) as an adjustment to net investment income over the term of the investment cash flows. The maximum term over which the Company is hedging its exposure to the variability of future cash flows for forecasted transactions, excluding interest payments on existing variable-rate financial instruments, is less than one year.
During the three months ended March 31, 2018, and March 31, 2017, the Company had no net reclassifications from AOCI to earnings resulting from the discontinuance of cash-flow hedges due to forecasted transactions that were no longer probable of occurring.
Non-Qualifying Strategies
For non-qualifying strategies, including embedded derivatives that are required to be bifurcated from their host contracts and accounted for as derivatives, the gain or loss on the derivative is recognized currently in earnings within net realized capital gains (losses).
38
THE HARTFORD FINANCIAL SERVICES GROUP, INC.
NOTES TO CONDENSED CONSOLIDATED FINANCIAL STATEMENTS (continued)
7. Derivative Instruments (continued)
Non-Qualifying Strategies Recognized within Net Realized Capital Gains (Losses) | ||||||
Three Months Ended March 31, | ||||||
2018 | 2017 | |||||
Foreign exchange contracts | ||||||
Foreign currency swaps and forwards | (3 | ) | (7 | ) | ||
Other non-qualifying derivatives | ||||||
Interest rate contracts | ||||||
Interest rate swaps, swaptions, and futures | (2 | ) | 5 | |||
Credit contracts | ||||||
Credit derivatives that purchase credit protection | (1 | ) | (5 | ) | ||
Credit derivatives that assume credit risk | (8 | ) | 9 | |||
Equity contracts | ||||||
Equity index swaps and options | 1 | (1 | ) | |||
Other | ||||||
Contingent capital facility put option | — | (1 | ) | |||
Total other non-qualifying derivatives | (10 | ) | 7 | |||
Total [1] | $ | (13 | ) | $ | — | |
[1] | Excludes investments that contain an embedded credit derivative for which the Company has elected the fair value option. For further discussion, see the Fair Value Option section in Note 5 - Fair Value Measurements. |
Credit Risk Assumed through Credit Derivatives
The Company enters into credit default swaps that assume credit risk of a single entity or referenced index in order to synthetically replicate investment transactions that are permissible under the Company's investment policies. The Company will receive periodic payments based on an agreed upon rate and notional amount and will only make a payment if there is a credit event. A credit event payment will typically be equal to the notional value of the swap contract less the value of the referenced security
issuer’s debt obligation after the occurrence of the credit event. A credit event is generally defined as a default on contractually obligated interest or principal payments or bankruptcy of the referenced entity. The credit default swaps in which the Company assumes credit risk primarily reference investment grade single corporate issuers and baskets, which include standard diversified portfolios of corporate and CMBS issuers. The diversified portfolios of corporate issuers are established within sector concentration limits and may be divided into tranches that possess different credit ratings.
39
THE HARTFORD FINANCIAL SERVICES GROUP, INC.
NOTES TO CONDENSED CONSOLIDATED FINANCIAL STATEMENTS (continued)
7. Derivative Instruments (continued)
Credit Derivatives by Type | |||||||||||||||
Underlying Referenced Credit Obligation(s) [1] | |||||||||||||||
Notional Amount [2] | Fair Value | Weighted Average Years to Maturity | Type | Average Credit Rating | Offsetting Notional Amount [3] | Offsetting Fair Value [3] | |||||||||
As of March 31, 2018 | |||||||||||||||
Single name credit default swaps | |||||||||||||||
Investment grade risk exposure | $ | 170 | $ | 4 | 5 years | Corporate Credit/ Foreign Gov. | A- | $ | — | $ | — | ||||
Basket credit default swaps [4] | |||||||||||||||
Investment grade risk exposure | 1,252 | 10 | 4 years | Corporate Credit | BBB+ | 453 | (1 | ) | |||||||
Investment grade risk exposure | 12 | (1 | ) | 6 years | CMBS Credit | A- | 2 | — | |||||||
Below investment grade risk exposure | 27 | (6 | ) | Less than 1 year | CMBS Credit | CCC | 27 | 6 | |||||||
Total [5] | $ | 1,461 | $ | 7 | $ | 482 | $ | 5 | |||||||
As of December 31, 2017 | |||||||||||||||
Single name credit default swaps | |||||||||||||||
Investment grade risk exposure | $ | 130 | $ | 3 | 5 years | Corporate Credit/ Foreign Gov. | A- | $ | — | $ | — | ||||
Below investment grade risk exposure | 9 | — | Less than 1 year | Corporate Credit | B | 9 | — | ||||||||
Basket credit default swaps [4] | |||||||||||||||
Investment grade risk exposure | 1,137 | 2 | 3 years | Corporate Credit | BBB+ | 454 | (2 | ) | |||||||
Below investment grade risk exposure | 27 | 2 | 3 years | Corporate Credit | B+ | 27 | — | ||||||||
Investment grade risk exposure | 13 | (1 | ) | 5 years | CMBS Credit | A | 3 | — | |||||||
Below investment grade risk exposure | 30 | (6 | ) | Less than 1 year | CMBS Credit | CCC | 30 | 7 | |||||||
Total [5] | $ | 1,346 | $ | — | $ | 523 | $ | 5 | |||||||
[1] | The average credit ratings are based on availability and are generally the midpoint of the available ratings among Moody’s, S&P, Fitch and Morningstar. If no rating is available from a rating agency, then an internally developed rating is used. |
[2] | Notional amount is equal to the maximum potential future loss amount. These derivatives are governed by agreements, clearing house rules and applicable law, which include collateral posting requirements. There is no additional specific collateral related to these contracts or recourse provisions included in the contracts to offset losses. |
[3] | The Company has entered into offsetting credit default swaps to terminate certain existing credit default swaps, thereby offsetting the future changes in value of, or losses paid related to, the original swap. |
[4] | Comprised of swaps of standard market indices of diversified portfolios of corporate and CMBS issuers referenced through credit default swaps. These swaps are subsequently valued based upon the observable standard market index. |
[5] | Excludes investments that contain an embedded credit derivative for which the Company has elected the fair value option. For further discussion, see the Fair Value Option section in Note 5 - Fair Value Measurements. |
Derivative Collateral Arrangements
The Company enters into various collateral arrangements in connection with its derivative instruments, which require both the pledging and accepting of collateral. As of March 31, 2018 and December 31, 2017, the Company pledged cash collateral associated with derivative instruments with a fair value of $1, for which the collateral receivable has been recorded in other assets or other liabilities on the Company's Condensed Consolidated Balance Sheets as determined by the Company's election to offset on the balance sheet. As of March 31, 2018 and December 31, 2017, the Company also pledged securities collateral associated with derivative instruments with a fair value of $93 and $101, respectively, which have been included in fixed
maturities on the Condensed Consolidated Balance Sheets. In addition, as of March 31, 2018 and December 31, 2017, the Company has also pledged initial margin of securities related to OTC- cleared and exchange traded derivatives of $92 and $96, respectively, which are included within fixed maturities on the Company's Condensed Consolidated Balance Sheets. The counterparties generally have the right to sell or re-pledge these securities.
As of March 31, 2018 and December 31, 2017, the Company accepted cash collateral associated with derivative instruments of $14 and $11, respectively, which was invested and recorded in the Company's Condensed Consolidated Balance Sheets in fixed maturities and short-term investments with corresponding amounts recorded in other investments or other liabilities as determined by the Company's election to offset on the balance
40
THE HARTFORD FINANCIAL SERVICES GROUP, INC.
NOTES TO CONDENSED CONSOLIDATED FINANCIAL STATEMENTS (continued)
7. Derivative Instruments (continued)
sheet. The Company also accepted securities collateral as of March 31, 2018 and December 31, 2017, with a fair value of $2, none of which the Company has the ability to sell or repledge. As of March 31, 2018 and December 31, 2017, the Company had no repledged securities and did not sell any securities held as collateral. In addition, as of March 31, 2018 and December 31, 2017, non-cash collateral accepted was held in separate custodial accounts and was not included in the Company’s Consolidated Balance Sheets.
41
THE HARTFORD FINANCIAL SERVICES GROUP, INC.
NOTES TO CONDENSED CONSOLIDATED FINANCIAL STATEMENTS (continued)
8. Goodwill & Other Intangible Assets
During the three months ended March 31, 2018, The Company entered into a renewal rights agreement with Farmers Exchanges of the Farmers Group of Companies to acquire its Foremost-branded small commercial business sold through independent agents. In connection with the renewal rights agreement, the Company recorded a customer relationships intangible asset of $46 which will be amortized over 10 years.
42
THE HARTFORD FINANCIAL SERVICES GROUP, INC.
NOTES TO CONDENSED CONSOLIDATED FINANCIAL STATEMENTS (continued)
9. Reserve for Unpaid Losses and Loss Adjustment Expenses
Rollforward of Liabilities for Unpaid Losses and Loss Adjustment Expenses
For the three months ended March 31, | ||||||
2018 | 2017 | |||||
Beginning liabilities for unpaid losses and loss adjustment expenses, gross | $ | 23,775 | $ | 22,545 | ||
Reinsurance and other recoverables | 3,957 | 3,488 | ||||
Beginning liabilities for unpaid losses and loss adjustment expenses, net | 19,818 | 19,057 | ||||
Provision for unpaid losses and loss adjustment expenses | ||||||
Current accident year | 1,640 | 1,762 | ||||
Prior accident year development | (32 | ) | 12 | |||
Total provision for unpaid losses and loss adjustment expenses | 1,608 | 1,774 | ||||
Less: payments | ||||||
Current accident year | 327 | 352 | ||||
Prior accident years | 1,322 | 1,300 | ||||
Total payments | 1,649 | 1,652 | ||||
Ending liabilities for unpaid losses and loss adjustment expenses, net | 19,777 | 19,179 | ||||
Reinsurance and other recoverables | 3,938 | 3,478 | ||||
Ending liabilities for unpaid losses and loss adjustment expenses, gross | $ | 23,715 | $ | 22,657 | ||
Unfavorable (Favorable) Prior Accident Year Development
For the three months ended March 31, | ||||||
2018 | 2017 | |||||
Workers’ compensation | $ | (25 | ) | $ | (20 | ) |
Workers’ compensation discount accretion | 10 | 8 | ||||
General liability | 8 | 10 | ||||
Package business | 8 | — | ||||
Commercial property | (13 | ) | 1 | |||
Professional liability | 2 | — | ||||
Bond | — | (10 | ) | |||
Automobile liability - Commercial Lines | (5 | ) | 20 | |||
Automobile liability - Personal Lines | — | — | ||||
Homeowners | (12 | ) | — | |||
Net asbestos reserves | — | — | ||||
Net environmental reserves | — | — | ||||
Catastrophes | (3 | ) | (3 | ) | ||
Uncollectible reinsurance | — | — | ||||
Other reserve re-estimates, net | (2 | ) | 6 | |||
Total prior accident year development | $ | (32 | ) | $ | 12 | |
Re-estimates of prior accident year reserves for the three months ended March 31, 2018
Workers’ compensation reserves were reduced in small commercial, primarily for accident years 2011 to 2015, as both claim frequency and medical claim severity have emerged favorably compared to previous reserve estimates.
General liability reserves were increased modestly, primarily due to an increase in reserves for specialty business within middle market for accident years 2009 to 2017, largely offset by a decrease in reserves for other lines within middle market, including premises and operations and products liability, principally for accident years 2015 and prior. Contributing to the increase in reserves for specialty general liability reserves was an increase in large losses. Contributing to the reduction in reserves for other middle market lines was more favorable outcomes on litigated claims.
Package business reserves were increased primarily due to increased severity of 2017 accident year property claims.
Commercial property reserves were reduced, driven by an increase in estimated reinsurance recoverable on marine losses from the 2017 accident year.
Homeowners reserves were reduced, primarily in accident years 2013 to 2017, driven by lower than expected severity across multiple perils.
43
THE HARTFORD FINANCIAL SERVICES GROUP, INC.
NOTES TO CONDENSED CONSOLIDATED FINANCIAL STATEMENTS (continued)
9. Reserve for Unpaid Losses and Loss Adjustment Expenses (continued)
Re-estimates of prior accident year reserves for the three months ended March 31, 2017
Workers’ compensation reserves in small commercial were reduced given the continued emergence of favorable frequency for accident years 2013 to 2015. Management has placed additional weight on this favorable experience as it becomes more credible.
General liability reserves were increased for the 2013 to 2016 accident years on a class of business that insures service and maintenance contractors. This increase was partially offset by a decrease in recent accident year reserves for other middle market general liability reserves.
Bond business reserves related to recent accident years were reduced as reported losses for commercial and contract surety have emerged favorably.
Automobile liability reserves within Commercial Lines were increased in small commercial and large national accounts for the 2013 to 2016 accident years, driven by higher frequency of more severe accidents, including litigated claims.
Group Life, Disability and Accident Products
Rollforward of Liabilities for Unpaid Losses and Loss Adjustment Expenses
For the three months ended March 31, | ||||||
2018 | 2017 | |||||
Beginning liabilities for unpaid losses and loss adjustment expenses, gross | $ | 8,512 | $ | 5,772 | ||
Reinsurance recoverables | 209 | 208 | ||||
Beginning liabilities for unpaid losses and loss adjustment expenses, net | 8,303 | 5,564 | ||||
Provision for unpaid losses and loss adjustment expenses | ||||||
Current incurral year | 1,185 | 678 | ||||
Prior year's discount accretion | 62 | 52 | ||||
Prior incurral year development [1] | (127 | ) | (69 | ) | ||
Total provision for unpaid losses and loss adjustment expenses [2] | 1,120 | 661 | ||||
Less: payments | ||||||
Current incurral year | 318 | 178 | ||||
Prior incurral years | 840 | 519 | ||||
Total payments | 1,158 | 697 | ||||
Ending liabilities for unpaid losses and loss adjustment expenses, net | 8,265 | 5,528 | ||||
Reinsurance recoverables | 233 | 208 | ||||
Ending liabilities for unpaid losses and loss adjustment expenses, gross | $ | 8,498 | $ | 5,736 | ||
[1] | Prior incurral year development represents the change in estimated ultimate incurred losses and loss adjustment expenses for prior incurral years on a discounted basis. |
[2] | Includes unallocated loss adjustment expenses of $41, and $24 for the three months ended March 31, 2018 and 2017, respectively, that are recorded in insurance operating costs and other expenses in the Condensed Consolidated Statements of Operations. |
Re-estimates of prior incurral years reserves for the three months ended March 31, 2018
Group disability- Prior period reserve estimates decreased by approximately $85 largely driven by group long-term disability claim terminations (recoveries and claimant deaths) higher than prior reserve assumptions and claim incidence lower than prior assumptions.
Group life and accident (including group life premium waiver)- Prior period reserve estimates decreased by approximately $40 largely driven by lower-than-previously expected claim incidence on group life, group life premium waiver, and group accidental death & dismemberment claims.
Re-estimates of prior incurral years reserves for the three months ended March 31, 2017
Group disability- Prior period reserve estimates decreased by approximately $35 largely driven by group long-term disability claim recoveries higher than prior reserve assumptions. This favorability was partially offset by lower Social Security Disability Income approvals driven by lower approval rates and ongoing backlogs in the Social Security Administration.
Group life and accident (including group life premium waiver)- Prior period reserve estimates decreased by approximately $35 largely driven by lower-than-previously expected claim incidence. This was partially offset by higher-than-expected claim severity.
44
THE HARTFORD FINANCIAL SERVICES GROUP, INC.
NOTES TO CONDENSED CONSOLIDATED FINANCIAL STATEMENTS (continued)
10. Reserve for Future Policy Benefits
Changes in Reserves for Future Policy Benefits[1] | |||
Liability balance as of January 1, 2018 | $ | 713 | |
Incurred | 10 | ||
Paid | (8 | ) | |
Change in unrealized investment gains and losses | (37 | ) | |
Liability balance as of March 31, 2018 | $ | 678 | |
Reinsurance recoverable asset, as of January 1, 2018 | $ | 26 | |
Incurred | 8 | ||
Paid | — | ||
Reinsurance recoverable asset, as of March 31, 2018 | $ | 34 | |
Liability balance as of January 1, 2017 | $ | 322 | |
Incurred | 20 | ||
Paid | (10 | ) | |
Change in unrealized investment gains and losses | (10 | ) | |
Liability balance as of March 31, 2017 | $ | 322 | |
Reinsurance recoverable asset, as of January 1, 2017 | $ | 28 | |
Incurred | 2 | ||
Paid | — | ||
Reinsurance recoverable asset, as of March 31, 2017 | $ | 30 | |
[1]Reserves for future policy benefits includes paid-up life insurance and whole-life policies resulting from conversion from group life policies included within the Group Benefits segment and reserves for structured settlement and terminal funding agreement liabilities retained which are in the Corporate category.
45
THE HARTFORD FINANCIAL SERVICES GROUP, INC.
NOTES TO CONDENSED CONSOLIDATED FINANCIAL STATEMENTS (continued)
11. Debt
Senior Notes
On March 15, 2018, The Hartford issued $500 of 4.4% senior notes ("4.4% Notes") due March 15, 2048 for net proceeds of approximately $490, after deducting underwriting discounts and expenses from the offering. Interest is payable semi-annually in arrears on March 15 and September 15, commencing September 15, 2018. The Hartford, at its option, can redeem the 4.4% Notes at any time, in whole or in part, at a redemption price equal to the greater of 100% of the principal amount being redeemed or a make-whole amount based on a comparable maturity US Treasury plus 25 basis points, plus any accrued and unpaid interest, except the option of a make-whole payment is not applicable within the final six months before maturity.
On March 15, 2018, The Hartford repaid at maturity the $320 principal amount of its 6.3% senior notes.
Revolving Credit Facility
The Company has a senior unsecured five-year revolving credit facility (the “Credit Facility”) that provides for borrowing capacity of up to $1 billion of unsecured credit through October 31, 2019, subject to amended terms and conditions as described below, available in U.S. Dollars, Euro, Sterling, Canadian Dollars and Japanese Yen. Of the aggregate principal amount available, up to $250 is available to support letters of credit. U.S. Dollar loans will bear interest at the higher of a rate (the prime rate or the Federal Funds Rate plus 0.50% ) plus a basis point spread based on The Hartford’s credit rating and will mature no later than October 31, 2019. Letters of credit issued from the Credit Facility bear a fee based on The Hartford’s credit rating and expire no later than October 31, 2020. The Credit Facility requires the Company to maintain a minimum consolidated net worth excluding AOCI, limits debt based on a maximum senior debt to capitalization ratio of 35%, and includes other customary covenants.
As of March 31, 2018, no borrowings were outstanding and $3 in letters of credit were issued under the Credit Facility and the Company was in compliance with all financial covenants.
On March 29, 2018, the Company entered into an amendment (the "Amendment") to its Credit Facility that reset the level of the Company’s minimum consolidated net worth financial covenant to $9 billion excluding AOCI from its former $13.5 billion (where net worth was defined as stockholders' equity excluding AOCI and including junior subordinated debt), among other updates. The Amendment also provides for an amended and restated credit agreement that would, upon and subject to certain conditions including consummation of the sale of the life and annuity run-off business and among other changes, (i) decrease the aggregate principal amount of the facility from $1 billion to $750, including a reduction to the amount available for letters of credit from $250 to $100 (ii) change the maturity date to March 29, 2023, and (iii) modify the liens covenant and certain other covenants therein.
46
THE HARTFORD FINANCIAL SERVICES GROUP, INC.
NOTES TO CONDENSED CONSOLIDATED FINANCIAL STATEMENTS (continued)
12. Income Taxes
Income Tax Rate Reconciliation | ||||||
Three Months Ended March 31, | ||||||
2018 | 2017 | |||||
Tax provision at U.S. federal statutory rate [1] | $ | 109 | $ | 140 | ||
Tax-exempt interest | (17 | ) | (30 | ) | ||
Executive compensation | 4 | — | ||||
Stock-based compensation | (2 | ) | (7 | ) | ||
Tax reform | (3 | ) | — | |||
Other | — | (5 | ) | |||
Provision for income taxes | $ | 91 | $ | 98 | ||
[1]Due to the passage of tax reform on December 22, 2017, current and prior period federal statutory rates are reflected at 21% and 35% respectively.
Rollforward of Unrecognized Tax Benefits | ||||||
Three Months Ended March 31, | ||||||
2018 | 2017 | |||||
Balance, beginning of period | $ | 9 | $ | 12 | ||
Gross increases - tax positions in prior period | — | — | ||||
Gross decreases - tax positions in prior period | — | — | ||||
Balance, end of period | $ | 9 | $ | 12 | ||
The entire amount of unrecognized tax benefits, if recognized, would affect the effective tax rate in the period of the release.
The federal audits have been completed through 2013, and the Company is not currently under examination for any open years. Management believes that adequate provision has been made in the consolidated financial statements for any potential adjustments that may result from tax examinations and other tax-related matters for all open tax years.
The Company classifies interest and penalties (if applicable) as income tax expense in the consolidated financial statements. The Company recognized no interest expense for the periods ended March 31, 2018 and 2017. The Company had no interest payable as of March 31, 2018 and 2017. The Company does not believe it would be subject to any penalties in any open tax years and, therefore, has not recorded any accrual for penalties.
Net deferred income taxes include the future tax benefits associated with the net operating loss carryover, foreign tax credit carryover and general business credit carryforward as shown in the table below.
Future Tax Benefits | ||||||||||||
As of | ||||||||||||
March 31, 2018 | Expiration | |||||||||||
Carryover amount | Expected tax benefit, gross | Dates | Amount | |||||||||
Net operating loss carryover - U.S. | $ | 3,087 | $ | 648 | 2020 | $ | 1 | |||||
2023 | - | 2036 | $ | 3,086 | ||||||||
Net operating loss carryover - foreign | $ | 4 | $ | — | No expiration | $ | 4 | |||||
Foreign tax credit carryover | $ | 21 | $ | 21 | 2023 | - | 2024 | $ | 21 | |||
General business credit carryover | $ | 3 | $ | 3 | 2031 | - | 2037 | $ | 3 | |||
Net Operating Loss Carryover
U.S. NOL's reflected above arose in taxable years prior to 2017 and are still subject to prior tax law which allows for carryback and limits the period over which carryforwards may be used to offset taxable income as shown in the above table. Utilization of the Company's loss carryovers is dependent upon the generation of sufficient future taxable income. The U.S. net operating loss carryover in the table above included $422 of NOL's of the life and annuity run-off business that the Company will retain. Given the expected earnings of the Company going forward, including earnings of its property and casualty, group benefits and mutual fund businesses, the Company expects to generate sufficient taxable income in the future to utilize its net operating loss carryover. Although the Company projects there will be sufficient
future taxable income to fully recover the remainder of the loss carryover, the Company's estimate of the likely realization may change over time.
Tax Credit Carryovers
Foreign Tax Credits and General Business Credits- These credits are available to offset regular federal income taxes from future taxable income. The use of these credits prior to expiration depends on the generation of sufficient taxable income to first utilize all U.S. net operating loss carryovers. However, the Company has purchased certain investments which allow for utilization of the foreign tax credits without first using the net operating loss carryover. Consequently, the Company believes it is more likely than not the foreign tax credit carryover will be fully realized. Accordingly, no valuation allowance has been provided.
47
THE HARTFORD FINANCIAL SERVICES GROUP, INC.
NOTES TO CONDENSED CONSOLIDATED FINANCIAL STATEMENTS (continued)
12. Income Taxes (continued)
Alternative Minimum Tax Credit Carryovers- As of March 31, 2018, the Company had an alternative minimum tax credit (AMT) carryover, net of a sequestration fee payable, of $793 which is reflected as a current income tax receivable within Other Assets in the accompanying condensed consolidated balance sheet. AMT credits may be used to offset a regular tax liability for any taxable year beginning after December 31, 2017, and are refundable at an amount equal to 50 percent of the excess of the minimum tax credit for the taxable year over the amount of the credit allowable for the year against regular tax liability. Any remaining credits not used against regular tax liability are refundable in the 2021 tax year to be collected in 2022. The sequestration fee applies to refunds of AMT credits but does not apply if those credits are used against regular tax liability. As of March 31, 2018, the Company's AMT credit carryover was net of an estimated sequestration fee payable of $53, but the amount of the fee that is ultimately payable is subject to change depending on the level and timing of future taxable income and any subsequent changes in the sequestration rate. During the first quarter of 2018, the Company recorded an income tax benefit of $3 related to the reduction of the sequestration rate from 6.6 percent to 6.2 percent.
48
THE HARTFORD FINANCIAL SERVICES GROUP, INC.
NOTES TO CONDENSED CONSOLIDATED FINANCIAL STATEMENTS (continued)
13. Commitments and Contingencies
Management evaluates each contingent matter separately. A loss is recorded if probable and reasonably estimable. Management establishes liabilities for these contingencies at its “best estimate,” or, if no one number within the range of possible losses is more probable than any other, the Company records an estimated liability at the low end of the range of losses.
Litigation
The Hartford is involved in claims litigation arising in the ordinary course of business, both as a liability insurer defending or providing indemnity for third-party claims brought against insureds and as an insurer defending coverage claims brought against it. The Hartford accounts for such activity through the establishment of unpaid loss and loss adjustment expense reserves. Subject to the uncertainties in the following discussion under the caption “Asbestos and Environmental Claims,” management expects that the ultimate liability, if any, with respect to such ordinary-course claims litigation, after consideration of provisions made for potential losses and costs of defense, will not be material to the consolidated financial condition, results of operations or cash flows of The Hartford.
The Hartford is also involved in other kinds of legal actions, some of which assert claims for substantial amounts. These actions include, among others, and in addition to the matters in the following discussion, putative state and federal class actions seeking certification of a state or national class. Such putative class actions have alleged, for example, underpayment of claims or improper underwriting practices in connection with various kinds of insurance policies, such as personal and commercial automobile, property, disability, life and inland marine. The Hartford also is involved in individual actions in which punitive damages are sought, such as claims alleging bad faith in the handling of insurance claims or other allegedly unfair or improper business practices. Like many other insurers, The Hartford also has been joined in actions by asbestos plaintiffs asserting, among other things, that insurers had a duty to protect the public from the dangers of asbestos and that insurers committed unfair trade practices by asserting defenses on behalf of their policyholders in the underlying asbestos cases. Management expects that the ultimate liability, if any, with respect to such lawsuits, after consideration of provisions made for estimated losses, will not be material to the consolidated financial condition of The Hartford. Nonetheless, given the large or indeterminate amounts sought in certain of these actions, and the inherent unpredictability of litigation, the outcome in certain matters could, from time to time, have a material adverse effect on the Company’s results of operations or cash flows in particular quarterly or annual periods.
In addition to the inherent difficulty of predicting litigation outcomes, the Mutual Funds Litigation identified below purports to seek substantial damages for unsubstantiated conduct spanning a multi-year period based on novel applications of complex legal theories. The alleged damages are not quantified or factually supported in the complaint, and, in any event, the Company’s experience shows that demands for damages often bear little relation to a reasonable estimate of potential loss. The application of the legal standard identified by the court for assessing the potentially available damages, as described below, is inherently unpredictable, and no legal precedent has been identified that would aid in determining a reasonable estimate of
potential loss. Accordingly, management cannot reasonably estimate the possible loss or range of loss, if any.
Mutual Funds Litigation — In February 2011, a derivative action was brought on behalf of six Hartford retail mutual funds in the United States District Court for the District of New Jersey, alleging that Hartford Investment Financial Services, LLC (“HIFSCO”), an indirect subsidiary of the Company, received excessive advisory and distribution fees in violation of its statutory fiduciary duty under Section 36(b) of the Investment Company Act of 1940. During the course of the litigation, the claims regarding distribution fees were dismissed without prejudice, the lineup of funds as plaintiffs changed several times, and the plaintiffs added as a defendant Hartford Funds Management Company (“HFMC”), an indirect subsidiary of the Company that assumed the role of advisor to the funds as of January 2013. In June 2015, HFMC and HIFSCO moved for summary judgment, and plaintiffs cross-moved for partial summary judgment with respect to one fund. In March 2016, the court denied the plaintiff's motion, and granted summary judgment for HIFSCO and HFMC with respect to one fund, leaving six funds as plaintiffs: The Hartford Balanced Fund, The Hartford Capital Appreciation Fund, The Hartford Floating Rate Fund, The Hartford Growth Opportunities Fund, The Hartford Healthcare Fund, and The Hartford Inflation Plus Fund. The court further ruled that the appropriate measure of damages on the surviving claims would be the difference, if any, between the actual advisory fees paid through trial and the fees permitted under the applicable legal standard. A bench trial on the issue of liability was held in November 2016. In February 2017, the court granted judgment for HIFSCO and HFMC as to all claims. Plaintiffs have appealed to the United States Court of Appeals for the Third Circuit.
Asbestos and Environmental Claims –The Company continues to receive asbestos and environmental claims. Asbestos claims relate primarily to bodily injuries asserted by people who came in contact with asbestos or products containing asbestos. Environmental claims relate primarily to pollution and related clean-up costs.
The Company wrote several different categories of insurance contracts that may cover asbestos and environmental claims. First, the Company wrote primary policies providing the first layer of coverage in an insured’s liability program. Second, the Company wrote excess and umbrella policies providing higher layers of coverage for losses that exhaust the limits of underlying coverage. Third, the Company acted as a reinsurer assuming a portion of those risks assumed by other insurers writing primary, excess, umbrella and reinsurance coverages.
Significant uncertainty limits the ability of insurers and reinsurers to estimate the ultimate reserves necessary for unpaid gross losses and expenses related to environmental and particularly asbestos claims. The degree of variability of gross reserve estimates for these exposures is significantly greater than for other more traditional exposures.
In the case of the reserves for asbestos exposures, factors contributing to the high degree of uncertainty include inadequate loss development patterns, plaintiffs’ expanding theories of liability, the risks inherent in major litigation, and inconsistent
49
THE HARTFORD FINANCIAL SERVICES GROUP, INC.
NOTES TO CONDENSED CONSOLIDATED FINANCIAL STATEMENTS (continued)
13. Commitments and Contingencies (continued)
emerging legal doctrines. Furthermore, over time, insurers, including the Company, have experienced significant changes in the rate at which asbestos claims are brought, the claims experience of particular insureds, and the value of claims, making predictions of future exposure from past experience uncertain. Plaintiffs and insureds also have sought to use bankruptcy proceedings, including “pre-packaged” bankruptcies, to accelerate and increase loss payments by insurers. In addition, some policyholders have asserted new classes of claims for coverages to which an aggregate limit of liability may not apply. Further uncertainties include insolvencies of other carriers and unanticipated developments pertaining to the Company’s ability to recover reinsurance for asbestos and environmental claims. Management believes these issues are not likely to be resolved in the near future.
In the case of the reserves for environmental exposures, factors contributing to the high degree of uncertainty include expanding theories of liability and damages, the risks inherent in major litigation, inconsistent decisions concerning the existence and scope of coverage for environmental claims, and uncertainty as to the monetary amount being sought by the claimant from the insured.
The reporting pattern for assumed reinsurance claims, including those related to asbestos and environmental claims, is much longer than for direct claims. In many instances, it takes months or years to determine that the policyholder’s own obligations have been met and how the reinsurance in question may apply to such claims. The delay in reporting reinsurance claims and exposures adds to the uncertainty of estimating the related reserves.
It is also not possible to predict changes in the legal and legislative environment and their effect on the future development of asbestos and environmental claims.
Given the factors described above, the Company believes the actuarial tools and other techniques it employs to estimate the ultimate cost of claims for more traditional kinds of insurance exposure are less precise in estimating reserves for asbestos and environmental exposures. For this reason, the Company principally relies on exposure-based analysis to estimate the ultimate costs of these claims, both gross and net of reinsurance, and regularly evaluates new account information in assessing its potential asbestos and environmental exposures. The Company supplements this exposure-based analysis with evaluations of the Company’s historical direct net loss and expense paid and reported experience, and net loss and expense paid and reported experience by calendar and/or report year, to assess any emerging trends, fluctuations or characteristics suggested by the aggregate paid and reported activity.
While the Company believes that its current asbestos and environmental reserves are appropriate, significant uncertainties limit the ability of insurers and reinsurers to estimate the ultimate reserves necessary for unpaid losses and related expenses. The ultimate liabilities, thus, could exceed the currently recorded reserves, and any such additional liability, while not estimable now, could be material to The Hartford’s consolidated operating results and liquidity.
As of March 31, 2018, the Company reported $1.2 billion of net asbestos reserves and $231 of net environmental reserves. While the Company believes that its current asbestos and environmental reserves are appropriate, significant uncertainties limit our ability to estimate the ultimate reserves necessary for unpaid losses and related expenses. The ultimate liabilities, thus, could exceed the currently recorded reserves, and any such additional liability, while not reasonably estimable now, could be material to The Hartford's consolidated operating results and liquidity.
Effective December 31, 2016, the Company entered into an ADC reinsurance agreement with NICO, a subsidiary of Berkshire Hathaway Inc., to reduce uncertainty about potential adverse development of asbestos and environmental reserves. Under the ADC, the Company paid a reinsurance premium of $650 for NICO to assume adverse net loss and allocated loss adjustment expense reserve development up to $1.5 billion above the Company’s existing net asbestos and environmental reserves as of December 31, 2016 of approximately $1.7 billion. The $650 reinsurance premium was placed into a collateral trust account as security for NICO’s claim payment obligations to the Company. Under retroactive reinsurance accounting, net adverse asbestos and environmental reserve development after December 31, 2016 will result in an offsetting reinsurance recoverable up to the $1.5 billion limit. Cumulative ceded losses up to the $650 reinsurance premium paid are recognized as a dollar-for-dollar offset to direct losses incurred. Cumulative ceded losses exceeding the $650 reinsurance premium paid would result in a deferred gain. The deferred gain would be recognized over the claim settlement period in the proportion of the amount of cumulative ceded losses collected from the reinsurer to the estimated ultimate reinsurance recoveries. Consequently, until periods when the deferred gain is recognized as a benefit to earnings, cumulative adverse development of asbestos and environmental claims after December 31, 2016 in excess of $650 may result in significant charges against earnings. Furthermore, cumulative adverse development of asbestos and environmental claims could ultimately exceed the $1.5 billion treaty limit in which case any adverse development in excess of the treaty limit would be absorbed as a charge to earnings by the Company. In these scenarios, the effect of these changes could be material to the Company’s consolidated operating results and liquidity. As of March 31, 2018, the Company has incurred $285 in cumulative adverse development on asbestos and environmental reserves that have been ceded under the ADC treaty with NICO, leaving approximately $1.2 billion of coverage available for future adverse net reserve development, if any.
Derivative Commitments
Certain of the Company’s derivative agreements contain provisions that are tied to the financial strength ratings, as set by nationally recognized statistical agencies, of the individual legal entity that entered into the derivative agreement. If the legal entity’s financial strength were to fall below certain ratings, the counterparties to the derivative agreements could demand immediate and ongoing full collateralization and in certain instances enable the counterparties to terminate the agreements and demand immediate settlement of all outstanding derivative positions traded under each impacted bilateral agreement. The settlement amount is determined by netting the derivative
50
THE HARTFORD FINANCIAL SERVICES GROUP, INC.
NOTES TO CONDENSED CONSOLIDATED FINANCIAL STATEMENTS (continued)
13. Commitments and Contingencies (continued)
positions transacted under each agreement. If the termination rights were to be exercised by the counterparties, it could impact the legal entity’s ability to conduct hedging activities by increasing the associated costs and decreasing the willingness of counterparties to transact with the legal entity. The aggregate fair value of all derivative instruments with credit-risk-related contingent features that are in a net liability position as of March 31, 2018 was $96. Of this $96 , the legal entities have posted collateral of $94 in the normal course of business. Based on derivative market values as of March 31, 2018, a downgrade of one level below the current financial strength ratings by either Moody's or S&P would require an additional $10 of assets to be posted as collateral. These collateral amounts could change as derivative market values change, as a result of changes in our hedging activities or to the extent changes in contractual terms are negotiated. The nature of the collateral that we post, when required, is primarily in the form of U.S. Treasury bills, U.S. Treasury notes and government agency securities.
51
THE HARTFORD FINANCIAL SERVICES GROUP, INC.
NOTES TO CONDENSED CONSOLIDATED FINANCIAL STATEMENTS (continued)
14. Equity
Capital Purchase Program ("CPP") Warrants
As of March 31, 2018 and December 31, 2017, respectively, the Company has 2.2 million of CPP warrants outstanding and exercisable. CPP warrant exercises were 0.1 million and 1.0 million for the three months ended March 31, 2018 and 2017, respectively.
The declaration of common stock dividends by the Company in excess of a threshold triggers a provision in the Company's warrant agreement with The Bank of New York Mellon resulting
in adjustments to the CPP warrant exercise price. Accordingly, the declaration of a common stock dividend during the three months ended March 31, 2018 resulted in an adjustment to the CPP warrant exercise price. The CPP warrant exercise price was $8.964 as of March 31, 2018 and $8.999 as of December 31, 2017.
Equity Repurchase Program
The Company does not currently have an equity repurchase authorization in 2018.
52
THE HARTFORD FINANCIAL SERVICES GROUP, INC.
NOTES TO CONDENSED CONSOLIDATED FINANCIAL STATEMENTS (continued)
15. Changes In and Reclassifications From Accumulated Other Comprehensive Income
Changes in AOCI, Net of Tax for the Three Months Ended March 31, 2018 | ||||||||||||||||||
Changes in | ||||||||||||||||||
Net Unrealized Gain on Securities | OTTI Losses in OCI | Net Gain on Cash Flow Hedging Instruments | Foreign Currency Translation Adjustments | Pension and Other Postretirement Plan Adjustments | AOCI, net of tax | |||||||||||||
Beginning balance | $ | 1,931 | $ | (3 | ) | $ | 18 | $ | 34 | $ | (1,317 | ) | $ | 663 | ||||
Cumulative effect of accounting changes, net of tax [1] | 273 | — | 2 | 4 | (284 | ) | (5 | ) | ||||||||||
Adjusted balance, beginning of period | 2,204 | (3 | ) | 20 | 38 | (1,601 | ) | 658 | ||||||||||
OCI before reclassifications | (882 | ) | (2 | ) | (31 | ) | (6 | ) | 1 | (920 | ) | |||||||
Amounts reclassified from AOCI | 27 | — | (13 | ) | — | 9 | 23 | |||||||||||
OCI, net of tax | (855 | ) | (2 | ) | (44 | ) | (6 | ) | 10 | (897 | ) | |||||||
Ending balance | $ | 1,349 | $ | (5 | ) | $ | (24 | ) | $ | 32 | $ | (1,591 | ) | $ | (239 | ) | ||
[1]Includes reclassification to retained earnings of $88 of stranded tax effects and $93 of net unrealized gains, after tax, related to equity securities. Refer to Note 1 - Basis of Presentation and Significant Accounting Policies for further information.
Reclassifications from AOCI | ||||
Three Months Ended March 31, 2018 | Affected Line Item in the Condensed Consolidated Statement of Operations | |||
Net Unrealized Gain on Securities | ||||
Available-for-sale securities | $ | (38 | ) | Net realized capital gains (losses) |
(38 | ) | Total before tax | ||
(8 | ) | Income tax expense | ||
$ | 3 | Income from discontinued operations, net of tax | ||
$ | (27 | ) | Net income | |
Net Gains on Cash Flow Hedging Instruments | ||||
Interest rate swaps | $ | 1 | Net realized capital gains (losses) | |
Interest rate swaps | 8 | Net investment income | ||
9 | Total before tax | |||
2 | Income tax expense | |||
$ | 6 | Income from discontinued operations, net of tax | ||
$ | 13 | Net income | ||
Pension and Other Postretirement Plan Adjustments | ||||
Amortization of prior service credit | $ | 1 | Insurance operating costs and other expenses | |
Amortization of actuarial loss | (13 | ) | Insurance operating costs and other expenses | |
(12 | ) | Total before tax | ||
(3 | ) | Income tax expense | ||
$ | (9 | ) | Net income | |
Total amounts reclassified from AOCI | $ | (23 | ) | Net income |
53
THE HARTFORD FINANCIAL SERVICES GROUP, INC.
NOTES TO CONDENSED CONSOLIDATED FINANCIAL STATEMENTS (continued)
15. Changes In and Reclassifications From Accumulated Other Comprehensive Income (continued)
Changes in AOCI, Net of Tax for the Three Months Ended March 31, 2017 | ||||||||||||||||||
Changes in | ||||||||||||||||||
Net Unrealized Gain on Securities | OTTI Losses in OCI | Net Gain on Cash Flow Hedging Instruments | Foreign Currency Translation Adjustments | Pension and Other Postretirement Plan Adjustments | AOCI, net of tax | |||||||||||||
Beginning balance | $ | 1,276 | $ | (3 | ) | $ | 76 | $ | 6 | $ | (1,692 | ) | $ | (337 | ) | |||
OCI before reclassifications | 160 | (1 | ) | (4 | ) | 2 | — | 157 | ||||||||||
Amounts reclassified from AOCI | (23 | ) | — | (14 | ) | — | 10 | (27 | ) | |||||||||
OCI, net of tax | 137 | (1 | ) | (18 | ) | 2 | 10 | 130 | ||||||||||
Ending balance | $ | 1,413 | $ | (4 | ) | $ | 58 | $ | 8 | $ | (1,682 | ) | $ | (207 | ) | |||
Reclassifications of AOCI | ||||
Three Months Ended March 31, 2017 | Affected Line Item in the Condensed Consolidated Statement of Operations | |||
Net Unrealized Gain on Securities | ||||
Available-for-sale securities | $ | 14 | Net realized capital gains (losses) | |
14 | Total before tax | |||
5 | Income tax expense | |||
14 | Income from discontinued operations, net of tax | |||
$ | 23 | Net income | ||
Net Gains on Cash Flow Hedging Instruments | ||||
Interest rate swaps | $ | 4 | Net realized capital gains (losses) | |
Interest rate swaps | 9 | Net investment income | ||
13 | Total before tax | |||
4 | Income tax expense | |||
5 | Income from discontinued operations, net of tax | |||
$ | 14 | Net income | ||
Pension and Other Postretirement Plan Adjustments | ||||
Amortization of prior service credit | $ | 1 | Insurance operating costs and other expenses | |
Amortization of actuarial loss | (16 | ) | Insurance operating costs and other expenses | |
(15 | ) | Total before tax | ||
(5 | ) | Income tax expense | ||
$ | (10 | ) | Net income | |
Total amounts reclassified from AOCI | $ | 27 | Net income | |
54
THE HARTFORD FINANCIAL SERVICES GROUP, INC.
NOTES TO CONDENSED CONSOLIDATED FINANCIAL STATEMENTS (continued)
16. Employee Benefit Plans
The Company’s employee benefit plans are described in Note 18 - Employee Benefit Plans of Notes to Consolidated Financial Statements included in The Hartford’s 2017 Annual Report on Form 10-K.
Net Periodic Benefit | ||||||||||||
Pension Benefits | Other Postretirement Benefits | |||||||||||
Three Months Ended March 31, | Three Months Ended March 31, | |||||||||||
2018 | 2017 | 2018 | 2017 | |||||||||
Service cost | $ | 1 | $ | 1 | $ | — | $ | — | ||||
Interest cost | 35 | 49 | 2 | 2 | ||||||||
Expected return on plan assets | (56 | ) | (79 | ) | (2 | ) | (2 | ) | ||||
Amortization of prior service credit | — | — | (1 | ) | (1 | ) | ||||||
Amortization of actuarial loss | 12 | 15 | 1 | 1 | ||||||||
Net periodic benefit | $ | (8 | ) | $ | (14 | ) | $ | — | $ | — | ||
55
THE HARTFORD FINANCIAL SERVICES GROUP, INC.
NOTES TO CONDENSED CONSOLIDATED FINANCIAL STATEMENTS (continued)
17. Business Dispositions and Discontinued Operations
Discontinued Operations
Sale of life and annuity run-off business
On December 3, 2017, the Company’s wholly-owned subsidiary, Hartford Holdings, Inc. (HHI) entered into a definitive agreement to sell the Company's life and annuity run-off business, to a group of investors led by Cornell Capital LLC, Atlas Merchant Capital LLC, TRB Advisors LP, Global Atlantic Financial Group, Pine Brook and J. Safra Group. Under the terms of the sale agreement, the investor group will form a limited partnership that will acquire Hartford Life, Inc. (HLI), a holding company, and its life and annuity operating subsidiaries, for cash of approximately $1.4 billion after a pre-closing dividend to The Hartford of $300 and The Hartford will receive a 9.7% ownership interest in the limited partnership valued at a cost of $164. In addition, as part of the terms of the sale agreement, The Hartford will reduce its long-term debt by $142 because the debt, which was issued by HLI, will be included as part of the sale. Including cash proceeds and the retained equity interest and net of transaction costs, net proceeds for the sale are approximately $1.5 billion.
The transaction completes The Hartford’s exit from the life and annuity run-off businesses and is anticipated to close by June 30, 2018, subject to regulatory approval and other closing conditions. The life and annuity run-off operations meet the criteria for reporting as discontinued operations and are reported in the Corporate category.
The Company has recognized an estimated loss on sale within discontinued operations of approximately $3.2 billion including $3.3 billion in the fourth quarter of 2017 and a reduction of loss on sale of $62 in the first quarter of 2018. The reduction in loss in the first quarter of 2018 was largely due to the reclassification to retained earnings of $193 of tax effects stranded in AOCI due to the accounting for tax reform, less $107 of operating income from discontinued operations in the first quarter of 2018 and a reclassification of $10 of net unrealized gains net of shadow DAC from AOCI to retained earnings. See Note 1 - Adoption of New Accounting Standards within Basis of Presentation and Significant Accounting Policies, for additional information about the reclassifications from AOCI to retained earnings. Under the agreement, results from the discontinued operations inure to the buyer; therefore, apart from the effect of the reclassification of amounts from AOCI to retained earnings, the loss from discontinued operations during the period between signing and closing will remain largely unchanged as any income earned by the life and annuity run-off business will be offset by a higher loss on sale. At closing, shareholders’ equity will be further reduced for the amount of accumulated other comprehensive income (AOCI) of the life and annuity run-off business, which was approximately $892 and $1 billion as of March 31, 2018 and December 31, 2017, respectively, largely consisting of net unrealized gains on investments, net of shadow DAC.
Following the sale, the Company will manage invested assets of the life and annuity run-off business for an initial term of five years and provide transition services for an estimated period of 12 to 24 months.
The following table summarizes the major classes of assets and liabilities of discontinued operations.
Major Classes of Assets and Liabilities to be Transferred to the Buyer in Connection with the Sale
Carrying Value as of 3/31/2018 | Carrying Value as of 12/31/2017 | |||||
Assets | ||||||
Cash and investments | $ | 29,227 | $ | 30,135 | ||
Reinsurance recoverables | 20,701 | 20,785 | ||||
Loss accrual [1] | (3,195 | ) | (3,257 | ) | ||
Other assets | 1,425 | 1,439 | ||||
Separate account assets | 108,393 | 115,834 | ||||
Total assets held for sale | 156,551 | 164,936 | ||||
Liabilities | ||||||
Reserve for future policy benefits and unpaid loss and loss adjustment expenses | $ | 14,282 | $ | 14,482 | ||
Other policyholder funds and benefits payable | 28,921 | 29,228 | ||||
Long-term debt | 142 | 142 | ||||
Other liabilities | 2,456 | 2,756 | ||||
Separate account liabilities | 108,393 | 115,834 | ||||
Total liabilities held for sale | $ | 154,194 | $ | 162,442 | ||
[1] | Represents the estimated accrued loss on sale of the Company's life and annuity run-off business. |
56
THE HARTFORD FINANCIAL SERVICES GROUP, INC.
NOTES TO CONDENSED CONSOLIDATED FINANCIAL STATEMENTS (continued)
17. Business Dispositions and Discontinued Operations (continued)
Reconciliation of the Major Line Items Constituting Pretax Profit (Loss) of Discontinued Operations
For the periods ended March 31, | ||||||
2018 | 2017 | |||||
Revenues | ||||||
Earned premiums | $ | 27 | $ | 36 | ||
Fee income and other | 232 | 223 | ||||
Net investment income | 312 | 318 | ||||
Net realized capital losses | 21 | (45 | ) | |||
Total revenues | 592 | 532 | ||||
Benefits, losses and expenses | ||||||
Benefits, losses and loss adjustment expenses | 328 | 333 | ||||
Amortization of DAC | 41 | 19 | ||||
Insurance operating costs and other expenses [1] | 101 | 94 | ||||
Total benefits, losses and expenses | 470 | 446 | ||||
Income before income taxes | 122 | 86 | ||||
Income tax expense | 15 | 11 | ||||
Income from operations of discontinued operations, net of tax | 107 | 75 | ||||
Net realized capital gain on disposal, net of tax | 62 | — | ||||
Income from discontinued operations, net of tax | $ | 169 | $ | 75 | ||
[1]Corporate allocated overhead has been included in continuing operations.
Cash flows from discontinued operations included in the Consolidated Statement of Cash Flows were as follows:
Cash Flows from Discontinued Operations
Three Months Ended March 31, | ||||||
2018 | 2017 | |||||
Net cash provided by operating activities from discontinued operations | $ | 267 | $ | 342 | ||
Net cash (used in) provided by investing activities from discontinued operations | $ | (187 | ) | $ | (467 | ) |
Net cash (used in) provided by financing activities from discontinued operations [1] | $ | (340 | ) | $ | 105 | |
Cash paid for interest | $ | 2 | $ | 2 | ||
[1] Excludes return of capital to parent of $300 for the three months ended March 31, 2017.
57
Part I - Item 2. Management's Discussion and Analysis of Financial Condition and Results of Operations
Item 2. MANAGEMENT’S DISCUSSION AND ANALYSIS OF FINANCIAL CONDITION
AND RESULTS OF OPERATIONS
(Dollar amounts in millions except for per share data, unless otherwise stated)
The Hartford provides projections and other forward-looking information in the following discussions, which contain many forward-looking statements, particularly relating to the Company’s future financial performance. These forward-looking statements are estimates based on information currently available to the Company, are made pursuant to the safe harbor provisions of the Private Securities Litigation Reform Act of 1995 and are subject to the cautionary statements set forth on pages 3 and 4 of this Form 10-Q. Actual results are likely to differ, and in the past have differed, materially from those forecast by the Company, depending on the outcome of various factors, including, but not limited to, those set forth in the following discussion and in Part I, Item 1A, Risk Factors in The Hartford’s 2017 Form 10-K Annual Report, and those identified from time to time in our other filings with the Securities and Exchange Commission. The Hartford undertakes no obligation to publicly update any forward-looking statements, whether as a result of new information, future developments or otherwise.
On February 16, 2018, The Hartford entered into a renewal rights agreement with the Farmers Exchanges, of the Farmers Insurance Group of Companies, to acquire its Foremost-branded small commercial business sold through independent agents.
On December 3, 2017, Hartford Holdings, Inc., a wholly owned subsidiary of the Company, entered into a definitive agreement to sell all of the issued and outstanding equity of Hartford Life, Inc. (“HLI”), a holding company, and its life and annuity operating subsidiaries. For discussion of this transaction, see Note 17 - Business Dispositions and Discontinued Operations of Notes to Condensed Consolidated Financial Statements.
On November 1, 2017, Hartford Life and Accident Insurance Company ("HLA"), a wholly owned subsidiary of the Company, completed the acquisition of Aetna's U.S. group life and disability business through a reinsurance transaction. Aetna's U.S. group life and disability revenue and earnings since the acquisition date are included in the operating results of the Company's Group Benefits reporting segment. For discussion of this transaction, see Note 2 - Business Acquisitions of Notes to Condensed Consolidated Financial Statements.
On May 10, 2017, the Company completed the sale of its U.K. property and casualty run-off subsidiaries. The operating results of the Company's U.K. property and casualty run-off subsidiaries are included in the P&C Other Operations reporting segment. For discussion of this transaction, see Note 20 - Business Dispositions and Discontinued Operations in The Hartford's 2017 Form 10K Annual Report Notes to Consolidated Financial Statements.
Certain reclassifications have been made to historical financial information presented in Management's Discussion and Analysis of Financial Condition and Results of Operations ("MD&A") to conform to the current period presentation.
Amortization of intangible assets has been reclassified out of Insurance operating costs and other expenses on the Condensed Consolidated Statements of Operations into their own line item.
Distribution costs within the Mutual Funds segment that were previously netted against fee income are presented gross in insurance operating costs and other expenses.
Assets and liabilities associated with the Company's life and annuity run-off business are now classified as held for sale.
Unpaid losses and loss adjustment expenses and reinsurance recoverables for structured settlements reserves and recoverables due from the Company's life and annuity run-off business now classified as held for sale have been reclassified into the Company's P&C Commercial Lines business. Annuities purchased from the Company's life and annuity run-off business are recognized as reinsurance recoverables in cases where the Company has not obtained a release from the claimant. These amounts were previously eliminated in consolidation.
Policy loans have been reclassified to Other investments on the Condensed Consolidated Balance Sheets.
Other intangible assets have been reclassified out of Other assets on the Condensed Consolidated Balance Sheets into their own line item.
The Hartford defines increases or decreases greater than or equal to 200% as “NM” or not meaningful.
INDEX
Description | Page |
Key Performance Measures and Ratios | |
Commercial Lines | |
Personal Lines | |
58
Part I - Item 2. Management's Discussion and Analysis of Financial Condition and Results of Operations
KEY PERFORMANCE MEASURES AND RATIOS
The Company considers the measures and ratios in the following discussion to be key performance indicators for its businesses. Management believes that these ratios and measures are useful in understanding the underlying trends in The Hartford’s businesses. However, these key performance indicators should only be used in conjunction with, and not in lieu of, the results presented in the segment discussions that follow in this MD&A. These ratios and measures may not be comparable to other performance measures used by the Company’s competitors.
Definitions of Non-GAAP and Other Measures and Ratios
Assets Under Management ("AUM")- include mutual fund and Exchange-Traded Products ("ETP") assets. AUM is a measure used by the Company because a significant portion of the Company’s mutual fund revenues are based upon asset values. These revenues increase or decrease with a rise or fall in AUM whether caused by changes in the market or through net flows.
Book Value per Diluted Share-excluding AOCI, is calculated based upon a non-GAAP financial measure. It is calculated by dividing (a) total stockholders' equity, excluding AOCI, after tax, by (b) common shares outstanding and dilutive potential common shares. The Company provides this measure to enable investors to analyze the amount of the Company's net worth that is primarily attributable to the Company's business operations. The Company believes it is useful to investors because it eliminates the effect of items that can fluctuate significantly from period to period, primarily based on changes in interest rates.
Catastrophe Ratio-(a component of the loss and loss adjustment expense ratio) represents the ratio of catastrophe losses incurred in the current calendar year (net of reinsurance) to earned premiums and includes catastrophe losses incurred for both the current and prior accident years. A catastrophe is an event that causes $25 or more in industry insured property losses and affects a significant number of property and casualty
policyholders and insurers, as defined by the Property Claim Service office of Verisk. The catastrophe ratio includes the effect of catastrophe losses, but does not include the effect of reinstatement premiums.
Combined Ratio-the sum of the loss and loss adjustment expense ratio, the expense ratio and the policyholder dividend ratio. This ratio is a relative measurement that describes the related cost of losses and expenses for every $100 of earned premiums. A combined ratio below 100 demonstrates underwriting profit; a combined ratio above 100 demonstrates underwriting losses.
Core Earnings- a non-GAAP measure, is an important measure of the Company’s operating performance. The Company believes that core earnings provides investors with a valuable measure of the underlying performance of the Company’s businesses because it reveals trends in our insurance and financial services businesses that may be obscured by including the net effect of certain realized capital gains and losses, certain restructuring and other costs, integration and transaction costs in connection with an acquired business, pension settlements, loss on extinguishment of debt, gains and losses on reinsurance transactions, income tax benefit from a reduction in deferred income tax valuation allowance, impact of tax reform on net deferred tax assets, and results of discontinued operations. Some realized capital gains and losses are primarily driven by investment decisions and external economic developments, the nature and timing of which are unrelated to the insurance and underwriting aspects of our business. Accordingly, core earnings excludes the effect of all realized gains and losses that tend to be variable from period to period based on capital market conditions. The Company believes, however, that some realized capital gains and losses are integrally related to our insurance operations, so core earnings includes net realized gains and losses such as net periodic settlements on credit derivatives. These net realized gains and losses are directly related to an offsetting item included in the income statement such as net investment income. Net income (loss) is the most directly comparable U.S. GAAP measure. Core earnings should not be considered as a substitute for net income (loss) and does not reflect the overall profitability of the Company’s business. Therefore, the Company believes that it is useful for investors to evaluate both net income (loss) and core earnings when reviewing the Company’s performance.
Reconciliation of Net Income to Core Earnings
Three Months Ended March 31, | ||||||
2018 | 2017 | |||||
Net income | $ | 597 | $ | 378 | ||
Less: Net realized capital gains (losses) excluded from core earnings, before tax | (30 | ) | 23 | |||
Less: Integration and transaction costs associated with acquired business, before tax | (12 | ) | — | |||
Less: Income tax benefit (expense) | 9 | (8 | ) | |||
Less: Income from discontinued operations, after tax | 169 | 75 | ||||
Core earnings | $ | 461 | $ | 288 | ||
Core Earnings Margin- a non-GAAP financial measure that the Company uses to evaluate, and believes is an important
measure of, the Group Benefits segment’s operating performance. Core earnings margin is calculated by dividing core
59
Part I - Item 2. Management's Discussion and Analysis of Financial Condition and Results of Operations
earnings by revenues excluding buyouts and realized gains (losses). Net income margin is the most directly comparable U.S. GAAP measure. The Company believes that core earnings margin provides investors with a valuable measure of the performance of Group Benefits because it reveals trends in the business that may be obscured by the effect of buyouts and realized gains (losses). Core earnings margin should not be considered as a substitute for net income margin and does not reflect the overall profitability of Group Benefits. Therefore, the Company believes it is important for investors to evaluate both core earnings margin and net income margin when reviewing performance. A reconciliation of net income margin to core earnings margin is set forth in the Results of Operations section within MD&A - Group Benefits.
Expense Ratio- for the underwriting segments of Commercial Lines and Personal Lines is the ratio of underwriting expenses less fee income, to earned premiums. Underwriting expenses include the amortization of deferred policy acquisition costs and insurance operating costs and expenses, including certain centralized services costs and bad debt expense. Deferred policy acquisition costs include commissions, taxes, licenses and fees and other incremental direct underwriting expenses and are amortized over the policy term.
The expense ratio for Group Benefits is expressed as the ratio of insurance operating costs and other expenses including amortization of intangibles and amortization of deferred policy acquisition costs, to premiums and other considerations, excluding buyout premiums. The expense ratio does not include integration and other transaction costs associated with acquired business.
Fee Income- largely driven from amounts earned as a result of contractually defined percentages of assets under management in our Mutual Funds business. These fees are generally earned on a daily basis. Therefore, the growth in assets under management either through positive net flows or favorable market performance will have a favorable impact on fee income. Conversely, either negative net flows or unfavorable market performance will reduce fee income.
Loss and Loss Adjustment Expense Ratio- a measure of the cost of claims incurred in the calendar year divided by earned premium and includes losses incurred for both the current and prior accident years. Among other factors, the loss and loss adjustment expense ratio needed for the Company to achieve its targeted return on equity fluctuates from year to year based on changes in the expected investment yield over the claim settlement period, the timing of expected claim settlements and the targeted returns set by management based on the competitive environment.
The loss and loss adjustment expense ratio is affected by claim frequency and claim severity, particularly for shorter-tail property lines of business, where the emergence of claim frequency and severity is credible and likely indicative of ultimate losses. Claim frequency represents the percentage change in the average number of reported claims per unit of exposure in the current accident year compared to that of the previous accident year. Claim severity represents the percentage change in the estimated average cost per claim in the current accident year compared to that of the previous accident year. As one of the factors used to determine pricing, the Company’s practice is to first make an overall assumption about claim frequency and severity for a given line of business and then, as part of the
ratemaking process, adjust the assumption as appropriate for the particular state, product or coverage.
Loss and Loss Adjustment Expense Ratio before Catastrophes and Prior Accident Year Development- a measure of the cost of non-catastrophe claims incurred in the current accident year divided by earned premiums. Management believes that the current accident year loss and loss adjustment expense ratio before catastrophes is a performance measure that is useful to investors as it removes the impact of volatile and unpredictable catastrophe losses and prior accident year development.
Loss Ratio, excluding Buyouts- utilized for the Group Benefits segment and is expressed as a ratio of benefits, losses and loss adjustment expenses to premiums and other considerations, excluding buyout premiums. Since Group Benefits occasionally buys a block of claims for a stated premium amount, the Company excludes this buyout from the loss ratio used for evaluating the underwriting results of the business as buyouts may distort the loss ratio. Buyout premiums represent takeover of open claim liabilities and other non-recurring premium amounts.
Mutual Fund and Exchange-Traded Product Assets- are owned by the shareholders of those products and not by the Company and, therefore, are not reflected in the Company’s consolidated financial statements except in instances where the Company seeds new mutual funds and holds an investment in the fund for a period of time. Mutual fund and ETP assets are a measure used by the Company primarily because a significant portion of the Company’s Mutual Funds segment revenues are based upon asset values. These revenues increase or decrease with a rise or fall in AUM whether caused by changes in the market or through net flows.
New Business Written Premium- represents the amount of premiums charged for policies issued to customers who were not insured with the Company in the previous policy term. New business written premium plus renewal policy written premium equals total written premium.
Policies in Force- represent the number of policies with coverage in effect as of the end of the period. The number of policies in force is a growth measure used for Personal Lines and standard commercial lines within Commercial Lines and is affected by both new business growth and policy count retention.
Policy Count Retention- represents the ratio of the number of policies renewed during the period divided by the number of policies available to renew. The number of policies available to renew represents the number of policies, net of any cancellations, written in the previous policy term. Policy count retention is affected by a number of factors, including the percentage of renewal policy quotes accepted and decisions by the Company to non-renew policies because of specific policy underwriting concerns or because of a decision to reduce premium writings in certain classes of business or states. Policy count retention is also affected by advertising and rate actions taken by competitors.
Policyholder Dividend Ratio- the ratio of policyholder dividends to earned premium.
60
Part I - Item 2. Management's Discussion and Analysis of Financial Condition and Results of Operations
Prior Accident Year Loss and Loss Adjustment Expense Ratio- represents the increase (decrease) in the estimated cost of settling catastrophe and non-catastrophe claims incurred in prior accident years as recorded in the current calendar year divided by earned premiums.
Reinstatement Premiums- represents additional ceded premium paid for the reinstatement of the amount of reinsurance coverage that was reduced as a result of a reinsurance loss payment.
Renewal Earned Price Increase (Decrease)- Written premiums are earned over the policy term, which is six months for certain Personal Lines automobile business and twelve months for substantially all of the remainder of the Company’s Property and Casualty business. Since the Company earns premiums over the six to twelve month term of the policies, renewal earned price increases (decreases) lag renewal written price increases (decreases) by six to twelve months.
Renewal Written Price Increase (Decrease)- for Commercial Lines, represents the combined effect of rate changes, amount of insurance and individual risk pricing decisions per unit of exposure on policies that renewed. For Personal Lines, renewal written price increases represent the total change in premium per policy on those policies that renewed and includes the combined effect of rate changes, amount of insurance and other changes in exposure. For Personal Lines, other changes in exposure include, but are not limited to, the effect of changes in number of drivers, vehicles and incidents, as well as changes in customer policy elections, such as deductibles and limits. The rate component represents the change in rate filed with and approved by state regulators during the period and the amount of insurance represents the change in the value of the rating base, such as model year/vehicle symbol for automobiles, building replacement costs for property and wage inflation for workers’ compensation. A number of factors affect renewal written price increases (decreases) including expected loss costs as projected by the Company’s pricing actuaries, rate filings approved by state regulators, risk selection decisions made by the Company’s underwriters and marketplace competition. Renewal written price changes reflect the property and casualty insurance market cycle. Prices tend to increase for a particular line of business when insurance carriers have incurred significant losses in that line of business in the recent past or the industry as a whole commits less of its capital to writing exposures in that line of business. Prices tend to decrease when recent loss experience has been favorable or when competition among insurance carriers increases. Renewal written price statistics are subject to change from period to period, based on a number of factors, including changes in actuarial estimates and the effect of subsequent cancellations and non-renewals, and modifications made to better reflect ultimate pricing achieved.
Return on Assets (“ROA”), Core Earnings- a non-GAAP financial measure that the Company uses to evaluate, and believes is an important measure of the Mutual Funds segment’s operating performance. ROA is the most directly comparable U.S. GAAP measure. The Company believes that ROA, core earnings, provides investors with a valuable measure of the performance of the Mutual Funds segment because it reveals trends in our business that may be obscured by the effect of realized gains (losses). ROA, core earnings, should not be considered as a
substitute for ROA and does not reflect the overall profitability of our Mutual Funds business. Therefore, the Company believes it is important for investors to evaluate both ROA, core earnings, and ROA when reviewing the Mutual Funds segment performance. ROA, core earnings is calculated by dividing core earnings by a daily average AUM. A reconciliation of ROA to ROA, core earnings is set forth in the Results of Operations section within MD&A - Mutual Funds.
Underlying Combined Ratio- a non-GAAP financial measure, represents the combined ratio before catastrophes and prior accident year development. Combined ratio is the most directly comparable U.S. GAAP measure. The Company believes the underlying combined ratio is an important measure of the trend in profitability since it removes the impact of volatile and unpredictable catastrophe losses and prior accident year loss and loss adjustment expense reserve development. A reconciliation of combined ratio to underlying combined ratio is set forth in the Results of Operations section within MD&A - Commercial Lines and Personal Lines.
Underwriting Gain (Loss)- The Company's management evaluates profitability of the P&C businesses primarily on the basis of underwriting gain (loss). Underwriting gain (loss) is a before tax measure that represents earned premiums less incurred losses, loss adjustment expenses and underwriting expenses. Underwriting gain (loss) is influenced significantly by earned premium growth and the adequacy of the Company's pricing. Underwriting profitability over time is also greatly influenced by the Company's pricing and underwriting discipline, which seeks to manage exposure to loss through favorable risk selection and diversification, its management of claims, its use of reinsurance and its ability to manage its expense ratio, which it accomplishes through economies of scale and its management of acquisition costs and other underwriting expenses. Net income (loss) is the most directly comparable GAAP measure. The Company believes that underwriting gain (loss) provides investors with a valuable measure of before tax profitability derived from underwriting activities, which are managed separately from the Company's investing activities. A reconciliation of underwriting gain (loss) to net income (loss) for Commercial Lines, Personal Lines and Property & Casualty Other Operations is set forth in segment sections of MD&A.
Written and Earned Premiums- Written premium is a statutory accounting financial measure which represents the amount of premiums charged for policies issued, net of reinsurance, during a fiscal period. Earned premium is a U.S. GAAP and statutory measure. Premiums are considered earned and are included in the financial results on a pro rata basis over the policy period. Management believes that written premium is a performance measure that is useful to investors as it reflects current trends in the Company’s sale of property and casualty insurance products. Written and earned premium are recorded net of ceded reinsurance premium.
Traditional life and disability insurance type products, such as those sold by Group Benefits, collect premiums from policyholders in exchange for financial protection for the policyholder from a specified insurable loss, such as death or disability. These premiums together with net investment income earned from the overall investment strategy are used to pay the contractual obligations under these insurance contracts. Two major factors, new sales and persistency, impact premium growth.
61
Part I - Item 2. Management's Discussion and Analysis of Financial Condition and Results of Operations
Sales can increase or decrease in a given year based on a number of factors, including but not limited to, customer demand for the Company’s product offerings, pricing competition, distribution channels and the Company’s reputation and ratings. Persistency refers to the percentage of premium remaining in-force from year-to-year.
THE HARTFORD’S OPERATIONS
Overview
The Hartford conducts business principally in five reporting segments including Commercial Lines, Personal Lines, Property & Casualty Other Operations, Group Benefits and Mutual Funds, as well as a Corporate category. The Hartford includes in its Corporate category discontinued operations of the Company's life and annuity run-off business accounted for as held for sale, reserves for structured settlement and terminal funding agreement liabilities retained, capital raising activities (including debt financing and related interest expense), purchase accounting adjustments related to goodwill and other expenses not allocated to the reporting segments.
The Company derives its revenues principally from: (a) premiums earned for insurance coverage provided to insureds; (b) management fees on mutual fund and ETP assets; (c) net investment income; (d) fees earned for services provided to third parties; and (e) net realized capital gains and losses. Premiums charged for insurance coverage are earned principally on a pro rata basis over the terms of the related policies in-force.
The profitability of the Company's property and casualty insurance businesses over time is greatly influenced by the Company’s underwriting discipline, which seeks to manage exposure to loss through favorable risk selection and diversification, its management of claims, its use of reinsurance, the size of its in force block, actual mortality and morbidity experience, and its ability to manage its expense ratio which it accomplishes through economies of scale and its management of acquisition costs and other underwriting expenses. Pricing adequacy depends on a number of factors, including the ability to obtain regulatory approval for rate changes, proper evaluation of underwriting risks, the ability to project future loss cost frequency and severity based on historical loss experience adjusted for known trends, the Company’s response to rate actions taken by competitors, its expense levels and expectations about regulatory and legal developments. The Company seeks to price its insurance policies such that insurance premiums and future net investment income earned on premiums received will cover underwriting expenses and the ultimate cost of paying claims reported on the policies and provide for a profit margin. For many of its insurance products, the Company is required to obtain approval for its premium rates from state insurance departments.
Similar to Property & Casualty, profitability of the Group Benefits business depends, in large part, on the ability to evaluate and rice risks appropriately and make reliable estimates of mortality, morbidity, disability and longevity. To manage the pricing risk, Group Benefits generally offers term insurance policies, allowing
for the adjustment of rates or policy terms in order to minimize the adverse effect of market trends, loss costs, declining interest rates and other factors. However, as policies are typically sold with rate guarantees of up to three years, pricing for the Company’s products could prove to be inadequate if loss trends emerge adversely during the rate guarantee period. For some of its products, the Company is required to obtain approval for its premium rates from state insurance departments. New and renewal business for group benefits business, particularly for long-term disability, are priced using an assumption about expected investment yields over time. While the Company employs asset-liability duration matching strategies to mitigate risk and may use interest-rate sensitive derivatives to hedge its exposure in the Group Benefits investment portfolio, cash flow patterns related to the payment of benefits and claims are uncertain and actual investment yields could differ significantly from expected investment yields, affecting profitability of the business. In addition to appropriately evaluating and pricing risks, the profitability of the Group Benefits business depends on other factors, including the Company’s response to pricing decisions and other actions taken by competitors, its ability to offer voluntary products and self-service capabilities, the persistency of its sold business and its ability to manage its expenses which it seeks to achieve through economies of scale and operating efficiencies.
The financial results in the Company’s mutual fund and ETP businesses depend largely on the amount of assets under management on which it earns fees and the level of fees charged based, in part, on asset share class and product type. Changes in assets under management are driven by two main factors: net flows, and the market return of the funds, which is heavily influenced by the return realized in the equity and bond markets. Net flows are comprised of new sales less redemptions by mutual fund and ETP shareholders. Financial results are highly correlated to the growth in assets under management since these products generally earn fee income on a daily basis.
The investment return, or yield, on invested assets is an important element of the Company’s earnings since insurance products are priced with the assumption that premiums received can be invested for a period of time before benefits, loss and loss adjustment expenses are paid. Due to the need to maintain sufficient liquidity to satisfy claim obligations, the majority of the Company’s invested assets have been held in available-for-sale securities, including, among other asset classes, corporate bonds, municipal bonds, government debt, short-term debt, mortgage-backed securities and asset-backed securities and collateralized debt obligations.
The primary investment objective for the Company is to maximize economic value, consistent with acceptable risk parameters, including the management of credit risk and interest rate sensitivity of invested assets, while generating sufficient after tax income to meet policyholder and corporate obligations. Investment strategies are developed based on a variety of factors including business needs, regulatory requirements and tax considerations.
For further information on the Company's reporting segments refer to Part I, Item 1, Business - Reporting Segments in The Hartford’s 2017 Form 10-K Annual Report.
62
Part I - Item 2. Management's Discussion and Analysis of Financial Condition and Results of Operations
Financial Highlights
Net Income | Net Income per Diluted Share | Book Value per Diluted Share |
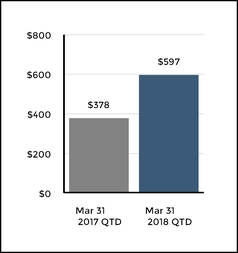
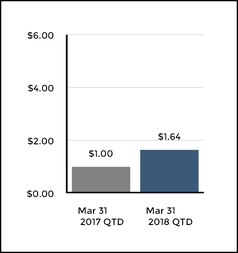
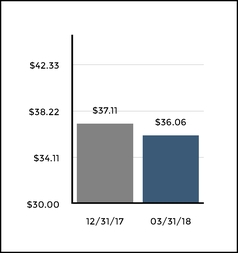
Net income increased to $597, or $1.67 per basic share and $1.64 per diluted share, from first quarter 2017 net income of $378, or $1.02 per basic share and $1.00 per diluted share, primarily due to the effects of a lower corporate Federal income tax rate, a higher underwriting gain in Property and Casualty, increased net investment income benefiting both Property and Casualty and Group Benefits, higher earnings in Mutual Funds and an increase in income from discontinued operations.
Book value per diluted share decreased to $36.06 from $37.11 as of December 31, 2017 as a result of a 3% decrease in stockholders' equity resulting primarily from a decrease in accumulated other comprehensive income ("AOCI") over the three month period, partially offset by net income in excess of shareholder dividends. AOCI decreased mainly due to lower net unrealized capital gains.
Net Investment Income | Annualized Investment Yield After tax |
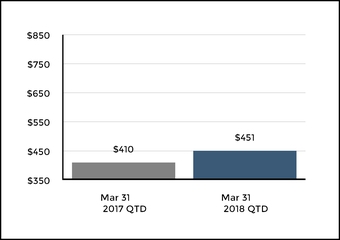
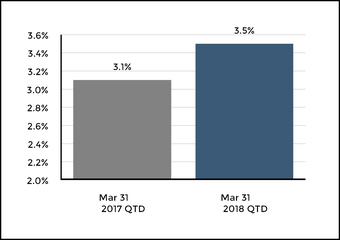
Net investment income of $451 increased 10% compared with first quarter 2017 primarily due to higher fixed maturities asset levels driven by the acquisition of Aetna's U.S. group life and disability business and higher income from limited partnerships and other alternative investments.
Net realized gains (losses) declined by $54 from the first quarter 2017 to $30 of net losses in 2018 principally due to a change to net realized losses on sales, primarily the result of duration, liquidity and credit management.
Annualized investment yield of 3.5%, after tax, increased from 3.1%, after tax, compared with first quarter 2017, primarily due the effect of a lower corporate Federal income tax rate.
63
Part I - Item 2. Management's Discussion and Analysis of Financial Condition and Results of Operations
Net unrealized gains, after tax, in the investment portfolio decreased by $855 in first quarter 2018 primarily due to the effect of higher interest rates and wider credit spreads.
Written Premiums | Combined Ratio |
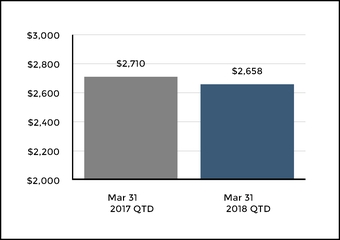
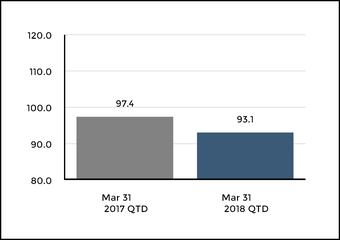
Written premiums for Property & Casualty decreased 2% compared with first quarter 2017 reflecting a decrease in Personal Lines, partially offset by an increase in Commercial Lines.
Combined ratio for Property & Casualty decreased 4.3 points to 93.1 compared with a combined ratio of 97.4 in first quarter 2017, largely due to lower catastrophes, more favorable prior accident year development and lower current accident year auto liability loss costs.
Catastrophe losses of $103, before tax, decreased from catastrophe losses of $150, before tax, in first quarter 2017, largely due to lower losses from winter storm events during the first quarter of 2018 compared to higher losses from wind and hail events in the first quarter of 2017.
Prior accident year development was a net favorable $32, before tax, in first quarter 2018, primarily due to a decrease in workers' compensation and homeowners reserves. Reserve development was a net unfavorable $12, before tax, in first quarter 2017, largely due to increased reserves for commercial automobile and general liability, partially offset by a decrease in reserves for workers' compensation.
Net Income Margin - Group Benefits |
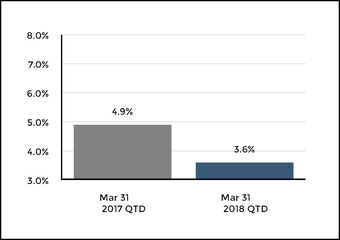
Net income margin on Group Benefits decreased to 3.6% from 4.9% in the first quarter 2017, primarily due to a change to net realized capital losses, integration costs incurred in the first quarter of 2018, a lower net investment yield and higher group life loss ratio, partially offset by an improvement in the expense ratio and an improved group disability loss ratio.
64
Part I - Item 2. Management's Discussion and Analysis of Financial Condition and Results of Operations
CONSOLIDATED RESULTS OF OPERATIONS
The Consolidated Results of Operations should be read in conjunction with the Company's Consolidated Financial Statements and the related Notes beginning on page F-1 as well as with the segment operating results sections of MD&A.
Three Months Ended March 31, | ||||||||
2018 | 2017 | Change | ||||||
Earned premiums | $ | 3,927 | $ | 3,438 | 14 | % | ||
Fee income | 323 | 278 | 16 | % | ||||
Net investment income | 451 | 410 | 10 | % | ||||
Net realized capital gains (losses) | (30 | ) | 24 | NM | ||||
Other revenues | 20 | 19 | 5 | % | ||||
Total revenues | 4,691 | 4,169 | 13 | % | ||||
Benefits, losses and loss adjustment expenses | 2,695 | 2,424 | 11 | % | ||||
Amortization of deferred policy acquisition costs | 342 | 344 | (1 | %) | ||||
Insurance operating costs and other expenses | 1,037 | 919 | 13 | % | ||||
Interest expense | 80 | 80 | — | % | ||||
Amortization of other intangible assets | 18 | 1 | NM | |||||
Total benefits, losses and expenses | 4,172 | 3,768 | 11 | % | ||||
Income from continuing operations before income taxes | 519 | 401 | 29 | % | ||||
Income tax expense | 91 | 98 | (7 | %) | ||||
Income from continuing operations, net of tax | 428 | 303 | 41 | % | ||||
Income from discontinued operations, net of tax | 169 | 75 | 125 | % | ||||
Net income | $ | 597 | $ | 378 | 58 | % | ||
Three months ended March 31, 2018 compared to the three months ended March 31, 2017
Net income increased by $219 with an increase in income from both continuing operations and discontinued operations. Income from continuing operations increased by $125, primarily due to the effects of a lower corporate Federal income tax rate, a higher underwriting gain in Property and Casualty, increased net investment income benefiting both Property and Casualty and Group Benefits and higher earnings in Mutual Funds.
Earned premiums increased by $489 before tax, primarily due to the acquisition of the Aetna U.S. group life and disability business in November 2017 that has increased earned premiums in our Group Benefits segment. Earned premiums in Property and Casualty declined reflecting an 8% decline in Personal Lines, partially offset by 1% growth in Commercial Lines. For a discussion of the Company's operating results by segment, see MD&A - Results of Operations by Segment.
Fee income increased by 16% reflecting increased fee income in Mutual Funds largely due to higher assets under management.
Net investment income increased by 10%, primarily due to a higher level of invested assets due to the acquisition of
the Aetna U.S. group life and disability business and higher income from limited partnerships and other alternative investments. For further discussion of investment results, see MD&A - Investment Results, Net Investment Income.
Net realized capital losses of $30 in the first quarter of 2018 compared with net realized capital gains of $24 in the first quarter of 2017, with losses in 2018 driven by sales of fixed maturities, AFS primarily the result of duration, liquidity and credit management. For further discussion of investment results, see MD&A - Investment Results, Net Realized Capital Gains (Losses).
Benefits, losses and loss adjustment expenses decreased in Property & Casualty and increased in Group Benefits. The increase in Group Benefits was largely due to the acquisition of the Aetna U.S. group life and disability business and higher group life mortality, partially offset by a lower group disability loss ratio. The net decrease in incurred losses for Property & Casualty was driven by:
• | Current accident year losses and loss adjustment expenses before catastrophes in Property & Casualty decreased $75, before tax, primarily resulting from the effect of lower Personal Lines earned premium and lower Personal Lines automobile liability loss costs. |
• | Current accident year catastrophe losses of $103, before tax, for the three months ended March 31, 2018, compared to |
65
Part I - Item 2. Management's Discussion and Analysis of Financial Condition and Results of Operations
$150, before tax, for the prior year period. Catastrophe losses in 2018 were primarily from East coast winter storms. Catastrophe losses in 2017 were primarily due to multiple wind and hail events across various U.S. geographic regions. For additional information, see MD&A - Critical Accounting Estimates, Property & Casualty Insurance Product Reserves, Net of Reinsurance.
• | Net prior accident year reserve development in Property & Casualty was favorable $32, before tax, for the three months ended March 31, 2018, compared to unfavorable net reserve development of $12, before tax, for the prior year period. Prior accident year development in 2018 primarily included a decrease in reserves for workers’ compensation and homeowners claims. Prior accident year development in 2017 was largely due to an increase in commercial automobile liability. For additional information, see MD&A - Critical Accounting Estimates, Reserve Rollforwards and Development. |
Amortization of deferred policy acquisition costs was relatively flat year over year as a decrease in Personal Lines was largely offset by an increase in Commercial Lines.
Insurance operating costs and other expenses increased due to operating costs associated with the acquisition of the Aetna U.S. group life and disability business and, to a lesser extent, higher variable expenses in Mutual Funds.
Amortization of other intangible assets increased reflecting the amortization of customer relationship intangibles in the Group Benefits segment that arose from the acquisition of the Aetna U.S. group life and disability business.
Income tax expense decreased primarily due to the effect of a lower corporate Federal income tax rate, partially offset by the effect of an increase in pre-tax income. Differences between the Company's effective income tax rate and the U.S. statutory rate of 21% and 35% in 2018 and 2017, respectively, are due primarily to tax-exempt interest earned on invested assets and stock-based compensation. For further discussion of income taxes, see Note 12 - Income Taxes of Notes to Condensed Consolidated Financial Statements.
Income from discontinued operations net of tax increased to $169 from $75 in the prior year quarter. The $169 of income from discontinued operations in the first quarter of 2018 was mostly attributable to the reclassification of $193 of stranded tax effects from AOCI to retained earnings related to the life and annuity run-off business. The reclassification reduced the estimated loss on sale with a corresponding increase in AOCI related to the assets held for sale. For more information on the reclassification of stranded tax effects, see Note 1 of Notes to Condensed Consolidated Financial Statements. Refer to the Corporate category MD&A discussion for more information about operating earnings from the life and annuity run-off business held for sale.
INVESTMENT RESULTS
Composition of Invested Assets | |||||||||||
March 31, 2018 | December 31, 2017 | ||||||||||
Amount | Percent | Amount | Percent | ||||||||
Fixed maturities, available-for-sale ("AFS"), at fair value | $ | 35,924 | 80.9 | % | $ | 36,964 | 81.9 | % | |||
Fixed maturities, at fair value using the fair value option ("FVO") | 38 | 0.1 | % | 41 | 0.1 | % | |||||
Equity securities, at fair value [1] | 1,123 | 2.5 | % | ||||||||
Equity securities, AFS, at fair value [1] | 1,012 | 2.3 | % | ||||||||
Mortgage loans | 3,221 | 7.2 | % | 3,175 | 7.0 | % | |||||
Limited partnerships and other alternative investments | 1,649 | 3.7 | % | 1,588 | 3.5 | % | |||||
Other investments [2] | 92 | 0.2 | % | 96 | 0.2 | % | |||||
Short-term investments | 2,385 | 5.4 | % | 2,270 | 5.0 | % | |||||
Total investments | $ | 44,432 | 100.0 | % | $ | 45,146 | 100.0 | % | |||
[1] | Effective January 1, 2018, with the adoption of new accounting standards for financial instruments, equity securities, AFS were reclassified to equity securities at fair value and are excluded from the table above as of March 31, 2018. |
[2] | Primarily relates to derivative instruments. |
March 31, 2018 compared to December 31, 2017
Total investments decreased primarily due to a decrease in fixed maturities, AFS, partially offset by slight increases in short-term investments and equity securities.
Fixed maturities, AFS decreased primarily due to the a decrease in valuations due to higher interest rates and wider credit spreads.
Short-term investments increased largely due to holding more short-term investments until those assets are reinvested into longer duration asset classes.
Equity securities increased largely due to purchases of common stock, slightly offset by a decrease in valuations.
66
Part I - Item 2. Management's Discussion and Analysis of Financial Condition and Results of Operations
Net Investment Income | ||||||||||
Three Months Ended March 31, | ||||||||||
2018 | 2017 | |||||||||
(Before tax) | Amount | Yield [1] | Amount | Yield [1] | ||||||
Fixed maturities [2] | $ | 349 | 3.9 | % | $ | 319 | 4.0 | % | ||
Equity securities | 6 | 2.3 | % | 5 | 2.1 | % | ||||
Mortgage loans | 33 | 4.1 | % | 30 | 4.1 | % | ||||
Limited partnerships and other alternative investments | 73 | 18.6 | % | 58 | 15.5 | % | ||||
Other [3] | 8 | 15 | ||||||||
Investment expense | (18 | ) | (17 | ) | ||||||
Total net investment income | $ | 451 | 4.2 | % | $ | 410 | 4.2 | % | ||
Total net investment income excluding limited partnerships and other alternative investments | $ | 378 | 3.7 | % | $ | 352 | 3.8 | % | ||
[1] | Yields calculated using annualized net investment income divided by the monthly average invested assets at amortized cost as applicable, excluding repurchase agreement and securities lending collateral , if any, and derivatives book value. |
[2] | Includes net investment income on short-term investments. |
[3] | Primarily includes income from derivatives that qualify for hedge accounting and hedge fixed maturities. |
Three months ended March 31, 2018, compared to the three months ended March 31, 2017
Total net investment income increased primarily due to higher income from fixed maturities and limited partnerships and other alternative investments. Fixed maturities income increased as compared to the prior year quarter primarily due to higher asset levels driven by the acquisition of Aetna's U.S. group life and disability business. Income from limited partnership and other alternative investments was above the prior year quarter due to higher returns on private equity investments.
Annualized net investment income yield, excluding limited partnerships and other alternative investments, was 3.7% in 2018 and 3.8% for the same period in 2017. Excluding non-routine items, which primarily include make-whole payments on fixed maturities, the annualized investment income yield was 3.6% for the three months ended March 31, 2018, down from 3.7% for the same period in 2017.
New money yield excluding certain U.S. Treasury securities and cash equivalent securities for the three months ended March 31, 2018, was approximately 3.8% which was above the average yield of sales and maturities of 3.3% for the same period. For the three months ended March 31, 2018, the average reinvestment rate of 3.8% increased from 3.5% for the three months ended March 31, 2017, due to higher interest rates.
As investment income in 2018 will include the lower yield on Aetna group life and disability assets that were recorded at current yields as of the November 1, 2017 acquisition date, we expect the annualized net investment income yield for the 2018 calendar year, excluding limited partnerships and other alternative investments, to be flat to slightly lower than the portfolio yield earned in 2017 though it could be higher depending on the level of non-routine income and if reinvestment rates stay above the sales/maturity yield. The estimated impact on net investment income yield is subject to change as the composition of the portfolio changes through portfolio management and changes in market conditions.
Net Realized Capital Gains (Losses) | ||||||
Three Months Ended March 31, | ||||||
(Before tax) | 2018 | 2017 | ||||
Gross gains on sales | $ | 19 | $ | 61 | ||
Gross losses on sales | (57 | ) | (46 | ) | ||
Equity securities [1] | 16 | — | ||||
Net other-than-temporary impairment ("OTTI") losses recognized in earnings [2] | — | (1 | ) | |||
Transactional foreign currency revaluation | 1 | 6 | ||||
Non-qualifying foreign currency derivatives | (3 | ) | (7 | ) | ||
Other, net [3] | (6 | ) | 11 | |||
Net realized capital gains (losses) | $ | (30 | ) | $ | 24 | |
[1] | Effective January 1, 2018, with adoption of new accounting standards for equity securities at fair value, includes all changes in fair value and trading gains and losses for equity securities. |
[2] | See Other-Than-Temporary Impairments within the Investment Portfolio Risks and Risk Management section of the MD&A. |
[3] | Primarily consists of changes in value of non-qualifying derivatives and including credit derivatives. |
67
Part I - Item 2. Management's Discussion and Analysis of Financial Condition and Results of Operations
Three months ended March 31, 2018
Gross gains and losses on sales were primarily the result of duration, liquidity and credit management within corporate securities, U.S. treasury securities, and tax-exempt municipal bonds.
Equity securities gains were primarily driven by the sale of a private direct equity investment, partially offset by a decline in fair value of common stock investments.
Other, net gains and losses were primarily due to losses of $6 related to credit derivatives driven by credit spread widening.
Three months ended March 31, 2017
Gross gains and losses on sales were primarily the result of duration, liquidity and credit management within corporate securities, equity securities, residential mortgage-backed securities ("RMBS") and U.S. treasury securities.
Other, net gains primarily related to $9 of interest rate derivatives used to manage duration.
CRITICAL ACCOUNTING ESTIMATES
The preparation of financial statements in conformity with U.S. GAAP requires management to make estimates and assumptions that affect the reported amounts of assets and liabilities and disclosure of contingent assets and liabilities at the date of the financial statements and the reported amounts of revenues and expenses during the reporting period. Actual results could differ, and in the past have differed, from those estimates.
The Company has identified the following estimates as critical in that they involve a higher degree of judgment and are subject to a significant degree of variability:
• | property and casualty insurance product reserves, net of reinsurance; |
• | group benefit long-term disability (LTD) reserves, net of reinsurance; |
• | evaluation of goodwill for impairment; |
• | valuation of investments and derivative instruments including evaluation of other-than-temporary impairments on available-for-sale securities and valuation allowances on mortgage loans; |
• | valuation allowance on deferred tax assets; and |
• | contingencies relating to corporate litigation and regulatory matters. |
Certain of these estimates are particularly sensitive to market conditions, and deterioration and/or volatility in the worldwide debt or equity markets could have a material impact on the Condensed Consolidated Financial Statements. In developing these estimates, management makes subjective and complex judgments that are inherently uncertain and subject to material change as facts and circumstances develop. Although variability is inherent in these estimates, management believes the amounts
provided are appropriate based upon the facts available upon compilation of the financial statements.
The Company’s critical accounting estimates are discussed in Part II, Item 7 MD&A in the Company’s 2017 Form 10-K Annual Report. In addition, Note 1 - Basis of Presentation and Significant Accounting Policies of Notes to Consolidated Financial Statements included in the Company's 2017 Form 10-K Annual Report should be read in conjunction with this section to assist with obtaining an understanding of the underlying accounting policies related to these estimates. The following discussion updates certain of the Company’s critical accounting estimates as of March 31, 2018.
Property & Casualty Insurance Product Reserves, Net of Reinsurance
P&C Loss and Loss Adjustment Expense ("LAE") Reserves of $19,777, Net of Reinsurance, by Segment as of March 31, 2018
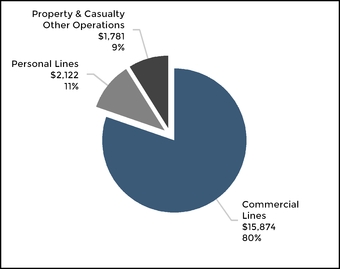
Based on the results of the quarterly reserve review process, the Company determines the appropriate reserve adjustments, if any, to record. Recorded reserve estimates are adjusted after consideration of numerous factors, including but not limited to, the magnitude of the difference between the actuarial indication and the recorded reserves, improvement or deterioration of actuarial indications in the period, the maturity of the accident year, trends observed over the recent past and the level of volatility within a particular line of business. In general, adjustments are made more quickly to more mature accident years and less volatile lines of business. Such adjustments of reserves are referred to as “prior accident year development”. Increases in previous estimates of ultimate loss costs are referred to as either an increase in prior accident year reserves or as unfavorable reserve development. Decreases in previous estimates of ultimate loss costs are referred to as either a decrease in prior accident year reserves or as favorable reserve development. Reserve development can influence the comparability of year over year underwriting results and is set forth in the paragraphs and tables that follow.
68
Part I - Item 2. Management's Discussion and Analysis of Financial Condition and Results of Operations
Rollforward of Property and Casualty Insurance Product Liabilities for Unpaid Losses and LAE for the Three Months Ended March 31, 2018
Commercial Lines | Personal Lines | Property & Casualty Other Operations | Total Property & Casualty Insurance | |||||||||
Beginning liabilities for unpaid losses and loss adjustment expenses, gross | $ | 18,893 | $ | 2,294 | $ | 2,588 | $ | 23,775 | ||||
Reinsurance and other recoverables | 3,147 | 71 | 739 | 3,957 | ||||||||
Beginning liabilities for unpaid losses and loss adjustment expenses, net | 15,746 | 2,223 | 1,849 | 19,818 | ||||||||
Provision for unpaid losses and loss adjustment expenses | ||||||||||||
Current accident year before catastrophes | 971 | 566 | — | 1,537 | ||||||||
Current accident year ("CAY") catastrophes ("CATS") | 69 | 34 | — | 103 | ||||||||
Prior accident year development ("PYD") | (19 | ) | (13 | ) | — | (32 | ) | |||||
Total provision for unpaid losses and loss adjustment expenses | 1,021 | 587 | — | 1,608 | ||||||||
Less: payments | 893 | 688 | 68 | 1,649 | ||||||||
Ending liabilities for unpaid losses and loss adjustment expenses, net | 15,874 | 2,122 | 1,781 | 19,777 | ||||||||
Reinsurance and other recoverables | 3,146 | 62 | 730 | 3,938 | ||||||||
Ending liabilities for unpaid losses and loss adjustment expenses, gross | $ | 19,020 | $ | 2,184 | $ | 2,511 | $ | 23,715 | ||||
Earned premiums and fee income | $ | 1,720 | $ | 869 | ||||||||
Loss and loss expense paid ratio [1] | 51.9 | 79.2 | ||||||||||
Loss and loss expense incurred ratio | 59.7 | 68.3 | ||||||||||
Prior accident year development (pts) [2] | (1.1 | ) | (1.5 | ) | ||||||||
[1] | The “loss and loss expense paid ratio” represents the ratio of paid losses and loss adjustment expenses to earned premiums. |
[2] | “Prior accident year development (pts)” represents the ratio of prior accident year development to earned premiums. |
Current Accident Year Catastrophe Losses for the Three Months Ended March 31, 2018, Net of Reinsurance
Commercial Lines | Personal Lines | |||||
Wind and hail | $ | 7 | $ | 12 | ||
Winter Storms | 62 | 22 | ||||
Total Catastrophe Losses | $ | 69 | $ | 34 | ||
69
Part I - Item 2. Management's Discussion and Analysis of Financial Condition and Results of Operations
Unfavorable (Favorable) Prior Accident Year Development for the Three Months Ended March 31, 2018
Commercial Lines | Personal Lines | Property & Casualty Other Operations | Total Property & Casualty Insurance | |||||||||
Workers’ compensation | $ | (25 | ) | $ | — | $ | — | $ | (25 | ) | ||
Workers’ compensation discount accretion | 10 | — | — | 10 | ||||||||
General liability | 8 | — | — | 8 | ||||||||
Package business | 8 | — | — | 8 | ||||||||
Commercial property | (13 | ) | — | — | (13 | ) | ||||||
Professional liability | 2 | — | — | 2 | ||||||||
Bond | — | — | — | — | ||||||||
Automobile liability | (5 | ) | — | — | (5 | ) | ||||||
Homeowners | — | (12 | ) | — | (12 | ) | ||||||
Net asbestos reserves | — | — | — | — | ||||||||
Net environmental reserves | — | — | — | — | ||||||||
Catastrophes | (8 | ) | 5 | — | (3 | ) | ||||||
Uncollectible reinsurance | — | — | — | — | ||||||||
Other reserve re-estimates, net | 4 | (6 | ) | — | (2 | ) | ||||||
Total prior accident year development | $ | (19 | ) | $ | (13 | ) | $ | — | $ | (32 | ) | |
Workers’ compensation reserves were reduced in small commercial, primarily for accident years 2011 to 2015, as both claim frequency and medical claim severity have emerged favorably compared to previous reserve estimates.
General liability reserves were increased modestly, primarily due to an increase in reserves for specialty business within middle market for accident years 2009 to 2017, largely offset by a decrease in reserves for other lines within middle market, including premises and operations and products liability, principally for accident years 2015 and prior. Contributing to the increase in reserves for specialty general liability reserves was an increase in large losses. Contributing to the reduction in reserves
for other middle market lines was more favorable outcomes on litigated claims.
Package business reserves were increased primarily due to increased severity of 2017 accident year property claims.
Commercial property reserves were reduced, driven by an increase in estimated reinsurance recoverable on marine losses from the 2017 accident year.
Homeowners reserves were reduced, primarily in accident years 2013 to 2017, driven by lower than expected severity across multiple perils.
70
Part I - Item 2. Management's Discussion and Analysis of Financial Condition and Results of Operations
Rollforward of Property and Casualty Insurance Product Liabilities for Unpaid Losses and LAE for the Three Months Ended March 31, 2017
Commercial Lines | Personal Lines | Property & Casualty Other Operations | Total Property & Casualty Insurance | |||||||||
Beginning liabilities for unpaid losses and loss adjustment expenses, gross | $ | 17,950 | $ | 2,094 | $ | 2,501 | $ | 22,545 | ||||
Reinsurance and other recoverables | 3,037 | 25 | 426 | 3,488 | ||||||||
Beginning liabilities for unpaid losses and loss adjustment expenses, net | 14,913 | 2,069 | 2,075 | 19,057 | ||||||||
Provision for unpaid losses and loss adjustment expenses | ||||||||||||
Current accident year before catastrophes | 968 | 644 | — | 1,612 | ||||||||
Current accident year catastrophes | 71 | 79 | — | 150 | ||||||||
Prior accident year development | 15 | (4 | ) | 1 | 12 | |||||||
Total provision for unpaid losses and loss adjustment expenses | 1,054 | 719 | 1 | 1,774 | ||||||||
Less: payments | 863 | 710 | 79 | 1,652 | ||||||||
Ending liabilities for unpaid losses and loss adjustment expenses, net | 15,104 | 2,078 | 1,997 | 19,179 | ||||||||
Reinsurance and other recoverables | 3,042 | 25 | 411 | 3,478 | ||||||||
Ending liabilities for unpaid losses and loss adjustment expenses, gross | $ | 18,146 | $ | 2,103 | $ | 2,408 | $ | 22,657 | ||||
Earned premiums and fee income | $ | 1,698 | $ | 945 | ||||||||
Loss and loss expense paid ratio [1] | 50.8 | 75.1 | ||||||||||
Loss and loss expense incurred ratio | 62.4 | 77.0 | ||||||||||
Prior accident year development (pts) [2] | 0.9 | (0.4 | ) | |||||||||
[1] | The “loss and loss expense paid ratio” represents the ratio of paid losses and loss adjustment expenses to earned premiums. |
[2] | “Prior accident year development (pts)” represents the ratio of prior accident year development to earned premiums. |
Current Accident Year Catastrophe Losses for the Three Months Ended March 31, 2017, Net of Reinsurance
Commercial Lines | Personal Lines | |||||
Wind and hail | $ | 70 | $ | 76 | ||
Winter storms | 1 | 3 | ||||
Total Catastrophe Losses | $ | 71 | $ | 79 | ||
Unfavorable (Favorable) Prior Accident Year Development for the Three Months Ended March 31, 2017
Commercial Lines | Personal Lines | Property & Casualty Other Operations | Total Property & Casualty Insurance | |||||||||
Workers’ compensation | $ | (20 | ) | $ | — | $ | — | $ | (20 | ) | ||
Workers’ compensation discount accretion | 8 | — | — | 8 | ||||||||
General liability | 10 | — | — | 10 | ||||||||
Commercial property | 1 | — | — | 1 | ||||||||
Bond | (10 | ) | — | — | (10 | ) | ||||||
Automobile liability | 20 | — | — | 20 | ||||||||
Catastrophes | — | (3 | ) | — | (3 | ) | ||||||
Other reserve re-estimates, net | 6 | (1 | ) | 1 | 6 | |||||||
Total prior accident year development | $ | 15 | $ | (4 | ) | $ | 1 | $ | 12 | |||
71
Part I - Item 2. Management's Discussion and Analysis of Financial Condition and Results of Operations
Workers’ compensation reserves in small commercial were reduced given the continued emergence of favorable frequency for accident years 2013 to 2015. Management has placed additional weight on this favorable experience as it becomes more credible.
General liability reserves were increased for the 2013 to 2016 accident years on a class of business that insures service and maintenance contractors. This increase was partially offset by a decrease in recent accident year reserves for other middle market general liability reserves.
Bond business reserves related to recent accident years were reduced as reported losses for commercial and contract surety have emerged favorably.
Automobile liability reserves within Commercial Lines were increased in small commercial and large national accounts for the 2013 to 2016 accident years, driven by higher frequency of more severe accidents, including litigated claims.
P&C Other Operations Total Reserves, Net of Reinsurance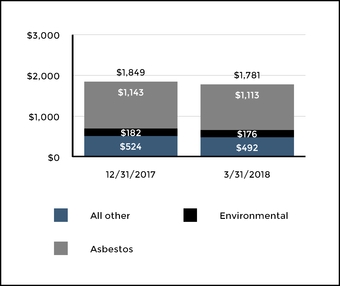
Asbestos and Environmental Reserves
Reserves for asbestos and environmental are primarily within P&C Other Operations with less significant amounts of asbestos and environmental reserves included within Commercial Lines and Personal Lines. The following tables include all asbestos and environmental reserves, including reserves in P&C Other Operations and Commercial Lines and Personal Lines.
Asbestos and Environmental Net Reserves
Asbestos | Environmental | |||||
March 31, 2018 | ||||||
Property and Casualty Other Operations | $ | 1,113 | $ | 176 | ||
Commercial Lines and Personal Lines | 71 | 55 | ||||
Ending liability — net | $ | 1,184 | $ | 231 | ||
December 31, 2017 | ||||||
Property and Casualty Other Operations | $ | 1,143 | $ | 182 | ||
Commercial Lines and Personal Lines | 72 | 55 | ||||
Ending liability — net | $ | 1,215 | $ | 237 | ||
Property & Casualty Reserves Asbestos and Environmental ("A&E") Summary as of March 31, 2018
Asbestos | Environmental | Total A&E | ||||||||
Gross | ||||||||||
Direct | $ | 1,378 | $ | 327 | $ | 1,705 | ||||
Assumed Reinsurance | 419 | 46 | 465 | |||||||
Total | 1,797 | 373 | 2,170 | |||||||
Ceded- other than NICO | (430 | ) | (40 | ) | (470 | ) | ||||
Ceded - NICO ADC | (183 | ) | (102 | ) | (285 | ) | ||||
Net | $ | 1,184 | $ | 231 | $ | 1,415 | ||||
Rollforward of Asbestos and Environmental Losses and LAE for the Three Months Ended March 31, 2018 and March 31, 2017
Asbestos | Environmental | |||||
2018 | ||||||
Beginning liability—net | $ | 1,215 | $ | 237 | ||
Losses and loss adjustment expenses incurred | — | — | ||||
Losses and loss adjustment expenses paid | (31 | ) | (6 | ) | ||
Reclassification of allowance for uncollectible reinsurance | — | — | ||||
Ending liability – net | $ | 1,184 | $ | 231 | ||
2017 | ||||||
Beginning liability—net | $ | 1,363 | $ | 292 | ||
Losses and loss adjustment expenses incurred | — | — | ||||
Losses and loss adjustment expenses paid | (44 | ) | (28 | ) | ||
Reclassification of allowance for uncollectible reinsurance [1] | 1 | — | ||||
Ending liability – net | $ | 1,320 | $ | 264 | ||
[1]Related to the reclassification of an allowance for uncollectible reinsurance from the "All Other" category of P&C Other Operations reserves.
72
Part I - Item 2. Management's Discussion and Analysis of Financial Condition and Results of Operations
The Company classifies its asbestos and environmental reserves into two categories: Direct and Assumed Reinsurance.
• | Direct Insurance- includes primary and excess coverage. Of the two categories of claims, direct policies tend to have the greatest factual development from which to estimate the Company’s exposures. |
• | Assumed Reinsurance- includes both “treaty” reinsurance (covering broad categories of claims or blocks of business) and “facultative” reinsurance (covering specific risks or individual policies of primary or excess insurance companies). Assumed Reinsurance exposures are less predictable than direct insurance exposures because the Company does not generally receive notice of a reinsurance claim until the underlying direct insurance claim is mature. This causes a delay in the receipt of information at the reinsurer level and adds to the uncertainty of estimating related reserves. |
Adverse Development Cover
Effective December 31, 2016, the Company entered into an asbestos and environmental adverse development cover (“ADC”) reinsurance agreement with National Indemnity Company (“NICO”), a subsidiary of Berkshire Hathaway Inc., to reduce uncertainty about potential adverse development. Under the ADC, the Company paid a reinsurance premium of $650 for NICO to assume adverse net loss and allocated loss adjustment expense reserve development up to $1.5 billion above the Company’s existing net asbestos and environmental (“A&E”) reserves as of December 31, 2016 of approximately $1.7 billion. The $650 reinsurance premium was placed in a collateral trust account as security for NICO’s claim payment obligations to the Company. The Company has retained the risk of collection on amounts due from other third-party reinsurers and continues to be responsible for claims handling and other administrative services, subject to certain conditions. The ADC covers substantially all the Company’s A&E reserve development up to the reinsurance limit.
Under retroactive reinsurance accounting, net adverse asbestos and environmental reserve development after December 31, 2016, will result in an offsetting reinsurance recoverable up to the $1.5 billion limit. Cumulative ceded losses up to the $650 reinsurance premium paid are recognized as a dollar-for-dollar offset to direct losses incurred. Cumulative ceded losses exceeding the $650 reinsurance premium paid would result in a deferred gain. The deferred gain would be recognized over the claim settlement period in the proportion of the amount of cumulative ceded losses collected from the reinsurer to the estimated ultimate reinsurance recoveries. Consequently, until periods when the deferred gain is recognized as a benefit to earnings, cumulative adverse development of asbestos and environmental claims after December 31, 2016 in excess of $650 may result in significant charges against earnings.
As of March 31, 2018, the Company has incurred a cumulative $285 in adverse development on asbestos and environmental reserves that have been ceded under the ADC treaty with NICO, leaving approximately $1.2 billion of coverage available for future adverse net reserve development, if any.
Net and Gross Survival Ratios
Net and Gross survival ratios are a measure of the quotient of the carried reserves divided by average annual payments (net of reinsurance and on a gross basis) and is an indication of the number of years that carried reserves would last (i.e. survive) if future annual payments were consistent with the calculated historical average.
The survival ratios shown below are calculated for the one and three year periods ended March 31, 2018. The net basis survival ratio has been materially affected by the adverse development cover entered into between the Company and NICO. The Company cedes adverse asbestos and environmental development in excess of its December 31, 2016 net carried reserves of $1.7 billion to NICO up to a limit of $1.5 billion. Since December 31, 2016, net reserves for asbestos and environmental have been declining as the Company has had no net incurred losses but continues to pay down net loss reserves. As a result, this has the effect of reducing the one- and three-year net survival ratios shown in the table below. For asbestos, the table also presents the three-year net survival ratios excluding the effect of the PPG settlement in 2016.
Net and Gross Survival Ratios
Asbestos | Environmental | |
One year net survival ratio | 8.7 | 7.0 |
Three year net survival ratio- excluding PPG | 7.5 | 4.7 |
One year gross survival ratio | 9.8 | 9.5 |
Three year gross survival ratio - excluding PPG settlement | 8.7 | 6.6 |
Asbestos and Environmental Paid and Incurred Losses and LAE Development for the Three Months Ended March 31, 2018
Asbestos | Environmental | |||||||||||
Paid Losses & LAE | Incurred Losses & LAE | Paid Losses & LAE | Incurred Losses & LAE | |||||||||
Gross | $ | 42 | $ | — | $ | 6 | $ | — | ||||
Ceded- other than NICO | (11 | ) | — | — | — | |||||||
Ceded - NICO ADC | — | — | — | — | ||||||||
Net | $ | 31 | $ | — | $ | 6 | $ | — | ||||
Annual Reserve Reviews
Review of Asbestos Reserves
In 2018, the Company expects to perform its regular comprehensive annual review of asbestos reserves in the fourth quarter.
As part of its evaluation in the fourth quarter of 2017, the Company reviewed all of its open direct domestic insurance accounts exposed to asbestos liability, as well as assumed reinsurance accounts. Based on this evaluation, the Company increased its net asbestos reserves for prior year development by
73
Part I - Item 2. Management's Discussion and Analysis of Financial Condition and Results of Operations
$183 in the fourth quarter of 2017 which was offset by $183 of ceded losses under the ADC agreement.
Review of Environmental Reserves
In 2018, the Company expects to perform its regular comprehensive annual review of environmental reserves in the fourth quarter.
As part of its evaluation in the fourth quarter of 2017, the Company reviewed all of its open direct domestic insurance accounts exposed to environmental liability, as well as assumed reinsurance accounts for both direct and assumed reinsurance. Based on this evaluation, the Company increased its net environmental reserves for prior year development by $102 in the fourth quarter 2017 which was offset by $102 of ceded losses under the ADC agreement.
2017 Reserve Reviews
For a discussion of the Company's 2017 comprehensive annual review of asbestos and environmental reserves, see Part II, Item 7 MD&A, Critical Accounting Estimates, Property & Casualty Other Operations section in the Company’s 2017 Form 10-K Annual Report.
Uncertainties Regarding Adequacy of Asbestos and Environmental Reserves
A number of factors affect the variability of estimates for asbestos and environmental reserves before considering the effect of the reinsurance agreement with NICO, including assumptions with respect to the frequency of claims, the average severity of those claims settled with payment, the dismissal rate of claims with no payment, resolution of coverage disputes with our policyholders and the expense to indemnity ratio. The uncertainty with respect to the underlying reserve assumptions for asbestos and environmental adds a greater degree of variability to these reserve estimates than reserve estimates for more traditional exposures.
As of March 31, 2018 , the Company reported $1.2 billion of net asbestos reserves and $231 of net environmental reserves. The Company believes that its current asbestos and environmental reserves are appropriate. However, analyses of future developments could cause The Hartford to change its estimates of its asbestos and environmental reserves. As discussed above the effect of these changes could be material to the Company's liquidity and, if cumulative adverse development subsequent to December 31, 2016 exceeded $650, the effect of the changes could be material to the Company's consolidated operating results. The process of estimating asbestos and environmental reserves remains subject to a wide variety of uncertainties, which are detailed in the Company's 2017 Form 10-K Annual Report.
Consistent with the Company's long-standing reserve practices, the Company will continue to review and monitor its reserves in Property & Casualty Other Operations regularly, including its annual reviews of asbestos liabilities, reinsurance recoverables and the allowance for uncollectible reinsurance, and environmental liabilities, and where future developments indicate, make appropriate adjustments to the reserves. For a discussion of the Company's reserving practices, see MD&A - Critical Accounting Estimates, Property & Casualty Insurance
Product Reserves, Net of Reinsurance in the Company's 2017 Form 10-K Annual Report.
Valuation Allowance on Deferred Tax Assets
Deferred tax assets represent the tax benefit of future deductible temporary differences and certain tax carryforwards. Deferred tax assets are measured using the enacted tax rates expected to be in effect when such benefits are realized if there is no change in tax law. Under U.S. GAAP, we test the value of deferred tax assets for impairment on a quarterly basis at the entity level within each tax jurisdiction, consistent with our filed tax returns. Deferred tax assets are reduced by a valuation allowance if, based on the weight of available evidence, it is more likely than not that some portion, or all, of the deferred tax assets will not be realized. The determination of the valuation allowance for our deferred tax assets requires management to make certain judgments and assumptions. In evaluating the ability to recover deferred tax assets, we have considered all available evidence as of March 31, 2018, including past operating results, forecasted earnings, future taxable income, and prudent and feasible tax planning strategies. In the event we determine it is more likely than not that we will not be able to realize all or part of our deferred tax assets in the future, an increase to the valuation allowance would be charged to earnings in the period such determination is made. Likewise, if it is later determined that it is more likely than not that those deferred tax assets would be realized, the previously provided valuation allowance would be reversed. Our judgments and assumptions are subject to change given the inherent uncertainty in predicting future performance and specific industry and investment market conditions.
As of March 31, 2018 and December 31, 2017, the Company had no valuation allowance. In assessing the need for a valuation allowance, management considered future taxable temporary difference reversals, future taxable income exclusive of reversing temporary differences and carryovers, taxable income in open carry back years and other tax planning strategies. From time to time, tax planning strategies could include holding a portion of debt securities with market value losses until recovery, altering the level of tax exempt securities held, making investments which have specific tax characteristics, and business considerations such as asset-liability matching. Management views such tax planning strategies as prudent and feasible, and would implement them, if necessary, to realize the deferred tax assets.
74
Part I - Item 2. Management's Discussion and Analysis of Financial Condition and Results of Operations
SEGMENT OPERATING SUMMARIES
COMMERCIAL LINES |
Results of Operations
Underwriting Summary
Three Months Ended March 31, | ||||||||
2018 | 2017 | Change | ||||||
Written premiums | $ | 1,851 | $ | 1,821 | 2 | % | ||
Change in unearned premium reserve | 140 | 133 | 5 | % | ||||
Earned premiums | 1,711 | 1,688 | 1 | % | ||||
Fee income | 9 | 10 | (10 | %) | ||||
Losses and loss adjustment expenses | ||||||||
Current accident year before catastrophes | 971 | 968 | — | % | ||||
Current accident year catastrophes [1] | 69 | 71 | (3 | %) | ||||
Prior accident year development [1] | (19 | ) | 15 | NM | ||||
Total losses and loss adjustment expenses | 1,021 | 1,054 | (3 | %) | ||||
Amortization of deferred policy acquisition costs | 257 | 249 | 3 | % | ||||
Underwriting expenses | 324 | 323 | — | % | ||||
Dividends to policyholders | 4 | 4 | — | % | ||||
Underwriting gain | 114 | 68 | 68 | % | ||||
Net investment income [2] | 258 | 243 | 6 | % | ||||
Net realized capital gains (losses) [2] | (8 | ) | 11 | (173 | %) | |||
Other income | 2 | 1 | 100 | % | ||||
Income before income taxes | 366 | 323 | 13 | % | ||||
Income tax expense [3] | 68 | 92 | (26 | %) | ||||
Net income | $ | 298 | $ | 231 | 29 | % | ||
[1] | For discussion of current accident year catastrophes and prior accident year development, see MD&A - Critical Accounting Estimates, Property and Casualty Insurance Product Reserves, Net of Reinsurance. |
[2] | For discussion of consolidated investment results, see MD&A - Investment Results. |
[3] | For discussion of income taxes, see Note 12 - Income Taxes of Notes to Condensed Consolidated Financial Statements. |
Premium Measures [1]
Three Months Ended March 31, | ||||||
2018 | 2017 | |||||
New business premium | $ | 337 | $ | 313 | ||
Standard commercial lines policy count retention | 82 | % | 85 | % | ||
Standard commercial lines renewal written price increase | 2.5 | % | 3.2 | % | ||
Standard commercial lines renewal earned price increase | 3.3 | % | 2.4 | % | ||
Standard commercial lines policies in-force as of end of period (in thousands) | 1,337 | 1,347 | ||||
[1] | Standard commercial lines consists of small commercial and middle market. Standard commercial premium measures exclude Maxum, middle market specialty programs and livestock lines of business. |
75
Part I - Item 2. Management's Discussion and Analysis of Financial Condition and Results of Operations
Underwriting Ratios
Three Months Ended March 31, | ||||||
2018 | 2017 | Change | ||||
Loss and loss adjustment expense ratio | ||||||
Current accident year before catastrophes | 56.8 | 57.3 | (0.5 | ) | ||
Current accident year catastrophes | 4.0 | 4.2 | (0.2 | ) | ||
Prior accident year development | (1.1 | ) | 0.9 | (2.0 | ) | |
Total loss and loss adjustment expense ratio | 59.7 | 62.4 | (2.7 | ) | ||
Expense ratio | 33.4 | 33.3 | 0.1 | |||
Policyholder dividend ratio | 0.2 | 0.2 | — | |||
Combined ratio | 93.3 | 96.0 | (2.7 | ) | ||
Current accident year catastrophes and prior year development | 2.9 | 5.1 | (2.2 | ) | ||
Underlying combined ratio | 90.4 | 90.9 | (0.5 | ) | ||
Net Income
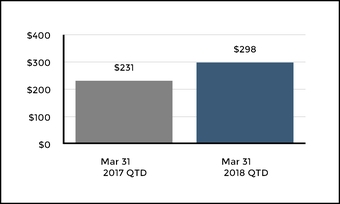
Three months ended March 31, 2018 compared to the three months ended March 31, 2017
Net income increased in 2018 due to a higher underwriting gain, a lower corporate Federal income tax rate and an increase in net investment income, partially offset by a change from net realized capital gains in 2017 to net realized capital losses in 2018. For further discussion of investment results, see MD&A - Investment Results).
Underwriting Gain
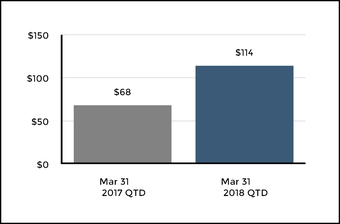
Three months ended March 31, 2018 compared to the three months ended March 31, 2017
Underwriting gain increased in 2018 primarily due to a change from unfavorable prior accident year development in 2017 to favorable development in 2018 and a lower loss and loss adjustment expense ratio before catastrophes and prior accident year development.
76
Part I - Item 2. Management's Discussion and Analysis of Financial Condition and Results of Operations
Earned Premiums
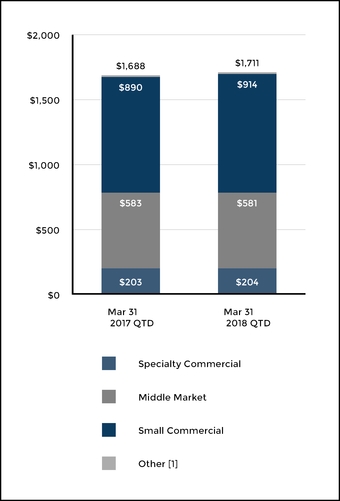
[1]Other of $12 for the three months ended March 31, 2017, and 2018, is included in the total.
Three months ended March 31, 2018 compared to the three months ended March 31, 2017
Earned premiums increased in 2018 reflecting written premium growth over the preceding twelve months.
Written premiums increased in 2018 primarily due to growth in small commercial and middle market.
• | Small commercial written premium growth for 2018 was primarily due to higher new business premium, renewal written price increases and growth from Maxum, partially offset by the effect of lower policy retention. |
• | Middle market written premiums increased in 2018 due to growth in new business and higher renewal premium, due in part to renewal written pricing increases, partially offset by lower policy retention. |
• | Specialty commercial written premiums in 2018 were down modestly driven by declines in bond and national accounts, partially offset by growth in financial products. |
Loss and LAE Ratio before Catastrophes and Prior Accident Year Development
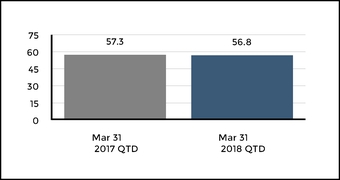
Three months ended March 31, 2018 compared to the three months ended March 31, 2017
Loss and LAE ratio before catastrophes and prior accident year development decreased in 2018, primarily due to a lower loss and loss adjustment expense ratio in both auto and general liability.
Catastrophes and Unfavorable (Favorable) Prior Accident Year Development
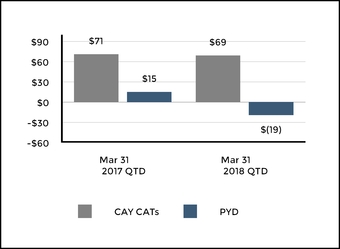
Three months ended March 31, 2018 compared to the three months ended March 31, 2017
Current accident year catastrophe losses for 2018 were primarily from winter storms on the east coast. Catastrophe losses for 2017 were primarily due to wind and hail events and winter storms in the midwest, Texas and the southeast.
Prior accident year development was favorable in 2018 compared to unfavorable prior accident year development in 2017. Net reserve decreases for 2018 were primarily related to lower loss reserve estimates for workers' compensation. Net reserves increases for 2017 were primarily related to commercial
77
Part I - Item 2. Management's Discussion and Analysis of Financial Condition and Results of Operations
automobile liability and general liability, largely offset by a decrease in reserves for bond and workers' compensation.
PERSONAL LINES |
Results of Operations
Underwriting Summary
Three Months Ended March 31, | ||||||||
Underwriting Summary | 2018 | 2017 | Change | |||||
Written premiums | $ | 807 | $ | 889 | (9 | %) | ||
Change in unearned premium reserve | (52 | ) | (45 | ) | (16 | %) | ||
Earned premiums | 859 | 934 | (8 | %) | ||||
Fee income | 10 | 11 | (9 | %) | ||||
Losses and loss adjustment expenses | ||||||||
Current accident year before catastrophes | 566 | 644 | (12 | %) | ||||
Current accident year catastrophes [1] | 34 | 79 | (57 | %) | ||||
Prior accident year development [1] | (13 | ) | (4 | ) | NM | |||
Total losses and loss adjustment expenses | 587 | 719 | (18 | %) | ||||
Amortization of DAC | 71 | 81 | (12 | %) | ||||
Underwriting expenses | 143 | 137 | 4 | % | ||||
Amortization of other intangible assets | 1 | 1 | — | % | ||||
Underwriting gain | 67 | 7 | NM | |||||
Net servicing income [2] | 4 | 3 | 33 | % | ||||
Net investment income [3] | 40 | 36 | 11 | % | ||||
Net realized capital gains [3] | — | 2 | (100 | %) | ||||
Other income | (1 | ) | (1 | ) | — | % | ||
Income before income taxes | 110 | 47 | 134 | % | ||||
Income tax expense [4] | 21 | 14 | 50 | % | ||||
Net income | $ | 89 | $ | 33 | 170 | % | ||
[1] | For discussion of current accident year catastrophes and prior accident year development, see MD&A - Critical Accounting Estimates, Property & Casualty Insurance Product Reserves, Net of Reinsurance. |
[2] | Includes servicing revenues of $19 for the three months ended March 31, 2018 and 2017 and includes servicing expenses of $15 and $16, for the three months ended March 31, 2018 and 2017, respectively. |
[3] | For discussion of consolidated investment results, see MD&A - Investment Results. |
[4] | For discussion of income taxes, see Note 12 - Income Taxes of Notes to Condensed Consolidated Financial Statements. |
Written and Earned Premiums
Three Months Ended March 31, | ||||||||
Written Premiums | 2018 | 2017 | Change | |||||
Product Line | ||||||||
Automobile | $ | 581 | $ | 645 | (10 | %) | ||
Homeowners | 226 | 244 | (7 | %) | ||||
Total | $ | 807 | $ | 889 | (9 | %) | ||
Earned Premiums | ||||||||
Product Line | ||||||||
Automobile | $ | 600 | $ | 654 | (8 | %) | ||
Homeowners | 259 | 280 | (8 | %) | ||||
Total | $ | 859 | $ | 934 | (8 | %) | ||
78
Part I - Item 2. Management's Discussion and Analysis of Financial Condition and Results of Operations
Premium Measures
Three Months Ended March 31, | ||||||
Premium Measures | 2018 | 2017 | ||||
Policies in-force end of period (in thousands) | ||||||
Automobile | 1,641 | 1,905 | ||||
Homeowners | 1,008 | 1,144 | ||||
New business written premium | ||||||
Automobile | $ | 37 | $ | 42 | ||
Homeowners | $ | 9 | $ | 12 | ||
Policy count retention | ||||||
Automobile | 80 | % | 82 | % | ||
Homeowners | 82 | % | 82 | % | ||
Renewal written price increase | ||||||
Automobile | 9.7 | % | 10.3 | % | ||
Homeowners | 9.5 | % | 8.9 | % | ||
Renewal earned price increase | ||||||
Automobile | 10.7 | % | 8.2 | % | ||
Homeowners | 8.9 | % | 8.2 | % | ||
Underwriting Ratios
Three Months Ended March 31, | ||||||
Underwriting Ratios | 2018 | 2017 | Change | |||
Loss and loss adjustment expense ratio | ||||||
Current accident year before catastrophes | 65.9 | 69.0 | (3.1 | ) | ||
Current accident year catastrophes | 4.0 | 8.5 | (4.5 | ) | ||
Prior year development | (1.5 | ) | (0.4 | ) | (1.1 | ) |
Total loss and loss adjustment expense ratio | 68.3 | 77.0 | (8.7 | ) | ||
Expense ratio | 23.9 | 22.3 | 1.6 | |||
Combined ratio | 92.2 | 99.3 | (7.1 | ) | ||
Current accident year catastrophes and prior year development | 2.5 | 8.1 | (5.6 | ) | ||
Underlying combined ratio | 89.8 | 91.2 | (1.4 | ) | ||
Product Combined Ratios
Three Months Ended March 31, | ||||||
2018 | 2017 | Change | ||||
Automobile | ||||||
Combined ratio | 93.1 | 97.5 | (4.4 | ) | ||
Underlying combined ratio | 94.2 | 96.6 | (2.4 | ) | ||
Homeowners | ||||||
Combined ratio | 89.8 | 103.4 | (13.6 | ) | ||
Underlying combined ratio | 78.9 | 78.9 | — | |||
79
Part I - Item 2. Management's Discussion and Analysis of Financial Condition and Results of Operations
Net Income
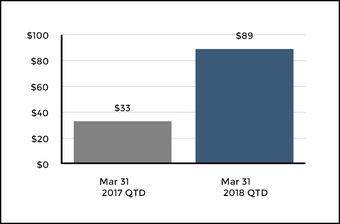
Three months ended March 31, 2018 compared to the three months ended March 31, 2017
Net income in 2018 increased primarily due to lower current accident year catastrophe losses, more favorable prior accident year reserve development and improved current accident year underwriting gains before catastrophes, partially offset by higher expenses associated with increased marketing spending. Net income also benefited from the enactment of lower Federal income tax rates.
Underwriting Gain
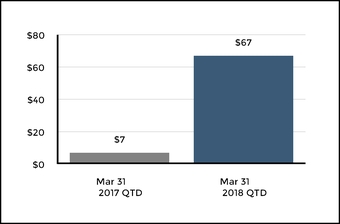
Three months ended March 31, 2018 compared to the three months ended March 31, 2017
Underwriting gain increased in 2018 primarily due to lower current accident year catastrophe losses, more favorable prior accident year development, and lower current accident year loss and loss adjustment expense ratios in both automobile and homeowners, partially offset by the effect of lower earned premium. Before catastrophes and prior accident year development, underwriting gain increased modestly as the effect of lower current accident year loss and loss adjustment expense ratios was offset by the effect of lower earned premium and the
effect of an increase in direct marketing spending to generate new business.
Earned Premiums
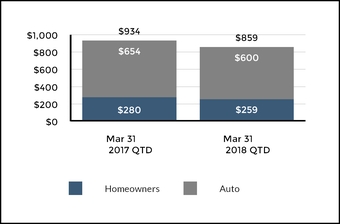
Three months ended March 31, 2018 compared to the three months ended March 31, 2017
Earned premiums decreased in 2018, reflecting a decline in written premium over the prior six to twelve months in both Agency channels and in AARP Direct.
Written premiums decreased in 2018 in both Agency channels and in AARP Direct primarily due to a decline in new business, as well as lower policy count retention in automobile, partially offset by the effect of renewal written price increases.
Renewal written pricing increases in 2018 were higher in homeowners and have moderated in automobile with high single-digit price increases in both lines driven by actions taken to improve profitability.
Policy count retention decreased in 2018 in automobile driven in part by renewal written pricing increases. Policy count retention in homeowners stayed flat in 2018 despite higher renewal written price increases.
Policies in-force decreased in 2018 in both automobile and homeowners, driven by low new business and low policy count retention.
80
Part I - Item 2. Management's Discussion and Analysis of Financial Condition and Results of Operations
Loss and LAE Ratio before Catastrophes and Prior Accident Year Development
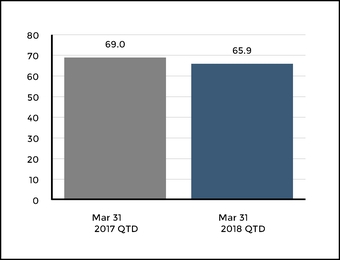
Three months ended March 31, 2018 compared to the three months ended March 31, 2017
Loss and LAE ratio before catastrophes and prior accident year development decreased in 2018, primarily as a result of lower automobile liability frequency, lower non-catastrophe weather-related homeowners loss costs, and the effect of earned pricing increases.
Catastrophes and Unfavorable (Favorable) Prior Accident Year Development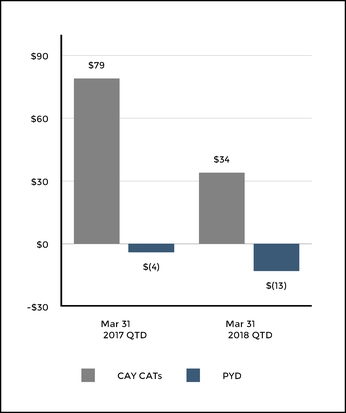
Three months ended March 31, 2018 compared to the three months ended March 31, 2017
Current accident year catastrophe losses for 2018 were from seven named catastrophe events across the country including several East coast winter storms and, to a lesser extent, wind and hail events in the South. Catastrophe losses for 2017 were primarily due to multiple wind and hail events across various U.S. geographic regions, concentrated in the Midwest, Texas and the Southeast.
Prior accident year development was favorable in 2018 primarily due to decreases in reserves for prior accident year homeowners losses and loss adjustment expenses. Net reserves decreased in 2017 primarily due to decreases in reserves for prior accident year catastrophes.
81
Part I - Item 2. Management's Discussion and Analysis of Financial Condition and Results of Operations
PROPERTY & CASUALTY OTHER OPERATIONS |
Results of Operations
Underwriting Summary
Three Months Ended March 31, | ||||||||
Underwriting Summary | 2018 | 2017 | Change | |||||
Losses and loss adjustment expenses | ||||||||
Prior accident year development [1] | — | 1 | (100 | %) | ||||
Total losses and loss adjustment expenses | — | 1 | (100 | %) | ||||
Underwriting expenses | 3 | 5 | (40 | %) | ||||
Underwriting loss | (3 | ) | (6 | ) | 50 | % | ||
Net investment income [2] | 24 | 31 | (23 | %) | ||||
Net realized capital gains (losses) [2] | (1 | ) | 4 | (125 | %) | |||
Other income | — | 2 | (100 | %) | ||||
Income before income taxes | 20 | 31 | (35 | %) | ||||
Income tax expense [3] | 3 | 7 | (57 | %) | ||||
Net income | $ | 17 | $ | 24 | (29 | %) | ||
[1]For discussion of prior accident year development, see MD&A - Critical Accounting Estimates, Property & Casualty Insurance Product Reserves, Net of Reinsurance.
[2]For discussion of consolidated investment results, see MD&A - Investment Results.
[3]For discussion of income taxes, see Note 12 - Income Taxes of Notes to Condensed Consolidated Financial Statements.
Net Income
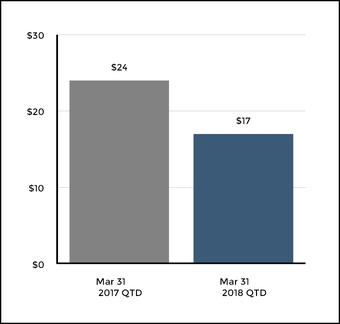
Three months ended March 31, 2018 compared to the three months ended March 31, 2017
Net income for the three months ended March 31, 2018 decreased, as compared to prior year period, primarily due to lower net investment income and a change to net realized capital losses in the current year period from net realized capital gains in the prior year period.
Asbestos and environmental comprehensive annual reserve reviews will occur in the fourth quarter of 2018. For information on asbestos and environmental reserves, see MD&A - Critical Accounting Estimates, Asbestos and Environmental Reserves.
82
Part I - Item 2. Management's Discussion and Analysis of Financial Condition and Results of Operations
GROUP BENEFITS |
Operating Summary | ||||||||
Three Months Ended March 31, | ||||||||
2018 | 2017 | Change | ||||||
Premiums and other considerations | $ | 1,401 | $ | 835 | 68 | % | ||
Net investment income [1] | 121 | 95 | 27 | % | ||||
Net realized capital gains (losses) [1] | (25 | ) | 8 | NM | ||||
Total revenues | 1,497 | 938 | 60 | % | ||||
Benefits, losses and loss adjustment expenses | 1,085 | 651 | 67 | % | ||||
Amortization of DAC | 10 | 8 | 25 | % | ||||
Insurance operating costs and other expenses | 321 | 220 | 46 | % | ||||
Amortization of other intangible assets | 17 | — | NM | |||||
Total benefits, losses and expenses | 1,433 | 879 | 63 | % | ||||
Income before income taxes | 64 | 59 | 8 | % | ||||
Income tax expense [2] | 10 | 14 | (29 | )% | ||||
Net income | $ | 54 | $ | 45 | 20 | % | ||
[1] | For discussion of consolidated investment results, see MD&A - Investment Results. |
[2] | For discussion of income taxes, see Note 12 - Income Taxes of Notes to the Consolidated Financial Statements. |
Premiums and Other Considerations | ||||||||
Three Months Ended March 31, | ||||||||
2018 | 2017 | Change | ||||||
Fully insured – ongoing premiums | $ | 1,357 | $ | 805 | 69 | % | ||
Buyout premiums | — | 11 | (100 | )% | ||||
Fee income | 44 | 19 | 132 | % | ||||
Total premiums and other considerations | $ | 1,401 | $ | 835 | 68 | % | ||
Fully insured ongoing sales, excluding buyouts | $ | 454 | $ | 211 | 115 | % | ||
Ratios, Excluding Buyouts | |||||
Three Months Ended March 31, | |||||
2018 | 2017 | Change | |||
Group disability loss ratio | 74.9 | % | 82.9 | % | 8.0 |
Group life loss ratio | 80.9 | % | 73.1 | % | (7.8) |
Total loss ratio | 77.4 | % | 77.7 | % | 0.3 |
Expense ratio [1] | 24.0 | % | 27.7 | % | 3.7 |
[1] Integration and transaction costs related to the acquisition of Aetna's U.S. group life and disability business are not included in the expense ratio.
83
Part I - Item 2. Management's Discussion and Analysis of Financial Condition and Results of Operations
Margin | ||||||
Three Months Ended March 31, | ||||||
2018 | 2017 | Change | ||||
Net income margin | 3.6 | % | 4.9 | % | (1.3 | ) |
Less: Net realized capital gains (losses) excluded from core earnings, after tax | (1.4 | )% | 0.6 | % | (2.0 | ) |
Less: Integration and transaction costs associated with acquired business, after tax | (0.6 | )% | — | % | (0.6 | ) |
Core earnings margin | 5.6 | % | 4.3 | % | 1.3 | |
Net Income
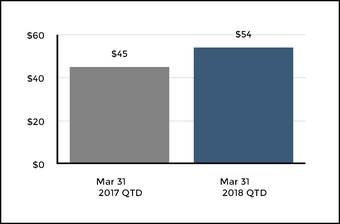
Three months ended March 31, 2018 compared to the three months ended March 31, 2017
Net income increased for the three month period, primarily due to higher investment income and higher premium and other considerations, partially offset by a change to net realized capital losses and higher insurance operating costs and other expenses, including integration costs related to the acquisition of Aetna's U.S. group life and disability business in November 2017.
Insurance operating costs and other expenses increased 46%, primarily due to the acquisition of Aetna's U.S. group life and disability business and integration expenses, partially offset by state guaranty fund assessments incurred in the first quarter 2017 related to the liquidation of a life and health insurance company.
Fully Insured Ongoing Premiums
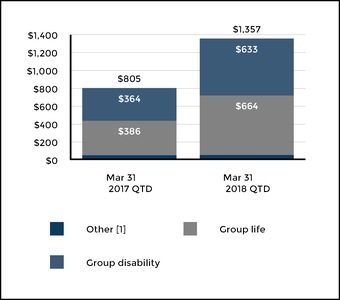
[1] Other of $55 and $60 is included in the three months ended March 31, 2017, and 2018, respectively
Three months ended March 31, 2018 compared to the three months ended March 31, 2017
Fully insured ongoing premiums increased 69% driven primarily by the acquisition of Aetna's U.S. group life and disability business, sales in excess of cancellations, strong group life and group disability persistency and premium from the New York Paid Family Leave product.
Fully insured ongoing sales, excluding buyouts increased 115% primarily due to new business generated by the sales force acquired with Aetna's U.S. group life and disability business. Excluding the impact of the acquisition, the Company saw an increase in fully insured sales in disability in 2018 due, in part, to the addition of a new New York Paid Family Leave product.
84
Part I - Item 2. Management's Discussion and Analysis of Financial Condition and Results of Operations
Ratios
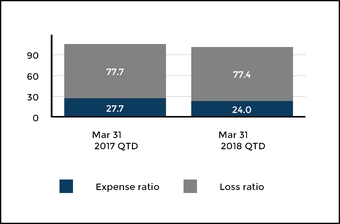
Three months ended March 31, 2018 compared to the three months ended March 31, 2017
Total loss ratio decreased 0.3 points reflecting a lower group disability loss ratio, largely offset by a higher group life loss ratio. The group life loss ratio increased 7.8 points driven by the higher loss ratios associated with the business from the Aetna acquisition and higher mortality, partially offset by lower than expected claim incidence related to prior incurral years on group life, group life premium waiver and group accidental death and dismemberment claims. The group disability loss ratio decreased 8.0 points due to favorable incidence and favorable terminations (recoveries and claimant deaths), driving favorable development on prior incurral year reserves, as well as modest price increases. In addition, results were favorable as a result of a lower discount accretion on reserves acquired with Aetna's group disability business.
Expense ratio decreased 3.7 points. Of the decline, 2.4 points is driven by state guaranty fund assessments in 2017 related to the liquidation of a life and health insurance company. The remaining 1.3 point decline is driven by a greater mix of lower commission national accounts business due to the acquisition of Aetna's U.S. group life and disability business and higher revenues to cover fixed costs, partially offset by intangible asset amortization incurred in 2018.
MUTUAL FUNDS |
Results of Operations
Operating Summary
Three Months Ended March 31, | ||||||||
2018 | 2017 | Change | ||||||
Fee income and other revenue | $ | 258 | $ | 237 | 9 | % | ||
Net investment income | 1 | 1 | — | % | ||||
Total revenues | 259 | 238 | 9 | % | ||||
Amortization of DAC | 4 | 6 | (33 | )% | ||||
Operating costs and other expenses [1] | 212 | 197 | 8 | % | ||||
Total benefits, losses and expenses | 216 | 203 | 6 | % | ||||
Income before income taxes | 43 | 35 | 23 | % | ||||
Income tax expense | 9 | 12 | (25 | )% | ||||
Net income | $ | 34 | $ | 23 | 48 | % | ||
Daily average total Mutual Funds segment AUM | $ | 117,301 | $ | 101,114 | 16 | % | ||
Return on Assets ("ROA") [2] | ||||||||
Net income | 11.9 | 9.2 | 29 | % | ||||
Core Earnings | 11.9 | 9.2 | 29 | % | ||||
[1] | 2017 includes distribution costs of $46 that were previously netted against fee income and are now presented gross in insurance operating costs and other expenses. |
[2] | Represents annualized earnings divided by a daily average of assets under management, as measured in basis points. |
85
Part I - Item 2. Management's Discussion and Analysis of Financial Condition and Results of Operations
Mutual Funds Segment AUM
Three Months Ended March 31, | ||||||||
2018 | 2017 [1] | Change | ||||||
Mutual Fund and ETP AUM - beginning of period | $ | 99,090 | $ | 81,507 | 22 | % | ||
Sales - mutual fund | 6,177 | 7,218 | (14 | )% | ||||
Redemptions - mutual fund | (5,693 | ) | (5,885 | ) | 3 | % | ||
Net flows - ETP | 194 | 22 | NM | |||||
Net flows - mutual fund and ETP | 678 | 1,355 | (50 | )% | ||||
Change in market value and other | 115 | 4,214 | (97 | )% | ||||
Mutual fund and ETP AUM - end of period | 99,883 | 87,076 | 15 | % | ||||
Life and annuity run-off business held for sale | 15,614 | 16,123 | (3 | )% | ||||
Total Mutual Funds segment AUM | $ | 115,497 | $ | 103,199 | 12 | % | ||
[1]ETP AUM has been combined with mutual fund AUM. Previously ETPs were shown separately.
Mutual Fund and ETP AUM by Asset Class
March 31, 2018 | March 31, 2017 | Change | ||||||
Equity | $ | 64,702 | $ | 54,683 | 18 | % | ||
Fixed Income | 14,378 | 13,973 | 3 | % | ||||
Multi-Strategy Investments [1] | 20,137 | 18,142 | 11 | % | ||||
Exchange-traded Products | 666 | 278 | 140 | % | ||||
Mutual Fund and ETP AUM | $ | 99,883 | $ | 87,076 | 15 | % | ||
[1]Includes balanced, allocation, and alternative investment products.
Net Income
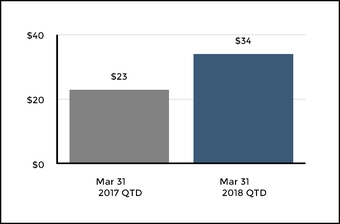
Three months ended March 31, 2018 compared to the three months ended March 31, 2017
Net income increased compared to the prior year, in part, due to higher investment management fees as a result of higher daily average AUM for the period, partially offset by higher variable costs including sub-advisory and distribution and services expenses. Also contributing to the increase was the effect of a lower corporate Federal income tax rate.
Total Mutual Funds Segment AUM
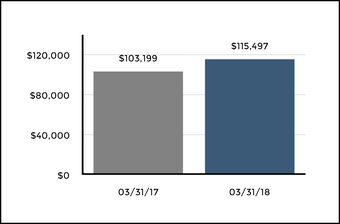
March 31, 2018 compared to March 31, 2017
Total Mutual Funds segment AUM increased in 2018 primarily due to positive net flows and market appreciation over the past 12 months, partially offset by the continued runoff of AUM related to the life and annuity run-off business held for sale.
86
Part I - Item 2. Management's Discussion and Analysis of Financial Condition and Results of Operations
CORPORATE |
Results of Operations
Operating Summary
Three Months Ended March 31, | ||||||||
Operating Summary | 2018 | 2017 | Change | |||||
Fee income | $ | 2 | $ | 1 | 100 | % | ||
Net investment income | 7 | 4 | 75 | % | ||||
Net realized capital gains (losses) | 4 | (1 | ) | NM | ||||
Total revenues | 13 | 4 | NM | |||||
Benefits, losses and loss adjustment expenses [1] | 2 | — | NM | |||||
Insurance operating costs and other expenses | 15 | 18 | (17 | %) | ||||
Interest expense [2] | 80 | 80 | — | % | ||||
Total benefits, losses and expenses | 97 | 98 | (1 | %) | ||||
Loss before income taxes | (84 | ) | (94 | ) | 11 | % | ||
Income tax benefit [3] | (20 | ) | (41 | ) | 51 | % | ||
Loss from continuing operations, net of tax | (64 | ) | (53 | ) | 21 | % | ||
Income from discontinued operations, net of tax | 169 | 75 | 125 | % | ||||
Net income | $ | 105 | $ | 22 | NM | |||
[1] | Represents benefits expense on life and annuity business retained by the Company. |
[2] | For discussion of debt, see Note 11 - Debt of Notes to Consolidated Financial Statements. |
[3] | For discussion of income taxes, see Note 12 - Income Taxes of Notes to the Consolidated Financial Statements. |
Net Income
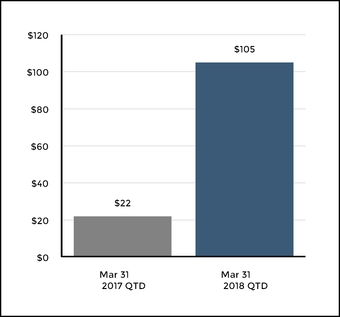
Three months ended March 31, 2018 compared to the three months ended March 31, 2017
Net income increased from the prior year period primarily due to an increase in income from discontinued operations, partially offset by a lower tax benefit that was principally due to
the reduction in the corporate Federal income tax rate. The income from discontinued operations in the first quarter of 2018 was mostly attributable to the reclassification of $193 of stranded tax effects from AOCI to retained earnings related to the life and annuity run-off business. The reclassification reduced the estimated loss on sale with a corresponding increase in AOCI related to the assets held for sale. Partially offsetting was the reclassification from AOCI to retained earnings of $10 of net unrealized gains net of shadow DAC related to the business held for sale which increased estimated loss on sale by the same amount. For more information on the reclassification of stranded tax effects and the reclassification of net unrealized gains net of shadow DAC, see Note 1 - Basis of Presentation and Significant Accounting Policies of Notes to Condensed Consolidated Financial Statements.
Operating earnings from the life and annuity run-off business of $107 during the first quarter of 2018 had no effect on income from discontinued operations since operating earnings of the business during the period inured to the benefit of the buyer and, therefore, resulted in an offsetting increase to estimated loss on sale. Operating income from discontinued operations increased from $75 in the 2017 period to $107 in the 2018 period primarily due to a change from net realized capital losses in 2017 to net realized capital gains in 2018 and the effect of a lower corporate Federal income tax rate, partially offset by a change from a favorable unlock in 2017 to an unfavorable unlock in 2018 and a reduction in tax benefits related to the dividends received deduction.
87
Part I - Item 2. Management's Discussion and Analysis of Financial Condition and Results of Operations
Interest Expense
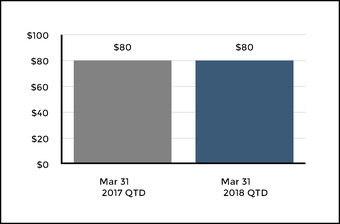
Three months ended March 31, 2018 compared to the three months ended March 31, 2017
Interest expense remained unchanged from 2017 to 2018. In March 31, 2018, the Company issued $500 of 4.4% senior notes due March 15, 2048 for net proceeds of approximately $490. The Company used a portion of the net proceeds to repay the Company's $320 of 6.3% notes at maturity. See Note 11 -Debt of Notes to the Consolidated Financial Statements.
ENTERPRISE RISK MANAGEMENT
The Company’s Board of Directors has ultimate responsibility for risk oversight, as described more fully in our Proxy Statement, while management is tasked with the day-to-day management of the Company’s risks.
The Company manages and monitors risk through risk policies, controls and limits. At the senior management level, an Enterprise Risk and Capital Committee (“ERCC”) oversees the risk profile and risk management practices of the Company.
The Company's enterprise risk management ("ERM") function supports the ERCC and functional committees, and is tasked with, among other things:
• | risk identification and assessment; |
• | the development of risk appetites, tolerances, and limits; |
• | risk monitoring; and |
• | internal and external risk reporting. |
The Company categorizes its main risks as insurance risk, operational risk and financial risk. Insurance risk and financial risk are described in more detail below. Operational risk and specific risk tolerances for natural catastrophes, terrorism risk and pandemic risk are described in the ERM section of the MD&A in The Hartford’s 2017 Form 10-K Annual Report.
Insurance Risk
The Company categorizes its insurance risks across property-
casualty, group benefits and life products. Non-catastrophe insurance risk arises from a number of exposures including property, liability, mortality, morbidity, disability and longevity. Catastrophe risk primarily arises in the group life, group disability, property, and workers' compensation product lines. The Company establishes risk limits to control potential loss and actively monitors the risk exposures as a percent of statutory surplus. The Company also uses reinsurance to transfer insurance risk to well-established and financially secure reinsurers.
Reinsurance as a Risk Management Strategy
The Company uses reinsurance to transfer certain risks to reinsurance companies based on specific geographic or risk concentrations. A variety of traditional reinsurance products are used as part of the Company's risk management strategy, including excess of loss occurrence-based products that reinsure property and workers' compensation exposures, and individual risk or quota share arrangements, that reinsure losses from specific classes or lines of business. The Company has no significant finite risk contracts in place and the statutory surplus benefit from all such prior year contracts is immaterial. Facultative reinsurance is used by the Company to manage policy-specific risk exposures based on established underwriting guidelines. The Hartford also participates in governmentally administered reinsurance facilities such as the Florida Hurricane Catastrophe Fund (“FHCF”), the Terrorism Risk Insurance Program established under “TRIPRA” and other reinsurance programs relating to particular risks or specific lines of business.
Reinsurance for Catastrophes- The Company has several catastrophe reinsurance programs, including reinsurance treaties that cover property and workers' compensation losses aggregating from single catastrophe events.
88
Part I - Item 2. Management's Discussion and Analysis of Financial Condition and Results of Operations
Primary Catastrophe Treaty Reinsurance Coverages as of March 31, 2018
Coverage | Effective for the period | % of layer(s) reinsurance | Per occurrence limit | Retention | |||||
Property losses arising from a single catastrophe event [1] [2] | 1/1/2018 to 1/1/2019 | 89% | $ | 850 | $ | 350 | |||
Property catastrophe losses from a Personal Lines Florida hurricane | 6/1/2017 to 6/1/2018 | 90% | $ | 102 | [3] | $ | 31 | ||
Workers compensation losses arising from a single catastrophe event [4] | 1/1/2018 to 12/31/2018 | 80% | $ | 350 | $ | 100 | |||
[1] | Certain aspects of our principal catastrophe treaty have terms that extend beyond the traditional one year term. While the overall treaty is placed at 89%, each layer's placement varies slightly. |
[2] | $100 of the property occurrence treaty can alternatively be used as part of the Property Aggregate treaty referenced below. |
[3] | The per occurrence limit on the FHCF treaty is $102 for the 6/1/2017 to 6/1/2018 treaty year based on the Company's election to purchase the required coverage from FHCF. Coverage is based on the best available information from FHCF, which was updated in January 2018. |
[4] | In addition to the limit shown, the workers compensation reinsurance includes a non-catastrophe, industrial accident layer, providing coverage for 80% of a $30 per event limit in excess of a $20 retention. |
In addition to the property catastrophe reinsurance coverage described in the above table, the Company has other catastrophe and working layer treaties and facultative reinsurance agreements that cover property catastrophe losses on an aggregate excess of loss and on a per risk basis. The principal property catastrophe reinsurance program and certain other reinsurance programs include a provision to reinstate limits in the event that a catastrophe loss exhausts limits on one or more layers under the treaties. In addition, covering the period from January 1, 2018 to December 31, 2018, the Company has a Property Aggregate treaty in place which provides one limit of $200 of aggregate qualifying property catastrophe losses in excess of a net retention of $825.
Reinsurance for Terrorism- For the risk of terrorism, private sector catastrophe reinsurance capacity is generally limited and largely unavailable for terrorism losses caused by nuclear, biological, chemical or radiological ("NBCR") attacks. As such, the Company's principal reinsurance protection against large-scale terrorist attacks is the coverage currently provided through the Terrorism Risk Insurance Program ("TRIPRA") to the end of 2020.
TRIPRA provides a backstop for insurance-related losses resulting from any “act of terrorism”, which is certified by the Secretary of the Treasury, in consultation with the Secretary of Homeland Security and the Attorney General, for losses that exceed a threshold of industry losses of $160 in 2018, with the threshold increasing to $200 by 2020. Under the program, in any one calendar year, the federal government would pay a percentage of losses incurred from a certified act of terrorism after an insurer's losses exceed 20% of the Company's eligible direct commercial earned premiums of the prior calendar year up to a combined annual aggregate limit for the federal government and all insurers of $100 billion. The percentage of losses paid by the federal government is 82% in 2018, decreasing by 1 point annually to 80% in the year 2020. The Company's estimated deductible under the program is $1.3 billion for 2018. If an act of terrorism or acts of terrorism result in covered losses exceeding the $100 billion annual industry aggregate limit, Congress would be responsible for determining how additional losses in excess of $100 billion will be paid.
Reinsurance for Asbestos and Environmental Reserve Development- Under an ADC reinsurance agreement, NICO, a subsidiary of Berkshire Hathaway Inc. (“Berkshire”), assumes adverse net loss and allocated loss adjustment expense reserve development up to $1.5 billion above the Company’s net asbestos and environmental reserves recorded as of December 31, 2016. Under retroactive reinsurance accounting, net adverse asbestos and environmental reserve development after December 31, 2016 results in an offsetting reinsurance recoverable up to the $1.5 billion limit. Cumulative ceded losses up to the $650 reinsurance premium paid for the ADC are recognized as a dollar-for-dollar offset to direct losses incurred. As of March 31, 2018, $285 of cumulative incurred asbestos and environmental losses had been ceded to NICO, leaving approximately 1.2 billion of coverage available for future adverse net reserve development, if any. Cumulative ceded losses exceeding the $650 reinsurance premium paid would result in a deferred gain. The deferred gain would be recognized over the claim settlement period in the proportion of the amount of cumulative ceded losses collected from the reinsurer to the estimated ultimate reinsurance recoveries. Consequently, until periods when the deferred gain is recognized as a benefit to earnings, cumulative adverse development of asbestos and environmental claims after December 31, 2016 in excess of $650 may result in significant charges against earnings. Furthermore, there is a risk that cumulative adverse development of asbestos and environmental claims could ultimately exceed the $1.5 billion treaty limit in which case all adverse development in excess of the treaty limit would be absorbed as a charge to earnings by the Company. In these scenarios, the effect of these changes could be material to the Company’s consolidated operating results and liquidity.
Reinsurance Recoverables
Property and casualty insurance product reinsurance recoverables represent loss and loss adjustment expense recoverables from a number of entities, including reinsurers and pools.
89
Part I - Item 2. Management's Discussion and Analysis of Financial Condition and Results of Operations
Property & Casualty Reinsurance Recoverables
As of March 31, 2018 | As of December 31, 2017 | |||||
Paid loss and loss adjustment expenses | $ | 79 | $ | 84 | ||
Unpaid loss and loss adjustment expenses | 3,478 | 3,496 | ||||
Gross reinsurance recoverables | $ | 3,557 | $ | 3,580 | ||
Less: Allowance for uncollectible reinsurance | (104 | ) | (104 | ) | ||
Net reinsurance recoverables | $ | 3,453 | $ | 3,476 | ||
Group benefits reinsurance recoverables represent future policy benefits and unpaid loss and loss adjustment
expenses and other policyholder funds and benefits payable that are recoverable from a number of reinsurers.
Group Benefits Reinsurance Recoverables
Reinsurance Recoverables | As of March 31, 2018 | As of December 31, 2017 | ||||
Future policy benefits and unpaid loss and loss adjustment expenses and other policyholder funds and benefits payable | $ | 242 | $ | 236 | ||
Less: Allowance for uncollectible reinsurance [1] | — | — | ||||
Net reinsurance recoverables | $ | 242 | $ | 236 | ||
[1]No allowance for uncollectible reinsurance is required as of March 31, 2018 and December 31, 2017.
For further explanation of the Company's insurance risk management strategy, see MD&A Enterprise Risk Management Insurance Risk Management in The Hartford's 2017 Form 10-K Annual Report.
Financial Risk
Financial risks include direct and indirect risks to the Company's financial objectives coming from events that impact market conditions or prices. Some events may cause correlated movement in multiple risk factors. The primary sources of financial risks are the Company's general account invested assets. Consistent with its risk appetite, the Company establishes financial risk limits to control potential loss on a U.S. GAAP, statutory, and economic basis. Exposures are actively monitored, and mitigated where appropriate. The Company uses various risk management strategies, including over-the-counter and exchange traded derivatives with counterparties meeting the appropriate regulatory and due diligence requirements. Derivatives are utilized to achieve one of four Company-approved objectives: hedging risk arising from interest rate, equity market, commodity market, credit spread and issuer default, price or currency exchange rate risk or volatility; managing liquidity; controlling transaction costs; or entering into synthetic replication transactions. Derivative activities are monitored and evaluated by the Company’s compliance and risk management teams and reviewed by senior management.
The Company identifies different categories of financial risk, including liquidity, credit, interest rate, equity and foreign currency exchange.
Liquidity Risk
Liquidity risk is the risk to current or prospective earnings or capital arising from the Company's inability or perceived inability to meet its contractual funding obligations as they come due. Stressed market conditions may impact the ability to sell assets or otherwise transact business and may result in a significant loss in value.
The Company measures and manages liquidity risk exposures and funding needs within prescribed limits across legal entities, taking into account legal, regulatory and operational limitations to the transferability of liquidity. The Company also monitors internal and external conditions, and identifies material risk changes and emerging risks that may impact liquidity.
For further discussion on liquidity see the section on Capital Resources and Liquidity.
Credit Risk
Credit risk is the risk to earnings or capital due to uncertainty of an obligor’s or counterparty’s ability or willingness to meet its obligations in accordance with contractually agreed upon terms. Credit risk is comprised of three major factors: the risk of change in credit quality, or credit migration risk; the risk of default; and the risk of a change in value due to changes in credit spreads.
Sources of Credit Risk The majority of the Company’s credit risk is concentrated in its investment holdings, but it is also present in the Company’s reinsurance and insurance portfolios.
Impact A decline in creditworthiness is typically associated with an increase in an investment’s credit spread, and potentially result in an increase in other-than-temporary impairments and an increased probability of a realized loss upon sale. Premiums receivable and reinsurance recoverables are also subject to credit risk based on the counterparty’s unwillingness or inability to pay.
Management The objective of the Company’s enterprise credit risk management strategy is to identify, quantify, and manage credit risk on an aggregate portfolio basis and to limit potential losses in accordance with an established credit risk management policy. The Company primarily manages its credit risk by holding a diversified mix of investment grade issuers and counterparties across its investment, reinsurance, and insurance portfolios. Potential losses are also limited within portfolios by diversifying across geographic regions, asset types, and sectors.
90
Part I - Item 2. Management's Discussion and Analysis of Financial Condition and Results of Operations
The Company manages credit risk on an on-going basis through the use of various processes and analyses. Both the investment and reinsurance areas have formulated procedures for counterparty approvals and authorizations, which establish minimum levels of creditworthiness and financial stability. Credits considered for investment are subjected to underwriting reviews. Within the investment portfolio, private securities are subject to committee review for approval. Mitigation strategies vary across the three sources of credit risk, but may include:
• | Investing in a portfolio of high-quality and diverse securities; |
• | Selling investments subject to credit risk; |
• | Hedging through use of credit default swaps; |
• | Clearing transactions through central clearing houses that require daily variation margin; |
• | Entering into contracts only with strong creditworthy institutions |
• | Requiring collateral; and |
• | Non-renewing policies/contracts or reinsurance treaties. |
The Company has developed credit exposure thresholds which are based upon counterparty ratings. Aggregate counterparty credit quality and exposure are monitored on a daily basis utilizing an enterprise-wide credit exposure information system that contains data on issuers, ratings, exposures, and credit limits. Exposures are tracked on a current and potential basis and aggregated by ultimate parent of the counterparty across investments, reinsurance receivables, insurance products with credit risk, and derivatives.
As of March 31, 2018, the Company had no investment exposure to any credit concentration risk of a single issuer or counterparty greater than 10% of the Company’s stockholders' equity, other than the U.S. government and certain U.S. government agencies. For further discussion of concentration of credit risk in the investment portfolio, see the Concentration of Credit Risk section in Note 6 - Investments of Notes to Condensed Consolidated Financial Statements.
Credit Risk of Derivatives
The Company uses various derivative counterparties in executing its derivative transactions. The use of counterparties creates credit risk that the counterparty may not perform in accordance with the terms of the derivative transaction.
Downgrades to the credit ratings of the Company’s insurance operating companies may have adverse implications for its use of derivatives. In some cases, downgrades may give derivative counterparties for over-the-counter derivatives and clearing brokers for OTC-cleared derivatives the right to cancel and settle outstanding derivative trades or require additional collateral to be posted. In addition, downgrades may result in counterparties and clearing brokers becoming unwilling to engage in or clear additional derivatives or may require collateralization before entering into any new trades.
The Company also has derivative counterparty exposure policies which limit the Company’s exposure to credit risk.
For the company’s derivative programs, the maximum uncollateralized threshold for a derivative counterparty for a single legal entity is $10. The Company currently transacts OTC derivatives in one legal entity that have a threshold greater than
zero. The maximum combined threshold for a single counterparty across all legal entities that use derivatives and have a threshold greater than zero is $10. Based on the contractual terms of the collateral agreements, these thresholds may be immediately reduced due to a downgrade in either party’s credit rating. For further discussion, see the Derivative Commitments section of Note 13 Commitments and Contingencies of Notes to Condensed Consolidated Financial Statements.
For the three months ended March 31, 2018, the Company incurred no losses on derivative instruments due to counterparty default.
Use of Credit Derivatives
The Company may also use credit default swaps to manage credit exposure or to assume credit risk to enhance yield.
Credit Risk Reduced Through Credit Derivatives
The Company uses credit derivatives to purchase credit protection with respect to a single entity or referenced index. The Company purchases credit protection through credit default swaps to economically hedge and manage credit risk of certain fixed maturity investments across multiple sectors of the investment portfolio.
Credit Risk Assumed Through Credit Derivatives
The Company also enters into credit default swaps that assume credit risk as part of replication transactions. Replication transactions are used as an economical means to synthetically replicate the characteristics and performance of assets that are permissible investments under the Company’s investment policies. These swaps reference investment grade single corporate issuers and indexes.
For further information on credit derivatives, see Note 7 - Derivative Instruments of Notes to Condensed Consolidated Financial Statements.
Interest Rate Risk
Interest rate risk is the risk of financial loss due to adverse changes in the value of assets and liabilities arising from movements in interest rates. Interest rate risk encompasses exposures with respect to changes in the level of interest rates, the shape of the term structure of rates and the volatility of interest rates. Interest rate risk does not include exposure to changes in credit spreads.
The Company has exposure to interest rates arising from its fixed maturity securities, liabilities such as structured settlements and terminal funding agreement liabilities and discount rate assumptions associated with the Company’s pension and other post retirement benefit obligations. In addition, certain product liabilities expose the Company to interest rate risk, in particular short and long-term disability claim reserves.
Changes in interest rates from current levels can have both favorable and unfavorable effects for the Company.
The Company primarily manages its exposure to interest rate risk by constructing investment portfolios that seek to protect the firm from the economic impact associated with changes in interest rates by setting portfolio duration targets that are aligned with the duration of the liabilities that they support.
The Company may also utilizes a variety of derivative instruments to mitigate interest rate risk associated with its investment
91
Part I - Item 2. Management's Discussion and Analysis of Financial Condition and Results of Operations
portfolio or to hedge liabilities. Interest rate caps, floors, swaps, swaptions, and futures may be used to manage portfolio duration.
Equity Risk
Equity risk is defined as the risk of financial loss due to changes in the value of global equities or equity indices. The Company has exposure to equity risk from invested assets, mutual fund assets under management, and assets that support the Company’s pension and other post-retirement benefit plans. The Company uses various approaches in managing its equity exposure, including limits on the proportion of assets invested in equities, diversification of the equity portfolio, and hedging of changes in equity indices.
Declines in equity markets may result in losses due to sales or impairments that are recognized as realized losses in earnings or in reductions in market value that are recognized as unrealized losses in accumulated other comprehensive income ("AOCI"). In 2018, changes in the market value of equity securities are recorded within our reported earnings. Declines in equity markets may also decrease the value of limited partnerships and other alternative investments or result in losses on derivatives, including on embedded product derivatives, thereby negatively impacting our reported earnings.
The Company’s mutual funds are significantly influenced by the
U.S. and other equity markets. Generally, declines in equity
markets will reduce the value of assets under management and
the amount of fee income generated from those assets.
Increases in equity markets will generally have the inverse impact.
For the assets that support its pension plans and other post-retirement benefit plans, the Company may be required to make
additional plan contributions if equity investments in the plan portfolio decline in value. The asset allocation mix is reviewed on a periodic basis. In order to minimize the risk, the pension plans maintain a listing of permissible and prohibited investments and impose concentration limits and investment quality requirements on permissible investment options.
Foreign Currency Exchange Risk
Foreign currency exchange risk is the risk of financial loss due to changes in the relative value between currencies.
The Company has foreign currency exchange risk in non-U.S. dollar denominated investments, which primarily consist of fixed maturity and equity investments and foreign denominated cash.
The open foreign currency exposure of non-U.S. dollar denominated investments will most commonly be reduced through the sale of the assets or through hedges using currency futures/forwards/swaps. In order to manage the currency risk related to any non-U.S. dollar denominated liability contracts, the Company enters into foreign currency swaps or holds non-U.S. dollar denominated investments.
Investment Portfolio Risk
The following table presents the Company’s fixed maturities, AFS, by credit quality. The credit ratings referenced throughout this section are based on availability and are generally the midpoint of the available ratings among Moody’s, S&P, Fitch and Morningstar. If no rating is available from a rating agency, then an internally developed rating is used.
Fixed Maturities by Credit Quality | ||||||||||||||||
March 31, 2018 | December 31, 2017 | |||||||||||||||
Amortized Cost | Fair Value | Percent of Total Fair Value | Amortized Cost | Fair Value | Percent of Total Fair Value | |||||||||||
United States Government/Government agencies | $ | 4,998 | $ | 4,972 | 13.8 | % | $ | 4,492 | $ | 4,536 | 12.3 | % | ||||
AAA | 5,681 | 5,812 | 16.2 | % | 5,864 | 6,072 | 16.4 | % | ||||||||
AA | 6,750 | 6,942 | 19.3 | % | 7,467 | 7,810 | 21.1 | % | ||||||||
A | 8,697 | 8,873 | 24.7 | % | 8,510 | 8,919 | 24.1 | % | ||||||||
BBB | 7,742 | 7,839 | 21.8 | % | 7,632 | 7,931 | 21.5 | % | ||||||||
BB & below | 1,462 | 1,486 | 4.2 | % | 1,647 | 1,696 | 4.6 | % | ||||||||
Total fixed maturities, AFS | $ | 35,330 | $ | 35,924 | 100 | % | $ | 35,612 | $ | 36,964 | 100 | % | ||||
The fair value of fixed maturities, AFS decreased as compared to December 31, 2017, primarily due a decrease in valuations due to higher interest rates and wider credit spreads. Also, municipal bonds were reallocated into corporate bonds and U.S. treasury
securities during the period. Fixed maturities, FVO, are not included in the preceding table. For further discussion on FVO securities, see Note 5 - Fair Value Measurements of Notes to Condensed Consolidated Financial Statements.
92
Part I - Item 2. Management's Discussion and Analysis of Financial Condition and Results of Operations
Securities by Type | ||||||||||||||||||||||||||||
March 31, 2018 | December 31, 2017 | |||||||||||||||||||||||||||
Cost or Amortized Cost | Gross Unrealized Gains | Gross Unrealized Losses | Fair Value | Percent of Total Fair Value | Cost or Amortized Cost | Gross Unrealized Gains | Gross Unrealized Losses | Fair Value | Percent of Total Fair Value | |||||||||||||||||||
Asset-backed securities ("ABS") | ||||||||||||||||||||||||||||
Consumer loans | $ | 797 | $ | 5 | $ | (3 | ) | $ | 799 | 2.2 | % | $ | 925 | $ | 7 | $ | (2 | ) | $ | 930 | 2.5 | % | ||||||
Other | 114 | 1 | (3 | ) | 112 | 0.3 | % | 194 | 2 | — | 196 | 0.5 | % | |||||||||||||||
Collateralized debt obligations ("CDOs") | ||||||||||||||||||||||||||||
CLOs | 1,145 | 1 | (2 | ) | 1,144 | 3.2 | % | 1,257 | 3 | — | 1,260 | 3.4 | % | |||||||||||||||
CMBS | ||||||||||||||||||||||||||||
Agency [1] | 1,308 | 10 | (27 | ) | 1,291 | 3.6 | % | 1,199 | 16 | (14 | ) | 1,201 | 3.2 | % | ||||||||||||||
Bonds | 1,685 | 17 | (26 | ) | 1,676 | 4.6 | % | 1,726 | 32 | (9 | ) | 1,749 | 4.7 | % | ||||||||||||||
Interest only (“IOs”) | 341 | 7 | (4 | ) | 344 | 1.0 | % | 379 | 10 | (3 | ) | 386 | 1.0 | % | ||||||||||||||
Corporate | ||||||||||||||||||||||||||||
Basic industry | 499 | 19 | (6 | ) | 512 | 1.4 | % | 523 | 28 | (1 | ) | 550 | 1.5 | % | ||||||||||||||
Capital goods | 1,093 | 29 | (14 | ) | 1,108 | 3.1 | % | 1,050 | 44 | (4 | ) | 1,090 | 2.9 | % | ||||||||||||||
Consumer cyclical | 888 | 18 | (12 | ) | 894 | 2.5 | % | 857 | 33 | (2 | ) | 888 | 2.4 | % | ||||||||||||||
Consumer non-cyclical | 1,621 | 25 | (33 | ) | 1,613 | 4.5 | % | 1,643 | 46 | (7 | ) | 1,682 | 4.6 | % | ||||||||||||||
Energy | 1,069 | 27 | (14 | ) | 1,082 | 3.0 | % | 1,056 | 43 | (3 | ) | 1,096 | 3.0 | % | ||||||||||||||
Financial services | 2,932 | 37 | (48 | ) | 2,921 | 8.1 | % | 2,722 | 77 | (10 | ) | 2,789 | 7.5 | % | ||||||||||||||
Tech./comm. | 1,546 | 58 | (26 | ) | 1,578 | 4.4 | % | 1,618 | 87 | (9 | ) | 1,696 | 4.6 | % | ||||||||||||||
Transportation | 522 | 8 | (6 | ) | 524 | 1.5 | % | 555 | 18 | — | 573 | 1.6 | % | |||||||||||||||
Utilities | 2,133 | 72 | (46 | ) | 2,159 | 6.0 | % | 2,097 | 110 | (19 | ) | 2,188 | 5.9 | % | ||||||||||||||
Other | 247 | 1 | (5 | ) | 243 | 0.7 | % | 249 | 4 | (1 | ) | 252 | 0.7 | % | ||||||||||||||
Foreign govt./govt. agencies | 1,076 | 22 | (16 | ) | 1,082 | 3.0 | % | 1,071 | 43 | (4 | ) | 1,110 | 3.0 | % | ||||||||||||||
Municipal bonds | ||||||||||||||||||||||||||||
Taxable | 561 | 21 | (11 | ) | 571 | 1.6 | % | 537 | 30 | (5 | ) | 562 | 1.5 | % | ||||||||||||||
Tax-exempt | 10,491 | 520 | (38 | ) | 10,973 | 30.5 | % | 11,206 | 724 | (7 | ) | 11,923 | 32.3 | % | ||||||||||||||
RMBS | ||||||||||||||||||||||||||||
Agency | 1,492 | 6 | (29 | ) | 1,469 | 4.1 | % | 1,530 | 10 | (4 | ) | 1,536 | 4.2 | % | ||||||||||||||
Non-agency | 394 | 3 | (3 | ) | 394 | 1.1 | % | 227 | 3 | — | 230 | 0.6 | % | |||||||||||||||
Alt-A | 53 | 3 | — | 56 | 0.2 | % | 58 | 4 | — | 62 | 0.2 | % | ||||||||||||||||
Sub-prime | 1,125 | 42 | — | 1,167 | 3.2 | % | 1,170 | 46 | — | 1,216 | 3.3 | % | ||||||||||||||||
U.S. Treasuries | 2,198 | 35 | (21 | ) | 2,212 | 6.2 | % | 1,763 | 46 | (10 | ) | 1,799 | 4.9 | % | ||||||||||||||
Fixed maturities, AFS | 35,330 | 987 | (393 | ) | 35,924 | 100 | % | 35,612 | 1,466 | (114 | ) | 36,964 | 100 | % | ||||||||||||||
Equity securities | ||||||||||||||||||||||||||||
Financial services | 115 | 19 | — | 134 | 13.3 | % | ||||||||||||||||||||||
Other | 792 | 102 | (16 | ) | 878 | 86.7 | % | |||||||||||||||||||||
Equity securities, AFS [2] | 907 | 121 | (16 | ) | 1,012 | 100 | % | |||||||||||||||||||||
Total AFS securities | $ | 35,330 | $ | 987 | $ | (393 | ) | $ | 35,924 | $ | 36,519 | $ | 1,587 | $ | (130 | ) | $ | 37,976 | ||||||||||
Fixed maturities, FVO | $ | 38 | $ | 41 | ||||||||||||||||||||||||
Equity securities, at fair value [2] | $ | 1,123 | ||||||||||||||||||||||||||
[1] | Includes securities with pools of loans issued by the Small Business Administration which are backed by the full faith and credit of the U.S. government. |
[2] | Effective January 1, 2018, with the adoption of new accounting standards for financial instruments, equity securities, AFS were reclassified to equity securities, at fair value. |
93
Part I - Item 2. Management's Discussion and Analysis of Financial Condition and Results of Operations
The fair value of AFS securities decreased as compared to December 31, 2017, primarily due to a decrease in valuations due to higher interest rates and wider credit spreads. Also, municipal bonds were reallocated into corporate bonds and U.S. treasury securities during the period.
Financial Services
The Company’s investment in the financial services sector is predominantly through investment grade banking and insurance
institutions. The following table presents the Company’s fixed maturities and equity, AFS securities in the financial services sector that are included in the preceding Securities by Type table.
Financial Services by Credit Quality | |||||||||||||||||||
March 31, 2018 | December 31, 2017 | ||||||||||||||||||
Amortized Cost | Fair Value | Net Unrealized Gain/(Loss) | Amortized Cost | Fair Value | Net Unrealized Gain/(Loss) | ||||||||||||||
AAA | $ | 20 | $ | 21 | $ | 1 | $ | 25 | $ | 26 | $ | 1 | |||||||
AA | 158 | 160 | 2 | 147 | 150 | 3 | |||||||||||||
A | 1,487 | 1,478 | (9 | ) | 1,525 | 1,575 | 50 | ||||||||||||
BBB | 1,181 | 1,175 | (6 | ) | 1,061 | 1,089 | 28 | ||||||||||||
BB & below | 86 | 87 | 1 | 79 | 83 | 4 | |||||||||||||
Total [1] | $ | 2,932 | $ | 2,921 | $ | (11 | ) | $ | 2,837 | $ | 2,923 | $ | 86 | ||||||
[1] | Includes equity, AFS securities with an amortized cost and fair value of $115 and $134 as of December 31, 2017. Effective January 1, 2018, with the adoption of new accounting guidance for financial instruments, equity securities, AFS were reclassified to equity securities, at fair value and are excluded from the table above as of March 31, 2018. |
The Company's fair value of investments in the financial services sector remained largely the same with December 31, 2017 due to purchases of corporate securities, offset by a decline in valuations due to higher interest rates and wider credit spreads.
Commercial Real Estate
The following table presents the Company’s exposure to CMBS bonds by current credit quality and vintage year included in the
preceding Securities by Type table. Credit protection represents the current weighted average percentage of the outstanding capital structure subordinated to the Company’s investment holding that is available to absorb losses before the security incurs the first dollar loss of principal and excludes any equity interest or property value in excess of outstanding debt.
Exposure to CMBS Bonds as of March 31, 2018 | ||||||||||||||||||||||||||||||||||||
AAA | AA | A | BBB | BB and Below | Total | |||||||||||||||||||||||||||||||
Vintage Year [1] | Amortized Cost | Fair Value | Amortized Cost | Fair Value | Amortized Cost | Fair Value | Amortized Cost | Fair Value | Amortized Cost | Fair Value | Amortized Cost | Fair Value | ||||||||||||||||||||||||
2008 & Prior | $ | 29 | $ | 29 | $ | 5 | $ | 5 | $ | — | $ | — | $ | — | $ | — | $ | 9 | $ | 9 | $ | 43 | $ | 43 | ||||||||||||
2009 | — | — | 2 | 2 | — | — | — | — | — | — | 2 | 2 | ||||||||||||||||||||||||
2010 | 18 | 18 | — | — | — | — | — | — | — | — | 18 | 18 | ||||||||||||||||||||||||
2011 | 39 | 41 | — | — | 2 | 2 | — | — | — | — | 41 | 43 | ||||||||||||||||||||||||
2012 | 17 | 17 | 9 | 8 | — | — | 5 | 5 | — | — | 31 | 30 | ||||||||||||||||||||||||
2013 | 3 | 3 | 11 | 11 | 36 | 37 | 1 | — | — | — | 51 | 51 | ||||||||||||||||||||||||
2014 | 286 | 288 | 36 | 36 | 43 | 42 | 5 | 4 | 5 | 5 | 375 | 375 | ||||||||||||||||||||||||
2015 | 136 | 134 | 111 | 111 | 155 | 158 | 20 | 21 | 3 | 4 | 425 | 428 | ||||||||||||||||||||||||
2016 | 175 | 169 | 107 | 105 | 78 | 80 | 9 | 9 | — | — | 369 | 363 | ||||||||||||||||||||||||
2017 | 131 | 127 | 142 | 138 | — | — | — | — | — | — | 273 | 265 | ||||||||||||||||||||||||
2018 | 46 | 47 | 5 | 5 | 6 | 6 | — | — | — | — | 57 | 58 | ||||||||||||||||||||||||
Total | $ | 880 | $ | 873 | $ | 428 | $ | 421 | $ | 320 | $ | 325 | $ | 40 | $ | 39 | $ | 17 | $ | 18 | $ | 1,685 | $ | 1,676 | ||||||||||||
Credit protection | 30.8% | 21.4% | 14.3% | 11.7% | 40.9% | 25.0% | ||||||||||||||||||||||||||||||
94
Part I - Item 2. Management's Discussion and Analysis of Financial Condition and Results of Operations
Exposure to CMBS Bonds as of December 31, 2017 | ||||||||||||||||||||||||||||||||||||
AAA | AA | A | BBB | BB and Below | Total | |||||||||||||||||||||||||||||||
Vintage Year [1] | Amortized Cost | Fair Value | Amortized Cost | Fair Value | Amortized Cost | Fair Value | Amortized Cost | Fair Value | Amortized Cost | Fair Value | Amortized Cost | Fair Value | ||||||||||||||||||||||||
2008 & Prior | $ | 32 | $ | 32 | $ | 5 | $ | 6 | $ | — | $ | — | $ | — | $ | — | $ | 9 | $ | 9 | $ | 46 | $ | 47 | ||||||||||||
2009 | — | — | 2 | 2 | — | — | — | — | — | — | 2 | 2 | ||||||||||||||||||||||||
2010 | 18 | 19 | — | — | — | — | — | — | — | — | 18 | 19 | ||||||||||||||||||||||||
2011 | 40 | 42 | — | — | 2 | 2 | — | — | — | — | 42 | 44 | ||||||||||||||||||||||||
2012 | 17 | 18 | 9 | 9 | — | — | 5 | 5 | — | — | 31 | 32 | ||||||||||||||||||||||||
2013 | — | — | 11 | 11 | 36 | 38 | — | — | — | — | 47 | 49 | ||||||||||||||||||||||||
2014 | 284 | 292 | 36 | 37 | 43 | 43 | 4 | 4 | 5 | 5 | 372 | 381 | ||||||||||||||||||||||||
2015 | 206 | 207 | 111 | 112 | 155 | 159 | 25 | 25 | 3 | 3 | 500 | 506 | ||||||||||||||||||||||||
2016 | 201 | 200 | 107 | 107 | 78 | 81 | 9 | 9 | — | — | 395 | 397 | ||||||||||||||||||||||||
2017 | 131 | 131 | 142 | 141 | — | — | — | — | — | — | 273 | 272 | ||||||||||||||||||||||||
Total | $ | 929 | $ | 941 | $ | 423 | $ | 425 | $ | 314 | $ | 323 | $ | 43 | $ | 43 | $ | 17 | $ | 17 | $ | 1,726 | $ | 1,749 | ||||||||||||
Credit protection | 30.8% | 21.4% | 14.1% | 11.3% | 41.0% | 25.1% | ||||||||||||||||||||||||||||||
[1] | The vintage year represents the year the pool of loans was originated. |
The Company also has exposure to commercial mortgage loans as presented in the following table. These loans are collateralized by a variety of commercial properties and are diversified both geographically throughout the United States and by property type. These loans are primarily in the form of whole loans, where
the Company is the sole lender, but may include participations. Loan participations are loans where the Company has purchased or retained a portion of an outstanding loan or package of loans and participates on a pro-rata basis in collecting interest and principal pursuant to the terms of the participation agreement.
Commercial Mortgage Loans | |||||||||||||||||||||||
March 31, 2018 | December 31, 2017 | ||||||||||||||||||||||
Amortized Cost [1] | Valuation Allowance | Carrying Value | Amortized Cost [1] | Valuation Allowance | Carrying Value | ||||||||||||||||||
Whole loans | $ | 3,222 | $ | (1 | ) | $ | 3,221 | $ | 3,176 | $ | (1 | ) | $ | 3,175 | |||||||||
Total | $ | 3,222 | $ | (1 | ) | $ | 3,221 | $ | 3,176 | $ | (1 | ) | $ | 3,175 | |||||||||
[1]Amortized cost represents carrying value prior to valuation allowances, if any.
The Company funded $70 of commercial whole loans with a weighted average loan-to-value (“LTV”) ratio of 57% and a weighted average yield of 4.0% during the three months ended March 31, 2018. The Company continues to originate commercial whole loans within primary markets, such as office, industrial and multi-family, focusing on loans with strong LTV ratios and high quality property collateral. There were no mortgage loans held
for sale as of March 31, 2018 or December 31, 2017.
Municipal Bonds
The following table presents the Company's exposure to municipal bonds by type and weighted average credit quality included in the preceding Securities by Type table.
95
Part I - Item 2. Management's Discussion and Analysis of Financial Condition and Results of Operations
Available For Sale Investments in Municipal Bonds | |||||||||||||||||||
March 31, 2018 | December 31, 2017 | ||||||||||||||||||
Amortized Cost | Fair Value | Weighted Average Credit Quality | Amortized Cost | Fair Value | Weighted Average Credit Quality | ||||||||||||||
General Obligation | $ | 1,586 | $ | 1,656 | AA | $ | 1,976 | $ | 2,087 | AA | |||||||||
Pre-Refunded [1] | 1,894 | 1,986 | AAA | 1,960 | 2,067 | AAA | |||||||||||||
Revenue | |||||||||||||||||||
Transportation | 1,682 | 1,786 | A+ | 1,638 | 1,790 | A+ | |||||||||||||
Health Care | 1,227 | 1,277 | AA- | 1,278 | 1,359 | AA- | |||||||||||||
Water & Sewer | 1,032 | 1,074 | AA | 1,069 | 1,131 | AA | |||||||||||||
Education | 1,054 | 1,071 | AA | 1,079 | 1,130 | AA | |||||||||||||
Leasing [2] | 801 | 833 | AA- | 809 | 858 | AA- | |||||||||||||
Sales Tax | 535 | 573 | AA | 537 | 590 | AA | |||||||||||||
Power | 396 | 420 | AA- | 442 | 478 | AA- | |||||||||||||
Housing | 22 | 23 | A | 79 | 82 | AA- | |||||||||||||
Other | 823 | 845 | AA- | 876 | 913 | AA- | |||||||||||||
Total Revenue | 7,572 | 7,902 | AA- | 7,807 | 8,331 | AA- | |||||||||||||
Total Municipal | $ | 11,052 | $ | 11,544 | AA | $ | 11,743 | $ | 12,485 | AA | |||||||||
[1] | Pre-Refunded bonds are bonds for which an irrevocable trust containing sufficient U.S. treasury, agency, or other securities has been established to fund the remaining payments of principal and interest. |
[2] | Leasing revenue bonds are generally the obligations of a financing authority established by the municipality that leases facilities back to a municipality. The notes are typically secured by lease payments made by the municipality that is leasing the facilities financed by the issue. Lease payments may be subject to annual appropriation by the municipality or the municipality may be obligated to appropriate general tax revenues to make lease payments. |
As of both March 31, 2018 and December 31, 2017, the largest issuer concentrations were the New York Dormitory Authority, the New York City Transitional Finance Authority, and the Commonwealth of Massachusetts, which each comprised less than 3% of the municipal bond portfolio and were primarily comprised of general obligation and revenue bonds. In total municipal bonds make up 26% of the fair value of the Company's investment portfolio. The Company has evaluated its portfolio allocation to municipal bonds with respect to the changes in corporate income tax rates that began in 2018. While tax-exempt municipal debt remains a high quality asset class with very low expected defaults and is a source of portfolio diversification, the Company has begun to slightly reduce exposure to the sector through both asset sales and principal repayments. The Company will continue to actively assess the impacts of the income tax rate changes on the municipal market and may continue to make portfolio changes over time based upon our view of the value of
the sector.
Limited Partnerships and Other Alternative Investments
The following tables present the Company’s investments in limited partnerships and other alternative investments which include hedge funds, real estate funds, and private equity funds. Real estate funds consist of investments primarily in real estate joint venture and equity funds, including some funds with public market exposure. Private equity funds primarily consist of investments in funds whose assets typically consist of a diversified pool of investments in small to mid-sized non-public businesses with high growth potential as well as limited exposure to public markets.
Limited Partnerships and Other Alternative Investments - Net Investment Income | |||||||||||
Three Months Ended March 31, | |||||||||||
2018 | 2017 | ||||||||||
Amount | Yield | Amount | Yield | ||||||||
Hedge funds | $ | — | — | % | $ | 2 | 50.7 | % | |||
Real estate funds | (1 | ) | (0.3 | )% | 4 | 3.1 | % | ||||
Private equity funds | 72 | 42.7 | % | 47 | 30.3 | % | |||||
Other alternative investments | 2 | 1.7 | % | 5 | 5.7 | % | |||||
Total | $ | 73 | 18.6 | % | $ | 58 | 15.5 | % | |||
96
Part I - Item 2. Management's Discussion and Analysis of Financial Condition and Results of Operations
Investments in Limited Partnerships and Other Alternative Investments | |||||||||||
March 31, 2018 | December 31, 2017 | ||||||||||
Amount | Percent | Amount | Percent | ||||||||
Hedge funds | $ | 34 | 2.1 | % | $ | 22 | 1.4 | % | |||
Real estate funds | 506 | 30.7 | % | 486 | 30.6 | % | |||||
Private equity and other funds | 721 | 43.7 | % | 693 | 43.6 | % | |||||
Other alternative investments [1] | 388 | 23.5 | % | 387 | 24.4 | % | |||||
Total | $ | 1,649 | 100 | % | $ | 1,588 | 100 | % | |||
Available-for-sale Securities — Unrealized Loss Aging
The total gross unrealized losses were $393 as of March 31, 2018 and have increased $263, or 202%, from December 31, 2017, primarily due to higher interest rates and wider credit spreads. As of March 31, 2018, $385 of the gross unrealized losses were associated with securities depressed less than 20% of cost or amortized cost. The remaining $8 of gross unrealized losses were associated with securities depressed greater than 20%. The securities depressed more than 20% are primarily securities with exposure to commercial real estate which are depressed primarily due to higher rates since the securities were purchased.
As part of the Company’s ongoing security monitoring process,
the Company has reviewed its AFS securities in an unrealized loss position and concluded that these securities are temporarily depressed and are expected to recover in value as the securities approach maturity or as market spreads tighten. For these securities in an unrealized loss position where a credit impairment has not been recorded, the Company’s best estimate of expected future cash flows are sufficient to recover the amortized cost basis of the security. Furthermore, the Company neither has an intention to sell nor does it expect to be required to sell these securities. For further information regarding the Company’s impairment analysis, see Other-Than-Temporary Impairments in the Investment Portfolio Risks and Risk Management section of this MD&A.
Unrealized Loss Aging for AFS Securities | |||||||||||||||||||||||||||||
March 31, 2018 | December 31, 2017 | ||||||||||||||||||||||||||||
Consecutive Months | Items | Cost or Amortized Cost | Fair Value | Unrealized Loss | Items | Cost or Amortized Cost | Fair Value | Unrealized Loss | |||||||||||||||||||||
Three months or less | 1,300 | $ | 9,134 | $ | 8,992 | $ | (142 | ) | 1,286 | $ | 4,315 | $ | 4,289 | $ | (26 | ) | |||||||||||||
Greater than three to six months | 585 | 3,057 | 2,973 | (84 | ) | 342 | 1,694 | 1,673 | (21 | ) | |||||||||||||||||||
Greater than six to nine months | 195 | 1,426 | 1,381 | (45 | ) | 157 | 601 | 594 | (7 | ) | |||||||||||||||||||
Greater than nine to eleven months | 65 | 367 | 361 | (6 | ) | 89 | 188 | 183 | (5 | ) | |||||||||||||||||||
Twelve months or more | 484 | 2,026 | 1,910 | (116 | ) | 652 | 2,040 | 1,969 | (71 | ) | |||||||||||||||||||
Total | 2,629 | $ | 16,010 | $ | 15,617 | $ | (393 | ) | 2,526 | $ | 8,838 | $ | 8,708 | $ | (130 | ) | |||||||||||||
Unrealized Loss Aging for AFS Securities Continuously Depressed Over 20% | |||||||||||||||||||||||||||||
March 31, 2018 | December 31, 2017 | ||||||||||||||||||||||||||||
Consecutive Months | Items | Cost or Amortized Cost | Fair Value | Unrealized Loss | Items | Cost or Amortized Cost | Fair Value | Unrealized Loss | |||||||||||||||||||||
Three months or less | 2 | $ | 2 | $ | 1 | $ | (1 | ) | 30 | $ | 14 | $ | 10 | $ | (4 | ) | |||||||||||||
Greater than three to six months | — | — | — | — | 12 | 10 | 7 | (3 | ) | ||||||||||||||||||||
Greater than six to nine months | 2 | 6 | 4 | (2 | ) | — | — | — | — | ||||||||||||||||||||
Twelve months or more | 38 | 12 | 7 | (5 | ) | 47 | 13 | 7 | (6 | ) | |||||||||||||||||||
Total | 42 | $ | 20 | $ | 12 | $ | (8 | ) | 89 | $ | 37 | $ | 24 | $ | (13 | ) | |||||||||||||
97
Part I - Item 2. Management's Discussion and Analysis of Financial Condition and Results of Operations
Other-than-temporary Impairments Recognized in Earnings by Security Type | ||||||
Three months ended March 31, | ||||||
2018 | 2017 | |||||
Credit Impairments | ||||||
CMBS | $ | — | $ | 1 | ||
Equity Impairments | — | — | ||||
Intent-to-Sell Impairments | — | — | ||||
Total | $ | — | $ | 1 | ||
Three months ended March 31, 2018
For the three months ended March 31, 2018, there were no impairments recognized in earnings.
The Company incorporates its best estimate of future performance using internal assumptions and judgments that are informed by economic and industry specific trends, as well as our expectations with respect to security specific developments.
There were no non-credit impairments recognized in other comprehensive income for the three months ended March 31, 2018.
Future impairments may develop as the result of changes in intent-to-sell specific securities or if actual results underperform current modeling assumptions, which may be the result of, but are not limited to, macroeconomic factors and security-specific performance below current expectations.
Three months ended March 31, 2017
For the three months ended March 31, 2017, impairments recognized in earnings were comprised of credit impairments of $1. These impairments were primarily related to interest-only CMBS and were identified through security specific review of the expected future cash flows. The Company incorporates its best estimate of future performance using internal assumptions and judgments that are informed by economic and industry specific trends, as well as our expectations with respect to security specific developments.
CAPITAL RESOURCES AND LIQUIDITY
The following section discusses the overall financial strength of The Hartford and its insurance operations including their ability to generate cash flows from each of their business segments, borrow funds at competitive rates and raise new capital to meet operating and growth needs over the next twelve months.
SUMMARY OF CAPITAL RESOURCES AND LIQUIDITY
Capital available at the holding company as of March 31, 2018:
• | $1.1 billion in fixed maturities, short-term investments and cash at HFSG Holding Company |
• | Borrowings available under a commercial paper program to a maximum of $1 billion. As of March 31, 2018 there was no commercial paper outstanding |
• | A senior unsecured five-year revolving credit facility that provides for borrowing capacity up to $1 billion of unsecured credit through October 31, 2019, though, as discussed below, upon and subject to, among other conditions, the closing of the sale of the life and annuity run-off business, the amount of the facility will be reduced to $750 and the term will be extended to March 29, 2023. No borrowings were outstanding as of March 31, 2018. |
Expected liquidity requirements for the next twelve months as of March 31, 2018:
• | $500 junior subordinated debt expected to be called in June of 2018 |
• | $413 maturing debt payment due in January of 2019 |
• | $270 of interest on debt, of which $3 is related to debt included in liabilities held for sale. |
• | $365 of common stockholders dividends, subject to the discretion of the Board of Directors |
Equity repurchase program:
• | The Company does not currently have an equity repurchase authorization in 2018. |
2018 dividend capacity:
• | The Company has dividend capacity of $1.4 billion from its property and casualty subsidiaries and expects to pay net dividends of $350 to HFSG Holding Company in 2018. During the first three months of 2018, there were no property and casualty dividends. |
• | Hartford Life and Accident Insurance Company ("HLA") has no dividend capacity for 2018 and does not anticipate paying dividends to the HFSG Holding Company. |
• | In connection with the announced sale of the life and annuity run-off business, Hartford Life Insurance Company ("HLIC") expects to pay a pre-closing dividend to the Company of up to $300, subject to approval by the Connecticut Insurance Commissioner. Other intercompany transactions with HLI will be net settled |
98
Part I - Item 2. Management's Discussion and Analysis of Financial Condition and Results of Operations
prior to closing. During the first three months of 2018, there were no HLIC dividends.
Liquidity Requirements and Sources of Capital
The Hartford Financial Services Group, Inc. (Holding Company)
The liquidity requirements of the holding company of The Hartford Financial Services Group, Inc. (“HFSG Holding Company”) have been and will continue to be met by HFSG Holding Company’s fixed maturities, short-term investments and cash, and dividends from its subsidiaries, principally from its insurance operations, as well as the issuance of common stock, debt or other capital securities and borrowings from its credit facilities, as needed.
As of March 31, 2018, HFSG Holding Company held fixed maturities, short-term investments and cash of $1.1 billion. Expected liquidity requirements of the HFSG Holding Company for the next twelve months include an expected call of $500 junior subordinated notes in June 2018, payment of 6.0% senior note of $413 at maturity in January 2019, interest payments on debt of approximately $270, and common stockholder dividends, subject to the discretion of the Board of Directors, of approximately $365.
The Hartford has an intercompany liquidity agreement that allows for short-term advances of funds among the HFSG Holding Company and certain affiliates of up to $2 billion for liquidity and other general corporate purposes. The Connecticut Insurance Department ("CTDOI") granted approval for certain affiliated insurance companies that are parties to the agreement to treat receivables from a parent, including the HFSG Holding Company, as admitted assets for statutory accounting purposes. As of March 31, 2018, there were no amounts outstanding from the HFSG Holding Company.
Debt
On March 15, 2018, The Hartford issued $500 of 4.4% senior notes ("4.4% Notes") due March 15, 2048 for net proceeds of approximately $490, after deducting underwriting discounts and expenses from the offering. Interest is payable semi-annually in arrears on March 15 and September 15, commencing September 15, 2018. The Hartford, at its option, can redeem the 4.4% Notes at any time, in whole or in part, at a redemption price equal to the greater of 100% of the principal amount being redeemed or a make-whole amount based on a comparable maturity US Treasury plus 25 basis points, plus any accrued and unpaid interest, except the option of a make-whole payment is not applicable within the final six months of maturity. The Hartford used a portion of the net proceeds from this issuance to repay $320 at maturity of the Company’s 6.3% notes due March 15, 2018, and the balance of the proceeds will be used for general corporate purposes.
Intercompany Liquidity Agreements
As of March 31, 2018, the company has $2 billion available under its intercompany liquidity agreement.
Equity
The Company does not currently have an equity repurchase authorization in 2018.
For further information about equity repurchases, see Part II. Other Information, Item 2.
Dividends
On February 22, 2018, The Hartford's Board of Directors declared a quarterly dividend of $0.25 per common share payable on April 2, 2018 to common shareholders of record as of March 5, 2018.
There are no current restrictions on the HFSG Holding Company's ability to pay dividends to its shareholders.
For a discussion of restrictions on dividends to the HFSG Holding Company from its insurance subsidiaries, see the following "Dividends from Insurance Subsidiaries" discussion. For a discussion of potential restrictions on the HFSG Holding Company's ability to pay dividends, see the risk factor "Our ability to declare and pay dividends is subject to limitations" in Item 1A of Part I of the Company’s Annual Report on Form 10-K for the year ended December 31, 2017.
Pension Plans and Other Postretirement Benefits
The Company does not have a 2018 required minimum funding contribution for the U.S. qualified defined benefit pension plan and the funding requirements for all pension plans are expected to be immaterial. The Company has not determined whether, and to what extent, contributions may be made to the U.S. qualified defined benefit pension plan in 2018. The Company will monitor the funded status of the U.S. qualified defined benefit pension plan during 2018 to make this determination.
Dividends from Insurance Subsidiaries
Dividends to the HFSG Holding Company from its insurance subsidiaries are restricted by insurance regulation. The payment of dividends by Connecticut-domiciled insurers is limited under the insurance holding company laws of Connecticut. These laws require notice to and approval by the state insurance commissioner for the declaration or payment of any dividend, which, together with other dividends or distributions made within the preceding twelve months, exceeds the greater of (i) 10% of the insurer’s policyholder surplus as of December 31 of the preceding year or (ii) net income (or net gain from operations, if such company is a life insurance company) for the twelve-month period ending on the thirty-first day of December last preceding, in each case determined under statutory insurance accounting principles. In addition, if any dividend of a Connecticut-domiciled insurer exceeds the insurer’s earned surplus, it requires the prior approval of the Connecticut Insurance Commissioner. The insurance holding company laws of the other jurisdictions in which The Hartford’s insurance subsidiaries are incorporated (or deemed commercially domiciled) generally contain similar (although in certain instances more restrictive) limitations on the payment of dividends. Dividends paid to HFSG Holding Company by its life insurance subsidiaries are further dependent on cash requirements of HLI, Hartford Holdings, Inc. ("HHI") and other factors. In addition to statutory limitations on paying dividends,
99
Part I - Item 2. Management's Discussion and Analysis of Financial Condition and Results of Operations
the Company also takes other items into consideration when determining dividends from subsidiaries. These considerations include, but are not limited to, expected earnings and capitalization of the subsidiaries, regulatory capital requirements and liquidity requirements of the individual operating company.
For 2018, the Company has dividend capacity of $1.4 billion for property and casualty insurance subsidiaries and no dividend capacity for HLA.
During the first three months of 2018, HFSG holding company did not receive any dividends from its subsidiaries with the exception of $27 from Mutual Funds.
Over the remainder of 2018, the Company anticipates receiving approximately $350 of net dividends from property and casualty subsidiaries and approximately $82 of dividends from Mutual Funds.
In connection with the announced sale of the life and annuity run-off business, HLIC expects to pay a pre-close dividend to the company of up to $300, subject to approval by the Connecticut Insurance Commissioner. Other intercompany transactions with HLI will be net settled prior to closing. In connection with the proceeds from that sale, the property and casualty subsidiaries expect to make dividends to HFSG Holding Company which would be funded by a pay down of principal on the intercompany note owed by Hartford Holdings Inc. to Hartford Fire Insurance Company.
Other Sources of Capital for the HFSG Holding Company
The Hartford endeavors to maintain a capital structure that provides financial and operational flexibility to its insurance subsidiaries, ratings that support its competitive position in the financial services marketplace (see the "Ratings" section below for further discussion), and shareholder returns. As a result, the Company may from time to time raise capital from the issuance of equity, equity-related debt or other capital securities and is continuously evaluating strategic opportunities. The issuance of debt, common equity, equity-related debt or other capital securities could result in the dilution of shareholder interests or reduced net income due to additional interest expense.
Shelf Registrations
The Hartford filed an automatic shelf registration statement with the Securities and Exchange Commission ("the SEC") on July 29, 2016 that permits it to offer and sell debt and equity securities during the three-year life of the registration statement.
Commercial Paper and Revolving Credit Facility
Commercial Paper
The Hartford’s maximum borrowings available under its commercial paper program are $1 billion. The Company is dependent upon market conditions to access short-term financing through the issuance of commercial paper to investors. As of March 31, 2018, there was no commercial paper outstanding.
Revolving Credit Facilities
The Company has a senior unsecured five-year revolving credit facility (the “Credit Facility”) that provides for borrowing capacity of up to $1 billion of unsecured credit through October 31, 2019,
subject to amended terms and conditions as described below, available in U.S. Dollars, Euro, Sterling, Canadian Dollars and Japanese Yen. Of the aggregate principal amount available, up to $250 is available to support letters of credit. U.S. Dollar loans will bear interest at a rate based on the higher of a rate (the prime rate or the Federal Funds Rate plus 0.50%) plus a basis point spread based on The Hartford’s credit rating and will mature no later than October 31, 2019. Letters of credit issued from the Credit Facility bear a fee based on The Hartford’s credit rating and expire no later than October 31, 2020. The Credit Facility requires the Company to maintain a minimum consolidated net worth excluding AOCI, limits debt based on a maximum senior debt to capitalization ratio of 35%, and includes other customary covenants.
As of March 31, 2018, no borrowings were outstanding and $3 in letters of credit were issued under the Credit Facility and the Company was in compliance with all financial covenants.
On March 29, 2018, the Company entered into an amendment (the "Amendment") to its Credit Facility that reset the level of the Company’s minimum consolidated net worth financial covenant to $9 billion excluding AOCI from its former $13.5 billion (where net worth was defined as stockholders' equity excluding AOCI and including junior subordinated debt), among other updates. The Amendment also provides for an amended and restated credit agreement that would, upon and subject to certain conditions including consummation of the sale of the life and annuity run-off business and among other changes, (i) decrease the aggregate principal amount of the facility from $1 billion to $750, including a reduction to the amount available for letters of credit from $250 to $100 (ii) change the maturity date to March 29, 2023, and (iii) modify the liens covenant and certain other covenants therein.
Derivative Commitments
Certain of the Company’s derivative agreements contain provisions that are tied to the financial strength ratings, as set by nationally recognized statistical agencies, of the individual legal entity that entered into the derivative agreement. If the legal entity’s financial strength were to fall below certain ratings, the counterparties to the derivative agreements could demand immediate and ongoing full collateralization and in certain instances enable the counterparties to terminate the agreements and demand immediate settlement of all outstanding derivative positions traded under each impacted bilateral agreement. The settlement amount is determined by netting the derivative positions transacted under each agreement. If the termination rights were to be exercised by the counterparties, it could impact the legal entity’s ability to conduct hedging activities by increasing the associated costs and decreasing the willingness of counterparties to transact with the legal entity. The aggregate fair value of all derivative instruments with credit-risk-related contingent features that are in a net liability position as of March 31, 2018 was $96. Of this $96, the legal entities have posted collateral of $94 in the normal course of business. Based on derivative market values as of March 31, 2018 , a downgrade of one level below the current financial strength ratings by either Moody’s or S&P would require an additional $10 of assets to be posted as collateral. These collateral amounts could change as derivative market values change, as a result of changes in our hedging activities or to the extent changes in contractual terms are negotiated. The nature of the collateral that we would post, if
100
Part I - Item 2. Management's Discussion and Analysis of Financial Condition and Results of Operations
required, would be primarily in the form of U.S. Treasury bills, U.S. Treasury notes and government agency securities.
As of March 31, 2018, the Company did not participate in any derivative relationships that would be subject to an immediate termination in the event of a downgrade of one level below the current financial strength ratings. This could change as a result of changes in our hedging activities or to the extent changes in contractual terms are negotiated.
Insurance Operations
While subject to variability period to period, claim frequency and severity patterns continue to be within historical norms and, therefore, the Company’s insurance operations’ current liquidity position is considered to be sufficient to meet anticipated demands over the next twelve months. For a discussion and tabular presentation of the Company’s current contractual obligations by period, refer to Off-Balance Sheet Arrangements and Aggregate Contractual Obligations within the Capital Resources and Liquidity section of the MD&A included in The Hartford’s 2017 Form 10-K Annual Report.
The principal sources of operating funds are premiums, fees earned from assets under management and investment income, while investing cash flows originate from maturities and sales of invested assets. The primary uses of funds are to pay claims, claim adjustment expenses, commissions and other underwriting and insurance operating costs, to pay taxes, to purchase new investments and to make dividend payments to the HFSG Holding Company.
The Company’s insurance operations consist of property and casualty insurance products (collectively referred to as “Property & Casualty Operations”) and Group Benefits.
Property & Casualty Operations
Property & Casualty Operations holds fixed maturity securities including a significant short-term investment position (securities with maturities of one year or less at the time of purchase) to meet liquidity needs.
Property & Casualty | |||
As of March 31, 2018 | |||
Fixed maturities | $ | 25,060 | |
Short-term investments | 1,217 | ||
Cash | 144 | ||
Less: Derivative collateral | 82 | ||
Total | $ | 26,339 | |
Liquidity requirements that are unable to be funded by Property & Casualty Operation’s short-term investments would be satisfied with current operating funds, including premiums or proceeds received through the sale of invested assets. A sale of invested assets could result in significant realized capital losses.
Group Benefits Operations
Group Benefits operations’ total unpaid loss and loss adjustment expense reserves of $8.5 billion are supported by $11.7 billion of cash and invested assets, including assets available to meet liquidity needs as shown below.
Group Benefits Operations | |||
As of March 31, 2018 | |||
Fixed maturities | $ | 10,155 | |
Short-term investments | 364 | ||
Cash | 44 | ||
Less: Derivative collateral | 26 | ||
Total | $ | 10,537 | |
Capital resources available to pay Group Benefits loss and loss adjustment expense reserves will be funded by Hartford Life and Accident Insurance Company.
Off-Balance Sheet Arrangements and Aggregate Contractual Obligations
There have been no material changes to the Company’s off-balance sheet arrangements and aggregate contractual obligations since the filing of the Company’s 2017 Form 10-K Annual Report.
101
Part I - Item 2. Management's Discussion and Analysis of Financial Condition and Results of Operations
Capitalization
Capital Structure | ||||||||
March 31, 2018 | December 31, 2017 | Change | ||||||
Short-term debt (includes current maturities of long-term debt) | $ | 413 | $ | 320 | 29 | % | ||
Long-term debt | 4,755 | 4,678 | 2 | % | ||||
Total debt | 5,168 | 4,998 | 3 | % | ||||
Stockholders’ equity excluding accumulated other comprehensive income (loss), net of tax (“AOCI”) | 13,382 | 12,831 | 4 | % | ||||
AOCI, net of tax | (239 | ) | 663 | (136 | )% | |||
Total stockholders’ equity | $ | 13,143 | $ | 13,494 | (3 | )% | ||
Total capitalization | $ | 18,311 | $ | 18,492 | (1 | )% | ||
Debt to stockholders’ equity | 39 | % | 37 | % | ||||
Debt to capitalization | 28 | % | 27 | % | ||||
Total capitalization decreased $181, or 1%, as of March 31, 2018 compared to December 31, 2017 primarily due to decreases in AOCI, partially offset by an increase in total debt.
For additional information on AOCI, net of tax, and unrealized capital gains from securities, see Note 15 - Changes In and
Reclassifications From Accumulated Other Comprehensive Income, and Note 6 - Investments of Notes to Condensed Consolidated Financial Statements.
Cash Flow[1]
Three Months Ended March 31, | ||||||
2018 | 2017 | |||||
Net cash provided by operating activities | $ | 712 | $ | 225 | ||
Net cash used for investing activities | $ | (242 | ) | $ | (1,208 | ) |
Net cash provided by (used for) financing activities | $ | (677 | ) | $ | 436 | |
Cash – end of period | $ | 228 | $ | 101 | ||
[1] Cash activities include cash flows from Discontinued Operations; see Note 17 - Business Dispositions and Discontinued Operations of Notes to Condensed Consolidated Financial Statements for information on cash flows from Discontinued Operations
Cash provided by operating activities increased in 2018 as compared to the prior year period primarily due to the payment in 2017 of a reinsurance premium of $650 for the ADC reinsurance agreement partially offset by a reduction in income taxes received in 2018. Other changes in cash provided by operating activities include an increase in cash received for insurance premiums, net investment income and fee income largely offset by an increase in cash paid for benefits, losses and loss adjustment expenses as well as operating expenses. The acquisition of Aetna's U.S. group life and disability business contributed to the increase in cash received for insurance premiums and net investment income and the increase in cash paid for benefits, losses and other expenses.
Cash used for investing activities decreased in 2018 compared to the prior year period primarily due to a decrease in net purchases of short-term investments.
Cash provided by (used for) financing activities changed from cash provided by financing activities in 2017 to cash used for financing activities in 2018, primarily due to a decrease in securities loaned or sold under agreements to repurchase, partially offset by a decrease in treasury stock acquired.
Operating cash flow for the three months ended March 31, 2018, together with $490 of net proceeds from the issuance of the 4.4% Notes, have been adequate to meet liquidity requirements.
Equity Markets
For a discussion of the potential impact of the equity markets on capital and liquidity, see the Financial Risk Liquidity Risk and Financial Risk on Statutory Capital sections in this MD&A.
Ratings
Ratings are an important factor in establishing a competitive position in the insurance marketplace and impact the Company's ability to access financing and its cost of borrowing. There can be no assurance that the Company’s ratings will continue for any given period of time, or that they will not be changed. In the event the Company’s ratings are downgraded, the Company’s competitive position, ability to access financing, and its cost of borrowing, may be adversely impacted.
102
Part I - Item 2. Management's Discussion and Analysis of Financial Condition and Results of Operations
Insurance Financial Strength Ratings as of April 24, 2018 | |||
A.M. Best | Standard & Poor’s | Moody’s | |
Hartford Fire Insurance Company | A+ | A+ | A1 |
Hartford Life and Accident Insurance Company | A | A | A2 |
Life and Annuity Legal Entities To Be Sold | |||
Hartford Life Insurance Company and Hartford Life and Annuity Insurance Company ratings are under review with developing implications at A.M. Best, on CreditWatch with negative implications at Standard and Poor's, and are under review for downgrade at Moody's. | |||
Hartford Life Insurance Company | B++ | BBB | Baa3 |
Hartford Life and Annuity Insurance Company | B++ | BBB | Baa3 |
Other Ratings: | |||
The Hartford Financial Services Group, Inc.: | |||
Senior debt | a- | BBB+ | Baa2 |
Commercial paper | AMB-1 | A-2 | P-2 |
These ratings are not a recommendation to buy or hold any of The Hartford’s securities and they may be revised or revoked at any time at the sole discretion of the rating organization.
The agencies consider many factors in determining the final rating of an insurance company. One consideration is the relative level of statutory capital and surplus (referred to collectively as "statutory capital") necessary to support the business written and is reported in accordance with accounting practices prescribed by the applicable state insurance department.
Statutory Capital
Statutory Capital Rollforward for the Company's Insurance Subsidiaries | ||||||||||||
Property and Casualty Insurance Subsidiaries | Group Benefits Insurance Subsidiary | Life and Annuity Run-Off Business | Total | |||||||||
U.S. statutory capital at January 1, 2018 | $ | 7,396 | $ | 2,029 | $ | 3,552 | $ | 12,977 | ||||
Variable annuity surplus impacts | — | — | 106 | 106 | ||||||||
Statutory income | 434 | 92 | 149 | 675 | ||||||||
Other items | (56 | ) | (9 | ) | (170 | ) | (235 | ) | ||||
Net change to U.S. statutory capital | 378 | 83 | 85 | 546 | ||||||||
U.S. statutory capital at March 31, 2018 | $ | 7,774 | $ | 2,112 | $ | 3,637 | $ | 13,523 | ||||
Contingencies
Legal Proceedings – For a discussion regarding contingencies related to The Hartford’s legal proceedings, please see the information contained under “Litigation” and "Asbestos and Environmental Claims" in Note 13 - Commitments and Contingencies Notes to Condensed Consolidated Financial Statements and Part II, Item 1 Legal Proceedings, which are incorporated herein by reference.
Legislative and Regulatory Developments
Patient Protection and Affordable Care Act of 2010 (the "Affordable Care Act")
It is unclear whether the Administration and Congress will seek to amend or alter the ongoing operation of the Affordable Care Act ("ACA"). If such actions were to occur, they may have an impact on various aspects of our business, including our insurance businesses. It is unclear what an amended ACA would entail, and to what extent there may be a transition period for the phase out of the ACA. The impact to The Hartford as an employer would be consistent with other large employers. The Hartford’s core business does not involve the issuance of health insurance, and we have not observed any material impacts on the Company’s
103
Part I - Item 2. Management's Discussion and Analysis of Financial Condition and Results of Operations
workers’ compensation business or group benefits business from the enactment of the ACA. We will continue to monitor the impact of the ACA and any reforms on consumer, broker and medical provider behavior for leading indicators of changes in medical costs or loss payments primarily on the Company's workers' compensation and disability liabilities.
United States Department of Labor Fiduciary Rule
On April 6, 2016, the U.S. Department of Labor (“DOL”) issued a final regulation (the “Rule” or “Fiduciary Rule") expanding the range of activities considered to be fiduciary investment advice under the Employee Retirement Income Security Act of 1974 (“ERISA”) and the Internal Revenue Code. While implementation of the Rule was to be phased in, the DOL has since delayed those dates. Based on comments received, the DOL has delayed the transition period to July 1, 2019. DOL intends to continue coordination with the SEC and other regulators, including state insurance regulators.
The impact of the Rule on our mutual fund business is difficult to assess because it is new and is still being studied. While we continue to analyze the Rule, we believe it may impact the compensation paid to the financial intermediaries who sell our mutual funds to their retirement clients and could negatively impact our mutual funds business.
In 2016, several plaintiffs, including insurers and industry groups such as the U.S. Chamber of Commerce and the Securities Industry and Financial Markets Association (SIFMA), filed a lawsuit against the DOL challenging the constitutionality of the Fiduciary Rule, and the DOL's rulemaking authority. In most cases, the district courts have entered a summary judgment in favor of the DOL. Certain cases were appealed to the Fifth Circuit and on July 5, 2017, the DOL filed a brief in support of upholding the Rule. On March 13, 2018, the Tenth Circuit upheld one of the exemptions of the Rule as valid, however, the Fifth Circuit overturned and vacated the Fiduciary Rule in its entirety on March 15, 2018. While the Rule remains technically in effect, the DOL announced that it will not enforce the Rule pending potential review of the Fifth Circuit decision. The DOL may petition for rehearing of the decision but absent such a request, the Fifth Circuit is expected to enter a mandate vacating the Fiduciary Rule on May 7, 2018. That mandate would vacate the Rule on a nationwide basis, restoring the status quo before the Rule took effect. We continue to monitor the impacts of the legal proceedings and the regulatory landscape on our mutual funds business.
Tax Reform
At the end of 2017, Congress passed and the president signed, the Tax Cuts and Jobs Act of 2017 ("Tax Reform"), which enacted significant reforms to the U.S. tax code. The major areas of interest to the company include the reduction of the corporate tax rate from 35% to 21% and the repeal of the corporate alternative minimum tax (AMT) and the refunding of AMT credits. We continue to analyze Tax Reform for other potential impacts. The U.S. Treasury and IRS will develop guidance implementing Tax Reform, and Congress may consider additional technical corrections to the legislation. Tax proposals and regulatory initiatives which have been or are being considered by Congress and/or the U.S. Treasury Department could have a material effect on the company and its insurance businesses. The nature and
timing of any Congressional or regulatory action with respect to any such efforts is unclear. For additional information on risks to the Company related to Tax Reform, please see the risk factor entitled "Changes in federal or state tax laws could adversely affect our business, financial condition, results of operations and liquidity" under "Risk Factors" in Part I of the Company's Annual Report on Form 10-K for the year ended December 31, 2017.
IMPACT OF NEW ACCOUNTING STANDARDS
For a discussion of accounting standards, see Note 1 - Basis of Presentation and Significant Accounting Policies of Notes to Consolidated Financial Statements included in The Hartford’s 2017 Form 10-K Annual Report and Note 1 - Basis of Presentation and Significant Accounting Policies of Notes to Condensed Consolidated Financial Statements in this Form 10-Q.
104
Part I - Item 4. Controls and Procedures
Item 4. CONTROLS AND PROCEDURES
Evaluation of Disclosure Controls and Procedures
The Company’s principal executive officer and its principal financial officer, based on their evaluation of the Company’s disclosure controls and procedures (as defined in Exchange Act Rule 13a-15(e)) have concluded that the Company’s disclosure controls and procedures are effective for the purposes set forth in the definition thereof in Exchange Act Rule 13a-15(e) as of March 31, 2018.
Changes in Internal Control Over Financial Reporting
There were no changes in the Company's internal control over financial reporting that occurred during the Company's current fiscal quarter that have materially affected, or are reasonably likely to materially affect, the Company's internal control over financial reporting.
105
Part II - Item 1. Legal Proceedings
Item 1. LEGAL PROCEEDINGS
Litigation
The Hartford is involved in claims litigation arising in the ordinary course of business, both as a liability insurer defending or providing indemnity for third-party claims brought against insureds and as an insurer defending coverage claims brought against it. The Hartford accounts for such activity through the establishment of unpaid loss and loss adjustment expense reserves. Subject to the uncertainties related to The Hartford's asbestos and environmental claims discussed in Note 13 - Commitments and Contingencies of the Notes to Condensed Consolidated Financial Statements, management expects that the ultimate liability, if any, with respect to such ordinary-course claims litigation, after consideration of provisions made for potential losses and costs of defense, will not be material to the consolidated financial condition, results of operations or cash flows of The Hartford.
The Hartford is also involved in other kinds of legal actions, some of which assert claims for substantial amounts. In addition to the matters described below, these actions include putative state and federal class actions seeking certification of a state or national class. Such putative class actions have alleged, for example, underpayment of claims or improper underwriting practices in connection with various kinds of insurance policies, such as personal and commercial automobile, property, disability and inland marine. The Hartford also is involved in individual actions in which punitive damages are sought, such as claims alleging bad faith in the handling of insurance claims or other allegedly unfair or improper business practices. Like many other insurers, The Hartford also has been joined in actions by asbestos plaintiffs asserting, among other things, that insurers had a duty to protect the public from the dangers of asbestos and that insurers committed unfair trade practices by asserting defenses on behalf of their policyholders in the underlying asbestos cases. Management expects that the ultimate liability, if any, with respect to such lawsuits, after consideration of provisions made for estimated losses, will not be material to the consolidated financial condition of The Hartford. Nonetheless, given the large or indeterminate amounts sought in certain of these actions, and the inherent unpredictability of litigation, the outcome in certain matters could, from time to time, have a material adverse effect on the Company’s results of operations or cash flows in particular quarterly or annual periods.
In addition to the inherent difficulty of predicting litigation outcomes, the Mutual Funds Litigation identified below purports to seek substantial damages for unsubstantiated conduct spanning a multi-year period based on novel applications of complex legal theories. The alleged damages are not quantified or factually supported in the complaint, and, in any event, the Company’s experience shows that demands for damages often bear little relation to a reasonable estimate of potential loss. The application of the legal standard identified by the court for assessing the potentially available damages, as described below, is inherently unpredictable, and no legal precedent has been identified that would aid in determining a reasonable estimate of
potential loss. Accordingly, management cannot reasonably estimate the possible loss or range of loss, if any.
Mutual Funds Litigation — In February 2011, a derivative action was brought on behalf of six Hartford retail mutual funds in the United States District Court for the District of New Jersey, alleging that Hartford Investment Financial Services, LLC (“HIFSCO”), an indirect subsidiary of the Company, received excessive advisory and distribution fees in violation of its statutory fiduciary duty under Section 36(b) of the Investment Company Act of 1940. During the course of the litigation, the claims regarding distribution fees were dismissed without prejudice, the lineup of funds as plaintiffs changed several times, and the plaintiffs added as a defendant Hartford Funds Management Company (“HFMC”), an indirect subsidiary of the Company that assumed the role of advisor to the funds as of January 2013. In June 2015, HFMC and HIFSCO moved for summary judgment, and plaintiffs cross-moved for partial summary judgment with respect to one fund. In March 2016, the court denied the plaintiff's motion, and granted summary judgment for HIFSCO and HFMC with respect to one fund, leaving six funds as plaintiffs: The Hartford Balanced Fund, The Hartford Capital Appreciation Fund, The Hartford Floating Rate Fund, The Hartford Growth Opportunities Fund, The Hartford Healthcare Fund, and The Hartford Inflation Plus Fund. The court further ruled that the appropriate measure of damages on the surviving claims would be the difference, if any, between the actual advisory fees paid through trial and the fees permitted under the applicable legal standard. A bench trial on the issue of liability was held in November 2016. In February 2017, the court granted judgment for HIFSCO and HFMC as to all claims. Plaintiffs have appealed to the United States Court of Appeals for the Third Circuit.
106
Part I - Item 1A. Risk Factors
Item 1A. RISK FACTORS
Investing in The Hartford involves risk. In deciding whether to invest in The Hartford, you should carefully consider the risk factors disclosed in Item 1A of Part I of the Company's Annual Report on Form 10-K for the year ended December 31, 2017, any of which could have a significant or material adverse effect on the business, financial condition, operating results or liquidity of The Hartford. This information should be considered carefully together with the other information contained in this report and the other reports and materials filed by The Hartford with the SEC.
107
Part II - Item 2. Unregistered Sales of Equity Securities and Use of Proceeds
Item 2. UNREGISTERED SALES OF EQUITY SECURITIES AND USE OF PROCEEDS
Purchases of Equity Securities by the Issuer
The Company’s repurchase authorization permits purchases of common stock, as well as warrants or other derivative securities. Repurchases may be made in the open market, through derivative, accelerated share repurchase and other privately negotiated transactions, and through plans designed to comply with Rule 10b5-1(c) under the Securities Exchange Act of 1934, as amended. The timing of any future repurchases will be
dependent upon several factors, including the market price of the Company’s securities, the Company’s capital position, consideration of the effect of any repurchases on the Company’s financial strength or credit ratings, and other corporate considerations. The repurchase program may be modified, extended or terminated by the Board of Directors at any time.
The Company does not currently have an equity repurchase authorization in 2018.
108
Part II - Item 6. Exhibits
Item 6. EXHIBITS
See Exhibits Index on page | 110. |
109
THE HARTFORD FINANCIAL SERVICES GROUP, INC.
FOR THE QUARTER ENDED MARCH 31, 2018
FORM 10-Q
EXHIBITS INDEX
Exhibit No. | Description | Form | File No. | Exhibit No | Filing Date |
3.01 | 8-K | 001-13958 | 3.01 | 10/20/2014 | |
3.02 | 8-K | 001-13958 | 3.01 | 7/21/2016 | |
4.01 | 8-K | 001-13958 | 4.3 | 3/15/2018 | |
10.01 | 8-K | 001-13958 | 10.01 | 3/30/2018 | |
*10.02 | |||||
15.01 | |||||
31.01 | |||||
31.02 | |||||
32.01 | |||||
32.02 | |||||
101.INS | XBRL Instance Document.** | ||||
101.SCH | XBRL Taxonomy Extension Schema.** | ||||
101.CAL | XBRL Taxonomy Extension Calculation Linkbase.** | ||||
101.DEF | XBRL Taxonomy Extension Definition Linkbase.** | ||||
101.LAB | XBRL Taxonomy Extension Label Linkbase.** | ||||
101.PRE | XBRL Taxonomy Extension Presentation Linkbase.** | ||||
* | Management contract, compensatory plan or arrangement. | ||||
** | Filed with the Securities and Exchange Commission as an exhibit to this report. | ||||
110
SIGNATURE
Pursuant to the requirements of the Securities Exchange Act of 1934, the registrant has duly caused this report to be signed on its behalf by the undersigned hereunto duly authorized.
The Hartford Financial Services Group, Inc. | ||||
(Registrant) | ||||
Date: | April 26, 2018 | /s/ Scott R. Lewis | ||
Scott R. Lewis | ||||
Senior Vice President and Controller | ||||
(Chief accounting officer and duly authorized signatory) | ||||
111