Attached files
| file | filename |
|---|---|
| EX-99.3 - EX-99.3 - GENTHERM Inc | thrm-ex993_42.htm |
| EX-99.1 - EX-99.1 - GENTHERM Inc | thrm-ex991_14.htm |
| 8-K - 8-K - GENTHERM Inc | thrm-8k_20180426.htm |
Gentherm Inc. 2018 First Quarter Results April 26, 2018 Exhibit 99.2
Forward-Looking Statement Except for historical information contained herein, statements in this presentation are forward-looking statements that are made pursuant to the safe harbor provisions of the Private Securities Litigation Reform Act of 1995. These forward-looking statements represent Gentherm Incorporated's goals, beliefs, plans and expectations about its prospects for the future and other future events. The forward-looking statements included in this presentation are made as of the date hereof or as of the date specified and are based on management's current expectations and beliefs. Such statements are subject to a number of important assumptions, risks, uncertainties and other factors that may cause the Company's actual performance to differ materially from that described in or indicated by the forward looking statements. Those risks include, but are not limited to, risks that new products may not be feasible, sales may not increase, additional financing requirements may not be available, new competitors may arise or customers may develop their own products to replace the Company’s products, currency exchange rates may change unfavorably, pricing pressures from customers may increase, the Company’s workforce and operations could be disrupted by civil or political unrest in the countries in which the Company operates, free trade agreements may be altered in a manner adverse to the Company, medical device regulations could change in an unfavorable manner, oil and gas prices could fluctuate causing adverse consequences, and other adverse conditions in the industries in which the Company operates may negatively affect its results. The business outlook discussed in this presentation does not include the potential impact of any business combinations, acquisitions, divestitures, strategic investments and other significant transactions that may be completed after the date hereof. The foregoing risks should be read in conjunction with the Company's annual report on Form 10-K for the year ended December 31, 2017 and subsequent reports filed with the Securities and Exchange Commission. Except as required by law, the Company expressly disclaims any obligation or undertaking to update any forward-looking statements to reflect any change in its expectations with regard thereto or any change in events, conditions or circumstances on which any such statement is based. Use of Non-GAAP Financial Measures In evaluating its business, Gentherm Incorporated considers and uses Adjusted EBITDA as a supplemental measure of its operating performance. The Company defines Adjusted EBITDA as earnings before interest, taxes, depreciation and amortization, deferred financing cost amortization, transaction expenses, debt retirement expenses, unrealized currency gain or loss and unrealized revaluation of derivatives. Management believes that Adjusted EBITDA is a meaningful measure of liquidity and the Company's ability to service debt because it provides a measure of cash available for such purposes. Management provides an Adjusted EBITDA measure so that investors will have the same financial information that management uses with the belief that it will assist investors in properly assessing the Company's performance on a period-over-period basis. The term Adjusted EBITDA is not defined under GAAP, and is not a measure of operating income, operating performance or liquidity presented in accordance with GAAP. Adjusted EBITDA has limitations as an analytical tool, and when assessing the Company's operating performance, investors should not consider Adjusted EBITDA in isolation, or as a substitute for net income or other consolidated income statement data prepared in accordance with GAAP. Gentherm compensates for these limitations by relying primarily on its GAAP results and using Adjusted EBITDA only supplementally.
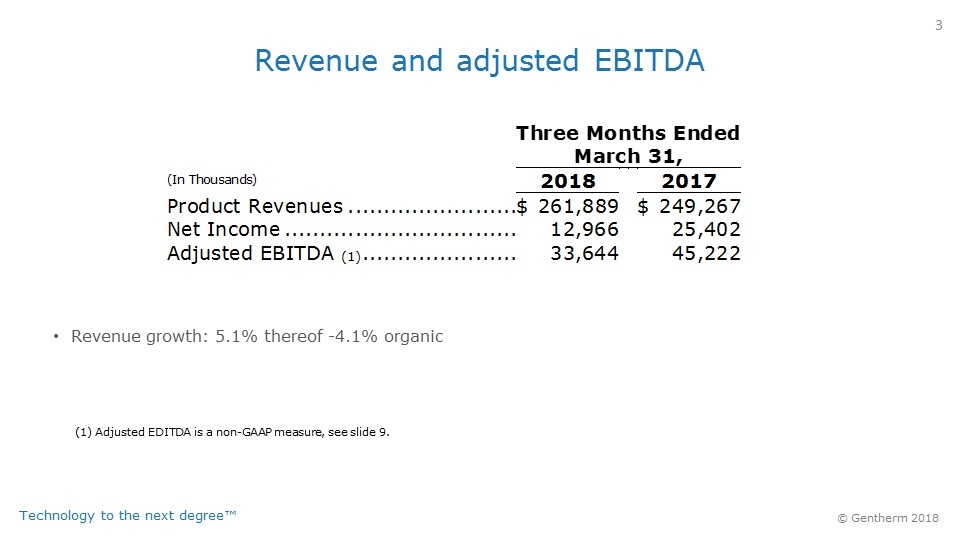
Revenue and adjusted EBITDA (1) Adjusted EDITDA is a non-GAAP measure, see slide 9. Revenue growth: 5.1% thereof -4.1% organic
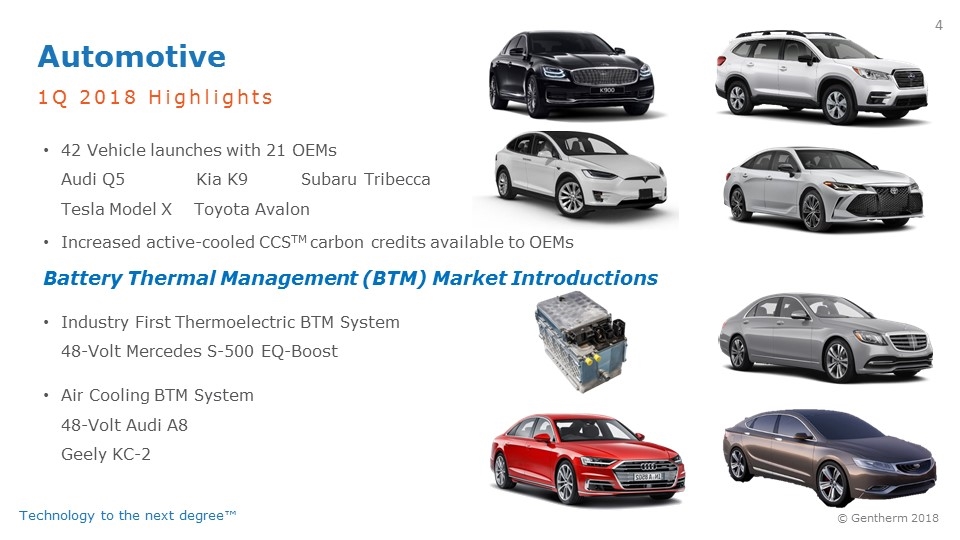
Automotive 1Q 2018 Highlights 42 Vehicle launches with 21 OEMs Audi Q5 Kia K9Subaru Tribecca Tesla Model X Toyota Avalon Increased active-cooled CCSTM carbon credits available to OEMs Battery Thermal Management (BTM) Market Introductions Industry First Thermoelectric BTM System 48-Volt Mercedes S-500 EQ-Boost Air Cooling BTM System 48-Volt Audi A8 Geely KC-2
Automotive 1Q 2018 AWARDS Over $375M in new awards across 14 customers Additional seat thermal comfort award from General Motors further strengthening strategic partnership Multiple CCSTM awards Acura RDX Jaguar E-PACE Lincoln MKC Genesis Kia ON Proprietary Intelligent Positioning System (IPSTM) award for Memory Seat Module from Ford Two follow-on awards for Air Cooling Battery Thermal Management applications with Geely
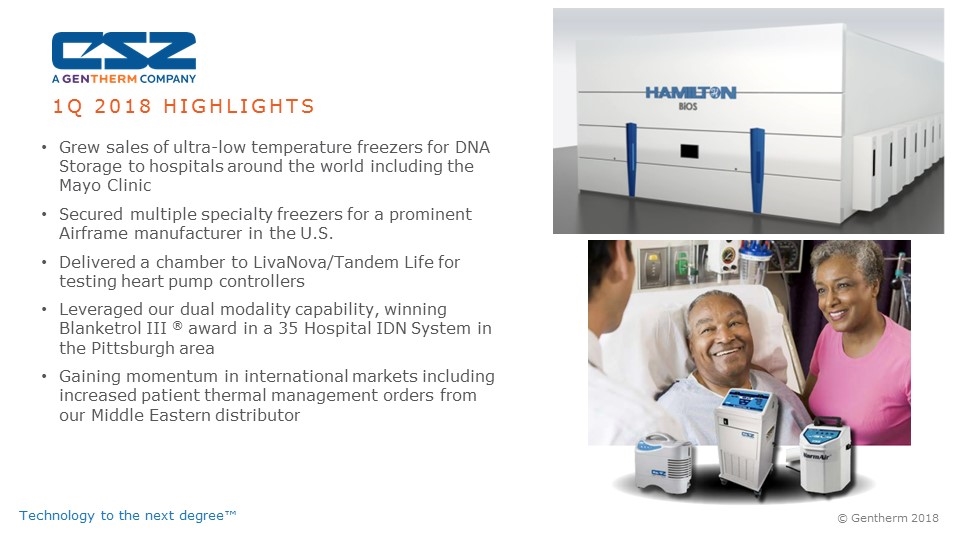
1Q 2018 HIGHLIGHTS Grew sales of ultra-low temperature freezers for DNA Storage to hospitals around the world including the Mayo Clinic Secured multiple specialty freezers for a prominent Airframe manufacturer in the U.S. Delivered a chamber to LivaNova/Tandem Life for testing heart pump controllers Leveraged our dual modality capability, winning Blanketrol III ® award in a 35 Hospital IDN System in the Pittsburgh area Gaining momentum in international markets including increased patient thermal management orders from our Middle Eastern distributor
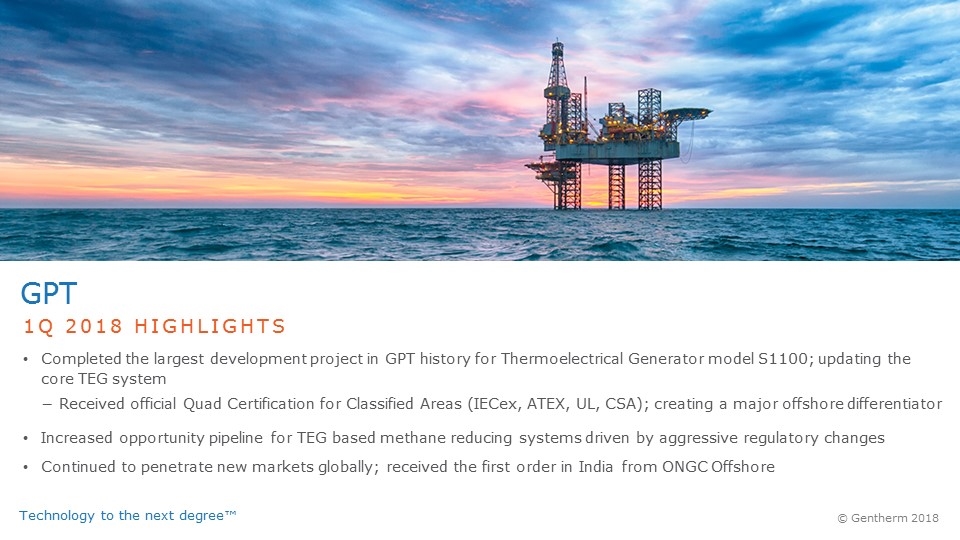
GPT Completed the largest development project in GPT history for Thermoelectrical Generator model S1100; updating the core TEG system Received official Quad Certification for Classified Areas (IECex, ATEX, UL, CSA); creating a major offshore differentiator Increased opportunity pipeline for TEG based methane reducing systems driven by aggressive regulatory changes Continued to penetrate new markets globally; received the first order in India from ONGC Offshore 1Q 2018 HIGHLIGHTS
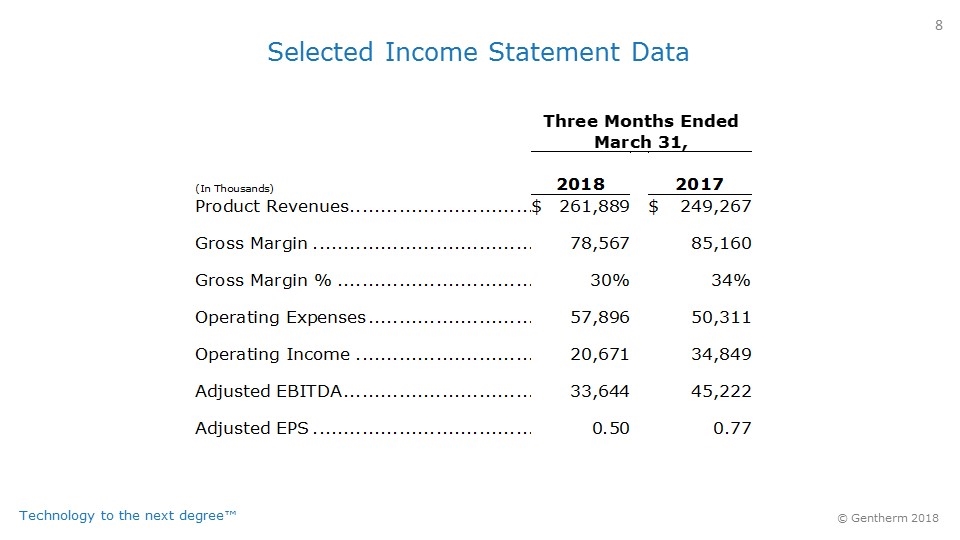
Selected Income Statement Data
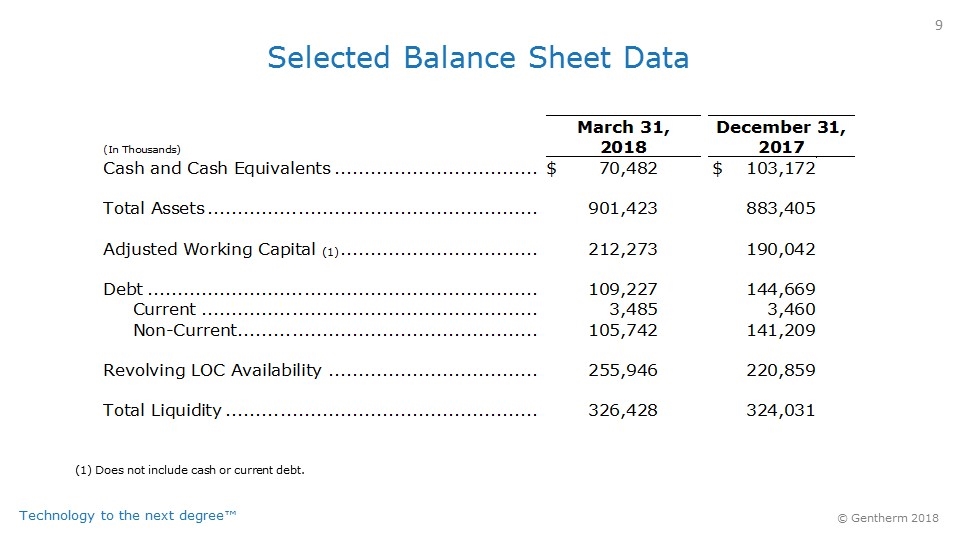
Selected Balance Sheet Data (1) Does not include cash or current debt.
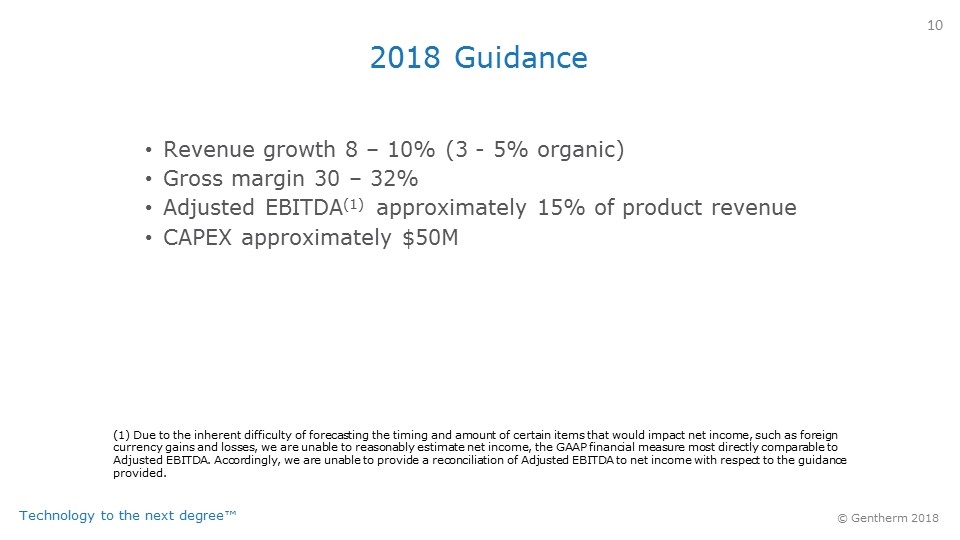
2018 Guidance Revenue growth 8 – 10% (3 - 5% organic) Gross margin 30 – 32% Adjusted EBITDA(1) approximately 15% of product revenue CAPEX approximately $50M (1) Due to the inherent difficulty of forecasting the timing and amount of certain items that would impact net income, such as foreign currency gains and losses, we are unable to reasonably estimate net income, the GAAP financial measure most directly comparable to Adjusted EBITDA. Accordingly, we are unable to provide a reconciliation of Adjusted EBITDA to net income with respect to the guidance provided.
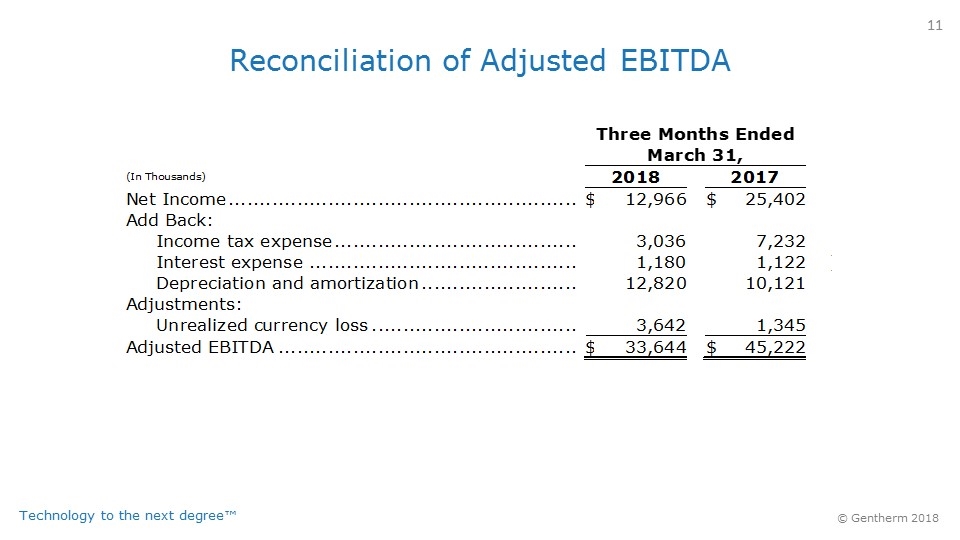
Reconciliation of Adjusted EBITDA
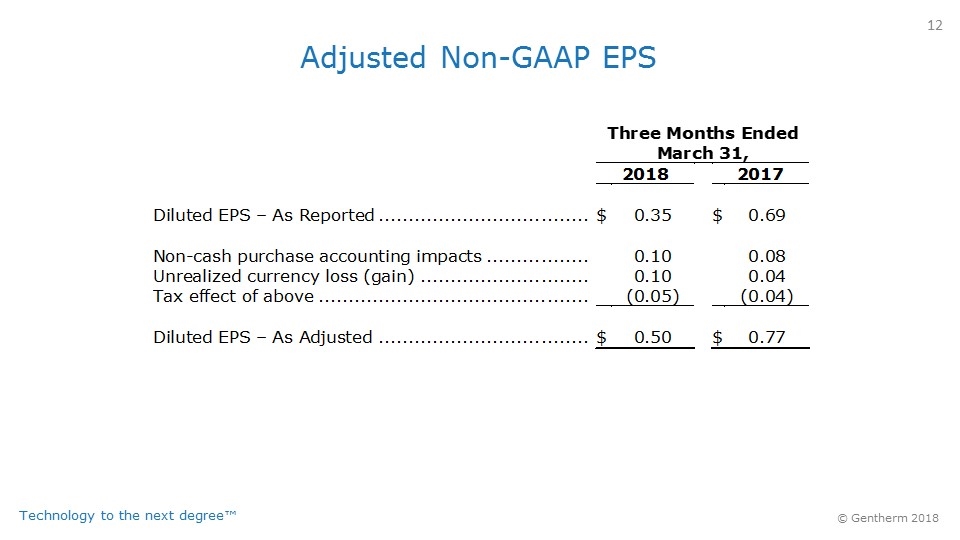
Adjusted Non-GAAP EPS
