Attached files
| file | filename |
|---|---|
| EX-99.1 - PRESS RELEASE - FRANKLIN RESOURCES INC | exhibit991q2fy18.htm |
| 8-K - FORM 8-K - FRANKLIN RESOURCES INC | form8kq2fy18.htm |
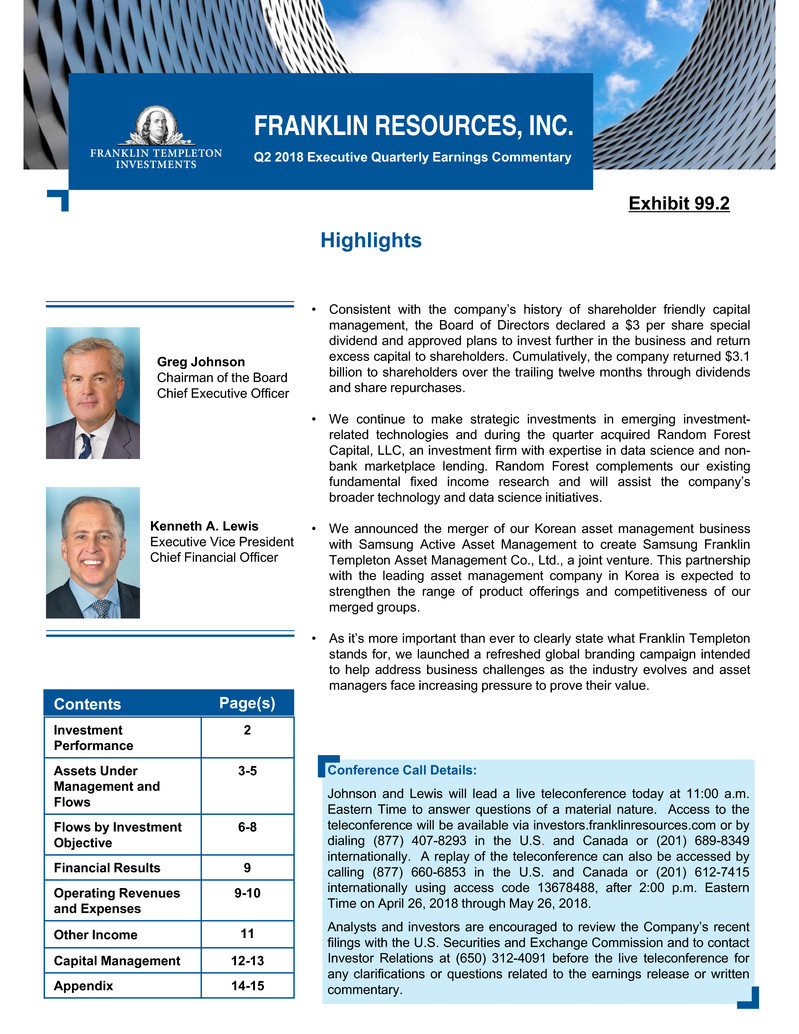
• Consistent with the company’s history of shareholder friendly capital
management, the Board of Directors declared a $3 per share special
dividend and approved plans to invest further in the business and return
excess capital to shareholders. Cumulatively, the company returned $3.1
billion to shareholders over the trailing twelve months through dividends
and share repurchases.
• We continue to make strategic investments in emerging investment-
related technologies and during the quarter acquired Random Forest
Capital, LLC, an investment firm with expertise in data science and non-
bank marketplace lending. Random Forest complements our existing
fundamental fixed income research and will assist the company’s
broader technology and data science initiatives.
• We announced the merger of our Korean asset management business
with Samsung Active Asset Management to create Samsung Franklin
Templeton Asset Management Co., Ltd., a joint venture. This partnership
with the leading asset management company in Korea is expected to
strengthen the range of product offerings and competitiveness of our
merged groups.
• As it’s more important than ever to clearly state what Franklin Templeton
stands for, we launched a refreshed global branding campaign intended
to help address business challenges as the industry evolves and asset
managers face increasing pressure to prove their value.
FRANKLIN RESOURCES, INC.
Q2 2018 Executive Quarterly Earnings Commentary
Highlights
Investment
Performance
2
Assets Under
Management and
Flows
3-5
Flows by Investment
Objective
6-8
Financial Results 9
Operating Revenues
and Expenses
9-10
Other Income 11
Capital Management 12-13
Appendix 14-15
Greg Johnson
Chairman of the Board
Chief Executive Officer
Kenneth A. Lewis
Executive Vice President
Chief Financial Officer
Contents Page(s)
Conference Call Details:
Johnson and Lewis will lead a live teleconference today at 11:00 a.m.
Eastern Time to answer questions of a material nature. Access to the
teleconference will be available via investors.franklinresources.com or by
dialing (877) 407-8293 in the U.S. and Canada or (201) 689-8349
internationally. A replay of the teleconference can also be accessed by
calling (877) 660-6853 in the U.S. and Canada or (201) 612-7415
internationally using access code 13678488, after 2:00 p.m. Eastern
Time on April 26, 2018 through May 26, 2018.
Analysts and investors are encouraged to review the Company’s recent
filings with the U.S. Securities and Exchange Commission and to contact
Investor Relations at (650) 312-4091 before the live teleconference for
any clarifications or questions related to the earnings release or written
commentary.
Exhibit 99.2

Q2 2018 Executive Commentary
Unaudited
Investment Performance
Several of our U.S. equity funds, particularly growth strategies, remain standouts with a majority of assets under
management of the Franklin equity group outperforming their peer groups over the 3-, 5- and 10-year periods.
Aggregate performance reflects the value discipline of much of our product offerings, and cyclically our investment
teams are well positioned, but this period of domestic growth and passive outperformance has also catalyzed some
fundamental enhancement to our investment and risk management process, new product development, and influenced
our acquisition strategy.
2
Percentage of Total Long-Term Assets ($476 billion) in the Top Two Peer Group Quartiles1
1. See note on page 16
2. See note on page 16
Greg Johnson, Chairman and CEO
3-Year 5-Year 10-Year
Equity & Multi-Asset/Balanced- $281 billion
Fixed Income - $195 billion
1-Year
51%
35% 77%25%12%
13% 28% 25%
10% 21% 76%
77%
MSCI WORLD VALUE INDEX VS. MSCI WORLD GROWTH INDEX
Rolling 10-Year Annualized Excess Return²
12/31/1984–12/31/2017
Relative investment performance trends
for our U.S. and cross-border mutual funds
were mixed, with most trailing 3-year and
10-year aggregates improving modestly,
while the 1-year and 5-year continued to
be challenged.
Assets Under Management and Flows
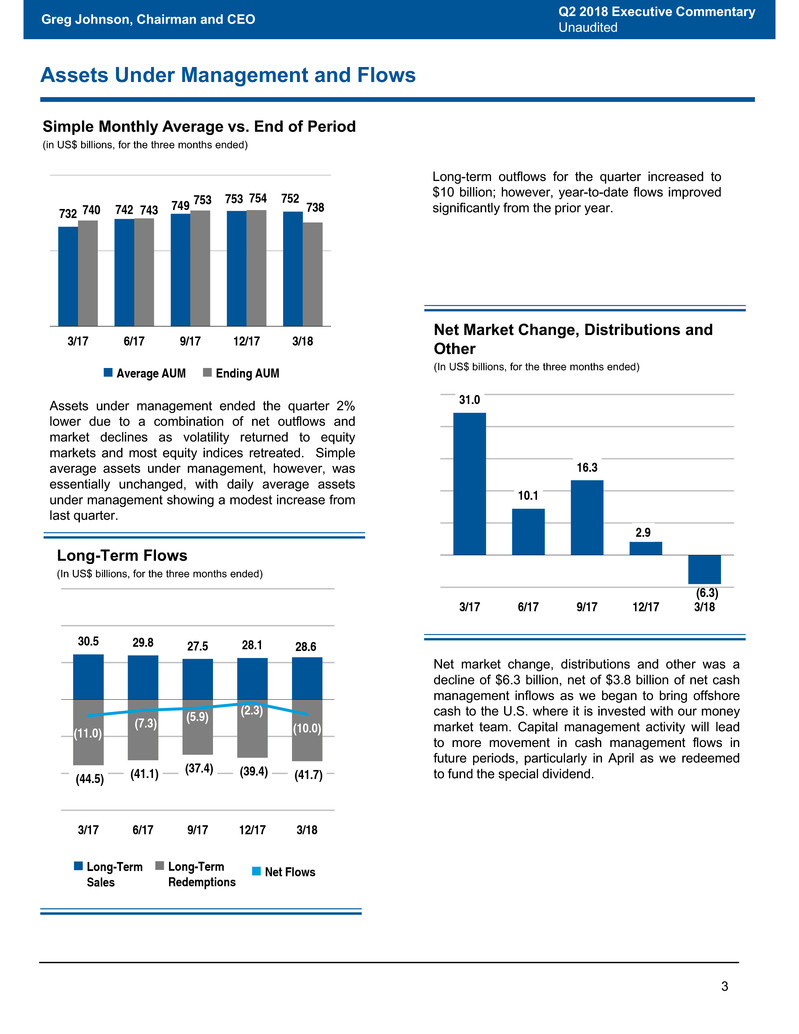
Long-term outflows for the quarter increased to
$10 billion; however, year-to-date flows improved
significantly from the prior year.
3
Simple Monthly Average vs. End of Period
(in US$ billions, for the three months ended)
732 742 749
753 752740 743 753 754 738
3/17 6/17 9/17 12/17 3/18
Average AUM Ending AUM
Greg Johnson, Chairman and CEO
Net Market Change, Distributions and
Other
(In US$ billions, for the three months ended)
Long-Term Flows
(In US$ billions, for the three months ended)
30.5 29.8 27.5 28.1 28.6
(44.5) (41.1) (37.4) (39.4) (41.7)
(11.0) (7.3)
(5.9) (2.3) (10.0)
3/17 6/17 9/17 12/17 3/18
Assets under management ended the quarter 2%
lower due to a combination of net outflows and
market declines as volatility returned to equity
markets and most equity indices retreated. Simple
average assets under management, however, was
essentially unchanged, with daily average assets
under management showing a modest increase from
last quarter.
Long-Term
Sales
Long-Term
Redemptions Net Flows
Q2 2018 Executive Commentary
Unaudited
31.0
10.1
16.3
2.9
(6.3)
3/17 6/17 9/17 12/17 3/18
Net market change, distributions and other was a
decline of $6.3 billion, net of $3.8 billion of net cash
management inflows as we began to bring offshore
cash to the U.S. where it is invested with our money
market team. Capital management activity will lead
to more movement in cash management flows in
future periods, particularly in April as we redeemed
to fund the special dividend.

12.4 11.6 9.6 8.9 10.3
(20.7)
(17.1) (16.0) (17.4) (18.4)
(6.1)
(2.4) (3.2)
(0.6)
(6.2)
3/17 6/17 9/17 12/17 3/18
Internationally, retail net flows turned slightly
negative this quarter. Sales remained unchanged,
but we did see a 14% increase in redemptions. This
was mostly attributed to an uptick in net outflows for
a couple of large SICAV bond funds, particularly in
the Asia Pacific and Europe regions. On the ETF
front, we continued to strengthen our presence in
Europe by listing five existing UCITs ETFs on
additional European exchanges, and expanding the
platform in Canada.
4
Greg Johnson, Chairman and CEO
Long-Term
Sales
Long-Term
Redemptions Net Flows
International flows for our institutional business
remained relatively steady as lower redemptions were
met with moderating sales. This is a notable
improvement from early 2017 since we are seeing
improvement in redemptions activity and sizeable new
account funding.
Q2 2018 Executive Commentary
Unaudited
Retail
Institutional Long-Term Sales
Long-Term
Redemptions Net Flows
Long-Term Flows: International¹
(In US$ billions, for the three months ended)
12.0 12.5 12.4 11.6 11.6
(11.6) (11.3) (11.2) (11.8) (13.4)
1.0 2.1 2.0 0.6
(0.9)
3/17 6/17 9/17 12/17 3/18
1. Graphs do not include high net-worth client flows.
Long-Term Flows: United States¹
(In US$ billions, for the three months ended)
Retail
Domestically, U.S. retail outflows accounted for the bulk
of the firm-wide outflows this quarter. Much of the nearly
16% increase in sales this quarter was offset by higher
redemption activity. We continue to make progress on
our multi-year strategic initiative to address the shift in
the U.S. distribution landscape by realigning our
structure and adding new resources, while increasingly
leveraging data analytics to better position ourselves for
growth.
Long-Term
Sales
Long-Term
Redemptions Net Flows
2.9 2.4 3.2
4.6
3.4
(6.0) (6.3)
(3.5)
(5.0) (4.3)
(2.9) (3.9)
(0.3) (0.3) (0.6)
3/17 6/17 9/17 12/17 3/18

5
Greg Johnson, Chairman and CEO
Long-Term
Sales
Long-Term
Redemptions Net Flows
Q2 2018 Executive Commentary
Unaudited
1. Graphs do not include high net-worth client flows.
Institutional
U.S. institutional also remained in outflows, but at
lower levels than we experienced last year. The
pipeline for new business remains healthy and we’ve
undertaken a significant client outreach program to
address at risk assets.
Long-Term Flows: United States¹
(In US$ billions, for the three months ended)
2.9 2.5 2.0 2.5 2.8
(5.8) (5.6) (5.9)
(4.8) (5.0)
(2.9) (3.1) (3.9)
(2.1) (2.2)
3/17 6/17 9/17 12/17 3/18
Flows by Investment Objective
6
1. Sales and redemptions as a percentage of beginning assets under management are annualized.
Global/International Equity
Net Flows Long-Term
Sales
Long-Term
Redemptions
(in US$ billions, for the three months ended)
6.9 6.5 5.4 5.9 6.6
(13.8) (12.9) (11.0) (11.6) (11.6)
(6.7) (6.2) (5.0)
(3.6) (4.5)
3/17 6/17 9/17 12/17 3/18
Global/International Fixed Income
(in US$ billions, for the three months ended)
9.0 11.2 11.9 11.1 10.3
(11.6) (9.5) (9.0) (10.2) (11.0)
(2.0)
2.6 3.8 1.8 0.1
3/17 6/17 9/17 12/17 3/18
Net Flows Long-Term
Sales
Long-Term
Redemptions
Greg Johnson, Chairman and CEO
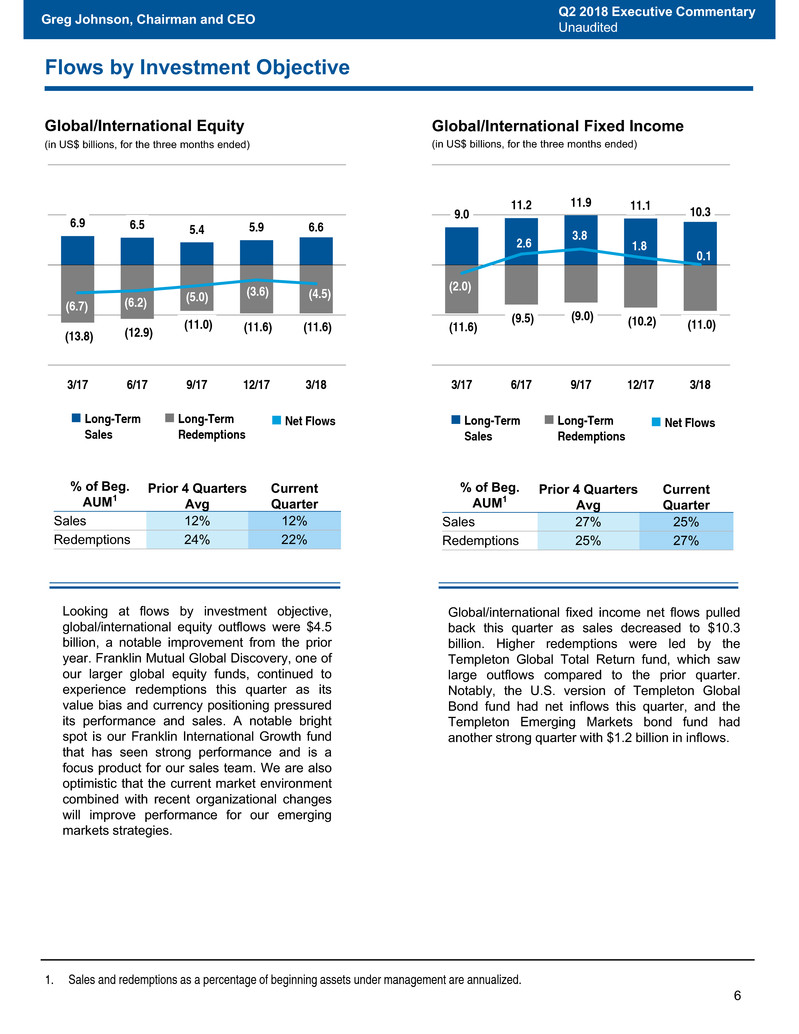
Global/international fixed income net flows pulled
back this quarter as sales decreased to $10.3
billion. Higher redemptions were led by the
Templeton Global Total Return fund, which saw
large outflows compared to the prior quarter.
Notably, the U.S. version of Templeton Global
Bond fund had net inflows this quarter, and the
Templeton Emerging Markets bond fund had
another strong quarter with $1.2 billion in inflows.
Q2 2018 Executive Commentary
Unaudited
Looking at flows by investment objective,
global/international equity outflows were $4.5
billion, a notable improvement from the prior
year. Franklin Mutual Global Discovery, one of
our larger global equity funds, continued to
experience redemptions this quarter as its
value bias and currency positioning pressured
its performance and sales. A notable bright
spot is our Franklin International Growth fund
that has seen strong performance and is a
focus product for our sales team. We are also
optimistic that the current market environment
combined with recent organizational changes
will improve performance for our emerging
markets strategies.
% of Beg.
AUM1
Prior 4 Quarters
Avg
Current
Quarter
Sales 12% 12%
Redemptions 24% 22%
% of Beg.
AUM1
Prior 4 Quarters
Avg
Current
Quarter
Sales 27% 25%
Redemptions 25% 27%
7
Multi-Asset/Balanced
(In US$ billions, for the three months ended)
4.2 4.6 4.0 3.5 4.0
(6.0) (6.8) (6.2) (5.8) (6.3)
(0.5) (0.6) (1.1) (0.5) (1.1)
3/17 6/17 9/17 12/17 3/18
U.S. Equity
(in US$ billions, for the three months ended)
4.3 3.6 3.1 3.6 4.1
(6.4) (5.9) (5.6) (5.5) (6.7)
(1.9) (1.9) (1.8)
1.5
(2.5)
3/17 6/17 9/17 12/17 3/18
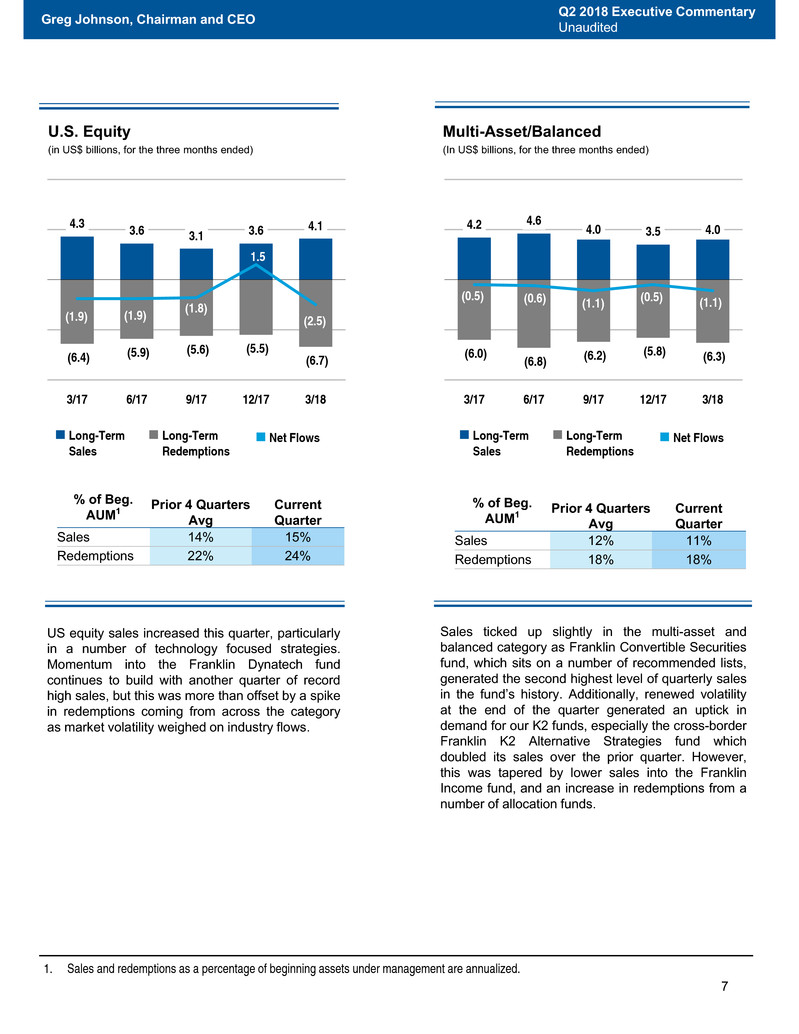
US equity sales increased this quarter, particularly
in a number of technology focused strategies.
Momentum into the Franklin Dynatech fund
continues to build with another quarter of record
high sales, but this was more than offset by a spike
in redemptions coming from across the category
as market volatility weighed on industry flows.
Net Flows Long-Term
Sales
Long-Term
Redemptions
Net Flows Long-Term
Sales
Long-Term
Redemptions
Sales ticked up slightly in the multi-asset and
balanced category as Franklin Convertible Securities
fund, which sits on a number of recommended lists,
generated the second highest level of quarterly sales
in the fund’s history. Additionally, renewed volatility
at the end of the quarter generated an uptick in
demand for our K2 funds, especially the cross-border
Franklin K2 Alternative Strategies fund which
doubled its sales over the prior quarter. However,
this was tapered by lower sales into the Franklin
Income fund, and an increase in redemptions from a
number of allocation funds.
Greg Johnson, Chairman and CEO
1. Sales and redemptions as a percentage of beginning assets under management are annualized.
Q2 2018 Executive Commentary
Unaudited
% of Beg.
AUM1 Prior 4 Quarters Avg
Current
Quarter
Sales 14% 15%
Redemptions 22% 24%
% of Beg.
AUM1 Prior 4 Quarters Avg
Current
Quarter
Sales 12% 11%
Redemptions 18% 18%

4.2
2.2 1.5
2.5
1.9
(3.9)
(3.1) (3.4) (3.1) (3.0)
0.5
(0.5)
(1.7)
(0.1) (0.9)
3/17 6/17 9/17 12/17 3/18
8
Taxable U.S. Fixed Income
(In US$ billions, for the three months ended)
Taxable U.S. fixed income remained in outflows
overall, but we did see improved flow trends in many
products.
Net Flows Long-Term
Sales
Long-Term
Redemptions
Tax-Free Fixed Income
(In US$ billions, for the three months ended)
1.9 1.7 1.6 1.5 1.7
(2.8) (2.9) (2.2) (3.2) (3.1)
(0.4) (0.7) (0.1)
(1.4) (1.1)
3/17 6/17 9/17 12/17 3/18
Our tax-free funds sales rebounded slightly after five
straight quarters of decline, boosted by a strong
January. Market conditions seem to be shifting in a
way that favors our funds’ positioning, and going
forward, we believe performance will be driven
largely by technical factors, such as rising interest
rates.
Net Flows Long-Term
Sales
Long-Term
Redemptions
Greg Johnson, Chairman and CEO
1. Sales and redemptions as a percentage of beginning assets under management are annualized.
Q2 2018 Executive Commentary
Unaudited
% of Beg.
AUM1 Prior 4 Quarters Avg
Current
Quarter
Sales 9% 10%
Redemptions 16% 18%
% of Beg.
AUM1 Prior 4 Quarters Avg
Current
Quarter
Sales 20% 15%
Redemptions 26% 24%

Mar-18 Dec-17 Mar-18 vs. Dec-17 Sep-17 Jun-17 Mar-17
Mar-18 vs.
Mar-17
Investment management fees $ 1,117.1 $ 1,113.6 0% $ 1,109.8 $ 1,097.0 $ 1,089.2 3%
Sales and distribution fees 409.8 417.8 (2%) 421.8 433.3 431.2 (5%)
Shareholder servicing fees 61.3 54.9 12% 56.0 56.7 56.4 9%
Other 29.6 29.2 1% 29.3 26.9 23.8 24%
Total Operating Revenues $ 1,617.8 $ 1,615.5 0% $ 1,616.9 $ 1,613.9 $ 1,600.6 1%
$0.74 $0.73 $0.76
$(1.06)
$0.78
3/17 6/17 9/17 12/17 3/18
556 564 558 581 556
421 411 425
(583)
443
3/17 6/17 9/17 12/17 3/18
Financial Results
9
(in US$ millions, except per share data, for the three months ended)
Overall, our second quarter financial results were in line with previous quarters. Operating income was $556 million, a bit
lower than the first quarter, due mostly to normal seasonal factors, and flat versus the year ago period.
Net income, on the other hand, increased 5% from the prior year due to lower tax expense. Quarter over quarter, net
income improved significantly following the large tax charge that we took in the December quarter.
Earnings per share were $0.78.
1. Net income (loss) attributable to Franklin Resources, Inc.
Ken Lewis, CFO Q2 2018 Executive CommentaryUnaudited
(In US$ millions, for the three months ended)
Total revenue for the quarter was $1.6 billion, essentially flat versus the prior quarter, and an increase of 1% over the
prior year.
Investment management fees increased marginally, reflecting higher daily average assets under management and
periodic revenue sources, including $6.9 million of performance fees, which more than offset the impact of a shorter
quarter.
Sales and distribution fees were down 2% as a result of the shorter quarter and lower assets subject to asset-based fees.
Shareholder servicing fees increased to $61 million due to the seasonal increase in end of year transactions. As a
reminder, last quarter our U.S. transfer agent adopted a new fee structure that is determined by a combination of assets
under management and transaction volume. While the new structure will increase quarterly volatility, we expect the
annual revenue amounts to be comparable with last year.
Operating and Net Income (Loss)1 Diluted Earnings (Loss) Per Share
Operating Income Net Income (Loss) 1
Operating Revenues and Expenses

10
Operating expenses increased 3% this quarter.
Sales, distribution and marketing expenses were lower by 1%, as the same factors impacting the related revenue were
partially offset by higher amortization of deferred sales commissions.
Compensation and benefits expense increased 7%, within the range we expected, due to a variety of factors, including
the normal seasonal impact of items such as payroll taxes and annual merit increases, as well as increased severance
expense associated with the new Korea joint venture.
Information systems and technology expense increased to $58 million, a 6% increase from the prior quarter, and
occupancy expense increased 16% to $34 million. Most of the increase in occupancy expense was due to a one-time
charge of $4 million related to an asset valuation. General, administrative and other expense increased 5% to $93 million.
We’ve committed to funding a number of key growth opportunities and innovative ideas in recent years. In 2018 the focus
is on bolstering our U.S. retail distribution—adding staff to focus on key channels and products lines— targeted
international growth in a number of countries, expansion of our ETF platform, and enhancement of our solutions and
institutional businesses. Additionally, we are increasing our advertising and promotion globally and investing to enhance
our technology infrastructure. Factoring into account those investments and the acquisitions of Edinburgh Partners that is
expected to close on May 1st, Random Forest and our Korean joint venture, our current forecast of expense growth,
excluding sales and distribution expense, for the full year is in the range of 6.5% to 7.5%.There are a number of moving
parts, but we currently forecast that full year compensation expense will increase in the range of 4.5% to 5.0%, with third
quarter expense increasing modestly before declining into year end.
Ken Lewis, CFO Q2 2018 Executive CommentaryUnaudited
Operating Margin (%) vs. Average AUM
(in US$ billions, for the fiscal year ended)
605
442
571
694 706
808
888 870
749 737 752
34.8%
28.7%
33.5%
37.3%
35.4%
36.6% 37.9% 38.1% 35.7% 35.4% 35.2%
09/08 09/09 09/10 09/11 09/12 09/13 09/14 09/15 09/16 09/17 FYTD
03/18
2,099 1,203 1,959 2,660 2,515 2,921 3,221 3,028 2,366 2,264 1,137
Fiscal Year
Operating Income
(in US$ millions)
Average AUM━Operating Margin
Average AUM:
2.2% CAGR
Operating
Income1:
0.8% CAGR
1. Fiscal year-to-date operating income is annualized for CAGR calculation. CAGR is the compound average annual growth rate over the
trailing 10-year period.
Mar-18 Dec-17 Mar-18 vs. Dec-17 Sep-17 Jun-17 Mar-17
Mar-18 vs.
Mar-17
Sales, distribution and marketing $ 521.5 $ 528.7 (1%) $ 534.9 $ 541.2 $ 534.8 (2%)
Compensation and benefits 355.5 332.5 7% 336.1 342.7 343.4 4%
Information systems and technology 58.1 55.0 6% 60.0 54.1 54.0 8%
Occupancy 34.1 29.4 16% 33.0 30.2 29.0 18%
General, administrative and other 92.9 88.8 5% 95.2 81.5 83.9 11%
Total Operating Expenses $ 1,062.1 $ 1,034.4 3% $ 1,059.2 $ 1,049.7 $ 1,045.1 2%
Although we have invested in a number of new initiatives in recent years, expense discipline remains a core part of our
DNA. Next year will be a time for us to assess these investments and either cull those that aren’t working, or look for
ways to reduce expenses of legacy businesses such that expense growth approximates the rate of inflation in future
years.

34.4
10.7
1.7 1.8
(10.0) 0.2
38.6
77.4
(27.3)
50.1
Interest and
dividend
income
Equity method
investments
Available-for-
sale
investments
Trading
investments
Interest
expense
Foreign
exchange and
other
Consolidated
Investment
Products (CIPs)
Total other
income
Noncontrolling
interests¹
Other income,
net of
noncontrolling
interests
11
Other Income
Ken Lewis, CFO
Other Income
(In US$ millions, for the three months ended March 31, 2018)
1. Reflects the portion of noncontrolling interests, attributable to third-party investors, related to CIPs included in Other income.
Other income, net of noncontrolling interests was $50 million, a decrease from the prior quarter due to lower gains from
equity method investments.
The effective tax rate for the quarter was slightly below the 24% to 25% range we forecasted due to discrete items. The
forecast for the remainder of the fiscal year remains the same.
Q2 2018 Executive Commentary
Unaudited

12
1. U.S. asset managers include AB, AMG, APAM, APO, ARES, BLK, BSIG, BX, CG, CNS, EV, FIG, FII, GBL, HLNE, IVZ, KKR, LM, MN, OAK, OZM,
PZN, TROW, VRTS, WDR and WETF. Source: Thomson Reuters and company reports.
BEN U.S. Asset Managers Average (ex-BEN)1
Change in Ending Shares Outstanding
U.S. Asset
Managers (ex-
BEN)1: 2.0%
Compound
Annual Dilution
BEN: 3.2%
Compound
Annual Accretion
Capital Management
Ken Lewis, CFO
-20%
-15%
-10%
-5%
0%
5%
10%
15%
20%
3/13 9/13 3/14 9/14 3/15 9/15 3/16 9/16 3/17 9/17 3/18
433
200168175167
262256
327337404
500
218190151178129179137
265
105
23
$0
$10
$20
$30
$40
$50
$60
3/189/173/179/163/169/153/159/143/149/133/13
Special Cash
Dividends per
Share Declared:
Feb-18: $3.00
Dec-14: $0.50
Share Repurchases (US$ millions) vs. Average BEN Price
BEN Average Price for the Period Special Cash Dividend DeclaredShare Repurchase Amount
Capital management remains an important area of focus for us and our fellow investors, and while changes to tax laws
have certainly enhanced our flexibility, our long-term track record of shareholder friendly capital management will not
change.
In mid-February the company's Board of Directors took the initial step of declaring a $3.00 per share special dividend, in
addition to the regular quarterly dividend that was increased 15% in December. At that time, we also stated that we plan
to allocate capital to share repurchases, mergers and acquisitions, retirement of outstanding debt, and additional
investments in the business.
Consistent with that message, we accelerated our stock repurchase activity this quarter, buying back 11.1 million
shares at a total cost of $433 million. At its most recent meeting, the Board of Directors authorized the company to
repurchase an additional 80 million shares. It is important to clarify a couple of points. First, while many factors such as
nominal price, valuation and buyable volume (which increased materially this quarter) influence the pace of open market
repurchases, this was only a partial quarter of accelerated repurchases. Second, this additional share authorization
does not impair our ability to pursue strategic acquisitions.
Q2 2018 Executive Commentary
Unaudited
24% 25% 26% NM
NM57% 49% 45% NM
NM
1,444 1,300 1,220 1,173
3,085
3/17 6/17 9/17 12/17 3/18
13
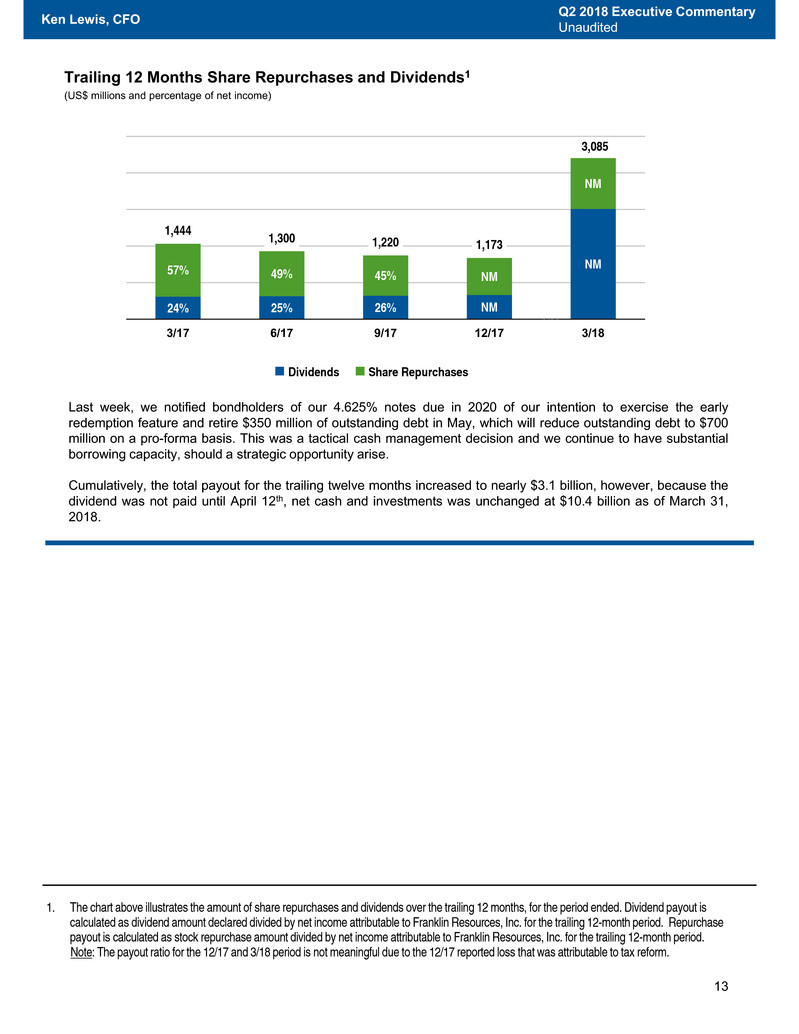
1. The chart above illustrates the amount of share repurchases and dividends over the trailing 12 months, for the period ended. Dividend payout is
calculated as dividend amount declared divided by net income attributable to Franklin Resources, Inc. for the trailing 12-month period. Repurchase
payout is calculated as stock repurchase amount divided by net income attributable to Franklin Resources, Inc. for the trailing 12-month period.
Note: The payout ratio for the 12/17 and 3/18 period is not meaningful due to the 12/17 reported loss that was attributable to tax reform.
Trailing 12 Months Share Repurchases and Dividends1
(US$ millions and percentage of net income)
Dividends Share Repurchases
Ken Lewis, CFO Q2 2018 Executive CommentaryUnaudited
NM
Last week, we notified bondholders of our 4.625% notes due in 2020 of our intention to exercise the early
redemption feature and retire $350 million of outstanding debt in May, which will reduce outstanding debt to $700
million on a pro-forma basis. This was a tactical cash management decision and we continue to have substantial
borrowing capacity, should a strategic opportunity arise.
Cumulatively, the total payout for the trailing twelve months increased to nearly $3.1 billion, however, because the
dividend was not paid until April 12th, net cash and investments was unchanged at $10.4 billion as of March 31,
2018.

66%
15%
13%
4%
2%
42%
19%
38%
1%
141. Net cash and investments consist of Franklin Resources, Inc. cash and investments (including only direct investments in CIPs), net of debt,
deposits (in FY 2014).
Net Cash and Investments1 (US$ billions)
Appendix
Net Cash and Investments¹
Ken Lewis, CFO
Investment Objective
(US$ billions)
Sales Region
(US$ billions)
Mix of Ending Assets Under Management
(as of March 31, 2018)
Q2 2018 Executive Commentary
Unaudited
9.2 9.6 9.7
10.4 10.4
FYE-9/14 FYE-9/15 FYE-9/16 FYE-9/17 3/18
Mar-18
Equity $ 309.3
Multi Asset/Balanced 137.6
Fixed Income 280.2
Cash Management 10.4
Total $ 737.5
Mar-18
United States $ 484.9
Europe, the Middle East
and Africa 108.7
Asia-Pacific 95.9
Canada 30.2
Latin America 17.8
Total $ 737.5

15
Appendix (continued)
Sales and Distribution Summary
(in US$ millions, for the three months ended)
CIPs Related Adjustments
(in US$ millions, for the three and six months ended)
This table summarizes the
impact of CIPs on the
Company’s reported U.S.
GAAP financial results.
Ken Lewis, CFO Q2 2018 Executive CommentaryUnaudited
Mar-18 Dec-17 Change % Change
Asset-based fees $ 331.5 $ 340.8 (9.3) (3%)
Asset-based expenses (431.2) (440.6) 9.4 (2%)
Asset-based fees, net $ (99.7) $ (99.8) $ 0.1 0%
Sales-based fees 73.5 74.3 (0.8) (1%)
Contingent sales charges 4.8 2.7 2.1 78%
Sales-based expenses (68.9) (69.0) 0.1 0%
Sales-based fees, net $ 9.4 $ 8.0 $ 1.4 18%
Amortization of deferred sales commissions (21.4) (19.1) (2.3) 12%
Sales and Distribution Fees, Net $ (111.7) $ (110.9) $ (0.8) 1%
FY
Mar-18 Mar-18
Operating Revenues $ 17.8 $ 32.5
Operating Expenses 4.8 10.8
Operating Income $ 13.0 $ 21.7
Investment Income (9.8) (21.4)
Interest Expense (0.6) (1.3)
CIPs 38.6 54.6
Other Income $ 28.2 $ 31.9
Net Income $ 41.2 $ 53.6
Less: net income attributable to noncontrolling
interests 38.3 49.5
Net Income Attributable to Franklin
Resources, Inc. $ 2.9 $ 4.1

Statements in this commentary regarding Franklin Resources, Inc. (“Franklin”) and its subsidiaries, which are not
historical facts, are "forward-looking statements" within the meaning of the U.S. Private Securities Litigation Reform Act
of 1995. When used in this commentary, words or phrases generally written in the future tense and/or preceded by
words such as “will,” “may,” “could,” “expect,” “believe,” “anticipate,” “intend,” “plan,” “seek,” “estimate” or other similar
words are forward-looking statements. Forward-looking statements involve a number of known and unknown risks,
uncertainties and other important factors, some of which are listed below, that could cause actual results and outcomes
to differ materially from any future results or outcomes expressed or implied by such forward-looking statements. While
forward-looking statements are our best prediction at the time that they are made, you should not rely on them and are
cautioned against doing so. Forward-looking statements are based on our current expectations and assumptions
regarding our business, the economy and other future conditions. Because forward-looking statements relate to the
future, they are subject to inherent uncertainties, risks and changes in circumstances that are difficult to predict. They are
neither statements of historical fact nor guarantees or assurances of future performance.
These and other risks, uncertainties and other important factors are described in more detail in Franklin’s recent filings
with the U.S. Securities and Exchange Commission, including, without limitation, in Risk Factors and Management’s
Discussion and Analysis of Financial Condition and Results of Operations in Franklin’s Annual Report on Form 10-K for
the fiscal year ended September 30, 2017 and Franklin’s subsequent Quarterly Reports on Form 10-Q:
• Volatility and disruption of the capital and credit markets, and adverse changes in the global economy, may
significantly affect our results of operations and may put pressure on our financial results.
• The amount and mix of our assets under management (“AUM”) are subject to significant fluctuations.
• We are subject to extensive, complex, overlapping and frequently changing rules, regulations, policies, and legal
interpretations.
• Global regulatory and legislative actions and reforms have made the regulatory environment in which we operate
more costly and future actions and reforms could adversely impact our financial condition and results of operations.
• Failure to comply with the laws, rules or regulations in any of the jurisdictions in which we operate could result in
substantial harm to our reputation and results of operations.
• Changes in tax laws or exposure to additional income tax liabilities could have a material impact on our financial
condition, results of operations and liquidity.
• Any significant limitation, failure or security breach of our information and cyber security infrastructure, software
applications, technology or other systems that are critical to our operations could disrupt our business and harm our
operations and reputation.
• Our business operations are complex and a failure to properly perform operational tasks or the misrepresentation of
our products and services, or the termination of investment management agreements representing a significant
portion of our AUM, could have an adverse effect on our revenues and income.
• We face risks, and corresponding potential costs and expenses, associated with conducting operations and growing
our business in numerous countries.
16
Forward-Looking Statements
Notes
1. The peer group rankings are sourced from either Lipper, a Thomson Reuters Company or Morningstar, as the case may be, and are based on an
absolute ranking of returns as of March 31, 2018. Lipper rankings for Franklin Templeton U.S.-registered long-term mutual funds are based on
Class A shares and do not include sales charges. Franklin Templeton U.S.-registered long-term funds are compared against a universe of all
share classes. Performance rankings for other share classes may differ. Morningstar rankings for Franklin Templeton cross-border long-term
mutual funds are based on primary share classes and do not include sales charges. Performance rankings for other share classes may differ.
Results may have been different if these or other factors had been considered. The figures in the table are based on data available from Lipper
as of April 6th, 2018 and Morningstar as of April 8th, 2018 and are subject to revision. © 2018 Morningstar, Inc. All Rights Reserved. The
information contained herein: (1) is proprietary to Morningstar and/or its content providers; (2) may not be copied or distributed; and (3) is not
warranted to be accurate, complete or timely. Neither Morningstar nor its content providers are responsible for any damages or losses arising
from any use of this information. Performance quoted above represents past performance, which cannot predict or guarantee future results. All
investments involve risks, including loss of principal.
2. Source: © 2017 Morningstar. Excess return calculated by Franklin Templeton. MSCI World Growth Index rolling 10-year average annual return is
subtracted from the MSCI World Value Index counterpart. Values above 0 represent value outperformance; under 0 represents growth
outperformance. Indexes are unmanaged and one cannot invest directly in an index. Index returns do not reflect any fees, expenses or sales
charges.
17
Investor Relations Contacts
Brian Sevilla
+1 (650) 312‐3326
Forward-Looking Statements (continued)
• We depend on key personnel and our financial performance could be negatively affected by the loss of their services.
• Strong competition from numerous and sometimes larger companies with competing offerings and products could limit
or reduce sales of our products, potentially resulting in a decline in our market share, revenues and income.
• Changes in the third-party distribution and sales channels on which we depend could reduce our income and hinder
our growth.
• Our increasing focus on international markets as a source of investments and sales of our products subjects us to
increased exchange rate and market-specific political, economic or other risks that may adversely impact our revenues
and income generated overseas.
• Harm to our reputation or poor investment performance of our products could reduce the level of our AUM or affect our
sales, and negatively impact our revenues and income.
• Our future results are dependent upon maintaining an appropriate level of expenses, which is subject to fluctuation.
• Our ability to successfully manage and grow our business can be impeded by systems and other technological
limitations.
• Our inability to successfully recover should we experience a disaster or other business continuity problem could cause
material financial loss, loss of human capital, regulatory actions, reputational harm, or legal liability.
• Regulatory and governmental examinations and/or investigations, litigation and the legal risks associated with our
business, could adversely impact our AUM, increase costs and negatively impact our profitability and/or our future
financial results.
• Our ability to meet cash needs depends upon certain factors, including the market value of our assets, operating cash
flows and our perceived creditworthiness.
• We are dependent on the earnings of our subsidiaries.
Any forward-looking statement made by us in this commentary speaks only as of the date on which it is made. Factors or
events that could cause our actual results to differ may emerge from time to time, and it is not possible for us to predict all
of them. We undertake no obligation to publicly update any forward-looking statement, whether as a result of new
information, future developments or otherwise, except as may be required by law.
The information in this commentary is provided solely in connection with this commentary, and is not directed
toward existing or potential investment advisory clients or fund shareholders.
