Attached files
| file | filename |
|---|---|
| 8-K - 8-K - CMS ENERGY CORP | a18-12207_28k.htm |
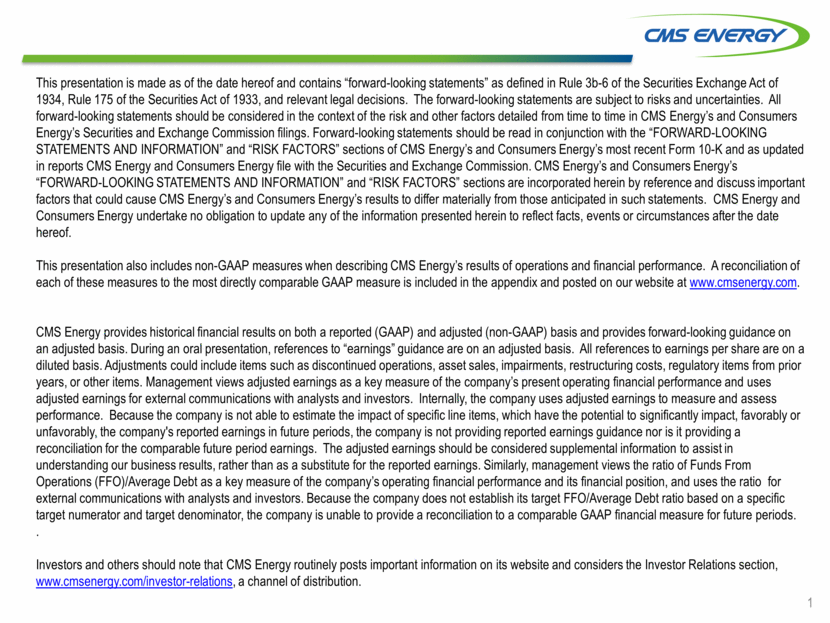
This presentation is made as of the date hereof and contains “forward-looking statements” as defined in Rule 3b-6 of the Securities Exchange Act of 1934, Rule 175 of the Securities Act of 1933, and relevant legal decisions. The forward-looking statements are subject to risks and uncertainties. All forward-looking statements should be considered in the context of the risk and other factors detailed from time to time in CMS Energy’s and Consumers Energy’s Securities and Exchange Commission filings. Forward-looking statements should be read in conjunction with the “FORWARD-LOOKING STATEMENTS AND INFORMATION” and “RISK FACTORS” sections of CMS Energy’s and Consumers Energy’s most recent Form 10-K and as updated in reports CMS Energy and Consumers Energy file with the Securities and Exchange Commission. CMS Energy’s and Consumers Energy’s “FORWARD-LOOKING STATEMENTS AND INFORMATION” and “RISK FACTORS” sections are incorporated herein by reference and discuss important factors that could cause CMS Energy’s and Consumers Energy’s results to differ materially from those anticipated in such statements. CMS Energy and Consumers Energy undertake no obligation to update any of the information presented herein to reflect facts, events or circumstances after the date hereof. This presentation also includes non-GAAP measures when describing CMS Energy’s results of operations and financial performance. A reconciliation of each of these measures to the most directly comparable GAAP measure is included in the appendix and posted on our website at www.cmsenergy.com. CMS Energy provides historical financial results on both a reported (GAAP) and adjusted (non-GAAP) basis and provides forward-looking guidance on an adjusted basis. During an oral presentation, references to “earnings” guidance are on an adjusted basis. All references to earnings per share are on a diluted basis. Adjustments could include items such as discontinued operations, asset sales, impairments, restructuring costs, regulatory items from prior years, or other items. Management views adjusted earnings as a key measure of the company’s present operating financial performance and uses adjusted earnings for external communications with analysts and investors. Internally, the company uses adjusted earnings to measure and assess performance. Because the company is not able to estimate the impact of specific line items, which have the potential to significantly impact, favorably or unfavorably, the company's reported earnings in future periods, the company is not providing reported earnings guidance nor is it providing a reconciliation for the comparable future period earnings. The adjusted earnings should be considered supplemental information to assist in understanding our business results, rather than as a substitute for the reported earnings. Similarly, management views the ratio of Funds From Operations (FFO)/Average Debt as a key measure of the company’s operating financial performance and its financial position, and uses the ratio for external communications with analysts and investors. Because the company does not establish its target FFO/Average Debt ratio based on a specific target numerator and target denominator, the company is unable to provide a reconciliation to a comparable GAAP financial measure for future periods. . Investors and others should note that CMS Energy routinely posts important information on its website and considers the Investor Relations section, www.cmsenergy.com/investor-relations, a channel of distribution. 1
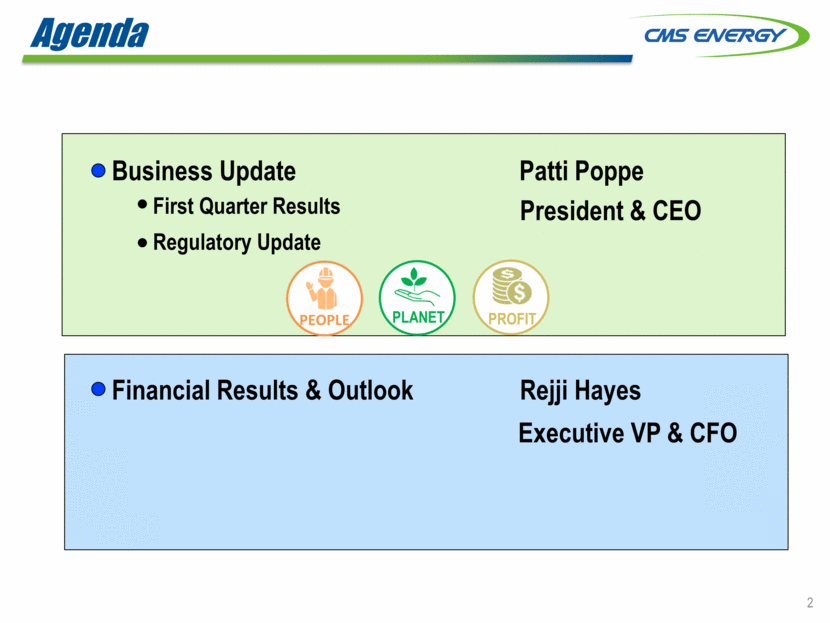
Agenda Business Update Patti Poppe President & CEO Financial Results & Outlook Rejji Hayes First Quarter Results Regulatory Update Executive VP & CFO 2 PROFIT PLANET PEOPLE
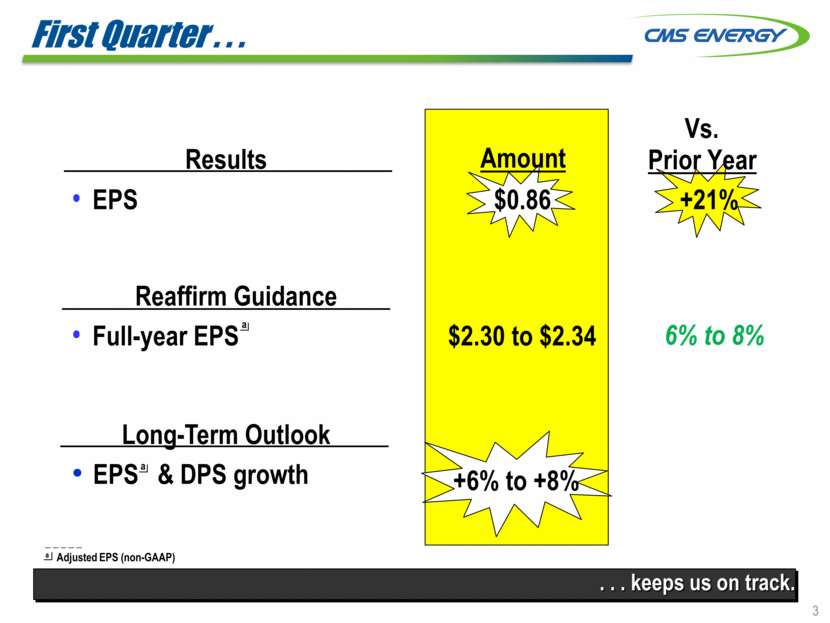
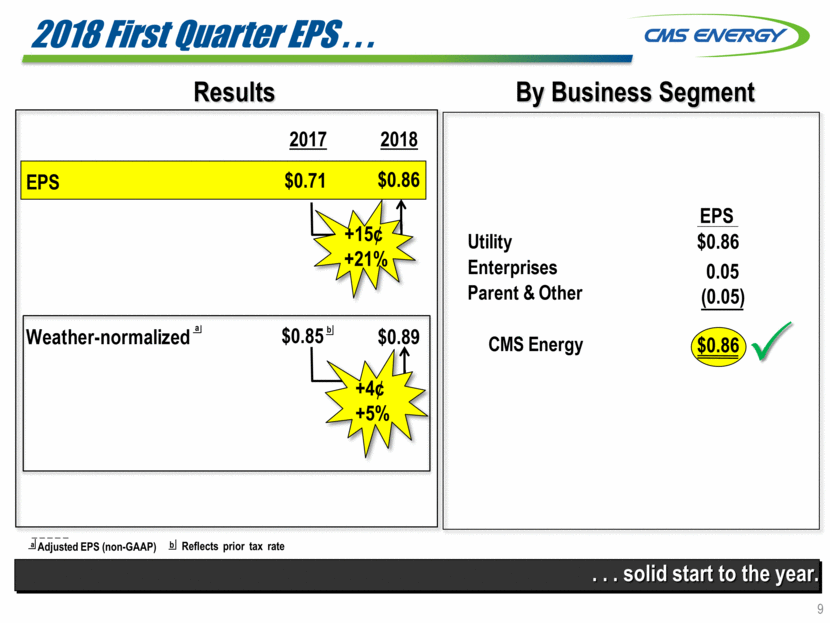
First Quarter . . . . . . keeps us on track. Prior Year EPS $0.86 +21% Reaffirm Guidance Full-year EPS $2.30 to $2.34 _ _ _ _ _ a Adjusted EPS (non-GAAP) Long-Term Outlook EPS & DPS growth +6% to +8% a 3 6% to 8% Results Amount Vs. a
The Triple Bottom Line . . . 4 . . . world class performance delivering hometown service. PERFORMANCE PEOPLE PLANET PEOPLE • PLANET • PROFIT PROFIT

5 Clean Energy Goal . . . . . . breakthrough thinking for our planet. By 2040 80% carbon Reduction zero coal 1 Bn gallons of h2o saved 5,000 acres protected Over the Next 5 Years 35% reduction in landfill waste
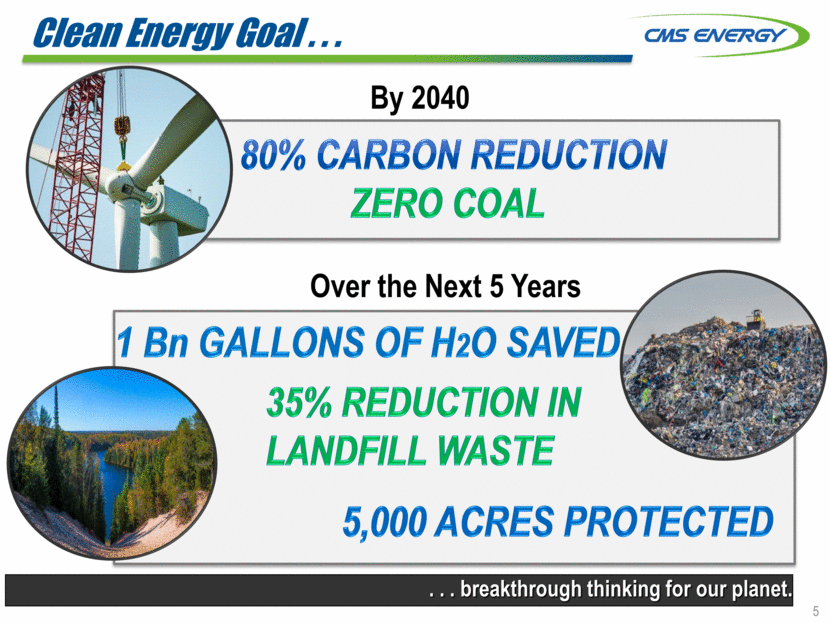
Gas Long-Term Regulatory Planning . . . . . . provides significant customer value and long-term visibility. Electric Regulatory / Policy 6/15: File long-term generation plan (IRP) U-18461 3/29: Final order U-18322 2018 1/1: Gas investment tracker $18 MM U-18124 3/1: Filed 5-Yr electric dist. plan U-17990 Fall: File next gas case 2/22: Tax reform order U-18494 Q2: File next electric case 6 1/19: CE submitted initial tax reform estimates U-18494 $66 MM 10% ROE Gas Current Gas Case Request Rev. Requirement: $83 MM ROE: 10.75% Trackers: $25 MM 8/31: Final order U-18424 a a See appendix for additional detail b b In March 2018, Consumers reduced its requested revenue requirement to $145 MM excluding the impacts of tax reform and reflecting a 10.75% ROE. Consumers further reduced its requested revenue requirement to $83 MM for the impacts of tax reform.
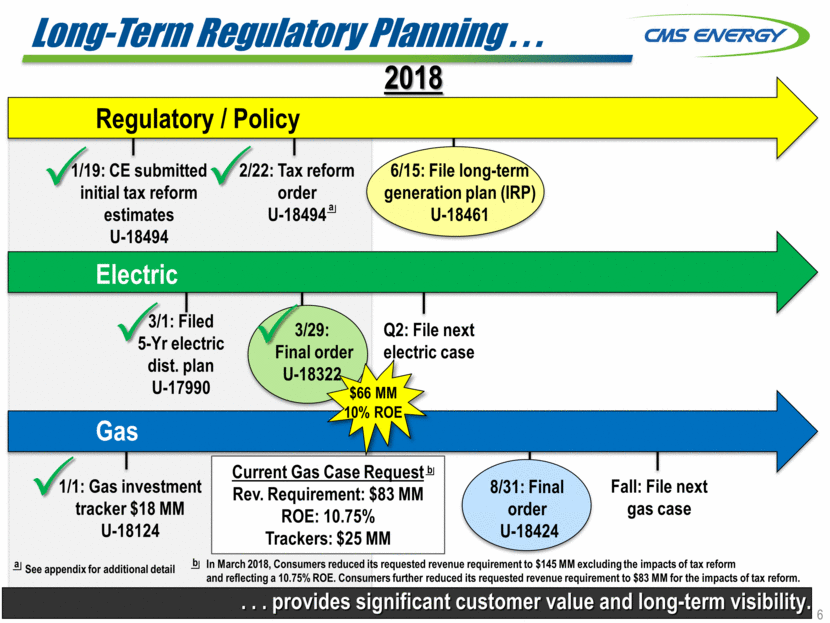
7 . . . matches supply with demand in a modular way. Clean and Lean . . . Old Utility Model Clean And Lean Big Build Big Build O&M Fuel Big Bets Modular Fully utilize assets O&M Fuel Lower Risk Results in excess capacity, higher cost Matches supply with demand Excess supply Excess supply Retirement Supply Actual Demand Demand EE & DR Excess supply Modular Modular Expected Demand Supply
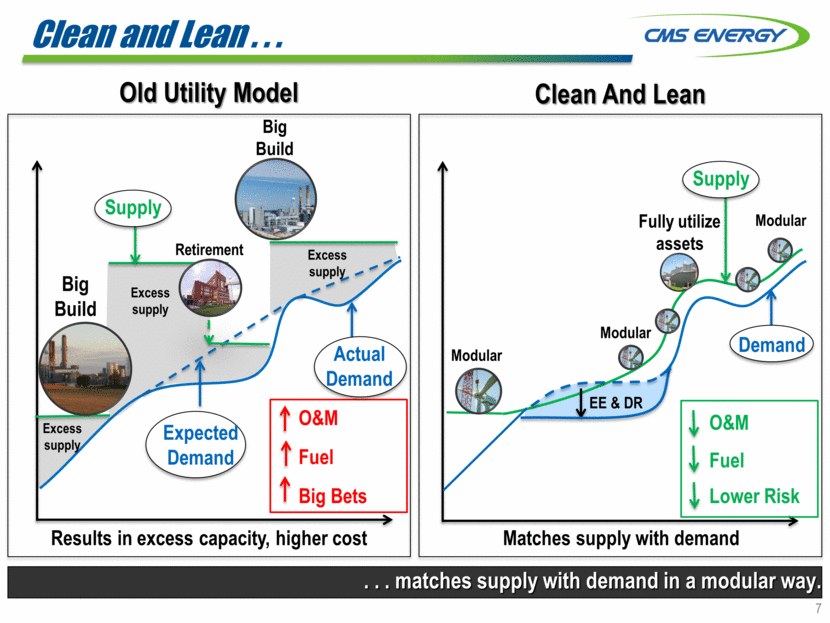
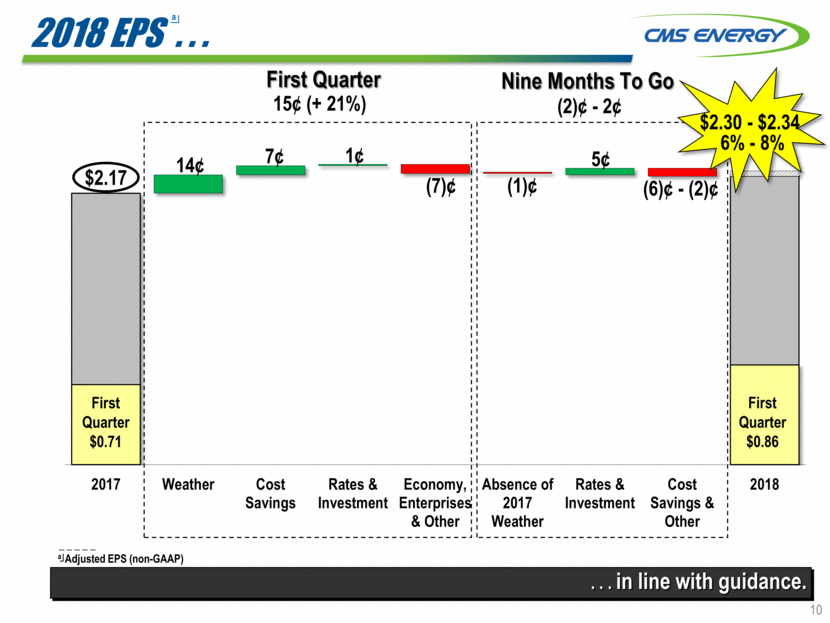
Consistent Growth Through . . . Recession Governor (R) Governor (D) Commission (D) Commission (R) Recession 7% CAGR Polar vortex Cold Feb. Mild summer Warm winter Hot summer Hot summer Cold winter Cold winter Summer- “less” Mild summer Mild summer Commission (D) Hurt Help EPS _ _ _ _ _ a Adjusted EPS (non-GAAP) a Warm winter Hot summer Dividend Weather . . . recessions and adverse weather. Commission (I) Cold Feb. Warm Dec. Warm Winter Warm Winter +6% to +8% 8 b _ _ _ _ _ b Non-GAAP 2003 2004 2005 2006 2007 2008 2009 2010 2011 2012 2013 2014 2015 2016 2017 2018
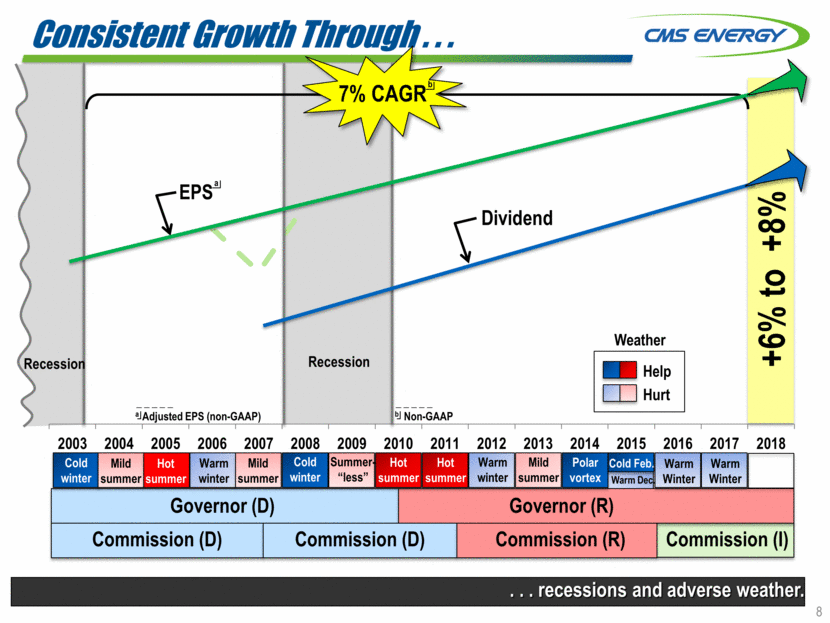
9 2018 First Quarter EPS . . . . . . solid start to the year. By Business Segment Results $0.86 0.05 (0.05) $0.86 EPS +15¢ +21% $0.71 2017 2018 $0.85 $0.89 $0.86 +4¢ +5% a _ _ _ _ _ a Adjusted EPS (non-GAAP) b b Reflects prior tax rate Utility Enterprises Parent & Other CMS Energy EPS Weather-normalized
10 2018 EPS . . . First Quarter Nine Months To Go 15¢ (+ 21%) (2)¢ - 2¢ $2.17 . . . in line with guidance. First Quarter $0.86 $2.30 - $2.34 First Quarter $0.71 6% - 8% 5¢ a _ _ _ _ _ a Adjusted EPS (non-GAAP) 7¢ (1)¢ (6)¢ - (2)¢ 1¢ (7)¢ 14¢ 2017 Weather Cost Savings Rates & Investment Economy, Enterprises & Other Absence of 2017 Weather Rates & Investment Cost Savings & Other 2018
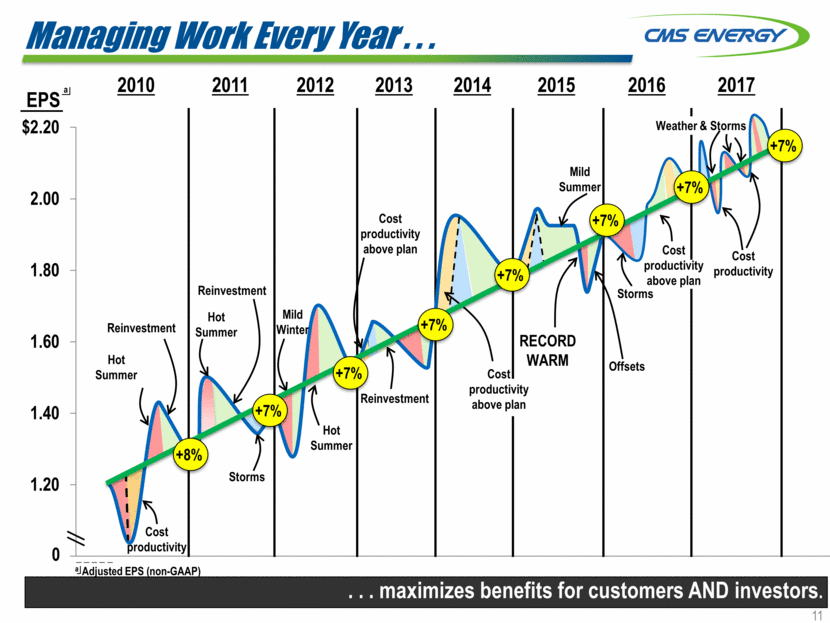
Managing Work Every Year . . . . . . maximizes benefits for customers AND investors. 2010 2011 2012 2013 2014 2015 Offsets RECORD WARM Mild Summer Cost productivity above plan Reinvestment Hot Summer Mild Winter Hot Summer Storms Hot Summer Cost productivity above plan 0 Cost productivity Reinvestment Reinvestment EPS _ _ _ _ _ a Adjusted EPS (non-GAAP) a 2016 Storms Cost productivity above plan Cost productivity 2017 +7% +7% +7% +7% +8% +7% +7% +7% 11 Weather & Storms $1.00 $1.20 $1.40 $1.60 $1.80 $2.00 $2.20
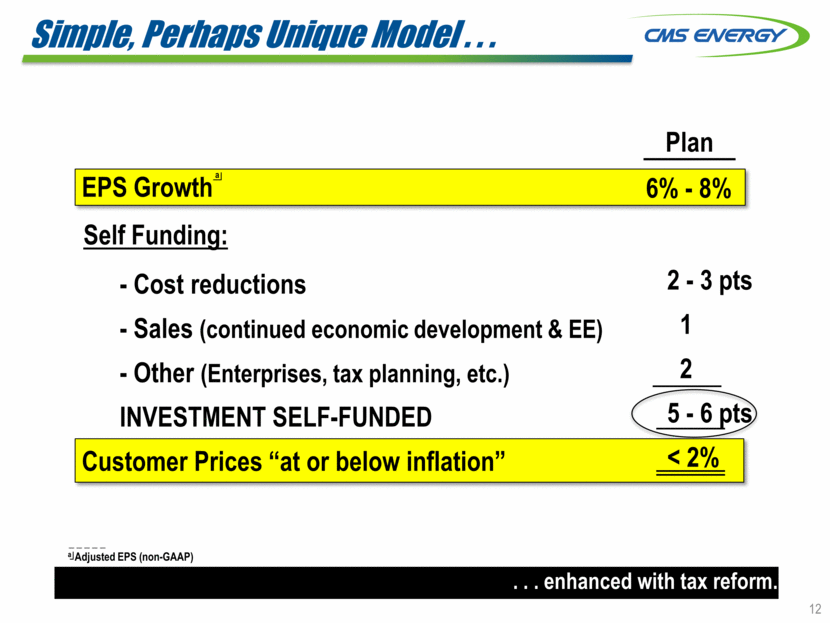
Simple, Perhaps Unique Model . . . EPS Growth - Cost reductions - Sales (continued economic development & EE) - Other (Enterprises, tax planning, etc.) INVESTMENT SELF-FUNDED Customer Prices “at or below inflation” Plan 6% - 8% . . . enhanced with tax reform. 2 - 3 pts 1 2 5 - 6 pts < 2% Self Funding: 12 _ _ _ _ _ a Adjusted EPS (non-GAAP) a
Needed Customer Investment . . . . . . potentially pulled forward by tax reform. $21 Bn Rate Base Growth Large and Aging System $15 Bn > $50 Bn System Need $10 Bn 5-Yr Plan Gas Electric 7% CAGR 30% 70% 40% 60% 13 > $18 Bn 10-Yr 2017 2022
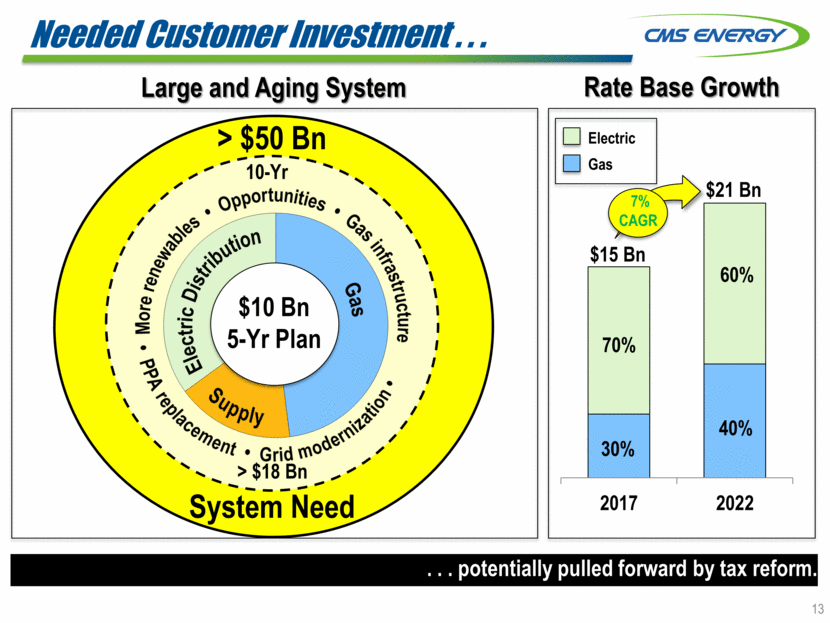
Our Entire Cost Structure . . . Cost Components Fuel and Power Costs Taxes Residential Electric Bills Residential Gas Bills $85 100% Capital Investments O&M Costs Cost of Capital . . . provides opportunities to lower costs and create headroom. ~70% 14 Tax Reform Coal to Gas / PPA $100 $106 $62 Down 6% Down 27% (current dollars) (current dollars) a a a Source: bls.gov for historical data, Bloomberg for 2018 estimate 2013 2018E 0% 10% 20% 30% 40% 50% 60% 70% 80% 90% 100% 2013 2018E
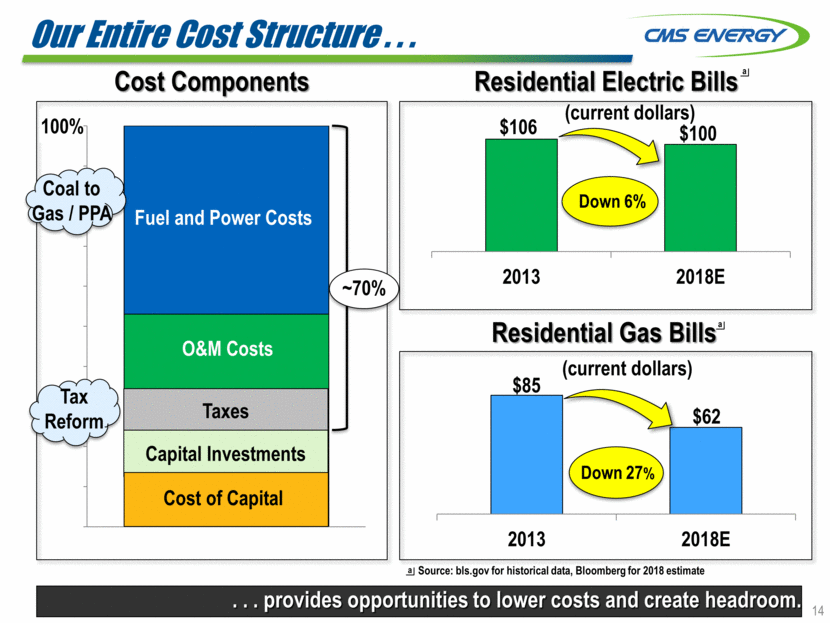
S&P / Fitch Moody’s S&P (Dec. ‘16) Moody’s (Apr. ‘17) Fitch (Jul. ‘17) AA- Aa3 A+ A1 A A2 A- A3 BBB+ Baa1 BBB Baa2 BBB- Baa3 BB+ Ba1 BBB+ Baa1 BBB Baa2 BBB- Baa3 BB+ Ba1 BB Ba2 BB- Ba3 B+ B1 B B2 B- B3 Outlook Stable Stable Stable FFO / Average Debt . . . at solid investment-grade levels. Credit Metrics Maintained . . . ~18% 19% 17% Present Prior 2002 Consumers Secured CMS Unsecured _ _ _ _ _ a Non-GAAP a < 30% HoldCo Debt 15 Target Range 2018 (w/ Tax Reform)
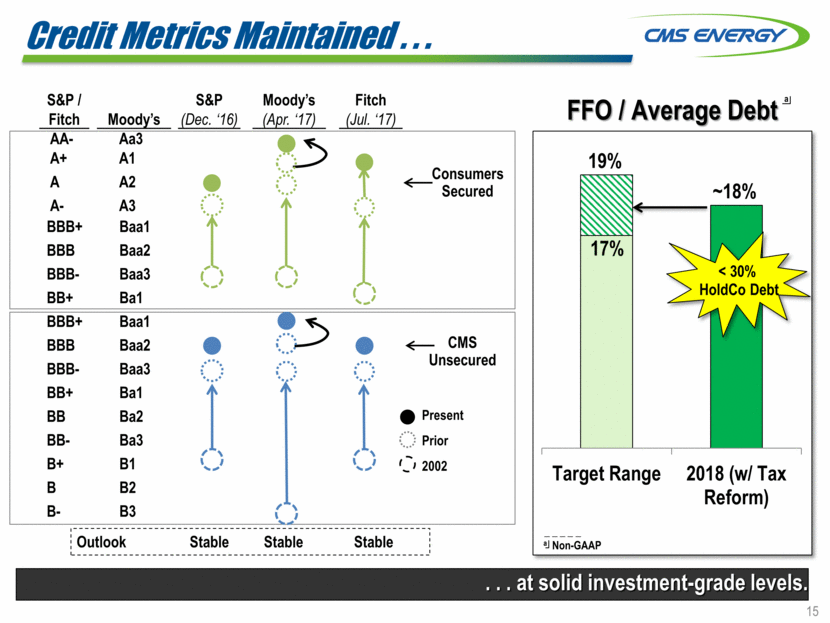
2018 Sensitivities . . . Full Year Impact Sensitivity EPS OCF Sales a Electric (37,477 GWh) Gas (303 Bcf) + 1% + 5 + 6¢ + 9 + $ 20 + 40 Gas prices (NYMEX) + 50¢ 0 55 ROE (planned) Electric (10.1%) Gas (10.1%) + 10 bps + 10 + 1½ + ½ + 6 + 3 Interest rates +100 bps < 1 7 – + . . . reflect strong risk mitigation. – + (MM) _ _ _ _ _ a Reflect 2018 sales forecast; weather - normalized – + – + 16 Order Received 3/29
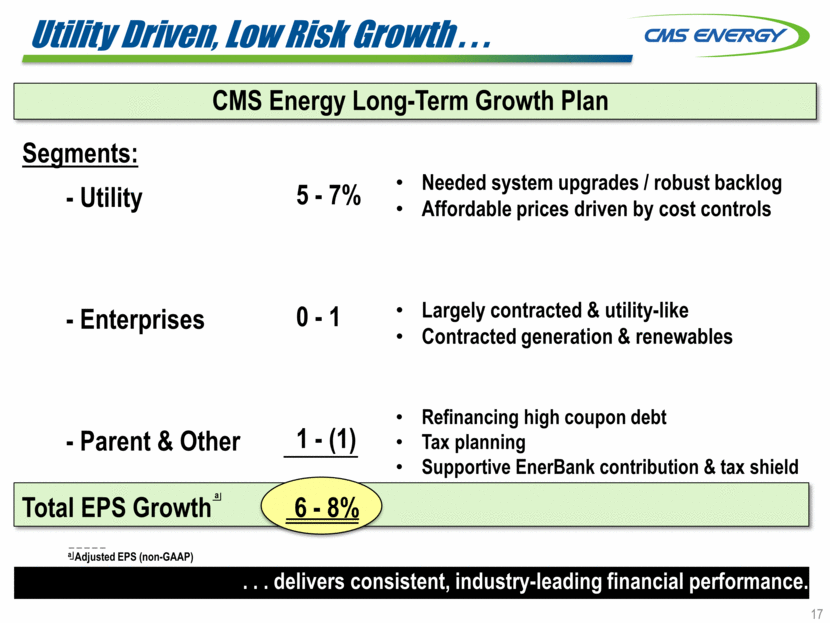
Utility Driven, Low Risk Growth . . . CMS Energy Long-Term Growth Plan - Utility - Enterprises - Parent & Other Total EPS Growth 6 - 8% . . . delivers consistent, industry-leading financial performance. 5 - 7% 0 - 1 1 - (1) Segments: _ _ _ _ _ a Adjusted EPS (non-GAAP) a Needed system upgrades / robust backlog Affordable prices driven by cost controls Largely contracted & utility-like Contracted generation & renewables Refinancing high coupon debt Tax planning Supportive EnerBank contribution & tax shield 17
Compelling Investment Thesis 18 Strong Cash Flow & Balance Sheet Aging Infrastructure Diversified Service Territory Affordable Prices Constructive Regulation

19 Q & A Thank You!

Appendix
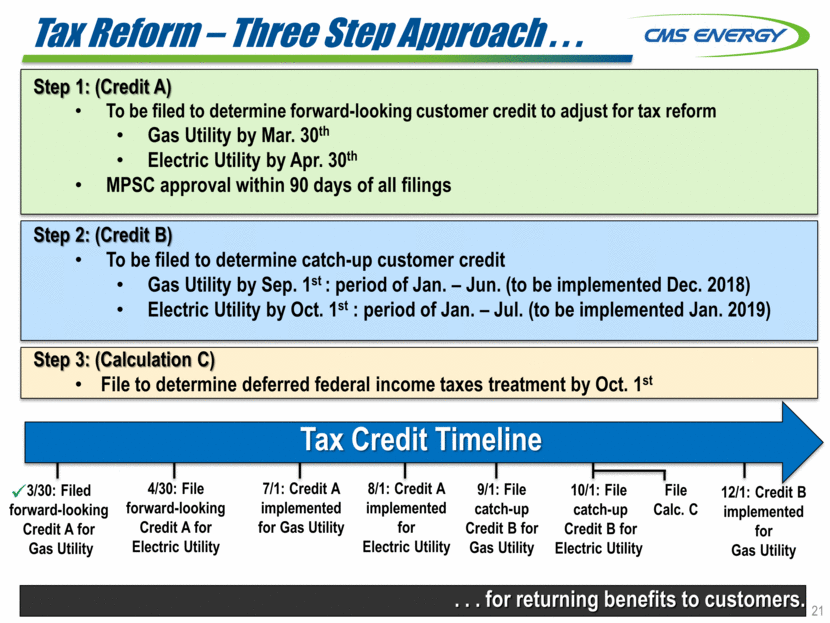
Tax Reform – Three Step Approach . . . . . . for returning benefits to customers. Tax Credit Timeline 3/30: Filed forward-looking Credit A for Gas Utility Step 1: (Credit A) To be filed to determine forward-looking customer credit to adjust for tax reform Gas Utility by Mar. 30th Electric Utility by Apr. 30th MPSC approval within 90 days of all filings Step 2: (Credit B) To be filed to determine catch-up customer credit Gas Utility by Sep. 1st : period of Jan. – Jun. (to be implemented Dec. 2018) Electric Utility by Oct. 1st : period of Jan. – Jul. (to be implemented Jan. 2019) Step 3: (Calculation C) File to determine deferred federal income taxes treatment by Oct. 1st 21 4/30: File forward-looking Credit A for Electric Utility 7/1: Credit A implemented for Gas Utility 8/1: Credit A implemented for Electric Utility 9/1: File catch-up Credit B for Gas Utility 10/1: File catch-up Credit B for Electric Utility File Calc. C 12/1: Credit B implemented for Gas Utility
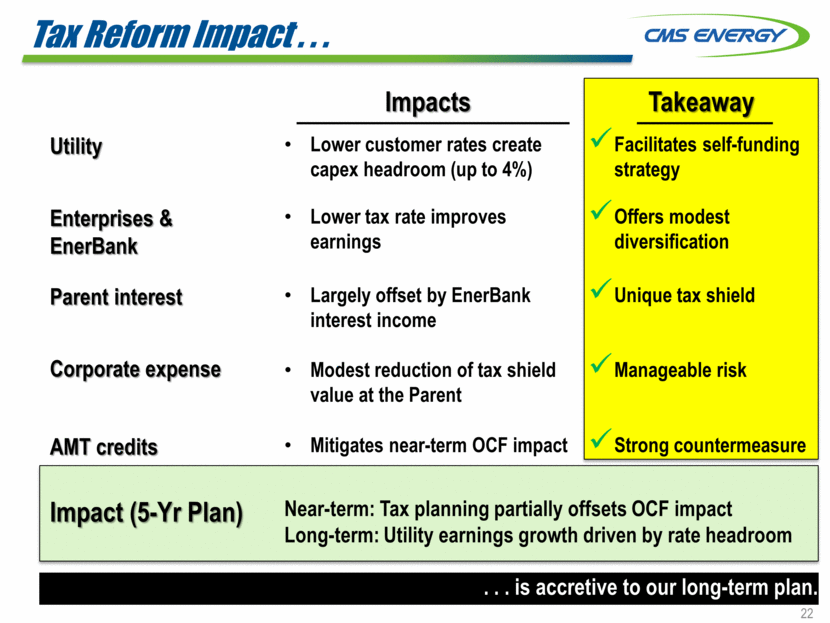
Tax Reform Impact . . . . . . is accretive to our long-term plan. Impacts Takeaway Utility Lower customer rates create capex headroom (up to 4%) Facilitates self-funding strategy Enterprises & EnerBank Lower tax rate improves earnings Offers modest diversification Parent interest Corporate expense Largely offset by EnerBank interest income Modest reduction of tax shield value at the Parent Unique tax shield Manageable risk AMT credits Mitigates near-term OCF impact Strong countermeasure Impact (5-Yr Plan) Near-term: Tax planning partially offsets OCF impact Long-term: Utility earnings growth driven by rate headroom 22
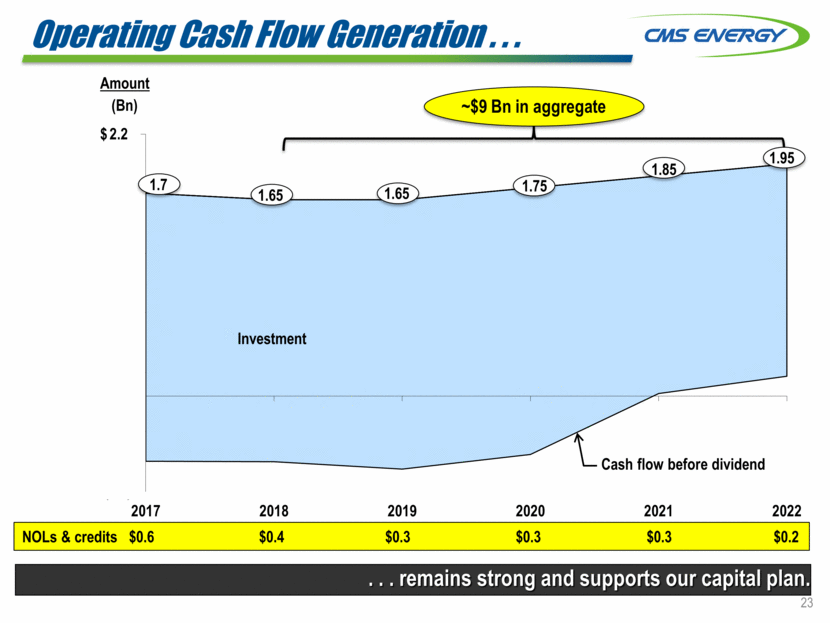
Operating Cash Flow Generation . . . . . . remains strong and supports our capital plan. Amount (Bn) $ Investment Cash flow before dividend NOLs & credits $0.6 $0.4 $0.3 $0.3 $0.3 $0.2 23 ~$9 Bn in aggregate 1.7 1.65 1.65 1.75 1.85 1.95 (0.8) (0.3) 0.2 0.7 1.2 1.7 2.2 2017 2018 2019 2020 2021 2022
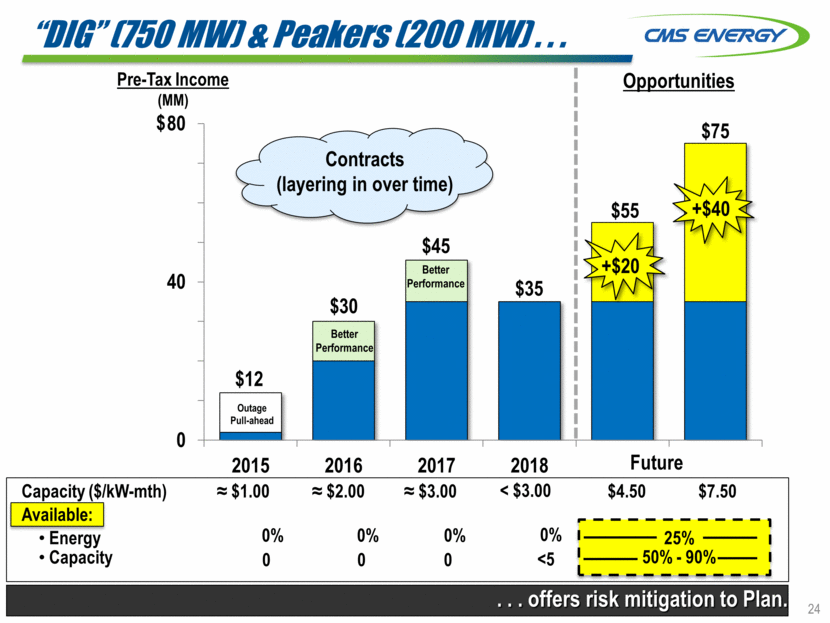
“DIG” (750 MW) & Peakers (200 MW) . . . . . . offers risk mitigation to Plan. Pre-Tax Income (MM) $12 $30 $45 Outage Pull-ahead Better Performance Future Opportunities Capacity ($/kW-mth) ≈ $1.00 ≈ $2.00 ≈ $3.00 $4.50 $7.50 Available: Energy Capacity 0% 0% 25% 0 0 0 $ +$20 +$40 Contracts (layering in over time) $75 $55 50% - 90% 0% Better Performance $35 < $3.00 <5 0% 24 0 10 20 30 40 50 60 70 80 2015 2016 2017 2018
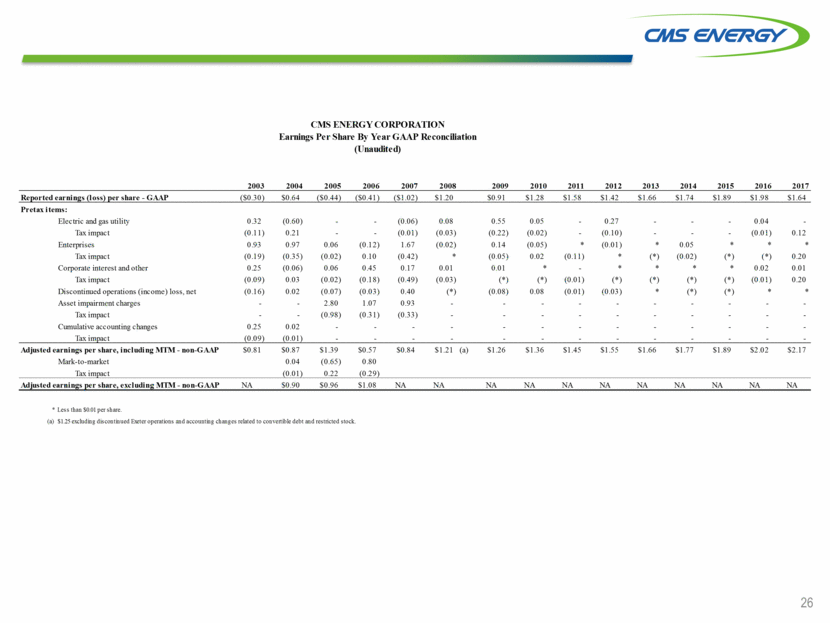
GAAP Reconciliation

26 CMS ENERGY CORPORATION Earnings Per Share By Year GAAP Reconciliation (Unaudited) 2003 2004 2005 2006 2007 2008 2009 2010 2011 2012 2013 2014 2015 2016 2017 Reported earnings (loss) per share - GAAP ($0.30) $0.64 ($0.44) ($0.41) ($1.02) $1.20 $0.91 $1.28 $1.58 $1.42 $1.66 $1.74 $1.89 $1.98 $1.64 Pretax items: Electric and gas utility 0.32 (0.60) - - (0.06) 0.08 0.55 0.05 - 0.27 - - - 0.04 - Tax impact (0.11) 0.21 - - (0.01) (0.03) (0.22) (0.02) - (0.10) - - - (0.01) 0.12 Enterprises 0.93 0.97 0.06 (0.12) 1.67 (0.02) 0.14 (0.05) * (0.01) * 0.05 * * * Tax impact (0.19) (0.35) (0.02) 0.10 (0.42) * (0.05) 0.02 (0.11) * (*) (0.02) (*) (*) 0.20 Corporate interest and other 0.25 (0.06) 0.06 0.45 0.17 0.01 0.01 * - * * * * 0.02 0.01 Tax impact (0.09) 0.03 (0.02) (0.18) (0.49) (0.03) (*) (*) (0.01) (*) (*) (*) (*) (0.01) 0.20 Discontinued operations (income) loss, net (0.16) 0.02 (0.07) (0.03) 0.40 (*) (0.08) 0.08 (0.01) (0.03) * (*) (*) * * Asset impairment charges - - 2.80 1.07 0.93 - - - - - - - - - - Tax impact - - (0.98) (0.31) (0.33) - - - - - - - - - - Cumulative accounting changes 0.25 0.02 - - - - - - - - - - - - - Tax impact (0.09) (0.01) - - - - - - - - - - - - - Adjusted earnings per share, including MTM - non-GAAP $0.81 $0.87 $1.39 $0.57 $0.84 $1.21 (a) $1.26 $1.36 $1.45 $1.55 $1.66 $1.77 $1.89 $2.02 $2.17 Mark-to-market 0.04 (0.65) 0.80 Tax impact (0.01) 0.22 (0.29) Adjusted earnings per share, excluding MTM - non-GAAP NA $0.90 $0.96 $1.08 NA NA NA NA NA NA NA NA NA NA NA * Less than $0.01 per share. (a) $1.25 excluding discontinued Exeter operations and accounting changes related to convertible debt and restricted stock.
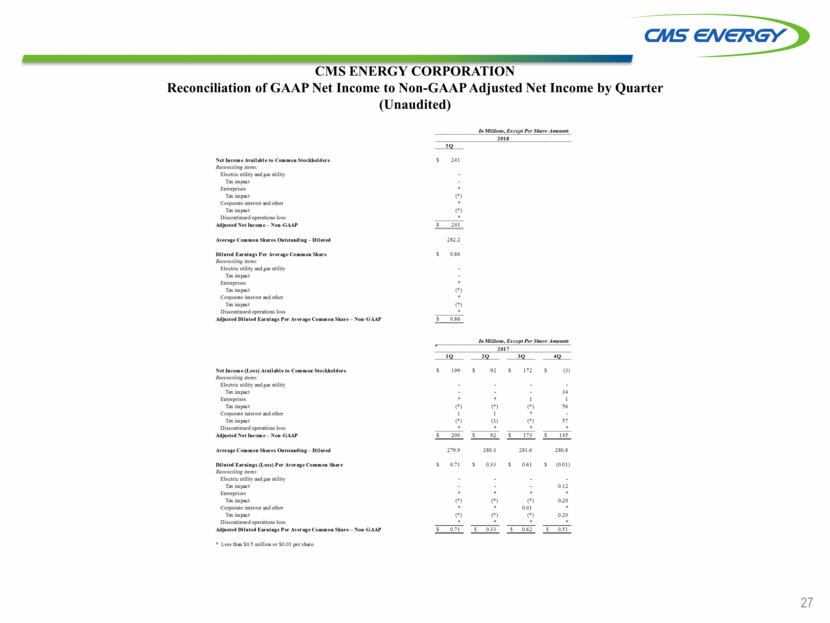
27 CMS ENERGY CORPORATION Reconciliation of GAAP Net Income to Non-GAAP Adjusted Net Income by Quarter (Unaudited) In Millions, Except Per Share Amounts 2018 1Q Net Income Available to Common Stockholders $ 241 Reconciling items: Electric utility and gas utility - Tax impact - Enterprises * Tax impact (*) Corporate interest and other * Tax impact (*) Discontinued operations loss * Adjusted Net Income – Non-GAAP $ 241 Average Common Shares Outstanding – Diluted 282.2 Diluted Earnings Per Average Common Share $ 0.86 Reconciling items: Electric utility and gas utility - Tax impact - Enterprises * Tax impact (*) Corporate interest and other * Tax impact (*) Discontinued operations loss * Adjusted Diluted Earnings Per Average Common Share – Non-GAAP $ 0.86 In Millions, Except Per Share Amounts 2017 1Q 2Q 3Q 4Q Net Income (Loss) Available to Common Stockholders $ 199 $ 92 $ 172 $ (3) Reconciling items: Electric utility and gas utility - - - - Tax impact - - - 34 Enterprises * * 1 1 Tax impact (*) (*) (*) 56 Corporate interest and other 1 1 * - Tax impact (*) (1) (*) 57 Discontinued operations loss * * * * Adjusted Net Income – Non-GAAP $ 200 $ 92 $ 173 $ 145 Average Common Shares Outstanding – Diluted 279.9 280.3 281.6 280.8 Diluted Earnings (Loss) Per Average Common Share $ 0.71 $ 0.33 $ 0.61 $ (0.01) Reconciling items: Electric utility and gas utility - - - - Tax impact - - - 0.12 Enterprises * * * * Tax impact (*) (*) (*) 0.20 Corporate interest and other * * 0.01 * Tax impact (*) (*) (*) 0.20 Discontinued operations loss * * * * Adjusted Diluted Earnings Per Average Common Share – Non-GAAP $ 0.71 $ 0.33 $ 0.62 $ 0.51 * Less than $0.5 million or $0.01 per share.
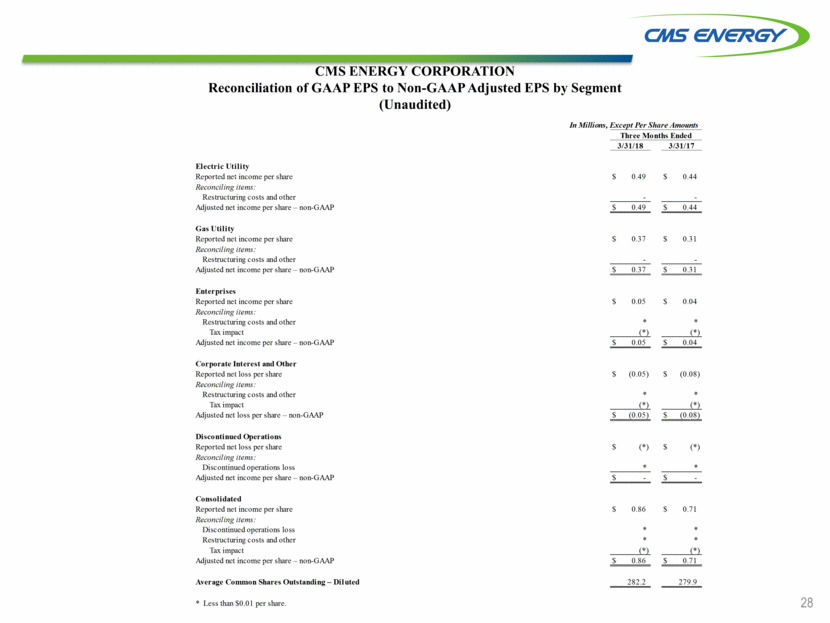
28 CMS ENERGY CORPORATION Reconciliation of GAAP EPS to Non-GAAP Adjusted EPS by Segment (Unaudited) In Millions, Except Per Share Amounts Three Months Ended 3/31/18 3/31/17 Electric Utility Reported net income per share $ 0.49 $ 0.44 Reconciling items: Restructuring costs and other - - Adjusted net income per share – non-GAAP $ 0.49 $ 0.44 Gas Utility Reported net income per share $ 0.37 $ 0.31 Reconciling items: Restructuring costs and other - - Adjusted net income per share – non-GAAP $ 0.37 $ 0.31 Enterprises Reported net income per share $ 0.05 $ 0.04 Reconciling items: Restructuring costs and other * * Tax impact (*) (*) Adjusted net income per share – non-GAAP $ 0.05 $ 0.04 Corporate Interest and Other Reported net loss per share $ (0.05) $ (0.08) Reconciling items: Restructuring costs and other * * Tax impact (*) (*) Adjusted net loss per share – non-GAAP $ (0.05) $ (0.08) Discontinued Operations Reported net loss per share $ (*) $ (*) Reconciling items: Discontinued operations loss * * Adjusted net income per share – non-GAAP $ - $ - Consolidated Reported net income per share $ 0.86 $ 0.71 Reconciling items: Discontinued operations loss * * Restructuring costs and other * * Tax impact (*) (*) Adjusted net income per share – non-GAAP $ 0.86 $ 0.71 Average Common Shares Outstanding – Diluted 282.2 279.9 * Less than $0.01 per share.
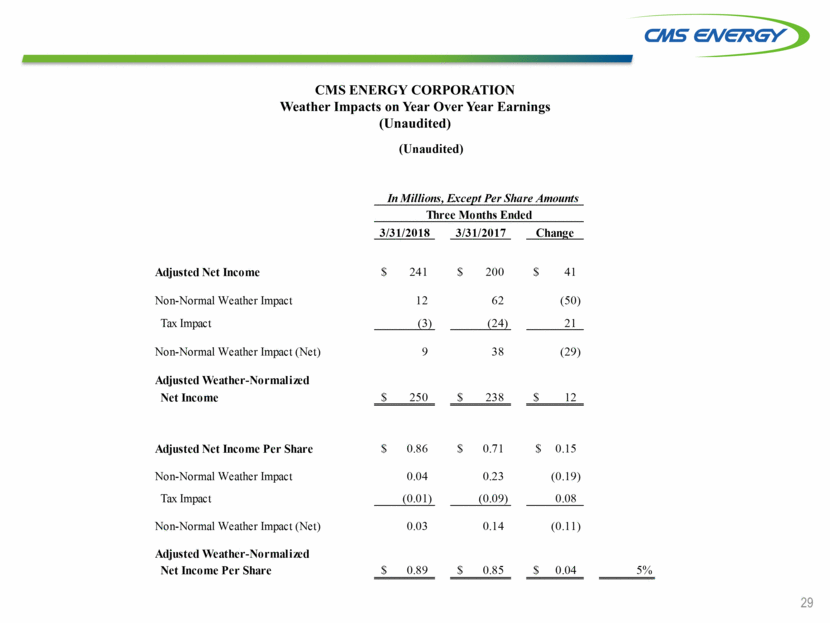
29 CMS ENERGY CORPORATION Weather Impacts on Year Over Year Earnings (Unaudited) CMS ENERGY CORPORATION Weather Impact on Year Over Year Earnings (Unaudited) In Millions, Except Per Share Amounts Three Months Ended 3/31/2018 3/31/2017 Change Adjusted Net Income $ 241 $ 200 $ 41 Non-Normal Weather Impact 12 62 (50) Tax Impact (3) (24) 21 Non-Normal Weather Impact (Net) 9 38 (29) Adjusted Weather-Normalized Net Income $ 250 $ 238 $ 12 Adjusted Net Income Per Share $ 0.86 $ 0.71 $ 0.15 Non-Normal Weather Impact 0.04 0.23 (0.19) Tax Impact (0.01) (0.09) 0.08 Non-Normal Weather Impact (Net) 0.03 0.14 (0.11) Adjusted Weather-Normalized Net Income Per Share $ 0.89 $ 0.85 $ 0.04 5% Average Common Shares Outstanding 282.2 279.9
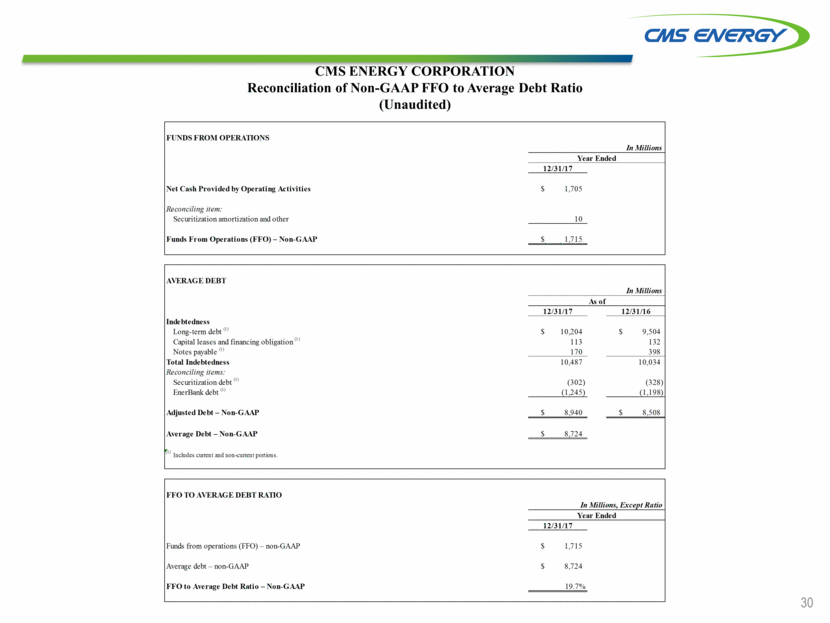
30 CMS ENERGY CORPORATION Reconciliation of Non-GAAP FFO to Average Debt Ratio (Unaudited) FUNDS FROM OPERATIONS In Millions Year Ended 12/31/17 Net Cash Provided by Operating Activities $ 1,705 Reconciling item: Securitization amortization and other 10 Funds From Operations (FFO) – Non-GAAP $ 1,715 AVERAGE DEBT In Millions As of 12/31/17 12/31/16 Indebtedness Long-term debt (1) $ 10,204 $ 9,504 Capital leases and financing obligation (1) 113 132 Notes payable (1) 170 398 Total Indebtedness 10,487 10,034 Reconciling items: Securitization debt (1) (302) (328) EnerBank debt (1) (1,245) (1,198) Adjusted Debt – Non-GAAP $ 8,940 $ 8,508 Average Debt – Non-GAAP $ 8,724 (1) Includes current and non-current portions. FFO TO AVERAGE DEBT RATIO In Millions, Except Ratio Year Ended 12/31/17 Funds from operations (FFO) – non-GAAP $ 1,715 Average debt – non-GAAP $ 8,724 FFO to Average Debt Ratio – Non-GAAP 19.7%
