Attached files
Table of Contents
As filed with the Securities and Exchange Commission on April 26, 2018
Registration No. 333-221521
UNITED STATES
SECURITIES AND EXCHANGE COMMISSION
WASHINGTON, D.C. 20549
Amendment No. 4
to
FORM S-1
REGISTRATION STATEMENT
UNDER
THE SECURITIES ACT OF 1933
AXA Equitable Holdings, Inc.
(Exact Name of Registrant as Specified in its Charter)
| Delaware | 6411 | 90-0226248 | ||
| (State or Other Jurisdiction of Incorporation or Organization) |
(Primary Standard Industrial Classification Code Number) |
(I.R.S. Employer Identification Number) |
1290 Avenue of the Americas
New York, New York 10104
(212) 554-1234
(Address, including zip code, and telephone number, including area code, of registrant’s principal executive offices)
Dave S. Hattem, Esq.
Senior Executive Vice President and General Counsel
1290 Avenue of the Americas
New York, New York 10104
(212) 554-1234
(Name, address, including zip code, and telephone number, including area code, of agent for service)
Copies to:
| Peter J. Loughran, Esq. Debevoise & Plimpton LLP 919 Third Avenue New York, New York 10022 (212) 909-6000 |
Robert G. DeLaMater, Esq. William Torchiana, Esq. Sullivan & Cromwell LLP 125 Broad Street New York, New York 10004 (212) 558-4000 |
Approximate date of commencement of proposed sale of the securities to the public: As soon as practicable after this registration statement becomes effective.
If any of the securities being registered on this Form are to be offered on a delayed or continuous basis pursuant to Rule 415 under the Securities Act of 1933, check the following box. ☐
If this Form is filed to register additional securities for an offering pursuant to Rule 462(b) under the Securities Act, please check the following box and list the Securities Act registration statement number of the earlier effective registration statement for the same offering. ☐
If this Form is a post-effective amendment filed pursuant to Rule 462(c) under the Securities Act, check the following box and list the Securities Act registration statement number of the earlier effective registration statement for the same offering. ☐
If this Form is a post-effective amendment filed pursuant to Rule 462(d) under the Securities Act, check the following box and list the Securities Act registration statement number of the earlier effective registration statement for the same offering. ☐
Indicate by check mark whether the registrant is a large accelerated filer, an accelerated filer, a non-accelerated filer, or smaller reporting company, or an emerging growth company. See the definitions of “large accelerated filer,” “accelerated filer,” “smaller reporting company,” and an emerging growth company in Rule 12b-2 of the Exchange Act.
| Large accelerated filer | ☐ | Accelerated filer | ☐ | |||
| Non-accelerated filer | ☒ (Do not check if a smaller reporting company) | Smaller reporting company | ☐ | |||
| Emerging growth company | ☐ | |||||
If an emerging growth company, indicate by check mark if the registrant has elected not to use the extended transition period for complying with any new or revised financial accounting standards provided pursuant to Section 7(a)(2)(B) of the Securities Act. ☐
CALCULATION OF REGISTRATION FEE
|
| ||||||||
| Title of Each Class of Securities to be Registered |
Amount to be Registered(1) |
Proposed Maximum Offering Per Share |
Proposed Maximum Offering Price(1)(2) |
Amount of Registration Fee(3) | ||||
| Common Stock, par value $0.01 per share |
157,837,500 | $27.00 | $4,261,612,500 | $530,571 | ||||
|
| ||||||||
|
| ||||||||
| (1) | Includes shares/offering price of shares that may be sold upon exercise of the underwriters’ option to purchase additional shares. |
| (2) | This amount represents the proposed maximum aggregate offering price of the securities registered hereunder. These figures are estimated solely for the purpose of calculating the amount of the registration fee pursuant to Rule 457(a) under the Securities Act of 1933, as amended. |
| (3) | The registrant previously paid $12,450 of this amount. |
The registrant hereby amends this registration statement on such date or dates as may be necessary to delay its effective date until the registrant shall file a further amendment which specifically states that this registration statement shall thereafter become effective in accordance with Section 8(a) of the Securities Act of 1933 or until the registration statement shall become effective on such date as the U.S. Securities and Exchange Commission, acting pursuant to said Section 8(a), may determine.
Table of Contents
The information in this preliminary prospectus is not complete and may be changed. We and the selling stockholder may not sell these securities until the U.S. Securities and Exchange Commission declares our registration statement effective. This preliminary prospectus is not an offer to sell these securities and it is not soliciting offers to buy these securities in any state or jurisdiction where the offer or sale is not permitted.
SUBJECT TO COMPLETION, DATED APRIL 26, 2018
137,250,000 Shares

AXA Equitable Holdings, Inc.
Common Stock
This is an initial public offering of shares of common stock of AXA Equitable Holdings, Inc. The selling stockholder, AXA S.A., is offering 137,250,000 shares of common stock. We will not receive any of the proceeds from the sale of the shares being sold by the selling stockholder in this offering.
Prior to this offering, there has been no public market for our common stock. We have been approved to list our common stock on the New York Stock Exchange (“NYSE”) under the symbol “EQH”.
We anticipate that the initial public offering price will be between $24.00 and $27.00 per share.
After the settlement of this offering, we will be a “controlled company” within the meaning of the corporate governance standards of the NYSE.
Investing in our common stock involves risks. See “Risk Factors” beginning on page 26 of this prospectus to read about factors you should consider before buying shares of our common stock.
| Per Share |
Total | |||||||
| Initial public offering price |
$ | $ | ||||||
| Underwriting discounts and commissions(1) |
$ | $ | ||||||
| Proceeds, before expenses, to the selling stockholder |
$ | $ | ||||||
| (1) | We have agreed to reimburse the underwriters for certain expenses in connection with this offering. See “Underwriting.” |
The underwriters also may purchase up to 20,587,500 additional shares from the selling stockholder at the initial offering price less the underwriting discounts and commissions, within 30 days from the date of this prospectus.
Neither the U.S. Securities and Exchange Commission nor any state securities commission has approved or disapproved the securities described herein or determined if this prospectus is truthful or complete. Any representation to the contrary is a criminal offense.
The underwriters expect to deliver the shares to purchasers on or about , 2018.
| Morgan Stanley | J.P. Morgan | Barclays | Citigroup |
| BofA Merrill Lynch | Credit Suisse | Deutsche Bank Securities | Goldman Sachs & Co. LLC |
| BNP PARIBAS | SOCIETE GENERALE | ING | Credit Agricole CIB | HSBC | Natixis | RBC Capital Markets |
| Lazard | BBVA | COMMERZBANK | Mizuho Securities | MUFG | PNC Capital Markets LLC |
| SMBC Nikko | SunTrust Robinson Humphrey | UniCredit Capital Markets |
Prospectus dated , 2018
Table of Contents

Table of Contents
| i | ||||
| 1 | ||||
| 26 | ||||
| Special Note Regarding Forward-Looking Statements and Information |
83 | |||
| 86 | ||||
| 87 | ||||
| 88 | ||||
| 92 | ||||
| 95 | ||||
| 96 | ||||
| 98 | ||||
| Management’s Discussion and Analysis of Financial Condition and Results of Operations |
103 | |||
| 175 | ||||
| 240 | ||||
| 248 | ||||
| 300 | ||||
| 303 | ||||
| 320 | ||||
| 326 | ||||
| Material U.S. Federal Tax Considerations For Non-U.S. Holders |
328 | |||
| 332 | ||||
| 343 | ||||
| 343 | ||||
| 343 | ||||
| 345 | ||||
| F-1 |
You should rely only on the information contained in this prospectus and any free writing prospectus we may authorize to be delivered to you. We have not, and the selling stockholder and the underwriters have not, authorized anyone to provide you with information different from, or in addition to, that contained in this prospectus and any related free writing prospectus. We, the selling stockholder and the underwriters take no responsibility for, and can provide no assurances as to the reliability of, any information that others may give you. This prospectus is an offer to sell only the shares offered hereby, but only under circumstances and in jurisdictions where it is lawful to do so. The information contained in this prospectus is only accurate as of the date of this prospectus, regardless of the time of delivery of this prospectus and any sale of shares of our common stock.
We use the following capitalized terms in this prospectus:
| • | “AB” or “AllianceBernstein” means AB Holding and ABLP. |
| • | “AB Holding” means AllianceBernstein Holding L.P., a Delaware limited partnership. |
| • | “AB Holding Units” means units representing assignments of beneficial ownership of limited partnership interests in AB Holding. |
| • | “AB Units” means units of limited partnership interests in ABLP. |
| • | “ABLP” means AllianceBernstein L.P., a Delaware limited partnership and the operating partnership for the AB business. |
i
Table of Contents
| • | “ACS Life” means AXA Corporate Solutions Life Reinsurance Company, a Delaware corporation and a wholly owned direct subsidiary of Holdings. |
| • | “ASV US” means AXA Strategic Ventures US, LLC, a private equity fund established to invest in early-stage companies that are aligned to our long-term strategy. |
| • | “AXA” means AXA S.A., a société anonyme organized under the laws of France, the selling stockholder in this offering and our parent company. AXA beneficially owned 100% of our common stock prior to this offering. Following the settlement of this offering, AXA will own 75.5% of our outstanding common stock (or 71.9% if the underwriters exercise their option to purchase additional shares in full) and will be our controlling stockholder. |
| • | “AXA Advisors” means AXA Advisors, LLC, a Delaware limited liability company, our retail broker/dealer for our retirement and protection businesses and a wholly owned indirect subsidiary of Holdings. |
| • | “AXA Distributors” means AXA Distributors, LLC, a Delaware limited liability company, our wholesale broker/dealer for our retirement and protection businesses and a wholly owned indirect subsidiary of Holdings. |
| • | “AXA Equitable FMG” means AXA Equitable Funds Management Group, LLC, a Delaware limited liability company and a wholly owned indirect subsidiary of Holdings. |
| • | “AXA Equitable L&A” means AXA Equitable Life and Annuity Company, a Colorado corporation and a wholly owned indirect subsidiary of Holdings. |
| • | “AXA Equitable Life” means AXA Equitable Life Insurance Company, a New York corporation, a life insurance company and a wholly owned indirect subsidiary of Holdings. |
| • | “AXA Financial” means AXA Financial, Inc., a Delaware corporation and a wholly owned direct subsidiary of Holdings. |
| • | “AXA Network” means AXA Network, LLC, a Delaware limited liability company and wholly owned indirect subsidiary of Holdings, and its subsidiary, AXA Network of Puerto Rico, Inc. |
| • | “AXA Premier VIP Trust” means AXA Premier VIP Trust, a series trust that is a Delaware statutory trust and is registered under the Investment Company Act of 1940, as amended (the “Investment Company Act”), as an open-end management investment company. |
| • | “AXA RE Arizona” means AXA RE Arizona Company, formerly an Arizona corporation and a wholly owned indirect subsidiary of Holdings, which merged with and into AXA Equitable Life in April 2018. |
| • | “AXA Tech” means AXA Technology Services America, Inc. |
| • | “CS Life RE” means CS Life RE Company, an Arizona corporation and a wholly owned indirect subsidiary of Holdings. |
| • | “EQAT” means EQ Advisors Trust, a series trust that is a Delaware statutory trust and is registered under the Investment Company Act as an open-end management investment company. |
| • | “EQ AZ Life Re” means EQ AZ Life Re Company, an Arizona corporation and a wholly owned indirect subsidiary of Holdings. |
| • | The “General Partner” means AllianceBernstein Corporation, a Delaware corporation and the general partner of AB Holding and ABLP. |
| • | “Holdings” means AXA Equitable Holdings, Inc. without its consolidated subsidiaries. |
| • | “MLOA” means MONY Life Insurance Company of America, an Arizona corporation and a wholly owned indirect subsidiary of Holdings. |
| • | “Reorganization” means the transactions described under the following headings: “The Reorganization Transactions—Transfer of AXA Financial Shares,” “—Extraction of U.S. Property and Casualty Insurance Business,” and “—Transfer of AXA’s Interests in AB.” |
ii
Table of Contents
| • | “Reorganization Transactions” means the Reorganization, the GMxB Unwind, as defined in “The Reorganization Transactions,” and the Recapitalization, as defined in “Recapitalization,” collectively. |
| • | “SCB LLC” means Sanford C. Bernstein & Co., LLC, a registered investment adviser and broker-dealer. |
| • | “USFL” means U.S. Financial Life Insurance Company, an Ohio corporation and a wholly owned indirect subsidiary of Holdings. |
| • | “we,” “us,” “our” and the “Company” mean AXA Equitable Holdings, Inc. and its consolidated subsidiaries, unless the context refers only to AXA Equitable Holdings, Inc. (which we refer to as “Holdings”) as a corporate entity. |
For definitions of selected financial and product-related terms used in this prospectus, please refer to “Glossary” beginning on page 345 of this prospectus.
MARKET AND INDUSTRY DATA
This prospectus includes estimates regarding market and industry data and forecasts, which are based on publicly available information, industry publications and surveys, reports from government agencies, reports by market research firms and our own estimates based on our management’s knowledge of, and experience in, the insurance industry and market segments in which we compete. Third-party industry publications and forecasts generally state that the information contained therein has been obtained from sources generally believed to be reliable. Our estimates involve risks and uncertainties and are subject to change based on various factors, including those discussed under the captions “Risk Factors,” “Special Note Regarding Forward-Looking Statements and Information” and “Management’s Discussion and Analysis of Financial Condition and Results of Operations.”
SERVICE MARKS, TRADEMARKS AND TRADE NAMES
We hold and license various service marks, trademarks and trade names, such as “AXA,” “AXA Equitable,” “AllianceBernstein,” “Bernstein,” “AB,” “Structured Capital Strategies,” “Retirement Cornerstone,” “Investment Edge,” “Income Edge,” “EQUI-VEST” and our and AB’s logo designs that we deem particularly important to the advertising activities conducted by each of our businesses. This prospectus also contains trademarks, service marks and trade names of other companies which are the property of their respective holders. We do not intend our use or display of such names or marks to imply relationships with, or endorsements of us by, any other company.
iii
Table of Contents
The following summary highlights selected information contained in this prospectus. Because this is only a summary, it does not contain all of the information you should consider before investing in our common stock. You should carefully read the entire prospectus, including the sections entitled “Risk Factors” and “Management’s Discussion and Analysis of Financial Condition and Results of Operations,” as well as our annual financial statements included elsewhere in this prospectus, before making an investment decision. For the definitions of certain capitalized terms used in this prospectus, please refer to “Certain Important Terms” on page i and “Glossary” on page 345.
Our Company
We are one of America’s leading financial services companies and have helped clients prepare for their financial future with confidence since 1859. Our approximately 12,200 employees and advisors are entrusted with more than $670 billion of assets under management through two complementary and well-established principal franchises, AXA Equitable Life and AllianceBernstein, providing:
| • | Advice and solutions for helping Americans set and meet their retirement goals and protect and transfer their wealth across generations; and |
| • | A wide range of investment management insights, expertise and innovations to drive better investment decisions and outcomes for clients and institutional investors worldwide. |
We aim to be a trusted partner to our clients by providing advice, products and services that help them navigate complex financial decisions. Our financial strength and the quality of our people, their ingenuity and the service they provide help us build relationships of trust with our clients.
We believe that the growing and aging U.S. population, shift of responsibility for retirement planning from employers to individuals and overall growth in total investable assets will drive significant demand for our products and services going forward. Throughout our long history, we have embraced change and looked to the future, and we continue to see significant opportunities to find new solutions and new ways to deliver service to clients within our target markets.
We have a leading position at the intersection of advice, asset management and financial protection that we believe provides our clients with products and solutions that meet their long-term financial needs and our stockholders with attractive growth prospects. We have market-leading positions in our four segments:
| • | Individual Retirement—We are a leading provider of variable annuity products, which primarily meet the needs of individuals saving for retirement or seeking retirement income by allowing them to invest in various markets through underlying investment options. As of December 31, 2017, we had more than 900,000 variable annuity policies in force, representing $103.4 billion of account value (“AV”), which reflects the aggregate policy account value of our products. |
| • | Group Retirement—We offer tax-deferred investment and retirement plans sponsored by educational entities, municipalities and not-for-profit entities as well as small and medium-sized businesses. As of December 31, 2017, we had approximately $33.9 billion of AV. According to LIMRA, for the year ended December 31, 2017, we were the #1 provider by gross premiums of retirement plans to kindergarten, primary and secondary schools (the “K-12 education market”). |
| • | Investment Management and Research—We are a leading provider of diversified investment management, research and related services to a broad range of clients around the world. As of December 31, 2017, our Investment Management and Research segment had approximately $554 billion in AUM consisting of 35% equities, 54% fixed income and 11% multi-asset class solutions, alternatives and other assets. |
1
Table of Contents
| • | Protection Solutions—We focus on attractive protection segments such as variable universal life (“VUL”) insurance, a universal life insurance product in which the excess amount paid over policy charges can be directed by the policyholder into a variety of Separate Account investment options, and indexed universal life (“IUL”) insurance, a universal life insurance product that uses an equity-linked approach for generating policy investment returns. According to LIMRA, for 2017 we ranked fourth in sales overall and first in the retail channel for VUL insurance and second in the retail channel in the same period for IUL insurance. As of December 31, 2017, we had approximately 900,000 outstanding policies with a face value of $446 billion. This business provides capital diversification benefits alongside the longevity profile of our retirement businesses. |
We manage our segments in a complementary way. We strive to create value for our clients and stockholders by pricing and managing risks on the liability side of our balance sheet and by generating attractive risk-adjusted investment returns on the asset side. We leverage our underwriting, risk management and investment management skills across our segments, General Account and Separate Accounts.
We distribute our products through a premier affiliated and third-party distribution platform with a successful track record of marketing our innovative and less capital intensive products and solutions allowing us to respond to our clients’ evolving needs and manage our capital and risks responsibly, consisting of:
| • | Affiliated Distribution: |
| • | Our affiliated retail sales force, AXA Advisors, which has approximately 4,700 licensed financial professionals who advise on retirement, protection and investment advisory solutions; and |
| • | Nearly 200 Bernstein Financial Advisors, who are responsible for the sale of investment products and solutions to Private Wealth Management clients. |
| • | Third-Party Distribution: |
| • | Distribution agreements with more than 1,000 third-party firms including broker-dealers, banks, insurance partners and brokerage general agencies, giving us access to more than 150,000 financial professionals to market our retirement, protection and investment solutions; and |
| • | An AB global distribution team of more than 500 professionals, who engage with our approximately 4,900 retail distribution partners and more than 500 institutional clients. |
We are confident that our market-leading positions, premier distribution platform, competitive products and investment expertise position us well to continue to generate a diversified and growing stream of earnings, maintain stability through market cycles and generate attractive returns and strong cash flows for our stockholders.
Our Businesses
Our four segments, Individual Retirement, Group Retirement, Investment Management and Research, and Protection Solutions, are well-established and distinct businesses, but complementary to one another. For example, as of December 31, 2017, AB managed 69% of AXA Equitable Life’s General Account and 29% of its Separate Account assets. Our segments allow us to deliver comprehensive services to our clients and provide us with capital diversification benefits and product development and margin improvement opportunities. As of December 31, 2017, our retirement and protection businesses had approximately 2.8 million clients, including approximately 766,000 in our Individual Retirement segment, and AB had approximately 2.6 million client accounts. The diversity of products and services offered by our businesses contributes to strong retention of financial professionals within AXA Advisors. We report certain activities and items that are not included in our segments in Corporate and Other.
2
Table of Contents
Our product approach is to ensure that design characteristics are attractive to both our customers and our stockholders. We currently focus on products across our businesses that expose us to less market and customer behavior risk, are more easily hedged and, overall, are less capital intensive than many traditional products. Our current suite of variable annuity products has been redesigned with reduced, floating rate, return of premium only or no guaranteed minimum living or death benefits (we refer to all forms of variable annuity guaranteed benefits, including guaranteed minimum living benefits and guaranteed minimum death benefits, as GMxB features). In 2008, most of our variable annuity first year premium and deposits (“FYP”) consisted of sales of variable annuity products with fixed rate GMxB features. In 2017, by comparison, variable annuity products with fixed rate GMxB features accounted for 1% of FYP. As of December 31, 2017, 48% of the total variable annuity AV in our Individual Retirement segment was attributable to variable annuity products that included fixed rate GMxB features, with the remaining AV attributable to variable annuity products with floating rate GMxB features (21% of total variable annuity AV), with return of premium death benefits only (9% of total variable annuity AV) and with no GMxB features (22% of total variable annuity AV).
Individual Retirement
We are a leading provider of variable annuity products, which are primarily sold to affluent and high net worth individuals saving for retirement or seeking guaranteed retirement income. We sell our variable annuity products through our affiliated retail sales force and a wide network of approximately 600 third-party firms, including banks, broker-dealers and insurance partners, reaching more than 100,000 advisors. As of December 31, 2017, we ranked third in variable annuity market share based on sales, according to Morningstar, Inc. (“Morningstar”), and our wholesalers serving third-party firms ranked second in variable annuity sales productivity in the third-party channel, according to preliminary data from Market Metrics.
We offer variable annuity products that help our clients accumulate wealth and prepare for their retirement income needs. We focus on three variable annuity products:
| • | Structured Capital Strategies, or SCS, a variable annuity with an index-linked feature that offers policyholders growth potential up to a cap and certain downside protection. This variable annuity does not offer GMxB features, other than a return of premium death benefit that we have introduced in some versions. For the year ended December 31, 2017, SCS sales represented 53% of our total variable annuity FYP. |
| • | Retirement Cornerstone, a multi-stage variable annuity that provides both wealth accumulation and guaranteed income and death benefits for policyholders. Customers have the option to elect a floating rate GMIB guarantee on this product for an additional fee. For the year ended December 31, 2017, Retirement Cornerstone sales represented 36% of our total variable annuity FYP. |
| • | Investment Edge, primarily a wealth accumulation variable annuity offering a unique tax efficient distribution option. This variable annuity does not offer any GMxB feature other than an optional return of premium death benefit. For the year ended December 31, 2017, Investment Edge sales represented 6% of our total variable annuity FYP. |
We frequently update our existing product benefits as well as introduce new products and benefits to our variable annuity product portfolio to meet the evolving needs of our clients and better manage the risk of these products. Due to our innovation, our product mix has evolved considerably since the financial crisis. The majority of our sales in 2017 consisted of products without GMxB features (other than the return of premium death benefit), and 1% of 2017 FYP had fixed rate guarantees. We believe that our current portfolio of less capital intensive products offers us an attractive risk-adjusted return.
As of December 31, 2017, we had more than 900,000 variable annuity policies in force, representing approximately $103.4 billion of AV. This in-force book contains the three primary products described above, as well as other products, which may contain GMxB features.
3
Table of Contents
To actively manage and protect against the economic risks associated with our in-force GMxB products, our management team has taken a multi-pronged approach. We use a dynamic hedging strategy to offset changes in the economic liability of our GMxB features due to changes in equity markets and interest rates (within this strategy we reevaluate our economic exposure at least daily and rebalance our hedge positions accordingly). In addition to our dynamic hedging strategy, in the fourth quarter of 2017 and the first quarter of 2018, we implemented static hedge positions (derivatives positions intended to be held to maturity with less frequent rebalancing) to maintain a target asset level for all variable annuities at or above a CTE98 level under most economic scenarios, and to maintain a CTE95 level even in extreme scenarios. We expect to adjust from time to time our static equity hedge positions to maintain our target level of CTE protection over time. In addition to these hedging strategies, we employ various other methods to manage the risks of our in-force variable annuity products, including asset-liability matching, volatility management tools within the Separate Accounts and an active in-force management program, including buyout offers for certain products.
The Individual Retirement business is an important source of earnings and cash flow for our company, and we believe our hedging strategy preserves a substantial portion of these cash flows across a wide range of risk scenarios. The primary sources of revenue for the Individual Retirement segment include fee revenue and investment income.
For the year ended December 31, 2017, Individual Retirement segment revenue was $4.4 billion and segment operating earnings were $1.3 billion.
Group Retirement
Our Group Retirement business offers tax-deferred investment products and related solutions to employer-sponsored retirement plans sponsored by educational and not-for-profit entities (including municipal governments), as well as small and medium-sized businesses. We operate in the 403(b), 401(k) and 457(b) markets where we sell variable annuities and mutual fund products. As of December 31, 2017, we had relationships with approximately 26,000 employers and served more than 1.0 million participants, of which approximately 725,000 were educators. A specialized division of AXA Advisors, the Retirement Benefits Group (“RBG”), is the primary distributor of our products and related solutions to the education market with more than 1,000 advisors dedicated to helping educators prepare for retirement as of December 31, 2017. We also distribute these products and solutions through third-party firms. As of December 31, 2017, we had approximately $33.9 billion of AV.
In Group Retirement, for the year ended December 31, 2017, we were the #1 provider by gross premiums of retirement plans to the K-12 education market, according to LIMRA. The tax exempt 403(b)/457(b) market, which includes our 403(b) K-12 business, accounted for the majority of sales within the Group Retirement business for the year ended December 31, 2017 and represented 75% of Group Retirement AV, as of December 31, 2017.
The recurring nature of the revenues from our Group Retirement business make this segment an important and stable contributor of earnings and cash flow to us. The primary sources of revenue for the Group Retirement business include fee revenue and investment income.
For the year ended December 31, 2017, Group Retirement segment revenue was $947 million and segment operating earnings were $283 million.
Investment Management and Research
Our global Investment Management and Research business provides diversified investment management, research and related solutions to a broad range of clients around the world. We distribute our investment
4
Table of Contents
management products and solutions through three main client channels—Institutional, Retail and Bernstein Private Wealth Management—and distribute our institutional research products and solutions through Bernstein Research Services. AB Holding is a master limited partnership publicly listed on the NYSE (symbol: AB). Giving effect to the Reorganization Transactions, we will own an approximate 65% economic interest in AB at the time of the offering. As the general partner of AB, we have the authority to manage and control its business, and accordingly, this segment reflects AB’s consolidated financial results.
Our Investment Management and Research business had approximately $554 billion in AUM as of December 31, 2017, composed of 35% equities, 54% fixed income and 11% multi-asset class solutions, alternatives and other assets. By distribution channel, institutional clients represented 48% of AUM, while retail and private wealth management clients represented 35% and 17%, respectively, as of December 31, 2017.
Bernstein Research Services has received top Institutional Investor rankings and Bernstein Private Wealth Management ranks among the top 20 wealth management firms in the United States, according to Barron’s.
AB has a strong global distribution footprint. For the year ended December 31, 2017, 41% of AB’s revenues came from outside the United States, with a significant portion derived from retail fixed income sales in the Asia region (excluding Japan). We have strong market positions in many of the region’s largest markets. As of December 31, 2016, we had a 23% market share of total retail assets in Taiwan, and our market share was 12% in both Hong Kong and Korea and 5% in Singapore.
Additionally, over the past several years AB has significantly broadened and strengthened its product portfolio, introducing more than 100 new and enhanced offerings since 2009. These services account for approximately 28% of AB’s AUM as of December 31, 2017. Examples include our Select Equities and U.S. and Global Concentrated Equity services, our middle markets private lending service, and our real estate private equity and debt service.
We and other AXA affiliates, collectively, are AB’s largest client. We represented 17% of AB’s total AUM as of December 31, 2017 and 3% of AB’s net revenues for the year ended December 31, 2017. AXA and its affiliates other than us represented 6% of AB’s total AUM as of December 31, 2017 and 2% of AB’s net revenues for the year ended December 31, 2017. Additionally, AXA and its affiliates (including us) have made seed investments in various AB investment services.
The primary sources of revenue for the Investment Management and Research segment include investment advisory and services fees calculated as a percentage of AUM and commissions received for providing equity research and brokerage-related services to institutional investors.
For the year ended December 31, 2017, Investment Management and Research segment revenue was $3.2 billion and segment operating earnings were $211 million (reflecting our approximately 47% economic interest in AB as of December 31, 2017).
Protection Solutions
Our Protection Solutions business includes our life insurance and employee benefits businesses.
We offer a targeted range of life insurance products aimed at serving the financial needs of our clients throughout their lives. Our product offerings include VUL, IUL and term life products, which represented 48%, 41% and 9% of our total life insurance annualized premium, respectively, for the year ended December 31, 2017. Our life insurance products are primarily designed to help affluent and high net worth individuals as well as small and medium-sized business owners protect and transfer their wealth and are primarily distributed through AXA Advisors and select third-party firms. Our Protection Solutions segment benefits from a long-term, stable distribution relationship with AXA Advisors.
5
Table of Contents
As of December 31, 2017, we had approximately 900,000 outstanding life insurance policies with a face value of $446 billion. In 2017, our VUL sales ranked fourth in the total U.S. market and first in the retail channel, and our IUL sales ranked second in the retail channel, according to LIMRA.
Our life insurance business provides a stable source of cash flows through its in-force book. In addition, the underlying mortality profile of our life insurance business complements the longevity profile in our individual and group retirement businesses, resulting in significant capital diversification benefits under our internal economic model, RBC and rating agency frameworks, allowing us to hold less capital than those frameworks would otherwise require for our individual and group retirement businesses alone.
In 2015, we entered the employee benefits business. We currently offer a suite of life, short and long-term disability, dental and vision insurance products to small and medium-sized businesses. We believe our employee benefits business will further augment our offerings to small and medium-sized businesses and is differentiated by a best-in-class technology platform. We sell our employee benefits products through AXA Advisors and third-party firms, including regional, national and local brokers.
The primary sources of revenue for our Protection Solutions segment include policy fees, premiums and investment income.
For the year ended December 31, 2017, Protection Solutions segment revenue was $3.0 billion and segment operating earnings were $536 million.
Corporate and Other
Corporate and Other includes certain of our financing and investment expenses. It also includes: the AXA Advisors broker-dealer business, closed block of life insurance (the “Closed Block”), run-off variable annuity reinsurance business, run-off group pension business, run-off health business, benefit plans for our employees, certain strategic investments and certain unallocated items, including capital and related investments, interest expense and corporate expense. AB’s results of operations are reflected in the Investment Management and Research segment. Accordingly, Corporate and Other does not include any items applicable to AB. For the year ended December 31, 2017, operating revenue for Corporate and Other was $1.2 billion and operating loss for Corporate and Other was $196 million.
Market Opportunities
Global asset accumulation markets continued their strong recent growth trend with total AUM reaching $81 trillion, up 6% year over year, including in the North American market, where total AUM increased by 8% year-over-year to $47 trillion as of December 31, 2016, according to Willis Towers Watson. In addition, the United States has experienced a decline in the traditional employer-based defined benefit retirement plan system which has raised concerns about the sustainability of safety nets historically provided by governments such as Social Security and employer-sponsored defined benefit plans. These trends have increased the need for Americans to prepare and plan for their own long-term financial security. Our complementary businesses are designed to provide affluent and high net worth Americans with the guidance, products and solutions they need to achieve their wealth accumulation and retirement income goals. We believe the following long-term trends will continue to favorably impact our business over time.
Continued rapid growth in the retirement-aged U.S. population. Technological advances and improvements in healthcare are projected to continue to contribute to increasing average life expectancy, and aging individuals must be prepared to fund retirement periods that will last longer than previously anticipated. The U.S. Census Bureau estimated that approximately 15% of the population was 65 years of age or older in
6
Table of Contents
2016, compared to approximately 9% in 1960. This segment of the population is estimated to double from approximately 49 million in 2016 to more than 98 million by 2060, and it is expected to represent approximately 24% of the overall population, as the youngest members of the “baby boomer” generation continue to reach retirement age.
Shifting retirement savings landscape. The Employee Benefit Research Institute estimates that the proportion of private sector workers participating only in a defined benefit plan declined from 28% in 1979 to 2% in 2014. Increased life expectancy, coupled with this transition away from defined benefit plans, has shifted the responsibility for retirement savings and income planning from employers to individuals. We expect that this shift in responsibility will drive demand for our products and services including wealth accumulation, income producing investments and financial advice.
Expected growth in retirement assets. U.S. retirement assets are estimated to increase by 5.2% per year from 2016 through 2021 to $29 trillion, with assets in the not-for-profit/governmental defined contribution sector projected to grow slightly faster at 6.6% for the same period. We believe that our retirement focused asset accumulation business will continue to benefit from this trend.
Strong need for financial planning advice. According to a recent McKinsey & Co. survey, roughly half of U.S. consumers with more than $100,000 in liquid financial assets surveyed said that they would prefer to purchase life insurance through an agent or advisor, even if they may start their research online. We believe that due to the complexity of financial planning, many consumers will continue to seek advice in connection with the purchase of these products, providing companies with broad distribution platforms and in-house advice capabilities a competitive advantage.
We believe that these trends, together with our competitive strengths and strategy discussed below, provide us an opportunity to increase the value of our business.
Our Competitive Strengths
Our two well-established principal franchises, AXA Equitable Life and AllianceBernstein, have a history of agility and innovation. At a time of significant challenges for investors—increased regulation, new technologies and a likely continued low yield environment—the ability to develop new creative solutions is critical for meeting clients’ needs and growing our businesses. Our company has a long history of developing innovative solutions, including introducing variable life insurance to the U.S. market, being one of the pioneers in performance fees for actively managed funds and launching our SCS product. Through Bernstein Research, we have a strong reputation for demonstrating that deeper research results in greater investment value.
Our strong balance sheet provides confidence for the future. We believe the strength of our balance sheet and the statutory capitalization of our insurance companies provide confidence to our clients and business partners and help position us for continued growth. In particular:
| • | In 2017, we increased the statutory capital and reserves of our retirement and protection businesses by approximately $2.3 billion, improving our ability to withstand adverse economic scenarios. As of December 31, 2017, our insurance company subsidiaries had statutory TAC of approximately $8.7 billion, resulting in a Combined RBC Ratio of approximately 650%; |
| • | Additionally, in April 2018, we effected the unwind of the reinsurance provided to AXA Equitable Life by AXA RE Arizona for certain variable annuities with GMxB features. As a result of the unwind and based on information available as of December 31, 2017, we estimate that the statutory TAC of our insurance company subsidiaries increased by $0.7 billion, which, if such unwind had occurred on or prior to December 31, 2017, would have resulted in an increase in our Combined RBC Ratio of 50 percentage points to approximately 700% as of December 31, 2017; |
7
Table of Contents
| • | We target maintaining an asset level for all variable annuities at or above a CTE98 level under most economic scenarios and an RBC ratio of 350-400% for non-variable annuity insurance liabilities, which, combined with the variable annuity capital, would result in a Combined RBC Ratio in excess of 500%; and |
| • | We have a diversified, high quality $82 billion investment portfolio as of December 31, 2017, including $47 billion in fixed maturities classified as available-for-sale, of which 97% are investment grade rated. |
Our business generates significant cash and we have in place a hedging program to protect our cash flows even in adverse economic scenarios. Our two principal operating companies are well established and have been generating, and are expected to continue to generate, significant cash, enabling us to pay dividends beginning in 2018, provide capital needed to support our business and service our debt over time. From 2014 to 2016, Holdings and AXA Financial received net distributions from our subsidiaries of $2.6 billion. In 2017, in accordance with our agreement with the NYDFS and in preparation for this offering, Holdings and AXA Financial collectively made $2.3 billion in aggregate capital contributions to AXA Equitable Life and AXA RE Arizona. In addition, we have implemented a hedging program intended to protect our variable annuity assets and statutory capital in the event of adverse economic scenarios.
Our leading retirement businesses are well-positioned to grow. There is a growing need for financial products that provide retirement income as well as a measure of protection against equity market volatility. In both the affluent and high net worth markets and in the K-12 education market, we believe that we are well-positioned to benefit from the growing and aging U.S. population and the continued shift away from defined benefit plans.
| • | For affluent and high net worth clients approaching retirement, our individual retirement products offer customers protection against market volatility and help instill confidence that their income needs will be satisfied in their retirement years. |
| • | In our Group Retirement business, we are the leading provider of retirement products and related solutions for the growing 403(b) K-12 education market. Our nationwide footprint of advisors provides valuable advisory services to a wide range of clients in the education market saving for retirement. |
Our Investment Management and Research business is strategically positioned to grow. We believe our Investment Management and Research business is well-positioned to navigate an evolving environment in which growth in passive strategies is pressuring fees for many active asset managers. We sell products and solutions that are difficult to replicate through passive mechanisms, including many of our credit, multi-asset and alternative strategies. We are present in markets worldwide, many of which have been less affected by the growth of passive investment options, such as parts of Asia. Additionally, a significant majority of our active equity and fixed income assets are in services that regularly exceed their benchmarks for the three-year performance period. The combination of relevance and performance has resulted in an annual organic growth rate for AB that has exceeded the average of AB’s closest asset manager peers for the past three years.
Our Protection Solutions business is well established and has growth potential in select segments. We are one of the leading life insurance providers in the United States, specifically with respect to VUL and IUL, and are committed to disciplined underwriting. Our in-force portfolio provides diversification on our statutory capital base and attractive cash flows. Over the years, much of this market has become commoditized, and we now selectively focus on the less capital intensive VUL and IUL accumulation segments of the market.
Our focus on less capital intensive fee-based products results in lower capital needs. Our ability to create less capital intensive products and solutions that meet the evolving needs of our clients, while still achieving our risk-adjusted return targets, has allowed us in recent years to capture increased market share, particularly in the variable annuity market. Our Individual Retirement, Group Retirement and Investment Management and Research segments’ earnings are predominantly fee-based.
8
Table of Contents
Our premier affiliated retail and institutional distribution platform differentiates us from competitors. We benefit from a broad reach across affiliated and third-party channels. Our affiliated retail distribution platform consists of our nearly 4,700 licensed AXA Advisors, as well as a direct network of nearly 200 Bernstein Financial Advisors serving approximately 15,000 high net worth clients as of December 31, 2017. The institutional platform in our retirement and protection segments is broad with more than 1,000 third-party relationships providing access to an additional approximately 150,000 financial professionals, while AB’s global distribution team of more than 500 professionals reach approximately 4,900 distribution partners and more than 500 institutional clients. We believe that our close alignment with our affiliated distribution platform, in conjunction with our extensive and growing network of third-party relationships, differentiates us from our competitors and allows us to effectively distribute our products and write high-quality new business.
Our disciplined risk management framework protects our balance sheet. We have well-developed technical risk management capabilities which are embedded throughout our business. Our decisions are driven by an internal economic model designed to ensure that we protect our solvency, honor our obligations to our clients and provide attractive risk-adjusted returns for our stockholders. For example, our variable annuity hedging strategy is focused on protecting the economic value of our liabilities while allowing us to return cash to our stockholders through dividends and share repurchases across a variety of economic scenarios.
Our highly experienced management team brings strong capabilities. We are led by well-respected industry veterans who bring diverse U.S. and global experiences with long-standing experience in the financial services industry.
Summary Risk Factors
Our business is subject to a number of risks, including risks that may prevent us from achieving our business objectives or may adversely affect our business, results of operations or financial condition that you should consider before making a decision to invest in our common stock. These risks are discussed more fully in “Risk Factors” in this prospectus. These risks include, but are not limited to, the following:
| • | Conditions in the global capital markets and the economy could materially and adversely affect our business, results of operations or financial condition. Factors such as consumer spending, business investment, government debt and spending, the volatility and strength of equity markets, interest rates, deflation and inflation all affect the business and economic environment and, ultimately, the amount and profitability of our business; |
| • | Equity market declines and volatility may materially and adversely affect our business, results of operations or financial condition. Our variable annuity business in particular is highly sensitive to equity markets, and a sustained weakness or stagnation in equity markets could decrease our revenues and earnings with respect to those products; |
| • | Interest rate fluctuations or prolonged periods of low interest rates may materially and adversely impact our business, results of operations or financial condition; |
| • | GMxB features within certain of our products may decrease our earnings, decrease our capitalization, increase the volatility of our results, result in higher risk management costs and expose us to increased counterparty risk; |
| • | This prospectus contains financial goals, reserves and cash flow projections, which are based on certain assumptions and estimates, including as to market conditions, likely utilization of GMxB product features, overall lapse rates and mortality and longevity experience. Our actual experience in the future may deviate from our assumptions and estimates and may impact our reserves, earnings and capitalization and may increase the volatility of our results and expose us to increased counterparty risk; |
9
Table of Contents
| • | Our reinsurance and hedging programs may be inadequate to protect us against the full extent of the exposure or losses we seek to mitigate. Downturns in equity markets or reduced interest rates could result in an increase in the valuation of liabilities associated with such products, resulting in increases in reserves and reductions in net earnings. Our hedging and reinsurance programs cannot eliminate all of these risks, and no assurance can be given as to the extent to which such programs will be completely effective in reducing these risks; |
| • | We face competition from other insurance companies, banks, asset managers and other financial institutions, which may adversely impact our market share and consolidated results of operations; |
| • | Elements of our business strategy are new and may not be effective in accomplishing our objectives, and we may not be able to improve our Non-GAAP Operating ROE as expected, including as a result of assumptions that may prove not to be accurate; |
| • | AB’s revenues and results of operations depend on the market value and composition of AB’s AUM, which can fluctuate significantly based on various factors, including many factors outside of its control such as market factors, client preferences, investing trends and service changes; |
| • | The revenues generated by Bernstein Research Services may be adversely affected by circumstances beyond our control, including declines in brokerage transaction rates, declines in global market volumes, failure to settle our trades by significant counterparties and the effects of MiFID II (as defined below); |
| • | Our inability to recruit, motivate and retain key employees and experienced and productive financial professionals may have a material adverse effect on our business, results of operations or financial condition; |
| • | Our retirement and protection businesses are heavily regulated, and changes in regulation and in supervisory and enforcement policies may limit our growth and have a material adverse effect on our business, results of operations or financial condition. For example, insurance regulators have implemented, or begun to implement, significant changes in the way in which insurers must determine statutory reserves and capital, which is particularly relevant to our variable annuity business and which could have a material adverse effect on our business and the Department of Labor has issued a rule with respect to fiduciary investment under ERISA; |
| • | The amount of statutory capital that we have and the amount of statutory capital we must hold to meet our statutory capital requirements and our financial strength and credit ratings can vary significantly from time to time; |
| • | The ability of our insurance subsidiaries to pay dividends and other distributions to Holdings is limited by state insurance laws, and our insurance subsidiaries may not generate sufficient statutory earnings or have sufficient statutory surplus to enable them to pay ordinary dividends; |
| • | Our profitability may decline if mortality, longevity or persistency or other experience differ significantly from our pricing expectations or reserve assumptions. For example, if policyholder elections differ from the assumptions we use in our pricing, our profitability may decline; |
| • | The industry-wide shift from actively-managed investment services to passive services has adversely affected AB’s investment advisory and services fees, revenues and results of operations, and this trend may continue; |
| • | We and AXA and its affiliates provide a significant amount of AB’s AUM and fund a significant portion of AB’s seed investments, and, if we or they choose to terminate their investment advisory agreements or withdraw capital support, it could have a material adverse effect on AB’s business, results of operations or financial condition; |
10
Table of Contents
| • | AB’s clients can withdraw the assets it manages on short notice, making its future client and revenue base unpredictable; |
| • | The Tax Reform Act (as defined below) could have adverse or uncertain impacts on some aspects of our business, results of operations or financial condition; |
| • | Future changes in U.S. tax laws and regulations or interpretations thereof could reduce our earnings and negatively impact our business, results of operations or financial condition, including by making our products less attractive to consumers; |
| • | Legal and regulatory actions could have a material adverse effect on our reputation, business, results of operations or financial condition. These actions involve, among other things, insurers’ sales practices, alleged agent misconduct, alleged failure to properly supervise agents, contract administration, product design, features and accompanying disclosure, cost of insurance increases, the use of captive reinsurers, payment of death benefits and the reporting and escheatment of unclaimed property, alleged breach of fiduciary duties, discrimination, alleged mismanagement of client funds and other general business-related matters. Some of these matters have resulted in the award of substantial fines and judgments, including material amounts of punitive damages, or in substantial settlements; |
| • | During the course of preparing our U.S. GAAP financial statements for this offering, we identified two material weaknesses in our internal control over financial reporting. If our remediation of these material weaknesses is not effective, we may not be able to report our financial condition or results of operations accurately or on a timely basis, which could materially and adversely affect investor confidence in us and, as a result, the price of our common stock; |
| • | As a result of misstatements in our previously issued financial statements due to these material weaknesses, we have restated and revised previously issued annual and interim financial statements; |
| • | Following the settlement of this offering, AXA will continue to control us and may have conflicts of interest with other stockholders. Conflicts of interest may arise because affiliates of our controlling stockholder have continuing agreements and business relationships with us. As a result of AXA’s majority interest, AXA will continue to be able to control the election of our directors, determine our corporate and management policies and determine, without the consent of our other stockholders, the outcome of any corporate action or other action submitted to our stockholders for approval, including potential mergers or acquisitions, asset sales and other significant corporate transactions; |
| • | Following the settlement of this offering, we may fail to replicate or replace functions, systems and infrastructure provided by AXA or certain of its affiliates (including through shared service contracts) or lose benefits from AXA’s global contracts, and AXA and its affiliates may fail to perform the services provided for in the Transitional Services Agreement (as defined in “Certain Relationships and Related Party Transactions”); |
| • | Costs associated with any rebranding that we expect to undertake after AXA ceases to own at least a majority of our outstanding common stock could be significant; |
| • | We may be subject to ongoing regulation as a result of AXA’s ownership of us following this offering and for as long as we are an affiliate of AXA; |
| • | The insurance that we maintain may not fully cover all potential exposures. For example, we are party to certain joint insurance arrangements with AXA; accordingly, if AXA ceases to own a majority of our outstanding common stock, we may need to obtain stand-alone insurance coverage, which may be at a higher price for the same coverage, which would increase our costs and may materially and adversely affect our business, results of operations or financial condition; |
| • | After this offering, certain of our directors may have actual or potential conflicts of interest because of their AXA equity ownership or their current or former AXA positions. For example, potential conflicts |
11
Table of Contents
| of interest could arise in connection with the resolution of any dispute that may arise between AXA and us regarding the terms of the agreements governing our relationship with AXA after the settlement of this offering; and |
| • | As of December 31, 2017, on a pro forma basis giving effect to the Reorganization Transactions, we would have had $5.2 billion of indebtedness (including approximately $4.1 billion of indebtedness we incurred in connection with the Recapitalization), and the degree to which we will be leveraged following completion of the Reorganization Transactions and this offering could materially and adversely affect our business, results of operations, or financial condition. |
Our Strategy
Our overarching objective is to position Holdings as the most trusted partner to clients by providing advice, products and services that help them navigate complex financial situations. We believe we are well-positioned to use our competitive strengths to grow our earnings base, actively manage our capital and generate attractive risk-adjusted returns for our stockholders. We have identified specific initiatives that are designed to grow our business, enhance productivity and optimize our capital. Underpinning this strategy is our commitment to disciplined risk management and a sound people strategy.
Growth Strategies
Deliver organic growth by focusing on attractive market segments. We intend to continue to innovate across our businesses, enhancing existing products and creating new products to service the needs of our retail and institutional clients.
Individual Retirement—We plan to further build on our market-leading position in the variable annuity market through continued innovation in our product portfolio to address evolving customer preferences and will seek opportunities to continue to expand our distribution network by deepening relationships with existing partners and developing relationships with new partners and channels. A key component of our strategy is to ensure that we maintain an “all-weather” portfolio to meet the needs and risk appetites of consumers through different market cycles. An example of this is the significant success we have had with SCS, which is designed to meet consumers’ preference for some downside protection while sharing in the potential for market upside.
Group Retirement—We will take advantage of our market-leading position in the K-12 education market where we expect attractive growth prospects through our more than 1,000 dedicated advisors serving clients in more than 8,800 public school plans as of December 31, 2017. We see further growth opportunities through expansion of our distribution capabilities and plan to use our new mutual fund platform to retain existing clients and expand our client base. We will continue to leverage technology through our direct marketing and online enrollment program, which provides an omni-channel capability to augment our proven advisor model.
Investment Management and Research—We will continue to build on AB’s heritage of research excellence and ingenuity to develop new actively managed solutions for which investors see value and are willing to pay a price premium over passively managed alternatives.
AB has a suite of actively managed, differentiated equity and fixed income services, delivering strong risk-adjusted returns. For instance, 91% of our fixed income services and 85% of our equity services have outperformed their benchmarks over the three-year period ended December 31, 2017.
In addition, our Multi-Asset Solutions group develops outcome-oriented services for institutional and retail clients, including innovative offerings such as our multi-manager target-date funds and our hedge fund replication strategies. We also have a diverse offering of alternative strategies with strong emerging track records that we expect to commercialize and grow over the next three years.
12
Table of Contents
Protection Solutions—We will focus our strategy on asset accumulation segments that are less capital intensive, such as VUL and IUL insurance which offer attractive risk-adjusted returns. We plan to improve our Non-GAAP Operating ROC by segment and operating earnings over time through earnings generated from sales of our repositioned product portfolio and by proactively managing and optimizing our in-force book.
In 2015, we entered the employee benefits market and have been focused on growing our capabilities. Using our strong presence in the small and medium-sized businesses market, we have developed a differentiated value proposition for employers where margins remain attractive.
Continue to expand and deepen our distribution channels. Over the last three years, we have had strong sales growth while maintaining attractive risk-adjusted returns. The combination of a strong affiliated sales force, symbiotic third-party relationships, financial strength and innovative product design has allowed us to achieve this while shifting our mix of business towards less capital intensive products.
We see opportunities for continued growth by expanding our affiliated and third-party distribution channels. We plan to expand our third-party distribution footprint with select partners and grow our footprint in the fee-based registered investment adviser channel. We have a track record in building new channels such as selling retirement products through insurance partners, which commenced in 2011 and accounted for approximately $674 million of FYP in 2017.
We plan to enhance sales delivery through investments in automation, analytics and digital capabilities. In recent years, we have upgraded our financial planning tool software for our advisers, and built new distribution capabilities alongside our affiliated sales force such as our outbound customer relations unit.
At AB, we are investing in our distribution capabilities to accelerate growth of well-performing products in U.S. and European retail channels. We are building our institutional sales capability to drive increased penetration of Multi-Asset Solutions and alternatives and deploying digital technologies to accelerate growth in our Private Wealth Management division. In addition, we will continue to leverage AB’s leading position in certain Asian markets to distribute our differentiated equity and fixed income solutions.
Productivity Strategies
Enhance profitability through diligent focus on managing expenses while still delivering a best-in-class customer experience. Over the last five years, we have delivered more than $350 million in productivity and efficiency gains, principally through right-sizing our organization, selectively outsourcing certain functions, reducing our real estate footprint and implementing information technology productivity measures. We see additional opportunities to improve profitability across our businesses through operating expense reductions, without impacting our ability to serve our existing clients and grow our businesses. In particular, we plan to:
| • | Shift our real estate footprint away from the New York metropolitan area to provide space efficiencies and lower labor costs and, where possible, take advantage of state and local tax incentives; |
| • | Replace costly technology infrastructure with more efficient and more up-to-date alternatives, including cloud-based solutions, and use lean management and agile practices to both enhance service and reduce infrastructure cost; |
| • | Leverage new technologies to further drive productivity, including accelerating our eDelivery, self-service and paperless initiatives to both improve service and reduce operating costs; and |
| • | Expand existing outsourcing arrangements (currently several hundred roles supporting service and finance) to further improve cost competitiveness. |
13
Table of Contents
Capital Optimization
Optimize our General Account portfolio. Currently, we have an outsized position in U.S. Treasury bonds when compared to many of our principal competitors in the United States and a relatively short credit portfolio duration. Over time, we expect to gradually transition our portfolio to be in line with our economic liabilities and better optimize our capital under a U.S. framework. Principally, we plan to transition a portion of our investment portfolio from U.S. Treasury bonds to high quality investment grade corporate bonds, as well as extend our investment portfolio’s credit duration, resulting in a meaningful increase in the yield on our General Account assets.
Proactively manage our business portfolio. One of our primary objectives is to improve our financial performance. In addition to driving operating earnings, we plan to continue to proactively manage our in-force portfolio to ensure we optimize equity invested in our businesses. This includes market transactions, reinsurance and exercising contractual rights as appropriate. Underpinning this is our strong experience in managing our various portfolios through actions such as buyouts, fund substitutions and portfolio sales.
Return capital to stockholders. We will focus on returning excess capital to stockholders actively and prudently. Our expected sources of excess capital generation over the course of the next several years include cash flow generated by earnings associated with our diverse, seasoned portfolio of retirement and protection businesses and quarterly unitholder distributions from our economic interest in AB, of which more than half will be held outside of our insurance company subsidiaries after giving effect to the Reorganization Transactions.
Risk Management Strategy
Maintain risk management discipline. The goal of our risk management strategy is to protect capital, enable growth and achieve profitable results across various market cycles. For our variable annuity business, we use a dynamic hedging strategy to offset changes in the economic liability of our GMxB features due to changes in equity markets and interest rates. In addition to our dynamic hedging strategy, in the fourth quarter of 2017 and the first quarter of 2018, we implemented static hedge positions to maintain a target asset level for all variable annuities at or above a CTE98 level under most economic scenarios, and to maintain a CTE95 level even in extreme scenarios. We expect to adjust from time to time our static equity hedge positions to maintain our target level of CTE protection over time. For our non-variable annuity insurance businesses, we aim to maintain a 350-400% RBC ratio, which, combined with the variable annuity capital, would result in a Combined RBC Ratio in excess of 500%.
In addition, we expect that our diverse, seasoned in-force book of business should continue to generate statutory earnings further bolstering our statutory capital position. We expect to have a debt-to-capital ratio that supports strong financial strength ratings. We expect to have a debt-to-capital ratio of approximately 26% at the time of this offering and expect to maintain a mid-20s% debt-to-capital ratio going forward.
We have enhanced our internal economic model to orient the company more toward U.S. regulatory and capital frameworks. Product pricing, new portfolio investments and capital distribution decisions are driven by this economic model and are designed to protect our economic solvency, honor our obligations to our clients and provide attractive risk-adjusted returns for our stockholders.
People Strategy
Raising likelihood of success through our people strategy. We understand that to execute our plan successfully we need not only a sound business strategy but an equally well-developed people strategy. In addition to ensuring strong alignment across our organization to our goals and strategies, we will continue our long-standing commitment to building a culture of inclusion, professional excellence and continuous learning. We are very pleased to have been recognized as a “Great Place to Work” in 2016 and 2017 by the Great Place to Work® Institute, an independent
14
Table of Contents
workplace authority. Professional development has always been a key part of our philosophy. For example, we were a founding partner with The American College of Financial Services in developing the Chartered Life Underwriter designation, which remains the industry standard. In addition to investing in our people’s development, we continually look for opportunities to bring in fresh talent to augment our team.
Financial Goals
We have designed our financial goals to maintain a strong balance sheet while delivering disciplined profitable growth. We have established the following financial goals which we believe best measure the execution of our business strategy and align with our stockholders’ interests:
| • | Target asset level for all variable annuities at or above a CTE98 and an RBC ratio of 350-400% for our non-variable annuity insurance liabilities; |
| • | Return of capital to stockholders equal to at least 40-60% of our Non-GAAP Operating Earnings on an annualized basis starting in 2018, including payment of a dividend; |
| • | Target a compound annual growth rate in our Non-GAAP Operating Earnings of 5-7% through 2020, subject to market conditions; and |
| • | We expect that the target growth in Non-GAAP Operating Earnings combined with our target return of capital to stockholders will result in Non-GAAP Operating ROE in the mid-teens by 2020. |
These goals are based on certain assumptions, including assumptions regarding interest rates and market performance. In calculating these goals, we exclude several significant impacts to our Protection Solutions Segment in 2017, including actuarial assumption updates and model changes, a maintenance expense assumption update, a mortality table update and loss recognition testing. For further information, see “Management’s Discussion and Analysis of Financial Condition and Results of Operations—Results of Operations by Segment—Protection Solutions.” We also exclude the beneficial impact anticipated of tax reform on Non-GAAP Operating Earnings. Actual results related to these goals may vary depending on various factors, including actual capital market outcomes, changes in actuarial models or emergence of actual experience, changes in regulation as well as other risks and factors discussed in “Business—Financial Goals” and “Risk Factors.” Non-GAAP Operating ROE and Non-GAAP Operating Earnings are non-GAAP financial measures. See “Management’s Discussion and Analysis of Financial Condition and Results of Operations—Key Operating Measures.”
Our Relationship with AXA
We are, and until the settlement of this offering will continue to be, a wholly owned subsidiary of AXA, a worldwide leader in life, property and casualty and health insurance and asset management. AXA is headquartered in France, with operations in 64 countries and more than 165,000 employees, including our operations and employees. AXA operates primarily in Europe, North America, the Asia/Pacific region and, to a lesser extent, in other regions including the Middle East, Africa and Latin America. Neither AXA nor any affiliate of AXA will have any obligation to provide additional capital or credit support to us following the settlement of this offering.
Following this offering, AXA will continue to hold a majority of our outstanding common stock, and as a result AXA will continue to have control of our business, including pursuant to the agreements described in “Certain Relationships and Related Party Transactions.” AXA has announced its intention to sell all of its interest in Holdings over time with intended sales of shares of our common stock subsequent to this offering, subject to the 180-day lock-up agreement described under “Underwriting” and market conditions. AXA is under no obligation to do so and retains the sole discretion to determine the timing of any future sales of shares of our common stock. In addition, we expect that AXA will continue to fully consolidate our financial results in AXA’s consolidated financial results at least until such time AXA ceases to beneficially own more than 50% of our common stock.
15
Table of Contents
Concurrently with this offering, AXA is offering mandatorily exchangeable securities, which will be mandatorily exchangeable into up to 33,823,529 issued and outstanding shares of our common stock (assuming $750 million principal amount, the midpoint of the price range set forth on the cover page of this prospectus and exercise of the initial purchasers’ option to purchase additional securities) owned by AXA three years from issuance, subject to early exchange events. The offering of such securities is subject to market conditions and other factors, and there can be no assurance that AXA will complete such offering. The mandatorily exchangeable securities and underlying shares of common stock are being offered and sold only in transactions exempt from the registration requirements of the Securities Act.
History and Development
Founded in 1859, our retirement and protection businesses distribute products to individuals and business owners through our affiliated distribution channel, AXA Advisors, and to the financial services market through our wholesalers serving third-party firms.
Our business also includes AB, of which we own an approximate 65% economic interest following the Reorganization Transactions. Our economic interest consists of approximately 64% of the AB Units and approximately 4% of the AB Holding Units (representing an approximate 1% economic interest in ABLP). Our indirect, wholly owned subsidiary, AllianceBernstein Corporation, is the General Partner of AB with the authority to manage and control AB, and accordingly, AB is consolidated in our financial statements. AB has been in the investment management and research business for more than 50 years. ABLP is the operating partnership for the AB business, and AB Holding’s activities consist of owning AB Units and engaging in related activities. AB Holding Units trade on the NYSE under the ticker symbol “AB”. AB Units do not trade publicly.
Organizational Structure
After the settlement of this offering, we expect that AXA will hold approximately 75.5% of our common stock (or 71.9% if the underwriters exercise their option to purchase additional shares from the selling stockholder). As a result, we will be a “controlled company” within the meaning of NYSE rules, following the settlement of this offering. This status will allow us to rely on exemptions from certain corporate governance requirements otherwise applicable to NYSE-listed companies. See “Management—Corporate Governance.”
16
Table of Contents
The following two charts illustrate our overall corporate organizational structure and our ownership structure of AB, after giving effect to the Reorganization Transactions and the settlement of this offering, assuming the underwriters do not exercise their option to purchase additional shares from the selling stockholder. The charts reflect only certain of our subsidiaries and have been simplified for illustrative purposes.
Organizational Structure Following Settlement of this Offering and Completion of the Reorganization Transactions
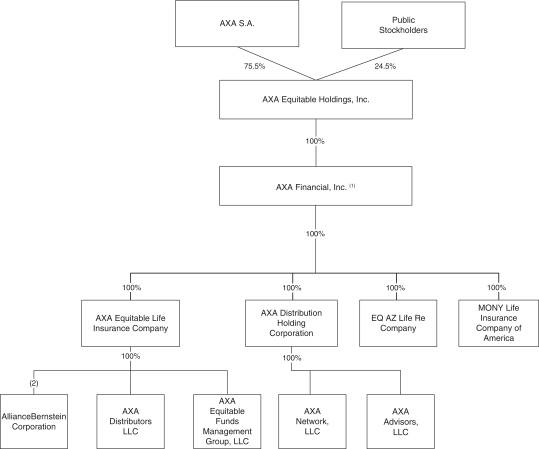
| (1) | We intend to merge AXA Financial into Holdings after the settlement of this offering. |
| (2) | For details on our economic ownership and general partnership interest in AB, see the following chart “Ownership Structure of AB Following Settlement of this Offering and Completion of the Reorganization Transactions.” |
17
Table of Contents
Ownership Structure of AB Following Settlement of this Offering and Completion of the Reorganization Transactions
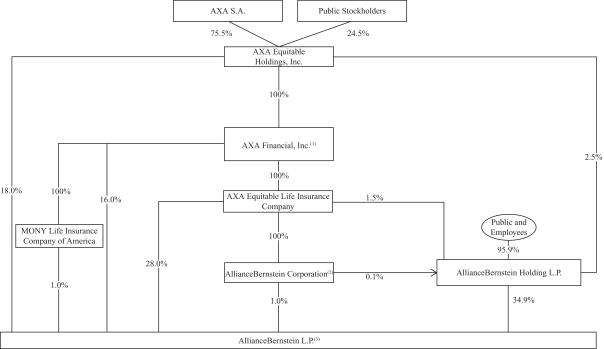
| (1) | We intend to merge AXA Financial into Holdings after the settlement of this offering. |
| (2) | AllianceBernstein Corporation is the general partner of AB Holding and ABLP. |
| (3) | 1.1% held by unaffiliated holders. |
Our Corporate Information
Holdings is a Delaware corporation. Our principal executive offices are located at 1290 Avenue of the Americas, New York, New York 10104, and our telephone number is (212) 554-1234.
18
Table of Contents
THE OFFERING
| Common stock offered by the selling stockholder |
137,250,000 shares. |
| Common stock to be outstanding after this offering |
561,000,000 shares. |
| Option to purchase additional shares |
The underwriters have a 30-day option to purchase up to an additional 20,587,500 shares of common stock from the selling stockholder at the initial public offering price, less underwriting discounts and commissions. |
| Use of proceeds |
We will not receive any proceeds from the sale of common stock in this offering; the selling stockholder will receive all of the proceeds from the sale of shares of our common stock. |
| Dividend policy |
We intend to pay quarterly cash dividends on our common stock at an initial amount of approximately $0.13 per share, although any declaration of dividends will be at the discretion of our board of directors (the “Board”) and will depend on our financial condition, earnings, liquidity and capital requirements, regulatory constraints, level of indebtedness, contractual restrictions with respect to payment of dividends, restrictions imposed by Delaware law, general business conditions and any other factors that the Board deems relevant in making such a determination. Therefore, there can be no assurance that we will pay any dividends to holders of our common stock, or as to the amount of any such dividends. See “Dividend Policy.” |
| NYSE symbol |
“EQH”. |
The number of shares of our common stock to be outstanding immediately following this offering is based on 561,000,000 shares outstanding as of April 26, 2018, and excludes 5,882,352 shares of common stock reserved for future issuance following this offering under our equity plans.
Unless otherwise indicated, all information in this prospectus:
| • | gives effect to a 459.4752645-for-1 stock split on our common stock effected on April 24, 2018; |
| • | assumes no exercise by the underwriters of their option to purchase additional shares from the selling stockholder; |
| • | does not give effect to the concurrent offering by AXA of mandatorily exchangeable securities and any subsequent exchange into shares of our common stock owned by AXA; |
| • | assumes that the initial public offering price of our common stock will be $25.50 per share (which is the midpoint of the price range set forth on the cover page of this prospectus); and |
| • | gives effect to amendments to our amended and restated certificate of incorporation and amended and restated by-laws to be adopted prior to the settlement of this offering. |
19
Table of Contents
SUMMARY HISTORICAL CONSOLIDATED FINANCIAL DATA
The financial information for the years ended December 31, 2017, 2016 and 2015 and as of December 31, 2017 and 2016 has been derived from the Company’s audited financial statements included elsewhere in this prospectus. The financial information as of December 31, 2015 has been derived from unaudited financial statements not included herein. The selected financial data as of and for the year ended December 31, 2016 has been restated and the selected financial data as of and for the year ended December 31, 2015 has been revised, in each case from the Company’s Form S-1 registration statement filed on February 14, 2018. This selected financial data should be read in conjunction with “Management’s Discussion and Analysis of Financial Condition and Results of Operations” and the annual financial statements included elsewhere in this prospectus. Historical results are not indicative of future operating results. The following consolidated statements of income (loss) and balance sheet data have been prepared in conformity with accounting principles generally accepted in the United States of America (“U.S. GAAP”).
| Years Ended December 31, | ||||||||||||
| 2017 | 2016 (as restated) |
2015 | ||||||||||
| (in millions) | ||||||||||||
| Statements of Income (Loss) Data |
||||||||||||
| Revenues |
||||||||||||
| Policy charges and fee income |
$ | 3,733 | $ | 3,762 | $ | 3,653 | ||||||
| Premiums |
1,124 | 1,083 | 1,070 | |||||||||
| Net derivative gains (losses) |
228 | (1,722 | ) | (1,393 | ) | |||||||
| Net investment income |
3,082 | 2,665 | 2,450 | |||||||||
| Investment gains (losses), net |
||||||||||||
| Total other-than-temporary impairment losses |
(15 | ) | (68 | ) | (42 | ) | ||||||
| Other investment gains (losses), net |
(176 | ) | 2,051 | 27 | ||||||||
|
|
|
|
|
|
|
|||||||
| Total investment gains (losses), net |
(191 | ) | 1,983 | (15 | ) | |||||||
|
|
|
|
|
|
|
|||||||
| Investment management and service fees |
4,093 | 3,749 | 3,895 | |||||||||
| Other income |
445 | 402 | 419 | |||||||||
|
|
|
|
|
|
|
|||||||
| Total revenues |
12,514 | 11,922 | 10,079 | |||||||||
| Benefits and Other Deductions |
||||||||||||
| Policyholders’ benefits |
4,354 | 3,343 | 3,505 | |||||||||
| Interest credited to policyholders’ account balances |
1,108 | 1,091 | 946 | |||||||||
| Compensation and benefits (includes $156, $154 and $157 of deferred acquisition costs) |
2,137 | 2,119 | 2,165 | |||||||||
| Commissions and distribution related payments (includes $523, $536 and $559 of deferred acquisition costs) |
1,604 | 1,536 | 1,586 | |||||||||
| Interest expense |
160 | 174 | 136 | |||||||||
| Amortization of deferred policy acquisition costs, net (net of capitalization of $687, $697 and $723) |
(239 | ) | 89 | (285 | ) | |||||||
| Other operating costs and expenses (includes $8, $7 and $7 of deferred acquisition costs) |
2,076 | 1,516 | 1,585 | |||||||||
|
|
|
|
|
|
|
|||||||
| Total benefits and other deductions |
11,200 | 9,868 | 9,638 | |||||||||
| Income (loss) from operations, before income taxes |
1,314 | 2,054 | 441 | |||||||||
| Income tax (expense) benefit |
(41 | ) | (387 | ) | 217 | |||||||
|
|
|
|
|
|
|
|||||||
| Net income (loss) |
1,273 | 1,667 | 658 | |||||||||
| Less: Net (income) loss attributable to the noncontrolling interest |
(423 | ) | (395 | ) | (325 | ) | ||||||
|
|
|
|
|
|
|
|||||||
| Net income (loss) attributable to Holdings |
$ | 850 | $ | 1,272 | $ | 333 | ||||||
|
|
|
|
|
|
|
|||||||
20
Table of Contents
| As of December 31, | ||||||||||||
| 2017 | 2016 (as restated) |
2015 | ||||||||||
| (in millions) | ||||||||||||
| Balance Sheet Data (at period end) |
||||||||||||
| Assets |
||||||||||||
| Total investments and cash and cash equivalents |
$ | 86,596 | $ | 77,972 | $ | 71,312 | ||||||
| Separate Account assets |
124,552 | 113,150 | 109,198 | |||||||||
| Total assets |
235,648 | 216,614 | 205,481 | |||||||||
| Liabilities |
||||||||||||
| Short-term and long-term debt |
2,408 | 1,605 | 1,786 | |||||||||
| Future policy benefits and other policyholders’ liabilities |
30,299 | 30,278 | 29,946 | |||||||||
| Policyholders’ account balances |
47,171 | 41,956 | 35,821 | |||||||||
| Equity |
||||||||||||
| Total equity attributable to Holdings |
13,485 | 11,455 | 10,437 | |||||||||
| Total equity attributable to Holdings, excluding Accumulated other comprehensive income (loss) |
$ | 13,593 | $ | 12,376 | $ | 11,114 | ||||||
| Years Ended December 31, | ||||||||||||
| 2017 | 2016 (as restated) |
2015 | ||||||||||
| (in millions, except per share data) | ||||||||||||
| Earnings Per Share Data |
||||||||||||
| Earnings per share—Common stock |
||||||||||||
| Basic |
$ | 1.52 | $ | 2.27 | $ | 0.59 | ||||||
| Diluted |
$ | 1.51 | $ | 2.27 | $ | 0.59 | ||||||
| Weighted average common shares outstanding |
561.0 | 561.0 | 561.0 | |||||||||
| Years Ended December 31, | ||||||||||||
| 2017 | 2016 (as restated) |
2015 | ||||||||||
| (in millions) | ||||||||||||
| Segment and Other Financial Data |
||||||||||||
| Operating earnings (loss) |
||||||||||||
| Individual Retirement |
$ | 1,287 | $ | 1,153 | $ | 1,060 | ||||||
| Group Retirement |
283 | 167 | 167 | |||||||||
| Investment Management and Research |
211 | 161 | 173 | |||||||||
| Protection Solutions |
536 | 79 | 113 | |||||||||
| Corporate and Other |
$ | (196 | ) | $ | (184 | ) | $ | (141 | ) | |||
|
|
|
|
|
|
|
|||||||
| Non-GAAP Operating Earnings(1) |
$ | 2,121 | $ | 1,376 | $ | 1,372 | ||||||
|
|
|
|
|
|
|
|||||||
| (1) | Non-GAAP Operating Earnings is a non-GAAP financial measure. For our definition and a reconciliation of Net income (loss) attributable to Holdings to Non-GAAP Operating Earnings for the periods presented, please see “Management’s Discussion and Analysis of Financial Condition and Results of Operations—Key Operating Measures—Non-GAAP Operating Earnings.” |
21
Table of Contents
| As of December 31, | ||||||||||||
| 2017 | 2016 | 2015 | ||||||||||
| (in millions) | ||||||||||||
| Assets Under Management |
||||||||||||
| AB AUM |
||||||||||||
| Total AB |
$ | 554,485 | $ | 480,200 | $ | 467,440 | ||||||
| Exclusion for General Account and Other Affiliated Accounts |
(59,669 | ) | (51,545 | ) | (48,405 | ) | ||||||
| Exclusion for Separate Accounts |
(35,022 | ) | (31,827 | ) | (31,163 | ) | ||||||
|
|
|
|
|
|
|
|||||||
| AB Third Party |
$ | 459,794 | $ | 396,828 | $ | 387,872 | ||||||
|
|
|
|
|
|
|
|||||||
| Total Company AUM |
||||||||||||
| AB Third Party |
$ | 459,794 | $ | 396,828 | $ | 387,872 | ||||||
| General Account and Other Affiliated Accounts |
86,596 | 77,972 | 71,312 | |||||||||
| Separate Accounts |
124,552 | 113,150 | 109,198 | |||||||||
|
|
|
|
|
|
|
|||||||
| Total AUM |
$ | 670,942 | $ | 587,950 | $ | 568,382 | ||||||
|
|
|
|
|
|
|
|||||||
22
Table of Contents
SUMMARY UNAUDITED PRO FORMA FINANCIAL INFORMATION
The summary unaudited pro forma condensed financial information presented below consists of the unaudited pro forma condensed balance sheet as of December 31, 2017 and the unaudited pro forma condensed statement of income (loss) for the year ended December 31, 2017 and the notes thereto. The unaudited pro forma condensed financial information should be read in conjunction with the information included under the headings, “The Reorganization Transactions,” “Recapitalization,” “Selected Historical Consolidated Financial Data,” “Unaudited Pro Forma Condensed Financial Information,” “Management’s Discussion and Analysis of Financial Condition and Results of Operations” and our annual financial statements included elsewhere in this prospectus.
The unaudited pro forma condensed statement of income (loss) for the year ended December 31, 2017 has been prepared to give effect to certain of the Reorganization Transactions as if these transactions had occurred on January 1, 2017. The unaudited pro forma condensed balance sheet as of December 31, 2017 gives effect to these transactions as if they had occurred on December 31, 2017. The pro forma adjustments that were made only represent those transactions which are directly attributable to this offering, factually supportable and expected to have a continuing impact on our results of operations.
The unaudited pro forma condensed financial information is presented for informational purposes only and does not purport to represent our financial condition or our results of operations had these transactions occurred on or as of the dates noted above or to project the results for any future date or period. The unaudited pro forma condensed financial information has been prepared in accordance with Regulation S-X. Actual results may differ from the pro forma adjustments.
| Pro forma | ||||
| Year ended December 31, 2017 |
||||
| (in millions) | ||||
| Statement of Income (Loss) Data |
||||
| Premiums |
$ | 1,124 | ||
| Policy charges and fee income |
3,733 | |||
| Net investment income (loss) and Net derivative gains (losses) |
3,247 | |||
| Total investment gains / (losses), net |
(191 | ) | ||
| Investment management fees and other income |
4,538 | |||
|
|
|
|||
| Total revenues |
$ | 12,451 | ||
|
|
|
|||
| Benefits and Other Deductions |
||||
| Policyholders’ benefits |
$ | 4,354 | ||
| Interest credited to policyholders’ account balances |
1,108 | |||
| Commissions and distribution related payments |
1,604 | |||
| Compensation and benefits |
2,137 | |||
| Operating costs and other expenses |
2,076 | |||
| Amortization of DAC, net |
(239 | ) | ||
| Interest expense |
251 | |||
|
|
|
|||
| Total benefits and other deductions |
$ | 11,291 | ||
|
|
|
|||
| Income (loss) from operations, before income taxes |
$ | 1,160 | ||
| Income tax (expense) benefit |
(44 | ) | ||
|
|
|
|||
| Net income (loss) |
1,116 | |||
| Less: net (income) loss attributable to the noncontrolling interest |
(276 | ) | ||
|
|
|
|||
| Net income (loss) attributable to Holdings |
$ | 840 | ||
|
|
|
|||
23
Table of Contents
| Pro forma As of December 31, 2017 |
||||
| (in millions) | ||||
| Balance Sheet Data (at period end) |
||||
| Total investments |
$ | 81,782 | ||
| Cash, cash equivalents and securities segregated, at fair value |
5,409 | |||
| Loans to affiliates |
— | |||
| Current and deferred income taxes |
(165 | ) | ||
| Other assets |
22,378 | |||
| Separate Account assets |
124,552 | |||
|
|
|
|||
| Total assets |
233,956 | |||
|
|
|
|||
| Future policy benefits and other policyholders’ liabilities |
$ | 30,299 | ||
| Policyholders’ account balances |
47,171 | |||
| Short-term and long-term debt |
5,218 | |||
| Loans from affiliates |
— | |||
| Other liabilities |
10,389 | |||
| Separate Account liabilities |
124,552 | |||
|
|
|
|||
| Total liabilities |
$ | 217,629 | ||
|
|
|
|||
| Redeemable noncontrolling interest |
626 | |||
|
|
|
|||
| Total equity attributable to Holdings |
14,187 | |||
|
|
|
|||
| Noncontrolling interest |
1,514 | |||
|
|
|
|||
| Total Equity |
15,701 | |||
|
|
|
|||
| Total liabilities, noncontrolling interest and equity |
233,956 | |||
|
|
|
|||
| Pro forma | ||||
| Year ended December 31, 2017 |
||||
| Other Pro Forma Data |
||||
| Pro Forma Non-GAAP Operating Earnings(1) (in millions) |
2,109 | |||
| Pro Forma Non-GAAP Operating ROE(2) |
15.2 | % | ||
24
Table of Contents
| (1) | Non-GAAP Operating Earnings is a non-GAAP financial measure. For our definition of Non-GAAP Operating Earnings, please see “Management’s Discussion and Analysis of Financial Condition and Results of Operations—Key Operating Measures—Non-GAAP Operating Earnings.” The following table provides a reconciliation of pro forma net income (loss) attributable to Holdings to pro forma Non-GAAP Operating Earnings: |
| Pro forma | ||||
| Year ended December 31, 2017 |
||||
| (in millions) | ||||
| Pro Forma Net income (loss) attributable to Holdings |
$ | 840 | ||
| Adjustments: |
||||
| Adjustments related to GMxB features |
1,250 | |||
| Investment (gains) losses |
192 | |||
| Investment income from certain derivative instruments |
18 | |||
| Net actuarial (gains) loss related to pension and other post-retirement benefit obligations |
136 | |||
| Goodwill Impairment |
369 | |||
| Other adjustments |
85 | |||
| Income tax expense (benefit) related to above adjustments |
(705 | ) | ||
| Non-recurring tax items |
(76 | ) | ||
|
|
|
|||
| Pro Forma Non-GAAP Operating Earnings |
2,109 | |||
|
|
|
|||
| (2) | Non-GAAP Operating ROE is a non-GAAP financial measure. For our definition of Non-GAAP Operating ROE, please see “Management’s Discussion and Analysis of Financial Condition and Results of Operations—Key Operating Measures—Non-GAAP Operating ROE and Non-GAAP Operating ROC by Segment.” The following table provides a reconciliation of Non-GAAP Operating ROE: |
| Pro Forma Year ended December 31, 2017 |
||||
| Pro Forma Non-GAAP Operating Earnings |
$ | 2,109 | ||
| Average Equity attributable to Holdings excluding Accumulated other comprehensive income (loss) |
13,875 | |||
| Pro Forma Non-GAAP Operating ROE |
15.2 | % | ||
The following table provides a reconciliation of Average equity attributable to Holdings excluding Accumulated other comprehensive income (loss):
| Pro forma | ||||||||
| Year ended December 31, |
||||||||
| 2017 | 2016 | |||||||
| Total equity attributable to Holdings |
14,187 | $ | 12,534 | |||||
| Accumulated other comprehensive income (loss) |
(108 | ) | (921 | ) | ||||
| Total equity attributable to Holdings excluding Accumulated other comprehensive income (loss)(1) |
14,295 | 13,455 | ||||||
| Average Equity attributable to Holdings excluding Accumulated other comprehensive income (loss) |
13,875 | |||||||
| (1) | Pro Forma Total equity attributable to Holdings excluding Accumulated other comprehensive income (loss) for the year ended December 31, 2016 was calculated as the Pro Forma Total equity attributable to Holdings excluding Accumulated other comprehensive income (loss) for the year ended December 31, 2017 less the Pro Forma Net income (loss) attributable to Holdings for the year ended December 31, 2017. |
25
Table of Contents
Investing in our common stock involves a high degree of risk. You should consider and read carefully all of the risks and uncertainties described below, as well as other information contained in this prospectus, including our annual financial statements, before making an investment decision. The risks described below are not the only ones facing us. The occurrence of any of the following risks or additional risks and uncertainties not presently known to us or that we currently believe to be immaterial could materially and adversely affect our business, financial position, results of operations or cash flows. In any such case, the trading price of our common stock could decline, and you may lose all or part of your investment. This prospectus also contains forward-looking statements and estimates that involve risks and uncertainties. Our actual results could differ materially from those anticipated in the forward-looking statements as a result of specific factors, including the risks and uncertainties described below.
Risks Relating to Our Consolidated Business
Risks Relating to Conditions in the Financial Markets and Economy
Conditions in the global capital markets and the economy could materially and adversely affect our business, results of operations or financial condition.
Our business, results of operations or financial condition are materially affected by conditions in the global capital markets and the economy generally. A wide variety of factors continue to impact economic conditions and consumer confidence. These factors include, among others, concerns over the pace of economic growth in the United States, equity market performance, continued low interest rates, uncertainty regarding the U.S. Federal Reserve’s plans to further raise short-term interest rates, the strength of the U.S. dollar, uncertainty created by the actions the Trump administration and Congress may pursue, global economic factors including quantitative easing or similar programs by major central banks or the unwinding of quantitative easing or similar programs, the United Kingdom’s vote to exit (“Brexit”) from the European Union (the “EU”) and other geopolitical issues. Given our interest rate and equity market exposure in our investment and derivatives portfolios and many of our products, these factors could have a material adverse effect on us. Our revenues may decline, our profit margins could erode and we could incur significant losses. The value of our investments and derivatives portfolios may also be impacted by reductions in price transparency, changes in the assumptions or methodology we use to estimate fair value and changes in investor confidence or preferences, which could potentially result in higher realized or unrealized losses and have a material adverse effect on our business, results of operations or financial condition. Market volatility may also make it difficult to transact in or to value certain of our securities if trading becomes less frequent.
Factors such as consumer spending, business investment, government debt and spending, the volatility and strength of the equity markets, interest rates, deflation and inflation all affect the business and economic environment and, ultimately, the amount and profitability of our business. In an economic downturn characterized by higher unemployment, lower family income, lower corporate earnings, lower business investment and lower consumer spending, the demand for our retirement, protection or investment products and our investment returns could be materially and adversely affected. The profitability of many of our retirement, protection and investment products depends in part on the value of the General Account and Separate Accounts supporting them, which may fluctuate substantially depending on any of the foregoing conditions. In addition, a change in market conditions could cause a change in consumer sentiment and adversely affect sales and could cause the actual persistency of these products to vary from their anticipated persistency (the probability that a product will remain in force from one period to the next) and adversely affect profitability. Changing economic conditions or adverse public perception of financial institutions can influence customer behavior, which can result in, among other things, an increase or decrease in the levels of claims, lapses, deposits, surrenders and withdrawals in certain products, any of which could adversely affect profitability. Our policyholders may choose to defer paying insurance premiums or stop paying insurance premiums altogether. In addition, market conditions
26
Table of Contents
may affect the availability and cost of reinsurance protections and the availability and performance of hedging instruments in ways that could materially and adversely affect our profitability.
Accordingly, both market and economic factors may affect our business results by adversely affecting our business volumes, profitability, cash flow, capitalization and overall financial condition. Disruptions in one market or asset class can also spread to other markets or asset classes. Upheavals and stagnation in the financial markets could also materially affect our financial condition (including our liquidity and capital levels) as a result of the impact of such events on our assets and liabilities.
Equity market declines and volatility may materially and adversely affect our business, results of operations or financial condition.
The S&P 500, the Dow Jones Industrial Average and the Nasdaq Composite are on an eight-year bull market run and are at or near record high levels. A market correction or bear market could materially and adversely affect our business, results of operations or financial condition. Declines or volatility in the equity markets can negatively impact our investment returns as well as our business, results of operations or financial condition. For example, equity market declines or volatility could, among other things, decrease the AV of our annuity and variable life contracts which, in turn, would reduce the amount of revenue we derive from fees charged on those account and asset values. Our variable annuity business in particular is highly sensitive to equity markets, and a sustained weakness or stagnation in equity markets could decrease our revenues and earnings with respect to those products. At the same time, for variable annuity contracts that include GMxB features, equity market declines increase the amount of our potential obligations related to such GMxB features and could increase the cost of executing GMxB-related hedges beyond what was anticipated in the pricing of the products being hedged. This could result in an increase in claims and reserves related to those contracts, net of any reinsurance reimbursements or proceeds from our hedging programs. We may not be able to effectively mitigate, including through our hedging strategies, and we may sometimes choose based on economic considerations and other factors not to fully mitigate the equity market volatility of our portfolio. Equity market declines and volatility may also influence policyholder behavior, which may adversely impact the levels of surrenders, withdrawals and amounts of withdrawals of our annuity and variable life contracts or cause policyholders to reallocate a portion of their account balances to more conservative investment options (which may have lower fees), which could negatively impact our future profitability or increase our benefit obligations particularly if they were to remain in such options during an equity market increase. Market volatility can negatively impact the value of equity securities we hold for investment which could in turn reduce the statutory capital of certain of our insurance subsidiaries. In addition, equity market volatility could reduce demand for variable products relative to fixed products, lead to changes in estimates underlying our calculations of DAC that, in turn, could accelerate our DAC amortization and reduce our current earnings and result in changes to the fair value of our GMIB reinsurance contracts and GMxB liabilities, which could increase the volatility of our earnings. Lastly, periods of high market volatility or adverse conditions could decrease the availability or increase the cost of derivatives.
Interest rate fluctuations or prolonged periods of low interest rates may materially and adversely impact our business, consolidated results of operations or financial condition.
We are affected by the monetary policies of the Board of Governors of the Federal Reserve System (“Federal Reserve Board”) and the Federal Reserve Bank of New York (collectively, with the Federal Reserve Board, the “Federal Reserve”) and other major central banks, including the unwinding of quantitative easing programs, as such policies may adversely impact the level of interest rates and, as discussed below, the income we earn on our investments or the level of product sales.
27
Table of Contents
Some of our retirement and protection products and certain of our investment products, and our investment returns, are sensitive to interest rate fluctuations, and changes in interest rates may adversely affect our investment returns and results of operations, including in the following respects:
| • | changes in interest rates may reduce the spread on some of our products between the amounts that we are required to pay under the contracts and the rate of return we are able to earn on our General Account investments supporting the contracts. When interest rates decline, we have to reinvest the cash income from our investments in lower yielding instruments, potentially reducing net investment income. Since many of our policies and contracts have guaranteed minimum interest or crediting rates or limit the resetting of interest rates, the spreads could decrease and potentially become negative. When interest rates rise, we may not be able to quickly replace the assets in our General Account with higher yielding assets needed to fund the higher crediting rates necessary to keep these products and contracts competitive, which may result in higher lapse rates; |
| • | when interest rates rise rapidly, policy loans and surrenders and withdrawals of annuity contracts and life insurance policies may increase as policyholders seek to buy products with perceived higher returns, requiring us to sell investment assets potentially resulting in realized investment losses, or requiring us to accelerate the amortization of DAC, which could reduce our net income; |
| • | a decline in interest rates accompanied by unexpected prepayments of certain investments may result in reduced investment income and a decline in our profitability. An increase in interest rates accompanied by unexpected extensions of certain lower yielding investments may result in a decline in our profitability; |
| • | changes in the relationship between long-term and short-term interest rates may adversely affect the profitability of some of our products; |
| • | changes in interest rates could result in changes to the fair value of our GMIB reinsurance contracts asset, which could increase the volatility of our earnings. Higher interest rates reduce the value of the GMIB reinsurance contract asset which reduces our earnings, while lower interest rates increase the value of the GMIB reinsurance contract asset which increases our earnings; |
| • | changes in interest rates could result in changes to the fair value liability of our variable annuity GMxB business. Higher interest rates decrease the fair value liability of our GMxB variable annuity business, which increases our earnings; while lower interest rates increase the fair value liability of our GMxB variable annuity business, which decreases our earnings; |
| • | changes in interest rates may adversely impact our liquidity and increase our costs of financing and the cost of some of our hedges; |
| • | our mitigation efforts with respect to interest rate risk are primarily focused on maintaining an investment portfolio with diversified maturities that has a weighted average duration that is within an acceptable range of the duration of our estimated liability cash flow profile given our risk appetite. However, our estimate of the liability cash flow profile may turn out to be inaccurate. In addition, there are practical and capital market limitations on our ability to accomplish this objective. Due to these and other factors we may need to liquidate investments prior to maturity at a loss in order to satisfy liabilities or be forced to reinvest funds in a lower rate environment; |
| • | we may not be able to effectively mitigate, including through our hedging strategies, and we may sometimes choose based on economic considerations and other factors not to fully mitigate or to increase, the interest rate risk of our assets relative to our liabilities; and |
| • | for certain of our products, a delay between the time we make changes in interest rate and other assumptions used for product pricing and the time we are able to reflect these assumptions in products available for sale may negatively impact the long-term profitability of products sold during the intervening period. |
28
Table of Contents
Recent periods have been characterized by low interest rates. A prolonged period during which interest rates remain low may result in greater costs associated with our variable annuity products with GMxB features; higher costs for some derivative instruments used to hedge certain of our product risks; or shortfalls in investment income on assets supporting policy obligations as our portfolio earnings decline over time, each of which may require us to record charges to increase reserves. In addition, an extended period of declining interest rates or a prolonged period of low interest rates may also cause us to change our long-term view of the interest rates that we can earn on our investments. Such a change in our view would cause us to change the long-term interest rate that we assume in our calculation of insurance assets and liabilities under U.S. GAAP. Any future revision would result in increased reserves, accelerated amortization of DAC and other unfavorable consequences. In addition, certain statutory capital and reserve requirements are based on formulas or models that consider interest rates, and an extended period of low interest rates may increase the statutory capital we are required to hold and the amount of assets we must maintain to support statutory reserves. In addition to compressing spreads and reducing net investment income, such an environment may cause certain policies to remain in force for longer periods than we anticipated in our pricing, potentially resulting in greater claims costs than we expected and resulting in lower overall returns on business in force.
We manage interest rate risk as part of our asset and liability management strategies, which include (i) maintaining an investment portfolio with diversified maturities that has a weighted average duration that is within an acceptable range of the duration of our estimated liability cash flow profile given our risk appetite and (ii) our hedging programs. For certain of our liability portfolios, it is not possible to invest assets to the full liability duration, thereby creating some asset/liability mismatch. Where a liability cash flow may exceed the maturity of available assets, as is the case with certain retirement products, we may support such liabilities with equity investments, derivatives or interest rate mismatch strategies. We take measures to manage the economic risks of investing in a changing interest rate environment, but we may not be able to mitigate the interest rate risk of our fixed income investments relative to our interest sensitive liabilities. Widening credit spreads, if not offset by equal or greater declines in the risk-free interest rate, would also cause the total interest rate payable on newly issued securities to increase, and thus would have the same effect as an increase in underlying interest rates.
Market conditions and other factors could materially and adversely affect our goodwill, which in turn could materially and adversely affect our business, results of operations or financial condition.
Business and market conditions may impact the amount of goodwill we carry in our consolidated balance sheet related to the Investment Management and Research segment. To the extent that securities valuations are depressed for prolonged periods of time or market conditions deteriorate, or that AB experiences significant net redemptions, its AUM, revenues, profitability and unit price will be adversely affected. Although the price of an AB Holding Unit is just one factor in the calculation of fair value of AB Holding Units and AB Units, if AB Holding Unit price levels were to decline significantly, reaching the conclusion that fair value exceeds carrying value will, over time, become more difficult. In addition, control premiums, industry earnings multiples and discount rates are impacted by economic conditions. As a result, subsequent impairment tests may occur more frequently and be based on more negative assumptions and future cash flow projections, and may result in an impairment of goodwill. An impairment may result in a material charge to our earnings, which would materially and adversely affect our business, results of operations or financial condition.
Because the value of certain of our businesses is significantly impacted by such factors as the state of the financial markets and ongoing operating performance, significant deterioration or prolonged weakness in the financial markets or economy generally, or our failure to meet financial and operating targets, could adversely impact goodwill impairment testing and also may require more frequent testing for impairment. Any impairment would reduce the recorded goodwill amount with a corresponding charge to earnings, which could be material.
29
Table of Contents
Adverse capital and credit market conditions may significantly affect our ability to meet liquidity needs, our access to capital and our cost of capital.
The capital and credit markets may experience, and have experienced, varying degrees of volatility and disruption. In some cases, the markets have exerted downward pressure on availability of liquidity and credit capacity for certain issuers. We need liquidity to pay our operating expenses (including potential hedging losses), interest expenses and any distributions on our capital stock and to capitalize our insurance subsidiaries. Without sufficient liquidity, we could be required to curtail our operations and our business would suffer. In addition, following this offering, AXA will not guarantee the indebtedness we issue or borrow or provide intra-company financing, and we will need to rely on the capital markets and third-party lenders.
While we expect that our future liquidity needs will be satisfied primarily through cash generated by our operations, borrowings from third parties and dividends and distributions from our subsidiaries, it is possible that the level of cash and securities we maintain when combined with expected cash inflows from investments and operations will not be adequate to meet our anticipated short-term and long-term benefit and expense payment obligations. If current resources are insufficient to satisfy our needs, we may access financing sources such as bank debt or the capital markets. The availability of additional financing would depend on a variety of factors, such as market conditions, the general availability of credit, the volume of trading activities, the overall availability of credit to the financial services industry, interest rates, credit spreads, our credit ratings and credit capacity, as well as the possibility that our stockholders, customers or lenders could develop a negative perception of our long- or short-term financial prospects if we incur large investment losses or if the level of our business activity decreases due to a market downturn. Similarly, our access to funds may be rendered more costly or impaired if rating agencies downgrade our ratings or if regulatory authorities take certain actions against us. If we are unable to access capital markets to issue new debt, refinance existing debt or sell additional shares as needed, or if we are unable to obtain such financing on acceptable terms, our business could be adversely impacted.
Volatility in the capital markets may also consume liquidity as we pay hedge losses and meet collateral requirements related to market movements. Our subsidiaries maintain hedging programs to reduce their net economic exposure under long-term liabilities to risk factors such as interest rates and equity market levels. We expect these hedging programs to incur losses in certain market scenarios, creating a need to pay cash settlements or post collateral to counterparties. Although our liabilities will also be reduced in these scenarios, this reduction is not immediate, and so in the short term hedging losses will reduce available liquidity. Liquidity may also be consumed by increased required contributions to captive reinsurance trusts. For more details, see “—Risks Relating to Our Retirement and Protection Businesses—Risks Relating to Our Reinsurance and Hedging Programs—Our reinsurance arrangements with affiliated captives may be adversely impacted by changes to policyholder behavior assumptions under the reinsured contracts, the performance of their hedging program, their liquidity needs, their overall financial results and changes in regulatory requirements regarding the use of captives.”
Disruptions, uncertainty or volatility in the capital and credit markets may also limit our access to capital. Such market conditions may in the future limit our ability to raise additional capital to support business growth, or to counter-balance the consequences of losses or increased regulatory reserves and rating agency capital requirements. This could force us to (i) delay raising capital, (ii) miss payments on our debt or reduce or eliminate dividends paid on our capital stock, (iii) issue capital of different types or under different terms than we would otherwise or (iv) incur a higher cost of capital than would prevail in a more stable market environment. This would have the potential to decrease both our profitability and our financial flexibility. Our business, results of operations, financial condition, liquidity, statutory capital or rating agency capital position could be materially and adversely affected by disruptions in the financial markets.
Future changes in our credit ratings are possible, and any downgrade to our ratings is likely to increase our borrowing costs and limit our access to the capital markets and could be detrimental to our business relationships
30
Table of Contents
with distribution partners. If this occurs, we may be forced to incur unanticipated costs or revise our strategic plans, which could materially and adversely affect our business, results of operations or financial condition.
Risks Relating to Our Operations
As a holding company, Holdings depends on the ability of its subsidiaries to transfer funds to it to meet its obligations.
Holdings is the holding company for all of our operations and is a legal entity separate from its subsidiaries. Dividends and other distributions from Holdings’ subsidiaries are the principal sources of funds available to Holdings to pay principal and interest on its outstanding indebtedness, to pay corporate operating expenses, to pay any stockholder dividends, to repurchase stock and to meet its other obligations. The inability to receive dividends from our subsidiaries could have a material adverse effect on our business, results of operations or financial condition.
The subsidiaries of Holdings have no obligation to pay amounts due on the debt of Holdings or to make funds available to Holdings for such payments. For our insurance and other subsidiaries, the principal sources of liquidity are fee income, insurance premiums and investment income. The ability of our subsidiaries to pay dividends or other distributions to Holdings in the future will depend on their earnings, tax considerations, covenants contained in any financing or other agreements and applicable regulatory restrictions. In addition, such payments may be limited as a result of claims against our subsidiaries by their creditors, including suppliers, vendors, lessors and employees. The ability of our insurance subsidiaries to pay dividends and make other distributions to Holdings will further depend on their ability to meet applicable regulatory standards and receive regulatory approvals, as discussed below under “—Risks Relating to Our Retirement and Protection Businesses—Risks Relating to the Products We Offer, Our Structure and Product Distribution—The ability of our insurance subsidiaries to pay dividends and other distributions to Holdings is limited by state insurance laws, and our insurance subsidiaries may not generate sufficient statutory earnings or have sufficient statutory surplus to enable them to pay ordinary dividends.” For example, a significant portion of our economic ownership interest and all of our general partnership interest in AB are held directly or indirectly by our insurance company subsidiaries. Any dividends paid by AB to our insurance company subsidiaries will be subject to applicable regulatory restrictions on dividends of those subsidiaries and may not be available to Holdings.
If the ability of our insurance or non-insurance subsidiaries to pay dividends or make other distributions or payments to Holdings is materially restricted by regulatory requirements, other cash needs, bankruptcy or insolvency, or our need to maintain the financial strength ratings of our insurance subsidiaries, or is limited due to operating results or other factors, we may be required to raise cash through the incurrence of debt, the issuance of equity or the sale of assets. However, there is no assurance that we would be able to raise sufficient cash by these means. This could materially and adversely affect our ability to pay our obligations.
Our historical consolidated financial data are not necessarily representative of the results we would have achieved as a stand-alone company and may not be a reliable indicator of our future results.
Our historical consolidated financial data included in this prospectus do not necessarily reflect the financial condition, results of operations or cash flows we would have achieved as a stand-alone company during the periods presented or those we will achieve in the future. For example, we anticipate adjusting our capital structure to more closely align with peer U.S. public companies. As a result, financial metrics that are influenced by our capital structure, such as interest expense, Non-GAAP Operating ROE and Non-GAAP Operating ROC by segment, are not necessarily indicative of the performance we may achieve as a stand-alone company following this offering. In addition, significant increases may occur in our cost structure as a result of this offering, including costs related to public company reporting, investor relations and compliance with the Sarbanes-Oxley Act of 2002. As a result of these matters, among others, it may be difficult for investors to compare our future results to historical results or to evaluate our relative performance or trends in our business.
31
Table of Contents
As a result of misstatements in our previously issued annual and interim financial statements due to the material weaknesses in our internal control over financial reporting, we have (i) restated the annual financial statements for the year ended December 31, 2016, (ii) restated the interim financial statements for the nine months ended September 30, 2017 and for the six months ended June 30, 2017, (iii) revised the annual financial statements for the year ended December 31, 2015 and (iv) revised the interim financial statements for the nine months ended September 30, 2016 and for the six months ended June 30, 2016, in each case that were reported in the preliminary prospectus included in the first amendment of our registration statement on Form S-1 filed with the SEC on February 14, 2018. On February 14, 2018, as a result of misstatements in our previously issued financial statements due to the material weaknesses in our internal control over financial reporting, we also (a) restated the interim financial statements for the six months ended June 30, 2017 and (b) revised the annual financial statements for the years ended December 31, 2016, 2015 and 2014 and the interim financial statements for the six months ended June 30, 2016, in each case that were reported in the preliminary prospectus included in our initial registration statement on Form S-1 filed with the SEC on November 13, 2017. See “—Risks Relating to Our Common Stock and This Offering—During the course of preparing our U.S. GAAP financial statements for this offering, we identified two material weaknesses in our internal control over financial reporting. If our remediation of these material weaknesses is not effective, we may not be able to report our financial condition or results of operations accurately or on a timely basis, which could materially and adversely affect investor confidence in us and, as a result, the price of our common stock” and “—Risks Relating to Our Common Stock and This Offering—Fulfilling our obligations incident to being a public company, including with respect to the requirements of and related rules under the Sarbanes-Oxley Act of 2002, or the “Sarbanes-Oxley Act,” and the Dodd-Frank Act, will be expensive and time-consuming, and any delays or difficulties in satisfying these obligations could have a material adverse effect on our future results of operations and our stock price.”
Further misstatements in previously issued financial statements that we may discover in the future, as a result of such material weaknesses or any other reason, could result in further revisions or restatements of our financial statements and cause us to fail to meet our periodic reporting obligations with the SEC on a timely basis following this offering. This could reduce our ability to obtain financing, restrict our access to the capital markets, cause investors to lose confidence in the accuracy and completeness of our financial reports and materially and adversely affect the price of our common stock.
We expect to incur indebtedness in connection with the Recapitalization, which will increase our costs, and the degree to which we will be leveraged following completion of the Reorganization Transactions and this offering could materially and adversely affect our business, results of operations or financial condition.
As of December 31, 2017, on a pro forma basis giving effect to the Reorganization Transactions, we would have had $5.2 billion of indebtedness (including approximately $3.8 billion of indebtedness from the issuance in April 2018 of $800 million aggregate principal amount of 3.900% Senior Notes due 2023, $1.5 billion aggregate principal amount of 4.350% Senior Notes due 2028 and $1.5 billion aggregate principal amount of 5.000% Senior Notes due 2048 (together, the “Notes”) and $300 million of term loan borrowings we expect to incur in connection with the Recapitalization), with a significant portion of the proceeds of such indebtedness being used to replace financing that is provided or guaranteed by AXA and its affiliates. We have historically relied upon AXA for financing and for other financial support functions. After this offering, we will not be able to rely on AXA’s earnings, assets or cash flow, and we will be responsible for servicing our own indebtedness, obtaining and maintaining sufficient working capital and paying any dividends. In addition, despite our indebtedness levels, we may be able to incur substantially more indebtedness under the terms of our debt agreements. Any such incurrence of additional indebtedness may increase the risks created by our level of indebtedness.
In February 2018, we entered into a $3.9 billion two-year senior unsecured delayed draw term loan agreement (the “two-year term loan agreement”), a $500 million three-year senior unsecured delayed draw term loan agreement (the “three-year term loan agreement” and, together with the two-year term loan agreement, the “term loan agreements”) and a $2.5 billion five-year senior unsecured revolving credit facility (the “revolving credit facility” and, together with the term loan agreements, the “Credit Facilities”). The Credit Facilities contain
32
Table of Contents
certain administrative, reporting, legal and financial covenants, including requirements to maintain a specified minimum consolidated net worth and to maintain a ratio of indebtedness to total capitalization not in excess of a specified percentage, and limitations on the dollar amount of indebtedness that may be incurred by our subsidiaries and the dollar amount of secured indebtedness that may be incurred by the Company, which could restrict our operations and use of funds. Borrowings under the term loan agreements may be made only prior to this offering. In April 2018, we terminated the two-year term loan agreement, and, in May 2018, we intend to borrow $300 million under the three-year term loan agreement. In April 2018, we also issued the Notes to third party investors. See “Recapitalization” and “Management’s Discussion and Analysis of Financial Condition and Results of Operations—Liquidity and Capital Resources.”
The right to borrow funds under the Credit Facilities is subject to the fulfillment of certain conditions, including compliance with all covenants, and the ability to borrow thereunder is also subject to the continued ability of the lenders that are or will be parties to the Credit Facilities to provide funds. Failure to comply with the covenants in the Credit Facilities or fulfill the conditions to borrowings, or the failure of lenders to fund their lending commitments (whether due to insolvency, illiquidity or other reasons) in the amounts provided for under the terms of the Credit Facilities, would restrict the ability to access the Credit Facilities when needed and, consequently, could have a material adverse effect on our business, results of operations or financial condition.
Our ability to make payments on and to refinance our indebtedness, including the debt retained or incurred pursuant to the Recapitalization as well as any future indebtedness that we may incur, will depend on our ability to generate cash in the future from operations, financing or asset sales. Our ability to generate cash to meet our debt obligations in the future is sensitive to capital market returns, primarily due to our variable annuity business.
Overall, our ability to generate cash is subject to general economic, financial market, competitive, legislative, regulatory, client behavior and other factors that are beyond our control. We may not generate sufficient funds to service our debt and meet our business needs, such as funding working capital or the expansion of our operations. If we are not able to repay or refinance our debt as it becomes due, we may be forced to take unfavorable actions, including significant business and legal entity restructuring, limited new business investment, selling assets or dedicating an unsustainable level of our cash flow from operations to the payment of principal and interest on our indebtedness. In addition, our ability to withstand competitive pressures and to react to changes in the insurance industry could be impaired. In the event we default, the lenders who hold our debt could also accelerate amounts due, which could potentially trigger a default or acceleration of the maturity of our other debt.
In addition, the level of our indebtedness could put us at a competitive disadvantage compared to our competitors that are less leveraged than us. These competitors could have greater financial flexibility to pursue strategic acquisitions and secure additional financing for their operations. The level of our indebtedness could also impede our ability to withstand downturns in our industry or the economy in general.
A violation or breach of the representations, warranties or covenants contained in any of our Credit Facilities or letter of credit facilities could result in a default or event of default, which would require a waiver or amendment with the consent of our lenders. The failure to obtain any such waiver or amendment would have a material adverse effect on our business, results of operations or financial condition.
In April 2018, we entered into waiver letter agreements with the lenders under each of our Credit Facilities and the letter of credit facilities, pursuant to which the lenders waived certain defaults or events of default under such facilities resulting from the restatement of our annual financial statements for the year ended December 31, 2016, the restatement of our interim financial statements for the nine months ended September 30, 2017 and for the six months ended June 30, 2017, the failure to furnish audited financial statements for the year ended December 31, 2017 on a timely basis as required by such facilities and related matters. There can be no assurance that our lenders will provide such waivers in the future. For a discussion of the restatement to our 2016 annual
33
Table of Contents
financial statements, see note 1 to the notes to our annual financial statements included elsewhere in this prospectus. For a discussion of the material weaknesses in our internal control over financial reporting, see “—Risks Relating to Our Common Stock and This Offering—During the course of preparing our U.S. GAAP financial statements for this offering, we identified two material weaknesses in our internal control over financial reporting. If our remediation of these material weaknesses is not effective, we may not be able to report our financial condition or results of operations accurately or on a timely basis, which could materially and adversely affect investor confidence in us and, as a result, the price of our common stock.”
Representations and warranties that prove to be incorrect when made or a breach of any of the covenants under any of the agreements under which AXA Equitable Life conducts its derivative transactions (its “Derivatives Agreements”) could result in an event of default under such agreements. Generally, if an event of default were to occur and be continuing under a Derivatives Agreements, the counterparty may designate an early termination date in respect of all outstanding transactions under the Derivatives Agreements. If an early termination date were designated by a substantial majority of AXA Equitable Life’s counterparties, AXA Equitable Life would have to implement changes to its hedging program. AXA Equitable Life restated its annual financial statements for the year ended December 31, 2016 and sought waiver letter agreements with the counterparties to its Derivatives Agreements to waive any events of default resulting from such restatement. AXA Equitable Life has obtained all such waivers.
Representations and warranties that prove to be incorrect when made or a breach of any of the covenants under any of our Credit Facilities or letter of credit facilities or any of our subsidiaries’ credit facilities or their Derivatives Agreements could result in a future default or event of default under such facilities. If a default or event of default were to occur and be continuing, we would not be permitted to borrow under our Credit Facilities or letter of credit facilities and our subsidiaries would not be permitted to borrow under their credit facilities or execute transactions under their Derivatives Agreements. In addition, until an event of default is cured or waived, the administrative agent under our Credit Facilities or our subsidiaries’ credit facilities, the lenders under the letter of credit facilities or the counterparties to the Derivatives Agreements would be entitled to take various actions, including the acceleration of amounts due under such agreements and the termination of commitments to extend credit. If our indebtedness were accelerated, we could not be certain that we will have sufficient funds available to pay the accelerated indebtedness or that we will have the ability to refinance the accelerated indebtedness on terms favorable to us or at all. A default or event of default under one of our Credit Facilities or letter of credit facilities or one of our subsidiaries’ credit facilities or Derivatives Agreements could also result in a cross-default under other material agreements. The inability to borrow under our Credit Facilities or letter of credit facilities, the inability of any of our subsidiaries to borrow under its credit facilities or execute derivatives transactions, the acceleration of indebtedness outstanding thereunder or a cross-default could have a material adverse effect on our business, results of operations or financial condition.
Elements of our business strategy are new and may not be effective in accomplishing our objectives, and we may not be able to improve our Non-GAAP Operating ROE as expected, including as a result of assumptions that may prove not to be accurate.
We intend to use our competitive strengths to grow our earnings base and actively manage our capital with the goal of generating attractive risk-adjusted returns for our stockholders. We will seek to achieve this growth by increasing sales through organic growth, by diversifying our product offerings and leveraging and expanding our distribution platform, executing on expense optimization initiatives, optimizing our General Account portfolio, actively managing risk to protect capital and returning capital to our stockholders. See “Business—Our Strategy.”
There can be no assurance that our strategy will be successful, as it may not adequately alleviate the risks relating to volatility of, and capital requirements with respect to, variable annuities and the risk of loss with respect to the use of derivatives in hedging transactions. We may not be able to reduce our operating expenses to the extent we expect or without impacting our ability to serve our clients and grow our businesses. In addition,
34
Table of Contents
we may not be successful in increasing the return on our General Account meaningfully or at all. Moreover, our ability to pay dividends or repurchase shares is subject to certain restrictions and limitations, including as a result of regulatory requirements, which may prevent us from returning the expected or any capital to our stockholders for the indefinite future. For these reasons, no assurances can be given that we will be able to execute our strategy or that our strategy will achieve our objectives, including our financial goals.
We have established certain financial goals, including targeted Non-GAAP Operating ROE and return of capital to stockholders, that we believe measure the execution of our strategy, as set forth in “Business—Financial Goals.” These goals are based on a number of important assumptions, including assumptions regarding interest rates and market performance. Actual results related to these goals may vary depending on various factors, including actual capital market outcomes, changes in actuarial models or emergence of actual experience, changes in regulation as well as other risks and factors discussed in “Business—Financial Goals.” There can be no assurance that we will achieve those financial goals.
Failure to protect the confidentiality of customer information or proprietary business information could adversely affect our reputation and have a material adverse effect on our business, results of operations or financial condition.
Our businesses and relationships with customers are dependent upon our ability to maintain the confidentiality of our and our customers’ proprietary business and confidential information (including customer transactional data and personal data about our employees, our customers and the employees and customers of our customers). Pursuant to federal laws, various federal regulatory and law enforcement agencies have established rules protecting the privacy and security of personal information. In addition, most states, including New York and Arizona, have enacted laws, which vary significantly from jurisdiction to jurisdiction, to safeguard the privacy and security of personal information.
We retain confidential information in our information systems and in cloud-based systems (including customer transactional data and personal information about our customers, the employees and customers of our customers, and our own employees). We rely on commercial technologies and third parties to maintain the security of those systems. Anyone who is able to circumvent our security measures and penetrate our information systems, or the cloud-based systems we use, could access, view, misappropriate, alter or delete any information in the systems, including personally identifiable customer information and proprietary business information. It is possible that an employee, contractor or representative could, intentionally or unintentionally, disclose or misappropriate personal information or other confidential information. Our employees, distribution partners and other vendors may use portable computers or mobile devices which may contain similar information to that in our information systems, and these devices have been and can be lost, stolen or damaged. In addition, an increasing number of states require that customers be notified if a security breach results in the inappropriate disclosure of personally identifiable customer information. Any compromise of the security of our information systems, or the cloud-based systems we use, through cyber-attacks or for any other reason that results in inappropriate disclosure of personally identifiable customer information could damage our reputation in the marketplace, deter people from purchasing our products, subject us to significant civil and criminal liability and require us to incur significant technical, legal and other expenses any of which could have a material adverse effect on our reputation, business, results of operations or financial condition.
Our own operational failures or those of service providers on which we rely, including failures arising out of human error, could disrupt our business, damage our reputation and have a material adverse effect on our business, results of operations or financial condition.
Weaknesses or failures in our internal processes or systems could lead to disruption of our operations, liability to clients, exposure to disciplinary action or harm to our reputation. Our business is highly dependent on our ability to process, on a daily basis, large numbers of transactions, many of which are highly complex, across numerous and diverse markets. These transactions generally must comply with client investment guidelines, as well as stringent legal and regulatory standards.
35
Table of Contents
Weaknesses or failures within a vendor’s internal processes or systems, or inadequate business continuity plans, can materially disrupt our business operations. In addition, vendors may lack the necessary infrastructure or resources to effectively safeguard our confidential data. If we are unable to effectively manage the risks associated with such third-party relationships, we may suffer fines, disciplinary action and reputational damage.
Our obligations to clients require us to exercise skill, care and prudence in performing our services. The large number of transactions we process makes it highly likely that errors will occasionally occur. If we make a mistake in performing our services that causes financial harm to a client, we have a duty to act promptly to put the client in the position the client would have been in had we not made the error. The occurrence of mistakes, particularly significant ones, can have a material adverse effect on our reputation, business, results of operations or financial condition.
Our information systems may fail or their security may be compromised, which could materially and adversely impact our business, results of operations or financial condition.
Our business is highly dependent upon the effective operation of our information systems. We also have arrangements in place with outside vendors and other service providers through which we share and receive information. We rely on these systems throughout our business for a variety of functions, including processing claims and applications, providing information to customers and third-party distribution firms, performing actuarial analyses and modeling, hedging, performing operational tasks (e.g., processing transactions and calculating net asset value) and maintaining financial records. Our information systems and those of our outside vendors and service providers may be vulnerable to physical or cyber-attacks, computer viruses or other computer related attacks, programming errors and similar disruptive problems. In some cases, such physical and electronic break-ins, cyber-attacks or other security breaches may not be immediately detected. In addition, we could experience a failure of one or these systems, our employees or agents could fail to monitor and implement enhancements or other modifications to a system in a timely and effective manner, or our employees or agents could fail to complete all necessary data reconciliation or other conversion controls when implementing a new software system or implementing modifications to an existing system. The failure of these systems for any reason could cause significant interruptions to our operations, which could result in a material adverse effect on our business, results of operations or financial condition. In addition, a failure of these systems could lead to the possibility of litigation or regulatory investigations or actions, including regulatory actions by state and federal governmental authorities. While we take preventative measures to avoid cyber-attacks and other security breaches, we cannot guarantee that such measures will successfully prevent an attack or breach.
Many of the software applications that we use in our business are licensed from, and supported, upgraded and maintained by, vendors. A suspension or termination of certain of these licenses or the related support, upgrades and maintenance could cause temporary system delays or interruptions. Additionally, technology rapidly evolves and we cannot guarantee that our competitors may not implement more advanced technology platforms for their products and services, which may place us at a competitive disadvantage and materially and adversely affect our results of operations and business prospects.
Our service providers, including service providers to whom we outsource certain of our functions, are also subject to the risks outlined above, any one of which could result in our incurring substantial costs and other negative consequences, including a material adverse effect on our business, results of operations or financial condition.
On February 16, 2017, the NYDFS issued final Cybersecurity Requirements for Financial Services Companies that require banks, insurance companies and other financial services institutions regulated by the NYDFS, including us, to, among other things, establish and maintain a cybersecurity policy “designed to protect consumers and ensure the safety and soundness of New York State’s financial services industry.” The regulation went into effect on March 1, 2017 and has transition periods ranging from 180 days to two years. We have a cybersecurity policy in place outlining our policies and procedures for the protection of our information systems
36
Table of Contents
and information stored on those systems that comports with the regulation. In accordance with the regulation, our Chief Information Security Officer reports to the Board. In addition to New York’s cybersecurity regulation, the NAIC recently adopted the Insurance Data Security Model Law in October 2017. Under the model law, companies that are compliant with the NYDFS cybersecurity regulation are deemed also to be in compliance with the model law. The purpose of the model law is to establish standards for data security and for the investigation and notification of insurance commissioners of cybersecurity events involving unauthorized access to, or the misuse of, certain nonpublic information. We expect that states will begin adopting the model law, although it cannot be predicted whether or not, or in what form or when, they will do so. We are currently evaluating these regulations and their potential impact on our operations, and, with respect to the NYDFS regulations, we have already begun implementing compliance procedures for those portions of the regulation not subject to a transition period. Depending on our assessment of these and other potential implementation requirements, we and other financial services companies may be required to incur significant expense in order to comply with these regulatory mandates.
Central banks in Europe and Japan have in recent years begun to pursue negative interest rate policies, and the Federal Open Market Committee has not ruled out the possibility that the Federal Reserve would adopt a negative interest rate policy for the United States, at some point in the future, if circumstances so warranted. Because negative interest rates are largely unprecedented, there is uncertainty as to whether the technology used by financial institutions, including us, could operate correctly in such a scenario. Should negative interest rates emerge, our hardware or software, or the hardware or software used by our contractual counterparties and financial services providers, may not function as expected or at all. In such a case, our business, results of operations or financial condition could be materially and adversely affected.
We face competition from other insurance companies, banks, asset managers and other financial institutions, which may adversely impact our market share and consolidated results of operations.
There is strong competition among insurers, banks, asset managers, brokerage firms and other financial institutions and financial services providers seeking clients for the types of products and services we provide. Competition is intense among a broad range of financial institutions and other financial service providers for retirement and other savings dollars. As a result, this competition makes it especially difficult to provide unique retirement and protection or asset management products because, once such products are made available to the public, they often are reproduced and offered by our competitors. As with any highly competitive market, competitive pricing structures are important. If competitors charge lower fees for similar products or strategies, we may decide to reduce the fees on our own products or strategies (either directly on a gross basis or on a net basis through fee waivers) in order to retain or attract customers. Such fee reductions, or other effects of competition, could have a material adverse effect on our business, results of operations or financial condition.
Competition may adversely impact our market share and profitability. Many of our competitors are large and well-established and some have greater market share or breadth of distribution, offer a broader range of products, services or features, assume a greater level of risk, have greater financial resources, have higher claims-paying or credit ratings, have better brand recognition or have more established relationships with clients than we do. We may also face competition from new market entrants or non-traditional or online competitors, which may have a material adverse effect on our business.
Our ability to compete is dependent on numerous factors including, among others, the successful implementation of our strategy; our financial strength as evidenced, in part, by our financial and claims-paying ratings; new regulations or different interpretations of existing regulations; our access to diversified sources of distribution; our size and scale; our product quality, range, features/functionality and price; our ability to bring customized products to the market quickly; our technological capabilities; our ability to explain complicated products and features to our distribution channels and customers; crediting rates on our fixed products; the visibility, recognition and understanding of our brands in the marketplace; our reputation and quality of service; the tax-favored status certain of our products receive under current federal and state laws; and, with respect to
37
Table of Contents
variable annuity and insurance products, mutual funds and other investment products, investment options, flexibility and investment management performance.
Many of our competitors also have been able to increase their distribution systems through mergers, acquisitions, partnerships or other contractual arrangements. Furthermore, larger competitors may have lower operating costs and have an ability to absorb greater risk, while maintaining financial strength ratings, allowing them to price products more competitively. These competitive pressures could result in increased pressure on the pricing of certain of our products and services, and could harm our ability to maintain or increase profitability. In addition, if our financial strength and credit ratings are lower than our competitors, we may experience increased surrenders or a significant decline in sales. The competitive landscape in which we operate may be further affected by government sponsored programs or regulatory changes in the United States and similar governmental actions outside of the United States. Competitors that receive governmental financing, guarantees or other assistance, or that are not subject to the same regulatory constraints, may have or obtain pricing or other competitive advantages. Due to the competitive nature of the financial services industry, there can be no assurance that we will continue to effectively compete within the industry or that competition will not materially and adversely impact our business, results of operations or financial condition.
We may also face competition from new entrants into our markets, many of whom are leveraging digital technology that may challenge the position of traditional financial service companies, including us, by providing new services or creating new distribution channels.
Our inability to recruit, motivate and retain key employees and experienced and productive financial professionals may have a material adverse effect on our business, results of operations or financial condition.
Our business depends on our ability to attract, motivate and retain highly skilled, and often highly specialized, technical, investment, managerial and executive personnel, and there is no assurance that we will be able to do so. Financial professionals associated with AXA Advisors, AXA Network and Bernstein financial advisors and our key employees are key factors driving our sales. AB’s professionals often maintain strong, personal relationships with investors in AB’s products and other members of the business community so their departure may cause AB to lose client accounts or result in fewer opportunities to win new business. Intense competition exists among insurers and other financial services companies for financial professionals and key employees. Companies compete for financial professionals principally with respect to compensation policies, products and sales support. Competition is particularly intense in the hiring and retention of experienced financial professionals. Our ability to incentivize our employees and financial professionals may be adversely affected by tax reform. We cannot provide assurances that we will be successful in our respective efforts to recruit, motivate and retain key employees and top financial professionals and the loss of such employees and professionals could have a material adverse effect on our business, results of operations or financial condition.
We also rely upon the knowledge and experience of employees involved in functions that require technical expertise in order to provide for sound operational controls for our overall enterprise, including the accurate and timely preparation of required regulatory filings and U.S. GAAP and statutory financial statements and operation of internal controls. A loss of such employees, including as a result of shifting our real estate footprint away from the New York metropolitan area, could adversely impact our ability to execute key operational functions and could adversely affect our operational controls, including internal control over financial reporting.
Misconduct by our employees or financial professionals could expose us to significant legal liability and reputational harm.
Past or future misconduct by our employees, financial professionals, agents, intermediaries, representatives of our broker-dealer subsidiaries or employees of our vendors could result in violations of law by us or our subsidiaries, regulatory sanctions or serious reputational or financial harm and the precautions we take to prevent and detect this activity may not be effective in all cases. We employ controls and procedures designed to monitor
38
Table of Contents
employees’ and financial professionals’ business decisions and to prevent us from taking excessive or inappropriate risks, including with respect to information security, but employees may take such risks regardless of such controls and procedures. Our compensation policies and practices are reviewed by us as part of our overall risk management program, but it is possible that such compensation policies and practices could inadvertently incentivize excessive or inappropriate risk taking. If our employees or financial professionals take excessive or inappropriate risks, those risks could harm our reputation, subject us to significant civil or criminal liability and require us to incur significant technical, legal and other expenses.
We may engage in strategic transactions that could pose risks and present financial, managerial and operational challenges.
We may consider potential strategic transactions, including acquisitions, dispositions, mergers, consolidations, joint ventures and similar transactions, some of which may be material. These transactions may not be effective and could result in decreased earnings and harm to our competitive position. In addition, these transactions, if undertaken, may involve a number of risks and present financial, managerial and operational challenges, including:
| • | adverse effects on our earnings if acquired intangible assets or goodwill become impaired; |
| • | additional demand on our existing employees; |
| • | unanticipated difficulties integrating operating facilities technologies and new technologies; |
| • | higher than anticipated costs related to integration; |
| • | existence of unknown liabilities or contingencies that arise after closing; and |
| • | potential disputes with counterparties. |
Acquisitions also pose the risk that any business we acquire may lose customers or employees or could underperform relative to expectations. Additionally, the loss of investment personnel poses the risk that we may lose the AUM we expected to manage, which could materially and adversely affect our business, results of operations or financial condition. Furthermore, strategic transactions may require us to increase our leverage or, if we issue shares to fund an acquisition, would dilute the holdings of the existing stockholders. Any of the above could cause us to fail to realize the benefits anticipated from any such transaction.
This prospectus contains financial goals, reserves and cash flow projections, which are based on certain assumptions and estimates, including as to market conditions, likely utilization of GMxB product features, overall lapse rates and mortality and longevity experience. Our actual experience in the future may deviate from our assumptions and estimates and may impact our reserves, earnings and capitalization and may increase the volatility of our results and expose us to increased counterparty risk.
Our financial goals and our reserves and cash flow projections set forth in this prospectus are based on certain assumptions and estimates, including as to market conditions, likely utilization of GMxB product features, overall lapse rates and mortality and longevity experience. These forward-looking statements are estimates and are not intended to predict the future financial performance of our variable annuity hedging program or to represent an opinion of market value.
We present a sensitivity analysis of the estimated cash flows, assets and liabilities associated with our in-force variable annuity business in this prospectus. See “Business—Segment Information—Individual Retirement—Supplemental Information on Our In-Force Variable Annuity Business.” The scenarios represented in our sensitivity analysis were selected for illustrative purposes only and they do not purport to encompass all of the many factors that may bear upon a market value and are based on a series of assumptions as to the future. It should be recognized that actual future results may differ from those shown, on account of changes in the operating and economic environments and natural variations in experience. The results shown are presented as of December 31, 2017, and no assurance can be given that future experience will be in line with the assumptions made.
39
Table of Contents
The policyholder behavior assumptions embedded in our cash flow sensitivities represent our current best estimate for our in-force business. The following policyholder options are examples of those included in our sensitivities: lapse, partial lapse, dollar-for-dollar withdrawals and voluntary annuitizations. These assumptions are dynamic and vary depending on the NAR of the contract and our expectation of how a customer will utilize their embedded options across the various scenarios. A change in our cash flows could result to the extent emerging experience deviates from these policyholder assumptions.
Our business could be materially and adversely affected by the occurrence of a catastrophe, including natural or man-made disasters.
Any catastrophic event, such as pandemic diseases, terrorist attacks, floods, severe storms or hurricanes or computer cyber-terrorism, could have a material and adverse effect on our business in several respects:
| • | we could experience long-term interruptions in our service and the services provided by our significant vendors due to the effects of catastrophic events. Some of our operational systems are not fully redundant, and our disaster recovery and business continuity planning cannot account for all eventualities. Additionally, unanticipated problems with our disaster recovery systems could further impede our ability to conduct business, particularly if those problems affect our computer-based data processing, transmission, storage and retrieval systems and destroy valuable data; |
| • | the occurrence of a pandemic disease could have a material adverse effect on our liquidity and the operating results of our insurance business due to increased mortality and, in certain cases, morbidity rates; |
| • | the occurrence of any pandemic disease, natural disaster, terrorist attack or any other catastrophic event that results in our workforce being unable to be physically located at one of our facilities could result in lengthy interruptions in our service; |
| • | a localized catastrophic event that affects the location of one or more of our corporate-owned or employer sponsored life insurance customers could cause a significant loss due to the corresponding mortality claims; and |
| • | a terrorist attack in the United States could have long-term economic impacts that may have severe negative effects on our investment portfolio, including loss of AUM and losses due to significant volatility, and disrupt our business operations. Any continuous and heightened threat of terrorist attacks could also result in increased costs of reinsurance. |
In the event of a disaster, such as a natural catastrophe, epidemic, industrial accident, blackout, computer virus, terrorist attack, cyber-attack or war, unanticipated problems with our disaster recovery systems could have a material adverse impact on our ability to conduct business and on our results of operations and financial position, particularly if those problems affect our computer-based data processing, transmission, storage and retrieval systems and destroy valuable data. Our ability to conduct business may be adversely affected by a disruption in the infrastructure that supports our operations and the communities in which they are located. This may include a disruption involving electrical, communications, transportation or other services we may use or third parties with which we conduct business. If a disruption occurs in one location and our employees in that location are unable to occupy our offices or communicate with or travel to other locations, our ability to conduct business with and on behalf of our clients may suffer, and we may not be able to successfully implement contingency plans that depend on communication or travel. Furthermore, unauthorized access to our systems as a result of a security breach, the failure of our systems, or the loss of data could give rise to legal proceedings or regulatory penalties under laws protecting the privacy of personal information, disrupt operations and damage our reputation.
Our operations require experienced, professional staff. Loss of a substantial number of such persons or an inability to provide properly equipped places for them to work may, by disrupting our operations, adversely affect our business, results of operations or financial condition. In addition, our property and business interruption insurance may not be adequate to compensate us for all losses, failures or breaches that may occur.
40
Table of Contents
We may not be able to protect our intellectual property and may be subject to infringement claims by a third party.
We rely on a combination of contractual rights, copyright, trademark and trade secret laws to establish and protect our intellectual property. Third parties may infringe or misappropriate our intellectual property. The loss of intellectual property protection or the inability to secure or enforce the protection of our intellectual property assets could have a material adverse effect on our business and our ability to compete. Third parties may have, or may eventually be issued, patents or other protections that could be infringed by our products, methods, processes or services or could limit our ability to offer certain product features. In recent years, there has been increasing intellectual property litigation in the financial services industry challenging, among other things, product designs and business processes. If we were found to have infringed or misappropriated a third-party patent or other intellectual property right, we could in some circumstances be enjoined from providing certain products or services to our customers or from using and benefiting from certain patents, copyrights, trademarks, trade secrets or licenses. Alternatively, we could be required to enter into costly licensing arrangements with third parties or implement a costly alternative. Any of these scenarios could harm our reputation and have a material adverse effect on our business, results of operations or financial condition.
The insurance that we maintain may not fully cover all potential exposures.
We maintain property, business interruption, cyber, casualty and other types of insurance, but such insurance may not cover all risks associated with the operation of our business. Our coverage is subject to exclusions and limitations, including higher self-insured retentions or deductibles and maximum limits and liabilities covered. In addition, from time to time, various types of insurance may not be available on commercially acceptable terms or, in some cases, at all. We are potentially at additional risk if one or more of our insurance carriers fail. Additionally, severe disruptions in the domestic and global financial markets could adversely impact the ratings and survival of some insurers. Future downgrades in the ratings of enough insurers could adversely impact both the availability of appropriate insurance coverage and its cost. In the future, we may not be able to obtain coverage at current levels, if at all, and our premiums may increase significantly on coverage that we maintain. We can make no assurance that a claim or claims will be covered by our insurance policies or, if covered, will not exceed the limits of available insurance coverage, or that our insurers will remain solvent and meet their obligations. Currently, we are party to certain joint insurance arrangements with AXA; accordingly, if AXA ceases to own a majority of our outstanding common stock, we may need to obtain stand-alone insurance coverage, which may be at a higher price for the same coverage, which would increase our costs and may materially and adversely affect our business, results of operations or financial condition.
Changes in accounting standards could have a material adverse effect on our business, results of operations or financial condition.
Our consolidated financial statements are prepared in accordance with U.S. GAAP, the principles of which are revised from time to time. Accordingly, from time to time we are required to adopt new or revised accounting standards issued by recognized authoritative bodies, including the Financial Accounting Standards Board (“FASB”). In the future, new accounting pronouncements, as well as new interpretations of existing accounting pronouncements, may have material adverse effects on our business, results of operations or financial condition.
FASB is working on several projects which could result in significant changes in U.S. GAAP, including how we account for our insurance contracts and financial instruments and how our financial statements are presented. The changes to U.S. GAAP could affect the way we account for and report significant areas of our business, could impose special demands on us in the areas of governance, employee training, internal controls and disclosure and will likely affect how we manage our business.
In addition, AXA, our parent company, prepares consolidated financial statements in accordance with International Financial Reporting Standards (“IFRS”). From time to time, AXA may be required to adopt new or
41
Table of Contents
revised accounting standards issued by recognized authoritative bodies, including the International Accounting Standards Board. In the future, new accounting pronouncements, as well as new interpretations of existing accounting pronouncements, may have material adverse effects on AXA’s business, results of operations or financial condition which could impact the way we conduct our business (including, for example, which products we offer), our competitive position, our hedging program and the way we manage capital.
Certain of our administrative operations and offices are located internationally, subjecting us to various international risks and increased compliance and regulatory risks and costs.
We have various offices in other countries and certain of our administrative operations are located in India. In the future, we may seek to expand operations in India or other countries. As a result of these operations, we may be exposed to economic, operating, regulatory and political risks in those countries, such as foreign investment restrictions, substantial fluctuations in economic growth, high levels of inflation, volatile currency exchange rates and instability, including civil unrest, terrorist acts or acts of war, which could have an adverse effect on our business, financial condition or results of operations. The political or regulatory climate in the United States could also change such that it would no longer be lawful or practical for us to use international operations in the manner in which they are currently conducted. If we had to curtail or cease operations in India and transfer some or all of these operations to another geographic area, we would incur significant transition costs as well as higher future overhead costs that could adversely affect us.
In many foreign countries, particularly in those with developing economies, it may be common to engage in business practices that are prohibited by laws and regulations applicable to us, such as the U.S. Foreign Corrupt Practices Act of 1977, as amended (the “FCPA”) and similar anti-bribery laws. Any violations of the FCPA or other anti-bribery laws by us, our employees, subsidiaries or local agents, could have a material adverse effect on our business and reputation and result in substantial financial penalties or other sanctions.
Our investment advisory agreements with clients, and our selling and distribution agreements with various financial intermediaries and consultants, are subject to termination or non-renewal on short notice.
AB derives most of its revenues pursuant to written investment management agreements (or other arrangements) with institutional investors, mutual funds and private wealth clients. In addition, as part of our variable annuity products, AXA Equitable FMG enters into written investment management agreements (or other arrangements) with mutual funds.
Generally, these investment management agreements, including AB’s agreements with AXA and its subsidiaries (AB’s largest client), are terminable without penalty at any time or upon relatively short notice by either party. For example, an investment management contract with an SEC-registered investment company (a “RIC”) may be terminated at any time, without payment of any penalty, by the RIC’s board of directors or by vote of a majority of the outstanding voting securities of the RIC on not more than 60 days’ notice. The investment management agreements pursuant to which AB and AXA Equitable FMG manage RICs must be renewed and approved by the RICs’ boards of directors (including a majority of the independent directors) annually. A significant majority of the directors are independent. Consequently, there can be no assurance that the board of directors of each RIC will approve the investment management agreement each year, or will not condition its approval on revised terms that may be adverse to us.
Also, as required by the Investment Company Act, each investment advisory agreement with a RIC automatically terminates upon its assignment, although new investment advisory agreements may be approved by the RIC’s board of directors or trustees and stockholders. An “assignment” includes a sale of a control block of the voting stock of the investment adviser or its parent company. In the event of a future sale by AXA to a third party of a controlling interest in our common stock or if future sales by AXA of our common stock were deemed to be an actual or constructive assignment, these termination provisions could be triggered, which may adversely affect AB’s and AXA Equitable FMG’s ability to realize the value of their respective investment advisory
42
Table of Contents
agreements. In addition, the actual or constructive transfer of our general partnership interest in AB would constitute an assignment.
The Investment Advisers Act of 1940, as amended (the “Investment Advisers Act”), may also require approval or consent of advisory contracts by clients in the event of an “assignment” of the contract (including a sale of a control block of the voting stock of the investment adviser or its parent company) or a change in control of the investment adviser. Were the sale of our common stock by AXA or another transaction to result in an assignment or change in control, the inability to obtain consent or approval from clients or stockholders of RICs or other clients could result in a significant reduction in advisory fees.
AXA has announced its intention to sell all of its interest in the Company over time with intended sales of shares of our common stock subsequent to this offering, subject to the 180-day lock-up period and market conditions. Prior to when such sales trigger an assignment as described above, we and AB will need to seek requisite consents or approvals for such assignment. We may not be successful in obtaining such consents or approvals which would result in terminations of the relevant contracts. Such terminations could have a material adverse effect on our business, results of operations or financial condition.
Similarly, we enter into selling and distribution agreements with securities firms, brokers, banks and other financial intermediaries that are terminable by either party upon notice (generally 30 days) and do not obligate the financial intermediary to sell any specific amount of our products. These intermediaries generally offer their clients investment products that compete with our products. In addition, certain institutional investors rely on consultants to advise them about choosing an investment adviser and some of AB’s services may not be considered among the best choices by these consultants. As a result, investment consultants may advise their clients to move their assets invested with AB to other investment advisers, which could result in significant net outflows.
Finally, AB’s Private Wealth Services relies on referrals from financial planners, registered investment advisers and other professionals. We cannot be certain that we will continue to have access to, or receive referrals from, these third parties.
Risks Relating to Credit, Counterparties and Investments
Our counterparties’ requirements to pledge collateral or make payments related to declines in estimated fair value of derivative contracts exposes us to counterparty credit risk and may adversely affect our liquidity.
We use derivatives and other instruments to help us mitigate various business risks. Our transactions with financial and other institutions generally specify the circumstances under which the parties are required to pledge collateral related to any decline in the market value of the derivatives contracts. If our counterparties fail or refuse to honor their obligations under these contracts, we could face significant losses to the extent collateral agreements do not fully offset our exposures and our hedges of the related risk will be ineffective. Such failure could have a material adverse effect on our business, results of operations or financial condition. Additionally, the implementation of the Dodd-Frank Wall Street Reform and Consumer Protection Act (the “Dodd-Frank Act”) and other regulations may increase the need for liquidity and for the amount of collateral assets in excess of current levels.
We may be materially and adversely affected by changes in the actual or perceived soundness or condition of other financial institutions and market participants.
A default by any financial institution or by a sovereign could lead to additional defaults by other market participants. The failure of any financial institution could disrupt securities markets or clearance and settlement systems and lead to a chain of defaults, because the commercial and financial soundness of many financial institutions may be closely related as a result of credit, trading, clearing or other relationships. Even the perceived
43
Table of Contents
lack of creditworthiness of a financial institution may lead to market-wide liquidity problems and losses or defaults by us or by other institutions. This risk is sometimes referred to as “systemic risk” and may adversely affect financial intermediaries, such as clearing agencies, clearing houses, banks, securities firms and exchanges with which we interact on a daily basis. Systemic risk could have a material adverse effect on our ability to raise new funding and on our business, results of operations or financial condition. In addition, such a failure could impact future product sales as a potential result of reduced confidence in the financial services industry. Regulatory changes implemented to address systemic risk could also cause market participants to curtail their participation in certain market activities, which could decrease market liquidity and increase trading and other costs.
Losses due to defaults, errors or omissions by third parties and affiliates, including outsourcing relationships, could materially and adversely impact our business, results of operations or financial condition.
We depend on third parties and affiliates that owe us money, securities or other assets to pay or perform under their obligations. These parties include the issuers whose securities we hold in our investment portfolios, borrowers under the mortgage loans we make, customers, trading counterparties, counterparties under swap and other derivatives contracts, reinsurers, clearing agents, exchanges, clearing houses and other financial intermediaries. Defaults by one or more of these parties on their obligations to us due to bankruptcy, lack of liquidity, downturns in the economy or real estate values, operational failure or other factors, or even rumors about potential defaults by one or more of these parties, could have a material adverse effect on our business, results of operations or financial condition.
We also depend on third parties and affiliates in other contexts, including as distribution partners. For example, in establishing the amount of the liabilities and reserves associated with the risks assumed in connection with reinsurance pools and arrangements, we rely on the accuracy and timely delivery of data and other information from ceding companies. In addition, as investment manager and administrator of several mutual funds, we rely on various affiliated and unaffiliated subadvisers to provide day-to-day portfolio management services for each investment portfolio.
We rely on various counterparties and other vendors to augment our existing investment, operational, financial and technological capabilities, but the use of a vendor does not diminish our responsibility to ensure that client and regulatory obligations are met. Default rates, credit downgrades and disputes with counterparties as to the valuation of collateral increase significantly in times of market stress. Disruptions in the financial markets and other economic challenges may cause our counterparties and other vendors to experience significant cash flow problems or even render them insolvent, which may expose us to significant costs and impair our ability to conduct business.
Losses associated with defaults or other failures by these third parties and outsourcing partners upon whom we rely could materially adversely impact our business, results of operations or financial condition.
We are also subject to the risk that our rights against third parties may not be enforceable in all circumstances. The deterioration or perceived deterioration in the credit quality of third parties whose securities or obligations we hold could result in losses or adversely affect our ability to use those securities or obligations for liquidity purposes. While in many cases we are permitted to require additional collateral from counterparties that experience financial difficulty, disputes may arise as to the amount of collateral we are entitled to receive and the value of pledged assets. Our credit risk may also be exacerbated when the collateral we hold cannot be realized or is liquidated at prices not sufficient to recover the full amount of the loan or derivatives exposure that is due to us, which is most likely to occur during periods of illiquidity and depressed asset valuations, such as those experienced during the financial crisis. The termination of contracts and the foreclosure on collateral may subject us to claims for the improper exercise of rights under the contracts. Bankruptcies, downgrades and disputes with counterparties as to the valuation of collateral tend to increase in times of market stress and illiquidity.
44
Table of Contents
Gross unrealized losses on fixed maturity and equity securities may be realized or result in future impairments, resulting in a reduction in our net earnings.
Fixed maturity and equity securities classified as available-for-sale are reported at fair value. Unrealized gains or losses on available-for-sale securities are recognized as a component of other comprehensive income (loss) and are, therefore, excluded from net earnings. Our gross unrealized losses on fixed maturity and equity securities at December 31, 2017 were approximately $324 million. The accumulated change in estimated fair value of these available-for-sale securities is recognized in net earnings when the gain or loss is realized upon the sale of the security or in the event that the decline in estimated fair value is determined to be other-than-temporary and an impairment charge to earnings is taken. Realized losses or impairments may have a material adverse effect on our net earnings in a particular quarterly or annual period.
The occurrence of a major economic downturn, acts of corporate malfeasance, widening credit risk spreads, or other events that adversely affect the issuers or guarantors of securities we own or the underlying collateral of structured securities we own could cause the estimated fair value of our fixed maturity securities portfolio and corresponding earnings to decline and cause the default rate of the fixed maturity securities in our investment portfolio to increase. A ratings downgrade affecting issuers or guarantors of particular securities we hold, or similar trends that could worsen the credit quality of issuers, such as the corporate issuers of securities in our investment portfolio, could also have a similar effect. With economic uncertainty, credit quality of issuers or guarantors could be adversely affected. Similarly, a ratings downgrade affecting a security we hold could indicate the credit quality of that security has deteriorated and could increase the capital we must hold to support that security to maintain our insurance companies’ RBC levels. Levels of write-downs or impairments are impacted by intent to sell, or our assessment of the likelihood that we will be required to sell, fixed maturity securities, as well as our intent and ability to hold equity securities which have declined in value until recovery. Realized losses or impairments on these securities may have a material adverse effect on our business, results of operations, liquidity or financial condition in, or at the end of, any quarterly or annual period.
Some of our investments are relatively illiquid and may be difficult to sell, or to sell in significant amounts at acceptable prices, to generate cash to meet our needs.
We hold certain investments that may lack liquidity, such as privately placed fixed maturity securities, mortgage loans, commercial mortgage backed securities and alternative investments. In the past, even some of our very high quality investments experienced reduced liquidity during periods of market volatility or disruption. Although we seek to adjust our cash and short-term investment positions to minimize the likelihood that we would need to sell illiquid investments, if we were required to liquidate these investments on short notice or were required to post or return collateral, we may have difficulty doing so and be forced to sell them for less than we otherwise would have been able to realize.
The reported values of our relatively illiquid types of investments do not necessarily reflect the current market price for the asset. If we were forced to sell certain of our assets in the current market, there can be no assurance that we would be able to sell them for the prices at which we have recorded them and we might be forced to sell them at significantly lower prices, which could have a material adverse effect on our business, results of operations, liquidity or financial condition.
Defaults on our mortgage loans and volatility in performance may adversely affect our profitability.
A portion of our investment portfolio consists of mortgage loans on commercial and agricultural real estate. Our exposure to this risk stems from various factors, including the supply and demand of leasable commercial space, creditworthiness of tenants and partners, capital markets volatility, interest rate fluctuations, agricultural prices and farm incomes, which have recently been declining. Although we manage credit risk and market valuation risk for our commercial and agricultural real estate assets through geographic, property type and product type diversification and asset allocation, general economic conditions in the commercial and agricultural
45
Table of Contents
real estate sectors will continue to influence the performance of these investments. These factors, which are beyond our control, could have a material adverse effect on our business, results of operations, liquidity or financial condition.
Our mortgage loans face default risk and are principally collateralized by commercial and agricultural properties. We establish valuation allowances for estimated impairments, which are based on loan risk characteristics, historical default rates and loss severities, real estate market fundamentals, such as property prices and unemployment, and economic outlooks, as well as other relevant factors (for example, local economic conditions). In addition, substantially all of our commercial and agricultural mortgage loans held-for-investment have balloon payment maturities. An increase in the default rate of our mortgage loan investments or fluctuations in their performance could have a material adverse effect on our business, results of operations, liquidity or financial condition.
Further, any geographic or property type concentration of our mortgage loans may have adverse effects on our investment portfolio and consequently on our business, results of operations, liquidity or financial condition. While we seek to mitigate this risk by having a broadly diversified portfolio, events or developments that have a negative effect on any particular geographic region or sector may have a greater adverse effect on our investment portfolio to the extent that the portfolio is concentrated. Moreover, our ability to sell assets relating to a group of related assets may be limited if other market participants are seeking to sell at the same time.
Risks Relating to Our Retirement and Protection Businesses
Risks Relating to Our Reinsurance and Hedging Programs
GMxB features within certain of our products may decrease our earnings, decrease our capitalization, increase the volatility of our results, result in higher risk management costs and expose us to increased counterparty risk.
Certain of the variable annuity products we offer and certain in-force variable annuity products we offered historically, and certain variable annuity risks we assumed historically through reinsurance, include GMxB features. As of December 31, 2017, 78% of the variable annuity AV in our Individual Retirement segment was attributable to products that included GMxB features. We also offer index-linked variable annuities with guarantees against a defined floor on losses. GMxB features are designed to offer protection to policyholders against changes in equity markets and interest rates. Any such periods of significant and sustained negative or low Separate Account returns, increased equity volatility or reduced interest rates will result in an increase in the valuation of our liabilities associated with those products. In addition, if the Separate Account assets consisting of fixed income securities, which support the guaranteed index-linked return feature, are insufficient to reflect a period of sustained growth in the equity-index on which the product is based, we may be required to support such Separate Accounts with assets from our General Account and increase our liabilities. An increase in these liabilities would result in a decrease in our net income and depending on the magnitude of any such increase, could materially and adversely affect our financial condition, including our capitalization, as well as the financial strength ratings which are necessary to support our product sales.
Additionally, we make assumptions regarding policyholder behavior at the time of pricing and in selecting and using the GMxB features inherent within our products (e.g., use of option to annuitize within a GMIB product). An increase in the valuation of the liability could result to the extent emerging and actual experience deviates from these policyholder option use assumptions. We review our actuarial assumptions at least annually, including those assumptions relating to policyholder behavior, and update assumptions when appropriate. If we update our assumptions based on our actuarial assumption review in future years, we could be required to increase the liabilities we record for future policy benefits and claims to a level that may materially and adversely affect our business, results of operations or financial condition which, in certain circumstances, could impair our solvency. In addition, we have in the past updated our assumptions on policyholder behavior, which has
46
Table of Contents
negatively impacted our net income, and there can be no assurance that similar updates will not be required in the future. For example, in 2015, we updated our expectations of long-term lapse and partial withdrawal behavior for variable annuities with GMxB features based on emerging experience. In 2015, the post-tax impact of these assumption updates decreased net income by approximately $605 million.
In addition, capital markets hedging instruments may not effectively offset the costs of GMxB features or may otherwise be insufficient in relation to our obligations. Furthermore, we are subject to the risk that changes in policyholder behavior or mortality, combined with adverse market events, could produce economic losses not addressed by the risk management techniques employed. These factors, individually or collectively, may have a material adverse effect on our business, results of operations, including net income, capitalization, financial condition or liquidity including our ability to receive dividends from our insurance operating companies.
Our reinsurance and hedging programs may be inadequate to protect us against the full extent of the exposure or losses we seek to mitigate.
Certain of our retirement and protection products contain GMxB features or minimum crediting rates. As of December 31, 2017, 78% of the variable annuity AV in our Individual Retirement segment was attributable to products that included GMxB features. Downturns in equity markets or reduced interest rates could result in an increase in the valuation of liabilities associated with such products, resulting in increases in reserves and reductions in net income. In the normal course of business, we seek to mitigate some of these risks to which our business is subject through our hedging and reinsurance programs. However, these programs cannot eliminate all of the risks, and no assurance can be given as to the extent to which such programs will be completely effective in reducing such risks. For example, in the event that reinsurers, derivatives or other counterparties or central clearinghouses do not pay balances due or do not post the required amount of collateral as required under our agreements, we still remain liable for the guaranteed benefits.
Reinsurance. We use reinsurance to mitigate a portion of the risks that we face, principally in certain of our in-force annuity and life insurance products with regard to mortality, and in certain of our annuity products with regard to a portion of the GMxB features. Under our reinsurance arrangements, other insurers assume a portion of the obligation to pay claims and related expenses to which we are subject. However, we remain liable as the direct insurer on all risks we reinsure and, therefore, are subject to the risk that our reinsurer is unable or unwilling to pay or reimburse claims at the time demand is made. The inability or unwillingness of a reinsurer to meet its obligations to us, or the inability to collect under our reinsurance treaties for any other reason, could have a material adverse impact on our business, results of operations or financial condition.
We are continuing to use reinsurance to mitigate a portion of our risk on certain new life insurance sales. Prolonged or severe adverse mortality or morbidity experience could result in increased reinsurance costs, and ultimately may reduce the availability of reinsurance for future life insurance sales. If, for new sales, we are unable to maintain our current level of reinsurance or purchase new reinsurance protection in amounts that we consider sufficient, we would either have to be willing to accept an increase in our net exposures, revise our pricing to reflect higher reinsurance premiums or limit the amount of new business written on any individual life. If this were to occur, we may be exposed to reduced profitability and cash flow strain or we may not be able to price new business at competitive rates.
The premium rates and other fees that we charge are based, in part, on the assumption that reinsurance will be available at a certain cost. Some of our reinsurance contracts contain provisions that limit the reinsurer’s ability to increase rates on in-force business; however, some do not. If a reinsurer raises the rates that it charges on a block of in-force business, in some instances, we will not be able to pass the increased costs onto our customers and our profitability will be negatively impacted. Additionally, such a rate increase could result in our recapturing of the business, which may result in a need to maintain additional reserves, reduce reinsurance receivables and expose us to greater risks. While in recent years, we have faced a number of rate increase actions on in-force business, to date they have not had a material effect on our business, results of operations or financial
47
Table of Contents
condition. However, there can be no assurance that the outcome of future rate increase actions would have no material effect. In addition, market conditions beyond our control determine the availability and cost of reinsurance for new business. If reinsurers raise the rates that they charge on new business, we may be forced to raise our premiums, which could have a negative impact on our competitive position.
Hedging Programs. We use a hedging program to mitigate a portion of the unreinsured risks we face in, among other areas, the GMxB features of our variable annuity products and minimum crediting rates on our variable annuity and life products from unfavorable changes in benefit exposures due to movements in the capital markets. In certain cases, however, we may not be able to apply these techniques to effectively hedge these risks because the derivatives markets in question may not be of sufficient size or liquidity or there could be an operational error in the application of our hedging strategy or for other reasons. The operation of our hedging programs is based on models involving numerous estimates and assumptions, including, among others, mortality, lapse, surrender and withdrawal rates and amounts of withdrawals, election rates, fund performance, equity market returns and volatility, interest rate levels and correlation among various market movements. There can be no assurance that ultimate actual experience will not differ materially from our assumptions, particularly, but not only, during periods of high market volatility, which could adversely impact our business, results of operations or financial condition. For example, in the past, due to, among other things, levels of volatility in the equity and interest rate markets above our assumptions as well as deviations between actual and assumed surrender and withdrawal rates, gains from our hedging programs did not fully offset the economic effect of the increase in the potential net benefits payable under the GMxB features offered in certain of our products. If these circumstances were to re-occur in the future or if, for other reasons, results from our hedging programs in the future do not correlate with the economic effect of changes in benefit exposures to customers, we could experience economic losses which could have a material adverse impact on our business, results of operations or financial condition. Additionally, our strategies may result in under or over-hedging our liability exposure, which could result in an increase in our hedging losses and greater volatility in our earnings and have a material adverse effect on our business, results of operations or financial condition.
For further discussion, see below “—Risks Relating to Estimates, Assumptions and Valuations—Our risk management policies and procedures may not be adequate to identify, monitor and manage risks, which may leave us exposed to unidentified or unanticipated risks, which could negatively affect our businesses or result in losses.”
Our reinsurance arrangements with affiliated captives may be adversely impacted by changes to policyholder behavior assumptions under the reinsured contracts, the performance of their hedging program, their liquidity needs, their overall financial results and changes in regulatory requirements regarding the use of captives.
ACS Life reinsures to its wholly owned direct subsidiary CS Life RE a 100% quota share of all the GMxB riders historically assumed by ACS Life from various unaffiliated insurers and reinsurers. It is not anticipated that the reinsurance arrangement between ACS Life and CS Life RE will change materially in connection with the Reorganization.
The reinsurance arrangements with CS Life RE and EQ AZ Life Re Company (collectively, the “Affiliated Captives”) provide important capital management benefits to AXA Equitable Life, MLOA, USFL and ACS Life (collectively, the “Affiliated Cedants”). Under applicable statutory accounting rules, the Affiliated Cedants are currently, and will in the future be, entitled to a credit in their calculations of reserves for amounts reinsured to the Affiliated Captives, to the extent the Affiliated Captives hold assets in trust or provide letters of credit or other financing acceptable to the respective domestic regulators of the Affiliated Cedants. Under the reinsurance documentation, the Affiliated Captives are required to or will be permitted to transfer assets from the trusts under certain circumstances. The level of assets required to be maintained in the trust fluctuates based on market and interest rate movements, age of the policies, mortality experience and policyholder behavior (i.e., the exercise or
48
Table of Contents
non-exercise of rights by policyholders under the contracts including, but not limited to, lapses and surrenders, withdrawal rates and amounts and contributions). Increasing reserve requirements may necessitate that additional assets be placed in trust or securing additional letters of credit, which could impact the liquidity of the Affiliated Captives.
In addition, like AXA Equitable Life, CS Life RE employs a hedging strategy that uses derivatives contracts and fixed income investments that are collectively managed to help reduce the economic impact of unfavorable market-driven changes to reserves. The terms of these contracts require CS Life RE to post initial margin to a clearinghouse and cash settle hedges when there is a decline in the estimated fair value of specified instruments. This would occur, for example, as interest rates or equity markets rise. When this happens, the terms of the reinsurance agreement may not always allow CS Life RE to restore liquidity by withdrawing assets from the trust.
While management believes that CS Life RE has and will have adequate liquidity and credit facilities to deal with a range of market scenarios and increasing reserve requirements, larger market movements, including but not limited to a significant increase in interest rates, could require CS Life RE to post more collateral or cash settle more hedges than its own resources would permit. While management of CS Life RE intends to take all reasonable steps to maintain adequate sources of liquidity to meet its obligations, there can be no assurance that such sources will be available in all market scenarios. The potential inability of CS Life RE to post such collateral or cash settle such hedges could cause CS Life RE to reduce the size of its hedging programs, which could ultimately adversely impact CS Life RE’s ability to perform under the reinsurance arrangements and ACS Life’s ability to obtain full statutory reserve credit for the reinsurance arrangements.
In 2014, the NAIC considered a proposal to require states to apply NAIC accreditation standards, applicable to traditional insurers, to captive reinsurers. In 2015, the NAIC adopted such a proposal, in the form of a revised preamble to the NAIC accreditation standards (the “Standard”), with an effective date of January 1, 2016 for application of the Standard to captives that assume level premium term life insurance (“XXX”) business and universal life with secondary guarantees (“AXXX”) business. The Standard applies prospectively, so that XXX/AXXX captives will not be subject to the Standard if reinsured policies were issued prior to January 1, 2015 and ceded so that they were part of a reinsurance arrangement as of December 31, 2014, as is the case for the XXX business and AXXX business reinsured by our current and future Affiliated Captives. The NAIC left for future action the application of the Standard to captives that assume variable annuity business. See “—Legal and Regulatory Risks—Our retirement and protection businesses are heavily regulated, and changes in regulation and in supervisory and enforcement policies may limit our growth and have a material adverse effect on our business, results of operations or financial condition.”
We cannot predict what revisions, if any, will be made to the Standard, if adopted for variable annuity captives, or to proposed revisions to NAIC reserve and capital requirements for variable annuity guarantees, after ongoing NAIC deliberations and as states consider their adoption or undertake their implementation. It is also unclear whether these or other proposals will be adopted by the NAIC or the NYDFS, or what additional actions and regulatory changes will result from the continued scrutiny and reform efforts by the NAIC and regulatory bodies with respect to captive reinsurance. Any regulatory action that limits our ability to achieve desired benefits from the use of, or materially increases our cost of using, captive reinsurance and applies retroactively, including, if the Standard is adopted as proposed, without grandfathering provisions for existing captive variable annuity reinsurance entities, could have a material adverse effect on our business, results of operations or financial condition.
In addition, a number of lawsuits have been filed against insurance companies, including AXA Equitable Life, over the use of captive reinsurers. The outcome of this litigation could have a material adverse effect on our business, results of operations or financial condition.
The inability to secure additional required capital or liquidity in the circumstances described above could have a material adverse effect on our business, results of operations or financial condition.
49
Table of Contents
Risks Relating to the Products We Offer, Our Structure and Product Distribution
Our retirement and protection products contain numerous features and are subject to extensive regulation and failure to administer or meet any of the complex product requirements may adversely impact our business, results of operations or financial condition.
Our retirement and protection products are subject to a complex and extensive array of state and federal tax, securities, insurance and employee benefit plan laws and regulations, which are administered and enforced by a number of different governmental and self-regulatory authorities, including, among others, state insurance regulators, state securities administrators, state banking authorities, the U.S. Securities and Exchange Commission (the “SEC”), the Financial Industry Regulatory Authority, Inc. (“FINRA”), the U.S. Department of Labor (the “DOL”) and the Internal Revenue Service (“IRS”).
For example, U.S. federal income tax law imposes requirements relating to annuity and insurance product design, administration and investments that are conditions for beneficial tax treatment of such products under the Internal Revenue Code of 1986, as amended (the “Code”). Additionally, state and federal securities and insurance laws impose requirements relating to annuity and insurance product design, offering and distribution, and administration. Failure to administer product features in accordance with contract provisions or applicable law, or to meet any of these complex tax, securities or insurance requirements could subject us to administrative penalties imposed by a particular governmental or self-regulatory authority, unanticipated costs associated with remedying such failure or other claims, litigation, harm to our reputation or interruption of our operations. If this were to occur, it could adversely impact our business, results of operations or financial condition.
We and certain of our subsidiaries are required to file periodic and other reports within certain time periods imposed by U.S. federal securities laws, rules and regulations. Failure to file such reports within the designated time period, failure to accurately report our financial condition or results of operations, or restatements of historical financial statements could require our insurance subsidiaries, including AXA Equitable Life and MLOA, to curtail or cease sales of certain of our variable annuity products and other variable insurance products or delay the launch of new products or new features, which could cause a significant disruption in the business of our insurance subsidiaries. If our affiliated and third party distribution platforms are required to curtail or cease sales of our products, we may lose shelf space for our products indefinitely, even once we are able to resume sales. For example, AXA Equitable Life failed to timely file its Quarterly Report on Form 10-Q for the quarter ended September 30, 2017 and required an extension of the due date under Rule 12b-25 for its Annual Report on Form 10-K for the year ended December 31, 2017. If AXA Equitable Life were to fail to file any future periodic or other report with the SEC on a timely basis, it would be required to cease sales of SEC-registered variable annuity products until such time that new registration statements could be filed with the SEC and declared effective. Any curtailment or cessation of sales of our variable insurance products could have a material adverse effect on our business, results of operations or financial condition.
Many of our products and services are complex and are frequently sold through intermediaries. In particular, our insurance business is reliant on intermediaries to describe and explain their products to potential customers. The intentional or unintentional misrepresentation of our products and services in advertising materials or other external communications, or inappropriate activities by our personnel or an intermediary, could adversely affect our reputation and business, as well as lead to potential regulatory actions or litigation.
The amount of statutory capital that we have and the amount of statutory capital we must hold to meet our statutory capital requirements and our financial strength and credit ratings can vary significantly from time to time.
Statutory accounting standards and capital and reserve requirements for our insurance subsidiaries are prescribed by the applicable state insurance regulators and the NAIC. State insurance regulators have established regulations that govern reserving requirements and provide minimum capitalization requirements based on RBC ratios for life insurance companies. This RBC formula establishes capital requirements relating to insurance,
50
Table of Contents
business, asset and interest rate risks, including equity, interest rate and expense recovery risks associated with variable annuities and group annuities that contain death benefits or certain living benefits.
In any particular year, statutory surplus amounts and RBC ratios may increase or decrease depending on a variety of factors, including but not limited to the amount of statutory income or losses we generate (which itself is sensitive to equity market and credit market conditions), changes in interest rates, changes to existing RBC formulas, changes in reserves, the amount of additional capital we must hold to support business growth, changes in equity market levels and the value and credit rating of certain fixed income and equity securities in our investment portfolio, including our investment in AB, which could in turn reduce the statutory capital of certain of our insurance subsidiaries. Additionally, state insurance regulators have significant leeway in how to interpret existing regulations, which could further impact the amount of statutory capital or reserves that we must maintain. AXA Equitable Life is primarily regulated by the NYDFS, which from time to time has taken more stringent positions than other state insurance regulators on matters affecting, among other things, statutory capital or reserves. In certain circumstances, particularly those involving significant market declines, the effect of these more stringent positions may be that our financial condition appears to be worse than competitors who are not subject to the same stringent standards, which could have a material adverse impact on our business, results of operations or financial condition. Moreover, rating agencies may implement changes to their internal models that have the effect of increasing or decreasing the amount of capital our insurance subsidiaries must hold in order to maintain their current ratings. To the extent that our statutory capital resources are deemed to be insufficient to maintain a particular rating by one or more rating agencies, our insurance subsidiaries’ financial strength and credit ratings might be downgraded by one or more rating agencies. There can be no assurance that any of our insurance subsidiaries will be able to maintain its current RBC ratio in the future or that its RBC ratio will not fall to a level that could have a material adverse effect on our business, results of operations or financial condition.
The failure of any of our insurance subsidiaries to meet its applicable RBC requirements or minimum capital and surplus requirements could subject it to further examination or corrective action imposed by insurance regulators, including limitations on its ability to write additional business, supervision by regulators, rehabilitation, or seizure or liquidation. Any corrective action imposed could have a material adverse effect on our business, results of operations or financial condition. A decline in RBC ratios, whether or not it results in a failure to meet applicable RBC requirements, may still limit the ability of an insurance subsidiary to make dividends or distributions to us, could result in a loss of customers or new business, and could be a factor in causing ratings agencies to downgrade the insurer’s financial strength ratings, each of which could have a material adverse effect on our business, results of operations or financial condition.
Changes in statutory reserve or other requirements or the impact of adverse market conditions could result in changes to our product offerings that could materially and adversely impact our business, results of operations or financial condition.
Changes in statutory reserve or other requirements, increased costs of hedging, other risk mitigation techniques and financing and other adverse market conditions could result in certain products becoming less profitable or unprofitable. These circumstances may cause us to modify or eliminate certain features of various products or cause the suspension or cessation of sales of certain products in the future. Any modifications to products that we may make could result in certain of our products being less attractive or competitive. This could adversely impact sales, which could negatively impact AXA Advisors’ ability to retain its sales personnel and our ability to maintain our distribution relationships. This, in turn, may materially and adversely impact our business, results of operations or financial condition.
A downgrade in our financial strength and claims-paying ratings could adversely affect our business, results of operations or financial condition.
Claims-paying and financial strength ratings are important factors in establishing the competitive position of insurance companies. They indicate the rating agencies’ opinions regarding an insurance company’s ability to
51
Table of Contents
meet policyholder obligations and are important to maintaining public confidence in our products and our competitive position. A downgrade of our ratings or those of AXA Equitable Life, MLOA or AXA Financial could adversely affect our business, results of operations or financial condition by, among other things, reducing new sales of our products, increasing surrenders and withdrawals from our existing contracts, possibly requiring us to reduce prices or take other actions for many of our products and services to remain competitive, or adversely affecting our ability to obtain reinsurance or obtain reasonable pricing on reinsurance. A downgrade in our ratings may also adversely affect our cost of raising capital or limit our access to sources of capital. Upon announcement of AXA’s plan to pursue this offering, AXA Equitable Life’s and Financial’s ratings were downgraded by AM Best, S&P and Moody’s. We may face additional downgrades as a result of this offering or future sales of our common stock by AXA.
As rating agencies continue to evaluate the financial services industry, it is possible that rating agencies will heighten the level of scrutiny that they apply to financial institutions, increase the frequency and scope of their credit reviews, request additional information from the companies that they rate and potentially adjust upward the capital and other requirements employed in the rating agency models for maintenance of certain ratings levels. It is possible that the outcome of any such review of us would have additional adverse ratings consequences, which could have a material adverse effect on our business, results of operations or financial condition. We may need to take actions in response to changing standards or capital requirements set by any of the rating agencies which could cause our business and operations to suffer. We cannot predict what additional actions rating agencies may take, or what actions we may take in response to the actions of rating agencies.
The ability of our insurance subsidiaries to pay dividends and other distributions to Holdings is limited by state insurance laws, and our insurance subsidiaries may not generate sufficient statutory earnings or have sufficient statutory surplus to enable them to pay ordinary dividends.
The payment of dividends and other distributions to Holdings by its insurance subsidiaries, including its captive reinsurers, is regulated by state insurance laws and regulations. These restrictions may limit or prevent our insurance subsidiaries from making dividend or other payments to Holdings and, as discussed above in “—Risks Relating to Our Consolidated Business—Risks Relating to Our Operations—As a holding company, Holdings depends on the ability of its subsidiaries to transfer funds to it to meet its obligations,” may limit or prevent Holdings from making payments to third parties, stockholder dividends and share repurchases.
The jurisdictions in which our insurance subsidiaries are domiciled impose certain restrictions on the ability to pay dividends to their respective parents. These restrictions are based, in part, on earned surplus and the prior year’s statutory income and policyholder surplus. In general, dividends may be paid only from earned surplus (typically defined as available or unassigned surplus, subject to possible adjustments) which is derived from realized net profits on the company’s business. Dividends up to specified levels are generally considered ordinary and generally may be made without prior regulatory approval. Meanwhile, dividends paid from sources other than earned surplus or in larger amounts, often called “extraordinary dividends,” are generally subject to approval by the insurance commissioner of the relevant state of domicile.
Under New York insurance law applicable to AXA Equitable Life, a domestic stock life insurer may not, without prior approval of the NYDFS, pay a dividend to its stockholders exceeding an amount calculated under one of two standards. The first standard allows payment of an ordinary dividend out of the insurer’s earned surplus (as reported on the insurer’s most recent annual statement) up to a limit calculated pursuant to a statutory formula, provided that the NYDFS is given notice and opportunity to disapprove the dividend if certain qualitative tests are not met (the “Earned Surplus Standard”). The second standard allows payment of an ordinary dividend up to a limit calculated pursuant to a different statutory formula without regard to the insurer’s earned surplus (the “Alternative Standard”). Dividends exceeding these prescribed limits require the insurer to file a notice of its intent to declare the dividends with the NYDFS and prior approval or non-disapproval from the NYDFS.
52
Table of Contents
Applying the formulas under these standards and the definition of earned surplus used in the Earned Surplus Standard, AXA Equitable Life could pay ordinary dividends of up to approximately $1.2 billion during 2018 and could have paid ordinary dividends of up to approximately $1.2 billion during 2017. However, in 2016, the NYDFS issued a circular letter to its regulated insurance companies stating that ordinary dividends which exceed an insurer’s positive unassigned funds (as reported in the insurer’s most recent annual statement) may fail one of the qualitative tests imposed by the Earned Surplus Standard. Given the circular letter, it is possible that the NYDFS could limit the amount of ordinary dividends declared by AXA Equitable Life under the Earned Surplus Standard to the amount of AXA Equitable Life’s positive unassigned funds. As of December 31, 2017 and December 31, 2016, AXA Equitable Life’s unassigned funds reported on its statutory financial statements were approximately $1.9 billion and $0.9 billion, respectively.
In the second quarter of 2017, AXA Equitable Life agreed with the NYDFS that until: (i) it files a plan with respect to the management of its variable annuity business ceded to AXA RE Arizona with the NYDFS and (ii) fully implements that plan (the “DFS Conditions”), it will pay ordinary dividends only under the Earned Surplus Standard.
We have confirmed that the completion of the GMxB Unwind, which occurred on April 12, 2018, satisfied the DFS Conditions, and that, going forward, satisfaction of either the Earned Surplus Standard or Alternative Standard will determine AXA Equitable Life’s ability to pay ordinary dividends.
Under the insurance laws applicable to our life insurance subsidiaries domiciled in Arizona and Colorado, an extraordinary dividend or distribution is defined as a dividend or distribution that, together with other dividends and distributions made within the preceding twelve months, exceeds the lesser of (1) 10% of the insurer’s policyholder surplus as of the preceding December 31 or (2) the insurer’s net gain from operations for the twelve-month period ended the preceding December 31, in each case determined in accordance with statutory accounting principles. Under insurance laws applicable to our life insurance subsidiaries domiciled in Delaware and Ohio, an extraordinary dividend or distribution is defined as one that, together with other dividends and distributions made within the preceding twelve months, exceeds the greater of (1) and (2) above. As a result, under applicable domiciliary insurance regulations, certain of our life insurance subsidiaries must deduct any distributions or dividends paid in the preceding twelve months in calculating dividend capacity. Insurance laws applicable to our Delaware-domiciled property and casualty insurance subsidiary, which was removed from Holdings’ ownership, are similar. In addition, although prior regulatory approval may not be required by law for the payment of dividends up to the limitations described above, in practice, the insurance subsidiaries would typically discuss any dividend payments with the applicable regulatory authority prior to payment.
From time to time, the NAIC and various state insurance regulators have considered, and may in the future consider, proposals to further limit dividend payments that an insurance company may make without regulatory approval. More stringent restrictions on dividend payments may be adopted from time to time by jurisdictions in which our insurance subsidiaries are domiciled, and such restrictions could have the effect, under certain circumstances, of significantly reducing dividends or other amounts payable to Holdings by its insurance subsidiaries without prior approval by regulatory authorities. We may also choose to change the domicile of one or more of our insurance subsidiaries or captive insurance subsidiaries, in which case we would be subject to the restrictions imposed under the laws of that new domicile, which could be more restrictive than those to which we are currently subject. In addition, in the future, we may become subject to debt instruments or other agreements that limit the ability of our insurance subsidiaries to pay dividends or make other distributions. The ability of our insurance subsidiaries to pay dividends or make other distributions is also limited by our need to maintain the financial strength ratings assigned to such subsidiaries by the rating agencies. These ratings depend to a large extent on the capitalization levels of our insurance subsidiaries.
Our life insurance subsidiaries domiciled in New York have ordinary dividend capacity for 2018. Our insurance subsidiaries domiciled in Arizona, Colorado, Ohio and Delaware do not have capacity at this time to make ordinary dividend payments to Holdings without domiciliary regulatory approval, which can be granted or withheld in the discretion of the regulator.
53
Table of Contents
If any of our insurance subsidiaries subject to the positive earned surplus requirement do not succeed in building up sufficient positive earned surplus to have ordinary dividend capacity in future years, such subsidiary would be unable to pay dividends or distributions to our holding company absent prior approval of its domiciliary insurance regulator, which can be granted or withheld in the discretion of the regulator. In addition, we may seek extraordinary dividends or distributions, but there can be no assurance that our insurance subsidiaries will receive approval for extraordinary distribution payments in the future.
The payment of dividends by our current and future captive reinsurance subsidiaries is regulated by their respective governing licensing orders, and in no event may the dividends decrease the capital of the captive below the minimum capital requirement applicable to it, and, after giving effect to the dividends, the assets of the captive paying the dividend must be sufficient to satisfy its domiciliary insurance regulator, the Arizona Department of Insurance, that it can meet its obligations.
In addition, a significant portion of our economic ownership interest and all of our general partnership interest in AB are held directly or indirectly by our insurance company subsidiaries. Any dividends paid by AB to our insurance company subsidiaries will be subject to applicable regulatory restrictions on dividends and may not be available to Holdings.
The ability of financial professionals associated with us to sell our competitors’ products could result in reduced sales of our products and revenues.
Most of the financial professionals associated with AXA Advisors and AXA Network are permitted to sell products from competing unaffiliated insurance companies. If our competitors offer products that are more attractive than ours, or pay higher commission rates to the sales representatives than we do, these representatives may concentrate their efforts in selling our competitor’s products instead of ours. To the extent the financial professionals sell our competitors’ products rather than our products, we may experience reduced sales and revenues.
A loss of, or significant change in, key product distribution relationships could materially and adversely affect sales.
We distribute certain products under agreements with third-party distributors and other members of the financial services industry that are not affiliated with us. We compete with other financial institutions to attract and retain commercial relationships in each of these channels, and our success in competing for sales through these distribution intermediaries depends upon factors such as the amount of sales commissions and fees we pay, the breadth of our product offerings, the strength of our brand, our perceived stability and financial strength ratings, and the marketing and services we provide to, and the strength of the relationships we maintain with, individual third-party distributors. An interruption or significant change in certain key relationships could materially and adversely affect our ability to market our products and could have a material adverse effect on our business, results of operation or financial condition. Distributors may elect to alter, reduce or terminate their distribution relationships with us, including for such reasons as changes in our distribution strategy, adverse developments in our business, adverse rating agency actions or concerns about market-related risks. Alternatively, we may terminate one or more distribution agreements due to, for example, a loss of confidence in, or a change in control of, one of the third-party distributors, which could reduce sales.
Furthermore, an interruption in certain key relationships could materially and adversely affect our ability to market our products and could have a material adverse effect on our business, results of operations or financial condition. The sale of shares by AXA in this offering could prompt some third parties to re-price, modify or terminate their distribution or vendor relationships with us due to a perceived uncertainty related to this offering or our business. An interruption or significant change in certain key relationships could materially and adversely affect our ability to market our products and could have a material adverse effect on our business, results of operations or financial condition. Distributors may elect to suspend, alter, reduce or terminate their distribution
54
Table of Contents
relationships with us for various reasons, including uncertainty related to this offering, changes in our distribution strategy, adverse developments in our business, adverse rating agency actions or concerns about market-related risks.
We are also at risk that key distribution partners may merge or change their business models in ways that affect how our products are sold, either in response to changing business priorities or as a result of shifts in regulatory supervision or potential changes in state and federal laws and regulations regarding standards of conduct applicable to third-party distributors when providing investment advice to retail and other customers.
Because our products are distributed through unaffiliated firms, we may not be able to monitor or control the manner of their distribution despite our training and compliance programs. If our products are distributed by such firms in an inappropriate manner, or to customers for whom they are unsuitable, we may suffer reputational and other harm to our business.
Consolidation of third-party distributors of retirement and protection products may adversely affect the insurance industry and the profitability of our business.
The insurance industry distributes many of its products through other financial institutions such as banks and broker-dealers. An increase in the consolidation activity of bank and other financial services companies may create firms with even stronger competitive positions, negatively impact the industry’s sales, increase competition for access to third-party distributors, result in greater distribution expenses and impair our ability to market retirement and protection products to our current customer base or expand our customer base. We may also face competition from new market entrants or non-traditional or online competitors, which may have a material adverse effect on our business. Consolidation of third-party distributors or other industry changes may also increase the likelihood that third-party distributors will try to renegotiate the terms of any existing selling agreements to terms less favorable to us.
Risks Relating to Estimates, Assumptions and Valuations
Our risk management policies and procedures may not be adequate to identify, monitor and manage risks, which may leave us exposed to unidentified or unanticipated risks, which could negatively affect our businesses, results of operations or financial condition.
Our policies and procedures, including hedging programs, to identify, monitor and manage risks may not be adequate or fully effective. Many of our methods of managing risk and exposures are based upon our use of historical market behavior or statistics based on historical models. As a result, these methods will not predict future exposures, which could be significantly greater than the historical measures indicate, such as the risk of terrorism or pandemics causing a large number of deaths. Other risk management methods depend upon the evaluation of information regarding markets, clients, catastrophe occurrence or other matters that is publicly available or otherwise accessible to us, which may not always be accurate, complete, up-to-date or properly evaluated. Management of operational, legal and regulatory risks requires, among other things, policies and procedures to record and verify large numbers of transactions and events. These policies and procedures may not be fully effective.
We employ various strategies, including hedging and reinsurance, with the objective of mitigating risks inherent in our business and operations. These risks include current or future changes in the fair value of our assets and liabilities, current or future changes in cash flows, the effect of interest rates, equity markets and credit spread changes, the occurrence of credit defaults and changes in mortality and longevity. We seek to control these risks by, among other things, entering into reinsurance contracts and through our various hedging programs. Developing an effective strategy for dealing with these risks is complex, and no strategy can completely insulate us from such risks. Our hedging strategies also rely on assumptions and projections regarding our assets, liabilities, general market factors and the creditworthiness of our counterparties that may prove to be
55
Table of Contents
incorrect or prove to be inadequate. Accordingly, our hedging activities may not have the desired beneficial impact on our business, results of operations or financial condition. As U.S. GAAP accounting differs from the methods used to determine regulatory reserves and rating agency capital requirements, our hedging program tends to create earnings volatility in our U.S. GAAP financial statements. Further, the nature, timing, design or execution of our hedging transactions could actually increase our risks and losses. Our hedging strategies and the derivatives that we use, or may use in the future, may not adequately mitigate or offset the hedged risk and our hedging transactions may result in losses.
Our reserves could be inadequate due to differences between our actual experience and management’s estimates and assumptions.
We establish and carry reserves to pay future policyholder benefits and claims. Our reserve requirements for our direct and reinsurance assumed business are calculated based on a number of estimates and assumptions, including estimates and assumptions related to future mortality, morbidity, longevity, interest rates, future equity performance, reinvestment rates, persistency, claims experience and policyholder elections (i.e., the exercise or non-exercise of rights by policyholders under the contracts). Examples of policyholder elections include, but are not limited to, lapses and surrenders, withdrawals and amounts of withdrawals, and contributions and the allocation thereof. The assumptions and estimates used in connection with the reserve estimation process are inherently uncertain and involve the exercise of significant judgment. We review the appropriateness of reserves and the underlying assumptions at least annually and update assumptions when appropriate. We cannot, however, determine with precision the amounts that we will pay for, or the timing of payment of, actual benefits and claims or whether the assets supporting the policy liabilities will grow to the level assumed prior to payment of benefits or claims. Our claim costs could increase significantly and our reserves could be inadequate if actual results differ significantly from our estimates and assumptions. If so, we will be required to increase reserves or reduce DAC, which could materially and adversely impact our business, results of operations or financial condition.
Our profitability may decline if mortality, longevity or persistency or other experience differ significantly from our pricing expectations or reserve assumptions.
We set prices for many of our retirement and protection products based upon expected claims and payment patterns, using assumptions for mortality rates of our policyholders. In addition to the potential effect of natural or man-made disasters, significant changes in mortality, longevity and morbidity could emerge gradually over time due to changes in the natural environment, the health habits of the insured population, technologies and treatments for disease or disability, the economic environment or other factors. The long-term profitability of our retirement and protection products depends upon how our actual mortality rates, and to a lesser extent actual morbidity rates, compare to our pricing assumptions. In addition, prolonged or severe adverse mortality or morbidity experience could result in increased reinsurance costs, and ultimately, reinsurers might not offer coverage at all. If we are unable to maintain our current level of reinsurance or purchase new reinsurance protection in amounts that we consider sufficient, we would have to accept an increase in our net risk exposures, revise our pricing to reflect higher reinsurance premiums, or otherwise modify our product offering.
Pricing of our retirement and protection products is also based in part upon expected persistency of these products, which is the probability that a policy or contract will remain in force from one period to the next. Persistency within our variable annuity products may be significantly and adversely impacted by the value of GMxB features contained in many of our variable annuity products being higher than current AV in light of poor equity market performance or extended periods of low interest rates as well as other factors. Results may also vary based on differences between actual and expected premium deposits and withdrawals for these products. Persistency within our life insurance products may be significantly impacted by, among other things, conditions in the capital markets, the changing needs of our policyholders, the manner in which a product is marketed or illustrated and competition, including the availability of new products and policyholder perception of us, which may be negatively impacted by adverse publicity.
56
Table of Contents
Significant deviations in actual experience from our pricing assumptions could have an adverse effect on the profitability of our products. For example, if policyholder elections differ from the assumptions we use in our pricing, our profitability may decline. Actual persistency that is lower than our persistency assumptions could have an adverse effect on profitability, especially in the early years of a policy, primarily because we would be required to accelerate the amortization of expenses we defer in connection with the acquisition of the policy. Actual persistency that is higher than our persistency assumptions could have an adverse effect on profitability in the later years of a block of business because the anticipated claims experience is higher in these later years. If actual persistency is significantly different from that assumed in our current reserving assumptions, our reserves for future policy benefits may prove to be inadequate. Although some of our variable annuity and life insurance products permit us to increase premiums or adjust other charges and credits during the life of the policy or contract, the adjustments permitted under the terms of the policies or contracts may not be sufficient to maintain profitability. Many of our variable annuity and life insurance products do not permit us to increase premiums or adjust other charges and credits or limit those adjustments during the life of the policy or contract. Even if we are permitted under the contract to increase premiums or adjust other charges and credits, we may not be able to do so due to litigation, point of sale disclosures, regulatory reputation and market risk or due to actions by our competitors. In addition, the development of a secondary market for life insurance, including life settlements or “viaticals” and investor owned life insurance, and to a lesser extent third-party investor strategies in the variable annuity market, could adversely affect the profitability of existing business and our pricing assumptions for new business.
We may be required to accelerate the amortization of DAC, which could adversely affect our business, results of operations or financial condition.
DAC represents policy acquisition costs that have been capitalized. Capitalized costs associated with DAC are amortized in proportion to actual and estimated gross profits, gross premiums or gross revenues depending on the type of contract. On an ongoing basis, we test the DAC recorded on our balance sheets to determine if the amount is recoverable under current assumptions. In addition, we regularly review the estimates and assumptions underlying DAC. The projection of estimated gross profits, gross premiums or gross revenues requires the use of certain assumptions, principally related to Separate Account fund returns in excess of amounts credited to policyholders, policyholder behavior such as surrender, lapse and annuitization rates, interest margin, expense margin, mortality, future impairments and hedging costs. Estimating future gross profits, gross premiums or gross revenues is a complex process requiring considerable judgment and the forecasting of events well into the future. If these assumptions prove to be inaccurate, if an estimation technique used to estimate future gross profits, gross premiums or gross revenues is changed, or if significant or sustained equity market declines occur or persist, we could be required to accelerate the amortization of DAC, which would result in a charge to earnings. Such adjustments could have a material adverse effect on our business, results of operations or financial condition.
We use financial models that rely on a number of estimates, assumptions and projections that are inherently uncertain and which may contain errors.
We use models in our hedging programs and many other aspects of our operations, including but not limited to, product development and pricing, capital management, the estimation of actuarial reserves, the amortization of DAC, the fair value of the GMIB reinsurance contracts and the valuation of certain other assets and liabilities. These models rely on estimates, assumptions and projections that are inherently uncertain and involve the exercise of significant judgment. Due to the complexity of such models, it is possible that errors in the models could exist and our controls could fail to detect such errors. Failure to detect such errors could materially and adversely impact our business, results of operations or financial condition.
The determination of the amount of allowances and impairments taken on our investments is subjective and could materially impact our business, results of operations or financial condition.
The determination of the amount of allowances and impairments vary by investment type and is based upon our evaluation and assessment of known and inherent risks associated with the respective asset class.
57
Table of Contents
Management updates its evaluations regularly and reflects changes in allowances and impairments in operations as such evaluations are revised. There can be no assurance that management’s judgments, as reflected in our financial statements, will ultimately prove to be an accurate estimate of the actual and eventual diminution in realized value. Historical trends may not be indicative of future impairments or allowances. Furthermore, additional impairments may need to be taken or allowances provided for in the future that could have a material adverse effect on our business, results of operations or financial condition.
We define fair value generally as the price that would be received to sell an asset or paid to transfer a liability. When available, the estimated fair value of securities is based on quoted prices in active markets that are readily and regularly obtainable; these generally are the most liquid holdings and their valuation does not involve management judgment. When quoted prices in active markets are not available, we estimate fair value based on market standard valuation methodologies, including discounted cash flow methodologies, matrix pricing, or other similar techniques. For securities with reasonable price transparency, the significant inputs to these valuation methodologies either are observable in the market or can be derived principally from or corroborated by observable market data. When the volume or level of activity results in little or no price transparency, significant inputs no longer can be supported by reference to market observable data but instead must be based on management’s estimation and judgment. Valuations may result in estimated fair values which vary significantly from the amount at which the investments may ultimately be sold. Further, rapidly changing and unprecedented credit and equity market conditions could materially impact the valuation of securities as reported within our financial statements and the period-to-period changes in estimated fair value could vary significantly. Decreases in the estimated fair value of securities we hold may have a material adverse effect on our business, results of operations or financial condition.
Risks Relating to Our Investment Management and Research Business
AB’s revenues and results of operations depend on the market value and composition of AB’s AUM, which can fluctuate significantly based on various factors, including many factors outside of its control.
We derive most of our revenues related to AB’s business from investment advisory and services fees, which typically are calculated as a percentage of the value of AUM as of a specified date, or as a percentage of the value of average AUM for the applicable billing period, and vary with the type of investment service, the size of the account and the total amount of assets AB manages for a particular client. The value and composition of AB’s AUM can be adversely affected by several factors, including:
| • | Market Factors. Uncertainties were prevalent throughout 2017. Although U.S. equity markets have advanced to record levels and fixed income risk assets, such as high yield and other credit instruments, have continued to be strong, geopolitical tensions with North Korea, severe hurricanes in the United States and U.S. territories, and new terror attacks in Europe and the United States have kept investors on edge. Many investors are concerned that the U.S. markets are nearly overvalued and are watching closely for Federal Reserve action. |
Beyond the United States, economic recovery is unfolding at varying rates throughout the developed and emerging markets. Europe, Asia and the Far East and emerging markets equities have earned high returns year-to-date as a result of improving corporate earnings, greater regulatory clarity, constructive outcomes of various European elections and stabilization in economic growth among the emerging markets. Despite this generally positive backdrop, uncertainty remains over issues like the potential for rising inflation in the United States and President Trump’s ability to pursue his promised pro-growth policies, the impact of Brexit and ongoing concerns about geopolitics, commodity prices and the sustainability of growth in the emerging markets. While the current environment of lower stock correlations, and the potential for lower returns and higher volatility going forward, bode well for active management, investors continue to favor passive management, presenting a significant industry-wide challenge to organic growth.
58
Table of Contents
These factors may adversely affect AB’s AUM and revenues. Additionally, increases in interest rates, particularly if rapid, likely will decrease the total return of many bond investments due to lower market valuations of existing bonds. These factors could have a significant adverse effect on AB’s revenues and results of operations as AUM in AB’s fixed income investments comprise a major component of AB’s total AUM.
| • | Client Preferences. Generally, AB’s clients may withdraw their assets at any time and on short notice. Also, changing market dynamics and investment trends, particularly with respect to sponsors of defined benefit plans choosing to invest in less risky investments and the ongoing shift to lower-fee passive services described below, may continue to reduce interest in some of the investment products AB offers, or clients and prospects may continue to seek investment products that AB may not currently offer. Loss of, or decreases in, AUM reduces AB’s investment advisory and services fees and revenues. |
| • | AB’s Investment Performance. AB’s ability to achieve investment returns for clients that meet or exceed investment returns for comparable asset classes and competing investment services is a key consideration when clients decide to keep their assets with AB or invest additional assets, and when a prospective client is deciding whether to invest with AB. Poor investment performance, both in absolute terms or relative to peers and stated benchmarks, may result in clients withdrawing assets and in prospective clients choosing to invest with competitors. |
| • | Investing Trends. AB’s fee rates vary significantly among the various investment products and services AB offers to its clients. For example, AB generally earns higher fees from assets invested in its actively-managed equity services than in its actively-managed fixed income services or passive services. Also, AB often earns higher fees from global and international services than AB does from U.S. services. An adverse mix shift would reduce AB’s investment advisory and services fees and revenues. |
| • | Service Changes. AB may be required to reduce its fee levels, restructure the fees it charges or adjust the services it offers to its clients because of, among other things, regulatory initiatives (whether industry-wide or specifically targeted), changing technology in the asset management business (including algorithmic strategies and emerging financial technology), court decisions and competitive considerations. A reduction in fees would reduce AB’s revenues. |
A decrease in the value of AB’s AUM, or a decrease in the amount of AUM AB manages, or an adverse mix shift in its AUM, would adversely affect AB’s investment advisory and services fees and revenues. A reduction in revenues, without a commensurate reduction in expenses, adversely affects AB’s and our business, results of operations or financial condition.
The industry-wide shift from actively-managed investment services to passive services has adversely affected AB’s investment advisory and services fees, revenues and results of operations, and this trend may continue.
The competitive environment with respect to the AB business has become increasingly difficult over the past decade, as active managers, which invest based on individual security selection, have, on average, consistently underperformed passive services, which invest based on market indices. Active managers continued to struggle to attract new assets as the popularity of passive strategies persisted. Active equity net outflows from U.S. mutual funds were $201 billion in 2017 while passive equity net inflows were $464 billion. In total, U.S. retail passive net inflows of $692 billion in 2017 represented a new all-time high. In this environment, organic growth through positive net flows is difficult to achieve for active managers, such as AB, and requires taking market share from other active managers.
The significant shift from active services to passive services adversely affects Bernstein Research Services revenues as well. Global market volumes have declined in recent years, and we expect this to continue, fueled by the steady rise in active equity outflows and passive equity inflows. As a result, portfolio turnover has decreased and investors hold fewer shares that are actively traded by managers.
59
Table of Contents
We and AXA and its affiliates provide a significant amount of AB’s AUM and fund a significant portion of AB’s seed investments, and, if we or they choose to terminate their investment advisory agreements or withdraw capital support, it could have a material adverse effect on AB’s business, results of operations or financial condition.
We and other AXA affiliates, collectively, are AB’s largest clients. We represented 17% of AB’s total AUM as of December 31, 2017 and 3% of AB’s net revenues for the year ended December 31, 2017. AXA and its affiliates other than us represented 6% of AB’s total AUM as of December 31, 2017 and 2% of AB’s net revenues for the year ended December 31, 2017. AB’s investment management agreements with us and AXA and its affiliates are terminable at any time or on short notice by either party, and neither we nor AXA and its affiliates are under any obligation to maintain any level of AUM with AB. If we or AXA and its affiliates were to terminate their investment management agreements with AB, it could have a material adverse effect on AB’s business, results of operations or financial condition.
Further, while we cannot at this time predict the eventual impact, if any, on AB of the offering, it could include a reduction in the support AXA has provided to AB in the past with respect to AB’s investment management business, resulting in a decrease to AB’s revenues and ability to initiate new investment services. Also, AB relies on AXA for a number of significant services and benefits from its affiliation with AXA in certain common vendor relationships. These arrangements may change with possible negative financial implications for AB.
AB’s reputation could suffer if it is unable to deliver consistent, competitive investment performance.
AB’s business is based on the trust and confidence of its clients. Poor investment performance on an absolute basis or as compared to third-party benchmarks or competitor products could lead to a decrease in sales and stimulate higher redemptions, thereby lowering the amount of AUM and reducing the investment advisory fees AB earns. The effects of poor performance on AB could be magnified where assets or customers are concentrated in certain strategies, products, asset classes or sectors. Damage to AB’s reputation, resulting from poor or inconsistent investment performance, among other factors, can reduce substantially AB’s AUM and impair its ability to maintain or grow its business.
Performance-based fee arrangements with AB’s clients cause greater fluctuations in its, and in turn our, net revenues.
AB sometimes charges its clients performance-based fees, whereby it charges a base advisory fee and is eligible to earn an additional performance-based fee or incentive allocation that is calculated as either a percentage of absolute investment results or a percentage of investment results in excess of a stated benchmark over a specified period of time. Some performance-based fees include a high-watermark provision, which generally provides that if a client account underperforms relative to its performance target (whether in absolute terms or relative to a specified benchmark), it must gain back such underperformance before AB can collect future performance-based fees. Therefore, if AB fails to achieve the performance target for a particular period, AB will not earn a performance-based fee for that period and, for accounts with a high-watermark provision, AB’s ability to earn future performance-based fees will be impaired.
If the percentage of AB’s AUM subject to performance-based fees grows, seasonality and volatility of revenue and earnings are likely to become more significant. AB’s performance-based fees in 2017, 2016 and 2015 were $94.7 million, $32.8 million and $23.7 million, respectively.
AB’s seed capital investments are subject to market risk. While AB enters into various futures, forwards, swap and option contracts to economically hedge many of these investments, AB also may be exposed to market risk and credit-related losses in the event of non-performance by counterparties to these derivative instruments.
AB has a seed investment program for the purpose of building track records and assisting with the marketing initiatives pertaining to its new products. These seed capital investments are subject to market risk.
60
Table of Contents
AB’s risk management team oversees a seed hedging program that attempts to minimize this risk, subject to practical and cost considerations. Also, not all seed investments are deemed appropriate to hedge, and in those cases AB is exposed to market risk. In addition, AB may be subject to basis risk in that it cannot always hedge with precision its market exposure and, as a result, AB may be subject to relative spreads between market sectors. As a result, volatility in the capital markets may cause significant changes in its period-to-period financial and operating results.
AB uses various derivative instruments, including futures, forwards, swap and option contracts, in conjunction with its seed hedging program. While in most cases broad market risks are hedged, AB’s hedges are imperfect and some market risk remains. In addition, AB’s use of derivatives results in counterparty risk (i.e., the risk of exposure to credit-related losses in the event of non-performance by counterparties to these derivative instruments), regulatory risk (e.g., short selling restrictions) and cash/synthetic basis risk (i.e., the risk that the underlying positions do not move identically to the related derivative instruments).
The revenues generated by Bernstein Research Services may be adversely affected by circumstances beyond our control, including declines in brokerage transaction rates, declines in global market volumes, failure to settle our trades by significant counterparties and the effects of MiFID II (as defined below).
Electronic, or “low-touch,” trading approaches represent a significant percentage of buy-side trading activity and typically produce transaction fees for execution-only services that are significantly lower than the price of traditional full service fee rates. As a result, blended pricing throughout our industry is lower now than it was historically, and price declines may continue. In addition, fee rates we charge and charged by other brokers for traditional brokerage services have historically experienced price pressure, and we expect these trends to continue. Also, while increases in transaction volume and market share often can offset decreases in rates, this may not continue.
In addition, the failure or inability of any of AB’s broker-dealer’s significant counterparties to perform could expose AB to substantial expenditures and adversely affect its revenues. For example, Sanford C. Bernstein & Co., LLC (“SCB LLC”), as a member of clearing and settlement exchanges, would be required to settle open trades of any non-performing counterparty. This exposes AB to the mark-to-market adjustment on the trades between trade date and settlement date, which could be significant, especially during periods of severe market volatility. Lastly, AB’s ability to access liquidity in such situations may be limited by what its funding relationships are able to offer us at such times.
The second installment of the Markets in Financial Instruments Directive II (“MiFID II”), which became effective on January 3, 2018, makes significant modifications to the manner in which European broker-dealers can be compensated for research. The ultimate impact of MiFID II on payments for research globally is not yet certain.
AB may not accurately value the securities it holds on behalf of its clients or its company investments.
In accordance with applicable regulatory requirements, contractual obligations or client direction, AB employs procedures for the pricing and valuation of securities and other positions held in client accounts or for company investments. AB has established a valuation committee, composed of senior officers and employees, which oversees pricing controls and valuation processes. If market quotations for a security are not readily available, the valuation committee determines a fair value for the security.
Extraordinary volatility in financial markets, significant liquidity constraints or our failure to adequately consider one or more factors when determining the fair value of a security based on information with limited market observability could result in AB failing to properly value securities AB holds for its clients or investments accounted for on its balance sheet. Improper valuation likely would result in its basing fee calculations on inaccurate AUM figures, its striking incorrect net asset values for company-sponsored mutual funds or hedge
61
Table of Contents
funds or, in the case of company investments, its inaccurately calculating and reporting AB’s business, financial condition and operating results. Although the overall percentage of AB’s AUM that it fair values based on information with limited market observability is not significant, inaccurate fair value determinations can harm AB’s clients, create regulatory issues and damage its reputation.
AB may not have sufficient information to confirm or review the accuracy of valuations provided to it by underlying external managers for the funds in which certain of its alternative investment products invest.
Certain of AB’s alternative investment services invest in funds managed by external managers (“External Managers”) rather than investing directly in securities and other instruments. As a result, AB’s ability will be limited with regard to (i) monitoring such investments, (ii) regularly obtaining complete, accurate and current information with respect to such investments and (iii) exercising control over such investments. Accordingly, AB may not have sufficient information to confirm or review the accuracy of valuations provided to it by External Managers. In addition, AB will be required to rely on External Managers’ compliance with any applicable investment guidelines and restrictions. Any failure of an External Manager to operate within such guidelines or to provide accurate information with respect to the investment could subject AB’s alternative investment products to losses and cause damage to its reputation.
The quantitative models AB uses in certain of its investment services may contain errors, resulting in imprecise risk assessments and unintended output.
AB uses quantitative models in a variety of its investment services, generally in combination with fundamental research. These models are developed by senior quantitative professionals and typically are implemented by IT professionals. AB’s model risk oversight committee oversees the model governance framework and associated model review activities, which are then executed by AB’s model risk team. However, due to the complexity and large data dependency of such models, it is possible that errors in the models could exist and AB’s controls could fail to detect such errors. Failure to detect errors could result in client losses and reputational damage.
AB may not always successfully manage actual and potential conflicts of interest that arise in its business.
Increasingly, AB must manage actual and potential conflicts of interest, including situations where its services to a particular client conflict, or are perceived to conflict, with the interests of another client. Failure to adequately address potential conflicts of interest could adversely affect our reputation, results of operations and business prospects.
AB has procedures and controls that are designed to identify and mitigate conflicts of interest, including those designed to prevent the improper sharing of information. However, appropriately managing conflicts of interest is complex. AB’s reputation could be damaged and the willingness of clients to enter into transactions in which such a conflict might arise may be affected if AB fails, or appears to fail, to deal appropriately with actual or perceived conflicts of interest. In addition, potential or perceived conflicts could give rise to litigation or regulatory enforcement actions.
The inability to access clients through intermediaries could have a material adverse effect on AB’s business.
AB’s ability to market investment products is highly dependent on access to the various distribution systems of national and regional securities dealer firms, which generally offer competing products that could limit the distribution of AB’s investment products. There can be no assurance that AB will be able to retain access to these intermediaries. The inability to have such access could have a material adverse effect on AB’s and, in turn, our business. To the extent that existing or potential customers, including securities broker-dealers, decide to invest in or broaden distribution relationships with AB’s competitors, the sales of its products as well as its market
62
Table of Contents
share, revenue and net income could decline. Certain intermediaries with which AB conducts business charge AB fees to maintain access to their distribution networks. If AB chooses not to pay such fees, its ability to distribute through those intermediaries would be limited.
AB’s clients can withdraw the assets it manages on short notice, making its future client and revenue base unpredictable.
AB’s open-end fund clients generally may redeem their investments in these funds each business day without prior notice. While not subject to daily redemption, closed-end funds that AB manages may shrink in size due to repurchases of shares in open-market transactions or pursuant to tender offers, or in connection with distributions in excess of realized returns. Institutional and individual Separate Account clients can terminate their relationships with AB generally at any time. In a declining stock market, the pace of open-end fund redemptions could accelerate. Poor performance relative to other asset management firms can result in decreased purchases of open-end fund shares, increased redemptions of open-end fund shares, and the loss of institutional or individual Separate Accounts. The decrease in revenue that could result from any of these events could have a material adverse effect on AB’s and, in turn, our business.
Fluctuations in the exchange rates between the U.S. dollar and various other currencies can adversely affect AB’s AUM, revenues and results of operations.
Although significant portions of AB’s net revenues and expenses, as well as AB’s AUM, presently are denominated in U.S. dollars, AB has subsidiaries and clients outside of the United States with functional currencies other than the U.S. dollar. Weakening of these currencies relative to the U.S. dollar adversely affects the value in U.S. dollar terms of AB’s revenues and our AUM denominated in these other currencies. Accordingly, fluctuations in U.S. dollar exchange rates affect our AUM, revenues and reported financial results from one period to the next.
Investments in other countries are subject to operational, regulatory, compliance and reputational risks, including changes in applicable laws and regulatory requirements; difficulties in staffing and managing foreign operations; difficulties in collecting investment management fees receivable; different, and in some cases less stringent, legal, regulatory and accounting regimes; political instability; fluctuations in currency exchange rates; expatriation controls; expropriation risks; and potential adverse tax consequences.
AB may not be successful in its efforts to hedge its exposure to such fluctuations, which could negatively impact its revenues and reported financial results.
Changes in the partnership structure of AB Holding and ABLP or changes in the tax law governing partnerships would have significant tax ramifications.
AB Holding, having elected under Section 7704(g) of the Code to be subject to a 3.5% federal tax on partnership gross income from the active conduct of a trade or business, is a “grandfathered” publicly traded partnership (“PTP”) for federal income tax purposes. AB Holding is also subject to the 4.0% New York City unincorporated business tax (“UBT”), net of credits for UBT paid by AB. In order to preserve AB Holding’s status as a “grandfathered” PTP for federal income tax purposes, management seeks to ensure that AB Holding does not directly or indirectly (through ABLP) enter into a substantial new line of business. A “new line of business” includes any business that is not closely related to AB’s historical business of providing research and diversified investment management and related services to its clients. A new line of business is “substantial” when a partnership derives more than 15% of its gross income from, or uses more than 15% of its total assets in, the new line of business.
ABLP is a private partnership for federal income tax purposes and, accordingly, is not subject to federal and state corporate income taxes. However, ABLP is subject to the 4.0% UBT. Domestic corporate subsidiaries of
63
Table of Contents
ABLP, which are subject to federal, state and local income taxes, generally are included in the filing of a consolidated federal income tax return with separate state and local income tax returns being filed. Foreign corporate subsidiaries generally are subject to taxes in the foreign jurisdiction where they are located. If ABLP’s business increasingly operates in countries other than the United States, ABLP’s effective tax rate may increase because its international subsidiaries are subject to corporate taxes in the jurisdictions where they are located.
In order to preserve ABLP’s status as a private partnership for federal income tax purposes, AB Units must not be considered publicly traded. If such units were to be considered readily tradable, ABLP would become subject to federal and state corporate income tax on its net income. Furthermore, as noted above, should ABLP enter into a substantial new line of business, AB Holding, by virtue of its ownership of ABLP, would lose its status as a grandfathered PTP and would become subject to federal and state corporate income tax on its net income. If AB Holding and ABLP were to become subject to corporate income tax as set forth above, their net income and quarterly distributions to holders of AB Holding Units or AB Units would be materially reduced.
The Tax Cuts and Jobs Act, enacted on December 22, 2017 (the “Tax Reform Act”), reduces the federal corporate income tax rate applicable to AB’s U.S. subsidiaries to 21%. The Tax Reform Act also imposes a one-time transitional tax on some of the accumulated earnings of AB’s foreign subsidiaries and will tax on a current basis earnings of its foreign subsidiaries. These and other changes in the Tax Reform Act could adversely affect AB’s business, results of operations or financial condition. AB is assessing the overall impact that the Tax Reform Act is expected to have on its business, results of operations and financial condition.
Legal and Regulatory Risks
We may be materially and adversely impacted by U.S. federal and state legislative and regulatory action affecting financial institutions.
Regulatory changes, and other reforms globally, could lead to business disruptions, could adversely impact the value of assets we have invested on behalf of clients and policyholders and could make it more difficult for us to conduct certain business activities or distinguish ourselves from competitors. Any of these factors could materially and adversely affect our business, results of operations or financial condition.
Dodd-Frank Act. The Dodd-Frank Act established the Financial Stability Oversight Council (“FSOC”), which has the authority to designate non-bank systemically important financial institutions (“SIFIs”), thereby subjecting them to enhanced prudential standards and supervision by the Federal Reserve Board, including enhanced risk-based capital requirements, leverage limits, liquidity requirements, single counterparty exposure limits, governance requirements for risk management, capital planning and stress test requirements, special debt-to-equity limits for certain companies, early remediation procedures and recovery and resolution planning. If the FSOC were to determine that Holdings is a non-bank SIFI, we would become subject to certain of these enhanced prudential standards. Other regulators, such as state insurance regulators, may also determine to adopt new or heightened regulatory safeguards as a result of actions taken by the Federal Reserve Board in connection with its supervision of non-bank SIFIs. There can be no assurance that Holdings will not be designated as a non-bank SIFI, that such new or enhanced regulation will not apply to Holdings in the future, or, to the extent such regulation is adopted, that it would not have a material impact on our operations.
In addition, if Holdings were designated a SIFI, it could potentially be subject to capital charges or other restrictions with respect to activities it engages in that are limited by Section 619 of the Dodd-Frank Act, commonly referred to as the “Volcker Rule,” which places limitations on the ability of banks and their affiliates to engage in proprietary trading and limits the sponsorship of, and investment in, covered funds by banking entities and their affiliates.
Title II of the Dodd-Frank Act provides that certain financial companies, including Holdings, may be subject to a special resolution regime outside the federal bankruptcy code, which is administered by the Federal
64
Table of Contents
Deposit Insurance Corporation as receiver, and is applied to a covered financial company upon a determination that the company presents a risk to U.S. financial stability. U.S. insurance subsidiaries of any such covered financial company, however, would be subject to rehabilitation and liquidation proceedings under state insurance law. We cannot predict how rating agencies, or our creditors, will evaluate this potential or whether it will impact our financing or hedging costs.
The Dodd-Frank Act also established the Federal Insurance Office (“FIO”) within the U.S. Department of the Treasury, which has the authority, on behalf of the United States, to participate in the negotiation of “covered agreements” with foreign governments or regulators, as well as to collect information and monitor about the insurance industry. While not having a general supervisory or regulatory authority over the business of insurance, the director of the FIO will perform various functions with respect to insurance, including serving as a non-voting member of the FSOC and making recommendations to the FSOC regarding insurers to be designated for more stringent regulation.
While the Trump administration has indicated its intent to modify various aspects of the Dodd-Frank Act, it is unclear whether or how such modifications will be implemented or the impact any such modifications would have on our businesses.
Title VII of the Dodd-Frank Act creates a new framework for regulation of the over-the-counter (“OTC”) derivatives markets. As a result of the adoption of final rules by federal banking regulators and the U.S. Commodity Futures Trading Commission (“CFTC”) in 2015 establishing margin requirements for non-centrally cleared derivatives, the amount of collateral we may be required to pledge in support of such transactions may increase under certain circumstances and will increase as a result of the requirement to pledge initial margin on non-centrally cleared derivatives commencing in 2020. Notwithstanding the broad categories of non-cash collateral permitted under the rules, higher capital charges on non-cash collateral applicable to our bank counterparties may significantly increase pricing of derivatives and restrict or eliminate certain types of eligible collateral that we have available to pledge, which could significantly increase our hedging costs, adversely affect the liquidity and yield of our investments, affect the profitability of our products or their attractiveness to our customers, or cause us to alter our hedging strategy or change the composition of the risks we do not hedge.
Regulation of Broker-Dealers. The Dodd-Frank Act provides that the SEC may promulgate rules to provide that the standard of conduct for all broker-dealers, when providing personalized investment advice about securities to retail customers (and any other customers as the SEC may by rule provide) will be the same as the standard of conduct applicable to an investment adviser under the Investment Advisers Act. For a discussion of the SEC’s recent set of proposed rules, see “Business—Regulation—Broker-Dealer and Securities Regulation—Broker-Dealer Regulation.”
ERISA. The DOL issued a final Rule (the “Rule”) on April 6, 2016 that significantly expanded the range of activities considered to be fiduciary investment advice under the Employment Retirement Income Security Act (“ERISA”) when our affiliated advisors and our employees provide investment-related information and support to retirement plan sponsors, participants, and Individual Retirement Account (“IRA”) holders. The DOL also issued in connection with the Rule amendments to certain prohibited transaction exemptions (“PTEs”) under ERISA, and issued a new PTE, the Best Interest Contract Exemption, that applies more onerous disclosure and contract requirements to, and increases fiduciary requirements and liability exposure in respect of, transactions involving ERISA plans, plan participants and IRAs. Implementation of the Rule was originally scheduled to be phased in starting on April 10, 2017. In February 2017, however, the DOL was directed by executive order and memorandum (the “President’s Order and Memorandum”) to review the Rule and determine whether the Rule should be rescinded or revised, in light of the new administration’s policies and orientations. In response, in March 2017, the DOL published a notice soliciting comments on the examination described in the President’s Memorandum, which were due in April 2017. In addition, in April 2017, the DOL announced that the applicability date of the Rule was deferred from April 10, 2017 until June 9, 2017. The Rule became partially effective on June 9, 2017, with a special transition period for the remaining requirements that were due to take
65
Table of Contents
effect on January 1, 2018. To date, compliance with the portion of the Rule currently in force has not materially adversely affected our business, results of operations or financial condition. On November 29, 2017, the DOL finalized a delay in implementing the remaining requirements of the Rule from January 1, 2018 to July 1, 2019. On March 15, 2018 a federal appeals court issued a decision vacating the Rule. A final mandate has not been issued as of the date of this prospectus, and there is a possibility that the DOL may ask for a rehearing or appeal this decision. At this time, we do not currently plan any immediate changes to our approach to selling products and providing services to ERISA plans and IRAs.
Although management continues to evaluate its potential impact on our business, the Rule, if it remains in effect, is expected to cause adverse changes to the level and type of services we provide, as well as the nature and amount of compensation and fees that we and our affiliated advisors and firms receive for investment-related services to retirement plans and IRAs, which may have a significant adverse effect on our business and consolidated results of operations. For example, a significant portion of our variable annuity sales are to IRAs. The new regulation deems advisors, including third-party distributors, who provide investment advice in connection with an IRA, IRA rollover or 401(k) plan, to be fiduciaries and prohibits them from receiving compensation unless they comply with a PTE. The relevant PTE requires advisors to comply with impartial conduct standards and will require us to exercise additional oversight of the sales process. Compliance with the PTEs will result in increased regulatory burdens on us and our third-party distribution channels, changes to our compensation practices and product offerings and increased litigation risk, which could adversely affect our business and results of operations.
There is still considerable uncertainty over whether the Rule will be substantially modified or repealed or whether the federal appeals court decision to vacate the Rule will stand. Changes to the Rule as currently adopted could also have a significant adverse effect on our business and consolidated results of operations. We cannot predict what other proposals may be made, what legislation may be introduced or enacted, or what impact any such legislation may have on our business, results of operations or financial condition.
General. From time to time, regulators raise issues during examinations or audits of us and regulated subsidiaries that could, if determined adversely, have a material impact on us. In addition, the interpretations of regulations by regulators may change and statutes may be enacted with retroactive impact, particularly in areas such as accounting or statutory reserve requirements. We are also subject to other regulations and may in the future become subject to additional regulations. Compliance with applicable laws and regulations is time consuming and personnel-intensive, and changes in these laws and regulations may materially increase our direct and indirect compliance and other expenses of doing business, thus having a material adverse effect on our business, results of operations or financial condition.
Our retirement and protection businesses are heavily regulated, and changes in regulation and in supervisory and enforcement policies may limit our growth and have a material adverse effect on our business, results of operations or financial condition.
We are subject to a wide variety of insurance and other laws and regulations. State insurance laws regulate most aspects of our retirement and protection businesses, and our insurance subsidiaries are regulated by the insurance departments of the states in which they are domiciled and the states in which they are licensed. Notably, AXA Equitable Life is domiciled in New York and is primarily regulated by the NYDFS. The primary purpose of state regulation is to protect policyholders, and not necessarily to protect creditors and investors.
State insurance guaranty associations have the right to assess insurance companies doing business in their state in order to help pay the obligations of insolvent insurance companies to policyholders and claimants. Because the amount and timing of an assessment is beyond our control, liabilities we have currently established for these potential assessments may not be adequate.
State insurance regulators, the NAIC and other regulatory bodies regularly reexamine existing laws and regulations applicable to insurance companies and their products. For example, the NAIC as well as state
66
Table of Contents
regulators are currently considering implementing regulations that would apply an impartial conduct standard similar to the Rule to recommendations made in connection with certain annuities and life insurance policies. In particular, on December 27, 2017, the NYDFS proposed regulations that would adopt a “best interest” standard for the sale of life insurance and annuity products in New York. The likelihood of enactment of these regulations is uncertain at this time, but if implemented, these regulations could have significant adverse effects on our business and consolidated results of operations. Generally, changes in laws and regulations, or in interpretations thereof, including potentially rescinding prior product approvals, are often made for the benefit of the consumer at the expense of the insurer and could materially and adversely affect our business, results of operations or financial condition.
We currently use captive reinsurance subsidiaries primarily to reinsure (i) term life insurance and universal life insurance with secondary guarantees, (ii) excess claims relating to variable annuities with GMIB riders which are subject to reinsurance treaties with unaffiliated third parties and (iii) to retrocede reinsurance of variable annuity guaranteed minimum benefits assumed from unaffiliated third parties. Prior to this offering, we also used captive reinsurance subsidiaries to reinsure the GMxB Business; however, on April 12, 2018, we effected an unwind of the captive reinsurance of the GMxB Business as described in “The Reorganization Transactions—Unwind of GMxB Reinsurance.” Uncertainties associated with continued use of captive reinsurance are primarily related to potential regulatory changes. See “—Risks Relating to Our Retirement and Protection Businesses—Risks Relating to Our Reinsurance and Hedging Programs.”
Insurance regulators have implemented, or begun to implement significant changes in the way in which insurers must determine statutory reserves and capital, particularly for products with contractual guarantees, such as variable annuities and universal life policies, and are considering further potentially significant changes in these requirements. The NAIC’s principle-based reserves (“PBR”) approach for life insurance policies became effective on January 1, 2017, and has a three-year phase-in period. We are currently assessing the impact of, and appropriate implementation plan for, the PBR approach for life policies. The timing and extent of further changes to statutory reserves and reporting requirements are uncertain.
During 2015, the NAIC Financial Condition Committee (the “E Committee”) established the Variable Annuities Issues (E) Working Group (“VAIWG”) to oversee the NAIC’s efforts to study and address, as appropriate, regulatory issues resulting in variable annuity captive reinsurance transactions. In November 2015, upon the recommendation of the VAIWG, the E Committee adopted the VA Framework for Change which recommends charges for NAIC working groups to adjust the variable annuity statutory framework applicable to all insurers that have written or are writing variable annuity business and therefore has broader implications beyond captive reinsurance transactions. The VA Framework for Change contemplates a holistic set of reforms that would improve the current reserve and capital framework for insurers that write variable annuity business. In November 2015, VAIWG engaged Oliver Wyman (“OW”) to conduct a quantitative impact study (the “QIS”) involving industry participants, including the Company, of various reforms outlined in the VA Framework for Change. OW completed the QIS in July of 2016 and reported its initial findings to the VAIWG in late August. The OW report proposed certain revisions to the current variable annuity reserve and capital framework and recommended a second quantitative impact study be conducted so that testing can inform the proper calibration for certain conceptual and/or preliminary parameters set out in the OW proposal. Following a fourth quarter 2016 public comment period and several meetings on the OW proposal, the VAIWG determined that a second quantitative impact study (the “QIS2”) involving industry participants including us, will be conducted by OW. The QIS2 was initiated in February 2017 and OW issued its recommendation in December 2017. The NAIC continues to deliberate on QIS2 results. The NAIC has indicated it expects to complete its work by the 2018 Fall NAIC Meeting. Timing for implementation of changes to the current variable annuity reserve and capital framework remains uncertain.
We are currently assessing the impact on the Company of the NAIC’s proposed changes to the reserve and capital framework requirements currently applicable to our variable annuity business and we cannot predict what revisions to the VA Framework for Change proposal may be implemented as a result of QIS2 and ongoing NAIC
67
Table of Contents
deliberations. As a result, the timing and extent of any necessary changes to reserves and capital requirements for our variable annuity business resulting from the work of the NAIC VAIWG are uncertain.
Our investment management and research business is heavily regulated, and changes in regulation and in supervisory and enforcement policies may limit our growth and have a material adverse effect on our business, results of operations or financial condition.
Virtually all aspects of our investment management and research business are subject to federal and state laws and regulations, rules of securities regulators and exchanges, and laws and regulations in the foreign jurisdictions in which our subsidiaries conduct business. If we violate these laws or regulations, we could be subject to civil liability, criminal liability or sanction, including restriction or revocation of our professional licenses or registrations, revocation of the licenses of our employees, censures, fines, or temporary suspension or permanent bar from conducting business. Any such liability or sanction could have a material adverse effect on our business, results of operations or financial condition. A regulatory proceeding, even if it does not result in a finding of wrongdoing or sanction, could require substantial expenditures of time and money and could potentially damage our reputation.
In recent years, global regulators have substantially increased their oversight of financial services and investment management services. For example, the Financial Supervisory Commission in Taiwan (“FSC”) implemented, as of January 1, 2015, new limits on the degree to which local investors can own an offshore investment product. While certain exemptions have been available to us, should we not continue to qualify, the FSC’s rules could force some of our local resident investors to redeem their investments in our funds sold in Taiwan (or prevent further sales of those funds in Taiwan), some of which funds have local ownership levels substantially above the FSC limits. This could lead to significant declines in our investment advisory and services fees and revenues earned from these funds.
The second installment of the MiFID II, which became effective on January 3, 2018, makes significant modifications to the manner in which European broker-dealers can be compensated for research. These modifications are recognized in the industry as having the potential to significantly decrease the overall research spend by European buy-side firms. Consequently, our U.K.-based broker-dealer is considering new charging mechanisms for its research in order to minimize this impact as part of its broader MiFID II implementation program. It is important to note, however, that our new charging techniques and other strategic decisions to address the new environment created by MiFID II may not be successful, which could result in a significant decline in our sell-side revenues.
Also, although MiFID II does permit buy-side firms to purchase research through the use of client-funded research payment accounts, most buy-side firms that operate in the Eurozone, including our U.K. buy-side subsidiaries, have decided to use their own funds to pay for research in the Eurozone. This change in practice will increase our expenses in the Eurozone and, if this practice becomes more pervasive globally, may have a significant adverse effect on our net income in future periods. The ultimate impact of MiFID II on payments for research globally is not yet certain.
Finally, in June 2016, a narrow majority of voters in a U.K. referendum voted to exit the EU, but it remains unclear exactly how the U.K.’s status in relation to the EU will change when it ultimately leaves. Ongoing changes in the EU’s regulatory framework applicable to our business, including Brexit and any other changes in the composition of the EU’s member states, may add further complexity to our global risks and operations.
The adoption of new laws, regulations or standards and changes in the interpretation or enforcement of existing laws, regulations or standards have directly affected, and will continue to affect, our business, including making our efforts to comply more expensive and time-consuming.
68
Table of Contents
The Tax Reform Act could have adverse or uncertain impacts on some aspects of our business, results of operations or financial condition.
On December 22, 2017, President Trump signed into law the Tax Reform Act, a broad overhaul of the U.S. Internal Revenue Code that changes long-standing provisions governing the taxation of U.S. corporations, including life insurance companies. While we expect the Tax Reform Act to have a net positive economic impact on us, it contains measures which could have adverse or uncertain impacts on some aspects of our business, results of operations or financial condition.
The Tax Reform Act reduces the federal corporate income tax rate to 21% beginning in 2018. On a GAAP basis, the reduction in the tax rate generally should have a positive impact on our earnings, but resulted in a reduction in the value of our deferred tax assets.
On a statutory basis, we recorded a reduction in the admitted deferred tax assets reported by our insurance company subsidiaries in 2017. The NAIC could also, as a result of the reduction in the federal corporate income tax rate, revise certain items indirectly linked to such tax rate in the RBC formula and CTE calculations. These revisions could have a negative impact on the Combined RBC Ratio and also impact the CTE calculations of our insurance company subsidiaries, which could cause us to revise our target RBC and CTE levels, as appropriate. We continue to monitor potential regulatory changes following the Tax Reform Act.
The Tax Reform Act includes provisions that modify the calculation of the dividends received deduction (“DRD”), change how deductions are determined for insurance reserves, increase the amount of policy acquisition expense (also called tax “DAC”) that must be capitalized and amortized for federal income tax purposes, limit the use of net operating losses (“NOLs”) and limit deductions for net interest expense. These provisions could adversely affect our business, results of operations or financial condition, notwithstanding the lower corporate income tax rate. These provisions could also impact our investments and investment strategies.
The Tax Reform Act also imposes a one-time transitional tax on some of the accumulated earnings of our foreign subsidiaries and will tax on a current basis earnings of our foreign subsidiaries. These and other changes in the Tax Reform Act could adversely affect our Investment Management and Research business, results of operations or financial condition.
We are assessing the overall impact that the Tax Reform Act is expected to have on our business, results of operations and financial condition.
Future changes in U.S. tax laws and regulations or interpretations thereof could reduce our earnings and negatively impact our business, results of operations or financial condition, including by making our products less attractive to consumers.
Future changes in U.S. tax laws could have a material adverse effect on our business, results of operations or financial condition. We anticipate that, following the recently enacted Tax Reform Act, we will continue deriving tax benefits from certain items, including but not limited to the DRD, tax credits, insurance reserve deductions and interest expense deductions. However, there is a risk that interpretations of the Tax Reform Act, regulations promulgated thereunder, or future changes to federal, state or other tax laws could reduce or eliminate the tax benefits from these or other items and result in our incurring materially higher taxes.
Many of the products that we sell benefit from one or more forms of tax-favored status under current federal and state income tax regimes. For example, life insurance and annuity contracts currently allow policyholders to defer the recognition of taxable income earned within the contract. While the Tax Reform Act does not change these rules, a future change in law that modifies or eliminates this tax-favored status could reduce demand for our products. Also, if the treatment of earnings accrued inside an annuity contract was changed prospectively, and the tax-favored status of existing contracts was grandfathered, holders of existing contracts would be less likely to surrender or rollover their contracts. Each of these changes could reduce our earnings and negatively impact our business.
69
Table of Contents
Legal and regulatory actions could have a material adverse effect on our reputation, business, results of operations or financial condition.
A number of lawsuits, claims, assessments and regulatory inquiries have been filed or commenced against us and other life and health insurers and asset managers in the jurisdictions in which we do business. These actions and proceedings involve, among other things, insurers’ sales practices, alleged agent misconduct, alleged failure to properly supervise agents, contract administration, product design, features and accompanying disclosure, cost of insurance increases, the use of captive reinsurers, payment of death benefits and the reporting and escheatment of unclaimed property, alleged breach of fiduciary duties, discrimination, alleged mismanagement of client funds and other general business-related matters. Some of these matters have resulted in the award of substantial fines and judgments, including material amounts of punitive damages, or in substantial settlements. In some states, juries have substantial discretion in awarding punitive damages.
We face a significant risk of, and from time to time we are involved in, such actions and proceedings, including class action lawsuits. Our consolidated results of operations or financial position could be materially and adversely affected by defense and settlement costs and any unexpected material adverse outcomes in such matters, as well as in other material actions and proceedings pending against us. The frequency of large damage awards, including large punitive damage awards and regulatory fines that bear little or no relation to actual economic damages incurred, continues to create the potential for an unpredictable judgment in any given matter. For instance, we are a defendant in a number of lawsuits related to cost of insurance increases, including class actions in federal and state court alleging breach of contract and other claims under UL policies. For information regarding these and others legal proceedings pending against us, see note 16 to the notes to our annual financial statements included elsewhere in this prospectus.
In addition, investigations or examinations by federal and state regulators and other governmental and self-regulatory agencies including, among others, the SEC, FINRA, the CFTC, the National Futures Association (the “NFA”), state attorneys general, the NYDFS and other state insurance regulators, and other regulators could result in legal proceedings (including securities class actions and stockholder derivative litigation), adverse publicity, sanctions, fines and other costs. We have provided and, in certain cases, continue to provide information and documents to the SEC, FINRA, the CFTC, the NFA, state attorneys general, the NYDFS and other state insurance regulators, and other regulators on a wide range of issues. On March 30, 2018, we received a copy of an anonymous letter containing general allegations relating to the preparation of our financial statements. The audit committee of AXA Equitable Life, with the assistance of independent outside counsel, has reviewed these matters and concluded that the allegations were not substantiated and accordingly did not present any issue material to our financial statements. At this time, management cannot predict what actions the SEC, FINRA, the CFTC, the NFA, state attorneys general, the NYDFS and other state insurance regulators, or other regulators may take or what the impact of such actions might be.
A substantial legal liability or a significant federal, state or other regulatory action against us, as well as regulatory inquiries or investigations, may divert management’s time and attention, could create adverse publicity and harm our reputation, result in material fines or penalties, result in significant expense, including legal costs, and otherwise have a material adverse effect on our business, results of operations or financial condition.
We will be required to disclose in our periodic reports filed with the SEC specified activities engaged in by our “affiliates.”
The Securities Exchange Act of 1934, as amended (the “Exchange Act”), requires companies subject to SEC reporting obligations to disclose in their periodic reports specified dealings or transactions involving Iran or other individuals and entities targeted by certain Office of Foreign Assets Control sanctions engaged in by the reporting company or any of its affiliates during the period covered by the relevant periodic report. In some cases, companies are required to disclose these types of transactions even if they would otherwise be permissible
70
Table of Contents
under U.S. law. Reporting companies are required to separately file with the SEC a notice that such activities have been disclosed in the relevant periodic report, and the SEC is required to post this notice of disclosure on its website and send the report to the U.S. President and certain U.S. Congressional committees. The U.S. President thereafter is required to initiate an investigation and, within 180 days of initiating such an investigation, to determine whether sanctions should be imposed. Under the Exchange Act, we would be required to report if we or any of our “affiliates” knowingly engaged in certain specified activities during the period covered by the report. Because the SEC defines the term “affiliate” broadly, it includes any entity controlled by us as well as any person or entity that controls us or is under common control with us. Because we will be controlled by AXA following the settlement of this offering, we may be required to disclose certain activities undertaken by AXA and its affiliates with Iranian counterparties. Disclosure of such activities, even if such activities are not subject to sanctions under applicable law, and any sanctions actually imposed on us or our affiliates as a result of these activities, could harm our reputation and have a negative impact on our business.
Risks Relating to Our Controlling Stockholder
Following the settlement of this offering, AXA will continue to control us and may have conflicts of interest with other stockholders. Conflicts of interest may arise because affiliates of our controlling stockholder have continuing agreements and business relationships with us.
Upon settlement of this offering, AXA will own 75.5% of our outstanding common stock, or 71.9% if the underwriters exercise their option to purchase additional shares in full. As a result, AXA will continue to be able to control the election of our directors, determine our corporate and management policies and determine, without the consent of our other stockholders, the outcome of any corporate transaction or other matter submitted to our stockholders for approval, including potential mergers or acquisitions, asset sales and other significant corporate transactions. AXA will also have sufficient voting power to amend our organizational documents. In addition, under the provisions of the Shareholder Agreement (as defined in “Certain Relationships and Related Party Transactions”) that we will enter into with AXA prior to the settlement of this offering, AXA will have consent rights with respect to certain corporate and business activities that we may undertake, including during periods where AXA holds less than a majority of our common stock. Specifically, the Shareholder Agreement will provide that, until the date on which AXA ceases to beneficially own at least 30% of our outstanding common stock, AXA’s prior written consent will be required before we may take certain corporate and business actions, whether directly or indirectly through a subsidiary, including, among others, the following:
| • | any merger, consolidation or similar transaction (or any amendment to or termination of an agreement to enter into such a transaction) involving us or any of our subsidiaries, on the one hand, and any other person, on the other hand, subject to certain specified exceptions; |
| • | any change in our authorized capital stock or the creation of any new class or series of our capital stock; |
| • | any issuance or acquisition of capital stock (including stock buy-backs, redemptions or other reductions of capital), or securities convertible into or exchangeable or exercisable for capital stock or equity-linked securities, subject to certain specified exceptions; |
| • | any issuance or acquisition of debt securities involving an aggregate principal amount exceeding $250 million; |
| • | any amendment (or approval or recommendation of any amendment) to our certificate of incorporation or by-laws; and |
| • | the election, appointment, hiring, dismissal or removal (other than for cause) of the Company’s CEO or CFO. |
As a result of these consent rights, AXA will maintain significant control over our corporate and business activities until such rights cease. For additional discussion of AXA’s consent rights under the Shareholder
71
Table of Contents
Agreement, see “Certain Relationships and Related Party Transactions—Shareholder Agreement—Consent Rights.” Although AXA has announced that it intends to sell all of its interest in Holdings over time, AXA is under no obligation to do so and retains the sole discretion to determine the timing of any future sales of shares of our common stock.
Our amended and restated certificate of incorporation and our amended and restated by-laws will also include a number of provisions that may discourage, delay or prevent a change in our management or control for so long as AXA owns specified percentages of our common stock. See “—Risks Relating to Our Common Stock and This Offering—Anti-takeover provisions in our amended and restated certificate of incorporation and amended and restated by-laws and Delaware law could discourage, delay or prevent a change of control of our company and may affect the trading price of our common stock.” These provisions not only could have a negative impact on the trading price of our common stock, but could also allow AXA to delay or prevent a corporate transaction of which the public stockholders approve.
Conflicts of interest may arise between our controlling stockholder and us. Affiliates of our controlling stockholder engage in transactions with us. Further, AXA may, from time to time, acquire and hold interests in businesses that compete directly or indirectly with us, and they may either directly, or through affiliates, also maintain business relationships with companies that may directly compete with us. In general, AXA or its affiliates could pursue business interests or exercise their voting power as stockholders in ways that are detrimental to us but beneficial to themselves or to other companies in which they invest or with whom they have a material relationship. Conflicts of interest could also arise with respect to business opportunities that could be advantageous to AXA, and they may pursue acquisition opportunities that may be complementary to our business. As a result, those acquisition opportunities may not be available to us. Under the terms of our amended and restated certificate of incorporation, AXA will have no obligation to offer us corporate opportunities. See “—Our amended and restated certificate of incorporation will provide that we will waive any interest or expectancy in corporate opportunities presented to AXA.” In addition, changes to IFRS could impact the way we conduct our business (including, for example, which products we offer), our competitive position, our hedging program and the way we manage capital. See “—Risks Relating to Our Consolidated Business—Risks Relating to Our Operations—Changes in accounting standards could have a material adverse effect on our business, results of operations or financial condition.”
AXA and its affiliates other than us are among AB’s largest clients. AXA and its affiliates other than us represented 6% of AB’s total AUM as of December 31, 2017 and 2% of AB’s net revenues for the year ended December 31, 2017. AB’s investment management agreements with AXA and its affiliates are terminable at any time or on short notice by either party and AXA and its affiliates are under no obligation to maintain any level of AUM with AB. If AXA and its affiliates were to terminate their investment management agreements with AB, it could have a materially adverse effect on AB’s business, results of operations or financial condition.
As a result of these relationships, the interests of AXA may not coincide with our interests or the interests of the other holders of our common stock. So long as AXA continues to control a significant amount of the outstanding shares of our common stock, AXA will continue to be able to strongly influence or effectively control our decisions, including potential mergers or acquisitions, asset sales and other significant corporate transactions.
Our amended and restated certificate of incorporation will provide that we will waive any interest or expectancy in corporate opportunities presented to AXA.
Our amended and restated certificate of incorporation will provide that we, on our behalf and on behalf of our subsidiaries, renounce and waive any interest or expectancy in, or in being offered an opportunity to participate in, corporate opportunities that are from time to time presented to AXA, or their respective officers, directors, agents, stockholders, members, partners, affiliates or subsidiaries, even if the opportunity is one that we or our subsidiaries might reasonably be deemed to have pursued or had the ability or desire to pursue if granted
72
Table of Contents
the opportunity to do so. None of AXA or its agents, stockholders, members, partners, affiliates or subsidiaries will generally be liable to us or any of our subsidiaries for breach of any fiduciary or other duty, as a director or otherwise, by reason of the fact that such person pursues, acquires or participates in such corporate opportunity, directs such corporate opportunity to another person or fails to present such corporate opportunity, or information regarding such corporate opportunity, to us or our subsidiaries unless, in the case of any such person who is a director or officer, such corporate opportunity is expressly offered to such director or officer in writing solely in his or her capacity as a director or officer. To the fullest extent permitted by law, by becoming a stockholder in our company, stockholders will be deemed to have notice of and consented to this provision of our amended and restated certificate of incorporation. This will allow AXA to compete with us. Strong competition for investment opportunities could result in fewer such opportunities for us. We likely will not always be able to compete successfully with our competitors and competitive pressures or other factors may also result in significant price competition, particularly during industry downturns, which could have a material adverse effect on our business, results of operations or financial condition.
If AXA sells a controlling interest in our company to a third party in a private transaction, you may not realize any change of control premium on shares of our common stock and we may become subject to the control of a presently unknown third party.
Following the settlement of this offering, AXA will have the ability, should it choose to do so, to sell some or all of its shares of our common stock in a privately negotiated transaction. If such a transaction were to be sufficient in size, it could result in a change of control of Holdings. The ability of AXA to privately sell such shares of our common stock, with no requirement for a concurrent offer to be made to acquire all of the shares of our common stock that will be publicly traded hereafter, could prevent you from realizing any change of control premium on your shares of our common stock that may otherwise accrue to AXA upon its private sale of our common stock. Additionally, if AXA privately sells a significant equity interest in us, we may become subject to the control of a presently unknown third party. Such third party may have conflicts of interest with the interests of other stockholders.
Following the settlement of this offering, we may fail to replicate or replace functions, systems and infrastructure provided by AXA or certain of its affiliates (including through shared service contracts) or lose benefits from AXA’s global contracts, and AXA and its affiliates may fail to perform the services provided for in the Transitional Services Agreement.
Historically, we have received services from AXA and have provided services to AXA, including information technology services, services that support financial transactions and budgeting, risk management and compliance services, human resources services, insurance, operations and other support services, primarily through shared services contracts with various third-party service providers. Following this offering, AXA and its affiliates will provide for the continued provision or procurement of certain services to us pursuant to the Transitional Services Agreement. Certain contracts and services between us and AXA are not covered by the Transitional Services Agreement and will continue pursuant to the terms of such contracts. Under the Transitional Services Agreement, AXA will agree to continue to provide us with certain services currently provided to us by or through AXA, either directly or on a pass-through basis, and we will agree to continue to provide, or arrange to provide, AXA with certain services currently provided to them, either directly or on a pass-through basis. The Transitional Services Agreement will not continue indefinitely.
We will work to replicate or replace the services that we will continue to need in the operation of our business that are provided currently by AXA or its affiliates through shared service contracts they have with various third-party providers and that will continue to be provided under the Transitional Services Agreement for applicable transitional periods. We cannot assure you that we will be able to obtain the services at the same or better levels or at the same or lower costs directly from third-party providers. As a result, when AXA or its affiliates cease providing these services to us, either as a result of the termination of the Transitional Services Agreement or individual services thereunder or a failure by AXA or its affiliates to perform their respective
73
Table of Contents
obligations under the Transitional Services Agreement, our costs of procuring these services or comparable replacement services may increase, and the cessation of such services may result in service interruptions and divert management attention from other aspects of our operations.
There is a risk that an increase in the costs associated with replicating and replacing the services provided to us under the Transitional Services Agreement and the diversion of management’s attention to these matters could have a material adverse effect on our business, results of operations or financial condition. We may fail to replicate the services we currently receive from AXA on a timely basis or at all. Additionally, we may not be able to operate effectively if the quality of replacement services is inferior to the services we are currently receiving. Furthermore, once we are no longer an affiliate of AXA, we will no longer receive certain group discounts and reduced fees that we are eligible to receive as an affiliate of AXA. The loss of these discounts and reduced fees could increase our expenses and have a material adverse effect on our business, results of operations or financial condition.
In connection with preparing for this offering and operating as a stand-alone public company following the settlement of this offering, we expect to incur one-time and recurring expenses. We estimate that the aggregate amount of the one-time expenses described above will be between approximately $300 million and $350 million, of which $93 million was incurred in 2017 and approximately $150 million is expected to be incurred in 2018. Additional one-time expenses will be incurred when AXA ceases to own at least a majority of our outstanding common stock. These expenses primarily relate to information technology, compliance, internal audit, finance, risk management, procurement, client service, human resources and other support services. These expenses, any recurring expenses, including under the Transitional Services Agreement, and any additional one-time expenses including as a result of rebranding, we may incur may be material.
Costs associated with any rebranding that we expect to undertake after AXA ceases to own at least a majority of our outstanding common stock could be significant.
Prior to this offering, as a wholly-owned subsidiary of AXA, we have marketed our products and services using the “AXA” brand name and logo together with the “Equitable” brand. We expect to continue to use the “AXA” brand name and logo following settlement of this offering. We have benefited, and will continue to benefit for a limited time as set forth in the Trademark License Agreement, from trademarks licensed in connection with the AXA brand. We believe the association with AXA provides us with preferred status among our customers, vendors and other persons due to AXA’s globally recognized brand, reputation for high quality products and services and strong capital base and financial strength. Any rebranding we undertake could adversely affect our ability to attract and retain customers, which could result in reduced sales of our products. We cannot accurately predict the effect that any rebranding we undertake will have on our business, customers or employees. We expect to incur significant costs, including marketing expenses, in connection with any rebranding of our business. Any adverse effect on our ability to attract and retain customers and any costs could have a material adverse effect on our business, results of operations or financial condition.
After this offering, certain of our directors may have actual or potential conflicts of interest because of their AXA equity ownership or their current or former AXA positions.
A number of the persons who currently are, or we expect to become, our directors have been, and will be, AXA officers, directors or employees and, thus, will have professional relationships with AXA’s executive officers, directors or employees. In addition, because of their current or former AXA positions, certain of our directors and executive officers own AXA common stock, American Depository Shares, deferred stock units, performance shares or options to acquire shares of AXA common stock, and, for some of these individuals, their individual holdings may be significant compared to their total assets. These relationships and financial interests may create, or may create the appearance of, conflicts of interest when these directors and officers are faced with decisions that could have different implications for AXA and us. For example, potential conflicts of interest could arise in connection with the resolution of any dispute that may arise between AXA and us regarding the terms of the agreements governing our relationship with AXA after the settlement of this offering.
74
Table of Contents
We will have indemnification obligations in favor of AXA after this offering.
We and AXA will enter into certain agreements, including a Shareholder Agreement, Registration Rights Agreement, Transitional Services Agreement, Trademark License Agreement and a Tax Sharing Agreement (each as defined in “Certain Relationships and Related Party Transactions”), that will govern our and AXA’s obligations to each other following this offering in respect of, among other things, taxes and transition services and their respective indemnification obligations. The amounts payable by us pursuant to such indemnification obligations could be significant.
We may be subject to ongoing regulation as a result of AXA’s ownership of us following this offering and for as long as we are an affiliate of AXA.
Regulators and lawmakers in non-U.S. jurisdictions are engaged in addressing the causes of the financial crisis and means of avoiding such crises in the future. For example, the Financial Stability Board has identified nine global systemically important insurers (“GSIIs”), which include AXA. While the precise implications of being designated a GSII are still developing, it could have far reaching regulatory and competitive implications for AXA and adversely impact AXA’s capital requirements, profitability, the fungibility of AXA’s capital and ability to provide capital/financial support for AXA companies, including potentially AXA Equitable Life, AXA’s ability to grow through future acquisitions, internal governance and could change the way AXA conducts its business and adversely impact AXA’s overall competitive position versus insurance groups that are not designated GSIIs. The multiplicity of different regulatory regimes, capital standards and reporting requirements could increase AXA’s operational complexity and costs. All of these possibilities, if they occurred, could affect the way we conduct our business (including, for example, which products we offer) and manage capital, and may require us to satisfy increased capital requirements, all of which in turn could materially affect our business, results of operations or financial condition.
AXA is subject to Solvency II, the European directive which, together with its associated regulations and guidelines, establishes capital adequacy, risk management and regulatory reporting requirements for groups with a parent company established in the European Union. Among other things, as a member of a group subject to Solvency II, we may be required to hold more capital than the levels required under local law and incur costs necessary to comply with its requirements. In addition, because AXA is subject to Solvency II, it may impact the types of investments in, and the duration of, our General Account portfolio. It is possible that the requirements imposed on Solvency II groups, or the regulatory interpretation of those requirements, may change over time, increasing our capital requirements or costs.
Risks Relating to Our Common Stock and This Offering
Fulfilling our obligations incident to being a public company, including with respect to the requirements of and related rules under the Sarbanes-Oxley Act of 2002, or the “Sarbanes-Oxley Act,” and the Dodd-Frank Act, will be expensive and time-consuming, and any delays or difficulties in satisfying these obligations could have a material adverse effect on our future results of operations and our stock price.
Following this offering, we will be subject to the reporting, accounting and corporate governance requirements under the listing standards of the NYSE, the Sarbanes-Oxley Act, the Dodd-Frank Act and the Exchange Act that apply to issuers of listed equity, which will impose new compliance requirements, costs and obligations upon us. The changes necessitated by publicly listing our equity will require a significant commitment of additional resources and management oversight which will increase our operating costs. Further, to comply with the requirements of being a public company, we will need to undertake various actions, such as implementing new or enhanced internal controls and procedures and hiring additional accounting or internal audit staff.
The expenses associated with being a public company include increases in auditing, accounting and legal fees and expenses, investor relations’ expenses, increased directors’ fees, director and officer liability insurance
75
Table of Contents
costs, registrar and transfer agent fees, and listing fees, as well as other expenses. As a public company, we will be required, among other things, to prepare and file periodic and current reports, and distribute other stockholder communications, in compliance with the federal securities laws and NYSE rules, define and expand the roles and the duties of our Board and its committees, and institute more comprehensive compliance and investor relations functions. Our ability to successfully implement our strategy and comply with the Exchange Act and the SEC’s rules thereunder requires us to be able to prepare timely and accurate financial statements. During the course of preparing for this offering, we:
| • | restated the annual financial statements for the year ended December 31, 2016, restated the interim financial statements for the nine months ended September 30, 2017 and for the six months ended June 30, 2017, revised the annual financial statements for the year ended December 31, 2015 and revised the interim financial statements for the nine months ended September 30, 2016 and for the six months ended June 30, 2016, in each case included in the first amendment of our Form S-1 registration statement filed on February 14, 2018; and |
| • | restated the interim financial statements for the six months ended June 30, 2017 and revised the annual financial statements for the years ended December 31, 2016, 2015 and 2014 and the interim financial statements for the six months ended June 30, 2016, in each case included in our initial Form S-1 registration statement filing on November 13, 2017. |
We cannot assure you that we will not discover additional misstatements in our previously issued financial statements in the future. Any delay in the implementation of, or disruption in the transition to, new or enhanced systems, procedures or controls, including any delay in the remediation of our existing material weaknesses, or if we are unable to comply with the demands that will be placed on us as a public company, including the requirements of the Exchange Act and the SEC’s rules thereunder, could cause our business, results of operations, financial condition or stock price to be materially and adversely impacted.
Becoming a public company may increase the burden on our accounting and internal audit staff because Holdings will be an additional company subject to the reporting requirements of the U.S. federal securities laws in addition to our subsidiaries that are already subject to such requirements. These additional burdens increase the risk that we will not be able to timely file our or our subsidiaries periodic and other reports with the SEC. The failure to report our insurance subsidiaries’ financial condition or financial results accurately or report them within the timeframes required by the SEC could cause our insurance subsidiaries to halt sales of certain variable insurance products and delay or prevent us from launching new products or new product features. For instance, AXA Equitable Life failed to timely file its Quarterly Report on Form 10-Q for the quarter ended September 30, 2017 and required an extension of the due date under Rule 12b-25 for its Annual Report on Form 10-K for the year ended December 31, 2017. See “—Risks Relating to the Products We Offer, Our Structure and Product Distribution—Our retirement and protection products contain numerous features and are subject to extensive regulation and failure to administer or meet any of the complex product requirements may adversely impact our business, results of operations or financial condition.”
During the course of preparing our U.S. GAAP financial statements for this offering, we identified two material weaknesses in our internal control over financial reporting. If our remediation of these material weaknesses is not effective, we may not be able to report our financial condition or results of operations accurately or on a timely basis, which could materially and adversely affect investor confidence in us and, as a result, the price of our common stock.
As a public company, we will be required to maintain and assess internal control over financial reporting and disclosure controls and procedures and, after a transition period, publicly report on the effectiveness of our internal control over financial reporting in accordance with the rules of the SEC under the Exchange Act. Following a transition period, our independent registered public accounting firm will be required to provide an attestation report on the effectiveness of our internal control over financial reporting pursuant to SEC rules under the Exchange Act.
76
Table of Contents
During the course of preparing our U.S. GAAP financial statements for this offering and preparing for these public company control requirements, we identified two material weaknesses in the design and operation of our internal control over financial reporting. A material weakness is a deficiency, or a combination of deficiencies, in internal control over financial reporting, such that there is a reasonable possibility that a material misstatement of a company’s annual or interim financial statements will not be prevented or detected on a timely basis.
Our management consequently concluded that we do not (1) maintain effective controls to timely validate that actuarial models are properly configured to capture all relevant product features and to provide reasonable assurance that timely reviews of assumptions and data have occurred, and, as a result, errors were identified in future policyholders’ benefits and deferred policy acquisition costs balances; and (2) maintain sufficient experienced personnel to prepare Holdings’ consolidated financial statements and to verify that consolidating and adjusting journal entries were completely and accurately recorded to the appropriate accounts or segments and, as a result, errors were identified in the consolidated financial statements, including in the presentation and disclosure between the operating and financing sections of the statement of cash flows. These material weaknesses resulted in misstatements in our previously issued annual and interim financial statements and resulted in:
| • | the restatement of the annual financial statements for the year ended December 31, 2016, the restatements of the interim financial statements for the nine months ended September 30, 2017 and for the six months ended June 30, 2017, the revision of the annual financial statements for the year ended December 31, 2015 and the revision of the interim financial statements for the nine months ended September 30, 2016 and for the six months ended June 30, 2016, in each case that were reported in the preliminary prospectus included in the first amendment of our Form S-1 registration statement filed on February 14, 2018; and |
| • | the restatement of the interim financial statements for the six months ended June 30, 2017 and the revision of the annual financial statements for the years ended December 31, 2016, 2015 and 2014 and the interim financial statements for the six months ended June 30, 2016, in each case that were reported in the preliminary prospectus included in our initial Form S-1 registration statement filed on November 13, 2017. |
The changes necessary to correct the identified misstatements in our previously reported historical results have been appropriately reflected in our consolidated annual financial statements included elsewhere in this prospectus. Until remedied, these material weaknesses could result in a misstatement of our consolidated financial statements or disclosures that would result in a material misstatement to our annual or interim financial statements that would not be prevented or detected.
Since identifying the material weakness related to our actuarial models, we have been, and are currently in the process of, remediating the material weakness by taking steps to validate all existing actuarial models and valuation systems as well as to improve controls and processes around our assumption and data process. These steps include verifying inputs and unique algorithms, ensuring alignment with documented accounting standards and verifying that assumptions used in our models are consistent with documented assumptions and data is reliable. The remediation efforts are being performed by our internal model risk team (which is separate from our modeling and valuation teams), as supported by third party firms. We will continue to enhance controls to ensure that our models, including assumptions and data, are re-validated on a fixed calendar schedule and that new model changes and product features are tested through our internal model risk team prior to adoption within our models and systems. Although we plan to complete this remediation process as quickly as possible, we cannot at this time estimate when the remediation will be completed.
Since identifying the material weakness related to our journal entry process, we have been, and are currently in the process of, remediating the material weakness by taking steps to strengthen the control function related to our financial closing process. These steps include recruiting additional personnel, retaining external expert resources, further automating entries where possible, enhancing the design of certain management review
77
Table of Contents
controls and providing training regarding internal control processes. We will continue to enhance controls to ensure that the financial closing process is effectively implemented. Although we plan to complete this remediation process as quickly as possible, we cannot at this time estimate when the remediation will be completed.
If we fail to remediate effectively these material weaknesses or if we identify additional material weaknesses in our internal control over financial reporting, we may be unable to report our financial condition or financial results accurately or to report them within the timeframes required by the SEC. If this were the case, we could become subject to sanctions or investigations by the SEC or other regulatory authorities. Furthermore, failure to report our insurance subsidiaries’ financial condition or financial results accurately or report them within the timeframes required by the SEC could cause our insurance subsidiaries to curtail or cease sales of certain variable insurance products. In addition, if we are unable to determine that our internal control over financial reporting or our disclosure controls and procedures are effective, or if our independent registered public accounting firm is unable to express an opinion as to the effectiveness of our internal control over financial reporting, when required, investors may lose confidence in the accuracy and completeness of our financial reports, we may face reduced ability to obtain financing and restricted access to the capital markets, we may be required to curtail or cease sales of our products, and the price of our common stock may be materially and adversely affected.
Future sales of shares by existing stockholders could cause our stock price to decline.
Sales of substantial amounts of our common stock in the public market following this offering, or the perception that these sales could occur, could cause the market price of our common stock to decline. These sales, or the possibility that these sales may occur, also might make it more difficult for us to sell equity securities in the future at a time and at a price that we deem appropriate.
As of April 26, 2018, we have 561,000,000 outstanding shares of common stock. All of the shares sold pursuant to this offering will be immediately tradable without restriction under the Securities Act of 1933, as amended, or the “Securities Act,” except for any shares held by “affiliates,” as that term is defined in Rule 144 under the Securities Act, or “Rule 144.”
The remaining shares of common stock outstanding as of April 26, 2018 will be restricted securities within the meaning of Rule 144, but will be eligible for resale subject, in certain cases, to applicable volume, manner of sale, holding period and other limitations of Rule 144 or pursuant to an exception from registration under Rule 701 under the Securities Act, or “Rule 701,” subject to the terms of the lock-up agreements described below.
Upon the settlement of this offering, we intend to file one or more registration statements on Form S-8 under the Securities Act to register the shares of common stock to be issued under our equity compensation plans and, as a result, all shares of common stock acquired upon exercise of stock options granted under our plans will also be freely tradable under the Securities Act, subject to the terms of the lock-up agreements, unless purchased by our affiliates. As of April 26, 2018, 5,882,352 shares of our common stock are reserved for future issuances under the equity incentive plan adopted in connection with this offering.
In connection with this offering, we, the selling stockholder and all of our directors and executive officers will enter into lock-up agreements under which, subject to certain exceptions, we and they have agreed not to sell, transfer or dispose of or hedge, directly or indirectly, any shares of our common stock or any securities convertible into or exercisable or exchangeable for shares of our common stock for a period of 180 days after the date of this prospectus, except with the prior written consent of Morgan Stanley & Co. LLC and J.P. Morgan Securities LLC. Following the expiration of this 180-day lock-up period, approximately 423,750,000 shares of our common stock will be eligible for future sale, subject to the applicable volume, manner of sale, holding period and other limitations of Rule 144 or pursuant to an exception from registration under Rule 701. As resale restrictions end, the market price of our common stock could decline if AXA sells its shares or is perceived by
78
Table of Contents
the market as intending to sell them. Morgan Stanley & Co. LLC and J.P. Morgan Securities LLC may, in their sole discretion and at any time, release all or any portion of the securities subject to lock-up agreements entered into in connection with this offering. Furthermore, subject to the expiration or waiver of the lock up agreements, AXA will have the right to require us to register shares of common stock for resale in some circumstances pursuant to the Registration Rights Agreement we will enter into with AXA.
In the future, we may issue additional shares of common stock or other equity or debt securities convertible into or exercisable or exchangeable for shares of our common stock in connection with a financing, strategic investment, litigation settlement or employee arrangement or otherwise. Any of these issuances could result in substantial dilution to our existing stockholders and could cause the trading price of our common stock to decline.
Our common stock has no prior public market, and the market price of our common stock may be volatile and could decline after this offering.
Prior to this offering, there has been no public market for our common stock, and an active market for our common stock may not develop or be sustained after this offering. We have been approved to list our common stock on the NYSE. We and the selling stockholder negotiated the initial public offering price per share with the representatives of the underwriters and, therefore, that price may not be indicative of the market price of our common stock after this offering. We cannot assure you that an active public market for our common stock will develop after this offering or, if one does develop, that it will be sustained. In the absence of an active public trading market, you may not be able to sell your shares. An inactive market may also impair our ability to raise capital to continue to fund operations by selling shares and may impair our ability to make strategic investments by using our shares as consideration. In addition, the market price of our common stock may fluctuate significantly. Among the factors that could affect our stock price are:
| • | industry or general market conditions; |
| • | domestic and international economic factors unrelated to our performance; |
| • | changes in our customers’ preferences; |
| • | new regulatory pronouncements and changes in regulatory guidelines; |
| • | lawsuits, enforcement actions and other claims by third parties or governmental authorities; |
| • | adverse publicity related to us or another industry participant; |
| • | actual or anticipated fluctuations in our operating results; |
| • | changes in securities analysts’ estimates of our financial performance or lack of research coverage and reports by industry analysts; |
| • | action by institutional stockholders or other large stockholders (including AXA), including future sales of our common stock; |
| • | failure to meet any guidance given by us or any change in any guidance given by us, or changes by us in our guidance practices; |
| • | announcements by us of significant impairment charges; |
| • | speculation in the press or investment community; |
| • | investor perception of us and our industry; |
| • | changes in market valuations or earnings of similar companies; |
| • | announcements by us or our competitors of significant contracts, acquisitions, dispositions or strategic partnerships; |
| • | war, terrorist acts and epidemic disease; |
79
Table of Contents
| • | any future sales of our common stock or other securities; |
| • | additions or departures of key personnel; and |
| • | misconduct or other improper actions of our employees. |
In particular, we cannot assure you that you will be able to resell your shares at or above the initial public offering price. Stock markets have experienced extreme volatility in recent years that has been unrelated to the operating performance of particular companies. These broad market fluctuations may adversely affect the trading price of our common stock. In the past, following periods of volatility in the market price of a company’s securities, class action litigation has often been instituted against the affected company. Any litigation of this type brought against us could result in substantial costs and a diversion of our management’s attention and resources, which could materially and adversely affect our business, results of operations or financial condition.
If securities or industry analysts do not publish research or publish misleading or unfavorable research about our business, our stock price and trading volume could decline.
The trading market for our common stock will depend in part on the research and reports that securities or industry analysts publish about us or our business. We do not currently have, and may never obtain, research coverage for our common stock. If there is no research coverage of our common stock, the trading price for our common stock may be negatively impacted. In the event we obtain research coverage for our common stock, if one or more of the analysts downgrades our stock or publishes misleading or unfavorable research about our business, our stock price would likely decline. If one or more of the analysts ceases coverage of our common stock or fails to publish reports on us regularly, demand for our common stock could decrease, which could cause our common stock price or trading volume to decline.
Future offerings of debt or equity securities which would rank senior to our common stock may adversely affect the market price of our common stock.
If, in the future, we decide to issue debt or equity securities that rank senior to our common stock, it is likely that such securities will be governed by an indenture or other instrument containing covenants restricting our operating flexibility. Additionally, any convertible or exchangeable securities that we issue in the future may have rights, preferences and privileges more favorable than those of our common stock and may result in dilution to owners of our common stock. We and, indirectly, our stockholders, will bear the cost of issuing and servicing such securities. Because our decision to issue debt or equity securities in any future offering will depend on market conditions and other factors beyond our control, we cannot predict or estimate the amount, timing or nature of our future offerings. Thus, holders of our common stock will bear the risk of our future offerings reducing the market price of our common stock and diluting the value of their stock holdings in us.
Anti-takeover provisions in our amended and restated certificate of incorporation and amended and restated by-laws and Delaware law could discourage, delay or prevent a change of control of our company and may affect the trading price of our common stock.
Our amended and restated certificate of incorporation and our amended and restated by-laws include a number of provisions that may discourage, delay or prevent a change in our management or control over us that stockholders may consider favorable. For example, prior to the settlement of this offering, our amended and restated certificate of incorporation and amended and restated by-laws will collectively:
| • | authorize the issuance of shares of our common stock to create voting impediments or to frustrate persons otherwise seeking to effect a takeover or gain control; |
| • | authorize the issuance of “blank check” preferred stock that could be issued by our Board to thwart a takeover attempt; |
80
Table of Contents
| • | provide that vacancies on our Board, including vacancies resulting from an enlargement of our Board, may be filled only by a majority vote of directors then in office once AXA ceases to beneficially own at least 50% of the outstanding shares of our common stock; |
| • | prohibit stockholders from calling special meetings of stockholders if AXA ceases to beneficially own at least 50% of the outstanding shares of our common stock; |
| • | prohibit stockholder action by written consent, thereby requiring all actions to be taken at a meeting of the stockholders, if AXA ceases to beneficially own at least 50% of the outstanding shares of our common stock; |
| • | establish advance notice requirements for nominations of candidates for election as directors or to bring other business before an annual meeting of our stockholders; and |
| • | require the approval of holders of at least 66 2⁄3% of the outstanding shares of our common stock to amend our amended and restated by-laws and certain provisions of our amended and restated certificate of incorporation if AXA ceases to beneficially own at least 50% of the outstanding shares of our common stock. |
These provisions may prevent our stockholders from receiving the benefit from any premium to the market price of our common stock offered by a bidder in a takeover context. Even in the absence of a takeover attempt, the existence of these provisions may adversely affect the prevailing market price of our common stock if the provisions are viewed as discouraging takeover attempts in the future.
Our amended and restated certificate of incorporation and amended and restated by-laws may also make it difficult for stockholders to replace or remove our management. Furthermore, the existence of the foregoing provisions, as well as the significant amount of common stock that AXA will own following this offering, could limit the price that investors might be willing to pay in the future for shares of our common stock. These provisions may facilitate management entrenchment that may delay, deter, render more difficult or prevent a change in our control, which may not be in the best interests of our stockholders.
We will be a “controlled company” within the meaning of the NYSE rules and, as a result, we will qualify for, and intend to rely on, exemptions from certain corporate governance requirements. You will not have the same protections afforded to stockholders of companies that are subject to such requirements.
After the settlement of this offering, AXA will control a majority of the voting power of our outstanding common stock. Accordingly, we will qualify as a “controlled company” within the meaning of the NYSE corporate governance standards. Under NYSE rules, a company of which more than 50% of the voting power is held by an individual, group or another company is a “controlled company” and may elect not to comply with certain NYSE corporate governance standards, including:
| • | the requirement that a majority of the Board consist of independent directors; |
| • | the requirement that we have a compensation committee that is composed entirely of independent directors with a written charter addressing the committee’s purpose and responsibilities; |
| • | the requirement that our nominating and governance committee be composed entirely of independent directors with a written charter addressing the committee’s purpose and responsibilities, or otherwise have director nominees selected by vote of a majority of the independent directors; and |
| • | the requirement for an annual performance evaluation of the nominating and governance and compensation committees. |
Following this offering, we intend to use these exemptions. As a result, we will not have a majority of independent directors, our compensation and our nominating and governance committees will not consist entirely of independent directors, and such committees may not be subject to annual performance evaluations.
81
Table of Contents
Additionally, we are only required to have all independent audit committee members within one year from the date of listing. Consequently, you will not have the same protections afforded to stockholders of companies that are subject to all of the NYSE corporate governance rules and requirements. Our status as a controlled company could make our common stock less attractive to some investors or otherwise harm our stock price.
Our amended and restated certificate of incorporation will include provisions limiting the personal liability of our directors for breaches of fiduciary duty under the Delaware General Corporation Law.
Our amended and restated certificate of incorporation will contain provisions permitted under the action asserting a claim arising under the General Corporation Law of the State of Delaware, or the “DGCL,” relating to the liability of directors. These provisions will eliminate a director’s personal liability to the fullest extent permitted by the DGCL for monetary damages resulting from a breach of fiduciary duty, except in circumstances involving:
| • | any breach of the director’s duty of loyalty; |
| • | acts or omissions not in good faith or which involve intentional misconduct or a knowing violation of the law; |
| • | under Section 174 of the DGCL (unlawful dividends); or |
| • | any transaction from which the director derives an improper personal benefit. |
The principal effect of the limitation on liability provision is that a stockholder will be unable to prosecute an action for monetary damages against a director unless the stockholder can demonstrate a basis for liability for which indemnification is not available under the DGCL. These provisions, however, should not limit or eliminate our rights or any stockholder’s rights to seek non-monetary relief, such as an injunction or rescission, in the event of a breach of a director’s fiduciary duty. These provisions will not alter a director’s liability under federal securities laws. The inclusion of this provision in our amended and restated certificate of incorporation may discourage or deter stockholders or management from bringing a lawsuit against directors for a breach of their fiduciary duties, even though such an action, if successful, might otherwise have benefited us and our stockholders.
Our amended and restated certificate of incorporation will designate the Court of Chancery of the State of Delaware as the sole and exclusive forum for certain litigation that may be initiated by our stockholders, which could limit our stockholders’ ability to obtain a favorable judicial forum for disputes with us or our directors, officers or stockholders.
Our amended and restated certificate of incorporation will provide that, unless we consent in writing to the selection of an alternative forum, the Court of Chancery of the State of Delaware will, to the fullest extent permitted by law, be the sole and exclusive forum for (i) any derivative action or proceeding brought on our behalf, (ii) any action asserting a claim of breach of a fiduciary duty owed to us or our stockholders by any of our directors, officers, other employees, agents or stockholders, (iii) any action asserting a claim arising out of or under the DGCL, or as to which the DGCL confers jurisdiction on the Court of Chancery of the State of Delaware (including, without limitation, any action asserting a claim arising out of or pursuant to our amended and restated certificate of incorporation or our amended and restated by-laws) or (iv) any action asserting a claim that is governed by the internal affairs doctrine. By becoming a stockholder in our company, you will be deemed to have notice of and have consented to the provisions of our amended and restated certificate of incorporation related to choice of forum. The choice of forum provision in our amended and restated certificate of incorporation may limit our stockholders’ ability to obtain a favorable judicial forum for disputes with us or any of our directors, officers, other employees, agents or stockholders, which may discourage lawsuits with respect to such claims. Alternatively, if a court were to find the choice of forum provision contained in our amended and restated certificate of incorporation to be inapplicable or unenforceable in an action, we may incur additional costs associated with resolving such action in other jurisdictions, which could materially and adversely affect our business, results of operations or financial condition.
82
Table of Contents
SPECIAL NOTE REGARDING FORWARD-LOOKING STATEMENTS AND INFORMATION
This prospectus contains forward-looking statements and cautionary statements within the meaning of the Private Securities Litigation Reform Act of 1995. Some of the forward-looking statements can be identified by the use of forward-looking terms such as “believes,” “expects,” “may,” “will,” “shall,” “should,” “would,” “could,” “seeks,” “aims,” “projects,” “is optimistic,” “intends,” “plans,” “estimates,” “anticipates” or other comparable terms. Forward-looking statements include, without limitation, all matters that are not historical facts. They appear in a number of places throughout this prospectus and include, without limitation, statements regarding our intentions, beliefs, assumptions or current expectations concerning, among other things, financial goals, projected variable annuity cash flows and estimated present value of our in-force variable annuity portfolio, financial position, results of operations, cash flows, prospects, strategies or expectations, and the impact of prevailing economic conditions.
Forward-looking statements are subject to known and unknown risks and uncertainties, many of which may be beyond our control. We caution you that forward-looking statements are not guarantees of future performance or outcomes and that actual performance and outcomes, including, without limitation, our actual results of operations or financial condition, and the development of the market in which we operate, may differ materially from those made in or suggested by the forward-looking statements contained in this prospectus. In addition, even if our results of operations, financial condition and cash flows, and the development of the market in which we operate, are consistent with the forward-looking statements contained in this prospectus, those results or developments may not be indicative of results or developments in subsequent periods. New factors emerge from time to time that may cause our business not to develop as we expect, and it is not possible for us to predict all of them. Factors that could cause actual results and outcomes to differ from those reflected in forward-looking statements include, without limitation:
| • | Adverse conditions in the global capital markets and the economy, including equity market declines, interest rate fluctuations and market conditions, and the ability to meet our liquidity needs; |
| • | GMxB features within certain of our products; |
| • | Inadequacy of our reinsurance and hedging programs to protect us against the full extent of the exposure or losses we seek to mitigate; |
| • | Competition from other insurance companies, banks, asset managers and other financial institutions; |
| • | The failure of our new business strategy in accomplishing our objectives; |
| • | Risks related to our Investment Management and Research business, including significant fluctuations in AB’s AUM, the industry-wide shift from actively-managed investment services to passive services, termination of investment advisory agreement, inability to deliver consistent performance, the quantitative models AB uses in certain of its investment services containing errors, and fluctuations in exchange rates; |
| • | Inability to recruit, motivate and retain key employees and experienced and productive financial professionals; |
| • | The amount of statutory capital we have and must hold to meet our statutory capital requirements and our financial strength and credit ratings varying significantly from time to time; |
| • | Holdings’ dependence on the ability of its subsidiaries to transfer funds to it to meet its obligations; |
| • | The ability of our insurance subsidiaries to pay dividends and other distributions to Holdings, and the failure of our insurance subsidiaries to generate sufficient statutory earnings or have sufficient statutory surplus to enable them to pay ordinary dividends; |
| • | We expect to incur indebtedness in connection with the Recapitalization, and the degree to which we will be leveraged following completion of the Reorganization Transactions and this offering; |
83
Table of Contents
| • | Operational failures, failure of information systems or failure to protect the confidentiality of customer information, including by service providers, or losses due to defaults, errors or omissions by third parties and affiliates; |
| • | Risks related to strategic transactions; |
| • | The occurrence of a catastrophe, including natural or man-made disasters and failure of insurance that we maintain to fully cover all potential exposures; |
| • | Failure to protect our intellectual property and infringement claims by a third party; |
| • | Our investment advisory agreements with clients, and selling and distribution agreements with various financial intermediaries and consultants, being subject to termination or non-renewal on short notice; |
| • | Various international risks and increased compliance and regulatory risks and costs due to certain of our administrative operations and offices being located internationally; |
| • | Our counterparties’ requirements to pledge collateral or make payments related to declines in estimated fair value of specified assets and changes in the actual or perceived soundness or condition of other financial institutions and market participants; |
| • | Gross unrealized losses on fixed maturity and equity securities, illiquid investments and defaults on investments, including mortgage loans; |
| • | Changes to policyholder behavior assumptions under the contracts reinsured to our affiliated captives, the performance of their hedging program, their liquidity needs, their overall financial results and changes in regulatory requirements regarding the use of captives; |
| • | The failure to administer or meet any of the complex product and regulatory requirements of our retirement and protection products; |
| • | Changes in statutory reserve or other requirements; |
| • | A downgrade in our financial strength and claims-paying ratings; |
| • | Consolidation of or a loss of, or significant change in, key product distribution relationships; |
| • | The failure of our risk management policies and procedures to be adequate to identify, monitor and manage risks, which may leave us exposed to unidentified or unanticipated risks; |
| • | Inadequate reserves due to differences between our actual experience and management’s estimates and assumptions; |
| • | Mortality, longevity and morbidity rates or persistency rates differing significantly from our pricing expectations; |
| • | The acceleration of the amortization of DAC; |
| • | Financial models that rely on a number of estimates, assumptions and projections that are inherently uncertain and which may contain errors; |
| • | Subjective determination of the amount of allowances and impairments taken on our investments; |
| • | Changes in the partnership structure of AB Holding and ABLP or changes in the tax law governing partnerships; |
| • | U.S. federal and state legislative and regulatory action affecting financial institutions and changes in supervisory and enforcement policies; |
| • | The Tax Reform Act could have adverse or uncertain impacts on some aspects of our business, results of operations or financial condition; |
| • | Future changes in U.S. tax laws and regulations or interpretations thereof; |
84
Table of Contents
| • | Adverse outcomes of legal or regulatory actions; |
| • | Conflicts of interest that arise because our controlling stockholder and its affiliates have continuing agreements and business relationships with us; and |
| • | If our remediation of the two material weaknesses in our internal control over financial reporting is not effective, we may not be able to report our financial condition or results of operations accurately or on a timely basis and the price of our common stock may be materially adversely affected. |
You should read this prospectus completely and with the understanding that actual future results may be materially different from expectations. All forward-looking statements made in this prospectus are qualified by these cautionary statements. These forward-looking statements are made only as of the date of this prospectus, and we do not undertake any obligation, other than as may be required by law, to update or revise any forward-looking or cautionary statements to reflect changes in assumptions, the occurrence of events, unanticipated or otherwise, and changes in future operating results over time or otherwise.
Other risks, uncertainties and factors, including those discussed under “Risk Factors,” could cause our actual results to differ materially from those projected in any forward-looking statements we make. Readers should read carefully the factors described in “Risk Factors” to better understand the risks and uncertainties inherent in our business and underlying any forward-looking statements.
85
Table of Contents
Table of Contents
Dividend Policy
We intend to pay quarterly cash dividends on our common stock at an initial amount of approximately $0.13 per share, although any declaration of dividends will be at the discretion of the Board and will depend on our financial condition, earnings, liquidity and capital requirements, regulatory constraints, level of indebtedness, contractual restrictions with respect to payment of dividends, restrictions imposed by Delaware law, general business conditions and any other factors that the Board deems relevant in making such a determination. Therefore, there can be no assurance that we will pay any dividends to holders of our common stock, or as to the amount of any such dividends.
We may consider share repurchase programs in the future to supplement our dividend policy. Our Board will need to approve any share repurchase program in the future, and it has not approved any such program at this time.
Delaware law requires that dividends be paid only out of “surplus,” which is defined as the fair market value of our net assets, minus our stated capital; or out of the current or the immediately preceding year’s earnings. Holdings is a holding company and has no direct operations. All of our business operations are conducted through our subsidiaries. The states in which our insurance subsidiaries are domiciled impose certain restrictions on our insurance subsidiaries’ ability to pay dividends to their parent companies. These restrictions are based in part on the prior year’s statutory income and surplus, as well as earned surplus. Such restrictions, or any future restrictions adopted by the states in which our insurance subsidiaries are domiciled, could have the effect, under certain circumstances, of significantly reducing dividends or other amounts payable by our subsidiaries without affirmative approval of state regulatory authorities. For more details, see “Business—Regulation—Holding Company and Shareholder Dividend Regulation” and “Risk Factors—Risks Relating to Our Consolidated Business—Risks Relating to Our Operations—As a holding company, Holdings depends on the ability of its subsidiaries to transfer funds to it to meet its obligations.”
87
Table of Contents
THE REORGANIZATION TRANSACTIONS
Summary of Reorganization
We have undertaken a reorganization prior to this offering, as described generally below. The Reorganization’s primary goals are to ensure that, prior to the settlement of this offering, (i) we will hold all of AXA’s U.S. retirement and protection businesses and AXA’s interests in AB and (ii) certain AXA U.S. P&C business will be extracted from us and held by AXA outside of us. As part of the Reorganization Transactions, we also effected an unwind of the reinsurance provided to AXA Equitable Life by AXA RE Arizona for certain variable annuities with GMxB features (the “GMxB Reinsurance”).
The Reorganization was subject to approval from various state insurance regulators. All required regulatory approvals have been received.
In April 2018, we completed the Reorganization.
Transfer of AXA Financial Shares
AXA Financial indirectly owns a number of subsidiaries that comprise AXA’s U.S. retirement and protection businesses. Holdings currently owns 100% of the shares in AXA Financial. Until January 2018, approximately 0.5% was held by Coliseum Reinsurance Company, an indirect subsidiary of AXA (“Coliseum Re”), and AXA Belgium S.A., an indirect subsidiary of AXA (“AXA Belgium”). As part of the Reorganization, AXA Belgium transferred its approximate 0.47% interest in AXA Financial to AXA in January 2018 and Coliseum Re transferred its approximate 0.03% interest in AXA Financial to AXA in March 2018. AXA then contributed the entire approximate 0.5% interest to Holdings (the “AXA Financial Transfer”) in March 2018.
Extraction of U.S. Property and Casualty Insurance Business
Holdings formerly held 78.99% of the shares of AXA America Corporate Solutions, Inc. (“AXA CS”), which holds certain AXA U.S. P&C business. As part of the Reorganization, Holdings sold its shares of AXA CS to AXA so that AXA CS and its subsidiaries are no longer a part of the Company. Holdings’ repayment obligation to AXA in respect of a $622 million loan made by AXA to Holdings in December 2017 was set off against AXA’s payment obligation to Holdings with respect to the sale of AXA CS shares and AXA paid Holdings the balance of the purchase price in cash. Note that AXA CS and its subsidiaries have been excluded from the historical financial statements of Holdings because their businesses (i) are demonstrably distinct from the other business of Holdings, (ii) have been managed and financed historically autonomously, (iii) have no more than incidental common facilities and costs with the other business of Holdings, (iv) are operated and financed autonomously following the disposition and (v) do not have material financial commitments, guarantees or contingent liabilities to or from Holdings following the disposition.
Transfer of AXA’s Interests in AB
Prior to the Reorganization, AXA’s interests in AB consisted of (i) approximately 15% held by AXA-IM Holding US Inc., a wholly owned, indirect subsidiary of AXA (“AXA IM Holding US”), approximately 3% held by Coliseum Re and approximately 47% currently held by the Company and (ii) the General Partner, 100% of which is held by us. As part of the Reorganization, in April 2018 Holdings acquired (i) 100% of the shares of AXA IM Holding US for approximately $873 million, representing the fair value of AXA IM Holding US’s interests in AB, net of other transferred assets and liabilities of AXA IM Holding US (AXA IM Holding US did not carry on any substantive business activity at the time of the transfer), and (ii) all of the AB Units held by Coliseum Re for approximately $217 million, so that all of AXA’s interests in AB are now held entirely by the Company. See “Unaudited Pro Forma Condensed Financial Information.”
88
Table of Contents
Unwind of GMxB Reinsurance
In April 2018, AXA Equitable Life effected an unwind of the GMxB Reinsurance (the “GMxB Unwind”) to mitigate the impact of any restrictions on the use of captive reinsurers to reinsure variable annuities that could be adopted by insurance regulators by reducing its use of such reinsurance. In addition, AXA Equitable Life undertook the GMxB Unwind in response to its agreement with the NYDFS that required us to provide the NYDFS with notice and the opportunity to disapprove any ordinary shareholder dividend until AXA Equitable Life fully implemented a plan with respect to the management of its variable annuity business ceded to AXA RE Arizona. We expect that the GMxB Unwind will provide increased transparency relative to our variable annuity risk management. The GMxB Unwind has no impact on our financial position or results of operations because the GMxB Reinsurance is between two wholly owned subsidiaries and is therefore eliminated in our U.S. GAAP consolidated financial statements. As a result of the GMxB Unwind and based on information available as of December 31, 2017, we estimate that, the statutory TAC of our insurance company subsidiaries increased by $0.7 billion, which, if such unwind had occurred on or prior to December 31, 2017, would have resulted in an increase in our Combined RBC Ratio of 50 percentage points to approximately 700% as of December 31, 2017.
The GMxB Unwind was accomplished by AXA RE Arizona first transferring certain risks that are not part of the GMxB Unwind to a newly formed subsidiary, EQ AZ Life Re. Following the transfer of that business to EQ AZ Life Re, AXA RE Arizona merged with and into AXA Equitable Life to complete the GMxB Unwind. Following AXA RE Arizona’s merger with and into AXA Equitable Life, the GMxB Business will not be subject to any new internal or third-party reinsurance arrangements, though in the future AXA Equitable Life may reinsure the GMxB Business with third parties. For more detail regarding the risks associated with the GMxB Unwind, see “Risk Factors—Risks Relating to Our Retirement and Protection Businesses—Risks Relating to Our Reinsurance and Hedging Programs—Our reinsurance arrangements with affiliated captives may be adversely impacted by changes to policyholder behavior assumptions under the reinsured contracts, the performance of their hedging program, their liquidity needs, their overall financial results and changes in regulatory requirements regarding the use of captives.”
89
Table of Contents
Organizational Structure
The following charts illustrate our ownership and organizational structure prior to the Reorganization Transactions and after giving effect to the Reorganization Transactions and this offering, assuming the underwriters do not exercise their option to purchase additional shares from the selling stockholder. The charts reflect only certain of our subsidiaries and have been simplified for illustrative purposes.
Organizational Structure Prior to Settlement of this Offering and
Completion of the Reorganization Transactions
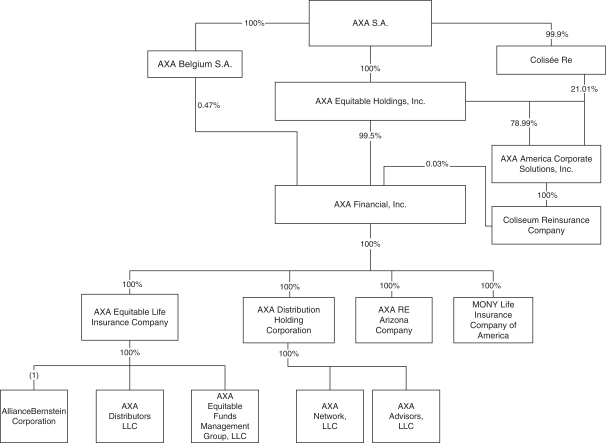
| (1) | As of December 31, 2017, the Company held an economic interest in AB of approximately 47%. For details on our economic ownership and general partnership interest in AB following this offering, see “Prospectus Summary—Organizational Structure—Ownership Structure of AB Following Settlement of this Offering and Completion of the Reorganization Transactions.” |
90
Table of Contents
Organizational Structure Following Settlement of this Offering and Completion of the Reorganization Transactions

| (1) | We intend to merge AXA Financial into Holdings after settlement of this offering. |
| (2) | For details on our economic ownership and general partnership interest in AB following this offering, see “Prospectus Summary—Organizational Structure—Ownership Structure of AB Following Settlement of this Offering and Completion of the Reorganization Transactions.” |
91
Table of Contents
We have historically operated with a capital structure that reflected our status as a wholly owned subsidiary of AXA. To prepare for this offering and operation as a stand-alone public company, we will undertake various recapitalization initiatives to align our capital structure—both at Holdings and on a consolidated basis—more closely with other U.S. public companies (the “Recapitalization”). In undertaking the Recapitalization, we are focused on several goals:
| • | Maintaining and strengthening our credit ratings; |
| • | Having a debt-to-capital ratio of approximately 26% at the time of this offering and maintaining a mid-20s% debt-to-capital ratio going forward; |
| • | Maintaining our target asset level for all variable annuities at or above a CTE98 level under most economic scenarios and an RBC ratio of 350-400% for our non-variable annuity insurance liabilities; |
| • | Replacing financing that is provided or guaranteed by AXA and its affiliates with financing that is supported solely on the basis of our stand-alone credit, and entering into new financing arrangements only on that basis; |
| • | Purchasing AB Units from AXA as described in “The Reorganization Transactions”; and |
| • | Maintaining a cash position of approximately $500 million at Holdings. |
On December 8, 2017, we received (i) a capital contribution of $318 million and (ii) a short-term loan of $622 million from AXA, which was set off against AXA’s payment obligation to Holdings with respect to the sale of AXA CS shares. See “The Reorganization Transactions” and “Unaudited Pro Forma Condensed Financial Information.”
In February 2018, we entered into the Credit Facilities, consisting of a $3.9 billion two-year senior unsecured delayed draw term loan agreement, a $500 million three-year senior unsecured delayed draw term loan agreement and a $2.5 billion five-year senior unsecured revolving credit facility with a syndicate of banks. The revolving credit facility provides for borrowings of up to $2.5 billion or the issuance of letters of credit within a sublimit of $1.5 billion to support our life insurance business reinsured to EQ AZ Life Re following the GMxB Unwind and to support the third-party GMxB variable annuity business reinsured by CS Life RE. The revolving credit facility is available for general corporate purposes. The term loan agreements provide for borrowings, which may only be drawn prior to the settlement of this offering, of up to $4.4 billion for general corporate purposes, including to replace financing that is provided by or guaranteed by AXA and its affiliates (the “AXA Refinancing”). In April 2018, we terminated the two-year term loan agreement, and, in May 2018, we intend to borrow $300 million under the three-year term loan agreement. In addition to the Credit Facilities, we entered into letter of credit facilities with an aggregate principal amount of approximately $1.9 billion, primarily to be used to support our life insurance business reinsured to EQ AZ Life Re following the GMxB Unwind. See “Anticipated Financing Activities Prior to Settlement of this Offering” below.
In order to finance the Reorganization Transactions, on April 20, 2018, we issued $800 million aggregate principal amount of 3.900% Senior Notes due 2023, $1.5 billion aggregate principal amount of 4.350% Senior Notes due 2028 and $1.5 billion aggregate principal amount of 5.000% Senior Notes due 2048. In April 2018, we used the net proceeds from the sale of the Notes, together with an intercompany loan of $800 million from AXA Equitable Life, to (i) repay financing provided by AXA and its affiliates, (ii) purchase 100% of the shares of AXA IM Holdings and (iii) purchase the AB Units held by Coliseum Re. The remaining proceeds, together with $300 million to be borrowed under our three-year term loan agreement, will be used to repay the outstanding commercial paper program of AXA Financial currently guaranteed by AXA.
In April 2018, we entered into waiver letter agreements with the lenders under each of our Credit Facilities and the letter of credit facilities, pursuant to which the lenders waived certain defaults or events of default under
92
Table of Contents
such facilities resulting from the restatement of our annual financial statements for the year ended December 31, 2016, the restatement of our interim financial statements for the nine months ended September 30, 2017 and for the six months ended June 30, 2017, the failure to furnish audited financial statements for the year ended December 31, 2017 on a timely basis as required by such facilities and related matters. There can be no assurance that our lenders will provide such waivers in the future. For a discussion of the restatement to our 2016 financial statements, see note 1 to the notes to our annual financial statements included elsewhere in this prospectus. For a discussion of the material weaknesses in our internal control over financial reporting, see “Risk Factors—Risks Relating to Our Common Stock and This Offering—During the course of preparing our U.S. GAAP financial statements for this offering, we identified two material weaknesses in our internal control over financial reporting. If our remediation of these material weaknesses is not effective, we may not be able to report our financial condition or results of operations accurately or on a timely basis, which could materially and adversely affect investor confidence in us and, as a result, the price of our common stock.” For a discussion of waivers under our Credit Facilities and letter of credit facilities, see “Risk Factors—Risks Relating to our Operations—A violation or breach of the representations, warranties or covenants contained in any of our Credit Facilities or letter of credit facilities could result in a default or event of default, which would require a waiver or amendment with the consent of our lenders. The failure to obtain any such waiver or amendment would have a material adverse effect on our business, results of operations or financial condition.”
In March 2018, AXA Equitable Life sold its interest in two real estate joint ventures to AXA France for a total purchase price of approximately $143 million, which resulted in the elimination of $203 million of long-term debt on Holdings’ consolidated balance sheet for the first quarter of 2018 and a corresponding reduction of our debt-to-capital ratio.
Anticipated Financing Activities Prior to Settlement of this Offering
Prior to the settlement of this offering, we intend to terminate AXA Financial’s commercial paper program.
Indebtedness Remaining Outstanding Following this Offering
AXA Financial
As of December 31, 2017, AXA Financial had outstanding $349 million aggregate principal amount of 7% Senior Debentures due 2028 (the “Senior Debentures”). The Senior Debentures are the unsecured, senior indebtedness of AXA Financial. The Senior Debentures contain customary affirmative and negative covenants, including a limitation on liens and a limit on AXA Financial’s ability to consolidate, merge or sell or otherwise dispose of all or substantially all of its assets. The Senior Debentures also include customary events of default (with customary grace periods, as applicable), including provisions under which, upon the occurrence of an event of default, all outstanding Senior Debentures may be accelerated.
AB
AB’s existing indebtedness that will remain outstanding following this offering is described below. Historically, AB has been self-reliant for its financing and will remain so in its financing activities going forward. Accordingly, we do not anticipate any changes to AB’s existing indebtedness in connection with this offering.
As of December 31, 2017, AB had $491 million in commercial paper outstanding with a weighted average interest rate of approximately 1.6%. The commercial paper is short term in nature, and as such, the recorded value is estimated to approximate fair value. Average daily borrowings of commercial paper during 2017 were $482.2 million, with a weighted average interest rate of approximately 1.2%.
AB has a $1.0 billion committed, unsecured senior revolving credit facility (the “AB Credit Facility”) with a group of commercial banks and other lenders, which matures on October 22, 2019. The AB Credit Facility
93
Table of Contents
provides for possible increases in the principal amount by up to an aggregate incremental amount of $250 million, any such increase being subject to the consent of the affected lenders. The AB Credit Facility is available for AB’s and SCB LLC’s business purposes, including the support of AB’s $1.0 billion commercial paper program. Both AB and SCB LLC can draw directly under the AB Credit Facility and AB management expects to draw on the AB Credit Facility from time to time. AB has agreed to guarantee the obligations of SCB LLC under the AB Credit Facility.
The AB Credit Facility contains affirmative, negative and financial covenants, which are customary for facilities of this type, including, among other things, restrictions on dispositions of assets, restrictions on liens, a minimum interest coverage ratio and a maximum leverage ratio. As of December 31, 2017, AB was in compliance with these covenants. The AB Credit Facility also includes customary events of default (with customary grace periods, as applicable), including provisions under which, upon the occurrence of an event of default, all outstanding loans may be accelerated and/or lender’s commitments may be terminated. Also, under such provisions, upon the occurrence of certain insolvency- or bankruptcy-related events of default, all amounts payable under the AB Credit Facility would automatically become immediately due and payable, and the lender’s commitments would automatically terminate.
As of December 31, 2017, AB and SCB LLC had no amounts outstanding under the AB Credit Facility. During 2017, AB and SCB LLC did not draw upon the AB Credit Facility.
AB has a $200.0 million, unsecured 364-day senior revolving credit facility (the “AB Revolver”) with a leading international bank and the other lending institutions that may be party thereto. The AB Revolver is available for AB’s and SCB LLC’s business purposes, including the provision of additional liquidity to meet funding requirements primarily related to SCB LLC’s operations. Both AB and SCB LLC can draw directly under the AB Revolver and management expects to draw on the AB Revolver from time to time. AB has agreed to guarantee the obligations of SCB LLC under the AB Revolver. The AB Revolver contains affirmative, negative and financial covenants that are identical to those of the AB Credit Facility. As of December 31, 2017, there was $75.0 million outstanding under the AB Revolver with an interest rate of 2.4%. Average daily borrowing of the AB Revolver for 2017 was $21.4 million, with a weighted average interest rate of approximately 2.0%.
In addition, SCB LLC has three uncommitted lines of credit with three financial institutions. Two of these lines of credit permit AB and SCB LLC to borrow up to an aggregate of approximately $175.0 million, with AB named as an additional borrower, while one line has no stated limit. As of December 31, 2017 and 2016, SCB LLC had no bank loans outstanding. Average daily borrowings of bank loans for 2017 was $4.5 million, with a weighted average interest rate of approximately 1.4%.
94
Table of Contents
The following table sets forth our cash and cash equivalents and capitalization on a consolidated basis and on a pro forma basis as of December 31, 2017. The selling stockholder is selling all of the shares of common stock in this offering, and we will not receive any proceeds from the sale of shares.
You should read this table in conjunction with “Recapitalization,” “Selected Historical Consolidated Financial Data,” “Unaudited Pro Forma Condensed Financial Information,” “Management’s Discussion and Analysis of Financial Condition and Results of Operations” and our annual financial statements included elsewhere in this prospectus.
| Actual | Pro Forma | |||||||||
| As of December 31, 2017 |
As of December 31, 2017 | |||||||||
| (in millions) | ||||||||||
| Cash and cash equivalents |
$ | 4,814 | $ | 4,584 | ||||||
|
|
|
|
|
|||||||
| Short-term debt |
||||||||||
| AXA Financial commercial paper |
1,290 | — | ||||||||
| AB commercial paper |
491 | 491 | ||||||||
| AB revolving credit facility |
75 | 75 | ||||||||
|
|
|
|
|
|||||||
| Total short-term debt |
$ | 1,856 | $ | 566 | ||||||
|
|
|
|
|
|||||||
| Long-term debt |
||||||||||
| Long-term debt |
$ | 552 | $ | 4,652 | ||||||
| Intercompany Debt |
||||||||||
| Loans from affiliates |
3,622 | — | ||||||||
|
|
|
|
|
|||||||
| Total long-term debt |
$ | 4,174 | $ | 4,652 | ||||||
|
|
|
|
|
|||||||
| Equity | ||||||||||
| Common stock, $0.01 par value per share; 2,000,000,000 shares authorized, 561,000,000 shares issued and outstanding |
$ | 6 | $ | 6 | ||||||
| Capital in excess of par value |
1,298 | 2,003 | ||||||||
| Retained earnings |
12,289 | 12,286 | ||||||||
| Accumulated other comprehensive income (loss) |
(108 | ) | (108 | ) | ||||||
|
|
|
|
|
|||||||
| Total equity attributable to Holdings |
13,485 | 14,187 | ||||||||
|
|
|
|
|
|||||||
| Noncontrolling interest |
3,097 | 1,514 | ||||||||
|
|
|
|
|
|||||||
| Total equity |
16,582 | 15,701 | ||||||||
|
|
|
|
|
|||||||
| Total capitalization |
22,612 | 20,919 | ||||||||
|
|
|
|
|
|||||||
95
Table of Contents
SELECTED HISTORICAL CONSOLIDATED FINANCIAL DATA
The following selected financial data have been derived from the Company’s audited and unaudited consolidated financial statements. The financial information for the years ended December 31, 2017, 2016 and 2015, and as of December 31, 2017 and 2016 has been derived from the Company’s audited financial statements included elsewhere in this prospectus. The financial information as of December 31, 2015 and as of and for the years ended December 31, 2014, and 2013 has been derived from unaudited financial statements not included in this prospectus. The selected financial data as of and for the year ended December 31, 2016 have been restated and the selected financial data as of and for the years ended December 31, 2015, 2014, and 2013 have been revised, in each case from the Company’s Form S-1 registration statement filed on February 14, 2018. The selected financial data should be read in conjunction with “Management’s Discussion and Analysis of Financial Condition and Results of Operations” and the annual financial statements included elsewhere in this prospectus.
| Years Ended | ||||||||||||||||||||
| December 31, | ||||||||||||||||||||
| 2017 | 2016 (as restated) |
2015 | 2014 | 2013 | ||||||||||||||||
| (in millions, except per share data) | ||||||||||||||||||||
| Statements of Income (Loss) Data: |
||||||||||||||||||||
| Revenues |
||||||||||||||||||||
| Policy charges and fee income |
$ | 3,733 | $ | 3,762 | $ | 3,653 | $ | 3,487 | $ | 3,560 | ||||||||||
| Premiums |
1,124 | 1,083 | 1,070 | 1,098 | 1,335 | |||||||||||||||
| Net derivative gains (losses) |
228 | (1,722 | ) | (1,393 | ) | 829 | (3,458 | ) | ||||||||||||
| Net investment income (loss) |
3,082 | 2,665 | 2,450 | 3,395 | 2,455 | |||||||||||||||
| Investment gains (losses), net |
||||||||||||||||||||
| Total other-than-temporary impairment losses |
(15 | ) | (68 | ) | (42 | ) | (82 | ) | (82 | ) | ||||||||||
| Other investment gains (losses), net |
(176 | ) | 2,051 | 27 | 40 | 439 | ||||||||||||||
|
|
|
|
|
|
|
|
|
|
|
|||||||||||
| Total investment gains (losses), net |
(191 | ) | 1,983 | (15 | ) | (42 | ) | 357 | ||||||||||||
| Investment management and service fees |
4,093 | 3,749 | 3,895 | 3,892 | 3,727 | |||||||||||||||
| Other income |
445 | 402 | 419 | 420 | 364 | |||||||||||||||
|
|
|
|
|
|
|
|
|
|
|
|||||||||||
| Total revenues |
$ | 12,514 | $ | 11,922 | $ | 10,079 | $ | 13,079 | $ | 8,340 | ||||||||||
|
|
|
|
|
|
|
|
|
|
|
|||||||||||
| Benefits and Other Deductions |
||||||||||||||||||||
| Policyholders’ benefits |
$ | 4,354 | $ | 3,343 | $ | 3,505 | $ | 4,369 | $ | 3,201 | ||||||||||
| Interest credited to policyholders’ account balances |
1,108 | 1,091 | 946 | 952 | 1,038 | |||||||||||||||
| Compensation and benefits (includes $156, $154, $157, $154 and $160 of deferred acquisition costs) |
2,137 | 2,119 | 2,165 | 2,109 | 2,215 | |||||||||||||||
| Commissions and distribution related payments (includes $523, $536, $559, $569 and $546 of deferred acquisition costs) |
1,604 | 1,536 | 1,586 | 1,585 | 1,583 | |||||||||||||||
| Interest expense |
160 | 174 | 136 | 389 | 404 | |||||||||||||||
| Amortization of deferred policy acquisition costs, net (net of capitalization of $687, $697, $723, $707 and $736) |
(239 | ) | 89 | (285 | ) | (352 | ) | 73 | ||||||||||||
| Other operating costs and expenses (includes $8, $7, $7, $8 and $7 of deferred acquisition costs) |
2,076 | 1,516 | 1,585 | 1,594 | 1,789 | |||||||||||||||
|
|
|
|
|
|
|
|
|
|
|
|||||||||||
| Total benefits and other deductions |
$ | 11,200 | $ | 9,868 | $ | 9,638 | $ | 10,646 | $ | 10,303 | ||||||||||
|
|
|
|
|
|
|
|
|
|
|
|||||||||||
| Income (loss) from operations, before income taxes |
$ | 1,314 | $ | 2,054 | $ | 441 | $ | 2,433 | $ | (1,963 | ) | |||||||||
| Income tax (expense) benefit |
(41 | ) | (387 | ) | 217 | (477 | ) | 847 | ||||||||||||
|
|
|
|
|
|
|
|
|
|
|
|||||||||||
| Net income (loss) |
1,273 | 1,667 | 658 | 1,956 | (1,116 | ) | ||||||||||||||
| Less: net (income) loss attributable to the noncontrolling interest |
(423 | ) | (395 | ) | (325 | ) | (317 | ) | (281 | ) | ||||||||||
|
|
|
|
|
|
|
|
|
|
|
|||||||||||
| Net income (loss) attributable to Holdings |
$ | 850 | $ | 1,272 | $ | 333 | $ | 1,639 | $ | (1,397 | ) | |||||||||
|
|
|
|
|
|
|
|
|
|
|
|||||||||||
| Earnings Per Share |
||||||||||||||||||||
| Earnings per share—common stock |
||||||||||||||||||||
| Basic |
$ | 1.52 | $ | 2.27 | $ | 0.59 | $ | 2.92 | $ | (2.49 | ) | |||||||||
| Diluted |
$ | 1.51 | $ | 2.27 | $ | 0.59 | $ | 2.92 | $ | (2.49 | ) | |||||||||
| Weighted average common shares outstanding |
561.0 | 561.0 | 561.0 | 561.0 | 561.0 | |||||||||||||||
96
Table of Contents
| As of December 31, | ||||||||||||||||||||
| 2017 | 2016 (as restated) |
2015 | 2014 | 2013 | ||||||||||||||||
| (in millions) | ||||||||||||||||||||
| Balance Sheet Data (at period end): |
||||||||||||||||||||
| Total investments |
$ | 81,782 | $ | 72,318 | $ | 64,755 | $ | 64,426 | $ | 58,086 | ||||||||||
| Separate Account assets |
124,552 | 113,150 | 109,198 | 112,886 | 110,696 | |||||||||||||||
| Total assets |
235,648 | 216,614 | 205,481 | 207,716 | 198,996 | |||||||||||||||
| Policyholders’ account balances |
47,171 | 41,956 | 35,821 | 34,530 | 32,938 | |||||||||||||||
| Future policy benefits and other policyholders’ liabilities |
30,299 | 30,278 | 29,946 | 28,451 | 24,679 | |||||||||||||||
| Short-term and long-term debt |
2,408 | 1,605 | 1,786 | 1,963 | 2,028 | |||||||||||||||
| Loans from affiliates |
3,622 | 2,904 | 4,665 | 5,447 | 6,430 | |||||||||||||||
| Separate Account liabilities |
124,552 | 113,150 | 109,198 | 112,886 | 110,696 | |||||||||||||||
| Total liabilities |
218,440 | 201,614 | 191,923 | 193,608 | 187,683 | |||||||||||||||
| Redeemable noncontrolling interest |
626 | 403 | 13 | 17 | — | |||||||||||||||
| Total equity attributable to Holdings |
13,485 | 11,455 | 10,437 | 10,940 | 8,207 | |||||||||||||||
| Total equity attributable to Holdings, excluding Accumulated other comprehensive income (loss) |
13,593 | 12,376 | 11,114 | 10,702 | 9,009 | |||||||||||||||
| Noncontrolling interest |
3,097 | 3,142 | 3,108 | 3,151 | 3,106 | |||||||||||||||
| Total equity |
16,582 | 14,597 | 13,545 | 14,091 | 11,313 | |||||||||||||||
97
Table of Contents
UNAUDITED PRO FORMA CONDENSED FINANCIAL INFORMATION
The unaudited pro forma condensed financial information consists of the unaudited pro forma condensed balance sheet as of December 31, 2017 and the unaudited pro forma condensed statement of income (loss) for the year ended December 31, 2017 and the notes thereto. The unaudited pro forma condensed financial information should be read in conjunction with the information included under the headings “The Reorganization Transactions,” “Recapitalization,” “Selected Historical Consolidated Financial Data,” “Management’s Discussion and Analysis of Financial Condition and Results of Operations,” and the annual financial statements included elsewhere in this prospectus.
The unaudited pro forma condensed statement of income (loss) for the year ended December 31, 2017 has been prepared to give effect to certain of the Reorganization Transactions described below as if these transactions had occurred on January 1, 2017. The unaudited pro forma condensed balance sheet as of December 31, 2017 gives effect to these transactions as if they had occurred on December 31, 2017. The pro forma adjustments that were made represent only those transactions which are directly attributable to this offering, factually supportable and expected to have a continuing impact on our results of operations.
The unaudited pro forma condensed financial information is presented for informational purposes only, and does not purport to represent our financial condition or our results of operations had these transactions occurred on or as of the dates noted above or to project the results for any future date or period. The unaudited pro forma condensed financial information has been prepared in accordance with Regulation S-X. Actual results may differ from the pro forma adjustments.
The pro forma adjustments include the following items:
Legal entity and capital adjustments. As part of the Reorganization Transactions, AXA Belgium transferred its approximate 0.47% interest in AXA Financial to AXA in January 2018. Also, in March 2018 Coliseum Re transferred its approximate 0.03% interest in AXA Financial to AXA. AXA then contributed the entire approximate 0.5% minority interest in AXA Financial to Holdings in March 2018. As a result of the AXA Financial Transfer, AXA Financial is a direct wholly owned subsidiary of Holdings. As part of the Reorganization Transactions, Holdings sold its shares of AXA CS to AXA so that AXA CS and its subsidiaries, which have been excluded from our historical financial statements, are no longer a part of the Company. To anticipate the funding of this transfer AXA made a short-term loan of $622 million to Holdings in fourth quarter of 2017. Holdings’ repayment obligation to AXA in respect of this loan was set off against AXA’s payment obligation to Holdings with respect to the sale of AXA CS shares and AXA paid Holdings the balance of the purchase price in cash.
AB Transfer. As part of the Reorganization Transactions, in April 2018 we acquired for fair value the AB Units held by AXA IM Holding US and Coliseum Re such that AXA’s interests in AB are now held entirely by the Company. As part of the transfer of the AB Units held by AXA IM Holding US, Holdings acquired AXA IM Holding US, a holding entity without any other substantive business for approximately $873 million. Therefore, the pro forma adjustments also reflect the transfer of the other assets and liabilities of AXA IM Holding US which mainly include an income tax payable of approximately $57 million and a loan from AXA Financial for an amount of $185 million.
Unwind of current financing. As part of the Recapitalization, we have settled all the current outstanding financing balances with AXA and its affiliates, and we will remove AXA’s guarantee of AXA Financial’s obligations under AXA Financial’s commercial paper program in which case we estimate the amount borrowed by AXA Financial under this program would be reduced to zero. Other borrowings from external parties are expected to remain in place.
New external financing. As part of the Recapitalization, we have incurred $3.8 billion of new indebtedness through the issuance of the Notes which the Company has used to repay current financing and fund the Reorganization, and expect to incur $300 million of term loan borrowings.
98
Table of Contents
The unaudited pro forma condensed balance sheet has been prepared as though the transactions described above had occurred on December 31, 2017.
| As Reported |
Legal Entity and Capital Adjustments |
AB Transfer | Unwind of Current Financing |
New External Financing |
Pro Forma |
|||||||||||||||||||||||||||||||||||
| (in millions) | ||||||||||||||||||||||||||||||||||||||||
| Total investments |
$ | 81,782 | $ | $ | $ | $ | $ | 81,782 | ||||||||||||||||||||||||||||||||
| Cash and cash equivalents and Securities segregated, at fair value |
5,639 | 8 | [A1 | ] | (1,090 | ) | [B1 | ] | (3,248 | ) | [C1 | ] | 4,100 | [D1 | ] | 5,409 | ||||||||||||||||||||||||
| Loans to affiliates |
1,230 | (185 | ) | [B2 | ] | (1,045 | ) | [C2 | ] | — | ||||||||||||||||||||||||||||||
| Current and deferred income taxes |
67 | (232 | ) | [B3 | ] | (165 | ) | |||||||||||||||||||||||||||||||||
| Other assets |
22,378 | 22,378 | ||||||||||||||||||||||||||||||||||||||
| Separate Account assets |
124,552 | 124,552 | ||||||||||||||||||||||||||||||||||||||
|
|
|
|
|
|
|
|
|
|
|
|
|
|
|
|
|
|||||||||||||||||||||||||
| Total assets |
235,648 | 8 | (1,507 | ) | (4,293 | ) | 4,100 | 233,956 | ||||||||||||||||||||||||||||||||
|
|
|
|
|
|
|
|
|
|
|
|
|
|
|
|
|
|||||||||||||||||||||||||
| Future policy benefits and other policyholders’ liabilities |
30,299 | 30,299 | ||||||||||||||||||||||||||||||||||||||
| Policyholders’ account balances |
47,171 | 47,171 | ||||||||||||||||||||||||||||||||||||||
| Short-term and long-term debt |
2,408 | (1,290 | ) | [C3 | ] | 4,100 | [D1 | ] | 5,218 | |||||||||||||||||||||||||||||||
| Loans from affiliates |
3,622 | (622 | ) | [A2 | ] | (3,000 | ) | [C3 | ] | — | ||||||||||||||||||||||||||||||
| Other liabilities |
10,388 | 1 | 10,389 | |||||||||||||||||||||||||||||||||||||
| Separate Account liabilities |
124,552 | 124,552 | ||||||||||||||||||||||||||||||||||||||
|
|
|
|
|
|
|
|
|
|
|
|
|
|
|
|
|
|||||||||||||||||||||||||
| Total liabilities |
218,440 | (622 | ) | 1 | (4,290 | ) | 4,100 | 217,629 | ||||||||||||||||||||||||||||||||
|
|
|
|
|
|
|
|
|
|
|
|
|
|
|
|
|
|||||||||||||||||||||||||
| Redeemable noncontrolling interest |
626 | 626 | ||||||||||||||||||||||||||||||||||||||
| Total equity attributable to Holdings |
13,485 | 688 | 17 | (3 | ) | 14,187 | ||||||||||||||||||||||||||||||||||
|
|
|
|
|
|||||||||||||||||||||||||||||||||||||
| Noncontrolling interest |
3,097 | (58 | ) | [A3 | ] | (1,525 | ) | [B4 | ] | 1,514 | ||||||||||||||||||||||||||||||
| Total equity |
16,582 | 630 | (1,508 | ) | (3 | ) | — | 15,701 | ||||||||||||||||||||||||||||||||
|
|
|
|
|
|
|
|
|
|
|
|
|
|
|
|
|
|||||||||||||||||||||||||
| Total liabilities, noncontrolling interest and equity |
$ | 235,648 | $ | 8 | (1,507 | ) | $ | (4,293 | ) | $ | 4,100 | 233,956 | ||||||||||||||||||||||||||||
|
|
|
|
|
|
|
|
|
|
|
|
|
|
|
|
|
|||||||||||||||||||||||||
99
Table of Contents
The unaudited pro forma condensed statement of income (loss) for the year ended December 31, 2017 has been prepared as though the transactions described above had occurred on January 1, 2017.
| Year ended December 31, 2017 |
As Reported |
Legal Entity and Capital Adjustments |
AB Transfer | Unwind of Current Financing |
New External Financing |
Pro Forma |
||||||||||||||||||||||||||||||||||
| (in millions) | ||||||||||||||||||||||||||||||||||||||||
| Premiums |
$ | 1,124 | $ | $ | $ | $ | $ | 1,124 | ||||||||||||||||||||||||||||||||
| Policy charges and fee income |
3,733 | 3,733 | ||||||||||||||||||||||||||||||||||||||
| Net investment income (loss) and Net derivative gains (losses) |
3,310 | (5 | ) | [B5 | ] | (58 | ) | [C4 | ] | 3,247 | ||||||||||||||||||||||||||||||
| Total investment gains (losses), net |
(191 | ) | (191 | ) | ||||||||||||||||||||||||||||||||||||
| Investment management fees and other income |
4,538 | 4,538 | ||||||||||||||||||||||||||||||||||||||
|
|
|
|
|
|
|
|
|
|
|
|
|
|||||||||||||||||||||||||||||
| Total revenues |
12,514 | — | (5 | ) | (58 | ) | — | 12,451 | ||||||||||||||||||||||||||||||||
| Policyholders’ benefits |
4,354 | 4,354 | ||||||||||||||||||||||||||||||||||||||
| Interest credited to policyholders’ account balances |
1,108 | 1,108 | ||||||||||||||||||||||||||||||||||||||
| Commissions and distribution related payments |
1,604 | 1,604 | ||||||||||||||||||||||||||||||||||||||
| Compensation and benefits |
2,137 | 2,137 | ||||||||||||||||||||||||||||||||||||||
| Operating costs and other expenses |
2,076 | 2,076 | ||||||||||||||||||||||||||||||||||||||
| Amortization of DAC, net |
(239 | ) | (239 | ) | ||||||||||||||||||||||||||||||||||||
| Interest expense |
160 | (1 | ) | (90 | ) | [C5 | ] | 182 | [D2 | ] | 251 | |||||||||||||||||||||||||||||
|
|
|
|
|
|
|
|
|
|
|
|
|
|||||||||||||||||||||||||||||
| Total benefits and other deductions |
11,200 | (1 | ) | — | (90 | ) | 182 | 11,291 | ||||||||||||||||||||||||||||||||
| Income (loss) from operations, before income taxes |
1,314 | 1 | (5 | ) | 32 | (182 | ) | 1,160 | ||||||||||||||||||||||||||||||||
| Income tax (expense) benefit |
(41 | ) | (56 | ) | (11 | ) | 64 | (44 | ) | |||||||||||||||||||||||||||||||
|
|
|
|
|
|
|
|
|
|
|
|
|
|||||||||||||||||||||||||||||
| Net income (loss) |
1,273 | 1 | (61 | ) | 21 | (118 | ) | 1,116 | ||||||||||||||||||||||||||||||||
|
|
|
|
|
|
|
|
|
|
|
|
|
|||||||||||||||||||||||||||||
| Less: net (income) loss attributable to the noncontrolling interest |
(423 | ) | 3 | [A4 | ] | 144 | [B6 | ] | (276 | ) | ||||||||||||||||||||||||||||||
|
|
|
|
|
|
|
|
|
|
|
|
|
|||||||||||||||||||||||||||||
| Net income (loss) attributable to Holdings |
$ | 850 | $ | 4 | $ | 83 | $ | 21 | $ | (118 | ) | $ | 840 | |||||||||||||||||||||||||||
|
|
|
|
|
|
|
|
|
|
|
|
|
|||||||||||||||||||||||||||||
100
Table of Contents
Notes to the Unaudited Pro Forma Condensed Financial Information
| [A1] | Represents the price adjustment related to the sale of AXA CS to AXA. As part of the Reorganization Transactions, Holdings sold its shares of AXA CS to AXA so that AXA CS and its subsidiaries, which have been excluded from our historical financial statements, are no longer a part of the Company. The sale price of our AXA CS shares was $630 million. To anticipate this transfer, AXA made a short-term loan of $622 million in the fourth quarter of 2017. Holdings’ repayment obligation to AXA in respect of this loan was set off against AXA’s payment obligation to Holdings with respect to the sale of AXA CS shares, and AXA paid Holdings the balance of the purchase price in cash, resulting in a price adjustment of $8 million. The $630 million proceeds from the sale of AXA CS shares is presented as an increase to Total equity attributable to Holdings because AXA CS and its subsidiaries have been excluded from the historical consolidated financial statements of Holdings as described in “The Reorganization Transactions—Extraction of U.S. Property and Casualty Insurance Business.” |
| [A2] | Represents the set off of the $622 million loan made by AXA to us in the fourth quarter of 2017 to anticipate the funding of the sale of AXA CS from us to AXA. |
| [A3] | Represents the contribution of approximately 0.5% minority ownership interest of AXA Financial from AXA to Holdings resulting in approximately $58 million increase in the retained interest in AXA Financial. |
| [A4] | Represents the decrease in net income attributable to noncontrolling interest following the transfer of AXA Financial shares. |
| [B1] | Represents the cash payment made by Holdings to acquire AXA IM Holding US (approximately $873 million, representing the fair value of its approximately 15% economic interest in AB net of other transferred assets and liabilities of AXA IM Holding US) and approximately a 3% economic interest in AB from Coliseum Re (approximately $217 million). |
| [B2] | Represents the elimination of the loan from AXA Financial to AXA IM Holding US on the consolidated financial statements of Holdings after the purchase by Holdings of AXA IM Holding US. |
| [B3] | As a result of the Tax Reform Act, the unaudited pro forma condensed financial information reflects an assumed federal income tax rate of 21%. The adjustments herein mainly represent the net impact of (i) income tax payable of approximately $57 million at AXA IM Holding US and the deferred tax liability of approximately $193 million which is expected to be generated by the purchase by Holdings of AXA IM Holding US, due to the difference between the book value of AB Units held by AXA IM Holding US and their tax basis, and (ii) the deferred tax asset of approximately $18 million which is expected to be generated by the purchase by Holdings of the AB Units from Coliseum Re, due to the difference between the book value of AB Units purchased and their tax basis. |
| [B4] | Represents the decrease of approximately $1,525 million in noncontrolling interest following the transfer of AB Units. |
| [B5] | Represents the elimination of the interest earned on the loan from AXA Financial to AXA IM Holding US due to the elimination of this loan on the consolidated financial statements of Holdings after the purchase by Holdings of AXA IM Holding US. |
| [B6] | Represents the decrease in net income by $144 million for the year ended December 31, 2017 which is attributable to noncontrolling interest following the transfer of AB Units. |
| [C1] | Represents the anticipated net cash impact of the repayment of current intercompany financing arrangements as described above. |
101
Table of Contents
Notes to the Unaudited Pro Forma Condensed Financial Information
| [C2] | Represents the settlement of existing loans between AXA and its affiliates and Holdings and its affiliates prior to the settlement of this offering as described above. |
| [C3] | Represents the settlement of approximately $1,290 million issued under AXA Financial commercial paper program guaranteed by AXA, and the settlement of existing loans of approximately $3,000 million by Holdings and its affiliates to AXA and its affiliates prior to the settlement of this offering. |
| [C4] | Represents the decrease in investment income by $58 million for the year ending December 31, 2017 due to the settlement of existing loans by AXA and its affiliates to Holdings and its affiliates prior to the settlement of this offering. |
| [C5] | Represents the decrease in interest expense due to (i) the settlement of AXA Financial’s commercial paper program and guaranteed by AXA; and (ii) the settlement of existing loans by Holdings and its affiliates to AXA and its affiliates prior to the settlement of this offering. |
| [D1] | Represents $4.1 billion in new external indebtedness incurred by Holdings prior to the settlement of this offering. |
| [D2] | Represents an annualized interest expense of $182 million, including approximately $171 million interest expense related to our $3.8 billion aggregate principal amount of Notes issued in April 2018 and approximately $10 million of estimated interest expense on $0.3 billion term loan borrowings under our three-year term loan agreement. |
| For the Year Ended December 31, 2017 |
||||
| (in millions; except per share data) |
||||
| Net income (loss), as reported |
$ | 1,273 | ||
| Adjustments: |
||||
| Pro forma adjustments before income tax |
(154 | ) | ||
| Income tax impact |
(3 | ) | ||
| Pro forma adjustments, net of income tax |
(157 | ) | ||
| Pro forma net income (loss) |
$ | 1,116 | ||
| Less: Pro forma net income (loss) attributable to the noncontrolling interest |
(276 | ) | ||
|
|
|
|||
| Pro forma net income (loss) attributable to Holdings |
$ | 840 | ||
| Net income (loss) attributable to Holdings common shareholders per common share: |
||||
| Basic: |
1.52 | |||
| Diluted: |
1.51 | |||
| Common shares outstanding (in millions) |
561 | |||
| Pro forma earnings per share - basic(1) |
1.50 | |||
| Pro forma earnings per share - diluted(1) |
1.50 | |||
| (1) | The calculation of pro forma basic and diluted earnings per share and average shares outstanding are based on the average number of shares of Holdings common stock outstanding for the year ended December 31, 2017, after giving retroactive effect to the 459.4752645-for-1 stock split of the common stock of Holdings effected on April 24, 2018. |
102
Table of Contents
MANAGEMENT’S DISCUSSION AND ANALYSIS OF FINANCIAL CONDITION
AND RESULTS OF OPERATIONS
The following discussion and analysis of our financial condition and results of operations should be read in conjunction with “Selected Historical Consolidated Financial Data,” “Unaudited Pro Forma Financial Information” and our annual financial statements included elsewhere in this prospectus. In addition to historical data, this discussion contains forward-looking statements about our business, operations and financial performance based on current expectations that involve risks, uncertainties and assumptions. Actual results may differ materially from those discussed in the forward-looking statements as a result of various factors. Factors that could or do contribute to these differences include those factors discussed below and elsewhere in this prospectus, particularly under the captions “Risk Factors” and “Special Note Regarding Forward-Looking Statements and Information.”
Executive Summary
Overview
We are one of America’s leading financial services companies, providing (i) advice and solutions for helping Americans set and meet their retirement goals and protect and transfer their wealth across generations and (ii) a wide range of investment management insights, expertise and innovations to drive better investment decisions and outcomes for clients worldwide.
We manage our business through four segments: Individual Retirement, Group Retirement, Investment Management and Research, and Protection Solutions. We report certain activities and items that are not included in these segments in Corporate and Other. See “Business—Segment Information” and note 18 to the notes to our annual financial statements included elsewhere in this prospectus for further information on the Company’s segments.
We benefit from our complementary mix of businesses. This business mix provides diversity in our earnings sources, which helps offset fluctuations in market conditions and variability in business results, while offering growth opportunities.
Revenues
Our revenues come from three principal sources:
| • | fee income derived from our retirement and protection products and our investment management and research services; |
| • | premiums from our traditional life insurance and annuity products; and |
| • | investment income from our General Account investment assets (“GAIA”). |
Our fee income varies directly in relation to the amount of the underlying AV or benefit base of our retirement and protection products and the amount of AUM of our Investment Management and Research business. AV and AUM are influenced by changes in economic conditions, primarily equity market returns, as well as net flows. Our premium income is driven by the growth in new policies written and the persistency of our in-force policies, both of which are influenced by a combination of factors, including our efforts to attract and retain customers and market conditions that influence demand for our products. Our investment income is driven by the yield on our portfolio of General Account investment assets and is impacted by the prevailing level of interest rates as we reinvest cash associated with maturing investments and net flows to the portfolio.
Benefits and Other Deductions
Our primary expenses are:
| • | policyholders’ benefits and interest credited to policyholders’ account balances; |
103
Table of Contents
| • | sales commissions and compensation paid to intermediaries and advisors that distribute our products and services; and |
| • | compensation and benefits provided to our employees and other operating expenses. |
Policyholders’ benefits are driven primarily by customer withdrawals and surrenders which change in response to changes in capital market conditions. In addition, some of our policyholders’ benefits are directly tied to the AV and benefit base of our variable annuity products. Interest credited to policyholders varies in relation to the amount of the underlying AV or benefit base. Sales commissions and compensation paid to intermediaries and advisors vary in relation to premium and fee income generated from these sources, whereas compensation and benefits to our employees are more constant and decline with increases in efficiency. Our ability to manage these expenses across various economic cycles and products is critical to the profitability of our company.
Net Income Volatility
We have offered and continue to offer variable annuity products with GMxB features. The future claims exposure on these features is sensitive to movements in the equity markets and interest rates. Accordingly, we have implemented hedging and reinsurance programs designed to mitigate the economic exposure to us from these features due to equity market and interest rate movements. Changes in the values of the derivatives associated with these programs due to equity market and interest rate movements are recognized in the periods in which they occur while corresponding changes in offsetting liabilities are recognized over time. This results in net income volatility as further described below. See “—Significant Factors Impacting Our Results—Impact of Hedging and GMIB Reinsurance on Results.”
In addition to our dynamic hedging strategy, we have recently implemented static hedge positions designed to mitigate the adverse impact of changing market conditions on our statutory capital. We believe this program will continue to preserve the economic value of our variable annuity contracts and better protect our target variable annuity asset level. However, these new static hedge positions increase the size of our derivative positions and may result in higher net income volatility on a period-over-period basis.
Due to the impacts on our net income of equity market and interest rate movements and other items that are not part of the underlying profitability drivers of our business, we evaluate and manage our business performance using Non-GAAP Operating Earnings, a non-GAAP financial measure that is intended to remove these impacts from our results. See “—Key Operating Measures—Non-GAAP Operating Earnings.”
Significant Factors Impacting Our Results
The following significant factors have impacted, and may in the future impact, our financial condition, results of operations or cash flows.
Impact of Hedging and GMIB Reinsurance on Results
We have offered and continue to offer variable annuity products with GMxB features. The future claims exposure on these features is sensitive to movements in the equity markets and interest rates. Accordingly, we have implemented hedging and reinsurance programs designed to mitigate the economic exposure to us from these features due to equity market and interest rate movements. These programs include:
| • | Variable annuity hedging programs. We use a dynamic hedging program (within this program, we reevaluate our economic exposure at least daily and rebalance our hedge positions accordingly) to mitigate certain risks associated with the GMxB features that are embedded in our liabilities for our variable annuity products. This program utilizes various derivative instruments that are managed in an effort to reduce the economic impact of unfavorable changes in GMxB features’ exposures attributable to movements in the equity markets and interest rates. Although this program is designed to provide a |
104
Table of Contents
| measure of economic protection against the impact of adverse market conditions, it does not qualify for hedge accounting treatment. Accordingly, changes in value of the derivatives will be recognized in the period in which they occur with offsetting changes in reserves partially recognized in the current period, resulting in net income volatility. In addition to our dynamic hedging program, in the fourth quarter of 2017 and the first quarter of 2018, we implemented a new hedging program using static hedge positions (derivative positions intended to be held to maturity with less frequent rebalancing) to protect our statutory capital against stress scenarios. The implementation of this new program in addition to our dynamic hedge program is expected to increase the size of our derivative positions, resulting in an increase in net income volatility. The impacts are most pronounced for variable annuity products in our Individual Retirement segment. See “Business—Segment Information—Individual Retirement.” |
| • | GMIB reinsurance contracts. Historically, GMIB reinsurance contracts were used to cede to non-affiliated reinsurers a portion of our exposure to variable annuity products that offer a GMIB feature. We account for the GMIB reinsurance contracts as derivatives and report them at fair value. Gross reserves for GMIB reserves are calculated on the basis of assumptions related to projected benefits and related contract charges over the lives of the contracts. Accordingly, our gross reserves will not immediately reflect the offsetting impact on future claims exposure resulting from the same capital market or interest rate fluctuations that cause gains or losses on the fair value of the GMIB reinsurance contracts. Because changes in the fair value of the GMIB reinsurance contracts are recorded in the period in which they occur and a majority of the changes in gross reserves for GMIB are recognized over time, net income will be more volatile. |
Effect of Assumption Updates on Operating Results
Most of the variable annuity products, variable universal life insurance and universal life insurance products we offer maintain policyholder deposits that are reported as liabilities and classified within either Separate Account liabilities or policyholder account balances. Our products and riders also impact liabilities for future policyholder benefits and unearned revenues and assets for DAC and deferred sales inducements. The valuation of these assets and liabilities (other than deposits) are based on differing accounting methods depending on the product, each of which requires numerous assumptions and considerable judgment. The accounting guidance applied in the valuation of these assets and liabilities includes, but is not limited to, the following: (i) traditional life insurance products for which assumptions are locked in at inception; (ii) universal life insurance and variable life insurance secondary guarantees for which benefit liabilities are determined by estimating the expected value of death benefits payable when the account balance is projected to be zero and recognizing those benefits ratably over the accumulation period based on total expected assessments; (iii) certain product guarantees for which benefit liabilities are accrued over the life of the contract in proportion to actual and future expected policy assessments; and (iv) certain product guarantees reported as embedded derivatives at fair value.
Our actuaries oversee the valuation of these product liabilities and assets and review underlying inputs and assumptions. We review the actuarial assumptions underlying these valuations at least annually and update assumptions when appropriate. Assumptions are based on a combination of company experience, industry experience, management actions and expert judgment and reflect our best estimate as of the date of each financial statement. Changes in assumptions can result in a significant change to the carrying value of product liabilities and assets and, consequently, the impact could be material to earnings in the period of the change. For further details of our accounting policies and related judgments pertaining to assumption updates, see note 2 to the notes to our annual financial statements included elsewhere in this prospectus and “—Summary of Critical Accounting Policies—Liability for Future Policy Benefits.”
Macroeconomic and Industry Trends
Our business and consolidated results of operations are significantly affected by economic conditions and consumer confidence, conditions in the global capital markets and the interest rate environment.
105
Table of Contents
Economic Conditions and Consumer Confidence
A wide variety of factors continue to impact economic conditions and consumer confidence. These factors include, among others, concerns over economic growth in the United States, continued low interest rates, falling unemployment rates, the U.S. Federal Reserve’s plans to further raise short-term interest rates, fluctuations in the strength of the U.S. dollar, the uncertainty created by what actions the current administration may pursue, changes in tax policy, global economic factors, including programs by the European Central Bank and the United Kingdom’s vote to exit from the European Union, and other geopolitical issues. Additionally, many of the products and solutions we sell are tax-advantaged or tax-deferred. If U.S. tax laws were to change, such that our products and solutions are no longer tax-advantaged or tax-deferred, demand for our products could materially decrease. See “Risk Factors—Legal and Regulatory Risks—Future changes in U.S. tax laws and regulations or interpretations thereof could reduce our earnings and negatively impact our business, results of operations or financial condition, including by making our products less attractive to consumers.”
Capital Market Conditions
Although extraordinary monetary accommodation has mitigated volatility in interest rate and credit and domestic equity markets for an extended period, global central banks may now be past peak accommodation as the U.S. Federal Reserve continues its gradual pace of policy normalization. As global monetary policy becomes less accommodating, an increase in market volatility could affect our business, including through effects on the yields we earn on invested assets, changes in required reserves and capital and fluctuations in the value of our AUM, AV or AUA. These effects could be exacerbated by uncertainty about future fiscal policy, changes in tax policy, the scope of potential deregulation and levels of global trade.
In the short- to medium-term, the potential for increased volatility, coupled with prevailing interest rates remaining below historical averages, could pressure sales and reduce demand for our products as consumers consider purchasing alternative products to meet their objectives. In addition, this environment could make it difficult to consistently develop products that are attractive to customers. Financial performance can be adversely affected by market volatility and equity market declines as fees driven by AV and AUM fluctuate, hedging costs increase and revenues decline due to reduced sales and increased outflows.
We monitor the behavior of our customers and other factors, including mortality rates, morbidity rates, annuitization rates and lapse rates, which change in response to changes in capital market conditions, to ensure that our products and solutions remain attractive and profitable. For additional information on our sensitivity to interest rates and capital market prices, see “—Quantitative and Qualitative Disclosures About Market Risk.”
Interest Rate Environment
We believe the interest rate environment will continue to impact our business and financial performance in the future for several reasons, including the following:
| • | Our GAIA portfolio consists predominantly of fixed income investments. In the near term, and absent further material change in yields available on investments, we expect the yield we earn on new investments will be lower than the yields we earn on maturing investments, which were generally purchased in environments where interest rates were higher than current levels. If interest rates were to rise, we expect the yield on our new money investments would also rise and gradually converge toward the yield of those maturing assets. |
| • | Certain of our variable annuity and life insurance products pay guaranteed minimum interest crediting rates. We are required to pay these guaranteed minimum rates even if earnings on our investment portfolio decline, with the resulting investment margin compression negatively impacting earnings. In addition, we expect more policyholders to hold policies with comparatively high guaranteed rates longer (lower lapse rates) in a low interest rate environment. Conversely, a rise in average yield on our investment portfolio should positively impact earnings. Similarly, we expect policyholders would be less likely to hold policies with existing guaranteed rates (higher lapse rates) as interest rates rise. |
106
Table of Contents
| • | A prolonged low interest rate environment also may subject us to increased hedging costs or an increase in the amount of statutory reserves that our insurance subsidiaries are required to hold for GMxB features, lowering their statutory surplus, which would adversely affect their ability to pay dividends to us. In addition, it may also increase the perceived value of GMxB features to our policyholders, which in turn may lead to a higher rate of annuitization and higher persistency of those products over time. Finally, low interest rates may continue to cause an acceleration of DAC amortization or reserve increase due to loss recognition for interest sensitive products, primarily for our Protection Solutions segment. |
Regulatory Developments
Our life insurance subsidiaries are regulated primarily at the state level, with some policies and products also subject to federal regulation. On an ongoing basis, regulators refine capital requirements and introduce new reserving standards. Regulations recently adopted or currently under review can potentially impact our statutory reserve and capital requirements.
| • | NAIC. The NAIC is currently considering a proposal, which if adopted, could materially change the sensitivity of variable annuity reserves and capital requirements to capital markets including interest rate, equity markets and volatility as well as prescribed assumptions for policyholder behavior. In addition, the NAIC E Committee has established a working group to study and address, as appropriate, regulatory issues resulting from variable annuity captive reinsurance transactions, including reforms that would improve the current reserve and capital framework for insurance companies that sell variable annuity products. |
| • | Department of Labor (“DOL”). In April 2016, the DOL issued the Rule, which significantly expanded the range of activities considered to be fiduciary investment advice under the Employee Retirement Income Security Act of 1974 (“ERISA”) when our advisors and our employees provide investment-related information and support to retirement plan sponsors, participants and individual retirement account (“IRA”) holders. In February 2017, the DOL was directed by memorandum (the “President’s Memorandum”) to review the Rule and determine whether the Rule should be rescinded or revised, in light of the new administration’s policies and orientations. The Rule was partially implemented on June 9, 2017, with a special transition period for certain requirements that are due to take effect on January 1, 2018. On November 29, 2017, the DOL finalized a delay in implementing certain portions of the Rule from January 1, 2018 to July 1, 2019. On March 15, 2018 a federal appeals court issued a decision vacating the Rule. A final mandate has not been issued as of the date of this prospectus, and there is a possibility that the DOL may ask for a rehearing or appeal this decision. At this time, we do not currently plan any immediate changes to our approach to selling products and providing services to ERISA plans and IRAs. If the Rule remains in effect, we may need to make adverse changes to the level and type of services we provide as well as the nature and amount of compensation and fees that we and our affiliated advisors and firms receive for investment-related services to retirement plans and IRAs. See “Business—Regulation—ERISA Considerations.” |
Impact of the Tax Reform Act
On December 22, 2017, President Trump signed into law the Tax Reform Act, a broad overhaul of the U.S. Internal Revenue Code that changes long-standing provisions governing the taxation of U.S. corporations, including life insurance companies.
The Tax Reform Act reduces the federal corporate income tax rate to 21% beginning in 2018 and repeals the corporate alternative minimum tax (“AMT”) while keeping existing AMT credits. It also contains measures affecting our insurance companies, including changes to the DRD, insurance reserves and tax DAC, and measures affecting our international operations, such as a one-time transitional tax on some of the accumulated earnings of our foreign subsidiaries.
107
Table of Contents
As a result of the Tax Reform Act, we expect our Non-GAAP Operating Earnings to improve on a recurring basis due to the reduction in the effective tax rate. Our new effective tax rate is expected to be approximately 19%, driven mainly by the new federal corporate tax rate of 21% and the DRD benefit.
We expect the Tax Reform Act to have both positive and negative impacts on our balance sheet. On the one hand, as a one-time effect, the lower tax rate resulted in a reduction to the value of our deferred tax assets. On the other hand, the Tax Reform Act repeals the corporate AMT and, subject to certain limitations, allows us to use our AMT credits going forward, which we expect will result in a reduction of our tax liability. We recorded a $3 million one-time benefit in 2017 as a result of the estimated change in value of our deferred tax assets and liabilities and the expected utilization of our AMT credits.
In 2017, on a statutory basis, we recorded a moderate increase to our Combined RBC Ratio as a result of the Tax Reform Act. Specifically, this was driven mainly by the benefit of the corporate AMT repeal, but partially offset by a lower statutory deferred tax asset valuation.
We expect the tax liability on the earnings of our foreign subsidiaries will decrease going forward. In 2017, we recorded a one-time decrease to net income of $23 million due to the estimated transitional tax on some of the accumulated earnings of these subsidiaries.
Overall, we expect the Tax Reform Act to have a net positive economic impact on us. We continue to evaluate this new and complicated piece of legislation, assess the magnitude of the various impacts and monitor potential regulatory changes related to this reform.
Separation Costs
In connection with the preparation of this offering and operating as a stand-alone public company following the settlement of this offering, we expect to incur one-time and recurring expenses. These expenses primarily relate to information technology, compliance, internal audit, finance, risk management, procurement, client service, human resources and other support services. The process of replicating and replacing functions, systems and infrastructure provided by AXA or certain of its affiliates in order to operate on a stand-alone basis is currently underway and we expect that it will continue following the settlement of this offering.
We estimate that the aggregate amount of the one-time expenses described above will be between approximately $300 million and $350 million, of which $93 million was incurred in 2017 and approximately $150 million is expected to be incurred in 2018. Additional one-time expenses will be incurred when AXA ceases to own at least a majority of our outstanding common stock. See “Risk Factors—Risks Relating to Our Controlling Stockholder—Following the settlement of this offering, we may fail to replicate or replace functions, systems and infrastructure provided by AXA or certain of its affiliates (including through shared service contracts) or lose benefits from AXA’s global contracts, and AXA and its affiliates may fail to perform the services provided for in the Transitional Services Agreement” and “—Costs associated with any rebranding that we expect to undertake after AXA ceases to own at least a majority of our outstanding common stock could be significant.”
Restatements of Historical Financial Statements
As a result of misstatements in our previously issued annual and interim financial statements due to the material weaknesses in our internal control over financial reporting, we have:
| • | restated the annual financial statements for the year ended December 31, 2016, |
| • | restated the interim financial statements for the nine months ended September 30, 2017 and for the six months ended June 30, 2017, |
| • | revised the annual financial statements for the year ended December 31, 2015 and |
108
Table of Contents
| • | revised the interim financial statements for the nine months ended September 30, 2016 and for the six months ended June 30, 2016, |
in each case that were reported in the preliminary prospectus included in the first amendment of our registration statement on Form S-1 filed with the SEC on February 14, 2018. Following settlement of this offering, our Quarterly Reports on Form 10-Q for the quarterly period ended June 30, 2018 and for the quarterly period ended September 30, 2018 will contain fully restated financial statements for the six months ended June 30, 2017 and the nine months ended September 30, 2017, respectively. See note 1 to the notes to the annual financial statements for a discussion of the restatement of the annual financial statements for the year ended December 31, 2016 and the revision of the annual financial statements for the year ended December 31, 2015. See page F-131 for further information on the restatement of the interim financial statements for the nine months ended September 30, 2017 and for the six months ended June 30, 2017 and the revision of the interim financial statements for the nine months ended September 30, 2016 and for the six months ended June 30, 2016.
Key Operating Measures
In addition to our results presented in accordance with U.S. GAAP, we plan to report Non-GAAP Operating Earnings and Non-GAAP Operating ROE as well as Non-GAAP Operating ROC by segment for our Individual Retirement, Group Retirement and Protection Solutions segments, each of which is a measure that is not determined in accordance with U.S. GAAP. Management believes that the use of these non-GAAP financial measures, together with relevant U.S. GAAP measures, provides a better understanding of our results of operations and the underlying profitability drivers and trends of our business. These non-GAAP financial measures are intended to remove from our results of operations the impact of market changes (other than with respect to equity method investments) as well as certain other expenses which are not part of our underlying profitability drivers or likely to re-occur in the foreseeable future, as such items fluctuate from period-to-period in a manner inconsistent with these drivers. These measures should be considered supplementary to our results that are presented in accordance with U.S. GAAP and should not be viewed as a substitute for the U.S. GAAP measures. Other companies may use similarly titled non-GAAP financial measures that are calculated differently from the way we calculate such measures. Consequently, our non-GAAP financial measures may not be comparable to similar measures used by other companies.
We also discuss certain operating measures, including AUM, AUA and AV and certain other operating measures, which management believes provide useful information about our businesses and the operational factors underlying our financial performance.
Non-GAAP Operating Earnings
Non-GAAP Operating Earnings is an after-tax non-GAAP financial measure used to evaluate our financial performance on a consolidated basis. The most significant of such adjustments relates to our derivative positions, which protect economic value and statutory capital, and are more sensitive to changes in market conditions than the variable annuity product liabilities as valued under U.S. GAAP. This is a large source of volatility in net income. Non-GAAP Operating Earnings equals our consolidated after-tax net income attributable to Holdings adjusted to eliminate the impact of the following items:
| • | Items related to GMxB features, which include changes in the fair value of the derivatives we use to hedge our GMxB features within our variable annuity products, the effect of benefit ratio unlock adjustments and changes in the fair value of the embedded derivatives of our GMxB riders reflected within variable annuity products net derivative results; |
| • | Investment (gains) losses, which includes other-than-temporary impairments of securities, sales or disposals of securities/investments, realized capital gains/losses and valuation allowances; |
| • | Investment (income) loss from certain derivative instruments, which includes net derivative (gains) losses, excluding derivative instruments used to hedge risks associated with interest margins on interest sensitive life and annuity contracts, replicate credit exposure of fixed maturity securities, replicate a |
109
Table of Contents
| dollar-denominated fixed-coupon cash bonds, Separate Accounts fee hedges, and freestanding and embedded derivatives associated with products with GMxB features; |
| • | Net actuarial (gains) losses, which includes actuarial gains and losses as a result of differences between actual and expected experience on pension plan assets or projected benefit obligation during a given period related to pension and other postretirement benefit obligations; |
| • | Other adjustments, which includes restructuring costs related to severance, lease write-offs related to non-recurring restructuring activities and write-downs of goodwill; and |
| • | Income tax expense (benefit) related to the above items and non-recurring tax items, which includes release of tax positions for a given audit period, goodwill impairment, state taxes on the sale of real estate and, for 2017, the impact related to the Tax Reform Act. |
Because Non-GAAP Operating Earnings excludes the foregoing items that can be distortive or unpredictable, management believes that this measure enhances the understanding of the Company’s underlying drivers of profitability and trends in our business, thereby allowing management to make decisions that will positively impact our business.
We use our prevailing corporate federal income tax rate of 35%, which was in effect on December 31, 2017, while taking into account any non-recurring differences for events recognized differently in our financial statements and federal income tax returns when reconciling Net income (loss) attributable to Holdings to Non-GAAP Operating Earnings.
The table below presents a reconciliation of Net income (loss) attributable to Holdings to Non-GAAP Operating Earnings for the years ended December 31, 2017, 2016 and 2015:
| Years Ended December 31, | ||||||||||||
| 2017 | 2016 | 2015 | ||||||||||
| (in millions) | ||||||||||||
| Net income (loss) attributable to Holdings |
$ | 850 | $ | 1,272 | $ | 333 | ||||||
|
|
|
|
|
|
|
|||||||
| Adjustments related to: |
||||||||||||
| GMxB features |
1,244 | 2,068 | 1,697 | |||||||||
| Investment (gains) losses |
191 | (1,983 | ) | 15 | ||||||||
| Investment income from certain derivative instruments |
18 | 6 | (104 | ) | ||||||||
| Net actuarial (gains) losses related to pension and other postretirement benefit obligations |
135 | 140 | 137 | |||||||||
| Goodwill impairment |
369 | — | — | |||||||||
| Other adjustments |
89 | 12 | (11 | ) | ||||||||
| Income tax expense (benefit) related to above adjustments |
(699 | ) | (76 | ) | (592 | ) | ||||||
| Non-recurring tax items |
(76 | ) | (63 | ) | (103 | ) | ||||||
|
|
|
|
|
|
|
|||||||
| Non-GAAP Operating Earnings |
$ | 2,121 | $ | 1,376 | $ | 1,372 | ||||||
|
|
|
|
|
|
|
|||||||
Non-GAAP Operating ROE and Non-GAAP Operating ROC by Segment
We plan to report Non-GAAP Operating ROE as well as Non-GAAP Operating ROC by segment for our Individual Retirement, Group Retirement and Protection Solutions segments, each of which is a non-GAAP financial measure used to evaluate our recurrent profitability on a consolidated basis and by segment, respectively. We calculate Non-GAAP Operating ROE by dividing Non-GAAP Operating Earnings by consolidated average equity attributable to Holdings, excluding Accumulated Other Comprehensive Income (“AOCI”) and Non-controlling interest (“NCI”). We calculate Non-GAAP Operating ROC by segment by dividing operating earnings (loss) on a segment basis by average capital on a segment basis, excluding AOCI and NCI, as described below. AOCI fluctuates period-to-period in a manner inconsistent with our underlying
110
Table of Contents
profitability drivers as the majority of such fluctuation is related to the market volatility of the unrealized gains and losses associated with our available for sale (“AFS”) securities. Therefore, we believe excluding AOCI is more effective in analyzing the trends of our operations. We do not calculate Non-GAAP Operating ROC by segment for our Investment Management & Research segment because we do not manage that segment from a return of capital perspective. Instead, we use metrics more directly applicable to an asset management business, such as AUM, to evaluate and manage that segment. For Non-GAAP Operating ROC by segment, capital components pertaining directly to specific segments such as DAC and goodwill along with targeted capital are directly attributed to these segments. Targeted capital for each segment is established using assumptions supporting statutory capital adequacy levels necessary to be considered a going concern. To enhance the ability to analyze these measures across periods, interim periods are annualized. Non-GAAP Operating ROE and Non-GAAP Operating ROC by segment should not be used as substitutes for ROE.
The following table sets forth Non-GAAP Operating ROC by segment for our Individual Retirement, Group Retirement and Protection Solutions segments for the year ended December 31, 2017.
| Year Ended December 31, 2017 | ||||||||||||
| Individual Retirement |
Group Retirement |
Protection Solutions |
||||||||||
| Operating earnings |
$ | 1,287 | $ | 283 | $ | 536 | ||||||
| Average capital(1) |
$ | 6,740 | $ | 1,254 | $ | 2,623 | ||||||
|
|
|
|
|
|
|
|||||||
| Non-GAAP Operating ROC |
19.1 | % | 22.6 | % | 20.4 | % | ||||||
| (1) | For average capital amounts by segment, capital components pertaining directly to specific segments such as DAC and goodwill along with targeted capital are directly attributed to these segments. Targeted capital for each segment is established using assumptions supporting statutory capital adequacy levels necessary to be considered a going concern. |
Assets Under Management (“AUM”)
AUM means investment assets that are managed by one of our subsidiaries and includes: (i) assets managed by AB, (ii) the assets in our GAIA portfolio and (iii) the Separate Account assets of our Individual Retirement, Group Retirement and Protection Solutions businesses. Total AUM reflects exclusions between segments to avoid double counting.
Assets Under Administration (“AUA”)
AUA includes non-insurance client assets that are invested in our savings and investment products or serviced by our AXA Advisors platform. We provide administrative services for these assets and generally record the revenues received as distribution fees.
Account Value (“AV”)
AV generally equals the aggregate policy account value of our retirement and protection products. General Account AV refers to account balances in investment options that are backed by the General Account while Separate Account AV refers to Separate Account investment assets.
Protection Solutions Reserves
Protection Solutions Reserves equals the aggregate value of Policyholders’ account balances and Future policy benefits for policies in our Protection Solutions segment.
111
Table of Contents
Consolidated Results of Operations
Our consolidated results of operations are significantly affected by conditions in the capital markets and the economy because we offer variable annuity products with GMxB features. These products have been a significant driver of our results of operations. Because the future claims exposure on these products is sensitive to movements in the equity markets and interest rates, we have in place various hedging and reinsurance programs that are designed to mitigate the economic risks of movements in the equity markets and interest rates. The volatility in our net income attributable to Holdings for the periods presented below results from the mismatch between (i) the change in carrying value of the reserves for GMDB and certain GMIB features that do not fully and immediately reflect the impact of equity and interest market fluctuations and (ii) the change in fair value of products with the GMIB feature that have a no-lapse guarantee, and our hedging and reinsurance programs.
As of December 31, 2017, our economic interest in AB was approximately 47%. As of the time of this offering and after giving effect to the Reorganization Transactions, our economic interest in AB will be approximately 65%. Our indirect, wholly owned subsidiary, AllianceBernstein Corporation, is the General Partner of AB. Accordingly, AB is consolidated in our financial statements, and its results are fully reflected in our consolidated financial statements.
The consolidated financial statements as of and for the year ended December 31, 2016 have been restated and the consolidated financial statements as of and for the year ended December 31, 2015 have been revised, primarily for the correction of errors in the calculation of policyholders’ benefit reserves and embedded derivatives for the Company’s variable annuity products and the calculation of DAC amortization for certain variable and interest sensitive products.
112
Table of Contents
The following table summarizes our consolidated statements of income (loss) for the years ended December 31, 2017, 2016 and 2015:
| Years Ended December 31, | ||||||||||||
| 2017 | 2016 (as restated) |
2015 | ||||||||||
| (in millions) | ||||||||||||
| REVENUES |
||||||||||||
| Policy charges and fee income |
$ | 3,733 | $ | 3,762 | $ | 3,653 | ||||||
| Premiums |
1,124 | 1,083 | 1,070 | |||||||||
| Net derivative gains (losses) |
228 | (1,722 | ) | (1,393 | ) | |||||||
| Net investment income |
3,082 | 2,665 | 2,450 | |||||||||
| Investment gains (losses), net: |
||||||||||||
| Total other-than-temporary impairment losses |
(15 | ) | (68 | ) | (42 | ) | ||||||
| Other investment gains (losses), net |
(176 | ) | 2,051 | 27 | ||||||||
|
|
|
|
|
|
|
|||||||
| Total investment gains (losses), net |
$ | (191 | ) | $ | 1,983 | $ | (15 | ) | ||||
| Investment management and service fees |
4,093 | 3,749 | 3,895 | |||||||||
| Other income |
445 | 402 | 419 | |||||||||
|
|
|
|
|
|
|
|||||||
| Total revenues |
$ | 12,514 | $ | 11,922 | $ | 10,079 | ||||||
|
|
|
|
|
|
|
|||||||
| BENEFITS AND OTHER DEDUCTIONS |
||||||||||||
| Policyholders’ benefits |
4,354 | 3,343 | 3,505 | |||||||||
| Interest credited to policyholders’ account balances |
1,108 | 1,091 | 946 | |||||||||
| Compensation and benefits (includes $156, $154 and $157 of deferred acquisition costs) |
2,137 | 2,119 | 2,165 | |||||||||
| Commissions and distribution related payments (includes $523, $536 and $559 of deferred acquisition costs) |
1,604 | 1,536 | 1,586 | |||||||||
| Interest expense |
160 | 174 | 136 | |||||||||
| Amortization of deferred policy acquisition costs, net (net of capitalization of $687, $697 and $723) |
(239 | ) | 89 | (285 | ) | |||||||
| Other operating costs and expenses (includes $8, $7 and $7 of deferred acquisition costs) (see note 11 for related party information) |
2,076 | 1,516 | 1,585 | |||||||||
|
|
|
|
|
|
|
|||||||
| Total benefits and other deductions |
$ | 11,200 | $ | 9,868 | $ | 9,638 | ||||||
|
|
|
|
|
|
|
|||||||
| Income (loss) from operations, before income taxes |
1,314 | 2,054 | 441 | |||||||||
| Income tax (expense) benefit |
(41 | ) | (387 | ) | 217 | |||||||
|
|
|
|
|
|
|
|||||||
| Net income (loss) |
$ | 1,273 | $ | 1,667 | $ | 658 | ||||||
| Less: net (income) loss attributable to the noncontrolling interest |
(423 | ) | (395 | ) | (325 | ) | ||||||
|
|
|
|
|
|
|
|||||||
| Net income (loss) attributable to Holdings |
$ | 850 | $ | 1,272 | $ | 333 | ||||||
|
|
|
|
|
|
|
|||||||
| Years Ended December 31, | ||||||||||||
| 2017 | 2016 | 2015 | ||||||||||
| (in millions) | ||||||||||||
| Non-GAAP Operating Earnings |
$ | 2,121 | $ | 1,376 | $ | 1,372 | ||||||
The following discussion compares the results for the year ended December 31, 2017 to the year ended December 31, 2016 and the results for the year ended December 31, 2016 to the year ended December 31, 2015.
Year Ended December 31, 2017 Compared to the Year Ended December 31, 2016
Net Income Attributable to Holdings
The $422 million decrease in net income attributable to Holdings to $850 million for the year ended 2017 from $1,272 million for the year ended 2016 was primarily driven by the following notable items:
| • | Lower investment gains of $2.2 billion mainly due to a non-recurring $1.9 billion realized gain on the sale of two real estate properties in New York City for the year ended 2016, and losses of $0.2 billion |
113
Table of Contents
| in 2017 mainly due to the disposal of our commercial-mortgage backed securities portfolio and the sale of U.S. treasury securities. |
| • | Increase in Policyholders’ benefits of $1.0 billion due to reserve increases of $1.5 billion for our Individual Retirement products mainly driven by policyholder behavior benefit ratio unlock adjustments, partially offset by $499 million in our Protection Solutions segment mainly driven by $700 million positive impact in 2017 from assumption updates and model changes compared to $117 million in 2016 and $27 million from other routine updates partially offset by a $187 million increase in net death claims. 2017 included the full reserve release of $677 million following assumption updates and model changes in the fourth quarter of 2017 and $92 million from a change in premium funding assumptions, partially offset by $70 million from a mortality table update. 2016 was mainly driven by a $106 million change in premium funding assumptions. |
| • | Increase in Compensation and benefits and Other operating costs and expenses of $578 million mainly reflecting the recognition of a goodwill impairment charge, reflected in Other operating costs and expenses, of $369 million in 2017 due to the Company’s early adoption on January 1, 2017 of new accounting guidance for goodwill, and $165 million from our Investment Management and Research segment reflecting higher compensation and benefits, as well as higher operating expenses. |
Partially offsetting this decrease were the following notable items:
| • | An increase in Net derivative gains (losses) of $2.0 billion mainly due to $1.7 billion increased gains due to our GMxB liability carried at fair value, and $0.4 billion from GMxB derivatives reflecting gains on Interest rate partially offset by higher equity return leading to higher losses. |
| • | Increase in Net investment income of $417 million primarily due to an increase of $409 million in income relating to trading securities driven primarily by increased SCS holdings and AB trading activity. |
| • | Higher Investment management and service fees of $344 million driven by $284 million increase in our Investment Management and Research segment primarily due to higher base fees of $205 million in Retail, Institutions and Private Wealth Management, reflecting an increase in average AUM and the impact of a shift in distribution channel mix from Institutions to Retail and Private Wealth Management, which generally have higher fees, and an increase in performance fees of $62 million. |
| • | Increase in Other income of $43 million primarily due to an increase of $47 million in distribution revenue from AXA Advisors broker-dealer business. |
| • | Increase in Premiums of $41 million, primarily from our Individual Retirement segment driven by higher income benefit elections, partially offset by a decrease from our Protection Solution segment, mainly driven by a decrease in term life premiums. |
| • | Lower Amortization of DAC, net of $328 million in 2017 driven by a decrease across all segments. Our Protection Solutions segment decreased by $235 million as a result of a decrease of $228 million in amortization of DAC before capitalization. This decrease was mainly due the impact of assumptions updates and model changes of $224 million (a $23 million decrease in 2017 compared to a $201 million increase in 2016). In 2017, the $23 million decrease included (i) a $204 million positive impact from a mortality table update, (ii) a $54 million decrease from a maintenance expense assumption update to reflect actual experience, partially offset by (iii) a $192 million DAC write-off related to our loss recognition testing of certain permanent life products due to low interest rates, and (iv) $61 million from the update of General Account spread and yield assumption. In 2016, the $201 million increase included (i) a $182 million increase from lower interest rates, and (ii) a $28 million increase from an update in premium funding assumptions. Individual Retirement decreased by $16 million mainly due to $36 million lower Amortization of DAC primarily due to an update of our lapse and withdrawal assumptions for our variable annuity products. Group Retirement was $29 million lower mainly due to $24 million lower Amortization of DAC reflecting assumption updates to reflect higher persistency. |
114
Table of Contents
| Corporate and Other decreased by $48 million primarily driven by Closed Block amortization of DAC decreasing by $36 million, primarily reflecting reactivity to lower gross margin in 2017. |
| • | Decrease of $346 million in income tax expense primarily driven by lower pre-tax income and the impact of a $228 million tax benefit related to the conclusion of an IRS audit for tax years 2008 and 2009 in the second quarter of 2017. |
Non-GAAP Operating Earnings
Our consolidated Non-GAAP Operating Earnings was favorably impacted during the period by several discrete actuarial assumption updates and model changes in our Protection Solutions segment.
Non-GAAP Operating Earnings increased $745 million to $2,121 million during 2017 from $1,376 million
in 2016, primarily driven by the following notable items:
| • | Increase in Net derivative gains of $343 million primarily due to GMxB derivative gains due to decreasing interest rates in 2017 compared to 2016. |
| • | Increase in Investment management and service fees of $344 million mainly driven by $283 million in our Investment Management and Research segment primarily due to higher base fees of $205 million reflecting an increase in average AUM and the impact of a shift in distribution channel mix from Institutions to Retail and Private Wealth Management, which generally have higher fees, and an increase in performance fees of $62 million. |
| • | Decrease in Amortization of DAC, net of $335 million in 2017 driven by a decrease across all segments. Our Protection Solutions segment decreased by $235 million as a result of a decrease of $228 million in amortization of DAC before capitalization. This decrease was mainly due the impact of assumptions updates and model changes of $224 million (a $23 million decrease in 2017 compared to a $201 million increase in 2016). In 2017, the $23 million decrease included (i) a $204 million positive impact from a mortality table update, (ii) a $54 million decrease from a maintenance expense assumption update to reflect actual experience, partially offset by (iii) a $192 million DAC write-off related to our loss recognition testing of certain permanent life products due to low interest rates, and (iv) $61 million from the update of General Account spread and yield assumption. In 2016, the $201 million increase included (i) a $182 million increase from lower interest rates, and (ii) a $28 million increase from an update in premium funding assumptions. Individual Retirement decreased by $22 million mainly due to $43 million lower Amortization of DAC primarily due to an update of our lapse and withdrawal assumptions for our variable annuity products. Group Retirement was $30 million lower mainly due to $25 million lower Amortization of DAC reflecting assumption updates to reflect higher persistency. Corporate and Other decreased by $48 million primarily driven by Closed Block amortization of DAC decreasing by $36 million, primarily reflecting reactivity to lower gross margin in 2017. |
| • | Increase in Net investment income of $190 million mainly due to higher equity method investments and higher asset base. |
| • | Increase in Premiums of $41 million, primarily from our Individual Retirement segment driven by higher IB elections, partially offset by a decrease from our Protection Solutions segment, mainly driven by a decrease in term life premiums. |
| • | Increase in Other income of $42 million due to an increase of $47 million in distribution revenue from AXA Advisors broker-dealer business. |
Partially offsetting this increase were the following notable items:
| • | Increase in Policyholders’ benefits of $32 million mainly driven by a $536 million increase in GMxB policyholder benefits, partially offset by a $499 million decrease in our Protection Solutions segment, |
115
Table of Contents
| mainly driven by a $700 million positive impact in 2017 from assumption updates and model changes (compared to $117 million in 2016) and $27 million from other routine updates, partially offset by a $187 million increase in net death claims. 2017 included the full reserve release of $677 million following assumption updates and model changes in the fourth quarter of 2017 and $92 million from a change in premium funding assumptions, partially offset by $70 million from a mortality table update. 2016 was mainly driven by a $106 million change in premium funding assumptions. |
| • | Higher Compensation and benefits and Other operating costs and expenses of $66 million mainly driven by business growth in our Investment Management and Research segment. |
| • | Increase of $292 million in income tax expense primarily driven by higher pre-tax income. |
Year ended December 31, 2016 Compared to the Year Ended December 31, 2015
Net Income (Loss) Attributable to Holdings
The $939 million increase in net income attributable to Holdings to $1,272 million in 2016 from $333 million in 2015 was primarily driven by the following notable items:
| • | Higher investment gains of $2.0 billion due to a $1.9 billion realized gain on the sale of two New York City real estate properties in 2016. |
| • | Increase of $215 million of Net investment income mainly due to unrealized gains on trading securities and higher commercial mortgage prepayments, partially offset by lower income from equity method investments. |
| • | Increase of $109 million in Policy charges and fee income mainly due to higher Separate Account fee income driven by higher average AV. |
Partially offsetting this increase were the following notable items:
| • | Increase in Amortization of DAC, net of $374 million primarily driven by an increase of $368 million in our Protection Solutions segment, reflecting an increase of $334 million in amortization of DAC before capitalization. This increase was mainly due to the impact of model changes and assumptions updates for $300 million ($201 million increase in 2016 compared to a $99 million decrease in 2015), and an increase of $34 million mainly due to $77 million from other routine model updates to reflect actual experience such as the update of the cost of the cap and floor of our equity indexed universal life products. In 2016, assumption updates and model changes increased amortization of DAC by $201 million reflecting $182 million from lower interest rates and $28 million from premium funding assumptions, compared to a decrease of $99 million in 2015 mainly due to an update in RTM assumptions. |
| • | Decrease in Investment management and service fees of $146 million primarily due to a decrease in Retail and Institutions base fees from a shift in product mix and lower Bernstein Research Service fees due to lower market values. |
| • | Higher income tax expense of $604 million in 2016 also contributed to a decrease in our overall results. |
Non-GAAP Operating Earnings
Non-GAAP Operating Earnings increased $4 million to $1,376 million in 2016 from $1,372 million in
2015, primarily driven by the following notable items:
| • | Increase in Net derivative gains of $478 million mainly driven by GMxB derivatives gains in Individual Retirement. |
| • | Increase of $122 million in Policy charges and fee income and premiums mainly due to the impact of assumption changes and higher cost of insurance charges in our Protection Solutions segment, as well as higher premiums primarily in Individual Retirement, partly offset by the decrease in Protection Solutions premiums. |
116
Table of Contents
| • | Decrease in Compensation and benefits and Other operating costs and expenses of $144 million mainly driven by lower Compensation and benefits in Investment Management and Research, as well as other operating efficiencies. |
Partially offsetting this increase were the following notable items:
| • | Higher Amortization of DAC, net of $376 million primarily driven by $368 million in our Protection Solutions segment, reflecting an increase of $334 million in amortization of DAC before capitalization. This increase was mainly due to the impact of model changes and assumptions updates for $300 million ($201 million increase in 2016 compared to a $99 million decrease in 2015), and an increase of $34 million mainly due to $77 million from other routine model updates to reflect actual experience such as the update of the cost of the cap and floor of our equity indexed universal life products. In 2016, assumption updates and model changes increased amortization of DAC by $201 million reflecting $182 million from lower interest rates and $28 million from premium funding assumptions, compared to a decrease of $99 million in 2015 mainly due to an update in RTM assumptions. |
| • | Increase of $157 million in Policyholders’ benefits mainly due to Individual Retirement (partially offsetting GMxB derivative gains). |
| • | Decrease in investment management and service fees of $146 million primarily due to a decrease in Retail and Institutions base fees from a shift in product mix and lower Bernstein Research Service fees due to lower market values. |
| • | Increase of $47 million in income tax expense primarily driven by higher pre-tax income. |
Results of Operations by Segment
We manage our business through the following four segments: Individual Retirement, Group Retirement, Investment Management and Research and Protection Solutions. We report certain activities and items that are not included in our four segments in Corporate and Other. The following section presents our discussion of operating earnings (loss) by segment and AUM and AV by segment, as applicable. Consistent with U.S. GAAP guidance for segment reporting, operating earnings (loss) is our U.S. GAAP measure of segment performance. See note 18 to the notes to our annual financial statements included elsewhere in this prospectus for further information on the Company’s segments.
The following table summarizes operating earnings (loss) by segment for the years ended December 31, 2017, 2016 and 2015:
| Years Ended December 31, | ||||||||||||
| 2017 | 2016 (as restated) |
2015 | ||||||||||
| (in millions) | ||||||||||||
| Operating earnings (loss) by segment: |
||||||||||||
| Individual Retirement |
$ | 1,287 | $ | 1,153 | $ | 1,060 | ||||||
| Group Retirement |
283 | 167 | 167 | |||||||||
| Investment Management and Research |
211 | 161 | 173 | |||||||||
| Protection Solutions |
536 | 79 | 113 | |||||||||
| Corporate and Other |
(196 | ) | (184 | ) | (141 | ) | ||||||
|
|
|
|
|
|
|
|||||||
| Non-GAAP Operating Earnings |
$ | 2,121 | $ | 1,376 | $ | 1,372 | ||||||
|
|
|
|
|
|
|
|||||||
Individual Retirement
The Individual Retirement segment includes our variable annuity products which primarily meet the needs of individuals saving for retirement or seeking retirement income.
117
Table of Contents
The following table summarizes operating earnings of our Individual Retirement segment for the periods presented:
| Years Ended December 31, | ||||||||||||
| 2017 | 2016 | 2015 | ||||||||||
| (in millions) | ||||||||||||
| Operating earnings |
$ | 1,287 | $ | 1,153 | $ | 1,060 | ||||||
|
|
|
|
|
|
|
|||||||
| Key components of operating earnings are: |
||||||||||||
| REVENUES |
||||||||||||
| Policy charges, fee income and premiums |
$ | 2,156 | $ | 2,014 | $ | 1,968 | ||||||
| Net investment income |
736 | 617 | 627 | |||||||||
| Investment gains (losses), net including derivative gains (losses) |
725 | 400 | (129 | ) | ||||||||
| Investment Management, service fees and other income |
739 | 700 | 738 | |||||||||
|
|
|
|
|
|
|
|||||||
| Segment revenues |
$ | 4,356 | $ | 3,731 | $ | 3,204 | ||||||
|
|
|
|
|
|
|
|||||||
| BENEFITS AND OTHER DEDUCTIONS |
||||||||||||
| Policyholders’ benefits |
$ | 1,563 | $ | 1,021 | $ | 656 | ||||||
| Interest credited to policyholders’ account balances |
214 | 221 | 227 | |||||||||
| Commissions and distribution related payments |
609 | 611 | 617 | |||||||||
| Amortization of deferred policy acquisition costs, net |
(302 | ) | (280 | ) | (292 | ) | ||||||
| Compensation, benefits, interest expense and other operating costs and expenses |
523 | 552 | 559 | |||||||||
|
|
|
|
|
|
|
|||||||
| Segment benefits and other deductions |
$ | 2,607 | $ | 2,125 | $ | 1,767 | ||||||
|
|
|
|
|
|
|
|||||||
The following table summarizes AV for our Individual Retirement segment as of the dates indicated:
| As of December 31, | ||||||||||||
| 2017 | 2016 | 2015 | ||||||||||
| (in millions) | ||||||||||||
| AV |
||||||||||||
| General Account |
$ | 19,059 | $ | 15,384 | $ | 12,187 | ||||||
| Separate Accounts |
84,364 | 78,220 | 76,170 | |||||||||
|
|
|
|
|
|
|
|||||||
| Total AV |
$ | 103,423 | $ | 93,604 | $ | 88,357 | ||||||
|
|
|
|
|
|
|
|||||||
The following table summarizes a roll forward of AV for our Individual Retirement segment for the periods indicated:
| Years Ended December 31, | ||||||||||||
| 2017 | 2016 | 2015 | ||||||||||
| (in millions) | ||||||||||||
| Balance as of beginning of period |
$ | 93,604 | $ | 88,357 | $ | 90,018 | ||||||
| Gross premiums |
7,786 | 7,960 | 7,460 | |||||||||
| Surrenders, withdrawals and benefits |
(7,854 | ) | (6,780 | ) | (6,354 | ) | ||||||
|
|
|
|
|
|
|
|||||||
| Net flows |
(68 | ) | 1,180 | 1,106 | ||||||||
| Investment performance, interest credited and policy charges |
9,887 | 4,067 | (2,767 | ) | ||||||||
|
|
|
|
|
|
|
|||||||
| Balance as of end of period |
$ | 103,423 | $ | 93,604 | $ | 88,357 | ||||||
|
|
|
|
|
|
|
|||||||
118
Table of Contents
Year Ended December 31, 2017 Compared to the Year Ended December 31, 2016 for the Individual Retirement Segment
Operating earnings
Operating earnings increased $134 million to $1.3 billion in 2017 from $1.2 billion in 2016 primarily attributable to the following:
| • | Increase in Policy charges, fee income and premiums and investment management fees of $176 million due to higher AV from higher equity market performance in 2017 and higher premium income from payout annuities. |
| • | Increase in Net investment income, consisting primarily of an $84 million increase related to equity method investments and higher assets. |
| • | Decrease in DAC amortization, net of $43 million due primarily to an update of our lapse and withdrawal assumptions for our variable annuity products with GMxB features in 2017. |
| • | Increase of $40 million in operating earnings due to higher SCS AV driven by higher gross premiums. |
| • | Decrease in operating expenses of $29 million due to company-wide efficiency actions. |
The increase was partially offset by:
| • | Net decrease of $233 million in operating earnings, consisting of a $536 million increase in GMxB Policyholders’ benefits partially offset by a $303 million increase in GMxB derivative gains. 2016 Policyholders’ benefits were below normal levels due to (i) an assumption update on our in-force block related to buyout offers that reduced future benefits and (ii) favorable withdrawal activity relative to expectations that did not recur in 2016. |
| • | Increase in income tax expense of $7 million due to higher pre-tax operating earnings. |
Net Flows and AV
| • | Net flows were $(68) million, a $1,248 million decrease in 2017, driven by a $1,074 million increase in surrenders, withdrawals and benefits mainly coming from our fixed-rate GMxB business, and a $174 million decrease in gross premiums mainly due to the DOL Rule’s impact on sales by certain third party firms. |
| • | Increase in AV of $9.8 billion year-over-year driven primarily by equity market performance. |
Year Ended December 31, 2016 Compared to the Year Ended December 31, 2015 for the Individual Retirement Segment
Operating earnings
Operating earnings increased $93 million in 2016 from $1.1 billion in 2015 primarily attributable to a net increase of $164 million as net derivative gains of $529 million more than offset the increase in Policyholders’ benefits of $365 million. In 2016, Policyholders’ benefits were positively impacted by $222 million due to assumption changes made on our in-force block from buyout offers. The increase was partially offset by an increase in income tax expense of $76 million due to an increase in pre-tax operating earnings.
Net Flows and AV
| • | Net flows of $1.2 billion during 2016 were $74 million higher than the net flows of $1.1 billion during 2015 due mostly to a $500 million increase in gross premiums, offset by an increase of $426 million in surrenders, benefits and other charges. |
119
Table of Contents
| • | Increase in AV of $5.2 billion during 2016 was $6.9 billion higher than the $1.7 billion decrease in AV during 2015 driven by an increase in interest credited and investment performance of $6.9 billion to $5.2 billion for 2016 from $(1.7) billion for 2015. |
Group Retirement
The Group Retirement segment offers tax-deferred investment and retirement plans sponsored by educational entities, municipalities and not-for-profit entities as well as small and medium-sized businesses.
The following table summarizes operating earnings of our Group Retirement segment for the periods presented:
| Years Ended December 31, | ||||||||||||
| 2017 | 2016 | 2015 | ||||||||||
| (in millions) | ||||||||||||
| Operating earnings |
$ | 283 | $ | 167 | $ | 167 | ||||||
|
|
|
|
|
|
|
|||||||
| Key components of operating earnings are: |
||||||||||||
| REVENUES |
||||||||||||
| Policy charges, fee income and premiums |
$ | 248 | $ | 217 | $ | 220 | ||||||
| Net investment income |
528 | 444 | 421 | |||||||||
| Investment gains (losses), net including derivative gains (losses) |
(3 | ) | (10 | ) | 3 | |||||||
| Investment Management, service fees and other income |
174 | 150 | 150 | |||||||||
|
|
|
|
|
|
|
|||||||
| Segment revenues |
$ | 947 | $ | 801 | $ | 794 | ||||||
|
|
|
|
|
|
|
|||||||
| BENEFITS AND OTHER DEDUCTIONS |
||||||||||||
| Policyholders’ benefits |
— | $ | 1 | — | ||||||||
| Interest credited to policyholders’ account balances |
284 | 271 | 261 | |||||||||
| Commissions and distribution related payments |
93 | 88 | 83 | |||||||||
| Amortization of deferred policy acquisition costs, net |
(63 | ) | (33 | ) | (28 | ) | ||||||
| Compensation, benefits, interest expense and other operating costs and expenses |
261 | 261 | 265 | |||||||||
|
|
|
|
|
|
|
|||||||
| Segment benefits and other deductions |
$ | 575 | $ | 588 | $ | 581 | ||||||
|
|
|
|
|
|
|
|||||||
The following tables summarize AV for our Group Retirement segment as of the dates indicated:
| As of December 31, | ||||||||||||
| 2017 | 2016 | 2015 | ||||||||||
| AV |
(in millions) | |||||||||||
| General Account |
$ | 11,319 | $ | 10,999 | $ | 10,232 | ||||||
| Separate Accounts |
22,587 | 19,139 | 17,525 | |||||||||
|
|
|
|
|
|
|
|||||||
| Total AV |
$ | 33,906 | $ | 30,138 | $ | 27,757 | ||||||
|
|
|
|
|
|
|
|||||||
120
Table of Contents
The following table summarizes a roll-forward of AV for our Group Retirement segment for the periods indicated:
| Years Ended December 31, | ||||||||||||
| 2017 | 2016 | 2015 | ||||||||||
| (in millions) |
||||||||||||
| Balance as of beginning of period |
$ | 30,138 | $ | 27,757 | $ | 27,607 | ||||||
| Gross premiums |
3,205 | 3,137 | 2,858 | |||||||||
| Surrenders, withdrawals and benefits |
(2,938 | ) | (2,458 | ) | (2,507 | ) | ||||||
|
|
|
|
|
|
|
|||||||
| Net flows |
267 | 679 | 351 | |||||||||
| Investment performance, interest credited and policy charges |
3,501 | 1,702 | (201 | ) | ||||||||
|
|
|
|
|
|
|
|||||||
| Balance as of end of period |
$ | 33,906 | $ | 30,138 | $ | 27,757 | ||||||
|
|
|
|
|
|
|
|||||||
Year Ended December 31, 2017 Compared to the Year Ended December 31, 2016 for the Group Retirement Segment
Operating earnings
Operating earnings increased by $116 million to $283 million in 2017 from $167 million in 2016.
The increase is primarily attributable to the following:
| • | Higher fee income from policy charges and investment management of $57 million due to positive net flows of $267 million and equity market performance in 2017. |
| • | Increase in Net investment income of $84 million due to higher income from equity method investments and higher assets. |
| • | Decrease of $30 million in DAC amortization, net due to the adjustment of our assumptions for DAC amortization, lengthening the amortization period due to higher persistency. |
This increase was partially offset by the following:
| • | Higher Interest credited to policyholder account balances of $13 million due to higher average general account AV. |
| • | Higher taxes of $41 million driven by higher pre-tax operating income. |
Net Flows and AV
| • | Net flows were $267 million, a $412 million decrease in 2017 from 2016, driven primarily by a $480 million increase in surrenders, withdrawals and benefits, partially offset by a $68 million increase in gross premiums in the 403(b) market through AXA Advisors’ distribution network. |
| • | Increase in AV of $3.8 billion year-over-year driven primarily by equity market performance. |
Year Ended December 31, 2016 Compared to the Year Ended December 31, 2015 for the Group Retirement Segment
Operating earnings
Operating earnings remain unchanged at $167 million in 2016 from 2015 primarily attributable to the following offsetting increases and decreases:
| • | Higher Net investment income of $23 million due to higher asset balances partially offset by lower income from equity method investments. |
121
Table of Contents
| • | Reduction in other operating expenses of $8 million reflecting operating efficiency. |
| • | Higher derivative losses of $13 million driven by separate account hedge losses from higher equity markets after the first quarter of 2016. |
| • | Higher Interest credited of $10 million due to an increase in our average General Account AV. |
| • | Despite higher average AV in 2016, the market downturn in the first quarter of 2016 resulted in a decline in fees relative to 2015. |
Net Flows and AV
| • | Net flows of $679 million during 2016 were $328 million higher than the net flows of $351 million during 2015, primarily driven by higher sales and strong in-force management. |
| • | Increase of $2.4 billion in AV during 2016 was $2.2 billion higher than the $150 million increase during 2015, primarily driven by strong investment performance. |
Investment Management and Research
The Investment Management and Research segment provides diversified investment management, research and related services to a broad range of clients around the world. Operating earnings (loss) presented here represents our current economic interest, net of tax, in AB of approximately 47%. Giving effect to the Reorganization Transactions, our economic interest in AB will increase to approximately 65%.
The following table summarizes operating earnings of our Investment Management and Research segment for the periods presented:
| Years Ended December 31, | ||||||||||||
| 2017 | 2016 | 2015 | ||||||||||
| (in millions) | ||||||||||||
| Operating earnings |
$ | 211 | $ | 161 | $ | 173 | ||||||
|
|
|
|
|
|
|
|||||||
| Key components of operating earnings are: |
||||||||||||
| REVENUES |
||||||||||||
| Policy charges, fee income and premiums |
— | — | — | |||||||||
| Net investment income |
$ | 60 | $ | 52 | $ | 13 | ||||||
| Investment gains (losses), net including derivative gains (losses) |
(24 | ) | (16 | ) | 15 | |||||||
| Investment Management, service fees and other income |
3,180 | 2,897 | 2,996 | |||||||||
|
|
|
|
|
|
|
|||||||
| Segment revenues |
$ | 3,216 | $ | 2,933 | $ | 3,024 | ||||||
|
|
|
|
|
|
|
|||||||
| BENEFITS AND OTHER DEDUCTIONS |
||||||||||||
| Policyholders’ benefits |
— | — | — | |||||||||
| Interest credited to policyholders’ account balances |
— | — | — | |||||||||
| Commissions and distribution related payments |
$ | 415 | $ | 372 | $ | 394 | ||||||
| Amortization of deferred policy acquisition costs, net |
— | — | — | |||||||||
| Compensation, benefits, interest expense and other operating costs and expenses |
2,042 | 1,936 | 2,006 | |||||||||
|
|
|
|
|
|
|
|||||||
| Segment benefits and other deductions |
$ | 2,457 | $ | 2,308 | $ | 2,400 | ||||||
|
|
|
|
|
|
|
|||||||
122
Table of Contents
Changes in AUM in the Investment Management and Research segment for the periods presented were as follows:
| Years Ended December 31 | ||||||||||||
| 2017 | 2016 | 2015 | ||||||||||
| (in billions) | ||||||||||||
| Balance as of beginning of period |
$ | 480.2 | $ | 467.4 | $ | 474.0 | ||||||
| Long-term flows: |
||||||||||||
| Sales/new accounts |
78.7 | 73.0 | 75.4 | |||||||||
| Redemptions/terminations |
(60.7 | ) | (65.8 | ) | (61.4 | ) | ||||||
| Cash flow/unreinvested dividends |
(4.8 | ) | (17.0 | ) | (10.8 | ) | ||||||
|
|
|
|
|
|
|
|||||||
| Net long-term (outflows) inflows |
13.2 | (9.8 | ) | 3.2 | ||||||||
| Acquisition |
— | 2.5 | — | |||||||||
| AUM adjustment(1) |
— | (3.0 | ) | — | ||||||||
| Market appreciation (depreciation) |
61.1 | 23.1 | (9.8 | ) | ||||||||
|
|
|
|
|
|
|
|||||||
| Net change |
74.3 | 12.8 | (6.6 | ) | ||||||||
|
|
|
|
|
|
|
|||||||
| Balance as of end of period |
$ | 554.5 | $ | 480.2 | $ | 467.4 | ||||||
|
|
|
|
|
|
|
|||||||
| (1) | During the second quarter of 2016, we removed $3.0 billion of Customized Retirement Solutions assets from AUM as our investment management services transitioned to consulting services. In addition, we previously made minor adjustments to reported AUM for reporting methodology changes that do not represent inflows or outflows. |
Average AUM in the Investment Management and Research segment for the periods presented by distribution channel and investment services were as follows:
| Years Ended December 31, | ||||||||||||
| 2017 | 2016 | 2015 | ||||||||||
| (in billions) | ||||||||||||
| Distribution Channel |
||||||||||||
| Institutions |
$ | 253.8 | $ | 243.4 | $ | 242.9 | ||||||
| Retail |
177.5 | 157.7 | 160.6 | |||||||||
| Private Wealth Management |
86.7 | 78.9 | 77.2 | |||||||||
|
|
|
|
|
|
|
|||||||
| Total |
$ | 518.0 | $ | 480.0 | $ | 480.7 | ||||||
|
|
|
|
|
|
|
|||||||
| Investment Service |
||||||||||||
| Equity Actively Managed |
$ | 125.6 | $ | 109.4 | $ | 113.2 | ||||||
| Equity Passively Managed(1) |
50.8 | 46.5 | 49.3 | |||||||||
| Fixed Income Actively |
||||||||||||
| Managed—Taxable |
236.3 | 221.5 | 217.7 | |||||||||
| Fixed Income Actively |
||||||||||||
| Managed—Tax-exempt |
38.8 | 36.3 | 32.6 | |||||||||
| Fixed Income Passively |
||||||||||||
| Managed(1) |
10.3 | 11.0 | 10.1 | |||||||||
| Other(2) |
56.2 | 55.3 | 57.8 | |||||||||
|
|
|
|
|
|
|
|||||||
| Total |
$ | 518.0 | $ | 480.0 | $ | 480.7 | ||||||
|
|
|
|
|
|
|
|||||||
| (1) | Includes index and enhanced index services. |
| (2) | Includes multi-asset solutions and services, and certain alternative investments. |
123
Table of Contents
Year Ended December 31, 2017 Compared to the Year Ended December 31, 2016 for the Investment Management and Research Segment
Operating earnings
Operating earnings increased $50 million in 2017 to $211 million from $161 million in 2016 primarily attributable to the following:
| • | Increase in investment management service fees and other income of $283 million primarily due to higher base fees of $205 million resulting from increases in Retail, Institutions and Private Wealth Management base fees due to a 7.9% increase in average AUM and the impact of a shift in distribution channel mix from Institutions to Retail and Private Wealth Management, which generally have higher fees. Performance fees increased by $62 million. |
| • | Increase in investment advisory fees was partially offset by a decrease in Bernstein Research Services revenues of $30 million primarily due to a decline in our clients’ trading activity in the United States and a volume mix shift to electronic trading in Europe, partially offset by increased client activity in Asia. |
This increase in operating earnings was partially offset by an increase in total segment benefits and other deductions of $149 million due to:
| • | Higher compensation and benefit expenses of $74 million, primarily attributable to higher incentive compensation of $68 million and higher base compensation of $5 million, which resulted from higher severance and higher commissions of $5 million. |
| • | Higher distribution plan payments of $43 million. |
| • | Higher other operating costs and expenses of $41 million. The increase is primarily due to a vendor termination payment of $20 million and higher expenses related to consolidated company-sponsored investment funds. |
| • | Increase in income tax expense of $15 million due to an increase in pre-tax operating earnings. |
Long-Term Net Flows and AUM
| • | Total AUM as of December 31, 2017 was $554.5 billion, up $74.3 billion, or 15.5%, during 2017. The increase was driven by market appreciation of $61.1 billion and net flows of $13.2 billion (primarily due to Retail and Institutional inflows of $8.9 billion and $3.6 billion, respectively). |
Year Ended December 31, 2016 Compared to the Year Ended December 31, 2015 for the Investment Management and Research Segment
Operating earnings
Operating earnings decreased $12 million to $161 million in 2016 from $173 million in 2015 primarily attributable to the following:
| • | Decrease in investment advisory and services base fees of $99 million primarily due to a decrease in Retail and Institutions base fees due to a shift in product mix to services generating lower fees and lower Retail average AUM in 2016, as compared to 2015. This was partially offset by an increase in Private Wealth Management base fees. |
| • | Decrease in Bernstein Research Services revenues of $14 million due to lower market values and volumes in Europe and Asia and the discontinuation of Equity Capital Market Services. |
| • | Increase in net distribution costs of $22 million, driven by a larger decrease in distribution revenue than the corresponding decrease in distribution plan payments and amortization of deferred sales commissions. |
| • | Higher income taxes of $11 million due to higher taxes on foreign earnings. |
124
Table of Contents
This decrease was partially offset by the following:
| • | Decrease in compensation and benefit expenses of $45 million, primarily attributable to lower incentive compensation of $34 million. In addition, there was a decrease in commissions and fringe benefits and other costs of $19 million, partially offset by an increase in base compensation of $10 million, reflecting higher severance costs. |
| • | Lower marketing, travel and entertainment and other expenses of $15 million. |
| • | Higher performance fees of $9 million, with an increase in Private Client performance fees and Institutions performance fees partially offset by lower Retail performance fees. |
Long-Term Net Flows and AUM
| • | Total AUM as of December 31, 2016 were $480.2 billion, up $12.8 billion, or 2.7%, during 2016. The increase was driven by market appreciation of $23.1 billion, offset by net outflows of $9.8 billion, reflecting Institutional outflows of $5.4 billion and Retail outflows of $4.8 billion, partially offset by Private Wealth Management inflows of $0.4 billion. |
Protection Solutions
The Protection Solutions segment includes our life insurance and employee benefits businesses. We provide a targeted range of products aimed at serving the financial needs of our clients throughout their lives, including VUL, IUL and term life products. In 2015, we entered the employee benefits market and currently offer a suite of dental, vision, life, as well as short- and long-term disability insurance products to small and medium-sized businesses.
Our Protection Solutions segment was impacted during the period by several discrete items, including actuarial assumption updates and model changes, a maintenance expense assumption update, a mortality table update and loss recognition testing. In recent years, we have refocused our product offering and distribution towards less capital intensive, higher return accumulation and protection products. Excluding the non-recurring items noted above, we plan to improve our operating earnings over time through earnings generated from sales of our repositioned product portfolio and by proactively managing and optimizing our in-force book.
125
Table of Contents
The following table summarizes operating earnings (loss) of our Protection Solutions segment for the periods presented:
| Years Ended December 31, | ||||||||||||
| 2017 | 2016 | 2015 | ||||||||||
| (in millions) | ||||||||||||
| Operating earnings |
$ | 536 | $ | 79 | $ | 113 | ||||||
|
|
|
|
|
|
|
|||||||
| Key components of operating earnings are: |
||||||||||||
| REVENUES |
||||||||||||
| Policy charges, fee income and premiums |
$ | 1,995 | $ | 2,156 | $ | 2,025 | ||||||
| Net investment income |
850 | 761 | 740 | |||||||||
| Investment gains (losses), net including derivative gains (losses) |
(11 | ) | (3 | ) | (2 | ) | ||||||
| Investment Management, service fees and other income |
212 | 210 | 209 | |||||||||
|
|
|
|
|
|
|
|||||||
| Segment revenues |
$ | 3,046 | $ | 3,124 | $ | 2,972 | ||||||
|
|
|
|
|
|
|
|||||||
| BENEFITS AND OTHER DEDUCTIONS |
||||||||||||
| Policyholders’ benefits |
$ | 956 | $ | 1,455 | $ | 1,591 | ||||||
| Interest credited to policyholders’ account balances |
455 | 479 | 453 | |||||||||
| Commissions and distribution related payments |
274 | 285 | 315 | |||||||||
| Amortization of deferred policy acquisition costs, net |
128 | 363 | (5 | ) | ||||||||
| Compensation, benefits, interest expense and other operating costs and expenses |
443 | 444 | 472 | |||||||||
|
|
|
|
|
|
|
|||||||
| Segment benefits and other deductions |
$ | 2,256 | $ | 3,026 | $ | 2,826 | ||||||
|
|
|
|
|
|
|
|||||||
The following table summarizes Protection Solutions Reserves for our Protection Solutions segment for the periods indicated:
| Years Ended December 31, | ||||||||||||
| 2017 | 2016 | 2015 | ||||||||||
| (in millions) | ||||||||||||
| Protection Solutions Reserves(1) |
||||||||||||
| General Account |
$ | 16,007 | $ | 16,420 | $ | 16,014 | ||||||
| Separate Accounts |
12,643 | 11,251 | 10,907 | |||||||||
|
|
|
|
|
|
|
|||||||
| Total |
$ | 28,650 | $ | 27,671 | $ | 26,921 | ||||||
|
|
|
|
|
|
|
|||||||
| (1) | Does not include Protection Solutions Reserves for our employee benefits business as it is a start-up business and therefore has immaterial in-force policies. |
126
Table of Contents
The following table presents our in-force face amounts for the periods indicated, respectively, for our individual life insurance products:
| Years Ended December 31, | ||||||||||||
| 2017 | 2016 | 2015 | ||||||||||
| (in billions) | ||||||||||||
| In-force face amount by product(1) |
||||||||||||
| Universal Life(2) |
$ | 59.0 | $ | 61.7 | $ | 64.0 | ||||||
| Indexed Universal Life |
|
20.5 |
|
18.4 | 16.6 | |||||||
| Variable Universal Life(3) |
|
128.9 |
|
130.3 | 132.7 | |||||||
| Term |
|
235.9 |
|
237.0 | 238.9 | |||||||
| Whole Life |
|
1.6 |
|
1.7 | 1.8 | |||||||
|
|
|
|
|
|
|
|||||||
| Total in-force face amount |
$ | 445.9 | $ | 449.1 | $ | 454.0 | ||||||
|
|
|
|
|
|
|
|||||||
| (1) | Includes individual life insurance and does not include employee benefits as it is a start-up business and therefore has immaterial in-force policies. |
| (2) | Universal Life includes Guaranteed Universal Life. |
| (3) | Variable Universal Life includes VL and COLI. |
Year Ended December 31, 2017 Compared to the Year Ended December 31, 2016 for the Protection Solutions Segment
Operating earnings
Operating earnings increased $457 million in 2017 to $536 million from $79 million in 2016 primarily attributable to the following:
| • | Decrease of $499 million in Policyholders’ benefits mainly driven by a $700 million positive impact in 2017 from assumption updates and model changes (compared to $117 million in 2016) and $27 million from other routine updates, partially offset by $187 million increase in net death claims. 2017 included the full reserve release of $677 million following assumption updates and model changes in the fourth quarter of 2017, $92 million from a change in premium funding assumptions, partially offset by $70 million from a mortality table update. 2016 was mainly driven by $106 million change in premium funding assumptions. |
| • | Decrease of $235 million in Amortization of DAC, net as a result of a decrease of $228 million in amortization of DAC before capitalization. This decrease was mainly due the impact of model changes and assumptions updates for $224 million (a $23 million decrease in 2017 compared to a $201 million increase in 2016). In 2017, the $23 million decrease included (i) $204 million positive impact from a mortality table update, (ii) $54 million decrease from a maintenance expense assumption update to reflect actual experience, partially offset by (iii) a $192 million DAC write-off related to our loss recognition testing of certain permanent life products due to low interest rates, and (iv) $61 million from the update of General Account spread and yield assumption. In 2016, the $201 million increase included (i) $182 million from lower interest rates, and (ii) $28 million from an update in premium funding assumptions. |
| • | Increase in Net investment income of $89 million due to higher income on equity method investments and higher asset balances. |
127
Table of Contents
This increase was partially offset by the following:
| • | Decrease in policy charges, fee income and premiums of $161 million mainly driven by a decrease of $69 million due to a change in the mortality table and $54 million primarily due to model updates, compared to positive impact of model updates in 2016, $30 million lower premiums primarily due to lower term sales and renewals, and an adverse impact to fee income of $17 million reflecting maintenance expense assumption update. |
| • | Increase in income tax expense of $234 million due to an increase in pre-tax operating earnings. |
Year Ended December 31, 2016 Compared to the Year Ended December 31, 2015 for the Protection Solutions Segment
Operating earnings
Operating earnings decreased $34 million to $79 million in 2016 from $113 million in 2015 primarily attributable to the following:
| • | Increase of $368 million in Amortization of DAC, net primarily reflected a $334 million increase in amortization of DAC before capitalization. This increase was mainly due to the impact of model changes and assumptions updates for $300 million ($201 million increase in 2016 compared to a $99 million decrease in 2015), and an increase of $34 million mainly due to $77 million from other routine model updates to reflect actual experience such as the update of the cost of the cap and floor of our equity indexed universal life products. In 2016, assumption updates and model changes increased amortization of DAC by $201 million reflecting $182 million from lower interest rates and $28 million from premium funding assumptions, compared to a decrease of $99 million in 2015 mainly due to an update in RTM assumptions. |
This decrease was partially offset by the following:
| • | Increase of $131 million in Policy charges, fee income and premiums mainly due to an increase of $69 million due to several assumption updates and model changes, $79 million higher cost of insurance charges on certain universal life policies and other policy fees, partially offset by $17 million decrease in premiums mainly due to term products. |
| • | Decrease of $136 million in Policyholders’ benefits mainly due $114 million positive impact of several assumption updates and model changes. |
| • | Increase of $21 million in net investment income due to higher asset balances, partially offset by lower income on equity method investments. |
| • | Decrease of $28 million in operating expenses primarily due to efficiency efforts. |
| • | Decrease in income tax expense of $14 million due to lower pre-tax operating earnings. |
Corporate and Other
Corporate and Other includes certain of our financing and investment expenses. It also includes: AXA Advisors broker-dealer business, the Closed Block, run-off variable annuity reinsurance business, run-off group pension business, run-off health business, benefit plans for our employees, certain strategic investments and certain unallocated items, including capital and related investments, interest expense and corporate expense. AB’s results of operations are reflected in the Investment Management and Research segment. Accordingly, Corporate and Other does not include any items applicable to AB.
128
Table of Contents
The following table summarizes operating earnings (loss) of Corporate and Other for the periods presented:
| Years Ended December 31 | ||||||||||||
| 2017 | 2016 | 2015 | ||||||||||
| (in millions) | ||||||||||||
| Operating earnings (loss) |
$ | (196 | ) | $ | (184 | ) | $ | (141 | ) | |||
General Account Investment Assets Portfolio
The GAIA portfolio and investment results support the insurance and annuity liabilities of our Individual Retirement, Group Retirement and Protection Solutions businesses. Our GAIA portfolio investment strategy seeks to achieve sustainable risk-adjusted returns by focusing on principal preservation, investment return, duration and liquidity requirements by product class and the diversification of risks. Investment activities are undertaken according to investment policy statements that contain internally established guidelines and are required to comply with applicable laws and insurance regulations. Risk tolerances are established for credit risk, market risk, liquidity risk and concentration risk across types of issuers and asset classes that seek to mitigate the impact of cash flow variability arising from these risks.
The GAIA portfolio consists largely of investment grade fixed maturities and short-term investments, commercial and agricultural mortgage loans, below investment grade fixed maturities, alternative investments and other instruments. Fixed maturities include publicly issued corporate bonds, government bonds, privately placed notes and bonds, bonds issued by states and municipalities, mortgage-backed securities and asset-backed securities.
As part of our asset and liability management strategies, we maintain a weighted average duration for our GAIA portfolio that is within an acceptable range of the estimated duration of our liabilities given our risk appetite and hedging programs. The GAIA portfolio includes credit derivatives to replicate exposure to individual securities or pools of securities as a means of achieving credit exposure similar to bonds of the underlying issuer(s) more efficiently. In addition, from time to time we use derivatives for hedging purposes to reduce our exposure to equity markets, interest rates and credit spreads.
Investment portfolios are primarily managed by legal entity with dedicated portfolios for certain blocks of business. For portfolios that back multiple product groups, investment results are allocated to business segments.
129
Table of Contents
The following tables reconcile the consolidated balance sheet asset and liability amounts to GAIA.
General Account Investment Assets
December 31, 2017
| Balance Sheet Captions: |
GAIA | Other(1) | Balance Sheet Total |
|||||||||
| (in millions) | ||||||||||||
| Fixed maturities, available for sale, at fair value |
$ | 45,751 | $ | 1,190 | $ | 46,941 | ||||||
| Mortgage loans on real estate |
10,952 | — | 10,952 | |||||||||
| Policy loans |
3,819 | — | 3,819 | |||||||||
| Real Estate held for the production of income |
390 | — | 390 | |||||||||
| Other equity investments |
1,264 | 128 | 1,392 | |||||||||
| Other invested assets |
25 | 4,093 | 4,118 | |||||||||
|
|
|
|
|
|
|
|||||||
| Subtotal investment assets |
$ | 62,201 | $ | 5,411 | $ | 67,612 | ||||||
| Trading securities |
12,050 | (2) | 2,120 | 14,170 | ||||||||
|
|
|
|
|
|
|
|||||||
| Total investments |
$ | 74,251 | $ | 7,531 | $ | 81,782 | ||||||
| Cash and cash equivalents |
4,539 | 275 | 4,814 | |||||||||
| Repurchase and funding agreements(3) |
(4,382 | ) | — | (4,382 | ) | |||||||
|
|
|
|
|
|
|
|||||||
| Total |
$ | 74,408 | $ | 7,806 | $ | 82,214 | ||||||
|
|
|
|
|
|
|
|||||||
| (1) | Assets listed in the “Other” category principally consist of our loans to affiliates and other miscellaneous assets or liabilities related to GAIA that are reclassified from various balance sheet lines held in portfolios other than the General Account and which are not managed as part of GAIA, including: (i) related accrued income or expense, (ii) certain reclassifications and intercompany adjustments, (iii) certain trading securities that are associated with hedging programs for variable annuity products with guarantee features, (iv) assets and income of AB and (v) for fixed maturities, the reversal of net unrealized gains (losses). The “Other” category is deducted in arriving at GAIA. |
| (2) | Primarily related to SCS and consists of corporate bonds (83%), U.S. Treasury securities (8%), other government securities (8%) and other trading securities (1%). |
| (3) | Includes Securities purchased under agreements to resell, Securities sold under agreements to repurchase and Federal Home Loan Bank funding agreements which are reported in policyholders’ account balances. |
130
Table of Contents
General Account Investment Assets
December 31, 2016
| Balance Sheet Captions: |
GAIA | Other(1) | Balance Sheet Total |
|||||||||
| (in millions) | ||||||||||||
| Fixed maturities, available for sale, at fair value |
$ | 42,302 | $ | (423 | ) | $ | 41,879 | |||||
| Mortgage loans on real estate |
9,729 | 45 | 9,774 | |||||||||
| Policy Loans |
3,823 | 32 | 3,855 | |||||||||
| Real estate held for the production of Income |
56 | — | 56 | |||||||||
| Other equity investments |
1,236 | 109 | 1,345 | |||||||||
| Other invested assets |
34 | 3,290 | 3,324 | |||||||||
|
|
|
|
|
|
|
|||||||
| Subtotal Investment Assets |
57,180 | 3,053 | 60,233 | |||||||||
| Trading securities |
8,671 | (2) | 3,414 | 12,085 | ||||||||
|
|
|
|
|
|
|
|||||||
| Total investments |
65,851 | 6,467 | 72,318 | |||||||||
| Cash and cash equivalents |
4,679 | 975 | 5,654 | |||||||||
| Repurchase and funding agreements(3) |
(3,730 | ) | — | (3,730 | ) | |||||||
|
|
|
|
|
|
|
|||||||
| Total |
$ | 66,800 | $ | 7,442 | $ | 74,242 | ||||||
|
|
|
|
|
|
|
|||||||
| (1) | Assets listed in the “Other” category principally consist of our loans to affiliates and other miscellaneous assets or liabilities related to GAIA that are reclassified from various balance sheet lines held in portfolios other than the General Account and which are not managed as part of GAIA, including: (i) related accrued income or expense, (ii) certain reclassifications and intercompany adjustments, (iii) certain trading securities that are associated with hedging programs for variable annuity products with guarantee features, (iv) assets and income of AB and (v) for fixed maturities, the reversal of net unrealized gains (losses). The “Other” category is deducted in arriving at GAIA. |
| (2) | Primarily related to SCS and consists of corporate bonds (70%), U.S. Treasury securities (20%), other government securities (6%) and other trading securities (3%). |
| (3) | Includes Securities purchased under agreements to resell, Securities sold under agreements to repurchase and federal name Loan Bank funding agreements which are reported in policyholders’ account balances. |
131
Table of Contents
Investment Results of General Account Investment Assets
The following table summarizes investment results by asset category for the periods indicated.
| Years Ended December 31, | ||||||||||||||||||||||||
| 2017 | 2016 | 2015 | ||||||||||||||||||||||
| Yield | Amount | Yield | Amount | Yield | Amount | |||||||||||||||||||
| (Dollars in millions) |
||||||||||||||||||||||||
| Fixed Maturities(1): |
||||||||||||||||||||||||
| Investment grade |
||||||||||||||||||||||||
| Income (loss) |
3.64 | % | $ | 1,515 | 4.06 | % | $ | 1,655 | 3.99 | % | $ | 1,548 | ||||||||||||
| Ending assets |
44,384 | 40,661 | 38,454 | |||||||||||||||||||||
| Below investment grade |
||||||||||||||||||||||||
| Income |
7.23 | % | 113 | 7.17 | % | 115 | 7.43 | % | 116 | |||||||||||||||
| Ending assets |
1,367 | 1,641 | 1,389 | |||||||||||||||||||||
| Mortgages: |
||||||||||||||||||||||||
| Income (loss) |
4.38 | % | 454 | 5.52 | % | 463 | 5.05 | % | 354 | |||||||||||||||
| Ending assets |
10,952 | 9,729 | 7,478 | |||||||||||||||||||||
| Real Estate Held For the Production of Income: |
||||||||||||||||||||||||
| Income (loss) |
1.30 | % | 2 | — | % | — | — | % | — | |||||||||||||||
| Ending assets |
390 | 56 | — | |||||||||||||||||||||
| Other Equity Investments:(2) |
||||||||||||||||||||||||
| Income (loss) |
14.37 | % | 169 | 4.98 | % | 62 | 5.59 | % | 74 | |||||||||||||||
| Ending assets |
1,289 | 1,270 | 1,272 | |||||||||||||||||||||
| Policy Loans: |
||||||||||||||||||||||||
| Income |
5.77 | % | 221 | 5.90 | % | 225 | 5.95 | % | 228 | |||||||||||||||
| Ending assets |
3,819 | 3,823 | 3,853 | |||||||||||||||||||||
| Cash and Short-term Investments: |
||||||||||||||||||||||||
| Income |
0.65 | % | 32 | 0.41 | % | 22 | 0.07 | % | 4 | |||||||||||||||
| Ending assets |
4,539 | 4,679 | 5,867 | |||||||||||||||||||||
| Repurchase and funding agreements: |
||||||||||||||||||||||||
| Interest expense and other |
(21 | ) | (13 | ) | (7 | ) | ||||||||||||||||||
| Ending assets (liabilities) |
(4,382 | ) | (3,730 | ) | (1,810 | ) | ||||||||||||||||||
| Total Invested Assets: |
||||||||||||||||||||||||
|
|
|
|
|
|
|
|||||||||||||||||||
| Income |
4.18 | % | 2,485 | 4.35 | % | 2,529 | 4.15 | % | 2,317 | |||||||||||||||
| Ending Assets |
62,358 | 58,129 | 56,503 | |||||||||||||||||||||
| Trading Securities: |
||||||||||||||||||||||||
| Income |
2.19 | % | $ | 231 | 0.77 | % | 57 | 0.84 | % | 46 | ||||||||||||||
| Ending assets |
12,050 | 8,671 | 6,375 | |||||||||||||||||||||
| Total: |
||||||||||||||||||||||||
|
|
|
|
|
|
|
|||||||||||||||||||
| Investment income |
3.88 | % | $ | 2,716 | 3.95 | % | 2,586 | 3.85 | % | 2,363 | ||||||||||||||
| Less: investment fees |
(0.10 | )% | (68 | ) | (.09 | )% | (62 | ) | (0.09 | )% | (57 | ) | ||||||||||||
|
|
|
|
|
|
|
|||||||||||||||||||
| Investment Income, Net |
3.78 | % | 2,648 | 3.86 | % | $ | 2,524 | 3.76 | % | $ | 2,306 | |||||||||||||
|
|
|
|
|
|
|
|||||||||||||||||||
| Ending Net Assets |
$74,408 | $ | 66,800 | $ | 62,878 | |||||||||||||||||||
|
|
|
|
|
|
|
|||||||||||||||||||
| (1) | Fixed Maturities Investment Grade and Below Investment Grade are based on Moody’s Equivalent ratings. |
| (2) | Includes, as of December 31, 2017, 2016 and 2015, respectively, $25 million, $34 million, and $0 million of other invested assets. |
132
Table of Contents
Fixed Maturities
The fixed maturity portfolio consists largely of investment grade corporate debt securities and includes significant amounts of U.S. government and agency obligations. The limited below investment grade securities in the GAIA portfolio consist of “fallen angels,” originally purchased as investment grade, as well as short duration public high yield and loans to middle market companies. At December 31, 2017 and 2016, respectively, 81.1% and 79.7% of the fixed maturity portfolio was publicly traded. At December 31, 2017 and 2016, respectively, the General Account had a $2.4 million and $2.4 million exposure to the sovereign debt of Italy, a $0.7 million and $1.2 million exposure to Puerto Rico and no exposure to the sovereign debt of Greece, Portugal, Spain and the Republic of Ireland.
Fixed Maturities by Industry
The following table sets forth these fixed maturities by industry category as of the dates indicated along with their associated gross unrealized gains and losses.
Fixed Maturities by Industry(1)
| Amortized Cost |
Gross Unrealized Gains |
Gross Unrealized Losses |
Fair Value | Percentage of Total (%) |
||||||||||||||||
| (in millions) | ||||||||||||||||||||
| At December 31, 2017 |
||||||||||||||||||||
| Corporate Securities: |
||||||||||||||||||||
| Finance |
$ | 5,824 | $ | 200 | $ | 7 | $ | 6,017 | 13 | % | ||||||||||
| Manufacturing |
7,546 | 289 | 15 | 7,820 | 17 | % | ||||||||||||||
| Utilities |
4,032 | 210 | 13 | 4,229 | 9 | % | ||||||||||||||
| Services |
3,307 | 130 | 15 | 3,422 | 7 | % | ||||||||||||||
| Energy |
1,980 | 101 | 9 | 2,072 | 4 | % | ||||||||||||||
| Retail and wholesale |
1,404 | 36 | 3 | 1,437 | 3 | % | ||||||||||||||
| Transportation |
957 | 58 | 3 | 1,012 | 2 | % | ||||||||||||||
| Other |
128 | 7 | — | 135 | — | % | ||||||||||||||
|
|
|
|
|
|
|
|
|
|
|
|||||||||||
| Total corporate securities |
25,178 | 1,031 | 65 | 26,144 | 55 | % | ||||||||||||||
|
|
|
|
|
|
|
|
|
|
|
|||||||||||
| U.S. government |
17,744 | 1,000 | 251 | 18,493 | 39 | % | ||||||||||||||
| Commercial mortgage-backed |
— | — | — | — | — | % | ||||||||||||||
| Residential mortgage-backed(2) |
797 | 22 | 1 | 818 | 2 | % | ||||||||||||||
| Preferred stock |
470 | 43 | 1 | 512 | 1 | % | ||||||||||||||
| State & municipal |
422 | 67 | — | 489 | 1 | % | ||||||||||||||
| Foreign governments |
395 | 29 | 5 | 419 | 1 | % | ||||||||||||||
| Asset-backed securities |
745 | 5 | 1 | 749 | 1 | % | ||||||||||||||
|
|
|
|
|
|
|
|
|
|
|
|||||||||||
| Total |
$ | 45,751 | $ | 2,197 | $ | 324 | $ | 47,624 | 100 | % | ||||||||||
|
|
|
|
|
|
|
|
|
|
|
|||||||||||
133
Table of Contents
| Amortized Cost |
Gross Unrealized Gains |
Gross Unrealized Losses |
Fair Value | Percentage of Total (%) |
||||||||||||||||
| (in millions) | ||||||||||||||||||||
| At December 31, 2016 |
||||||||||||||||||||
| Corporate Securities: |
||||||||||||||||||||
| Finance |
$ | 5,371 | $ | 162 | $ | 24 | $ | 5,509 | 13 | % | ||||||||||
| Manufacturing |
6,892 | 285 | 48 | 7,129 | 17 | % | ||||||||||||||
| Utilities |
3,917 | 217 | 27 | 4,107 | 10 | % | ||||||||||||||
| Services |
3,557 | 147 | 25 | 3,679 | 9 | % | ||||||||||||||
| Energy |
1,705 | 78 | 18 | 1,765 | 4 | % | ||||||||||||||
| Retail and wholesale |
1,392 | 42 | 10 | 1,424 | 3 | % | ||||||||||||||
| Transportation |
849 | 54 | 7 | 896 | 2 | % | ||||||||||||||
| Other |
82 | 3 | 1 | 84 | — | % | ||||||||||||||
|
|
|
|
|
|
|
|
|
|
|
|||||||||||
| Total corporate securities |
23,765 | 988 | 160 | 24,593 | 58 | % | ||||||||||||||
|
|
|
|
|
|
|
|
|
|
|
|||||||||||
| U.S. government |
15,169 | 405 | 755 | 14,819 | 35 | % | ||||||||||||||
| Commercial mortgage-backed |
472 | 31 | 108 | 395 | 1 | % | ||||||||||||||
| Residential mortgage-backed(2) |
979 | 27 | 2 | 1,004 | 2 | % | ||||||||||||||
| Preferred stock |
532 | 45 | 11 | 566 | 1 | % | ||||||||||||||
| State & municipal |
441 | 64 | 2 | 503 | 1 | % | ||||||||||||||
| Foreign governments |
385 | 30 | 14 | 401 | 1 | % | ||||||||||||||
| Asset-backed securities |
273 | 10 | 1 | 282 | 1 | % | ||||||||||||||
|
|
|
|
|
|
|
|
|
|
|
|||||||||||
| Total |
$ | 42,016 | $ | 1,600 | $ | 1,053 | $ | 42,563 | 100 | % | ||||||||||
|
|
|
|
|
|
|
|
|
|
|
|||||||||||
| (1) | Investment data has been classified based on standard industry categorizations for domestic public holdings and similar classifications by industry for all other holdings. |
| (2) | Includes publicly traded agency pass-through securities and collateralized obligations. |
Fixed Maturities Credit Quality
The Securities Valuation Office (“SVO”) of the National Association of Insurance Commissioners (“NAIC”), evaluates the investments of insurers for regulatory reporting purposes and assigns fixed maturity securities to one of six categories (“NAIC Designations”). NAIC Designations of “1” or “2” include fixed maturities considered investment grade, which include securities rated Baa3 or higher by Moody’s or BBB- or higher by Standard & Poor’s. NAIC Designations of “3” through “6” are referred to as below investment grade, which include securities rated Ba1 or lower by Moody’s and BB+ or lower by Standard & Poor’s. As a result of time lags between the funding of investments and the completion of the SVO filing process, the fixed maturity portfolio typically includes securities that have not yet been rated by the SVO as of each balance sheet date. Pending receipt of SVO ratings, the categorization of these securities by NAIC designation is based on the expected ratings indicated by internal analysis.
The amortized cost of the General Account’s public and private below investment grade fixed maturities totaled $1.1 billion, or 2.5% of the total fixed maturities at December 31, 2017 and $1.2 billion, or 2.8%, of the total fixed maturities at December 31, 2016. Gross unrealized losses on public and private fixed maturities decreased from $1.1 billion in 2016 to $324 million in 2017. Below investment grade fixed maturities represented 5.6% and 5.3% of the gross unrealized losses at December 31, 2017 and 2016, respectively.
134
Table of Contents
Public Fixed Maturities Credit Quality. The following table sets forth the General Account’s public fixed maturities portfolio by NAIC rating at the dates indicated.
Public Fixed Maturities
| NAIC Designation(1) |
Rating Agency Equivalent |
Amortized Cost |
Gross Unrealized Gains |
Gross Unrealized Losses |
Fair Value | |||||||||||||
| (in millions) | ||||||||||||||||||
| As of December 31, 2017 |
||||||||||||||||||
| 1 |
Aaa, Aa, A | $ | 29,137 | $ | 1,506 | $ | 274 | $ | 30,369 | |||||||||
| 2 |
Baa | 7,521 | 434 | 10 | 7,945 | |||||||||||||
|
|
|
|
|
|
|
|
|
|||||||||||
| Investment grade |
36,658 | 1,940 | 284 | 38,314 | ||||||||||||||
|
|
|
|
|
|
|
|
|
|||||||||||
| 3 |
Ba | 304 | 5 | 6 | 303 | |||||||||||||
| 4 |
B | 119 | — | 1 | 118 | |||||||||||||
| 5 |
Caa | 3 | — | — | 3 | |||||||||||||
| 6 |
Ca, C | 9 | — | — | 9 | |||||||||||||
|
|
|
|
|
|
|
|
|
|||||||||||
| Below investment grade |
435 | 5 | 7 | 433 | ||||||||||||||
|
|
|
|
|
|
|
|
|
|||||||||||
| Total Public Fixed Maturities |
$ | 37,093 | $ | 1,945 | $ | 291 | $ | 38,747 | ||||||||||
|
|
|
|
|
|
|
|
|
|||||||||||
| As of December 31, 2016 |
||||||||||||||||||
| 1 |
Aaa, Aa, A | $ | 25,628 | $ | 910 | $ | 847 | $ | 25,691 | |||||||||
| 2 |
Baa | 7,373 | 396 | 47 | 7,722 | |||||||||||||
|
|
|
|
|
|
|
|
|
|||||||||||
| Investment grade |
33,001 | 1,306 | 894 | 33,413 | ||||||||||||||
|
|
|
|
|
|
|
|
|
|||||||||||
| 3 |
Ba | 354 | 6 | 1 | 359 | |||||||||||||
| 4 |
B | 132 | 1 | 1 | 132 | |||||||||||||
| 5 |
Caa | — | — | — | — | |||||||||||||
| 6 |
Ca, C | 16 | 1 | 1 | 16 | |||||||||||||
|
|
|
|
|
|
|
|
|
|||||||||||
| Below investment grade |
502 | 8 | 3 | 507 | ||||||||||||||
|
|
|
|
|
|
|
|
|
|||||||||||
| Total Public Fixed Maturities |
$ | 33,503 | $ | 1,314 | $ | 897 | $ | 33,920 | ||||||||||
|
|
|
|
|
|
|
|
|
|||||||||||
| (1) | Includes, as of December 31, 2017, 2 securities with amortized cost of $14 million (fair value, $14 million). At December 31, 2016, no securities had been categorized based on expected NAIC designation pending receipt of SVO ratings. |
135
Table of Contents
Private Fixed Maturities Credit Quality. The following table sets forth the General Account’s private fixed maturities portfolio by NAIC rating at the dates indicated:
Private Fixed Maturities
| NAIC Designation(1) |
Rating Agency Equivalent |
Amortized Cost |
Gross Unrealized Gains |
Gross Unrealized Losses |
Fair Value | |||||||||||||
| (in millions) | ||||||||||||||||||
| As of December 31, 2017 |
||||||||||||||||||
| 1 |
Aaa, Aa, A | $ | 4,356 | $ | 122 | $ | 12 | $ | 4,466 | |||||||||
| 2 |
Baa | 3,610 | 123 | 10 | 3,723 | |||||||||||||
|
|
|
|
|
|
|
|
|
|||||||||||
| Investment grade |
7,966 | 245 | 22 | 8,189 | ||||||||||||||
|
|
|
|
|
|
|
|
|
|||||||||||
| 3 |
Ba | 358 | 2 | 4 | 356 | |||||||||||||
| 4 |
B | 315 | 2 | 7 | 310 | |||||||||||||
| 5 |
Caa | 17 | 1 | — | 18 | |||||||||||||
| 6 |
Ca, C | 2 | 2 | — | 4 | |||||||||||||
|
|
|
|
|
|
|
|
|
|||||||||||
| Below investment grade |
692 | 7 | 11 | 688 | ||||||||||||||
|
|
|
|
|
|
|
|
|
|||||||||||
| Total Private Fixed Maturities |
$ | 8,658 | $ | 252 | $ | 33 | $ | 8,877 | ||||||||||
|
|
|
|
|
|
|
|
|
|||||||||||
| As of December 31, 2016 |
||||||||||||||||||
| 1 |
Aaa, Aa, A | $ | 4,075 | $ | 155 | $ | 78 | $ | 4,152 | |||||||||
| 2 |
Baa | 3,758 | 125 | 25 | 3,858 | |||||||||||||
|
|
|
|
|
|
|
|
|
|||||||||||
| Investment grade |
7,833 | 280 | 103 | 8,010 | ||||||||||||||
|
|
|
|
|
|
|
|
|
|||||||||||
| 3 |
Ba | 491 | 3 | 14 | 480 | |||||||||||||
| 4 |
B | 137 | 1 | 17 | 121 | |||||||||||||
| 5 |
Caa | 35 | — | 11 | 24 | |||||||||||||
| 6 |
Ca, C | 17 | 2 | 11 | 8 | |||||||||||||
|
|
|
|
|
|
|
|
|
|||||||||||
| Below investment grade |
680 | 6 | 53 | 633 | ||||||||||||||
|
|
|
|
|
|
|
|
|
|||||||||||
| Total Private Fixed Maturities |
$ | 8,513 | $ | 286 | $ | 156 | $ | 8,643 | ||||||||||
|
|
|
|
|
|
|
|
|
|||||||||||
| (1) | Includes, as of December 31, 2017 and 2016, respectively, 24 securities with amortized cost of $541 million (fair value, $543 million) and 12 securities with amortized cost of $195 million (fair value, $185 million) that were categorized based on expected NAIC designation pending receipt of SVO ratings. |
136
Table of Contents
Corporate Fixed Maturities Credit Quality
The following table sets forth the General Account’s holdings of public and private corporate fixed maturities by NAIC rating at the dates indicated:
Corporate Fixed Maturities
| NAIC Designation |
Rating Agency Equivalent |
Amortized Cost |
Gross Unrealized Gains |
Gross Unrealized Losses |
Fair Value | |||||||||||||
| (in millions) | ||||||||||||||||||
| As of December 31, 2017 |
||||||||||||||||||
| 1 |
Aaa, Aa, A | $ | 13,517 | $ | 508 | $ | 29 | $ | 13,996 | |||||||||
| 2 |
Baa | 10,543 | 510 | 19 | 11,034 | |||||||||||||
|
|
|
|
|
|
|
|
|
|||||||||||
| Investment grade | 24,060 | 1,018 | 48 | 25,030 | ||||||||||||||
|
|
|
|
|
|
|
|
|
|||||||||||
| 3 |
Ba | 660 | 7 | 9 | 658 | |||||||||||||
| 4 |
B | 432 | 3 | 8 | 427 | |||||||||||||
| 5 |
Caa | 19 | — | — | 19 | |||||||||||||
| 6 |
Ca, C | 7 | 3 | — | 10 | |||||||||||||
|
|
|
|
|
|
|
|
|
|||||||||||
| Below investment grade |
1,118 | 13 | 17 | 1,114 | ||||||||||||||
|
|
|
|
|
|
|
|
|
|||||||||||
| Total Corporate Fixed Maturities |
$ | 25,178 | $ | 1,031 | $ | 65 | $ | 26,144 | ||||||||||
|
|
|
|
|
|
|
|
|
|||||||||||
| As of December 31, 2016 |
||||||||||||||||||
| 1 |
Aaa, Aa, A | $ | 12,153 | $ | 498 | $ | 88 | $ | 12,563 | |||||||||
| 2 |
Baa | 10,542 | 477 | 57 | 10,962 | |||||||||||||
|
|
|
|
|
|
|
|
|
|||||||||||
| Investment grade |
22,695 | 975 | 145 | 23,525 | ||||||||||||||
|
|
|
|
|
|
|
|
|
|||||||||||
| 3 |
Ba | 836 | 9 | 14 | 831 | |||||||||||||
| 4 |
B | 214 | 2 | 1 | 215 | |||||||||||||
| 5 |
Caa | 19 | — | — | 19 | |||||||||||||
| 6 |
Ca, C | 1 | 2 | — | 3 | |||||||||||||
|
|
|
|
|
|
|
|
|
|||||||||||
| Below investment grade |
1,070 | 13 | 15 | 1,068 | ||||||||||||||
|
|
|
|
|
|
|
|
|
|||||||||||
| Total Corporate Fixed Maturities |
$ | 23,765 | $ | 988 | $ | 160 | $ | 24,593 | ||||||||||
|
|
|
|
|
|
|
|
|
|||||||||||
| (1) | Includes, as of December 31, 2017 and 2016, respectively, 25 securities with amortized cost of $484 million (fair value, $484 million) and 12 securities with amortized cost of $195 million (fair value, $185 million) that were categorized based on expected NAIC designation pending receipt of SVO ratings. |
Asset-backed Securities
As of December 31, 2017 the amortized cost and fair value of asset-backed securities held were $745 million and $749 million, respectively; as of December 31, 2016, the amortized cost and fair value of asset-backed securities held were $273 million and $282 million, respectively.
Commercial Mortgage-backed Securities
At December 31, 2017, there were no General Account commercial mortgage-backed securities outstanding. At December 31, 2016, the amortized cost and fair value of the General Account’s commercial mortgage-backed securities were $472 million and $395 million, respectively.
137
Table of Contents
Mortgages
Investment Mix
As of December 31, 2017 and December 31, 2016, approximately 12.7% and 12.5%, respectively, of invested assets were in commercial and agricultural mortgage loans. The table below shows the composition of the commercial and agricultural mortgage loan portfolio, before the loss allowance, as of the dates indicated.
| As of December 31, | ||||||||
| 2017 | 2016 | |||||||
| (in millions) | ||||||||
| Commercial mortgage loans |
$ | 8,386 | $ | 7,281 | ||||
| Agricultural mortgage loans |
2,574 | 2,501 | ||||||
|
|
|
|
|
|||||
| Total Mortgage Loans |
$ | 10,960 | $ | 9,782 | ||||
|
|
|
|
|
|||||
The investment strategy for the mortgage loan portfolio emphasizes diversification by property type and geographic location with a primary focus on asset quality. The tables below show the breakdown of the amortized cost of the General Account’s investments in mortgage loans by geographic region and property type as of the dates indicated.
Mortgage Loans by Region and Property Type
| As of December 31, 2017 | As of December 31, 2016 | |||||||||||||||
| Amortized Cost | % of Total | Amortized Cost | % of Total | |||||||||||||
| (in millions) | ||||||||||||||||
| By Region: |
||||||||||||||||
| U.S. Regions: |
||||||||||||||||
| Pacific |
$ | 3,264 | 29.8 | % | $ | 2,760 | 28.2 | % | ||||||||
| Middle Atlantic |
2,958 | 27.0 | 2,688 | 27.5 | ||||||||||||
| South Atlantic |
1,096 | 10.0 | 1,069 | 10.9 | ||||||||||||
| East North Central |
917 | 8.4 | 818 | 8.4 | ||||||||||||
| Mountain |
800 | 7.3 | 725 | 7.4 | ||||||||||||
| West North Central |
778 | 7.1 | 713 | 7.3 | ||||||||||||
| West South Central |
499 | 4.5 | 448 | 4.6 | ||||||||||||
| New England |
460 | 4.2 | 371 | 3.8 | ||||||||||||
| East South Central |
188 | 1.7 | 190 | 1.9 | ||||||||||||
|
|
|
|
|
|
|
|
|
|||||||||
| Total Mortgage Loans |
$ | 10,960 | 100.0 | % | $ | 9,782 | 100.0 | % | ||||||||
|
|
|
|
|
|
|
|
|
|||||||||
| By Property Type: |
||||||||||||||||
| Office |
$ | 3,639 | 33.2 | % | $ | 3,249 | 33.2 | % | ||||||||
| Multifamily |
3,014 | 27.5 | 2,456 | 25.1 | ||||||||||||
| Agricultural loans |
2,574 | 23.5 | 2,501 | 25.6 | ||||||||||||
| Retail |
647 | 5.9 | 585 | 6.0 | ||||||||||||
| Industrial |
326 | 3.0 | 453 | 4.6 | ||||||||||||
| Hospitality |
417 | 3.8 | 416 | 4.3 | ||||||||||||
| Other |
343 | 3.1 | 122 | 1.2 | ||||||||||||
|
|
|
|
|
|
|
|
|
|||||||||
| Total Mortgage Loans |
$ | 10,960 | 100.0 | % | $ | 9,782 | 100.0 | % | ||||||||
|
|
|
|
|
|
|
|
|
|||||||||
As of December 31, 2017 and December 31, 2016, the General Account investments in commercial mortgage loans had a weighted average loan-to-value ratio of 59% and 60%, respectively, while the agricultural mortgage loans weighted average loan-to-value ratio was 46% and 46%, respectively.
138
Table of Contents
The following tables provide information relating to the loan-to-value and debt service coverage ratios for commercial and agricultural mortgage loans as of December 31, 2017 and 2016, respectively. The values used in these ratio calculations were developed as part of the periodic review of the commercial and agricultural mortgage loan portfolio, which includes an evaluation of the underlying collateral value.
Mortgage Loans by Loan-to-Value and Debt Service Coverage Ratios
December 31, 2017
| Debt Service Coverage Ratio(1) | ||||||||||||||||||||||||||||
| Loan-to-Value Ratio |
Greater than 2.0x |
1.8x to 2.0x |
1.5x to 1.8x |
1.2x to 1.5x |
1.0x to 1.2x |
Less than 1.0x |
Total Mortgage Loans |
|||||||||||||||||||||
| (in millions) | ||||||||||||||||||||||||||||
| 0% - 50% |
$ | 1,031 | $ | 149 | $ | 595 | $ | 589 | $ | 316 | $ | 30 | $ | 2,710 | ||||||||||||||
| 50% - 70% |
4,199 | 728 | 1,293 | 787 | 366 | 49 | 7,422 | |||||||||||||||||||||
| 70% - 90% |
169 | 110 | 196 | 276 | 50 | — | 801 | |||||||||||||||||||||
| 90% plus |
— | — | 27 | — | — | — | 27 | |||||||||||||||||||||
|
|
|
|
|
|
|
|
|
|
|
|
|
|
|
|||||||||||||||
| Total Commercial and Agricultural Mortgage Loans |
$ | 5,399 | $ | 987 | $ | 2,111 | $ | 1,652 | $ | 732 | $ | 79 | $ | 10,960 | ||||||||||||||
|
|
|
|
|
|
|
|
|
|
|
|
|
|
|
|||||||||||||||
December 31, 2016
| Debt Service Coverage Ratio(1) | ||||||||||||||||||||||||||||
| Loan-to-Value Ratio |
Greater than 2.0x |
1.8x to 2.0x |
1.5x to 1.8x |
1.2x to 1.5x |
1.0x to 1.2x |
Less than 1.0x |
Total Mortgage Loans |
|||||||||||||||||||||
| (in millions) | ||||||||||||||||||||||||||||
| 0% - 50% |
$ | 1,009 | $ | 233 | $ | 355 | $ | 524 | $ | 286 | $ | 49 | $ | 2,456 | ||||||||||||||
| 50% - 70% |
3,358 | 487 | 882 | 1,433 | 295 | 45 | 6,500 | |||||||||||||||||||||
| 70% - 90% |
282 | 65 | 231 | 131 | 28 | 46 | 783 | |||||||||||||||||||||
| 90% plus |
— | — | 28 | 15 | — | — | 43 | |||||||||||||||||||||
|
|
|
|
|
|
|
|
|
|
|
|
|
|
|
|||||||||||||||
| Total Commercial and Agricultural Mortgage Loans |
$ | 4,649 | $ | 785 | $ | 1,496 | $ | 2,103 | $ | 609 | $ | 140 | $ | 9,782 | ||||||||||||||
|
|
|
|
|
|
|
|
|
|
|
|
|
|
|
|||||||||||||||
| (1) | The debt service coverage ratio is calculated using actual results from property operations. |
The tables below show the breakdown of the commercial and agricultural mortgage loans by year of origination as of December 31, 2017 and 2016, respectively.
Mortgage Loans by Year of Origination
December 31, 2017
| Year of Origination |
Amortized Cost | % of Total | ||||||
| (in millions) | ||||||||
| 2017 |
$ | 2,026 | 18.5 | % | ||||
| 2016 |
3,298 | 30.1 | ||||||
| 2015 |
1,551 | 14.2 | ||||||
| 2014 |
1,170 | 10.7 | ||||||
| 2013 |
1,485 | 13.5 | ||||||
| 2012 and prior |
1,430 | 13.0 | ||||||
|
|
|
|
|
|||||
| Total Mortgage Loans |
$ | 10,960 | 100.0 | % | ||||
|
|
|
|
|
|||||
139
Table of Contents
Mortgage Loans by Year of Origination
December 31, 2016
| Year of Origination |
Amortized Cost | % of Total | ||||||
| (in millions) | ||||||||
| 2016 |
$ | 3,325 | 33.9 | % | ||||
| 2015 |
1,437 | 14.7 | ||||||
| 2014 |
1,331 | 13.6 | ||||||
| 2013 |
1,642 | 16.8 | ||||||
| 2012 |
945 | 9.7 | ||||||
| 2011 and prior |
1,102 | 11.3 | ||||||
|
|
|
|
|
|||||
| Total Mortgage Loans |
$ | 9,782 | 100 | % | ||||
|
|
|
|
|
|||||
As of December 31, 2017 and December 31, 2016, $49 million and $6 million, respectively, of mortgage loans were classified as problem loans while $0 million and $60 million were classified as potential problem loans. During 2017, the Company sold the property previously considered a Troubled Debt Restructuring (“TDR”) mortgage loan. As of December 31, 2017 and 2016, there were $0 million and $15 million, respectively, of troubled debt restructuring related to mortgage loans.
Valuation allowances for the commercial mortgage loan portfolio were related to loan specific reserves. The following table sets forth the change in valuation allowances for the commercial mortgage loan portfolio as of the dates indicated. There were no valuation allowances for agricultural mortgages at December 31, 2017 and 2016.
| Commercial Mortgage Loans | ||||||||
| December 31, | ||||||||
| 2017 | 2016 | |||||||
| (in millions) | ||||||||
| Allowance for credit losses: |
||||||||
| Beginning Balance, January 1, |
$ | 8 | $ | 6 | ||||
| Charge-offs |
— | — | ||||||
| Recoveries |
— | (2 | ) | |||||
| Provision |
— | 4 | ||||||
|
|
|
|
|
|||||
| Ending Balance, December 31, |
$ | 8 | $ | 8 | ||||
|
|
|
|
|
|||||
| Ending Balance, December 31, |
||||||||
| Individually Evaluated for Impairment |
$ | 8 | $ | 8 | ||||
|
|
|
|
|
|||||
Other Equity Investments
As of December 31, 2017, private equity partnerships, hedge funds and real-estate related partnerships were 87.5% of total other equity investments. These interests, which represent 1.5% of GAIA, consist of a diversified portfolio of LBO mezzanine, venture capital and other alternative limited partnerships, diversified by sponsor, fund and vintage year. The portfolio is actively managed to control risk and generate investment returns over the long term. Portfolio returns are sensitive to overall market developments.
140
Table of Contents
Other Equity Investments—Classifications
| As of December 31, | ||||||||
| 2017 | 2016 | |||||||
| (in millions) | ||||||||
| Common stock |
$ | 158 | $ | 113 | ||||
| Joint ventures and limited partnerships |
||||||||
| Private equity |
927 | 902 | ||||||
| Hedge funds |
179 | 221 | ||||||
|
|
|
|
|
|||||
| Total Other Equity Investments |
$ | 1,264 | $ | 1,236 | ||||
|
|
|
|
|
|||||
Derivatives
We use derivatives as part of our overall asset/liability risk management primarily to reduce exposures to equity market and interest rate risks. Derivative hedging strategies are designed to reduce these risks from an economic perspective and are all executed within the framework of a Derivative Use Plan (“DUP”) approved by applicable states’ insurance law. Derivatives are generally not accounted for using hedge accounting Operation of these hedging programs is based on models involving numerous estimates and assumptions, including, among others, mortality, lapse, surrender and withdrawal rates, election rates, fund performance, market volatility and interest rates. A wide range of derivative contracts are used in these hedging programs, including exchange traded equity, currency and interest rate futures contracts, total return swaps on equity, bond and Treasury indices, total return swaps on single U.S. Treasury Securities, interest rate swaps bond and bond-index total return swaps, swaptions, variance swaps, equity options, credit and foreign exchange derivatives, as well as bond and repo transactions to support the hedging.
Derivatives used to hedge exposure to variable annuity products with GMxB features
We have issued and continue to offer certain variable annuity products with GMxB features. The risk associated with the GMDB feature is that under-performance of the financial markets could result in GMDB benefits, in the event of death, being higher than what accumulated policyholders’ account balances would support. The risk associated with the GMLB features is that under-performance of the financial markets could result in the GMLB features’ benefits being higher than what accumulated policyholders’ account balances would support.
For GMxB features, we retain certain risks including basis, credit spread and some volatility risk and risk associated with actual versus expected actuarial assumptions for mortality, lapse and surrender, withdrawal, policyholder election rates and other behaviors. The derivative contracts are managed to correlate with changes in the value of the GMxB features that result from financial markets movements. A portion of exposure to realized equity volatility is hedged using equity options and variance swaps and a portion of exposure to credit risk is hedged using total return swaps on fixed income indices. Additionally, we are party to total return swaps for which the reference U.S. Treasury securities are contemporaneously purchased from the market and sold to the swap counterparty. As these transactions result in a transfer of control of the U.S. Treasury securities to the swap counterparty, we derecognize these securities with consequent gain or loss from the sale. We have also purchased reinsurance contracts to mitigate the risks associated with GMDB features and the impact of potential market fluctuations on future policyholder elections of GMIB features contained in certain annuity contracts issued by us.
Derivatives used to hedge crediting rate exposure on SCS, SIO, MSO and IUL products/investment options
We hedge crediting rates in SCS, SIO in the EQUI-VEST variable annuity product series, MSO in the variable life insurance products and IUL insurance products. These products permit the contract owner to
141
Table of Contents
participate in the performance of an index, ETF or commodity price movement up to a cap for a set period of time. They also contain a protection feature, in which we will absorb, up to a certain percentage, the loss of value in an index, ETF or commodity price, which varies by product segment.
In order to support the returns associated with these features, we enter into derivative contracts whose payouts, in combination with fixed income investments, emulate those of the index, ETF or commodity price, subject to caps and buffers.
Other derivatives based hedges
From time to time and depending on market and other conditions we hedge additional risks not otherwise covered by our variable annuity product hedge programs. Such hedge programs include:
| • | the net duration of our General Account economic liability and assets; |
| • | expected income from fees on Separate Account AUM against declines in equity markets; |
| • | the economic impact of lower interest-rates on expected variable annuity product sales; |
| • | the equity exposure of General Account assets; and |
| • | the credit exposure of General Account assets. |
Derivatives utilized for General Account investment portfolio
We maintain a strategy in our General Account investment portfolio to replicate the exposure of fixed maturity securities otherwise permissible for investment under our investment guidelines. Examples include corporate bond exposure replicated through the sale of credit default swaps together with the purchase of a Treasury bond and Treasury bond exposure replicated through the sale of an asset swap and the purchase the bond referenced in the asset swap.
These asset swaps, when considered in combination with the bonds, result a yield higher than a term-equivalent U.S. Treasury bond.
142
Table of Contents
The tables below present quantitative disclosures about the Company’s derivative instruments, including those embedded in other contracts required to be accounted for as derivative instruments.
Derivative Instruments by Category
At or For the Year Ended December 31, 2017
| Fair Value | Gains (Losses) Reported in Net Earnings (Loss) |
|||||||||||||||
| Notional Amount |
Asset Derivatives |
Liability Derivatives |
||||||||||||||
| (in millions) | ||||||||||||||||
| Freestanding Investment Derivatives |
||||||||||||||||
| Equity contracts:(1) |
||||||||||||||||
| Futures |
$ | 6,552 | $ | — | $ | — | $ | (1,282 | ) | |||||||
| Swaps |
7,555 | 3 | 200 | (1,407 | ) | |||||||||||
| Options |
22,223 | 3,456 | 1,457 | 1,265 | ||||||||||||
| Interest rate contracts:(1) |
||||||||||||||||
| Floors |
— | — | — | — | ||||||||||||
| Swaps |
26,725 | 603 | 192 | 863 | ||||||||||||
| Futures |
20,675 | — | — | 293 | ||||||||||||
| Credit contracts:(1) |
||||||||||||||||
| Credit default swaps |
2,057 | 34 | 2 | 21 | ||||||||||||
| Other freestanding contracts:(1) |
||||||||||||||||
| Foreign currency Contracts |
1,297 | 11 | 2 | (38 | ) | |||||||||||
| Margin |
18 | 4 | ||||||||||||||
| Collateral |
4 | 2,123 | ||||||||||||||
| Embedded and Freestanding Insurance Derivatives |
||||||||||||||||
| GMIB reinsurance contracts(6) |
1,894 | 174 | ||||||||||||||
| GMxB derivative features liability(3,6) |
4,358 | 1,553 | ||||||||||||||
| SCS, SIO, MSO and IUL indexed features liability(5,6) |
1,786 | (1,190 | ) | |||||||||||||
|
|
|
|||||||||||||||
| Net derivative investment gains (loss) |
252 | |||||||||||||||
| Cross currency swaps(2,4) |
— | — | — | — | ||||||||||||
|
|
|
|
|
|
|
|
|
|||||||||
| Balance, December 31, 2017 |
$ | 87,084 | $ | 6,023 | $ | 10,124 | $ | 252 | ||||||||
|
|
|
|
|
|
|
|
|
|||||||||
| (1) | Reported in Other invested assets in the consolidated balance sheets. |
| (2) | Reported in Other assets or Other liabilities in the consolidated balance sheets. |
| (3) | Reported in Future policy benefits and other policyholders’ liabilities in the consolidated balance sheets. |
| (4) | Reported in Other income in the consolidated statements of income (loss). |
| (5) | SCS and SIO indexed features are reported in Policyholders’ account balances; MSO and IUL indexed features are reported in Future policyholders’ benefits and other policyholders’ liabilities in the consolidated balance sheets. |
| (6) | Reported in Net derivative gains (losses) in the consolidated statements of income (loss). |
143
Table of Contents
Derivative Instruments by Category
As of or For the Year Ended December 31, 2016
| Fair Value | Gains (Losses) Reported in Net Earnings (Loss) |
|||||||||||||||
| Notional Amount |
Asset Derivatives |
Liability Derivatives |
||||||||||||||
| (in millions) | ||||||||||||||||
| Freestanding Investment Derivatives |
||||||||||||||||
| Equity contracts:(1) |
||||||||||||||||
| Futures |
$ | 9,028 | $ | — | $ | — | $ | (1,442 | ) | |||||||
| Swaps |
5,843 | 22 | 116 | (450 | ) | |||||||||||
| Options |
12,241 | 2,190 | 1,174 | 746 | ||||||||||||
| Interest rate contracts:(1) |
||||||||||||||||
| Floors |
1,500 | 11 | — | 4 | ||||||||||||
| Swaps |
26,092 | 513 | 1,442 | (197 | ) | |||||||||||
| Futures |
14,818 | — | — | 156 | ||||||||||||
| Swaptions |
— | — | — | — | ||||||||||||
| Credit contracts:(1) |
||||||||||||||||
| Credit default swaps |
2,712 | 19 | 14 | 16 | ||||||||||||
| Other freestanding contracts:(1) |
||||||||||||||||
| Foreign currency Contracts |
549 | 48 | 1 | 47 | ||||||||||||
| Margin |
— | 115 | 6 | — | ||||||||||||
| Collateral |
— | 934 | 908 | — | ||||||||||||
| Embedded and Freestanding Insurance Derivatives |
||||||||||||||||
| GMIB reinsurance contracts(6) |
— | 1,735 | — | (77 | ) | |||||||||||
| GMxB derivative features liability(3, 6) |
— | — | 5,580 | 138 | ||||||||||||
| SCS, SIO, MSO and IUL indexed features liability(5, 6) |
— | — | 940 | (647 | ) | |||||||||||
|
|
|
|||||||||||||||
| Net derivative investment gains (loss) |
(1,706 | ) | ||||||||||||||
| Cross currency swaps(2, 4) |
— | — | — | — | ||||||||||||
|
|
|
|
|
|
|
|
|
|||||||||
| Balance, December 31, 2016 |
$ | 72,783 | $ | 5,587 | $ | 10,181 | $ | (1,706 | ) | |||||||
|
|
|
|
|
|
|
|
|
|||||||||
| (1) | Reported in Other invested assets in the consolidated balance sheets. |
| (2) | Reported in Other assets or Other liabilities in the consolidated balance sheets. |
| (3) | Reported in Future policy benefits and other policyholders’ liabilities in the consolidated balance sheets. |
| (4) | Reported in Other income in the consolidated statements of income (loss). |
| (5) | SCS and SIO indexed features are reported in Policyholders’ account balances; MSO and IUL indexed features are reported in Future policyholders’ benefits and other policyholders’ liabilities in the consolidated balance sheets. |
| (6) | Reported in Net derivative gains (losses) in the consolidated statements of income (loss). |
Realized Investment Gains (Losses)
Realized investment gains (losses) are generated from numerous sources, including the sale of fixed maturity securities, equity securities, investments in limited partnerships and other types of investments, as well as adjustments to the cost basis of investments for OTTI. Realized investment gains (losses) are also generated from prepayment premiums received on private fixed maturity securities, recoveries of principal on previously impaired securities, provisions for losses on commercial mortgage and other loans, fair value changes on commercial mortgage loans carried at fair value, and fair value changes on embedded derivatives and free-standing derivatives that do not qualify for hedge accounting treatment.
144
Table of Contents
The following table sets forth “Realized investment gains (losses), net,” for the periods indicated:
Realized Investment Gains (Losses), Net
| Years Ended December 31, | ||||||||||||
| 2017 | 2016 | 2015 | ||||||||||
| (in millions) | ||||||||||||
| Fixed maturities |
$ | (194 | ) | $ | 83 | $ | (9 | ) | ||||
| Other equity investments |
2 | — | — | |||||||||
| Other |
1 | (2 | ) | (1 | ) | |||||||
|
|
|
|
|
|
|
|||||||
| Total |
$ | (191 | ) | $ | 81 | $ | (10 | ) | ||||
|
|
|
|
|
|
|
|||||||
The following table further describes realized gains (losses), net for Fixed maturities for the periods indicated:
Fixed Maturities
Realized Investment Gains (Losses), Net
| Years Ended December 31, |
||||||||||||
| 2017 | 2016 | 2015 | ||||||||||
| (in millions) | ||||||||||||
| Gross realized investment gains: |
||||||||||||
| Gross gains on sales and maturities |
$ | 126 | $ | 242 | $ | 56 | ||||||
|
|
|
|
|
|
|
|||||||
| Total gross realized investment gains |
126 | 242 | 56 | |||||||||
|
|
|
|
|
|
|
|||||||
| Gross realized investment losses: |
||||||||||||
| Other-than-temporary impairments recognized in earnings (loss) |
(15 | ) | (68 | ) | (42 | ) | ||||||
| Gross losses on sales and maturities |
(305 | ) | (91 | ) | (23 | ) | ||||||
|
|
|
|
|
|
|
|||||||
| Total gross realized investment losses |
(320 | ) | (159 | ) | (65 | ) | ||||||
|
|
|
|
|
|
|
|||||||
| Total |
$ | (194 | ) | $ | 83 | $ | (9 | ) | ||||
|
|
|
|
|
|
|
|||||||
The following table sets forth, for the periods indicated, the composition of other-than-temporary impairments recorded in net income (loss) by asset type for the periods indicated:
Other-Than-Temporary Impairments Recorded in Earnings (Losses)
| Years Ended December 31, |
||||||||||||
| 2017 | 2016 | 2015 | ||||||||||
| (in millions) | ||||||||||||
| Fixed Maturities: |
||||||||||||
| Public fixed maturities |
$ | (1 | ) | $ | (45 | ) | $ | (22 | ) | |||
| Private fixed maturities |
(14 | ) | (23 | ) | (20 | ) | ||||||
|
|
|
|
|
|
|
|||||||
| Total fixed maturities securities |
(15 | ) | (68 | ) | (42 | ) | ||||||
|
|
|
|
|
|
|
|||||||
| Equity securities |
— | — | — | |||||||||
|
|
|
|
|
|
|
|||||||
| Total |
$ | (15 | ) | $ | (68 | ) | $ | (42 | ) | |||
|
|
|
|
|
|
|
|||||||
145
Table of Contents
OTTI on fixed maturities recorded in net income (loss) in 2016 and 2015 were due to credit events or adverse conditions of the respective issuer. In these situations, management believes such circumstances have caused, or will lead to, a deficiency in the contractual cash flows related to the investment. The amount of the impairment recorded in net income (loss) is the difference between the amortized cost of the debt security and the net present value of its projected future cash flows discounted at the effective interest rate implicit in the debt security prior to impairment.
Liquidity and Capital Resources
Liquidity refers to our ability to generate adequate amounts of cash from our operating, investment and financing activities to meet our cash requirements with a prudent margin of safety. Capital refers to our long-term financial resources available to support business operations and future growth. Our ability to generate and maintain sufficient liquidity and capital is dependent on the profitability of our businesses, timing of cash flows related to our investments and products, our ability to access the capital markets, general economic conditions and the alternative sources of liquidity and capital described herein. When considering our liquidity and cash flows, it is important to distinguish between the needs of Holdings and the needs of our insurance and non-insurance subsidiaries. We also distinguish and separately manage the liquidity and capital resources of our retirement and protection businesses, including our Individual Retirement, Group Retirement and Protection Solutions segments, and our Investment Management and Research segment.
Sources and Uses of Liquidity and Capital Position of Holdings
As a holding company with no business operations of its own, Holdings primarily derives cash flows from dividends and interest payments from its insurance subsidiaries and distributions related to its economic interest in AB, more than half of which will be held outside our insurance company subsidiaries, after giving effect to the Reorganization. These principal sources of liquidity are augmented by cash and short-term investments held by Holdings and access to bank lines of credit and the capital markets. The main uses of liquidity for Holdings are interest payments and debt repayment, payment of dividends and other distributions to stockholders, which may include stock repurchases, and capital contributions, if needed, to our insurance subsidiaries. Our principal sources of liquidity and our capital position following this offering are described in the following paragraphs.
Historical Distributions from Our Subsidiaries
From 2014 to 2016, Holdings and AXA Financial received net distributions from our subsidiaries of $2.6 billion. These net distributions comprised dividends and principal payments on surplus notes from our insurance subsidiaries ($1.2 billion, $1.0 billion and $1.1 billion in 2014, 2015 and 2016, respectively), distributions from AB ($70 million, $72 million and $85 million in 2014, 2015 and 2016, respectively) and distributions from AXA Advisors ($30 million, $30 million and $33 million in 2014, 2015 and 2016, respectively), partially offset by a contribution by AXA Financial to AXA RE Arizona to enhance its balance sheet and liquidity position. In addition, AXA Financial also received dividends of $85 million in 2015 related to certain real estate assets. During this period, we also received $1.9 billion of net proceeds from the sale of certain real estate assets by AXA Financial. In 2017, in accordance with our agreement with the NYDFS and in preparation for this offering, Holdings and AXA Financial collectively made $2.3 billion in aggregate capital contributions to AXA Equitable Life and AXA RE Arizona, and AXA Financial received a $0.1 billion distribution on AB Units held by it and a $0.1 billion distribution from AXA Advisors and USFL.
Distributions from Insurance Subsidiaries
Our insurance companies are subject to limitations on the payment of dividends and other transfers of funds to Holdings and other affiliates under applicable insurance law and regulation. Also, more generally, the ability of our insurance subsidiaries to pay dividends can be affected by market conditions and other factors beyond our control.
146
Table of Contents
Under New York insurance law applicable to AXA Equitable Life, a domestic stock life insurer may not, without prior approval of the NYDFS, pay a dividend to its stockholders exceeding an amount calculated under either the Earned Surplus Standard or the Alternative Standard. Dividends exceeding these prescribed limits require the insurer to file a notice of its intent to declare the dividends with the NYDFS and prior approval or non-disapproval from the NYDFS.
Applying the formulas under these standards and the definition of earned surplus used in the Earned Surplus Standard, AXA Equitable Life could pay ordinary dividends of up to approximately $1.2 billion during 2018 and could have paid ordinary dividends of up to approximately $1.2 billion during 2017. However, in 2016, the NYDFS issued a circular letter to its regulated insurance companies stating that ordinary dividends which exceed an insurer’s positive unassigned funds (as reported on the insurer’s most recent annual statement) may fail one of the qualitative tests imposed by the Earned Surplus Standard. Given the circular letter, it is possible that the NYDFS could limit the amount of ordinary dividends declared by AXA Equitable Life under the Earned Surplus Standard to the amount of AXA Equitable Life’s positive unassigned funds. As of December 31, 2017 and December 31, 2016, AXA Equitable Life’s unassigned funds reported on its statutory financial statements were approximately $1.9 billion and $0.9 billion, respectively.
In the second quarter of 2017, AXA Equitable Life agreed with the NYDFS that until the DFS Conditions are met, it will pay ordinary dividends only under the Earned Surplus Standard.
We have confirmed that the completion of the GMxB Unwind, which occurred on April 12, 2018, satisfied the DFS Conditions, and that, going forward, satisfaction of either the Earned Surplus Standard or Alternative Standard will determine AXA Equitable Life’s ability to pay ordinary dividends. Our other insurance subsidiaries that reside outside of New York are subject to legal restrictions on dividends similar to those described above under New York law, though the specifics of such rules vary from state to state.
Distributions from AllianceBernstein
ABLP and AB Holding are required to distribute all of their Available Cash Flow, as defined in the Amended and Restated Agreement of Limited Partnership of ABLP and the Amended and Restated Agreement of Limited Partnership of AB Holding, respectively, to holders of AB Units and AB Holdings Units, respectively. Available Cash Flow for ABLP is defined as net cash provided from operations minus such amounts as the General Partner determines, in its sole discretion, should be retained by ABLP for use in its business, or plus such amounts as the General Partner determines, in its sole discretion, should be released from previously retained cash flow. Distributions by ABLP are made 1% to the General Partner and 99% among the limited partners. Available Cash Flow for AB Holding is defined as the cash distributions that AB Holding receives from ABLP minus such amounts as the General Partner determines, in its sole discretion, should be released from previously retained cash flow. AB Holding is dependent on the quarterly cash distributions it receives from ABLP, which is subject to the performance of capital markets and other factors beyond our control. Distributions from AB Holding are made pro rata based on the holder’s percentage ownership interest in AB Holding.
Following the Reorganization Transactions, Holdings and AXA Financial and AXA IM Holdings US, non-insurance company subsidiaries, now hold 93.1 million AB Units and 2.3 million AB Holding Units directly, while 77.0 million AB Units, 1.4 million AB Holding Units and the 1% General Partnership interest in AB are now held by AXA Equitable Life and MLOA, two of our insurance company subsidiaries. Because AXA Equitable Life and MLOA are subject to regulatory restrictions on dividends, distributions they receive from AB may not be distributable to Holdings.
Capital Position Following the Offering
We manage our capital position to maintain financial strength and credit ratings that facilitate the distribution of our products and provide our desired level of access to the bank and public financing markets. Our
147
Table of Contents
capital position is supported by the ability of our subsidiaries to generate cash flows and distribute cash to us and our ability to effectively manage the risk of our businesses and to borrow funds and raise capital to meet our operating and growth needs.
We have historically operated with a capital structure that reflected our status as a wholly owned subsidiary of AXA, including relying on financing provided or guaranteed by AXA and its affiliates. To meet our target capitalization at the time of this offering, we have taken or intend to take certain significant actions that will impact our liquidity and capital position prior to the settlement of this offering and that will align our capital structure more closely with other U.S. public companies. These actions include:
| • | issuing debt securities to third party investors: (i) $800 million aggregate principal amount of 3.900% Senior Notes due 2023, (ii) $1.5 billion aggregate principal amount of 4.350% Senior Notes due 2028 and (iii) $1.5 billion aggregate principal amount of 5.000% Senior Notes due 2048, to replace intercompany financing that is provided or guaranteed by AXA and its affiliates, among other things; |
| • | arranging additional contingent financing facilities, including (i) letter of credit facilities with an aggregate principal amount of $1.9 billion, primarily to be used to support our life insurance business reinsured to EQ AZ Life Re following the GMxB Unwind, (ii) a five-year senior unsecured revolving credit facility for an amount of approximately $2.5 billion, and (iii) a three-year senior unsecured term loan facility of up to $500 million; |
| • | borrowing $300 million under our three-year term loan agreement; |
| • | terminating the current outstanding balance issued under AXA Financial’s commercial paper program; |
| • | (i) a capital contribution of $318 million and (ii) a short-term loan of $622 million from AXA, which was set off against AXA’s payment obligation to Holdings with respect to the sale of AXA CS shares as described in “The Reorganization Transactions”; |
| • | increasing the statutory capital and reserves of our retirement and protection businesses by approximately $2.3 billion in 2017; |
| • | selling AXA Equitable Life’s interest in two real estate joint ventures to AXA France for a total purchase price of $143 million, which resulted in the elimination of $203 million of long-term debt on Holdings’ consolidated balance sheet for the first quarter of 2018 and a corresponding reduction of our debt-to-capital ratio; and |
| • | implementing the Reorganization Transactions which include the direct or indirect acquisition of an additional 18.7% economic interest in AB and the GMxB Unwind. |
Waiver Letter Agreements
In April 2018, we entered into waiver letter agreements with the lenders under each of our Credit Facilities and the letter of credit facilities, pursuant to which the lenders waived certain defaults or events of default under such facilities resulting from the restatement of our annual financial statements for the year ended December 31, 2016, the restatement of our interim financial statements for the nine months ended September 30, 2017 and for the six months ended June 30, 2017, the failure to furnish audited financial statements for the year ended December 31, 2017 on a timely basis as required by such facilities and related matters. There can be no assurance that our lenders will provide such waivers in the future. For a discussion of the restatement to our 2016 annual financial statements, see note 1 to the notes to our annual financial statements included elsewhere in this prospectus. For a discussion of the material weaknesses in our internal control over financial reporting, see “Risk Factors—Risks Relating to Our Common Stock and This Offering—During the course of preparing our U.S. GAAP financial statements for this offering, we identified two material weaknesses in our internal control over financial reporting. If our remediation of these material weaknesses is not effective, we may not be able to report our financial condition or results of operations accurately or on a timely basis, which could materially and
148
Table of Contents
adversely affect investor confidence in us and, as a result, the price of our common stock.” For a discussion of waivers under our Credit Facilities and letter of credit facilities, see “Risk Factors—Risks Relating to our Operations—A violation or breach of the representations, warranties or covenants contained in any of our Credit Facilities or letter of credit facilities could result in a default or event of default, which would require a waiver or amendment with the consent of our lenders. The failure to obtain any such waiver or amendment would have a material adverse effect on our business, results of operations or financial condition.”
Capital Management
Historically, as a wholly owned subsidiary of AXA, we adopted and abided by capital management policies determined by AXA and managed by AXA on a worldwide basis. Our Board and senior management are directly involved in the development of our future capital management policies to be adopted prior to the settlement of this offering. Following the settlement of this offering, capital actions, including proposed changes to the annual capital plan, capital targets and capital policies, will be approved by the Board.
Sources and Uses of Liquidity of Our Insurance Subsidiaries
The principal sources of liquidity for our insurance subsidiaries are premiums, investment and fee income, deposits associated with our insurance and annuity operations, cash and invested assets, as well as internal borrowings. The principal uses of that liquidity include benefits, claims and dividends paid to policyholders and payments to policyholders in connection with surrenders and withdrawals. Other uses of liquidity include commissions, general and administrative expenses, purchases of investments, the payment of dividends to Holdings and hedging activity. Certain of our insurance subsidiaries’ principal sources and uses of liquidity are described in the paragraphs that follow.
We manage the liquidity of our insurance subsidiaries with the objective of ensuring that they are able to meet payment obligations linked to our Individual Retirement, Group Retirement and Protection Solutions businesses and to their outstanding debt and derivative positions, including in our hedging programs, without support from Holdings. We employ an asset/liability management approach specific to the requirements of each of our insurance businesses. We measure liquidity against internally-developed benchmarks that consider the characteristics of our asset portfolio and the liabilities that it supports. We consider attributes of the various categories of our liquid assets (for example, type of asset and credit quality) in calculating internal liquidity indicators for our insurance and reinsurance operations. Our liquidity benchmarks are established for various stress scenarios and durations, including company-specific and market-wide events. The scenarios we use to evaluate the liquidity of our subsidiaries are defined to allow operating entities to operate without support from Holdings.
Liquid Assets
The investment portfolios of our insurance subsidiaries are a significant component of our overall liquidity. Liquid assets include cash and cash equivalents, short-term investments, U.S. Treasury fixed maturities, fixed maturities that are not designated as held-to-maturity and public equity securities. We believe that our business operations and the liquidity profile of our assets provide sufficient liquidity under reasonably foreseeable stress scenarios for each of our insurance subsidiaries.
See “—General Account Investment Assets Portfolio” for a description of our retirement and protection businesses’ portfolio of liquid assets.
Hedging Activities
Because the future claims exposure on our insurance products, and in particular our variable annuity products with GMxB features, is sensitive to movements in the equity markets and interest rates, we have in
149
Table of Contents
place various hedging and reinsurance programs that are designed to mitigate the economic risks of movements in the equity markets and interest rates. We use derivatives as part of our overall asset/liability risk management program primarily to reduce exposures to equity market and interest rate risks. In addition, we use credit derivatives to replicate exposure to individual securities or pools of securities as a means of achieving credit exposure similar to bonds of the underlying issuer(s) more efficiently. The derivative contracts are an integral part of our risk management program, especially for the management of our variable annuities program, and are collectively managed to reduce the economic impact of unfavorable movements in capital markets. These derivative transactions require liquidity to meet payment obligations such as payments for periodic settlements, purchases, maturities and terminations as well as liquid assets pledged as collateral related to any decline in the net estimated fair value. Collateral calls represent one of our biggest drivers for liquidity needs for our insurance subsidiaries. Historically, we have managed our liquidity needs related to our derivative portfolio at AXA Financial and AXA RE Arizona on a combined basis. Due to the limited size of the AXA RE Arizona investment portfolio, we have historically supported its collateral funding needs through AXA Financial’s commercial paper program. Following the GMxB Unwind, which was effected on April 12, 2018, our derivatives contracts reside primarily within AXA Equitable Life. As AXA Equitable Life has a significantly larger investment portfolio than AXA RE Arizona had, we anticipate a reduced need for overall liquidity going forward.
FHLB Membership
AXA Equitable Life is a member of the Federal Home Loan Bank of New York (“FHLBNY”), which provides AXA Equitable Life with access to collateralized borrowings and other FHLBNY products. At December 31, 2017, we had $500 million of outstanding short-term funding agreements and $2.5 billion of long-term outstanding funding agreements issued to the FHLBNY and had posted $4.5 billion securities as collateral for funding agreements. MLOA also became a member of the Federal Home Loan Bank of San Francisco in February 2018.
Sources and Uses of Liquidity of our Investment Management and Research Segment
The principal sources of liquidity for our Investment Management and Research segment include investment management fees and borrowings under its revolving credit facility and commercial paper program. The principal uses of liquidity include general and administrative expenses, business financing and distributions to holders of AB Units and AB Holdings Units plus interest and debt service. The primary liquidity risk for our fee-based Investment Management and Research segment is its profitability, which is impacted by market conditions and our investment management performance.
AB has a $1.0 billion committed, unsecured senior revolving credit facility with a group of commercial banks and other lenders, which matures on October 22, 2019. The credit facility provides for possible increases in the principal amount by up to an aggregate incremental amount of $250 million. Any such increase is subject to the consent of the affected lenders. The AB Credit Facility is available for AB and SCB LLC, for business purposes, including the support of AB’s $1.0 billion commercial paper program. Borrowings under the AB Credit Facility bear interest at a rate per annum, which will be, at our option, a rate equal to an applicable margin, which is subject to adjustment based on the credit ratings of AB, plus one of the following indices: London Interbank Offered Rate, a floating base rate or the Federal Funds rate. See “Recapitalization—Indebtedness Remaining Outstanding Following this Offering—AB” for additional details on the AB Credit Facility.
As of December 31, 2017 and 2016, AB and SCB LLC had no amounts outstanding under the AB Credit Facility. During 2017 and 2016, AB and SCB LLC did not draw upon the AB Credit Facility.
AB has a $200 million, unsecured 364-day senior revolving credit facility (the “AB Revolver”) with a leading international bank and the other lending institutions that may be party thereto. The AB Revolver is available for AB’s and SCB LLC’s business purposes, including the provision of additional liquidity to meet funding requirements primarily related to SCB LLC’s operations. Both AB and SCB LLC can draw directly
150
Table of Contents
under the AB Revolver and management expects to draw on the AB Revolver from time to time. AB has agreed to guarantee the obligations of SCB LLC under the AB Revolver. As of December 31, 2017 and 2016, AB had $75.0 million and $0 million, respectively, outstanding under the AB Revolver. Average daily borrowing of the AB Revolver for 2017 and 2016 were $21.4 million and $7.3 million, respectively, with weighted average interest rates of approximately 2.0% and 1.6%, respectively.
In addition, SCB LLC also has three uncommitted lines of credit with three financial institutions. Two of these lines of credit permit us to borrow up to an aggregate of $175 million, with AB named as an additional borrower, while one line has no stated limit. As of December 31, 2017 and 2016, SCB LLC had no bank loans outstanding.
Consolidated Cash Flow Analysis
We believe that cash flows from our operations on a consolidated basis are adequate to satisfy current liquidity requirements. The continued adequacy of our liquidity will depend upon factors such as future market conditions, changes in interest rate levels, policyholder perceptions of our financial strength, policyholder behavior, the effectiveness of our hedging programs, catastrophic events and the relative safety and attractiveness of competing products. Changes in any of these factors may result in reduced or increased cash outflows. Our insurance subsidiaries’ cash flows from investment activities result from repayments of principal, proceeds from maturities and sales of invested assets and investment income, net of amounts reinvested. The primary liquidity risks with respect to these cash flows are the risk of default by debtors or bond insurers, our counterparties’ willingness to extend repurchase agreements, commitments to invest and market volatility. We closely manage these risks through our asset/liability management process and regular monitoring of our liquidity position.
| Years Ended December 31, | ||||||||||||
| 2017 | 2016 | 2015 | ||||||||||
| (in billions) | ||||||||||||
| Cash and Cash Equivalents, beginning of period |
$ | 5.7 | $ | 6.6 | $ | 6.0 | ||||||
| Net cash provided by (used in) operating activities |
1.0 | (0.2 | ) | (0.2 | ) | |||||||
| Net cash provided by (used in) investing activities |
(9.7 | ) | (5.8 | ) | (2.1 | ) | ||||||
| Net cash provided by financing activities |
7.8 | 5.1 | 2.9 | |||||||||
|
|
|
|
|
|
|
|||||||
| Cash and Cash Equivalents, end of period |
$ | 4.8 | $ | 5.7 | $ | 6.6 | ||||||
|
|
|
|
|
|
|
|||||||
Year Ended December 31, 2017 Compared to the Year Ended December 31, 2016
Cash and cash equivalents at December 31, 2017 were $4.8 billion, a decrease of $0.9 billion from cash and cash equivalents of $5.7 billion at December 31, 2016.
Cash inflows from operating activities were $1.0 billion in 2017 and cash outflows from operating activities were $0.2 billion in 2016.
Net cash used in investing activities were $9.7 billion in 2017, an increase of $3.9 billion from 2016, primarily related to $6.5 billion higher net purchase of investments mainly to support net deposits to policyholders’ account balances and $2.0 billion higher cash outflow from the settlement of derivatives, which was partially offset by an increase of $4.6 billion of proceeds from the sale and settlement of investments.
Net cash provided by financing activities were $7.8 billion in 2017, an increase of $2.7 billion in 2016. The increase was primarily driven by $0.6 billion higher net deposits to policyholders’ account balances ($10.6 billion in 2017 compared to $10.0 billion in 2016) and $2.4 billion lower cash outflows from net repayments of loans from affiliates (net proceeds of $0.7 billion in 2017 compared to net repayments of $1.8 billion in 2016).
151
Table of Contents
Year Ended December 31, 2016 Compared to Year Ended December 31, 2015
Cash and cash equivalents at December 31, 2016 were $5.7 billion, a decrease of $0.9 billion from cash and cash equivalents of $6.6 billion at December 31, 2015.
Cash outflows from operating activities were $0.2 billion in 2016 and 2015.
Net cash used in investing activities were $5.8 billion in 2016, an increase of $3.7 billion from 2015, primarily related to $3.2 billion higher net purchase of investments mainly to support net deposits to policyholders’ account balances and $0.8 billion lower cash inflow from the settlement of derivatives (cash outflows of $0.2 billion in 2016 compared to $0.6 billion of cash inflows in 2015).
Net cash provided by financing activities were $5.1 billion in 2016, an increase of $2.2 billion in 2016. The increase was primarily driven by $4.7 billion higher net deposits to policyholders’ account balances ($10 billion in 2016 compared to $5.3 billion in 2015). Partially offsetting the net cash inflows from net deposits were $0.3 billion higher cash outflows from net repayments of loans from affiliates (repayments of $1.8 billion in 2016 compared to net repayments of $1.5 billion in 2015) and $1.0 billion higher net cash outflows from change in collateralized pledged assets ($1.0 billion in 2016 compared to $0.0 billion in 2015).
Statutory Capital of Our Insurance Subsidiaries
Our capital management framework is primarily based on statutory RBC standards and the CTE asset standard for our variable annuity business.
RBC requirements are used as minimum capital requirements by the NAIC and the state insurance departments to evaluate the capital condition of regulated insurance companies. RBC is based on a formula calculated by applying factors to various asset, premium, claim, expense and statutory reserve items. The formula takes into account the risk characteristics of the insurer, including asset risk, insurance risk, interest rate risk, market risk and business risk and is calculated on a quarterly basis and made public on an annual basis. The formula is used as an early warning regulatory tool to identify possible inadequately capitalized insurers for purposes of initiating regulatory action, and not as a means to rank insurers generally. These rules apply to our insurance company subsidiaries and not to Holdings. State insurance laws provide insurance regulators the authority to require various actions by, or take various actions against, insurers whose total adjusted capital does not meet or exceed certain RBC levels. At the date of the most recent annual statutory financial statements filed with insurance regulators, the total adjusted capital of each of these insurance company subsidiaries subject to these requirements was in excess of each of those RBC levels.
CTE is a statistical measure of tail risk which quantifies the total asset requirement to sustain a loss if an event outside a given probability level has occurred. In the case of our analysis of variable annuity guarantees, CTE98 denotes the financial resources a company would need to cover the average of the worst 2% of scenarios.
We target to maintain an asset level for all variable annuity products at or above a CTE98 level under most economic scenarios. For our non-variable annuity insurance liabilities, we target to maintain a RBC ratio of 350-400%.
Captive Reinsurance Companies
We use captive reinsurance companies to more effectively manage our reserves and capital on an economic basis and to enable the aggregation and transfer of risks. Our captive reinsurance companies assume business from affiliates only and are closed to new business. All of our captive reinsurance companies are wholly owned subsidiaries and are located in the United States. In addition to state insurance regulation, our captives are subject to internal policies governing their activities. We continue to analyze the use of our existing captive reinsurance
152
Table of Contents
structures, as well as additional third-party reinsurance arrangements. On April 12, 2018, we effected an unwind of certain of our existing captive reinsurance structures. See “The Reorganization Transactions—Unwind of GMxB Reinsurance.”
Description of Certain Indebtedness
Historically, our insurance companies have relied on AXA for most of our financing, either through internal loans or guarantees. As described above, we have put in place a stand-alone financing strategy at Holdings targeting an overall indebtedness level in line with our U.S. public company peers. AB historically has been self-reliant for its financing, and we expect AB will remain so in its financing activities going forward. As of December 31, 2017 and December 31, 2016, our total short-term and long-term external debt on a consolidated basis was $2.4 billion and $1.6 billion, respectively. The following table sets forth our total consolidated borrowings as of the dates indicated. Our financial strategy going forward will remain subject to market conditions and other factors.
| As of December 31, 2017 | As of December 31, 2016 | |||||||||||||||||||||||||||||||
| Holdings and AXA Financial |
AXA Equitable Life(1) |
AB | Consolidated | Holdings and AXA Financial |
AXA Equitable Life |
AB | Consolidated | |||||||||||||||||||||||||
| (in millions) | ||||||||||||||||||||||||||||||||
| Short-term and long-term debt |
||||||||||||||||||||||||||||||||
| Commercial paper |
$ | 1,290 | $ | — | $ | 491 | $ | 1,781 | $ | 743 | $ | — | $ | 513 | $ | 1,256 | ||||||||||||||||
| AB Revolver |
— | — | 75 | 75 | — | — | — | — | ||||||||||||||||||||||||
| Long-term debt |
349 | 203 | — | 552 | 349 | — | — | 349 | ||||||||||||||||||||||||
|
|
|
|
|
|
|
|
|
|
|
|
|
|
|
|
|
|||||||||||||||||
| Total short-term and long-term debt |
1,639 | 203 | 566 | 2,408 | 1,092 | — | 513 | 1,605 | ||||||||||||||||||||||||
|
|
|
|
|
|
|
|
|
|
|
|
|
|
|
|
|
|||||||||||||||||
| Loans from affiliates |
||||||||||||||||||||||||||||||||
| Loans from affiliates |
3,622 | — | — | 3,622 | 2,904 | — | — | 2,904 | ||||||||||||||||||||||||
|
|
|
|
|
|
|
|
|
|
|
|
|
|
|
|
|
|||||||||||||||||
| Total borrowings |
$ | 5,261 | $ | 203 | $ | 566 | $ | 6,030 | $ | 3,996 | $ | — | $ | 513 | $ | 4,509 | ||||||||||||||||
|
|
|
|
|
|
|
|
|
|
|
|
|
|
|
|
|
|||||||||||||||||
| (1) | In March 2018, AXA Equitable Life sold its interest in two real estate joint ventures to AXA France for a total purchase price of approximately $143 million, which resulted in the elimination of the $203 million long-term debt shown in this column on Holdings’ consolidated balance sheet for the first quarter of 2018. |
In February 2018, we entered into a $3.9 billion two-year senior unsecured delayed draw term loan agreement, a $500 million three-year senior unsecured delayed draw term loan agreement and a $2.5 billion five-year senior unsecured revolving credit facility, which may provide significant support to our liquidity position when alternative sources of credit are limited. The Credit Facilities contain certain administrative, reporting, legal and financial covenants, including requirements to maintain a specified minimum consolidated net worth and to maintain a ratio of indebtedness to total capitalization not in excess of a specified percentage, and limitations on the dollar amount of indebtedness that may be incurred by our subsidiaries and the dollar amount of secured indebtedness that may be incurred by the Company, which could restrict our operations and use of funds. Borrowings under the term loan agreements may be made only prior to this offering. In April 2018, we terminated the two-year term loan agreement, and, in May 2018, we intend to borrow $300 million under the three-year term loan agreement. In addition to the Credit Facilities, we entered into letter of credit facilities with an aggregate principal amount of approximately $1.9 billion, primarily to be used to support our life insurance business reinsured to EQ AZ Life Re following the GMxB Unwind. In April 2018, we also issued $3.8 billion in aggregate principal amount of the Notes to third party investors. See “Recapitalization.”
The right to borrow funds under the Credit Facilities is subject to the fulfillment of certain conditions, including compliance with all covenants, and the ability to borrow thereunder is also subject to the continued
153
Table of Contents
ability of the lenders that are or will be parties to the Credit Facilities to provide funds. For additional information regarding the covenants in our Credit Facilities and the conditions to borrowing thereunder, see “Risk Factors—Risks Relating to Our Operations—We expect to incur indebtedness in connection with the Recapitalization, which will increase our costs, and the degree to which we will be leveraged following completion of the Reorganization Transactions and this offering could materially and adversely affect our business, results of operations or financial condition.” For a discussion of the consequences of violating or breaching any covenants in our Credit Facilities and obtaining waivers thereunder, see “Risk Factors—Risks Relating to Our Operations—A violation or breach of the representations, warranties or covenants contained in any of our Credit Facilities or letter of credit facilities could result in a default or event of default, which would require a waiver or amendment with the consent of our lenders. The failure to obtain any such waiver or amendment would have a material adverse effect on our business, results of operations or financial condition.”
Ratings
Financial strength ratings (which are sometimes referred to as “claims-paying” ratings) and credit ratings are important factors affecting public confidence in an insurer and its competitive position in marketing products. Our credit ratings are also important for our ability to raise capital through the issuance of debt and for the cost of such financing.
A downgrade of our debt ratings could affect our ability to raise additional debt with terms and conditions similar to our current debt, and accordingly, likely increase our cost of capital. In addition, a downgrade of these ratings could make it more difficult to raise capital to refinance any maturing debt obligations, to support business growth at our insurance subsidiaries and to maintain or improve the current financial strength ratings of our principal insurance subsidiaries. Upon announcement of AXA’s plan to pursue this offering and the filing of our initial Form S-1 on November 13, 2017, AXA Equitable Life’s and AXA Financial’s ratings were downgraded by AM Best, S&P and Moody’s. The downgrades reflected the removal of the uplift associated with assumed financial support from AXA.
Financial strength ratings represent the opinions of rating agencies regarding the financial ability of an insurance company to meet its obligations under an insurance policy. Credit ratings represent the opinions of rating agencies regarding an entity’s ability to repay its indebtedness. The following table summarizes the ratings for Holdings and certain of its subsidiaries. S&P and Moody’s financial strength and credit ratings have a stable outlook while AM Best ratings are currently under review with developing implications.
| AM Best |
S&P | Moody’s | ||||||||||
| Last review date | 3/7/2018 | 3/6/2018 | 4/11/2018 | |||||||||
| Financial Strength Ratings: |
||||||||||||
| AXA Equitable Life |
A | A+ | A2 | |||||||||
| MLOA |
A | A+ | A2 | |||||||||
| Credit Ratings: |
||||||||||||
| Holdings |
— | BBB+ | Baa2 | |||||||||
| AXA Financial |
bbb+ | BBB+ | Baa2 | |||||||||
| AB(1) |
— | A | A2 | |||||||||
| (1) | Last review date 5/10/2017 |
Contractual Obligations
The table below summarizes the future estimated cash payments related to certain contractual obligations as of December 31, 2017. The estimated payments reflected in this table are based on management’s estimates and assumptions about these obligations. Because these estimates and assumptions are necessarily subjective, the
154
Table of Contents
actual cash outflows in future periods will vary, possibly materially, from those reflected in the table. In addition, we do not believe that our cash flow requirements can be adequately assessed based solely upon an analysis of these obligations, as the table below does not contemplate all aspects of our cash inflows, such as the level of cash flow generated by certain of our investments, nor all aspects of our cash outflows.
| Estimated Payments Due by Period(2) | ||||||||||||||||||||
| Total | Less than 1 year |
1 - 3 years | 4 - 5 years | Over 5 years |
||||||||||||||||
| (in millions) | ||||||||||||||||||||
| Contractual Obligations |
||||||||||||||||||||
| Policyholders’ liabilities(1) |
$ | 102,333 | $ | 2,230 | $ | 5,650 | $ | 7,159 | $ | 87,294 | ||||||||||
| FHLBNY funding agreements |
3,000 | 500 | 208 | 1,413 | 879 | |||||||||||||||
| Interest on FHLBNY funding agreements |
315 | 57 | 117 | 75 | 66 | |||||||||||||||
| AB commercial paper |
491 | 491 | — | — | — | |||||||||||||||
| AB Revolver |
75 | 75 | — | — | — | |||||||||||||||
| AXA Financial commercial paper |
1,290 | 1,290 | — | — | — | |||||||||||||||
| Operating leases |
1,256 | 214 | 384 | 324 | 334 | |||||||||||||||
| Long-term debt |
552 | — | — | 82 | 470 | |||||||||||||||
| Interest on long-term debt |
319 | 33 | 65 | 64 | 157 | |||||||||||||||
| Loans from affiliates |
3,622 | 1,092 | 770 | 366 | 1,394 | |||||||||||||||
| Interest on loans from affiliates |
618 | 96 | 188 | 145 | 189 | |||||||||||||||
| Employee benefits |
5,902 | 284 | 564 | 540 | 4,514 | |||||||||||||||
| AB funding commitments |
22 | 9 | 6 | 3 | 4 | |||||||||||||||
|
|
|
|
|
|
|
|
|
|
|
|||||||||||
| Total Contractual Obligations |
$ | 119,795 | $ | 6,371 | $ | 7,952 | $ | 10,171 | $ | 95,301 | ||||||||||
|
|
|
|
|
|
|
|
|
|
|
|||||||||||
| (1) | Policyholders’ liabilities represent estimated cash flows out of the General Account related to the payment of death and disability claims, policy surrenders and withdrawals, annuity payments, minimum guarantees on Separate Account funded contracts, matured endowments, benefits under accident and health contracts, policyholder dividends and future renewal premium-based and fund-based commissions offset by contractual future premiums and deposits on in-force contracts. These estimated cash flows are based on mortality, morbidity and lapse assumptions comparable with the Company’s experience and assume market growth and interest crediting consistent with actuarial assumptions used in amortizing DAC. These amounts are undiscounted and, therefore, exceed the policyholders’ account balances and future policy benefits and other policyholder liabilities included in the consolidated balance sheet included elsewhere in this prospectus. They do not reflect projected recoveries from reinsurance agreements. Due to the use of assumptions, actual cash flows will differ from these estimates, see “—Summary of Critical Accounting Policies—Liability for Future Policy Benefits.” Separate Account liabilities have been excluded as they are legally insulated from General Account obligations and will be funded by cash flows from Separate Account assets. |
| (2) | Without giving effect to the Reorganization Transactions. |
Unrecognized tax benefits of $477 million, including $8 million related to AB, were not included in the above table because it is not possible to make reasonably reliable estimates of the occurrence or timing of cash settlements with the respective taxing authorities.
In addition, the below items are included as part of AB’s aggregate contractual obligations:
| • | At year-end 2017, AB had a $246 million accrual for compensation and benefits, of which $154 million is expected to be paid in 2018, $45 million in 2019 and 2020, $20 million in 2021-2022 and the rest thereafter. Further, AB expects to make contributions to its qualified profit sharing plan of $14 million in each of the next four years. |
| • | In addition, the Company has obligations under contingent commitments at December 31, 2017, including: the AB Credit Facility and AB’s commercial paper program; the Company’s $4,489 million |
155
Table of Contents
| undrawn letters of credit; the Company’s $756 million and $636 million commitments under equity financing arrangements to certain limited partnership and existing mortgage loan agreements, respectively. Information on these contingent commitments can be found in notes 10, 16 and 17 to the notes to our annual financial statements included elsewhere in this prospectus. |
| • | During 2010, as general partner of AllianceBernstein U.S. Real Estate L.P. (“Real Estate Fund”), AB committed to invest $25.0 million in the Real Estate Fund. As of December 31, 2017, AB had funded $22.4 million of this commitment. During 2014, as general partner of AllianceBernstein U.S. Real Estate II L.P. (“Real Estate Fund II”), AB committed to invest $28.0 million, as amended in 2015, in the Real Estate Fund II. As of December 31, 2017, AB had funded $10.4 million of this commitment. |
| • | During 2012, AB entered into an investment agreement under which it committed to invest up to $8 million in an oil and gas fund over a three-year period. As of December 31, 2017, AB had funded $6 million of this commitment. |
| • | During 2009, AB entered into a subscription agreement under which it committed to invest up to $35 million, as amended in 2011, in a venture capital fund over a six-year period. As of December 31, 2017, AB had funded all of this commitment. |
Off-Balance Sheet Arrangements
At December 31, 2017, the Company was not a party to any off-balance sheet transactions other than those guarantees and commitments described in note 10 and note 16 to the notes to our annual financial statements included elsewhere in this prospectus.
Summary of Critical Accounting Policies
The preparation of financial statements in conformity with U.S. GAAP requires management to adopt accounting policies and make estimates and assumptions that affect amounts reported in our consolidated financial statements included elsewhere herein. For a discussion of our significant accounting policies, see note 2 to the notes to our annual financial statements included elsewhere in this prospectus. The most critical estimates include those used in determining:
| • | liabilities for future policy benefits; |
| • | accounting for reinsurance; |
| • | capitalization and amortization of DAC; |
| • | estimated fair values of investments in the absence of quoted market values and investment impairments; |
| • | estimated fair values of freestanding derivatives and the recognition and estimated fair value of embedded derivatives requiring bifurcation; |
| • | goodwill and related impairment; |
| • | measurement of income taxes and the valuation of deferred tax assets; and |
| • | liabilities for litigation and regulatory matters. |
In applying our accounting policies, we make subjective and complex judgments that frequently require estimates about matters that are inherently uncertain. Many of these policies, estimates and related judgments are common in the insurance and financial services industries while others are specific to our business and operations. Actual results could differ from these estimates.
During the course of preparing our U.S. GAAP financial statements for this offering, we identified two material weaknesses in the design and operation of our internal control over financial reporting. Our management
156
Table of Contents
has concluded that we do not (1) maintain effective controls to timely validate that actuarial models are properly configured to capture all relevant product features and to provide reasonable assurance that timely reviews of assumptions and data have occurred; and (2) maintain sufficient experienced personnel to prepare Holdings’ consolidated financial statements and to verify that consolidating and adjusting journal entries were completely and accurately recorded to the appropriate accounts or segments. We are currently in the process of remediating these material weaknesses by taking steps to (i) validate all existing actuarial models and valuation systems as well as to improve controls and process around our assumption and data process and (ii) strengthen the control function related to the financial closing process. Although we plan to complete these remediation processes as quickly as possible, we cannot at this time estimate when the remediations will be completed. See “Risk Factors—Risks Relating to Our Common Stock—During the course of preparing our U.S. GAAP financial statements for this offering, we identified two material weaknesses in our internal control over financial reporting. If our remediation of these material weaknesses is not effective, we may not be able to report our financial condition or results of operations accurately or on a timely basis, which could materially and adversely affect investor confidence in us and, as a result, the price of our common stock.”
Liability for Future Policy Benefits
We establish reserves for future policy benefits to, or on behalf of, policyholders in the same period in which the policy is issued or acquired, using methodologies prescribed by U.S. GAAP. The assumptions used in establishing reserves are generally based on the Company’s experience, industry experience or other factors, as applicable. At least annually we review our actuarial assumptions, such as mortality, morbidity, retirement and policyholder behavior assumptions, and update assumptions when appropriate. Generally, we do not expect trends to change significantly in the short-term and, to the extent these trends may change, we expect such changes to be gradual over the long-term.
The reserving methodologies used include the following:
| • | Universal life (“UL”) and investment-type contract policyholder account balances are equal to the policy AV. The policy AV represent an accumulation of gross premium payments plus credited interest less expense and mortality charges and withdrawals. |
| • | Participating traditional life insurance future policy benefit liabilities are calculated using a net level premium method on the basis of actuarial assumptions equal to guaranteed mortality and dividend fund interest rates. |
| • | Non-participating traditional life insurance future policy benefit liabilities are estimated using a net level premium method on the basis of actuarial assumptions as to mortality, persistency and interest. |
For most long-duration contracts, we utilize best estimate assumptions as of the date the policy is issued or acquired with provisions for the risk of adverse deviation, as appropriate. After the liabilities are initially established, we perform premium deficiency tests using best estimate assumptions as of the testing date without provisions for adverse deviation. If the liabilities determined based on these best estimate assumptions are greater than the net reserves (i.e., U.S. GAAP reserves net of any DAC, DSI or VOBA asset), the existing net reserves are adjusted by first reducing the DAC, DSI or VOBA assets by the amount of the deficiency or to zero through a charge to current period earnings. If the deficiency is more than these asset balances for insurance contracts, we then increase the net reserves by the excess, again through a charge to current period earnings. If a premium deficiency is recognized, the assumptions as of the premium deficiency test date are locked in and used in subsequent valuations and the net reserves continue to be subject to premium deficiency testing.
For certain reserves, such as those related to GMDB and GMIB features, we use current best estimate assumptions in establishing reserves. The reserves are subject to adjustments based on periodic reviews of assumptions and quarterly adjustments for experience, including market performance, and the reserves may be adjusted through a benefit or charge to current period earnings.
157
Table of Contents
For certain GMxB features in our Individual Retirement segment, the benefits are accounted for as embedded derivatives, with fair values calculated as the present value of expected future benefit payments to contractholders less the present value of assessed rider fees attributable to the embedded derivative feature. Under U.S. GAAP, the fair values of these benefit features are based on assumptions a market participant would use in valuing these embedded derivatives. Changes in the fair value of the embedded derivatives are recorded quarterly through a benefit or charge to current period earnings.
The assumptions used in establishing reserves are generally based on the Company’s experience, industry experience and/or other factors, as applicable. We typically update our actuarial assumptions, such as mortality, morbidity, retirement and policyholder behavior assumptions, annually, unless a material change is observed in an interim period that we feel is indicative of a long-term trend. Generally, we do not expect trends to change significantly in the short-term and, to the extent these trends may change, we expect such changes to be gradual over the long-term. In a sustained low interest rate environment, there is an increased likelihood that the reserves determined based on best estimate assumptions may be greater than the net liabilities.
See note 8 to the notes to our annual financial statements included elsewhere in this prospectus for additional information on our accounting policy relating to GMxB features and liability for future policy benefits and note 2 to the notes to our annual financial statements included elsewhere in this prospectus for future policyholder benefit liabilities.
Sensitivity of Future Rate of Return Assumptions on GMDB/GMIB Reserves
The Separate Account future rate of return assumptions that are used in establishing reserves for GMxB features are set using a long term-view of expected average market returns by applying a RTM approach, consistent with that used for DAC amortization. For additional information regarding the future expected rate of return assumptions and the reversion to the mean approach, see “—DAC”.
The GMDB/GMIB reserve balance before reinsurance ceded was $9.0 billion at December 31, 2017. The following table provides the sensitivity of the reserves GMxB features related to variable annuity contracts relative to the future rate of return assumptions by quantifying the adjustments to these reserves that would be required assuming both a 1% increase and decrease in the future rate of return. This sensitivity considers only the direct effect of changes in the future rate of return on operating results due to the change in the reserve balance before reinsurance ceded and not changes in any other assumptions such as persistency, mortality, or expenses included in the evaluation of the reserves, or any changes on DAC or other balances including hedging derivatives and the GMIB reinsurance asset.
GMDB/GMIB Reserves
Sensitivity - Rate of Return
December 31, 2017
| Increase/(Decrease) in GMDB/GMIB Reserves |
||||
| (in millions) | ||||
| 1% decrease in future rate of return |
$ | 1,355 | ||
| 1% increase in future rate of return |
$ | (1,443 | ) | |
Traditional Annuities
The reserves for future policy benefits for annuities include group pension and payout annuities, and, during the accumulation period, are equal to accumulated policyholders’ fund balances and, after annuitization, are
158
Table of Contents
equal to the present value of expected future payments based on assumptions as to mortality, retirement, maintenance expense, and interest rates. Interest rates used in establishing such liabilities range from 1.6% to 5.5% (weighted average of 4.2%). If reserves determined based on these assumptions are greater than the existing reserves, the existing reserves are adjusted to the greater amount.
Health
Individual health benefit liabilities for active lives are estimated using the net level premium method and assumptions as to future morbidity, withdrawals and interest. Benefit liabilities for disabled lives are estimated using the present value of benefits method and experience assumptions as to claim terminations, expenses and interest.
Reinsurance
Accounting for reinsurance requires extensive use of assumptions and estimates, particularly related to the future performance of the underlying business and the potential impact of counterparty credit risk with respect to reinsurance receivables. We periodically review actual and anticipated experience compared to the aforementioned assumptions used to establish assets and liabilities relating to ceded and assumed reinsurance and evaluate the financial strength of counterparties to our reinsurance agreements using criteria similar to those evaluated in our security impairment process. See “—Estimated Fair Value of Investments.” Additionally, for each of our reinsurance agreements, we determine whether the agreement provides indemnification against loss or liability relating to insurance risk, in accordance with applicable accounting standards. We review all contractual features, including those that may limit the amount of insurance risk to which the reinsurer is subject or features that delay the timely reimbursement of claims. If we determine that a reinsurance agreement does not expose the reinsurer to a reasonable possibility of a significant loss from insurance risk, we record the agreement using the deposit method of accounting.
For reinsurance contracts other than those covering GMIB exposure, reinsurance recoverable balances are calculated using methodologies and assumptions that are consistent with those used to calculate the direct liabilities. GMIB reinsurance contracts are used to cede affiliated and non-affiliated reinsurers a portion of the exposure on variable annuity products that offer the GMIB feature. The GMIB reinsurance contracts are accounted for as derivatives and are reported at fair value. Gross reserves for GMIB, on the other hand, are calculated on the basis of assumptions related to projected benefits and related contract charges over the lives of the contracts, therefore, will not immediately reflect the offsetting impact on future claims exposure resulting from the same capital market and/or interest rate fluctuations that cause gains or losses on the fair value of the GMIB reinsurance contracts.
See note 9 to the notes to our annual financial statements included elsewhere in this prospectus for additional information on our reinsurance agreements.
DAC
We incur significant costs in connection with acquiring new and renewal insurance business. Costs that relate directly to the successful acquisition or renewal of insurance contracts, are deferred as DAC. In addition to commissions, certain direct-response advertising expenses and other direct costs, other deferrable costs include the portion of an employee’s total compensation and benefits related to time spent selling, underwriting or processing the issuance of new and renewal insurance business only with respect to actual policies acquired or renewed. We utilize various techniques to estimate the portion of an employee’s time spent on qualifying acquisition activities that result in actual sales, including surveys, interviews, representative time studies and other methods. These estimates include assumptions that are reviewed and updated on a periodic basis or more frequently to reflect significant changes in processes or distribution methods.
159
Table of Contents
Amortization Methodologies
Participating Traditional Life Policies
For participating traditional life policies (substantially all of which are in the Closed Block), DAC is amortized over the expected total life of the contract group as a constant percentage based on the present value of the estimated gross margin amounts expected to be realized over the life of the contracts using the expected investment yield.
At December 31, 2017, the average investment yields assumed (excluding policy loans) were 4.7% grading to 4.3% in 2024. Estimated gross margins include anticipated premiums and investment results less claims and administrative expenses, changes in the net level premium reserve and expected annual policyholder dividends. The effect on the accumulated amortization of DAC of revisions to estimated gross margins is reflected in earnings in the period such estimated gross margins are revised. The effect on the DAC assets that would result from realization of unrealized gains (losses) is recognized with an offset to AOCI in consolidated equity as of the balance sheet date. Many of the factors that affect gross margins are included in the determination of the Company’s dividends to these policyholders. DAC adjustments related to participating traditional life policies do not create significant volatility in results of operations as the Closed Block recognizes a cumulative policyholder dividend obligation expense in “Policyholders’ dividends,” for the excess of actual cumulative earnings over expected cumulative earnings as determined at the time of demutualization.
Non-participating Traditional Life Insurance Policies
DAC associated with non-participating traditional life policies is amortized in proportion to anticipated premiums. Assumptions as to anticipated premiums are estimated at the date of policy issue and are consistently applied during the life of the contracts. Deviations from estimated experience are reflected in earnings (loss) in the period such deviations occur. For these contracts, the amortization periods generally are for the total life of the policy.
Universal Life and Investment-type Contracts
DAC associated with certain variable annuity products is amortized based on estimated assessments, with the remainder of variable annuity products, UL and investment-type products amortized over the expected total life of the contract group as a constant percentage of estimated gross profits arising principally from investment results, Separate Account fees, mortality and expense margins and surrender charges based on historical and anticipated future experience, updated at the end of each accounting period. When estimated gross profits are expected to be negative for multiple years of a contract life, DAC is amortized using the present value of estimated assessments. The effect on the amortization of DAC of revisions to estimated gross profits or assessments is reflected in net income (loss) in the period such estimated gross profits or assessments are revised. A decrease in expected gross profits or assessments would accelerate DAC amortization. Conversely, an increase in expected gross profits or assessments would slow DAC amortization. The effect on the DAC assets that would result from realization of unrealized gains (losses) is recognized with an offset to AOCI in consolidated equity as of the balance sheet date.
Quarterly adjustments to the DAC balance are made for current period experience and market performance related adjustments, and the impact of reviews of estimated total gross profits. The quarterly adjustments for current period experience reflect the impact of differences between actual and previously estimated expected gross profits for a given period. Total estimated gross profits include both actual experience and estimates of gross profits for future periods. To the extent each period’s actual experience differs from the previous estimate for that period, the assumed level of total gross profits may change. In these cases, cumulative adjustment to all previous periods’ costs is recognized.
During each accounting period, the DAC balances are evaluated and adjusted with a corresponding charge or credit to current period earnings for the effects of the Company’s actual gross profits and changes in the
160
Table of Contents
assumptions regarding estimated future gross profits. A decrease in expected gross profits or assessments would accelerate DAC amortization. Conversely, an increase in expected gross profits or assessments would slow DAC amortization. The effect on the DAC assets that would result from realization of unrealized gains (losses) is recognized with an offset to AOCI in consolidated equity as of the balance sheet date.
For the variable and UL policies a significant portion of the gross profits is derived from mortality margins and therefore, are significantly influenced by the mortality assumptions used. Mortality assumptions represent the Company’s expected claims experience over the life of these policies and are based on a long-term average of actual company experience. This assumption is updated periodically to reflect recent experience as it emerges. Improvement of life mortality in future periods from that currently projected would result in future deceleration of DAC amortization. Conversely, deterioration of life mortality in future periods from that currently projected would result in future acceleration of DAC amortization.
Loss Recognition Testing
After the initial establishment of reserves, loss recognition tests are performed using best estimate assumptions as of the testing date without provisions for adverse deviation. When the liabilities for future policy benefits plus the present value of expected future gross premiums for the aggregate product group are insufficient to provide for expected future policy benefits and expenses for that line of business (i.e., reserves net of any DAC asset), DAC is first written off, and thereafter a premium deficiency reserve is established by a charge to earnings.
In 2017, we determined that we had a loss recognition in certain of our variable interest sensitive life insurance products due to low interest rates. As of December 31, 2017, we wrote off $192 million of the DAC balance through accelerated amortization.
In addition, we are required to analyze the impacts from net unrealized investment gains and losses on our available-for-sale investment securities backing insurance liabilities, as if those unrealized investment gains and losses were realized. This may result in the recognition of unrealized gains and losses on related insurance assets and liabilities in a manner consistent with the recognition of the unrealized gains and losses on available-for-sale investment securities within the statements of comprehensive income and changes in equity. Changes to net unrealized investment (gains) losses may increase or decrease the ending DAC balance. Similar to a loss recognition event, when the DAC balance is reduced to zero, additional insurance liabilities are established if necessary. Unlike a loss recognition event, which is based on changes in net unrealized investment (gains) losses, these adjustments may reverse from period to period. In 2017, due primarily to the release of life reserves, we wrote-off $184 million during the year ended December 31, 2017 of our DAC balance, and a cumulative decrease in the accumulated effect of net unrealized investment gains of approximately $238 million as of December 31, 2017 with an offsetting amount recorded in other comprehensive income (loss). There was no impact to net income (loss).
Sensitivity of DAC to Changes in Future Mortality Assumptions
The following table demonstrates the sensitivity of the DAC balance relative to future mortality assumptions by quantifying the adjustments that would be required, assuming an increase and decrease in the future mortality rate by 1.0%. This information considers only the direct effect of changes in the mortality assumptions on the DAC balance and not changes in any other assumptions used in the measurement of the DAC balance and does not assume changes in reserves.
161
Table of Contents
DAC Sensitivity - Mortality
December 31, 2017
| Increase/(Decrease) in DAC |
||||
| (in millions) | ||||
| Decrease in future mortality by 1% |
$ | 34 | ||
| Increase in future mortality by 1% |
$ | (34 | ) | |
Sensitivity of DAC to Changes in Future Rate of Return Assumptions
A significant assumption in the amortization of DAC on variable annuity products and, to a lesser extent, on variable and interest-sensitive life insurance relates to projected future Separate Account performance. Management sets estimated future gross profit or assessment assumptions related to Separate Account performance using a long-term view of expected average market returns by applying a RTM approach, a commonly used industry practice. This future return approach influences the projection of fees earned, as well as other sources of estimated gross profits. Returns that are higher than expectations for a given period produce higher than expected account balances, increase the fees earned resulting in higher expected future gross profits and lower DAC amortization for the period. The opposite occurs when returns are lower than expected.
In applying this approach to develop estimates of future returns, it is assumed that the market will return to an average gross long-term return estimate, developed with reference to historical long-term equity market performance. In second quarter 2015, based upon management’s then-current expectations of interest rates and future fund growth, the Company updated its reversion to the mean assumption from 9.0% to 7.0%. The average gross long-term return measurement start date was also updated to December 31, 2014. Management has set limitations as to maximum and minimum future rate of return assumptions, as well as a limitation on the duration of use of these maximum or minimum rates of return. At December 31, 2017, the average gross short-term and long-term annual return estimate on variable and interest-sensitive life insurance and variable annuity products was 7.0% (4.7% net of product weighted average Separate Account fees), and the gross maximum and minimum short-term annual rate of return limitations were 15.0% (12.7% net of product weighted average Separate Account fees) and 0.0% ((2.3)% net of product weighted average Separate Account fees), respectively. The maximum duration over which these rate limitations may be applied is 5 years. This approach will continue to be applied in future periods. These assumptions of long-term growth are subject to assessment of the reasonableness of resulting estimates of future return assumptions.
If actual market returns continue at levels that would result in assuming future market returns of 15.0% for more than 5 years in order to reach the average gross long-term return estimate, the application of the five-year maximum duration limitation would result in an acceleration of DAC amortization. Conversely, actual market returns resulting in assumed future market returns of 0.0% for more than 5 years would result in a required deceleration of DAC amortization. At December 31, 2017, current projections of future average gross market returns assume a 1.6% annualized return for the next two quarters, followed by 7.0% thereafter.
Other significant assumptions underlying gross profit estimates for UL and investment type products relate to contract persistency and General Account investment spread.
The following table provides an example of the sensitivity of the DAC balance of variable annuity products and variable and interest-sensitive life insurance relative to future return assumptions by quantifying the adjustments to the DAC balance that would be required assuming both an increase and decrease in the future rate of return by 1.0%. This information considers only the effect of changes in the future Separate Account rate of return and not changes in any other assumptions used in the measurement of the DAC balance.
162
Table of Contents
DAC Sensitivity - Rate of Return
December 31, 2017
| Increase/(Decrease) in DAC |
||||
| (in millions) | ||||
| Decrease in future rate of return by 1% |
$ | (123 | ) | |
| Increase in future rate of return by 1% |
$ | 143 | ||
Estimated Fair Value of Investments
The Company’s investment portfolio principally consists of public and private fixed maturities, mortgage loans, equity securities and derivative financial instruments, including exchange traded equity, currency and interest rate futures contracts, total return and/or other equity swaps, interest rate swap and floor contracts, swaptions, variance swaps as well as equity options used to manage various risks relating to its business operations.
Fair Value Measurements
Investments reported at fair value in the consolidated balance sheets of the Company include fixed maturity and equity securities classified as available-for-sale, trading securities and certain other invested assets, such as freestanding derivatives. In addition, reinsurance contracts covering GMIB exposure and the liabilities in the SCS variable annuity products, SIO in the EQUI-VEST variable annuity product series, MSO in the variable life insurance products, IUL insurance products and the GMAB, GIB, GMWB and GWBL feature in certain variable annuity products issued by the Company are considered embedded derivatives and reported at fair value.
When available, the estimated fair value of securities is based on quoted prices in active markets that are readily and regularly obtainable; these generally are the most liquid holdings and their valuation does not involve management judgment. When quoted prices in active markets are not available, the Company estimates fair value based on market standard valuation methodologies. These alternative approaches include matrix or model pricing and use of independent pricing services, each supported by reference to principal market trades or other observable market assumptions for similar securities. More specifically, the matrix pricing approach to fair value is a discounted cash flow methodology that incorporates market interest rates commensurate with the credit quality and duration of the investment. For securities with reasonable price transparency, the significant inputs to these valuation methodologies either are observable in the market or can be derived principally from or corroborated by observable market data. When the volume or level of activity results in little or no price transparency, significant inputs no longer can be supported by reference to market observable data but instead must be based on management’s estimation and judgment. Substantially the same approach is used by the Company to measure the fair values of freestanding and embedded derivatives with exception for consideration of the effects of master netting agreements and collateral arrangements as well as incremental value or risk ascribed to changes in own or counterparty credit risk.
As required by the accounting guidance, we categorize our assets and liabilities measured at fair value into a three-level hierarchy, based on the priority of the inputs to the respective valuation technique, giving the highest priority to quoted prices in active markets for identical assets and liabilities (Level 1) and the lowest priority to unobservable inputs (Level 3). For additional information regarding the key estimates and assumptions surrounding the determinations of fair value measurements, see note 7 to the notes of our annual financial statements included elsewhere in this prospectus.
Impairments and Valuation Allowances
The assessment of whether OTTIs have occurred is performed quarterly by our Investments Under Surveillance (“IUS”) Committee, with the assistance of its investment advisors, on a security-by-security basis
163
Table of Contents
for each available-for-sale fixed maturity and equity security that has experienced a decline in fair value for purpose of evaluating the underlying reasons. The analysis begins with a review of gross unrealized losses by the following categories of securities: (i) all investment grade and below investment grade fixed maturities for which fair value has declined and remained below amortized cost by 20% or more; (ii) below-investment-grade fixed maturities for which fair value has declined and remained below amortized cost for a period greater than 12 months; and (iii) equity securities for which fair value has declined and remained below cost by 20% or greater or remained below cost for a period of 6 months or greater. Integral to the analysis is an assessment of various indicators of credit deterioration to determine whether the investment security is expected to recover, including, but not limited to, consideration of the duration and severity of the unrealized loss, failure, if any, of the issuer of the security to make scheduled payments, actions taken by rating agencies, adverse conditions specifically related to the security or sector, the financial strength, liquidity and continued viability of the issuer and, for equity securities only, the intent and ability to hold the investment until recovery, resulting in identification of specific securities for which OTTI is recognized.
If there is no intent to sell or likely requirement to dispose of the fixed maturity security before its recovery, only the credit loss component of any resulting OTTI is recognized in earnings and the remainder of the fair value loss is recognized in OCI. The amount of credit loss is the shortfall of the present value of the cash flows expected to be collected as compared to the amortized cost basis of the security. The present value is calculated by discounting management’s best estimate of projected future cash flows at the effective interest rate implicit in the debt security at the date of acquisition. Projections of future cash flows are based on assumptions regarding probability of default and estimates regarding the amount and timing of recoveries. These assumptions and estimates require use of management judgment and consider internal credit analyses as well as market observable data relevant to the collectability of the security. For mortgage- and asset-backed securities, projected future cash flows also include assumptions regarding prepayments and underlying collateral value.
Mortgage loans are stated at unpaid principal balances, net of unamortized discounts and valuation allowances. Valuation allowances are based on the present value of expected future cash flows discounted at the loan’s original effective interest rate or on its collateral value if the loan is collateral dependent. However, if foreclosure is or becomes probable, the collateral value measurement method is used.
For commercial and agricultural mortgage loans, an allowance for credit loss is typically recommended when management believes it is probable that principal and interest will not be collected according to the contractual terms. Factors that influence management’s judgment in determining allowance for credit losses include the following:
| • | Loan-to-value ratio—Derived from current loan balance divided by the fair market value of the property. An allowance for credit loss is typically recommended when the loan-to-value ratio is in excess of 100%. In the case where the loan-to-value is in excess of 100%, the allowance for credit loss is derived by taking the difference between the fair market value (less cost of sale) and the current loan balance. |
| • | Debt service coverage ratio—Derived from actual operating earnings divided by annual debt service. If the ratio is below 1.0x, then the income from the property does not support the debt. |
| • | Occupancy—Criteria varies by property type but low or below market occupancy is an indicator of sub-par property performance. |
| • | Lease expirations—The percentage of leases expiring in the upcoming 12 to 36 months are monitored as a decline in rent and/or occupancy may negatively impact the debt service coverage ratio. In the case of single-tenant properties or properties with large tenant exposure, the lease expiration is a material risk factor. |
| • | Maturity—Mortgage loans that are not fully amortizing and have upcoming maturities within the next 12 to 24 months are monitored in conjunction with the capital markets to determine the borrower’s ability to refinance the debt and/or pay off the balloon balance. |
164
Table of Contents
| • | Borrower/tenant related issues—Financial concerns, potential bankruptcy, or words or actions that indicate imminent default or abandonment of property. |
| • | Payment status—current vs. delinquent—A history of delinquent payments may be a cause for concern. |
| • | Property condition—Significant deferred maintenance observed during the lenders annual site inspections. |
| • | Other—Any other factors such as current economic conditions may call into question the performance of the loan. |
Mortgage loans also are individually evaluated quarterly by the IUS Committee for impairment on a loan-by-loan basis, including an assessment of related collateral value. Commercial mortgages 60 days or more past due and agricultural mortgages 90 days or more past due, as well as all mortgages in the process of foreclosure, are identified as problem mortgages. Based on its monthly monitoring of mortgages, a class of potential problem mortgages also is identified, consisting of mortgage loans not currently classified as problems but for which management has doubts as to the ability of the borrower to comply with the present loan payment terms and which may result in the loan becoming a problem or being restructured. The decision whether to classify a performing mortgage loan as a potential problem involves significant subjective judgments by management as to likely future industry conditions and developments with respect to the borrower or the individual mortgaged property.
For problem mortgage loans a valuation allowance is established to provide for the risk of credit losses inherent in the lending process. The allowance includes loan specific reserves for loans determined to be non-performing as a result of the loan review process. A non-performing loan is defined as a loan for which it is probable that amounts due according to the contractual terms of the loan agreement will not be collected. The loan specific portion of the loss allowance is based on the Company’s assessment as to ultimate collectability of loan principal and interest. Valuation allowances for a non-performing loan are recorded based on the present value of expected future cash flows discounted at the loan’s effective interest rate or based on the fair value of the collateral if the loan is collateral dependent. The valuation allowance for mortgage loans can increase or decrease from period to period based on such factors.
Impaired mortgage loans without provision for losses are mortgage loans where the fair value of the collateral or the net present value of the expected future cash flows related to the loan equals or exceeds the recorded investment. Interest income earned on mortgage loans where the collateral value is used to measure impairment is recorded on a cash basis. Interest income on mortgage loans where the present value method is used to measure impairment is accrued on the net carrying value amount of the loan at the interest rate used to discount the cash flows. Changes in the present value attributable to changes in the amount or timing of expected cash flows are reported as investment gains or losses.
Mortgage loans are placed on nonaccrual status once management believes the collection of accrued interest is doubtful. Once mortgage loans are classified as nonaccrual mortgage loans, interest income is recognized under the cash basis of accounting and the resumption of the interest accrual would commence only after all past due interest has been collected or the mortgage loan on real estate has been restructured to where the collection of interest is considered likely.
See notes 2 and 3 to the notes to our annual financial statements included elsewhere in this prospectus for additional information relating to our determination of the amount of allowances and impairments.
Derivatives
We use freestanding derivative instruments to hedge various capital market risks in our products, including: (i) certain guarantees, some of which are reported as embedded derivatives; (ii) current or future changes in the
165
Table of Contents
fair value of our assets and liabilities; and (iii) current or future changes in cash flows. All derivatives, whether freestanding or embedded, are required to be carried on the balance sheet at fair value with changes reflected in either net income (loss) or in other comprehensive income, depending on the type of hedge. Below is a summary of critical accounting estimates by type of derivative.
Freestanding Derivatives
The determination of the estimated fair value of freestanding derivatives, when quoted market values are not available, is based on market standard valuation methodologies and inputs that management believes are consistent with what other market participants would use when pricing such instruments. Derivative valuations can be affected by changes in interest rates, foreign currency exchange rates, financial indices, credit spreads, default risk, nonperformance risk, volatility, liquidity and changes in estimates and assumptions used in the pricing models. See note 8 to the notes to our annual financial statements included elsewhere herein for additional details on significant inputs into the OTC derivative pricing models and credit risk adjustment.
Embedded Derivatives
We issue variable annuity products with guaranteed minimum benefits, some of which are embedded derivatives measured at estimated fair value separately from the host variable annuity product, with changes in estimated fair value reported in net derivative gains (losses). We also have assumed from an affiliate the risk associated with certain guaranteed minimum benefits, which are accounted for as embedded derivatives measured at estimated fair value. The estimated fair values of these embedded derivatives are determined based on the present value of projected future benefits minus the present value of projected future fees attributable to the guarantee. The projections of future benefits and future fees require capital markets and actuarial assumptions, including expectations concerning policyholder behavior. A risk neutral valuation methodology is used under which the cash flows from the guarantees are projected under multiple capital market scenarios using observable risk-free rates.
Market conditions, including, but not limited to, changes in interest rates, equity indices, market volatility and variations in actuarial assumptions, including policyholder behavior, mortality and risk margins related to non-capital market inputs, as well as changes in our nonperformance risk adjustment may result in significant fluctuations in the estimated fair value of the guarantees that could materially affect net income. Changes to actuarial assumptions, principally related to contract holder behavior such as annuitization utilization and withdrawals associated with GMIB riders, can result in a change of expected future cash outflows of a guarantee between the accrual-based model for insurance liabilities and the fair-value based model for embedded derivatives. See note 1 to the notes to our annual financial statements included elsewhere herein for additional information relating to the determination of the accounting model. Risk margins are established to capture the non-capital market risks of the instrument which represent the additional compensation a market participant would require to assume the risks related to the uncertainties in certain actuarial assumptions. The establishment of risk margins requires the use of significant management judgment, including assumptions of the amount and cost of capital needed to cover the guarantees.
With respect to assumptions regarding policyholder behavior, we have recorded charges, and in some cases benefits, in prior years as a result of the availability of sufficient and credible data at the conclusion of each review.
We ceded the risk associated with certain of the variable annuity products with GMxB features described in the preceding paragraphs. The value of the embedded derivatives on the ceded risk is determined using a methodology consistent with that described previously for the guarantees directly written by us with the exception of the input for nonperformance risk that reflects the credit of the reinsurer. However, because certain of the reinsured guarantees do not meet the definition of an embedded derivative and, thus are not accounted for at fair value, significant fluctuations in net income may occur when the change in the fair value of the
166
Table of Contents
reinsurance recoverable is recorded in net income without a corresponding and offsetting change in fair value of the directly written guaranteed liability.
Nonperformance Risk Adjustment
The valuation of our embedded derivatives includes an adjustment for the risk that we fail to satisfy our obligations, which we refer to as our nonperformance risk. The nonperformance risk adjustment, which is captured as a spread over the risk-free rate in determining the discount rate to discount the cash flows of the liability, is determined by taking into consideration publicly available information relating to spreads on corporate bonds in the secondary market comparable to Holdings’ financial strength rating.
The table below illustrates the impact that a range of reasonably likely variances in credit spreads would have on our consolidated balance sheet, excluding the effect of income tax, related to the embedded derivative valuation on certain variable annuity products measured at estimated fair value. Even when credit spreads do not change, the impact of the nonperformance risk adjustment on fair value will change when the cash flows within the fair value measurement change. The table only reflects the impact of changes in credit spreads on our consolidated financial statements included elsewhere herein and not these other potential changes. In determining the ranges, we have considered current market conditions, as well as the market level of spreads that can reasonably be anticipated over the near term. The ranges do not reflect extreme market conditions such as those experienced during the 2008-2009 financial crisis as we do not consider those to be reasonably likely events in the near future.
| Future policyholders’ benefits and other policyholders’ liabilities |
||||
| (in billions) | ||||
| 100% increase in Holdings’ credit spread |
$ | 3.8 | ||
| As reported |
4.4 | |||
| 50% decrease in Holdings’ credit spread |
$ | 4.7 | ||
See note 3 to the notes to our annual financial statements included elsewhere in this prospectus for additional information on our derivatives and hedging programs.
Goodwill
Goodwill represents the excess of purchase price over the estimated fair value of identifiable net assets acquired in a business combination. The Company tests goodwill for recoverability each annual reporting period at December 31 and at interim periods if facts or circumstances are indicative of potential impairment. As further described in notes 2 and 4 to the Company’s annual financial statements included elsewhere in this prospectus, during the first quarter of 2017, the Company early adopted Accounting Standards Update No. 2017-04 (“ASU 2017-04”), Intangibles-Goodwill and Other (Topic 350): Simplifying the Test for Goodwill Impairment. The new guidance eliminates Step 2 goodwill impairment testing that requires a hypothetical purchase price allocation to assess goodwill recoverability when the carrying value of a reporting unit exceeds its fair value and continues to limit the measure of impairment loss to the total amount of goodwill allocated to the reporting unit. The Company’s early adoption of ASU 2017-04 resulted in recognition of an impairment loss of $369 million during first quarter 2017, representing all of the goodwill attributed to its Financial/Advisory Insurance segment. As application of the new guidance is required prospectively, prior reporting periods were not restated for the impact of adoption. As further described in notes 4 and 18 to the Company’s annual financial statements included elsewhere in this prospectus, in the fourth quarter of 2017, the Company recast its operating segments to align with the reorganization of its reporting structure, thereby resulting in identification of new reporting units and the reassignment of goodwill related to those affected. At December 31, 2017, the Company’s $4.6 billion of
167
Table of Contents
goodwill results solely from its investment in AB and is attributed to the Investment Management and Research segment, also deemed a reporting unit for purpose of assessing the recoverability of that goodwill.
Estimating the fair value of reporting units for the purpose of goodwill impairment testing is a subjective process that involves the use of significant judgements by management. Estimates of fair value are inherently uncertain and represent management’s reasonable expectation regarding future developments, giving consideration to internal strategic plans and general market and economic forecasts. The company uses a discounted cash flow approach as its primary valuation methodology and validates the fair value to market comparables and industry metrics. Determining estimated fair value using a discounted cash flow valuation technique consists of applying business growth rate assumptions over the estimated life of the goodwill asset and then discounting the resulting expected cash flows using an estimated weighted average cost of capital of market participants to arrive at a present value amount that approximates fair value. Key inputs and assumptions include projected cash flows, the level of economic capital required to support the business mix, growth of the existing business, projections of renewed business and margins on such business, interest rates, credit spreads, equity market levels, and the discount rate.
Litigation Contingencies
We are a party to a number of legal actions and are involved in a number of regulatory investigations. Given the inherent unpredictability of these matters, it is difficult to estimate the impact on our financial position.
Liabilities are established when it is probable that a loss has been incurred and the amount of the loss can be reasonably estimated. On a quarterly and annual basis, we review relevant information with respect to liabilities for litigation, regulatory investigations and litigation-related contingencies to be reflected in our consolidated financial statements included elsewhere herein.
See note 16 to the notes to our annual financial statements included elsewhere in this prospectus for information regarding our assessment of litigation contingencies.
Income Taxes
Income taxes represent the net amount of income taxes that the Company expects to pay to or receive from various taxing jurisdictions in connection with its operations. The Company provides for Federal and state income taxes currently payable, as well as those deferred due to temporary differences between the financial reporting and tax bases of assets and liabilities. Deferred tax assets and liabilities are measured at the balance sheet date using enacted tax rates expected to apply to taxable income in the years the temporary differences are expected to reverse. The realization of deferred tax assets depends upon the existence of sufficient taxable income within the carryforward periods under the tax law in the applicable jurisdiction. Valuation allowances are established when management determines, based on available information, that it is more likely than not that deferred tax assets will not be realized. Management considers all available evidence including past operating results, the existence of cumulative losses in the most recent years, forecasted earnings, future taxable income and prudent and feasible tax planning strategies. The Company’s accounting for income taxes represents management’s best estimate of the tax consequences of various events and transactions.
Significant management judgment is required in determining the provision for income taxes and deferred tax assets and liabilities, and in evaluating the Company’s tax positions including evaluating uncertainties under the guidance for Accounting for Uncertainty in Income taxes. Under the guidance, the Company determines whether it is more likely than not that a tax position will be sustained upon examination by the appropriate taxing authorities before any part of the benefit can be recorded in the financial statements. Tax positions are then measured at the largest amount of benefit that is greater than 50 percent likely of being realized upon settlement.
The Company’s tax positions are reviewed quarterly and the balances are adjusted as new information becomes available.
168
Table of Contents
Profits Followed by Losses (“PFBL”)
Certain policyholder liability balances for a particular line of business may not be deficient in the aggregate to trigger loss recognition; however, the pattern of earnings may be such that profits are expected to be recognized in earlier years and then followed by losses in later years. In these situations, accounting standards require that an additional PFBL liability be recognized by an amount necessary to sufficiently offset the losses that would be recognized in later years. The PFBL liability is based on current estimate of the present value of the amount necessary to offset losses anticipated in future periods.
Adoption of New Accounting Pronouncements
See note 2 to the notes to our annual financial statements included elsewhere in this prospectus for a complete discussion of newly issued accounting pronouncements.
169
Table of Contents
QUANTITATIVE AND QUALITATIVE DISCLOSURES ABOUT MARKET RISK
Our businesses are subject to financial, market, political and economic risks, as well as to risks inherent in its business operations. The discussion that follows provides additional information on market risks arising from its insurance asset/liability management and investment management activities. Such risks are evaluated and managed by each business on a decentralized basis. Primary market risk exposure results from interest rate fluctuations, equity price movements and changes in credit quality.
Individual Retirement, Group Retirement and Protection Solutions Segments
Our results significantly depend on profit margins or “spreads” between investment results from assets held in the GAIA and interest credited on individual insurance and annuity products. Management believes its fixed rate liabilities should be supported by a portfolio principally composed of fixed rate investments that generate predictable, steady rates of return. Although these assets are purchased for long-term investment, the portfolio management strategy considers them available for sale in response to changes in market interest rates, changes in prepayment risk, changes in relative values of asset sectors and individual securities and loans, changes in credit quality outlook and other relevant factors. See the “Investments” section of note 2 to the notes to our annual financial statements included elsewhere in this prospectus for the accounting policies for the investment portfolios. The objective of portfolio management is to maximize returns, taking into account interest rate and credit risks. Insurance asset/liability management includes strategies to minimize exposure to loss as interest rates and economic and market conditions change. As a result, the fixed maturity portfolio has modest exposure to call and prepayment risk and the vast majority of mortgage holdings are fixed rate mortgages that carry yield maintenance and prepayment provisions.
Investments with Interest Rate Risk—Fair Value
Assets with interest rate risk include available-for-sale and trading fixed maturities and mortgage loans that make up 80.6% and 77.1% of the carrying value of General Account Investment Assets at December 31, 2017 and December 31, 2016, respectively. As part of our asset/liability management, quantitative analyses are used to model the impact various changes in interest rates have on assets with interest rate risk. The table that follows shows the impact an immediate 1% increase/decrease in interest rates at December 31, 2017 and December 31, 2016 would have on the fair value of fixed maturities and mortgage loans:
Interest Rate Risk Exposure
| December 31, 2017 | December 31, 2016 | |||||||||||||||||||||||
| Fair Value |
Impact of +1% Change |
Impact of -1% Change |
Fair Value |
Impact of +1% Change |
Impact of -1% Change |
|||||||||||||||||||
| (in millions) | ||||||||||||||||||||||||
| Fixed Income Investments |
||||||||||||||||||||||||
|
Available-for-sale: |
||||||||||||||||||||||||
| Fixed rate |
$ | 44,899 | $ | (4,375 | ) | $ | 5,293 | $ | 40,428 | $ | (3,795 | ) | $ | 4,658 | ||||||||||
| Floating rate |
2,022 | (2 | ) | 2 | 1,431 | (2 | ) | 2 | ||||||||||||||||
| Trading securities: |
||||||||||||||||||||||||
| Fixed rate |
11,404 | (283 | ) | 294 | 8,127 | (178 | ) | 185 | ||||||||||||||||
| Floating rate |
541 | (1 | ) | 1 | 377 | (1 | ) | 1 | ||||||||||||||||
| Mortgage loans |
$ | 10,912 | $ | (596 | ) | $ | 432 | $ | 9,624 | $ | (547 | ) | $ | 460 | ||||||||||
A 1% increase/decrease in interest rates is a hypothetical rate scenario used to demonstrate potential risk; it does not represent management’s view of future market changes. While these fair value measurements provide a representation of interest rate sensitivity of fixed maturities and mortgage loans, they are based on various
170
Table of Contents
portfolio exposures at a particular point in time and may not be representative of future market results. These exposures will change as a result of ongoing portfolio activities in response to management’s assessment of changing market conditions and available investment opportunities.
Investments with Equity Price Risk—Fair Value
The investment portfolios also have direct holdings of public and private equity securities. The following table shows the potential exposure from those equity security investments, measured in terms of fair value, to an immediate 10% increase/decrease in equity prices from those prevailing at December 31, 2017 and December 31, 2016:
Equity Price Risk Exposure
| December 31, 2017 | December 31, 2016 | |||||||||||||||||||||||
| Fair Value |
Impact of +10% Equity Price Change |
Impact of -10% Equity Price Change |
Fair Value |
Impact of +10% Equity Price Change |
Impact of -10% Equity Price Change |
|||||||||||||||||||
| (in millions) | ||||||||||||||||||||||||
| Equity Investments |
||||||||||||||||||||||||
|
Available-For-Sale |
$ | 158 | $ | 16 | $ | (16 | ) | $ | 113 | $ | 11 | $ | (11 | ) | ||||||||||
A 10% decrease in equity prices is a hypothetical scenario used to calibrate potential risk and does not represent management’s view of future market changes. The fair value measurements shown are based on the equity securities portfolio exposures at a particular point in time and these exposures will change as a result of ongoing portfolio activities in response to management’s assessment of changing market conditions and available investment opportunities.
Liabilities with Interest Rate Risk—Fair Value
At December 31, 2017 and December 31, 2016, the aggregate carrying values of insurance contracts with interest rate risk net of reinsurance were $5.1 billion and $4.5 billion, respectively. The aggregate fair value of such liabilities at December 31, 2017 and December 31, 2016 were $5.2 billion and $4.5 billion, respectively. The impact of a relative 1% decrease in interest rates would be an increase in the fair value of those liabilities of $0.2 billion and $0.2 billion, respectively. While these fair value measurements provide a representation of the interest rate sensitivity of insurance liabilities, they are based on the composition of such liabilities at a particular point in time and may not be representative of future results.
Asset/liability management is integrated into many aspects of the Individual Retirement, Group Retirement and Protection Solutions segments’ operations, including investment decisions, product development and determination of crediting rates. As part of our risk management process, numerous economic scenarios are modeled, including cash flow testing required for insurance regulatory purposes, to determine if existing assets would be sufficient to meet projected liability cash flows. Key variables include policyholder behavior, such as persistency, under differing crediting rate strategies.
Derivatives and Interest Rate and Equity Risks—Fair Value
We primarily use derivative contracts for asset/liability risk management, to mitigate our exposure to equity market decline and interest rate risks and for hedging individual securities. In addition, we periodically enter into forward, exchange-traded futures and interest rate swap, swaptions and floor contracts to reduce the economic impact of movements in the equity and fixed income markets, including the program to hedge certain risks associated with the GMxB features. As more fully described in notes 2 and 3 to the notes to our annual financial
171
Table of Contents
statements included elsewhere in this prospectus, various traditional derivative financial instruments are used to achieve these objectives. To minimize credit risk exposure associated with its derivative transactions, each counterparty’s credit is appraised and approved and risk control limits and monitoring procedures are applied. Credit limits are established and monitored on the basis of potential exposures that take into consideration current market values and estimates of potential future movements in market values given potential fluctuations in market interest rates. To reduce credit exposures in OTC derivative transactions, we enter into master agreements that provide for a netting of financial exposures with the counterparty and allow for collateral arrangements. We further control and minimize counterparty exposure through a credit appraisal and approval process. Under the ISDA Master Agreement, we have executed a Credit Support Annex (“CSA”) with each of our OTC derivative counterparties that require both posting and accepting collateral either in the form of cash or high-quality securities, such as U.S. Treasury securities or those issued by government agencies.
Mark to market exposure is a point-in-time measure of the value of a derivative contract in the open market. A positive value indicates existence of credit risk for us because the counterparty would owe money to us if the contract were closed. Alternatively, a negative value indicates we would owe money to the counterparty if the contract were closed. If there is more than one derivative transaction outstanding with a counterparty, a master netting arrangement exists with the counterparty. In that case, the market risk represents the net of the positive and negative exposures with the single counterparty. In management’s view, the net potential exposure is the better measure of credit risk.
At December 31, 2017 and December 31, 2016, the net fair values of our derivatives were $150 million and $191 million, respectively. The table that follows shows the interest rate or equity sensitivities of those derivatives, measured in terms of fair value. These exposures will change as a result of ongoing portfolio and risk management activities.
Derivative Financial Instruments
| Interest Rate Sensitivity | ||||||||||||||||||||
| Notional Amount |
Weighted Average Term (Years) |
Impact of -1% Change |
Fair Value |
Impact of +1% Change |
||||||||||||||||
| (in millions, except for Weighted Average Term) | ||||||||||||||||||||
| December 31, 2017 |
||||||||||||||||||||
| Floors |
$ | — | $ | — | $ | — | $ | — | ||||||||||||
| Swaps |
26,725 | 6 | 3,443 | 411 | (2,562 | ) | ||||||||||||||
| Futures |
20,675 | 121 | — | (91 | ) | |||||||||||||||
| Credit Default Swaps |
2,057 | 3 | — | 33 | — | |||||||||||||||
|
|
|
|
|
|
|
|
|
|||||||||||||
| Total |
$ | 49,457 | $ | 3,564 | $ | 444 | $ | (2,653 | ) | |||||||||||
|
|
|
|
|
|
|
|
|
|||||||||||||
| December 31, 2016 |
||||||||||||||||||||
| Floors |
$ | 1,500 | $ | 11 | $ | 11 | $ | 11 | ||||||||||||
| Swaps |
26,092 | 5 | 1,332 | (929 | ) | (2,799 | ) | |||||||||||||
| Futures |
14,818 | (35 | ) | — | 103 | |||||||||||||||
| Credit Default Swaps |
2,712 | 4 | 5 | 5 | 5 | |||||||||||||||
|
|
|
|
|
|
|
|
|
|||||||||||||
| Total |
$ | 45,122 | $ | 1,313 | $ | (913 | ) | $ | (2,680 | ) | ||||||||||
|
|
|
|
|
|
|
|
|
|||||||||||||
172
Table of Contents
| Equity Sensitivity | ||||||||||||||||
| Notional Amount |
Weighted Average Term (Years) |
Fair Value |
Balance after -10% Equity Price Shift |
|||||||||||||
| (in millions, except for Weighted Average Term) | ||||||||||||||||
| December 31, 2017 |
||||||||||||||||
| Futures |
$ | 6,552 | $ | — | $ | 621 | ||||||||||
| Swaps |
7,555 | 1 | (197 | ) | 652 | |||||||||||
| Options |
22,223 | 2 | 1,999 | 1,452 | ||||||||||||
|
|
|
|
|
|
|
|||||||||||
| Total |
$ | 36,330 | $ | 1,802 | $ | 2,725 | ||||||||||
|
|
|
|
|
|
|
|||||||||||
| December 31, 2016 |
||||||||||||||||
| Futures |
$ | 9,028 | $ | — | $ | 867 | ||||||||||
| Swaps |
5,843 | 1 | (95 | ) | 447 | |||||||||||
| Options |
12,241 | 2 | 1,016 | 521 | ||||||||||||
|
|
|
|
|
|
|
|||||||||||
| Total |
$ | 27,112 | $ | 921 | $ | 1,835 | ||||||||||
|
|
|
|
|
|
|
|||||||||||
In addition to the freestanding derivatives discussed above, we have entered into reinsurance contracts to mitigate the risk associated with the impact of potential market fluctuations on future policyholder elections of GMIB features contained in certain annuity contracts. These reinsurance contracts are considered derivatives under the guidance on derivatives and hedging and were reported at their fair values of $1.9 billion and $1.7 billion at December 31, 2017 and December 31, 2016, respectively. The potential fair value exposure to an immediate 10% drop in equity prices from those prevailing at December 31, 2017 and December 31, 2016, respectively, would increase the balances of the reinsurance contract asset by $0.2 billion and $0.2 billion. Also, the GMxB feature’s liability associated with certain annuity contracts is similarly considered to be a derivative for accounting purposes and was reported at its fair value. The liability for embedded derivative liability features was $4.4 billion and $5.6 billion at December 31, 2017 and December 31, 2016, respectively. The potential fair value exposure to an immediate 10% drop in equity prices from those prevailing as of December 31, 2017 and December 31, 2016, respectively, would be to increase the liability balance by $0.7 billion and $0.7 billion.
Investment Management and Research
The investments of our Investment Management and Research segment consist of trading and available-for-sale investments and other investments. AB’s trading and available-for-sale investments include U.S. Treasury bills and equity and fixed income mutual funds’ investments. Trading investments are purchased for short-term investment, principally to fund liabilities related to deferred compensation plans and to seed new investment services. Although available-for-sale investments are purchased for long-term investment, the portfolio strategy considers them available-for-sale from time to time due to changes in market interest rates, equity prices and other relevant factors. Other investments include investments in hedge funds sponsored by AB and other private investment vehicles.
173
Table of Contents
Investments with Interest Rate Risk—Fair Value
The table below provides AB’s potential exposure with respect to its fixed income investments, measured in terms of fair value, to an immediate 1% increase in interest rates at all maturities from the levels prevailing at December 31, 2017 and December 31, 2016:
Interest Rate Risk Exposure
| December 31, 2017 | December 31, 2016 | |||||||||||||||||||||||
| Fair Value |
Balance After -1% Change |
Balance After +1% Change |
Fair Value |
Balance After -1% Change |
Balance After +1% Change |
|||||||||||||||||||
| (in millions) | ||||||||||||||||||||||||
| Fixed Income Investments: |
||||||||||||||||||||||||
| Trading |
$ | 137 | $ | 147 | $ | 128 | $ | 120 | $ | 129 | $ | 113 | ||||||||||||
Such a fluctuation in interest rates is a hypothetical rate scenario used to calibrate potential risk and does not represent AB management’s view of future market changes. Although these fair value measurements provide a representation of interest rate sensitivity of its investments in fixed income mutual funds and fixed income hedge funds, they are based on AB’s exposures at a particular point in time and may not be representative of future market results. These exposures will change as a result of ongoing changes in investments in response to AB management’s assessment of changing market conditions and available investment opportunities.
Investments with Equity Price Risk—Fair Value
AB’s investments include investments in equity mutual funds and equity hedge funds. The following table presents AB’s potential exposure from its equity investments, measured in terms of fair value, to an immediate 10% drop in equity prices from those prevailing at December 31, 2017 and December 31, 2016:
Equity Price Risk Exposure
| December 31, 2017 | December 31, 2016 | |||||||||||||||||||||||
| Fair Value |
Balance After +10% Equity Price Change |
Balance After -10% Equity Price Change |
Fair Value |
Balance After +10% Equity Price Change |
Balance After -10% Equity Price Change |
|||||||||||||||||||
| (in millions) | ||||||||||||||||||||||||
| Equity Investments: |
||||||||||||||||||||||||
| Trading |
$ | 214 | $ | 236 | $ | 193 | $ | 180 | $ | 198 | $ | 162 | ||||||||||||
| Available-for-sale and other investments |
92 | 102 | 83 | 163 | 179 | 147 | ||||||||||||||||||
A 10% decrease in equity prices is a hypothetical scenario used to calibrate potential risk and does not represent AB management’s view of future market changes. While these fair value measurements provide a representation of equity price sensitivity of AB’s investments in equity mutual funds and equity hedge funds, they are based on AB’s exposure at a particular point in time and may not be representative of future market results. These exposures will change as a result of ongoing portfolio activities in response to AB management’s assessment of changing market conditions and available investment opportunities.
174
Table of Contents
Overview
We are one of America’s leading financial services companies and have helped clients prepare for their financial future with confidence since 1859. Our approximately 12,200 employees and advisors are entrusted with more than $670 billion of assets under management through two complementary and well-established principal franchises, AXA Equitable Life and AllianceBernstein, providing:
| • | Advice and solutions for helping Americans set and meet their retirement goals and protect and transfer their wealth across generations; and |
| • | A wide range of investment management insights, expertise and innovations to drive better investment decisions and outcomes for clients and institutional investors worldwide. |
We aim to be a trusted partner to our clients by providing advice, products and services that help them navigate complex financial decisions. Our financial strength and the quality of our people, their ingenuity and the service they provide help us build relationships of trust with our clients.
We believe that the growing and aging U.S. population, shift of responsibility for retirement planning from employers to individuals and overall growth in total investable assets will drive significant demand for our products and services going forward. Throughout our long history, we have embraced change and looked to the future, and we continue to see significant opportunities to find new solutions and new ways to deliver service to clients within our target markets.
We have a leading position at the intersection of advice, asset management and financial protection that we believe provides our clients with products and solutions that meet their long-term financial needs and our stockholders with attractive growth prospects. We have market-leading positions in our four segments:
| • | Individual Retirement—We are a leading provider of variable annuity products, which primarily meet the needs of individuals saving for retirement or seeking retirement income by allowing them to invest in various markets through underlying investment options. As of December 31, 2017, we had more than 900,000 variable annuity policies in force, representing $103.4 billion of account value, or AV. |
| • | Group Retirement—We offer tax-deferred investment and retirement plans sponsored by educational entities, municipalities and not-for-profit entities as well as small and medium-sized businesses. As of December 31, 2017, we had approximately $33.9 billion of AV. For the year ended December 31, 2017, we were the #1 provider by gross premiums of retirement plans to the K-12 education market. |
| • | Investment Management and Research—We are a leading provider of diversified investment management, research and related services to a broad range of clients around the world. As of December 31, 2017, our Investment Management and Research segment had approximately $554 billion in AUM consisting of 35% equities, 54% fixed income and 11% multi-asset class solutions, alternatives and other assets. |
| • | Protection Solutions—We focus on attractive protection segments such as VUL insurance, where for 2017 we ranked fourth in sales overall and first in the retail channel, and IUL insurance, where we ranked second in the retail channel in the same period, according to LIMRA. As of December 31, 2017, we had approximately 900,000 outstanding policies with a face value of $446 billion. This business provides capital diversification benefits alongside the longevity profile of our retirement businesses. |
We manage our segments in a complementary way. We strive to create value for our clients and stockholders by pricing and managing risks on the liability side of our balance sheet and by generating attractive risk-adjusted investment returns on the asset side. We leverage our underwriting, risk management and investment management skills across our segments, General Account and Separate Accounts.
175
Table of Contents
We distribute our products through a premier affiliated and third-party distribution platform with a successful track record of marketing our innovative and less capital intensive products and solutions allowing us to respond to our clients’ evolving needs and manage our capital and risks responsibly, consisting of:
| • | Affiliated Distribution: |
| • | Our affiliated retail sales force, AXA Advisors, which has approximately 4,700 licensed financial professionals who advise on retirement, protection and investment advisory solutions; |
| • | Nearly 200 Bernstein Financial Advisors, who are responsible for the sale of investment products and solutions to Private Wealth Management clients; |
| • | Third-Party Distribution: |
| • | Distribution agreements with more than 1,000 third-party firms including broker-dealers, banks, insurance partners and brokerage general agencies, giving us access to more than 150,000 financial professionals to market our retirement, protection and investment solutions; and |
| • | An AB global distribution team of more than 500 professionals, who engage with our approximately 4,900 retail distribution partners and more than 500 institutional clients. |
Our product approach is to ensure that design characteristics are attractive to both our customers and our stockholders. We currently focus on products across our businesses that expose us to less market and customer behavior risk, are more easily hedged and, overall, are less capital intensive than many traditional products. For example, in our Individual Retirement segment, we have evolved our variable annuity products to promote products with only a return of premium death benefit) (such as index-linked and investment only annuities) and have restructured products that provide GMxB features. We believe these efforts have been successful with our customers—approximately 65% of our variable annuity product sales in 2017 had no GMxB feature—and for our stockholders—we hold less capital and reserves and do less hedging than would be needed when compared with variable annuity products with GMxB features. Many of our other products, such as those sold in our Group Retirement and Investment Management and Research segments, by their very nature, require little to no incremental capital over the product lifecycle. We also apply this approach to our most capital-intensive segment—Protection Solutions. We do so by focusing on products such as VUL and IUL insurance (which collectively accounted for 89% of our 2017 sales in the Protection Solutions segment), which require substantially less up-front capital relative to other types of life insurance (such as whole life insurance and traditional universal life insurance). In addition, by providing diversification to our more market-oriented products, the Protection Solutions segment helps improve our overall capital efficiency.
We are confident that our market leading positions, premier distribution platform, competitive products and investment expertise position us well to continue to generate a diversified and growing stream of earnings, maintain stability through market cycles and generate attractive returns and strong cash flows for our stockholders.
Our History
We are, and until the settlement of this offering will continue to be, a wholly owned subsidiary of AXA, a worldwide leader in life, property and casualty and health insurance and asset management. AXA is headquartered in France, with operations in 64 countries and more than 165,000 employees, including our operations and employees. AXA operates primarily in Europe, North America, the Asia/Pacific region and, to a lesser extent, in other regions including the Middle East, Africa and Latin America. Neither AXA nor any affiliate of AXA will have any obligation to provide additional capital or credit support to us following the settlement of this offering.
Founded in 1859, our retirement and protection businesses distribute products to individuals and business owners through our affiliated distribution channel, AXA Advisors, and to the financial services market through our wholesalers serving third-party firms.
176
Table of Contents
Our business also includes AB, of which we own an approximate 65% economic interest following the Reorganization Transactions. Our economic interest consists of approximately 64% of the AB Units and approximately 4% of the AB Holding Units (representing an approximate 1% economic interest in ABLP). Our indirect, wholly owned subsidiary, AllianceBernstein Corporation, is the General Partner of AB with the authority to manage and control AB, and accordingly, AB is consolidated in our financial statements. AB has been in the investment management and research business for more than 50 years. ABLP is the operating partnership for the AB business, and AB Holding’s activities consist of owning AB Units and engaging in related activities. AB Holding Units trade on the NYSE under the ticker symbol “AB”. AB Units do not trade publicly.
Our Organizational Structure
After the settlement of this offering, we expect that AXA will hold approximately 75.5% of our common stock (or 71.9% if the underwriters exercise their option to purchase additional shares from the selling stockholder). As a result, we will be a “controlled company” within the meaning of NYSE rules, following the settlement of this offering. This status will allow us to rely on exemptions from certain corporate governance requirements otherwise applicable to NYSE-listed companies. See “Management—Corporate Governance.”
We are a holding company incorporated in Delaware in May 2003. We operate our businesses through a number of direct and indirect subsidiaries. For details on our overall corporate organizational structure, see “Prospectus Summary—Organizational Structure—Organizational Structure Following Settlement of this Offering and Completion of the Reorganization Transactions.”
Market Opportunities
Global asset accumulation markets continued their strong recent growth trend with total AUM reaching $81 trillion, up 6% year over year, including in the North American market, where total AUM increased by 8% year-over-year to $47 trillion as of December 31, 2016, according to Willis Towers Watson. In addition, the United States has experienced a decline in the traditional employer-based defined benefit retirement plan system which has raised concerns about the sustainability of safety nets historically provided by governments such as Social Security and employer-sponsored defined benefit plans. These trends have increased the need for Americans to prepare and plan for their own long-term financial security. Our complementary businesses are designed to provide affluent and high net worth Americans with the guidance, products and solutions they need to achieve their wealth accumulation and retirement income goals. We believe the following long-term trends will continue to favorably impact our business over time.
Continued rapid growth in the retirement-aged U.S. population. Technological advances and improvements in healthcare are projected to continue to contribute to increasing average life expectancy, and aging individuals must be prepared to fund retirement periods that will last longer than previously anticipated. The U.S. Census Bureau estimated that approximately 15% of the population was 65 years of age or older in 2016, compared to approximately 9% in 1960. This segment of the population is estimated to double from approximately 49 million in 2016 to more than 98 million by 2060, and it is expected to represent approximately 24% of the overall population, as the youngest members of the “baby boomer” generation continue to reach retirement age.
Shifting retirement savings landscape. The Employee Benefit Research Institute estimates that the proportion of private sector workers participating in a defined benefit plan declined from 28% in 1979 to 2% in 2014. Increased life expectancy, coupled with this transition away from defined benefit plans has shifted the responsibility for retirement savings and income planning from employers to individuals. We expect that this shift in responsibility will drive demand for our products and services including wealth accumulation, income producing investments and financial advice.
177
Table of Contents
Expected growth in retirement assets. U.S. retirement assets are estimated to increase by 5.2% per year from 2016 through 2021 to $29 trillion with assets in the not-for-profit/governmental defined contribution sector projected to grow slightly faster at 6.6% for the same period. We believe that our retirement focused asset accumulation business will continue to benefit from this trend.
Strong need for financial planning advice. According to a recent McKinsey & Co. survey, roughly half of U.S. consumers with more than $100,000 in liquid financial assets surveyed said that they would prefer to purchase life insurance through an agent or advisor, even if they may start their research online. We believe that due to the complexity of financial planning, many consumers will continue to seek advice in connection with the purchase of these products, providing companies with broad distribution platforms and in-house advice capabilities a competitive advantage.
We believe that these trends, together with our competitive strengths and strategy discussed below, provide us an opportunity to increase the value of our business.
Our Competitive Strengths
Our two well-established principal franchises, AXA Equitable Life and AllianceBernstein, have a history of agility and innovation. At a time of significant challenges for investors—increased regulation, new technologies and a likely continued low yield environment—the ability to develop new creative solutions is critical for meeting clients’ needs and growing our businesses. Our company has a long history of developing innovative solutions, including introducing variable life insurance to the U.S. market, being one of the pioneers in performance fees for actively managed funds and launching our SCS product. Through Bernstein Research, we have a strong reputation for demonstrating that deeper research results in greater investment value.
Our strong balance sheet provides confidence for the future. We believe the strength of our balance sheet and the statutory capitalization of our insurance companies provide confidence to our clients and business partners and help position us for continued growth. In particular:
| • | In 2017, we increased the statutory capital and reserves of our retirement and protection businesses by approximately $2.3 billion, improving our ability to withstand adverse economic scenarios. As of December 31, 2017, our insurance company subsidiaries had statutory TAC of approximately $8.7 billion, resulting in a Combined RBC Ratio of approximately 650%; |
| • | Additionally, on April 12, 2018, we effected an unwind of the reinsurance provided to AXA Equitable Life by AXA RE Arizona for certain variable annuities with GMxB features. As a result of the unwind and based on information available as of December 31, 2017, we estimate that the statutory TAC of our insurance company subsidiaries increased by $0.7 billion, which, if such unwind had occurred on or prior to December 31, 2017, would have resulted in an increase in our Combined RBC Ratio of 50 percentage points to approximately 700% as of December 31, 2017; |
| • | We target maintaining an asset level for all variable annuities at or above a CTE98 level under most economic scenarios and an RBC ratio of 350-400% for non-variable annuity insurance liabilities, which, combined with the variable annuity capital, would result in a Combined RBC Ratio in excess of 500%; and |
| • | We have a diversified, high quality $82 billion investment portfolio as of December 31, 2017, including $47 billion in fixed maturities classified as available-for-sale, of which 97% are investment grade rated. |
Our business generates significant cash and we have in place a hedging program to protect our cash flows even in adverse economic scenarios. Our two principal operating companies are well established and have been generating, and are expected to continue to generate, significant cash, enabling us to pay dividends beginning in 2018, provide capital needed to support our business and service our debt over time. From 2014 to
178
Table of Contents
2016, Holdings and AXA Financial received net distributions from our subsidiaries of $2.6 billion. In 2017, in accordance with our agreement with the NYDFS and in preparation for this offering, Holdings and AXA Financial collectively made $2.3 billion in aggregate capital contributions to AXA Equitable Life and AXA RE Arizona. In addition, we have implemented a hedging program intended to protect our variable annuity assets and statutory capital in the event of adverse economic scenarios.
The projected cumulative distributable earnings of our in-force variable annuity portfolio from January 1, 2018 to December 31, 2020 and the estimated present value of our in-force portfolio over its lifetime demonstrate resiliency across a range of scenarios. Based on the assumptions underlying our base case scenario, we expect cumulative distributable variable annuity earnings of our in-force portfolio over the three-year period to be $4.1 billion, while in upside, downside, extreme and downside and lapse sensitivity scenarios, we expect cumulative distributable variable annuity earnings to be $4.3 billion, $3.1 billion, $1.6 billion and $2.9 billion, respectively. In addition, assuming a 4% discount rate, we estimate the present value of our in-force variable annuity portfolio over its lifetime to be $12.9 billion in our base case scenario and $17.5 billion, $9.2 billion, $6.3 billion and $8.6 billion in upside, downside, extreme and downside and lapse sensitivity scenarios, respectively. The projected cumulative distributable earnings of our in-force variable annuity portfolio and the estimated present value of our in-force portfolio over its lifetime are based on certain actuarial assumptions. Our actual future results may differ from those in our projections and no assurance can be given that future experience will be in line with our assumptions. For additional information, see “—Segment Information—Individual Retirement—Supplemental Information on Our In-Force Variable Annuity Business.”
Our leading retirement businesses are well-positioned to grow. There is a growing need for financial products that provide retirement income as well as a measure of protection against equity market volatility. In both the affluent and high net worth markets and in the K-12 education market, we believe that we are well-positioned to benefit from the growing and aging U.S. population and the continued shift away from defined benefit plans.
| • | For affluent and high net worth clients approaching retirement, our individual retirement products offer customers protection against market volatility and help instill confidence that their income needs will be satisfied in their retirement years. |
| • | In our Group Retirement business, we are the leading provider of retirement products and related solutions for the growing 403(b) K-12 education market. Our nationwide footprint of advisors provides valuable advisory services to a wide range of clients in the education market saving for retirement. |
Our Investment Management and Research business is strategically positioned to grow. We believe our Investment Management and Research business is well-positioned to navigate an evolving environment in which growth in passive strategies is pressuring fees for many active asset managers. We sell products and solutions that are difficult to replicate through passive mechanisms, including many of our credit, multi-asset and alternative strategies. We are present in markets worldwide, many of which have been less affected by the growth of passive investment options, such as parts of Asia. Additionally, a significant majority of our active equity and fixed income assets are in services that regularly exceed their benchmarks for the three-year performance period. The combination of relevance and performance has resulted in an annual organic growth rate for AB that has exceeded the average of AB’s closest asset manager peers for the past three years.
Our Protection Solutions business is well established and has growth potential in select segments. We are one of the leading life insurance providers in the United States, specifically with respect to VUL and IUL, and are committed to disciplined underwriting. Our in-force portfolio provides diversification on our statutory capital base and attractive cash flows. Over the years, much of this market has become commoditized, and we now selectively focus on the less capital intensive VUL and IUL accumulation segments of the market.
Our focus on less capital intensive fee-based products results in lower capital needs. Our ability to create less capital intensive products and solutions that meet the evolving needs of our clients, while still achieving our
179
Table of Contents
risk-adjusted return targets, has allowed us in recent years to capture increased market share, particularly in the variable annuity market. In the fourth quarter of 2017, both the profitability and volume of the sales of our products exceeded those of a majority of our industry peers, based on a report of an industry source. Our Individual Retirement, Group Retirement and Investment Management and Research segments’ earnings are predominantly fee-based.
Our premier affiliated retail and institutional distribution platform differentiates us from competitors. We benefit from a broad reach across affiliated and third-party channels. Our affiliated retail distribution platform consists of our nearly 4,700 licensed AXA Advisors as well as a direct network of nearly 200 Bernstein Financial Advisors serving approximately 15,000 high net worth clients as of December 31, 2017. The institutional platform in our retirement and protection segments is broad with more than 1,000 third-party relationships providing access to an additional approximately 150,000 financial professionals, while AB’s global distribution team of more than 500 professionals reach approximately 4,900 distribution partners and more than 500 institutional clients. We believe that our close alignment with our affiliated distribution platform, in conjunction with our extensive and growing network of third-party relationships, differentiates us from our competitors and allows us to effectively distribute our products and write high-quality new business.
Our disciplined risk management framework protects our balance sheet. We have well-developed technical risk management capabilities which are embedded throughout our business. Our decisions are driven by an internal economic model designed to ensure that we protect our solvency, honor our obligations to our clients and provide attractive risk-adjusted returns for our stockholders. For example, our variable annuity hedging strategy is focused on protecting the economic value of our liabilities while allowing us to return cash to our stockholders through dividends and share repurchases across a variety of economic scenarios.
Our highly experienced management team brings strong capabilities. We are led by well-respected industry veterans who bring diverse U.S. and global experiences with long-standing experience in the financial services industry.
Our Strategy
Our overarching objective is to position the Company as the most trusted partner to clients by providing advice, products and services that help them navigate complex financial situations. We believe we are well-positioned to use our competitive strengths to grow our earnings base, actively manage our capital and generate attractive risk-adjusted returns for our stockholders. We have identified specific initiatives that are designed to grow our business, enhance productivity and optimize our capital. Underpinning this strategy is our commitment to disciplined risk management and a sound people strategy.
Growth Strategies
Deliver organic growth by focusing on attractive market segments. We intend to continue to innovate across our businesses, enhancing existing products and creating new products to service the needs of our retail and institutional clients.
Individual Retirement—We plan to further build on our market-leading position in the variable annuity market through continued innovation in our product portfolio to address evolving customer preferences and will seek opportunities to continue to expand our distribution network by deepening relationships with existing partners and developing relationships with new partners and channels. A key component of our strategy is to ensure that we maintain an “all-weather” portfolio to meet the needs and risk appetites of consumers through different market cycles. An example of this is the significant success we have had with SCS, which is designed to meet consumers’ preference for some downside protection while sharing in the potential for market upside.
Group Retirement—We will take advantage of our market-leading position in the K-12 education market where we expect attractive growth prospects through our more than 1,000 dedicated advisors serving clients in
180
Table of Contents
more than 8,800 public school plans as of December 31, 2017. We see further growth opportunities through expansion of our distribution capabilities and plan to use our new mutual fund platform to retain existing clients and expand our client base. We will continue to leverage technology through our direct marketing and online enrollment program, which provides an omni-channel capability to augment our proven advisor model.
Investment Management and Research—We will continue to build on AB’s heritage of research excellence and ingenuity to develop new actively managed solutions for which investors see value and are willing to pay a price premium over passively managed alternatives.
AB has a suite of actively managed, differentiated equity and fixed income services, delivering strong risk-adjusted returns. For instance, 91% of our fixed income services and 85% of our equity services have outperformed their benchmarks over the three-year period ended December 31, 2017.
In addition, our Multi-Asset Solutions group develops outcome-oriented services for institutional and retail clients, including innovative offerings such as our multi-manager target-date funds and our hedge fund replication strategies. We also have a diverse offering of alternative strategies with strong emerging track records that we expect to commercialize and grow over the next three years.
Protection Solutions—We will focus our strategy on asset accumulation segments that are less capital intensive, such as VUL and IUL insurance which offer attractive risk-adjusted returns. We plan to improve our Non-GAAP Operating ROC by segment and operating earnings over time through earnings generated from sales of our repositioned product portfolio and by proactively managing and optimizing our in-force book.
In 2015, we entered the employee benefits market and have been focused on growing our capabilities. Using our strong presence in the small and medium-sized businesses market, we have developed a differentiated value proposition for employers where margins remain attractive.
Continue to expand and deepen our distribution channels. Over the last three years, we have had strong sales growth while maintaining attractive risk-adjusted returns. The combination of a strong affiliated sales force, symbiotic third-party relationships, financial strength and innovative product design has allowed us to achieve this while shifting our mix of business towards less capital intensive products.
We see opportunities for continued growth by expanding our affiliated and third-party distribution channels. We plan to expand our third-party distribution footprint with select partners and grow our footprint in the fee-based registered investment adviser channel. We have a track record in building new channels such as selling retirement products through insurance partners, which commenced in 2011 and accounted for approximately $674 million of FYP in 2017.
We plan to enhance sales delivery through investments in automation, analytics and digital capabilities. In recent years, we have upgraded our financial planning tool software for our advisers, and built new distribution capabilities alongside our affiliated sales force such as our outbound customer relations unit.
At AB, we are investing in our distribution capabilities to accelerate growth of well-performing products in U.S. and European retail channels. We are building our institutional sales capability to drive increased penetration of Multi-Asset Solutions and alternatives and deploying digital technologies to accelerate growth in our Private Wealth Management division. In addition, we will continue to leverage AB’s leading position in certain Asian markets to distribute our differentiated equity and fixed income solutions.
Productivity Strategies
Enhance profitability through diligent focus on managing expenses while still delivering a best-in-class customer experience. Over the last five years, we have delivered more than $350 million in productivity and
181
Table of Contents
efficiency gains, principally through right-sizing our organization, selectively outsourcing certain functions, reducing our real estate footprint and implementing information technology productivity measures. We see additional opportunities to improve profitability across our businesses through operating expense reductions, without impacting our ability to serve our existing clients and grow our businesses. In particular, we plan to:
| • | Shift our real estate footprint away from the New York metropolitan area to provide space efficiencies and lower labor costs and, where possible, take advantage of state and local tax incentives; |
| • | Replace costly technology infrastructure with more efficient and more up-to-date alternatives, including cloud-based solutions, and use lean management and agile practices to both enhance service and reduce infrastructure cost; |
| • | Leverage new technologies to further drive productivity, including accelerating our eDelivery, self-service and paperless initiatives to both improve service and reduce operating costs; and |
| • | Expand existing outsourcing arrangements (currently several hundred roles supporting service and finance) to further improve cost competitiveness. |
Capital Optimization
Optimize our General Account portfolio. Currently, we have an outsized position in U.S. Treasury bonds when compared to many of our principal competitors in the United States and a relatively short credit portfolio duration. Over time, we expect to gradually transition our portfolio to be in line with our economic liabilities and better optimize our capital under a U.S. framework. Principally, we plan to transition a portion of our investment portfolio from U.S. Treasury bonds to high quality investment grade corporate bonds, as well as extend our investment portfolio’s credit duration, resulting in a meaningful increase in the yield on our General Account assets.
Proactively manage our business portfolio. One of our primary objectives is to improve our financial performance. In addition to driving operating earnings, we plan to continue to proactively manage our in-force portfolio to ensure we optimize equity invested in our businesses. This includes market transactions, reinsurance and exercising contractual rights as appropriate. Underpinning this is our strong experience in managing our various portfolios through actions such as buyouts, fund substitutions and portfolio sales.
Return capital to stockholders. We will focus on returning excess capital to stockholders actively and prudently. Our expected sources of excess capital generation over the course of the next several years include cash flow generated by earnings associated with our diverse, seasoned portfolio of retirement and protection businesses and quarterly unitholder distributions from our economic interest in AB, of which more than half will be held outside of our insurance company subsidiaries after giving effect to the Reorganization Transactions.
Risk Management Strategy
Maintain risk management discipline. The goal of our risk management strategy is to protect capital, enable growth and achieve profitable results across various market cycles. For our variable annuity business, we use a dynamic hedging strategy to offset changes in the economic liability of our GMxB features due to changes in equity markets and interest rates. In addition to our dynamic hedging strategy, in the fourth quarter of 2017 and the first quarter of 2018, we implemented static hedge positions to maintain a target asset level for all variable annuities at or above a CTE98 level under most economic scenarios, and to maintain a CTE95 level even in extreme scenarios. We expect to adjust from time to time our static equity hedge positions to maintain our target level of CTE protection over time. For our non-variable annuity insurance businesses, we aim to maintain a 350-400% RBC ratio which, combined with the variable annuity capital, would result in a Combined RBC Ratio in excess of 500%.
In addition, we expect that our diverse, seasoned in-force book of business should continue to generate statutory earnings further bolstering our statutory capital position. We expect to have a debt-to-capital ratio of
182
Table of Contents
approximately 26% at the time of this offering, which we believe supports strong financial strength ratings. In addition, we expect to maintain a mid-20s% debt-to-capital ratio going forward.
We have enhanced our internal economic model to orient the company more toward U.S. regulatory and capital frameworks. Product pricing, new portfolio investments and capital distribution decisions are driven by this economic model and are designed to protect our economic solvency, honor our obligations to our clients and provide attractive risk-adjusted returns for our stockholders.
People Strategy
Raising likelihood of success through our people strategy. We understand that to execute our plan successfully we need not only a sound business strategy but an equally well-developed people strategy. In addition to ensuring strong alignment across our organization to our goals and strategies, we will continue our long-standing commitment to building a culture of inclusion, professional excellence and continuous learning. We are very pleased to have been recognized as a “Great Place to Work” in 2016 and 2017 by the Great Place to Work® Institute, an independent workplace authority. Professional development has always been a key part of our philosophy. For example, we were a founding partner with The American College of Financial Services in developing the Chartered Life Underwriter designation, which remains the industry standard. In addition to investing in our people’s development, we continually look for opportunities to bring in fresh talent to augment our team.
Financial Goals
We have designed our financial goals to maintain a strong balance sheet while delivering disciplined profitable growth. We have established the following financial goals which we believe best measure the execution of our business strategy and align with our stockholders’ interests:
| • | Target asset level for all variable annuities at or above a CTE98 and an RBC ratio of 350-400% for our non-variable annuity insurance liabilities; |
| • | Return of capital to stockholders equal to at least 40-60% of our Non-GAAP Operating Earnings on an annualized basis starting in 2018, including payment of a dividend; |
| • | Target a compound annual growth rate in our Non-GAAP Operating Earnings of 5-7% through 2020, subject to market conditions; and |
| • | We expect that the target growth in Non-GAAP Operating Earnings combined with our target return of capital to stockholders will result in Non-GAAP Operating ROE in the mid-teens by 2020. |
We focus on Non-GAAP Operating ROE, which is a measure of our Non-GAAP Operating Earnings divided by our Total equity attributable to Holdings, excluding AOCI, as a key measure of profitability for our Company. See “Management’s Discussion and Analysis of Financial Condition and Results of Operations—Key Operating Measures—Non-GAAP Operating ROE and Non-GAAP Operating ROC by Segment.” Giving effect to the Reorganization Transactions, we had Pro Forma Non-GAAP Operating ROE of 15.2% for the year ended December 31, 2017. We believe this level of Pro Forma Non-GAAP Operating ROE demonstrates the strength and profitability of our business today.
Beginning in 2018, we expect to benefit from the Tax Reform Act which we expect will reduce our effective tax rate on Non-GAAP Operating Earnings to be approximately 19%. This is expected to result in an improvement to Non-GAAP Operating Earnings of approximately $150 million per annum based on 2017 pre-tax income.
In addition to the favorable change in tax rate, we anticipate that the following key initiatives will assist us in increasing our Non-GAAP Operating ROE to our stated goal:
| • | General Account Optimization: We have begun to transition $5 billion of our General Account investment portfolio from U.S. Treasury bonds to high quality investment grade corporate bonds and |
183
Table of Contents
| $2 billion of our General Account investment portfolio from shorter duration, high quality investment grade corporate bonds to longer duration, high quality investment grade corporate bonds. We expect this transition to increase the yield on the reallocated portion of our investment portfolio. At current market rates and corporate spreads over U.S. Treasury bonds, once the transition and other investment actions are completed, we estimate an improvement to Non-GAAP Operating Earnings of approximately $160 million per annum on our General Account investments by 2020. We do not expect the change in our investment allocation to have a meaningful impact on our RBC ratio. |
| • | AB’s Margin Target Expansion: AB has adopted a goal of increasing AB’s consolidated adjusted operating margin to 30% by 2020. AB’s adjusted operating margin is a financial measure that is not comparable to our Non-GAAP Operating Earnings measure. Adjusted operating margin is a non-GAAP financial measure used by AB’s management in evaluating AB’s financial performance on a standalone basis and to compare its performance, as reported by AB, in its periodic reports. In setting this goal, AB made a number of significant assumptions, including with respect to levels of positive net flows into its investment services, the growth in its alternative products business, rates of increase in fixed costs as well as transitional costs associated with establishing a second principal U.S. location outside of the New York City metropolitan area, including employee relocation, severance, recruitment and duplicative occupation and occupancy costs, and the timing of such costs, its success in achieving planned cost reductions and the timing of such cost reductions, investments it makes in its business and general market conditions. |
| • | Productivity Strategies: We expect to continue to build upon our recent productivity improvements, through which we have delivered more than $350 million in efficiency improvements over the last five years. We have identified several additional initiatives, including reallocating some of our real estate footprint away from New York, replacing or updating less efficient legacy technology infrastructure and expanding existing outsourcing arrangements, that we believe will reduce costs and improve productivity. We anticipate that the savings from these strategies should offset any incremental ongoing expenses we incur as a standalone company and we expect these initiatives to improve our operating leverage, increasing our Non-GAAP Operating Earnings by approximately $75 million per annum by 2020. |
| • | Capital Optimization: We plan to return capital to shareholders through dividends and share repurchases, which we expect, in aggregate, will represent at least 40-60% of our Non-GAAP Operating Earnings. We also plan to opportunistically manage our in-force portfolio through potential market transactions, reinsurance and the exercise of our contractual rights. |
| • | Growth Strategies: We plan to continue to grow our core business through further refinement of our product offerings, expansion of our third-party distribution network and our AXA Advisors affiliated salesforce and increased penetration of our target markets. |
These goals are based on our baseline business plan scenario, which we refer to as our “Base Case Scenario.” Our Base Case Scenario assumes 6.25% annual equity market returns, the yield on the 10-year U.S. Treasury note rising ratably over the next 10 years to 2.8% and policyholder behavior based on our current best estimate assumptions which include dynamic variables to reflect the impact of a change in market levels. Actual results related to these targets may vary depending on various factors, including actual capital market outcomes, changes in actuarial models or emergence of actual experience, changes in regulation as well as other risks and factors discussed in “Business—Financial Goals” and “Risk Factors.” Non-GAAP Operating ROE and Non-GAAP Operating Earnings are non-GAAP financial measures. See “Management’s Discussion and Analysis of Financial Condition and Results of Operations—Key Operating Measures.”
In setting the targets described above, we have made significant assumptions with respect to, among other things:
| • | our amount of new sales of individual retirement, group retirement and protection solutions products; |
184
Table of Contents
| • | net flows at AB and the amount of distributions from AB; |
| • | the absence of new regulation such as NAIC variable annuity reserve and capital reform; |
| • | effective tax rates of approximately 19%; |
| • | our degree of leverage following the Recapitalization due to indebtedness incurred in connection with the Recapitalization or following the settlement of this offering; |
| • | limited differences between actual experience and existing actuarial assumptions, including assumptions for which existing experience is limited and experience will emerge over time; |
| • | the efficacy and maturity of existing actuarial models to appropriately reflect all aspects of our existing and in-force businesses; |
| • | the effectiveness and cost of our proposed hedging program, the timing of its implementation and the impact of our hedging strategy on net income volatility and possible negative effects on our statutory capital; |
| • | completion of the Reorganization Transactions, and our ability to implement our business strategy, including optimizing our General Account portfolio and reducing expenses; |
| • | new regulations previously issued by the DOL that we expect will be fully effective sometime during the planning timeframe, and that such regulations will be consistent with the proposals at the time of this filing; |
| • | the successful implementation of our key initiatives outlined above; |
| • | our access to capital; and |
| • | general conditions of the markets in which our businesses operate. |
While these targets are presented with numerical specificity, and we believe such targets to be reasonable as of the date of this prospectus, given the uncertainties surrounding such assumptions, there are significant risks that these assumptions may not be realized and as a result, the financial goals may not be achieved. In calculating these goals, we exclude several significant impacts to our Protection Solutions segment in 2017 including actuarial assumption updates and model changes, a maintenance expense assumption update, a mortality table update and loss recognition testing. For further information, see “Management’s Discussion and Analysis of Financial Condition and Results of Operations—Results of Operations by Segment—Protection Solutions.” We also exclude the anticipated beneficial impact of tax reform on Non-GAAP Operating Earnings. Accordingly, our actual results may differ from these financial goals and the differences may be material and adverse, particularly if actual events adversely differ from one or more of our key assumptions. The financial goals and their underlying assumptions are forward-looking statements and can be affected by any of the factors discussed in “Risk Factors” and “Special Note Regarding Forward-Looking Statements and Information.” We strongly caution investors not to place undue reliance on any of these assumptions or financial goals. Except as may be required by applicable securities laws, we are not under any obligation and expressly disclaim any obligation to update or alter any assumptions, estimates, financial goals, projections or other related statements that we may make.
Segment Information
We are organized into four segments: Individual Retirement, Group Retirement, Investment Management and Research, and Protection Solutions. We report certain activities and items that are not included in our segments in Corporate and Other.
185
Table of Contents
The following table presents operating earnings (loss) by segment and Corporate and Other for the years ended December 31, 2017, 2016 and 2015:
| Years Ended December 31, | ||||||||||||
| 2017 | 2016 (as restated) |
2015 | ||||||||||
| (in millions) | ||||||||||||
| Operating Earnings |
||||||||||||
| Individual Retirement |
$ | 1,287 | $ | 1,153 | $ | 1,060 | ||||||
| Group Retirement |
283 | 167 | 167 | |||||||||
| Investment Management and Research |
211 | 161 | 173 | |||||||||
| Protection Solutions |
536 | 79 | 113 | |||||||||
|
|
|
|
|
|
|
|||||||
| Corporate and Other |
(196 | ) | (184 | ) | (141 | ) | ||||||
|
|
|
|
|
|
|
|||||||
| Non-GAAP Operating Earnings |
$ | 2,121 | $ | 1,376 | $ | 1,372 | ||||||
For additional financial information on segments, see “Management’s Discussion and Analysis of Financial Condition and Results of Operations—Results of Operations by Segment” and note 18 of the notes to our annual financial statements included elsewhere in this prospectus.
Individual Retirement
Our Individual Retirement segment is a leading provider of individual variable annuity products, which are primarily sold to affluent and high net worth individuals saving for retirement or seeking guaranteed retirement income. We have a long history of innovation, as one of the first companies, in 1968, to enter the variable annuity market, as the first company, in 1996, to provide variable annuities with living benefits, and as the first company, in 2010, to bring to market an index-linked variable annuity product. Our Individual Retirement business is an important source of earnings and cash flow for our company, and we believe our hedging strategy preserves a substantial portion of these cash flows across a wide range of risk scenarios. The primary sources of revenue for our Individual Retirement segment include fee revenue and investment income. As of December 31, 2017, we had more than 900,000 variable annuity contracts in force, representing approximately $103.4 billion of AV.
We principally focus on selling three variable annuity products, each of which provides policyholders with distinct benefits, features and return profiles. We continue to innovate our offering, periodically updating our product benefits and introducing new variable annuity products to meet the evolving needs of our clients while managing the risk and return of these variable annuity products to our company. Due to our innovation, our product mix has evolved considerably since the financial crisis. The majority of our sales in 2017 consisted of products without GMxB features (other than the return of premium (“ROP”) death benefit), and 1% of 2017 FYP was attributable to products with fixed rate guarantees. We believe that our current portfolio of less capital intensive products offers a range of solutions for our clients and provides us with attractive risk-adjusted returns.
We sell our variable annuity products through AXA Advisors and a wide network of approximately 600 third-party firms, including banks, broker-dealers and insurance partners, reaching more than 100,000 advisors. This differentiated distribution network, along with our diverse product portfolio, has enabled us to rank among the industry leaders in sales of variable annuity products. As of December 31, 2017, we ranked third in variable annuity market share based on sales, according to Morningstar, and our wholesalers serving third-party firms ranked second in variable annuity sales productivity in the third-party channel, according to preliminary data from Market Metrics. As of December 31, 2017, our in-force block ranked fifth based on variable annuity net assets, according to Morningstar.
We believe that our current portfolio of less capital intensive products offers a range of solutions for our clients and provides us with attractive risk-adjusted returns. To further our growth, we plan to continue to innovate our product portfolio, expand and deepen our distribution channels and effectively manage risk in our business.
186
Table of Contents
Product Innovation. We have created a diverse portfolio of variable annuity products that are designed to be attractive in different market scenarios and economic conditions. We will seek opportunities to expand our product line-up in new segments of the individual variable annuity market that leverage our product design, risk management and distribution capabilities and provide additional growth opportunities with favorable risk-adjusted returns. For affluent and high net worth clients approaching retirement, our individual retirement products offer customers protection against market volatility and help instill confidence that their income needs will be satisfied in their retirement years.
Distribution Expansion. We have a large and differentiated distribution network that includes AXA Advisors and a wide range of financial services firms including broker-dealers, banks, insurance partners and brokerage general agencies. We have had considerable success in evolving our third-party distribution network by growing in the bank, broker-dealer and insurance partner channels and will seek opportunities to continue to expand our distribution network by deepening relationships with existing partners and developing relationships with new partners and channels.
Risk Management. We have taken a multi-pronged approach to actively manage the economic risks associated with our in-force variable annuity products. We use a dynamic hedging strategy to offset changes in the economic liability of our GMxB features due to changes in equity markets and interest rates (within this strategy we reevaluate our economic exposure at least daily and rebalance our hedge positions accordingly). Beginning in the fourth quarter of 2017, we supplemented this dynamic strategy with additional static hedge positions (derivatives positions intended to be held to maturity with less frequent rebalancing) to maintain a target asset level for all variable annuities at a CTE98 level under most economic scenarios, and to maintain a CTE95 level even in extreme scenarios. In addition to these hedging strategies, we employ various other methods to manage the risks of our in-force variable annuity products, including asset-liability matching, volatility management tools within the Separate Accounts, and an active in-force management program, including buyout offers.
Variable Annuities Policy Feature Overview
Variable annuities allow the policyholder to make deposits into accounts offering variable investment options. For deposits allocated to Separate Accounts, the risks associated with the investment options are borne entirely by the policyholder, except where the policyholder elects GMxB features in certain variable annuities, for which additional fees are charged. Additionally, certain variable annuity products permit policyholders to allocate a portion of their account to investment options backed by the General Account and are credited with interest rates that we determine, subject to certain limitations. As of December 31, 2017, the total AV of our variable annuity products was $103.4 billion, consisting of $84.4 billion of Separate Account AV and $19.0 billion of General Account AV.
Certain variable annuity products offer one or more GMxB features in addition to the standard return of premium death benefit guarantee. GMxB features (other than the return of premium death benefit guarantee) provide the policyholder a minimum return based on their initial deposit adjusted for withdrawals (i.e., the benefit base), thus guarding against a downturn in the markets. The rate of this return may increase the specified benefit base at a guaranteed minimum rate (i.e., a fixed roll-up rate) or may increase the benefit base at a rate tied to interest rates (i.e., a floating roll-up rate). GMxB riders must be chosen by the policyholder no later than at the issuance of the contract.
187
Table of Contents
The following table presents our variable annuity AV by GMxB feature for our variable annuity business in our Individual Retirement segment as of December 31, 2017, December 31, 2016 and December 31, 2015:
| As of | ||||||||||||
| December 31, 2017 |
December 31, 2016 |
December 31, 2015 |
||||||||||
| (in millions) | ||||||||||||
| Account Value |
||||||||||||
| Non-GMxB |
$ | 22,428 | $ | 17,433 | $ | 13,060 | ||||||
| ROP Death Benefit Only |
9,560 | 9,309 | 9,475 | |||||||||
|
|
|
|
|
|
|
|||||||
| Total Non-GMxB & ROP Death Benefit Only |
$ | 31,988 | $ | 26,742 | $ | 22,535 | ||||||
| Floating Rate GMxB |
21,599 | 18,768 | 16,217 | |||||||||
| Fixed Rate GMxB |
49,836 | 48,094 | 49,605 | |||||||||
|
|
|
|
|
|
|
|||||||
| Total Variable Annuity AV |
$ | 103,423 | $ | 93,604 | $ | 88,357 | ||||||
|
|
|
|
|
|
|
|||||||
The following table presents our variable annuity benefit base by GMxB feature for the Individual Retirement segment as of December 31, 2017, December 31, 2016 and December 31, 2015. Many of our variable annuity contracts offer more than one type of GMxB feature such that the amounts listed below are not mutually exclusive. Thus, the benefit base cannot be totaled.
| As of | ||||||||||||
| December 31, 2017 |
December 31, 2016 |
December 31, 2015 |
||||||||||
| (in millions) | ||||||||||||
| Benefit Base |
||||||||||||
| ROP Death Benefit Only |
$ | 6,260 | $ | 6,640 | $ | 7,084 | ||||||
| Floating Rate GMxB |
||||||||||||
| GMDB |
20,628 | 18,948 | 16,635 | |||||||||
| GMIB |
18,412 | 16,211 | 13,396 | |||||||||
| Fixed Rate GMxB |
||||||||||||
| GMDB |
62,723 | 63,926 | 65,650 | |||||||||
| GMIB |
65,758 | 66,310 | 67,010 | |||||||||
The guaranteed benefit received by a policyholder pursuant to a GMxB feature is calculated based on the benefit base. The benefit base is defined as a hypothetical amount (i.e., not actual cash value) used to calculate the policyholder’s optional benefits within a variable annuity. A benefit base cannot be withdrawn for cash and is used solely to calculate the variable annuity’s optional guarantees. Generally, the benefit base is not subject to a cap on the value. However, the benefit base stops increasing after a defined time period or at a maximum age, usually age 85 or 95, as defined in the contract.
The calculation of the benefit base varies by benefit type and may differ in value from the policyholder’s AV for the following reasons:
| • | The benefit base is defined to exclude the effects of a decline in the market value of the policyholder’s AV. Accordingly, actual claim payments to be made in the future to the policyholder will be determined without giving effect to market declines. |
| • | The terms of the benefit base may allow it to increase at a guaranteed rate irrespective of the rate of return on the policyholder’s AV. |
We currently offer GMxB riders. Their principal features are as follows:
| • | GMDBs provide that in the event of the death of the policyholder, the beneficiary will receive the higher of the current contract account balance or the benefit base upon the death of the owner (or annuitant). |
188
Table of Contents
| • | GMIBs provide, if elected by the policyholder after a stipulated waiting period from contract issuance, guaranteed minimum annual lifetime payments based on predetermined guaranteed annuity purchase factors that may exceed what the contract AV can purchase at then-current annuity purchase rates. |
For a detailed discussion of GMxB riders, see “—Overview of GMxB Features.”
Products
We primarily sell three variable annuity products, each providing policyholders with distinct features and return profiles. We believe these products offer us attractive risk-adjusted returns. Our current primary product offering, ordered below according to sales volume for the year ended December 31, 2017, includes:
SCS. Our index-linked variable annuity product allows the policyholder to invest in various investment options, whose performance is tied to one or more securities indices, commodities indices or ETFs, subject to a performance cap, over a set period of time. The risks associated with such investment options are borne entirely by the policyholder, except the portion of any negative performance that we absorb (a buffer) upon investment maturity. This variable annuity does not offer GMxB features, other than an optional return of premium death benefit that we have introduced on some versions.
Retirement Cornerstone. Our Retirement Cornerstone product offers two platforms: (i) RC Performance, which offers access to over 100 funds with annuitization benefits based solely on non-guaranteed account investment performance and (ii) RC Protection, which offers access to a focused selection of funds and an optional floating-rate GMxB feature providing guaranteed income for life, with a choice between two floating roll-up rate options.
Investment Edge. Our investment-only variable annuity is a wealth accumulation variable annuity that defers current taxes during accumulation and provides tax-efficient distributions on non-qualified assets through scheduled payments over a set period of time with a portion of each payment being a return of cost basis, thus excludable from taxes. Investment Edge does not offer any GMxB feature other than an optional return of premium death benefit.
Other products. We offer other products which offer optional GMxB benefits. These other products do not contribute significantly to our sales.
189
Table of Contents
Our variable annuity portfolio is mature with gross premiums for our fixed rate GMxB products, ranging from $8.5 billion to $11.3 billion from 2005 to 2008. Since 2009, gross premiums for these products have decreased substantially. Over this period, we shifted our business from selling variable annuity products with GMxB features with fixed roll-up rates, to predominantly (i) variable annuity products without GMxB features (other than the return of premium death benefit in some cases) and (ii) variable annuity products with GMxB features with floating roll-up rates. We had a total of $11 billion of FYP for our entire variable annuity portfolio in 2008. Based on FYP, we have shifted our portfolio from 90% fixed rate GMxB products in 2008 to 95% floating rate GMxB products and non-GMxB products in 2017. In addition, AV has shifted from 77% Fixed Rate GMxB products in 2008 to 48% in 2017.
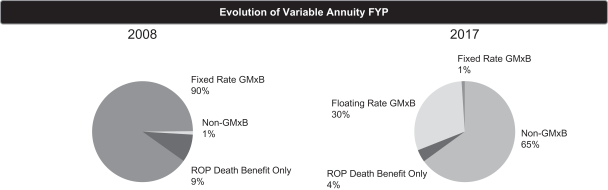
The following tables present the relative contribution to FYP of each of the above products and GMxB features for the years ended December 31, 2017, 2016 and 2015.
| FYP by Product |
Years Ended | |||||||||||
| December 31, 2017 |
December 31, 2016 |
December 31, 2015 |
||||||||||
| (in millions) | ||||||||||||
| SCS |
$ | 3,781 | $ | 3,424 | $ | 1,449 | ||||||
| Retirement Cornerstone |
2,522 | 3,042 | 4,687 | |||||||||
| Investment Edge |
418 | 408 | 412 | |||||||||
| Other |
374 | 470 | 532 | |||||||||
|
|
|
|
|
|
|
|||||||
| Total FYP |
$ | 7,095 | $ | 7,344 | $ | 7,080 | ||||||
|
|
|
|
|
|
|
|||||||
| Years Ended | ||||||||||||
| FYP by Guarantee Feature | December 31, 2017 |
December 31, 2016 |
December 31, 2015 |
|||||||||
| (in millions) | ||||||||||||
| Non-GMxB |
$ | 4,622 | $ | 4,265 | $ | 2,769 | ||||||
| ROP Death Benefit Only |
276 | 271 | 323 | |||||||||
|
|
|
|
|
|
|
|||||||
| Total Non-GMxB & ROP Death Benefit Only |
$ | 4,898 | $ | 4,536 | $ | 3,092 | ||||||
|
|
|
|
|
|
|
|||||||
| Floating Rate GMxB |
2,108 | 2,600 | 3,754 | |||||||||
| Fixed Rate GMxB |
89 | 208 | 234 | |||||||||
|
|
|
|
|
|
|
|||||||
| Total GMxB |
$ | 2,197 | $ | 2,808 | $ | 3,988 | ||||||
|
|
|
|
|
|
|
|||||||
| Total FYP |
$ | 7,095 | $ | 7,344 | $ | 7,080 | ||||||
|
|
|
|
|
|
|
|||||||
Our sales for the years ended December 31, 2017, 2016 and 2015 further demonstrate the result of our product sales evolution, as 65%, 58% and 39% of FYP, respectively, came from variable annuity products that do
190
Table of Contents
not contain GMxB riders, and of the GMxB riders sold, they overwhelmingly featured floating, as opposed to fixed, roll-up rates.
Our Individual Retirement segment works with AXA Equitable FMG to identify and include appropriate underlying investment options in its products, as well as to control the costs of these options and increase profitability of the products. AXA Equitable FMG also offers our product designers access to initial due diligence and contract negotiations for outside variable investment portfolios that may be offered within the product. For a discussion of AXA Equitable FMG, see below “—AXA Equitable FMG.”
Markets
For our Individual Retirement segment, we target sales of our products to affluent and high net worth individuals and families saving for retirement or seeking retirement income. As the retirement age population in the United States continues to grow and employers continue to shift away from defined benefit plans, we expect the need for these retirement savings and income products to expand.
Within our target customer base, customers prioritize certain features based on their life-stage and investment needs. In addition, our products offer features designed to serve different market conditions. SCS targets clients with investable assets who want exposure to equity markets, but also want to guard against a market correction. Retirement Cornerstone targets clients who want growth potential and guaranteed income with increases in a rising interest rate environment. Investment Edge targets clients concerned about rising taxes.
Distribution
We distribute our variable annuity products through AXA Advisors, and through third-party distribution channels. For the year ended December 31, 2017, AXA Advisors represented 37% of our variable annuity FYP in this segment, while our third-party distribution channel represented 63% of our variable annuity FYP in this segment. We employ 150 external and internal wholesalers who distribute our variable annuity products across both channels. Our wholesalers serving third-party firms ranked second in third-party variable annuity wholesale productivity for the year ended December 31, 2017, according to preliminary data from Market Metrics.
Affiliated Distribution. We offer our variable annuity products on a retail basis through our affiliated retail sales force of financial professionals, AXA Advisors. These financial professionals have access to and offer a broad array of variable annuity, life insurance, employee benefits and investment products and services from affiliated and unaffiliated insurers and other financial service providers.
Third-Party Distribution. We have shifted the focus of our third-party distribution significantly over the last decade, growing our distribution in the bank, broker-dealer and insurance partner channels and providing us access to more than 100,000 financial professionals. For example, in 2011, we began distributing our variable annuity products to insurance partners. Today, we work with some of the country’s largest insurance partners and our sales through this channel have grown to comprise 10% of our total FYP for the year ended December 31, 2017.
191
Table of Contents
The table below presents the contributions to and percentage of FYP of our variable annuity products by distribution channel for the year ended December 31, 2017.
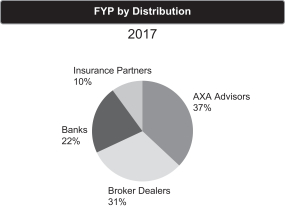
Other than AXA Advisors, no single distribution firm contributed more than 10% of our sales in 2017.
Competition
Our Individual Retirement business competes with traditional life insurers, as well as banks, mutual fund companies and other investment managers. The variable annuities market is highly competitive, with no single provider dominating the market across products. The main factors that distinguish competitors to clients include product features, access to capital, access to diversified sources of distribution, financial and claims-paying ratings, investment options, brand recognition, quality of service, technological capabilities and tax-favored status of certain products. Competition may affect, among other matters, both the growth of our business and the pricing and features of our products.
Underwriting and Pricing
We generally do not underwrite our variable annuity products on an individual-by-individual basis. Instead, we price our products based upon our expected investment returns and assumptions regarding mortality, longevity and persistency for our policyholders collectively, while taking into account historical experience. We price annuities by analyzing longevity and persistency risk, volatility of expected earnings on our AV and the expected time to retirement. Our product pricing models also take into account capital requirements, hedging costs and operating expenses. Investment-oriented products are priced based on various factors, which may include investment return, expenses, persistency and optionality.
Our variable annuity products generally include penalties for early withdrawals. From time to time, we reevaluate the type and level of GMxB and other features we offer. We have previously changed the nature and pricing of the features we offer and will likely do so from time to time in the future as the needs of our clients, the economic environment and our risk appetite evolve.
Fees on AV, Fund Assets, Benefit Base and Investment Income
We earn various types of fee revenue based on AV, fund assets and benefit base. In general, fees from GMxB features that are calculated based on the benefit base are more stable compared to fees calculated based on the AV.
Mortality & Expense, Administrative Charges and Distribution Charges. We deduct a daily charge from the net assets in each variable investment option to compensate us for mortality risks, administrative expenses and a portion of our sales expenses under the variable annuity contract. These charges are calculated based on the portion of the policyholder’s AV allocated to the Separate Accounts and are expressed as an annual percentage.
192
Table of Contents
Withdrawal Charges. Some variable annuity contracts may also impose charges on withdrawals for a period after the purchase, and in certain products for a period after each subsequent contribution, also known as the withdrawal charge period. A withdrawal charge is calculated as a percentage of the contributions withdrawn. The percentage of the withdrawal charge that applies to each contribution depends on how long each contribution had been invested in the contract. Withdrawal charges generally decline gradually over the withdrawal charge period, which can range from zero to 12 years depending on the product and share class. Our variable annuity contracts typically permit policyholders to withdraw up to 10% of their AV each year without any withdrawal charge, although their guarantees may be significantly negatively impacted by such withdrawals. Contracts may also specify circumstances when no surrender charges apply (for example, upon payment of a death benefit or due to disability, terminal illness or confinement to a nursing home).
Investment Management Fees. We charge investment management fees for the proprietary funds managed by AXA Equitable FMG that are offered as investments under the variable annuities. Investment management fees are also paid on the non-proprietary funds managed by investment advisers unaffiliated with us to the unaffiliated investment advisers. Investment management fees differ by fund. A portion of the investment management fees charged on funds managed by subadvisers unaffiliated with us are paid by us to the subadvisers. Investment management fees reduce the net returns on the variable annuity investments.
12b-1 Fees and Other Revenue. 12b-1 fees are paid by the mutual funds which our policyholders chose to invest in and are calculated based on the net assets of the funds allocated to our subaccounts. These fees reduce the returns policyholders earn from these funds. Additionally, mutual fund companies with funds that are available to policyholders through the variable annuity subaccounts pay us fees consistent with the terms of administrative service agreements. These fees are funded from the fund companies’ net revenues.
Death Benefit Rider Charges. We deduct a charge annually from the policyholders’ AV on each contract date anniversary for most of our optional death benefits. This charge is in addition to the base mortality and expense charge for promising to pay the GMDB. The charges earned vary by generation and rider type. For some death benefits, the charges are calculated based on AV, but for enhanced death benefits, the charges are normally calculated based on the benefit base.
Living Benefit Riders Charges. We deduct a charge annually from the policyholders’ AV on each contract date anniversary. We earn these fees for promising to pay guaranteed benefits while the policyholder is alive, such as for any type of GMLB (including GMIB, GWBL, GMWB and GMAB). The fees earned vary by generation and rider type and are calculated based on the benefit base.
Investment Income. We earn revenue from investment income on our General Account investments.
Risk Management
We approach risk management of our variable annuity products: (i) prospectively, by assessing, and from time to time, modifying our current product offerings to manage our risk and (ii) retrospectively, by implementing actions to reduce our exposure and manage the risks associated with in-force variable annuity contracts.
Current GMxB Product Strategy
Over the last decade, we have redesigned our variable annuity product offering by introducing new variable annuities without GMxB features, discontinuing the offering of certain GMxB features and adding or adjusting other features to better enable us to manage the risk associated with these products. Through the increase in sales of our products without GMxB features, sales of our variable annuity contracts with GMxB features have decreased significantly as a percentage of our total sales. We continue to offer certain GMxB features to meet evolving consumer demand while maintaining attractive risk-adjusted returns and effectively managing our risk.
193
Table of Contents
Some of the features of our GMxB products have been redesigned over the past several years to better manage our risk and to meet customer demand. For example:
| • | we primarily offer floating (tied to interest rates), as opposed to fixed, roll-up rates; |
| • | we offer lower risk investment options, including passive investments and bond funds with reduced credit risk if certain optional guaranteed benefits are elected; and |
| • | we offer managed volatility funds, which seek to reduce the risk of large, sudden declines in AV during market downturns by managing the volatility or draw-down risk of the underlying fund holdings through re-balancing the fund holdings within certain guidelines or overlaying hedging strategies at the fund level. |
To further manage our risk, features in our current GMxB products provide us with the right to make adjustments post-sale, including the ability to increase benefit charges. For more information on GMxB features contained in our current and in-force products, see below “—Overview of GMxB Features.”
In-force Variable Annuity Management
Since the financial crisis, we have implemented several actions to reduce our exposure and manage the risks associated with in-force variable annuity contracts while ensuring policyholder rights are fully respected. We manage the risks associated with our in-force variable annuity business through our dynamic hedging program, reinsurance and product design. The dynamic hedging program was implemented in the early 2000s and today is managed by a dedicated team focused on managing our total variable annuity assets to a CTE level consistent with our financial goals. In addition, we use reinsurance for the GMxB riders on our older variable annuity products (generally issued 1996-2004). We have also introduced several other risk management programs, some of which are described in this section below.
To actively manage and protect against the economic risks associated with our in-force variable annuity products, our management team has taken a multi-pronged approach. Our in-force variable annuity risk management programs include:
Hedging
We use a dynamic hedging strategy supplemented by static hedges to offset changes in our economic liability from changes in equity markets and interest rates. In addition to our dynamic hedging strategy, in the fourth quarter of 2017 and the first quarter of 2018, we implemented static hedge positions to maintain a target asset level for all variable annuities at a CTE98 level under most economic scenarios, and to maintain a CTE95 level even in extreme scenarios. We expect to adjust from time to time our static equity hedge positions to maintain our target level of CTE protection over time. A wide range of derivatives contracts are used in these hedging programs, such as futures and total return swaps (both equity and fixed income), options and variance swaps, as well as, to a lesser extent, bond investments and repurchase agreements. For GMxB features, we retain certain risks including basis, credit spread and some volatility risk and risk associated with actual versus expected assumptions for mortality, lapse and surrender, withdrawal and contract-holder election rates, among other things.
Reinsurance
We have used reinsurance to mitigate a portion of the risks that we face in certain of our variable annuity products with regard to a portion of the GMxB features. Under our reinsurance arrangements, other insurers assume a portion of the obligation to pay claims and related expenses to which we are subject. However, we remain liable as the direct insurer on all risks we reinsure and, therefore, are subject to the risk that our reinsurer is unable or unwilling to pay or reimburse claims at the time demand is made. We evaluate the financial condition of our reinsurers in an effort to minimize our exposure to significant losses from reinsurer insolvencies.
194
Table of Contents
Non-affiliate Reinsurance. We have reinsured to non-affiliated reinsurers a portion of our exposure on variable annuity products that offer a GMxB feature issued through February 2005. At December 31, 2017, we had reinsured to non-affiliated reinsurers, subject to certain maximum amounts or caps in any one period, approximately 16.8% of our net amount at risk resulting from the GMIB feature and approximately 3.6% of our net amount at risk to the GMDB obligation on variable annuity contracts in force as of December 31, 2017.
Captive Reinsurance. In addition to non-affiliated reinsurance, AXA Equitable Life ceded to AXA RE Arizona, a captive reinsurance company, a 100% quota share of all liabilities for variable annuities with GMxB riders other than return of premium death benefit issued on or after January 1, 2006 and in-force on September 30, 2008 and a 100% quota share of all liabilities for variable annuities with GMIB riders issued on or after May 1, 1999 through August 31, 2005 in excess of the liability assumed by two unaffiliated reinsurers, which are subject to certain maximum amounts or limitations on aggregate claims (the “Excess Risks”). On April 12, 2018 we effected the GMxB Unwind. As a result of the GMxB Unwind, AXA Equitable Life assumed all of the liabilities of the GMxB Business that were previously ceded to AXA RE Arizona and the Excess Risks were novated to a newly formed captive reinsurance company. For additional information on the GMxB Unwind, see “The Reorganization Transactions—Unwind of GMxB Reinsurance.”
Other Programs
We have introduced several other programs that reduced gross reserves and reduced the risk in our in-force block and, in many cases, offered a benefit to our clients by offering liquidity or flexibility:
Investment Option Changes. We made several changes to our investment options within our variable annuity products over the years to manage risk, employ more passive strategies and offer our clients attractive risk-adjusted investment returns. To reduce the differential between hedging instruments performance and fund performance, we added many passive investment strategies and reduced the credit risk of some of the bond portfolios, which is designed to provide a better risk adjusted return to clients. We also introduced managed volatility funds in 2009. As a result, the investment strategy mix of our in-force variable annuity products with GMxB features shifted from 90% active based on AV as of December 31, 2008 to 80% passive based on AV as of December 31, 2017. Our volatility management strategy seeks to reduce the portfolio’s equity exposure during periods when certain market indicators indicate that market volatility is above specific thresholds set for the portfolio. Historically when market volatility is high, equity markets generally are trending down, and therefore this strategy is intended to reduce the overall risk of investing in the portfolio for clients. As of December 31, 2017, 57% of our in-force variable annuity products with GMxB features were invested in managed volatility assets based on AV. Coupled with our shift towards passive strategies, as of December 31, 2017, 91% of our in-force variable annuity products with GMxB features were invested in passive and/or managed volatility assets based on AV.
Optional Buyouts. Since 2012, we have implemented several successful buyout programs that benefited clients whose needs had changed since buying the initial contract and reduced our exposure to certain types of GMxB features. We have executed buyout programs since 2012, offering buyouts to contracts issued between 2002 and 2009.
Premium Suspension Programs. We have suspended the acceptance of subsequent premiums to certain GMxB contracts.
Lump Sum Option. Since 2015, we have provided certain policyholders with the optional benefit to receive a one-time lump sum payment rather than systematic lifetime payments if their AV falls to zero. This option provides the same advantages as a buyout. However, because the availability of this option is contingent on future events, their actual effectiveness will only be known over a long-term horizon.
195
Table of Contents
Overview of GMxB Features
We have historically offered a variety of variable annuity benefit features, including GMxB features, to our policyholders in our Individual Retirement segment.
Guaranteed Minimum Death Benefits Summary
We have historically offered GMDB features in isolation or together with GMLB features, including the following (with no additional charge unless noted):
| • | Return of Premium Death Benefit. This death benefit pays the greater of the AV at the time of a claim following the owner’s death or the total contributions to the contract (subject to adjustment for withdrawals). The charge for this benefit is usually included in the Mortality & Expense charge that is deducted daily from the net assets in each variable investment option. |
| • | RMD Wealthguard Death Benefit. This death benefit features a benefit base that does not decrease by the amount of any IRS-mandated withdrawals, or “required minimum distributions” (“RMD”), from the contract. The benefit base automatically increases to equal the highest AV on the current or any prior contract anniversary until RMD withdrawals begin or until the owner reaches a specified maximum age, even if the AV is reduced by negative investment performance. The charges for this benefit is calculated based on the benefit base value and deducted annually from the AV. |
| • | Annual Ratchet (also referred to as Highest Anniversary Value). This death benefit features a benefit base that is reset each year to equal the higher of total contributions to the contract or the highest AV on the current or any prior contract anniversary (subject to adjustment for withdrawals), even if the AV is reduced by negative investment performance. The charge for this benefit is calculated based on the benefit base value and deducted annually from the AV. |
| • | Roll-up Death Benefit. This death benefit features a benefit base that increases (or “rolls up”) at a specified guaranteed annual rate (subject to adjustment for withdrawals), even if the AV is reduced by negative investment performance. The charge for this benefit is calculated based on the benefit base value and deducted annually from the AV. This GMxB feature was discontinued in 2003. |
| • | Greater of Roll-up or Annual Ratchet. This death benefit features a benefit base that increases each year to equal the higher of the initial benefit base accumulated at a specified guaranteed rate or the highest AV on the current or any prior contract anniversary (subject to adjustment for withdrawals), even if the AV is reduced by negative investment performance. The charge for this benefit is calculated based on the benefit base value and deducted annually from the AV. |
In addition, we offered two guaranteed minimum death benefits with our GWBL rider, available at issue.
| • | GWBL Standard Death Benefit. This death benefit features a benefit base that is equal to total contributions to the contract less a deduction reflecting the amount of any withdrawals made. |
| • | GWBL Enhanced Death Benefit. This death benefit features a benefit base that is equal to total contributions to the contract plus the amounts of any ratchets and deferral bonus, less a deduction reflecting the amount of any withdrawals made. This benefit was available for an additional fee. |
196
Table of Contents
The following table presents the AV and benefit base by type of guaranteed minimum death benefit. Because variable annuity contracts with GMDB features may also offer GMLB features, the GMDB amounts listed are not mutually exclusive from the GMLB amounts provided in the table below.
| As of December 31, | ||||||||||||||||||||||||
| 2017 | 2016 | 2015 | ||||||||||||||||||||||
| Account Value |
Benefit Base |
Account Value |
Benefit Base |
Account Value |
Benefit Base |
|||||||||||||||||||
| (in millions) | ||||||||||||||||||||||||
| GMDB In-Force(1) |
||||||||||||||||||||||||
| ROP Death Benefit Only |
$ | 9,560 | $ | 6,260 | $ | 9,309 | $ | 6,640 | $ | 9,475 | $ | 7,084 | ||||||||||||
| Floating Rate GMDB |
||||||||||||||||||||||||
| Greater of Ratchet or Roll-up |
6,880 | 7,332 | 6,175 | 6,821 | 5,548 | 6,050 | ||||||||||||||||||
| All Other(2) |
14,719 | 13,297 | 12,593 | 12,127 | 10,669 | 10,585 | ||||||||||||||||||
|
|
|
|
|
|
|
|
|
|
|
|
|
|||||||||||||
| Total Floating Rate GMDB |
$ | 21,599 | $ | 20,629 | $ | 18,768 | $ | 18,948 | $ | 16,217 | $ | 16,635 | ||||||||||||
|
|
|
|
|
|
|
|
|
|
|
|
|
|||||||||||||
| Fixed Rate GMDB |
||||||||||||||||||||||||
| Greater of Ratchet or Roll-up |
29,061 | 43,750 | 27,858 | 43,790 | 28,815 | 44,190 | ||||||||||||||||||
| All Other(2) |
20,775 | 18,973 | 20,236 | 20,136 | 20,790 | 21,460 | ||||||||||||||||||
|
|
|
|
|
|
|
|
|
|
|
|
|
|||||||||||||
| Total Fixed Rate GMDB |
$ | 49,836 | $ | 62,723 | $ | 48,094 | $ | 63,926 | $ | 49,605 | $ | 65,650 | ||||||||||||
|
|
|
|
|
|
|
|
|
|
|
|
|
|||||||||||||
| Total GMDB |
$ | 80,995 | $ | 89,612 | $ | 76,171 | $ | 89,514 | $ | 75,297 | $ | 89,369 | ||||||||||||
|
|
|
|
|
|
|
|
|
|
|
|
|
|||||||||||||
| (1) | See table summarizing the NAR and reserves of policyholders by type of GMxB feature for variable annuity contracts as of December 31, 2017, December 31, 2016 and December 31, 2015 under “—Net Amount at Risk.” |
| (2) | All Other includes individual variable annuity policies with Annual Ratchet or Roll-up GMDB, either stand-alone or in conjunction with a GMLB, or with ROP GMDB in conjunction with a GMLB. |
Guaranteed Living Benefits Summary
We have historically offered a variety of guaranteed living benefits to our policyholders in our Individual Retirement segment. Our block of variable annuities includes four types of guaranteed living benefit riders: GMIB, GWBL/GMWB, GMAB and GIB. Based on total AV, approximately 65% and 67% of our variable annuity block included living benefit guarantees at December 31, 2017 and December 31, 2016, respectively.
GMIB. GMIB is our largest block of living benefit guarantees based on in-force AV. Policyholders who purchase the GMIB rider will be eligible, at the end of a defined waiting period, to receive annuity payments for life that will never be less than a guaranteed minimum amount, regardless of the performance of their investment options prior to the first payment. During this waiting period, which is often referred to as the accumulation phase of the contract and is usually 10 years, policyholders can invest their contributions in a range of variable and guaranteed investment options to grow their AV on a tax-deferred basis while increasing the value of the GMIB benefit base that helps determine the minimum annuity payment amount. Policyholders may elect to continue the accumulation phase beyond the waiting period if they wish to maintain the ability to take withdrawals from their AV or continue to participate in the growth of both their AV and GMIB benefit base.
The second phase of the contract starts when the policyholder annuitizes the contract, either by exercising the GMIB or through the contract’s standard annuitization provisions. Upon exercise of their GMIB, policyholders receive guaranteed lifetime income payments that are calculated as the higher of (i) application of their GMIB benefit base to the GMIB guaranteed annuity purchase factors specified in the contract or (ii) application of their AV to our then current or guaranteed annuity purchase factors. Beginning in 2005 we started offering a no-lapse guarantee on our GMIB riders that provides for the automatic exercise of the GMIB in the event that the policyholder’s AV falls to zero and provided no “excess withdrawals” (as defined in the contract) have been taken.
197
Table of Contents
The charge for the GMIB is calculated based on the GMIB benefit base value and deducted annually from the AV.
GWBL. This benefit guarantees that a policyholder can take lifetime withdrawals from their contract up to a maximum amount per year without reducing their GWBL benefit base. The amount of each guaranteed annual withdrawal is based on the value of the GWBL benefit base. The GWBL benefit base is equal to the total initial contributions to the contract and will increase by subsequent contributions (where permitted), ratchets or deferral bonuses (if applicable), and will be reduced by any “excess withdrawals,” which are withdrawals that exceed the guaranteed annual withdrawal amount. The policyholder may elect one of our automated withdrawal plans or take ad hoc withdrawals. This benefit can be purchased on a single life or joint life basis. The charge for the GWBL is calculated based on the GWBL benefit base value and deducted annually from the AV. We ceased offering a stand-alone GWBL rider in 2008.
GMWB. This benefit guarantees that the policyholder can take withdrawals from their contract up to the amount of their total contributions, even if the AV subsequently falls to zero, provided that during each contract year total withdrawals do not exceed annual GMWB withdrawal amount that is calculated under the terms of the contract. The policyholder may choose either a 5% GMWB Annual withdrawal option or a 7% GMWB Annual withdrawal option. Annual withdrawal amounts are not cumulative year over year. The charge for the GMWB is calculated based on the GMWB benefit base value and deducted annually from the AV. We ceased offering GMWB riders in 2008.
GMAB. This benefit guarantees that the AV can never fall below a minimum amount for a set period, which can also include locking in capital market gains. This rider protects the policyholder from market fluctuations. Two options we offered were a 100% principal guarantee and a 125% principal guarantee. Each option limited the policyholder to specified investment options. The charge for the GMAB is calculated based on the GMAB benefit base value and deducted annually from the AV. We ceased offering GMAB riders in 2008.
GIB. This benefit provides the policyholder with a guaranteed lifetime annuity based on predetermined annuity purchase rates applied to a GIB benefit base, with annuitization automatically triggered if and when the contract AV falls to zero. The charge for the GIB is calculated based on the GIB benefit base value and deducted annually from the AV. We ceased offering the GIB in 2012.
Below are examples of policyholder benefit utilization choices that can affect benefit payment patterns and reserves:
| • | Lapse. The policyholder may lapse or exit the contract, at which time the GMIB and any other GMxB guarantees are terminated. If the policyholder partially exits, the GMIB benefit base and any other GMxB benefit bases will be reduced in accordance with the contract terms. |
| • | Dollar-for-Dollar Withdrawals. A policyholder may request a onetime withdrawal or take systematic withdrawals from his or her contract at any time. All withdrawals reduce a contract’s AV by the dollar amount of a withdrawal. However, the impact of withdrawals on the GMIB and any other guaranteed benefit bases may vary depending on the terms of the contract. Withdrawals will reduce guaranteed benefit bases on a dollar-for-dollar basis as long as the sum of withdrawals in a contract year is equal to or less than the dollar-for-dollar withdrawal threshold defined in the contract, beyond which all withdrawals are considered “excess withdrawals.” An excess withdrawal may reduce the guaranteed benefit bases on a pro rata basis, which can have a significantly adverse effect on their values. A policyholder wishing to take the maximum amount of dollar-for-dollar withdrawals on a systematic basis may sign up for our dollar-for-dollar withdrawal service at no additional charge. Withdrawals under this automated service will never result in a pro rata reduction of the guaranteed benefit bases, provided that no withdrawals are made outside the service. If making dollar-for-dollar withdrawals in combination with negative investment reduces the AV to zero, the contract may have a no-lapse guarantee that triggers the automatic exercise of the GMIB, providing the policyholder with a stream of |
198
Table of Contents
| lifetime annuity payments determined by the GMIB benefit base value, the age and gender of the annuitant and predetermined annuity purchase factors. |
| • | Voluntary Annuitization. The policyholder may choose to annuitize their AV or exercise their GMIB (if eligible). GMIB annuitization entitles the policyholder to receive a stream of lifetime (with or without period certain) annuity payments determined by the GMIB benefit base value, the age and gender of the annuitant and predetermined annuity purchase factors. GMIB annuitization cannot be elected past the maximum GMIB exercise age as stated in the contract, generally age 85 or 95. The policyholder may otherwise annuitize the AV and choose one of several payout options. |
| • | Convert to a GWBL. In some products, policyholders have the option to convert their GMIB into a GWBL to receive guaranteed income through a lifetime withdrawal feature. This choice can be made as an alternative to electing to annuitize at the maximum GMIB exercise age, and may be appealing to policyholders who would prefer the ability to withdraw higher annual dollar-for-dollar amounts from their contract than permitted under the GMIB, for as long as their AV remains greater than zero. |
| • | Remain in Accumulation Phase. If the policyholder chooses to remain in the contract’s accumulation phase past the maximum GMIB exercise age—that is, by not electing annuitization or converting to a GWBL—and as long as the AV has not fallen to zero, then the GMIB will terminate and the contract will continue until the contractual maturity date. In these circumstances, depending on the GMDB elected at issue (if any) and the terms of the contract, the benefit base for the GMDB may be equal to the GMIB benefit base at the time the GMIB was terminated, may no longer increase and will be reduced by future withdrawals. |
The likelihood of a policyholder choosing a particular option cannot be predicted with certainty at the time of contract issuance or thereafter. The incidents and timing of benefit elections and the amounts of resulting benefit payments may materially differ from those we anticipate at the time we issue a variable annuity contract. As we observe actual policyholder behavior, we update our assumptions at least annually with respect to future policyholder activity and take appropriate action with respect to the amount of the reserves we establish for the future payment of such benefits. Additionally, upon the death of a policyholder (or annuitant), if the sole beneficiary is a surviving spouse, they can choose to continue the contract and benefits subject to age restrictions.
The following table presents the AV and benefit base by type of guaranteed living benefit. Because variable annuity contracts with GMLB features may also offer GMDB features, the GMLB amounts listed are not mutually exclusive from the GMDB amounts provided in the table above.
| As of December 31, | ||||||||||||||||||||||||
| 2017 | 2016 | 2015 | ||||||||||||||||||||||
| Account Value |
Benefit Base |
Account Value |
Benefit Base |
Account Value |
Benefit Base |
|||||||||||||||||||
| (in millions) | ||||||||||||||||||||||||
| GMLB In-Force(1) |
||||||||||||||||||||||||
| Floating Rate GMLB |
||||||||||||||||||||||||
| GMIB |
$ | 17,840 | $ | 18,412 | $ | 15,039 | $ | 16,211 | $ | 12,477 | $ | 13,396 | ||||||||||||
| Other (GIB) |
3,439 | 3,664 | 3,478 | 3,829 | 3,551 | 3,872 | ||||||||||||||||||
|
|
|
|
|
|
|
|
|
|
|
|
|
|||||||||||||
| Total Floating Rate GMLB |
$ | 21,279 | $ | 22,076 | $ | 18,517 | $ | 20,040 | $ | 16,028 | $ | 17,268 | ||||||||||||
|
|
|
|
|
|
|
|
|
|
|
|
|
|||||||||||||
| Fixed Rate GMLB |
||||||||||||||||||||||||
| GMIB |
44,704 | 65,758 | 43,106 | 66,310 | 44,419 | 67,010 | ||||||||||||||||||
| All Other (e.g., GWBL / GMWB, GMAB, other)(2) |
977 | 1,288 | 1,003 | 1,371 | 1,075 | 1,437 | ||||||||||||||||||
|
|
|
|
|
|
|
|
|
|
|
|
|
|||||||||||||
| Total Fixed Rate GMLB |
$ | 45,681 | $ | 67,046 | $ | 44,109 | $ | 67,681 | $ | 45,494 | $ | 68,447 | ||||||||||||
|
|
|
|
|
|
|
|
|
|
|
|
|
|||||||||||||
| Total GMLB |
$ | 66,960 | $ | 89,122 | $ | 62,626 | $ | 87,721 | $ | 61,522 | $ | 85,715 | ||||||||||||
|
|
|
|
|
|
|
|
|
|
|
|
|
|||||||||||||
| (1) | See table summarizing the NAR and reserves of policyholders by type of GMxB feature for variable annuity contracts as of December 31, 2017, 2016 and 2015 under “—Net Amount at Risk.” |
199
Table of Contents
| (2) | All Other includes individual variable annuity policies with stand-alone Annual Ratchet or stand-alone Roll-up GMDB. |
Net Amount at Risk
The NAR for the GMDB is the amount of death benefits payable in excess of the total AV (if any) as of the balance sheet date, net of reinsurance. It represents the amount of the claim we would incur if death claims were made on all contracts with a GMDB on the balance sheet date and includes any additional contractual claims associated with riders purchased to assist with covering income taxes payable upon death.
The NAR for the GMIB is the amount (if any) that would be required to be added to the total AV to purchase a lifetime income stream, based on current annuity rates, equal to the minimum amount provided under the GMIB. This amount represents our potential economic exposure to such guarantees in the event all policyholders were to annuitize on the balance sheet date, even though the guaranteed amount under the contracts may not be annuitized until after the waiting period of the contract.
The NAR for the GWBL, GMWB and GMAB is the actuarial present value in excess of the AVs (if any) as of the balance sheet date. The NAR assumes utilization of benefits by all policyholders as of the balance sheet date. For the GMWB and GWBL benefits, only a small portion of the benefit base is available for withdrawal on an annual basis. For the GMAB, the NAR would not be available until the GMAB maturity date.
NAR reflects the difference between the benefit base (as adjusted, in some cases, as described above) and the AV. We believe that NAR alone provides an inadequate presentation of the risk exposure of our in-force variable annuity portfolio. NAR does not take into consideration the aggregate amount of reserves and capital that we hold against our variable annuity portfolio, particularly the target asset level for all variable annuities at a CTE98 level under most economic scenarios. Additionally, the NAR calculation includes a number of assumptions that are not reflective of our actual or expected experience of the assumptions related to the reserves we hold on our variable annuity portfolio. Accordingly, we believe the projected cash flows provided in the cash flow table below represents our best estimate of the cash flow profile as well as the potential risks of our variable annuity portfolio under various market scenarios.
The NAR and reserves of contract owners by type of GMxB feature for variable annuity contracts are summarized below as of December 31, 2017, 2016 and 2015. Many of our variable annuity contracts offer more than one type of guarantee such that the GMIB amounts are not mutually exclusive to the amounts in the GMDB table.
| As of December 31, | ||||||||||||||||||||||||
| 2017 | 2016 | 2015 | ||||||||||||||||||||||
| NAR | Reserves | NAR | Reserves | NAR | Reserves | |||||||||||||||||||
| (in millions) | ||||||||||||||||||||||||
| GMDB |
||||||||||||||||||||||||
| ROP Death Benefit Only(1) |
$ | 119 | N/A | $ | 177 | N/A | $ | 299 | N/A | |||||||||||||||
| Floating Rate GMDB |
519 | 160 | 695 | 124 | 583 | 101 | ||||||||||||||||||
| Fixed Rate GMDB |
16,237 | 3,818 | 17,647 | 2,998 | 17,331 | 2,810 | ||||||||||||||||||
|
|
|
|
|
|
|
|
|
|
|
|
|
|||||||||||||
| Total |
$ | 16,875 | $ | 3,978 | $ | 18,519 | $ | 3,122 | $ | 18,213 | $ | 2,911 | ||||||||||||
|
|
|
|
|
|
|
|
|
|
|
|
|
|||||||||||||
200
Table of Contents
| Years Ended December 31, | ||||||||||||||||||||||||
| 2017 | 2016 | 2015 | ||||||||||||||||||||||
| NAR | Reserves | NAR | Reserves | NAR | Reserves | |||||||||||||||||||
| (in millions) | ||||||||||||||||||||||||
| GMIB |
||||||||||||||||||||||||
| Floating Rate GMIB |
$ | — | $ | 367 | $ | — | $ | 351 | $ | 2 | $ | 310 | ||||||||||||
| Fixed Rate GMIB |
6,032 | 6,603 | 6,348 | 6,907 | 5,955 | 6,739 | ||||||||||||||||||
|
|
|
|
|
|
|
|
|
|
|
|
|
|||||||||||||
| Total |
$ | 6,032 | $ | 6,970 | $ | 6,348 | $ | 7,258 | $ | 5,957 | $ | 7,049 | ||||||||||||
|
|
|
|
|
|
|
|
|
|
|
|
|
|||||||||||||
| (1) | U.S. GAAP reserves for ROP death benefit only are not available, as U.S. GAAP reserve valuation basis applies on policy contracts grouped by issue year. |
Supplemental Information on Our In-Force Variable Annuity Business
This section presents a sensitivity analysis (the “Sensitivity Analysis”) of the estimated cash flows and distributable earnings associated with our in-force variable annuity business (primarily in our Individual Retirement and Group Retirement segments) as of December 31, 2017 across five capital markets scenarios described below (the “VA Distributable Earnings Projections”). We have engaged Milliman, Inc. (“Milliman”), a third-party actuarial firm, to assist in the development of the Sensitivity Analysis under the scenarios presented in this section. The scope of Milliman’s work was consistent with and designed to meet the guidelines promulgated by the American Academy of Actuaries for actuarial opinions. In this role, Milliman relied on underlying data provided by us, relied on our assumptions and relied on our planned hedge strategy for use in its calculations, as described elsewhere in this prospectus. Based solely on the foregoing, Milliman independently developed a cash flow and distributable earnings projection model that was used to produce the Sensitivity Analysis and confirmed that the VA Distributable Earnings Projections reflect the methodologies used to calculate our statutory balance sheet. Milliman concluded that the Sensitivity Analysis and VA Distributable Earnings Projections have been prepared in accordance with generally accepted actuarial principles based on data, information and assumptions provided by us. Milliman’s scope of work did not include an audit or assessment of such data, information or assumptions.
| Assumptions |
Base Case Scenario |
Upside Scenario |
Downside Scenario |
Extreme Scenario |
Downside and Lapse Sensitivity | |||||
| Equity Return in 2018 onward (annualized) |
6.25% | 10.00% | (25)% shock immediately after December 31, 2017, 6.25% recovery | (40)% shock immediately after December 31, 2017, 6.25% recovery | (25)% shock immediately after December 31, 2017, 6.25% recovery | |||||
| Interest Rate |
2017 Year-end 10-year U.S. Treasury rate: 2.4%
2027 Year-end 10-year U.S. Treasury rate: 2.8% |
Rates increase by 150 bps over five years relative to base case |
Immediately after December 31, 2017, 10-year U.S. Treasury rate decreases to 1.4%
2027 Year-end 10-year U.S. Treasury rate: 1.6% |
Immediately after December 31, 2017, 10-year U.S. Treasury rate decreases to 1.4%
2027 Year-end 10-year U.S. Treasury rate: 1.6% |
Immediately after December 31, 2017 10-year U.S. Treasury rate decreases to 1.4%
2027 Year-end 10-year Treasury rate: 1.6% | |||||
| Average Separate Account Returns After Shock for 2019-2027 (annualized) |
5.4% | 8.6% | 5.1% | 4.9% | 5.1% | |||||
| Base Lapse |
Baseline | Baseline | Baseline | Baseline | 20% reduction to base lapse, including lapse floor | |||||
201
Table of Contents
In addition to the capital markets assumptions described above, the projections also reflect assumptions pertaining to (i) actuarial and policyholder behavior experience, which are aligned to our assumptions as of December 31, 2017, except for the “Downside and Lapse Sensitivity” scenario where we apply a 20% reduction to base lapse, including lapse floor, only to variable annuity business with GMxB features; (ii) the Reorganization Transactions, which is assumed to have occurred at December 31, 2017; and (iii) the variable annuity hedging program, which had transitioned to our prospective target hedging program by January 1, 2018, and which seeks to protect assets backing the variable annuity business at or above a CTE98 level under most economic scenarios, and at a CTE95 level in extreme scenarios. The target funding level is the maximum of CTE98 and Actuarial Guideline 43, by which we are required to calculate the statutory reserves that support our variable annuity products plus $500 million. The projections include several changes resulting from the Tax Reform Act, effective for the 2018 year, including: (i) 21% tax rate, (ii) dividends received deduction and (iii) tax reserves. The projection does not assume changes to applicable regulatory frameworks. Additionally, the CTE calculations, both regulatory and our target funding level, do not reflect the impact of changes in tax rates.
The table below illustrates the projected estimated cumulative distributable earnings from our in-force variable annuity business (the “VA Distributable Earnings”) under these five scenarios for a period of three years beginning January 1, 2018 and ending December 31, 2020. For the purpose of this analysis, the VA Distributable Earnings represent the sum of (i) the statutory earnings of the in-force variable annuity business under these scenarios and (ii) the net capital release or injection required to maintain our target funding level by the end of each year.
| January 1, 2018 to December 31, 2020 |
Base Case Scenario |
Upside Scenario |
Downside Scenario |
Extreme Scenario |
Downside and Lapse Sensitivity |
|||||||||||||||
| (in billions) | ||||||||||||||||||||
| VA Distributable Earnings |
$ | 4.1 | $ | 4.3 | $ | 3.1 | $ | 1.6 | $ | 2.9 | ||||||||||
The table below illustrates the estimated present value of the in-force variable annuity business under each of the five scenarios. The table represents the (i) estimated present value of the in-force variable annuity cash flows at a 4% discount rate, which includes the anticipated revenues net of assumed expenses and hedging costs, without reflecting the effect of capital and reserving requirements and the investment income on the assets backing reserve and capital and (ii) total amount of starting assets that we intend to hold for the business at the time of the settlement of this offering to meet a target asset level of CTE98 plus a $500 million buffer (excluding any additional excess assets we may have overall).
| Estimated as of December 31, 2017 | ||||||||||||||||||||
| Base Case Scenario |
Upside Scenario |
Downside Scenario |
Extreme Scenario |
Downside and Lapse Sensitivity |
||||||||||||||||
| (in billions) | ||||||||||||||||||||
| Present Value of Pre-Tax Cash Flows |
$ | 0.2 | $ | 4.8 | $ | (3.4 | ) | $ | (6.3 | ) | $ | (4.1 | ) | |||||||
| Variable Annuity Assets |
12.6 | 12.6 | 12.6 | 12.6 | 12.6 | |||||||||||||||
|
|
|
|
|
|
|
|
|
|
|
|||||||||||
| Total (including Variable Annuity Assets) |
$ | 12.9 | $ | 17.5 | $ | 9.2 | $ | 6.3 | $ | 8.6 | ||||||||||
|
|
|
|
|
|
|
|
|
|
|
|||||||||||
The foregoing analyses illustrate the resilience of our in-force variable annuity business across a wide range of capital market scenarios, including under extreme adverse shocks to equity returns and interest rates. As our variable annuity products with fixed rate GMxB features mature, under the base case scenario, payment of benefit claims and release of prudent margins result in a decrease in assets we are required to hold to maintain our target funding level. Under the base case scenario and applying the assumptions above for all future periods, we expect to release capital over time as the variable annuity assets we are required to hold to maintain our target funding level are expected to decrease by approximately 15% by 2027 as our variable annuity portfolio matures and benefits of planned management actions are realized.
202
Table of Contents
The sensitivities and scenarios discussed in this section are estimates and are not intended to predict the future financial performance of our variable annuity business or to represent an opinion of market value. They were selected for illustrative purposes only and they do not purport to encompass all of the many factors that may bear upon a market value and are based on a series of assumptions as to the future. It should be recognized that actual future results will differ from those shown, on account of changes in the operating and economic environments and natural variations in experience. The results shown are presented as of December 31, 2017 and no assurance can be given that future experience will be in line with the assumptions made.
The results of the analysis are derived from our projection model which cannot entirely encompass the complexity of the evolution of financial markets and of our asset and liability portfolios. The projections are based on assumptions that we believe are reasonable based on our historical experience. However, there is no guarantee that future experience will be consistent with these assumptions, and therefore actual results could materially deviate from the results shown above. We provide below a non-comprehensive list of key assumptions from which any deviation could significantly impact the actual cash-flow generation of our in-force variable annuity business:
| • | Economic scenarios. Our economic scenarios assume annual evolution of equity and interest rates. Actual market conditions are significantly more complex than our scenarios, which will cause our actual results to deviate from our estimated results, even if the annual performance of equity and interest rates is similar to that assumed in our economic scenarios. |
| • | Basis risk. Our asset allocation in investment funds is mapped to different equity or fixed income indices. The actual fund return for these funds will differ from the mapped estimates used in our modeling. |
| • | Actuarial assumptions. Actuarial assumptions are based on our observed experience, and future experience will deviate from our assumptions. Our policyholder behavior assumptions include certain dynamic components, i.e., variables which may change as a result of financial market conditions, to capture our experiences on the general trend of our policyholders’ reaction to market conditions. The actual reaction of our policyholders to market conditions may deviate from our assumptions. |
| • | Hedging. To represent our prospective hedging program within the projections, we project a hedge asset portfolio, mainly comprised of derivatives, according to targets defined in our prospective strategy. The estimate of our hedging targets is based on models containing a number of simplifications which could cause the projection of targets to differ from the actual evolution of these targets over time. Additionally, we may not be able to effectively implement our intended hedging strategy due to a variety of factors including unavailability of desired instruments, excessive transaction costs, or deviations in market prices for hedge assets from our modeled assumptions. |
The policyholder behavior assumptions embedded in our cash flow sensitivities represent our best estimate for our in-force business as of December 31, 2017. The following policyholder options are examples of those included in our sensitivities: lapse, partial lapse, dollar-for-dollar withdrawals and voluntary annuitizations. These assumptions are dynamic and vary depending on the NAR of the contract and our expectation of how a customer will utilize their embedded options across the various scenarios. As one of the first sellers of GMLB features, we have one of the oldest variable annuity in-force books of business with over 20 years of policyholder behavior experience from which to base our assumptions. However, a change in our cash flows will result to the extent emerging experience deviates from these policyholder option use assumptions.
The information appearing in this section, “Supplemental Information on Our In-Force Variable Annuity Business,” is considered prospective financial information. This prospective financial information has been prepared by, and is the responsibility of, the Company’s management. PricewaterhouseCoopers LLP has neither audited, reviewed, examined, compiled nor applied agreed-upon procedures with respect to the accompanying prospective financial information, including, but not limited to, the Company’s Sensitivity Analysis and VA Distributable Earnings projections, and, accordingly, PricewaterhouseCoopers LLP does not express an opinion
203
Table of Contents
or any other form of assurance with respect thereto. The PricewaterhouseCoopers LLP report included in this prospectus relates to the Company’s historical financial information. It does not extend to the prospective financial information and should not be read to do so.
Group Retirement
Our Group Retirement segment, known in the market as Retirement Plan Services, offers tax-deferred investment products and related solutions to employer-sponsored retirement plans sponsored by educational and not-for-profit entities (including municipal governments), as well as small and medium-sized businesses. We operate in the 403(b), 401(k) and 457(b) markets where we sell variable annuity and mutual fund-based products. As of December 31, 2017, we had relationships with approximately 26,000 employers and served more than 1.0 million participants, of which approximately 725,000 were educators. A specialized division of AXA Advisors, RBG, is the primary distributor of our products and related solutions to the education market with more than 1,000 advisors dedicated to helping educators prepare for retirement as of December 31, 2017.
In Group Retirement, for the year ended December 31, 2017, we were the #1 provider by gross premiums of retirement plans to the K-12 education market, according to LIMRA. The tax-exempt 403(b)/457(b) market, which includes our 403(b) K-12 business, accounted for the majority of sales within the Group Retirement business for the year ended December 31, 2017 and represented 75% of Group Retirement AV, as of December 31, 2017.
The recurring nature of the revenues from our Group Retirement business makes this segment an important and stable contributor of earnings and cash flow to our business. The primary sources of revenue for the Group Retirement business include fee revenue and investment income.
To further growth of our Group Retirement segment, we plan to generate new sales by innovating our products and expanding our distribution footprint and to optimize participant contributions and client retention by providing superior client service.
Product Innovation. We continuously seek to improve our products by offering several product features that differentiate us from our competition including our index-linked investment, guaranteed income and fixed interest rate features. More recently, we launched a mutual fund-based product to complement our variable annuity products, which will enable us to accelerate growth in certain segments of the market.
Distribution Expansion. We believe that RBG is a strategic differentiator in the 403(b) market. Our nationwide footprint of advisors provides valuable services to a wide range of clients in the education market saving for retirement. For 401(k) products, we primarily focus on the under $20 million plan market, which is attractive to us because it is aligned with our affiliated advisor distribution focus on small businesses and business owners and because of the relatively high level of new plan creation and takeover opportunities in this market. We seek to grow our distribution footprint through hiring and developing new RBG advisors and expanding third-party distribution relationships.
In-force Client Engagement. Through our RBG advisors and direct education efforts, such as direct mail and email, we regularly provide our in-force clients with information to keep them on track for a secure retirement. Through this interactive client engagement model, many of our clients choose to increase the amount of contributions into our retirement plans to achieve their retirement goals.
Client Retention. Our strong retention rate in the 403(b) market, driven by our interactive client engagement model and strong customer service, places us among the top companies in the industry. We had a retention rate of 93% for 2017. Our Group Retirement business customer service team has won the DALBAR Annuity Service Award for seven straight years from 2011 to 2017. In addition to engaging with our clients through advisors as noted above, we also engage our customers digitally with our learning lab and education platform. In 2017, we
204
Table of Contents
launched additional retirement income readiness tools that leverage peer benchmarking and other behavioral economics strategies to drive increased contributions from existing participants in all markets. The overall objective of this and our other client retention programs is to maintain a high level of customer engagement and satisfaction and limit asset outflows.
Products
Our products offer teachers, municipal employees and corporate employees a savings opportunity that provides tax-deferred wealth accumulation coupled with industry award-winning customer service. Our innovative product offerings address all retirement phases with diverse investment options.
Variable Annuities. Our variable annuities offer defined contribution plan recordkeeping, as well as administrative and participant services combined with a variety of proprietary and non-proprietary investment options. Our variable annuity investment lineup mostly consists of proprietary variable investment options that are managed by AXA Equitable FMG. AXA Equitable FMG provides discretionary investment management services for these investment options that include developing and executing asset allocation strategies and providing rigorous oversight of sub-advisors for the investment options. This helps to ensure that we retain high quality managers and that we leverage our scale across both the Individual Retirement and Group Retirement products. In addition, our variable annuity products offer the following features:
| • | Guaranteed Interest Option (“GIO”)—Provides a fixed interest rate and guaranteed AV. 32% of Group Retirement AV is in these options. |
| • | Structured Investment Option (“SIO”)—Provides upside market participation that tracks either the S&P 500, Russell 2000 or the MSCI EAFE index subject to a performance cap, with a downside buffer that limits losses in the investment over a 1, 3 or 5 year investment horizon. This option leverages our innovative SCS individual annuity offering, and we believe that we are the only provider that offers this type of guarantee in the defined contribution markets today. |
| • | Personal Income Benefit—An optional GMxB feature that enables participants to obtain a guaranteed withdrawal benefit for life for an additional fee. |
While GMxB features provide differentiation in the market, only approximately $69 million, or 0.2%, of our total AV is invested in products with GMxB features (other than ROP death benefits) as of December 31, 2017, and based on current utilization, we do not expect significant flows into these types of GMxB features.
Open Architecture Mutual Fund Platform. We recently launched a mutual fund-based product to complement our variable annuity products. This platform provides a similar service offering to our variable annuities from the same award-winning service team. The program allows plan sponsors to select from approximately 15,000 mutual funds. The platform also offers a group fixed annuity that operates very similarly to the GIO as an available investment option on this platform.
Services. Both our variable annuity and open architecture mutual fund products offer a suite of tools and services to enable plan participants to obtain education and guidance on their contributions and investment decisions and plan fiduciary services. Education and guidance is available on-line or in person from a team of plan relationship and enrollment specialists and/or the advisor that sold the product. Our clients’ retirement contributions come through payroll deductions, which contribute significantly to stable and recurring sources of renewals.
205
Table of Contents
The chart below illustrates our net flows for the years ended December 31, 2017, 2016 and 2015.
| Years Ended | ||||||||||||
| December 31, 2017 | December 31, 2016 | December 31, 2015 | ||||||||||
| (in millions) | ||||||||||||
| Net Flows |
||||||||||||
| Gross Premiums |
$ | 3,205 | $ | 3,137 | $ | 2,858 | ||||||
| Surrenders, Withdrawals and Benefits |
(2,938 | ) | (2,458 | ) | (2,507 | ) | ||||||
|
|
|
|
|
|
|
|||||||
| Net Flows |
$ | 267 | $ | 679 | $ | 351 | ||||||
|
|
|
|
|
|
|
|||||||
The following table presents the gross premiums for each of our markets for the periods specified.
| Years Ended | ||||||||||||
| December 31, 2017 | December 31, 2016 | December 31, 2015 | ||||||||||
| (in millions) | ||||||||||||
| Gross Premiums by Market |
||||||||||||
| Tax-Exempt |
$ | 872 | $ | 842 | $ | 738 | ||||||
| Corporate |
470 | 497 | 360 | |||||||||
| Other |
45 | 34 | 36 | |||||||||
|
|
|
|
|
|
|
|||||||
| Total FYP |
$ | 1,387 | $ | 1,373 | $ | 1,134 | ||||||
|
|
|
|
|
|
|
|||||||
| Tax-Exempt |
1,330 | 1,280 | 1,225 | |||||||||
| Corporate |
293 | 275 | 288 | |||||||||
| Other |
213 | 209 | 211 | |||||||||
|
|
|
|
|
|
|
|||||||
| Total Renewal Premiums |
$ | 1,836 | $ | 1,764 | $ | 1,724 | ||||||
|
|
|
|
|
|
|
|||||||
| Gross Premiums |
$ | 3,223 | $ | 3,137 | $ | 2,858 | ||||||
|
|
|
|
|
|
|
|||||||
Markets
We primarily operate in the tax-exempt 403(b)/457(b), corporate 401(k) and other markets.
Tax-exempt 403(b)/457(b)—We primarily serve employees of public school systems and have access to clients in more than 8,800 public school plans. We serve more than 725,000 educators with access to approximately 3.2 million educators in the plans where we are an approved provider. To a lesser extent, we also market to 1,100 government entities that sponsor 457(b) plans. Given that the bulk of our plans are state or local government sponsored, they are not subject to the scope of the DOL fiduciary rule.
Overall, the 403(b) and 457(b) markets represent 75% of FYP in the Group Retirement segment as of December 31, 2017. We seek to grow in these markets by increasing our presence in the school districts where we currently operate and also by potentially growing our presence in school districts where we currently do not have access.
Corporate 401(k)—We target small and medium-sized businesses with 401(k) plans that generally have under $20 million in assets. Our product offerings accommodate start up plans and plans with accumulated assets. Typically, our products appeal to companies with strong contribution flows and a smaller number of participants with relatively high average participant balances. Our corporate 401(k) business serves more than 4,500 employers and more than 69,000 participants. The under $20 million asset plan market is well aligned with our advisor distribution, which has a strong presence in the small and medium-sized business market, and complements our other products focused on this market (such as life insurance and employee benefits products aimed at this market).
Other—Our other business includes an affinity-based direct marketing program where we offer retirement and individual products to employers that are members of industry or trade associations and various other sole proprietor and small business retirement accounts.
206
Table of Contents
The following table presents the relative contribution of each our markets to AV for the periods specified.
| As of | ||||||||||||
| December 31, 2017 |
December 31, 2016 |
December 31, 2015 |
||||||||||
| (in millions) | ||||||||||||
| AV by Market |
||||||||||||
| Tax-Exempt |
$ | 25,383 | $ | 22,454 | $ | 20,562 | ||||||
| Corporate |
3,959 | 3,422 | 3,008 | |||||||||
| Other |
4,564 | 4,262 | 4,187 | |||||||||
|
|
|
|
|
|
|
|||||||
| AV |
$ | 33,906 | $ | 30,138 | $ | 27,757 | ||||||
|
|
|
|
|
|
|
|||||||
Distribution
We primarily distribute our products and services to this market through AXA Advisors and third-party distribution firms. For the year ended December 31, 2017, these channels represented 88% and 12% of our sales, respectively. We also distribute through direct online sales. We employ more than 40 internal and external wholesalers to exclusively market our products through AXA Advisors and third-party firms.
AXA Advisors, through RBG, is the primary distribution channel for our products. RBG has a group of more than 1,000 advisors that specialize in the 403(b) and 457(b) markets as of December 31, 2017. The cornerstone of the RBG model is a repeatable and scalable advisor recruiting and training model that we believe is more effective than the overall industry model. RBG advisors complete several levels of training that are specific to the education market and give them the requisite skills to assess the educators’ retirement needs and how our products can help to address those needs. AXA Advisors also accounted for 92% of our 403(b) sales in 2017.
Group Retirement products are also distributed through third-party firms and directly to customers online. We are a 403(b) market leader in digital customer acquisition. Beginning in 2015, we created a digital engagement strategy to supplement our traditional advisor based model. The program uses data analysis combined with digital media to engage educators, teach them about their retirement needs and increase awareness of our products and services. Educators can then complete the process to enroll in a 403(b) product fully online, through a phone conversation or face-to-face with an advisor.
The following table presents first year premium by distribution channel for the periods indicated:
| Years Ended | ||||||||||||
| December 31, 2017 | December 31, 2016 | December 31, 2015 | ||||||||||
| (in millions) |
||||||||||||
| FYP by Distribution |
||||||||||||
| AXA Advisors |
$ | 1,226 | $ | 1,151 | $ | 1,022 | ||||||
| Third-Party |
161 | 222 | 112 | |||||||||
|
|
|
|
|
|
|
|||||||
| Total |
$ | 1,387 | $ | 1,373 | $ | 1,134 | ||||||
|
|
|
|
|
|
|
|||||||
Competition
We compete with select insurance companies, asset managers, record keepers and diversified financial institutions that target similar market segments. Competition varies in all market segments with no one company dominating across all market segments. In the K-12 education market, competitors are primarily insurance-based providers that focus on school districts. In the small and medium-sized business market, the primary competitors are insurance-based providers and mutual fund companies. The main features that distinguish our offering to clients include our RBG distribution model; the product features we offer to clients, including guarantees; our financial strength and our award winning customer service.
207
Table of Contents
Underwriting and Pricing
We generally do not underwrite our annuity products on an individual-by-individual basis. Instead, we price our products based upon our expected investment returns and assumptions regarding mortality, longevity and persistency for our policyholders collectively, while taking into account historical experience. We price variable annuities by analyzing longevity and persistency risk, volatility of expected earnings on our AV and the expected time to retirement. Our product pricing models also take into account capital requirements, hedging costs and operating expenses. Investment-oriented products are priced based on various factors, which may include investment return, expenses, persistency and optionality.
Our variable annuity products generally include penalties for early withdrawals. From time to time, we reevaluate the type and level of guarantees and other features we offer. We have previously changed the nature and pricing of the features we offer and will likely do so from time to time in the future as the needs of our clients, the economic environment and our risk appetite evolve.
Fees
We earn various types of fee revenue based on AV, fund assets and benefit base. Fees that we collect include mortality & expense, administrative charges and distribution charges; withdrawal charges; investment management fees; 12b-1 fees; death benefit rider charges; and living benefit riders charges. For a more detailed description of these types of fees, see “—Individual Retirement—Fees on AV, Fund Assets, Benefit Base and Investment Income.”
Risk Management
We design our Group Retirement products with the goal of providing attractive features to clients that also minimize risks to us. To mitigate risks to our General Account from fluctuations in interest rates, we apply a variety of techniques that align well with a given product type. We designed our GIO to comply with the NAIC minimum rate (1% for new issues), and our 403(b) products that we currently sell include a contractual provision that enables us to limit transfers into the GIO. As most defined contribution plans allow participants to borrow against their accounts, we have made changes to our loan repayment processes to minimize participant loan defaults and to facilitate loan repayments to the participant’s current investment allocation as opposed to requiring repayments only to the GIO. In the 401(k) and 457(b) markets, we may charge a market value adjustment on the assets of the GIO when a plan sponsor terminates its agreement with us. We also prohibit direct transfers to fixed income products that compete with the GIO, which protects the principal in the General Account in a rising interest rate environment.
In the Tax-Exempt market, the benefits include a minimum guaranteed interest rate on our GIO, return of premium death benefits and limited optional GMxB features. The utilization of GMxB features is low. In the Corporate market, the products that we sell today do not offer death benefits in excess of the AV.
208
Table of Contents
While approximately two-thirds of our General Account AV has a minimum guaranteed rate of 3-4%, we have twice the amount of Separate Account AV. Given the growth in net flows to our newer products and the slowing in flows to older blocks due to retirement, we expect that guarantees at a rate over 3% will continue to diminish as a percentage of our overall General Account AV. The table below illustrates the guaranteed minimum rates applicable to our General Account AV for products with the GIO, as of December 31, 2017.
| Guaranteed Minimum Interest Rate |
Total General Account AV |
|||
| (in billions) | ||||
| 1 – < 2% |
$ | 2.4 | ||
| 2 – < 3% |
1.3 | |||
| 3% |
6.9 | |||
| 4% |
0.2 | |||
|
|
|
|||
| Total |
$ | 10.8 | ||
|
|
|
|||
We use a committee of subject matter experts and business leaders that meet periodically to set crediting rates for our guaranteed interest options. The committee evaluates macroeconomic and business factors to determine prudent interest rates in excess of the contract minimum when appropriate.
We also monitor the behavior of our clients who have the ability to transfer assets between the GIO and various Separate Account investment options. We have not historically observed a material shift of assets moving into guarantees during times of higher market volatility.
Hedging. We hedge crediting rates to mitigate certain risks associated with the SIO. In order to support the returns associated with the SIO, we enter into derivatives contracts whose payouts, in combination with fixed income investments, emulate those of the S&P 500, Russell 2000 or MSCI EAFE index, subject to caps and buffers.
Investment Management and Research
Our global Investment Management and Research business provides diversified investment management, research and related solutions to a broad range of clients around the world. We distribute our investment management products and solutions through three main client channels—Institutional, Retail and Bernstein Private Wealth Management—and distribute our institutional research products and solutions through Bernstein Research Services. AB Holding is a master limited partnership publicly listed on the NYSE. Giving effect to the Reorganization Transactions, we will own an approximate 65% economic interest in AB at the time of the offering. As the general partner of AB, we have the authority to manage and control its business, and accordingly, this segment reflects AB’s consolidated financial results.
Our Investment Management and Research business had approximately $554 billion in AUM as of December 31, 2017, composed of 35% equities, 54% fixed income and 11% multi-asset class solutions, alternatives and other assets. By distribution channel, institutional clients represented 48% of AUM, while retail and private wealth management clients represented 35% and 17%, respectively, as of December 31, 2017.
AB has a suite of actively managed, differentiated equity and fixed income services, delivering strong risk-adjusted returns. For instance, 91% of our fixed income services and 85% of our equity services have outperformed their benchmarks over the three-year period ended December 31, 2017. In addition, 72% of AB’s rated U.S. retail assets were invested in funds rated four or five stars by Morningstar.
Bernstein Research Services has received top Institutional Investor rankings and Bernstein Private Wealth Management ranks among the top 20 wealth management firms in the United States, according to Barron’s.
209
Table of Contents
AB has a strong global distribution footprint. For the year ended December 31, 2017, 41% of AB’s revenues came from outside the United States, with a significant portion derived from retail fixed income sales in the Asia region (excluding Japan). We have strong market positions in many of the region’s largest markets. As of December 31, 2016, we had a 23% market share of total retail assets in Taiwan, and our market share was 12% in both Hong Kong and Korea and 5% in Singapore.
Additionally, over the past several years AB has significantly broadened and strengthened its product portfolio, introducing more than 100 new and enhanced offerings since 2009. These services account for 28% of AB’s AUM as of December 31, 2017. Examples include our Select Equities and U.S. and Global Concentrated Equity services, our middle markets private lending service and our real estate private equity and debt service.
We and other AXA affiliates, collectively, are AB’s largest client. We represented 17% of AB’s total AUM as of December 31, 2017 and 3% of AB’s net revenues for the year ended December 31, 2017. AXA and its affiliates other than us represented 6% of AB’s total AUM as of December 31, 2017 and 2% of AB’s net revenues for the year ended December 31, 2017. Additionally, AXA and its affiliates (including us) have made seed investments in various AB investment services. By letter dated March 31, 2018, AXA advised AB of its current intention to continue using AB for the foreseeable future as a preferred provider of asset management services and to continue making commercial and seed investments that suit AXA from an investment perspective, in each case (i) consistent with past practice, (ii) subject to investment performance/returns and (iii) subject to applicable fiduciary duties.
AB provides research, diversified investment management and related services globally to a broad range of clients. Its principal services include:
| • | Institutional Services—servicing its institutional clients, including private and public pension plans, foundations and endowments, insurance companies, central banks and governments worldwide, and affiliates such as AXA and its subsidiaries, by means of separately-managed accounts, sub-advisory relationships, structured products, collective investment trusts, mutual funds, hedge funds and other investment vehicles. |
| • | Retail Services—servicing its retail clients, primarily by means of retail mutual funds sponsored by AB or AXA Equitable FMG, sub-advisory relationships with mutual funds sponsored by third parties, separately-managed account programs sponsored by financial intermediaries worldwide and other investment vehicles. |
| • | Private Wealth Management Services—servicing its private clients, including high net worth individuals and families, trusts and estates, charitable foundations, partnerships, private and family corporations, and other entities, by means of separately-managed accounts, hedge funds, mutual funds and other investment vehicles. |
| • | Bernstein Research Services—servicing institutional investors, such as pension fund, hedge fund and mutual fund managers, seeking high-quality fundamental research, quantitative services and brokerage-related services in equities and listed options. |
AB also provides distribution, shareholder servicing, transfer agency services and administrative services to the mutual funds it sponsors.
Generally, AB is compensated for its investment services on the basis of investment advisory and services fees calculated as a percentage of AUM.
Products and Services
Investment Services. AB provides a broad range of investment services with expertise in:
| • | Actively-managed equity strategies, with global and regional portfolios across capitalization ranges, concentration ranges and investment strategies, including value, growth and core equities; |
210
Table of Contents
| • | Actively-managed traditional and unconstrained fixed income strategies, including taxable and tax-exempt strategies; |
| • | Passive management, including index and enhanced index strategies; |
| • | Alternative investments, including hedge funds, fund of funds, private equity (e.g., direct real estate investing) and direct lending; and |
| • | Multi-asset solutions and services, including dynamic asset allocation, customized target-date funds and target-risk funds. |
AB’s services span various investment disciplines, including market capitalization (e.g., large-, mid- and small-cap equities), term (e.g., long-, intermediate- and short-duration debt securities) and geographic location (e.g., U.S., international, global, emerging markets, regional and local), in major markets around the world.
Research. AB’s high-quality, in-depth research is the foundation of its business. AB believes that its global team of research professionals, whose disciplines include economic, fundamental equity, fixed income and quantitative research, gives it a competitive advantage in achieving investment success for its clients. AB also has experts focused on multi-asset strategies, wealth management and alternative investments.
Custody. AB’s U.S.-based broker-dealer subsidiary acts as custodian for the majority of AB’s Private Wealth Management AUM and some of its Institutions AUM. Other custodial arrangements are maintained by client-designated banks, trust companies, brokerage firms or custodians.
For additional information about AB’s investment advisory fees, including performance-based fees, see “Risk Factors—Risks Relating to Our Investment Management and Research Business” and “Management’s Discussion and Analysis of Financial Condition and Results of Operations—Results of Operations by Segment—Investment Management and Research.”
Markets
AB operates in major markets around the world, including the United States, EMEA (Europe, the Middle East and Africa) and Asia. Our AUM is disbursed as follows:
By Investment Service ($ in billions):
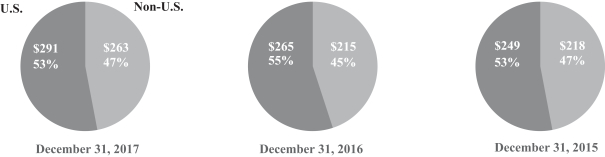
211
Table of Contents
By Client Domicile ($ in billions):
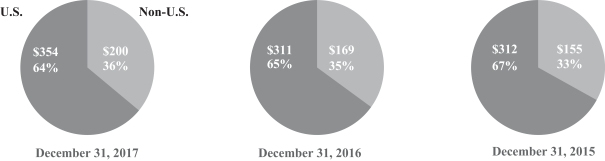
Distribution
We distribute our products and solutions through three main client channels: Institutional, Retail and Bernstein Private Wealth Management.
Institutional. AB offers to its institutional clients, which include private and public pension plans, foundations and endowments, insurance companies, central banks and governments worldwide, various of AB’s AXA affiliates, separately-managed accounts, sub-advisory relationships, structured products, collective investment trusts, mutual funds, hedge funds and other investment vehicles (“Institutional Services”).
AB manages the assets of its institutional clients pursuant to written investment management agreements or other arrangements, which generally are terminable at any time or upon relatively short notice by either party. In general, AB’s written investment management agreements may not be assigned without the client’s consent.
Retail. AB provides investment management and related services to a wide variety of individual retail investors, both in the United States and internationally, through retail mutual funds AB sponsors, mutual fund sub-advisory relationships, separately-managed account programs and other investment vehicles (“Retail Products and Services”).
AB distributes its Retail Products and Services through financial intermediaries, including broker-dealers, insurance sales representatives, banks, registered investment advisers and financial planners. These products and services include open-end and closed-end funds that are either (i) registered as investment companies under the Investment Company Act or (ii) not registered under the Investment Company Act and generally not offered to U.S. persons. They also include separately-managed account programs, which are sponsored by financial intermediaries and generally charge an all-inclusive fee covering investment management, trade execution, asset allocation and custodial and administrative services. In addition, AB provides distribution, shareholder servicing, transfer agency services and administrative services for its Retail Products and Services.
Private Wealth Management. AB offers to its private clients, which include high net worth individuals and families, trusts and estates, charitable foundations, partnerships, private and family corporations and other entities, separately-managed accounts, hedge funds, mutual funds and other investment vehicles.
AB manages these accounts pursuant to written investment advisory agreements, which generally are terminable at any time or upon relatively short notice by any party and may not be assigned without the client’s consent.
Competition
AB competes in all aspects of its business with numerous investment management firms, mutual fund sponsors, brokerage and investment banking firms, insurance companies, banks, savings and loan associations
212
Table of Contents
and other financial institutions that often provide investment products that have similar features and objectives as those AB offers. AB’s competitors offer a wide range of financial services to the same customers that AB seeks to serve.
To grow its business, AB believes it must be able to compete effectively for AUM. Key competitive factors include (i) AB’s investment performance for clients; (ii) AB’s commitment to place the interests of its clients first; (iii) the quality of AB’s research; (iv) AB’s ability to attract, motivate and retain highly skilled, and often highly specialized, personnel; (v) the array of investment products AB offers; (vi) the fees AB charges; (vii) Morningstar/Lipper rankings for the AB Funds; (viii) AB’s ability to sell its actively-managed investment services despite the fact that many investors favor passive services; (ix) AB’s operational effectiveness; (x) AB’s ability to further develop and market its brand; and (xi) AB’s global presence.
AUM
AUM by distribution channel were as follows:
| As of December 31, | ||||||||||||
| 2017 | 2016 | 2015 | ||||||||||
| (in billions) | ||||||||||||
| Institutions |
$ | 269.3 | $ | 239.3 | $ | 236.2 | ||||||
| Retail |
192.9 | 160.2 | 154.4 | |||||||||
| Private Wealth Management |
92.3 | 80.7 | 76.8 | |||||||||
|
|
|
|
|
|
|
|||||||
| Total |
$ | 554.5 | $ | 480.2 | $ | 467.4 | ||||||
|
|
|
|
|
|
|
|||||||
AUM by investment service are as follows:
| As of December 31, | ||||||||||||
| 2017 | 2016 | 2015 | ||||||||||
| (in billions) | ||||||||||||
| Equity |
||||||||||||
| Actively Managed |
$ | 139.4 | $ | 111.9 | $ | 110.6 | ||||||
| Passively Managed(1) |
54.3 | 48.1 | 46.4 | |||||||||
|
|
|
|
|
|
|
|||||||
| Total Equity |
193.7 | $ | 160.0 | $ | 157.0 | |||||||
|
|
|
|
|
|
|
|||||||
| Fixed Income |
||||||||||||
| Actively Managed |
||||||||||||
| Taxable |
247.9 | 220.9 | 207.4 | |||||||||
| Tax—exempt |
40.4 | 36.9 | 33.5 | |||||||||
|
|
|
|
|
|
|
|||||||
| Total Actively Managed |
288.3 | 257.8 | 240.9 | |||||||||
|
|
|
|
|
|
|
|||||||
| Passively Managed(1) |
9.9 | 11.1 | 10.0 | |||||||||
|
|
|
|
|
|
|
|||||||
| Total Fixed Income |
$ | 298.2 | $ | 268.9 | $ | 250.9 | ||||||
|
|
|
|
|
|
|
|||||||
| Other(2) |
||||||||||||
| Actively Managed |
$ | 61.9 | $ | 50.8 | $ | 59.1 | ||||||
| Passively Managed(1) |
0.7 | 0.5 | 0.4 | |||||||||
|
|
|
|
|
|
|
|||||||
| Total Other |
$ | 62.6 | $ | 51.3 | $ | 59.5 | ||||||
|
|
|
|
|
|
|
|||||||
| Total |
$ | 554.5 | $ | 480.2 | $ | 467.4 | ||||||
|
|
|
|
|
|
|
|||||||
| (1) | Includes index and enhanced index services. |
| (2) | Includes certain multi-asset solutions and services and certain alternative investments. |
213
Table of Contents
Changes in AUM for the twelve-month period ended December 31, 2017 are as follows:
| Distribution Channel | ||||||||||||||||
| Institutions | Retail | Private Wealth Management |
Total | |||||||||||||
| (in billions) | ||||||||||||||||
| Balance as of December 31, 2016 |
$ | 239.3 | $ | 160.2 | $ | 80.7 | $ | 480.2 | ||||||||
| Long-term flows |
||||||||||||||||
| Sales/new accounts |
13.4 | 53.8 | 11.5 | 78.7 | ||||||||||||
| Redemptions/terminations |
(11.5 | ) | (38.6 | ) | (10.6 | ) | (60.7 | ) | ||||||||
| Cash flow/unreinvested dividends |
1.7 | (6.3 | ) | (0.2 | ) | (4.8 | ) | |||||||||
|
|
|
|
|
|
|
|
|
|||||||||
| Net long-term (outflows) inflows |
3.6 | 8.9 | 0.7 | 13.2 | ||||||||||||
| Market appreciation |
26.4 | 23.8 | 10.9 | 61.1 | ||||||||||||
|
|
|
|
|
|
|
|
|
|||||||||
| Net change |
30.0 | 32.7 | 11.6 | 74.3 | ||||||||||||
|
|
|
|
|
|
|
|
|
|||||||||
| Balance as of December 31, 2017 |
$ | 269.3 | $ | 192.9 | $ | 92.3 | $ | 554.5 | ||||||||
|
|
|
|
|
|
|
|
|
|||||||||
| Investment Service | ||||||||||||||||||||||||||||
| Equity Actively Managed |
Equity Passively Managed(1) |
Fixed Income Actively Managed— Taxable |
Fixed Income Actively Managed— Tax-Exempt |
Fixed Income Passively Managed(1) |
Other(2) | Total | ||||||||||||||||||||||
| (in billions) | ||||||||||||||||||||||||||||
| Balance as of December 31, 2016 |
$ | 111.9 | $ | 48.1 | $ | 220.9 | $ | 36.9 | $ | 11.1 | $ | 51.3 | $ | 480.2 | ||||||||||||||
| Long-term flows |
||||||||||||||||||||||||||||
| Sales/new accounts |
21.9 | 1.1 | 41.1 | 7.9 | 0.1 | 6.6 | 78.7 | |||||||||||||||||||||
| Redemptions/terminations |
(19.0 | ) | (1.4 | ) | (29.8 | ) | (5.9 | ) | (1.8 | ) | (2.8 | ) | (60.7 | ) | ||||||||||||||
| Cash flow/unreinvested dividends |
(2.1 | ) | (4.0 | ) | 1.5 | (0.1 | ) | — | (0.1 | ) | (4.8 | ) | ||||||||||||||||
|
|
|
|
|
|
|
|
|
|
|
|
|
|
|
|||||||||||||||
| Net long-term (outflows) inflows |
0.8 | (4.3 | ) | 12.8 | 1.9 | (1.7 | ) | 3.7 | 13.2 | |||||||||||||||||||
| Market appreciation |
26.7 | 10.5 | 14.2 | 1.6 | 0.5 | 7.6 | 61.1 | |||||||||||||||||||||
|
|
|
|
|
|
|
|
|
|
|
|
|
|
|
|||||||||||||||
| Net change |
27.5 | 6.2 | 27.0 | 3.5 | (1.2 | ) | 11.3 | 74.3 | ||||||||||||||||||||
|
|
|
|
|
|
|
|
|
|
|
|
|
|
|
|||||||||||||||
| Balance as of December 31, 2017 |
$ | 139.4 | $ | 54.3 | $ | 247.9 | $ | 40.4 | $ | 9.9 | $ | 62.6 | $ | 554.5 | ||||||||||||||
|
|
|
|
|
|
|
|
|
|
|
|
|
|
|
|||||||||||||||
| (1) | Includes index and enhanced index services. |
| (2) | Includes certain multi-asset solutions and services and certain alternative investments. |
214
Table of Contents
Net long-term inflows (outflows) for actively-managed investment services as compared to passively managed investment services for the years ended December 31, 2017, 2016 and 2015, respectively, are as follows:
| Years Ended | ||||||||||||
| December 31, 2017 |
December 31, 2016 |
December 31, 2015 |
||||||||||
| (in billions) | ||||||||||||
| Actively Managed |
||||||||||||
| Equity |
$ | 0.8 | $ | (7.6 | ) | $ | (2.3 | ) | ||||
| Fixed Income |
14.7 | 9.0 | (1.9 | ) | ||||||||
| Other |
3.6 | (9.5 | ) | 10.5 | ||||||||
|
|
|
|
|
|
|
|||||||
| Total |
$ | 19.1 | $ | (8.1 | ) | $ | 6.3 | |||||
|
|
|
|
|
|
|
|||||||
| Passively Managed |
||||||||||||
| Equity |
$ | (4.3 | ) | $ | (2.5 | ) | $ | (3.1 | ) | |||
| Fixed Income |
(1.7 | ) | 0.7 | — | ||||||||
| Other |
0.1 | 0.1 | — | |||||||||
|
|
|
|
|
|
|
|||||||
| Total |
$ | (5.9 | ) | $ | (1.7 | ) | $ | (3.1 | ) | |||
|
|
|
|
|
|
|
|||||||
| Total net long-term inflows (outflows) |
$ | 13.2 | $ | (9.8 | ) | $ | 3.2 | |||||
|
|
|
|
|
|
|
|||||||
Average AUM by distribution channel and investment service were as follows:
| Years Ended | ||||||||||||
| December 31, 2017 |
December 31, 2016 |
December 31, 2015 |
||||||||||
| (in billions) | ||||||||||||
| Distribution Channel |
||||||||||||
| Institutions |
$ | 253.8 | $ | 243.4 | $ | 242.9 | ||||||
| Retail |
177.5 | 157.7 | 160.6 | |||||||||
| Private Wealth Management |
86.7 | 78.9 | 77.2 | |||||||||
|
|
|
|
|
|
|
|||||||
| Total |
$ | 518.0 | $ | 480.0 | $ | 480.7 | ||||||
|
|
|
|
|
|
|
|||||||
| Investment Service |
||||||||||||
| Equity Actively Managed |
$ | 125.6 | $ | 109.4 | $ | 113.2 | ||||||
| Equity Passively Managed(1) |
50.8 | 46.5 | 49.3 | |||||||||
| Fixed Income Actively Managed—Taxable |
236.3 | 221.5 | 217.7 | |||||||||
| Fixed Income Actively Managed—Tax-exempt |
38.8 | 36.3 | 32.6 | |||||||||
| Fixed Income Passively Managed(1) |
10.3 | 11.0 | 10.1 | |||||||||
| Other(2) |
56.2 | 55.3 | 57.8 | |||||||||
|
|
|
|
|
|
|
|||||||
| Total |
$ | 518.0 | $ | 480.0 | $ | 480.7 | ||||||
|
|
|
|
|
|
|
|||||||
| (1) | Includes index and enhanced index services. |
| (2) | Includes certain multi-asset solutions and services and certain alternative investments. |
215
Table of Contents
Fees
Generally, AB is compensated for its investment services on the basis of investment advisory and services fees calculated as a percentage of AUM. Bernstein Research Services revenue consists principally of commissions received for providing equity research and brokerage-related services to institutional investors. The components of net revenues are as follows:
| Years Ended | ||||||||||||
| December 31, 2017 |
December 31, 2016 |
December 31, 2015 |
||||||||||
| (in millions) | ||||||||||||
| Investment advisory and services fees: |
||||||||||||
| Institutions |
||||||||||||
| Base fees |
$ | 429.6 | $ | 403.5 | $ | 422.0 | ||||||
| Performance-based fees |
45.1 | 17.4 | 12.5 | |||||||||
|
|
|
|
|
|
|
|||||||
| Total |
474.7 | 420.9 | 434.5 | |||||||||
|
|
|
|
|
|
|
|||||||
| Retail |
||||||||||||
| Base fees |
922.5 | 805.6 | 847.2 | |||||||||
| Performance-based fees |
24.2 | 3.3 | 8.8 | |||||||||
|
|
|
|
|
|
|
|||||||
| Total |
946.7 | 808.9 | 856.0 | |||||||||
|
|
|
|
|
|
|
|||||||
| Private Wealth Management |
||||||||||||
| Base fees |
753.6 | 691.6 | 680.9 | |||||||||
| Performance-based fees |
25.4 | 12.1 | 2.4 | |||||||||
|
|
|
|
|
|
|
|||||||
| Total |
779.0 | 703.7 | 683.3 | |||||||||
|
|
|
|
|
|
|
|||||||
| Total |
||||||||||||
| Base fees |
$ | 2,105.7 | $ | 1,900.7 | $ | 1,950.1 | ||||||
| Performance-based fees |
94.7 | 32.8 | 23.7 | |||||||||
|
|
|
|
|
|
|
|||||||
| Total |
2,200.4 | 1,933.5 | 1,973.8 | |||||||||
|
|
|
|
|
|
|
|||||||
| Bernstein Research Services |
449.9 | 479.9 | 493.5 | |||||||||
| Distribution revenues |
412.1 | 384.4 | 427.1 | |||||||||
| Dividend and interest income |
71.2 | 46.9 | 24.9 | |||||||||
| Investment gains (losses) |
92.1 | 93.3 | 3.5 | |||||||||
| Other revenues |
98.0 | 99.9 | 101.2 | |||||||||
|
|
|
|
|
|
|
|||||||
| Total revenues |
$ | 3,323.7 | $ | 3,037.9 | $ | 3,024.0 | ||||||
| Less: Interest expense |
25.2 | 9.1 | 3.3 | |||||||||
|
|
|
|
|
|
|
|||||||
| Net revenues |
$ | 3,298.5 | $ | 3,028.8 | $ | 3,020.7 | ||||||
|
|
|
|
|
|
|
|||||||
Protection Solutions
Our Protection Solutions segment includes our life insurance and employee benefits businesses. We have a long history of providing life insurance products to affluent and high net worth individuals and small and medium-sized business markets. We are currently focused on the relatively less capital intensive asset accumulation segments of the market, with leading offerings in the VUL and IUL markets.
We offer a targeted range of life insurance products aimed at serving the financial needs of our clients throughout their lives. Specifically, our products are designed to help affluent and high net worth individuals as well as small and medium-sized business owners protect and transfer their wealth. Our product offerings include VUL, IUL and term life products, which represented 48%, 41% and 9% of our total life insurance annualized premium, respectively, for the year ended December 31, 2017. Our products are distributed through AXA
216
Table of Contents
Advisors and select third-party firms. We benefit from a long-term, stable distribution relationship with AXA Advisors, with AXA Advisors representing approximately 79% of our total life insurance sales for the year ended December 31, 2017.
As of December 31, 2017, we had approximately 900,000 outstanding life insurance policies with a face value of $446 billion. In 2017, our VUL sales ranked fourth in the total U.S. market and first in the retail channel, and our IUL sales ranked second in the retail channel, according to LIMRA.
In 2015, we entered the employee benefits market focusing on small and medium-sized businesses, a target market for our life insurance business and Group Retirement 401(k) market. We currently offer a suite of employee benefits products, including life, short- and long-term disability, dental and vision insurance products. We believe our employee benefits business will further augment our solutions for small and medium-sized businesses and is differentiated by a high quality technology platform. We sell our employee benefit products through AXA Advisors and third-party distributors, including regional, national and local brokers.
Our Protection Solutions segment provides strong cash flows generated by our in-force book and capital diversification benefits. The primary sources of revenue are premiums, investment income, asset-based fees (investment management and 12b-1 fees), and policy charges (expense loads, surrender charges, mortality charges and other policy charges), as well as fees collected from AXA Advisors non-proprietary sales through AXA Network.
To grow our Protection Solutions segment, we remain focused on the accumulation segment of the market supported by our VUL and IUL products, and are expanding our commitment to the small and medium-sized business market through our employee benefits offerings. We plan to grow our distribution footprint by maintaining our presence through AXA Advisors, and opportunistically growing our relationship with targeted third-party firms. We plan to improve our Non-GAAP Operating ROC by segment and earnings over time through earnings generated from sales of our repositioned product portfolio and by proactively managing and optimizing our in-force book.
Life Insurance
We have been serving the financial needs of our clients and their families since 1859. We have an established reputation in product innovation by pioneering the VUL market in 1976 and continuing today with our range of innovative IUL offerings. As of December 31, 2017, we had approximately 900,000 outstanding policies and $446 billion of life insurance face amount in-force. As of December 31, 2017, Protection Solutions Reserves for our life insurance products accounted for $13 billion in Separate Accounts and $16 billion in the General Account.
Products
Our life insurance products are primarily designed to help individuals and small and medium-sized businesses with protection, wealth accumulation and transfer, as well as corporate planning solutions. We target select segments of the life insurance market: permanent life insurance, including IUL and VUL products and term insurance. As part of a strategic shift over the past several years, we evolved our product design to be less capital-intensive and more accumulation-focused.
Permanent Life Insurance. Our permanent life insurance offerings are built on the premise that all clients expect to receive a benefit from the policy. The benefit may take the form of a life insurance death benefit paid at time of death no matter the age or duration of the policy or the form of access to cash that has accumulated in the policy on a tax-favored basis. In each case, the value to the client comes from access to a broad spectrum of investments that accumulate the policy value at attractive rates of return.
217
Table of Contents
We have three permanent life insurance offerings built upon a UL insurance framework: IUL, VUL and corporate-owned life insurance targeting the small and medium-sized business market, which is a subset of VUL products. Universal life policies offer flexible premiums, and generally offer the policyholder the ability to choose one of two death benefit options: a level benefit equal to the policy’s original face amount or a variable benefit equal to the original face amount plus any existing policy AV. Our universal life insurance products include single-life products and second-to-die (i.e., survivorship) products, which pay death benefits following the death of both insureds.
IUL. IUL uses an equity-linked approach for generating policy investment returns. The equity linked options provide upside return based on an external equity based index (e.g., S&P 500) subject to a cap. In exchange for this cap on investment returns, the policy provides downside protection in that annual investment returns are guaranteed to never be less than zero, even if the relevant index is down. In addition, there is an option to receive a higher cap on certain investment returns in exchange for a fee. As noted above, the performance of any universal life insurance policy also depends on the level of policy charges. For further discussion, see “—Pricing and Fees.”
VUL. VUL uses a series of investment options to generate the investment return allocated to the cash value. The subaccounts are similar to retail mutual funds: a policyholder can invest premiums in one or more underlying investment options offering varying levels of risk and growth potential. These provide long-term growth opportunities, tax-deferred earnings and the ability to make tax-free transfers among the various subaccounts. In addition, the policyholder can invest premiums in a guaranteed interest option, as well as an investment option we call the Market Stabilizer Option (“MSO”), which provides downside protection from losses in the index up to a specified percentage. We also offer corporate-owned life insurance, which is a VUL insurance product tailored specifically to support executive benefits in the small business market.
We work with AXA Equitable FMG to identify and include appropriate underlying investment options in our variable life products, as well as to control the costs of these options. AXA Equitable FMG also offers our product designers access to initial due diligence and contract negotiations for outside variable investment portfolios that may be offered within the product.
Term Life. Term life provides basic life insurance protection for a specified period of time, and is typically a client’s first life insurance purchase due to its relatively low cost. Life insurance benefits are paid if death occurs during the term period, as long as required premiums have been paid. The required premiums are guaranteed not to increase during the term period, otherwise known as a level pay or fixed premium. Our term products include competitive conversion features that allow the policyholder to convert their term life insurance policy to permanent life insurance within policy limits and the ability to add certain riders. Our term life portfolio includes 1, 10, 15 and 20-year term products.
Other Benefits. We offer a portfolio of riders to provide clients with additional flexibility to protect the value of their investments and overcome challenges. Our Long Term Care Services Rider provides an acceleration of the policy death benefit in the event of a chronic illness, and has been elected on 38% of all eligible policies and issued on 33% of new policies sold for the year ended December 31, 2017. The MSO, referred to above and offered via a policy rider on our variable life products, provides policyholders with the opportunity to manage volatility. The return of premium rider provides a guarantee that the death benefit payable will be no less than the amount invested in the policy.
218
Table of Contents
The following table presents individual life insurance annualized premiums for the periods indicated:
| Years Ended December 31, | ||||||||||||
| 2017 | 2016 | 2015 | ||||||||||
| (in millions) | ||||||||||||
| Annualized Premium |
||||||||||||
| Indexed Universal Life |
$ | 82 | $ | 90 | $ | 105 | ||||||
| Variable Universal Life |
94 | 86 | 94 | |||||||||
| Term |
19 | 20 | 23 | |||||||||
| Other(1) |
3 | 4 | 5 | |||||||||
|
|
|
|
|
|
|
|||||||
| Total |
$ | 198 | $ | 200 | $ | 227 | ||||||
|
|
|
|
|
|
|
|||||||
The following table presents individual life insurance FYP and renewals by product and total gross premiums as of the dates indicated:
| Years Ended December 31, | ||||||||||||
| 2017 | 2016 | 2015 | ||||||||||
| (in millions) | ||||||||||||
| FYP by Product Line |
||||||||||||
| Universal Life |
$ | 4 | $ | 5 | $ | 7 | ||||||
| Indexed Universal Life |
219 | 267 | 306 | |||||||||
| Variable Universal Life |
163 | 148 | 155 | |||||||||
| Term |
19 | 20 | 23 | |||||||||
| Other(1) |
1 | 1 | 1 | |||||||||
|
|
|
|
|
|
|
|||||||
| Total |
$ | 406 | $ | 441 | $ | 492 | ||||||
|
|
|
|
|
|
|
|||||||
| Renewals by Product Line |
||||||||||||
| Universal Life |
$ | 913 | $ | 905 | $ | 840 | ||||||
| Indexed Universal Life |
189 | 145 | 111 | |||||||||
| Variable Universal Life |
959 | 914 | 914 | |||||||||
| Term |
504 | 549 | 558 | |||||||||
| Other(1) |
27 | 39 | 41 | |||||||||
|
|
|
|
|
|
|
|||||||
| Total |
$ | 2,592 | $ | 2,552 | $ | 2,464 | ||||||
|
|
|
|
|
|
|
|||||||
| Total Gross Premiums |
$ | 2,998 | $ | 2,993 | $ | 2,956 | ||||||
|
|
|
|
|
|
|
|||||||
| (1) | For the individual life insurance in-force, other includes current assumption universal life insurance, whole life insurance and other products available for sale but not actively marketed. |
Our in-force book spans four insurance companies, AXA Equitable Life, MLOA, USFL and AXA Equitable L&A. USFL and AXA Equitable L&A are closed for new business. Certain term products and permanent products riders from MLOA, USFL and AXA Equitable Life have been reinsured to our captive reinsurer EQ AZ Life Re and, prior to the GMxB Unwind, AXA RE Arizona. Our in-force portfolio is made up of core product offerings as described above, as well as past generation product offerings that include current assumption universal life insurance, whole life insurance and other products.
219
Table of Contents
The following table presents our in-force face amount, policy counts and AV as of the dates indicated, respectively, for the individual life insurance products we offer:
| As of | ||||||||||||
| December 31, 2017 |
December 31, 2016 |
December 31, 2015 |
||||||||||
| (in billions) | ||||||||||||
| In-force Face Amount by Product(1) |
||||||||||||
| Universal Life(2) |
$ | 59.0 | $ | 61.7 | $ | 64.0 | ||||||
| Indexed Universal Life |
20.5 | 18.5 | 16.7 | |||||||||
| Variable Universal Life(3) |
128.9 | 130.3 | 132.7 | |||||||||
| Term |
235.9 | 237.0 | 238.9 | |||||||||
| Whole Life |
1.6 | 1.7 | 1.8 | |||||||||
|
|
|
|
|
|
|
|||||||
| Total |
$ | 445.9 | $ | 449.2 | $ | 454.0 | ||||||
|
|
|
|
|
|
|
|||||||
| As of | ||||||||||||
| December 31, 2017 |
December 31, 2016 |
December 31, 2015 |
||||||||||
| (in thousands) | ||||||||||||
| In-force Policy Count by Product(1) |
||||||||||||
| Universal Life(2) |
188 | 199 | 210 | |||||||||
| Indexed Universal Life |
45 | 38 | 31 | |||||||||
| Variable Universal Life(3) |
316 | 326 | 338 | |||||||||
| Term |
340 | 346 | 354 | |||||||||
| Whole Life |
20 | 21 | 22 | |||||||||
|
|
|
|
|
|
|
|||||||
| Total |
909 | 930 | 955 | |||||||||
|
|
|
|
|
|
|
|||||||
| As of | ||||||||||||
| December 31, 2017 |
December 31, 2016 |
December 31, 2015 |
||||||||||
| (in millions) | ||||||||||||
| Protection Solutions Reserves(4) |
||||||||||||
| General Account |
$ | 16,007 | $ | 16,420 | $ | 16,014 | ||||||
| Separate Account |
12,643 | 11,251 | 10,907 | |||||||||
|
|
|
|
|
|
|
|||||||
| Total |
$ | 28,650 | $ | 27,671 | $ | 26,921 | ||||||
|
|
|
|
|
|
|
|||||||
| (1) | Does not include life insurance sold as part of our employee benefits business as it is a start-up business with a limited amount of in-force policies. |
| (2) | Universal life includes guaranteed universal life insurance products. |
| (3) | Variable universal life includes variable life insurance and corporate-owned life insurance. |
| (4) | Does not include Protection Solutions Reserves for our employee benefits business as it is a start-up business and therefore has immaterial in-force policies. |
220
Table of Contents
In order to optimize our capital efficiency and improve the profitability of new business, in 2009, we made a strategic decision to exit the guaranteed universal life (“GUL”) insurance and 30-year term life insurance markets. Over the past decade, we have refocused our offering to less capital intensive segments of the market. The following chart shows this shift in our product sales (annualized premiums) from 2008 to 2017:
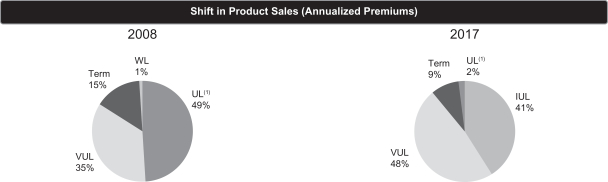
| (1) | Universal life includes GUL insurance products. |
As part of our in-force management function, we monitor the performance of our life insurance portfolio against our expectations at the time of pricing of the products. It is our objective to align the performance of our portfolio to pricing expectations and take in-force actions where appropriate, in accordance with our contracts, applicable law and our governance processes. For example, in 2016, we increased the cost of insurance rates on certain universal life policies sold between 2004 and 2007 which have both issue ages of 70 and above and a current face value amount of $1 million and above. We have also increased administrative fees and have lowered interest crediting rates and persistency bonus for certain classes of our portfolio.
Markets
We are focused on targeted segments of the market, particularly affluent and high net worth individuals, as well as small and medium-sized businesses. We focus on creating value for our customers through the differentiated features and benefits we offer on our products. We distribute these products through retail advisors and third-party firms who demonstrate the value of life insurance in helping clients to accumulate wealth and protect their assets.
Distribution
We primarily distribute life insurance through two channels: AXA Advisors and third-party firms. AXA Advisors has been a long-term, stable distribution partner for our life insurance business, ranking first in VUL sales in the retail channel and second in IUL sales in the retail channel for 2017, according to LIMRA.
To supplement our sales through AXA Advisors, distribution through third-party firms provides efficient access to independent producers on a largely variable cost basis. Brokerage general agencies, producer groups, banks, wirehouses, independent broker-dealers and registered investment advisers are all important partners who distribute our products today. We also have a competitive strength serving specialty markets including professional athletes, entertainers and foreign national residents.
221
Table of Contents
The following table presents individual life insurance annualized premium by distribution channel for the periods indicated:
| Years Ended | ||||||||||||
| December 31, 2017 |
December 31, 2016 |
December 31, 2015 |
||||||||||
| (in millions) | ||||||||||||
| Annualized Premium by Distribution |
||||||||||||
| AXA Advisors |
$ | 157 | $ | 160 | $ | 166 | ||||||
| Third-Party Firms |
41 | 40 | 61 | |||||||||
|
|
|
|
|
|
|
|||||||
| Total |
$ | 198 | $ | 200 | $ | 227 | ||||||
|
|
|
|
|
|
|
|||||||
Competition
The life insurance industry consists of many companies with no single company dominating the market for all products. We selectively compete with large, well-established life insurance companies in a mature market, where product features, price and service are key drivers. We primarily compete with others based on these drivers as well as distribution channel relationships, brand recognition, financial strength ratings of our insurance subsidiaries and financial stability. We are selective in our markets of interest and will continue to focus deeply in those areas that align to our offering.
Underwriting
Our underwriting process, built around extensive underwriting guidelines, is designed to assign prospective insureds to risk classes in a manner that is consistent with our business and financial objectives, including our risk appetite and pricing expectations.
As part of making an underwriting decision, our underwriters evaluate information disclosed as part of the application process as well as information obtained from other sources after the application. This information includes, but is not limited to, the insured’s age and sex, results from medical exams and financial information.
We continue to research and develop guideline changes to increase the efficiency of our underwriting process (e.g., through the use of predictive models), both from an internal cost perspective and our customer experience perspective.
We manage changes to our underwriting guidelines though a robust governance process that ensures that our underwriting decisions continue to align with our business and financial objectives, including risk appetite and pricing expectations.
With an average of more than 15 years of industry underwriting experience, our team of more than 100 underwriters and four medical directors is dedicated to making accurate, timely and competitive underwriting decisions. Our line underwriters are empowered to make decisions and receive support of underwriting managers and medical directors when needed.
Our financial due diligence team, with more than 50 years of combined insurance experience, combines legal, financial and investigative expertise to support the financial underwriting of complex cases, assist in case design and plays an important in fraud prevention.
We continuously monitor our underwriting decisions through internal audits and other quality control processes, to ensure accurate and consistent application of our underwriting guidelines.
222
Table of Contents
We use reinsurance to manage our mortality risk and volatility. Our reinsurer partners regularly review our underwriting practices and mortality and lapse experience through audits and experience studies, the outcome of which have consistently validated the high-quality underwriting process and decisions.
Pricing and Fees
Life insurance products are priced based upon assumptions including, but not limited to, expected future premium payments, surrender rates, mortality and morbidity rates, investment returns, hedging costs, equity returns, expenses and inflation and capital requirements. The primary source of revenue from our life insurance business is premiums, investment income, asset-based fees (including investment management and 12b-1 fees) and policy charges (expense loads, surrender charges, mortality charges and other policy charges).
Risk Management
Reinsurance
We use reinsurance to mitigate a portion of our risk and optimize the capital efficiency and operating returns of our life insurance portfolio. As part of our risk management function, we continuously monitor the financial condition of our reinsurers in an effort to minimize our exposure to significant losses from reinsurer insolvencies.
Non-affiliate Reinsurance. We generally obtain reinsurance for the portion of a life insurance policy that exceeds $10 million. We have set up reinsurance pools with highly rated unaffiliated reinsurers that obligate the pool participants to pay death claim amounts in excess of our retention limits for an agreed-upon premium.
Captive Reinsurance. Prior to April 2018, AXA RE Arizona reinsured a 90% quota share of level premium term insurance issued by AXA Equitable Life on or after March 1, 2003 through December 31, 2008, 100% quota share of level term insurance issued by USFL on or after December 31, 2004, 90% of the risk of the lapse protection riders under UL insurance policies issued by AXA Equitable Life on or after June 1, 2003 through June 30, 2007 and those issued by MLOA on or after June 1, 2003 through June 30, 2007 on a 90% quota share basis (collectively, the “Life Business”).
In April 2018, AXA RE Arizona novated the Life Business from AXA RE Arizona to a newly formed captive reinsurance company as part of the GMxB Unwind. For additional information on the GMxB Unwind, see “The Reorganization Transactions—Unwind of GMxB Reinsurance.”
Hedging
We hedge the exposure contained in our IUL products and the MSO rider we offer on our VUL products. These products and riders allow the policyholder to participate in the performance of an index price movement up to certain caps and/or protect the policyholder in a movement down to a certain buffer for a set period of time. In order to support our obligations under these investment options, we enter into derivatives contracts whose payouts, in combination with returns from the underlying fixed income investments, seek to replicate those of the index price, subject to prescribed caps and buffers.
Employee Benefits
Our employee benefits business focuses on serving small and medium-sized businesses, a priority segment for us, offering these businesses a differentiated technology platform and competitive suite of group insurance products. Though we only entered the market in 2015, we now offer coverage nationally and have more than 157,000 participants as of December 31, 2017. Leveraging our innovative technology platform, we have formed strategic partnerships with large insurance and health carriers as their primary group benefits provider. As a new entrant in the employee benefits market we were able to build a platform from the ground up, without reliance on legacy systems. This puts us in a position to embrace industry shifts quickly and provides us with an advantage over many competitors.
223
Table of Contents
Products
Our products are designed to provide valuable protection for employees as well as help employers attract employees and control costs. We currently offer a suite of life, short- and long-term disability, dental and vision insurance products.
For the year ended December 31, 2017, employee benefits gross premiums amounted to $26 million, mainly driven by group life insurance sales ($14 million), short- and long-term disability ($9 million) and dental ($3 million). For the year ended December 31, 2017, annualized premiums amounted to $24 million.
Markets
Our employee benefit product suite is targeted to small and medium-sized businesses seeking simple, technology-driven employee benefits management. We built the employee benefits business from the ground up based on feedback from brokers and employers, ensuring the business’ relevance to the market we address. We are committed to continuously evolving our product suite and technology platform to meet market demand.
Distribution
We distribute our employee benefits products through AXA Advisors and through a growing network of third-party firms, including private exchanges, health plans and professional employer organizations.
Competition
The employee benefits marketplace is a fast-moving, competitive environment. The main factors of competition include price, quality of customer service and claims management, technological capabilities, quality of distribution and financial strength ratings. In this market, we compete with several companies offering similar products. In addition, there is competition in attracting brokers to actively market our products. Key competitive factors in attracting brokers include product offerings and features, financial strength, support services and compensation.
Underwriting
We manage the underwriting process to facilitate quality sales and serve the needs of our customers, while supporting our financial strength and business objectives. The application of our underwriting guidelines is continuously monitored through internal underwriting audits to achieve high standards of underwriting and consistency.
Pricing and Fees
Employee benefits pricing reflects the claims experience and the risk characteristics of each group. We set appropriate plans for the group based on demographic information and, for larger groups, also evaluate the experience of the group. The claims experience is reviewed at time of policy issuance and during the renewal timeframes, resulting in periodic pricing adjustments at the group level.
Reinsurance
Group Reinsurance Plus provides reinsurance on our short and long-term disability products. Our current arrangement provides quota share reinsurance at 50% for disability products.
Corporate and Other
Corporate and Other includes certain of our financing and investment expenses. It also includes: the AXA Advisors broker-dealer business, Closed Block, run-off variable annuity reinsurance business, run-off group
224
Table of Contents
pension business, run-off health business, benefit plans for our employees and certain unallocated items, including capital and related investments, interest expense and corporate expense. AB’s results of operations are reflected in the Investment Management and Research segment. Accordingly, Corporate and Other does not include any items applicable to AB.
AXA Advisors Broker-Dealer Business
AXA Advisors provides financial planning and advice, insurance and savings solutions, as well as full-service brokerage services through our financial advisors who have access to a broad selection of both affiliated and non-affiliated products to help clients meet their financial needs. While the revenue from retirement and protection products sold through AXA Advisors is recognized within the Individual Retirement, Group Retirement and Protection Solutions segments, Corporate and Other includes revenue from the AUA of the AXA Advisors broker-dealer business. As of December 31, 2017 and December 31, 2016, the AXA Advisors broker-dealer business included $44.4 billion and $36.7 billion, respectively, in AUA.
Closed Block
In connection with the demutualization of AXA Equitable Life in 1992, the Closed Block was established for the benefit of certain classes of individual participating policies for which AXA Equitable Life had a dividend scale payable in 1991 and which were in force on that date. Assets were allocated to the Closed Block in an amount which, together with anticipated revenues from policies included in the Closed Block, was reasonably expected to be sufficient to support such business, including provisions for the payment of claims, certain expenses and taxes, and for the continuation of dividend scales payable in 1991, assuming the experience underlying such scales continues.
Assets allocated to the Closed Block inure solely to the benefit of the holders of policies included in the Closed Block and will not revert to the benefit of the Company. The plan of demutualization prohibits the reallocation, transfer, borrowing or lending of assets between the Closed Block and other portions of the General Account, any of our Separate Accounts or to any affiliate of ours without the approval of the NYDFS. Closed Block assets and liabilities are carried on the same basis as similar assets and liabilities held in the General Account. The excess of Closed Block liabilities over Closed Block assets represents the expected future post-tax contribution from the Closed Block which would be recognized in income over the period the policies and contracts in the Closed Block remain in force.
For additional information on the Closed Block, see note 5 of the notes to our annual financial statements included elsewhere in this prospectus.
ACS Life
ACS Life is a reinsurer that has been in run-off since 2002. It predominantly wrote reinsurance treaties on variable annuity GMxB riders for third parties, as well as a limited amount of ordinary life, structured settlements and long-term disability. All open treaties were closed to new business by December 31, 2004. Depending on the benefit reinsured, these treaties generally contain limitations on the individual and aggregate annual claims. In addition, GMIB claims are cash settled and the settlement formulas are all subject to minimum interest rates. These features, together with a dynamic hedging program, serve to protect the capital allocated to the business, particularly in adverse market scenarios.
225
Table of Contents
A summary of ACS Life’s exposures to GMxB features is provided in the table below.
| As of | ||||||||
| ACS Life In-Force VA | December 31, 2017 |
December 31, 2016 |
||||||
| GMDB |
||||||||
| Policy Count (in thousands) |
215 | 239 | ||||||
| Reinsured Account Value (in billions) |
$ | 9.5 | $ | 9.4 | ||||
| Net amount at risk (in millions) |
$ | 637 | $ | 912 | ||||
| U.S. GAAP Reserves (in millions) |
$ | 95 | $ | 121 | ||||
| GMIB |
||||||||
| Policy Count (in thousands) |
52 | 57 | ||||||
| Reinsured Account Value (in billions) |
$ | 2.8 | $ | 2.7 | ||||
| Net amount at risk (in millions) |
$ | 281 | $ | 357 | ||||
| U.S. GAAP Reserves (in millions) |
$ | 194 | $ | 258 | ||||
To achieve better alignment between statutory capital requirements and economic hedging program objectives, ACS Life retrocedes a 100% quota share of its GMDB and GMIB liabilities to its captive subsidiary CS Life RE. ACS Life is entitled to a credit in its calculation of statutory reserves for amounts reinsured to CS Life RE, to the extent CS Life RE holds assets in an irrevocable trust, letters of credit or other financing acceptable to the Delaware Department of Insurance. CS Life RE meets this requirement in part through letters of credit and after this offering we expect that CS Life RE will continue to have access to letters of credit through the revolving credit facility described in “Recapitalization.”
CS Life RE employs a dynamic hedging program in order to mitigate the economic risks associated with its GMDB and GMIB reinsurance contracts. CS Life RE seeks to hedge its economic exposure to both equity markets and interest rates through the use of exchange traded equity index futures and U.S. Treasury futures as well by holding long-term bonds.
AXA Equitable FMG
AXA Equitable FMG oversees our variable funds and supports each of our retirement and protection businesses. Accordingly, AXA Equitable FMG’s results are embedded in the Individual Retirement, Group Retirement and protection solutions segments. AXA Equitable FMG helps add value and marketing appeal to our retirement and protection solutions products by bringing investment management expertise and specialized strategies to the underlying investment lineup of each product. In addition, by advising an attractive array of proprietary investment portfolios (each, a “Portfolio,” and together, the “Portfolios”), AXA Equitable FMG brings investment acumen, financial controls and economies of scale to the construction of high-quality, economical underlying investment options for our products. Finally, AXA Equitable FMG is able to negotiate favorable terms for investment services, operations, trading and administrative function for the Portfolios.
AXA Equitable FMG provides investment management and administrative services to proprietary investment vehicles sponsored by the Company, including investment companies that are underlying investment options for our variable insurance and annuity products. AXA Equitable FMG is registered as an investment adviser under the Investment Advisers Act. AXA Equitable FMG serves as the investment adviser to three investment companies that are registered under the Investment Company Act of 1940, as amended—EQAT, AXA Premier VIP Trust and 1290 Funds (each, a “Trust” and collectively, the “Trusts”)—and to two private investment trusts established in the Cayman Islands. Each of the investment companies and private investment trusts is a “series” type of trust with multiple Portfolios. AXA Equitable FMG provides discretionary investment management services to the Portfolios, including, among other things, (1) portfolio management services for the Portfolios; (2) selecting investment sub-advisers and (3) developing and executing asset allocation strategies for multi-advised Portfolios and Portfolios structured as funds-of-funds. AXA Equitable FMG also provides
226
Table of Contents
administrative services to the Portfolios. AXA Equitable FMG is further charged with ensuring that the other parts of the Company that interact with the Trusts, such as product management, the distribution system and the financial organization, have a specific point of contact.
AXA Equitable FMG has a variety of responsibilities for the general management and administration of its investment company clients. One of AXA Equitable FMG’s primary responsibilities is to provide clients with portfolio management and investment advisory evaluation services, principally by reviewing whether to appoint, dismiss or replace sub-advisers to each Portfolio, and thereafter monitoring and reviewing each sub-adviser’s performance through qualitative and quantitative analysis, as well as periodic in-person, telephonic and written consultations with the sub-advisers. Currently, AXA Equitable FMG has entered into sub-advisory agreements with more than 40 different sub-advisers, including AB and other AXA affiliates. Another primary responsibility of AXA Equitable FMG is to develop and monitor the investment program of each Portfolio, including Portfolio investment objectives, policies and asset allocations for the Portfolios, select investments for Portfolios (or portions thereof) for which it provides direct investment selection services, and ensure that investments and asset allocations are consistent with the guidelines that have been approved by clients. The administrative services that AXA Equitable FMG provides to the Portfolios include, among others, coordination of each Portfolio’s audit, financial statements and tax returns; expense management and budgeting; legal administrative services and compliance monitoring; portfolio accounting services, including daily net asset value accounting; risk management; and oversight of proxy voting procedures and anti-money laundering program.
Regulation
Insurance Regulation
Our insurance subsidiaries are licensed to transact insurance business, and are subject to extensive regulation and supervision by insurance regulators, in all 50 states of the United States, the District of Columbia, Puerto Rico, the U.S. Virgin Islands and nine of Canada’s thirteen provinces and territories. The primary regulator of an insurance company, however, is located in its state of domicile. AXA Equitable Life is domiciled in New York and is primarily regulated by the NYDFS. ACS Life is domiciled in Delaware and is primarily regulated by the Commissioner of the Delaware Department of Insurance. MLOA, EQ AZ Life Re and CS Life RE are domiciled in Arizona and are primarily regulated by the Director of Insurance of the Arizona Department of Insurance. AXA Equitable L&A is domiciled in Colorado and is primarily regulated by the Commissioner of Insurance of the Colorado Division of Insurance. USFL is domiciled in Ohio and is primarily regulated by the Director of Insurance of the Ohio Department of Insurance. The extent of regulation by jurisdiction varies, but most jurisdictions have laws and regulations governing the financial aspects and business conduct of insurers. State laws in the United States grant insurance regulatory authorities broad administrative powers with respect to, among other things, licensing companies to transact business, sales practices, establishing statutory capital and reserve requirements and solvency standards, reinsurance and hedging, protecting privacy, regulating advertising, restricting the payment of dividends and other transactions between affiliates, permitted types and concentrations of investments and business conduct to be maintained by insurance companies as well as agent licensing, approval of policy forms and, for certain lines of insurance, approval or filing of rates. Insurance regulators have the discretionary authority to limit or prohibit new issuances of business to policyholders within their jurisdictions when, in their judgment, such regulators determine that the issuing company is not maintaining adequate statutory surplus or capital. Additionally, New York Insurance Law limits sales commissions and certain other marketing expenses that we may incur. For additional information on Insurance Supervision, see “Risk Factors.”
Supervisory agencies in each of the jurisdictions in which we do business may conduct regular or targeted examinations of our operations and accounts, and make requests for particular information from us. Periodic financial examinations of the books, records, accounts and business practices of insurers domiciled in their states are generally conducted by such supervisory agencies every three to five years. From time to time, regulators raise issues during examinations or audits of us that could, if determined adversely, have a material adverse
227
Table of Contents
effect on us. In addition, the interpretations of regulations by regulators may change and statutes may be enacted with retroactive impact, particularly in areas such as accounting or statutory reserve requirements. In addition to oversight by state insurance regulators in recent years, the insurance industry has seen an increase in inquiries from state attorneys general and other state officials regarding compliance with certain state insurance, securities and other applicable laws. We have received and responded to such inquiries from time to time. For additional information on legal and regulatory risk, see “Risk Factors—Legal and Regulatory Risks.”
Each of our insurance subsidiaries are required to file detailed annual financial statements, prepared on a statutory accounting basis or in accordance with other accounting practices permitted by the applicable regulator, with supervisory agencies in each of the jurisdictions in which we do business. The NAIC has approved a series of uniform statutory accounting principles (“SAP”) that have been adopted, in some cases with minor modifications, by all state insurance regulators. As a basis of accounting, SAP was developed to monitor and regulate the solvency of insurance companies. In developing SAP, the insurance regulators were primarily concerned with assuring an insurer’s ability to pay all its current and future obligations to policyholders. As a result, statutory accounting focuses on conservatively valuing the assets and liabilities of insurers, generally in accordance with standards specified by the insurer’s domiciliary state. The values for assets, liabilities and equity reflected in financial statements prepared in accordance with U.S. GAAP are usually different from those reflected in financial statements prepared under SAP. See note 17 to the notes to our annual financial statements included elsewhere in this prospectus.
Holding Company and Shareholder Dividend Regulation. Most states, including Arizona, Colorado, Delaware, New York and Ohio, regulate transactions between an insurer and its affiliates under insurance holding company acts. The insurance holding company laws and regulations vary from jurisdiction to jurisdiction, but generally require that all transactions affecting insurers within a holding company system be fair and reasonable and, if material, typically require prior notice and approval or non-disapproval by the state’s insurance regulator.
The insurance holding company laws and regulations generally also require a controlled insurance company (insurers that are subsidiaries of insurance holding companies) to register with state regulatory authorities and to file with those authorities certain reports, including information concerning its capital structure, ownership, financial condition, certain intercompany transactions and general business operations. States generally require the ultimate controlling person of a U.S. insurer to file an annual enterprise risk report with the lead state of the insurance holding company system identifying risks likely to have a material adverse effect upon the financial condition or liquidity of the insurer or its insurance holding company system as a whole.
State insurance statutes also typically place restrictions and limitations on the amount of dividends or other distributions payable by insurance company subsidiaries to their parent companies, as well as on transactions between an insurer and its affiliates. Under New York insurance law applicable to AXA Equitable Life, a domestic stock life insurer may not, without prior approval of the NYDFS, pay a dividend to its stockholders exceeding an amount calculated under either the Earned Surplus Standard or the Alternative Standard. Dividends exceeding these prescribed limits require the insurer to file a notice of its intent to declare the dividends with the NYDFS and prior approval or non-disapproval from the NYDFS.
In the second quarter of 2017, AXA Equitable Life agreed with the NYDFS that until the DFS Conditions are met, it will pay ordinary dividends only under the Earned Surplus Standard.
We have confirmed that the completion of the GMxB Unwind, which occurred on April 12, 2018, satisfied the DFS Conditions, and that, going forward, satisfaction of either the Earned Surplus Standard or Alternative Standard will determine AXA Equitable Life’s ability to pay ordinary dividends.
Other states have limitations on dividends similar to New York’s, providing that dividends in excess of prescribed limits, based on prior year’s earnings and surplus of the insurance company, established by applicable
228
Table of Contents
state regulation, are considered to be extraordinary dividends and require explicit approval from the applicable state regulator. As a holding company, we depend on dividends from our subsidiaries to meet our obligations. For additional information on shareholder dividends, see “Management’s Discussion and Analysis of Financial Condition and Results of Operations—Liquidity and Capital Resources.”
State insurance holding company regulations also regulate changes in control. State laws generally provide that no person, corporation or other entity may acquire control of an insurance company, or a controlling interest in any parent company of an insurance company, without the prior approval of such insurance company’s domiciliary state insurance regulator. Generally, any person acquiring, directly or indirectly, 10% or more of the voting securities of an insurance company is presumed to have acquired “control” of the company. This statutory presumption may be rebutted by a showing that control does not exist in fact. State insurance regulators, however, may find that “control” exists in circumstances in which a person owns or controls less than 10% of voting securities.
The laws and regulations regarding acquisition of control transactions may discourage potential acquisition proposals and may delay or prevent a change of control involving us, including through unsolicited transactions that some of our shareholders might consider desirable.
NAIC. The mandate of the NAIC is to benefit state insurance regulatory authorities and consumers by promulgating model insurance laws and regulations for adoption by the states. The NAIC provides standardized insurance industry accounting and reporting guidance through its Accounting Practices and Procedures Manual (the “Manual”). However, statutory accounting principles have been, or may be, modified by individual state laws, regulations and permitted practices. Changes to the Manual or modifications by the various state insurance departments may impact the statutory capital and surplus of our U.S. insurance companies.
In September 2012, the NAIC adopted the Risk Management and Own Risk and Solvency Assessment Model Act (“ORSA”), which has been enacted by New York and our other domiciliary states. ORSA requires that insurers maintain a risk management framework and conduct an internal risk and solvency assessment of the insurer’s material risks in normal and stressed environments. The assessment is documented in a confidential annual summary report, a copy of which must be made available to regulators as required or upon request.
In December 2012, the NAIC approved a new valuation manual containing a principles-based approach to life insurance company reserves. Principles-based reserving is designed to better address reserving for products, including the current generation of products for which the current formulaic basis for reserve determination does not work effectively. The principles-based reserving approach became effective for new business on January 1, 2017 in the states where it has been adopted with a three-year phase-in period. The NYDFS has publicly stated its intention to implement the principles-based reserving approach beginning in January 2018, subject to a working group of the NYDFS establishing the necessary reserves safeguards, although the New York State Legislature has yet to adopt enabling legislation.
Captive Reinsurer Regulation. As described above, we use captive reinsurers as part of our capital management strategy. During the last few years, the NAIC and certain state regulators, including the NYDFS, have been scrutinizing insurance companies’ use of affiliated captive reinsurers or offshore entities.
In 2014, the NAIC considered a proposal to require states to apply NAIC accreditation standards, applicable to traditional insurers, to captive reinsurers. In 2015, the NAIC adopted such a proposal, in the form of a revised preamble to the NAIC accreditation standards (the “Standard”), with an effective date of January 1, 2016 for application of the Standard to captives that assume level premium term life insurance (“XXX”) business and universal life with secondary guarantees (“AXXX”) business. During 2014, the NAIC approved a new regulatory framework, the XXX/AXXX Reinsurance Framework, applicable to XXX/AXXX transactions. The framework requires more disclosure of an insurer’s use of captives in its statutory financial statements, and narrows the types of assets permitted to back statutory reserves that are required to support the insurer’s future obligations. The
229
Table of Contents
NAIC implemented the framework through an actuarial guideline (“AG 48”), which requires the actuary of the ceding insurer that opines on the insurer’s reserves to issue a qualified opinion if the framework is not followed. AG 48 applies prospectively, so that XXX/AXXX captives will not be subject to AG 48 if reinsured policies were issued prior to January 1, 2015 and ceded so that they were part of a reinsurance arrangement as of December 31, 2014, as is the case for the XXX business and AXXX business reinsured by our current and future Arizona captives. Regulation of XXX/AXXX captives is deemed to satisfy the Standard if the applicable reinsurance transaction satisfies the XXX/AXXX Reinsurance Framework requirements adopted by the NAIC. The NAIC also adopted a revised Credit for Reinsurance Model Law in January 2016 and the Term and Universal Life Insurance Reserving Financing Model Regulation in December 2016 to replace AG 48. The model regulation will generally replace AG 48 in a state upon the state’s adoption of the model regulation. The NAIC left for future action the application of the Standard to captives that assume variable annuity business.
During 2015, the E Committee established the VAIWG to oversee the NAIC’s efforts to study and address, as appropriate, regulatory issues resulting in variable annuity captive reinsurance transactions. In November 2015, upon the recommendation of the VAIWG, the E Committee adopted the VA Framework for Change which recommends charges for NAIC working groups to adjust the variable annuity statutory framework applicable to all insurers that have written or are writing variable annuity business. The VA Framework for Change contemplates a holistic set of reforms that would improve the current reserve and capital framework and address root cause issues that result in the use of captive arrangements but would not necessarily mandate recapture by insurers of VA cessions to captives. In November 2015, VAIWG engaged OW to conduct a QIS involving industry participants including the Company, of various reforms outlined in the VA Framework for Change. OW completed the QIS in July of 2016 and reported its initial findings to the VAIWG in late August 2016. The OW report proposed certain revisions to the current VA reserve and capital framework, which focused on (i) mitigating the asset-liability accounting mismatch between hedge instruments and statutory instruments and statutory liabilities, (ii) removing the non-economic volatility in statutory capital charges and the resulting solvency ratios and (iii) facilitating greater harmonization across insurers and products for greater compatibility, and recommended a second quantitative impact study be conducted so that testing can inform the proper calibration for certain conceptual and/or preliminary parameters set out in the OW proposal. Following a fourth quarter 2016 public comment period and several meetings on the OW proposal, the VAIWG determined that a QIS2 involving industry participants, including us, will be conducted by OW. The QIS2 began in February 2017 and OW issued its recommendations in December 2017. The NAIC continues to deliberate on QIS2 results. The NAIC has indicated that it expects to complete its work by the 2018 Fall NAIC Meeting. Timing for implementation of changes to the current VA reserve and capital framework remains uncertain.
We cannot predict what revisions, if any, will be made to the model laws and regulations relating to XXX/AXXX transactions, or to the Standard, if adopted for variable annuity captives, as states consider their adoption or undertake their implementation, or to the VA Framework for Change proposal as a result of QIS2 and ongoing NAIC deliberations. It is also unclear whether these or other proposals will be adopted by the NAIC, or what additional actions and regulatory changes will result from the continued captives scrutiny and reform efforts by the NAIC and other regulatory bodies. Any regulatory action that limits our ability to achieve desired benefits from the use of or materially increases our cost of using captive reinsurance and applies retroactively, including, if the Standard is adopted as proposed, without grandfathering provisions for existing captive variable annuity reinsurance entities, could have a material adverse effect on our financial condition or results of operations. For additional information on our use of a captive reinsurance company, see “Risk Factors.”
Surplus and Capital; Risk Based Capital. Insurers are required to maintain their capital and surplus at or above minimum levels. Regulators have discretionary authority, in connection with the continued licensing of insurance companies, to limit or prohibit an insurer’s sales to policyholders if, in their judgment, the regulators determine that such insurer has not maintained the minimum surplus or capital or that the further transaction of business will be hazardous to policyholders. We report our RBC based on a formula calculated by applying factors to various asset, premium and statutory reserve items, as well as taking into account the risk characteristics of the insurer. The major categories of risk involved are asset risk, insurance risk, interest rate
230
Table of Contents
risk, market risk and business risk. The formula is used as a regulatory tool to identify possible inadequately capitalized insurers for purposes of initiating regulatory action, and not as a means to rank insurers generally. State insurance laws provide insurance regulators the authority to require various actions by, or take various actions against, insurers whose RBC ratio does not meet or exceed certain RBC levels. As of the date of the most recent annual statutory financial statements filed with insurance regulators, the RBC of each of our insurance subsidiaries was in excess of each of those RBC levels.
Guaranty Associations and Similar Arrangements. Each of the states in which we are admitted to transact business require life insurers doing business within the jurisdiction to participate in guaranty associations, which are organized to pay certain contractual insurance benefits owed pursuant to insurance policies issued by impaired, insolvent or failed insurers. The laws are designed to protect policyholders from losses under insurance policies issued by insurance companies that become impaired or insolvent. These associations levy assessments, up to prescribed limits, on all member insurers in a particular state on the basis of the proportionate share of the premiums written by member insurers in the lines of business in which the impaired, insolvent or failed insurer is engaged. Some states permit member insurers to recover assessments paid through full or partial premium tax offsets.
During each of the past five years, the assessments levied against us have not been material.
Broker-Dealer and Securities Regulation
We and certain policies and contracts offered by us are subject to regulation under the Federal securities laws administered by the SEC, self-regulatory organizations and under certain state securities laws. These regulators may conduct examinations of our operations, and from time to time make requests for particular information from us.
Certain of our subsidiaries, including AXA Advisors, AXA Distributors, AllianceBernstein Investments, Inc. and Sanford C. Bernstein & Co., LLC (“SCB LLC”), are registered as broker-dealers (collectively, the “Broker-Dealers”) under the Exchange Act. The Broker-Dealers are subject to extensive regulation by the SEC and are members of, and subject to regulation by, FINRA, a self-regulatory organization subject to SEC oversight. The Broker-Dealers are subject to the capital requirements of the SEC and/or FINRA, which specify minimum levels of capital (“net capital”) that the Broker-Dealers are required to maintain and also limit the amount of leverage that the Broker-Dealers are able to employ in their businesses. The SEC and FINRA also regulate the sales practices of the Broker-Dealers. In recent years, the SEC and FINRA have intensified their scrutiny of sales practices relating to variable annuities, variable life insurance and alternative investments, among other products. In addition, the Broker-Dealers are also subject to regulation by state securities administrators in those states in which they conduct business, who may also conduct examinations and direct inquiries to the Broker-Dealers.
Certain of our Separate Accounts are registered as investment companies under the Investment Company Act. Separate Account interests under certain annuity contracts and insurance policies issued by us are also registered under the Securities Act. EQAT, AXA Premier VIP Trust and 1290 Funds are registered as investment companies under the Investment Company Act and shares offered by these investment companies are also registered under the Securities Act. Many of the investment companies managed by AB, including a variety of mutual funds and other pooled investment vehicles, are registered with the SEC under the Investment Company Act, and, if appropriate, shares of these entities are registered under the Securities Act.
Certain subsidiaries including AXA Equitable FMG, AXA Advisors and AB and certain of its subsidiaries and affiliates are registered as investment advisers under the Investment Advisers Act. The investment advisory activities of such registered investment advisers are subject to various federal and state laws and regulations and to the laws in those foreign countries in which they conduct business. These laws and regulations generally grant supervisory agencies broad administrative powers, including the power to limit or restrict the carrying on of business for failure to comply with such laws and regulations.
231
Table of Contents
AXA Equitable FMG is registered with the CFTC as a commodity pool operator with respect to certain portfolios and is also a member of the National Futures Association (“NFA”). AB and certain of its subsidiaries are also separately registered with the CFTC as commodity pool operators and commodity trading advisers; SCB LLC is also registered with the CFTC as a commodity introducing broker. The CFTC is a federal independent agency that is responsible for, among other things, the regulation of commodity interests and enforcement of the Commodity Exchange Act (“CEA”). The NFA is a self-regulatory organization to which the CFTC has delegated, among other things, the administration and enforcement of commodity regulatory registration requirements and the regulation of its members. As such, AXA Equitable FMG is subject to regulation by the NFA and CFTC and is subject to certain legal requirements and restrictions in the CEA and in the rules and regulations of the CFTC and the rules and by-laws of the NFA on behalf of itself and any commodity pools that it operates, including investor protection requirements and antifraud prohibitions, and is subject to periodic inspections and audits by the CFTC and NFA. AXA Equitable FMG is also subject to certain CFTC-mandated disclosure, reporting and recordkeeping obligations.
Regulators, including the SEC, FINRA, the CFTC, NFA and state attorneys general, continue to focus attention on various practices in or affecting the investment management and/or mutual fund industries, including portfolio management, valuation and the use of fund assets for distribution.
We and certain of our subsidiaries have provided, and in certain cases continue to provide, information and documents to the SEC, FINRA, the CFTC, NFA, state attorneys general, the NYDFS and other state insurance regulators, and other regulators regarding our compliance with insurance, securities and other laws and regulations regarding the conduct of our businesses. For example, we have responded to inquiries from the SEC requesting information with regard to contract language and accompanying disclosure for certain variable annuity contracts. For additional information on regulatory matters, see note 17 of the notes to our annual financial statements included elsewhere in this prospectus.
The SEC, FINRA, the CFTC and other governmental regulatory authorities may institute administrative or judicial proceedings that may result in censure, fines, the issuance of cease-and-desist orders, trading prohibitions, the suspension or expulsion of a broker-dealer or member, its officers, registered representatives or employees or other similar sanctions.
AB Holding is an NYSE-listed company and, accordingly, is subject to the applicable regulations promulgated by the NYSE. We will also be subject to the applicable regulations of the NYSE following settlement of this offering.
Dodd-Frank Wall Street Reform and Consumer Protection Act
Currently, the U.S. federal government does not directly regulate the business of insurance. While the Dodd-Frank Act does not remove primary responsibility for the supervision and regulation of insurance from the states, Title V of the Dodd-Frank Act establishes the FIO within the U.S. Treasury Department and reforms the regulation of the non-admitted property and casualty insurance market and the reinsurance market. The Dodd-Frank Act also established the FSOC, which is authorized to subject non-bank financial companies, including insurers, to supervision by the Federal Reserve and enhanced prudential standards if the FSOC determines that a non-bank financial institution could pose a threat to U.S. financial stability. The FIO has authority that extends to all lines of insurance except health insurance, crop insurance and (unless included with life or annuity components) long-term care insurance. Under the Dodd-Frank Act, the FIO is charged with monitoring all aspects of the insurance industry (including identifying gaps in regulation that could contribute to a systemic crisis), recommending to the FSOC the designation of any insurer and its affiliates (potentially including AXA and its affiliates) as a non-bank financial company subject to oversight by the Board of Governors of the Federal Reserve System (including the administration of stress testing on capital), assisting the Treasury Secretary in negotiating “covered agreements” with non-U.S. governments or regulatory authorities, and, with respect to state insurance laws and regulation, determining whether state insurance measures are pre-empted by such covered
232
Table of Contents
agreements. In addition, the FIO is empowered to request and collect data (including financial data) on and from the insurance industry and insurers (including reinsurers) and their affiliates. In such capacity, the FIO may require an insurer or an affiliate of an insurer to submit such data or information as the FIO may reasonably require. In addition, the FIO’s approval will be required to subject an insurer or a company whose largest U.S. subsidiary is an insurer to the special orderly liquidation process outside the federal bankruptcy code, administered by the FDIC pursuant to the Dodd-Frank Act. The Dodd-Frank Act also reforms the regulation of the non-admitted property/casualty insurance market (commonly referred to as excess and surplus lines) and the reinsurance markets, including prohibiting the ability of non-domiciliary state insurance regulators to deny credit for reinsurance when recognized by the ceding insurer’s domiciliary state regulator.
Other aspects of our operations could also be affected by the Dodd-Frank Act. These include:
Heightened Standards and Safeguards. The FSOC may recommend that state insurance regulators or other regulators apply new or heightened standards and safeguards for activities or practices we and other insurers or other financial services companies engage in if the FSOC determines that those activities or practices could create or increase the risk that significant liquidity, credit or other problems spread among financial companies. We cannot predict whether any such recommendations will be made or their effect on our business, consolidated results of operations or financial condition.
Over-The-Counter Derivatives Regulation. The Dodd-Frank Act includes a framework of regulation of the OTC derivatives markets. Regulations approved to date require clearing of previously uncleared transactions and will require clearing of additional OTC transactions in the future. In addition, recently approved regulations impose margin requirements on OTC transactions not required to be cleared. As a result of these regulations, our costs of risk mitigation have and may continue to increase under the Dodd-Frank Act. For example, margin requirements, including the requirement to pledge initial margin for OTC cleared transactions entered into after June 10, 2013 and for OTC uncleared transactions entered into after the phase-in period, which would be applicable to us in 2019, have increased. In addition, restrictions on securities that will qualify as eligible collateral will require increased holdings of cash and highly liquid securities with lower yields causing a reduction in income. Centralized clearing of certain OTC derivatives exposes us to the risk of a default by a clearing member or clearinghouse with respect to our cleared derivatives transactions. We use derivatives to mitigate a wide range of risks in connection with our business, including the impact of increased benefit exposures from certain variable annuity products that offer GMxB features. We have always been subject to the risk that our hedging and other management procedures might prove ineffective in reducing the risks to which insurance policies expose us or that unanticipated policyholder behavior or mortality, combined with adverse market events, could produce economic losses beyond the scope of the risk management techniques employed. Any such losses could be increased by higher costs of writing derivatives (including customized derivatives) and the reduced availability of customized derivatives that might result from the enactment and implementation of the Dodd-Frank Act.
Broker-Dealer Regulation. The Dodd-Frank Act provides that the SEC may promulgate rules to provide that the standard of conduct for all broker-dealers, when providing personalized investment advice about securities to retail customers (and any other customers as the SEC may by rule provide) will be the same as the standard of conduct applicable to an investment adviser under the Investment Advisers Act. On April 18, 2018, the SEC released a set of proposed rules that would, among other things, enhance the existing standard of conduct for broker-dealers to require them to act in the best interest of their clients; clarify the nature of the fiduciary obligations owed by registered investment advisers to their clients; impose new disclosure requirements aimed at ensuring investors understand the nature of their relationship with their investment professionals; and restrict certain broker-dealers and their financial professionals from using the terms “adviser” or “advisor”. Public comments will be accepted for 90 days following publication of the proposal in the Federal Register. Although the full impact of the proposed rules can only be measured when the implementing regulations are adopted, the intent of this provision is to authorize the SEC to impose on broker-dealers fiduciary duties to their customers similar to what applies to investment advisers under existing law. We are currently assessing these
233
Table of Contents
proposed rules to determine the impact they may have on our business. In addition, FINRA is also currently focusing on how broker-dealers identify and manage conflicts of interest.
Although many of the regulations implementing portions of the Dodd-Frank Act have been promulgated, we are still unable to predict how this legislation may be interpreted and enforced or the full extent to which implementing regulations and policies may affect us. Also, the Trump administration and Congressional majority have indicated that the Dodd-Frank Act will be under further scrutiny and some of the provisions of the Dodd-Frank Act may be revised, repealed or amended. For example, President Trump has issued an executive order that calls for a comprehensive review of the Dodd-Frank Act and requires the Secretary of the Treasury to consult with the heads of the member agencies of FSOC to identify any laws, regulations or requirements that inhibit federal regulation of the financial system in a manner consistent with the core principles identified in the executive order. In addition, on June 8, 2017, the U.S. House of Representatives passed the Financial CHOICE Act of 2017, which proposes to amend or repeal various sections of the Dodd-Frank Act. There is considerable uncertainty with respect to the impact the Trump administration and Congressional majority may have, if any, on the Dodd-Frank Act, and any changes likely will take time to unfold. We cannot predict the ultimate content, timing or effect of any reform legislation or the impact of potential legislation on us.
ERISA Considerations
We provide certain products and services to employee benefit plans that are subject to the Employee Retirement Income Security Act of 1974 (“ERISA”) and certain provisions of the Code. As such, our activities are subject to the restrictions imposed by ERISA and the Code, including the requirement that fiduciaries must perform their duties solely in the interests of plan participants and beneficiaries, and fiduciaries may not cause or permit a covered plan to engage in certain prohibited transactions with persons (parties-in-interest) who have certain relationships with respect to such plans. The applicable provisions of ERISA and the Code are subject to enforcement by the DOL, the IRS and the Pension Benefit Guaranty Corporation.
In April 2016, the DOL issued the Rule, which significantly expanded the range of activities considered to be fiduciary investment advice under ERISA when our advisors and our employees provide investment-related information and support to retirement plan sponsors, participants and IRA holders. The DOL also issued in connection with the Rule amendments to certain PTEs under ERISA, and issued a new PTE, the Best Interest Contract Exemption, that applies more onerous disclosure and contract requirements to, and increases fiduciary requirements and liability exposure in respect of, transactions involving ERISA plans, plan participants and IRAs. Implementation of the Rule was originally scheduled to be phased in starting on April 10, 2017. In February 2017, however, the DOL was directed by the President’s Memorandum to review the Rule and determine whether the Rule should be rescinded or revised, in light of the new administration’s policies and orientations. In response, in March 2017, the DOL published a notice soliciting comments on the examination described in the President’s Memorandum, which were due in April 2017. In addition, in April 2017, the DOL announced that the applicability date of the Rule was deferred from April 10, 2017 until June 9, 2017. The Rule became partially effective on June 9, 2017, with a special transition period for the remaining requirements that were due to take effect on January 1, 2018. On November 29, 2017, the DOL finalized a delay in implementing the remaining requirements of the Rule from January 1, 2018 to July 1, 2019. On March 15, 2018 a federal appeals court issued a decision vacating the Rule. A final mandate has not been issued as of the date of this prospectus, and there is a possibility that the DOL may ask for a rehearing or appeal this decision. At this time, we do not currently plan any immediate changes to our approach to selling products and providing services to ERISA plans and IRAs.
Although management continues to evaluate its potential impact on our business, the Rule, if it remains in effect, is expected to cause adverse changes to the level and type of services we provide, as well as the nature and amount of compensation and fees that we and our affiliated advisors and firms receive for investment-related services to retirement plans and IRAs, which may have a significant adverse effect on our business and consolidated results of operations. For example, a significant portion of our variable annuity sales are to IRAs.
234
Table of Contents
The new regulation deems advisors, including third-party distributors, who provide investment advice in connection with an IRA, IRA rollover or 401(k) plan, to be fiduciaries and prohibits them from receiving compensation unless they comply with a PTE. The relevant PTE requires advisors to comply with impartial conduct standards and will require us to exercise additional oversight of the sales process. Compliance with the PTEs will result in increased regulatory burdens on us and our third-party distribution firms, changes to our compensation practices and product offerings and increased litigation risk, which could adversely affect our business and results of operations.
While the extent of implementation of the Rule remains uncertain, unless it is judicially vacated, repealed or meaningfully revised it is likely to result in adverse changes to the level and type of services we provide, as well as the nature and amount of compensation and fees that we and our advisors and firms receive for investment-related services to retirement plans and IRAs, which may have a significant adverse effect on our business and consolidated results of operations. In addition, the NAIC as well as state regulators are currently considering implementing regulations that would apply an impartial conduct standard similar to the Rule to recommendations made in connection with certain annuities and life insurance policies. For example, on December 27, 2017, the NYDFS proposed regulations that would adopt a “best interest” standard for the sale of life insurance and annuity products in New York. The likelihood of enactment of these regulations is uncertain at this time, but if implemented, these regulations could also have significant adverse effects on our business and consolidated results of operations.
International Regulation
Regulators and lawmakers in non-U.S. jurisdictions are engaged in addressing the causes of the financial crisis and means of avoiding such crises in the future. On July 18, 2013, the International Association of Insurance Supervisors (“IAIS”) published an initial assessment methodology for designating GSIIs, as part of the global initiative launched by the G20 with the assistance of the Financial Stability Board (“FSB”) to identify those insurers whose distress or disorderly failure, because of their size, complexity and interconnectedness, would cause significant disruption to the global financial system and economic activity.
On July 18, 2013, the FSB published its initial list of nine GSIIs, which included AXA. The GSII list is intended to be updated annually following consultation with the IAIS and respective national supervisory authorities. AXA remained on the list as updated in November 2014, 2015 and 2016. However, the FSB announced in November 2017 that it, in connection with the IAIS and national authorities, has decided not to publish a new list of GSIIs for 2017. The policy measures for GSIIs, published by the IAIS in July 2013, include (i) the introduction of new capital requirements; a “basic” capital requirement (“BCR”) applicable to all GSII activities which serves as a basis for an additional level of capital, called “Higher Loss Absorbency” (“HLA”) required from GSIIs in relation to their systemic activities, (ii) greater regulatory oversight over holding companies, (iii) various measures to promote the structural and financial “self-sufficiency” of group companies and reduce group interdependencies including restrictions on intra-group financing and other arrangements and (iv) in general, a greater level of regulatory scrutiny for GSIIs (including a requirement to establish a Systemic Risk Management Plan (“SRMP”), a Liquidity Risk Management Plan (“LRMP”) and a Recovery and Resolution Plan (“RRP”) which have entailed significant new processes, reporting and compliance burdens and costs for AXA. The contemplated policy measures include the constitution of a Crisis Management Group by the group-wide supervisor, the preparation of the above-mentioned documents (SRMP, LRMP and RRP) and the development and implementation of the BCR in 2014, while other measures are to be phased in more gradually, such as the HLA (the first version of which was endorsed by the FSB in October 2015 but which is expected to be revised before its implementation in at least 2019).
On June 16, 2016, the IAIS published an updated assessment methodology, applicable to the 2016 designation process, which is yet to be endorsed by the FSB. To support some adjustments proposed by the revised assessment methodology, the IAIS also published a paper on June 16, 2016, describing the “Systemic Features Framework” that the IAIS intends to employ in assessing whether certain contractual features and other
235
Table of Contents
factors are likely to expose an insurer to a greater degree of systemic risk, focusing specifically on two sets of risks: macroeconomic exposure and substantial liquidity risk. Also, the IAIS stated that the 2016 assessment methodology, along with the Systemic Features Framework, will lead to a change in HLA design and calibration. In addition, the IAIS is in the process of developing an activities-based approach to systemic risk in the insurance sector and published a consultation paper on this approach in December 2017. The development of this activities-based approach may have significant implications for the identification of GSIIs and the policy measures to which they are expected to be subject.
As part of its efforts to create a common framework for the supervision of internationally active insurance groups (“IAIGs”), the IAIS has also been developing a comprehensive, group-wide international insurance capital standard (the “ICS”) to be applied to both GSIIs and IAIGs, although it is not expected to be finalized until 2019 at the earliest, and is not expected to be fully implemented, if at all, until at least five years thereafter. AXA currently meets the parameters set forth to define an IAIG. Although the BCR and HLA are more developed than the ICS at present, the IAIS has stated that it intends to revisit both standards following development and refinement of the ICS, and that the BCR will eventually be replaced by the ICS.
These measures could have far reaching regulatory and competitive implications for AXA in the event they are implemented by its group supervisors, which in turn, to the extent we are deemed to be controlled by AXA at the time the measures are implemented, or we independently meet the criteria for being an IAIG and the measures are adopted by U.S. group supervisors, could materially affect our competitive position, consolidated results of operations, financial condition, liquidity and how we operate our business.
In addition, many of AB’s subsidiaries are subject to the oversight of regulatory authorities in jurisdictions outside of the United States in which they operate, including the European Securities and Markets Authority, the Financial Conduct Authority in the U.K., the CSSF in Luxembourg, the Financial Services Agency in Japan, the Securities & Futures Commission in Hong Kong, the Monetary Authority of Singapore, the Financial Services Commission in South Korea and the Financial Supervisory Commission in Taiwan. While these regulatory requirements often may be comparable to the requirements of the SEC and other U.S. regulators, they are sometimes more restrictive and may cause AB to incur substantial expenditures of time and money related to AB’s compliance efforts.
Federal Tax Legislation, Regulation and Administration
Although we cannot predict what legislative, regulatory, or administrative changes may or may not occur with respect to the federal tax law, we nevertheless endeavor to consider the possible ramifications of such changes on the profitability of our business and the attractiveness of our products to consumers. In this regard, we analyze multiple streams of information, including those described below.
Enacted Legislation. At present, the federal tax laws generally permit certain holders of life insurance and annuity products to defer taxation on the build-up of value within such products (commonly referred to as “inside build-up”) until payments are made to the policyholders or other beneficiaries. From time to time, Congress considers legislation that could enhance or reduce (or eliminate) the benefit of tax deferral on some life insurance and annuity products. As an example, the American Taxpayer’s Relief Act increased individual tax rates for higher-income taxpayers. Higher tax rates increase the benefits of tax deferral on inside build-up and, correspondingly, tend to enhance the attractiveness of life insurance and annuity products to consumers that are subject to those higher tax rates. The recently enacted Tax Reform Act reduced individual tax rates, which could reduce demand for our products. The modification or elimination of this tax-favored status could also reduce demand for our products. In addition, if the treatment of earnings accrued inside an annuity contract was changed prospectively, and the tax-favored status of existing contracts was grandfathered, holders of existing contracts would be less likely to surrender or rollover their contracts. These changes could reduce our earnings and negatively impact our business.
236
Table of Contents
The Tax Reform Act. The Tax Reform Act is a broad overhaul of the U.S. Internal Revenue Code that changes long-standing provisions governing the taxation of U.S. corporations, including life insurance companies. While we expect the Tax Reform Act to have a net positive economic impact on us, it contains measures which could have adverse or uncertain impacts on some aspects of our business, results of operations or financial condition. We are assessing the overall impact that the Tax Reform Act is expected to have on our business, results of operations and financial condition. See “Management’s Discussion and Analysis of Financial Condition and Results of Operations—Macroeconomic and Industry Trends—Impact of the Tax Reform Act.”
Future Changes in U.S. Tax Laws. We anticipate that, following the recently enacted Tax Reform Act, we will continue deriving tax benefits from certain items, including but not limited to the DRD, tax credits, insurance reserve deductions and interest expense deductions. However, there is a risk that interpretations of the Tax Reform Act, regulations promulgated thereunder, or future changes to federal, state or other tax laws could reduce or eliminate the tax benefits from these or other items and result in our incurring materially higher taxes.
Regulatory and Other Administrative Guidance from the Treasury Department and the IRS. Regulatory and other administrative guidance from the Treasury Department and the IRS also could impact the amount of federal tax that we pay. For example, the adoption of “principles based” approaches for calculating statutory reserves may lead the Treasury Department and the IRS to issue guidance that changes the way that deductible insurance reserves are determined, potentially reducing future tax deductions for us.
Privacy and Security of Customer Information and Cybersecurity Regulation
We are subject to federal and state laws and regulations that require financial institutions to protect the security and confidentiality of customer information, and to notify customers about their policies and practices relating to their collection and disclosure of customer information and their practices relating to protecting the security and confidentiality of that information. We have adopted a privacy policy outlining procedures and practices to be followed by members of the Company relating to the collection, disclosure and protection of customer information. As required by law, a copy of the privacy policy is mailed to customers on an annual basis. Federal and state laws generally require that we provide notice to affected individuals, law enforcement, regulators and/or potentially others if there is a situation in which customer information is intentionally or accidentally disclosed to and/or acquired by unauthorized third parties. Federal regulations require financial institutions to implement programs to detect, prevent and mitigate identity theft. Federal and state laws and regulations regulate the ability of financial institutions to make telemarketing calls and to send unsolicited e-mail or fax messages to both consumers and customers, and also regulate the permissible uses of certain categories of customer information. Violation of these laws and regulations may result in significant fines and remediation costs. It may be expected that legislation considered by either the U.S. Congress and/or state legislatures could create additional and/or more detailed obligations relating to the use and protection of customer information.
On February 16, 2017, the NYDFS announced the adoption of a new cybersecurity regulation for financial services institutions, including banking and insurance entities, under its jurisdiction. The new regulation became effective on March 1, 2017 and is being implemented in stages that commenced on August 28, 2017. This new regulation requires these entities to, among other things, establish and maintain a cybersecurity policy designed to protect consumers’ private data. We have adopted a cybersecurity policy outlining our policies and procedures for the protection of our information systems and information stored on those systems that comports with the regulation. In addition to New York’s cybersecurity regulation, the NAIC adopted the Insurance Data Security Model Law in October 2017. Under the model law, companies that are compliant with the NYDFS cybersecurity regulation are deemed also to be in compliance with the model law. The purpose of the model law is to establish standards for data security and for the investigation and notification of insurance commissioners of cybersecurity events involving unauthorized access to, or the misuse of, certain nonpublic information. We expect that states will begin adopting the model law, although it cannot be predicted whether or not, or in what form or when, they will do so.
237
Table of Contents
Environmental Considerations
Federal, state and local environmental laws and regulations apply to our ownership and operation of real property. Inherent in owning and operating real property are the risk of environmental liabilities and the costs of any required clean-up. Under the laws of certain states, contamination of a property may give rise to a lien on the property to secure recovery of the costs of clean-up, which could adversely affect our mortgage lending business. In some states, this lien may have priority over the lien of an existing mortgage against such property. In addition, in some states and under the federal Comprehensive Environmental Response, Compensation, and Liability Act of 1980, or CERCLA, we may be liable, in certain circumstances, as an “owner” or “operator,” for costs of cleaning-up releases or threatened releases of hazardous substances at a property mortgaged to us. We also risk environmental liability when we foreclose on a property mortgaged to us. However, federal legislation provides for a safe harbor from CERCLA liability for secured lenders, provided that certain requirements are met. Application of various other federal and state environmental laws could also result in the imposition of liability on us for costs associated with environmental hazards.
We routinely conduct environmental assessments prior to making a mortgage loan or taking title to real estate, whether through acquisition for investment or through foreclosure on real estate collateralizing mortgages. We cannot provide assurance that unexpected environmental liabilities will not arise. However, based on information currently available to us, we believe that any costs associated with compliance with environmental laws and regulations or any clean-up of properties would not have a material adverse effect on our consolidated results of operations.
Intellectual Property
We rely on a combination of copyright, trademark, patent and trade secret laws to establish and protect our intellectual property rights. AXA Financial has entered into a licensing arrangement with AXA concerning the use by AXA Financial Group of the “AXA” name. Since 2014, AXA Financial Group companies have been using AXA as the single brand for AXA Financial’s advice, retirement and life insurance lines of business. As a result, we have simplified our brand in the U.S. marketplace to “AXA” from AXA Equitable. We also have an extensive portfolio of trademarks and service marks that we consider important in the marketing of our products and services. We regard our intellectual property as valuable assets and protect them against infringement.
AB has also registered a number of service marks with the U.S. Patent and Trademark Office and various foreign trademark offices, including the mark “AllianceBernstein.” The [A/B] logo and “Ahead of Tomorrow” are service marks of AB. In January 2015, AB established two new brand identities. Although the legal names of AB did not change, the corporate entity, and its Institutions and Retail businesses now are referred to as “AB”. Private Wealth Management and Bernstein Research Services now are referred to as “AB Bernstein”. Also, AB adopted the [A/B] logo and “Ahead of Tomorrow” service marks described above. AB has acquired all of the rights and title in, and to, the Bernstein service marks, including the mark “Bernstein” and the W.P. Stewart & Co., Ltd. services marks, including the logo “WPSTEWART”.
Employees
As of December 31, 2017, we had approximately 7,500 full time employees. Of these, approximately 3,500 were employed full-time by AB.
Properties
Our principal executive offices at 1290 Avenue of the Americas, New York, New York are occupied pursuant to a lease that extends to 2023. We also have the following significant office space leases in: Syracuse, NY, under a lease that expires in 2023; Jersey City, NJ, under a lease that expires in 2023, Charlotte, NC, under a lease that expires in 2028; and Secaucus, NJ, under a lease that expires in 2018.
238
Table of Contents
AB’s principal executive offices at 1345 Avenue of the Americas, New York, New York are occupied pursuant to a lease expiring in 2024. AB also leases space at two other locations in New York City. In addition, AB leases office space in White Plains, NY under a lease expiring in 2021 with options to extend to 2031 and in San Antonio, TX under a lease expiring in 2019 (with options to extend to 2029). AB also leases space in 21 other cities in the United States and AB’s subsidiaries lease space in 28 cities outside the United States, the most significant of which are in London, England and in Tokyo, Japan.
Legal Proceedings
For information regarding certain legal proceedings pending against us, see note 16 of the notes to our annual financial statements included elsewhere in this prospectus. See “Risk Factors—Legal and Regulatory Risks—Legal and regulatory actions could have a material adverse effect on our reputation, business, results of operations or financial condition.”
239
Table of Contents
The following table sets forth certain information concerning our directors and executive officers. The respective age of each individual in the table below is as of March 1, 2018.
| Name |
Age |
Position | ||||
| Thomas Buberl |
44 | Chairman of the Board | ||||
| Mark Pearson |
59 | Director; President and Chief Executive Officer | ||||
| George Stansfield |
58 | Director | ||||
| Gérald Harlin |
62 | Director | ||||
| Karima Silvent |
44 | Director | ||||
| Bertrand Poupart-Lafarge |
50 | Director | ||||
| Daniel G. Kaye |
63 | Director | ||||
| Ramon de Oliveira |
63 | Director | ||||
| Charles G. T. Stonehill |
60 | Director | ||||
| Seth Bernstein |
55 | President and Chief Executive Officer of AllianceBernstein Corporation | ||||
| Dave S. Hattem |
61 | Senior Executive Vice President and General Counsel | ||||
| Jeffrey J. Hurd |
51 | Senior Executive Vice President and Chief Operating Officer | ||||
| Anders Malmström |
50 | Senior Executive Vice President and Chief Financial Officer | ||||
| Brian Winikoff |
45 | Senior Executive Vice President and Head of U.S. Life, Retirement and Wealth Management | ||||
Directors
Thomas Buberl
Mr. Buberl has been a director since September 2016 and Chairman of the Board since November 2017. Mr. Buberl has served as Chief Executive Officer of AXA since September 2016. From March 2016 to August 2016, Mr. Buberl served as Deputy Chief Executive Officer (Directeur Général Adjoint) of AXA. Prior thereto, Mr. Buberl served as Chief Executive Officer of AXA Konzern AG (May 2012 to April 2016), Chief Executive Officer for the global business line for the Health Business (March 2015 to March 2016) and Chief Executive Officer for the global business line for the Life and Savings Business (January 2016 to March 2016). From November 2008 to April 2012, Mr. Buberl served as Chief Executive Officer for Switzerland of Zurich Financial Services (“Zurich”). Prior to joining Zurich, Mr. Buberl held various management positions with Boston Consulting Group (February 2000 to October 2005) and Winterthur Group (November 2005 to October 2008). Mr. Buberl has been a director of AXA Financial, AXA Equitable Life and MLOA since May 2016.
Mr. Buberl is also Chairman of the Board of Directors of AXA Leben AG (Switzerland), AXA Versicherungen AG (Switzerland), Chairman of the Supervisory Board of AXA Konzern AG (Germany) and Member of the Management Committee of AXA ASIA (France).
Mr. Buberl is also a member of the Supervisory Board of Bertelsmann SE & Co. KGaA (Germany).
Mr. Buberl brings to the Board his extensive experience and key leadership skills developed through his service as an executive, including invaluable perspective as the Chief Executive Officer of AXA. The Board also benefits from his perspective as a member of AXA’s Management Committee.
Gérald Harlin
Gérald Harlin has been a director since September 2016, and was Chairman and Chief Executive Officer from September 2016 to November 2017. Mr. Harlin has been AXA’s Deputy Chief Executive Officer (Directeur
240
Table of Contents
Général Adjoint) since December 1, 2017, Chief Financial Officer since 2010, a member of AXA’s Executive Committee since July 2008 and a member of AXA’s Management Committee since July 2016. He holds various directorships within AXA: Chairman & Chief Executive Officer of AXA China (France), Chief Executive Officer and a member of the Management Board of Vinci B.V. (the Netherlands), Chairman of the Board of Directors of AXA Holdings Belgium SA (Belgium) and AXA Mediterranean Holdings, S.A.U. (Spain), Chairman of AXA Oeuvres d’Art (France) and Lor Patrimoine (France) Chairman of the Management Committee of AXA ASIA (France) and a director or member of the Supervisory Board or member of the AXA Liabilities Managers (France) and AXA Real Estate Investment Managers (France). Mr. Harlin is also AXA’s permanent representative to the board of AXA Investment Managers (France). From 2003 to 2009, Mr. Harlin served as Executive Vice President, Finance & Control of AXA. From 1979 to 1990, Mr. Harlin held various positions with the Total Group. He was Head of Corporate Finance Department for North America, Mining & Chemical Subsidiaries from 1989 to 1990.
Mr. Harlin brings to the Board his extensive experience and key leadership skills developed through his service as an executive, including invaluable perspective as the Chief Financial Officer of AXA. The Board also benefits from his perspective as a member of AXA’s Management Committee.
Mark Pearson, President and Chief Executive Officer
Mr. Pearson has been a director since January 2011 and currently serves as our President and Chief Executive Officer. Mr. Pearson has been the President and Chief Executive Officer of AXA Financial since February 2011, has been a director of AXA Equitable Life since January 2011 and has been a member of the Executive Committee of AXA since 2008. From February 2011 through September 2013, Mr. Pearson served as AXA Equitable Life’s Chairman of the Board and Chief Executive Officer. From 2008 to 2011, he was the President and Chief Executive Officer of AXA Japan Holding Co. Ltd. (“AXA Japan”). Mr. Pearson joined AXA in 1995 with the acquisition of National Mutual Holdings and was appointed Regional Chief Executive of AXA Asia Life in 2001. Before joining AXA, Mr. Pearson spent approximately 20 years in the insurance sector, assuming several senior manager positions at Hill Samuel, Schroders, National Mutual Holdings and Friends Provident. Mr. Pearson is a Fellow of the Chartered Association of Certified Accountants and is a member of the Board of Directors of the American Council of Life Insurers. Mr. Pearson is also a director of AXA Financial (since January 2011), MONY America (since January 2011) and AllianceBernstein Corporation (since February 2011).
Mr. Pearson brings to the Board diverse financial services experience developed though his service as an executive, including as a Chief Executive Officer, to AXA Financial, AXA Japan and other AXA affiliates.
George Stansfield
Mr. Stansfield has been a director since November 2017. Since December 1, 2017, Mr. Stansfield has been Deputy Chief Executive Officer (Directeur Général Adjoint) of AXA, and since July 1, 2016, Mr. Stansfield has been Group General Secretary and a member of AXA’s Management Committee. Mr. Stansfield was previously Head of AXA’s Group Human Resources from 2010 to 2016 and was AXA’s Group General Counsel from 2004 to 2016. Prior to 2004, Mr. Stansfield was an attorney in the legal department of AXA Equitable Life for 11 years. Mr. Stansfield holds various directorships within AXA: Chairman of the Supervisory Board of AXA Liabilities Managers (France), GIE AXA (France) and Kamet (France), Chairman of the Management Committee of AXA Venture Partners (France) and director or Management Committee member of AXA ASIA (France) and AXA Life Insurance Co Ltd. (Japan). Mr. Stansfield is also AXA’s permanent representative to the board of AXA Millésimes Finance, Château Petit Village, Château Pichon Longueville, SCI de L’Arlot and Société Belle Hélène. Mr. Stansfield has also served as a director of AXA Equitable Life, AXA Financial and MLOA since May 2017.
241
Table of Contents
Mr. Stansfield is also a Trustee of the American Library of Paris, a non-profit organization and the largest English language lending library on the European mainland.
Mr. Stansfield brings to the Board his extensive experience and knowledge and key leadership skills developed through his service as an executive, including his experience as Group General Secretary and his perspective as a member of AXA’s Management Committee.
Karima Silvent
Mrs. Silvent has been a director since April 2018. Mrs. Silvent has served as HR Director of AXA France since July 2016 and Global Head of HR for AXA Group since November 2017. In April 2012, she joined GIE AXA as Global HR Business Partner for Chief Operating Office functions (Operations, IT, Marketing and Distribution) and, in September 2013, she was appointed Global HR Director in charge of workforce transformation, culture, employer brand and recruiting and also in charge of talent and executive career management for support functions professional families (Finance, Legal & Compliance, IT, Marketing & Distribution, Operations, HR and Communication). Prior to that, in 2007, Mrs. Silvent joined Korian, a private health group (clinics, retirement homes), first as Group HR Director and in 2011 as Chief Operating Officer for the French Business Line. Previously, in 2002, she was Deputy Human Resources Director at the French, state-owned Health Service (Hôpitaux de Paris), with approximately 90,000 employees. In 1997, Mrs. Silvent was Deputy and then Head of the National Fund for Employment the French Ministry of Employment and Health, where she worked on employment reforms as well as helped private companies implement HR policies.
Mrs. Silvent will bring to the Board her extensive experience, knowledge and key leadership skills, developed through her service in both the government and private sectors, in implementing and managing human resources and employment matters, including her experience as Global Head of HR for AXA Group and HR Director of AXA France.
Bertrand Poupart-Lafarge
Mr. Poupart-Lafarge has been a director since April 2018. Mr. Poupart-Lafarge was appointed Group Chief Financial Officer of AXA UK in September 2013, and, since April 2018, he has also acted as interim Chief Executive Officer of AXA UK. Mr. Poupart-Lafarge has been with AXA UK since September 2012 when he served as Deputy CFO (with responsibility for financial controls; planning, budgeting, reporting and tax; business intelligence; and finance projects). He also previously held the roles of Chief Investment Officer and Treasurer of AXA Equitable Inc. in New York and, prior to that, Executive Vice President and Chief Financial Officer of AXA Canada. He has also held various roles in AXA France in Paris since 1997.
Mr. Poupart-Lafarge will bring to the Board his extensive experience, knowledge and key leadership skills, developed through his service as an executive, including his experience as Group Chief Financial Officer of AXA UK.
Daniel G. Kaye
Mr. Kaye has been a director since April 2018. From January 2013 to May 2014, Mr. Kaye served as Interim Chief Financial Officer and Treasurer of HealthEast Care System (“HealthEast”). Prior to joining HealthEast, Mr. Kaye spent 35 years with Ernst & Young LLP (“Ernst & Young”) from which he retired in 2012. Throughout his time at Ernst & Young, where he was an audit partner for 25 years, Mr. Kaye enjoyed a track record of increasing leadership and responsibilities, including serving as the New England Managing Partner and the Midwest Managing Partner of Assurance. Mr. Kaye was a member of the Board of Directors of Ferrellgas Partners L.P. (“Ferrellgas”) from August 2012 to November 2015 where he served on the Audit Committee and Corporate Governance and Nominating Committee (Chair). Mr. Kaye is a Certified Public Accountant and National Association of Corporate Directors (NACD) Board Leadership Fellow. Mr. Kaye is also a director of
242
Table of Contents
AXA Financial, AXA Equitable Life and MONY America since September 2015, AllianceBernstein Corporation since May 2017 and AXA Insurance Company since April 2017. Mr. Kaye currently serves as the Chairman of the Audit Committee of AllianceBernstein Corporation.
Mr. Kaye will bring to the Board invaluable expertise as an audit committee financial expert, and extensive financial services and insurance industry experience and his general knowledge and experience in financial matters developed through his roles at Ernst & Young and HealthEast. The Board will also benefit from his experience as a director of Ferrellgas, AllianceBernstein Corporation and AXA Insurance Company.
Ramon de Oliveira
Mr. de Oliveira has been a director since April 2018. Mr. de Oliveira has been a member of AXA’s Board of Directors since April 2010, where he serves on the Finance Committee (Chair) and Audit Committee, and from April 2009 to May 2010, he was a member of AXA’s Supervisory Board. He is currently the Managing Director of the consulting firm Investment Audit Practice, LLC, based in New York, NY. From 2002 to 2006, Mr. de Oliveira was an adjunct professor of Finance at Columbia University. Prior thereto, starting in 1977, he spent 24 years at JP Morgan & Co. where he was Chairman and Chief Executive Officer of JP Morgan Investment Management and was also a member of the firm’s Management Committee since its inception in 1995. Upon the merger with Chase Manhattan Bank in 2001, Mr. de Oliveira was the only executive from JP Morgan & Co. asked to join the Executive Committee of the new firm with operating responsibilities. Mr. de Oliveira is currently a member of the Board of Directors of Fonds de Dotation du Louvre. Previously he was a Director of JP Morgan Suisse, American Century Company, Inc., SunGard Data Systems, JACCAR Holdings and The Hartford Insurance Company. Mr. de Oliveira is also a director of AXA Financial, AXA Equitable Life and MONY America since May 2011 and AllianceBernstein Corporation since May 2017.
Mr. de Oliveira will bring to the Board extensive financial services experience, and key leadership and analytical skills developed through his roles within the financial services industry and academia. The Board also will benefit from his perspective as a director of AXA and as a former director of other companies.
Charles G.T. Stonehill
Mr. Stonehill has been a director since April 2018. Mr. Stonehill is Founding Partner of Green & Blue Advisors LLC. He also serves as nonexecutive Vice Chairman of the Board of Directors of Julius Baer Group Ltd. Mr. Stonehill is a member of the Board of Directors of CommonBond, LLC, and of PlayMagnus A/S. During his financial services career, Mr. Stonehill served as the Managing Director of Lazard Frères & Co., LLC, and global head of Lazard Capital Markets from 2002 to 2004. He served as Head of Investment Banking for the Americas of Credit Suisse First Boston from 1997 to 2002 and as Head of European Equities and Equity Capital Markets at Morgan Stanley & Co., Inc., from 1984 to 1997. Mr. Stonehill began his career at JP Morgan in the oil and gas investment banking group, where he worked from 1978 to 1984. Mr. Stonehill is also a director of AXA Financial, AXA Equitable Life and MONY America since November 2017.
Mr. Stonehill will bring to the Board his expertise and distinguished track record of success in the financial services industry and over 30 years’ experience in energy markets, investment banking and capital markets.
Executive Officers
The current executive officers (other than our President and Chief Executive Officer, whose biography is included above in the Directors information) are as follows:
Seth Bernstein, President and Chief Executive Officer of AllianceBernstein Corporation
Mr. Bernstein has been the President and Chief Executive Officer of AllianceBernstein Corporation since May 2017. Mr. Bernstein is also a director of AllianceBernstein Corporation. From 2014 to 2017, Mr. Bernstein
243
Table of Contents
was Managing Director and Global Head of Managed Solutions and Strategy at JPMorgan Asset Management. In this role, he was responsible for the management of all discretionary assets within the Private Banking client segment. From 2012 to 2014, Mr. Bernstein was Managing Director and Global Head of Asset Management Solutions for JPMorgan Chase & Co. Among other roles, Mr. Bernstein was Managing Director and Global Head of Fixed Income & Currency from 2002 to 2012. Previously, Mr. Bernstein served as Chief Financial Officer at JPMorgan Chase’s investment management and private banking division. He is a member of the Board of Managers of Haverford College.
Dave S. Hattem, Senior Executive Vice President and General Counsel
Mr. Hattem is responsible for the oversight of the Law Department, including the compliance, government relations and corporate secretary’s functions, helping the Company navigate the legal and regulatory environment to achieve its strategic goals. Mr. Hattem has been the Senior Executive Director and General Counsel of AXA Equitable Life since 2012. Prior to his election as General Counsel in 2010, he served as Senior Vice President and Deputy General Counsel of AXA Equitable Life from 2004 to 2010. Prior to joining AXA Equitable Life in 1994, Mr. Hattem served in several senior management positions in the Office of the United States Attorney for the Eastern District of New York. Mr. Hattem began his professional legal career as an Associate in the Litigation Department of Barrett Smith Schapiro Simon & Armstrong. Mr. Hattem is Chairman of the Board of Directors of The Life Insurance Council of New York.
Jeffrey J. Hurd, Senior Executive Vice President and Chief Operating Officer
Mr. Hurd is responsible for overseeing the human resources, information technology and transformation office functions. The transformation office encompasses operations, data and analytics, procurement and oversight of strategic taskforces. Prior to joining us on January 8, 2018, Mr. Hurd held various positions at American International Group, Inc. (“AIG”), where he most recently served as executive vice president and chief operating officer. Mr. Hurd joined AIG in 1998 and served in various leadership positions there, including AIG deputy general counsel, general counsel and chief administrative officer of asset management, AIG chief administrative officer and executive vice president and chief human resources officer.
Anders Malmström, Senior Executive Vice President and Chief Financial Officer
Mr. Malmström is responsible for all actuarial and investment functions, with oversight of the controller, tax, expense management and distribution finance areas. Mr. Malmström has been the Senior Executive Director and Chief Financial Officer of AXA Equitable Life since 2012. Prior to joining AXA Equitable Life, Mr. Malmström was a member of the Executive Board and served as the Head of the Life Business at AXA Winterthur. Prior to joining AXA Winterthur in January 2009, Mr. Malmström was a Senior Vice President at Swiss Life, where he was also a member of management. Mr. Malmström joined Swiss Life in 1997, and held several positions of increasing responsibility during his tenure. Mr. Malmström was appointed a Director of AB in 2017.
Brian Winikoff, Senior Executive Vice President and Head of U.S. Life, Retirement and Wealth Management
Mr. Winikoff is responsible for our Individual Retirement, Group Retirement and Protection Solutions businesses along with AXA Advisors and AXA Equitable FMG. Mr. Winikoff has been the Senior Executive Director and Head of U.S. Life, Retirement and Wealth Management at AXA Equitable Life since 2016. Prior to joining AXA Equitable Life, Mr. Winikoff served as President and Chief Executive Officer of Crump Life Insurance Services, Inc. (“Crump”) from 2008 to 2016. Prior thereto, Mr. Winikoff served in multiple roles at Crump from 2002 to 2008, including as Chief Financial Officer and Vice President, Investor Relations and Corporate Finance. Prior to joining Crump, Mr. Winikoff was Vice President of Finance for LoudCloud, Inc. and an investment banking analyst at Salomon Brothers.
244
Table of Contents
Corporate Governance
Board Composition and Director Independence
Our Board is composed of nine directors. Our directors will be elected annually to serve until the next annual meeting of stockholders or until their successors are duly elected and qualified. The Shareholder Agreement with AXA will provide AXA with certain rights relating to the composition of our Board. See “Certain Relationships and Related Party Transactions—Relationship with AXA Following this Offering—Shareholder Agreement.”
The number of members on our Board may be fixed by majority vote of the members of our Board. Any vacancy in the Board that results from (x) the death, disability, resignation or disqualification of any director shall be filled by an affirmative vote of at least a majority of the directors then in office, even if less than a quorum, or by a sole remaining director and (y) an increase in the number of directors or the removal of any director shall be filled (a) until the first date on which AXA ceases to beneficially own more than 50% of the outstanding shares of common stock, solely by an affirmative vote of the holders of at least a majority of the outstanding shares of common stock entitled to vote in an election of directors and (b) from and after the first date on which AXA ceases to beneficially own more than 50% of the outstanding shares of common stock, by an affirmative vote of at least a majority of the directors then in office, even if less than a quorum, or by a sole remaining director. Each director shall hold office until his or her successor has been duly elected and qualified, or until his or her earlier death, resignation or removal.
Our Board has determined that Daniel G. Kaye, Ramon de Oliveira and Charles G. T. Stonehill are “independent” as defined under the NYSE rules and the Exchange Act rules and regulations.
Controlled Company
After the settlement of this offering, AXA will control a majority of the voting power of our outstanding common stock. AXA will own approximately 75.5% of our common stock after the settlement of this offering (or approximately 71.9% if the underwriters exercise in full their option to purchase additional shares from the selling stockholder). Accordingly, we will be a “controlled company” within the meaning of the NYSE corporate governance standards. Under NYSE rules, a company of which more than 50% of the voting power is held by an individual, group or another company is a “controlled company” and may elect not to comply with certain NYSE corporate governance standards, including:
| • | the requirement that a majority of the Board consist of independent directors; |
| • | the requirement that we have a compensation committee that is composed entirely of independent directors; |
| • | the requirement that our nominating and corporate governance committee be composed entirely of independent directors; and |
| • | the requirement for an annual performance evaluation of the nominating and corporate governance and compensation committees. |
Following this offering, we will use these exemptions. Accordingly, you may not have the same protections afforded to stockholders of companies that are subject to all of the NYSE corporate governance rules and requirements. The “controlled company” exception does not modify audit committee independence requirements of Rule 10A-3 under the Exchange Act and NYSE rules.
Board Committees
Upon the listing of our common stock, our Board will maintain an Audit Committee, a Compensation Committee, a Nominating and Corporate Governance Committee, an Executive Committee and a Finance and
245
Table of Contents
Risk Committee. Under NYSE rules, our Audit Committee will be required to be composed entirely of independent directors within one year from the date of this prospectus. As a controlled company, we are not required to have independent Compensation or Nominating and Corporate Governance Committees. The following is a brief description of our committees.
Audit Committee
The primary purposes of the Audit Committee will be to: (i) to assist the Board in overseeing (a) the quality and integrity of our financial statements, (b) the qualifications, independence and performance of our independent auditor, (c) our accounting, financial and external reporting policies and practices, (d) the performance of our internal audit function and (e) our compliance with legal and regulatory requirements, including without limitation any requirements promulgated by the Public Company Accounting Oversight Board and the Financial Accounting Standards Board; and (ii) to prepare the report of the Audit Committee required to be included in our annual proxy statement. The charter of our Audit Committee will be available without charge on the investor relations portion of our website upon the listing of our common stock.
Prior to the settlement of this offering, we expect the members of our Audit Committee to be Gérald Harlin, Daniel G. Kaye (Chair), Ramon de Oliveira and Charles G. T. Stonehill. Our Board has designated Gérald Harlin, Daniel G. Kaye, Ramon de Oliveira and Charles G. T. Stonehill as “audit committee financial experts,” and each of Gérald Harlin, Daniel G. Kaye, Ramon de Oliveira and Charles G. T. Stonehill has been determined to be “financially literate” under NYSE rules. Our Board has also determined that Daniel G. Kaye, Ramon de Oliveira and Charles G. T. Stonehill are “independent” as defined under NYSE and Exchange Act rules and regulations.
Compensation Committee
The primary purpose of the Compensation Committee will be to: (i) be responsible for general oversight of compensation and compensation related matters; (ii) prepare any report on executive compensation required by the rules and regulations of the SEC for inclusion in our annual proxy statement or Annual Report on Form 10-K; and (iii) take such other actions relating to our compensation and benefits structure as the Compensation Committee deems necessary or appropriate. The charter of our Compensation Committee will be available without charge on the investor relations portion of our website upon the listing of our common stock.
Prior to the settlement of this offering, we expect the members of our Compensation Committee to be Daniel G. Kaye, George Stansfield (Chair) and Charles G. T. Stonehill. Our Board has also determined that Daniel G. Kaye and Charles G. T. Stonehill are “independent” as defined under NYSE and Exchange Act rules and regulations. In light of our status as a “controlled company” within the meaning of the corporate governance standards of the NYSE following this offering, we are exempt from the requirement that our Compensation Committee be composed entirely of independent directors under listing standards applicable to membership on the Compensation Committee. We intend to establish a sub-committee of our Compensation Committee consisting of Daniel G. Kaye and Charles G. T. Stonehill for purposes of approving any equity-based compensation that we may wish to qualify for the exemption provided under Rule 16b-3 under the Exchange Act.
Nominating and Corporate Governance Committee
Our Nominating and Corporate Governance Committee will be responsible, among its other duties and responsibilities, for: (i) identifying individuals qualified and suitable to become Board members and recommending to the Board the director nominees for each annual meeting of stockholders; (ii) developing and recommending to the Board a set of corporate governance principles applicable to us; and (iii) otherwise taking a leadership role in shaping our corporate governance policies. The charter of our Nominating and Corporate Governance Committee will be available without charge on the investor relations portion of our website upon the settlement of this offering.
246
Table of Contents
Prior to the settlement of this offering, we expect the members of our Nominating and Corporate Governance Committee to be Daniel G. Kaye, George Stansfield (Chair) and Charles G. T. Stonehill. Our Board has also determined that Daniel G. Kaye and Charles G. T. Stonehill are “independent” as defined under NYSE and Exchange Act rules and regulations. In light of our status as a “controlled company” within the meaning of the corporate governance standards of the NYSE following this offering, we are exempt from the requirement that our Nominating and Corporate Governance Committee be composed entirely of independent directors.
Executive Committee
The function of the Executive Committee is to exercise the authority of the Board in the management of Holdings between meetings of the Board with specified exceptions.
Prior to the settlement of this offering, we expect the members of our Executive Committee to be Thomas Buberl (Chair), Mark Pearson, George Stansfield and Charles G. T. Stonehill.
Finance and Risk Committee
The primary purpose of the Finance and Risk Committee is to assist the Board in fulfilling its oversight of management’s responsibilities with respect to financial and capital matters, including strategies that bear upon our long-term financial sustainability. In addition, the Finance and Risk Committee oversees the governance of significant risks throughout the Company and the establishment and ongoing monitoring of the Company’s risk profile, risk capacity and risk appetite.
Prior to the settlement of this offering, we expect the members of our Finance and Risk Committee to be Daniel G. Kaye, Ramon de Oliveira and Charles G. T. Stonehill (Chair).
Code of Ethics
We have a Code of Business Conduct and Ethics that applies to all of our directors, officers and employees and financial professionals. Upon the settlement of this offering, we expect to have a Financial Code of Ethics that applies to the CEO, CFO and CAO, or persons performing similar functions, and other designated officers and associates. The Code of Business Conduct and Ethics addresses, and we expect that the Financial Code of Ethics will address, matters such as conflicts of interest, confidentiality, fair dealing and compliance with laws and regulations. The Code of Business Conduct and Ethics and the Financial Code of Ethics will be available without charge on the investor relations portion of our website upon settlement of this offering.
Corporate Governance of AB
AB’s activities are managed and controlled by the General Partner of AB Holding and ABLP. The Board of the General Partner acts as the Board of each of AB Holding and ABLP. Neither ABLP Unitholders nor AB Holding Unitholders have any rights to manage or control AB Holding or ABLP or to elect directors of the General Partner. The General Partner is an indirect, wholly owned subsidiary of Holdings.
The General Partner does not receive any compensation from ABLP and AB Holding for services rendered to them as their general partner. The General Partner holds a 1% general partnership interest in ABLP and 100,000 units of general partnership interest in AB Holding. Each general partnership unit in AB Holding is entitled to receive distributions equal to those received by each AB Holding Unit.
The General Partner is entitled to reimbursement for any expenses it incurs in carrying out its activities as general partner of ABLP and AB Holding, including compensation paid by the General Partner to its directors and officers (to the extent such persons are not compensated directly by AB).
247
Table of Contents
INTRODUCTION
In 2017, Holdings was an indirect, wholly owned subsidiary of AXA and executive officers of AXA Equitable Life and the Chief Executive Officer of AB served as executive officers of Holdings. As a result, decisions regarding the 2017 compensation of the executive officers of AXA Equitable Life who were our named executive officers in 2017 (the “EQ Named Executive Officers”) were made by the AXA Equitable Life Board of Directors and its Organization and Compensation Committee with the input of AXA as discussed in greater detail below in “Compensation Discussion and Analysis—EQ Named Executive Officers.” Similarly, decisions regarding the 2017 compensation of the Chief Executive Officer of AB were made by the AB Board of Directors and its Compensation Committee with the input of AXA as discussed in greater detail below in “Compensation Discussion and Analysis—Mr. Bernstein.”
Going forward, the Compensation Committee will determine the appropriate philosophy, objectives and design for our executive compensation program and the compensation of our executive officers. The committee will retain a compensation consultant to provide advice and support to the committee in the design and implementation of our executive compensation program, as it deems necessary or appropriate. For a description of the compensation plans that will be provided to our executives following this offering, please see “Post-Offering Executive Compensation Information” below.
2017 NAMED EXECUTIVE OFFICERS
The following individuals are our 2017 Named Executive Officers:
| • | Mark Pearson, President and Chief Executive Officer | |
| • | Anders Malmström, Senior Executive Vice President and Chief Financial Officer | |
| • | Brian Winikoff, Senior Executive Director and Head of U.S. Life, Retirement and Wealth Management of AXA Equitable Life | |
| • | Dave Hattem, Senior Executive Vice President and General Counsel | |
| • | Seth Bernstein, Chief Executive Officer of AB | |
| • | Gérald Harlin, Chairman of the Board and Chief Executive Officer (through November 6, 2017) | |
During 2017, all of the executive officers listed above other than Mr. Harlin were employees of AXA Equitable Life or AB and received no compensation directly from Holdings for services performed. Rather, their compensation was paid by AXA Equitable Life or AB. Accordingly, this Compensation Discussion and Analysis provides an overview of the philosophy, goals and principal components of AXA Equitable Life’s and AB’s 2017 executive compensation programs.
Mr. Harlin did not receive any compensation from Holdings or any of its subsidiaries for services performed for Holdings during 2017. Accordingly, none of the discussion that follows includes any information regarding Mr. Harlin and all references to our “Named Executive Officers” below relate solely to the other executive officers listed above.
The details of each Named Executive Officer’s compensation may be found in the Summary Compensation Table and other compensation tables included below.
248
Table of Contents
COMPENSATION DISCUSSION AND ANALYSIS—EQ NAMED EXECUTIVE OFFICERS
Compensation Program Overview
Goal
The overriding goal of AXA Equitable Life’s 2017 executive compensation program was to attract, retain and motivate top-performing executive officers dedicated to the long-term financial and operational success of AXA Equitable Life, AXA Financial and AXA Financial Group’s retirement and protection related businesses (“AXA Financial R&P Operations”) as well as AXA. Accordingly, as further described below, the program incorporated metrics to measure that success.
Philosophy and Strategy
To achieve its goal, AXA Equitable Life’s 2017 executive compensation program was structured to foster a pay-for-performance management culture by:
| • | providing total compensation opportunities competitive with the levels of total compensation available at the large diversified financial services companies with which the AXA Financial Group most directly competes in the marketplace; |
| • | making performance-based variable compensation the principal component of executive pay to drive superior performance by basing a significant portion of the executive officers’ financial success on the financial and operational success of AXA Financial R&P Operations and AXA; |
| • | setting performance objectives and targets for variable compensation arrangements that provided individual executives with the opportunity to earn above-median compensation by achieving above-target results; |
| • | establishing equity-based arrangements that aligned the executives’ financial interests with those of AXA by ensuring the executives had a material financial stake in the rising equity value of AXA and the business success of its affiliates; and |
| • | structuring compensation packages and outcomes to foster internal equity. |
Compensation Components
To support this pay-for-performance strategy, AXA Equitable Life’s 2017 Total Compensation Program provided a mix of fixed and variable compensation components that based the majority of each executive’s compensation on the success of AXA Financial R&P Operations and AXA as well as an assessment of each executive’s overall contribution to that success.
The fixed and variable components provided a mix of cash and non-cash compensation and short-term and long-term incentive compensation awards. The particular mix of cash and non-cash and short-term and long-term compensation was based on market practice determined in accordance with AXA Equitable Life’s benchmarking practices described below in “—Use of Competitive Compensation Data.”
Fixed Component
The fixed compensation component of AXA Equitable Life’s 2017 Total Compensation Program, base salary, fell within the market median of the large diversified financial services companies that are the AXA Financial Group’s major competitors and was meant to fairly and competitively compensate executives for their positions and the scope of their responsibilities.
249
Table of Contents
Variable Components
The variable compensation components of AXA Equitable Life’s 2017 Total Compensation Program, the short-term incentive compensation program and equity-based awards, gave executives the opportunity to receive compensation at the median of the market if they met various corporate and individual financial and operational goals and to receive compensation above the median if they exceeded their goals. The variable compensation components measured and rewarded performance with short-term and long-term focuses.
The short-term incentive compensation program focused executives on annual corporate and business unit goals that, when attained, drive AXA’s global success. It also served as the primary means for differentiating, recognizing and most directly rewarding individual executives for their personal achievements and leadership based on both qualitative and quantitative results.
Equity-based awards were structured to reward long-term value creation. AXA performance share awards granted in 2017 will vest after four years. AXA stock options awarded in 2017 were intended to focus executives on a longer time horizon. They were granted with vesting schedules of five years and terms of 10 years to effectively align a portion of each executive’s compensation with the long-term financial success of AXA. AXA Equitable Life granted these awards because it was confident that the direct alignment of the long-term interests of the executives with those of AXA, combined with the multi-year vesting and performance periods of its equity-based awards, would promote executive retention, focus executives on gearing their performances to long-term value-creation strategies and discourage excessive risk-taking.
How 2017 Compensation Decisions Were Made
Role of the AXA Board of Directors
The global framework governing the 2017 executive compensation policies for AXA and its U.S. subsidiaries, including AXA Equitable Life, were set and administered at the AXA level by AXA’s Board of Directors. The AXA Board of Directors (i) reviewed the compensation policies applicable to executives of AXA worldwide, which were then adapted to local law, conditions and practices by the boards of directors and compensation committees of AXA’s subsidiaries, (ii) reviewed and approved all AXA equity-based compensation programs prior to their implementation and (iii) approved individual grants of equity-based awards.
The Compensation and Governance Committee of the AXA Board of Directors reviews annually the compensation of members of the AXA Management Committee, including Mr. Pearson. The Compensation and Governance Committee also recommended to the AXA Board of Directors the amount of equity-based awards to be granted to the AXA Management Committee members in 2017. The Compensation and Governance Committee is exclusively composed of directors determined to be independent by the AXA Board of Directors in accordance with the criteria set forth in the Corporate Governance Code for French listed companies.
Role of the Organization and Compensation Committee of the Board of Directors of AXA Equitable Life
Within the global framework of executive compensation policies that AXA established, direct responsibility for overseeing the development and administration of the 2017 executive compensation program for AXA Equitable Life fell to the Organization and Compensation Committee of the AXA Equitable Life Board of Directors (the “EQ OCC”). The EQ OCC consists of three members, all of whom were determined to be independent directors by the AXA Equitable Life Board of Directors under New York Stock Exchange standards as of February 15, 2018. In implementing AXA’s global compensation program at the entity level, the EQ OCC was aided by the Chief Executive Officer of AXA who, while not a formal member of the EQ OCC, is a member of the AXA Equitable Life Board of Directors and participates in the EQ OCC’s deliberations related to compensation issues and assists in ensuring coordination with AXA’s global compensation policies.
250
Table of Contents
The EQ OCC is primarily responsible for general oversight of compensation and compensation related matters, including reviewing new benefit plans, equity-based plans and the compensation practices of AXA Equitable Life to ensure they support AXA Equitable Life’s business strategy and meet the objectives set by AXA for its global compensation policy. Also, in accordance with New York Insurance Law, the EQ OCC is responsible for evaluating the performance of AXA Equitable Life’s principal officers and comparably paid employees (as determined under New York Insurance Law) and recommending their compensation, including their salaries and variable compensation, to the Board of Directors of AXA Equitable Life for its discussion and approval. As of February 15, 2018, Mr. Pearson, Mr. Malmström and Mr. Winikoff were principal officers and Mr. Hattem was a comparably paid employee.
The EQ OCC is also responsible for:
| • | reviewing all other AXA Equitable Life senior executive compensation arrangements; |
| • | receiving reports on succession planning for AXA Equitable Life executive management; |
| • | supervising the policies relating to compensation of AXA Equitable Life officers and employees; and |
| • | reviewing and approving corporate goals and objectives included in variable compensation arrangements and evaluating AXA Equitable Life executive management performance in light of those goals and objectives. |
Role of the Chief Executive Officer
As Chief Executive Officer of AXA Equitable Life, Mr. Pearson assisted the EQ OCC in its review of the 2017 total compensation of all the EQ Named Executive Officers except himself. Mr. Pearson provided the EQ OCC with his assessment of the performance of each EQ Named Executive Officer relative to the corporate and individual goals and other expectations set for the EQ Named Executive Officer for 2017. Based on these assessments, he then provided his recommendations for each EQ Named Executive Officer’s total compensation and the appropriate goals for each in 2018. However, the EQ OCC was not bound by his recommendations.
Other than the Chief Executive Officer, no Named Executive Officer played or will play a decision-making role in determining the 2017 compensation of any other Named Executive Officer.
Role of AXA Equitable Life Human Resources
AXA Equitable Life Human Resources supports the EQ OCC’s work on executive compensation matters and is responsible for many of the organizational and administrative tasks that underlie the compensation review and determination process and making presentations on various topics. Human Resources’ efforts in 2017 included, among other things:
| • | evaluating the compensation data from peer groups, national executive pay surveys and other sources for the EQ Named Executive Officers and other officers as appropriate; |
| • | gathering and correlating performance ratings and reviews for individual executive officers, including the EQ Named Executive Officers; |
| • | reviewing executive compensation recommendations against appropriate market data and for internal consistency and equity; and |
| • | reporting to, and answering requests for information from, the EQ OCC. |
Human Resources officers also coordinate and share information with their counterparts at AXA and provide input into AXA’s comprehensive review of the 2017 total compensation of AXA’s executives worldwide.
251
Table of Contents
Role of Compensation Consultant
Towers Watson was retained by AXA Equitable Life to serve as an executive compensation consultant in 2017. Towers Watson provided various services, including advising AXA Equitable Life management on issues relating to AXA Equitable Life’s executive compensation practices and providing market information and analysis regarding the competitiveness of AXA Equitable Life’s Total Compensation Program.
During 2017, Towers Watson performed the following specific services for AXA Equitable Life management:
| • | provided periodic updates on legal, accounting and other developments and trends affecting compensation and benefits generally and executive compensation specifically; |
| • | offered a competitive review of total compensation (including base salary, targeted and actual annual incentives, annualized value of long-term incentives, welfare and retirement benefits) against selected peer companies, covering specific groups of executive positions; and |
| • | assisted in analyzing general reports published by third-party national compensation consultants on corporate compensation and benefits. |
Also, during 2016, Towers Watson prepared a comparative review of the total compensation of Mr. Pearson against that received by chief executive officers at peer companies that was used in determining his 2017 target compensation.
Although AXA Equitable Life management has full authority to approve all fees paid to Towers Watson, determine the nature and scope of its services, evaluate its performance and terminate its engagement, the EQ OCC reviewed the services to be provided by Towers Watson in 2017 as well as the related fees. The total amount of fees paid to Towers Watson by AXA Equitable Life in 2017 for executive compensation services was approximately $11,958. We may also pay fees to Towers Watson from time to time for actuarial or other services unrelated to our compensation programs. During 2017, these fees totaled $1,457,407. AXA and other AXA affiliates may also pay fees to Towers Watson for various services. Specifically, AXA pays fees for services in connection with its comprehensive review of executive officer compensation.
Use of Competitive Compensation Data
Because AXA Equitable Life competes most directly for executive talent with large diversified financial services companies, AXA Equitable Life regards it as essential to regularly review the competitiveness of its Total Compensation Program for its executives to ensure that they are provided compensation opportunities that compare favorably with the levels of total compensation offered to similarly situated executives by peer companies. A variety of sources of compensation information are used to benchmark the competitive market for AXA Equitable Life executives.
252
Table of Contents
Primary Compensation Data Source
For all executives, AXA Equitable Life relies primarily on the Towers Watson U.S. Diversified Insurance Study of Executive Compensation (the “DIS”) for information to compare their total compensation to the total compensation reported for equivalent executive officer positions at peer companies. For the 2016 study (which was used in determining 2017 target compensation), the companies included:
| Aflac |
Lincoln Financial |
Principal Financial Group | ||
| Allstate |
Massachusetts Mutual |
Prudential Financial | ||
| AXA Equitable Life |
MetLife |
Securian Financial Group | ||
| CIGNA |
Nationwide |
Thrivent Financial for Lutherans | ||
| CNO Financial |
New York Life |
|||
| Genworth Financial |
Northwestern Mutual |
TIAA-CREF | ||
| Guardian Life |
OneAmerica Financial Partners |
Transamerica | ||
| Hartford Financial Services |
Pacific Life |
Unum Group | ||
| John Hancock |
Phoenix Companies |
Voya Financial Services |
Other Compensation Data Sources
The information in the DIS is supplemented with additional information from general surveys of corporate compensation and benefits published by various national compensation consulting firms. AXA Equitable Life also participates in surveys conducted by Mercer, McLagan Partners, Towers Watson and LOMA Executive Survey to benchmark both its executive and non-executive compensation programs.
All these information sources are employed to measure and compare actual pay levels not only on a total compensation basis but also by breaking down the Total Compensation Program component by component to review and compare specific compensation elements as well as the particular mixes of fixed versus variable, short-term versus long-term and cash versus equity-based compensation at peer companies. This information, as collected and reviewed by Human Resources, is submitted to the EQ OCC for review and discussion.
Pricing Philosophy
AXA Equitable Life’s compensation practices are designed with the aid of the market data to set the total target compensation of each executive at the median for total compensation with respect to the pay for comparable positions at peer companies. The analysis takes into account certain individual factors such as the specific characteristics and responsibilities of a particular executive’s position as compared to similarly situated executives at peer companies. Differences in the amounts of total compensation for the EQ Named Executive Officers in 2017 resulted chiefly from differences in each executive’s level of responsibilities, tenure, performance and appropriate benchmark data as well as general considerations of internal consistency and equity.
Components of The Total Rewards Program
AXA Equitable Life’s Total Rewards Program for executives in 2017 consisted of six components. These components included the three components of the Total Compensation Program (i.e., base salary, short-term incentive compensation and equity-based awards) as well as: (i) retirement, financial protection and other compensation and benefit programs, (ii) severance and change-in-control benefits and (iii) perquisites.
Base Salary
For executives, AXA Equitable Life believes that the primary purpose of base salary is to compensate the executives fairly based on the position held, the executive’s career experience, the scope of the position’s
253
Table of Contents
responsibilities and the executive’s own performance, all of which are reviewed with the aid of market survey data. Using this data, a 50th percentile pricing philosophy is maintained, comparing base salaries against the median for comparable salaries at peer companies, unless exceptional conditions require otherwise (for example, a base salary may include an additional amount in lieu of a housing or education allowance) or an executive’s experience and tenure warrant a lower initial salary with an adjustment to market over time. Once set, base salaries for executives are typically not increased, except to reflect a change in job responsibility, a sustained change in the market compensation for the position or a market adjustment for an executive whose initial base salary was set below the 50th percentile.
Mr. Pearson is the only EQ Named Executive Officer with an employment agreement. Under this agreement, Mr. Pearson’s employment will continue until he is age 65 unless the employment agreement is terminated earlier by either party on 30 days’ prior written notice. Mr. Pearson is entitled to a minimum rate of base salary of $1,225,000 per year, except that his rate of base salary may be decreased in the case of across-the-board salary reductions similarly affecting all AXA Equitable Life officers with the title of Executive Director or higher.
Other than Mr. Winikoff, none of the EQ Named Executive Officers received an increase in their annual rate of base salary in 2017. Mr. Winikoff received a salary increase of $40,000 to reflect the elimination of a fringe benefit. The amount of base salary earned by each EQ Named Executive Officer in 2017 was:
| Named Executive Officer |
Base Salary | |||
| Mr. Pearson |
$ | 1,250,114 | ||
| Mr. Malmström |
$ | 658,228 | ||
| Mr. Winikoff |
$ | 737,246 | ||
| Mr. Hattem |
$ | 609,333 | ||
The base salaries earned by the EQ Named Executive Officers in 2017, 2016 and 2015 are reported in the Summary Compensation Table included below.
Short-Term Incentive Compensation Program
Variable cash awards were available in 2017 for executives under the AXA Equitable Life Short-Term Incentive Compensation Program (the “STIC Program”).
The purpose of the STIC Program is to:
| • | align incentive awards with corporate strategic objectives and reward participants based on both company and individual performance; |
| • | enhance the performance assessment process with a focus on accountability; |
| • | establish greater compensation differentiation based on performance; |
| • | provide competitive total compensation opportunities; and |
| • | attract, motivate and retain top performers. |
The STIC Program awards are typically paid in March of each year, following review of each participant’s performance and achievements over the course of the preceding fiscal year. Awards can vary from year to year, and differ by participant, depending primarily on the business and operational results of AXA Financial R&P Operations, as measured by the performance objectives under the STIC Program, as well as the participant’s individual contributions to those results. No individual is guaranteed any award under the STIC Program, except for certain limited guarantees for new hires.
254
Table of Contents
Individual Targets
Initially, individual award targets of fixed dollar amounts are assigned to each STIC Program participant based on evaluations of competitive market data for his or her position. These individual award targets are reviewed each year and may be increased or decreased, but generally remain constant from year to year unless there has been a significant change in the level of the participant’s responsibilities or a proven and sustained change in the market compensation for the position.
Individual Payout Calculation
The amount of an EQ Named Executive Officer’s individual award under the 2017 STIC Program is determined by multiplying his STIC Program award target by a funding percentage based on the performance of both AXA and AXA Financial R&P Operations (the “Funding Percentage”) and by his “Individual Assessment Percentage” as further described below. The calculation is as follows:
Award Target * Funding Percentage * Individual Assessment Percentage = 2017 STIC Program Award
Funding Percentage—The Funding Percentage is determined by combining the individual performance percentages for AXA Financial R&P Operations and AXA which measure their performance against certain financial and other targets. For all of the EQ Named Executive Officers other than Mr. Pearson, the performance percentage for AXA Financial R&P Operations is weighted 90% and the performance percentage for AXA is weighted 10%. For Mr. Pearson, the performance percentage for AXA Financial R&P Operations is weighted 70% and the performance percentage for AXA is weighted 30%, reflecting his broader range of performance responsibilities within AXA worldwide as a member of the AXA Management Committee.
AXA Financial R&P Operations—To determine the performance percentage for AXA Financial R&P Operations, various performance objectives are established for AXA Financial R&P Operations, and a target is set for each one. Other than underlying earnings, each performance objective is separately subject to a 150% cap and a 50% cliff. For example, if a particular performance objective is weighted 15% for AXA Financial R&P Operations, 15% will be added to the overall performance percentage for AXA Financial R&P Operations if that target is met, regardless of AXA Financial R&P Operations’ performance on its other objectives. If the target for that performance objective is exceeded, the amount added to the overall performance percentage for AXA Financial R&P Operations will be increased up to a maximum of 22.5% (150% x 15%). If the target for the performance objective is not met, the amount added to the performance percentage will be decreased down to a threshold of 7.5% (50% x 15%). If performance is below the threshold for a performance objective, 0% will be added to AXA Financial R&P Operations’ overall performance percentage. Underlying earnings is subject to a 175% cap and 25% cliff, allowing for a wider range of results before hitting the cliff or cap. The performance objectives and targets are approved by the EQ OCC.
The following grid presents the targets and actual results for each of the performance objectives used to measure the performance of AXA Financial R&P Operations in 2017, along with their relative weightings. The performance objectives for AXA Financial R&P Operations and their relative weightings are standardized for AXA R&P companies in mature markets worldwide and, accordingly, are not measures calculated and presented in accordance with U.S. GAAP.
| AXA Financial R&P Operations Performance Objectives |
Weighting | Target(1) | Actual | |||||||||
| Underlying Earnings(2) |
25.0 | % | 936 | 962 | ||||||||
| Gross Written Premiums(3) |
20.0 | % | 3,317 | 3,303 | ||||||||
| New Business Value(4) |
20.0 | % | 426 | 475 | ||||||||
| Gross Expenses(5) |
20.0 | % | 1,276 | 1,274 | ||||||||
| Net Promoter Score Gap(6) |
||||||||||||
| Retirement |
7.5 | % | 13.8 | % | 13.1 | % | ||||||
| Life |
7.5 | % | 6.5 | % | 5.7 | % | ||||||
255
Table of Contents
| (1) | All numbers other than those stated in percentages are in millions of U.S. dollars. |
| (2) | “Underlying earnings” means adjusted earnings excluding net capital gains or losses attributable to stockholders. “Adjusted earnings” means net income before the impact of exceptional and discontinued operations, certain integration and restructuring costs, goodwill and other related intangibles and profit or loss on financial assets accounted for under the fair value option and derivatives. Underlying earnings and adjusted earnings are measured using International Financial Reporting Standards (“IFRS”) since AXA uses IFRS as its principal method of accounting. Note that, in addition to the underlying earnings of AXA Financial R&P Operations, this performance objective also includes the underlying earnings of ACS Life (since it is managed by AXA Equitable Life personnel) and AXA Financial. |
| (3) | “Gross Written Premiums” means gross premiums (first-year premiums plus renewal premiums) for pure life insurance protection business. |
| (4) | “New Business Value” means the value of new contracts issued during 2017. It consists of the present value of future profits after the costs of acquiring the business, after allowing for the time value of financial options and guarantees and the cost of capital and non-financial risks. It is calculated net of tax. |
| (5) | “Gross Expenses” means the total operating expenses of AXA Financial and AXA Financial R&P Operations excluding deferred acquisition costs, commissions and restructuring/exception items. Operating expenses include compensation (including equity plans), benefits and other expenses necessary to manage the business. |
| (6) | “Net Promoter Score Gap” means the excess of the Net Promoter Score for our retirement and life insurance businesses over the average Net Promoter Score of seven main competitors. Net Promoter Score is an industry standard metric established by a leading management consulting firm and is determined based on customer surveys that classify customers as “promoters” or “detractors” based on their answer to a question asking how likely they are to recommend their current provider to friends or family on a scale of 0-10. |
Since the performance objectives under the STIC Program are meant to cover only the key performance indicators for a year, there are generally no more than five objectives. The performance objectives and their relative weightings are determined based on AXA’s strategy and focus and they may change from year to year as different metrics may become more relevant. Underlying earnings is generally the most highly weighted performance objective, however, reflecting AXA’s belief that it is the strongest indicator of performance for a year.
Once set, the targets for each performance objective may not change during the course of the year except for exceptional circumstances, as determined by the AXA Management Committee. No adjustments will be made for large losses related to terrorist attacks or natural catastrophes or for market and regulatory changes.
AXA - AXA’s performance percentage is primarily based on underlying earnings per share (55%). Adjusted return on equity (15%), Gross Revenues-Protection and Health (15%) and customer experience tracking (15%) are also considered. For this purpose, “adjusted return on equity” means adjusted earnings (as defined above) divided by average stockholder’s equity excluding undated subordinated debt and other comprehensive income.
The following grid presents the targets and actual results for each of the performance objectives used to measure AXA’s performance in 2017.
| Target |
Actual | |||
| Underlying Earnings Per Share |
2.33 euro | 2.40 euro | ||
| Adjusted Return on Equity |
13.3% | 14.5% | ||
| Gross Revenues – Protection and Health |
49,946 million euro | 49,907 million euro | ||
| Customer Experience Tracking |
.9 – 2.9 | 1.4 |
Individual Assessment Percentage—An EQ Named Executive Officer’s Individual Assessment Percentage will be based on their individual performance and demonstrated leadership behaviors. As stated above, no
256
Table of Contents
participant is guaranteed his or her target award or any award under the STIC Program except for certain limited guarantees for new hires.
The EQ OCC reviewed the 2017 performance of each EQ Named Executive Officer as well as Management’s recommendations for each such EQ Named Executive Officer’s Individual Assessment Percentage and STIC Program award. Based on its subjective determination of each EQ Named Executive Officer’s performance, the EQ OCC made its recommendations as to the maximum STIC Program award for each EQ Named Executive Officer to the AXA Equitable Life Board of Directors. The AXA Equitable Life Board of Directors approved the final maximum award amounts for the EQ Named Executive Officers and delegated authority to the Chief Executive Officer of AXA to determine the final award amount for Mr. Pearson and to Mr. Pearson to determine the final award amounts for the other EQ Named Executive Officers.
In making its recommendations, the EQ OCC took into account the factors that it deemed relevant, including the accomplishments achieved in 2017 by the EQ Named Executive Officers and the Funding Percentage. Since the EQ Named Executive Officers are responsible for the success of each of AXA Equitable Life, AXA Financial and AXA Financial R&P Operations, the EQ OCC considered all related 2017 accomplishments. The EQ OCC also considered the EQ Named Executive Officers’ contributions to AXA worldwide. The accomplishments and contributions considered included:
| Named Executive Officer |
Accomplishments | |
| Mark Pearson | • Provided overall leadership for company strategy and activities related to this offering.
• Delivered on key financial goals, including earnings and productivity savings while continuing to set strong tone at the top for disciplined risk management.
• Drove favorable outcomes regarding industry regulatory matters including federal taxation, the DOL Rule and capital adequacy through service on Board of Directors of American Council of Life Insurers.
• Restructured Management governance framework and implemented executive management changes, including addition of the Implementation Management Office to oversee investments and strategic projects.
• Led company efforts to achieve customer satisfaction of 4.4 out of 5.0 across all business segments, resulting in the company’s receipt of the DALBAR Annuity Service Award in recognition of superior service for the seventh consecutive year.
• Continued to build a culture of inclusion, professional excellence and continuous learning, resulting in external recognitions for consecutive years from the Great Place to Work Institute, Human Rights Campaign and the Disability Equality Index. | |
| Anders Malmström | • Provided leadership for Finance strategy and activities related to this offering, including overseeing the preparation of historical and pro forma GAAP financials for Holdings and the development of non-GAAP reporting measures and serving as liaison to underwriters, ratings agencies and other external parties.
• Supervised several key initiatives to enhance existing Finance practices, including the development of a new hedging strategy, economic model and risk framework and the creation of new investment income, expense and equity allocation methodologies to better reflect business performance.
• Played key role in company’s efforts related to regulatory initiatives such as tax reform and the NAIC reserve and capital framework as well as efforts related to closing significant regulatory exams. | |
257
Table of Contents
| • Successfully led the strategic planning process in 2017, providing insight on margin and revenue streams for each business area, identifying mitigating actions to close the gap to targets and driving conversations with executive management and the Board of Directors. | ||
| Brian Winikoff | • Drove strong 2017 sales performance, increasing year-over-year growth and outperforming budget and the industry in key markets.
• Created a clear business strategy and implemented focused plans and processes across all business areas, resulting in successful execution of key initiatives.
• Successfully implemented several executive management changes, including consolidation of business leader functions, addition of talent in key areas and enhanced alignment of business support areas.
• Provided thought-leadership on short and long-term manufacturing and distribution strategies that will further improve sales and profitability while maintaining our position as a leader in key markets.
• Played a key role in leading the company’s and industry’s efforts through various regulatory changes, including cross-functional actions to prepare for the DOL Rule. | |
| Dave Hattem | • Provided leadership for the Law Department’s strategy and activities related to this offering, including drafting of the registration statement and amendments, obtaining required regulatory approvals and analysis and implementation of related corporate restructuring.
• Drove company strategy regarding significant regulatory proposals, including tax reform, the DOL Rule and the NAIC and NYDFS cyber initiatives and, as appropriate, developed compliance programs to comport with new rules (particularly the DOL Rule).
• Provided leadership on the company strategy related to the NYDFS Quinquennial and other regulatory examinations, none of which resulted in any significant adverse findings or enforcement proceedings.
• Oversaw the creation of the Financial Intelligence Unit within the Law Department, combining the Financial Crimes Office responsible for our anti-money laundering, anti-bribery and sanctions programs and the Financial Security Office responsible for the detection and prevention of external fraud, while providing leadership for the Law Department’s efficiencies efforts and relocation of positions strategy.
• Served as key advisor to Mr. Pearson regarding this offering and other strategic initiatives and Management Committee, corporate governance and Board matters. | |
No specific weight was assigned to any particular factor and all were evaluated in the aggregate to arrive at the recommended STIC Program award for each of the Named Executive Officers. Mr. Malmström and Mr. Hattem each received a percentage of their STIC Program award target that was greater than the Funding Percentage while Mr. Winikoff received a percentage of his STIC Program award target that was less than the Funding Percentage. Mr. Pearson received a STIC Program award equal to approximately 119% of his STIC Program award target.
258
Table of Contents
The following table reflects the 2017 STIC Program award targets and actual STIC Program awards for the EQ Named Executive Officers:
| Named Executive Officer |
Target Award | Actual Award | ||||||
| Mr. Pearson |
$ | 2,128,400 | $ | 2,526,000 | ||||
| Mr. Malmström |
$ | 800,000 | $ | 1,047,248 | ||||
| Mr. Winikoff |
$ | 900,000 | $ | 936,729 | ||||
| Mr. Hattem |
$ | 650,000 | $ | 788,119 | ||||
The STIC Program awards and bonuses earned by the EQ Named Executive Officers in 2017, 2016 and 2015 are reported in the Summary Compensation Table included below.
Equity-Based Awards
The purpose of equity-based awards granted to AXA Equitable Life’s executives in 2017 and prior years was to:
| • | align strategic interests of award recipients with those of AXA; |
| • | provide competitive total compensation opportunities; |
| • | focus on achievement of long-term strategic business objectives; and |
| • | attract, motivate and retain top performers. |
In 2017 and prior years, annual equity-based awards for executives were available under the umbrella of AXA’s global equity program. Equity-based awards were also granted from time to time to executives outside of AXA’s global equity program as part of a sign-on package or as a retention vehicle. The value of the equity-based awards granted in 2017 and prior years was linked to the performance of AXA’s stock. Prior to this offering, neither Holdings nor AXA Equitable Life sponsored any equity-based award programs.
Annual Awards Process
Annual equity-based awards granted under AXA’s global equity program in 2017 and prior years were subject to the oversight of the AXA Board of Directors, which approved all annual equity programs prior to their implementation and all individual grants. The AXA Board of Directors also set the size of the equity pool each year. The pools were allocated annually among AXA affiliates based on each affiliate’s contribution to AXA’s financial results during the preceding year and with consideration for specific local needs (e.g., market competitiveness, consistency with local practices, group development).
The AXA Board of Directors set the mix of equity-based awards for individual grants, which was standardized through AXA worldwide. Since 2004, there was a decreasing reliance on AXA stock options in equity-based awards. For example, in 2017, equity grants were awarded entirely in AXA performance shares, except for a group of approximately 150 senior executives (including the EQ Named Executive Officers) who continued to receive a portion of their grant in AXA stock options.
Each year, the EQ OCC submitted recommendations to the AXA Board of Directors with respect to annual equity-based awards for executives, taking into account the available equity pool allocation and based on a review of each executive’s potential future contributions, consideration of the importance of retaining the executive in his or her current position and a review of competitive market data relating to equity-based awards for similar positions at peer companies, as described above in the section entitled, “—Use of Competitive Compensation Data.” The AXA Board of Directors approved the individual grants as it deemed appropriate.
259
Table of Contents
Individual Targets
Individual equity-based award targets were initially assigned to each EQ Named Executive Officer other than Mr. Pearson based on evaluations of competitive market data for his position. These individual award targets are reviewed each year and may increase or decrease, but generally remain constant from year to year unless there is a significant change in the level of the EQ Named Executive Officer’s responsibilities or a proven and sustained change in the market compensation for the position. For Mr. Pearson, his equity-based award target was based on his actual award for the prior year.
2017 Annual Award Grants
Each EQ Named Executive Officer received an equity-based award grant on June 21, 2017. These grants involved a mix of two components: (1) AXA stock options granted under the AXA Stock Option Plan for AXA Financial Employees and Associates (the “AXA Stock Option Plan”) and (2) AXA performance shares granted under the 2017 AXA International Performance Shares Plan (the “2017 AXA Performance Shares Plan”).
The awards to the EQ Named Executive Officers were granted using U.S. dollar values. The U.S. dollar values for the EQ Named Executive Officers were allocated between AXA stock options and AXA performance shares in accordance with the mix determined by the AXA Board of Directors. For this purpose, the value of the AXA stock options and AXA performance shares granted were determined using a Black-Scholes pricing methodology which was based on assumptions which differ from the assumptions used in determining an option’s or performance share’s grant date fair value reflected in the Summary Compensation Table which is based on FASB ASC Topic 718.
The amounts granted to the EQ Named Executive Officers were as follows:
| Named Executive Officer |
AXA Stock Options |
AXA Performance Shares |
||||||
| Mr. Pearson |
170,004 | 97,144 | ||||||
| Mr. Malmström |
53,162 | 30,377 | ||||||
| Mr. Winikoff |
56,483 | 32,276 | ||||||
| Mr. Hattem |
53,162 | 30,377 | ||||||
2017 Stock Option Award Grants
The AXA stock options granted to the EQ Named Executive Officers on June 21, 2017 have a 10-year term and a vesting schedule of five years, with one-third of the grant vesting on each of the third, fourth and fifth anniversaries of the grant, provided that the last third will vest on June 21, 2022 only if the AXA ordinary share performs at least as well as the Stoxx Insurance Index (“SXIP Index”) over a specified period of at least three years. This performance condition applies to all of Mr. Pearson’s AXA stock options. The exercise price for the AXA stock options is 23.92 euro, which was the average of the closing prices for the AXA ordinary share on Euronext Paris SA over the 20 trading days immediately preceding June 21, 2017.
In the event of an EQ Named Executive Officer’s retirement, the AXA stock options continue to vest and may be exercised until the end of the term, except in the case of misconduct. Accordingly, since Mr. Hattem and Mr. Pearson are currently eligible to retire, these stock options will not be forfeited due to any service condition.
2017 Performance Share Award Grants
An AXA performance share is a “phantom” share of AXA stock that, once earned and vested, provides the right to receive an AXA ordinary share at the time of payment. Performance shares are granted unearned. Under the 2017 AXA Performance Shares Plan, the number of shares that is earned will be determined at the end of a three-year performance period, starting on January 1, 2017 and ending on December 31, 2019, by multiplying the
260
Table of Contents
number of shares granted by a performance percentage that is determined as described below. If no dividend is proposed for payment by the AXA Board of Directors to AXA’s stockholders for 2017 and/or 2018 and/or 2019, the performance percentage for the grant will be divided in half. The AXA performance shares granted to the EQ Named Executive Officers on June 21, 2017 have a cliff vesting schedule of four years.
The performance percentage for the 2017 AXA Performance Shares Plan initially will be determined based: (a) 40% on AXA’s performance with respect to adjusted earnings per share, (b) 50% on AXA Financial R&P Operations’ performance with respect to adjusted earnings and underlying earnings (each weighted 50%) and (c) 10% on AXA’s score on the DJSI World, a Dow Jones sustainability index which tracks the performance of the world’s sustainability leaders. A positive or negative adjustment of 5% will then be made to the performance percentage based on AXA’s relative performance against a selection of its peers with respect to total stockholder return. The components of the performance percentage and their targets were determined by the AXA Board of Directors based on their review of AXA’s strategic objectives, market practices and regulatory changes.
Generally, if performance targets are met, 100% of the AXA performance shares initially granted will be earned. Performance that exceeds the targets results in increases in the number of shares earned, subject to a cap of 130% of the initial number of shares. Performance that falls short of targets results in a decrease in the number of shares earned with a possible forfeiture of all shares. Since AXA uses IFRS as its principal method of accounting, AXA’s adjusted earnings per share and AXA Financial R&P Operations’ adjusted earnings and underlying earnings are calculated using IFRS. Accordingly, they are not measures calculated and presented in accordance with U.S. GAAP.
The settlement of 2017 AXA performance shares will be made in AXA ordinary shares on June 21, 2021. In the case of retirement, a participant is treated as if he or she continued employment until the settlement date. Accordingly, Mr. Hattem and Mr. Pearson will still receive a payout under the 2017 AXA Performance Shares Plan if they choose to retire prior to the end of the vesting period.
Detailed information on the AXA stock option and AXA performance share grants for each of the EQ Named Executive Officers in 2017 is reported in the 2017 Grants of Plan-Based Awards Table included below.
2017 Payouts from Prior Year Awards
In 2017, certain EQ Named Executive Officers received a payout under the 2014 AXA International Performance Shares Plan (the “2014 AXA Performance Shares Plan”). Under the 2014 AXA Performance Shares Plan, 50% of the AXA performance shares granted to a participant had a cliff vesting schedule of three years (first tranche) and the remaining 50% had a cliff vesting schedule of four years (second tranche).
The number of AXA performance shares earned was determined for the first tranche at the end of a two-year performance period starting on January 1, 2014 and ending on December 31, 2015 and for the second tranche at the end of a three-year performance period starting on January 1, 2014 and ending on December 31, 2016, by multiplying the number of AXA performance shares granted for the applicable tranche by a performance percentage determined based on the performance of AXA Group and AXA Financial R&P Operations over the applicable performance period. The performance percentage for the first tranche was 123.77% and the performance percentage for the second tranche was 122.92%.
Detailed information on the payouts of 2014 AXA performance shares in 2017 is reported in the 2017 Option Exercises and Stock Vested Table included below.
Other Compensation and Benefit Programs
AXA Equitable Life believes that a comprehensive benefits program which offers long-term financial support and security for all employees plays a critical role in attracting and retaining high caliber executives.
261
Table of Contents
Accordingly, all AXA Equitable Life employees, including executives, are offered a benefits program that includes group health and disability coverage, group life insurance and various deferred compensation and retirement benefits. In addition, AXA Equitable Life offers certain benefit programs for executives that are not available to non-executive employees. The overall program is periodically reviewed to ensure that the benefits it provides continue to serve business objectives and remain cost-effective and competitive with the programs offered by large diversified financial services companies.
Qualified Retirement Plans
AXA Equitable Life believes that qualified retirement plans encourage long-term service. Accordingly, the following qualified retirement plans are offered to eligible employees, including executives:
AXA Equitable 401(k) Plan (the “401(k) Plan”)
AXA Equitable Life sponsors the 401(k) Plan, a tax-qualified defined contribution plan, for its eligible employees, including executive officers. Eligible employees may contribute to the 401(k) Plan on a before tax, after-tax, or Roth 401(k) basis (or any combination of the foregoing), up to plan and tax law limits. The 401(k) Plan also provides participants with the opportunity to earn a discretionary profit sharing contribution and a company contribution. The discretionary profit sharing contribution for a calendar year is based on company performance for that year and ranges from 0% to 4% of annual eligible compensation (subject to tax law limits). Any contribution for a calendar year is expected to be made in the first quarter of the following year. A profit sharing contribution of 1% of annual eligible compensation was made for the 2017 plan year. The company contribution for a calendar year is based on the following formula and is subject to tax law limits: (i) 2.5% of eligible compensation up to the Social Security Wage Base ($127,200 in 2017) plus, (ii) 5.0% of eligible compensation in excess of the Social Security Wage Base, up to the qualified plan compensation limit ($270,000 in 2017). All of the EQ Named Executive Officers were eligible to participate in the 401(k) Plan for 2017.
AXA Equitable Retirement Plan (the “Retirement Plan”)
AXA Equitable Life sponsors the Retirement Plan, a tax-qualified defined benefit plan for eligible employees which was frozen effective December 31, 2013. The Retirement Plan provides for retirement benefits upon reaching age sixty-five and has provisions for early retirement, death benefits and benefits upon termination of employment for vested participants. It has a three-year cliff-vesting schedule. Mr. Pearson and Mr. Hattem participated in the plan prior to its freeze.
Prior to its freeze, the Retirement Plan provided a cash balance benefit whereby AXA Equitable Life established a notional account in the name of each Retirement Plan participant. The notional account was credited with deemed pay credits equal to 5% of eligible compensation up to the Social Security Wage Base plus 10% of eligible compensation above the Social Security Wage Base up to the qualified plan compensation limit. These notional accounts continue to be credited with deemed interest credits.
For certain grandfathered participants, the Retirement Plan provides benefits under a traditional defined benefit formula based on final average pay, estimated Social Security benefits and years of service. None of the Named Executive Officers are grandfathered participants.
Excess Plans
AXA Equitable Life believes that excess plans are an important component of competitive market-based compensation in both its peer group and generally. Accordingly, the following excess plan benefits are offered to eligible AXA Equitable Life employees, including executives:
Excess 401(k) Contributions
AXA Equitable Life provides excess 401(k) contributions for participants in the 401(k) Plan with eligible compensation in excess of the qualified plan compensation limit. These contributions are equal to 10% of the
262
Table of Contents
participant’s (i) eligible compensation in excess of the qualified plan compensation limit and (ii) voluntary deferrals to the AXA Equitable Life Post-2004 Variable Deferred Compensation Plan for Executives for the applicable year, and are made to accounts established for participants under the AXA Equitable Life Post-2004 Variable Deferred Compensation Plan for Executives. All the EQ Named Executive Officers were eligible to receive excess 401(k) contributions in 2017.
AXA Equitable Excess Retirement Plan (the “Excess Plan”)
AXA Equitable Life sponsors the Excess Plan, a nonqualified defined benefit plan for eligible employees which was frozen effective December 31, 2013. Prior to its freeze, the Excess Plan allowed eligible employees, including Mr. Pearson and Mr. Hattem, to earn retirement benefits in excess of what was permitted under the Code with respect to the Retirement Plan. Specifically, the Excess Plan permitted participants to accrue and be paid benefits that they would have earned and been paid under the Retirement Plan but for certain Code limits.
Voluntary Non-Qualified Deferred Compensation Plans
AXA Equitable Life believes that compensation deferral is a cost-effective method of enhancing the savings of executives. Accordingly, AXA Equitable Life sponsors the following plans:
The AXA Equitable Post-2004 Variable Deferred Compensation Plan for Executives (the “Post-2004 Plan”)
AXA Equitable Life sponsors the Post-2004 Plan which allows eligible employees to defer the receipt of certain compensation, including base salary and STIC Program awards. The amount deferred is credited to a bookkeeping account established in the participant’s name and participants may choose from a range of nominal investments according to which their accounts rise or decline. Participants annually elect the amount they want to defer, the date on which payment of their deferrals will begin and the form of payment. In addition, as mentioned above, excess 401(k) contributions are made to accounts established for eligible employees under the Post-2004 Plan. All of the EQ Named Executive Officers were eligible to participate in the Post-2004 Plan for 2017.
The AXA Equitable Variable Deferred Compensation Plan for Executives (the “VDCP”)
The VDCP is the predecessor plan to the Post-2004 Plan. Like the Post-2004 Plan, it allowed eligible employees to defer the receipt of compensation. To preserve its grandfathering from the provisions of Internal Revenue Code Section 409A (“Section 409A”), the VDCP was frozen in 2004 so that no amounts earned or vested after 2004 may be deferred under the VDCP. Section 409A imposes stringent requirements which covered nonqualified deferred compensation arrangements must meet to avoid the imposition of additional taxes, including a 20% additional income tax, on the amounts deferred under the arrangements. Mr. Hattem participated in the VDCP prior to its freeze in 2004.
Financial Protection
The AXA Equitable Executive Survivor Benefits Plan (the “ESB Plan”)
AXA Equitable Life sponsors the ESB Plan which offers financial protection to a participant’s family in the case of his or her death. Eligible employees may choose up to four levels of coverage and the form of benefit to be paid at each level. Each level provides a benefit equal to one times the participant’s eligible compensation and offers different coverage choices. Generally, the participant can choose between a life insurance death benefit and a deferred compensation benefit payable upon death at each level. All of the EQ Named Executive Officers were eligible to participate in the ESB Plan for 2017.
For additional information on 401(k) Plan benefits and excess 401(k) contributions for the Named Executive Officers as well as amounts voluntarily deferred by Mr. Hattem under the Post-2004 Plan and the VDCP, see the
263
Table of Contents
Summary Compensation Table and Nonqualified Deferred Compensation Table included below. For additional information on Retirement Plan, Excess Plan and ESB Plan benefits for the EQ Named Executive Officers, see the Pension Benefits Table included below.
Severance and Change in Control Benefits
AXA Equitable Life maintains severance pay arrangements to provide temporary income and other severance benefits to all employees following an involuntary termination of employment. Executive officers, including the EQ Named Executive Officers other than Mr. Pearson, are also eligible for additional severance benefits as described below. In addition, AXA Equitable Life offers certain limited change in control benefits to provide a moderate level of protection to employees to help reduce anxiety that may accompany a change in control.
The AXA Equitable Severance Benefit Plan (the “Severance Plan”)
AXA Equitable Life sponsors the Severance Plan to provide severance benefits to eligible employees whose jobs are eliminated for specific defined reasons. The Severance Plan generally bases temporary income payments to eligible employees on length of service or base salary. Payments are capped at the lesser of 52 weeks of base salary and $300,000. To obtain benefits under the Severance Plan, participants must execute a general release and waiver of claims against AXA Equitable Life and affiliates. For executive officers, the general release and waiver of claims typically includes non-competition and non-solicitation provisions.
The AXA Equitable Supplemental Severance Plan for Executives (the “Supplemental Severance Plan”)
AXA Equitable Life sponsors the Supplemental Severance Plan for officers at the level of Executive Director or above. The Supplemental Severance Plan is intended solely to supplement, and is not duplicative of, any severance benefits for which an executive may be eligible under the Severance Plan. The Supplemental Severance Plan provides that eligible executives will receive, among other benefits:
| • | Temporary income payments equal to 52 weeks’ of base salary, reduced by any temporary income payments for which the executive may be eligible under the Severance Plan; |
| • | Additional temporary income payments equal to the greater of: |
| • | The most recent short-term incentive compensation award paid to the executive; |
| • | The average of the three most recent short-term incentive compensation awards paid to the executive; and |
| • | The annual target short-term incentive compensation award for the executive for the year in which he or she receives notice of job elimination; |
| • | An additional year of participation in the ESB Plan; and |
| • | A lump sum payment equal to the sum of: (a) the executive’s short-term incentive compensation for the year in which the executive receives notice of job elimination, pro-rated based on the number of the executive’s full calendar months of service in that year and (b) $40,000. |
Mr. Pearson’s Employment Agreement
Mr. Pearson waived the right to receive any benefits under the Severance Plan or the Supplemental Severance Plan. Rather, his employment agreement provides that, if his employment is terminated by AXA Equitable Life prior to his attaining age 65 other than for cause or death, or Mr. Pearson resigns for “good reason,” Mr. Pearson will be entitled to certain severance benefits, including (i) severance pay equal to the sum of two years of salary and two times the greatest of: (a) Mr. Pearson’s most recent bonus, (b) the average of
264
Table of Contents
Mr. Pearson’s last three bonuses and (c) Mr. Pearson’s target bonus for the year in which termination occurred, (ii) a pro-rated bonus at target for the year of termination and (iii) a lump sum cash payment equal to the additional employer contributions that Mr. Pearson would have received under the 401(k) Plan and its related excess plan for the year of his termination if those plans provided employer contributions on his severance pay and all of his severance pay was paid in that year.
For this purpose, “good reason” includes an assignment of duties materially inconsistent with Mr. Pearson’s duties or authority or a material limitation of Mr. Pearson’s powers, the removal of Mr. Pearson from his positions, AXA Equitable Life requiring Mr. Pearson to be based at an office more than 75 miles from New York City, a diminution of Mr. Pearson’s titles, a material failure by the company to comply with the agreement’s compensation provisions, a failure of the company to secure a written assumption of the agreement by any successor company and a change in control of AXA Financial (provided that Mr. Pearson delivers notice of termination within 180 days after the change in control). The severance benefits are contingent upon Mr. Pearson releasing all claims against AXA Equitable Life and its affiliates and his entitlement to severance pay will be discontinued if he provides services for a competitor. Also, in the event of a termination of Mr. Pearson’s employment by AXA Equitable Life without cause or Mr. Pearson’s resignation due to a change in control, Mr. Pearson’s severance benefits will cease after one year if certain performance conditions are not met for each of the two consecutive fiscal years immediately preceding the year of termination.
Mr. Winikoff’s Severance Arrangement
Mr. Winikoff’s severance arrangement with the company provides that, if Mr. Winikoff’s employment is terminated by the company without “cause” or by Mr. Winikoff for “good reason”:
| • | any outstanding RSUs granted to Mr. Winikoff would immediately vest and be paid out in cash on their otherwise applicable payment dates and |
| • | he would be eligible to receive a payment equal to (i) two times the sum of his annual base salary plus his STIC Program award target for the year in which his employment is terminated, reduced by (ii) any severance pay for which he may be otherwise eligible under the Severance Plan or the Supplemental Severance Plan. This payment would be contingent on all other terms and conditions of the Severance Plan and Supplemental Severance Plan, including the execution of a general release and waiver of claims against AXA Equitable Life and affiliates. |
For this purpose, “good reason” includes: (a) relocation of his position to a work site that is more than 35 miles away from 1290 Avenue of the Americas, New York City, (b) a material reduction in his compensation (other than in connection with, and substantially proportionate to, reductions by the company of the compensation of other similarly situated senior executives), (c) a material diminution in his duties, authority or responsibilities and (d) a material change in the lines of reporting such that he no longer reports to the company’s President and Chief Executive Officer.
“Cause” is defined in Mr. Winikoff’s severance arrangement as: (i) failure or refusal to perform his duties or responsibilities, which failure is not cured within 30 days written notice, (ii) gross negligence or misconduct , which gross negligence or misconduct has caused harm or damage to the business, affairs or reputation of AXA Equitable Life or any of its affiliates, (iii) commission of, conviction of, or plea of nolo contedere to, any crime involving moral turpitude or any felony or (iv) breach of the non-solicitation obligations in his severance arrangement, which breach is not cured within 10 days written notice. Pursuant to his severance arrangement, Mr. Winikoff is subject to a one-year post-termination employee non-solicitation covenant.
Change in Control Benefits
Change in control benefits are provided for stock options granted under the Stock Option Plan. Under that plan, if there is a change in control of AXA Financial, all stock options will become immediately exercisable for their term regardless of the otherwise applicable exercise schedule.
265
Table of Contents
Change in control benefits are not provided for performance shares granted under the AXA Performance Share Plan. Although participants forfeit all of their performance shares upon a change in control, a change in control will not be deemed to occur for purposes of the Performance Share Plan unless AXA ceases to own at least 10% of the capital or voting rights of Holdings.
Mr. Pearson’s employment agreement also provides for change in control benefits as described above in “—Mr. Pearson’s Employment Agreement.”
None of the change in control provisions above will be triggered by this offering.
For additional information on severance and change in control benefits for the Named Executive Officers, see “—Potential Payments Upon Termination of Change in Control” below.
Perquisites
Executive officers receive limited perquisites. Specifically, executive officers may use a car and driver for personal purposes from time to time and may occasionally bring spouses and guests on certain flights otherwise being taken for business reasons. Also, financial planning and tax preparation services are provided to help ensure their peace of mind so that they are not unnecessarily distracted from focusing on the company’s business.
Pursuant to his employment agreement, Mr. Pearson is entitled to unlimited personal use of a car and driver, two business class trips to the United Kingdom per year with his spouse, expatriate tax services, a company car for his personal use, excess liability insurance coverage and repatriation costs.
The incremental costs of perquisites for the EQ Named Executive Officers during 2017 are included in the column entitled “All Other Compensation” in the Summary Compensation Table included below.
Other Compensation Policies
Clawbacks
In the event an individual’s employment is terminated for cause, all AXA stock options granted under the AXA Stock Option Plan held by the individual are forfeited as of the date of termination. In addition, if an individual retires and induces others to leave the employment of an AXA affiliate, misuses confidential information learned while in the employ of an AXA affiliate or otherwise acts in a manner that is substantially detrimental to the business or reputation of any AXA affiliate, all outstanding stock options held by the individual will be forfeited.
Share Ownership Policy
Holdings does not currently have any stock ownership guidelines. However, any executives who are subject to AXA’s stock ownership policy as members of AXA’s Management Committee are required to meet AXA’s requirements for holding AXA stock. Those requirements are expressed as a multiple of base salary, with members of AXA’s Management Committee (such as Mr. Pearson) required to hold the equivalent of their base salary multiplied by two.
Derivatives Trading and Hedging Policies
The AXA Financial Group’s reputation for integrity and high ethical standards in the conduct of its affairs is of paramount importance to it. To preserve this reputation, all employees of the AXA Financial Group, including executive officers, are subject to the AXA Financial Insider Trading Policy. This policy prohibits, among other items, all short sales of securities of AXA and its publicly-traded subsidiaries (including AB Holding) and any
266
Table of Contents
hedging of equity compensation awards (including stock option, performance share or similar awards) or the securities underlying those awards. Members of AXA’s Management Committee must pre-clear with the AXA General Counsel any derivatives transactions with respect to AXA securities and/or the securities of other AXA publicly-traded subsidiaries.
Impact of Accounting and Tax Rules
Code Section 162(m) limits tax deductions relating to executive compensation of certain executives of publicly held companies. For taxable years ended prior to this offering, neither Holdings nor any of its subsidiaries, including AXA Equitable Life, were deemed to be publicly held for purposes of Code Section 162(m). Accordingly, these limitations were not applicable to the executive compensation program described above and were not taken into consideration in making compensation decisions. For 2018 and future years, our Compensation Committee will review and consider the deductibility of executive compensation under Internal Revenue Code Section 162(m), taking into account the changes to Code Section 162(m) effective for taxable years after 2017. However, in light of these changes, it is expected that our Compensation Committee will authorize compensation payments that are not deductible for federal income tax purposes when the committee believes that such payments are appropriate to attract, retain and incentivize executive talent.
AXA Equitable Life’s nonqualified deferred compensation arrangements that are subject to Section 409A are designed to comply with the requirements of Section 409A to avoid additional income taxes.
Accounting and other tax impacts not discussed above are also considered in the design of equity-based award programs.
COMPENSATION DISCUSSION AND ANALYSIS – MR. BERNSTEIN
Compensation Program Overview
The intellectual capital of its employees is collectively the most important asset of AB. AB invests in people—its hires qualified people, trains them, encourages them to give their best thinking to the firm and its clients, and compensates them in a manner designed to motivate, reward and retain them while aligning their interests with the interests of holders of AB Holding Units and AB Units (collectively, the “Unitholders”).
AB structures its executive compensation programs with the intent of enhancing firm-wide and individual performance and Unitholder value.
AB is also focused on ensuring that its compensation practices are competitive with industry peers and provide sufficient potential for wealth creation for its executives and employees generally, which AB believes will enable it to meet the following key compensation goals:
| • | attract, motivate and retain highly-qualified executive talent; |
| • | reward prior year performance; |
| • | incentivize future performance; |
| • | recognize and support outstanding individual performance and behaviors that demonstrate and foster AB’s culture of “Relentless Ingenuity,” which includes the core competencies of relentlessness, ingeniousness, collaboration and accountability; and |
| • | align its executives’ long-term interests with those of Unitholders and clients. |
Compensation Elements
AB utilizes a variety of compensation elements to achieve the goals described above, consisting of base salary, annual short-term incentive compensation awards (cash bonuses), a long-term incentive compensation award program, a defined contribution plan and certain other benefits, each of which are discussed below.
267
Table of Contents
Base Salaries
Base salaries comprise a relatively small portion of the total compensation of AB’s executives. AB considers individual experience, responsibilities and tenure with the firm when determining the narrow range of base salaries paid to its executives.
Annual Short-Term Incentive Compensation Awards (Cash Bonuses)
AB provides executives with annual short-term incentive compensation awards in the form of cash bonuses.
AB believes that annual cash bonuses, which generally reflect individual performance and the firm’s current year financial performance, provide a short-term retention mechanism for executives because such bonuses typically are paid during the last week of the year.
Long-Term Incentive Compensation Awards
A substantial portion of long-term incentive compensation awards for executives generally is denominated in restricted AB Holding Units. AB uses this structure to align its executives’ long-term interests directly with the interests of Unitholders and indirectly with the interests of clients, as strong performance for clients generally contributes directly to increases in assets under management and improved financial performance for the firm.
AB believes that annual long-term incentive compensation awards provide a long-term retention mechanism for executives because such awards generally vest ratably over four years.
An award recipient who resigns or is terminated without cause continues to vest in the recipient’s long-term incentive compensation award if the award recipient complies with certain agreements and restrictive covenants set forth in the applicable award agreement, including restrictions on competition, restrictions on employee and client solicitation, and a claw-back for failing to follow existing risk management policies. As such, for accounting purposes, there is no employee service requirement and awards are fully expensed when granted. As used in this Executive Compensation section, “vest” refers to the time at which the awards are no longer subject to forfeiture for breach of these restrictions or risk management policies, which we discuss further below in “Consideration of Risk Matters in Determining Compensation.”
Prior to vesting, distributions of the restricted AB Holding Units underlying an award are not permitted. Upon vesting, the AB Holding Units underlying an award are distributed unless the award recipient has, in advance, voluntarily elected to defer receipt to future periods. Quarterly cash distributions on vested and unvested restricted AB Holding Units are paid to award recipients when paid to Unitholders generally.
Defined Contribution Plan
U.S. employees of AB, including Mr. Bernstein, are eligible to participate in the Profit Sharing Plan for Employees of AB (as amended and restated as of January 1, 2015 and as further amended as of January 1, 2017, the “Profit Sharing Plan”), a tax-qualified retirement plan. The Compensation Committee of the AB Board of Directors (the “AB Compensation Committee”) determines the amount of company contributions (both the level of annual matching by the firm of an employee’s pre-tax salary deferral contributions and the annual company profit sharing contribution, if any).
For 2017, the AB Compensation Committee determined that employee deferral contributions would be matched on a dollar-for-dollar basis up to 5% of eligible compensation and that there would be no profit sharing contribution.
Other Benefits
AB pays the premiums associated with life insurance policies purchased on behalf of its executives.
268
Table of Contents
Overview of Mr. Bernstein’s Compensation
On May 1, 2017, Mr. Bernstein, the General Partner and AB entered into an agreement (the “SB Employment Agreement”) pursuant to which Mr. Bernstein is serving as AB’s President and CEO until May 1, 2020, provided that the term of employment shall automatically extend for one additional year on May 1, 2020 and each anniversary thereafter, unless the SB Employment Agreement is terminated in accordance with its terms (“Employment Term”).
The terms of the SB Employment Agreement were the result of arm’s length negotiations between Mr. Bernstein and senior executives at AXA, AB’s parent company and majority Unitholder. The AB Board of Directors then approved the CEO Employment Agreement after having considered, among other things, the compensation package provided to Mr. Bernstein’s predecessor, the 2016 and 2017 compensation of AB’s other executive officers and Mr. Bernstein’s compensation at his former employer.
Compensation Elements
Base Salary
Mr. Bernstein’s annual base salary under the CEO Employment Agreement is $500,000. This amount is consistent with AB’s policy to keep base salaries of executives and other highly-compensated employees low in relation to total compensation. Any future increase to Mr. Bernstein’s base salary is entirely in the discretion of the AB Compensation Committee.
Cash Bonus
Under the SB Employment Agreement, Mr. Bernstein was entitled to, and received, a cash bonus of $3,000,000 in 2017. During each subsequent year of the Employment Term, he is entitled to be paid a cash bonus at a target level of $3,000,000, subject to review and increase from time to time by the AB Compensation Committee, in its sole discretion.
Restricted AB Holding Units
On May 16, 2017, in connection with the commencement of Mr. Bernstein’s employment, Mr. Bernstein was granted restricted AB Holding Units with a grant date fair value of $3,500,003, or 164,706 restricted AB Holding Units (“SB Sign-On Grant”) which, subject to accelerated vesting upon circumstances described in the SB Employment Agreement, vest ratably on each of the first four anniversaries of May 1, 2017, commencing May 1, 2018, provided, with respect to each installment, Mr. Bernstein continues to be employed by AB on the vesting date. Also, subject to accelerated delivery of the SB Sign-On Grant upon circumstances described in the SB Employment Agreement, the entire SB Sign-On Grant, minus any AB Holding Units withheld to cover applicable taxes, will be delivered to Mr. Bernstein as promptly as possible after May 1, 2021. Mr. Bernstein will receive the cash distributions payable with respect to the unvested portion of the SB Sign-On Grant and the vested but undelivered portion of the SB Sign-On Grant on the same basis as cash distributions are paid to AB Holding Unitholders generally.
Commencing in 2018 and during the remainder of the Employment Term, Mr. Bernstein will be eligible to receive annual equity awards with a grant date fair value of $3,500,000, subject to review and increase from time to time by the AB Compensation Committee in its sole discretion, in accordance with AB’s compensation practices and policies generally applicable to the firm’s executives as in effect from time to time.
A substantial portion of Mr. Bernstein’s 2017 compensation consists of, and his annual compensation throughout the Employment Term will continue to substantially consist of, restricted AB Holding Unit awards. Accordingly, his long-term interests are, and will continue to be, aligned directly with the interests of Unitholders and indirectly with the interests of clients. In this connection, strong performance for clients generally contributes directly to increases in assets under management and improved financial performance for the firm.
269
Table of Contents
Perquisites and Benefits
Under the SB Employment Agreement, Mr. Bernstein is eligible to participate in all benefit plans available to executives and for his safety and accessibility, a company car and driver for personal and business use.
Severance and Change in Control Benefits
The SB Employment Agreement contains severance and change-in-control provisions which are highlighted below and also described in detail under the heading “Potential Payments upon Termination or Change in Control”. We believe that these severance and change-in-control provisions assist in retaining Mr. Bernstein and in the event of a change in control, provide protection to Mr. Bernstein so he is not distracted by personal or financial situations at a time when AB needs him to remain focused on his responsibilities.
If Mr. Bernstein is terminated without cause or resigns for good reason and he signs and does not revoke a waiver and release of claims, he will receive the following:
| • | a cash payment equal to the sum of (a) his current base salary and (b) bonus opportunity amount; |
| • | a pro rata bonus based on actual performance for the fiscal year in which the termination occurs; |
| • | immediate vesting of any outstanding equity awards; |
| • | delivery of AB Holding Units in respect of the SB Sign-On Grant (subject to any withholding requirements); |
| • | monthly payments equal to the cost of COBRA coverage for the COBRA coverage period; and |
| • | following the COBRA coverage period, access to participation in AB’s medical plans as in effect from time to time at Mr. Bernstein’s (or his spouse’s) sole expense. |
If during the 12 months following a change in control, Mr. Bernstein is terminated without cause or resigns for good reason, in addition to the amounts described above, he will receive a cash payment equal to three times the sum of (a) his current base salary and (b) bonus opportunity amount (provided that if the change in control occurs on or after May 1, 2018, the sum is multiplied by two).
In the event of a change in control or in the event that Mr. Bernstein’s employment is terminated because the SB Employment Agreement is not renewed (other than for cause), his SB Sign-On Grant will immediately vest and AB Holding Units in respect of any such award will be delivered by AB to him.
In the event any payments constitute “golden parachute payments” within the meaning of Section 280G of the Code and would be subject to an excise tax imposed by Section 4999, such payments will be reduced to the maximum amount that does not result in the imposition of such excise tax, but only if such reduction results in Mr. Bernstein receiving a higher net-after tax amount than he would receive absent such reduction. If a change in control occurs prior to January 1, 2020, to the extent that payments to Mr. Bernstein would be subject to the excise tax under Section 4999 of the Code, Mr. Bernstein will be entitled to a gross-up payment to ensure that he will retain an amount equal to the excise tax imposed upon the payments, but if the payments do not exceed 110% of the statutory limit imposed by Section 280G of the Code, the payments will be reduced to the maximum amount that does not result in the imposition of such excise tax.
Mr. Bernstein is subject to a confidentiality provision, in addition to covenants with respect to noncompetition during his employment and six months thereafter and non-solicitation of customers and employees for twelve months following his termination of employment.
A change in control is defined as, among other things:
| • | AXA Financial and its majority-owned subsidiaries ceasing to control the election of a majority of the AB Board of Directors; or |
| • | AB Holding, or any successor thereto, ceasing to be a publicly traded entity. |
270
Table of Contents
Mr. Bernstein negotiated the severance and change-in-control provisions to have the security and flexibility to focus on the business and preserve the value of his long-term incentive compensation. The AB Board of Directors and AXA determined that these provisions were reasonable and appropriate because they were necessary to recruit and retain Mr. Bernstein and provided Mr. Bernstein with effective incentives for future performance. The AB Board of Directors and AXA determined to limit the applicability of the excise tax gross-up provision since the application of the excise tax is more burdensome on newly hired employees.
The AB Board of Directors and AXA also concluded that the change-in-control and termination provisions in the SB Employment Agreement fit within AB’s overall compensation objectives because these provisions, which align with AB’s goal of providing its executives with effective incentives for future performance, also:
| • | permitted AB to recruit and retain a highly-qualified CEO; |
| • | aligned Mr. Bernstein’s long-term interests with those of AB’s Unitholders and clients; |
| • | were consistent with AXA’s and the AB Board of Directors’ expectations with respect to the manner in which AB and AB Holding would be operated during Mr. Bernstein’s tenure; and |
| • | were consistent with the AB Board of Directors’ expectations that Mr. Bernstein would not be terminated without cause and that no steps would be taken that would provide him with the ability to terminate the agreement for good reason. |
The AB Compensation Committee
The AB Compensation Committee has general oversight of compensation and compensation-related matters, including:
| • | determining cash bonuses; |
| • | determining contributions and awards under incentive plans or other compensation arrangements (whether qualified or non-qualified) for employees of AB and its subsidiaries, and amending or terminating such plans or arrangements or any welfare benefit plan or arrangement or making recommendations to the AB Board of Directors with respect to adopting any new incentive compensation plan, including equity-based plans; and |
| • | reviewing and approving the compensation of the CEO, evaluating his performance, and determining and approving his compensation level based on this evaluation. |
Other Compensation-Related Matters
Code Section 162(m) is not applicable to either AB or AB Holding.
POST-OFFERING EXECUTIVE COMPENSATION INFORMATION
Post-Offering Compensation Philosophy
Executives Employed by AXA Equitable Life
We intend to implement a comprehensive executive compensation program for AXA Equitable Life employees following the offering with core principles consistent with the philosophy of AXA Equitable Life’s 2017 executive compensation program. Specifically, our overriding goal will be to attract, retain and motivate top performers. To achieve our goal, we will foster a pay-for-performance management culture by:
| • | providing total target compensation opportunities competitive with the median total compensation available at our primary competitors; |
| • | making performance-based variable compensation the principal component of executive compensation; |
271
Table of Contents
| • | setting performance objectives and targets for variable compensation that provide the opportunity to earn above-median compensation by achieving above-target results and that result in below-median compensation for below-target results; |
| • | establishing equity-based arrangements that ensure a financial stake in the equity value of the Company; and |
| • | structuring compensation packages and outcomes to foster internal equity. |
The primary differences between our executive compensation program following the offering and AXA Equitable Life’s 2017 executive compensation program will be driven by our intention to ensure our executives are fully aligned to the success of Holdings. This includes establishing:
| • | performance objectives for variable compensation that reflect the most critical business objectives driving Holdings’ long-term sustainable growth (rather than AXA’s strategy and focus); |
| • | equity-based arrangements that ensure a financial stake in the equity value of Holdings (rather than AXA); and |
| • | ownership requirements for executives based on Holdings’ stock. |
We intend to design our plans and policies in accordance with U.S. best practices.
Executives Employed by AB
The compensation of Mr. Bernstein and other executives who are employed by AB will continue to be governed by the philosophy, goals and principal components of AB’s executive compensation programs as determined by the AB Board of Directors and the AB Compensation Committee.
Post-Offering Compensation Plans
Short-Term Incentive Compensation Plan
Prior to the settlement of this offering, we intend to adopt the AXA Equitable Holdings, Inc. Short-Term Incentive Compensation Plan (the “STIC Plan”). The STIC Plan will allow the Compensation Committee or the Board to establish performance goals and other terms and conditions applicable to annual incentive awards for our employees. Awards under the STIC Plan will be payable in cash, shares of our common stock or stock-based awards in any form available under our equity incentive plan, or a combination thereof. We may cancel, reduce or require an employee to forfeit any awards granted under the STIC Plan or require an employee to reimburse and disgorge to us any amounts received pursuant to awards granted under the STIC Plan, to the extent permitted or required by applicable law, regulation or policy in effect on or after the effective date of the STIC Plan.
Omnibus Equity Plan
Our board of directors and our stockholders have approved the AXA Equitable Holdings, Inc. 2018 Omnibus Incentive Plan, or the “Omnibus Incentive Plan,” which will be effective on the day prior to the effective date of the registration statement of which this prospectus forms a part, pursuant to which we will make grants of long-term equity incentive compensation to our directors, officers and other employees. The following are the material terms of the Omnibus Incentive Plan, which is qualified by reference to the full text of the Omnibus Incentive Plan.
Administration. Our board of directors has the authority to interpret the terms and conditions of the Omnibus Incentive Plan, to determine eligibility for and terms of awards for participants and to make all other determinations necessary or advisable for the administration of the Omnibus Incentive Plan. The board of directors may delegate its authority to a subcommittee. The board of directors, or the applicable subcommittee, is referred to below as the “Administrator.” To the extent consistent with applicable law, the Administrator may further delegate matters involving administration of the Omnibus Incentive Plan to our Chief Executive Officer or other of our officers. In addition, subcommittees may be established to the extent necessary to comply with Rule 16b-3 under the Exchange Act.
272
Table of Contents
Eligible Award Recipients. Our directors, employees and financial professionals are eligible to receive awards under the Omnibus Incentive Plan.
Awards. Awards under the Omnibus Incentive Plan may be made in the form of stock options, which may be either incentive stock options or non-qualified stock options; restricted stock; restricted stock units; performance shares; performance units; stock appreciation rights, or “SARs”; dividend equivalents; and other stock-based awards. Cash awards may also be granted under the Plan as annual or long-term incentives.
Shares Subject to the Omnibus Incentive Plan. Subject to adjustment as described below, the aggregate number of shares of common stock available for issuance under the Omnibus Incentive Plan will be equal to 5,882,352 shares. Shares issued under the Omnibus Incentive Plan may be authorized but unissued shares or shares reacquired by us. All of the shares under the Omnibus Incentive Plan may be granted as incentive stock options within the meaning of the Code.
Any shares covered by an award, or portion of an award, granted under the Omnibus Incentive Plan that are forfeited, canceled, expired or otherwise terminated for any reason will again be available for the grant of awards under the Omnibus Incentive Plan. Additionally, any shares tendered or withheld to satisfy the grant or exercise price or tax withholding obligations pursuant to any award under the Omnibus Incentive Plan, and the shares subject to any award that is settled in cash, will again be available for issuance. The Omnibus Incentive Plan permits us to issue replacement awards to employees of companies acquired by us, but those replacement awards would not count against the share maximum listed above.
Director Limits. With respect to any period from one annual meeting of shareholders to the next following annual meeting of shareholders, the fair market value of shares subject to awards granted to any non-employee director, and the cash paid to any non-employee director, may not exceed $300,000 in the aggregate for any such non-employee director who is serving as chairman of the board of directors and $500,000 in the aggregate for any other such non-employee director.
Terms and Conditions of Options and Stock Appreciation Rights. An “incentive stock option” is an option that meets the requirements of Section 422 of the Code, and a “non-qualified stock option” is an option that does not meet those requirements. A SAR is the right of a participant to a payment, in shares of common stock, or such other form determined by the Administrator, equal to the amount by which the market value of a share of common stock exceeds the exercise price of the stock appreciation right. An option or SAR granted under the Omnibus Incentive Plan will be exercisable only to the extent that it is vested on the date of exercise. Each option and SAR will vest and become exercisable according to the terms and conditions determined by the Administrator. Options and SARs will vest ratably in equal annual installments over a three-year period on each of the first three anniversaries of the grant date unless otherwise determined by the Administrator. Unless otherwise determined by the Administrator, no option or SAR may be exercisable more than ten years from the grant date. SARs may be granted to participants in tandem with options or separately.
The exercise price per share under each non-qualified option and SAR granted under the Omnibus Incentive Plan may not be less than 100% of the fair market value of our common stock on the option grant date. The Omnibus Incentive Plan includes a general prohibition on the repricing of out-of-the-money options and SARs without shareholder approval.
Terms and Conditions of Restricted Stock and Restricted Stock Units. Restricted stock is an award of common stock on which certain restrictions are imposed over specified periods that subject the shares to a substantial risk of forfeiture. A restricted stock unit is a unit, equivalent in value to a share of common stock, credited by means of a bookkeeping entry in our books to a participant’s account, which is settled after vesting in stock or cash, as determined by the Administrator. Subject to the provisions of the Omnibus Incentive Plan, our Administrator will determine the terms and conditions of each award of restricted stock or restricted stock units,
273
Table of Contents
including the restricted period for all or a portion of the award, and the restrictions applicable to the award. Restricted stock and restricted stock units will vest based on a period of service specified by our Administrator, the occurrence of events specified by our Administrator or both. Unless otherwise determined by the Administrator, restricted stock units granted under the Omnibus Incentive Plan that vest solely based on the continued service of the participant will vest ratably in equal annual installments over a three-year period, on each of the first three anniversaries of the grant date. Restricted stock units granted under the plan will receive dividend equivalents settled in shares of our common stock unless otherwise determined by the Administrator.
Terms and Conditions of Performance Shares and Performance Units. A performance share is a grant of a specified number of shares of common stock, or a right to receive a specified (or formulaic) number of shares of common stock after the date of grant, subject to the achievement of predetermined performance conditions. A performance unit is a unit, having a specified cash value, that represents the right to receive a share of common stock or cash if performance conditions are achieved. Vested performance units may be settled in cash, stock or a combination of cash and stock, at the discretion of the Administrator. Performance shares and performance units will vest based on the achievement of performance goals during the performance cycle established by the Administrator, and such other conditions, restrictions and contingencies as the Administrator may determine. Unless otherwise determined by the Administrator, performance shares and performance units granted under the Omnibus Incentive Plan will vest at the end of a three-year performance cycle, subject to achievement of the applicable performance goals. Performance shares and performance units granted under the plan will receive dividend equivalents settled in shares of our common stock unless otherwise determined by the Administrator.
Other Stock-Based Awards. The Administrator may make other equity-based or equity-related awards not otherwise described by the terms of the Omnibus Incentive Plan, including fully vested stock awards.
Dividend Equivalents. A dividend equivalent is the right to receive payments in cash or in stock, based on dividends with respect to shares of stock. Dividend equivalents may be granted to participants in tandem with another award or as freestanding awards.
Termination of Employment. Except as otherwise set forth in an award agreement, outstanding awards under the Omnibus Incentive Plan will be treated as follows in the event of a termination of employment:
| • | Termination for cause. In the event of a participant’s termination for “cause” (as defined in the Omnibus Incentive Plan), all options and SARs, whether vested or unvested, and all other awards that are unvested or unpaid will immediately be forfeited and canceled. |
| • | Termination due to death. In the event of a participant’s termination due to death, all options and SARs, whether or not exercisable, will become exercisable in full and may be exercised for up to one year after the participant’s death, and all other awards will immediately vest in full, and any such restricted stock units and performance awards will be settled in shares of common stock. The vesting of performance awards upon a termination due to death will be based on target levels of performance. |
| • | Termination due to disability. In the event of a participant’s termination due to disability, all awards will remain outstanding and will vest in accordance with the terms set forth in the applicable award agreement. All options and SARs that are vested and exercisable as of the participant’s termination for disability or that vest and become exercisable following a participant’s termination for disability will be exercisable for up to five years following the participant’s termination due to disability. |
| • | Termination due to a qualifying termination. In the event of a participant’s “qualifying termination” (as defined below), any awards granted in the one-year period prior to such qualifying termination will be immediately forfeited and canceled, and any awards granted after such one-year period will remain outstanding and will vest in accordance with the terms set forth in the applicable award agreement (including, for performance awards, subject to the attainment of the applicable performance goals). All options and SARs that are vested and exercisable as of the date of the participant’s qualifying termination or that vest and become exercisable following a participant’s qualifying termination will be exercisable for up to five years following the date of the qualifying termination. For this purpose, a “qualifying termination” mean a voluntary termination or an involuntary termination without cause |
274
Table of Contents
| after the participant has reached 55 years of age with 10 years of service to the Company, provided that, in the case of an involuntary termination, the participant signs a general release and waiver of claims which is not revoked. |
| • | Termination without cause. In the event a participant’s employment is terminated by the Company without “cause” (as defined in the Omnibus Incentive Plan), all unvested options and SARs will be forfeited and canceled, and all options and SARs that are vested and exercisable will remain exercisable for up to 30 days following the date of the participant’s termination of employment. All restricted stock and restricted stock units that are unvested will be immediately forfeited and canceled. Provided that the participant signs a general release and waiver of claims which is not revoked, all performance units that are unvested will be retained by the participant on a pro-rata basis (based on the number of days elapsed in the performance cycle on the participant’s date of termination over the total number of days in the performance cycle), and such retained awards will remain outstanding and vest subject to attainment of the applicable performance goals. |
| • | Termination for any other reason. In the event a participant’s employment is terminated for any other reason not described above, including a voluntary resignation, all unvested options and SARs will be forfeited and canceled and all options and SARs that are vested and exercisable will remain exercisable for up to 30 days following the date of the participant’s termination of employment. All other awards that are unvested or have not otherwise been earned shall be immediately forfeited and canceled. |
Other Forfeiture Provisions; Clawback. A participant will be required to forfeit and disgorge any awards granted or vested and all gains earned or accrued due to the exercise of stock options or SARs or the sale of any Company common stock to the extent required by any policies as to forfeiture and recoupment or clawback policies as may be adopted by the Administrator or the board of directors, or as required by applicable law, including Section 304 of the Sarbanes-Oxley Act and Section 10D of the Exchange Act, or as required by any stock exchange or quotation system on which our common stock is listed.
In addition, in the event a participant engages in “competitive activity” (as defined in the Omnibus Incentive Plan) following a termination of the participant’s employment or service, all options and SARs, whether vested or unvested, and all other awards that are vested or unpaid as of the date of engagement in competitive activity will be immediately forfeited and canceled, and any portion of the participant’s award that became vested after such termination of employment or service, and any shares of common stock or cash issued upon exercise or settlement of such awards, will be immediately forfeited, canceled, and disgorged or paid to the Company together with all gains earned or accrued due to the sale of shares of common stock issued upon exercise or settlement of the awards.
Change in Capitalization or Other Corporate Event. The number or amount of shares of stock, other property or cash covered by outstanding awards, the number and type of shares of stock that have been authorized for issuance under the Omnibus Incentive Plan, the exercise or purchase price of each outstanding award, and the other terms and conditions of outstanding awards, will be subject to adjustment by the Administrator in the event of any stock dividend, extraordinary dividend, stock split or share combination or any recapitalization, merger, consolidation, exchange of shares, spin-off, liquidation or dissolution of the Company or other similar transaction affecting our common stock. Any such adjustment would not be considered a repricing for purposes of the prohibition on repricing described above.
Effect of a Change in Control. Except as otherwise determined by the Administrator, upon a future change in control of the Company, unless prohibited by applicable law (including if such action would trigger adverse tax treatment under Section 409A of the Code), no accelerated vesting or cancellation of awards would occur if the awards are assumed and/or replaced in the change in control with substitute awards having the same or better terms and conditions (except that any substitute awards must fully vest on a participant’s involuntary termination of employment without “cause” or for “good reason” (as defined in the Omnibus Incentive Plan), in each case occurring within two years following the date of the change in control). To the extent that awards that vest based on continued service are not assumed and/or replaced in this manner, then those awards would fully vest and be
275
Table of Contents
cancelled for the same per share payment made to the shareholders in the change in control (less, in the case of options and SARs, the applicable exercise or base price). Performance-vesting awards would be modified into time-vesting awards at the time of the change in control based on either target or actual levels of performance, and the modified awards would then either be replaced or assumed, or cashed out, as described above. In the event of a participant’s termination of employment without “cause” or for “good reason” within the period ninety days prior to the change in control, the participant’s awards shall be treated as if the participant’s termination occurred immediately after the change in control. The Administrator has the ability to prescribe different treatment of awards in the award agreements and/or to take actions that are more favorable to participants.
Expiration Date. The Omnibus Incentive Plan has a ten-year term and will expire at the end of that term unless further approval of our shareholders of the Omnibus Incentive Plan (or a successor plan) is obtained. However, the expiration of the Omnibus Incentive Plan would have no effect on outstanding awards previously granted.
The Supplemental Severance Plan
Prior to the settlement of this offering, we intend to amend and restate the Supplemental Severance Plan to provide benefits for officers at the level of Managing Director or above. As amended, the Supplemental Severance Plan will provide that an executive whose job is eliminated unrelated to a change in control will be eligible to receive, among other benefits:
| • | temporary income payments equal to 52 weeks’ of base salary, reduced by any temporary income payments for which the executive may be eligible under the Severance Plan, provided that members of the Holdings’ Management Committee will receive 78 weeks’ of base salary; |
| • | additional temporary income payments equal to the greater of: |
| ○ | the most recent short-term incentive compensation award paid to the executive; |
| ○ | the average of the three most recent short-term incentive compensation awards paid to the executive; and |
| ○ | the annual target short-term incentive compensation award for the executive for the year in which he or she receives notice of job elimination; |
| • | a lump sum payment equal to the sum of: (a) the executive’s short-term incentive compensation for the year in which the executive receives notice of job elimination, pro-rated based on the number of the executive’s full calendar months of service in that year and (b) $40,000; and |
| • | in the event that the executive receives notice that the executive’s job will be eliminated on any date occurring during the period beginning on January 1 of a calendar year and ending on the date on which short-term incentive compensation awards are paid under the STIC Plan for the prior calendar year, a lump sum payment equal to his or her annual target short-term incentive compensation for the prior year. |
In the event of a job elimination is related to a change in control, members of the Holdings’ Management Committee and certain other key executives will be eligible to receive 104 weeks’ of base salary. A job elimination will be deemed to be “related to a change in control” only if it occurs within 12 months after a change in control. For this purpose, the term “job elimination” will include certain voluntary terminations of employment by an executive for “good reason,” which includes:
| • | a material diminution of the executive’s duties, authority or responsibilities; |
| • | a material reduction in the executive’s base compensation (other than in connection with, and substantially proportionate to, reductions by the company of the compensation of other similarly situated senior executives); and |
| • | a material change in the geographic location of the executive’s position. |
276
Table of Contents
For a voluntary termination of employment for “good reason” to be treated as an involuntary termination, the executive must give notice of the existence of the “good reason” condition within 90 days of its initial existence and the Company must not remedy the condition within 30 days of the notice.
The Supplemental Severance Plan will continue to supplement, and not be duplicative of, any severance benefits for which an executive may be eligible under the Basic Severance Plan. All provisions of the Basic Severance Plan will continue to apply to the Supplemental Severance Plan, including the requirement to execute a general release and waiver of claims. As amended, the Supplemental Severance Plan will require the general release and waiver of claims to include non-competition and non-solicitation provisions.
2018 Short-Term Incentive Compensation Program and Equity-Based Awards
STIC Program
The EQ Named Executive Officers will be eligible for an award under the 2018 program under the STIC Plan (the “2018 STIC Program”). The 2018 STIC Program will differ from prior programs by:
| • | determining funding based solely on the performance of AXA Financial R&P Operations against its targets, rather than a mix of its performance and AXA’s performance; and |
| • | incorporating performance objectives that reflect AXA Financial R&P Operations’ key performance indicators, rather than objectives based on AXA’s strategy and focus. |
The potential funding percentage for the 2018 STIC Program will range from 0% to 200% of target, consistent with peer payout ranges. The funding percentage will be allocated to business units based on Holdings’ Chief Executive Officer’s assessment of business unit performance, provided that the funding for corporate staff will solely reflect company performance.
Expected performance objectives and weightings for the 2018 STIC Program are as follows:
| Performance Objective |
Weighting | |
| Non-GAAP Operating Earnings |
50% | |
| Premiums and Flows |
25% | |
| Strategic Goals |
25% |
For this purpose, the “strategic goals” category will focus on the milestones needed to ensure that the Company transitions successfully to a standalone entity such as General Account optimization, IT systems implementations, position relocations and key staffing.
Transaction Incentive Grants
At the time of this offering, we will grant one-time equity-based awards (“Transaction Incentive Awards”) to the Named Executive Officers and certain other employees under the Omnibus Equity Incentive Plan. Each Named Executive Officer will receive a target award value as listed in the table below. However, the actual value of the award granted to each Named Executive Officer other than Mr. Pearson could range from 50% to 150% of this target amount, depending on Holdings’ valuation at the time of this offering. Mr. Pearson’s award is capped at $6,000,000.
| Named Executive Officer |
Target Award Value | |||
| Mark Pearson |
$ | 5,000,000 | ||
| Anders Malmström |
$ | 2,000,000 | ||
| Brian Winikoff |
$ | 1,000,000 | ||
| Dave Hattem |
$ | 2,000,000 | ||
| Seth Bernstein |
$ | 1,000,000 | ||
277
Table of Contents
All Transaction Incentive Awards will be paid in the form of restricted stock units linked to the value of Holdings’ stock to further align the interests of our Named Executive Officers with those of our stockholders. The amount of the restricted stock units granted to each Named Executive Officer will be determined by dividing the Named Executive Officers’ actual award value by the offering price.
Fifty percent of each Named Executive Officer’s restricted stock units will vest based on continued service (the “Service Units’) and fifty percent will vest based on the performance of the Holdings share price (“Performance Units”) as follows:
| Type of Units |
Vesting Requirements | |
| Service Units |
• 50% of the Service Units will vest upon the expiration of the lock-up period related to this offering (expected to be six months);
• 25% of the Service Units will vest on the first anniversary of the offering date; and
• 25% of the Service Units will vest on the second anniversary of the offering date. | |
| Performance Units |
• Condition #1 - if, prior to the second anniversary of the offering date, the average closing price of the Holdings’ share for thirty consecutive days is at least equal to 130% of the offering price, all Performance Units will immediately vest;
• Condition #2 - if Condition #1 is not met but, prior to the fifth anniversary of the offering date, the average closing price of the Holdings’ share for thirty consecutive days is at least equal to 150% of the offering price, all Performance Units will immediately vest; and
• Condition #3 - if neither Condition #1 or Condition #2 is met, fifty percent of the Performance Units will vest on the fifth anniversary of the offering date. The remaining 50% of the Performance Units will be forfeited. | |
Unvested restricted stock units will be forfeited upon termination of employment, except as follows:
| Termination Type |
Retention | |
| Involuntary Termination (without cause) | A pro-rated portion of the Performance Units based on the participant’s full months of service completed during the five-year period from the date of grant will continue to vest subject to the performance criteria. All other units will be forfeited | |
| Death | All restricted stock units will be immediately vested. | |
| Disability | All restricted stock units will continue to vest as if the individual continued employment. | |
| Other | All restricted stock units will be forfeited. | |
Other Equity-Based Awards
Each of the EQ Named Executive Officers will receive an equity-based award in 2018 linked to Holdings’ stock as follows.
| Named Executive Officer |
Value of Award | |||
| Mr. Pearson |
$ | 3,850,000 | ||
| Mr. Malmström |
$ | 1,500,000 | ||
| Mr. Winikoff |
$ | 850,000 | ||
| Mr. Hattem |
$ | 1,000,000 | ||
278
Table of Contents
The award will consist of three components: (a) Holdings performance shares (50%), (b) Holdings stock options (25%) and (c) Holdings restricted stock units (25%).
To determine the amount of Holdings restricted stock units to be granted to each EQ Named Executive Officer, the applicable percentage of his total award value will be divided by the fair market value of the Holdings’ stock on the grant date. To determine the amount of Holdings stock options to be granted to each EQ Named Executive Officer, 25% of his total award value will be divided by the value of a Holdings stock option on the grant date which will be determined using a Black-Scholes pricing methodology based on assumptions which may differ from the assumptions used in determining the option’s grant date fair value based on FASB ASC Topic 718.
The Holdings stock options and restricted stock units will each vest ratably over three years while the Holdings performance shares grants will cliff vest after three years. Holdings performance shares will be granted unearned and will be earned over the vesting period based on the Company’s performance against performance objectives based on Relative Total Shareholder Return and Non-GAAP Operating ROE.
Both Holdings performance shares and restricted stock units will receive dividend equivalents with the same vesting schedule as the related shares or units.
Compensation Adjustments
The following compensation adjustments will apply for Mr. Pearson, Mr. Malmström and Mr. Hattem, effective May 14, 2018, subject to approval by the AXA Equitable Life Board of Directors:
| Mr. Pearson |
Equity-based award target increased from $2,350,000 to $3,850,000 | |
| Mr. Malmström |
Salary increase from $660,000 to $710,000 STIC Program award target increased from $800,000 to $1,000,000 Equity-based award target increased from $800,000 to $1,500,000 | |
| Mr. Hattem |
Salary increase from $609,000 to $700,000 STIC Program award target increased from $650,000 to $750,000 Equity-based award target increased from $750,000 to $1,000,000 | |
Compensation Policies
Clawbacks
We intend to implement a clawback and forfeiture policy providing that:
| • | if the Company is required to prepare an accounting restatement of its financial results due to material noncompliance of the Company with any financial reporting requirement under the securities laws caused by the fraud, misconduct or gross negligence of a current or former executive officer, the Company will use reasonable efforts to recover any incentive compensation paid to the executive officer that would not have been paid if the financial results had been properly reported; and |
| • | if a current or former executive officer commits fraudulent or other wrongful conduct that causes the Company or its business financial or reputational harm, the Company may seek recovery of performance-based compensation with respect to the period of misconduct. |
For this purpose, an “executive officer” includes any officer of the Company for purposes of Section 16 of the Securities Exchange Act of 1934, as amended. Currently, this includes the members of Holdings’ Management Committee (“MC Members”) and our Chief Accounting Officer.
279
Table of Contents
Stock Ownership
We intend to implement a stock ownership policy for the MC Members as follows:
| Executive |
Requirement | |
| Holdings’ Chief Executive Officer |
6 x base salary | |
| Other MC Members |
3 x base salary |
For purposes of determining whether the requirements are met, the following will be taken into account:
| • | AEH common stock; |
| • | AB units and |
| • | unvested restricted stock or restricted stock units that are subject only to service requirements. |
The executives will be required to retain 75% of any net shares (shares after the payment of taxes and the costs of exercise and commissions for stock options) received as compensation until the applicable requirement is met. Once an executive satisfies the stock ownership guidelines, the executive will not be deemed to have fallen out of compliance solely by reason of a decline in the value of the AEH common stock or AB units.
Hedging and Pledging
We intend to adopt an insider trading policy prohibiting all employees and directors of the Company from engaging in hedging or pledging with respect to securities of Holdings or its subsidiaries.
Treatment of Outstanding AXA Equity-Based Awards
All of the EQ Named Executive Officer’s outstanding equity-based awards linked to AXA’s stock will remain subject to their original terms and conditions following the offering.
COMPENSATION COMMITTEE INTERLOCKS AND INSIDER PARTICIPATION
The Board did not maintain a compensation committee in 2017 and it did not deliberate regarding executive officer compensation in 2017. During 2017 none of our executive officers served as: (a) a member of the compensation committee of any entity for which a member of our Board served as an executive officer or (b) a director of another entity, an executive officer of which serves as a member of the Board.
CONSIDERATION OF RISK MATTERS IN DETERMINING COMPENSATION
Holdings has considered whether the compensation practices of its subsidiaries are reasonably likely to have a material adverse effect on Holdings and determined that they do not. When conducting the analysis, Holdings considered that AXA Equitable Life’s programs have a number of features that contribute to prudent decision-making and avoid an incentive to take excessive risk. The overall design and metrics of AXA Equitable Life’s incentive compensation program effectively balance performance over time, considering both company earnings and individual results with multi-year vesting and performance periods. AXA Equitable Life’s short-term incentive program further mitigates risk by permitting discretionary adjustments for both funding and granting purposes. Holdings also considered that AXA Equitable Life’s general risk management controls, oversight of programs, award review and governance processes preclude decision-makers from taking excessive risk to achieve targets under the compensation plans.
Holdings also considered that a substantial portion of each long-term incentive compensation award granted to an eligible employee of AB is denominated in AB Holding Units that are not delivered until subsequent years, so the ultimate value that the employee derives from the award depends on the long-term performance of the
280
Table of Contents
firm. Denominating a substantial portion of the award in restricted AB Holding Units and deferring their delivery sensitizes employees to risk outcomes and discourages them from taking excessive risks that could lead to a decrease in the value of the AB Holding Units. Furthermore, generally all outstanding long-term incentive compensation awards include a provision permitting AB to “claw-back” the unvested portion of an employee’s long-term incentive compensation award if the AB Compensation Committee determines that (i) the employee failed to follow existing risk management policies and (ii) as a result of the employee’s failure, there has been or reasonably could be expected to be a material adverse impact on AB or the employee’s business unit.
281
Table of Contents
SUMMARY COMPENSATION TABLE
The following table presents the total compensation of our Named Executive Officers for services performed for us for the years ended December 31, 2017, December 31, 2016 and December 31, 2015, except that no information is provided for years prior to 2016 for Mr. Winikoff or for years prior to 2017 for Mr. Bernstein since they were not Named Executive Officers in those years.
The amounts listed in this table as well as all other executive compensation tables reflect all payments made to the EQ Named Executive Officers by AXA Equitable Life even though a portion of these costs may have been reimbursed by certain affiliates pursuant to various service agreements. The total compensation reported in the following table includes items such as salary and non-equity incentive compensation as well as the grant date fair value of equity-based compensation. The equity-based compensation may never become payable or may end up with a value that is substantially different from the value reported here. The amounts in the Total column do not represent “Total Compensation” as described in the Compensation Discussion and Analysis.
2017 SUMMARY COMPENSATION TABLE
| Name and Principal Position |
Fiscal Year |
Salary (1) |
Bonus (2) |
Stock Awards (3) |
Option Awards (4) |
Non-Equity Incentive Compensation (5) |
Change in Pension Value and Nonqualified Deferred Compensation Earnings (6) |
All Other Compensation (7) |
Total | |||||||||||||||||||||||||||
| Mark Pearson |
2017 | $ | 1,250,114 | $ | 2,067,378 | $ | 341,280 | $ | 2,526,000 | $ | 1,017,919 | $ | 370,237 | $ | 7,572,928 | |||||||||||||||||||||
| President and Chief Executive Officer |
2016 | $ | 1,250,744 | $ | 2,010,449 | $ | 382,419 | $ | 2,164,000 | $ | 393,441 | $ | 389,201 | $ | 6,590,254 | |||||||||||||||||||||
| 2015 | $ | 1,250,744 | $ | 1,681,267 | $ | 261,309 | $ | 2,341,000 | $ | 573,100 | $ | 6,107,420 | ||||||||||||||||||||||||
| Anders Malmström |
2017 | $ | 658,228 | $ | 526,564 | $ | 106,722 | $ | 1,047,248 | $ | 180,070 | $ | 330,539 | $ | 2,849,371 | |||||||||||||||||||||
| Senior Executive Vice President and Chief Financial Officer |
2016 | $ | 658,228 | $ | 496,993 | $ | 116,089 | $ | 850,000 | $ | 280,596 | $ | 172,895 | $ | 2,574,801 | |||||||||||||||||||||
| 2015 | $ | 658,228 | $ | 350,014 | $ | 61,295 | $ | 940,000 | $ | 22,125 | $ | 165,337 | $ | 2,196,999 | ||||||||||||||||||||||
| Brian Winikoff |
2017 | $ | 737,246 | $ | 559,481 | $ | 113,389 | $ | 936,729 | $ | 52,726 | $ | 168,155 | $ | 2,567,726 | |||||||||||||||||||||
| Senior Executive Director and Head of U.S. Life, Retirement and Wealth Management for AXA Equitable Life |
2016 | $ | 332,950 | $ | 1,599,925 | $ | 900,000 | $ | 20,054 | $ | 2,852,929 | |||||||||||||||||||||||||
| Dave Hattem |
2017 | $ | 609,333 | $ | 646,471 | $ | 106,722 | $ | 788,119 | $ | 578,537 | $ | 155,009 | $ | 2,884,191 | |||||||||||||||||||||
| Senior Executive Vice President and General Counsel |
2016 | $ | 599,893 | $ | 648,443 | $ | 123,348 | $ | 750,000 | $ | 238,250 | $ | 134,224 | $ | 2,494,158 | |||||||||||||||||||||
| 2015 | $ | 551,331 | $ | 47,596 | $ | 429,728 | $ | 66,791 | $ | 720,000 | $ | 16,467 | $ | 159,859 | $ | 1,991,772 | ||||||||||||||||||||
| Seth Bernstein |
2017 | $ | 334,615 | $ | 3,000,000 | $ | 3,500,003 | $ | 148,274 | $ | 6,982,892 | |||||||||||||||||||||||||
| Chief Executive Officer of AllianceBernstein Corporation |
||||||||||||||||||||||||||||||||||||
| Gérald Harlin |
2017 | |||||||||||||||||||||||||||||||||||
| Chairman of the Board and Chief Executive Officer |
||||||||||||||||||||||||||||||||||||
| (1) | For the EQ named executive officers, the amounts in this column reflect actual salary paid in each year. Mr. Bernstein’s annual base salary is $500,000. The salary figure in the table is prorated based on his hire date (May 1, 2017). |
| (2) | No bonuses were paid to the EQ Named Executive Officers in 2017, 2016 or 2015 except that Mr. Hattem was paid a bonus in May 2015 to compensate him for the loss of AXA stock options due to regulatory and other constraints prohibiting his exercise. Mr. Bernstein was paid a bonus in 2017 consistent with the SB Employment Agreement. |
| (3) | For Mr. Winikoff, this column reflects the grant date fair value of his sign-on restricted stock unit (“RSU”) grant in 2016. For Mr. Bernstein, this column reflects the grant date fair value of the SB Sign-On Grant. Otherwise, the amounts reported in this column represent the aggregate |
282
Table of Contents
| grant date fair value of AXA performance shares awarded in each year in accordance with FASB ASC Topic 718, and the assumptions made in calculating them can be found in note 13 of the notes to Holdings’ consolidated financial statements for the year ended December 31, 2017. The AXA performance share grants were valued at target which represents the probable outcome at grant date. A maximum payout for the AXA performance share grants, valued at the grant date fair value, would result in values of: |
| 2017 | 2016 | 2015 | ||||||||||
| Mr. Pearson |
$ | 2,687,592 | $ | 2,613,584 | $ | 2,185,653 | ||||||
| Mr. Malmström |
$ | 684,533 | $ | 646,091 | $ | 455,027 | ||||||
| Mr. Winikoff |
$ | 727,326 | ||||||||||
| Mr. Hattem |
$ | 840,412 | $ | 842,976 | $ | 558,656 | ||||||
The 2017 AXA performance share grants, Mr. Winikoff’s sign-on RSU grant and the AB Sign-On Grant are described in more detail below in “—Executive Compensation—Supplemental Information for Summary Compensation and Grants of Plan-Based Awards Tables.”
| (4) | The amounts reported in this column represent the aggregate grant date fair value of AXA stock options awarded in each year in accordance with FASB ASC Topic 718, and the assumptions made in calculating them can be found in note 13 of the notes to Holdings’ consolidated financial statements for the year ended December 31, 2017. The 2017 AXA stock option grants are described in more detail below in “—Supplemental Information for Summary Compensation and Grants of Plan-Based Awards Tables.” |
| (5) | For the EQ Named Executive Officers, the amounts reported for 2017 are the awards paid in March 2018 to each of the Named Executive Officers based on their 2017 performance. The amounts reported for 2016 are the awards paid in February 2017 to each of the Named Executive Officers based on their 2016 performance. The amounts reported for 2015 are the awards paid in February 2016 to each of the Named Executive Officers based on their 2015 performance. |
| (6) | The amounts reported represent the increase in the actuarial present value of accumulated pension benefits for the Named Executive Officer. The Named Executive Officers did not have any above-market earnings on non-qualified deferred compensation in 2017, 2016 or 2015. For more information regarding the pension benefits for each Named Executive Officer, see the Pension Benefits as of December 31, 2017 Table below. |
| (7) | The following table provides additional details for the compensation information found in the All Other Compensation column. |
2017 ALL OTHER COMPENSATION TABLE
| Name |
Auto (a) |
Excess Liability Insurance (b) |
Financial Advice (c) |
401k Plan Contributions (d) |
Excess 401(k) Contributions (e) |
Other Perquisites/ Benefits (f) |
TOTAL | |||||||||||||||||||||||||
| Mark Pearson |
2017 | $ | 10,246 | $ | 8,161 | $ | 24,546 | $ | 13,020 | 314,264 | — | $ | 370,237 | |||||||||||||||||||
| 2016 | $ | 11,469 | $ | 8,110 | $ | 24,220 | 12,938 | 332,464 | — | $ | 389,201 | |||||||||||||||||||||
| 2015 | $ | 17,874 | $ | 8,110 | $ | 34,610 | 16,913 | 342,264 | 153,329 | $ | 573,100 | |||||||||||||||||||||
| Anders Malmström |
2017 | $ | — | $ | — | $ | 28,484 | $ | 13,020 | 123,823 | $ | 165,212 | $ | 330,539 | ||||||||||||||||||
| 2016 | $ | 333 | $ | 25,980 | 12,938 | 133,323 | $ | 321 | $ | 172,895 | ||||||||||||||||||||||
| 2015 | $ | 839 | $ | 29,190 | 16,913 | 109,323 | $ | 9,072 | $ | 165,337 | ||||||||||||||||||||||
| Brian Winikoff |
2017 | $ | — | $ | 17,791 | $ | 13,020 | 136,725 | $ | 619 | $ | 168,155 | ||||||||||||||||||||
| 2016 | $ | — | $ | — | $ | — | 12,938 | 6,795 | $ | 321 | 20,054 | |||||||||||||||||||||
| 2015 | ||||||||||||||||||||||||||||||||
| Dave Hattem |
2017 | $ | — | $ | — | $ | 15,000 | $ | 13,020 | 118,809 | $ | 8,180 | $ | 155,009 | ||||||||||||||||||
| 2016 | $ | 51 | $ | — | 12,938 | 114,487 | $ | 6,748 | 134,224 | |||||||||||||||||||||||
| 2015 | $ | 6,157 | $ | 17,524 | 16,913 | 109,558 | $ | 9,707 | 159,859 | |||||||||||||||||||||||
| Seth Bernstein |
2017 | $ | 146,845 | $ | 1,429 | $ | 148,274 | |||||||||||||||||||||||||
| 2016 | ||||||||||||||||||||||||||||||||
| 2015 | ||||||||||||||||||||||||||||||||
| a. | Pursuant to his employment agreement, Mr. Pearson is entitled to the business and personal use of a dedicated car and driver. The personal use of this vehicle for 2017 was valued based on a formula considering the annual lease value of the vehicle, the compensation of the driver and the cost of fuel. Pursuant to his employment agreement, Mr. Bernstein is entitled to a car and driver for his business and personal purposes and this column includes auto lease costs ($10,493) and driver compensation and other auto-related expenses ($136,352). |
| b. | AXA Equitable Life pays the premiums for excess liability insurance coverage for Mr. Pearson pursuant to his employment agreement. The amounts in this column reflect the actual amount of the premiums paid for each year. |
283
Table of Contents
| c. | AXA Equitable Life pays for financial planning and tax preparation services for each of the EQ Named Executive Officers. The amounts in this column reflect the actual amounts paid to the service provider for each year. |
| d. | This column includes the amount of company contributions received by each EQ Named Executive Officer under the 401(k) Plan for 2017. |
| e. | This column includes the amount of any excess 401(k) contributions made by AXA Equitable Life to the Post-2004 Plan for each EQ Named Executive Officer. |
| f. | This column includes for 2017: |
| Mr. Malmström |
$157,783 – relocation expense of $100,000 and related tax gross-up of $57,783 $7,429 – costs related to having a guest accompany him to company events | |
| Mr. Winikoff |
$577 – cost related to having a guest accompany him to a company event $41 – refund of health insurance premium | |
| Mr. Hattem |
$8,042 – costs related to having a guest accompany him to company events | |
| Mr. Bernstein |
$1,429 – life insurance premiums | |
| (8) | Mr. Harlin served as the Chairman of the Board and Chief Executive Officer of Holdings during 2017. Mr. Harlin received no compensation from the Company for his services rendered to Holdings during 2017. Mr. Harlin resigned as Chairman of the Board and Chief Executive Officer of Holdings on November 6, 2017. |
2017 GRANTS OF PLAN-BASED AWARDS
The following table provides additional information about plan-based compensation disclosed in the Summary Compensation Table. This table includes both equity and non-equity awards granted during 2017. No equity awards in respect of Holdings stock were granted in 2017.
| 2017 GRANTS OF PLAN-BASED AWARDS | ||||||||||||||||||||||||||||||||||||||||||||||||||||
| Name |
Grant Date |
OCC Approval Date (1) |
Estimated Future Payouts |
Estimated Future Payouts |
All Other Stock Awards: Number of Shares of Stock or Units (#)(4) |
All Other Option Awards: Number of Securities Underlying Options (#) |
Exercise or Base Price of Option Awards ($/Sh)(5) |
Closing Market Price on Date of Grant |
Grant Date Fair Value of Stock and Option Awards(6) |
|||||||||||||||||||||||||||||||||||||||||||
| Threshold ($) |
Target ($) |
Maximum ($) |
Threshold (#) |
Target (#) |
Maximum (#) |
|||||||||||||||||||||||||||||||||||||||||||||||
| Mark Pearson |
$ | 0 | $ | 2,128,400 | n/a | |||||||||||||||||||||||||||||||||||||||||||||||
| 06/21/17 | 02/15/17 | 0 | 170,004 | 170,004 | $ | 26.69 | $ | 26.80 | $ | 341,280 | ||||||||||||||||||||||||||||||||||||||||||
| 06/21/17 | 02/15/17 | 0 | 97,144 | 126,287 | $ | 2,067,378 | ||||||||||||||||||||||||||||||||||||||||||||||
| Anders Malmström |
$ | 0 | $ | 800,000 | n/a | |||||||||||||||||||||||||||||||||||||||||||||||
| 06/21/17 | 02/15/17 | 17,720 | 17,720 | 35,442 | $ | 26.69 | $ | 26.80 | $ | 106,722 | ||||||||||||||||||||||||||||||||||||||||||
| 06/21/17 | 02/15/17 | 30,377 | 39,490 | $ | 526,564 | |||||||||||||||||||||||||||||||||||||||||||||||
| Brian Winikoff |
$ | 0 | $ | 900,000 | n/a | |||||||||||||||||||||||||||||||||||||||||||||||
| 06/21/17 | 02/15/17 | 0 | 18,827 | 18,827 | 37,656 | $ | 26.69 | $ | 26.80 | $ | 113,389 | |||||||||||||||||||||||||||||||||||||||||
| 06/21/17 | 02/15/17 | 0 | 32,276 | 41,959 | $ | 559,481 | ||||||||||||||||||||||||||||||||||||||||||||||
| Dave Hattem |
$ | 0 | $ | 650,000 | n/a | |||||||||||||||||||||||||||||||||||||||||||||||
| 06/21/17 | 02/15/17 | 0 | 17,720 | 17,720 | 35,442 | $ | 26.69 | $ | 26.80 | $ | 106,722 | |||||||||||||||||||||||||||||||||||||||||
| 06/21/17 | 02/15/17 | 0 | 30,377 | 39,490 | $ | 646,471 | ||||||||||||||||||||||||||||||||||||||||||||||
| Seth Bernstein |
||||||||||||||||||||||||||||||||||||||||||||||||||||
| 05/16/17 | 164,706 | $ | 3,500,003 | |||||||||||||||||||||||||||||||||||||||||||||||||
| (1) | For the EQ Named Executive Officers, this column reports the date on which the EQ OCC approved its recommendation of the grants to the AXA Board of Directors. |
| (2) | For the EQ Named Executive Officers, the target column shows the target award for 2017 under the STIC Program assuming the plan was 100% funded. There is no minimum or maximum award for any participant in this plan. The actual 2017 awards paid to the EQ Named Executive Officers are listed in the Non-Equity Incentive Compensation column of the Summary Compensation Table. |
| (3) | The second row for each EQ Named Executive Officer shows the AXA stock options granted under the AXA Stock Option Plan on June 21, 2017. The third row for each EQ Named Executive Officer shows the AXA performance shares granted under the AXA 2017 Performance Share Plan on June 21, 2017. |
| (4) | For Mr. Bernstein, this column shows the SB Sign-On Grant. |
| (5) | The exercise price for the AXA stock options granted on June 21, 2017 is equal to the average of the closing prices for an AXA ordinary share on Euronext Paris SA over the 20 trading days immediately preceding June 21, 2017. For purposes of this table, the exercise price was converted to U.S. dollars using the euro to U.S. dollar exchange rate on June 20, 2017. |
284
Table of Contents
| (6) | For the EQ Named Executive Officers, the amounts in this column represent the aggregate grant date fair value of the AXA stock options and AXA performance shares granted in 2017 in accordance with FASB ASC Topic 718. The AXA performance share grants were valued at target which represents the probable outcome at grant date. For Mr. Bernstein, the amount in this column represents the grant date fair value of the SB Sign-On Grant. |
SUPPLEMENTAL INFORMATION FOR SUMMARY COMPENSATION AND GRANTS OF PLAN-BASED AWARDS TABLES
2017 Stock Option Award Grants
The AXA stock option awards granted to the EQ Named Executive Officers on June 21, 2017 have a 10-year term and a vesting schedule of five years, with one-third of the grant vesting on each of the third, fourth and fifth anniversaries of the grant, provided that the last third will vest on June 21, 2022 only if the AXA ordinary share performs at least as well as the SXIP Index over a specified period of at least three years. This performance condition applies to all of Mr. Pearson’s options. The exercise price for the options is 23.92 euro, which was the average of the closing prices for the AXA ordinary share on Euronext Paris SA over the 20 trading days immediately preceding June 21, 2017.
In the event of retirement, the AXA stock options continue to vest and may be exercised until the end of the term, except in the case of misconduct. Accordingly, since Messrs. Hattem and Pearson are currently eligible to retire, their AXA stock options will not be forfeited due to any service condition.
2017 Performance Share Award Grants
An AXA performance share is a “phantom” share of AXA that, once earned and vested, provides the right to receive an AXA ordinary share at the time of payment. AXA performance shares are granted unearned. Under the 2017 AXA Performance Shares Plan, the number of shares that is earned is determined at the end of a three-year performance period, starting on January 1, 2017 and ending on December 31, 2019, by multiplying the number of shares granted by a performance percentage that is determined as described below. If no dividend is proposed for payment by the AXA Board of Directors to AXA’s stockholders for 2017 and/or 2018 and/or 2019, the performance percentage for the grant will be divided in half. The AXA performance shares granted to the EQ Named Executive Officers on June 21, 2017 cliff vest after four years.
The performance percentage for the 2017 AXA Performance Shares Plan initially will be determined based: (a) 40% on AXA’s performance with respect to adjusted earnings per share, (b) 50% on AXA Financial R&P Operations’ performance with respect to adjusted earnings and underlying earnings (each weighted 50%) and (c) 10% on AXA’s score on the DJSI World, a Dow Jones sustainability index which tracks the performance of the world’s sustainability leaders. A positive or negative adjustment of 5% will then be made to the performance percentage based on AXA’s relative performance against a selection of its peers with respect to total stockholder return. The components of the performance percentage and their targets are determined by the AXA Board of Directors based on their review of AXA’s strategic objectives, market practices and regulatory changes.
Generally, if performance targets are met, 100% of the AXA performance shares initially granted is earned. Performance that exceeds the targets results in increases in the number of shares earned, subject to a cap of 130% of the initial number of shares. Performance that falls short of targets results in a decrease in the number of shares earned with a possible forfeiture of all shares. Since AXA uses IFRS as its principal method of accounting, AXA’s adjusted earnings per share and AXA Financial R&P Operations’ adjusted earnings and underlying earnings are calculated using IFRS. Accordingly, they are not measures calculated and presented in accordance with U.S. GAAP.
The settlement of 2017 AXA performance shares will be made in AXA ordinary shares on June 21, 2021. In the case of retirement, a participant is treated as if he or she continued employment until the settlement date. Accordingly, Messrs. Hattem and Pearson will still receive a payout if they choose to retire prior to the end of the vesting period.
285
Table of Contents
Mr. Winikoff’s RSUs Grant
On July 5, 2016, Mr. Winikoff received a sign-on grant of 84,611 RSUs in respect of AXA ordinary shares. These RSUs will vest ratably over a four-year period and be paid out in cash within 30 days after the vesting date. 21,153 of these RSUs vested in 2017.
The SB Sign-On Grant
On May 16, 2017, in connection with the commencement of Mr. Bernstein’s employment, Mr. Bernstein was granted restricted AB Holding Units with a grant date fair value of $3,500,003, or 164,706 restricted AB Holding which, subject to accelerated vesting upon circumstances described in the SB Employment Agreement, vest ratably on each of the first four anniversaries of May 1, 2017, commencing May 1, 2018, provided, with respect to each installment, Mr. Bernstein continues to be employed by AB on the vesting date. Also, subject to accelerated delivery of the SB Sign-On Grant upon circumstances described in the SB Employment Agreement, the entire SB Sign-On Grant, minus any AB Holding Units withheld to cover applicable taxes, will be delivered to Mr. Bernstein as promptly as possible after May 1, 2021. Mr. Bernstein will receive the cash distributions payable with respect to the unvested portion of the SB Sign-On Grant and the vested but undelivered portion of the SB Sign-On Grant on the same basis as cash distributions are paid to AB Holding Unitholders generally.
286
Table of Contents
OUTSTANDING EQUITY AWARDS AS OF DECEMBER 31, 2017
The following table lists outstanding equity grants for each Named Executive Officer as of December 31, 2017. The table includes outstanding equity grants from past years as well as the current year. For the EQ Named Executive Officers, equity grants in 2017 and prior years were awarded in respect of AXA ordinary shares. For Mr. Bernstein, equity grants in 2017 were awarded in respect of AB Holding Units. Prior to this offering, none of our Named Executive Officers have received equity awards in respect of our common stock.
| OUTSTANDING EQUITY AWARDS AT 2017 YEAR-END | ||||||||||||||||||||||||||||||||||||
| OPTION AWARDS | STOCK AWARDS | |||||||||||||||||||||||||||||||||||
| Name |
Number of Securities Underlying Unexercised Options (#) Exercisable (1) |
Number of Securities Underlying Unexercised Options (#) Unexercisable (1) |
Equity Incentive Plan Awards: Number of Securities Underlying Unexercised Unearned Options (#) (1) |
Option Exercise Price ($)(2) |
Option Expiration Date |
Number of Shares or Units of Stock That Have Not Vested (#)(3) |
Market Value of Shares or Units of Stock That Have Not Vested ($) |
Equity Incentive Plan Awards: Number of Unearned Shares, Units or Other Rights That Have Not Vested (#)(4) |
Equity Incentive Plan Awards: Market or Payout Value of Unearned Shares, Units or Other Rights That Have Not Vested ($) |
|||||||||||||||||||||||||||
| Mark Pearson |
2,936 | $ | 33.21 | 04/01/18 | 45,418 | $ | 1,177,884 | 286,589 | $ | 7,432,485 | ||||||||||||||||||||||||||
| 34,574 | $ | 21.59 | 06/10/19 | |||||||||||||||||||||||||||||||||
| 60,500 | $ | 21.08 | 03/19/20 | |||||||||||||||||||||||||||||||||
| 137,500 | $ | 20.63 | 03/18/21 | |||||||||||||||||||||||||||||||||
| 116,000 | $ | 15.96 | 03/16/22 | |||||||||||||||||||||||||||||||||
| 140,000 | $ | 17.83 | 03/22/23 | |||||||||||||||||||||||||||||||||
| 41,133 | 82,267 | $ | 25.74 | 03/24/24 | ||||||||||||||||||||||||||||||||
| 145,458 | $ | 26.12 | 06/19/25 | |||||||||||||||||||||||||||||||||
| 186,069 | $ | 24.00 | 06/06/26 | |||||||||||||||||||||||||||||||||
| 170,004 | $ | 26.69 | 06/21/27 | |||||||||||||||||||||||||||||||||
| Anders Malmström |
11,644 | $ | 17.83 | 03/22/23 | 13,398 | $ | 347,468 | 83,899 | $ | 2,175,862 | ||||||||||||||||||||||||||
| 12,207 | 12,207 | 12,206 | $ | 25.74 | 03/24/24 | |||||||||||||||||||||||||||||||
| 24,786 | 12,393 | $ | 26.12 | 06/19/25 | ||||||||||||||||||||||||||||||||
| 37,656 | 18,828 | $ | 24.00 | 06/06/26 | ||||||||||||||||||||||||||||||||
| 35,442 | 17,720 | $ | 26.69 | 06/21/27 | ||||||||||||||||||||||||||||||||
| Brian Winikoff |
37,656 | 18,827 | $ | 26.69 | 06/21/27 | 63,458 | $ | 1,645,739 | 32,276 | $ | 837,055 | |||||||||||||||||||||||||
| Dave Hattem |
2,251 | $ | 33.21 | 04/01/18 | 12,415 | $ | 321,974 | 85,916 | $ | 2,228,171 | ||||||||||||||||||||||||||
| 11,313 | 11,313 | 11,314 | $ | 25.74 | 03/24/24 | |||||||||||||||||||||||||||||||
| 24,786 | 12,393 | $ | 26.12 | 06/19/25 | ||||||||||||||||||||||||||||||||
| 40,012 | 20,004 | $ | 24.00 | 06/06/26 | ||||||||||||||||||||||||||||||||
| 35,442 | 17,720 | $ | 26.69 | 06/21/27 | ||||||||||||||||||||||||||||||||
| Seth Bernstein |
164,706 | $ | 4,125,885 | |||||||||||||||||||||||||||||||||
| (1) | All AXA stock options have ten-year terms. All AXA stock options granted after 2013 have a vesting schedule of five years, with one-third of the grant vesting on each of the third, fourth and fifth anniversaries of the grant, and all AXA stock options granted in 2008 through 2013 have a vesting schedule of four years, with one-third of the grant vesting on each of the second, third and fourth anniversaries of the grant date; provided that for all these grants the last third will vest only if the AXA ordinary share performs at least as well as the SXIP Index during a specified period (this condition applies to all AXA stock options granted to Mr. Pearson after 2011). |
| (2) | All AXA stock options have euro exercise prices. All euro exercise prices have been converted to U.S. dollars based on the euro to U.S. dollar exchange rate on the day prior to the grant date. The actual U.S. dollar equivalent of the exercise price will depend on the exchange rate at the date of exercise. |
| (3) | For all of the EQ Named Executive Officers except Mr. Winikoff, this column reflects earned but unvested AXA performance shares granted in 2014 with a vesting date of March 24, 2018. For Mr. Winikoff, this column reflects the unvested portion of his sign-on RSU grant for 2016. His RSUs will vest ratably over a four-year period and be paid out in cash within 30 days after the vesting date. For Mr. Bernstein, this column reflects his AB Sign-On Grant. |
287
Table of Contents
| (4) | This column reflects unearned and unvested AXA performance shares granted in 2015, 2016 and 2017 to the EQ Named Executive Officers as follows: |
| 2015 AXA Performance Shares Vesting 6/19/19 |
2016 AXA Performance Shares Vesting 6/06/20 |
2017 AXA Performance Shares Vesting 6/21/21 |
||||||||||
| Mr. Pearson |
83,119 | 106,326 | 97,144 | |||||||||
| Mr. Malmström |
21,245 | 32,227 | 30,377 | |||||||||
| Mr. Winikoff |
32,276 | |||||||||||
| Mr. Hattem |
21,245 | 34,294 | 30,377 | |||||||||
OPTION EXERCISES AND STOCK VESTED IN 2017
The following table summarizes the value received from AXA stock option exercises and stock awards vested during 2017.
| OPTION EXERCISES AND STOCK VESTED | ||||||||||||||||
| OPTION AWARDS | STOCK AWARDS | |||||||||||||||
| Name |
Number of Shares Acquired on Exercise (#) (1) |
Value Realized on Exercise ($) (2) |
Number of Shares Acquired on Vesting (#) (3) |
Value Realized on Vesting ($) (4) |
||||||||||||
| Mark Pearson |
5,874 | $ | 31,871 | 45,734 | $ | 1,143,350 | ||||||||||
| Anders Malmström |
13,491 | $ | 337,275 | |||||||||||||
| Brian Winikoff |
21,153 | $ | 578,133 | |||||||||||||
| Dave Hattem |
79,364 | $ | 999,118 | 12,501 | $ | 312,525 | ||||||||||
| Seth Bernstein |
||||||||||||||||
| (1) | This column reflects the number of AXA stock options exercised in 2017 by Mr. Pearson and Mr. Hattem. |
| (2) | All shares acquired upon the option exercises were immediately sold. This column reflects the actual sale price received less the exercise price. |
| (3) | For Mr. Winikoff, this column reflects the portion of his RSUs that vested in 2017. Otherwise, this column reflects the first tranche of the AXA performance shares earned under the 2014 AXA Performance Shares Plan that vested in 2017. |
| (4) | The value of the AXA performance shares that vested in 2017 was determined based on the average of the high and low AXA ordinary share price on the vesting date, converted to US dollars using the European Central Bank reference rate on the vesting date. |
288
Table of Contents
PENSION BENEFITS AS OF DECEMBER 31, 2017
The following table lists the pension program participation and actuarial present value of each EQ Named Executive Officer’s defined benefit pension at December 31, 2017. Note that Messrs. Malmström and Winikoff did not participate in the Retirement Plan or the Excess Plan since they were not eligible to participate in these plans prior to their freeze. Mr. Bernstein does not have any pension benefits.
| PENSION BENEFITS | ||||||||||||||
| Name |
Plan Name(1) |
Number of Years Credited Service(2) |
Present Value of Accumulated Benefit ($) |
Payments during the last fiscal year ($) |
||||||||||
| Mark Pearson |
AXA Equitable Retirement Plan | 3 | $ | 70,739 | ||||||||||
| AXA Equitable Excess Retirement Plan | 3 | $ | 702,234 | |||||||||||
| AXA Equitable Executive Survivor Benefit Plan | 23 | $ | 4,298,300 | |||||||||||
| Anders Malmström |
AXA Equitable Retirement Plan | 0 | $ | — | ||||||||||
| AXA Equitable Excess Retirement Plan | 0 | $ | — | |||||||||||
| AXA Equitable Executive Survivor Benefit Plan | 6 | $ | 511,466 | |||||||||||
| Brian Winikoff |
AXA Equitable Retirement Plan | 0 | $ | — | ||||||||||
| AXA Equitable Excess Retirement Plan | 0 | $ | — | |||||||||||
| AXA Equitable Executive Survivor Benefit Plan | 1 | $ | 52,726 | |||||||||||
| Dave Hattem |
AXA Equitable Retirement Plan | 19 | $ | 517,856 | ||||||||||
| AXA Equitable Excess Retirement Plan | 19 | $ | 1,074,995 | |||||||||||
| AXA Equitable Executive Survivor Benefit Plan | 24 | $ | 2,447,999 | |||||||||||
| Seth Bernstein |
||||||||||||||
| (1) | The December 31, 2017 liabilities for the Retirement Plan, the Excess Plan, and the ESB Plan were calculated using the same participant data, plan provisions and actuarial methods and assumptions used for financial reporting purposes, except that a retirement age of 65 is assumed for all calculations. The assumptions used include: |
| • | a discount rate of 3.40% for the Retirement Plan; |
| • | a discount rate of 3.32% for the Excess Plan; |
| • | a discount rate of 3.47% for the ESB Plan; and |
| • | the RP-2000 mortality table projected on a full generational basis using Scale BB. |
| (2) | Credited service for purposes of the Retirement Plan and the Excess Plan does not include an executive’s first year of service and does not include any service after the freeze of the plans on December 31, 2013. Pursuant to his employment agreement, Mr. Pearson’s credited service for purposes of the ESB Plan includes approximately 16 years of service with AXA Equitable Life affiliates. However, this additional credited service does not result in any benefit augmentation for Mr. Pearson. |
The Retirement Plan
The Retirement Plan is a tax-qualified defined benefit plan for eligible employees. The Retirement Plan was frozen effective December 31, 2013.
289
Table of Contents
Participants became vested in their benefits under the Retirement Plan after three years of service. Participants are eligible to retire and begin receiving benefits under the Retirement Plan: (a) at age 65 (the “normal retirement date”) or (b) if they are at least age 55 with at least 5 full years of service (an “early retirement date”).
Prior to the freeze, the Retirement Plan provided a cash balance benefit whereby AXA Equitable Life established a notional account for each Retirement Plan participant. This notional account was credited with deemed pay credits equal to 5% of eligible compensation up to the Social Security wage base plus 10% of eligible compensation above the Social Security wage base. Eligible compensation included base salary and short-term incentive compensation and was subject to limits imposed by the Internal Revenue Code. These notional accounts continue to be credited with deemed interest credits. For pay credits earned on or after April 1, 2012 up to December 31, 2013, the interest rate is determined annually based on the average discount rates for one-year Treasury Constant Maturities. For pay credits earned prior to April 1, 2012, the annual interest rate is the greater of 4% and a rate derived from the average discount rates for one-year Treasury Constant Maturities. For 2017, pay credits earned prior to April 1, 2012 received an interest crediting rate of 4% while pay credits earned on or after April 1, 2012 received an interest crediting rate of 0.75%.
Participants elect the time and form of payment of their cash balance account after they separate from service. The normal form of payment depends on a participant’s marital status as of the payment commencement date. If the participant is unmarried, the normal form will be a single life annuity. If the participant is married, the normal form will be a 50% joint and survivor annuity. Subject to spousal consent requirements, participants may elect the following optional forms of payment for their cash balance account:
| • | Single life annuity; |
| • | Optional joint and survivor annuity of any whole percentage between 1% and 100%; and |
| • | Lump sum. |
Messrs. Pearson and Hattem are each entitled to a frozen cash balance benefit under the Retirement Plan and are currently eligible for early retirement under the plan.
Note that, for certain grandfathered participants, the Retirement Plan provides benefits under a traditional defined benefit formula based on final average pay, estimated Social Security benefits and years of service. None of the Named Executive Officers are grandfathered participants.
The Excess Plan
The purpose of the Excess Plan, which was frozen as of December 31, 2013 was to allow eligible employees to earn retirement benefits in excess of those permitted under the Retirement Plan. Specifically, the Retirement Plan is subject to rules under the Code that cap both the amount of eligible earnings that may be taken into account for determining benefits under the Retirement Plan and the amount of benefits that the Retirement Plan may pay annually. Prior to the freeze of the Retirement Plan, the Excess Plan permitted participants to accrue and be paid benefits that they would have earned and been paid under the Retirement Plan but for these limits. The Excess Plan is an unfunded plan and no assets are actually set aside in participants’ names.
The Excess Plan was amended effective September 1, 2008 to comply with the provisions of Code Section 409A. Pursuant to the amendment, a participant’s Excess Plan benefits vested after 2005 will generally be paid in a lump sum on the first day of the month following the month in which separation from service provided that payment will be delayed six months for “specified employees” (generally, the fifty most highly-compensated officers of AXA), unless the participant made a special one-time election with respect to the time and form of payment of those benefits by November 14, 2008. Neither Mr. Pearson or Mr. Hattem made a special election. The time and form of payment of Excess Plan benefits that vested prior to 2005 are the same as the time and form of payment of the participant’s Retirement Plan benefits.
290
Table of Contents
The ESB Plan
The ESB Plan offers financial protection to a participant’s family in the case of his or her death. Eligible employees may choose up to four levels of coverage and the form of benefit to be paid at each level. Each level provides a benefit equal to one times the participant’s eligible compensation (generally, base salary plus the higher of: (a) most recent short-term incentive compensation award and (b) the average of the three highest short-term incentive compensation awards), subject to an overall $25 million cap. Each level offers different coverage choices. Generally, the participant can choose between a life insurance death benefit and a deferred compensation benefit payable upon death at each level. Participants are not required to contribute to the cost of Level 1 or Level 2 coverage but are required to contribute annually to the cost of any options elected under Levels 3 and 4 until age 65.
Level 1 coverage continues after retirement until the participant attains age 65. Levels 2, 3 and 4 coverage continue after retirement until the participant’s death, provided that, for Levels 3 and 4 coverage, all required participant contributions are made.
Level 1
A participant can choose between the following two options at Level 1:
Lump Sum Option—Under the Lump Sum Option, a life insurance policy is purchased on the participant’s life. At the death of the participant, the participant’s beneficiary receives a tax-free lump sum death benefit from the policy. The participant is taxed annually on the value of the life insurance coverage provided.
Survivor Income Option—Upon the participant’s death, the Survivor Income Option provides the participant’s beneficiary with 15 annual payments approximating the value of the Lump Sum Option or a payment equal to the amount of the lump sum. The payments will be taxable but the participant is not subject to annual taxation.
Level 2
At Level 2, a participant can choose among the Lump Sum Option and Survivor Income Option, described above, and the following option:
Surviving Spouse Benefit Option—The Surviving Spouse Benefit Option provides the participant’s spouse with monthly income equal to about 25% of the participant’s monthly compensation (with an offset for social security). The payments are taxable but there is no annual taxation to the participant. The duration of the monthly income depends on the participant’s years of service (with a minimum duration of 5 years).
Levels 3 and 4
At Levels 3 and 4, a participant can choose among the Lump Sum Option and Survivor Income Option, described above and the following option:
Surviving Spouse Income Addition Option—The Surviving Spouse Income Addition Option provides monthly income to the participant’s spouse for life equal to 10% of the participant’s monthly compensation. The payments are taxable but there is no annual taxation to the participant.
291
Table of Contents
NON-QUALIFIED DEFERRED COMPENSATION TABLE AS OF DECEMBER 31, 2017
The following table provides information on: (i) earnings on compensation Mr. Hattem has previously elected to defer and (ii) the excess 401(k) contributions received by the EQ Named Executive Officers in 2017.
| NON-QUALIFIED DEFERRED COMPENSATION | ||||||||||||||||||
| Name |
Plan Name |
Registrant Contributions in Last FY ($)(1) |
Aggregate Earnings in Last FY ($)(2) |
Aggregate Withdrawals/ Distributions ($) |
Aggregate Balance at Last FYE ($) (3) |
|||||||||||||
| Mark Pearson |
The Post-2004 Variable Deferred Compensation Plan | $ | 314,264 | $ | 133,235 | $ | 1,508,574 | |||||||||||
| Anders Malmström |
The Post-2004 Variable Deferred Compensation Plan | $ | 123,823 | $ | 62,319 | $ | 452,033 | |||||||||||
| Brian Winikoff |
The Post-2004 Variable Deferred Compensation Plan | $ | 136,725 | $ | 8,901 | $ | 152,421 | |||||||||||
| Dave Hattem |
The Post-2004 Variable Deferred Compensation Plan | $ | 118,809 | $ | 81,903 | $ | 100,722 | $ | 755,590 | |||||||||
| Seth Bernstein |
The Variable Deferred Compensation Plan |
$ | 146,578 | $ | 1,332,200 | |||||||||||||
| (1) | The amounts reported in this column are also reported in the “All Other Compensation” column of the 2017 Summary Compensation Table above. |
| (2) | The amounts reported in this column are not reported in the 2017 Summary Compensation Table. |
| (3) | The amounts in this column that were previously reported as compensation in the Summary Compensation Table included in AXA Equitable Life’s Forms 10-K for the years ended December 31, 2016, 2015 and December 31, 2014 are: |
| Mr. Pearson |
$ | 1,016,981 | ||
| Mr. Malmström |
$ | 242,646 | ||
| Mr. Winikoff |
$ | 6,795 | ||
| Mr. Hattem |
$ | 339,865 |
The Post-2004 Plan
The above table reflects the excess 401(k) contributions made by AXA Equitable Life to the EQ Named Executive Officers under the Post-2004 Plan as well as amounts deferred by Mr. Hattem under the plan.
The Post-2004 Plan allows eligible employees to defer the receipt of up to 25% of their base salary and short-term incentive compensation. Deferrals are credited to a bookkeeping account in the participant’s name on the first day of the month following the month in which the compensation otherwise would have been paid to him or her. The account is used solely for record keeping purposes and no assets are actually placed into any account in the participant’s name.
Account balances in the Post-2004 Plan are credited with gains and losses as if invested in the available earnings crediting options chosen by the participant. The Post-2004 Plan currently offers a variety of earnings crediting options which are among those offered by the AXA Premier VIP Trust and EQAT.
Each year, participants in the Post-2004 Plan can elect to make deferrals into an account they have already established under the plan or they may open a new account, provided that they may not allocate any new deferrals into an account if they are scheduled to receive payments from the account in the next calendar year.
292
Table of Contents
When participants establish an account, they must elect the form and timing of payments for that account. They may receive payments of their account balance in a lump sum or in any combination of lump sum and/or annual installments paid over consecutive years. They may elect to commence payments from an account in July or December of any year after the year following the deferral election provided that payments must commence by the first July or December following age 71.
In addition, AXA Equitable Life provides excess 401(k) contributions in the Post-2004 Plan for participants in the 401(k) Plan with eligible compensation in excess of the qualified plan compensation limit. These contributions are equal to 10% of the participant’s (i) eligible compensation in excess of the qualified plan compensation limit ($270,000 in 2017) and (ii) voluntary deferrals to the Post-2004 Plan for the applicable year.
The Variable Deferred Compensation Plan for Executives (the “VDCP”)
The above table also reflects amounts deferred by Mr. Hattem under the VDCP. Under the VDCP, eligible employees were permitted to defer the receipt of up to 25% of their base salary and short-term incentive compensation. Deferrals were credited to a bookkeeping account in the participant’s name on the first day of the month following the month in which the compensation otherwise would have been paid to him or her. The account is used solely for record keeping purposes and no assets are actually placed into any account in the participant’s name. The VDCP was frozen as of December 31, 2004 so that no amounts earned or vested after 2004 can be deferred under the VDCP.
Account balances in the VDCP that are attributable to deferrals of base salary and short-term incentive compensation are credited with gains and losses as if invested in the available earnings crediting options chosen by the participant. The VDCP currently offers a variety of earnings crediting options.
Participants in the VDCP could elect to credit their deferrals to in-service or retirement distribution accounts. For retirement accounts, payments may be received in any combination of a lump sum and/or annual installments paid in consecutive years. Payments may begin in any January or July following the participant’s termination date, but they must begin by either the first January or the first July following the later of: (a) the participant’s attainment of age 65 and (b) the date that is thirteen months following the participant’s termination date. For in-service accounts, payments are made to the participant in December of the year elected by the participant in a lump sum or in up to five annual installments over consecutive years.
POTENTIAL PAYMENTS UPON TERMINATION OR CHANGE IN CONTROL – EQ NAMED EXECUTIVE OFFICERS
The tables below and the accompanying text present the hypothetical payments and benefits that would have been payable if the EQ Named Executive Officers terminated employment, or a change-in-control of AXA Financial occurred on December 31, 2017 (the “Trigger Date”) and uses the closing price of the AXA ordinary share on December 29, 2017, converted to U.S. dollars where applicable.
The payments and benefits described below are hypothetical only, as no such payments or benefits have been paid or made available. Hypothetical payments or benefits that would be due under arrangements that are generally available on the same terms to all salaried employees are not described.
Retirement
The only EQ Named Executive Officers eligible to retire on the Trigger Date were Mr. Pearson and Mr. Hattem. They would have been entitled to the following payments and benefits if they retired on the Trigger Date. For this purpose, “retirement” means termination of service on or after the normal retirement date or any early retirement date under the Retirement Plan.
293
Table of Contents
Short-Term Incentive Compensation: Mr. Pearson and Mr. Hattem would have received short-term incentive compensation awards for 2017 under the Retiree Short-Term Incentive Compensation Program in the following amounts:
| Mr. Pearson |
$ | 2,128,400 | ||
| Mr. Hattem |
$ | 650,000 |
Stock Options: All AXA stock options granted to Mr. Pearson and Mr. Hattem would have continued to vest and be exercisable until their expiration date, except in the case of misconduct (for which the options would be forfeited). The value at the Trigger Date of the AXA stock options that would have vested after 2017 for each of Messrs. Pearson and Hattem are:
| Mr. Pearson |
$ | 1,814,269 | ||
| Mr. Hattem |
$ | 539,584 |
Performance Shares: Mr. Pearson and Mr. Hattem would have been treated as if they continued in the employ of the company until the end of the vesting period for purposes of their AXA performance share awards. Accordingly, they would have received AXA Performance Share Plan payouts at the same time and in the same amounts as they would have received such payouts if they had not retired. The estimated values of those payouts at the Trigger Date assuming target performance are:
| Mr. Pearson |
$ | 9,848,883 | ||
| Mr. Hattem |
$ | 2,916,958 |
Retirement Benefits: Mr. Pearson and Mr. Hattem would have been entitled to the benefits described in the pension and nonqualified deferred compensation tables above.
Medical Benefits: Mr. Pearson and Mr. Hattem would have been entitled to access to retiree medical coverage without any company subsidy.
ESB Plan: Mr. Pearson and Mr. Hattem would have been entitled to continuation of their participation in the ESB Plan described above.
Voluntary Termination Other Than Retirement
Mr. Malmström
If Mr. Malmström had voluntarily terminated employment on the Trigger Date:
Short-Term Incentive Compensation: He would not have been entitled to a STIC Program award for 2017.
Stock Options: All vested and unvested AXA stock options granted to him would have been forfeited on his termination date.
Performance Shares: He would have forfeited all AXA performance shares on his termination date.
Retirement Benefits: He would have been entitled to the benefits described in the pension and nonqualified deferred compensation tables above, except that he would no longer be entitled to any benefits under the ESB Plan.
Mr. Winikoff
If Mr. Winikoff had voluntarily terminated on the Trigger Date for “good reason:”
| • | any outstanding RSUs granted to Mr. Winikoff would have immediately vested and been paid out in cash on their otherwise applicable payment dates (estimated value at the Trigger Date of $1,882,462); and |
294
Table of Contents
| • | he would have been eligible to receive a payment of $2,380,000 (equal to two times his annual base salary plus his STIC Program award target for 2017). This payment would have been contingent on the execution of a general release and waiver of claims against AXA Equitable Life and affiliates. |
For this purpose, “good reason” includes: (a) relocation of his position to a work site that is more than 35 miles away from 1290 Avenue of the Americas, New York City, (b) a material reduction in his compensation (other than in connection with, and substantially proportionate to, reductions by the company of the compensation of other similarly situated senior executives), (c) a material diminution in his duties, authority or responsibilities and (d) a material change in the lines of reporting such that he no longer reports to the company’s President and Chief Executive Officer.
Regardless of whether the voluntary termination was for “good reason,” Mr. Winikoff would have been entitled to the benefits described in the pension and nonqualified deferred compensation tables above, except that he would no longer be entitled to any benefits under the ESB Plan.
Mr. Pearson
If Mr. Pearson had voluntarily terminated on the Trigger Date for “good reason” as described below, he would have been entitled to: (i) temporary income payments equal to the sum of two years of salary and two times the greatest of: (a) Mr. Pearson’s most recent STIC Program award, (b) the average of Mr. Pearson’s last three STIC Program awards and (c) Mr. Pearson’s target STIC Program award for the year in which termination occurred; (ii) a pro-rated STIC Program award at target for the year of termination; and (iii) a cash payment equal to the additional employer contributions that Mr. Pearson would have received under the 401(k) Plan and its related excess plan for the year of his termination if those plans provided employer contributions on his temporary income payments and all of his temporary income payments were paid in that year.
For this purpose, “good reason” includes a material reduction in Mr. Pearson’s duties or authority, the removal of Mr. Pearson from his positions, AXA Equitable Life requiring Mr. Pearson to be based at an office more than 75 miles from New York City, a diminution of Mr. Pearson’s titles, a material failure by the company to comply with the agreement’s compensation provisions, a failure of the company to secure a written assumption of the agreement by any successor company and a change in control of AXA Financial (provided that Mr. Pearson delivers notice of termination within 180 days after the change in control). The severance benefits are contingent upon Mr. Pearson releasing all claims against AXA Equitable Life and its affiliates and his entitlement to severance pay will be discontinued if he provides services for a competitor. Also, in the event of a termination of Mr. Pearson’s employment by AXA Equitable Life without cause or Mr. Pearson’s resignation due to a change in control, Mr. Pearson’s severance benefits will cease after one year if certain performance conditions are not met for each of the two consecutive fiscal years immediately preceding the year of termination.
Mr. Pearson would have received the following amounts if he had voluntarily terminated for good reason on the Trigger Date and released all claims against AXA Equitable Life and its affiliates:
| Temporary Income Payments |
$ | 7,133,333 | ||
| Pro-Rated Bonus |
$ | 2,128,400 | ||
| Cash Payment |
$ | 713,333 |
In addition, because Mr. Pearson was eligible to retire on the Trigger Date, he would have been eligible for the retirement benefits described above, regardless of whether he terminated for good reason.
Mr. Hattem
Because Mr. Hattem was eligible to retire on the Trigger Date, he would have been eligible for the retirement benefits described above.
295
Table of Contents
Death
If the EQ Named Executive Officers had terminated employment due to death on the Trigger Date:
Short-Term Incentive Compensation: The EQ Named Executive Officers’ estates would not have been entitled to any STIC Program awards for 2017.
Stock Options: All AXA stock options would have immediately vested and would have continued to be exercisable until the earlier of their expiration date and the six-month anniversary of the date of death. The estimated values of the AXA stock options with accelerated vesting are:
| Mr. Pearson |
$ | 1,814,269 | ||
| Mr. Malmström |
$ | 528,852 | ||
| Mr. Winikoff |
$ | 55,208 | ||
| Mr. Hattem |
$ | 539,584 |
Performance Shares: The total number of AXA performance shares granted in 2015, 2016 and 2017 would have been multiplied by an assumed performance factor of 1.3 and the second tranche of the performance shares granted in 2014 would have been multiplied by the actual performance factor for that tranche. The performance shares would have been paid in AXA ordinary shares to the executive’s heirs within 90 days following death. The estimated values of those payouts are:
| Mr. Pearson |
$ | 12,399,355 | ||
| Mr. Malmström |
$ | 3,632,936 | ||
| Mr. Winikoff |
$ | 1,244,695 | ||
| Mr. Hattem |
$ | 3,681,560 |
Restricted Stock Units: Mr. Winikoff’s RSUs would have immediately vested in full for an estimated value of $1,882,462.
Retirement Benefits: The executives’ heirs would have been entitled to the benefits described in the pension and nonqualified deferred compensation tables above.
Involuntary Termination Without Cause
EQ Named Executive Officers Other than Mr. Pearson
The EQ Named Executive Officers, excluding Mr. Pearson, would have been eligible for severance benefits under the Severance Benefit Plan, as supplemented by the Supplemental Severance Plan (collectively, the “Severance Plan”), if an involuntary termination of employment had occurred on the Trigger Date that satisfied the conditions in the Severance Plan. To receive benefits, the executives would have been required to sign a separation agreement including a release of all claims against AXA Equitable Life and its affiliates and non-solicitation provisions.
The severance benefits would have included:
| • | temporary income payments equal to 52 weeks’ of base salary; |
| • | additional temporary income payments equal to the greater of: (i) the most recent STIC Program award paid to the executive, (ii) the average of the three most recent STIC Program awards paid to the executive or (iii) the executive’s target STIC Program award for 2017; |
| • | a lump sum payment equal to the sum of: (i) the executive’s target STIC Program award for 2017 and (ii) $40,000; and |
| • | one year’s continued participation in the ESB Plan. |
296
Table of Contents
The EQ Named Executive Officers would have had a one-year severance period. If an EQ Named Executive Officer would have been eligible to retire prior to the end of the severance period, all AXA stock options granted to him would have continued to vest and be exercisable until their expiration date, except in the case of misconduct (for which the options would be forfeited). Also, the EQ Named Executive Officer would have been treated as if he continued in the employ of AXA Equitable Life until the end of the vesting period for his AXA performance shares.
In addition to the above, Mr. Winikoff would have received the following:
| • | the immediately vesting of his outstanding RSUs for an estimated value of $1,882,462 and |
| • | a payment equal to (i) two times his annual base salary plus his STIC Program award target for 2017, reduced by (ii) any severance pay for which he would otherwise eligible under the Severance Plan or the Supplemental Severance Plan. This payment would be contingent on all other terms and conditions of the Severance Plan and Supplemental Severance Plan, including the execution of a general release and waiver of claims against AXA Equitable Life and affiliates. |
The following table lists the payments that the EQ Named Executive Officers would have received if they were involuntarily terminated under the Severance Plan on the Trigger Date as well as the implications for their AXA stock option and AXA performance share awards:
| Temporary Income Payments |
Lump Sum Payment |
AXA Stock Options |
AXA Performance Shares | |||||||||
| Mr. Malmström | $ | 1,505,946 | $ | 840,000 | Options would continue to be exercisable and vest until the earlier of their expiration date and 30 days after the end of the one-year severance period. | Forfeited | ||||||
| Mr. Winikoff | $ | 1,635,596 | $ | 2,584,404 | Options would continue to be exercisable and vest until the earlier of their expiration date and 30 days after the end of the one-year severance period. | Forfeited | ||||||
| Mr. Hattem | $ | 1,355,351 | $ | 690,000 | Continued vesting in all options and ability to exercise the options through expiration date. | Would receive payouts in the same time and in the same amounts as if he had continued to be employed. | ||||||
Mr. Pearson
Under Mr. Pearson’s employment agreement, he waived any right to participate in the Severance Plan. Rather, if Mr. Pearson’s employment had been terminated without “cause” on the Trigger Date, he would have been entitled to the same benefits as termination for good reason as described above, subject to the same conditions. “Cause” is defined in Mr. Pearson’s employment agreement as: (i) willful failure to perform substantially his duties after reasonable notice of his failure, (ii) willful misconduct that is materially injurious to the company, (iii) conviction of, or plea of nolo contedere to, a felony or (iv) willful breach of any written covenant or agreement with the company to not disclose information pertaining to them or to not compete or interfere with the company.
297
Table of Contents
Change-in-Control
With the exception of Mr. Pearson, none of the EQ Named Executive Officers are entitled to any special benefits upon a change-in-control of AXA Financial other than the benefits provided for all AXA stock options granted under the AXA Stock Option Plan. For those options, if there is a change in control of AXA Financial, all unvested options will become immediately exercisable for their term regardless of the otherwise applicable exercise schedule. The value of the AXA stock options that would have immediately vested for each EQ Named Executive Officer is:
| Mr. Pearson |
$ | 1,814,269 | ||
| Mr. Malmström |
$ | 528,852 | ||
| Mr. Winikoff |
$ | 55,208 | ||
| Mr. Hattem |
$ | 539,584 |
As mentioned above, Mr. Pearson’s employment agreement provides that “good reason” includes Mr. Pearson’s termination of employment in the event of a change in control (provided that Mr. Pearson delivers notice of termination within 180 days after the change in control). Accordingly, Mr. Pearson would have been entitled to the benefits described above for a voluntary termination for good reason, subject to the same conditions. For this purpose, a change in control includes: (a) any person becoming the beneficial owner of more than 50% of the voting stock of AXA Financial, (b) AXA and its affiliates ceasing to control the election of a majority of the AXA Financial Board of Directors and (c) approval by AXA Financial’s stock holders of a reorganization, merger or consolidation or sale of all or substantially all of the assets of AXA Financial unless AXA and its affiliates owned directly or indirectly more than 50% of voting power of the company resulting from such transaction.
POTENTIAL PAYMENTS UPON TERMINATION OR CHANGE IN CONTROL – MR. BERNSTEIN
Estimated payments and benefits to which Mr. Bernstein would have been entitled upon a change in control of AB or the specified qualifying events of termination of employments as of the Trigger Date, using the closing price of an AB Holding Unit on December 29, 2017, are as follows:
Change in Control
| Cash |
Equity | Other Benefits | Total | |||||||||||
| $ | $ | 4,125,885 | $ | $ | 4,125,885 | |||||||||
Termination Due to Non-Extension of Employment Term
| Cash |
Equity | Other Benefits | Total | |||
| $4,125,885 | $ | $4,125,885 |
Termination by Mr. Bernstein for Good Reason or by AB other than for Cause
| Cash |
Equity | Other Benefits | Total | |||
| $3,500,000 | $4,125,885 | $13,610 | $7,639,495 |
Death or Disability
| Cash |
Equity | Other Benefits | Total | |||
| $4,125,885 | $13,610 | $4,139,495 |
298
Table of Contents
Termination by Mr. Bernstein for Good Reason or by AB without cause prior to May 1, 2018 and within 12 months of a change in control
| Cash |
Equity | Other Benefits | Total | |||
| $10,500,000 | $4,125,885 | $13,610 | $14,639,495 |
2017 DIRECTOR COMPENSATION
In 2017, the following individuals served as directors of Holdings: Thomas Buberl, the Chief Executive Officer of AXA, George Stansfield, the Deputy Chief Executive Officer of AXA, and Messrs. Harlin, Pearson and Malmström. Mr. Buberl, Mr. Stansfield and Mr. Harlin were not compensated by the Company in respect of their services as directors of Holdings.
Mr. Stansfield received $231,870 in compensation during 2017 for services provided to AXA Financial. All of the compensation paid to Messrs. Pearson and Malmström is fully reflected in the Summary Compensation Table above.
Following our offering, the directors of Holdings will be the individuals listed above under the heading “Management—Directors.”
Changes to Director Compensation in Connection with the Offering
We expect to implement a non-officer director compensation program following the offering, including a mix of cash and equity compensation as well as certain benefits.
Cash Retainers and Equity-Based Award
| Compensation Item |
Amount | |
| Cash Retainer |
$100,000 paid quarterly | |
| Equity Award |
$150,000 annual stock grant with no vesting restrictions ($105,000 for 2018) | |
| Committee Chair Retainers |
Audit Committee: $30,000 Compensation Committee: $25,000 Nominating & Governance Committee: $20,000 Finance & Risk Committee: $20,000 |
Benefits
Benefits provided to the non-officer directors will include:
| • | a matching gift program, up to $2,000 per year; |
| • | business travel accident insurance up to four times annual compensation, subject to certain maximums; and |
| • | reimburse of costs for attending director education programs offered by third parties, including related reasonable travel and lodging expenses, up to a maximum amount of $5,000 per director each calendar year. |
Stock Ownership
We intend to implement a stock ownership policy under which our non-officer directors will be required to hold five times the value of their annual cash retainer in Holdings stock and/or AB Holding Units. The directors will be required to retain 100% of any net shares (after the payment of taxes) received as compensation until the ownership requirement is achieved.
299
Table of Contents
PRINCIPAL AND SELLING STOCKHOLDERS
The following table sets forth information as of April 26, 2018 with respect to the ownership of our common stock by:
| • | each person known to own beneficially more than five percent of our common stock, including the selling stockholder; |
| • | each of our directors; |
| • | each of our named executive officers; and |
| • | all of our current executive officers and directors as a group. |
The amounts and percentages of shares beneficially owned are reported on the basis of regulations of the SEC governing the determination of beneficial ownership of securities. Under SEC rules, a person is deemed to be a “beneficial owner” of a security if that person has or shares voting power or investment power, which includes the power to dispose of or to direct the disposition of such security. A person is also deemed to be a beneficial owner of any securities of which that person has a right to acquire beneficial ownership within 60 days. Securities that can be so acquired are deemed to be outstanding for purposes of computing such person’s ownership percentage, but not for purposes of computing any other person’s percentage. Under these rules, more than one person may be deemed to be a beneficial owner of the same securities, and a person may be deemed to be a beneficial owner of securities as to which such person has no economic interest.
Percentage computations are based on approximately 561,000,000 shares of our common stock outstanding as of April 26, 2018, and 561,000,000 shares outstanding following this offering. The numbers of shares on the following table have been adjusted to reflect our 459.4752645-for-1 stock split effected on April 24, 2018.
Except as otherwise indicated in these footnotes, each of the beneficial owners listed has, to our knowledge, sole voting and investment power with respect to the indicated shares of common stock. Unless otherwise set forth in the footnotes to the table, the address for each listed stockholder is c/o 1290 Avenue of the Americas, New York, New York 10104.
| Shares Beneficially Owned Before the Offering and After the Offering Assuming the Underwriters’ Option is Not Exercised(1) |
Shares Beneficially Owned After the Offering Assuming the Underwriters’ Option is Exercised in Full |
|||||||||||||||||||||||||||
| Name of Beneficial |
Number of Shares Owned |
Percent of Class Before the Offering (%) |
Shares Offered Hereby |
Number of Shares Owned |
Percent of Class After the Offering (%) |
Number of Shares Owned |
Percent of Class After the Offering (%) |
|||||||||||||||||||||
| AXA(2) |
561,000,000 | 100.0 | 137,250,000 | 423,750,000 | 75.5 | 403,162,500 | 71.9 | |||||||||||||||||||||
| Thomas Buberl |
— | — | — | — | — | — | — | |||||||||||||||||||||
| Gérald Harlin |
— | — | — | — | — | — | — | |||||||||||||||||||||
| Daniel G. Kaye |
— | — | — | — | — | — | — | |||||||||||||||||||||
| Ramon de Oliveira |
— | — | — | — | — | — | — | |||||||||||||||||||||
| Mark Pearson |
— | — | — | — | — | — | — | |||||||||||||||||||||
| Bertrand Poupart-Lafarge |
— | — | — | — | — | — | — | |||||||||||||||||||||
| Karima Silvent |
— | — | — | — | — | — | — | |||||||||||||||||||||
| George Stansfield |
— | — | — | — | — | — | — | |||||||||||||||||||||
| Charles G. T. Stonehill |
— | — | — | — | — | — | — | |||||||||||||||||||||
| Seth Bernstein |
— | — | — | — | — | — | — | |||||||||||||||||||||
| Dave Hattem |
— | — | — | — | — | — | — | |||||||||||||||||||||
| Jeffrey Hurd |
— | — | — | — | — | — | — | |||||||||||||||||||||
| Anders Malmström |
— | — | — | — | — | — | — | |||||||||||||||||||||
| Brian Winikoff |
— | — | — | — | — | — | — | |||||||||||||||||||||
| All current directors and executive officers as a group (14 persons) |
— | — | — | — | — | — | — | |||||||||||||||||||||
300
Table of Contents
| * | Less than one percent. |
| (1) | The selling stockholder has granted the underwriters an option to purchase up to an additional 20,587,500 shares. |
| (2) | Does not give effect to the up to 33,823,529 shares of our common stock (assuming $750 million principal amount, the midpoint of the price range set forth on the cover page of this prospectus and exercise of the initial purchasers’ option to purchase additional securities) that AXA would agree to deliver upon exchange of the mandatorily exchangeable securities that AXA is offering concurrently with this offering. AXA would continue to have the right to vote those shares until delivery. AXA’s principal place of business is 21-25 avenue Matignon, 75008 Paris, France. |
The following tables set forth information as of April 1, 2018 regarding the ownership of common stock of AXA and of AB Holding Units and AB Units by each of our directors and executive officers and by all of our directors and executive officers as a group.
| AXA Common Stock(1) | ||||||||
| Name of Beneficial Owner |
Number of Shares Owned |
Percent of Class (%) |
||||||
| Thomas Buberl(2) |
384,080 | * | ||||||
| Gérald Harlin(3) |
487,195 | * | ||||||
| Daniel G. Kaye |
10,493 | * | ||||||
| Ramon de Oliveira(4) |
36,546 | * | ||||||
| Mark Pearson(5) |
1,019,311 | * | ||||||
| Bertrand Poupart-Lafarge(6) |
106,803 | * | ||||||
| Karima Silvent(7) |
40,634 | * | ||||||
| George Stansfield(8) |
276,726 | * | ||||||
| Charles G. T. Stonehill(9) |
1,890 | * | ||||||
| Seth Bernstein |
— | * | ||||||
| Dave Hattem(10) |
110,973 | * | ||||||
| Jeffrey Hurd |
— | * | ||||||
| Anders Malmström(11) |
128,559 | * | ||||||
| Brian Winikoff(12) |
32,276 | * | ||||||
| All current directors and executive officers as a group (14 persons)(13) |
2,635,486 | * | ||||||
| * | Number of shares listed represents less than 1% of the outstanding AXA common stock. |
| (1) | Holdings of AXA American Depositary Shares (“ADS”) are expressed as their equivalent in AXA ordinary shares. Each AXA ADS represents the right to receive one AXA ordinary share. |
| (2) | Includes (i) 16,267 shares Mr. Buberl can acquire within 60 days under option plans, (ii) 184,012 unvested AXA performance shares and (iii) 4,295 units in AXA employee shareholding plans. |
| (3) | Includes (i) 99,800 shares Mr. Harlin can acquire within 60 days under option plans, (ii) 103,411 unvested AXA performance shares and (iii) 18,613 units in AXA employee shareholding plans. |
| (4) | Includes 4,361 shares Mr. de Oliveira can acquire within 60 days under option plans. |
| (5) | Includes (i) 570,840 shares Mr. Pearson can acquire within 60 days under option plans and (ii) 203,470 unvested AXA performance shares. |
| (6) | Includes (i) 47,504 shares Mr. Poupart-Lafarge can acquire within 60 days under option plans, (ii) 31,840 unvested AXA performance shares and (iii) 7,396 units in AXA employee shareholding plans. |
| (7) | Includes 28,961 unvested AXA performance shares. |
| (8) | Includes (i) 57,268 shares Mr. Stansfield can acquire within 60 days under option plans, (ii) 111,145 unvested AXA performance shares and (iii) 20,480 units in AXA employee shareholding plans. |
| (9) | Includes 1,890 deferred stock units under The Equity Plan for Directors. |
| (10) | Includes (i) 22,626 shares Mr. Hattem can acquire within 60 days under option plans and (ii) 64,671 unvested AXA performance shares. |
| (11) | Includes (i) 36,058 shares Mr. Malmström can acquire within 60 days under option plans and (ii) 62,654 unvested AXA performance shares. |
301
Table of Contents
| (12) | Includes 32,276 unvested AXA performance shares. |
| (13) | Includes 854,724 shares the directors and executive officers as a group can acquire within 60 days under option plans. |
| AB Holding and AB Units | AllianceBernstein Holding L.P. | AllianceBernstein L.P. | ||||||||||||||
| Name of Beneficial Owner |
Number of Units Owned(1) |
Percent of Class (%) |
Number of Units Owned(1) |
Percent of Class (%) |
||||||||||||
| Thomas Buberl |
— | * | — | * | ||||||||||||
| Gérald Harlin |
— | * | — | * | ||||||||||||
| Daniel G. Kaye |
7,059 | * | — | * | ||||||||||||
| Ramon de Oliveira |
7,059 | * | — | * | ||||||||||||
| Mark Pearson |
— | * | — | * | ||||||||||||
| Bertrand Poupart-Lafarge |
— | * | — | * | ||||||||||||
| Karima Silvent |
— | * | — | * | ||||||||||||
| George Stansfield |
— | * | — | * | ||||||||||||
| Charles G. T. Stonehill |
— | * | — | * | ||||||||||||
| Seth Bernstein(2) |
164,706 | * | — | * | ||||||||||||
| Dave Hattem |
— | * | — | * | ||||||||||||
| Jeffrey Hurd |
— | * | — | * | ||||||||||||
| Anders Malmström |
— | * | — | * | ||||||||||||
| Brian Winikoff |
— | * | — | * | ||||||||||||
| All current directors and executive officers as a group (14 persons) |
178,824 | * | — | * | ||||||||||||
| * | Number of Holding Units listed represents less than 1% of the Units outstanding. |
| (1) | Excludes units beneficially owned by AXA and its subsidiaries. |
| (2) | Reflects 164,706 restricted AB Holding Units awarded to Mr. Bernstein pursuant to the CEO Employment Agreement that have not yet vested. |
302
Table of Contents
CERTAIN RELATIONSHIPS AND RELATED PARTY TRANSACTIONS
Policies and Procedures for Related Person Transactions
Holdings
Prior to the settlement of this offering, our Board will approve written policies and procedures with respect to the review and approval of certain transactions between us and a “Related Person,” or a “Related Person Transaction,” which we refer to as our “Related Person Transaction Policy.” Pursuant to the terms of the Related Person Transaction Policy, our Board, acting through our Audit Committee, must review and decide whether to approve or ratify any Related Person Transaction. Any potential Related Person Transaction is required to be reported to our legal department, which will then determine whether it should be submitted to our Audit Committee for consideration. The Audit Committee must then review and decide whether to approve any Related Person Transaction.
For the purposes of the Related Person Transaction Policy, a “Related Person Transaction” is a transaction, arrangement or relationship (or any series of similar transactions, arrangements or relationships) in which we were, are or will be a participant and the amount involved exceeds $120,000, and in which any Related Person had, has or will have a direct or indirect interest.
A “Related Person,” as defined in the Related Person Transaction Policy, means any person who is, or at any time since the beginning of our last fiscal year was, a director or executive officer of Holdings or a nominee to become a director of Holdings; any person who is known to be the beneficial owner of more than five percent of our common stock; any immediate family member of any of the foregoing persons, including any child, stepchild, parent, stepparent, spouse, sibling, mother-in-law, father-in-law, son-in-law, daughter-in-law, brother-in-law, or sister-in-law of the director, executive officer, nominee or more than five percent beneficial owner, and any person (other than a tenant or employee) sharing the household of such director, executive officer, nominee or more than five percent beneficial owner; and any firm, corporation or other entity in which any of the foregoing persons is a general partner or, for other ownership interests, a limited partner or other owner in which such person has a beneficial ownership interest of ten percent or more.
AB
The partnership agreements for each of AB Holding and ABLP expressly permit AXA and its affiliates, which includes Holdings and its subsidiaries (collectively, “AXA Affiliates”), to provide services to AB Holding and ABLP if the terms of the transaction are approved by the General Partner in good faith as being comparable to (or more favorable to each such partnership than) those that would prevail in a transaction with an unaffiliated party. This requirement is conclusively presumed to be satisfied as to any transaction or arrangement that (i) in the reasonable and good faith judgment of the General Partner, meets that unaffiliated party standard, or (ii) has been approved by a majority of those directors of the General Partner who are not also directors, officers or employees of an affiliate of the General Partner.
In practice, ABLP’s management pricing committees review investment advisory agreements with AXA Affiliates, which is the manner in which the General Partner reaches a judgment regarding the appropriateness of the fees. Other transactions with AXA Affiliates are submitted to ABLP’s audit committee for review and approval.
Relationship with AXA Following this Offering
We are a wholly owned subsidiary of AXA, and have been part of AXA’s consolidated business operations, and we will remain a wholly owned subsidiary of AXA until the settlement of this offering. Following this offering, AXA will continue to hold a majority of our outstanding common stock, and as a result AXA will continue to have control of our business, including pursuant to the agreements described below. AXA has
303
Table of Contents
announced its intention to sell all of its interest in the Company over time with intended sales of shares of our common stock subsequent to this offering, subject to the 180-day lock-up agreement described under “Underwriting” and market conditions. AXA is under no obligation to do so and retains the sole discretion to determine the timing of any future sales of shares of our common stock. See “Risk Factors—Risks Relating to Our Controlling Stockholder—Following the settlement of this offering, AXA will continue to control us and may have conflicts of interest with other stockholders. Conflicts of interest may arise because affiliates of our controlling stockholder have continuing agreements and business relationships with us.” In addition, we expect that AXA will continue to fully consolidate our financial results in AXA’s consolidated financial statements.
Shareholder Agreement
We will enter into a shareholder agreement (the “Shareholder Agreement”) with AXA prior to the settlement of this offering that will govern the relationship between AXA and us following this offering. The Shareholder Agreement will address the composition of our Board and its committees, other corporate governance matters, AXA approval and consent rights with respect to specified business and corporate actions, and rights that AXA will have with respect to business and financial information and financial accounting matters. The form of the Shareholder Agreement has been filed as an exhibit to the registration statement of which this prospectus forms a part.
Board of Directors and AXA Rights with Respect to Director Designation
The Shareholder Agreement will entitle AXA, in connection with any election of directors by our stockholders, to have our Board include in the candidates it designates for election (the “Company Slate”) a specified number of directors designated by AXA (“AXA Directors”). The number of AXA Directors that AXA is entitled to have included on the Company Slate will be based on its beneficial ownership of our common stock, as follows:
| • | until the date on which AXA ceases to beneficially own more than 50% of our outstanding common stock (which is referred to as the “Majority Holder Date”), AXA will be entitled to designate a majority of the directors on the Board, which such majority shall initially be five AXA Directors; |
| • | following the Majority Holder Date, and until and including the date on which AXA ceases to beneficially own at least 35% of our outstanding common stock (which is referred to as the “First Threshold Date”), AXA will be entitled to designate three AXA Directors; and |
| • | following the First Threshold Date, and until and including the date on which AXA ceases to beneficially own at least 10% of our outstanding common stock (which is referred to as the “Fourth Threshold Date”), AXA will be entitled to designate two AXA Directors. |
Following the Fourth Threshold Date, AXA will have no further right to designate AXA Directors.
The Shareholder Agreement also will provide that, as of the completion of this offering and until the Majority Holder Date, our Board will consist of nine members, one of whom will be our CEO and three of whom will be independent directors, as defined by NYSE listing rules and Rule 10A-3 under the Exchange Act (“Independent Directors”). Until and including the date on which AXA ceases to beneficially own at least 30% of our outstanding common stock (which is referred to as the “Second Threshold Date”), our Board may not change the number of directors without the consent of AXA. Until the Majority Holder Date, we will also be obligated under the Shareholder Agreement to, and to use our best efforts to cause the Board to, cause the Chairman of the Board to be an AXA Director.
In addition, the Shareholder Agreement will include provisions relating to the membership and conduct of our Board committees, including providing that:
| • | until the earlier of the date immediately preceding the first anniversary of the effectiveness of the registration statement of which this prospectus forms a part and the Second Threshold Date, our Audit |
304
Table of Contents
| Committee shall consist of three Independent Directors and one AXA Director, who need not be an Independent Director; and afterwards the AXA Director shall resign from the Audit Committee and, thereafter, such committee shall consist of three Independent Directors; |
| • | if the Second Threshold Date occurs after the first anniversary of the effectiveness of the registration statement of which this prospectus forms a part, then until the Second Threshold Date, AXA shall have the right to designate one Independent Director to the Audit Committee, so long as such Independent Director meets the NYSE standards for audit committee membership; |
| • | until the Majority Holder Date, AXA shall have the right to designate one AXA Director who shall be appointed by the Board to the Compensation Committee; and within 60 days after the Majority Holder Date, the AXA Director shall resign from the Compensation Committee and thereafter, the Compensation Committee shall consist of three Independent Directors; and after the Majority Holder Date and until the Second Threshold Date, AXA shall have the right to designate one Independent Director to the Compensation Committee; |
| • | until the Majority Holder Date, except for such matters as are reserved for approval by a subcommittee of qualified directors, our Compensation Committee may not act without the consent of a majority of the Compensation Committee, which majority must include an AXA Director; |
| • | until the Majority Holder Date, AXA shall have the right to designate one AXA Director who shall be appointed by the Board to the Nominating and Governance Committee; and within 60 days after the Majority Holder Date, the AXA Director shall resign from the Compensation Committee and thereafter, the Nominating and Governance Committee shall consist of three Independent Directors; and after the Majority Holder Date and until the Second Threshold Date, AXA shall have the right to designate one Independent Director to the Nominating and Governance Committee; |
| • | until the Majority Holder Date, unless such action is required by applicable law to be approved solely by Independent Directors, our Nominating and Governance Committee may not act without the consent of a majority of the Nominating and Governance Committee, which majority must include an AXA Director; |
| • | until the Majority Holder Date, two AXA Directors shall serve on the Executive Committee of the Board; following the Majority Holder Date but prior to the First Threshold Date, one AXA Director shall serve on the Executive Committee of the Board; |
| • | until the Majority Holder Date, our Executive Committee may not act without the consent of a majority of the Executive Committee, which majority must include an AXA Director; |
| • | until the Second Threshold Date, AXA shall have the right to designate one of the three Independent Directors who constitute our Finance and Risk Committee; |
| • | until the date on which AXA ceases to beneficially own at least 20% of our outstanding common stock (which is referred to as the “Third Threshold Date”), AXA is entitled to have one observer present at meetings of our Management Risk Committee and our Asset Liability Management Committee and to receive all materials, reports and other communications from such committees; and |
| • | our Board committees shall have the membership and responsibilities described under “Management—Corporate Governance—Board Committees”. |
Consent Rights
The Shareholder Agreement will provide that, until the Second Threshold Date, the prior written consent of AXA will be required before we may take any of the following actions, whether directly or indirectly through a subsidiary:
| • | any merger, consolidation or similar transaction (or any amendment to or termination of an agreement to enter into such a transaction) involving us or any of our subsidiaries, on the one hand, and any other |
305
Table of Contents
| person, on the other hand; other than (A) an acquisition of 100% of the capital stock of such other person or (B) disposition of 100% of the capital stock of one of our subsidiaries, in each case involving consideration not exceeding $250 million; |
| • | any acquisition or disposition of securities, assets or liabilities (including through reinsurance transactions) involving consideration or book value greater than $250 million, other than transactions involving assets invested in our consolidated general account and approved in accordance with our established policies and procedures to monitor invested assets; |
| • | any change in our authorized capital stock or the creation of any new class or series of our capital stock; |
| • | any issuance or acquisition of capital stock (including stock buy-backs, redemptions or other reductions of capital), or securities convertible into or exchangeable or exercisable for capital stock or equity-linked securities, except (i) issuances of equity awards to directors or employees pursuant to an equity compensation plan approved by the Board; (ii) issuances or acquisitions of capital stock of one of our subsidiaries (except for acquisitions of AB Units or AB Holding Units) to or by one of our wholly-owned subsidiaries; (iii) issuances or acquisitions of capital stock that our Board determines are necessary to maintain compliance with covenants contained in any debt instrument; and (iv) acquisitions of capital stock in connection with the funding of equity awards or to prevent shareholder dilution from the issuance of equity awards; |
| • | any issuance or acquisition of debt securities to or from a third party involving an aggregate principal amount exceeding $250 million |
| • | any other incurrence of a debt obligation to or from a third party by having a principal amount greater than $250 million, subject to specified exceptions; |
| • | entry into or termination of any joint venture or cooperation arrangements involving assets having a value exceeding $250 million; |
| • | listing or delisting of any securities on a securities exchange, other than the listing or delisting of debt securities on the NYSE or any other securities exchange located solely in the United States; |
| • | (A) the formation of, or delegation of authority to, any new committee, or subcommittee thereof, of the Board, (B) the delegation of authority to any existing committee or subcommittee thereof not set forth in the committee’s charter or authorized by the Board prior to the settlement of this offering or (C) any amendments to the charter (or equivalent authorizing document) of any committee, including any action to increase or decrease size of any committee (whether by amendment or otherwise), except in each case as required by applicable law; |
| • | any amendment (or approval or recommendation of any amendment) to our certificate of incorporation or by-laws; |
| • | any filing or petition under bankruptcy laws, admission of insolvency or similar actions by us or any of our subsidiaries, or our dissolution or winding-up; |
| • | any commencement or settlement of material litigation or any regulatory proceedings if such litigation or regulatory proceeding is material to AXA or could reasonably be expected to have a material adverse effect on AXA’s reputation; |
| • | entry into any material written agreement or settlement with, or any material written commitment to, a regulatory agency, or any settlement of a material enforcement action if such agreement, settlement or commitment is material to AXA or could reasonably be expected to have a material adverse effect on AXA’s reputation; |
| • | the election, appointment, hiring, dismissal or removal (other than for cause) of the Company’s CEO or CFO; |
306
Table of Contents
| • | the entry into, termination of or material amendment of any material contract with a third party, subject to specified exceptions; |
| • | any material change to the nature or scope of the Company’s business immediately prior to the settlement of this offering; or |
| • | any material change in hedging strategy. |
Information Rights, Disclosure and Financial Accounting
The Shareholder Agreement will require us, as long as AXA is required under IFRS to consolidate our financial results with its financial results, and in any case for all financial periods commencing prior to the Majority Holder Date, to continue to provide AXA with (A) information and data relating to our and our subsidiaries’ business and financial results and (B) access to our personnel, data and systems. During this period, we will also be required to provide all information required or requested by AXA (i) in order for AXA to comply with its Solvency II obligations and (ii) necessary for AXA to produce any requested actuarial indicators.
Following the time at which the provisions of the immediately preceding paragraph cease to apply, and until the later of (1) the date when AXA is no longer required under IFRS (x) to account in its financial statements for its holdings in us under an equity method or (y) to consolidate our financial results with its financial results and (2) the Third Threshold Date, we will be obligated to (A) provide AXA with (i) information and data relating to our business and financial results (ii) access to our personnel, data and systems, (iii) information and data relating to AXA’s Solvency II obligations and (iv) information and data necessary for AXA to produce any requested actuarial indicators and (B) maintain all necessary controls and procedures.
The Shareholder Agreement will provide that, until the date on which AXA is no longer required under IFRS to account in its financial statements for its holdings in us under an equity accounting method, AXA will have certain access and cooperation rights with respect to the independent public registered accounting firm responsible for the audit of our financial statements and to our internal audit function.
The Shareholder Agreement will also provide that, until the Third Threshold Date, we shall consult and coordinate with AXA with respect to public disclosures and filings, including in connection with our quarterly and annual financial results.
Rights with Respect to Policies and Conduct
The Shareholder Agreement will provide that, until the Majority Holder Date, our Board shall, when determining to implement, amend or rescind any of our or our subsidiaries’ policies relating to risk, capital, investment, environmental and social responsibility or regulatory compliance (each, a “Critical Policy”), take into account our status as a consolidated subsidiary of AXA, and the interests of AXA with respect to such policies and the requirement for us to comply with AXA’s standards.
In addition, during any period in which AXA is deemed to control us for U.S., European Commission or French regulatory purposes, and in any case at all times prior to the Third Threshold Date, we (i) may not adopt or implement any policies or procedures, and at AXA’s reasonable request, must refrain from taking any actions, that would cause AXA to violate any applicable laws to which AXA is subject; (ii) must, prior to implementing, amending or rescinding any Critical Policy, consult with AXA and, to the extent consistent with its fiduciary duties, our Board must take into account the interests of AXA with respect thereto; and (iii) must maintain and observe the policies of AXA to the extent necessary for AXA to comply with its legal or regulatory obligations.
Provisions Relating to Specific Regulatory Requirements
Pursuant to the Shareholder Agreement, during any period in which we are deemed to be under the control of AXA and at all times prior to the Third Threshold Date, we will, upon request from AXA, promptly provide
307
Table of Contents
any information, records or documents requested or demanded by any governmental or regulatory authority with jurisdiction over AXA or necessary for AXA in connection with any filing, report or response to such entities and will, upon reasonable notice, provide access to such entities to our offices, employees and management, where and as required under applicable law.
Provisions Relating to Indemnification and Liability Insurance
The Shareholder Agreement will provide that, until at least the day after the last date on which any director, officer, employee or certain designees of AXA or any of its subsidiaries (an “AXA Individual”) is a director, officer or employee of the Company, we must indemnify (including advancement of expenses) each such directors, officers and employees to the greatest extent permitted under Section 145 of the DGCL and other applicable laws. Such indemnification must continue as to any AXA Individual who becomes entitled to indemnification notwithstanding any subsequent change in our indemnification policies or, with respect to liabilities existing or arising from events that have occurred on or prior to such date, that such AXA Individual ceases to be a director, officer or employee of the Company. The Shareholder Agreement will also require that we renew annually our insurance coverage with respect to director and officer and other fiduciary liability and liabilities under U.S. federal and state securities laws covering directors, officers and employees of the Company, AXA Individuals, the Company and respective Subsidiaries of the Company.
Provisions with respect to certain obligations of the Company guaranteed by AXA or its subsidiaries
The Shareholder Agreement will also provide that (i) to the extent AXA or any of its subsidiaries (other than the Company) shall at any time make any payments or be obligated to post collateral with respect to any Company obligations that are the subject of a guarantee by AXA or its subsidiaries, the Company shall immediately reimburse or transfer assets to AXA or such subsidiary for the full amount of such payments or collateral obligations and reimburse AXA or such subsidiary for all reasonable expenses incurred by AXA or the subsidiary in connection with making such payments or posting such collateral and (ii) the Company shall cooperate with AXA to ensure that appropriate steps are taken as may be necessary to implement such payment or collateral arrangements. In addition, the Shareholder Agreement will also provide that the Company agrees to use its reasonable best efforts to novate or terminate such guarantees by AXA or its subsidiaries (other than the Company) as promptly as practicable after the settlement of this offering.
Term
The Shareholder Agreement will terminate on the date that is one year following the Fourth Threshold Date, except for certain provisions including those relating to confidentiality, dispute resolution, provisions with respect to guaranteed obligations and the obligation to indemnify and maintain insurance.
Transitional Services Agreement
We will enter into a transitional services agreement (the “Transitional Services Agreement”) with AXA prior to the settlement of this offering that will govern the continued provision of certain services between AXA and us. Prior to the settlement of this offering, Holdings is a wholly-owned subsidiary of AXA. Accordingly, we, AXA and AXA’s subsidiaries each provide certain services to the others, share certain services and rely on certain third-party service providers to provide services pursuant to shared services contracts. AXA and its subsidiaries rely on certain contracts to which we are party for the provision of services that are important to its business. Likewise, we rely on certain contracts to which AXA or its subsidiaries are party for the provision of certain services. As we transition toward operating as a standalone public company, the parties to the Transitional Services Agreement and their respective subsidiaries (Holdings and its subsidiaries are not subsidiaries of AXA for purposes of the Transitional Services Agreement) will generally cease to provide services to one another and we will (i) cease to rely on the contracts that we have historically shared with AXA and (ii) replace them with new contracts between us and third-party service providers to the extent necessary. The Transitional Services
308
Table of Contents
Agreement will (i) govern our migration away from shared services with AXA and its subsidiaries during specified transition periods and (ii) provide for the continued provision or procurement of certain services among us, AXA and its subsidiaries and third-party service providers. Certain contracts and services between us and AXA are not covered by the Transitional Services Agreement and will continue pursuant to the terms of such contracts.
The Transitional Services Agreement will provide for the continuation of services pursuant to the following types of arrangements:
| • | services AXA or its subsidiaries (excluding us) receive pursuant to a contract with a third-party service provider, which AXA or its subsidiaries then provide to us on a pass-through basis; |
| • | services we receive pursuant to a contract with a third-party service provider, which we then provide to AXA or its subsidiaries (excluding us) on a pass-through basis; |
| • | certain services we receive directly from AXA or its subsidiaries (excluding us); and |
| • | certain services we provide directly to AXA or its subsidiaries (excluding us). |
The Transitional Services Agreement will govern the continued provision of these types of arrangements relating to the following categories of services:
| • | information technology services, including, without limitation, data processing, data transmission, various software applications and platforms including maintenance agreements, databases, services related to the management and operation of both a production data center and a disaster recovery center and other related pass-through services; |
| • | various services that support or relate to finance and risk management and actuarial functions, including, without limitation, consulting and other management and advisory services, risk management methodology and software, investment and asset liability management services such as risk modeling support and access to risk reports, frameworks, guidelines, tools and advice on investments, and other services related to tax matters; |
| • | human resources, such as third-party services (e.g., consulting arrangements) and services related to share plans, payroll and other administrative services, access to training programs and content and human resource analytical tools for planning purposes; |
| • | operations, including, without limitation, specialized internal audit and compliance resources; |
| • | marketing and public relations; for a description of the trademark license agreement that will govern AXA’s licensing of its name and certain other AXA trademarks to us, see “—Trademark License Agreement”; and |
| • | various other miscellaneous services, including, without limitation, the maintenance and integration of various third-party services and access to certain corporate, environmental and social frameworks and initiatives. |
The fees for each of the services to be provided under the Transitional Services Agreement will be mutually agreed upon as part of the negotiation of the Transitional Services Agreement and may vary on the basis of usage and other factors. Although we believe the Transitional Services Agreement will contain commercially reasonable terms (including fees for the services provided) that could have been negotiated with an independent third party, the terms of the agreement may later prove to be more or less favorable than arrangements we could make to provide these services internally or to obtain them from unaffiliated service providers in the future.
The Transitional Services Agreement will terminate on the last date on which either party thereto is obligated to provide or procure any service to or for the other party in accordance with the terms of the Transitional Services Agreement and the schedules thereto; provided that, if the settlement of this offering does
309
Table of Contents
not occur by December 31, 2018, the Transitional Services Agreement will terminate automatically. The services provided under the Transitional Services Agreement will terminate at various times specified in the agreement and the schedules thereto, but the party receiving services may also elect to terminate any service by giving at least 180 days prior written notice to the provider of the service. In the event of elective early termination of a particular service, the service recipient is only responsible for the portion of the service fee covering the portion of the service provided or procured through the date of termination. In addition, subject to consent rights or requirements under third-party agreements and except as otherwise specified therein, the Transitional Services Agreement will provide that the parties may agree to extensions of each service term.
Subject to the certain exceptions and limitations set forth in the Transitional Services Agreement, Holdings and AXA will agree to indemnify and hold harmless the other party from and against any and all losses relating to, arising out of or resulting from any breach of the Transitional Services Agreement to the extent caused by its or its subsidiaries infringement, misappropriation or violation of intellectual property rights of a third party in connection with the provision or receipt of services.
Except for certain exceptions, the aggregate liability of each party to the Transitional Services Agreement will be limited (x) in respect of any service, to an amount equal to 12 times the amount of service fees paid for the first full calendar month in respect of such service and (y) in the aggregate, to an amount equal to the total service fees paid and payable to such party during the 12 months prior to the occurrence of the event giving rise to the liability, except with respect to breaches of the Transitional Services Agreement’s confidentiality and systems security provisions, which are subject to a higher limit. Any claim for losses arising out of or relating to the Transitional Services Agreement must be filed no later than three years after the claim has accrued.
Registration Rights Agreement
We will enter into a registration rights agreement (the “Registration Rights Agreement”) with AXA prior to the settlement of this offering, pursuant to which AXA will be able to require us, beginning after the 180-day lock-up, to file one or more registration statements with the SEC covering the public resale of shares of our common stock beneficially owned by AXA. AXA may transfer all or any portion of its rights under the Registration Rights Agreement to a transferee of shares of our common stock constituting not less than 10% of our outstanding common stock. The rights of AXA and its permitted transferees under the Registration Rights Agreement will remain in effect with respect to all shares of our common stock covered by such agreement until such securities (a) are sold in a private transaction in which the transferor’s rights under the Registration Rights Agreement are not assigned to the transferee, (b) are sold pursuant to an effective registration statement, (c) are sold pursuant to Rule 144 or (d) shall have ceased to be outstanding.
Demand Registration. AXA will be able to request an unlimited number of registrations under the Securities Act of all or any portion of our shares covered by the agreement, and we will be obligated, subject to limited exceptions, to register such shares as requested by AXA. Subject to certain exceptions, we may defer the filing of a registration statement after a demand request has been made if, at the time of such request, our Board determines that any pending or imminent event would require disclosure of material, non-public information in the registration statement for such registration statement not to be materially misleading and would not otherwise be required to be publicly disclosed by us. We will not be obligated to effect more than one demand registration in any 90-day period.
Shelf Registration. At any time after the date that is one year following the date of the Registration Rights Agreement or, if sooner, once we become eligible to use Form S-3, we will be obligated, upon request by AXA to file a shelf registration statement to register all or any portion of our shares covered by the Registration Rights Agreement, and we will be obligated, subject to limited exceptions, to register such shares as requested by AXA. AXA may, at any time and from time to time, request that we complete an unlimited number of shelf take downs.
Piggy-Back Registration. If at any time we intend to file on our behalf or on behalf of any of our other security holders a registration statement in connection with a public offering of any of our securities on a form
310
Table of Contents
and in a manner that would permit the registration for offer and sale of our common stock held by AXA, AXA will have the right to include its shares of our common stock in that offering. AXA’s ability to participate in any such offering will be subject to market “cut-back” exceptions.
Registration Procedures; Expenses. We will be responsible for all registration expenses, including expenses incurred by us, in connection with the registration, offer and sale of securities under the Registration Rights Agreement by AXA, except for AXA’s legal fees and underwriting discounts, selling commissions and transfer taxes applicable to such sale.
The Registration Rights Agreement will set forth customary registration procedures, including an agreement by us to make our management available for road show presentations in connection with any underwritten offerings. We will also agree to indemnify AXA and its permitted transferees with respect to liabilities resulting from any material untrue statements or omissions in any registration statement used in any registration, other than untrue statements or omissions resulting from information furnished to us expressly for use in such registration statement by AXA or any permitted transferee.
Tax Sharing Agreement
We entered into a tax sharing agreement with AXA and AXA Investment Managers S.A., a société anonyme organized under the laws of France (“AXA IM SA”), dated March 28, 2018 (the “Tax Sharing Agreement”). The Tax Sharing Agreement allocates rights, obligations and responsibilities between AXA, AXA IM SA and us for taxes (i) arising in connection with the Reorganization and (ii) for taxable periods predating or postdating the Reorganization, and for related administrative and procedural matters, including the preparation and filing of tax returns, tax refunds, tax contests and cooperation between the parties.
The Tax Sharing Agreement generally allocates responsibility for the taxes of AXA IM Holding US and AXA CS to the seller of the applicable entity for taxable periods predating the sale and to the buyer of such entity for taxable periods postdating the sale, except that any taxes arising in connection with the Reorganization as a result of an adjustment by a taxing authority will instead be borne 90% by the seller and 10% by the buyer (or, if that taxes are attributable to any action or inaction of the seller or the buyer, 100% by the responsible party). The right to tax refunds is generally allocated to the party that would be responsible for the underlying taxes.
The Tax Sharing Agreement allocates control of tax audits and proceedings between the parties, and requires the parties to cooperate with one another in relation to the preparation and filing of tax returns and in connection with tax audits and proceedings. All current tax sharing, indemnification and similar agreements between us and AXA or between us and AXA IM SA, whether written or unwritten, the primary purpose of which is the allocation of taxes, have been terminated, and the Tax Sharing Agreement generally governs our rights, obligations and responsibilities in relation to taxes vis-à-vis AXA and AXA IM SA.
Trademark License Agreement
Prior to the settlement of this offering, we anticipate that our existing sublicensing agreement with AXA Financial, by which we are licensed to use certain trademarks, including “AXA”, will be terminated and that AXA and we will enter into a new trademark license agreement (the “Trademark License Agreement”). Under the Trademark License Agreement, AXA will grant us, subject to certain limitations, a limited, non-exclusive, non-transferable, non-sublicenseable license to use certain trademarks (the “Licensed Marks”), including the name “AXA” and domain names, for use in our retirement and protection business (as we and our subsidiaries had conducted such business prior to the effective date of the Trademark License Agreement) in the United States and Canada (the “Territory”). Under the Trademark License Agreement, we will be obligated to pay AXA consideration for the grant of the license following the close of each financial year during the term of the Trademark License Agreement based on a formula that takes into account our revenue (excluding certain items) and a notoriety index for the Licensed Marks in the Territory. We will also be required to pay such consideration
311
Table of Contents
during the Transition Period (as defined below). The Trademark License Agreement will remain in effect until it is terminated by AXA’s and our mutual agreement, or upon the occurrence of certain conditions, including AXA’s right to terminate upon a change in control of Holdings, which will occur when AXA no longer directly or indirectly owns or controls more than 50% of the voting capital stock of Holdings. Prior to the expiration of the Trademark License Agreement, we will not be permitted to cease use of the Licensed Marks or otherwise rebrand our products and services. The Trademark License Agreement will also restrict our use of marks confusingly similar to the Licensed Marks.
After the term of the Trademark License Agreement, we will be able to continue to use the Licensed Marks for a transition period (the “Transition Period”) of 18 months (which period is subject to an extension, capped at a total of 36 months (we can request an extension of such period), for any Licensed Mark for which we cannot obtain government approvals), but we will be required to use reasonable best efforts to transition to other trademarks.
The Trademark License Agreement will contain reciprocal indemnification obligations, which are uncapped, with respect to third-party claims arising out of the indemnifying party’s breach.
Transactions with AXA Affiliates
As a wholly owned subsidiary of AXA, historically, we have entered into various transactions with AXA and its subsidiaries in the normal course of business including, among others, service agreements, reinsurance transactions, and lending and other financing arrangements. The transactions described below are between us and affiliates of AXA that are not also subsidiaries of Holdings.
Retirement and Protection
General Service Agreements
Services Received from Affiliates
| Affiliate |
Services |
Amount Paid or Accrued for year ended December 31, 2017 |
Amount Paid or Accrued for year ended December 31, 2016 |
Amount Paid or Accrued for year ended December 31, 2015 |
||||||||||
| (in millions) | ||||||||||||||
| AXA Group Solutions Pvt. Ltd. (“AGS”) | AGS provides maintenance and development support for certain applications. | $ | 16.6 | $ | 27.3 | $ | 9.4 | |||||||
| GIE Informatique AXA (“GIE”) | GIE provides corporate services, including marketing and branding, finance and control, strategy, business support and development, audit and legal. | $ | 15.8 | $ | 13.6 | $ | 12.2 | |||||||
| AXA Business Service Private Ltd. (“ABS”) | ABS provides certain policy administration services, including policy records updates, account maintenance, certain claim review and approval services and employee records updates and reporting services. | $ | 13.3 | $ | 14.4 | $ | 12.2 | |||||||
312
Table of Contents
| Affiliate |
Services |
Amount Paid or Accrued for year ended December 31, 2017 |
Amount Paid or Accrued for year ended December 31, 2016 |
Amount Paid or Accrued for year ended December 31, 2015 |
||||||||||
| (in millions) | ||||||||||||||
| AXA Global Life (“AGL”) | AGL provides services related to our life business and advice on our strategic initiatives. | $ | 2.5 | $ | 1.2 | $ | 2.0 | |||||||
| AXA Investment Managers Inc. (“AXA IM”), AXA Real Estate Investment Managers (“AXA REIM”) and AXA Rosenberg Investment Management LLC (“AXA Rosenberg”) | AXA IM, AXA REIM and AXA Rosenberg provide sub-advisory services to our retail mutual funds and advisory services to certain investments in our General Account. | $ | 5.3 | $ | 15.0 | $ | 2.1 | |||||||
| AXA Strategic Ventures Corporation (“ASV Corp”) | ASV Corp provides investment management services to AXA Strategic Ventures US, LLC | $ | 1.8 | $ | 1.8 | $ | 0.0 | |||||||
| AXA Tech SAS (“SAS”) | SAS provides services related to global contracts, security projects and other global internal projects. | $ | 24.3 | $ | 19.4 | $ | 17.1 | |||||||
| AXA Tech Morocco (“ATM”) | ATM provides certain finance and accounting services. | $ | 0.2 | $ | 0.1 | $ | 0.1 | |||||||
| AXA Tech France (“ATF”) | ATF provides services related to our global intranet application platform and support services as well as security related services. | $ | 0.7 | $ | 0.9 | $ | 0.5 | |||||||
| AXA Tech affiliates in: Switzerland, Germany, UK, Belgium, Med Region, Japan, AXA Colpatria | These affiliates provide transversal technology strategy and related services. | $ | 0.5 | $ | 0.5 | $ | 0.4 | |||||||
| AXA Tech India (“ATI”) | ATI provides infrastructure monitoring and support, database services and application support. | $ | (0.1 | ) | $ | 2.1 | $ | 2.2 | ||||||
313
Table of Contents
Services Provided to Affiliates
| Affiliate |
Services |
Amount Paid or Accrued for year ended December 31, 2017 |
Amount Paid or Accrued for year ended December 31, 2016 |
Amount Paid or Accrued for year ended December 31, 2015 |
||||||||||
| (in millions) | ||||||||||||||
| AXA IM, AXA Liabilities Managers, AXA REIM, AXA Rosenberg Group LLC, AXA Insurance Company and AXA Venture Partners SAS Corporation | We provide corporate services, including participation in employee benefit plans, finance and payroll services. | $ | 5.1 | $ | 5.2 | $ | 3.2 | |||||||
| GIE | We administer the AXA Intranet site. | $ | 0.8 | $ | 2.6 | $ | 2.7 | |||||||
| AXA Life Insurance Co., Ltd. (“AXA Life Japan”) |
We provide mainframe platform services and global e-mail hosting and application support. |
$ | 0.0 | $ | 5.0 | $ | 5.0 | |||||||
| SAS | We host global security, transversal officers and big data infrastructure. | $ | 4.1 | $ | 4.4 | $ | 3.1 | |||||||
| AXA Technology Services Mexico SA | We provide infrastructure hosting and support. | $ | 3.3 | $ | 3.4 | $ | 4.9 | |||||||
| AXA | We host the AXA Lab business unit. | $ | 1.3 | $ | 1.2 | $ | 1.3 | |||||||
| AGS | We host the AGS business unit. | $ | 1.6 | $ | 0.7 | — | ||||||||
| AXA Liabilities Managers | We host AXA Global Network connectivity and disaster recovery platform services. | $ | 0.4 | $ | 0.5 | $ | 0.5 | |||||||
| AXA Tech affiliates in: France, Switzerland, Germany, Belgium, UK, Spain, Colombia, Hong Kong, Italy, India, Indonesia, Asia, Portugal, Japan, Singapore, AXA Assistance US and Other | We provide Airwatch global platform hosting and support services as well as technology strategy and support. | $ | 5.3 | $ | 3.8 | $ | 4.3 | |||||||
Reinsurance Assumed
AXA Global Life retrocedes a quota share portion of certain life and health risks of various AXA affiliates to AXA Equitable Life and MLOA on a one-year term basis. Also, AXA Life Insurance Company Ltd. cedes a portion of its variable deferred annuity business to AXA Equitable Life.
For the year ended December 31, 2017, the premiums earned from the above transactions totaled $8 million. Premiums earned in 2016 and 2015 were $9 million and $8 million, respectively.
For the year ended December 31, 2017, the claims and expenses paid due to the above transactions totaled $2 million. Claims and expenses paid in 2016 and 2015 were $2 million and $2 million, respectively.
314
Table of Contents
Reinsurance Ceded
AXA Equitable Life has entered into a stop loss reinsurance agreement with AXA Global Life to protect AXA Equitable Life with respect to a deterioration in its claim experience following the occurrence of an extreme mortality event.
AXA Equitable Life has accepted certain retrocession policies through reinsurance agreements with various reinsurers. AXA Equitable Life retrocedes to AXA Global Life the excess of its first retention layer.
Certain of our subsidiaries have entered into a Life Catastrophe Excess of Loss Reinsurance Agreement with a number of subscribing reinsurers, including AXA Global Life. AXA Global Life participates in 5% of the pool, pro-rata, across the upper and lower layers.
For the year ended December 31, 2017, premiums and expenses paid for the above agreements were $4 million. Premiums and expenses paid in 2016 and 2015 were $4 million and $4 million, respectively.
Loans to Affiliates
In September 2007, AXA issued a $700 million 5.4% Senior Unsecured Note to the Company. The note pays interest semi-annually and was scheduled to mature on September 30, 2012. In March 2011, the maturity date of the note was extended to December 30, 2020 and the interest rate was increased to 5.7%. In January 2018, AXA pre-paid $50 million of this note. In April 2018, AXA pre-paid the remainder of this note.
In December 2008, AXA issued a $500 million senior unsecured note to the Company. This note has an interest rate of 5.4% payable semi-annually with a maturity date of December 15, 2020. As of December 31, 2017, there was an outstanding balance of $200 million on this note. In January 2018, AXA pre-paid $150 million of this note. In April 2018, AXA pre-paid the remainder of this note.
In December 2013, Colisée Re issued a $145 million 4.75% Senior Unsecured Note to Holdings. The loan was scheduled to mature on December 19, 2028. This loan was repaid on March 26, 2018.
In 2017, AXA Financial issued a $900 million 1.55% Senior Unsecured Note to Holdings. The loan was scheduled to mature on March 12, 2018. In February 2018, AXA Financial pre-paid $100 million of this note. In March 2018, the maturity date of the note was extended to June 12, 2018 and the interest rate was increased to 1.915%. In April 2018, AXA Financial pre-paid the remainder of this note.
In December 2015, AXA Financial issued a $185 million 3-month LIBOR plus 1.5% unsecured loan to AXA IM Holding US. The loan pays interest quarterly and is scheduled to mature on December 10, 2025. In April 2018, AXA Financial repaid this loan.
In September 2016, AXA Tech issued a $12 million 2.0% unsecured loan to AXA Technology Services SAS. $2 million of this loan was repaid in December 2016, $5 million was repaid in January 2017 and the remainder of the loan was repaid on March 27, 2017.
In June 2016, AXA Tech issued a $2 million 2.0% unsecured loan to AXA Technology Services Mexico SA. The loan was repaid on March 27, 2017.
In October 2016, AXA Tech issued a $3 million 6.0% unsecured loan to PT AXA Technology Services Asia Indonesia. The loan is scheduled to mature on October 3, 2022. On December 31, 2017, this loan was transferred to AXA US Holdings Inc. for consideration equal to par value.
Loans from Affiliates
In March 2010, AXA Financial issued subordinated notes to AXA Life Japan in the amount of $770 million. The subordinated notes have a maturity date of March 30, 2020 and a floating interest rate of LIBOR plus 120
315
Table of Contents
basis points, which resets semiannually on March 30 and September 30. The 2017, 2016 and 2015 interest cost related to the subordinated notes totaled approximately $19 million, $16 million and $12 million, respectively. The notes were repaid in April 2018.
In January 2016, AXA Financial pre-paid a $177 million term loan from AXA Insurance UK PLC and $72 million term loan from AXA France IARD S.A. As a result of this pre-payment, AXA Financial incurred a prepayment penalty of $43 million.
In October 2012, AXA Financial issued a note denominated in Euros in the amount of €300 million or $391 million to AXA Belgium. This note had an interest rate of Europe Interbank Offered Rate (“EURIBOR”) plus 115 basis points and a maturity date of October 23, 2017. Concurrently, AXA Financial entered into a swap with AXA covering the exchange rate on both the interest and principal payments related to this note. The interest rate on the swap was 6-month LIBOR plus 147.5 basis points. In October 2017, the note was extended to March 30, 2018. The extended note has a floating interest rate of 1-month EURIBOR plus six basis points with a minimum rate of 0%. Concurrently, AXA Financial entered into a swap with AXA covering the exchange rate on both the interest and principal payments related to the extended note until March 30, 2018. Both the loan and the swap were repaid on March 29, 2018. The 2017, 2016 and 2015 interest cost related to this note totaled approximately $12 million, $9 million and $7 million, respectively.
In December 2014, AXA Financial received a $2,727 million, 3-month LIBOR plus 1.06% margin term loan from AXA. The loan has a maturity date of December 18, 2024. In June 2015, AXA Financial repaid $520 million and during 2016 repaid an additional $1,200 million of this loan. The outstanding balance on this loan at December 31, 2017 was $1,007 million. The 2017, 2016 and 2015 interest cost related to this loan totaled approximately $23 million, $23 million and $33 million, respectively. In April 2018, the remainder of this loan was repaid.
In December 2015, AXA Financial received a $300 million 1-month LIBOR plus 0.58% unsecured loan from AXA. The Company repaid this loan on June 30, 2016.
In 2015, Holdings received a $366 million 3-month LIBOR plus 1.44% loan from AXA. The loan has a maturity date of October 8, 2022. The 2017, 2016 and 2015 interest cost related to this loan totaled approximately $9 million, $8 million and $2 million, respectively. This loan was repaid in April 2018.
In 2013, Holdings received $242 million and $145 million 4.75% loans from Coliseum Re. The loans each have a maturity date in December 2028. The 2017, 2016 and 2015 interest cost related to both loans from Coliseum Re totaled approximately $18 million each year. The loans were repaid in April 2018.
In 2017, Holdings repaid a $56 million 1.39% loan from AXA CS originally made in 2015. The 2017, 2016 and 2015 interest cost related to the loan was approximately $2 million, $1 million and $1 million, respectively. In 2017, Holdings received a $100 million and $10 million loan from AXA CS. The loans had interest rates of 1.86% and 1.76%, respectively, and were repaid on their maturity date of February 5, 2018.
In 2016, AXA Tech repaid a $4 million 12-month LIBOR plus 1.42% loan from SAS.
In December 2017, Holdings received a $622 million, 3-month LIBOR plus 0.439% margin term loan from AXA. The loan has a maturity date of June 8, 2018. The loan was repaid on March 22, 2018.
Guarantees
AXA Financial paid fees to AXA for certain guarantees related to our employee benefit plans which were terminated in May 2016. For the years ended December 31, 2016 and 2015, fees associated with these guarantees were $0.4 million and $1.2 million, respectively.
316
Table of Contents
We paid fees to AXA for its guarantee of our borrowing under certain third-party credit facilities, commercial paper and from AXA Belgium. For the years ended December 31, 2017, 2016 and 2015, fees associated with these guarantees were $8.7 million, $7.9 million and $8.0 million, respectively. Following the GMxB Unwind, we no longer pay fees for AXA’s guarantee under third-party credit facilities or from AXA Belgium.
Other Transactions
In 2016, AXA Equitable Life and Saum Sing LLC (“Saum Sing”), formed Broad Vista Partners LLC (“Broad Vista”), of which AXA Equitable Life owns 70% and Saum Sing owns 30%. On June 30, 2016, Broad Vista entered into a real estate joint venture with a third party and AXA Equitable Life invested approximately $25 million.
In 2016, AXA Financial invested in ASV Capital B FPCI, a French Professional Private Equity Fund managed by AXA Venture Partners SAS. As of December 31, 2017 and 2016, the fair value of the investment in the fund was valued at $7 million and $5 million, respectively.
AXA RE Arizona benefited from a $1.5 billion revolving credit facility with AXA prior to the execution of the GMxB Unwind. For the years ended December 31, 2017, 2016 and 2015, fees associated with this facility were $1 million, $5 million and $5 million, respectively. As a result of the GMxB Unwind, we no longer benefit from this revolving credit facility.
Pursuant to a sub-licensing agreement with AXA, we may use the “AXA” trademarks as an umbrella brand, as part of the name of our companies or investment funds managed by us and other specified purposes. For the years ended December 31, 2017, 2016 and 2015, fees associated with this agreement totaled $3 million, $2 million and $1 million, respectively.
In September 2017, AXA Equitable FMG made a 30 million euro capital commitment to ASV Diversified, a French Special Limited Partnership investing in venture funds specialized in both early stage and growth start-ups with new technologies and business models relevant to AXA’s business. This fund is managed by AXA Venture Partners SAS. As of December 31, 2017, 0.45 million euro has been called.
In December 2017, AXA Tech paid approximately $18 million to AXA US Holdings Inc., a U.S. subsidiary of AXA, which is not a subsidiary of Holdings, in exchange for AXA US Holdings Inc. assuming certain liabilities pertaining to its servicing of AXA companies within the United States not included in the scope of this offering and in Latin America valued at approximately $18 million, including costs and expenses associated with providing infrastructure services to AXA and its subsidiaries.
Prior to the settlement of this offering, Holdings intends to make a capital contribution of approximately €2.2 million to AXA Venture Partners SAS in exchange for approximately 30.3% of the shares of AXA Venture Partners SAS and certain rights and protections as a stockholder of the company, including the right to appoint two of the directors of AXA Venture Partners SAS as well as consent rights over significant transactions. AXA Strategic Ventures Holding SAS will have the right to call the shares of AXA Venture Partners SAS held by Holdings in certain situations described in the AXA Venture Partners SAS shareholder agreement.
317
Table of Contents
Investment Management and Research
We pay fees for certain services, including data processing, support for certain investment operations functions, maintenance and development support for applications, portfolio-related services and cooperative technology development and procurement services for our Investment Management and Research business to the following related parties, each of whom is an affiliate of AXA:
| Name of Related Party |
Amount Paid or Accrued for the Year Ended December 31, 2017 |
Amount Paid or Accrued for the Year Ended December 31, 2016 |
Amount Paid or Accrued for the Year Ended December 31, 2015 |
|||||||||
| (in millions) | ||||||||||||
| AXA Business Service Private Ltd. |
$ | 5.6 | $ | 5.5 | $ | 5.5 | ||||||
| AXA Technology Services India Pvt. Ltd. |
$ | 1.7 | $ | 5.3 | $ | 4.6 | ||||||
| AXA Group Solutions Pvt. Ltd. (“AXA Solutions”) |
$ | 0.9 | $ | 1.1 | $ | 2.8 | ||||||
| GIE |
$ | 0.7 | $ | 0.4 | $ | 0.5 | ||||||
| AXA Wealth |
$ | 0.5 | $ | 0.9 | $ | 1.0 | ||||||
We provide investment management, distribution and stockholder servicing related services to the following related parties, each of whom is an affiliate of AXA:
| Name of Related Party |
Amount Received or Accrued for the Year Ended December 31, 2017 |
Amount Received or Accrued for the Year Ended December 31, 2016 |
Amount Received or Accrued for the Year Ended December 31, 2015 |
|||||||||
| (in millions) | ||||||||||||
| AXA Life Japan |
$ | 14.1 | $ | 14.8 | $ | 16.5 | ||||||
| AXA France IARD S.A. |
$ | 12.3 | $ | 6.9 | $ | 5.7 | ||||||
| AXA Switzerland Life |
$ | 10.4 | $ | 9.6 | $ | 10.7 | ||||||
| AXA Insurance UK PLC Pensions Scheme |
$ | 7.0 | $ | 7.6 | $ | 8.3 | ||||||
| AXA Germany |
$ | 5.0 | $ | 3.0 | $ | 1.7 | ||||||
| AXA Belgium |
$ | 3.4 | $ | 2.2 | $ | 2.8 | ||||||
| AXA Hong Kong Life |
$ | 1.6 | $ | 6.7 | $ | 5.8 | ||||||
| AXA Mediterranean Holding S.A.U. |
$ | 1.4 | $ | 0.8 | $ | 0.5 | ||||||
| AXA Switzerland Property & Casualty |
$ | 1.0 | $ | 1.3 | $ | 0.9 | ||||||
| AIM Deutschland GmbH |
$ | 0.5 | $ | 0.5 | $ | 0.4 | ||||||
| AXA Investment Managers, Ltd. Paris |
$ | 0.4 | $ | 0.4 | $ | 0.6 | ||||||
| AXA Investment Managers Ltd. |
$ | 0.4 | $ | 0.2 | $ | 0.1 | ||||||
| AXA Winterthur |
$ | 0.4 | $ | — | $ | — | ||||||
| AXA MPS |
$ | 0.4 | $ | 0.1 | $ | — | ||||||
| AXA General Insurance Hong Kong Ltd. |
$ | 0.3 | $ | 0.2 | $ | 0.7 | ||||||
| AXA Insurance Company |
$ | 0.1 | $ | 0.1 | $ | 0.1 | ||||||
| AXA Life Singapore |
$ | 0.1 | $ | 0.1 | $ | 0.1 | ||||||
| Coliseum Reinsurance |
$ | — | $ | 0.1 | $ | 0.1 | ||||||
In addition, we make commission and distribution payments to AXA affiliates who distribute our sponsored mutual funds. For the years ended 2017, 2016 and 2015, these payments totaled $15.4 million, $11.8 million, $10.9 million, respectively.
Reorganization and Recapitalization
For a discussion of certain reorganization and recapitalization transactions that AXA and its affiliates and we have entered into or will enter into in connection with this offering, see “The Reorganization Transactions” and “Recapitalization.”
318
Table of Contents
Director Indemnification Agreements
Prior to the settlement of this offering, we will enter into indemnification agreements with our directors. The indemnification agreements will provide the directors with contractual rights to indemnification and expense rights. See “Description of Capital Stock—Limitations on Liability and Indemnification.”
319
Table of Contents
The following description of our capital stock is a summary of the material terms of our amended and restated certificate of incorporation and amended and restated by-laws. Reference is made to the more detailed provisions of, and the descriptions are qualified in their entirety by reference to, these documents, forms of which are filed with the SEC as exhibits to the registration statement of which this prospectus is a part, and applicable law. This description assumes the effectiveness of our amended and restated certificate of incorporation and amended and restated by-laws, which will take effect prior to the settlement of this offering.
General
Our authorized capital stock consists of 2,000,000,000 shares of common stock, par value $0.01 per share, and 200,000,000 shares of undesignated preferred stock, par value $0.01 per share. There are 561,000,000 shares of our common stock issued and outstanding.
Common Stock
Holders of common stock will be entitled:
| • | to cast one vote for each share held of record on all matters submitted to a vote of the stockholders; |
| • | to receive, on a pro rata basis, dividends and distributions, if any, that our Board may declare out of legally available funds, subject to preferences that may be applicable to preferred stock, if any, then outstanding; and |
| • | upon our liquidation, dissolution or winding up, to share equally and ratably in any assets remaining after the payment of all debt and other liabilities, subject to the prior rights, if any, of holders of any outstanding shares of preferred stock. |
The holders of our common stock will not have any preemptive, cumulative voting, subscription, conversion, redemption or sinking fund rights. The common stock will not be subject to future calls or assessments by us. The rights and privileges of holders of our common stock are subject to any series of preferred stock that we may issue in the future, as described below.
Before the date of this prospectus, there has been no public market for our common stock.
As of April 26, 2018, we had 561,000,000 shares of common stock outstanding and one holder of record of common stock.
Preferred Stock
Under our amended and restated certificate of incorporation, our Board will have the authority, without further action by our stockholders, to issue up to 200,000,000 shares of preferred stock in one or more series and to fix the voting powers, designations, preferences and the relative participating, optional or other special rights and qualifications, limitations and restrictions of each series, including, without limitation, dividend rights, dividend rates, conversion rights, voting rights, terms of redemption, liquidation preferences and the number of shares constituting any series. Upon the settlement of this offering, no shares of our authorized preferred stock will be outstanding. Because the Board will have the power to establish the preferences and rights of the shares of any additional series of preferred stock, it may afford holders of any preferred stock preferences, powers and rights, including voting and dividend rights, senior to the rights of holders of our common stock, which could adversely affect the holders of the common stock and could delay, discourage or prevent a takeover of us even if a change of control of our company would be beneficial to the interests of our stockholders.
320
Table of Contents
Annual Stockholders Meeting
Our amended and restated by-laws will provide that annual stockholders meetings will be held at a date, time and place, if any, as exclusively selected by our Board. To the extent permitted under applicable law, we may conduct meetings by remote communications, including by webcast.
Voting
The affirmative vote of a plurality of the shares of our common stock present, in person or by proxy, at the meeting and entitled to vote on the election of directors will decide the election of any directors, and the affirmative vote of a majority of the shares of our common stock present, in person or by proxy, at the meeting and entitled to vote at any annual or special meeting of stockholders will decide all other matters voted on by stockholders, unless the question is one upon which, by express provision of law, under our amended and restated certificate of incorporation, or under our amended and restated by-laws, a different vote is required, in which case such provision will control. Stockholders do not have the right to cumulate their votes for the election of directors.
Board Designation Rights
Pursuant to the Shareholder Agreement, AXA will have specified board designation and other rights following this offering. See “Certain Relationships and Related Party Transactions—Relationship with AXA Following this Offering—Shareholder Agreement.”
Removal of Directors
Our amended and restated certificate of incorporation will provide that directors may be removed, with or without cause, at any time upon the affirmative vote of holders of at least a majority of the outstanding shares of common stock then entitled to vote at an election of directors. Any vacancy in the Board that results from (x) the death, disability, resignation or disqualification of any director shall be filled by an affirmative vote of at least a majority of the directors then in office, even if less than a quorum, or by a sole remaining director and (y) an increase in the number of directors or the removal of any director shall be filled (a) until the first date on which AXA ceases to beneficially own more than 50% of the outstanding shares of common stock, solely by an affirmative vote of the holders of at least a majority of the outstanding shares of common stock entitled to vote in an election of directors and (b) from and after the first date on which AXA ceases to beneficially own more than 50% of the outstanding shares of common stock, by an affirmative vote of at least a majority of the directors then in office, even if less than a quorum, or by a sole remaining director.
Anti-Takeover Effects of our Certificate of Incorporation and By-laws
The provisions of our amended and restated certificate of incorporation and amended and restated by-laws summarized below may have an anti-takeover effect and may delay, defer or prevent a tender offer or takeover attempt that you might consider in your best interest, including an attempt that might result in your receipt of a premium over the market price for your shares. These provisions are also designed, in part, to encourage persons seeking to acquire control of us to first negotiate with our Board, which could result in an improvement of their terms.
Authorized but Unissued Shares of Common Stock. Following the settlement of this offering, our shares of authorized and unissued common stock will be available for future issuance without additional stockholders approval. While our authorized and unissued shares are not designed to deter or prevent a change of control, under some circumstances we could use the additional shares to create voting impediments or to frustrate persons seeking to effect a takeover or otherwise gain control by, for example, issuing those shares in private placements to purchasers who might side with our Board in opposing a hostile takeover bid.
321
Table of Contents
Authorized but Unissued Shares of Preferred Stock. Under our amended and restated certificate of incorporation, our Board will have the authority, without further action by our stockholders, to issue up to 200,000,000 shares of preferred stock in one or more series and to fix the voting powers, designations, preferences and the relative participating, optional or other special rights and qualifications, limitations and restrictions of each series, including, without limitation, dividend rights, dividend rates, conversion rights, voting rights, terms of redemption, liquidation preferences and the number of shares constituting any series. The existence of authorized but unissued preferred stock could reduce our attractiveness as a target for an unsolicited takeover bid since we could, for example, issue shares of preferred stock to parties who might oppose such a takeover bid or shares that contain terms the potential acquiror may find unattractive. This may have the effect of delaying or preventing a change of control, may discourage bids for the common stock at a premium over the market price of the common stock, and may adversely affect the market price of, and the voting and other rights of the holders of, our common stock.
Special Meetings of Stockholders. Our amended and restated certificate of incorporation will provide that a special meeting of stockholders may be called only by the Chairman of our Board or Chief Executive Officer or by a resolution adopted by a majority of our Board. Special meetings may also be called by our corporate secretary at the request of the holders of at least a majority of the outstanding shares of our common stock until AXA ceases to own at least 50% of the outstanding shares of our common stock. Thereafter, the stockholder will not be permitted to call a special meeting of stockholders.
Stockholders Advance Notice Procedure. Our amended and restated by-laws will establish an advance notice procedure for stockholders to make nominations of candidates for election as directors or to bring other business before an annual meeting of our stockholders. The amended and restated by-laws will provide that any stockholders wishing to nominate persons for election as directors at, or bring other business before, an annual meeting must deliver to our corporate secretary a written notice of the stockholder’s intention to do so. These provisions may have the effect of precluding the conduct of certain business at a meeting if the proper procedures are not followed. We expect that these provisions may also discourage or deter a potential acquirer from conducting a solicitation of proxies to elect the acquirer’s own slate of directors or otherwise attempting to obtain control of our company. To be timely, the stockholder’s notice must be delivered to our corporate secretary at our principal executive offices not less than 90 days nor more than 120 days before the first anniversary date of the annual meeting for the preceding year; provided, however, that in the event that the annual meeting is set for a date that is more than 30 days before or delayed by more than 60 days after the first anniversary date of the preceding year’s annual meeting, a stockholder’s notice must be delivered to our corporate secretary not later than the later of (x) the close of business on the 90th day prior to the meeting or (y) the close of business on the 10th day following the day on which a public announcement of the date of the meeting is first made by us.
No Stockholders Action by Written Consent. Our amended and restated certificate of incorporation will provide that stockholders action may be taken only at an annual meeting or special meeting of stockholders, provided that stockholders action may be taken by written consent in lieu of a meeting until AXA ceases to own at least 50% of the outstanding shares of our common stock.
Amendments to Certificate of Incorporation and By-laws. Our amended and restated certificate of incorporation will provide that our amended and restated certificate of incorporation may be amended by both the affirmative vote of a majority of our Board and the affirmative vote of the holders of a majority of the outstanding shares of our common stock then entitled to vote at any annual or special meeting of stockholders; provided that, at any time when AXA owns less than 50% of the outstanding shares of our common stock, specified provisions of our amended and restated certificate of incorporation may not be amended, altered or repealed unless the amendment is approved by the affirmative vote of the holders of at least 66 2⁄3% of the outstanding shares of our common stock then entitled to vote at any annual or special meeting of stockholders, including, but not limited to, the provisions governing:
| • | liability and indemnification of directors; |
322
Table of Contents
| • | corporate opportunities; |
| • | elimination of stockholders action by written consent if AXA ceases to own at least 50% of the outstanding shares of our common stock; |
| • | prohibition on the rights of stockholders to call a special meeting if AXA ceases to own at least 50% of the outstanding shares of our common stock; and |
| • | required approval of the holders of at least 66 2⁄3% of the outstanding shares of our common stock to amend our amended and restated by-laws and certain provisions of our amended and restated certificate of incorporation if AXA ceases to own at least 50% of the outstanding shares of our common stock. |
In addition, our amended and restated by-laws may be amended, altered or repealed, or new by-laws may be adopted, by the affirmative vote of a majority of the Board, or by the affirmative vote of the holders of (x) as long as AXA owns at least 50% of the outstanding shares of our common stock, at least a majority and (y) thereafter, at least 66 2⁄3%, of the outstanding shares of our common stock then entitled to vote at any annual or special meeting of stockholders.
These provisions make it more difficult for any person to remove or amend any provisions in our amended and restated certificate of incorporation and amended and restated by-laws that may have an anti-takeover effect.
Delaware Anti-Takeover Law. In general, Section 203 prohibits a publicly held Delaware corporation from engaging in a business combination, such as mergers, sales and leases of assets, issuances of securities and similar transactions by a corporation or subsidiary with an interested stockholder including a person or group who beneficially owns 15% or more of the corporation’s voting stock for a period of three years following the date the person became an interested stockholder, unless (with certain exceptions) the business combination or the transaction in which the person became an interested stockholder is approved in a prescribed manner. Section 203 permits corporations, in their certificate of incorporation, to opt out of the protections of Section 203. Our amended and restated certificate of incorporation will provide that we have elected not to be subject to Section 203 of the DGCL for so long as AXA owns, directly or indirectly, at least five percent of the outstanding shares of our common stock. From and after the date that AXA ceases to own, directly or indirectly, at least five percent of the outstanding shares of our common stock, we will be governed by Section 203.
Insurance Regulations. The insurance laws and regulations of the various states in which our insurance subsidiaries are organized may delay or impede a business combination or other strategic transaction involving us. State insurance laws prohibit an entity from acquiring control of an insurance company without the prior approval of the domestic insurance regulator. Under most states’ statutes, an entity is presumed to have control of an insurance company if it owns, directly or indirectly, 10% or more of the voting stock of that insurance company or its parent company. These regulatory restrictions may delay, deter or prevent a potential merger or sale of our company, even if the Board decides that it is in the best interests of stockholders for us to merge or be sold. These restrictions also may delay sales by us or acquisitions by third parties of our subsidiaries. See “Business—Regulation—Insurance Regulation.”
Limitations on Liability and Indemnification
Our amended and restated certificate of incorporation will contain provisions relating to the liability of directors. These provisions will eliminate a director’s personal liability for monetary damages resulting from a breach of fiduciary duty, except in circumstances involving:
| • | any breach of the director’s duty of loyalty; |
| • | acts or omissions not in good faith or which involve intentional misconduct or a knowing violation of the law; |
| • | unlawful payments of dividends or unlawful stock repurchases, redemptions or other distributions; or |
| • | any transaction from which the director derives an improper personal benefit. |
323
Table of Contents
The principal effect of the limitation on liability provision is that a stockholder will be unable to prosecute an action for monetary damages against a director unless the stockholder can demonstrate a basis for liability for which indemnification is not available under the DGCL. These provisions, however, should not limit or eliminate our rights or any stockholder’s rights to seek non-monetary relief, such as an injunction or rescission, in the event of a breach of director’s fiduciary duty. These provisions will not alter a director’s liability under federal securities laws. The inclusion of this provision in our amended and restated certificate of incorporation may discourage or deter stockholders or management from bringing a lawsuit against directors for a breach of their fiduciary duties, even though such an action, if successful, might otherwise have benefited us and our stockholders. In addition, your investment may be adversely affected to the extent we pay costs of settlement and damage awards against directors and officers pursuant to these indemnification provisions.
Our amended and restated certificate of incorporation and our amended and restated by-laws will require us to indemnify and advance expenses to our directors and officers to the fullest extent not prohibited by the DGCL and other applicable law, except in the case of a proceeding instituted by the director without the approval of our Board. Our amended and restated certificate of incorporation and our amended and restated by-laws will provide that we are required to indemnify our directors and executive officers, to the fullest extent permitted by law, for all judgments, fines, settlements, legal fees and other expenses incurred in connection with pending or threatened legal proceedings because of the director’s or officer’s positions with us or another entity that the director or officer serves at our request, subject to various conditions, and to advance funds to our directors and officers to enable them to defend against such proceedings. To receive indemnification, the director or officer must have been successful in the legal proceeding or have acted in good faith and in what was reasonably believed to be a lawful manner in our best interest and, with respect to any criminal proceeding, have had no reasonable cause to believe his or her conduct was unlawful.
Prior to the settlement of this offering, we will enter into an indemnification agreement with each of our directors. The indemnification agreement will provide our directors with contractual rights to the indemnification and expense advancement rights provided under our amended and restated by-laws, as well as contractual rights to additional indemnification as provided in the indemnification agreement.
Corporate Opportunities
Our amended and restated certificate of incorporation will provide that we, on our behalf and on behalf of our subsidiaries, renounce any interest or expectancy in, or in being offered an opportunity to participate in, potential transactions, matters or business opportunities (each, a “corporate opportunity”) that are from time to time presented to AXA or any of its officers, directors, employees, agents, stockholders, members, partners, affiliates or subsidiaries (other than us and our subsidiaries), even if the opportunity is one that we or our subsidiaries might reasonably be deemed to have pursued or had the ability or desire to pursue if granted the opportunity to do so. Neither AXA nor any of its officers, directors, employees, agents, stockholders, members, partners, affiliates or subsidiaries will be liable to us or any of our subsidiaries for breach of any fiduciary or other duty, as a director or otherwise, by reason of the fact that such person pursues or acquires such corporate opportunity, directs such corporate opportunity to another person or fails to present such corporate opportunity, or information regarding such corporate opportunity, to us or our subsidiaries unless, in the case of any such person who is a director or officer of Holdings, such corporate opportunity is expressly offered to such director or officer in writing solely in his or her capacity as a director or officer of Holdings. To the fullest extent permitted by law, by becoming a stockholder in our company, stockholders will be deemed to have notice of and consented to this provision of our amended and restated certificate of incorporation.
Choice of Forum
Our amended and restated certificate of incorporation will provide that, unless we consent in writing to the selection of an alternate forum, the Court of Chancery of the State of Delaware will, to the fullest extent provided by law, be the sole and exclusive forum for (i) any derivative action or proceeding brought on our behalf, (ii) any
324
Table of Contents
action asserting a claim of breach of a fiduciary duty owed to us or our stockholders by any of our directors, officers, other employees, agents or stockholders, (iii) any action asserting a claim against us arising under the DGCL or as to which the DGCL confers jurisdiction on the Court of Chancery of the State of Delaware (including, without limitation, any action asserting a claim arising out of or pursuant to our amended and restated by-laws) or (iv) any action asserting a claim against us that is governed by the internal affairs doctrine. To the fullest extent permitted by law, by becoming a stockholder in our company, you will be deemed to have notice of and have consented to the provisions of our amended and restated certificate of incorporation related to choice of forum.
Market Listing
We have been approved to list our common stock on the NYSE under the symbol “EQH”.
Transfer Agent and Registrar
The transfer agent and registrar for our common stock will be Computershare Trust Company, N.A.
325
Table of Contents
SHARES AVAILABLE FOR FUTURE SALE
Immediately prior to this offering, there was no public market for our common stock. Sales of substantial amounts of our common stock in the public market could adversely affect prevailing market prices of our common stock. Some shares of our common stock will not be available for sale for a certain period of time after this offering because they are subject to contractual and legal restrictions on resale some of which are described below. Sales of substantial amounts of common stock in the public market after these restrictions lapse, or the perception that these sales could occur, could adversely affect the prevailing market price and our ability to raise equity capital in the future.
Sales of Restricted Securities
Currently, 561,000,000 shares of our common stock are outstanding. Of these shares, 137,250,000 shares sold in this offering (or 157,837,500 shares if the underwriters exercise their option to purchase additional shares of common stock from the selling stockholder in full) will be freely tradable without restriction under the Securities Act, unless purchased by our “affiliates,” as that term is defined in Rule 144 under the Securities Act. The remaining 423,750,000 shares of our common stock (or 403,162,500 shares if the underwriters exercise their option to purchase additional shares of common stock from the selling stockholder in full) that will be outstanding after this offering are “restricted securities” within the meaning of Rule 144 under the Securities Act. Restricted securities may be sold in the public market only if they are registered under the Securities Act or are sold pursuant to an exemption from registration under Rule 144 or Rule 701 under the Securities Act, which are summarized below. Subject to the lock-up agreements described below, shares held by our affiliates that are not restricted securities or that have been owned for more than one year may be sold subject to compliance with Rule 144 of the Securities Act without regard to the prescribed one-year holding period under Rule 144.
AXA is offering mandatorily exchangeable securities concurrently with this offering, which will be mandatorily exchangeable into up to 33,823,529 issued and outstanding shares of our common stock (assuming $750 million principal amount, the midpoint of the price range set forth on the cover page of this prospectus and exercise of the initial purchasers’ option to purchase additional securities) owned by AXA three years from issuance, subject to early exchange events. At maturity, AXA expects that any shares delivered by AXA to the security holders in exchange for the securities will be freely tradeable shares listed on the NYSE without regard to any limitations of Rule 144.
Stock Options
Upon the settlement of this offering, we intend to file one or more registration statements under the Securities Act to register the shares of common stock to be issued under our stock option plans and, as a result, all shares of common stock acquired upon exercise of stock options and other equity-based awards granted under these plans will, subject to a 180-day lock-up period, also be freely tradable under the Securities Act unless purchased by our affiliates. A total of 5,882,352 shares of common stock will be available for grants of additional equity awards under stock incentive plans to be adopted prior to the settlement of this offering.
Lock-up Agreements
Upon the settlement of this offering, the selling stockholder and our directors and executive officers will have signed lock-up agreements, under which they will agree not to sell, transfer or dispose of, directly or indirectly, any shares of our common stock or any securities convertible into or exercisable or exchangeable for shares of our common stock without the prior written consent of Morgan Stanley & Co. LLC and J.P. Morgan Securities LLC for a period of 180 days after the date of this prospectus. These agreements are described below under “Underwriting.”
326
Table of Contents
Registration Rights Agreement
AXA will have the right to require us to register its shares of common stock for resale. See “Certain Relationships and Related Party Transactions—Relationship with AXA Following this Offering—Registration Rights Agreement.”
Rule 144
In general, under Rule 144, as currently in effect, a person (or persons whose shares are aggregated) who is not deemed to be or have been one of our affiliates for purposes of the Securities Act at any time during 90 days preceding a sale and who has beneficially owned the shares proposed to be sold for at least six months, including the holding period of any prior owner other than an affiliate, is entitled to sell such shares without registration, subject to compliance with the public information requirements of Rule 144. If such a person has beneficially owned the shares proposed to be sold for at least one year, including the holding period of a prior owner other than an affiliate, then such person is entitled to sell such shares without complying with any of the requirements of Rule 144.
In general, under Rule 144, as currently in effect, our affiliates or persons selling shares on behalf of our affiliates, who have met the six-month holding period for beneficial ownership of “restricted shares” of our common stock, are entitled to sell within any three month period, a number of shares that does not exceed the greater of:
| • | 1% of the number of shares of our common stock then outstanding, which will equal approximately 5,610,000 shares immediately after this offering; and |
| • | the average reported weekly trading volume of our common stock on the NYSE during the four calendar weeks preceding the date of filing a Notice of Proposed Sale of Securities Pursuant to Rule 144 with respect to the sale. |
Sales under Rule 144 by our affiliates or persons selling shares on behalf of our affiliates are also subject to certain manner of sale provisions and notice requirements and to the availability of current public information about us. The sale of these shares, or the perception that sales will be made, could adversely affect the price of our common stock after this offering because a great supply of shares would be, or would be perceived to be, available for sale in the public market.
Rule 701
Any of our employees, officers or directors who acquired shares under a written compensatory plan or contract may be entitled to sell them in reliance on Rule 701. Rule 701 permits affiliates to sell their Rule 701 shares under Rule 144 without complying with the holding period requirements of Rule 144. Rule 701 further provides that non-affiliates may sell these shares in reliance on Rule 144 without complying with the holding period, public information, volume limitation or notice provisions of Rule 144. However, all shares issued under Rule 701 are subject to lock-up agreements and will only become eligible for sale when the 180-day lock-up agreements expire.
327
Table of Contents
MATERIAL U.S. FEDERAL TAX CONSIDERATIONS FOR NON-U.S. HOLDERS
The following is a discussion of material U.S. federal income tax considerations relating to the purchase, ownership and disposition of our common stock by Non-U.S. Holders (as defined below) that purchase such common stock pursuant to this offering and hold such common stock as a capital asset. This discussion is based on the U.S. Internal Revenue Code of 1986, as amended (the “Code”), U.S. Treasury regulations promulgated or proposed thereunder, and administrative and judicial interpretations thereof, all as in effect on the date hereof and all of which are subject to change, possibly with retroactive effect, or to different interpretation. This discussion does not address all of the U.S. federal income tax considerations that may be relevant to specific Non-U.S. Holders in light of their particular circumstances or to Non-U.S. Holders subject to special treatment under U.S. federal income tax law (such as banks, insurance companies, dealers in securities or other Non-U.S. Holders that generally mark their securities to market for U.S. federal income tax purposes, foreign governments, international organizations, tax-exempt entities, certain former citizens or residents of the United States, or Non-U.S. Holders that hold our common stock as part of a straddle, hedge, conversion or other integrated transaction). This discussion does not address any U.S. state or local or non-U.S. tax considerations or any U.S. federal gift, Medicare contribution or alternative minimum tax considerations.
As used in this discussion, the term “Non-U.S. Holder” means a beneficial owner of our common stock that, for U.S. federal income tax purposes, is:
| • | an individual who is neither a citizen nor a resident of the United States; |
| • | a corporation that is not created or organized in or under the laws of the United States, any state thereof, or the District of Columbia; |
| • | an estate that is not subject to U.S. federal income tax on income from non-U.S. sources which is not effectively connected with the conduct of a trade or business in the United States; or |
| • | a trust unless (i) a court within the United States is able to exercise primary supervision over its administration and one or more U.S. persons have the authority to control all of its substantial decisions or (ii) it has in effect a valid election under applicable U.S. Treasury regulations to be treated as a U.S. person. |
If an entity treated as a partnership for U.S. federal income tax purposes invests in our common stock, the U.S. federal income tax considerations relating to such investment will depend in part upon the status and activities of such entity and the particular partner. Any such entity should consult its own tax advisor regarding the U.S. federal income tax considerations applicable to it and its partners relating to the purchase, ownership and disposition of our common stock.
PERSONS CONSIDERING AN INVESTMENT IN OUR COMMON STOCK SHOULD CONSULT THEIR OWN TAX ADVISORS REGARDING THE U.S. FEDERAL, STATE AND LOCAL AND NON-U.S. INCOME, ESTATE AND OTHER TAX CONSIDERATIONS RELATING TO THE PURCHASE, OWNERSHIP AND DISPOSITION OF OUR COMMON STOCK IN LIGHT OF THEIR PARTICULAR CIRCUMSTANCES.
Distributions on Common Stock
If we make a distribution of cash or other property (other than certain pro rata distributions of our common stock or rights to acquire our common stock) with respect to a share of our common stock, the distribution generally will be treated as a dividend to the extent it is paid from our current or accumulated earnings and profits (as determined under U.S. federal income tax principles). If the amount of such distribution exceeds our current and accumulated earnings and profits, such excess generally will be treated first as a tax-free return of capital to the extent of the Non-U.S. Holder’s adjusted tax basis in such share of our common stock, and then as capital gain (which will be treated in the manner described below under “—Sale, Exchange or Other Disposition
328
Table of Contents
of Common Stock”). Distributions treated as dividends on our common stock that are paid to or for the account of a Non-U.S. Holder generally will be subject to U.S. federal withholding tax at a rate of 30%, or at a lower rate if provided by an applicable tax treaty and the Non-U.S. Holder provides the documentation (generally, Internal Revenue Service (“IRS”) Form W-8BEN or W-8BEN-E) required to claim benefits under such tax treaty to the applicable withholding agent. Even if our current or accumulated earnings and profits are less than the amount of the distribution, the applicable withholding agent may elect to treat the entire distribution as a dividend for U.S. federal withholding tax purposes. Each Non-U.S. Holder should consult its own tax advisor regarding U.S. federal withholding tax on distributions, including such Non-U.S. Holder’s eligibility for a lower rate and the availability of a refund of any excess U.S. federal tax withheld.
If, however, a dividend is effectively connected with the conduct of a trade or business in the United States by a Non-U.S. Holder, such dividend generally will not be subject to the 30% U.S. federal withholding tax if such Non-U.S. Holder provides the appropriate documentation (generally, IRS Form W-8ECI) to the applicable withholding agent. Instead, such Non-U.S. Holder generally will be subject to U.S. federal income tax on such dividend in substantially the same manner as a U.S. person (except as provided by an applicable tax treaty). In addition, a Non-U.S. Holder that is treated as a corporation for U.S. federal income tax purposes may be subject to a branch profits tax at a rate of 30% (or a lower rate if provided by an applicable tax treaty) on its effectively connected income for the taxable year, subject to certain adjustments.
The foregoing discussion is subject to the discussion below under “—FATCA Withholding” and “—Information Reporting and Backup Withholding.”
Sale, Exchange or Other Disposition of Common Stock
A Non-U.S. Holder generally will not be subject to U.S. federal income tax on any gain recognized on the sale, exchange or other disposition of our common stock unless:
| (i) | such gain is effectively connected with the conduct of a trade or business in the United States by such Non-U.S. Holder, in which event such Non-U.S. Holder generally will be subject to U.S. federal income tax on such gain in substantially the same manner as a U.S. person (except as provided by an applicable tax treaty) and, if it is treated as a corporation for U.S. federal income tax purposes, may also be subject to a branch profits tax at a rate of 30% (or a lower rate if provided by an applicable tax treaty); |
| (ii) | such Non-U.S. Holder is an individual who is present in the United States for 183 days or more during the taxable year of such sale, exchange or other disposition and certain other conditions are met, in which event such gain (net of certain U.S. source losses) generally will be subject to U.S. federal income tax at a rate of 30% (except as provided by an applicable tax treaty); or |
| (iii) | we are or have been a “United States real property holding corporation” for U.S. federal income tax purposes at any time during the shorter of (x) the five-year period ending on the date of such sale, exchange or other disposition and (y) such Non-U.S. Holder’s holding period with respect to such common stock, and certain other conditions are met. |
Generally, a corporation is a “United States real property holding corporation” if the fair market value of its United States real property interests equals or exceeds 50% of the sum of the fair market value of its worldwide real property interests and its other assets used or held for use in a trade or business (all as determined for U.S. federal income tax purposes). We believe that we presently are not, and we do not presently anticipate that we will become, a United States real property holding corporation.
The foregoing discussion is subject to the discussion below under “—FATCA Withholding” and “—Information Reporting and Backup Withholding.”
329
Table of Contents
FATCA Withholding
Under the Foreign Account Tax Compliance Act provisions of the Code and related U.S. Treasury guidance (“FATCA”), a withholding tax of 30% will be imposed in certain circumstances on payments of (i) dividends on our common stock and (ii) on or after January 1, 2019, gross proceeds from the sale or other disposition of our common stock. In the case of payments made to a “foreign financial institution” (such as a bank, a broker, an investment fund or, in certain cases, a holding company), as a beneficial owner or as an intermediary, this tax generally will be imposed, subject to certain exceptions, unless such institution (i) has agreed to (and does) comply with the requirements of an agreement with the United States (an “FFI Agreement”) or (ii) is required by (and does comply with) applicable foreign law enacted in connection with an intergovernmental agreement between the United States and a foreign jurisdiction (an “IGA”) to, among other things, collect and provide to the U.S. tax authorities or other relevant tax authorities certain information regarding U.S. account holders of such institution and, in either case, such institution provides the withholding agent with a certification as to its FATCA status. In the case of payments made to a foreign entity that is not a financial institution (as a beneficial owner), the tax generally will be imposed, subject to certain exceptions, unless such entity provides the withholding agent with a certification as to its FATCA status and, in certain cases, identifies any “substantial” U.S. owner (generally, any specified U.S. person that directly or indirectly owns more than a specified percentage of such entity). If our common stock is held through a foreign financial institution that has agreed to comply with the requirements of an FFI Agreement or is subject to similar requirements under applicable foreign law enacted in connection with an IGA, such foreign financial institution (or, in certain cases, a person paying amounts to such foreign financial institution) generally will be required, subject to certain exceptions, to withhold tax on payments made to (i) a person (including an individual) that fails to provide any required information or documentation or (ii) a foreign financial institution that has not agreed to comply with the requirements of an FFI Agreement and is not subject to similar requirements under applicable foreign law enacted in connection with an IGA. Each Non-U.S. Holder should consult its own tax advisor regarding the application of FATCA to the ownership and disposition of our common stock.
Information Reporting and Backup Withholding
Amounts treated as payments of dividends on our common stock paid to a Non-U.S. Holder and the amount of any U.S. federal tax withheld from such payments generally will be reported annually to the IRS and to such Non-U.S. Holder by the applicable withholding agent.
The information reporting and backup withholding rules that apply to payments of dividends to certain U.S. persons generally will not apply to payments of dividends on our common stock to a Non-U.S. Holder if such Non-U.S. Holder certifies under penalties of perjury that it is not a U.S. person (generally by providing an IRS Form W-8BEN or W-8BEN-E to the applicable withholding agent) or otherwise establishes an exemption.
Proceeds from the sale, exchange or other disposition of our common stock by a Non-U.S. Holder effected outside the United States through a non-U.S. office of a non-U.S. broker generally will not be subject to the information reporting and backup withholding rules that apply to payments to certain U.S. persons, provided that the proceeds are paid to the Non-U.S. Holder outside the United States. However, proceeds from the sale, exchange or other disposition of our common stock by a Non-U.S. Holder effected through a non-U.S. office of a non-U.S. broker with certain specified U.S. connections or of a U.S. broker generally will be subject to these information reporting rules (but generally not to these backup withholding rules), even if the proceeds are paid to such Non-U.S. Holder outside the United States, unless such Non-U.S. Holder certifies under penalties of perjury that it is not a U.S. person (generally by providing an IRS Form W-8BEN or W-8BEN-E to the applicable withholding agent) or otherwise establishes an exemption. Proceeds from the sale, exchange or other disposition of our common stock by a Non-U.S. Holder effected through a U.S. office of a broker generally will be subject to these information reporting and backup withholding rules unless such Non-U.S. Holder certifies under penalties of perjury that it is not a U.S. person (generally by providing an IRS Form W-8BEN or W-8BEN-E to the applicable withholding agent) or otherwise establishes an exemption.
330
Table of Contents
Backup withholding is not an additional tax. Any amounts withheld under the backup withholding rules generally will be allowed as a refund or a credit against a Non-U.S. Holder’s U.S. federal income tax liability if the required information is furnished by such Non-U.S. Holder on a timely basis to the IRS.
U.S. Federal Estate Tax
Shares of our common stock owned or treated as owned by an individual Non-U.S. Holder at the time of such Non-U.S. Holder’s death will be included in such Non-U.S. Holder’s gross estate for U.S. federal estate tax purposes and may be subject to U.S. federal estate tax unless an applicable estate tax treaty provides otherwise.
331
Table of Contents
Under the terms and subject to the conditions in an underwriting agreement dated the date of this prospectus, the underwriters named below, for whom Morgan Stanley & Co. LLC, J.P. Morgan Securities LLC, Barclays Capital Inc. and Citigroup Global Markets Inc. are acting as representatives, have severally agreed to purchase, and the selling stockholder has agreed to sell to them the number of shares indicated below:
| Name |
Number of Shares |
|||
| Morgan Stanley & Co. LLC |
||||
| J.P. Morgan Securities LLC |
||||
| Barclays Capital Inc. |
||||
| Citigroup Global Markets Inc. |
||||
| Merrill Lynch, Pierce, Fenner & Smith Incorporated |
||||
| Credit Suisse Securities (USA) LLC |
||||
| Deutsche Bank Securities Inc. |
||||
| Goldman Sachs & Co. LLC |
||||
| BNP Paribas Securities Corp. |
||||
| SG Americas Securities, LLC |
||||
| ING Financial Markets LLC |
||||
| Credit Agricole Securities (USA) Inc. |
||||
| HSBC Securities (USA) Inc. |
||||
| Natixis Securities Americas LLC |
||||
| RBC Capital Markets, LLC |
||||
| Lazard Frères & Co LLC |
||||
| BBVA Securities Inc. |
||||
| Commerz Markets LLC |
||||
| Mizuho Securities USA LLC |
||||
| MUFG Securities Americas Inc. |
||||
| PNC Capital Markets LLC |
||||
| SMBC Nikko Securities America, Inc. |
||||
| SunTrust Robinson Humphrey, Inc. |
||||
| UniCredit Capital Markets LLC |
||||
|
|
|
|||
| Total: |
||||
|
|
|
|||
The underwriters and the representatives are collectively referred to as the “underwriters” and the “representatives,” respectively. The underwriters are offering the shares of common stock subject to their acceptance of the shares from the selling stockholder and subject to prior sale. The underwriting agreement provides that the obligations of the several underwriters to pay for and accept delivery of the shares of common stock offered by this prospectus are subject to the approval of certain legal matters by their counsel and to certain other conditions. The underwriters are obligated to take and pay for all of the shares of common stock offered by this prospectus if any such shares are taken. However, the underwriters are not required to take or pay for the shares covered by the underwriters’ purchase option described below. The underwriting agreement also provides that if an underwriter defaults, the purchase commitments of non-defaulting underwriters may be increased or the offering may be terminated.
The underwriters initially propose to offer part of the shares of common stock directly to the public at the offering price listed on the cover page of this prospectus and part to certain dealers at a price that represents a concession not in excess of $ per share under the public offering price. After the initial offering of the shares of common stock, the offering price and other selling terms may from time to time be varied by the representatives. The offering of the shares by the underwriters is subject to receipt and acceptance and subject to the underwriters’ right to reject any order in whole or in part. Sales of shares of common stock made outside the United States may be made by affiliates of the underwriters.
332
Table of Contents
The selling stockholder has granted to the underwriters an option, exercisable for 30 days from the date of this prospectus, to purchase up to 20,587,500 additional shares of common stock at the public offering price listed on the cover page of this prospectus, less underwriting discounts and commissions. The underwriters may exercise this option solely for the purpose of covering over-allotments, if any, made in connection with the offering of the shares of common stock offered by this prospectus. To the extent the option is exercised, each underwriter will become obligated, subject to certain conditions, to purchase about the same percentage of the additional shares of common stock as the number listed next to the underwriter’s name in the preceding table bears to the total number of shares of common stock listed next to the names of all underwriters in the preceding table.
The following table shows the per share and total public offering price, underwriting discounts and commissions, and proceeds before expenses to the selling stockholder. These amounts are shown assuming both no exercise and full exercise of the underwriters’ option to purchase up to an additional 20,587,500 shares of common stock.
| Total | ||||||||||||
| Per Share | No Exercise |
Full Exercise |
||||||||||
| Public offering price |
$ | $ | $ | |||||||||
| Underwriting discounts and commissions to be paid by the selling stockholder |
$ | $ | $ | |||||||||
|
|
|
|
|
|
|
|||||||
| Proceeds, before expenses, to selling stockholder |
$ | $ | $ | |||||||||
|
|
|
|
|
|
|
|||||||
Our estimated offering expenses payable in connection with the offering, exclusive of the underwriting discounts and commissions, are approximately $88 million. We have agreed to reimburse the underwriters for certain expenses relating to clearance of this offering with FINRA up to $30,000.
The underwriters have informed us that they do not intend sales to discretionary accounts to exceed 5% of the total number of shares of common stock offered by them.
We have been approved to list our common stock on the NYSE under the trading symbol “EQH”.
We, the selling stockholder and all of our directors and executive officers have agreed that, without the prior written consent of Morgan Stanley & Co. LLC and J.P. Morgan Securities LLC on behalf of the underwriters, we and they will not, during the period ending 180 days after the date of this prospectus (the “restricted period”):
| • | offer, pledge, sell, contract to sell, sell any option or contract to purchase, purchase any option or contract to sell, grant any option, right or warrant to purchase, lend or otherwise transfer or dispose of, directly or indirectly, any shares of common stock or any securities convertible into or exercisable or exchangeable for shares of common stock whether any such transaction is to be settled by delivery of common stock or such other securities, in cash or otherwise; |
| • | enter into any swap or other arrangement that transfers to another, in whole or in part, any of the economic consequences of ownership of the common stock whether any such transaction is to be settled by delivery of common stock or other securities, in cash or otherwise; or |
| • | file any registration statement with the SEC relating to the offering of any shares of common stock or any securities convertible into or exercisable or exchangeable for common stock or otherwise publicly announce any intention to enter into any transaction described above. |
The lock-up agreements will be subject to specified exceptions.
Morgan Stanley & Co. LLC and J.P. Morgan Securities LLC may release the common stock and other securities subject to the lock-up agreements described above in whole or in part at any time.
333
Table of Contents
In order to facilitate the offering of the common stock, the underwriters may engage in transactions that stabilize, maintain or otherwise affect the price of the common stock. Specifically, the underwriters may sell more shares than they are obligated to purchase under the underwriting agreement, creating a short position. A short sale is covered if the short position is no greater than the number of shares available for purchase by the underwriters under the over-allotment option. The underwriters can close out a covered short sale by exercising the over-allotment option or purchasing shares in the open market. In determining the source of shares to close out a covered short sale, the underwriters will consider, among other things, the open market price of shares compared to the price available under the over-allotment option. The underwriters may also sell shares in excess of the over-allotment option, creating a naked short position. The underwriters must close out any naked short position by purchasing shares in the open market. A naked short position is more likely to be created if the underwriters are concerned that there may be downward pressure on the price of the common stock in the open market after pricing that could adversely affect investors who purchase in this offering. As an additional means of facilitating this offering, the underwriters may bid for, and purchase, shares of common stock in the open market to stabilize the price of the common stock. These activities may raise or maintain the market price of the common stock above independent market levels or prevent or retard a decline in the market price of the common stock. The underwriters are not required to engage in these activities and may end any of these activities at any time.
We, the selling stockholder and the underwriters have agreed to indemnify each other against certain liabilities, including liabilities under the Securities Act.
A prospectus in electronic format may be made available on websites maintained by one or more underwriters, or selling group members, if any, participating in this offering. The representatives may agree to allocate a number of shares of common stock to underwriters for sale to their online brokerage account holders. Internet distributions will be allocated by the representatives to underwriters that may make Internet distributions on the same basis as other allocations.
Other Relationships
The underwriters and their respective affiliates are full service financial institutions engaged in various activities, which may include securities trading, commercial and investment banking, financial advisory, investment management, investment research, principal investment, hedging, financing and brokerage activities. Certain of the underwriters and their respective affiliates have, from time to time, performed, and may in the future perform, various financial advisory and investment banking services for us, for which they received or will receive customary fees and expenses.
Certain underwriters or affiliates of the underwriters are lenders under the Credit Facilities and the letter of credit facilities. In addition, in connection with the revolving credit facility, JPMorgan Chase Bank, N.A., an affiliate of J.P. Morgan Securities LLC, acts as Administrative Agent and, (i) together with Citigroup Global Markets Inc. acted as a Joint Lead Arranger and Bookrunner, and (ii) together with Citibank, N.A., an affiliate of Citigroup Global Markets Inc., acted as a Syndication Agent. In connection with our three-year term loan agreement, J.P. Morgan Chase Bank, N.A., an affiliate of J.P. Morgan Securities LLC, acts as Administrative Agent and, together with Citigroup Global Markets Inc., acted as a Joint Lead Arranger.
In addition, certain underwriters or affiliates of the underwriters act as lenders in connection with the AB Credit Facility. In connection with the AB Credit Facility, Citigroup Global Markets Inc. and J.P. Morgan Securities LLC acted as Joint Lead Arrangers and Joint Book Managers and Citibank, N.A., an affiliate of Citigroup Global Markets Inc. and JPMorgan Chase Bank, N.A., an affiliate of J.P. Morgan Securities LLC, acted as Co-Syndication Agents.
In addition, certain underwriters or affiliates of the underwriters will be acting or may act as initial purchasers in the offering of mandatorily exchangeable securities that AXA is offering concurrently with this
334
Table of Contents
offering. Morgan Stanley & Co. LLC, J.P. Morgan Securities LLC, Barclays Capital Inc. and Citigroup Global Markets Inc., who are serving as representatives in this offering, may act as representatives in such offering.
In addition to acting as an underwriter, Lazard Frères & Co LLC provided advisory services to the selling stockholder in connection with this offering.
In addition, in the ordinary course of their various business activities, the underwriters and their respective affiliates may make or hold a broad array of investments and actively trade debt and equity securities (or related derivative securities) and financial instruments (including bank loans) for their own account and for the accounts of their customers and may at any time hold long and short positions in such securities and instruments. Such investment and securities activities may involve our securities and instruments. The underwriters and their respective affiliates may also make investment recommendations or publish or express independent research views in respect of such securities or instruments and may at any time hold, or recommend to clients that they acquire, long or short positions in such securities and instruments.
Pricing of the Offering
Prior to this offering, there has been no public market for our common stock. The initial public offering price was determined by negotiations between the selling stockholder and the representatives. Among the factors considered in determining the initial public offering price were our future prospects and those of our industry in general, our sales, earnings and certain other financial and operating information in recent periods, and the price-earnings ratios, price-sales ratios, market prices of securities, and certain financial and operating information of companies engaged in activities similar to ours.
Directed Share Program
At our request, Morgan Stanley & Co. LLC has reserved 5% of the shares of common stock offered by this prospectus for sale, at the initial public offering price, to eligible directors, employees and financial professionals of the Company. The number of shares of common stock available for sale to the general public will be reduced to the extent these individuals purchase such reserved shares. Any reserved shares that are not so purchased will be offered by the underwriters to the general public on the same basis as the other shares offered by this prospectus. Any individual that participates in the directed share program will agree to a six-month lock-up on such shares.
Selling Restrictions
Other than in the United States, no action has been taken by us or the underwriters that would permit a public offering of the securities offered by this prospectus in any jurisdiction where action for that purpose is required. The securities offered by this prospectus may not be offered or sold, directly or indirectly, nor may this prospectus or any other offering material or advertisements in connection with the offer and sale of any such securities be distributed or published, in any jurisdiction, except under circumstances that will result in compliance with the applicable rules and regulations of that jurisdiction. Persons into whose possession this prospectus comes are advised to inform themselves about and to observe any restrictions relating to the offering and the distribution of this prospectus. This prospectus does not constitute an offer to sell or a solicitation of an offer to buy any securities offered by this prospectus in any jurisdiction in which such an offer or a solicitation is unlawful.
Notice to Prospective Investors in the European Economic Area
In relation to each Member State of the European Economic Area which has implemented the Prospectus Directive (each, a “Relevant Member State”), with effect from and including the date on which the Prospectus Directive is implemented in that Relevant Member State, no offer of shares may be made to the public in that Relevant Member State other than:
| (a) | to any legal entity which is a qualified investor as defined in the Prospectus Directive; |
335
Table of Contents
| (b) | to fewer than 150 natural or legal persons (other than qualified investors as defined in the Prospectus Directive), subject to obtaining the prior consent of the underwriters; or |
| (c) | in any other circumstances falling within Article 3(2) of the Prospectus Directive; provided that no such offer of shares shall require the Company or any underwriter to publish a prospectus pursuant to Article 3 of the Prospectus Directive and each person who initially acquires any shares or to whom any offer is made will be deemed to have represented, acknowledged and agreed to and with each of the underwriters and the Company that it is a “qualified investor” within the meaning of the law in that Relevant Member State implementing Article 2(1)(e) of the Prospectus Directive. |
In the case of any shares being offered to a financial intermediary as that term is used in Article 3(2) of the Prospectus Directive, each such financial intermediary will be deemed to have represented, acknowledged and agreed that the shares acquired by it in the offer have not been acquired on a non-discretionary basis on behalf of, nor have they been acquired with a view to their offer or resale to, persons in circumstances which may give rise to an offer of any shares to the public other than their offer or resale in a Relevant Member State to qualified investors as so defined or in circumstances in which the prior consent of the representatives has been obtained to each such proposed offer or resale.
For the purposes of this provision, the expression an “offer of shares to the public” in relation to any shares in any Relevant Member State means the communication in any form and by means of sufficient information on the terms of the offer and the shares to be offered so as to enable an investor to decide to purchase shares, as the same may be varied in that Member State by any measure implementing the Prospectus Directive in that Member State, the expression “Prospectus Directive” means Directive 2003/71/EC (as amended, including by Directive 2010/73/EU), and includes any relevant implementing measure in the Relevant Member State.
Notice to Prospective Investors in the United Kingdom
In addition, in the United Kingdom, this document is being distributed only to, and is directed only at, and any offer subsequently made may only be directed at persons who are “qualified investors” (as defined in the Prospectus Directive) (i) who have professional experience in matters relating to investments falling within Article 19(5) of the Financial Services and Markets Act 2000 (Financial Promotion) Order 2005, as amended (the “Order”) and/or (ii) who are high net worth companies (or persons to whom it may otherwise be lawfully communicated) falling within Article 49(2)(a) to (d) of the Order (all such persons together being referred to as “relevant persons”) or otherwise in circumstances which have not resulted and will not result in an offer to the public of the shares in the United Kingdom within the meaning of the Financial Services and Markets Act 2000.
Any person in the United Kingdom that is not a relevant person should not act or rely on the information included in this document or use it as basis for taking any action. In the United Kingdom, any investment or investment activity that this document relates to may be made or taken exclusively by relevant persons.
Notice to Prospective Investors in Canada
The shares may be sold only to purchasers purchasing, or deemed to be purchasing, as principal that are accredited investors, as defined in National Instrument 45-106 Prospectus Exemptions or subsection 73.3(1) of the Securities Act (Ontario), and are permitted clients, as defined in National Instrument 31-103 Registration Requirements, Exemptions and Ongoing Registrant Obligations. Any resale of the shares must be made in accordance with an exemption from, or in a transaction not subject to, the prospectus requirements of applicable securities laws.
Securities legislation in certain provinces or territories of Canada may provide a purchaser with remedies for rescission or damages if this prospectus (including any amendment thereto) contains a misrepresentation, provided that the remedies for rescission or damages are exercised by the purchaser within the time limit
336
Table of Contents
prescribed by the securities legislation of the purchaser’s province or territory. The purchaser should refer to any applicable provisions of the securities legislation of the purchaser’s province or territory for particulars of these rights or consult with a legal advisor.
Pursuant to section 3A.3 of National Instrument 33-105 Underwriting Conflicts (NI 33-105), the underwriters are not required to comply with the disclosure requirements of NI 33-105 regarding underwriter conflicts of interest in connection with this offering.
Notice to Prospective Investors in Switzerland
The shares may not be publicly offered in Switzerland and will not be listed on the SIX Swiss Exchange (“SIX”) or on any other stock exchange or regulated trading facility in Switzerland. This document does not constitute a prospectus within the meaning of, and has been prepared without regard to the disclosure standards for issuance prospectuses under art. 652a or art. 1156 of the Swiss Code of Obligations or the disclosure standards for listing prospectuses under art. 27 ff. of the SIX Listing Rules or the listing rules of any other stock exchange or regulated trading facility in Switzerland. Neither this document nor any other offering or marketing material relating to the shares or the offering may be publicly distributed or otherwise made publicly available in Switzerland.
Neither this document nor any other offering or marketing material relating to the offering, the Company or the shares have been or will be filed with or approved by any Swiss regulatory authority. In particular, this document will not be filed with, and the offer of shares will not be supervised by, the Swiss Financial Market Supervisory Authority FINMA, and the offer of shares has not been and will not be authorized under the Swiss Federal Act on Collective Investment Schemes (“CISA”). The investor protection afforded to acquirers of interests in collective investment schemes under the CISA does not extend to acquirers of shares.
Notice to Prospective Investors in the Dubai International Financial Centre (“DIFC”)
This document relates to an Exempt Offer in accordance with the Markets Rules 2012 of the Dubai Financial Services Authority (“DFSA”). This document is intended for distribution only to persons of a type specified in the Markets Rules 2012 of the DFSA. It must not be delivered to, or relied on by, any other person. The DFSA has no responsibility for reviewing or verifying any documents in connection with Exempt Offers. The DFSA has not approved this prospectus supplement nor taken steps to verify the information set forth herein and has no responsibility for this document. The securities to which this document relates may be illiquid and/or subject to restrictions on their resale. Prospective purchasers of the securities offered should conduct their own due diligence on the securities. If you do not understand the contents of this document you should consult an authorized financial advisor.
In relation to its use in the DIFC, this document is strictly private and confidential and is being distributed to a limited number of investors and must not be provided to any person other than the original recipient, and may not be reproduced or used for any other purpose. The interests in the securities may not be offered or sold directly or indirectly to the public in the DIFC.
Notice to Prospective Investors in the United Arab Emirates
The shares have not been, and are not being, publicly offered, sold, promoted or advertised in the United Arab Emirates (including the Dubai International Financial Centre) other than in compliance with the laws of the United Arab Emirates (and the Dubai International Financial Centre) governing the issue, offering and sale of securities. Further, this prospectus does not constitute a public offer of securities in the United Arab Emirates (including the Dubai International Financial Centre) and is not intended to be a public offer. This prospectus has not been approved by or filed with the Central Bank of the United Arab Emirates, the Securities and Commodities Authority or the Dubai Financial Services Authority.
337
Table of Contents
Notice to Prospective Investors in Australia
This prospectus:
| • | does not constitute a product disclosure document or a prospectus under Chapter 6D.2 of the Corporations Act 2001 (Cth) (the “Corporations Act”); |
| • | has not been, and will not be, lodged with the Australian Securities and Investments Commission (“ASIC”), as a disclosure document for the purposes of the Corporations Act and does not purport to include the information required of a disclosure document under Chapter 6D.2 of the Corporations Act; |
| • | does not constitute or involve a recommendation to acquire, an offer or invitation for issue or sale, an offer or invitation to arrange the issue or sale, or an issue or sale, of interests to a “retail client” (as defined in section 761G of the Corporations Act and applicable regulations) in Australia; and |
| • | may only be provided in Australia to select investors who are able to demonstrate that they fall within one or more of the categories of investors, or Exempt Investors, available under section 708 of the Corporations Act. |
The shares may not be directly or indirectly offered for subscription or purchased or sold, and no invitations to subscribe for or buy the shares may be issued, and no draft or definitive offering memorandum, advertisement or other offering material relating to any shares may be distributed in Australia, except where disclosure to investors is not required under Chapter 6D of the Corporations Act or is otherwise in compliance with all applicable Australian laws and regulations. By submitting an application for the shares, you represent and warrant to us that you are an Exempt Investor.
As any offer of shares under this document will be made without disclosure in Australia under Chapter 6D.2 of the Corporations Act, the offer of those securities for resale in Australia within 12 months may, under section 707 of the Corporations Act, require disclosure to investors under Chapter 6D.2 if none of the exemptions in section 708 applies to that resale. By applying for the shares you undertake to us that you will not, for a period of 12 months from the date of issue of the shares, offer, transfer, assign or otherwise alienate those securities to investors in Australia except in circumstances where disclosure to investors is not required under Chapter 6D.2 of the Corporations Act or where a compliant disclosure document is prepared and lodged with ASIC.
Notice to Prospective Investors in Japan
The shares have not been and will not be registered pursuant to Article 4, Paragraph 1 of the Financial Instruments and Exchange Act. Accordingly, none of the shares nor any interest therein may be offered or sold, directly or indirectly, in Japan or to, or for the benefit of, any “resident” of Japan (which term as used herein means any person resident in Japan, including any corporation or other entity organized under the laws of Japan), or to others for re-offering or resale, directly or indirectly, in Japan or to or for the benefit of a resident of Japan, except pursuant to an exemption from the registration requirements of, and otherwise in compliance with, the Financial Instruments and Exchange Act and any other applicable laws, regulations and ministerial guidelines of Japan in effect at the relevant time.
Notice to Prospective Investors in Hong Kong
The shares have not been offered or sold and will not be offered or sold in Hong Kong, by means of any document, other than (a) to “professional investors” as defined in the Securities and Futures Ordinance (Cap. 571) of Hong Kong and any rules made under that Ordinance; or (b) in other circumstances which do not result in the document being a “prospectus” as defined in the Companies (Winding Up and Miscellaneous Provisions) Ordinance (Cap. 32) of Hong Kong or which do not constitute an offer to the public within the meaning of that Ordinance. No advertisement, invitation or document relating to the shares has been or may be issued or has been or may be in the possession of any person for the purposes of issue, whether in Hong Kong or elsewhere, which
338
Table of Contents
is directed at, or the contents of which are likely to be accessed or read by, the public of Hong Kong (except if permitted to do so under the securities laws of Hong Kong) other than with respect to shares which are or are intended to be disposed of only to persons outside Hong Kong or only to “professional investors” as defined in the Securities and Futures Ordinance and any rules made under that Ordinance.
The contents of this document have not been reviewed by any regulatory authority in Hong Kong. You are advised to exercise caution in relation to the offer. If you are in any doubt about any of the contents of this document, you should obtain independent professional advice.
Notice to Prospective Investors in Singapore
This prospectus has not been registered as a prospectus with the Monetary Authority of Singapore. Accordingly, this prospectus and any other document or material in connection with the offer or sale, or invitation for subscription or purchase, of shares may not be circulated or distributed, nor may the shares be offered or sold, or be made the subject of an invitation for subscription or purchase, whether directly or indirectly, to persons in Singapore other than (i) to an institutional investor under Section 274 of the Securities and Futures Act, Chapter 289 of Singapore (the “SFA”), (ii) to a relevant person pursuant to Section 275(1), or any person pursuant to Section 275(1A), and in accordance with the conditions specified in Section 275 of the SFA, or (iii) otherwise pursuant to, and in accordance with the conditions of, any other applicable provision of the SFA.
Where the shares are subscribed or purchased under Section 275 of the SFA by a relevant person which is:
| (a) | a corporation (which is not an accredited investor (as defined in Section 4A of the SFA)) the sole business of which is to hold investments and the entire share capital of which is owned by one or more individuals, each of whom is an accredited investor; or |
| (b) | a trust (where the trustee is not an accredited investor) whose sole purpose is to hold investments and each beneficiary of the trust is an individual who is an accredited investor, |
securities (as defined in Section 239(1) of the SFA) of that corporation or the beneficiaries’ rights and interest (howsoever described) in that trust shall not be transferred within six months after that corporation or that trust has acquired the shares pursuant to an offer made under Section 275 of the SFA except:
| (a) | to an institutional investor or to a relevant person defined in Section 275(2) of the SFA, or to any person arising from an offer referred to in Section 275(1A) or Section 276(4)(i)(B) of the SFA; |
| (b) | where no consideration is or will be given for the transfer; |
| (c) | where the transfer is by operation of law; |
| (d) | as specified in Section 276(7) of the SFA; or |
| (e) | as specified in Regulation 32 of the Securities and Futures (Offers of Investments) (Shares and Debentures) Regulations 2005 of Singapore |
Notice to Prospective Investors in Bermuda
Shares may be offered or sold in Bermuda only in compliance with the provisions of the Investment Business Act of 2003 of Bermuda which regulates the sale of securities in Bermuda. Additionally, non-Bermudian persons (including companies) may not carry on or engage in any trade or business in Bermuda unless such persons are permitted to do so under applicable Bermuda legislation.
Notice to Prospective Investors in Saudi Arabia
This document may not be distributed in the Kingdom of Saudi Arabia except to such persons as are permitted under the Offers of Securities Regulations as issued by the board of the Saudi Arabian Capital Market
339
Table of Contents
Authority (“CMA”) pursuant to resolution number 2-11-2004 dated 4 October 2004 as amended by resolution number 1-28-2008, as amended. The CMA does not make any representation as to the accuracy or completeness of this document and expressly disclaims any liability whatsoever for any loss arising from, or incurred in reliance upon, any part of this document. Prospective purchasers of the securities offered hereby should conduct their own due diligence on the accuracy of the information relating to the securities. If you do not understand the contents of this document, you should consult an authorised financial adviser.
Notice to Prospective Investors in the British Virgin Islands
The shares may be offered to persons located in the British Virgin Islands who are “qualified investors” for the purposes of the Securities and Investment Business Act, 2010 (“SIBA”). Qualified investors include (i) certain entities which are regulated by the Financial Services Commission in the British Virgin Islands, including banks, insurance companies, licensees under SIBA and public, professional and private mutual funds; (ii) a company, any securities of which are listed on a recognised exchange; and (iii) persons defined as “professional investors” under SIBA, which is any person (a) whose ordinary business involves, whether for that person’s own account or the account of others, the acquisition or disposal of property of the same kind as the property, or a substantial part of the property of the Company; or (b) who has signed a declaration that he, whether individually or jointly with his spouse, has net worth in excess of US$1,000,000 and that he consents to being treated as a professional investor.
Notice to Prospective Investors in China
This prospectus does not constitute a public offer of shares, whether by sale or subscription, in the People’s Republic of China (the “PRC”). The shares are not being offered or sold directly or indirectly in the PRC to or for the benefit of, legal or natural persons of the PRC.
Further, no legal or natural persons of the PRC may directly or indirectly purchase any of the shares or any beneficial interest therein without obtaining all prior PRC’s governmental approvals that are required, whether statutorily or otherwise. Persons who come into possession of this document are required by the issuer and its representatives to observe these restrictions.
Notice to Prospective Investors in Korea
The shares have not been and will not be registered under the Financial Investments Services and Capital Markets Act of Korea and the decrees and regulations thereunder (the “FSCMA”), and the shares have been and will be offered in Korea as a private placement under the FSCMA. None of the shares may be offered, sold or delivered directly or indirectly, or offered or sold to any person for re-offering or resale, directly or indirectly, in Korea or to any resident of Korea except pursuant to the applicable laws and regulations of Korea, including the FSCMA and the Foreign Exchange Transaction Law of Korea and the decrees and regulations thereunder (the “FETL”). The shares have not been listed on any of securities exchanges in the world including, without limitation, the Korea Exchange in Korea. Furthermore, the purchaser of the shares shall comply with all applicable regulatory requirements (including but not limited to requirements under the FETL) in connection with the purchase of the shares. By the purchase of the shares, the relevant holder thereof will be deemed to represent and warrant that if it is in Korea or is a resident of Korea, it purchased the shares pursuant to the applicable laws and regulations of Korea.
Notice to Prospective Investors in Malaysia
No prospectus or other offering material or document in connection with the offer and sale of the shares has been or will be registered with the Securities Commission of Malaysia (“Commission”) for the Commission’s approval pursuant to the Capital Markets and Services Act 2007. Accordingly, this prospectus and any other document or material in connection with the offer or sale, or invitation for subscription or purchase, of the shares
340
Table of Contents
may not be circulated or distributed, nor may the shares be offered or sold, or be made the subject of an invitation for subscription or purchase, whether directly or indirectly, to persons in Malaysia other than (i) a closed end fund approved by the Commission; (ii) a holder of a Capital Markets Services Licence; (iii) a person who acquires the shares, as principal, if the offer is on terms that the shares may only be acquired at a consideration of not less than RM250,000 (or its equivalent in foreign currencies) for each transaction; (iv) an individual whose total net personal assets or total net joint assets with his or her spouse exceeds RM3 million (or its equivalent in foreign currencies), excluding the value of the primary residence of the individual; (v) an individual who has a gross annual income exceeding RM300,000 (or its equivalent in foreign currencies) per annum in the preceding twelve months; (vi) an individual who, jointly with his or her spouse, has a gross annual income of RM400,000 (or its equivalent in foreign currencies), per annum in the preceding twelve months; (vii) a corporation with total net assets exceeding RM10 million (or its equivalent in a foreign currencies) based on the last audited accounts; (viii) a partnership with total net assets exceeding RM10 million (or its equivalent in foreign currencies); (ix) a bank licensee or insurance licensee as defined in the Labuan Financial Services and Securities Act 2010; (x) an Islamic bank licensee or takaful licensee as defined in the Labuan Financial Services and Securities Act 2010; and (xi) any other person as may be specified by the Commission; provided that, in the each of the preceding categories (i) to (xi), the distribution of the shares is made by a holder of a Capital Markets Services Licence who carries on the business of dealing in securities. The distribution in Malaysia of this prospectus is subject to Malaysian laws. This prospectus does not constitute and may not be used for the purpose of public offering or an issue, offer for subscription or purchase, invitation to subscribe for or purchase any securities requiring the registration of a prospectus with the Commission under the Capital Markets and Services Act 2007.
Notice to Prospective Investors in Taiwan
The shares have not been and will not be registered with the Financial Supervisory Commission of Taiwan pursuant to relevant securities laws and regulations and may not be sold, issued or offered within Taiwan through a public offering or in circumstances which constitutes an offer within the meaning of the Securities and Exchange Act of Taiwan that requires a registration or approval of the Financial Supervisory Commission of Taiwan. No person or entity in Taiwan has been authorised to offer, sell, give advice regarding or otherwise intermediate the offering and sale of the shares in Taiwan.
Notice to Prospective Investors in South Africa
Due to restrictions under the securities laws of South Africa, the shares are not offered, and the offer shall not be transferred, sold, renounced or delivered, in South Africa or to a person with an address in South Africa, unless one or other of the following exemptions applies:
| (i) | the offer, transfer, sale, renunciation or delivery is to: |
| (a) | persons whose ordinary business is to deal in securities, as principal or agent; |
| (b) | the South African Public Investment Corporation; |
| (c) | persons or entities regulated by the Reserve Bank of South Africa; |
| (d) | authorised financial service providers under South African law; |
| (e) | financial institutions recognised as such under South African law; |
| (f) | a wholly-owned subsidiary of any person or entity contemplated in (c), (d) or (e), acting as agent in the capacity of an authorised portfolio manager for a pension fund or collective investment scheme (in each case duly registered as such under South African law); or |
| (g) | any combination of the person in (a) to (f); or |
| (ii) | the total contemplated acquisition cost of the securities, for any single addressee acting as principal is equal to or greater than ZAR1,000,000. |
341
Table of Contents
No “offer to the public” (as such term is defined in the South African Companies Act, No. 71 of 2008 (as amended or re-enacted) (the “South African Companies Act”)) in South Africa is being made in connection with the issue of the shares. Accordingly, this document does not, nor is it intended to, constitute a “registered prospectus” (as that term is defined in the South African Companies Act) prepared and registered under the South African Companies Act and has not been approved by, and/or filed with, the South African Companies and Intellectual Property Commission or any other regulatory authority in South Africa. Any issue or offering of the shares in South Africa constitutes an offer of the shares in South Africa for subscription or sale in South Africa only to persons who fall within the exemption from “offers to the public” set out in section 96(1)(a) of the South African Companies Act. Accordingly, this document must not be acted on or relied on by persons in South Africa who do not fall within section 96(1)(a) of the South African Companies Act (such persons being referred to as “SA Relevant Persons”). Any investment or investment activity to which this document relates is available in South Africa only to SA Relevant Persons and will be engaged in South Africa only with SA Relevant Persons.
342
Table of Contents
The validity of the shares of our common stock offered hereby will be passed upon for us by Debevoise & Plimpton LLP, New York, New York and will be passed upon for the underwriters by Sullivan & Cromwell LLP, New York, New York. Sullivan & Cromwell LLP has in the past provided, and continues to provide, legal services to AXA and to the independent directors or trustees of certain registered investment companies advised by AB.
The financial statements as of December 31, 2017 and December 31, 2016 and for each of the three years in the period ended December 31, 2017 included in this prospectus, and the financial statement schedules included in the registration statement, have been so included in reliance on the report (which contains an explanatory paragraph relating to the Company’s restatement of its financial statements and financial statement schedules as described in Note 1 to the financial statements and Note 5 to Schedule II) of PricewaterhouseCoopers LLP, an independent registered public accounting firm, given on the authority of said firm as experts in auditing and accounting.
As summarized under “Business—Segment Information—Individual Retirement—Supplemental Information on Our In-Force Variable Annuity Business,” Milliman has assisted in the development of the Sensitivity Analysis and the VA Distributable Earnings Projections presented therein. The Sensitivity Analysis and the VA Distributable Earnings Projections have been included in this prospectus on the authority of Milliman as experts in actuarial and related services.
WHERE YOU CAN FIND MORE INFORMATION
We have filed with the SEC a registration statement on Form S-1, of which this prospectus forms a part, with respect to the shares of our common stock being sold in this offering. This prospectus does not contain all of the information set forth in the registration statement and the exhibits thereto because some parts have been omitted in accordance with the rules and regulations of the SEC. For further information with respect to us and the common stock being sold in this offering, reference is made to the registration statement and the exhibits filed therewith. Statements contained in this prospectus as to the contents of any contract or other document referred to are not necessarily complete and in each instance, if such contract or document is filed as an exhibit, reference is made to the copy of such contract or other document filed as an exhibit to the registration statement, each statement being qualified in all respects by such reference. A copy of the registration statement, including the exhibits thereto, may be read and copied at the SEC’s Public Reference Room at 100 F Street, N.E., Room 1580, Washington, D.C. 20549. Information on the operation of the Public Reference Room may be obtained by calling the SEC at 1-800-SEC-0330. In addition, the SEC maintains an internet site at http://www.sec.gov, from which interested persons can electronically access the registration statement, including the exhibits and any schedules thereto. Copies of the registration statement, including the exhibits and schedules thereto, are also available at your request, without charge, from:
AXA Equitable Holdings, Inc.
1290 Avenue of the Americas
New York, New York 10104
Attention: Head of Investor Relations
We will be subject to the informational requirements of the Exchange Act and, accordingly, will file annual reports containing financial statements audited by an independent registered public accounting firm, quarterly reports containing unaudited financial statements, current reports, proxy statements and other information with
343
Table of Contents
the SEC. You will be able to inspect and copy these reports, proxy statements and other information at the public reference facilities maintained by the SEC at the address noted above. You will also be able to obtain copies of this material from the Public Reference Room of the SEC as described above, or inspect them without charge at the SEC’s website. You will also be able to access, free of charge, our reports filed with the SEC (for example, our Annual Reports on Form 10-K, our Quarterly Reports on Form 10-Q and our Current Reports on Form 8-K and any amendments to those forms) through our website (www.axa.com). Reports filed with or furnished to the SEC will be available as soon as reasonably practicable after they are filed with or furnished to the SEC. None of the information contained on, or that may be accessed through our websites or any other website identified herein is part of, or incorporated into, this prospectus. All website addresses in this prospectus are intended to be inactive textual references only.
344
Table of Contents
Glossary of Selected Financial Terms
| Account value (“AV”) | Generally equals the aggregate policy account value of our retirement and protection products. General Account AV refers to account balances in investment options that are backed by the General Account while Separate Account AV refers to Separate Account investment assets. | |
| Alternative investments | Investments in real estate and real estate joint ventures and other limited partnerships. | |
| Assets under administration (“AUA”) | Includes non-insurance client assets that are invested in our savings and investment products or serviced by our AXA Advisors platform. We provide administrative services for these assets and generally record the revenues received as distribution fees. | |
| Annualized Premium | 100% of first year recurring premiums (up to target) and 10% of excess first year premiums or first year premiums from single premium products. | |
| Assets under management (“AUM”) | Investment assets that are managed by one of our subsidiaries and includes: (i) assets managed by AB, (ii) the assets in our GAIA portfolio and (iii) the Separate Account assets of our retirement and protection businesses. Total AUM reflects exclusions between segments to avoid double counting. | |
| Combined RBC Ratio | Calculated as the overall aggregate RBC ratio for the Company’s insurance subsidiaries including capital held for its life insurance and variable annuity liabilities and non-variable annuity insurance liabilities. | |
| Conditional tail expectation (“CTE”) | Calculated as the average amount of total assets required to satisfy obligations over the life of the contract or policy in the worst [x]% of scenarios. Represented as CTE (100 less x). Example: CTE95 represents the worst five percent of scenarios. | |
| Deferred acquisition cost (“DAC”) | Represents the incremental costs related directly to the successful acquisition of new and certain renewal insurance policies and annuity contracts and which have been deferred on the balance sheet as an asset. | |
| Deferred sales inducements (“DSI”) | Represent amounts that are credited to a policyholder’s account balance that are higher than the expected crediting rates on similar contracts without such an inducement and that are an incentive to purchase a contract and also meet the accounting criteria to be deferred as an asset that is amortized over the life of the contract. | |
| Dividends Received Deduction (“DRD”) | A tax deduction under U.S. federal income tax law received by a corporation on the dividends it receives from other corporations in which it has an ownership stake. | |
| ETF | Exchange traded fund. | |
| FYP | First year premium and deposits. | |
| Gross Premiums | FYP and Renewal premium and deposits. | |
| Invested assets | Includes fixed maturity securities, equity securities, mortgage loans, policy loans, alternative investments and short-term investments. | |
| P&C | Property and casualty. | |
345
Table of Contents
| Premium and deposits | Amounts a policyholder agrees to pay for an insurance policy or annuity contract that may be paid in one or a series of payments as defined by the terms of the policy or contract. | |
| Protection Solutions Reserves | Equals the aggregate value of Policyholders’ account balances and Future policy benefits for policies in our Protection Solutions segment. | |
| Reinsurance | Insurance policies purchased by insurers to limit the total loss they would experience from an insurance claim. | |
| Renewal premium and deposits | Premiums and deposits after the first twelve months of the policy or contract. | |
| Risk-based capital (“RBC”) | Rules to determine insurance company statutory capital requirements. It is based on rules published by the National Association of Insurance Commissioners (“NAIC”). | |
| Total adjusted capital (“TAC”) | Primarily consists of capital and surplus, and the asset valuation reserve. | |
| Value of business acquired (“VOBA”) | Present value of estimated future gross profits from in-force policies of acquired businesses. | |
Glossary of Product Terms
| 401(k) | A tax-deferred retirement savings plan sponsored by an employer. 401(k) refers to the section of the Internal Revenue Code of 1986, as amended (the “Code”) pursuant to which these plans are established. | |
| 403(b) | A tax-deferred retirement savings plan available to certain employees of public schools and certain tax-exempt organizations. 403(b) refers to the section of the Code pursuant to which these plans are established. | |
| 457(b) | A deferred compensation plan that is available to governmental and certain non-governmental employers. 457(b) refers to the section of the Code pursuant to which these plans are established. | |
| Accumulation phase | The phase of a variable annuity contract during which assets accumulate based on the policyholder’s lump sum or periodic deposits and reinvested interest, capital gains and dividends that are generally tax-deferred. | |
| Affluent | Refers to individuals with $250,000 to $999,999 of investable assets. | |
| Annuitant | The person who receives annuity payments or the person whose life expectancy determines the amount of variable annuity payments upon annuitization of an annuity to be paid for life. | |
| Annuitization |
The process of converting an annuity investment into a series of periodic income payments, generally for life. | |
| Benefit base |
A notional amount (not actual cash value) used to calculate the owner’s guaranteed benefits within an annuity contract. The death benefit and living benefit within the same contract may not have the same benefit base. | |
| Cash surrender value |
The amount an insurance company pays (minus any surrender charge) to the policyholder when the contract or policy is voluntarily terminated prematurely. | |
| Deferred annuity |
An annuity purchased with premiums paid either over a period of years or as a lump sum, for which savings accumulate prior to annuitization or surrender, and upon annuitization, such savings are exchanged for either a future lump sum or periodic payments for a specified length of time or for a lifetime. | |
346
Table of Contents
| Dollar-for-dollar withdrawal |
A method of calculating the reduction of a variable annuity benefit base after a withdrawal in which the benefit is reduced by one dollar for every dollar withdrawn. | |
| Fixed annuity |
An annuity that guarantees a set annual rate of return with interest at rates we determine, subject to specified minimums. Credited interest rates are guaranteed not to change for certain limited periods of time. | |
| Fixed Rate GMxB |
Guarantees on our individual variable annuity products that are based on a rate that is fixed at issue. | |
| Floating Rate GMxB |
Guarantees on our individual variable annuity products that are based on a rate that varies with a specified index rate, subject to a cap and floor. | |
| Future policy benefits |
Future policy benefits for the annuities business are comprised mainly of liabilities for life-contingent income annuities, and liabilities for the variable annuity guaranteed minimum benefits accounted for as insurance.
Future policy benefits for the life business are comprised mainly of liabilities for traditional life and certain liabilities for universal and variable life insurance contracts (other than the policyholder account balance). | |
| General Account Investment Assets (“GAIA”) |
Means the invested assets held in the General Account. | |
| General Account | Means the assets held in the general accounts of our insurance companies as well as assets held in our separate accounts on which we bear the investment risk. | |
| GMxB | A general reference to all forms of variable annuity guaranteed benefits, including guaranteed minimum living benefits, or GMLBs (such as GMIBs, GMWBs and GMABs), and guaranteed minimum death benefits, or GMDBs (inclusive of return of premium death benefit guarantees). | |
| Guaranteed income benefit (“GIB”) | An optional benefit which provides the policyholder with a guaranteed lifetime annuity based on predetermined annuity purchase rates applied to a GIB benefit base, with annuitization automatically triggered if and when the contract AV falls to zero. | |
| Guaranteed minimum accumulation benefits (“GMAB”) | An optional benefit (available for an additional cost) which entitles an annuitant to a minimum payment, typically in lump-sum, after a set period of time, typically referred to as the accumulation period. The minimum payment is based on the benefit base, which could be greater than the underlying AV. | |
| Guaranteed minimum death benefits (“GMDB”) | An optional benefit (available for an additional cost) that guarantees an annuitant’s beneficiaries are entitled to a minimum payment based on the benefit base, which could be greater than the underlying AV, upon the death of the annuitant. | |
| Guaranteed minimum income benefits (“GMIB”) | An optional benefit (available for an additional cost) where an annuitant is entitled to annuitize the policy and receive a minimum payment stream based on the benefit base, which could be greater than the underlying AV. | |
| Guaranteed minimum living benefits (“GMLB”) | A reference to all forms of guaranteed minimum living benefits, including GMIBs, GMWBs and GMABs (does not include GMDBs). | |
347
Table of Contents
| Guaranteed minimum withdrawal benefit riders (“GMLB Riders”) | Changes in the carrying value of GMLB liabilities, related hedges and reinsurance; the fees earned directly from the GMLB liabilities; and related DAC offsets. | |
| Guaranteed minimum withdrawal benefits (“GMWB”) | An optional benefit (available for an additional cost) where an annuitant is entitled to withdraw a maximum amount of their benefit base each year, for which cumulative payments to the annuitant could be greater than the underlying AV. | |
| Guaranteed Universal Life (“GUL”) | A universal life insurance offering with a lifetime no lapse guarantee rider, otherwise known as a guaranteed UL policy. With a GUL policy, the premiums are guaranteed to last the life of the policy. | |
| Guaranteed withdrawal benefit for life (“GWBL”) | An optional benefit (available for an additional cost) where an annuitant is entitled to withdraw a maximum amount of their benefit base each year, for the duration of the policyholder’s life, regardless of account performance. | |
| High net worth | Refers to individuals with $1,000,000 or more of investable assets. | |
| Index-linked annuities | An annuity that provides for asset accumulation and asset distribution needs with an ability to share in the upside from certain financial markets such as equity indices, or an interest rate benchmark. With an index-linked annuity, the policyholder’s AV can grow or decline due to various external financial market indices performance. | |
| Indexed Universal Life (“IUL”) | A permanent life insurance offering built on a universal life insurance framework that uses an equity-linked approach for generating policy investment returns. | |
| Living benefits | Optional benefits (available at an additional cost) that guarantee that the policyholder will get back at least his original investment when the money is withdrawn. | |
| Mortality and expense risk fee (“M&E fee”) | A fee charged by insurance companies to compensate for the risk they take by issuing life insurance and variable annuity contracts. | |
| Net flows | Net change in customer account balances in a period including, but not limited to, gross premiums, surrenders, withdrawals and benefits. It excludes investment performance, interest credited to customer accounts and policy charges. | |
| Net long-term flows | Net change of assets under management in a period which includes new sales net of redemptions of mutual funds and terminations of separately managed accounts and cash flow which includes both cash invested or withdrawn from existing clients. In addition, cash flow includes fees received from certain clients. It excludes the impact of the markets. | |
| Period certain annuity | Type of annuity that guarantees payment to the annuitant for a specified time period and to the beneficiary if the annuitant dies before the period ends. | |
| Policyholder account balances | Annuities. Policyholder account balances are held for fixed deferred annuities, the fixed account portion of variable annuities and non-life contingent income annuities. Interest is credited to the policyholder’s account at interest rates we determine which are influenced by current market rates, subject to specified minimums.
Life Insurance Policies. Policyholder account balances are held for retained asset accounts, universal life policies and the fixed account of universal variable life insurance policies. Interest is credited to the policyholder’s account at interest rates we determine which are influenced by current market rates, subject to specified minimums. | |
348
Table of Contents
| Return of premium (“ROP”) death benefit | This death benefit pays the greater of the account value at the time of a claim following the owner’s death or the total contributions to the contract (subject to adjustment for withdrawals). The charge for this benefit is usually included in the M&E fee that is deducted daily from the net assets in each variable investment option. We also refer to this death benefit as the Return of Principal death benefit. | |
| Rider | An optional feature or benefit that a policyholder can purchase at an additional cost. | |
| Roll-up rate | The guaranteed percentage that the benefit base increases by each year. | |
| SCS | Structured Capital Strategies, a variable annuity with an index-linked feature that offers policyholders growth potential up to a cap and certain downside protection. | |
| Separate Account | Refers to the separate account investment assets of our insurance subsidiaries excluding the assets held in those separate accounts on which we bear the investment risk. | |
| Step up | An optional vehicle annuity feature (available at an additional cost) that can increase the benefit base amount if the variable annuity AV is higher than the benefit base on specified dates. | |
| Surrender charge | A fee paid by a contract owner for the early withdrawal of an amount that exceeds a specific percentage or for cancellation of the contract within a specified amount of time after purchase. | |
| Surrender rate | Represents annualized surrenders and withdrawals as a percentage of average AV. | |
| Universal life (“UL”) products | Life insurance products that provide a death benefit in return for payment of specified annual policy charges that are generally related to specific costs, which may change over time. To the extent that the policyholder chooses to pay more than the charges required in any given year to keep the policy in-force, the excess premium will be placed into the AV of the policy and credited with a stated interest rate on a monthly basis. | |
| Variable annuity | A type of annuity that offers guaranteed periodic payments for a defined period of time or for life and gives purchasers the ability to invest in various markets though the underlying investment options, which may result in potentially higher, but variable, returns. | |
| Variable Universal Life (“VUL”) | Universal life products where the excess amount paid over policy charges can be directed by the policyholder into a variety of Separate Account investment options. In the Separate Account investment options, the policyholder bears the entire risk and returns of the investment results. | |
| Whole Life (“WL”) | A life insurance policy that is guaranteed to remain in-force for the policyholder’s lifetime, provided the required premiums are paid. | |
349
Table of Contents
INDEX TO CONSOLIDATED FINANCIAL STATEMENTS
F-1
Table of Contents
Report of Independent Registered Public Accounting Firm
To the Board of Directors and Shareholders of
AXA Equitable Holdings, Inc.:
Opinion on the Financial Statements
We have audited the accompanying consolidated balance sheets of AXA Equitable Holdings, Inc. and its subsidiaries as of December 31, 2017 and 2016, and the related consolidated statements of income (loss), comprehensive income (loss), equity and cash flows for each of the three years in the period ended December 31, 2017, including the related notes and financial statement schedules listed in the accompanying index (collectively referred to as the “consolidated financial statements”). In our opinion, the consolidated financial statements present fairly, in all material respects, the financial position of the Company as of December 31, 2017 and 2016, and the results of their operations and their cash flows for each of the three years in the period ended December 31, 2017 in conformity with accounting principles generally accepted in the United States of America.
Restatement of Previously Issued Financial Statements
As discussed in Note 1 to the consolidated financial statements and Note 5 to Schedule II, the Company has restated its 2016 consolidated financial statements and financial statement schedules to correct errors.
Basis for Opinion
These consolidated financial statements are the responsibility of the Company’s management. Our responsibility is to express an opinion on the Company’s consolidated financial statements based on our audits. We are a public accounting firm registered with the Public Company Accounting Oversight Board (United States) (“PCAOB”) and are required to be independent with respect to the Company in accordance with the U.S. federal securities laws and the applicable rules and regulations of the Securities and Exchange Commission and the PCAOB.
We conducted our audits of these consolidated financial statements in accordance with the standards of the PCAOB. Those standards require that we plan and perform the audit to obtain reasonable assurance about whether the consolidated financial statements are free of material misstatement, whether due to error or fraud.
Our audits included performing procedures to assess the risks of material misstatement of the consolidated financial statements, whether due to error or fraud, and performing procedures that respond to those risks. Such procedures included examining, on a test basis, evidence regarding the amounts and disclosures in the consolidated financial statements. Our audits also included evaluating the accounting principles used and significant estimates made by management, as well as evaluating the overall presentation of the consolidated financial statements. We believe that our audits provide a reasonable basis for our opinion.
/s/PricewaterhouseCoopers LLP
New York, New York
April 6, 2018, except for the effects of the stock split discussed in Note 19 to the consolidated financial statements, as to which the date is April 26, 2018
We have served as the Company’s auditor since 1993.
F-2
Table of Contents
CONSOLIDATED BALANCE SHEETS
DECEMBER 31, 2017 AND 2016
| As Restated | ||||||||
| 2017 | 2016 | |||||||
| (in millions, except share amounts) |
||||||||
| ASSETS |
||||||||
| Investments: |
||||||||
| Fixed maturities available for sale, at fair value (amortized cost of $45,068 and $41,332) |
$ | 46,941 | $ | 41,879 | ||||
| Mortgage loans on real estate (net of valuation allowance of $8 and $8) |
10,952 | 9,774 | ||||||
| Real estate held for production of income(1) |
390 | 56 | ||||||
| Policy loans |
3,819 | 3,855 | ||||||
| Other equity investments(1) |
1,392 | 1,345 | ||||||
| Trading securities, at fair value |
14,170 | 12,085 | ||||||
| Other invested assets(1) |
4,118 | 3,324 | ||||||
|
|
|
|
|
|||||
| Total investments |
$ | 81,782 | $ | 72,318 | ||||
| Cash and cash equivalents(1) |
4,814 | 5,654 | ||||||
| Cash and securities segregated, at fair value |
825 | 946 | ||||||
| Broker-dealer related receivables |
2,158 | 2,100 | ||||||
| Deferred policy acquisition costs |
5,969 | 6,044 | ||||||
| Goodwill and other intangible assets, net |
4,824 | 5,243 | ||||||
| Amounts due from reinsurers |
5,023 | 5,220 | ||||||
| Loans to affiliates |
1,230 | 1,246 | ||||||
| GMIB reinsurance contract asset, at fair value |
1,894 | 1,735 | ||||||
| Current and deferred tax assets |
67 | 496 | ||||||
| Other assets(1) |
2,510 | 2,462 | ||||||
| Separate Accounts assets |
124,552 | 113,150 | ||||||
|
|
|
|
|
|||||
| Total assets |
$ | 235,648 | $ | 216,614 | ||||
|
|
|
|
|
|||||
| LIABILITIES |
||||||||
| Policyholders’ account balances |
$ | 47,171 | $ | 41,956 | ||||
| Future policy benefits and other policyholders liabilities |
30,299 | 30,278 | ||||||
| Broker-dealer related payables |
783 | 539 | ||||||
| Securities sold under agreements to repurchase |
1,887 | 3,593 | ||||||
| Customers related payables |
2,229 | 2,360 | ||||||
| Amounts due to reinsurers |
1,436 | 1,509 | ||||||
| Short-term and long-term debt(1) |
2,408 | 1,605 | ||||||
| Loans from affiliates |
3,622 | 2,904 | ||||||
| Other liabilities(1) |
4,053 | 3,720 | ||||||
| Separate Accounts liabilities |
124,552 | 113,150 | ||||||
|
|
|
|
|
|||||
| Total liabilities |
$ | 218,440 | $ | 201,614 | ||||
|
|
|
|
|
|||||
| Redeemable noncontrolling interest(1) |
$ | 626 | $ | 403 | ||||
|
|
|
|
|
|||||
| Commitments and contingent liabilities (Notes 10 and 16) |
||||||||
| EQUITY |
||||||||
| Equity attributable to Holdings: |
||||||||
| Common stock, $0.01 par value, 2,000,000,000 shares authorized and 561,000,000 issued and outstanding |
$ | 6 | $ | 6 | ||||
| Capital in excess of par value |
1,298 | 931 | ||||||
| Retained earnings |
12,289 | 11,439 | ||||||
| Accumulated other comprehensive income (loss) |
(108 | ) | (921 | ) | ||||
|
|
|
|
|
|||||
| Total equity attributable to Holdings |
$ | 13,485 | $ | 11,455 | ||||
|
|
|
|
|
|||||
| Noncontrolling interest |
$ | 3,097 | $ | 3,142 | ||||
|
|
|
|
|
|||||
| Total equity |
$ | 16,582 | $ | 14,597 | ||||
|
|
|
|
|
|||||
| Total Liabilities, Redeemable Noncontrolling Interest and Equity |
$ | 235,648 | $ | 216,614 | ||||
|
|
|
|
|
|||||
| (1) | See Note 2 for details of balances with variable interest entities. |
See Notes to Consolidated Financial Statements.
F-3
Table of Contents
CONSOLIDATED STATEMENTS OF INCOME (LOSS)
YEARS ENDED DECEMBER 31, 2017, 2016 AND 2015
| As Restated | ||||||||||||
| 2017 | 2016 | 2015 | ||||||||||
| (in millions, except earnings per share data) | ||||||||||||
| REVENUES |
||||||||||||
| Policy charges and fee income |
$ | 3,733 | $ | 3,762 | $ | 3,653 | ||||||
| Premiums |
1,124 | 1,083 | 1,070 | |||||||||
| Net derivative gains (losses) |
228 | (1,722 | ) | (1,393 | ) | |||||||
| Net investment income |
3,082 | 2,665 | 2,450 | |||||||||
| Investment gains (losses), net: |
||||||||||||
| Total other-than-temporary impairment losses |
(15 | ) | (68 | ) | (42 | ) | ||||||
| Other investment gains (losses), net |
(176 | ) | 2,051 | 27 | ||||||||
|
|
|
|
|
|
|
|||||||
| Total investment gains (losses), net |
$ | (191 | ) | $ | 1,983 | $ | (15 | ) | ||||
|
|
|
|
|
|
|
|||||||
| Investment management and service fees |
4,093 | 3,749 | 3,895 | |||||||||
| Other Income |
445 | 402 | 419 | |||||||||
|
|
|
|
|
|
|
|||||||
| Total revenues |
$ | 12,514 | $ | 11,922 | $ | 10,079 | ||||||
|
|
|
|
|
|
|
|||||||
| BENEFITS AND OTHER DEDUCTIONS |
||||||||||||
| Policyholders’ benefits |
4,354 | 3,343 | 3,505 | |||||||||
| Interest credited to policyholders’ account balances |
1,108 | 1,091 | 946 | |||||||||
| Compensation and benefits (includes $156, $154 and $157 of deferred acquisition costs; see note 6) |
2,137 | 2,119 | 2,165 | |||||||||
| Commissions and distribution related payments (includes $523, $536 and $559 of deferred acquisition costs; see note 6) |
1,604 | 1,536 | 1,586 | |||||||||
| Interest expense |
160 | 174 | 136 | |||||||||
| Amortization of deferred policy acquisition costs, net (net of capitalization of $687, $697 and $723; see note 6) |
(239 | ) | 89 | (285 | ) | |||||||
| Other operating costs and expenses (see note 11 for related party information) (includes $8, $7 and $7 of deferred acquisition costs; see note 6) |
2,076 | 1,516 | 1,585 | |||||||||
|
|
|
|
|
|
|
|||||||
| Total benefits and other deductions |
$ | 11,200 | $ | 9,868 | $ | 9,638 | ||||||
|
|
|
|
|
|
|
|||||||
| Income (loss) from operations, before income taxes |
1,314 | 2,054 | 441 | |||||||||
| Income tax (expense) benefit |
(41 | ) | (387 | ) | 217 | |||||||
|
|
|
|
|
|
|
|||||||
| Net income (loss) |
$ | 1,273 | $ | 1,667 | $ | 658 | ||||||
| Less: Net (income) loss attributable to the noncontrolling interest |
(423 | ) | (395 | ) | (325 | ) | ||||||
|
|
|
|
|
|
|
|||||||
| Net income (loss) attributable to Holdings |
$ | 850 | $ | 1,272 | $ | 333 | ||||||
|
|
|
|
|
|
|
|||||||
| EARNINGS PER SHARE |
||||||||||||
| Earnings per share - Common stock |
||||||||||||
| Basic |
$ | 1.52 | $ | 2.27 | $ | 0.59 | ||||||
|
|
|
|
|
|
|
|||||||
| Diluted |
$ | 1.51 | $ | 2.27 | $ | 0.59 | ||||||
|
|
|
|
|
|
|
|||||||
| Weighted average common shares outstanding |
561.0 | 561.0 | 561.0 | |||||||||
|
|
|
|
|
|
|
|||||||
See Notes to Consolidated Financial Statements.
F-4
Table of Contents
CONSOLIDATED STATEMENTS OF COMPREHENSIVE INCOME (LOSS)
YEARS ENDED DECEMBER 31, 2017, 2016 AND 2015
| As Restated | ||||||||||||
| 2017 | 2016 | 2015 | ||||||||||
| (in millions) | ||||||||||||
| COMPREHENSIVE INCOME (LOSS) |
||||||||||||
| Net income (loss) |
$ | 1,273 | $ | 1,667 | $ | 658 | ||||||
|
|
|
|
|
|
|
|||||||
| Other comprehensive income (loss) net of income taxes: |
||||||||||||
| Foreign currency translation adjustment |
42 | (18 | ) | (25 | ) | |||||||
| Change in unrealized gains (losses), net of reclassification adjustment |
690 | (274 | ) | (939 | ) | |||||||
| Changes in defined benefit plan related items not yet recognized in periodic benefit cost, net of reclassification adjustment |
100 | 34 | 35 | |||||||||
|
|
|
|
|
|
|
|||||||
| Total other comprehensive income (loss), net of income taxes |
832 | (258 | ) | (929 | ) | |||||||
|
|
|
|
|
|
|
|||||||
| Comprehensive income (loss) |
2,105 | 1,409 | (271 | ) | ||||||||
| Less: Comprehensive (income) loss attributable to noncontrolling interest |
(442 | ) | (381 | ) | (311 | ) | ||||||
|
|
|
|
|
|
|
|||||||
| Comprehensive income (loss) attributable to Holdings |
$ | 1,663 | $ | 1,028 | $ | (582 | ) | |||||
|
|
|
|
|
|
|
|||||||
See Notes to Consolidated Financial Statements.
F-5
Table of Contents
CONSOLIDATED STATEMENTS OF EQUITY
YEARS ENDED DECEMBER 31, 2017, 2016 AND 2015
| As Restated | ||||||||||||
| 2017 | 2016 | 2015 | ||||||||||
| (in millions) | ||||||||||||
| Equity attributable to Holdings: |
||||||||||||
| Common stock, at par value, beginning and end of year |
$ | 6 | $ | 6 | $ | 6 | ||||||
|
|
|
|
|
|
|
|||||||
| Capital in excess of par value, beginning of year |
$ | 931 | $ | 941 | $ | 862 | ||||||
| Changes in capital in excess of par value |
367 | (10 | ) | 79 | ||||||||
|
|
|
|
|
|
|
|||||||
| Capital in excess of par value, end of year |
$ | 1,298 | $ | 931 | $ | 941 | ||||||
|
|
|
|
|
|
|
|||||||
| Retained earnings, beginning of year |
$ | 11,439 | $ | 10,167 | $ | 9,834 | ||||||
| Net income (loss) attributable to Holdings |
850 | 1,272 | 333 | |||||||||
|
|
|
|
|
|
|
|||||||
| Retained earnings, end of year |
$ | 12,289 | $ | 11,439 | $ | 10,167 | ||||||
|
|
|
|
|
|
|
|||||||
| Accumulated other comprehensive income (loss), beginning of year |
(921 | ) | (677 | ) | 238 | |||||||
| Other comprehensive income (loss) |
813 | (244 | ) | (915 | ) | |||||||
|
|
|
|
|
|
|
|||||||
| Accumulated other comprehensive income (loss), end of year |
$ | (108 | ) | $ | (921 | ) | $ | (677 | ) | |||
|
|
|
|
|
|
|
|||||||
| Total Holdings’ equity, end of year |
$ | 13,485 | $ | 11,455 | $ | 10,437 | ||||||
|
|
|
|
|
|
|
|||||||
| Noncontrolling interest, beginning of year |
3,142 | 3,108 | 3,151 | |||||||||
| Repurchase of AB Holding units |
(121 | ) | (128 | ) | (118 | ) | ||||||
| Net income (loss) attributable to noncontrolling interest |
370 | 369 | 325 | |||||||||
| Dividends paid to noncontrolling interest |
(348 | ) | (294 | ) | (337 | ) | ||||||
| Other comprehensive income (loss) attributable to noncontrolling interest |
19 | (14 | ) | (14 | ) | |||||||
| Other changes in noncontrolling interest |
35 | 101 | 101 | |||||||||
|
|
|
|
|
|
|
|||||||
| Noncontrolling interest, end of period |
$ | 3,097 | $ | 3,142 | $ | 3,108 | ||||||
|
|
|
|
|
|
|
|||||||
| Total equity, end of period |
$ | 16,582 | $ | 14,597 | $ | 13,545 | ||||||
|
|
|
|
|
|
|
|||||||
See Notes to Consolidated Financial Statements.
F-6
Table of Contents
CONSOLIDATED STATEMENTS OF CASH FLOWS
YEARS ENDED DECEMBER 31, 2017, 2016 AND 2015
| 2017 | As Restated 2016 |
2015 | ||||||||||
| (in millions) | ||||||||||||
| Net income (loss) |
$ | 1,273 | $ | 1,667 | $ | 658 | ||||||
| Adjustments to reconcile net income (loss) to net cash provided by (used in) operating activities: |
||||||||||||
| Interest credited to policyholders’ account balances |
1,108 | 1,091 | 946 | |||||||||
| Policy charges and fee income |
(3,733 | ) | (3,762 | ) | (3,653 | ) | ||||||
| Net derivative (gains) losses, net |
(228 | ) | 1,722 | 1,393 | ||||||||
| Investment (gains) losses, net |
191 | (1,983 | ) | 15 | ||||||||
| Realized and unrealized (gains) losses on trading securities |
(266 | ) | 63 | 128 | ||||||||
| Non-cash long term incentive compensation expense |
185 | 152 | 176 | |||||||||
| Amortization and depreciation |
(104 | ) | (21 | ) | 9 | |||||||
| Change in goodwill |
369 | — | — | |||||||||
| Distributions from joint ventures and limited partnerships |
140 | 582 | 199 | |||||||||
| Changes in: |
||||||||||||
| Net broker-dealer and customer related receivables/payables |
(278 | ) | 608 | (39 | ) | |||||||
| Segregated cash and securities, net |
130 | (381 | ) | (89 | ) | |||||||
| Deferred policy acquisition costs |
(239 | ) | 89 | (285 | ) | |||||||
| Future policy benefits |
1,587 | 273 | 672 | |||||||||
| Current and deferred income taxes |
759 | (208 | ) | (163 | ) | |||||||
| Other, net |
127 | (128 | ) | (159 | ) | |||||||
|
|
|
|
|
|
|
|||||||
| Net cash provided by (used in) operating activities |
$ | 1,021 | $ | (236 | ) | $ | (192 | ) | ||||
|
|
|
|
|
|
|
|||||||
| Cash flows from investing activities: |
||||||||||||
| Proceeds from the sale/maturity/prepayment of: |
||||||||||||
| Fixed maturities, available for sale |
$ | 11,339 | $ | 8,606 | $ | 5,349 | ||||||
| Mortgage loans on real estate |
934 | 676 | 609 | |||||||||
| Trading account securities |
11,231 | 7,841 | 19,864 | |||||||||
| Real estate |
— | 1,828 | — | |||||||||
| Real estate joint ventures |
— | 136 | — | |||||||||
| Other |
228 | 64 | 181 | |||||||||
| Payment for the purchase/origination of: |
||||||||||||
| Fixed maturities, available for sale |
(15,166 | ) | (10,688 | ) | (5,179 | ) | ||||||
| Mortgage loans on real estate |
(2,108 | ) | (3,278 | ) | (1,311 | ) | ||||||
| Trading account securities |
(13,328 | ) | (10,283 | ) | (21,053 | ) | ||||||
| Real estate |
— | (1 | ) | (20 | ) | |||||||
| Real estate joint ventures |
— | (51 | ) | — | ||||||||
| Other |
(296 | ) | (192 | ) | (148 | ) | ||||||
| Purchase of business, net of cash acquired |
(130 | ) | (21 | ) | — | |||||||
| Cash settlements related to derivative instruments |
(2,166 | ) | (195 | ) | 602 | |||||||
| Change in short-term investments |
(342 | ) | (485 | ) | (961 | ) | ||||||
| Repayments of loans to affiliates |
15 | — | 90 | |||||||||
| Issuance of loans to affiliates |
— | (12 | ) | (275 | ) | |||||||
| Investment in capitalized software, leasehold improvements and EDP equipment |
(102 | ) | (97 | ) | (83 | ) | ||||||
| Other, net |
202 | 384 | 194 | |||||||||
|
|
|
|
|
|
|
|||||||
| Net cash provided by (used in) investing activities |
$ | (9,689 | ) | $ | (5,768 | ) | $ | (2,141 | ) | |||
|
|
|
|
|
|
|
|||||||
F-7
Table of Contents
AXA EQUITABLE HOLDINGS, INC.
CONSOLIDATED STATEMENTS OF CASH FLOWS
YEARS ENDED DECEMBER 31, 2017, 2016 AND 2015
(CONTINUED)
| 2017 | As Restated 2016 |
2015 | ||||||||||
| (in millions) | ||||||||||||
| Cash flows from financing activities: |
||||||||||||
| Policyholders’ account balances: |
||||||||||||
| Deposits |
$ | 10,591 | $ | 10,001 | $ | 5,255 | ||||||
| Withdrawals |
(6,140 | ) | (2,976 | ) | (2,934 | ) | ||||||
| Transfers (to) from Separate Accounts |
1,677 | 1,432 | 2,001 | |||||||||
| Proceeds from loans from affiliates |
731 | — | 694 | |||||||||
| Change in short-term financings |
600 | (176 | ) | 30 | ||||||||
| Change in collateralized pledged assets |
1,044 | (991 | ) | (45 | ) | |||||||
| Change in collateralized pledged liabilities |
1,246 | 15 | (515 | ) | ||||||||
| (Decrease) increase in overdrafts payable |
63 | (85 | ) | 80 | ||||||||
| Repayment of loans from affiliates |
(56 | ) | (1,752 | ) | (1,454 | ) | ||||||
| Repayments of long-term debt |
— | — | (200 | ) | ||||||||
| Repurchase of AB Holding units |
(220 | ) | (236 | ) | (214 | ) | ||||||
| Purchases (redemptions) of non-controlling interests of consolidated company-sponsored investment funds |
120 | (137 | ) | — | ||||||||
| Distribution to noncontrolling interest in consolidated subsidiaries |
(348 | ) | (294 | ) | (337 | ) | ||||||
| Increase (decrease) in securities sold under agreement to repurchase |
(1,706 | ) | 227 | 612 | ||||||||
| (Increase) decrease in securities purchased under agreement to resell |
— | 79 | (79 | ) | ||||||||
| Purchase of shares in consolidated subsidiaries |
(55 | ) | — | — | ||||||||
| Capital contribution from parent |
318 | — | — | |||||||||
| Other, net |
(59 | ) | 4 | 4 | ||||||||
|
|
|
|
|
|
|
|||||||
| Net cash provided by (used in) financing activities |
7,806 | 5,111 | 2,898 | |||||||||
|
|
|
|
|
|
|
|||||||
| Effect of exchange rate changes on cash and cash equivalents |
22 | (10 | ) | (10 | ) | |||||||
| Change in cash and cash equivalents |
(840 | ) | (903 | ) | 555 | |||||||
| Cash and cash equivalents, beginning of year |
5,654 | 6,557 | 6,002 | |||||||||
|
|
|
|
|
|
|
|||||||
| Cash and cash equivalents, end of year |
$ | 4,814 | $ | 5,654 | $ | 6,557 | ||||||
|
|
|
|
|
|
|
|||||||
| Supplemental cash flow information: |
||||||||||||
| Interest paid |
$ | 119 | $ | 108 | $ | 120 | ||||||
|
|
|
|
|
|
|
|||||||
| Income taxes (refunded) paid |
$ | 31 | $ | (385 | ) | $ | 94 | |||||
|
|
|
|
|
|
|
|||||||
See Notes to Consolidated Financial Statements.
F-8
Table of Contents
NOTES TO CONSOLIDATED FINANCIAL STATEMENTS
| 1) | ORGANIZATION |
AXA Equitable Holdings, Inc. (“Holdings” and, collectively with its consolidated subsidiaries, the “Company”) is a diversified financial services company. The Company is a direct, wholly-owned subsidiary of AXA S.A. (“AXA”), a French holding company for the AXA Group, a worldwide leader in life, property and casualty and health insurance and asset management.
The Company conducts operations in four segments: Individual Retirement, Group Retirement, Investment Management and Research, and Protection Solutions. The Company’s management evaluates the performance of each of these segments independently.
| • | The Individual Retirement segment offers a diverse suite of variable annuity products which are primarily sold to affluent and high net worth individuals saving for retirement or seeking retirement income. |
| • | The Group Retirement segment offers tax-deferred investment and retirement plans sponsored by educational entities, municipalities and not-for-profit entities as well as small and medium-sized businesses. |
| • | The Investment Management and Research segment provides diversified investment management, research and related solutions globally to a broad range of clients through three main client channels - Institutional, Retail and Private Wealth Management - and distributes its institutional research products and solutions through Bernstein Research Services. Our Investment Management and Research segment reflects the business of AllianceBernstein Holding L.P. (“AB Holding”), AllianceBernstein L.P. (“ABLP”) and their subsidiaries (collectively, “AB”). |
| • | The Protection Solutions segment includes our life insurance and group employee benefits businesses. Our life insurance business offers a variety of variable universal life, indexed universal life and term life products to help affluent and high net worth individuals, as well as small and medium-sized business owners, with their wealth protection, wealth transfer and corporate needs. Our group employee benefits business offers a suite of life, short- and long-term disability, dental and vision insurance products to small and medium-size businesses across the United States. |
Corporate and Other includes certain of our financing and investment expenses. It also includes: the AXA Advisors broker-dealer business, closed block of life insurance (the “Closed Block”), run-off variable annuity reinsurance business, run-off group pension business, run-off health business, benefit plans for our employees, certain strategic investments and certain unallocated items, including capital and related investments, interest expense and corporate expense. AB’s results of operations are reflected in the Investment Management and Research segment. Accordingly, Corporate and Other does not include any items applicable to AB.
At December 31, 2017 and 2016, the Company’s economic interest in AB was 46.7% and 45.8%, respectively. At December 31, 2017 and 2016, respectively, AXA and its subsidiaries’ economic interest in AB (including the Company’s interest) was approximately 64.7% and 63.7%. The general partner of AB, AllianceBernstein Corporation (the “General Partner”), is a wholly-owned subsidiary of the Company. Because the General Partner has the authority to manage and control the business of AB, AB is consolidated in the Company’s financial statements.
F-9
Table of Contents
Restatement and Revision of Prior Period Financial Statements
Management identified errors in its previously issued financial statements. These errors primarily relate to errors in the calculation of policyholders’ benefit reserves and the calculation of DAC amortization for certain variable and interest sensitive life products, primarily attributable to corrections in actuarial modeling methodology changes, calculations and inputs as well as journal entry processing. Based on quantitative and qualitative factors, management determined that the impact of the errors was material to the consolidated financial statements as of and for the year ended December 31, 2016, which therefore are restated herein and discussed below. The impact of these errors to the consolidated financial statements for the year ended December 31, 2015 was not considered to be material either individually or in the aggregate. In order to improve the consistency and comparability of the financial statements, management voluntarily revised the consolidated statements of income (loss), statements of comprehensive income (loss), statements of equity and statements of cash flows for the year ended December 31, 2015 to include the revisions discussed below.
| December 31, 2016 | ||||||||||||
| As Previously Reported |
Impact of Adjustments |
As Restated | ||||||||||
| (in millions) | ||||||||||||
| Assets: |
||||||||||||
| Deferred policy acquisition costs |
$ | 5,971 | $ | 73 | $ | 6,044 | ||||||
| Loans to affiliates |
1,257 | (11 | ) | 1,246 | ||||||||
| Current and deferred income taxes |
531 | (35 | ) | 496 | ||||||||
|
|
|
|||||||||||
| Total assets |
$ | 216,587 | $ | 27 | $ | 216,614 | ||||||
|
|
|
|||||||||||
| Liabilities: |
||||||||||||
| Future policyholders’ benefits and other policyholders’ liabilities |
30,346 | (68 | ) | 30,278 | ||||||||
|
|
|
|||||||||||
| Total liabilities |
201,682 | (68 | ) | 201,614 | ||||||||
|
|
|
|||||||||||
| Equity: |
||||||||||||
| Capital in excess of par value(1) |
942 | (11 | ) | 931 | ||||||||
| Retained earnings |
11,356 | 83 | 11,439 | |||||||||
| Accumulated other comprehensive income (loss) |
(943 | ) | 22 | (921 | ) | |||||||
|
|
|
|||||||||||
| Total equity attributable to Holdings |
11,361 | 94 | 11,455 | |||||||||
| Noncontrolling interest |
3,141 | 1 | 3,142 | |||||||||
|
|
|
|||||||||||
| Total equity |
14,502 | 95 | 14,597 | |||||||||
|
|
|
|||||||||||
| Total liabilities, redeemable noncontrolling interest and equity |
$ | 216,587 | $ | 27 | $ | 216,614 | ||||||
|
|
|
|||||||||||
| (1) | Previously reported amounts have been adjusted to give retrospective effect to the 459.4752645-for-1 stock split effected on April 24, 2018. |
F-10
Table of Contents
| As Previously Reported |
Impact of Adjustments |
As Restated |
As Revised |
|||||||||||||||||||||
| Year Ended December 31, |
Year Ended December 31, |
Year Ended December 31, |
||||||||||||||||||||||
| 2016 | 2015 | 2016 | 2015 | 2016 | 2015 | |||||||||||||||||||
| Statements of Income (Loss): |
||||||||||||||||||||||||
| Revenues: |
||||||||||||||||||||||||
| Policy charges and fee income |
$ | 3,759 | $ | 3,648 | $ | 3 | $ | 5 | $ | 3,762 | $ | 3,653 | ||||||||||||
| Premiums |
1,063 | 1,058 | 20 | 12 | 1,083 | 1,070 | ||||||||||||||||||
| Net derivative gains (losses) |
(1,720 | ) | (1,393 | ) | (2 | ) | — | (1,722 | ) | (1,393 | ) | |||||||||||||
|
|
|
|
|
|||||||||||||||||||||
| Total revenues |
11,901 | 10,062 | 21 | 17 | 11,922 | 10,079 | ||||||||||||||||||
|
|
|
|
|
|||||||||||||||||||||
| Benefits and other deductions: |
||||||||||||||||||||||||
| Policyholders’ benefits |
3,317 | 3,489 | 26 | 16 | 3,343 | 3,505 | ||||||||||||||||||
| Interest credited to policyholder’s account balances |
1,102 | 956 | (11 | ) | (10 | ) | 1,091 | 946 | ||||||||||||||||
| Amortization of deferred policy acquisition costs, net |
213 | (302 | ) | (124 | ) | 17 | 89 | (285 | ) | |||||||||||||||
|
|
|
|
|
|||||||||||||||||||||
| Total benefits and other deductions |
9,977 | 9,615 | (109 | ) | 23 | 9,868 | 9,638 | |||||||||||||||||
|
|
|
|
|
|||||||||||||||||||||
| Income (loss) from operations, before income taxes |
1,924 | 447 | 130 | (6 | ) | 2,054 | 441 | |||||||||||||||||
| Income tax (expense) benefit |
(354 | ) | 212 | (33 | ) | 5 | (387 | ) | 217 | |||||||||||||||
|
|
|
|
|
|||||||||||||||||||||
| Net income (loss) |
1,570 | 659 | 97 | (1 | ) | 1,667 | 658 | |||||||||||||||||
| Less: net (income) loss attributable to the noncontrolling interest |
(373 | ) | (329 | ) | (22 | ) | 4 | (395 | ) | (325 | ) | |||||||||||||
|
|
|
|
|
|||||||||||||||||||||
| Net income (loss) attributable to Holdings |
$ | 1,197 | $ | 330 | $ | 75 | $ | 3 | $ | 1,272 | $ | 333 | ||||||||||||
|
|
|
|
|
|||||||||||||||||||||
| Statements of Comprehensive Income (Loss): |
||||||||||||||||||||||||
| Net income (loss) |
$ | 1,570 | $ | 659 | $ | 97 | $ | (1 | ) | $ | 1,667 | $ | 658 | |||||||||||
|
|
|
|
|
|||||||||||||||||||||
| Change in unrealized gains (losses), net of reclassification adjustment |
(297 | ) | (939 | ) | 23 | — | (274 | ) | (939 | ) | ||||||||||||||
|
|
|
|
|
|||||||||||||||||||||
| Total other comprehensive income (loss), net of income taxes |
(281 | ) | (929 | ) | 23 | — | (258 | ) | (929 | ) | ||||||||||||||
|
|
|
|
|
|||||||||||||||||||||
| Comprehensive income (loss) |
1,289 | (270 | ) | 120 | (1 | ) | 1,409 | (271 | ) | |||||||||||||||
| Less: Comprehensive (income) loss attributable to noncontrolling interest |
(359 | ) | (315 | ) | (22 | ) | 4 | (381 | ) | (311 | ) | |||||||||||||
|
|
|
|
|
|||||||||||||||||||||
| Comprehensive income (loss) attributable to AXA Equitable Holdings |
$ | 930 | $ | (585 | ) | $ | 98 | $ | 3 | $ | 1,028 | $ | (582 | ) | ||||||||||
|
|
|
|
|
|||||||||||||||||||||
F-11
Table of Contents
| As Previously Reported |
Impact of Adjustments |
As Restated |
As Revised |
|||||||||||||||||||||
| Year Ended December 31, |
Year Ended December 31, |
Year Ended December 31, |
||||||||||||||||||||||
| 2016 | 2015 | 2016 | 2015 | 2016 | 2015 | |||||||||||||||||||
| Statements of Equity: |
||||||||||||||||||||||||
| Capital in excess of par value, beginning of year(1) |
$ | 952 | $ | 873 | $ | (11 | ) | $ | (11 | ) | $ | 941 | $ | 862 | ||||||||||
|
|
|
|
|
|||||||||||||||||||||
| Capital in excess of par value, end of year(1) |
942 | 952 | (11 | ) | (11 | ) | 931 | 941 | ||||||||||||||||
| Retained earnings, beginning of year |
$ | 10,159 | $ | 9,829 | $ | 8 | $ | 5 | $ | 10,167 | $ | 9,834 | ||||||||||||
| Net income (loss) attributable to Holdings |
1,197 | 330 | 75 | 3 | 1,272 | 333 | ||||||||||||||||||
|
|
|
|
|
|||||||||||||||||||||
| Retained earnings, end of period |
11,356 | 10,159 | 83 | 8 | 11,439 | 10,167 | ||||||||||||||||||
|
|
|
|
|
|||||||||||||||||||||
| Other comprehensive income (loss) |
(266 | ) | (915 | ) | 22 | — | (244 | ) | (915 | ) | ||||||||||||||
|
|
|
|
|
|||||||||||||||||||||
| Accumulated other comprehensive income (loss), end of year |
(943 | ) | (677 | ) | 22 | — | (921 | ) | (677 | ) | ||||||||||||||
|
|
|
|
|
|||||||||||||||||||||
| Total Holding’s equity, end of period |
11,361 | 10,440 | 94 | (3 | ) | 11,455 | 10,437 | |||||||||||||||||
|
|
|
|
|
|||||||||||||||||||||
| Noncontrolling interest, beginning of year |
3,129 | 3,168 | (21 | ) | (17 | ) | 3,108 | 3,151 | ||||||||||||||||
| Net income attributable to non-controlling interest |
369 | 329 | — | (4 | ) | 369 | 325 | |||||||||||||||||
| Other changes in noncontrolling interest |
79 | 101 | 22 | — | 101 | 101 | ||||||||||||||||||
|
|
|
|
|
|||||||||||||||||||||
| Noncontrolling interest, end of year |
3,141 | 3,129 | 1 | (21 | ) | 3,142 | 3,108 | |||||||||||||||||
|
|
|
|
|
|||||||||||||||||||||
| Total Equity, End of Period |
$ | 14,502 | $ | 13,569 | $ | 95 | $ | (24 | ) | $ | 14,597 | $ | 13,545 | |||||||||||
|
|
|
|
|
|||||||||||||||||||||
| Statements of Cash flows: |
||||||||||||||||||||||||
| Cash flow from operating activities: |
||||||||||||||||||||||||
| Net income (loss) |
$ | 1,570 | $ | 659 | $ | 97 | $ | (1 | ) | $ | 1,667 | $ | 658 | |||||||||||
| Policy charges and fee income |
(3,759 | ) | (3,648 | ) | (3 | ) | (5 | ) | (3,762 | ) | (3,653 | ) | ||||||||||||
| Interest credited to policyholders’ account balances |
1,102 | 956 | (11 | ) | (10 | ) | 1,091 | 946 | ||||||||||||||||
| Net derivative (gains) loss |
1,720 | 1,393 | 2 | — | 1,722 | 1,393 | ||||||||||||||||||
| Changes in: |
||||||||||||||||||||||||
| Future policy benefits |
266 | 669 | 7 | 3 | 273 | 672 | ||||||||||||||||||
| Deferred policy acquisition costs |
213 | (302 | ) | (124 | ) | 17 | 89 | (285 | ) | |||||||||||||||
| Current and deferred income taxes |
(240 | ) | (159 | ) | 32 | (4 | ) | (208 | ) | (163 | ) | |||||||||||||
|
|
|
|
|
|||||||||||||||||||||
| Net cash provided by (used in) operating activities |
$ | (236 | ) | $ | (192 | ) | $ | — | $ | — | $ | (236 | ) | $ | (192 | ) | ||||||||
|
|
|
|
|
|||||||||||||||||||||
| (1) | Previously reported amounts have been adjusted to give retrospective effect to the 459.4752645-for-1 stock split effected on April 24, 2018. |
F-12
Table of Contents
| 2) | SIGNIFICANT ACCOUNTING POLICIES |
Basis of Presentation and Principles of Consolidation
The preparation of the accompanying consolidated financial statements in conformity with accounting principles generally accepted in the United States of America (“GAAP”) requires management to make estimates and assumptions (including normal, recurring accruals) that affect the reported amounts of assets and liabilities and the disclosure of contingent assets and liabilities at the date of the consolidated financial statements and the reported amounts of revenues and expenses during the reporting periods. Actual results could differ from these estimates. The accompanying consolidated financial statements reflect all adjustments necessary in the opinion of management for a fair presentation of the consolidated financial position of the Company and its consolidated results of operations and cash flows for the periods presented.
AXA announced on May 10, 2017 that it intended to sell a minority stake in the Company in an initial public offering. These financial statements were prepared in connection with the proposed transaction. The accompanying consolidated financial statements present the consolidated results of operations, financial condition, and cash flows of the Company and its subsidiaries and those investment companies, partnerships and joint ventures in which the Company has control and a majority economic interest as well as those variable interest entities (“VIEs”) that meet the requirements for consolidation. The financial statements were prepared on a consolidated basis as operations have been under the common control of AXA.
Financial results in the historical consolidated financial statements may not be indicative of the results of operations, comprehensive income (loss), financial position, equity or cash flows that would have been achieved had we operated as a separate, standalone entity during the reporting periods presented. We believe that the consolidated financial statements include all adjustments necessary for a fair presentation of the results of operations of the Company.
On April 24, 2018, the Company filed a Certificate of Amendment to amend its Certificate of Incorporation, authorizing the issuance of 2,000,000,000 shares of common stock, par value $0.01 per share, and effecting a 459.4752645-for-1 common stock split, resulting in 561,000,000 shares of common stock issued and outstanding. Prior to the Company’s initial public offering, all 561,000,000 shares of the Company’s common stock are held by AXA S.A. The accompanying Consolidated Financial Statements and Notes to the Consolidated Financial Statements give retroactive effect to the stock split for all periods presented.
All significant intercompany transactions and balances have been eliminated in consolidation. The years “2017,” “2016” and “2015” refer to the years ended December 31, 2017, 2016 and 2015, respectively.
Adoption of New Accounting Pronouncements
In January 2017, the Financial Accounting Standards Board (“FASB”) issued new guidance that amends the definition of a business to provide a more robust framework for determining when a set of assets and activities is a business. The definition primarily adds clarity for evaluating whether certain transactions should be accounted for as acquisitions/dispositions of assets or businesses, the latter subject to guidance on business combinations, but also may interact with other areas of accounting where the defined term is used, such as in the application of guidance on consolidation and goodwill impairment. The new guidance is effective for fiscal years ending December 31, 2018. The Company elected to early adopt the new guidance for the year ending December 31, 2016. Adoption of this guidance did not have a material impact on the Company’s consolidated financial statements.
In January 2017, the FASB issued updated guidance to simplify the accounting for goodwill impairment on a prospective basis in years beginning after December 15, 2019, with early adoption permitted for impairment testing performed after January 1, 2017. The revised guidance removes Step 2 from the goodwill impairment testing model that currently requires a hypothetical purchase price allocation to assess goodwill recoverability when Step 1 testing demonstrates a reporting unit’s carrying value exceeds its fair value. Existing guidance that limits the measure of goodwill impairment to the carrying amount of the
F-13
Table of Contents
reporting unit’s goodwill remains unchanged by elimination of the requirement to perform Step 2 testing. The Company elected to early adopt the guidance effective January 1, 2017 for its first quarter 2017 interim goodwill recoverability assessments. As a result, the Company reduced the carrying value of its goodwill and increased other operating costs and expenses by $369 million as reflected in the December 31, 2017 consolidated financial statements.
In October 2016, the FASB issued updated guidance on consolidation of interests held through related parties that are under common control, which alters how a decision maker needs to consider indirect interests in a VIE held through an entity under common control. The guidance amends the recently adopted consolidation guidance analysis. Under the new guidance, if a decision maker is required to evaluate whether it is the primary beneficiary of a VIE, it will need to consider only its proportionate indirect interest in the VIE held through a common control party. The Company adopted the revised guidance effective January 1, 2017. Adoption of this guidance did not have a material impact on the Company’s consolidated financial statements.
In March 2016, the FASB issued new guidance simplifying the transition to the equity method of accounting. The amendment eliminates the requirement for an investor to retroactively adjust the basis of a previously held interest in an investment that subsequently qualifies for use of the equity method. Additionally, the amendment requires any unrealized holding gain or loss recognized in AOCI to be realized in earnings at the date an AFS security qualifies for use of the equity method. The Company adopted the revised guidance effective January 1, 2017. Adoption of this guidance did not have a material impact on the Company’s consolidated financial statements.
In March 2016, the FASB issued new guidance on improvements to employee share-based payment accounting. The amendment includes provisions intended to simplify various aspects related to how share-based payments are accounted for and presented in the financial statements, including income tax effects of share-based payments, minimum statutory tax withholding requirements and forfeitures. The Company adopted the revised guidance effective January 1, 2017. Adoption of this guidance did not have a material impact on the Company’s consolidated financial statements.
In February 2015, the FASB issued a new consolidation standard that makes targeted amendments to the VIE assessment, including guidance specific to the analysis of fee arrangements and related party relationships, modifies the guidance for the evaluation of limited partnerships and similar entities for consolidation to eliminate the presumption of general partner control, and ends the deferral that had been granted to certain investment companies for applying previous VIE guidance. The Company adopted this guidance beginning January 1, 2016 using a modified retrospective approach, thereby not requiring a restatement of prior year periods. At initial adoption, the Company’s reevaluation of all legal entities under the new standard resulted in identification of additional VIEs and consolidation of certain investment products of the Investment Management and Research segment that were not consolidated in accordance with previous guidance. The analysis performed under this guidance requires the exercise of judgment and is updated continuously as circumstances change or new entities are formed.
In August 2014, the FASB issued new guidance which requires management to evaluate whether there is “substantial doubt” about the reporting entity’s ability to continue as a going concern and provide related footnote disclosures about those uncertainties, if they exist. The new guidance is effective for annual periods, ending after December 15, 2016 and interim periods thereafter. The Company implemented this guidance beginning with the year ended December 31, 2016. The effect of implementing this guidance was not material to the Company’s consolidated financial statements.
Future Adoption of New Accounting Pronouncements
In February 2018, the FASB issued new guidance that will permit, but not require, entities to reclassify to retained earnings tax effects “stranded” in AOCI resulting from the change in federal tax rate enacted by the Tax Cuts and Jobs Act (the “Act”) on December 22, 2017. An entity that elects this option must reclassify these stranded tax effects for all items in AOCI, including, but not limited to, AFS securities and employee
F-14
Table of Contents
benefits. Tax effects stranded in AOCI for other reasons, such as prior changes in tax law, may not be reclassified. While the new guidance provides entities the option to reclassify these amounts, new disclosures are required regardless of whether entities elect to do so. The new guidance is effective for fiscal years beginning after December 15, 2018, and interim periods within those fiscal years. Early adoption is permitted for periods for which financial statements have not yet been issued or made available for issuance, including in the period the Act was signed into law (i.e., the reporting period including December 22, 2017). Election can be made either to apply the new guidance retrospectively to each period in which the effect of the Act is recognized or in the period of adoption. Management currently is evaluating the options provided for adopting this guidance and the potential impacts on the Company’s consolidated financial statements.
In August 2017, the FASB issued new guidance on accounting for hedging activities, intended to more closely align the financial statement reporting of hedging relationships to the economic results of an entity’s risk management activities. In addition, the new guidance makes certain targeted modifications to simplify the application of current hedge accounting guidance. The new guidance is effective for fiscal years beginning after December 15, 2018 and interim periods within those fiscal years, with early application permitted. The effect of adoption should be reflected as of the beginning of the fiscal year of adoption (that is, the initial application date). All transition requirements and elections should be applied to derivatives positions and hedging relationships existing on the date of adoption. Management currently is evaluating the impact that adoption of this guidance will have on the Company’s consolidated financial statements.
In May 2017, the FASB issued guidance on share-based payments. The amendment provides clarity intended to reduce diversity in practice and the cost and complexity of accounting for changes to the terms or conditions of share-based payment awards. The new guidance is effective for interim and annual periods beginning after December 15, 2017, requires prospective application to awards modified on or after the date of adoption, and permits early adoption. This amendment is not expected to have a material impact on the Company’s consolidated financial statements.
In March 2017, the FASB issued guidance that requires certain premiums on callable debt securities to be amortized to the earliest call date and is intended to better align interest income recognition with the manner in which market participants price these instruments. The new guidance is effective for interim and annual periods beginning after December 15, 2018 with early adoption permitted and is to be applied on a modified retrospective basis. Management currently is evaluating the impact that adoption of this guidance will have on the Company’s consolidated financial statements.
In March 2017, the FASB issued new guidance on the presentation of net periodic pension and post-retirement benefit costs that requires disaggregation of the service cost component from the other components of net benefit costs on the income statement. The service cost component will be presented with other employee compensation costs in “income from operations,” and the remaining components will be reported separately outside of income from operations. While this standard does not change the rules for how benefits costs are measured, it limits the amount eligible for capitalization to the service cost component and, therefore, may require insurers and other entities that establish deferred assets related to the acquisition of new contracts to align its capitalization policies/practices with that limitation. The new guidance is effective for interim and annual periods beginning after December 15, 2017 with early adoption permitted and is to be applied retrospectively for changes in the income statement presentation of net benefit cost and prospectively for changes in capitalization eligibility. The guidance permits the use of amounts previously disclosed for the various components of net benefits cost as the basis for the retrospective change in the income statement presentation, and use of that approach must be disclosed as a “practical expedient” to determining how much of the various components of net benefits costs actually was reflected in historical income statements a result of capitalization and subsequent amortization. For purpose of segment reporting, net periodic benefits costs should continue to be presented based on how management reports those costs internally for evaluation, regardless of these new requirements. The Company expects to utilize the practical expedient for adopting the retrospective change in its income statement presentation of net benefits costs. Based on the assessments performed to-date, adoption of this new guidance in first quarter 2018 is not expected to have a material impact on the Company’s consolidated financial statements.
F-15
Table of Contents
In August 2016, the FASB issued new guidance to simplify elements of cash flow classification. The new guidance is intended to reduce diversity in practice in how certain transactions are classified in the statement of cash flows. The new guidance is effective for interim and annual periods beginning after December 15, 2017 and should be applied using a retrospective transition method. Adoption of this new guidance in first quarter 2018 is not expected to have a material impact on the Company’s financial condition or results of operations.
In June 2016, the FASB issued new guidance related to the accounting for credit losses on financial instruments. The new guidance introduces an approach based on expected losses to estimate credit losses on certain types of financial instruments. It also modifies the impairment model for available-for-sale debt securities and provides for a simplified accounting model for purchased financial assets with credit deterioration since their origination. The new guidance is effective for interim and annual periods beginning after December 15, 2019 with early adoption permitted for annual periods beginning after December 15, 2018. Management currently is evaluating the impact that adoption of this guidance will have on the Company’s consolidated financial statements.
In February 2016, the FASB issued revised guidance to lease accounting that will require lessees to recognize on the balance sheet a “right-of-use” asset and a lease liability for virtually all lease arrangements, including those embedded in other contracts. The new lease accounting model will continue to distinguish between capital and operating leases. The current straight-line pattern for the recognition of rent expense on an operating lease is expected to remain substantially unchanged by the new guidance but instead will be comprised of amortization of the right-of-use asset and interest cost on the related lease obligation, thereby resulting in an income statement presentation similar to a financing arrangement or capital lease. Lessor accounting will remain substantially unchanged from the current model but has been updated to align with certain changes made to the lessee model. The new guidance is effective for fiscal years, and interim periods within those fiscal years, beginning after December 15, 2018, with early adoption permitted. The transition provisions require application on a modified retrospective approach at the beginning of the earliest comparative period presented in the financial statements (that is, January 1, 2017). Extensive quantitative and qualitative disclosures, including significant judgments made by management, will be required to provide greater insight into the extent of revenue and expense recognized and expected to be recognized from existing lease contracts and arrangements. Management currently is evaluating the impact that adoption of this guidance will have on the Company’s consolidated financial statements.
In January 2016, the FASB issued new guidance related to the recognition and measurement of financial assets and financial liabilities. The new guidance primarily affects the accounting for equity investments, financial liabilities under the fair value option, and presentation and disclosure requirements for financial instruments. In addition, the FASB clarified guidance related to the valuation allowance assessment when recognizing deferred tax assets resulting from unrealized losses on available-for-sale (“AFS”) debt securities. The new guidance will require equity investments in unconsolidated entities, except those accounted for under the equity method, to be measured at fair value through earnings, thereby eliminating the AFS classification for equity securities with readily determinable fair values for which changes in fair value currently are reported in AOCI. Adoption of this new guidance is required in interim and annual periods beginning after December 15, 2017 and is to be applied on a modified retrospective basis. At December 31, 2017, the Company’s equity investments include approximately $190 million common stock securities designated as AFS for which a cumulative effect adjustment to opening retained earnings will be made at January 1, 2018 to reclassify from AOCI the related net unrealized investment gains/(losses), net of income tax. The Company’s investment assets held in the form of equity interests in unconsolidated entities, such as limited partnerships and limited liability companies, including hedge funds, private equity funds, and real estate-related funds, generally are accounted for under the equity method and will not be impacted by this new guidance. The Company does not currently report any of its financial liabilities under the fair value option. Adoption of this new guidance in first quarter 2018 is not expected to have a material impact on the Company’s financial condition or results of operations.
F-16
Table of Contents
In May 2014, the FASB issued new guidance that revises the recognition criteria for revenue arising from contracts with customers to provide goods or services, except when those revenue streams are from insurance contracts, leases, rights and obligations that are in the scope of certain financial instruments (i.e., derivative contracts) and guarantees other than product or service warranties. The new standard’s core principle is that revenue should be recognized when “control” of promised goods or services is transferred to customers and in an amount that reflects the consideration to which it expects to be entitled in exchange. Applying the new revenue recognition criteria generally will require more judgments and estimates than under current guidance in order to identify contractual performance obligations to customers, assess the roles of intermediaries in fulfilling those obligations, determine the amount of variable consideration to include in the transaction price, and allocate the transaction price to distinct performance obligations in bundled contracts. The new guidance is effective for interim and annual periods, beginning after December 15, 2017, with early adoption permitted. Transition to the new standard requires a retrospective approach but application is permitted either on a full or modified basis, the latter by recognition of a cumulative-effect adjustment to opening equity in the period of initial adoption. On January 1, 2018, the Company will adopt the new revenue recognition guidance on a modified retrospective basis and provide in its first quarter 2018 reporting the additional disclosures required by the new standard. Revenues within the scope of this standard and subject to the Company’s analysis largely emerge from its investment in AllianceBernstein, as reported in the Company’s Investment Management and Research segment, but also result from the Company’s indirect wholly-owned subsidiaries, namely FMG as well as retail and wholesale broker-dealer operations. Based on the assessments performed to-date, the Company does not expect any changes in the amounts or timing of revenue recognition, including base investment management and advisory fees, distribution revenues, shareholder servicing revenues, and broker-dealer revenues. However, performance-based fees, that currently are recognized at the end of the applicable measurement period when no risk of reversal remains, and carried-interest distributions received (considered performance-based fees), that currently are recorded as deferred revenues until no risk of reversal remains, in certain instances may be recognized earlier under the new standard if it is probable that significant reversal will not occur. As a result, the Company currently expects its initial adoption of the new revenue recognition standard at January 1, 2018 will result in a pre-tax cumulative effect adjustment to increase opening equity by approximately $35 million, representing carried-interest distributions previously received, net of revenue sharing payments to investment team members, with respect to which it is probable that significant reversal will not occur. The Company’s future financial statements will include additional disclosures as required by the new revenue recognition guidance.
Closed Block
As a result of demutualization, the Company’s Closed Block was established in 1992 for the benefit of certain individual participating policies that were in force on that date. Assets, liabilities and earnings of the Closed Block are specifically identified to support its participating policyholders.
Assets allocated to the Closed Block inure solely to the benefit of the Closed Block policyholders and will not revert to the benefit of the Company. No reallocation, transfer, borrowing or lending of assets can be made between the Closed Block and other portions of the Company’s general account (the “General Account”), any of its separate accounts (the “Separate Accounts”) or any affiliate of the Company without the approval of the New York State Department of Financial Services (the “NYDFS”). Closed Block assets and liabilities are carried on the same basis as similar assets and liabilities held in the General Account.
The excess of Closed Block liabilities over Closed Block assets (adjusted to exclude the impact of related amounts in AOCI) represents the expected maximum future post-tax earnings from the Closed Block that would be recognized in income from continuing operations over the period the policies and contracts in the Closed Block remain in force. As of January 1, 2001, the Company has developed an actuarial calculation of the expected timing of the Closed Block’s earnings.
If the actual cumulative earnings from the Closed Block are greater than the expected cumulative earnings, only the expected earnings will be recognized in net income. Actual cumulative earnings in excess of
F-17
Table of Contents
expected cumulative earnings at any point in time are recorded as a policyholder dividend obligation because they will ultimately be paid to Closed Block policyholders as an additional policyholder dividend unless offset by future performance that is less favorable than originally expected. If a policyholder dividend obligation has been previously established and the actual Closed Block earnings in a subsequent period are less than the expected earnings for that period, the policyholder dividend obligation would be reduced (but not below zero). If, over the period the policies and contracts in the Closed Block remain in force, the actual cumulative earnings of the Closed Block are less than the expected cumulative earnings, only actual earnings would be recognized in income from continuing operations. If the Closed Block has insufficient funds to make guaranteed policy benefit payments, such payments will be made from assets outside the Closed Block.
Many expenses related to Closed Block operations, including amortization of deferred policy acquisition costs (“DAC”), are charged to operations outside of the Closed Block; accordingly, net revenues of the Closed Block do not represent the actual profitability of the Closed Block operations. Operating costs and expenses outside of the Closed Block are, therefore, disproportionate to the business outside of the Closed Block.
Investments
The carrying values of fixed maturities classified as available-for-sale (“AFS”) are reported at fair value. Changes in fair value are reported in other comprehensive income (“OCI”). The amortized cost of fixed maturities is adjusted for impairments in value deemed to be other than temporary which are recognized in Investment gains (losses), net. The redeemable preferred stock investments that are reported in fixed maturities include real estate investment trusts (“REIT”), perpetual preferred stock, and redeemable preferred stock. These securities may not have a stated maturity, may not be cumulative and do not provide for mandatory redemption by the issuer.
The Company determines the fair values of fixed maturities and equity securities based upon quoted prices in active markets, when available, or through the use of alternative approaches when market quotes are not readily accessible or available. These alternative approaches include matrix or model pricing and use of independent pricing services, each supported by reference to principal market trades or other observable market assumptions for similar securities. More specifically, the matrix pricing approach to fair value is a discounted cash flow methodology that incorporates market interest rates commensurate with the credit quality and duration of the investment.
The Company’s management, with the assistance of its investment advisors, monitors the investment performance of its portfolio and reviews AFS securities with unrealized losses for other-than-temporary impairments (“OTTI”). Integral to this review is an assessment made each quarter, on a security-by-security basis, by the Company’s Investments Under Surveillance (“IUS”) Committee, of various indicators of credit deterioration to determine whether the investment security is expected to recover. This assessment includes, but is not limited to, consideration of the duration and severity of the unrealized loss, failure, if any, of the issuer of the security to make scheduled payments, actions taken by rating agencies, adverse conditions specifically related to the security or sector, the financial strength, liquidity, and continued viability of the issuer and, for equity securities only, the intent and ability to hold the investment until recovery, and results in identification of specific securities for which OTTI is recognized.
If there is no intent to sell or likely requirement to dispose of the fixed maturity security before its recovery, only the credit loss component of any resulting OTTI is recognized in income (loss) and the remainder of the fair value loss is recognized in OCI. The amount of credit loss is the shortfall of the present value of the cash flows expected to be collected as compared to the amortized cost basis of the security. The present value is calculated by discounting management’s best estimate of projected future cash flows at the effective interest rate implicit in the debt security at the date of acquisition. Projections of future cash flows are based on assumptions regarding probability of default and estimates regarding the amount and timing of recoveries. These assumptions and estimates require use of management judgment and consider internal credit analyses as well as market observable
F-18
Table of Contents
data relevant to the collectability of the security. For mortgage- and asset-backed securities, projected future cash flows also include assumptions regarding prepayments and underlying collateral value.
Real estate held for the production of income is stated at depreciated cost less valuation allowances.
Depreciation of real estate held for production of income is computed using the straight-line method over the estimated useful lives of the properties, which generally range from 40 to 50 years.
Policy loans represent funds loaned to policyholders up to the cash surrender value of the associated insurance policies and are carried at the unpaid principal balances due to the Company from the policyholders. Interest income on policy loans is recognized in net investment income at the contract interest rate when earned. Policy loans are fully collateralized by the cash surrender value of the associated insurance policies.
Partnerships, investment companies and joint venture interests that the Company has control of and has an economic interest in or those that meet the requirements for consolidation under accounting guidance for consolidation of VIEs are consolidated. Those that the Company does not have control of and does not have a majority economic interest in and those that do not meet the VIE requirements for consolidation are reported on the equity method of accounting and are reported in other equity investments. The Company records its interests in certain of these partnerships on a month or one quarter lag.
Equity securities, which include common stock, and non-redeemable preferred stock classified as AFS securities, are carried at fair value and are included in other equity investments with changes in fair value reported in OCI.
Trading securities, which include equity securities and fixed maturities, are carried at fair value based on quoted market prices, with realized and unrealized gains (losses) reported in net investment income (loss) in the statements of Net income (loss).
Corporate owned life insurance (“COLI”) has been purchased by the Company and certain subsidiaries on the lives of certain key employees and the Company and these subsidiaries are named as beneficiaries under these policies. COLI is carried at the cash surrender value of the policies. At December 31, 2017, 2016, and 2015, the carrying value of COLI was $918 million, $889 million and $891 million, respectively, and is reported in Other invested assets in the consolidated balance sheets.
Short-term investments are reported at amortized cost that approximates fair value and are included in Other invested assets. The Company classifies as short-term securities purchased with a maturity of twelve months or less.
Cash and cash equivalents includes cash on hand, demand deposits, money market accounts, overnight commercial paper and highly liquid debt instruments purchased with an original maturity of three months or less. Due to the short-term nature of these investments, the recorded value is deemed to approximate fair value.
Cash and securities segregated primarily includes U.S. Treasury Bills segregated by AB in a special reserve bank custody account for the exclusive benefit of its brokerage customers under Rule 15c3-3 of the Exchange Act.
All securities owned, including U.S. government and agency securities, mortgage-backed securities, futures and forwards transactions, are reported in the consolidated financial statements on a trade date basis.
Derivatives
Derivatives are financial instruments whose values are derived from interest rates, foreign exchange rates, financial indices, values of securities or commodities, credit spreads, market volatility, expected returns, and liquidity. Values can also be affected by changes in estimates and assumptions, including those related to counterparty behavior and non-performance risk used in valuation models. Derivative financial instruments generally used by the Company include equity, currency, and interest rate futures, total return and/or other equity swaps, interest rate swaps and floors, swaptions, variance swaps, and equity options, all of which
F-19
Table of Contents
may be exchange-traded or contracted in the over-the-counter market. All derivative positions are carried in the consolidated balance sheets at fair value, generally by obtaining quoted market prices or through the use of valuation models.
Freestanding derivative contracts are reported in the consolidated balance sheets either as assets within “Other invested assets” or as liabilities within “Other liabilities.” The Company nets the fair value of all derivative financial instruments with counterparties for which an ISDA Master Agreement and related Credit Support Annex (“CSA”) have been executed. The Company uses derivatives to manage asset/liability risk and has designated some of those economic relationships under the criteria to qualify for hedge accounting treatment. All changes in the fair value of the Company’s freestanding derivative positions not designated to hedge accounting relationships, including net receipts and payments, are included in “Net derivative gains (losses)” without considering changes in the fair value of the economically associated assets or liabilities.
The Company is a party to financial instruments and other contracts that contain “embedded” derivative instruments. At inception, the Company assesses whether the economic characteristics of the embedded instrument are “clearly and closely related” to the economic characteristics of the remaining component of the “host contract” and whether a separate instrument with the same terms as the embedded instrument would meet the definition of a derivative instrument. When those criteria are satisfied, the resulting embedded derivative is bifurcated from the host contract, carried in the consolidated balance sheets at fair value, and changes in its fair value are recognized immediately and captioned in the consolidated statements of income (loss) according to the nature of the related host contract. For certain financial instruments that contain an embedded derivative that otherwise would need to be bifurcated and reported at fair value, the Company instead may elect to carry the entire instrument at fair value.
Securities Repurchase and Reverse Repurchase Agreements
Securities repurchase and reverse repurchase transactions involve the temporary exchange of securities for cash or other collateral of equivalent value, with agreement to redeliver a like quantity of the same or similar securities at a future date prior to maturity at a fixed and determinable price. Transfers of securities under these agreements to repurchase or resell are evaluated by the Company to determine whether they satisfy the criteria for accounting treatment as secured borrowing or lending arrangements. Agreements not meeting the criteria would require recognition of the transferred securities as sales or purchases with related forward repurchase or resale commitments. All of the Company’s securities repurchase transactions are accounted for as collateralized borrowings with the related obligations distinctly captioned in the consolidated balance sheets. Earnings from investing activities related to the cash received under the Company’s securities repurchase arrangements are reported in the consolidated statements of income (loss) as “Net investment income” and the associated borrowing cost is reported as “Interest expense.” The Company has not actively engaged in securities reverse repurchase transactions.
Commercial and Agricultural Mortgage Loans on Real Estate
Mortgage loans are stated at unpaid principal balances, net of unamortized discounts and valuation allowances. Valuation allowances are based on the present value of expected future cash flows discounted at the loan’s original effective interest rate or on its collateral value if the loan is collateral dependent. However, if foreclosure is or becomes probable, the collateral value measurement method is used.
For commercial and agricultural mortgage loans, an allowance for credit loss is typically recommended when management believes it is probable that principal and interest will not be collected according to the contractual terms. Factors that influence management’s judgment in determining allowance for credit losses include the following:
| • | Loan-to-value ratio–Derived from current loan balance divided by the fair market value of the property. An allowance for credit loss is typically recommended when the loan-to-value ratio is in |
F-20
Table of Contents
| excess of 100%. In the case where the loan-to-value is in excess of 100%, the allowance for credit loss is derived by taking the difference between the fair market value (less cost of sale) and the current loan balance. |
| • | Debt service coverage ratio – Derived from actual operating earnings divided by annual debt service. If the ratio is below 1.0x, then the income from the property does not support the debt. |
| • | Occupancy – Criteria varies by property type but low or below market occupancy is an indicator of sub-par property performance. |
| • | Lease expirations – The percentage of leases expiring in the upcoming 12 to 36 months are monitored as a decline in rent and/or occupancy may negatively impact the debt service coverage ratio. In the case of single-tenant properties or properties with large tenant exposure, the lease expiration is a material risk factor. |
| • | Maturity – Mortgage loans that are not fully amortizing and have upcoming maturities within the next 12 to 24 months are monitored in conjunction with the capital markets to determine the borrower’s ability to refinance the debt and/or pay off the balloon balance. |
| • | Borrower/tenant related issues – Financial concerns, potential bankruptcy, or words or actions that indicate imminent default or abandonment of property. |
| • | Payment status (current vs. delinquent) – A history of delinquent payments may be a cause for concern. |
| • | Property condition – Significant deferred maintenance observed during the lenders annual site inspections. |
| • | Other – Any other factors such as current economic conditions may call into question the performance of the loan. |
Mortgage loans also are individually evaluated quarterly by the Company’s IUS Committee for impairment, including an assessment of related collateral value. Commercial mortgages 60 days or more past due and agricultural mortgages 90 days or more past due, as well as all mortgages in the process of foreclosure, are identified as problem mortgages. Based on its monthly monitoring of mortgages, a class of potential problem mortgages are also identified, consisting of mortgage loans not currently classified as problem mortgages but for which management has doubts as to the ability of the borrower to comply with the present loan payment terms and which may result in the loan becoming a problem or being restructured. The decision whether to classify a performing mortgage loan as a potential problem involves significant subjective judgments by management as to likely future industry conditions and developments with respect to the borrower or the individual mortgaged property.
For problem mortgage loans, a valuation allowance is established to provide for the risk of credit losses inherent in the lending process. The allowance includes loan specific reserves for mortgage loans determined to be non-performing as a result of the loan review process. A non-performing loan is defined as a loan for which it is probable that amounts due according to the contractual terms of the loan agreement will not be collected. The loan-specific portion of the loss allowance is based on the Company’s assessment as to ultimate collectability of loan principal and interest. Valuation allowances for a non-performing loan are recorded based on the present value of expected future cash flows discounted at the loan’s effective interest rate or based on the fair value of the collateral if the loan is collateral dependent. The valuation allowance for mortgage loans can increase or decrease from period to period based on such factors.
Impaired mortgage loans without provision for losses are mortgage loans where the fair value of the collateral or the net present value of the expected future cash flows related to the loan equals or exceeds the recorded investment. Interest income earned on mortgage loans where the collateral value is used to measure impairment is recorded on a cash basis. Interest income on mortgage loans where the present value method is used to measure impairment is accrued on the net carrying value amount of the loan at the interest rate used to discount the cash flows. Changes in the present value attributable to changes in the amount or timing of expected cash flows are reported as investment gains or losses.
F-21
Table of Contents
Mortgage loans are placed on nonaccrual status once management believes the collection of accrued interest is doubtful. Once mortgage loans are classified as nonaccrual mortgage loans, interest income is recognized under the cash basis of accounting and the resumption of the interest accrual would commence only after all past due interest has been collected or the mortgage loan has been restructured to where the collection of interest is considered likely. At December 31, 2017, 2016 and 2015, the carrying values of commercial mortgage loans that had been classified as nonaccrual mortgage loans were $19 million, $34 million and $72 million, respectively.
Troubled Debt Restructuring
When a loan modification is determined to be a troubled debt restructuring (“TDR”), the impairment of the loan is re-measured by discounting the expected cash flows to be received based on the modified terms using the loan’s original effective yield, and the allowance for loss is adjusted accordingly. Subsequent to the modification, income is recognized prospectively based on the modified terms of the mortgage loans. Additionally, the loan continues to be subject to the credit review process noted above.
Net Investment Income (Loss), Investment Gains (Losses), Net and Unrealized Investment Gains (Losses)
Realized investment gains (losses) are determined by identification with the specific asset and are presented as a component of revenue. Changes in the valuation allowances are included in Investment gains (losses), net.
Realized and unrealized holding gains (losses) on trading securities are reflected in Net investment income (loss).
Unrealized investment gains (losses) on fixed maturities and equity securities designated as AFS held by the Company are accounted for as a separate component of AOCI, net of related deferred income taxes, as are amounts attributable to certain pension operations, Closed Block’s policyholders dividend obligation, insurance liability loss recognition, DAC related to UL policies, investment-type products and participating traditional life policies.
Changes in unrealized gains (losses) reflect changes in fair value of only those fixed maturities and equity securities classified as AFS and do not reflect any change in fair value of policyholders’ account balances and future policy benefits.
Fair Value of Financial Instruments
Fair value is defined as the exchange price that would be received for an asset or paid to transfer a liability (an exit price) in the principal or most advantageous market for the asset or liability in an orderly transaction between market participants on the measurement date. The accounting guidance establishes a fair value hierarchy that requires an entity to maximize the use of observable inputs and minimize the use of unobservable inputs when measuring fair value, and identifies three levels of inputs that may be used to measure fair value:
| Level 1 | Unadjusted quoted prices for identical instruments in active markets. Level 1 fair values generally are supported by market transactions that occur with sufficient frequency and volume to provide pricing information on an ongoing basis. | |
| Level 2 | Observable inputs other than Level 1 prices, such as quoted prices for similar instruments, quoted prices in markets that are not active, and inputs to model-derived valuations that are directly observable or can be corroborated by observable market data. | |
| Level 3 | Unobservable inputs supported by little or no market activity and often requiring significant management judgment or estimation, such as an entity’s own assumptions about the cash flows or other significant components of value that market participants would use in pricing the asset or liability. | |
The Company uses unadjusted quoted market prices to measure fair value for those instruments that are actively traded in financial markets. In cases where quoted market prices are not available, fair values are
F-22
Table of Contents
measured using present value or other valuation techniques. The fair value determinations are made at a specific point in time, based on available market information and judgments about the financial instrument, including estimates of the timing and amount of expected future cash flows and the credit standing of counterparties. Such adjustments do not reflect any premium or discount that could result from offering for sale at one time the Company’s entire holdings of a particular financial instrument, nor do they consider the tax impact of the realization of unrealized gains or losses. In many cases, the fair value cannot be substantiated by direct comparison to independent markets, nor can the disclosed value be realized in immediate settlement of the instrument.
Management is responsible for the determination of the value of investments carried at fair value and the supporting methodologies and assumptions. Under the terms of various service agreements, the Company often utilizes independent valuation service providers to gather, analyze, and interpret market information and derive fair values based upon relevant methodologies and assumptions for individual securities. These independent valuation service providers typically obtain data about market transactions and other key valuation model inputs from multiple sources and, through the use of widely accepted valuation models, provide a single fair value measurement for individual securities for which a fair value has been requested. As further described below with respect to specific asset classes, these inputs include, but are not limited to, market prices for recent trades and transactions in comparable securities, benchmark yields, interest rate yield curves, credit spreads, quoted prices for similar securities, and other market-observable information, as applicable. Specific attributes of the security being valued also are considered, including its term, interest rate, credit rating, industry sector, and when applicable, collateral quality and other security- or issuer-specific information. When insufficient market observable information is available upon which to measure fair value, the Company either will request brokers knowledgeable about these securities to provide a non-binding quote or will employ internal valuation models. Fair values received from independent valuation service providers and brokers and those internally modeled or otherwise estimated are assessed for reasonableness. To validate reasonableness, prices also are internally reviewed by those with relevant expertise through comparison with directly observed recent market trades.
Recognition of Insurance Income and Related Expenses
Deposits related to universal life (“UL”) and investment-type contracts are reported as deposits to policyholders’ account balances. Revenues from these contracts consist of fees assessed during the period against policyholders’ account balances for mortality charges, policy administration charges and surrender charges. Policy benefits and claims that are charged to expense include benefit claims incurred in the period in excess of related policyholders’ account balances.
Premiums from participating and non-participating traditional life and annuity policies with life contingencies generally are recognized in income when due. Benefits and expenses are matched with such income so as to result in the recognition of profits over the life of the contracts. This match is accomplished by means of the provision for liabilities for future policy benefits and the deferral and subsequent amortization of DAC.
For contracts with a single premium or a limited number of premium payments due over a significantly shorter period than the total period over which benefits are provided, premiums are recorded as revenue when due with any excess profit deferred and recognized in income in a constant relationship to insurance in-force or, for annuities, the amount of expected future benefit payments.
Premiums from individual health contracts are recognized as income over the period to which the premiums relate in proportion to the amount of insurance protection provided.
DAC
Acquisition costs that vary with and are primarily related to the acquisition of new and renewal insurance business, reflecting incremental direct costs of contract acquisition with independent third parties or
F-23
Table of Contents
employees that are essential to the contract transaction, as well as the portion of employee compensation, including payroll fringe benefits and other costs directly related to underwriting, policy issuance and processing, medical inspection, and contract selling for successfully negotiated contracts including commissions, underwriting, agency and policy issue expenses, are deferred. DAC is subject to recoverability testing at the time of policy issue and loss recognition testing at the end of each accounting period.
After the initial establishment of reserves, premium deficiency and loss recognition tests are performed each period end using best estimate assumptions as of the testing date without provisions for adverse deviation. When the liabilities for future policy benefits plus the present value of expected future gross premiums for the aggregate product group are insufficient to provide for expected future policy benefits and expenses for that line of business (i.e., reserves net of any DAC asset), DAC would first be written off and thereafter, if required, a premium deficiency reserve would be established by a charge to earnings.
Amortization Policy. In accordance with the guidance for the accounting and reporting by insurance enterprises for certain long-duration contracts and participating contracts and for realized gains and losses from the sale of investments, current and expected future profit margins for products covered by this guidance are examined regularly in determining the amortization of DAC.
DAC associated with certain variable annuity products is amortized based on estimated assessments, with DAC on the remainder of variable annuities, UL and investment-type products amortized over the expected total life of the contract group as a constant percentage of estimated gross profits arising principally from investment results, separate account fees, mortality and expense margins and surrender charges based on historical and anticipated future experience, embedded derivatives and changes in the reserve of products that have indexed features such as SCS IUL and MSO, updated at the end of each accounting period. When estimated gross profits are expected to be negative for multiple years of a contract life, DAC are amortized using the present value of estimated assessments. The effect on the amortization of DAC of revisions to estimated gross profits or assessments is reflected in earnings (loss) in the period such estimated gross profits or assessments are revised. A decrease in expected gross profits or assessments would accelerate DAC amortization. Conversely, an increase in expected gross profits or assessments would slow DAC amortization. The effect on the DAC assets that would result from realization of unrealized gains (losses) is recognized with an offset to AOCI in consolidated equity as of the balance sheet date.
A significant assumption in the amortization of DAC on variable annuities and, to a lesser extent, on variable and interest-sensitive life insurance relates to projected future separate account performance. Management sets estimated future gross profit or assessment assumptions related to separate account performance using a long-term view of expected average market returns by applying a reversion to the mean (“RTM”) approach, a commonly used industry practice. This future return approach influences the projection of fees earned, as well as other sources of estimated gross profits. Returns that are higher than expectations for a given period produce higher than expected account balances, increase the fees earned resulting in higher expected future gross profits and lower DAC amortization for the period. The opposite occurs when returns are lower than expected.
In applying this approach to develop estimates of future returns, it is assumed that the market will return to an average gross long-term return estimate, developed with reference to historical long-term equity market performance. Based upon management’s current expectations of interest rates and future fund growth, the Company updated its RTM assumption from 9.0% to 7.0%. The average gross long-term return measurement start date was also updated to December 31, 2014. Management has set limitations as to maximum and minimum future rate of return assumptions, as well as a limitation on the duration of use of these maximum or minimum rates of return. At December 31, 2017, the average gross short-term and long-term annual return estimate on variable and interest-sensitive life insurance and variable annuities was 7.0% (4.7% net of product weighted average separate account fees), and the gross maximum and minimum short-term annual rate of return limitations were 15.0% (12.7% net of product weighted average separate account fees) and 0.0% ((2.3)% net of product weighted average separate account fees), respectively. The maximum duration over which these rate limitations may be applied is five years. This approach will continue to be
F-24
Table of Contents
applied in future periods. These assumptions of long-term growth are subject to assessment of the reasonableness of resulting estimates of future return assumptions.
If actual market returns continue at levels that would result in assuming future market returns of 15.0% for more than five years in order to reach the average gross long-term return estimate, the application of the five year maximum duration limitation would result in an acceleration of DAC amortization. Conversely, actual market returns resulting in assumed future market returns of 0.0% for more than five years would result in a required deceleration of DAC amortization.
In addition, projections of future mortality assumptions related to variable and interest-sensitive life products are based on a long-term average of actual experience. This assumption is updated periodically to reflect recent experience as it emerges. Improvement of life mortality in future periods from that currently projected would result in future deceleration of DAC amortization. Conversely, deterioration of life mortality in future periods from that currently projected would result in future acceleration of DAC amortization.
Other significant assumptions underlying gross profit estimates for UL and investment type products relate to contract persistency and General Account investment spread.
For participating traditional life policies (substantially all of which are in the Closed Block), DAC is amortized over the expected total life of the contract group as a constant percentage based on the present value of the estimated gross margin amounts expected to be realized over the life of the contracts using the expected investment yield. At December 31, 2017, the average rate of assumed investment yields, excluding policy loans, for the Company was 4.7% grading to 4.3% over seven years. Estimated gross margins include anticipated premiums and investment results less claims and administrative expenses, changes in the net level premium reserve and expected annual policyholder dividends. The effect on the accumulated amortization of DAC of revisions to estimated gross margins is reflected in earnings in the period such estimated gross margins are revised. The effect on the DAC assets that would result from realization of unrealized gains (losses) is recognized with an offset to AOCI in consolidated equity as of the balance sheet date. Many of the factors that affect gross margins are included in the determination of the Company’s dividends to these policyholders. DAC adjustments related to participating traditional life policies do not create significant volatility in results of operations as the Closed Block recognizes a cumulative policyholder dividend obligation expense in “Policyholders’ dividends,” for the excess of actual cumulative earnings over expected cumulative earnings as determined at the time of demutualization.
DAC associated with non-participating traditional life policies are amortized in proportion to anticipated premiums. Assumptions as to anticipated premiums are estimated at the date of policy issue and are consistently applied during the life of the contracts. Deviations from estimated experience are reflected in income (loss) in the period such deviations occur. For these contracts, the amortization periods generally are for the total life of the policy. DAC related to these policies are subject to recoverability testing as part of the Company’s premium deficiency testing. If a premium deficiency exists, DAC are reduced by the amount of the deficiency or to zero through a charge to current period earnings (loss). If the deficiency exceeds the DAC balance, the reserve for future policy benefits is increased by the excess, reflected in earnings (loss) in the period such deficiency occurs.
For some products, policyholders can elect to modify product benefits, features, rights or coverages that occur by the exchange of a contract for a new contract, or by amendment, endorsement, or rider to a contract, or by election or coverage within a contract. These transactions are known as internal replacements. If such modification substantially changes the contract, the associated DAC is written off immediately through income and any new deferrable costs associated with the replacement contract are deferred. If the modification does not substantially change the contract, the DAC amortization on the original contract will continue and any acquisition costs associated with the related modification are expensed.
F-25
Table of Contents
Policyholder Bonus Interest Credits
Policyholder bonus interest credits are offered on certain deferred annuity products in the form of either immediate bonus interest credited or enhanced interest crediting rates for a period of time. The interest crediting expense associated with these policyholder bonus interest credits is deferred and amortized over the lives of the underlying contracts in a manner consistent with the amortization of DAC. Unamortized balances are included in Other assets in the consolidated balance sheets and amortization is included in Interest credited to policyholders’ account balances in the consolidated statements of income (loss).
Policyholders’ Account Balances and Future Policy Benefits
Policyholders’ account balances for UL and investment-type contracts are equal to the policy account values. The policy account values represent an accumulation of gross premium, investment performance and interest credited, net of surrenders, withdrawals, benefits and charges.
For participating traditional life policies, future policy benefit liabilities are calculated using a net level premium method on the basis of actuarial assumptions equal to guaranteed mortality and dividend fund interest rates. The liability for annual dividends represents the accrual of annual dividends earned. Terminal dividends are accrued in proportion to gross margins over the life of the contract.
For non-participating traditional life insurance policies, future policy benefit liabilities are estimated using a net level premium method on the basis of actuarial assumptions as to mortality, persistency and interest established at policy issue. Assumptions established at policy issue as to mortality and persistency are based on the Company’s experience that, together with interest and expense assumptions, includes a margin for adverse deviation. Benefit liabilities for traditional annuities during the accumulation period are equal to accumulated policyholders’ fund balances and, after annuitization, are equal to the present value of expected future payments. Interest rates used in establishing such liabilities range from 5.0% to 6.3% (weighted average of 5.1%) for approximately 99.1% of life insurance liabilities and from 1.6% to 5.5% (weighted average of 4.2%) for annuity liabilities.
Individual health benefit liabilities for active lives are estimated using the net level premium method and assumptions as to future morbidity, withdrawals and interest. Benefit liabilities for disabled lives are estimated using the present value of benefits method and experience assumptions as to claim terminations, expenses and interest. While management believes its disability income (“DI”) reserves have been calculated on a reasonable basis and are adequate, there can be no assurance reserves will be sufficient to provide for future liabilities.
When the liabilities for future policy benefits plus the present value of expected future gross premiums for a product are insufficient to provide for expected future policy benefits and expenses for that product, DAC is written off and thereafter, if required, a premium deficiency reserve is established by a charge to earnings.
Funding agreements are reported in Policyholders’ account balances in the consolidated balance sheets. As a member of the Federal Home Loan Bank of New York (“FHLBNY”), the Company has access to collateralized borrowings. The Company may also issue funding agreements to the FHLBNY. Both the collateralized borrowings and funding agreements would require the Company to pledge qualified mortgage-backed assets and/or government securities as collateral.
For reinsurance contracts other than those accounted for as derivatives, reinsurance recoverable balances are calculated using methodologies and assumptions that are consistent with those used to calculate the direct liabilities.
The Company has issued and continues to offer certain variable annuity products with guaranteed minimum death benefits (“GMDB”) and/or contain a guaranteed minimum living benefit (“GMLB,” and together with GMDB, the “GMxB features”) which, if elected by the policyholder after a stipulated waiting period from contract issuance, guarantees a minimum lifetime annuity based on predetermined annuity purchase rates that may be in excess of what the contract account value can purchase at then-current annuity purchase
F-26
Table of Contents
rates. This minimum lifetime annuity is based on predetermined annuity purchase rates applied to a guaranteed minimum income benefit (“GMIB”) base. The Company previously issued certain variable annuity products with and guaranteed income benefit (“GIB”) features, guaranteed withdrawal benefit for life (“GWBL”), guaranteed minimum withdrawal benefit (“GMWB”) and guaranteed minimum accumulation benefit (“GMAB”) features. The Company has also assumed reinsurance for products with GMxB features.
Reserves for products that have GMIB features, but do not have no-lapse guarantee features, and products with GMDB features are calculated on the basis of actuarial assumptions related to projected benefits and related contract charges generally over the lives of the contracts. The determination of this estimated liability is based on models that involve numerous estimates and subjective judgments, including those regarding expected market rates of return and volatility, contract surrender and withdrawal rates, mortality experience, and, for contracts with the GMIB feature, GMIB election rates. Assumptions regarding separate account performance used for purposes of this calculation are set using a long-term view of expected average market returns by applying a RTM approach, consistent with that used for DAC amortization. There can be no assurance that actual experience will be consistent with management’s estimates.
Products that have a GMIB feature with a no-lapse guarantee rider (“NLG”), GIB, GWBL, GMWB and GMAB features and the assumed products with GMIB features (collectively “GMxB derivative features”) are considered either freestanding or embedded derivatives and discussed below under (“Embedded and Freestanding Insurance Derivatives”).
After the initial establishment of reserves, premium deficiency and loss recognition tests are performed each period end using best estimate assumptions as of the testing date without provisions for adverse deviation. When the liabilities for future policy benefits plus the present value of expected future gross premiums for the aggregate product group are insufficient to provide for expected future policy benefits and expenses for that line of business (i.e., reserves net of any DAC asset), DAC would first be written off and thereafter, if required, a premium deficiency reserve would be established by a charge to earnings. Premium deficiency reserves have been recorded for the group single premium annuity business, certain interest-sensitive life contracts, structured settlements, individual disability income and major medical. Additionally, in certain instances the policyholder liability for a particular line of business may not be deficient in the aggregate to trigger loss recognition, but the pattern of earnings may be such that profits are expected to be recognized in earlier years followed by losses in later years. In these situations, accounting standards require that an additional profits followed by loss liability be recognized by an amount necessary to sufficiently offset the losses that would be recognized in later years.
Embedded and Freestanding Insurance Derivatives
Reserves for products considered either embedded or freestanding derivatives are measured at estimated fair value separately from the host variable annuity product, with changes in estimated fair value reported in Net derivative gains (losses). The estimated fair values of these derivatives are determined based on the present value of projected future benefits minus the present value of projected future fees attributable to the guarantee. The projections of future benefits and future fees require capital markets and actuarial assumptions, including expectations concerning policyholder behavior. A risk neutral valuation methodology is used under which the cash flows from the guarantees are projected under multiple capital market scenarios using observable risk-free rates.
Additionally, the Company cedes and assumes reinsurance for products with GMxB features, which are considered an embedded when part of a reinsurance contract covers risks not treated as derivative or a freestanding derivative otherwise. The GMxB reinsurance contract asset and liabilities’ fair value reflects the present value of reinsurance premiums and recoveries and risk margins over a range of market consistent economic scenarios.
F-27
Table of Contents
Changes in the fair value of embedded and freestanding derivatives are reported on the consolidated statements of income (loss) in Net derivative gains (losses). Reserves for embedded derivatives liabilities and assumed reinsurance contracts are reported in Future policyholders’ benefits and other policyholders’ liabilities and the GMIB reinsurance contract asset, at fair value is reported in a stand-alone line in the consolidated balance sheets.
Embedded and freestanding insurance derivatives fair values are determined based on the present value of projected future benefits minus the present value of projected future fees. At policy inception, a portion of the projected future guarantee fees to be collected from the policyholder equal to the present value of projected future guaranteed benefits is attributed to the embedded derivative. The percentage of fees included in the fair value measurement is locked-in at inception. Fees above those amounts represent “excess” fees and are reported in Policy charges and fee income.
Policyholders’ Dividends
The amount of policyholders’ dividends to be paid (including dividends on policies included in the Closed Block) is determined annually by the board of directors of the issuing insurance company. The aggregate amount of policyholders’ dividends is related to actual interest, mortality, morbidity and expense experience for the year and judgment as to the appropriate level of statutory surplus to be retained by the Company.
Separate Accounts
Generally, Separate Accounts established under New York State and Arizona State Insurance Law are not chargeable with liabilities that arise from any other business of the Company. Separate Account assets are subject to General Account claims only to the extent Separate Account assets exceed separate accounts liabilities. Assets and liabilities of the Separate Account represent the net deposits and accumulated net investment earnings (loss) less fees, held primarily for the benefit of policyholders, and for which the Company does not bear the investment risk. Separate Account assets and liabilities are shown on separate lines in the consolidated balance sheets. Assets held in Separate Accounts are reported at quoted market values or, where quoted values are not readily available or accessible for these securities, their fair value measures most often are determined through the use of model pricing that effectively discounts prospective cash flows to present value using appropriate sector-adjusted credit spreads commensurate with the security’s duration, also taking into consideration issuer-specific credit quality and liquidity. Investment performance (including investment income, net investment gains (losses) and changes in unrealized gains (losses)) and the corresponding amounts credited to policyholders of such Separate Account are offset within the same line in the consolidated statements of income (loss). For 2017, 2016 and 2015, investment results of such Separate Accounts were gains (losses) of $17,042 million, $8,275 million and $(1,160) million, respectively.
Deposits to Separate Accounts are reported as increases in Separate Account assets and liabilities and are not reported in revenues or expenses. Mortality, policy administration and surrender charges on all policies including those funded by Separate Accounts are included in revenues.
The Company reports the General Account’s interests in Separate Accounts as Other equity investments in the consolidated balance sheets.
Recognition of Investment Management and Service Fees and Related Expenses
Investment Management and Research
Investment management and service fees principally include the Investment Management and Research segment’s investment advisory and service fees, distribution revenues and institutional research services revenue. Investment advisory and service base fees, generally calculated as a percentage, referred to as basis points (“BPs”), of assets under management, are recorded as revenue as the related services are performed.
F-28
Table of Contents
Certain investment advisory contracts, including those associated with hedge funds, provide for a performance-based fee, in addition to or in lieu of a base fee which is calculated as either a percentage of absolute investment results or a percentage of the investment results in excess of a stated benchmark over a specified period of time. Performance-based fees are recorded as a component of revenue at the end of each contract’s measurement period. Institutional research services revenue consists of brokerage transaction charges received by Sanford C. Bernstein & Co. LLC (“SCB LLC”) and Sanford C. Bernstein Limited (“SCBL”) for independent research and brokerage-related services provided to institutional investors. Brokerage transaction charges earned and related expenses are recorded on a trade date basis. Distribution revenues and shareholder servicing fees are accrued as earned.
Commissions paid to financial intermediaries in connection with the sale of shares of open-end AB sponsored mutual funds sold without a front-end sales charge (“back-end load shares”) are capitalized as deferred sales commissions and amortized over periods not exceeding five and one-half years for U.S. fund shares and four years for non-U.S. fund shares, the periods of time during which the deferred sales commissions are generally recovered. These commissions are recovered from distribution services fees received from those funds and from contingent deferred sales commissions (“CDSC”) received from shareholders of those funds upon the redemption of their shares. CDSC cash recoveries are recorded as reductions of unamortized deferred sales commissions when received. Since January 31, 2009, AB sponsored U.S. mutual funds have not offered back-end load shares to new investors. Likewise, as of December 31, 2016, AB sponsored Non-U.S. Funds are no longer offering back-end load shares, except in isolated instances.
Management periodically reviews the deferred sales commission asset for impairment as events or changes in circumstances indicate that the carrying value may not be recoverable. If these factors indicate impairment in value, a comparison is made of the carrying value to the undiscounted cash flows expected to be generated by the asset over its remaining life. If it is determined the deferred sales commission asset is not fully recoverable, the asset will be deemed impaired and a loss will be recorded in the amount by which the recorded amount of the asset exceeds its estimated fair value.
Retirement and Protection
Investment management and service fees also includes fees earned by AXA Equitable Funds Management Group, LLC (“AXA Equitable FMG”) from providing investment management and administrative services to AXA Premier VIP Trust (“VIP Trust”), EQ Advisors Trust (“EQAT”) and 1290 Funds as well as two private investment trusts established in the Cayman Islands, AXA Allocation Funds Trusts and AXA Offshore Multimanager Funds Trust (collectively, the “Other AXA Trusts”). AXA Equitable FMG’s administrative services include, among others, fund accounting and compliance services.
AXA Equitable FMG has entered into sub-advisory agreements with affiliated and unaffiliated registered investment advisers to provide sub-advisory services to AXA Equitable FMG with respect to certain portfolios of EQAT and the Other AXA Trusts. It has also entered into a sub-administration agreement with JPMorgan Chase Bank, N.A. to provide certain sub-administration services to AXA Equitable FMG as instructed by AXA Equitable FMG.
AXA Equitable FMG’s fees related to its services are calculated as a percentage of assets under management and are recorded in Investment management and service fees in the consolidated statements of income (loss) as the related services are performed. Sub-advisory and sub-administrative expenses associated with the services are calculated and recorded as the related services are performed in Other operating costs and expenses in the consolidated statements of income (loss).
Broker-Dealer Revenues
AXA Advisors and certain of the Company’s other subsidiaries provide investment management, brokerage, and distribution services for affiliates and third parties. Third-party revenues earned from these services are reported in Other income in the Company’s consolidated statement of income (loss).
F-29
Table of Contents
Goodwill and Other Intangible Assets
Goodwill recorded by the Company represents the excess of purchase price over the estimated fair value of identifiable net assets of companies acquired in a business combination and relates principally to the acquisition of SCB Inc., an investment research and management company formerly known as Sanford C. Bernstein Inc. (“Bernstein Acquisition”) and the purchase of units of the limited partnership interest in ABLP (“AB Units”). The Company tests goodwill for recoverability each annual reporting period at December 31 and at interim periods if facts or circumstances are indicative of potential impairment.
Effective January 1, 2017, the Company early-adopted new guidance that eliminated Step 2 testing from the goodwill impairment model and continued to limit the measurement of any goodwill impairment to the carrying value of the reporting unit’s goodwill.
The Company’s intangible assets primarily relate to the Bernstein Acquisition and purchases of AB Units and reflect amounts assigned to acquired investment management contracts based on their estimated fair values at the time of acquisition, less accumulated amortization. These intangible assets generally are amortized on a straight-line basis over their estimated useful life, ranging from six to twenty years. All intangible assets are periodically reviewed for impairment as events or changes in circumstances indicate that the carrying value may not be recoverable. If the carrying value exceeds fair value, impairment tests are performed to measure the amount of the impairment loss, if any.
Internal-use Software
Capitalized internal-use software, included in Other assets in the consolidated balance sheets, is amortized on a straight-line basis over the estimated useful life of the software that ranges between three and five years. Capitalized amounts are periodically tested for impairment in accordance with the guidance on impairment of long-lived assets. An immediate charge to earnings is recognized if capitalized software costs no longer are deemed to be recoverable. In addition, service potential is periodically reassessed to determine whether facts and circumstances have compressed the software’s useful life such that acceleration of amortization over a shorter period than initially determined would be required.
Income Taxes
The Company and certain of its consolidated subsidiaries and affiliates file a consolidated federal income tax return. The Company provides for federal and state income taxes currently payable, as well as those deferred due to temporary differences between the financial reporting and tax bases of assets and liabilities. Current federal income taxes are charged or credited to operations based upon amounts estimated to be payable or recoverable as a result of taxable operations for the current year. Deferred income tax assets and liabilities are recognized based on the difference between financial statement carrying amounts and income tax bases of assets and liabilities using enacted income tax rates and laws. Valuation allowances are established when management determines, based on available information, that it is more likely than not that deferred tax assets will not be realized.
Under accounting for uncertainty in income taxes guidance, the Company determines whether it is more likely than not that a tax position will be sustained upon examination by the appropriate taxing authorities before any part of the benefit can be recorded in the consolidated financial statements. Tax positions are then measured at the largest amount of benefit that is greater than 50% likely of being realized upon settlement.
ABLP is a private partnership for federal income tax purposes and, accordingly, is not subject to federal and state corporate income taxes. However, ABLP is subject to a 4.0% New York City unincorporated business tax (“UBT”). AB Holding is subject to a 3.5% federal tax on partnership gross income from the active conduct of a trade or business. Domestic corporate subsidiaries of AB are subject to federal, state and local income taxes. Foreign corporate subsidiaries are generally subject to taxes in the foreign jurisdictions where
F-30
Table of Contents
they are located. The Company provides federal and state income taxes on the undistributed earnings of non-U.S. corporate subsidiaries except to the extent that such earnings are permanently invested outside the United States.
As required under accounting for income taxes, the Company determined reasonable estimates for certain effects of the Tax Cuts and Jobs Act enacted on December 22, 2017 and recorded those estimates as provisional amounts in the 2017 consolidated financial statements. In accordance with SEC Staff Accounting Bulletin No. 118 (“SAB 118”), the Company may make additional adjustments during 2018 (the measurement period) to the income tax balance sheet and income statement accounts as the U.S. Department of the Treasury issues further guidance and interpretations.
Accounting and Consolidation of VIEs
For all new investment products and entities developed by the Company (other than Collateralized Debt Obligations (“CDOs”)), the Company first determines whether the entity is a VIE, which involves determining an entity’s variability and variable interests, identifying the holders of the equity investment at risk and assessing the five characteristics of a VIE. Once an entity has been determined to be a VIE, the Company then identifies the primary beneficiary of the VIE. If the Company is deemed to be the primary beneficiary of the VIE, then the Company consolidates the entity.
The Company provides seed capital to its investment teams to develop new products and services for their clients. The Company’s original seed investment typically represents all or a majority of the equity investment in the new product and is temporary in nature. The Company evaluates its seed investments on a quarterly basis to determine whether consolidation is required.
Management of the Company reviews quarterly its investment management agreements and its investments in, and other financial arrangements with, certain entities that hold client assets under management (“AUM”) to determine the entities that the Company is required to consolidate under this guidance. These entities include certain mutual fund products, hedge funds, structured products, group trusts, collective investment trusts and limited partnerships.
A VIE must be consolidated by its primary beneficiary, which generally is defined as the party that has a controlling financial interest in the VIE. The Company is deemed to have a controlling financial interest in a VIE if it has (i) the power to direct the activities of the VIE that most significantly affect the VIE’s economic performance, and (ii) the obligation to absorb losses of the VIE or the right to receive income from the VIE that potentially could be significant to the VIE. For purposes of evaluating (ii) above, fees paid to the Company as a decision maker or service provider are excluded if the fees are compensation for services provided commensurate with the level of effort required to be performed and the arrangement includes only customary terms, conditions or amounts present in arrangements for similar services negotiated at arm’s length.
If the Company has a variable interest in an entity that is determined not to be a VIE, the entity then is evaluated for consolidation under the voting interest entity (“VOE”) model. For limited partnerships and similar entities, the Company is deemed to have a controlling financial interest in a VOE, and would be required to consolidate the entity, if the Company owns a majority of the entity’s kick-out rights through voting limited partnership interests and other limited partners do not hold substantive participating rights (or other rights that would indicate that the Company does not control the entity). For entities other than limited partnerships, the Company is deemed to have a controlling financial interest in a VOE if it owns a majority voting interest in the entity.
The analysis performed to identify variable interests held, determine whether entities are VIEs or VOEs, and evaluate whether the Company has a controlling financial interest in such entities requires the exercise of judgment and is updated on a continuous basis as circumstances change or new entities are developed. The primary beneficiary evaluation generally is performed qualitatively based on all facts and circumstances, including consideration of economic interests in the VIE held directly and indirectly through related parties and entities under common control, as well as quantitatively, as appropriate.
F-31
Table of Contents
At December 31, 2017, the Company held approximately $1,131 million of investment assets in the form of equity interests issued by non-corporate legal entities determined under the new guidance to be VIEs, such as limited partnerships and limited liability companies, including hedge funds, private equity funds, and real estate-related funds. As an equity investor, the Company is considered to have a variable interest in each of these VIEs as a result of its participation in the risks and/or rewards these funds were designed to create by their defined portfolio objectives and strategies. Primarily through qualitative assessment, including consideration of related party interests or other financial arrangements, if any, the Company was not identified as primary beneficiary of any of these VIEs, largely due to its inability to direct the activities that most significantly impact their economic performance. Consequently, the Company continues to reflect these equity interests in the consolidated balance sheet as Other equity investments and to apply the equity method of accounting for these positions. The net assets of these nonconsolidated VIEs are approximately $160,186 million. The Company’s maximum exposure to loss from its direct involvement with these VIEs is the carrying value of its investment of $1,131 million and approximately $734 million of unfunded commitments at December 31, 2017. The Company has no further economic interest in these VIEs in the form of guarantees, derivatives, credit enhancements or similar instruments and obligations.
At December 31, 2017, the Company consolidated three real estate joint ventures for which it was identified as primary beneficiary under the VIE model. Two of the joint ventures are owned 95% by the Company and 5% by the venture partner. The third consolidated entity is jointly owned by AXA Equitable and AXA France and holds an investment in a real estate venture. Included in the Company’s consolidated balance sheets at December 31, 2017 and 2016, respectively, are total assets of $393 million and $36 million related to these VIEs, primarily resulting from the consolidated presentation of $372 million and $36 million of real estate held for production of income. Also resulting from the Company’s consolidated presentation of these VIEs are total liabilities of $229 million and $11 million at December 31, 2017 and 2016, respectively, including long term debt in the amount of $203 million and $0 million. In addition, real estate held for production of income reflects $18 million and $20 million as related to two non-consolidated joint ventures at December 31, 2017 and 2016, respectively.
Included in the Company’s consolidated balance sheet at December 31, 2017 are assets of $1,550 million, liabilities of $696 million and redeemable non-controlling interest of $596 million associated with the consolidation of AB-sponsored investment funds under the VIE model. Also included in the Company’s consolidated balance sheets are assets of $58 million, liabilities of $2 million and redeemable non-controlling interest of $0 million from consolidation of AB-sponsored investment funds under the VOE model. The assets of these consolidated funds are presented within Other invested assets and cash and cash equivalents, and liabilities of these consolidated funds are presented with other liabilities on the face of the Company’s consolidated balance sheet at December 31, 2017; ownership interests not held by the Company relating to consolidated VIEs and VOEs are presented either as redeemable or non-redeemable noncontrolling interest, as appropriate. The Company is not required to provide financial support to these company-sponsored investment funds, and only the assets of such funds are available to settle each fund’s own liabilities.
As of December 31, 2017, the net assets of investment products sponsored by AB that are nonconsolidated VIEs are approximately $53,600 million and the Company’s maximum exposure to loss from its direct involvement with these VIEs is its investment of $7.9 million at December 31, 2017. The Company has no further commitments to or economic interest in these VIEs.
Assumption Updates and Model Changes
In 2017, the Company made several assumption updates and model changes, including the following: (1) updated the expectation of long-term Separate Accounts volatility used in estimating policyholders’ benefits for variable annuities with GMDB and GMIB guarantees and variable universal life contracts with secondary guarantees; (2) updated the estimated duration used to calculate policyholders’ benefits for
F-32
Table of Contents
variable annuities with GMDB and GMIB guarantees and the period over which DAC is amortized; (3) updated policyholder behavior assumptions based on emerging experience, including expectations of long-term lapse and partial withdrawal rates for variable annuities with GMxB features; (4) updated premium funding assumptions for certain universal life and variable universal life products with secondary guarantees; (5) completed its periodic review and updated its long term mortality assumption for universal, variable universal and traditional life products; (6) updated the assumption for long term General Account spread and yield assumptions in the DAC amortization and loss recognition testing calculations for universal life, variable universal life and deferred annuity business lines; (7) updated our maintenance expense assumption for universal life and variable universal life products; and (8) implemented other actuarial assumption updates and model changes, resulting in the full release of the reserve. The net impact of assumption changes in 2017 increased policyholders’ benefits by $277 million, decreased amortization of DAC by $112 million, decreased policy charges and fee income by $85 million, increased the fair value of our GMIB reinsurance asset by $504 million and decreased the fair value of the GMIB NLG liability by $457 million. This resulted in an increase in Income (loss) from operations, before income taxes of $711 million and increased Net income by approximately $462 million.
In 2016, the Company made several assumption updates and model changes, including the following: (1) updated the premium funding assumption used in setting variable life policyholder benefit reserves; (2) made changes in the model used in calculating premium loads, which increased interest sensitive life policyholder benefit reserves; (3) updated its mortality assumption for certain variable interest-sensitive life (“VISL”) products as a result of favorable mortality experience for some of its older products and unfavorable mortality experience on some of its newer products; and (4) updated the General Account spread and yield assumptions for certain VISL products to reflect lower expected investment yields. The net impact of assumption updates and model changes in 2016 decreased policyholders’ benefits by $117 million, increased the amortization of DAC by $201 million, increased policy charges and fee income by $54 million, decreased income (loss) from operations, before income taxes of $30 million and decreased Net income by approximately $20 million.
In 2015, the Company made several assumption updates, including the following: (1) updated policyholder behavior assumptions based on emerging experience, including expectations of long-term lapse and partial withdrawal rates for variable annuities with GMDB and GMIB guarantees, which. increased expected future claim costs, the fair value of the GMxB derivative features liability, and the fair value of the GMIB reinsurance contract asset; (2) lowered the expectation of GMIB election rates for certain ages based on emerging experience which decreased the expected future GMIB claim cost and the fair value of the GMIB reinsurance contract asset, while increasing the expected future GMDB claim cost and the GMxB derivative features liability; updated the RTM assumption used to calculate GMDB/GMIB and VISL reserves and amortization of DAC from 9.0% to 7.0% based upon the Company’s current expectations of interest rates and future fund growth. The impact of these assumption updates in 2015 was a net decrease in the fair value of the GMIB reinsurance contract asset of $407 million, an increase in the GMDB/GMIB reserves of $328 million, an increase in the GMxB derivative features liability of $887 million, an increase in VISL reserves of $29 million, a decrease in the amortization of DAC of $173 million, and $34 million decrease in policy charges and fee income. This resulted in a decrease to Income (loss) from operations, before income taxes of $1,511 million and decreased Net income by approximately $982 million.
In 2015, the Company announced it would raise cost of insurance (“COI”) rates for certain UL policies. AXA Equitable Life Insurance Company (“AXA Equitable Life”) and U.S. Financial Life Insurance Company (“USFL”) raised the COI rates for these policies as management expects future mortality and investment experience to be less favorable than what was anticipated when the current schedule of COI rates was established. The AXA Equitable Life COI rate increase is larger than the increase that previously had been anticipated in management’s reserve assumptions. As a result of these rate increases, management updated its assumptions to reflect the actual COI rate increases, resulting in a $73 million increase to the 2015 Net income.
F-33
Table of Contents
| 3) | INVESTMENTS |
Fixed Maturities and Equity Securities
The following table provides information relating to fixed maturities and equity securities classified as AFS:
Available-for-Sale Securities by Classification
| Amortized Cost |
Gross Unrealized Gains |
Gross Unrealized Losses |
Fair Value | OTTI in AOCI(3) |
||||||||||||||||
| (in millions) | ||||||||||||||||||||
| December 31, 2017 |
||||||||||||||||||||
| Fixed Maturity Securities: |
||||||||||||||||||||
| Public corporate |
$ | 17,181 | $ | 806 | $ | 33 | $ | 17,954 | $ | — | ||||||||||
| Private corporate |
7,299 | 225 | 32 | 7,492 | — | |||||||||||||||
| U.S. Treasury, government and agency |
17,759 | 1,000 | 251 | 18,508 | — | |||||||||||||||
| States and political subdivisions |
422 | 67 | — | 489 | — | |||||||||||||||
| Foreign governments |
395 | 29 | 5 | 419 | — | |||||||||||||||
| Commercial mortgage-backed |
— | — | — | — | — | |||||||||||||||
| Residential mortgage-backed(1) |
797 | 22 | 1 | 818 | — | |||||||||||||||
| Asset-backed(2) |
745 | 5 | 1 | 749 | 2 | |||||||||||||||
| Redeemable preferred stock |
470 | 43 | 1 | 512 | — | |||||||||||||||
|
|
|
|
|
|
|
|
|
|
|
|||||||||||
| Total Fixed Maturities |
45,068 | 2,197 | 324 | 46,941 | 2 | |||||||||||||||
| Equity securities |
188 | 2 | — | 190 | — | |||||||||||||||
|
|
|
|
|
|
|
|
|
|
|
|||||||||||
| Total at December 31, 2017 |
$ | 45,256 | $ | 2,199 | $ | 324 | $ | 47,131 | $ | 2 | ||||||||||
|
|
|
|
|
|
|
|
|
|
|
|||||||||||
| December 31, 2016: |
||||||||||||||||||||
| Fixed Maturity Securities: |
||||||||||||||||||||
| Public corporate |
$ | 15,930 | $ | 767 | $ | 102 | $ | 16,595 | $ | — | ||||||||||
| Private corporate |
7,133 | 221 | 57 | 7,297 | — | |||||||||||||||
| U.S. Treasury, government and agency |
15,187 | 405 | 756 | 14,836 | — | |||||||||||||||
| States and political subdivisions |
441 | 64 | 2 | 503 | — | |||||||||||||||
| Foreign governments |
384 | 30 | 14 | 400 | — | |||||||||||||||
| Commercial mortgage-backed |
472 | 31 | 108 | 395 | 8 | |||||||||||||||
| Residential mortgage-backed(1) |
980 | 27 | 2 | 1,005 | — | |||||||||||||||
| Asset-backed(2) |
273 | 10 | 1 | 282 | 3 | |||||||||||||||
| Redeemable preferred stock |
532 | 45 | 11 | 566 | — | |||||||||||||||
|
|
|
|
|
|
|
|
|
|
|
|||||||||||
| Total Fixed Maturities |
41,332 | 1,600 | 1,053 | 41,879 | 11 | |||||||||||||||
| Equity securities |
113 | — | — | 113 | — | |||||||||||||||
|
|
|
|
|
|
|
|
|
|
|
|||||||||||
| Total at December 31, 2016 |
$ | 41,445 | $ | 1,600 | $ | 1,053 | $ | 41,992 | $ | 11 | ||||||||||
|
|
|
|
|
|
|
|
|
|
|
|||||||||||
| (1) | Includes publicly traded agency pass-through securities and collateralized obligations. |
| (2) | Includes credit-tranched securities collateralized by sub-prime mortgages and other asset types and credit tenant loans. |
| (3) | Amounts represent OTTI losses in AOCI, which were not included in income (loss) in accordance with current accounting guidance. |
The contractual maturities of AFS fixed maturities at December 31, 2017 are shown in the table below. Bonds not due at a single maturity date have been included in the table in the final year of maturity. Actual maturities may differ from contractual maturities because borrowers may have the right to call or prepay obligations with or without call or prepayment penalties.
F-34
Table of Contents
Available-for-Sale Fixed Maturities
Contractual Maturities
| Amortized Cost |
Fair Value | |||||||
| (in millions) | ||||||||
| December 31, 2017 |
||||||||
| Due in one year or less |
$ | 1,651 | $ | 1,668 | ||||
| Due in years two through five |
10,350 | 10,649 | ||||||
| Due in years six through ten |
13,638 | 13,852 | ||||||
| Due after ten years |
17,417 | 18,693 | ||||||
|
|
|
|
|
|||||
| Subtotal |
43,056 | 44,862 | ||||||
| Commercial mortgage-backed securities |
— | — | ||||||
| Residential mortgage-backed securities |
797 | 818 | ||||||
| Asset-backed securities |
745 | 749 | ||||||
| Redeemable preferred stocks |
470 | 512 | ||||||
|
|
|
|
|
|||||
| Total at December 31, 2017 |
$ | 45,068 | $ | 46,941 | ||||
|
|
|
|
|
|||||
The following table shows proceeds from sales, gross gains (losses) from sales and OTTI for AFS fixed maturities during 2017, 2016 and 2015:
| December 31, | ||||||||||||
| 2017 | 2016 | 2015 | ||||||||||
| (in millions) | ||||||||||||
| Proceeds from sales |
$ | 8,213 | $ | 5,036 | $ | 1,225 | ||||||
|
|
|
|
|
|
|
|||||||
| Gross gains on sales |
$ | 107 | $ | 212 | $ | 44 | ||||||
|
|
|
|
|
|
|
|||||||
| Gross losses on sales |
$ | (259 | ) | $ | (60 | ) | $ | (8 | ) | |||
|
|
|
|
|
|
|
|||||||
| Total OTTI |
$ | (15 | ) | $ | (68 | ) | $ | (42 | ) | |||
| Non-credit losses recognized in OCI |
— | — | — | |||||||||
|
|
|
|
|
|
|
|||||||
| Credit losses recognized in earnings (loss) |
$ | (15 | ) | $ | (68 | ) | $ | (42 | ) | |||
|
|
|
|
|
|
|
|||||||
F-35
Table of Contents
The following table sets forth the amount of credit loss impairments on fixed maturity securities held by the Company at the dates indicated and the corresponding changes in such amounts:
Fixed Maturities - Credit Loss Impairments
| 2017 | 2016 | |||||||
| (in millions) | ||||||||
| Balances at January 1, |
$ | (239 | ) | $ | (274 | ) | ||
| Previously recognized impairments on securities that matured, paid, prepaid or sold |
236 | 103 | ||||||
| Recognized impairments on securities impaired to fair value this period(1) |
— | (17 | ) | |||||
| Impairments recognized this period on securities not previously impaired |
(14 | ) | (49 | ) | ||||
| Additional impairments this period on securities previously impaired |
(1 | ) | (2 | ) | ||||
| Increases due to passage of time on previously recorded credit losses |
— | — | ||||||
| Accretion of previously recognized impairments due to increases in expected cash flows |
— | — | ||||||
|
|
|
|
|
|||||
| Balances at December 31, |
$ | (18 | ) | $ | (239 | ) | ||
|
|
|
|
|
|||||
| (1) | Represents circumstances where the Company determined in the current period that it intends to sell the security or it is more likely than not that it will be required to sell the security before recovery of the security’s amortized cost. |
Net unrealized investment gains (losses) on fixed maturities and equity securities classified as AFS are included in the consolidated balance sheets as a component of AOCI. The table below presents these amounts as of the dates indicated:
| December 31, | ||||||||
| 2017 | 2016 | |||||||
| (in millions) | ||||||||
| AFS Securities: |
||||||||
| Fixed maturities: |
||||||||
| With OTTI loss |
$ | 2 | $ | 19 | ||||
| All other |
1,871 | 528 | ||||||
| Equity securities |
2 | — | ||||||
|
|
|
|
|
|||||
| Net Unrealized Gains (Losses) |
$ | 1,875 | $ | 547 | ||||
|
|
|
|
|
|||||
F-36
Table of Contents
Changes in net unrealized investment gains (losses) recognized in AOCI include reclassification adjustments to reflect amounts realized in Net income (loss) for the current period that had been part of OCI in earlier periods. The tables that follow below present a rollforward of net unrealized investment gains (losses) recognized in AOCI, split between amounts related to fixed maturity securities on which an OTTI loss has been recognized, and all other:
Net Unrealized Gains (Losses) on Fixed Maturities with OTTI Losses
| Net Unrealized Gain (Losses) on Investments |
DAC | Policyholders’ Liabilities |
Deferred Income Tax Asset (Liability) |
AOCI Gain (Loss) Related to Net Unrealized Investment Gains (Losses) |
||||||||||||||||
| (in millions) | ||||||||||||||||||||
| Balance, January 1, 2017 |
$ | 19 | $ | 1 | $ | (10 | ) | $ | (4 | ) | $ | 6 | ||||||||
| Net investment gains (losses) arising during the period |
(18 | ) | — | — | — | (18 | ) | |||||||||||||
| Reclassification adjustment for OTTI losses: |
||||||||||||||||||||
| Included in Net income (loss) |
1 | — | — | — | 1 | |||||||||||||||
| Excluded from Net income (loss)(1) |
— | — | — | |||||||||||||||||
| Impact of net unrealized investment gains (losses) on: |
||||||||||||||||||||
| DAC |
— | (1 | ) | — | — | (1 | ) | |||||||||||||
| Deferred income taxes |
— | — | — | (3 | ) | (3 | ) | |||||||||||||
| Policyholders’ liabilities |
— | — | 9 | — | 9 | |||||||||||||||
|
|
|
|
|
|
|
|
|
|
|
|||||||||||
| Balance, December 31, 2017 |
$ | 2 | $ | — | $ | (1 | ) | $ | (7 | ) | $ | (6 | ) | |||||||
|
|
|
|
|
|
|
|
|
|
|
|||||||||||
| Balance, January 1, 2016 |
$ | 21 | $ | — | $ | (4 | ) | $ | (6 | ) | $ | 11 | ||||||||
| Net investment gains (losses) arising during the period |
(17 | ) | — | — | — | (17 | ) | |||||||||||||
| Reclassification adjustment for OTTI losses: |
||||||||||||||||||||
| Included in Net income (loss) |
15 | — | — | — | 15 | |||||||||||||||
| Excluded from Net income (loss)(1) |
— | — | — | — | — | |||||||||||||||
| Impact of net unrealized investment gains (losses) on: |
||||||||||||||||||||
| DAC |
— | 1 | — | — | 1 | |||||||||||||||
| Deferred income taxes |
— | — | — | 2 | 2 | |||||||||||||||
| Policyholders’ liabilities |
— | — | (6 | ) | — | (6 | ) | |||||||||||||
|
|
|
|
|
|
|
|
|
|
|
|||||||||||
| Balance, December 31, 2016 |
$ | 19 | $ | 1 | $ | (10 | ) | $ | (4 | ) | $ | 6 | ||||||||
|
|
|
|
|
|
|
|
|
|
|
|||||||||||
| (1) | Represents “transfers in” related to the portion of OTTI losses recognized during the period that were not recognized in income (loss) for securities with no prior OTTI loss. |
F-37
Table of Contents
All Other Net Unrealized Investment Gains (Losses) in AOCI
| Net Unrealized Gains (Losses) on Investments |
DAC | Policyholders’ Liabilities |
Deferred Income Tax Asset (Liability) |
AOCI Gain (Loss) Related to Net Unrealized Investment Gains (Losses) |
||||||||||||||||
| (in millions) | ||||||||||||||||||||
| Balance, January 1, 2017 |
$ | 528 | $ | (45 | ) | $ | (192 | ) | $ | (95 | ) | $ | 196 | |||||||
| Net investment gains (losses) arising during the period |
1,329 | — | — | — | 1,329 | |||||||||||||||
| Reclassification adjustment for OTTI losses: |
||||||||||||||||||||
| Included in Net income (loss) |
14 | — | — | — | 14 | |||||||||||||||
| Excluded from Net income (loss)(1) |
— | — | — | — | — | |||||||||||||||
| Impact of net unrealized investment gains (losses) on: |
||||||||||||||||||||
| DAC |
— | (313 | ) | — | — | (313 | ) | |||||||||||||
| Deferred income taxes |
— | — | — | (288 | ) | (288 | ) | |||||||||||||
| Policyholders’ liabilities |
— | — | (46 | ) | — | (46 | ) | |||||||||||||
|
|
|
|
|
|
|
|
|
|
|
|||||||||||
| Balance, December 31, 2017 |
$ | 1,871 | $ | (358 | ) | $ | (238 | ) | $ | (383 | ) | $ | 892 | |||||||
|
|
|
|
|
|
|
|
|
|
|
|||||||||||
| Balance, January 1, 2016 |
$ | 962 | $ | (128 | ) | $ | (226 | ) | $ | (213 | ) | $ | 395 | |||||||
| Net investment gains (losses) arising during the period |
(335 | ) | — | — | — | (335 | ) | |||||||||||||
| Reclassification adjustment for OTTI losses: |
||||||||||||||||||||
| Included in Net income (loss) |
(99 | ) | — | — | — | (99 | ) | |||||||||||||
| Excluded from Net income (loss)(1) |
— | — | — | — | — | |||||||||||||||
| Impact of net unrealized investment gains (losses) on: |
||||||||||||||||||||
| DAC |
— | 83 | — | — | 83 | |||||||||||||||
| Deferred income taxes |
— | — | — | 118 | 118 | |||||||||||||||
| Policyholders’ liabilities |
— | — | 34 | — | 34 | |||||||||||||||
|
|
|
|
|
|
|
|
|
|
|
|||||||||||
| Balance, December 31, 2016 |
$ | 528 | $ | (45 | ) | $ | (192 | ) | $ | (95 | ) | $ | 196 | |||||||
|
|
|
|
|
|
|
|
|
|
|
|||||||||||
| (1) | Represents “transfers out” related to the portion of OTTI losses during the period that were not recognized in income (loss) for securities with no prior OTTI loss. |
F-38
Table of Contents
The following tables disclose the fair values and gross unrealized losses of the 752 issues at December 31, 2017 and the 894 issues at December 31, 2016 of fixed maturities that are not deemed to be other-than-temporarily impaired, aggregated by investment category and length of time that individual securities have been in a continuous unrealized loss position for the specified periods at the dates indicated:
| Less Than 12 Months | 12 Months or Longer | Total | ||||||||||||||||||||||
| Fair Value | Gross Unrealized Losses |
Fair Value | Gross Unrealized Losses |
Fair Value | Gross Unrealized Losses |
|||||||||||||||||||
| (in millions) | ||||||||||||||||||||||||
| December 31, 2017: |
||||||||||||||||||||||||
| Fixed Maturity Securities: |
||||||||||||||||||||||||
| Public corporate |
$ | 2,123 | $ | 15 | $ | 690 | $ | 18 | $ | 2,813 | $ | 33 | ||||||||||||
| Private corporate |
780 | 8 | 641 | 24 | 1,421 | 32 | ||||||||||||||||||
| U.S. Treasury, government and agency |
2,718 | 6 | 4,506 | 245 | 7,224 | 251 | ||||||||||||||||||
| States and political subdivisions |
20 | — | — | — | 20 | — | ||||||||||||||||||
| Foreign governments |
11 | — | 73 | 5 | 84 | 5 | ||||||||||||||||||
| Commercial mortgage-backed |
— | — | — | — | — | — | ||||||||||||||||||
| Residential mortgage-backed |
62 | — | 76 | 1 | 138 | 1 | ||||||||||||||||||
| Asset-backed |
15 | 1 | 12 | — | 27 | 1 | ||||||||||||||||||
| Redeemable preferred stock |
10 | — | 13 | 1 | 23 | 1 | ||||||||||||||||||
|
|
|
|
|
|
|
|
|
|
|
|
|
|||||||||||||
| Total |
$ | 5,739 | $ | 30 | $ | 6,011 | $ | 294 | $ | 11,750 | $ | 324 | ||||||||||||
|
|
|
|
|
|
|
|
|
|
|
|
|
|||||||||||||
| December 31, 2016: |
||||||||||||||||||||||||
| Fixed Maturity Securities: |
||||||||||||||||||||||||
| Public corporate |
$ | 3,466 | $ | 95 | $ | 150 | $ | 7 | $ | 3,616 | $ | 102 | ||||||||||||
| Private corporate |
1,548 | 39 | 283 | 18 | 1,831 | 57 | ||||||||||||||||||
| U.S. Treasury, government and agency |
7,290 | 756 | — | — | 7,290 | 756 | ||||||||||||||||||
| States and political subdivisions |
— | — | 18 | 2 | 18 | 2 | ||||||||||||||||||
| Foreign governments |
73 | 3 | 49 | 11 | 122 | 14 | ||||||||||||||||||
| Commercial mortgage-backed |
68 | 6 | 180 | 102 | 248 | 108 | ||||||||||||||||||
| Residential mortgage-backed |
347 | 2 | 35 | — | 382 | 2 | ||||||||||||||||||
| Asset-backed |
128 | — | 8 | 1 | 136 | 1 | ||||||||||||||||||
| Redeemable preferred stock |
227 | 10 | 12 | 1 | 239 | 11 | ||||||||||||||||||
|
|
|
|
|
|
|
|
|
|
|
|
|
|||||||||||||
| Total |
$ | 13,147 | $ | 911 | $ | 735 | $ | 142 | $ | 13,882 | $ | 1,053 | ||||||||||||
|
|
|
|
|
|
|
|
|
|
|
|
|
|||||||||||||
The Company’s investments in fixed maturity securities do not include concentrations of credit risk of any single issuer greater than 10% of the consolidated equity of the Company, other than securities of the U.S. government, U.S. government agencies, and certain securities guaranteed by the U.S. government. The Company maintains a diversified portfolio of corporate securities across industries and issuers and does not have exposure to any single issuer in excess of 0.8% of total investments. The largest exposures to a single issuer of corporate securities held at December 31, 2017 and 2016 were $207 million and $173 million, respectively. Corporate high yield securities, consisting primarily of public high yield bonds, are classified as other than investment grade by the various rating agencies, i.e., a rating below Baa3/BBB- or the National Association of Insurance Commissioners (“NAIC”) designation of 3 (medium grade), 4 or 5 (below investment grade) or 6 (in or near default). At December 31, 2017 and 2016, respectively, approximately $1,372 million and $1,661 million, or 3% and 4%, of the $45,068 million and $41,332 million aggregate amortized cost of fixed maturities held by the Company were considered to be other than investment grade. These securities had net unrealized gains and (losses) of $5 million and $(60) million at December 31, 2017 and 2016, respectively. At December 31, 2017 and 2016, respectively, the $294 million and $142 million of
F-39
Table of Contents
gross unrealized losses of twelve months or more were concentrated in U.S. Treasury, corporate and commercial mortgage-backed securities. In accordance with the policy described in Note 2, the Company concluded that an adjustment to income for OTTI for these securities was not warranted at either December 31, 2017 or 2016. As of December 31, 2017, the Company did not intend to sell the securities nor will it likely be required to dispose of the securities before the anticipated recovery of their remaining amortized cost basis.
The Company does not originate, purchase or warehouse residential mortgages and is not in the mortgage servicing business.
At December 31, 2017, the carrying value of fixed maturities that were non-income producing for the twelve months preceding that date was $3 million.
At December 31, 2017 and 2016, respectively, the fair value of the Company’s trading account securities was $14,170 million and $12,085 million. Included in the trading classification at December 31, 2017 and 2016, respectively, were U.S. Treasury securities with aggregate fair values of $0 million and $1,446 million, pledged under repos accounted for as collateralized borrowings and reported in Securities sold under repurchase agreements in the consolidated balance sheets. Also at December 31, 2017 and 2016, respectively, trading account securities included the General Account’s investment in Separate Accounts which had carrying values of $50 million and $64 million.
Mortgage Loans
The payment terms of mortgage loans may from time to time be restructured or modified.
Troubled Debt Restructuring
The investment in troubled debt restructured mortgage loans, based on amortized cost, amounted to $0 million and $15 million at December 31, 2017 and 2016, respectively. Gross interest income on these loans included in net investment income (loss) totaled $0 million, $0 million and $1 million in 2017, 2016 and 2015, respectively.
Valuation Allowances for Mortgage Loans:
Allowance for credit losses for mortgage loans for 2017, 2016 and 2015 are as follows:
| Commercial Mortgage Loans | ||||||||||||
| 2017 | 2016 | 2015 | ||||||||||
| (in millions) | ||||||||||||
| Allowance for credit losses: |
||||||||||||
| Beginning Balance, January 1, |
$ | 8 | $ | 6 | $ | 37 | ||||||
| Charge-offs |
— | — | (32 | ) | ||||||||
| Recoveries |
— | (2 | ) | (1 | ) | |||||||
| Provision |
— | 4 | 2 | |||||||||
|
|
|
|
|
|
|
|||||||
| Ending Balance, December 31, |
$ | 8 | $ | 8 | $ | 6 | ||||||
|
|
|
|
|
|
|
|||||||
| Ending Balance, December 31, |
||||||||||||
| Individually Evaluated for Impairment |
$ | 8 | $ | 8 | $ | 6 | ||||||
|
|
|
|
|
|
|
|||||||
There were no allowances for credit losses for agricultural mortgage loans in 2017, 2016 and 2015.
The following tables provide information relating to the loan-to-value and debt service coverage ratios for commercial and agricultural mortgage loans at December 31, 2017 and 2016, respectively. The values used in these ratio calculations were developed as part of the periodic review of the commercial and agricultural mortgage loan portfolio, which includes an evaluation of the underlying collateral value.
F-40
Table of Contents
Mortgage Loans by Loan-to-Value and Debt Service Coverage Ratios
December 31, 2017
| Debt Service Coverage Ratio(1) | ||||||||||||||||||||||||||||
| Loan-to-Value Ratio:(2) | Greater than 2.0x |
1.8x to 2.0x |
1.5x to 1.8x |
1.2x to 1.5x |
1.0x to 1.2x |
Less than 1.0x |
Total Mortgage Loans |
|||||||||||||||||||||
| (in millions) | ||||||||||||||||||||||||||||
| Commercial Mortgage Loans(1) |
||||||||||||||||||||||||||||
| 0% - 50% |
$ | 759 | $ | — | $ | 320 | $ | 74 | $ | — | $ | — | $ | 1,153 | ||||||||||||||
| 50% - 70% |
4,088 | 682 | 1,066 | 428 | 145 | — | 6,409 | |||||||||||||||||||||
| 70% - 90% |
169 | 110 | 196 | 272 | 50 | — | 797 | |||||||||||||||||||||
| 90% plus |
— | — | 27 | — | — | — | 27 | |||||||||||||||||||||
|
|
|
|
|
|
|
|
|
|
|
|
|
|
|
|||||||||||||||
| Total Commercial Mortgage Loans |
$ | 5,016 | $ | 792 | $ | 1,609 | $ | 774 | $ | 195 | $ | — | $ | 8,386 | ||||||||||||||
|
|
|
|
|
|
|
|
|
|
|
|
|
|
|
|||||||||||||||
| Agricultural Mortgage Loans(1) |
||||||||||||||||||||||||||||
| 0% - 50% |
$ | 272 | $ | 149 | $ | 275 | $ | 515 | $ | 316 | $ | 30 | $ | 1,557 | ||||||||||||||
| 50% - 70% |
111 | 46 | 227 | 359 | 221 | 49 | 1,013 | |||||||||||||||||||||
| 70% - 90% |
— | — | — | 4 | — | — | 4 | |||||||||||||||||||||
| 90% plus |
— | — | — | — | — | — | — | |||||||||||||||||||||
|
|
|
|
|
|
|
|
|
|
|
|
|
|
|
|||||||||||||||
| Total Agricultural Mortgage Loans |
$ | 383 | $ | 195 | $ | 502 | $ | 878 | $ | 537 | $ | 79 | $ | 2,574 | ||||||||||||||
|
|
|
|
|
|
|
|
|
|
|
|
|
|
|
|||||||||||||||
| Total Mortgage Loans(1) |
||||||||||||||||||||||||||||
| 0% - 50% |
$ | 1,031 | $ | 149 | $ | 595 | $ | 589 | $ | 316 | $ | 30 | $ | 2,710 | ||||||||||||||
| 50% - 70% |
4,199 | 728 | 1,293 | 787 | 366 | 49 | 7,422 | |||||||||||||||||||||
| 70% - 90% |
169 | 110 | 196 | 276 | 50 | — | 801 | |||||||||||||||||||||
| 90% plus |
— | — | 27 | — | — | — | 27 | |||||||||||||||||||||
|
|
|
|
|
|
|
|
|
|
|
|
|
|
|
|||||||||||||||
| Total Mortgage Loans |
$ | 5,399 | $ | 987 | $ | 2,111 | $ | 1,652 | $ | 732 | $ | 79 | $ | 10,960 | ||||||||||||||
|
|
|
|
|
|
|
|
|
|
|
|
|
|
|
|||||||||||||||
| (1) | The debt service coverage ratio is calculated using the most recently reported operating earnings results from property operations divided by annual debt service. |
| (2) | The loan-to-value ratio is derived from current loan balance divided by the fair market value of the property. The fair market value of the underlying commercial properties is updated annually. |
F-41
Table of Contents
Mortgage Loans by Loan-to-Value and Debt Service Coverage Ratios
December 31, 2016
| Debt Service Coverage Ratio(1) | ||||||||||||||||||||||||||||
| Loan-to-Value Ratio:(2) | Greater than 2.0x |
1.8x to 2.0x |
1.5x to 1.8x |
1.2x to 1.5x |
1.0x to 1.2x |
Less than 1.0x |
Total Mortgage Loans |
|||||||||||||||||||||
| (in millions) | ||||||||||||||||||||||||||||
| Commercial Mortgage Loans (1) |
||||||||||||||||||||||||||||
| 0% - 50% |
$ | 755 | $ | 95 | $ | 59 | $ | 56 | $ | — | $ | — | $ | 965 | ||||||||||||||
| 50% - 70% |
3,217 | 430 | 673 | 1,100 | 76 | — | 5,496 | |||||||||||||||||||||
| 70% - 90% |
282 | 65 | 229 | 127 | 28 | 46 | 777 | |||||||||||||||||||||
| 90% plus |
— | — | 28 | 15 | — | — | 43 | |||||||||||||||||||||
|
|
|
|
|
|
|
|
|
|
|
|
|
|
|
|||||||||||||||
| Total Commercial Mortgage Loans |
$ | 4,254 | $ | 590 | $ | 989 | $ | 1,298 | $ | 104 | $ | 46 | $ | 7,281 | ||||||||||||||
|
|
|
|
|
|
|
|
|
|
|
|
|
|
|
|||||||||||||||
| Agricultural Mortgage Loans (1) |
||||||||||||||||||||||||||||
| 0% - 50% |
$ | 254 | $ | 138 | $ | 296 | $ | 468 | $ | 286 | $ | 49 | $ | 1,491 | ||||||||||||||
| 50% - 70% |
141 | 57 | 209 | 333 | 219 | 45 | 1,004 | |||||||||||||||||||||
| 70% - 90% |
— | — | 2 | 4 | — | — | 6 | |||||||||||||||||||||
| 90% plus |
— | — | — | — | — | — | — | |||||||||||||||||||||
|
|
|
|
|
|
|
|
|
|
|
|
|
|
|
|||||||||||||||
| Total Agricultural Mortgage Loans |
$ | 395 | $ | 195 | $ | 507 | $ | 805 | $ | 505 | $ | 94 | $ | 2,501 | ||||||||||||||
|
|
|
|
|
|
|
|
|
|
|
|
|
|
|
|||||||||||||||
| Total Mortgage Loans (1) |
||||||||||||||||||||||||||||
| 0% - 50% |
$ | 1,009 | $ | 233 | $ | 355 | $ | 524 | $ | 286 | $ | 49 | $ | 2,456 | ||||||||||||||
| 50% - 70% |
3,358 | 487 | 882 | 1,433 | 295 | 45 | 6,500 | |||||||||||||||||||||
| 70% - 90% |
282 | 65 | 231 | 131 | 28 | 46 | 783 | |||||||||||||||||||||
| 90% plus |
— | — | 28 | 15 | — | — | 43 | |||||||||||||||||||||
|
|
|
|
|
|
|
|
|
|
|
|
|
|
|
|||||||||||||||
| Total Mortgage Loans |
$ | 4,649 | $ | 785 | $ | 1,496 | $ | 2,103 | $ | 609 | $ | 140 | $ | 9,782 | ||||||||||||||
|
|
|
|
|
|
|
|
|
|
|
|
|
|
|
|||||||||||||||
| (1) | The debt service coverage ratio is calculated using the most recently reported operating earnings results from property operations divided by annual debt service. |
| (2) | The loan-to-value ratio is derived from current loan balance divided by the fair market value of the property. The fair market value of the underlying commercial properties is updated annually. |
The following table provides information relating to the aging analysis of past due mortgage loans at December 31, 2017 and 2016, respectively.
Age Analysis of Past Due Mortgage Loan
| 30-59 Days |
60-89 Days |
90 Days Or > |
Total | Current | Total Financing Receivables |
Recorded Investment 90 Days Or > and Accruing |
||||||||||||||||||||||
| (in millions) | ||||||||||||||||||||||||||||
| December 31, 2017: |
||||||||||||||||||||||||||||
| Commercial |
$ | 27 | $ | — | $ | — | $ | 27 | $ | 8,359 | $ | 8,386 | $ | — | ||||||||||||||
| Agricultural |
49 | 3 | 22 | 74 | 2,500 | 2,574 | 22 | |||||||||||||||||||||
|
|
|
|
|
|
|
|
|
|
|
|
|
|
|
|||||||||||||||
| Total Mortgage Loans |
$ | 76 | $ | 3 | $ | 22 | $ | 101 | $ | 10,859 | $ | 10,960 | $ | 22 | ||||||||||||||
|
|
|
|
|
|
|
|
|
|
|
|
|
|
|
|||||||||||||||
| December 31, 2016: |
||||||||||||||||||||||||||||
| Commercial |
$ | — | $ | — | $ | — | $ | — | $ | 7,281 | $ | 7,281 | $ | — | ||||||||||||||
| Agricultural |
9 | 2 | 6 | 17 | 2,484 | 2,501 | 6 | |||||||||||||||||||||
|
|
|
|
|
|
|
|
|
|
|
|
|
|
|
|||||||||||||||
| Total Mortgage Loans |
$ | 9 | $ | 2 | $ | 6 | $ | 17 | $ | 9,765 | $ | 9,782 | $ | 6 | ||||||||||||||
|
|
|
|
|
|
|
|
|
|
|
|
|
|
|
|||||||||||||||
F-42
Table of Contents
The following table provides information relating to impaired mortgage loans at December 31, 2017 and 2016, respectively.
| Impaired Mortgage Loans | ||||||||||||||||||||
| Recorded Investment |
Unpaid Principal Balance |
Related Allowance |
Average Recorded Investment(1) |
Interest Income Recognized |
||||||||||||||||
| (in millions) | ||||||||||||||||||||
| December 31, 2017: |
||||||||||||||||||||
| With no related allowance recorded: |
||||||||||||||||||||
| Commercial mortgage loans - other |
$ | — | $ | — | $ | — | $ | — | $ | — | ||||||||||
| Agricultural mortgage loans |
— | — | — | — | — | |||||||||||||||
|
|
|
|
|
|
|
|
|
|
|
|||||||||||
| Total |
$ | — | $ | — | $ | — | $ | — | $ | — | ||||||||||
| With related allowance recorded: |
||||||||||||||||||||
| Commercial mortgage loans - other |
$ | 27 | $ | 27 | $ | (8 | ) | $ | 27 | $ | 2 | |||||||||
| Agricultural mortgage loans |
— | — | — | — | — | |||||||||||||||
|
|
|
|
|
|
|
|
|
|
|
|||||||||||
| Total |
$ | 27 | $ | 27 | $ | (8 | ) | $ | 27 | $ | 2 | |||||||||
|
|
|
|
|
|
|
|
|
|
|
|||||||||||
| December 31, 2016: |
||||||||||||||||||||
| With no related allowance recorded: |
||||||||||||||||||||
| Commercial mortgage loans - other |
$ | 15 | $ | 15 | $ | — | $ | 22 | $ | — | ||||||||||
| Agricultural mortgage loans |
— | — | — | — | — | |||||||||||||||
|
|
|
|
|
|
|
|
|
|
|
|||||||||||
| Total |
$ | 15 | $ | 15 | $ | — | $ | 22 | $ | — | ||||||||||
|
|
|
|
|
|
|
|
|
|
|
|||||||||||
| With related allowance recorded: |
||||||||||||||||||||
| Commercial mortgage loans - other |
$ | 27 | $ | 27 | $ | (8 | ) | $ | 48 | $ | 2 | |||||||||
| Agricultural mortgage loans |
— | — | — | — | — | |||||||||||||||
|
|
|
|
|
|
|
|
|
|
|
|||||||||||
| Total |
$ | 27 | $ | 27 | $ | (8 | ) | $ | 48 | $ | 2 | |||||||||
|
|
|
|
|
|
|
|
|
|
|
|||||||||||
| (1) | Represents a five-quarter average of recorded amortized cost. |
Real Estate
In January 2016, the Company completed the sale of a property located at 787 7th Avenue, New York, New York for a price of $1.9 billion and realized a pre-tax gain of $1.4 billion in the consolidated statements of income (loss). In May 2016, the Company completed the sale of its 50% interest in a property located at 1285 Avenue of the Americas, New York, New York for a price of $825 million and realized a pre-tax gain of $457 million in the consolidated statements of income (loss). These investments were classified as Real estate held-for-sale in the consolidated balance sheets at December 31, 2015.
Equity Method Investments
Included in other equity investments are limited partnership interests accounted for under the equity method with a total carrying value of $1,114 million and $1,133 million, respectively, at December 31, 2017 and 2016. The Company’s total equity in Net income (loss) for these limited partnership interests was $154 million and $50 million, respectively, for 2017 and 2016.
Derivatives and Offsetting Assets and Liabilities
The Company uses derivatives as part of its overall asset/liability risk management primarily to reduce exposures to equity market and interest rate risks. Derivative hedging strategies are designed to reduce these risks from an economic perspective and are all executed within the framework of a “Derivative Use Plan”
F-43
Table of Contents
approved by applicable states’ insurance law. Derivatives are generally not accounted for using hedge accounting, with the exception of Treasury Inflation-Protected Securities (“TIPS”), which is discussed further below. Operation of these hedging programs is based on models involving numerous estimates and assumptions, including, among others, mortality, lapse, surrender and withdrawal rates, election rates, fund performance, market volatility and interest rates. A wide range of derivative contracts are used in these hedging programs, including exchange traded equity, currency and interest rate futures contracts, total return and/or other equity swaps, interest rate swap and floor contracts, bond and bond-index total return swaps, swaptions, variance swaps and equity options, credit and foreign exchange derivatives, as well as bond and repo transactions to support the hedging. The derivative contracts are collectively managed in an effort to reduce the economic impact of unfavorable changes in guaranteed benefits’ exposures attributable to movements in capital markets. In addition, as part of its hedging strategy, the Company targets an asset level for all variable annuity products at or above a CTE98 level under most economic scenarios (CTE is a statistical measure of tail risk which quantifies the total asset requirement to sustain a loss if an event outside a given probability level has occurred. CTE 98 denotes the financial resources a company would need to cover the average of the worst 2% of scenarios.)
Derivatives utilized to hedge exposure to Variable Annuities with Guarantee Features
The Company has issued and continues to offer variable annuity products with GMxB features. The risk associated with the GMDB feature is that under-performance of the financial markets could result in GMDB benefits, in the event of death, being higher than what accumulated policyholders’ account balances would support. The risk associated with the GMIB feature is that under-performance of the financial markets could result in the present value of GMIB, in the event of annuitization, being higher than what accumulated policyholders’ account balances would support, taking into account the relationship between current annuity purchase rates and the GMIB guaranteed annuity purchase rates. The risk associated with products that have a GMxB derivative features liability is that under-performance of the financial markets could result in the GMxB derivative features’ benefits being higher than what accumulated policyholders’ account balances would support.
For GMxB features, the Company retains certain risks including basis, credit spread and some volatility risk and risk associated with actual versus expected actuarial assumptions for mortality, lapse and surrender, withdrawal and policyholder election rates, among other things. The derivative contracts are managed to correlate with changes in the value of the GMxB features that result from financial markets movements. A portion of exposure to realized equity volatility is hedged using equity options and variance swaps and a portion of exposure to credit risk is hedged using total return swaps on fixed income indices. Additionally, the Company is party to total return swaps for which the reference U.S. Treasury securities are contemporaneously purchased from the market and sold to the swap counterparty. As these transactions result in a transfer of control of the U.S. Treasury securities to the swap counterparty, the Company derecognizes these securities with consequent gain or loss from the sale. The Company has also purchased reinsurance contracts to mitigate the risks associated with GMDB features and the impact of potential market fluctuations on future policyholder elections of GMIB features contained in certain annuity contracts issued by the Company.
Derivatives utilized to hedge crediting rate exposure on SCS, SIO, MSO and IUL products/investment options
The Company hedges crediting rates in the Structured Capital Strategies (“SCS”) variable annuity, Structured Investment Option in the EQUI-VEST variable annuity series (“SIO”), Market Stabilizer Option (“MSO”) in the variable life insurance products and Indexed Universal Life (“IUL”) insurance products. These products permit the contract owner to participate in the performance of an index, ETF or commodity price movement up to a cap for a set period of time. They also contain a protection feature, in which the Company will absorb, up to a certain percentage, the loss of value in an index, ETF or commodity price, which varies by product segment.
F-44
Table of Contents
In order to support the returns associated with these features, the Company enters into derivative contracts whose payouts, in combination with fixed income investments, emulate those of the index, ETF or commodity price, subject to caps and buffers without any basis risk due to market exposures, thereby substantially reducing any exposure to market-related earnings volatility.
Derivatives used for General Account Investment Portfolio
The Company maintains a strategy in its General Account investment portfolio to replicate the credit exposure of fixed maturity securities otherwise permissible for investment under its investment guidelines through the sale of credit default swaps (“CDSs”). Under the terms of these swaps, the Company receives quarterly fixed premiums that, together with any initial amount paid or received at trade inception, replicate the credit spread otherwise currently obtainable by purchasing the referenced entity’s bonds of similar maturity. These credit derivatives generally have remaining terms of five years or less and are recorded at fair value with changes in fair value, including the yield component that emerges from initial amounts paid or received, reported in Net investment income (loss). The Company manages its credit exposure taking into consideration both cash and derivatives based positions and selects the reference entities in its replicated credit exposures in a manner consistent with its selection of fixed maturities. In addition, the Company generally transacts the sale of CDSs in single name reference entities of investment grade credit quality and with counterparties subject to collateral posting requirements. If there is an event of default by the reference entity or other such credit event as defined under the terms of the swap contract, the Company is obligated to perform under the credit derivative and, at the counterparty’s option, either pay the referenced amount of the contract less an auction-determined recovery amount or pay the referenced amount of the contract and receive in return the defaulted or similar security of the reference entity for recovery by sale at the contract settlement auction. To date, there have been no events of default or circumstances indicative of a deterioration in the credit quality of the named referenced entities to require or suggest that the Company will have to perform under these CDSs. The maximum potential amount of future payments the Company could be required to make under these credit derivatives is limited to the par value of the referenced securities which is the dollar or euro-equivalent of the derivative notional amount. The Standard North American CDS Contract (“SNAC”) or Standard European Corporate Contract (“STEC”) under which the Company executes these CDS sales transactions does not contain recourse provisions for recovery of amounts paid under the credit derivative.
The Company purchased 30-year TIPS and other sovereign bonds, both inflation linked and non-inflation linked, as General Account investments and enters into asset or cross-currency basis swaps, to result in payment of the given bond’s coupons and principal at maturity in the bond’s specified currency to the swap counterparty in return for fixed dollar amounts. These swaps, when considered in combination with the bonds, together result in a net position that is intended to replicate a dollar-denominated fixed-coupon cash bond with a yield higher than a term-equivalent U.S. Treasury bond. At December 31, 2017 and 2016, respectively, the Company’s unrealized gains (losses) related to this program were $(86) million and $(97) million and reported in AOCI.
The Company implemented a strategy to hedge a portion of the credit exposure in its General Account investment portfolio by buying protection through a swap. These are swaps on the “super senior tranche” of the investment grade CDX index. Under the terms of these swaps, the Company pays quarterly fixed premiums that, together with any initial amount paid or received at trade inception, serve as premiums paid to hedge the risk arising from multiple defaults of bonds referenced in the CDX index. These credit derivatives have terms of five years or less and are recorded at fair value with changes in fair value, including the yield component that emerges from initial amounts paid or received, reported in Net derivative gains (losses).
In 2016, the Company implemented a program to mitigate its duration gap using total return swaps for which the reference U.S. Treasury securities are sold to the swap counterparty under arrangements economically similar to repurchase agreements. As these transactions result in a transfer of control of the U.S. Treasury securities to the swap counterparty, the Company derecognizes these securities with
F-45
Table of Contents
consequent gain or loss from the sale. Under this program, the Company derecognized approximately $3,905 million of U.S. Treasury securities for which the Company received proceeds of approximately $3,905 million at inception of the total return swap contract. Under the terms of these swaps, the Company retains ongoing exposure to the total returns of the underlying U.S. Treasury securities in exchange for a financing cost. At December 31, 2017, the aggregate fair value of U.S. Treasury securities derecognized under this program was approximately $3,796 million. Reported in Other invested assets in the Company’s balance sheet at December 31, 2017 is approximately $(23) million, representing the fair value of the total return swap contracts.
Derivatives used to hedge currency fluctuations on affiliated loans
The Company uses foreign exchange derivatives to reduce exposure to currency fluctuations that may arise from non-U.S.-dollar denominated financial instruments. The Company has currency swap contracts with AXA to hedge foreign exchange exposure from affiliated loans.
The tables below present quantitative disclosures about the Company’s derivative instruments, including those embedded in other contracts required to be accounted for as derivative instruments:
Derivative Instruments by Category
At or For the Year Ended December 31, 2017
| Fair Value | ||||||||||||||||
| Notional Amount |
Asset Derivatives |
Liability Derivatives |
Gains (Losses) Reported In Earnings (Loss) |
|||||||||||||
| (in millions) | ||||||||||||||||
| Freestanding Investment Derivatives: |
||||||||||||||||
| Equity contracts:(1) |
||||||||||||||||
| Futures |
$ | 6,716 | $ | 1 | $ | 2 | $ | (1,297 | ) | |||||||
| Swaps |
7,623 | 4 | 201 | (1,413 | ) | |||||||||||
| Options |
22,223 | 3,456 | 1,457 | 1,265 | ||||||||||||
| Interest rate contracts:(1) |
||||||||||||||||
| Floors |
||||||||||||||||
| Swaps |
26,769 | 604 | 193 | 863 | ||||||||||||
| Futures |
20,675 | — | — | 293 | ||||||||||||
| Credit contracts:(1) |
||||||||||||||||
| Credit default swaps |
2,131 | 35 | 3 | 19 | ||||||||||||
| Other freestanding contracts:(1) |
||||||||||||||||
| Foreign currency contracts |
1,423 | 19 | 10 | (39 | ) | |||||||||||
| Margin |
— | 24 | 4 | — | ||||||||||||
| Collateral paid |
— | 4 | — | — | ||||||||||||
| Collateral received |
— | — | 2,123 | — | ||||||||||||
| Embedded and Freestanding Insurance Derivatives: |
||||||||||||||||
| GMIB reinsurance contracts(6) |
— | 1,894 | — | 174 | ||||||||||||
| GMxB derivative features liability(3,6) |
— | — | 4,358 | 1,553 | ||||||||||||
| SCS, SIO, MSO and IUL indexed features liability(5,6) |
— | — | 1,786 | (1,190 | ) | |||||||||||
|
|
|
|||||||||||||||
| Net derivative investment (gains) loss |
228 | |||||||||||||||
|
|
|
|||||||||||||||
| Cross currency swaps (2,4) |
354 | 5 | — | 40 | ||||||||||||
|
|
|
|
|
|
|
|
|
|||||||||
| Balances, December 31, 2017 |
$ | 87,914 | $ | 6,046 | $ | 10,137 | $ | 268 | ||||||||
|
|
|
|
|
|
|
|
|
|||||||||
| (1) | Reported in Other invested assets in the consolidated balance sheets. |
| (2) | Reported in Other assets or Other liabilities in the consolidated balance sheets. |
| (3) | Reported in Future policy benefits and other policyholders’ liabilities in the consolidated balance sheets. |
F-46
Table of Contents
| (4) | Reported in Other income in the consolidated statement of income (loss). |
| (5) | SCS and SIO indexed features are reported in Policyholders’ account balances; MSO and IUL indexed features are reported in the Future policyholders’ benefits and other policyholders’ liabilities in the consolidated balance sheets. |
| (6) | Reported in Net derivative gains (losses) in the consolidated statements of income (loss). |
Derivative Instruments by Category
At or For the Year Ended December 31, 2016
| Fair Value | ||||||||||||||||
| Notional Amount |
Asset Derivatives |
Liability Derivatives |
Gains (Losses) Reported In Earnings (Loss) |
|||||||||||||
| (in millions) | ||||||||||||||||
| Freestanding Investment Derivatives: |
||||||||||||||||
| Equity contracts:(1) |
||||||||||||||||
| Futures |
$ | 9,131 | $ | 1 | $ | 1 | $ | (1,445 | ) | |||||||
| Swaps |
5,933 | 22 | 117 | (459 | ) | |||||||||||
| Options |
12,241 | 2,190 | 1,174 | 746 | ||||||||||||
| Interest rate contracts:(1) |
||||||||||||||||
| Floors |
1,500 | 11 | — | 4 | ||||||||||||
| Swaps |
26,133 | 514 | 1,443 | (198 | ) | |||||||||||
| Futures |
14,818 | — | — | 156 | ||||||||||||
| Credit contracts:(1) |
||||||||||||||||
| Credit default swaps |
2,757 | 20 | 15 | 15 | ||||||||||||
| Other freestanding contracts:(1) |
||||||||||||||||
| Foreign currency contracts |
730 | 52 | 6 | 45 | ||||||||||||
| Margin |
— | 121 | 6 | — | ||||||||||||
| Collateral |
— | 935 | 908 | — | ||||||||||||
| Embedded and Freestanding Insurance Derivatives: |
||||||||||||||||
| GMIB reinsurance contracts(6) |
— | 1,735 | — | (77 | ) | |||||||||||
| GMxB derivative features liability(3,6) |
— | — | 5,580 | 138 | ||||||||||||
| SCS, SIO, MSO and IUL indexed features liability(5, 6) |
— | — | 940 | (647 | ) | |||||||||||
|
|
|
|||||||||||||||
| Net derivative gains (loss) |
(1,722 | ) | ||||||||||||||
|
|
|
|||||||||||||||
| Cross currency swaps(2, 4) |
391 | — | 81 | (19 | ) | |||||||||||
|
|
|
|
|
|
|
|
|
|||||||||
| Balances, December 31, 2016 |
$ | 73,634 | $ | 5,601 | $ | 10,271 | $ | (1,741 | ) | |||||||
|
|
|
|
|
|
|
|
|
|||||||||
| (1) | Reported in Other invested assets in the consolidated balance sheets. |
| (2) | Reported in Other assets or Other liabilities in the consolidated balance sheets. |
| (3) | Reported in Future policy benefits and other policyholders’ liabilities in the consolidated balance sheets. |
| (4) | Reported in Other income in the consolidated statement of income (loss). |
| (5) | SCS and SIO indexed features are reported in Policyholders’ account balances; MSO and IUL indexed features are reported in the Future policyholders’ benefits and other policyholders’ liabilities in the consolidated balance sheets. |
| (6) | Reported in Net derivative gains (losses) in the consolidated statements of income (loss) |
For 2017, 2016 and 2015, respectively, Net derivative gains (losses) from derivatives included $(2,206) million, $(482) million and $(483) million of realized gains (losses) on contracts closed during those periods and $1,937 million, $(655) million and $(752) million of unrealized gains (losses) on derivative positions at each respective year end.
F-47
Table of Contents
Equity-Based and Treasury Futures Contracts Margin
All outstanding equity-based and treasury futures contracts at December 31, 2017 are exchange-traded and net settled daily in cash. At December 31, 2017, the Company had open exchange-traded futures positions on: (i) the S&P 500, Russell 2000 and Emerging Market indices, having initial margin requirements of $208 million, (ii) the 2-year, 5-year and 10-year U.S. Treasury Notes on U.S. Treasury bonds and ultra-long bonds, having initial margin requirements of $40 million and (iii) the Euro Stoxx, FTSE 100, Topix, ASX 200 and European, Australasia, and Far East (“EAFE”) indices as well as corresponding currency futures on the Euro/U.S. dollar, Pound/U.S. dollar, Australian dollar/U.S. dollar, and Yen/U.S. dollar, having initial margin requirements of $25 million.
Credit Risk
Although notional amount is the most commonly used measure of volume in the derivatives market, it is not used as a measure of credit risk. A derivative with positive fair value (a derivative asset) indicates existence of credit risk because the counterparty would owe money to the Company if the contract were closed at the reporting date. Alternatively, a derivative contract with negative fair value (a derivative liability) indicates the Company would owe money to the counterparty if the contract were closed at the reporting date. To reduce credit exposures in Over-the-Counter (“OTC”) derivative transactions, the Company generally enters into master agreements that provide for a netting of financial exposures with the counterparty and allow for collateral arrangements as further described below under “ISDA Master Agreements.” The Company further controls and minimizes its counterparty exposure through a credit appraisal and approval process.
ISDA Master Agreements
Netting Provisions. The standardized ISDA Master Agreement under which the Company conducts its OTC derivative transactions includes provisions for payment netting. In the normal course of business activities, if there is more than one derivative transaction with a single counterparty, the Company will set-off the cash flows of those derivatives into a single amount to be exchanged in settlement of the resulting net payable or receivable with that counterparty. In the event of default, insolvency, or other similar event pre-defined under the ISDA Master Agreement that would result in termination of OTC derivatives transactions before their maturity, netting procedures would be applied to calculate a single net payable or receivable with the counterparty.
Collateral Arrangements. The Company generally has executed a CSA under the ISDA Master Agreement, it maintains with each of its OTC derivative counterparties that requires both posting and accepting collateral either in the form of cash or high-quality securities, such as U.S. Treasury securities, U.S. government and government agency securities and investment grade corporate bonds. These CSAs are bilateral agreements that require collateral postings by the party “out-of-the-money” or in a net derivative liability position. Various thresholds for the amount and timing of collateralization of net liability positions are applicable. Consequently, the credit exposure of the Company’s OTC derivative contracts is limited to the net positive estimated fair value of those contracts at the reporting date after taking into consideration the existence of netting agreements and any collateral received pursuant to CSAs. Derivatives are recognized at fair value in the consolidated balance sheets and are reported either as assets in Other invested assets or as liabilities in Other liabilities, except for embedded insurance-related derivatives as described above and derivatives transacted with a related counterparty. The Company nets the fair value of all derivative financial instruments with counterparties for which an ISDA Master Agreement and related CSA have been executed.
At December 31, 2017 and 2016, respectively, the Company held $2,123 million and $740 million in cash and securities collateral delivered by trade counterparties, representing the fair value of the related derivative agreements. This unrestricted cash collateral is reported in Cash and cash equivalents. The aggregate fair value of all collateralized derivative transactions that were in a liability position with trade
F-48
Table of Contents
counterparties as of December 31, 2017 and 2016, respectively, were $2 million and $747 million, for which the Company posted collateral of $4 million and $868 million at December 31, 2017 and 2016, respectively, in the normal operation of its collateral arrangements. Certain of the Company’s ISDA Master Agreements contain contingent provisions that permit the counterparty to terminate the ISDA Master Agreement if the Company’s credit rating falls below a specified threshold, however, the occurrence of such credit event would not impose additional collateral requirements.
Margin
Effective January 3, 2017, the CME amended its rulebook, resulting in the characterization of variation margin transfers as settlement payments, as opposed to adjustments to collateral. These amendments impacted the accounting treatment of the Company’s centrally cleared derivatives for which the CME serves as the central clearing party. As of the effective date, the application of the amended rulebook reduced gross derivative assets by $18 million and gross derivative liabilities by $4 million.
Securities Repurchase and Reverse Repurchase Transactions
Securities repurchase and reverse repurchase transactions are conducted by the Company under a standardized securities industry master agreement, amended to suit the specificities of each respective counterparty. These agreements generally provide detail as to the nature of the transaction, including provisions for payment netting, establish parameters concerning the ownership and custody of the collateral securities, including the right to substitute collateral during the term of the agreement, and provide for remedies in the event of default by either party. Amounts due to/from the same counterparty under these arrangements generally would be netted in the event of default and subject to rights of set-off in bankruptcy. The Company’s securities repurchase and reverse repurchase agreements are accounted for as secured borrowing or lending arrangements, respectively and are reported in the consolidated balance sheets on a gross basis. The Company obtains or posts collateral generally in the form of cash and U.S. Treasury, corporate and government agency securities. The fair value of the securities to be repurchased or resold are monitored on a daily basis with additional collateral posted or obtained as necessary. Securities to be repurchased or resold are the same, or substantially the same, as those initially transacted under the arrangement. At December 31, 2017 and 2016, the balance outstanding under securities repurchase transactions was $1,887 million and $3,593 million, respectively. The Company utilized these repurchase and reverse repurchase agreements for asset liability and cash management purposes. For other instruments used for asset liability management purposes, see “Policyholders’ Account Balances and Future Policy Benefits” included in Note 2.
F-49
Table of Contents
The following table presents information about the Company’s offsetting of financial assets and liabilities and derivative instruments at December 31, 2017:
Offsetting of Financial Assets and Liabilities and Derivative Instruments
At December 31, 2017
| Gross Amounts Recognized |
Gross Amounts Offset in the Balance Sheets |
Net Amounts Presented in the Balance Sheets |
||||||||||
| (in millions) | ||||||||||||
| ASSETS(1) |
||||||||||||
| Derivatives: |
||||||||||||
| Equity contracts |
$ | 3,461 | $ | 1,660 | $ | 1,801 | ||||||
| Interest rate contracts |
604 | 193 | 411 | |||||||||
| Credit contracts |
35 | 3 | 32 | |||||||||
| Currency |
19 | 10 | 9 | |||||||||
| Collateral |
4 | 2,123 | (2,119 | ) | ||||||||
| Margin |
24 | 4 | 20 | |||||||||
|
|
|
|
|
|
|
|||||||
| Total Derivatives, subject to an ISDA Master Agreement |
4,147 | 3,993 | 154 | |||||||||
| Total Derivatives |
4,147 | 3,993 | 154 | |||||||||
| Other financial instruments |
3,964 | 3,964 | ||||||||||
|
|
|
|
|
|
|
|||||||
| Other invested assets |
$ | 8,111 | $ | 3,993 | $ | 4,118 | ||||||
|
|
|
|
|
|
|
|||||||
| Total Derivatives, not subject to an ISDA Master Agreement(4) |
5 | — | 5 | |||||||||
|
|
|
|
|
|
|
|||||||
| Securities purchased under agreement to resell |
$ | — | — | $ | — | |||||||
|
|
|
|
|
|
|
|||||||
| LIABILITIES(2) |
||||||||||||
| Derivatives: |
||||||||||||
| Equity contracts |
$ | 1,660 | $ | 1,660 | $ | — | ||||||
| Interest rate contracts |
193 | 193 | — | |||||||||
| Credit contracts |
3 | 3 | — | |||||||||
| Currency |
10 | 10 | — | |||||||||
| Collateral |
2,123 | 2,123 | — | |||||||||
| Margin |
4 | 4 | — | |||||||||
|
|
|
|
|
|
|
|||||||
| Total Derivatives, subject to an ISDA Master Agreement |
3,993 | 3,993 | — | |||||||||
| Total Derivatives, not subject to an ISDA Master Agreement |
— | — | — | |||||||||
|
|
|
|
|
|
|
|||||||
| Total Derivatives |
3,993 | 3,993 | — | |||||||||
| Other non-financial liabilities |
4,053 | 4,053 | ||||||||||
|
|
|
|
|
|
|
|||||||
| Other liabilities |
$ | 8,046 | $ | 3,993 | $ | 4,053 | ||||||
|
|
|
|
|
|
|
|||||||
| Securities sold under agreement to repurchase(3) |
$ | 1,882 | — | $ | 1,882 | |||||||
|
|
|
|
|
|
|
|||||||
| (1) | Excludes Investment Management and Research segment’s derivative assets of consolidated VIEs/VOEs. |
| (2) | Excludes Investment Management and Research segment’s derivative liabilities of consolidated VIEs/VOEs. |
| (3) | Excludes expense of $5 million in securities sold under agreement to repurchase. |
| (4) | This amount is reflected in Other assets. |
F-50
Table of Contents
The following table presents information about the Company’s gross collateral amounts that are offset in the consolidated balance sheets at December 31, 2017:
Collateral Amounts Offset in the Consolidated Balance Sheets
At December 31, 2017
| Fair Value of Assets |
Collateral (Received)/Paid | |||||||||||||||
| Financial Instruments |
Cash | Net Amounts |
||||||||||||||
| (in millions) | ||||||||||||||||
| Assets(1) |
||||||||||||||||
| Total Derivatives |
$ | 2,253 | $ | — | $ | (2,099 | ) | $ | 154 | |||||||
| Other financial instruments |
3,964 | — | — | 3,964 | ||||||||||||
|
|
|
|
|
|
|
|
|
|||||||||
| Other invested assets |
$ | 6,217 | $ | — | $ | (2,099 | ) | $ | 4,118 | |||||||
|
|
|
|
|
|
|
|
|
|||||||||
| Liabilities:(2) |
$ | — | ||||||||||||||
| Other Derivatives |
$ | — | $ | — | $ | — | $ | — | ||||||||
| Other financial liabilities |
4,053 | — | — | 4,053 | ||||||||||||
|
|
|
|
|
|
|
|
|
|||||||||
| Other liabilities |
$ | 4,053 | $ | — | $ | — | $ | 4,053 | ||||||||
|
|
|
|
|
|
|
|
|
|||||||||
| Securities sold under agreement to repurchase(3)(4)(5) |
$ | 1,882 | $ | (1,988 | ) | $ | (21 | ) | $ | (127 | ) | |||||
| (1) | Excludes Investment Management and Research segment’s derivative assets of consolidated VIEs/VOEs. |
| (2) | Excludes Investment Management and Research segment’s derivative liabilities of consolidated VIEs/VOEs. |
| (3) | Excludes expense of $5 million in securities sold under agreement to repurchase. |
| (4) | US Treasury and agency securities are in fixed maturities available for sale on consolidated balance sheet. |
| (5) | Cash is in cash and cash equivalent on consolidated balance sheet. |
The following table presents information about repurchase agreements accounted for as secured borrowings in the consolidated balance sheets at December 31, 2017:
Repurchase Agreement Accounted for as Secured Borrowings
| At December 31, 2017 | ||||||||||||||||||||
| Remaining Contractual Maturity of the Agreements | ||||||||||||||||||||
| Overnight and Continuous |
Up to 30 days |
30-90 days |
Greater Than 90 days |
Total | ||||||||||||||||
| (in millions) | ||||||||||||||||||||
| Securities sold under agreement to repurchase(1) |
||||||||||||||||||||
| U.S. Treasury and agency securities |
$ | — | $ | 1,882 | $ |
— |
$ | — | $ | 1,882 | ||||||||||
|
|
|
|
|
|
|
|
|
|
|
|||||||||||
| Total |
$ | — | $ | 1,882 | $ |
— |
$ | — | $ | 1,882 | ||||||||||
|
|
|
|
|
|
|
|
|
|
|
|||||||||||
| (1) | Excludes expense of $5 million in securities sold under agreement to repurchase. |
F-51
Table of Contents
The following table presents information about the General Account’s offsetting of financial assets and liabilities and derivative instruments at December 31, 2016:
Offsetting of Financial Assets and Liabilities and Derivative Instruments
At December 31, 2016
| Gross Amounts Recognized |
Gross Amounts Offset in the Balance Sheets |
Net Amounts Presented in the Balance Sheets |
||||||||||
| (in millions) | ||||||||||||
| Assets(1) |
||||||||||||
| Derivatives: |
||||||||||||
| Equity contracts |
$ | 2,214 | $ | 1,292 | $ | 922 | ||||||
| Interest rate contracts |
521 | 1,443 | (922 | ) | ||||||||
| Credit contracts |
20 | 15 | 5 | |||||||||
| Currency |
52 | 6 | 46 | |||||||||
| Collateral |
935 | 908 | 27 | |||||||||
| Margin |
121 | 6 | 115 | |||||||||
|
|
|
|
|
|
|
|||||||
| Total Derivatives, subject to an ISDA Master Agreement |
3,863 | 3,670 | 193 | |||||||||
| Total Derivatives, not subject to an ISDA Master Agreement |
4 | — | 4 | |||||||||
|
|
|
|
|
|
|
|||||||
| Total Derivatives |
3,867 | 3,670 | 197 | |||||||||
| Other financial instruments |
3,127 | — | 3,127 | |||||||||
|
|
|
|
|
|
|
|||||||
| Other invested assets |
$ | 6,994 | $ | 3,670 | $ | 3,324 | ||||||
|
|
|
|
|
|
|
|||||||
| Securities purchased under agreement to resell |
$ | — | $ | — | $ | — | ||||||
|
|
|
|
|
|
|
|||||||
| Gross Amounts Recognized |
Gross Amounts Offset in the Balance Sheets |
Net Amounts Presented in the Balance Sheets |
||||||||||
| (in millions) | ||||||||||||
| Liabilities(2) |
||||||||||||
| Derivatives: |
||||||||||||
| Equity contracts |
$ | 1,292 | $ | 1,292 | $ | — | ||||||
| Interest rate contracts |
1,443 | 1,443 | — | |||||||||
| Credit contracts |
15 | 15 | — | |||||||||
| Currency |
6 | 6 | — | |||||||||
| Collateral |
908 | 908 | — | |||||||||
| Margin |
6 | 6 | — | |||||||||
|
|
|
|
|
|
|
|||||||
| Total Derivatives, subject to an ISDA Master Agreement |
3,670 | 3,670 | — | |||||||||
| Total Derivatives, not subject to an ISDA Master Agreement |
81 | — | 81 | |||||||||
|
|
|
|
|
|
|
|||||||
| Total Derivatives |
3,751 | 3,670 | 81 | |||||||||
| Other non-financial liabilities |
3,639 | — | 3,639 | |||||||||
|
|
|
|
|
|
|
|||||||
| Other liabilities |
7,390 | 3,670 | 3,720 | |||||||||
|
|
|
|
|
|
|
|||||||
| Securities sold under agreement to repurchase(3) |
$ | 3,586 | $ | — | $ | 3,586 | ||||||
|
|
|
|
|
|
|
|||||||
| (1) | Excludes Investment Management and Research segment’s derivative assets of consolidated VIEs/VOEs. |
| (2) | Excludes Investment Management and Research segment’s derivative liabilities of consolidated VIEs/VOEs. |
| (3) | Excludes expense of $7 million in securities sold under agreement to repurchase. |
F-52
Table of Contents
The following table presents information about the General Account’s gross collateral amounts that are offset in the consolidated balance sheets at December 31, 2016:
Collateral Amounts Offset in the Consolidated Balance Sheets
At December 31, 2016
| Fair Value of Assets | Collateral (Received)/Paid | |||||||||||||||
| Financial Instruments |
Cash | Net Amounts |
||||||||||||||
| (in millions) | ||||||||||||||||
| Assets(1) |
||||||||||||||||
| Total Derivatives |
$ | 56 | $ | (6 | ) | $ | 141 | $ | 191 | |||||||
| Other financial instruments |
3,127 | — | — | 3,127 | ||||||||||||
|
|
|
|
|
|
|
|
|
|||||||||
| Other invested assets |
$ | 3,183 | $ | (6 | ) | $ | 141 | 3,318 | ||||||||
|
|
|
|
|
|
|
|
|
|||||||||
| Securities sold under agreement to resell |
$ | 79 | $ | (79 | ) | $ | — | $ | — | |||||||
|
|
|
|
|
|
|
|
|
|||||||||
| Liabilities(2) |
$ | — | ||||||||||||||
| Other Derivatives |
$ | 81 | $ | — | $ | — | $ | 81 | ||||||||
| Other financial liabilities |
$ | 3,639 | $ | — | $ | — | $ | 3,639 | ||||||||
|
|
|
|
|
|
|
|
|
|||||||||
| Other liabilities |
$ | 3,720 | $ | — | $ | — | $ | 3,720 | ||||||||
|
|
|
|
|
|
|
|
|
|||||||||
| Securities sold under agreement to repurchase(3)(4)(5) |
$ | 3,586 | $ | (3,467 | ) | $ | (115 | ) | $ | 4 | ||||||
|
|
|
|
|
|
|
|
|
|||||||||
| (1) | Excludes Investment Management and Research segment’s derivative assets of consolidated VIEs/VOEs. |
| (2) | Excludes Investment Management and Research segment’s derivative liabilities of consolidated VIEs/VOEs. |
| (3) | Excludes expense of $7 million in securities sold under agreement to repurchase. |
| (4) | US Treasury and agency securities are in fixed maturities available for sale and trading securities on consolidated balance sheet. |
| (5) | Cash is in cash and cash equivalent on consolidated balance sheet. |
The following table presents information about repurchase agreements accounted for as secured borrowings in the consolidated balance sheets at December 31, 2016.
Repurchase Agreement Accounted for as Secured Borrowings
At December 31, 2016
| Remaining Contractual Maturity of the Agreements | ||||||||||||||||||||
| Overnight and Continuous |
Up to 30 days |
30-90 days |
Greater Than 90 days |
Total | ||||||||||||||||
| (in millions) | ||||||||||||||||||||
| Securities sold under agreement to repurchase |
||||||||||||||||||||
| U.S. Treasury and agency securities |
$ | — | $ | 3,586 | $ | — | $ | — | $ | 3,586 | ||||||||||
|
|
|
|
|
|
|
|
|
|
|
|||||||||||
| Total |
$ | — | $ | 3,586 | $ | — | $ | — | $ | 3,586 | ||||||||||
|
|
|
|
|
|
|
|
|
|
|
|||||||||||
| Securities purchased under agreement to resell |
||||||||||||||||||||
| Corporate securities |
$ | — | ||||||||||||||||||
|
|
|
|
|
|
|
|
|
|
|
|||||||||||
| Total |
$ | — | $ | — | $ | — | $ | — | $ | — | ||||||||||
|
|
|
|
|
|
|
|
|
|
|
|||||||||||
F-53
Table of Contents
Net Investment Income (Loss)
The following table breaks out Net investment income (loss) by asset category:
| Years Ended December 31, | ||||||||||||
| 2017 | 2016 | 2015 | ||||||||||
| (in millions) | ||||||||||||
| Fixed maturities |
$ | 1,629 | $ | 1,723 | $ | 1,717 | ||||||
| Mortgage loans on real estate |
454 | 397 | 339 | |||||||||
| Real estate held for the production of income |
2 | 19 | 164 | |||||||||
| Other equity investments |
186 | 168 | 84 | |||||||||
| Policy loans |
221 | 225 | 228 | |||||||||
| Repurchase agreements |
— | 1 | 1 | |||||||||
| Trading securities |
553 | 144 | 21 | |||||||||
| Other investment income |
109 | 67 | 35 | |||||||||
|
|
|
|
|
|
|
|||||||
| Gross investment income (loss) |
3,154 | 2,744 | 2,589 | |||||||||
| Investment expenses (1) |
(72 | ) | (79 | ) | (139 | ) | ||||||
|
|
|
|
|
|
|
|||||||
| Net Investment Income (Loss) |
$ | 3,082 | $ | 2,665 | $ | 2,450 | ||||||
|
|
|
|
|
|
|
|||||||
| (1) | Investment expenses includes expenses related to the management of the two buildings sold in 2016. |
Net unrealized and realized gains (losses) on trading account equity securities are included in Net investment income (loss) in the consolidated statements of income (loss). The table below shows a breakdown of Net investment income from trading account securities during the year ended 2017, 2016 and 2015:
Net Investment Income (Loss) from Trading Securities
| Years Ended December, 31 | ||||||||||||
| 2017 | 2016 | 2015 | ||||||||||
| (in millions) | ||||||||||||
| Net investment gains (losses) recognized during the period on securities held at the end of the period |
$ | 247 | $ | (51 | ) | $ | (209 | ) | ||||
| Net investment gains (losses) recognized on securities sold during the period |
19 | (12 | ) | 81 | ||||||||
|
|
|
|
|
|
|
|||||||
| Unrealized and realized gains (losses) on trading securities |
266 | (63 | ) | (128 | ) | |||||||
| Interest and dividend income from trading securities |
287 | 207 | 149 | |||||||||
|
|
|
|
|
|
|
|||||||
| Net investment income (loss) from trading securities |
$ | 553 | $ | 144 | $ | 21 | ||||||
|
|
|
|
|
|
|
|||||||
Investment Gains (Losses), Net
Investment gains (losses), net including changes in the valuation allowances and OTTI are as follows:
| Years Ended December, 31 | ||||||||||||
| 2017 | 2016 | 2015 | ||||||||||
| (in millions) | ||||||||||||
| Fixed maturities |
$ | (194 | ) | $ | 83 | $ | (8 | ) | ||||
| Mortgage loans on real estate |
2 | (2 | ) | (1 | ) | |||||||
| Real estate held for the production of income (1) |
— | 1,880 | — | |||||||||
| Other equity investments |
2 | (2 | ) | (5 | ) | |||||||
| Other |
(1 | ) | 24 | (1 | ) | |||||||
|
|
|
|
|
|
|
|||||||
| Investment Gains (Losses), Net |
$ | (191 | ) | $ | 1,983 | $ | (15 | ) | ||||
|
|
|
|
|
|
|
|||||||
F-54
Table of Contents
| (1) | See “Real Estate” within this note for more information on realized gain on sale of real estate. |
For 2017, 2016 and 2015, respectively, investment results passed through to certain participating group annuity contracts as interest credited to policyholders’ account balances totaled $3 million, $4 million and $4 million.
| 4) | GOODWILL AND OTHER INTANGIBLE ASSETS |
Goodwill represents the excess of purchase price over the estimated fair value of identifiable net assets acquired in a business combination. The Company tests goodwill for recoverability each annual reporting period at December 31 and at interim periods if facts or circumstances are indicative of potential impairment. The Company managed its business under two operating segments through third quarter 2017, each deemed to be reporting units for purpose of its goodwill impairment assessments. Effective January 1, 2017, the Company early adopted the new goodwill guidance that eliminates Step 2 from the impairment model and continues to limit the measure of goodwill impairment to the carrying amount of the reporting unit’s goodwill. As a result, the Company recognized an impairment loss of $369 million during first quarter 2017, representing all of the goodwill assigned to its Financial Advisory/Insurance reporting unit for which recoverability previously had been supported by a Step 2 assessment.
The carrying value of goodwill assigned to the Company’s Investment Management reporting unit totaled $4,570 million and $4,570 million at December 31, 2017 and 2016, respectively, resulting from its investment in AB as well as direct strategic acquisitions of AB, including its purchase of Sanford C. Bernstein, Inc. For purpose of testing this goodwill for impairment, the Company applied a discounted cash flow valuation technique to measure the fair value of the reporting unit, sourcing the underlying cash flows and assumptions from AB’s current business plan projections and adjusting the result to reflect the noncontrolling interest in AB as well as incremental taxes at the Company level as related to the form and structure of its investment in AB. At December 31, 2017 and 2016, the Company’s annual testing resulted in no impairment of this goodwill as the fair value of the reporting unit exceeded its carrying amount at each respective date.
In fourth quarter 2017, the Company recast its Financial Advisory/Insurance segment into multiple operating segments as described in Note 18, Business Segment Information. Accordingly, goodwill previously attributed to the Financial Advisory/Insurance segment in reporting periods prior thereto was reassigned to the reporting units affected using a relative fair value allocation approach in accordance with the relevant accounting guidance. Goodwill resulting from the Company’s investment in AB was reassigned to the Company’s Investment Management and Research segment and the resulting reporting unit redefined. Immediately prior thereto, the Company determined there were no indications of potential goodwill impairment that would require quantitative assessment prior to its annual testing at December 31, 2017.
F-55
Table of Contents
Information regarding goodwill by reporting segment and Corporate and Other is as follows:
| Individual Retirement |
Group Retirement |
Protection Solutions |
Corporate and Other |
Subtotal | Investment Management and Research |
Total | ||||||||||||||||||||||
| (in millions) | ||||||||||||||||||||||||||||
| Balance at January 1, 2015 |
||||||||||||||||||||||||||||
| Goodwill |
$ | 53 | $ | 122 | $ | 139 | $ | 55 | $ | 369 | $ | 4,548 | $ | 4,917 | ||||||||||||||
| Accumulated impairment losses |
— | — | — | — | — | — | — | |||||||||||||||||||||
|
|
|
|
|
|
|
|
|
|
|
|
|
|
|
|||||||||||||||
| Total goodwill, net |
$ | 53 | $ | 122 | $ | 139 | $ | 55 | $ | 369 | $ | 4,548 | $ | 4,917 | ||||||||||||||
|
|
|
|
|
|
|
|
|
|
|
|
|
|
|
|||||||||||||||
| Goodwill acquired during year |
— | — | — | — | — | — | $ | — | ||||||||||||||||||||
| Impairment losses recognized during year |
— | — | — | — | — | — | — | |||||||||||||||||||||
| Balance at December 31, 2015 |
||||||||||||||||||||||||||||
| Goodwill |
$ | 53 | $ | 122 | $ | 139 | $ | 55 | $ | 369 | $ | 4,548 | $ | 4,917 | ||||||||||||||
| Accumulated impairment losses |
— | — | — | — | — | — | — | |||||||||||||||||||||
|
|
|
|
|
|
|
|
|
|
|
|
|
|
|
|||||||||||||||
| Total goodwill, net |
$ | 53 | $ | 122 | $ | 139 | $ | 55 | $ | 369 | $ | 4,548 | $ | 4,917 | ||||||||||||||
|
|
|
|
|
|
|
|
|
|
|
|
|
|
|
|||||||||||||||
| Goodwill acquired during year |
— | — | — | — | — | 22 | 22 | |||||||||||||||||||||
| Impairment losses recognized during year |
— | — | — | — | — | — | — | |||||||||||||||||||||
| Balance at December 31, 2016 |
||||||||||||||||||||||||||||
| Goodwill |
$ | 53 | $ | 122 | $ | 139 | $ | 55 | $ | 369 | $ | 4,570 | $ | 4,939 | ||||||||||||||
| Accumulated impairment losses |
— | — | — | — | — | — | — | |||||||||||||||||||||
|
|
|
|
|
|
|
|
|
|
|
|
|
|
|
|||||||||||||||
| Total goodwill, net |
$ | 53 | $ | 122 | $ | 139 | $ | 55 | $ | 369 | $ | 4,570 | $ | 4,939 | ||||||||||||||
|
|
|
|
|
|
|
|
|
|
|
|
|
|
|
|||||||||||||||
| Goodwill acquired during year |
— | — | — | — | — | — | — | |||||||||||||||||||||
| Impairment losses recognized during year |
$ | (53 | ) | (122 | ) | (139 | ) | (55 | ) | (369 | ) | — | (369 | ) | ||||||||||||||
| Balance at December 31, 2017 |
||||||||||||||||||||||||||||
| Goodwill |
$ | 53 | $ | 122 | $ | 139 | $ | 55 | $ | 369 | $ | 4,570 | $ | 4,939 | ||||||||||||||
| Accumulated impairment losses |
(53 | ) | (122 | ) | (139 | ) | (55 | ) | (369 | ) | — | (369 | ) | |||||||||||||||
|
|
|
|
|
|
|
|
|
|
|
|
|
|
|
|||||||||||||||
| Total goodwill, net |
$ | — | $ | — | $ | — | $ | — | $ | — | $ | 4,570 | $ | 4,570 | ||||||||||||||
|
|
|
|
|
|
|
|
|
|
|
|
|
|
|
|||||||||||||||
The Company has certain intangible assets recorded in other assets related to the acquisition of MONY Life. At December 31, 2017 and 2016, the gross carrying amount was $449 million and $449 million and accumulated amortization was $438 million and $436 million, respectively. For 2017, 2016 and 2015, total amortization expense related to these intangible assets was $2 million, $12 million and $3 million respectively. Intangible assets amortization expense is estimated to range from $1 million to $2 million through 2022.
At December 31, 2017 and 2016, respectively, net deferred sales commissions from AB totaled $30 million and $64 million and are included within other assets. The estimated amortization expense of deferred sales commissions, based on the December 31, 2017 net asset balance for each of the next five years is $21 million, $6 million, $3 million, $0 million and $0 million. The Company tests the deferred sales commission asset for impairment quarterly by comparing undiscounted future cash flows to the recorded value, net of accumulated amortization. Each quarter, significant assumptions used to estimate the future cash flows are updated to reflect management’s consideration of current market conditions on expectations made with respect to future market levels and redemption rates. As of December 31, 2017 and 2016, the Company determined that the deferred sales commission asset was not impaired.
F-56
Table of Contents
The gross carrying amount of AB related intangible assets was $909 million and $911 million at December 31, 2017 and 2016, respectively and the accumulated amortization of these intangible assets was $659 million and $617 million at December 31, 2017 and 2016, respectively. Amortization expense for AB-related intangible assets totaled $44 million, $42 million and $41 million for 2017, 2016 and 2015, respectively. Estimated annual amortization expense for each of the next two years is approximately $43 million, then approximately $36 million in year three and $20 million in years four and five.
On September 23, 2016, AB acquired a 100% ownership interest in Ramius Alternative Solutions LLC (“RASL”), a global alternative investment management business that, as of the acquisition date, had approximately $2.5 billion in AUM. RASL offers a range of customized alternative investment and advisory solutions to a global institutional client base. On the acquisition date, AB made a cash payment of $21 million and recorded a contingent consideration payable of $12 million based on projected fee revenues over a five-year measurement period. Goodwill in the amount of $22 million and finite-lived intangible assets of $10 million related to investment management contracts also were recognized at the date of acquisition.
On June 20, 2014, AB acquired an 81.7% ownership interest in CPH Capital Fondsmaeglerselskab A/S (“CPH”), a Danish asset management firm that managed approximately $3,000 million in global core equity assets for institutional investors, for a cash payment of $64 million and a contingent consideration payable of $9 million based on projected assets under management levels over a three-year measurement period. Also recognized on the date of acquisition were $58 million of goodwill, $24 million of finite-lived intangible assets related to separately-managed account relationships, and $4 million of indefinite-lived intangible assets related to an acquired fund’s investment contract. Redeemable noncontrolling interest of $17 million was recorded as related to the fair value of CPH not purchased by AB. During 2016 and 2017, AB purchased additional shares of CPH, bringing its ownership interest to 93.6% as of December 31, 2017.
The acquisitions described above did not have a significant impact on the Company’s consolidated revenues or net income. As a result, supplemental pro forma information has not been provided. Additional information regarding the contingent payment obligations associated with these and other acquisitions made by AB is included in Note 7, Fair Value Disclosures.
Capitalized Software
Capitalized software, net of accumulated amortization, amounted to $162 million and $170 million at December 31, 2017 and 2016, respectively, and is recorded in other assets. Amortization of capitalized software in 2017 and 2016 was $51 million and $56 million, respectively, recorded in other operating costs and expenses in the Consolidated Statements of Income (loss).
F-57
Table of Contents
| 5) | CLOSED BLOCK |
Summarized financial information for the Company’s Closed Block is as follows:
| December 31, | ||||||||
| 2017 | 2016 | |||||||
| (in millions) | ||||||||
| Closed Block Liabilities: |
||||||||
| Future policy benefits, policyholders’ account balances and other |
$ | 6,945 | $ | 7,179 | ||||
| Policyholder dividend obligation |
32 | 52 | ||||||
| Other liabilities |
271 | 43 | ||||||
|
|
|
|
|
|||||
| Total Closed Block liabilities |
7,248 | 7,274 | ||||||
|
|
|
|
|
|||||
| Assets Designated To The Closed Block: |
||||||||
| Fixed maturities, available for sale, at fair value (amortized cost of $3,923 and $3,884) |
4,070 | 4,025 | ||||||
| Mortgage loans on real estate |
1,720 | 1,623 | ||||||
| Policy loans |
781 | 839 | ||||||
| Cash and other invested assets |
351 | 444 | ||||||
| Other assets |
219 | 213 | ||||||
|
|
|
|
|
|||||
| Total assets designated to the Closed Block |
7,141 | 7,144 | ||||||
|
|
|
|
|
|||||
| Excess of Closed Block liabilities over assets designated to the Closed Block |
107 | 130 | ||||||
| Amounts included in accumulated other comprehensive income (loss): |
||||||||
| Net unrealized investment gains (losses), net of policyholder dividend obligation of $19 and $52 |
138 | 100 | ||||||
|
|
|
|
|
|||||
| Maximum Future Earnings To Be Recognized From Closed Block Assets and Liabilities |
$ | 245 | $ | 230 | ||||
|
|
|
|
|
|||||
The Company’s Closed Block revenues and expenses follow:
| Years Ended December 31, | ||||||||||||
| 2017 | 2016 | 2015 | ||||||||||
| (in millions) | ||||||||||||
| Revenues: |
||||||||||||
| Premiums and other income |
$ | 224 | $ | 212 | $ | 236 | ||||||
| Investment income (loss) |
314 | 349 | 368 | |||||||||
| Net investment gains (losses) |
(20 | ) | (1 | ) | 2 | |||||||
|
|
|
|
|
|
|
|||||||
| Total revenues |
518 | 560 | 606 | |||||||||
|
|
|
|
|
|
|
|||||||
| Benefits and Other Deductions: |
||||||||||||
| Policyholders’ benefits and dividends |
537 | 522 | 550 | |||||||||
| Other operating costs and expenses |
2 | 4 | 4 | |||||||||
|
|
|
|
|
|
|
|||||||
| Total benefits and other deductions |
539 | 526 | 554 | |||||||||
|
|
|
|
|
|
|
|||||||
| Net income, before income taxes |
(21 | ) | 34 | 52 | ||||||||
| Income tax (expense) benefit |
6 | (12 | ) | (18 | ) | |||||||
|
|
|
|
|
|
|
|||||||
| Net income (losses) |
$ | (15 | ) | $ | 22 | $ | 34 | |||||
|
|
|
|
|
|
|
|||||||
F-58
Table of Contents
A reconciliation of the Company’s policyholder dividend obligation follows:
| December 31, | ||||||||
| 2017 | 2016 | |||||||
| (in millions) | ||||||||
| Balance, beginning of year |
$ | 52 | $ | 81 | ||||
| Unrealized investment gains (losses) |
(20 | ) | (29 | ) | ||||
|
|
|
|
|
|||||
| Balance, end of year |
$ | 32 | $ | 52 | ||||
|
|
|
|
|
|||||
| 6) | DAC AND POLICYHOLDER BONUS INTEREST CREDITS |
Changes in deferred acquisition costs at December 31, 2017 and 2016 were as follows:
| December 31, | ||||||||
| 2017 | 2016 | |||||||
| (in millions) | ||||||||
| Balance, beginning of year |
$ | 6,044 | $ | 6,049 | ||||
| Capitalization of commissions, sales and issue expenses |
687 | 697 | ||||||
| Amortization |
(448 | ) | (786 | ) | ||||
| Change in unrealized investment gains and losses |
(314 | ) | 84 | |||||
|
|
|
|
|
|||||
| Balance, end of year |
$ | 5,969 | $ | 6,044 | ||||
|
|
|
|
|
|||||
The components of Amortization of deferred policy acquisition costs, net as presented in the income statement are as follows:
| December 31, | ||||||||||||
| 2017 | 2016 | 2015 | ||||||||||
| (in millions) | ||||||||||||
| Commissions and distribution related payments |
$ | 523 | $ | 536 | $ | 559 | ||||||
| Compensation and benefits |
156 | 154 | 157 | |||||||||
| Other operating costs and expenses |
8 | 7 | 7 | |||||||||
|
|
|
|
|
|
|
|||||||
| Capitalization of commissions, sales and issue expenses |
687 | 697 | 723 | |||||||||
|
|
|
|
|
|
|
|||||||
| Amortization |
(448 | ) | (786 | ) | (438 | ) | ||||||
|
|
|
|
|
|
|
|||||||
| Amortization of deferred policy acquisition costs, net |
239 | (89 | ) | 285 | ||||||||
|
|
|
|
|
|
|
|||||||
Changes in the deferred asset for policyholder bonus interest credits are as follows:
| December 31, | ||||||||
| 2017 | 2016 | |||||||
| (in millions) | ||||||||
| Balance, beginning of year |
$ | 504 | $ | 534 | ||||
| Policyholder bonus interest credits deferred |
7 | 13 | ||||||
| Amortization charged to income |
(38 | ) | (43 | ) | ||||
|
|
|
|
|
|||||
| Balance, end of year |
$ | 473 | $ | 504 | ||||
|
|
|
|
|
|||||
| 7) | FAIR VALUE DISCLOSURES |
Assets and liabilities measured at fair value on a recurring basis are summarized below. At December 31, 2017 and 2016, no assets were required to be measured at fair value on a non-recurring basis. Fair value measurements are required on a non-recurring basis for certain assets, including goodwill, mortgage loans on real estate and real estate held for sale, only when an OTTI or other event occurs. When such fair value measurements are recorded, they are classified and disclosed within the fair value hierarchy. The Company recognizes transfers between valuation levels at the beginning of the reporting period.
F-59
Table of Contents
Fair Value Measurements at December 31, 2017
| Level 1 | Level 2 | Level 3 | Total | |||||||||||||
| (in millions) | ||||||||||||||||
| Assets |
||||||||||||||||
| Investments |
||||||||||||||||
| Fixed maturities, available-for-sale: |
||||||||||||||||
| Public Corporate |
$ | — | $ | 17,906 | $ | 48 | $ | 17,954 | ||||||||
| Private Corporate |
— | 6,390 | 1,102 | 7,492 | ||||||||||||
| U.S. Treasury, government and agency |
— | 18,508 | — | 18,508 | ||||||||||||
| States and political subdivisions |
— | 449 | 40 | 489 | ||||||||||||
| Foreign governments |
— | 419 | — | 419 | ||||||||||||
| Commercial mortgage-backed |
— | — | — | — | ||||||||||||
| Residential mortgage-backed(1) |
— | 818 | — | 818 | ||||||||||||
| Asset-backed(2) |
— | 208 | 541 | 749 | ||||||||||||
| Redeemable preferred stock |
184 | 327 | 1 | 512 | ||||||||||||
|
|
|
|
|
|
|
|
|
|||||||||
| Subtotal |
184 | 45,025 | 1,732 | 46,941 | ||||||||||||
|
|
|
|
|
|
|
|
|
|||||||||
| Other equity investments |
13 | — | 34 | 47 | ||||||||||||
| Trading securities |
485 | 13,647 | 38 | 14,170 | ||||||||||||
| Other invested assets |
||||||||||||||||
| Short-term investments |
— | 1,730 | — | 1,730 | ||||||||||||
| Assets of consolidated VIEs/VOEs |
1,060 | 215 | 27 | 1,302 | ||||||||||||
| Swaps |
— | 222 | — | 222 | ||||||||||||
| Credit Default Swaps |
— | 33 | — | 33 | ||||||||||||
| Futures |
(2 | ) | — | — | (2 | ) | ||||||||||
| Foreign currency contract(3) |
— | 5 | — | 5 | ||||||||||||
| Options |
— | 1,999 | — | 1,999 | ||||||||||||
|
|
|
|
|
|
|
|
|
|||||||||
| Subtotal |
1,058 | 4,204 | 27 | 5,289 | ||||||||||||
|
|
|
|
|
|
|
|
|
|||||||||
| Cash equivalents |
3,608 | — | — | 3,608 | ||||||||||||
| Segregated securities |
— | 825 | — | 825 | ||||||||||||
| GMIB reinsurance contracts asset |
— | — | 1,894 | 1,894 | ||||||||||||
| Separate Account assets |
121,000 | 2,997 | 349 | 124,346 | ||||||||||||
|
|
|
|
|
|
|
|
|
|||||||||
| Total Assets |
$ | 126,348 | $ | 66,698 | $ | 4,074 | $ | 197,120 | ||||||||
|
|
|
|
|
|
|
|
|
|||||||||
| Liabilities |
||||||||||||||||
| Other invested liabilities |
||||||||||||||||
| GMxB derivative features’ liability |
— | — | 4,358 | 4,358 | ||||||||||||
| SCS, SIO, MSO and IUL indexed features’ liability |
— | 1,786 | — | 1,786 | ||||||||||||
| Liabilities of consolidated VIEs and VOEs |
670 | 22 | — | 692 | ||||||||||||
| Contingent payment arrangements |
— | — | 15 | 15 | ||||||||||||
|
|
|
|
|
|
|
|
|
|||||||||
| Total Liabilities |
$ | 670 | $ | 1,808 | $ | 4,373 | $ | 6,851 | ||||||||
|
|
|
|
|
|
|
|
|
|||||||||
| (1) | Includes publicly traded agency pass-through securities and collateralized obligations. |
| (2) | Includes credit-tranched securities collateralized by sub-prime mortgages and other asset types and credit tenant loans. |
| (3) | Reported in Other assets in the consolidated balance sheets. |
F-60
Table of Contents
Fair Value Measurements at December 31, 2016
| Level 1 | Level 2 | Level 3 | Total | |||||||||||||
| (in millions) | ||||||||||||||||
| Assets |
||||||||||||||||
| Investments |
||||||||||||||||
| Fixed maturities, available-for-sale |
||||||||||||||||
| Public Corporate |
$ | — | $ | 16,566 | $ | 29 | $ | 16,595 | ||||||||
| Private Corporate |
— | 6,469 | 828 | 7,297 | ||||||||||||
| U.S. Treasury, government and agency |
— | 14,836 | — | 14,836 | ||||||||||||
| States and political subdivisions |
— | 461 | 42 | 503 | ||||||||||||
| Foreign governments |
— | 400 | — | 400 | ||||||||||||
| Commercial mortgage-backed |
— | 22 | 373 | 395 | ||||||||||||
| Residential mortgage-backed(1) |
— | 1,005 | — | 1,005 | ||||||||||||
| Asset-backed(2) |
— | 162 | 120 | 282 | ||||||||||||
| Redeemable preferred stock |
227 | 338 | 1 | 566 | ||||||||||||
|
|
|
|
|
|
|
|
|
|||||||||
| Subtotal |
227 | 40,259 | 1,393 | 41,879 | ||||||||||||
|
|
|
|
|
|
|
|
|
|||||||||
| Other equity investments |
3 | — | 16 | 19 | ||||||||||||
| Trading securities |
494 | 11,565 | 26 | 12,085 | ||||||||||||
| Other invested assets |
||||||||||||||||
| Short-term investments |
— | 1,511 | — | 1,511 | ||||||||||||
| Assets of consolidated VIEs/VOEs |
342 | 205 | 46 | 593 | ||||||||||||
| Swaps |
— | (978 | ) | — | (978 | ) | ||||||||||
| Credit Default Swaps |
— | 5 | — | 5 | ||||||||||||
| Options |
— | 1,016 | — | 1,016 | ||||||||||||
| Floors |
— | 11 | — | 11 | ||||||||||||
|
|
|
|
|
|
|
|
|
|||||||||
| Subtotal |
342 | 1,770 | 46 | 2,158 | ||||||||||||
|
|
|
|
|
|
|
|
|
|||||||||
| Cash equivalents |
3,917 | — | — | 3,917 | ||||||||||||
| Segregated securities |
— | 946 | — | 946 | ||||||||||||
| GMIB reinsurance contracts asset |
— | — | 1,735 | 1,735 | ||||||||||||
| Separate Account assets |
109,817 | 2,832 | 313 | 112,962 | ||||||||||||
|
|
|
|
|
|
|
|
|
|||||||||
| Total Assets |
$ | 114,800 | $ | 57,372 | $ | 3,529 | $ | 175,701 | ||||||||
|
|
|
|
|
|
|
|
|
|||||||||
| Liabilities |
||||||||||||||||
| Other invested liabilities |
||||||||||||||||
| Foreign currency contracts |
$ | — | $ | 81 | $ | — | $ | 81 | ||||||||
| GMxB derivative features’ liability |
— | — | 5,580 | 5,580 | ||||||||||||
| SCS, SIO, MSO and IUL indexed features’ liability |
— | 940 | — | 940 | ||||||||||||
| Liabilities of consolidated VIEs and VOEs |
248 | 2 | — | 250 | ||||||||||||
| Contingent payment arrangements |
— | — | 25 | 25 | ||||||||||||
|
|
|
|
|
|
|
|
|
|||||||||
| Total Liabilities |
$ | 248 | $ | 1,023 | $ | 5,605 | $ | 6,876 | ||||||||
|
|
|
|
|
|
|
|
|
|||||||||
| (1) | Includes publicly traded agency pass-through securities and collateralized obligations. |
| (2) | Includes credit-tranched securities collateralized by sub-prime mortgages and other asset types and credit tenant loans. |
At December 31, 2017 and 2016, respectively, the fair value of public fixed maturities is approximately $38,762 million and $33,936 million or approximately 20.0% and 19.6% of the Company’s total assets measured at fair value on a recurring basis (excluding GMIB reinsurance contracts and segregated securities measured at fair value on a recurring basis). The fair values of the Company’s public fixed maturity securities are generally based on prices obtained from independent valuation service providers and for
F-61
Table of Contents
which the Company maintains a vendor hierarchy by asset type based on historical pricing experience and vendor expertise. Although each security generally is priced by multiple independent valuation service providers, the Company ultimately uses the price received from the independent valuation service provider highest in the vendor hierarchy based on the respective asset type, with limited exception. To validate reasonableness, prices also are internally reviewed by those with relevant expertise through comparison with directly observed recent market trades. Consistent with the fair value hierarchy, public fixed maturity securities validated in this manner generally are reflected within Level 2, as they are primarily based on observable pricing for similar assets and/or other market observable inputs. If the pricing information received from independent valuation service providers is not reflective of market activity or other inputs observable in the market, the Company may challenge the price through a formal process in accordance with the terms of the respective independent valuation service provider agreement. If, as a result, it is determined that the independent valuation service provider is able to reprice the security in a manner agreed as more consistent with current market observations, the security remains within Level 2. Alternatively, a Level 3 classification may result if the pricing information then is sourced from another vendor, non-binding broker quotes, or internally-developed valuations for which the Company’s own assumptions about market-participant inputs would be used in pricing the security.
At December 31, 2017 and 2016, respectively, the fair value of private fixed maturities is approximately $8,179 million and $7,943 million or approximately 4.2% and 4.6% of the Company’s total assets measured at fair value on a recurring basis. The fair values of the Company’s private fixed maturities are determined from prices obtained from independent valuation service providers. Prices not obtained from an independent valuation service provider are determined by using a discounted cash flow model or a market comparable company valuation technique. In certain cases, these models use observable inputs with a discount rate based upon the average of spread surveys collected from private market intermediaries who are active in both primary and secondary transactions, taking into account, among other factors, the credit quality and industry sector of the issuer and the reduced liquidity associated with private placements. Generally, these securities have been reflected within Level 2. For certain private fixed maturities, the discounted cash flow model or a market comparable company valuation technique may also incorporate unobservable inputs, which reflect the Company’s own assumptions about the inputs market participants would use in pricing the asset. To the extent management determines that such unobservable inputs are significant to the fair value measurement of a security, a Level 3 classification generally is made.
As disclosed in Note 3, at December 31, 2017 and 2016, respectively, the net fair value of freestanding derivative positions is approximately $2,258 million and $(27) million or approximately 42.9% and (1.3)% of Other invested assets measured at fair value on a recurring basis. The fair values of the Company’s derivative positions are generally based on prices obtained either from independent valuation service providers or derived by applying market inputs from recognized vendors into industry standard pricing models. The majority of these derivative contracts are traded in the OTC derivative market and are classified in Level 2. The fair values of derivative assets and liabilities traded in the OTC market are determined using quantitative models that require use of the contractual terms of the derivative instruments and multiple market inputs, including interest rates, prices, and indices to generate continuous yield or pricing curves, including overnight index swap (“OIS”) curves, and volatility factors, which then are applied to value the positions. The predominance of market inputs is actively quoted and can be validated through external sources or reliably interpolated if less observable. If the pricing information received from independent valuation service providers is not reflective of market activity or other inputs observable in the market, the Company may challenge the price through a formal process in accordance with the terms of the respective independent valuation service provider agreement. If as a result it is determined that the independent valuation service provider is able to reprice the derivative instrument in a manner agreed as more consistent with current market observations, the position remains within Level 2. Alternatively, a Level 3 classification may result if the pricing information then is sourced from another vendor, non-binding broker quotes, or internally-developed valuations for which the Company’s own assumptions about market-participant inputs would be used in pricing the security.
F-62
Table of Contents
At December 31, 2017 and 2016, respectively, investments classified as Level 1 comprise approximately 64.9% and 66.4% of assets measured at fair value on a recurring basis and primarily include redeemable preferred stock, trading securities, cash equivalents and Separate Account assets. Fair value measurements classified as Level 1 include exchange-traded prices of fixed maturities, equity securities and derivative contracts, and net asset values for transacting subscriptions and redemptions of mutual fund shares held by Separate Accounts. Cash equivalents classified as Level 1 include money market accounts, overnight commercial paper and highly liquid debt instruments purchased with an original maturity of three months or less, and are carried at cost as a proxy for fair value measurement due to their short-term nature.
At December 31, 2017 and 2016, respectively, investments classified as Level 2 comprise approximately 34.0% and 32.6% of assets measured at fair value on a recurring basis and primarily include U.S. government and agency securities and certain corporate debt securities, such as public and private fixed maturities. As market quotes generally are not readily available or accessible for these securities, their fair value measures are determined utilizing relevant information generated by market transactions involving comparable securities and often are based on model pricing techniques that effectively discount prospective cash flows to present value using appropriate sector-adjusted credit spreads commensurate with the security’s duration, also taking into consideration issuer-specific credit quality and liquidity. Segregated securities classified as Level 2 are U.S. Treasury Bills segregated by AB in a special reserve bank custody account for the exclusive benefit of brokerage customers, as required by Rule 15c3-3 of the Exchange Act and for which fair values are based on quoted yields in secondary markets.
Observable inputs generally used to measure the fair value of securities classified as Level 2 include benchmark yields, reported secondary trades, issuer spreads, benchmark securities and other reference data. Additional observable inputs are used when available, and as may be appropriate, for certain security types, such as prepayment, default, and collateral information for the purpose of measuring the fair value of mortgage- and asset-backed securities. At December 31, 2017 and 2016, respectively, approximately $875 million and $1,078 million of AAA-rated mortgage- and asset-backed securities are classified as Level 2 for which the observability of market inputs to their pricing models is supported by sufficient, albeit more recently contracted, market activity in these sectors.
The Company’s SCS and EQUI-VEST variable annuity products, the IUL product, and in the MSO fund available in some life contracts offer investment options which permit the contract owner to participate in the performance of an index, ETF or commodity price. These investment options, which depending on the product and on the index selected can currently have 1, 3, 5, or 6 year terms, provide for participation in the performance of specified indices, ETF or commodity price movement up to a segment-specific declared maximum rate. Under certain conditions that vary by product, e.g. holding these segments for the full term, these segments also shield policyholders from some or all negative investment performance associated with these indices, ETF or commodity prices. These investment options have defined formulaic liability amounts, and the current values of the option component of these segment reserves are accounted for as Level 2 embedded derivatives. The fair values of these embedded derivatives are based on data obtained from independent valuation service providers.
At December 31, 2017 and 2016, respectively, investments classified as Level 3 comprise approximately 1.1% and 1.0% of assets measured at fair value on a recurring basis and primarily include commercial mortgage-backed securities (“CMBS”) and corporate debt securities, such as private fixed maturities. Determinations to classify fair value measures within Level 3 of the valuation hierarchy generally are based upon the significance of the unobservable factors to the overall fair value measurement. Included in the Level 3 classification at December 31, 2017 and 2016, respectively, were approximately $97 million and $126 million of fixed maturities with indicative pricing obtained from brokers that otherwise could not be corroborated to market observable data. The Company applies various due diligence procedures, as considered appropriate, to validate these non-binding broker quotes for reasonableness, based on its understanding of the markets, including use of internally-developed assumptions about inputs a market participant would use to price the security. In addition, approximately $598 million and $494 million of mortgage- and asset-backed securities, including CMBS, are classified as Level 3 at December 31, 2017 and
F-63
Table of Contents
2016, respectively. The Company utilizes prices obtained from an independent valuation service vendor to measure fair value of CMBS securities.
The Company also issues certain benefits on its variable annuity products that are accounted for as derivatives and are also considered Level 3. The GMIBNLG feature allows the policyholder to receive guaranteed minimum lifetime annuity payments based on predetermined annuity purchase rates applied to the contract’s benefit base if and when the contract account value is depleted and the NLG feature is activated. The GMWB feature allows the policyholder to withdraw at minimum, over the life of the contract, an amount based on the contract’s benefit base. The GWBL feature allows the policyholder to withdraw, each year for the life of the contract, a specified annual percentage of an amount based on the contract’s benefit base. The GMAB feature increases the contract account value at the end of a specified period to a GMAB base. The GIB feature provides a lifetime annuity based on predetermined annuity purchase rates if and when the contract account value is depleted. This lifetime annuity is based on predetermined annuity purchase rates applied to a GIB base.
Level 3 also includes the GMIB reinsurance contract asset’s which are accounted for as derivative contracts. The GMIB reinsurance contract asset and liabilities’ fair value reflects the present value of reinsurance premiums and recoveries and risk margins over a range of market consistent economic scenarios while GMxB derivative features liability reflects the present value of expected future payments (benefits) less fees, adjusted for risk margins and nonperformance risk, attributable to GMxB derivative features liability over a range of market-consistent economic scenarios.
The valuations of the GMIB reinsurance contract asset and GMxB derivative features liability incorporate significant non-observable assumptions related to policyholder behavior, risk margins and projections of equity separate account funds. The credit risks of the counterparty and of the Company are considered in determining the fair values of its GMIB reinsurance contract asset and GMxB derivative features liability positions, respectively, after taking into account the effects of collateral arrangements. Incremental adjustment to the swap curve for non-performance risk is made to the fair values of the GMIB reinsurance contract asset and liabilities and GMIBNLG feature to reflect the claims-paying ratings of counterparties and the Company. Equity and fixed income volatilities were modeled to reflect current market volatilities. Due to the unique, long duration of the GMIBNLG feature, adjustments were made to the equity volatilities to remove the illiquidity bias associated with the longer tenors and risk margins were applied to the non-capital markets inputs to the GMIBNLG valuations.
After giving consideration to collateral arrangements, the Company reduced the fair value of its GMIB reinsurance contract asset by $8 million and $10 million at December 31, 2017 and 2016, respectively, to recognize incremental counterparty non-performance risk and reduced the fair value of its GMIB reinsurance contract liabilities by $24 million and $32 million at December 31, 2017 and 2016, respectively to recognize its own incremental non-performance risk.
Lapse rates are adjusted at the contract level based on a comparison of the actuarially calculated guaranteed values and the current policyholder account value, which include other factors such as considering surrender charges. Generally, lapse rates are assumed to be lower in periods when a surrender charge applies. A dynamic lapse function reduces the base lapse rate when the guaranteed amount is greater than the account value as in the money contracts are less likely to lapse. For valuing the embedded derivative, lapse rates vary throughout the period over which cash flows are projected.
The Company’s Level 3 liabilities include contingent payment arrangements associated with acquisitions in 2010, 2013, 2014 and 2016 by AB. At each reporting date, AB estimates the fair values of the contingent consideration expected to be paid based upon probability-weighted AUM and revenue projections, using unobservable market data inputs, which are included in Level 3 of the valuation hierarchy. The Company’s Level 3 liabilities also include contingent payment arrangements associated with a Renewal Rights Agreement (the “Renewal Rights Agreement”) that transitions certain group employee benefits policies beginning January 1, 2017 from an insurer exiting such business to MONY Life Insurance Company of America (“MLOA”). The fair value of the contingent payments liability associated with this transaction is
F-64
Table of Contents
measured and adjusted each reporting period through final settlement using projected premiums from these policies, net of potential surrenders and terminations, and applying a risk-adjusted discount factor (7% at December 31, 2017) to the resulting cash flows.
As of December 31, 2017 and 2016, the Company’s consolidated VIEs/VOEs hold $2 million and $6 million, respectively, of investments that are classified as Level 3. They primarily consist of corporate bonds that are vendor priced with no ratings available, bank loans, non-agency collateralized mortgage obligations and asset-backed securities.
In 2017, AFS fixed maturities with fair values of $5 million were transferred out of Level 3 and into Level 2 principally due to the availability of trading activity and/or market observable inputs to measure and validate their fair values. In addition, AFS fixed maturities with fair value of $7 million were transferred from Level 2 into the Level 3 classification. These transfers in the aggregate represent approximately 0.1% of total equity at December 31, 2017.
In 2016, AFS fixed maturities with fair values of $62 million were transferred out of Level 3 and into Level 2 principally due to the availability of trading activity and/or market observable inputs to measure and validate their fair values. In addition, AFS fixed maturities with fair value of $25 million were transferred from Level 2 into the Level 3 classification. During 2016, one of AB’s private securities went public and, due to a trading restriction period, $56 million was transferred from a Level 3 to a Level 2 classification. These transfers in the aggregate represent approximately 0.8% of total equity at December 31, 2016.
F-65
Table of Contents
The table below presents a reconciliation for all Level 3 assets and liabilities at December 31, 2017, 2016 and 2015 respectively:
Level 3 Instruments
Fair Value Measurements
| Corporate | State and Political Subdivisions |
Foreign Governments |
Commercial Mortgage- backed |
Residential Mortgage- backed |
Asset- backed |
|||||||||||||||||||
| (in millions) | ||||||||||||||||||||||||
| Balance, January 1, 2017 |
$ | 857 | $ | 42 | $ | — | $ | 373 | $ | — | $ | 120 | ||||||||||||
| Total gains (losses), realized and unrealized, included in: |
||||||||||||||||||||||||
| Income (loss) as: |
||||||||||||||||||||||||
| Net investment income (loss) |
4 | — | — | (2 | ) | — | — | |||||||||||||||||
| Investment gains (losses), net |
1 | — | — | (95 | ) | — | 15 | |||||||||||||||||
|
|
|
|
|
|
|
|
|
|
|
|
|
|||||||||||||
| Subtotal |
5 | — | — | (97 | ) | — | 15 | |||||||||||||||||
|
|
|
|
|
|
|
|
|
|
|
|
|
|||||||||||||
| Other comprehensive income (loss) |
4 | (1 | ) | — | 78 | — | (7 | ) | ||||||||||||||||
| Purchases |
615 | — | — | — | — | 434 | ||||||||||||||||||
| Sales |
(333 | ) | (1 | ) | — | (354 | ) | — | (21 | ) | ||||||||||||||
| Transfers into Level 3(1) |
7 | — | — | — | — | — | ||||||||||||||||||
| Transfers out of Level 3(1) |
(5 | ) | — | — | — | — | — | |||||||||||||||||
|
|
|
|
|
|
|
|
|
|
|
|
|
|||||||||||||
| Balance, December 31, 2017 |
$ | 1,150 | $ | 40 | $ | — | $ | — | $ | — | $ | 541 | ||||||||||||
|
|
|
|
|
|
|
|
|
|
|
|
|
|||||||||||||
| Balance, January 1, 2016 |
$ | 430 | $ | 45 | $ | 1 | $ | 535 | $ | — | $ | 41 | ||||||||||||
| Total gains (losses), realized and unrealized, included in: |
||||||||||||||||||||||||
| Income (loss) as: |
||||||||||||||||||||||||
| Net investment income (loss) |
— | — | — | — | — | — | ||||||||||||||||||
| Investment gains (losses), net |
2 | — | — | (71 | ) | — | — | |||||||||||||||||
|
|
|
|
|
|
|
|
|
|
|
|
|
|||||||||||||
| Subtotal |
2 | — | — | (71 | ) | — | — | |||||||||||||||||
|
|
|
|
|
|
|
|
|
|
|
|
|
|||||||||||||
| Other comprehensive income (loss) |
8 | (2 | ) | — | 14 | — | 1 | |||||||||||||||||
| Purchases |
574 | — | — | — | — | 96 | ||||||||||||||||||
| Sales |
(144 | ) | (1 | ) | — | (91 | ) | — | (9 | ) | ||||||||||||||
| Transfers into Level 3(1) |
25 | — | — | — | — | — | ||||||||||||||||||
| Transfers out of Level 3(1) |
(38 | ) | — | (1 | ) | (14 | ) | — | (9 | ) | ||||||||||||||
|
|
|
|
|
|
|
|
|
|
|
|
|
|||||||||||||
| Balance, December 31, 2016 |
$ | 857 | $ | 42 | $ | — | $ | 373 | $ | — | $ | 120 | ||||||||||||
|
|
|
|
|
|
|
|
|
|
|
|
|
|||||||||||||
F-66
Table of Contents
| Corporate | State and Political Subdivisions |
Foreign Governments |
Commercial Mortgage- backed |
Residential Mortgage- backed |
Asset- backed |
|||||||||||||||||||
| (in millions) | ||||||||||||||||||||||||
| Balance, January 1, 2015 |
$ | 389 | $ | 47 | $ | — | $ | 752 | $ | 2 | $ | 54 | ||||||||||||
| Total gains (losses), realized and unrealized, included in: |
||||||||||||||||||||||||
| Income (loss) as: |
||||||||||||||||||||||||
| Net investment income (loss) |
2 | — | — | 2 | — | — | ||||||||||||||||||
| Investment gains (losses), net |
2 | — | — | (40 | ) | — | — | |||||||||||||||||
|
|
|
|
|
|
|
|
|
|
|
|
|
|||||||||||||
| Subtotal |
4 | — | — | (38 | ) | — | — | |||||||||||||||||
|
|
|
|
|
|
|
|
|
|
|
|
|
|||||||||||||
| Other comprehensive income (loss) |
(26 | ) | (1 | ) | — | 72 | — | (4 | ) | |||||||||||||||
| Purchases |
63 | — | 1 | — | — | — | ||||||||||||||||||
| Sales |
(39 | ) | (1 | ) | — | (177 | ) | (2 | ) | (9 | ) | |||||||||||||
| Transfers into Level 3(1) |
100 | — | — | — | — | — | ||||||||||||||||||
| Transfers out of Level 3(1) |
(61 | ) | — | — | (74 | ) | — | — | ||||||||||||||||
|
|
|
|
|
|
|
|
|
|
|
|
|
|||||||||||||
| Balance, December 31, 2015 |
$ | 430 | $ | 45 | $ | 1 | $ | 535 | $ | — | $ | 41 | ||||||||||||
|
|
|
|
|
|
|
|
|
|
|
|
|
|||||||||||||
| Redeemable Preferred Stock |
Other Equity Investments(2) |
GMIB Reinsurance Asset |
Separate Account Assets |
GMxB Derivative Features Liability |
Contingent Payment Arrangement |
|||||||||||||||||||
| (in millions) | ||||||||||||||||||||||||
| Balance, January 1, 2017 |
$ | 1 | $ | 88 | $ | 1,735 | $ | 313 | $ | (5,580 | ) | (25 | ) | |||||||||||
| Total gains (losses), realized and unrealized, included in: |
||||||||||||||||||||||||
| Income (loss) as: |
||||||||||||||||||||||||
| Investment gains (losses), net |
— | — | — | 29 | — | — | ||||||||||||||||||
| Net derivative gains (losses) |
— | — | 174 | — | 1,553 | — | ||||||||||||||||||
|
|
|
|
|
|
|
|
|
|
|
|
|
|||||||||||||
| Subtotal |
— | — | 174 | 29 | 1,553 | — | ||||||||||||||||||
|
|
|
|
|
|
|
|
|
|
|
|
|
|||||||||||||
| Other comprehensive income (loss) |
— | 14 | — | — | — | — | ||||||||||||||||||
| Purchases(2) |
— | 22 | 48 | 13 | (352 | ) | — | |||||||||||||||||
| Sales(3) |
— | (3 | ) | (63 | ) | (2 | ) | 21 | — | |||||||||||||||
| Settlements(4) |
— | — | — | (4 | ) | — | 10 | |||||||||||||||||
| Activity related to VIEs/VOEs |
— | (22 | ) | — | — | — | — | |||||||||||||||||
| Transfers into Level 3(1) |
— | — | — | — | — | — | ||||||||||||||||||
| Transfers out of Level 3(1) |
— | — | — | — | — | — | ||||||||||||||||||
|
|
|
|
|
|
|
|
|
|
|
|
|
|||||||||||||
| Balance, December 31, 2017 |
$ | 1 | $ | 99 | $ | 1,894 | $ | 349 | $ | (4,358 | ) | $ | (15 | ) | ||||||||||
|
|
|
|
|
|
|
|
|
|
|
|
|
|||||||||||||
| Balance, January 1, 2016 |
$ | — | $ | 81 | $ | 1,829 | $ | 313 | $ | (5,416 | ) | (31 | ) | |||||||||||
| Total gains (losses), realized and unrealized, included in: |
||||||||||||||||||||||||
| Income (loss) as: |
||||||||||||||||||||||||
| Net investment income (loss) |
— | — | — | — | — | — | ||||||||||||||||||
| Investment gains (losses), net |
— | — | — | 19 | — | — | ||||||||||||||||||
| Net derivative gains (losses) |
— | — | (77 | ) | — | 138 | — | |||||||||||||||||
|
|
|
|
|
|
|
|
|
|
|
|
|
|||||||||||||
| Subtotal |
— | — | (77 | ) | 19 | 138 | — | |||||||||||||||||
|
|
|
|
|
|
|
|
|
|
|
|
|
|||||||||||||
| Other comprehensive income(loss) |
— | (1 | ) | — | — | — | — | |||||||||||||||||
F-67
Table of Contents
| Purchases(2) |
1 | 4 | 48 | 10 | (325 | ) | (18 | ) | ||||||||||||||||
| Sales(3) |
— | — | (65 | ) | — | 23 | — | |||||||||||||||||
| Settlements(4) |
— | — | — | — | — | — | ||||||||||||||||||
| Activity related to consolidated VIEs/VOEs |
— | 60 | — | (7 | ) | — | 24 | |||||||||||||||||
| Transfers into Level 3(1) |
— | — | — | 1 | — | — | ||||||||||||||||||
| Transfers out of Level 3(1) |
— | (56 | ) | — | (23 | ) | — | — | ||||||||||||||||
|
|
|
|
|
|
|
|
|
|
|
|
|
|||||||||||||
| Balance, December 31, 2016 |
$ | 1 | $ | 88 | $ | 1,735 | $ | 313 | $ | (5,580 | ) | $ | (25 | ) | ||||||||||
|
|
|
|
|
|
|
|
|
|
|
|
|
| Redeemable Preferred Stock |
Other Equity Investments(2) |
GMIB Reinsurance Asset |
Separate Account Assets |
GMxB Derivative Features Liability |
Contingent Payment Arrangement |
|||||||||||||||||||
| (in millions) | ||||||||||||||||||||||||
| Balance, January 1, 2015 |
$ | — | $ | 87 | $ | 2,151 | $ | 260 | $ | (4,361 | ) | $ | (42 | ) | ||||||||||
| Total gains (losses), realized and unrealized, included in: |
||||||||||||||||||||||||
| Income (loss) as: |
||||||||||||||||||||||||
| Net investment income (loss) |
— | — | — | — | — | — | ||||||||||||||||||
| Investment gains (losses), net |
— | 5 | — | 36 | — | — | ||||||||||||||||||
| Net derivative gains (losses) |
— | — | (330 | ) | — | (777 | ) | — | ||||||||||||||||
| Subtotal |
— | 5 | (330 | ) | 36 | (777 | ) | — | ||||||||||||||||
|
|
|
|
|
|
|
|
|
|
|
|
|
|||||||||||||
| Other comprehensive income (loss) |
— | 2 | — | — | — | — | ||||||||||||||||||
| Purchases(2) |
— | 7 | 49 | 26 | (291 | ) | — | |||||||||||||||||
| Sales(3) |
— | (20 | ) | (41 | ) | (2 | ) | 13 | 11 | |||||||||||||||
| Settlements(4) |
— | — | — | (5 | ) | — | — | |||||||||||||||||
| Transfers into Level 3(1) |
— | — | — | — | — | — | ||||||||||||||||||
| Transfers out of Level 3(1) |
— | — | — | (2 | ) | — | — | |||||||||||||||||
|
|
|
|
|
|
|
|
|
|
|
|
|
|||||||||||||
| Balance, December 31, 2015 |
$ | — | $ | 81 | $ | 1,829 | $ | 313 | $ | (5,416 | ) | $ | (31 | ) | ||||||||||
|
|
|
|
|
|
|
|
|
|
|
|
|
|||||||||||||
| (1) | Transfers into/out of Level 3 classification are reflected at beginning-of-period fair values. |
| (2) | For the GMIB reinsurance contract asset, and GMxB derivative features liability, represents attributed fee. |
| (3) | For the GMIB reinsurance contract asset, represents recoveries from reinsurers and for GMxB derivative features liability represents benefits paid. |
| (4) | For contingent payment arrangements, it represents payments under the arrangement. |
F-68
Table of Contents
The table below details changes in unrealized gains (losses) for 2017, 2016 and 2015 by category for Level 3 assets and liabilities still held at December 31, 2017, 2016 and 2015 respectively
| Earnings (Loss) | ||||||||||||
| Investment Gains (Losses), Net |
Net Derivative Gains (Losses) |
OCI | ||||||||||
| (in millions) | ||||||||||||
| Held as of December 31, 2017 |
||||||||||||
| Change in unrealized gains (losses) |
||||||||||||
| Fixed maturities, available-for-sale Corporate |
$ | — | $ | — | $ | 5 | ||||||
| State and political subdivisions |
— | — | (1 | ) | ||||||||
| Commercial mortgage-backed |
— | — | — | |||||||||
| Asset-backed |
— | — | 1 | |||||||||
|
|
|
|
|
|
|
|||||||
| Subtotal |
$ | — | $ | — | $ | 5 | ||||||
|
|
|
|
|
|
|
|||||||
| GMIB reinsurance contracts |
— | 174 | — | |||||||||
| Separate Account assets(1) |
29 | — | — | |||||||||
| GMxB derivative features liability |
— | 1,553 | — | |||||||||
|
|
|
|
|
|
|
|||||||
| Total |
$ | 29 | $ | 1,727 | $ | 5 | ||||||
|
|
|
|
|
|
|
|||||||
| Held as of December 31, 2016 |
||||||||||||
| Change in unrealized gains (losses) |
||||||||||||
| Fixed maturities, available-for-sale Corporate |
$ | — | $ | — | $ | 11 | ||||||
| State and political subdivisions |
— | — | (2 | ) | ||||||||
| Commercial mortgage-backed |
— | — | 10 | |||||||||
| Asset-backed |
— | — | 1 | |||||||||
|
|
|
|
|
|
|
|||||||
| Subtotal |
$ | — | $ | — | $ | 20 | ||||||
|
|
|
|
|
|
|
|||||||
| GMIB reinsurance contracts |
— | (77 | ) | — | ||||||||
| Separate Account assets(1) |
20 | — | — | |||||||||
| GMxB derivative features liability |
— | 138 | — | |||||||||
|
|
|
|
|
|
|
|||||||
| Total |
$ | 20 | $ | 61 | $ | 20 | ||||||
|
|
|
|
|
|
|
|||||||
| Earnings (Loss) | ||||||||||||
| Investment Gains (Losses), Net |
Net Derivative Gains (losses) |
OCI | ||||||||||
| (in millions) | ||||||||||||
| Held as of December 31, 2015 |
||||||||||||
| Change in unrealized gains (losses) |
||||||||||||
| Fixed maturities, available-for-sale Corporate |
$ | — | $ | — | $ | (25 | ) | |||||
| State and political subdivisions |
— | — | (2 | ) | ||||||||
| Commercial mortgage-backed |
— | — | 68 | |||||||||
| Asset-backed |
— | — | (4 | ) | ||||||||
|
|
|
|
|
|
|
|||||||
| Subtotal |
$ | — | $ | — | $ | 37 | ||||||
|
|
|
|
|
|
|
|||||||
| GMIB reinsurance contracts |
— | (330 | ) | — | ||||||||
| Separate Account assets(1) |
36 | — | — | |||||||||
| GMxB derivative features liability |
— | (777 | ) | — | ||||||||
|
|
|
|
|
|
|
|||||||
| Total |
$ | 36 | $ | (1,107 | ) | $ | 37 | |||||
|
|
|
|
|
|
|
|||||||
| (1) | There is an investment expense that offsets this investment gain (loss). |
F-69
Table of Contents
The following table discloses quantitative information about Level 3 fair value measurements by category for assets and liabilities as of December 31, 2017 and 2016, respectively.
Quantitative Information about Level 3 Fair Value Measurements
December 31, 2017
| Fair Value |
Valuation |
Significant |
Range |
Weighted Average |
||||||||||
| (in millions) | ||||||||||||||
| Assets |
||||||||||||||
| Investments |
||||||||||||||
| Fixed maturities, available-for-sale |
||||||||||||||
| Corporate |
$ | 53 | Matrix pricing model | Spread over the industry-specific benchmark yield curve | 0 - 565 bps | 125 bps | ||||||||
| 789 | Market comparable companies | EBITDA multiples Discount Rate Cash flow Multiple |
5.3x - 27.9x 7.2% - 17.0% 9.0x - 17.7x |
|
12.9x 11.1x 13.1x |
| ||||||||
| Other equity investments |
38 | Discounted cash flow |
Earnings Multiple Discounts factor Discount years |
10.8x 10.0% 12 |
||||||||||
| Separate Account assets |
326 | Third party appraisal |
Capitalization Rate Exit capitalization Rate Discount Rate |
4.6% 5.6% 6.6% |
||||||||||
| 1 | Discounted cash flow | Spread over U.S. Treasury curve Discount factor |
243 bps 4.409% | |||||||||||
| GMIB reinsurance contract asset |
1,894 | Discounted cash flow |
Lapse Rates Withdrawal Rates GMIB Utilization Rates Non-performance risk Volatility rates - Equity |
1.0% - 6.3% 0.0% - 8.0% 0.0% - 16.0% 5bps - 10bps 9.9% - 30.9% | ||||||||||
| Liabilities: |
||||||||||||||
| GMIBNLG |
4,056 | Discounted cash flow |
Non-performance risk Lapse Rates Withdrawal Rates Utilization Rates NLG Forfeiture Rates Long-term Equity Volatility |
1.0% 0.8% - 26.2% 0.0% - 12.4% 0.0% - 16.0% 0.55% - 2.1% 20.0% |
||||||||||
| Assumed GMIB Reinsurance Contracts |
194 | Discounted cash flow |
Lapse Rates Withdrawal Rates (Age 0-85) Withdrawal Rates (Age 86+) GMIB Utilization Rates Non-performance risk Volatility rates - Equity |
1.1% - 13.3%
0.7% - 22.2% 1.3% - 100% 1.3% 9.9% - 30.9% |
||||||||||
| GWBL/GMWB |
130 | Discounted cash flow |
Lapse Rates Withdrawal Rates Utilization Rates Volatility rates - Equity |
0.9% - 5.7% 0.0% - 7.0% 100% after delay 9.9% - 30.9% | ||||||||||
| GIB |
(27 | ) | Discounted cash flow |
Lapse Rates Withdrawal Rates Utilization Rates Volatility rates - Equity |
0.9% - 5.7% 0.0% - 7.0% 0.0% - 16.0% 9.9% - 30.9% | |||||||||
| GMAB |
5 | Discounted cash flow |
Lapse Rates Volatility rates - Equity |
0.5% - 11.0% 9.9% - 30.9% | ||||||||||
F-70
Table of Contents
Quantitative Information about Level 3 Fair Value Measurements
December 31, 2016
| Fair Value |
Valuation Technique |
Significant |
Range |
Weighted | ||||||||
| (in millions) | ||||||||||||
| Assets |
||||||||||||
| Investments |
||||||||||||
| Fixed maturities, available-for-sale |
||||||||||||
| Corporate |
$ | 55 | Matrix pricing model | Spread over the industry- specific benchmark yield curve |
0 - 565 bps | 151 bps | ||||||
| 636 | Market comparable companies | EBITDA multiples Discount rate Cash flow Multiples |
4.3x - 25.6x 7.0% - 17.8% 14.0x - 16.5x |
11.7x 11.4% 15.6x | ||||||||
| Asset-backed |
2 | Matrix pricing model |
Spread over U.S. Treasury curve |
25 bps - 687 bps | 38 bps | |||||||
| Other equity investments |
26 | Discounted Cash Flow |
Earnings Multiple Discounts factor Discount years |
10.8x 10.0% 12 |
||||||||
| Separate Account assets |
295 | Third party appraisal |
Capitalization Rate Exit capitalization Rate Discount Rate |
4.8% 5.7% 6.6% |
||||||||
| 3 | Discounted cash flow | Spread over U.S. Treasury curve Gross domestic product rate Discount factor |
273 bps - 512 bps 1.1% - 7.0% |
283 bps 4.3% | ||||||||
| GMIB reinsurance contract asset |
1,735 | Discounted cash flow |
Lapse Rates Withdrawal Rates GMIB Utilization Rates Non-performance risk Volatility rates - Equity |
1.5% - 5.7% 0.0% - 8.0% 0.0% - 16.0% 5 bps - 17 bps 11.0% - 38.0% |
||||||||
| Liabilities |
||||||||||||
| GMIBNLG |
5,158 | Discounted cash flow |
Non-performance risk Lapse Rates Withdrawal Rates Annuitization NLG Forfeiture Rates Long-term Equity Volatility |
1.1% 1.2% - 26.20% 0.0% - 11.5% 0.0% - 16.0% 0.55% - 2.1% 20.0% |
||||||||
| Assumed GMIB Reinsurance Contracts |
258 | Discounted cash flow |
Lapse Rates Withdrawal Rates (Age 0-85) Withdrawal Rates (Age 86+) GMIB Utilization Rates Non-performance risk Volatility rates - Equity |
0.7% - 14.6% 0.7% - 22.7% 1.3% - 100.0% 0.0% - 27.3% 1.8% 9.0% - 35.0% |
||||||||
| GWBL/GMWB |
114 | Discounted cash flow |
Lapse Rates Withdrawal Rates Utilization Rates Volatility rates - Equity |
1.0% - 5.7% 0.0% - 7.0% 100% after delay 9.0% - 35.0% |
||||||||
| GIB |
30 | Discounted cash flow |
Withdrawal Rates Utilization Rates Volatility rates - Equity |
1.0% - 5.7% 0.0% - 8.0% 0.0% - 16.0% 9.0% - 35.0% |
||||||||
| GMAB |
20 | Discounted cash flow |
Lapse Rates Volatility rates - Equity |
1.0% - 11.0% 9.0% - 35.0% |
||||||||
F-71
Table of Contents
Excluded from the tables above at December 31, 2017 and 2016, respectively, are approximately $948 million and $777 million of Level 3 fair value measurements of investments for which the underlying quantitative inputs are not developed by the Company and are not readily available. The fair value measurements of these Level 3 investments comprise approximately 44.0% and 43.3% of total assets classified as Level 3 and represent only 0.5% and 0.4% of total assets measured at fair value on a recurring basis at December 31, 2017 and 2016, respectively. These investments primarily consist of certain privately placed debt securities with limited trading activity, including commercial mortgage, residential mortgage and asset-backed instruments, and their fair values generally reflect unadjusted prices obtained from independent valuation service providers and indicative, non-binding quotes obtained from third-party broker-dealers recognized as market participants. Significant increases or decreases in the fair value amounts received from these pricing sources may result in the Company’s reporting significantly higher or lower fair value measurements for these Level 3 investments.
Included in the tables above at December 31, 2017 and 2016, respectively, are approximately $842 million and $691 million fair value of privately placed, available-for-sale corporate debt securities classified as Level 3. The fair value of private placement securities is determined by application of a matrix pricing model or a market comparable company value technique, representing approximately 73.2% and 80.6% of the total fair value of Level 3 securities in the corporate fixed maturities asset class. The significant unobservable input to the matrix pricing model valuation technique is the spread over the industry-specific benchmark yield curve. Generally, an increase or decrease in spreads would lead to directionally inverse movement in the fair value measurements of these securities. The significant unobservable input to the market comparable company valuation technique is the discount rate. Generally, a significant increase (decrease) in the discount rate would result in significantly lower (higher) fair value measurements of these securities.
Residential mortgage-backed securities classified as Level 3 primarily consist of non-agency paper with low trading activity. Included in the tables above at December 31, 2017 and 2016, there were no Level 3 securities that were determined by application of a matrix pricing model and for which the spread over the U.S. Treasury curve is the most significant unobservable input to the pricing result. Generally, a change in spreads would lead to directionally inverse movement in the fair value measurements of these securities.
Asset-backed securities classified as Level 3 primarily consist of non-agency mortgage loan trust certificates, including subprime and Alt-A paper, credit tenant loans, and equipment financings. Included in the tables above at December 31, 2017 and 2016, are approximately 0.0% and 1.7%, respectively, of the total fair value of these Level 3 securities that is determined by application of a matrix pricing model and for which the spread over the U.S. Treasury curve is the most significant unobservable input to the pricing result. Significant increases (decreases) in spreads would result in significantly lower (higher) fair value measurements.
Included in other equity investments classified as Level 3 are reporting entities’ venture capital securities in the Technology, Media and Telecommunications industries. The fair value measurements of these securities include significant unobservable inputs including an enterprise value to revenue multiples and a discount rate to account for liquidity and various risk factors. Significant increases (decreases) in the enterprise value to revenue multiple inputs in isolation would result in a significantly higher (lower) fair value measurement. Significant increases (decreases) in the discount rate would result in a significantly lower (higher) fair value measurement.
Separate Account assets classified as Level 3 in the table at December 31, 2017 and 2016, primarily consist of a private real estate fund with a fair value of approximately $326 million and $295 million, a private equity investment with a fair value of approximately $0 million and $1 million and mortgage loans with fair value of approximately $1 million and $2 million, respectively. A third party appraisal valuation technique is used to measure the fair value of the private real estate investment fund, including consideration of observable replacement cost and sales comparisons for the underlying commercial properties, as well as the results from applying a discounted cash flow approach. Significant increase (decrease) in isolation in the capitalization rate and exit capitalization rate assumptions used in the discounted cash flow approach to the appraisal value would result in a higher (lower) measure of fair value. A discounted cash flow approach is applied to determine the private equity investment for which the significant unobservable assumptions are
F-72
Table of Contents
the gross domestic product rate formula and a discount factor that takes into account various risks, including the illiquid nature of the investment. A significant increase (decrease) in the gross domestic product rate would have a directionally inverse effect on the fair value of the security. With respect to the fair value measurement of mortgage loans a discounted cash flow approach is applied, a significant increase (decrease) in the assumed spread over U.S. Treasury securities would produce a lower (higher) fair value measurement. Changes in the discount rate or factor used in the valuation techniques to determine the fair values of these private equity investments and mortgage loans generally are not correlated to changes in the other significant unobservable inputs. Significant increase (decrease) in isolation in the discount rate or factor would result in significantly lower (higher) fair value measurements. The remaining Separate Account investments classified as Level 3 excluded from the table consist of mortgage- and asset-backed securities with fair values of approximately $14 million and $8 million at December 31, 2017 and $12 million and $3 million at December 31, 2016, respectively. These fair value measurements are determined using substantially the same valuation techniques as earlier described above for the Company’s General Account investments in these securities.
Significant unobservable inputs with respect to the fair value measurement of the Level 3 GMIB reinsurance contract asset and the Level 3 liabilities identified in the table above are developed using the Company data. Validations of unobservable inputs are performed to the extent the Company has experience. When an input is changed the model is updated and the results of each step of the model are analyzed for reasonableness.
The significant unobservable inputs used in the fair value measurement of the Company’s GMIB reinsurance contract asset are lapse rates, withdrawal rates and GMIB utilization rates. Significant increases in GMIB utilization rates or decreases in lapse or withdrawal rates in isolation would tend to increase the GMIB reinsurance contract asset.
Fair value measurement of the GMIB reinsurance contract asset and liabilities includes dynamic lapse and GMIB utilization assumptions whereby projected contractual lapses and GMIB utilization reflect the projected net amount of risks of the contract. As the net amount of risk of a contract increases, the assumed lapse rate decreases and the GMIB utilization increases. Increases in volatility would increase the asset and liabilities.
The significant unobservable inputs used in the fair value measurement of the Company’s GMIBNLG liability are lapse rates, withdrawal rates, GMIB utilization rates, adjustment for non-performance risk and NLG forfeiture rates. NLG forfeiture rates are caused by excess withdrawals above the annual GMIB accrual rate that cause the NLG to expire. Significant decreases in lapse rates, NLG forfeiture rates, adjustment for non-performance risk and GMIB utilization rates would tend to increase the GMIBNLG liability, while decreases in withdrawal rates and volatility rates would tend to decrease the GMIBNLG liability.
The significant unobservable inputs used in the fair value measurement of the Company’s GMWB and GWBL liability are lapse rates and withdrawal rates. Significant increases in withdrawal rates or decreases in lapse rates in isolation would tend to increase these liabilities. Increases in volatility would increase these liabilities.
During 2017, AB made the final contingent consideration payment relating to its 2014 acquisition and recorded a change in estimate and wrote off the remaining contingent consideration payable relating to its 2010 acquisition. As of December 31, 2017, one acquisition-related contingent consideration liability of $11 million remains relating to AB’s 2016 acquisition, which was valued using a revenue growth rate of 31.0% and a discount rate ranging from 1.4% to 2.3%.
The three AB acquisition-related contingent consideration liabilities recorded have a combined fair value of $18 million as of December 31, 2016, and are valued using a projected AUM weighted average growth rate of 18.0% for one acquisition, and revenue growth rates and discount rates ranging from 4.0% to 31.0% and 1.4% to 6.4%, respectively, for the three acquisitions.
The MLOA contingent payment arrangements associated with the Agreement (with a fair value of $4 million as of December 31, 2017 is measured using projected premiums from these policies, net of potential surrenders and terminations, and applying a risk-adjusted discount factor (7% at December 31, 2017) to the resulting cash flows.
F-73
Table of Contents
The carrying values and fair values at December 31, 2017 and 2016 for financial instruments not otherwise disclosed in Notes 3 and 12 are presented in the table below. Certain financial instruments are exempt from the requirements for fair value disclosure, such as insurance liabilities other than financial guarantees and investment contracts, limited partnerships accounted for under the equity method and pension and other postretirement obligations.
| Carrying Value |
Fair Value | |||||||||||||||||||
| Level 1 | Level 2 | Level 3 | Total | |||||||||||||||||
| (in millions) | ||||||||||||||||||||
| December 31, 2017: |
||||||||||||||||||||
| Mortgage loans on real estate |
$ | 10,952 | $ | — | $ | — | $ | 10,912 | $ | 10,912 | ||||||||||
| Loans to affiliates |
1,230 | — | 1,230 | — | 1,230 | |||||||||||||||
| Policyholders liabilities: Investment contracts |
2,224 | — | — | 2,329 | 2,329 | |||||||||||||||
| FHLBNY funding agreements |
3,014 | — | 3,020 | — | 3,020 | |||||||||||||||
| Short term and long-term debt |
2,408 | — | 2,500 | — | 2,500 | |||||||||||||||
| Loans from affiliates |
3,622 | — | 3,622 | — | 3,622 | |||||||||||||||
| Policy loans |
3,819 | — | — | 4,754 | 4,754 | |||||||||||||||
| Separate Account liabilities |
7,537 | — | — | 7,537 | 7,537 | |||||||||||||||
| December 31, 2016: |
||||||||||||||||||||
| Mortgage loans on real estate |
$ | 9,774 | $ | — | $ | — | $ | 9,624 | $ | 9,624 | ||||||||||
| Loans to affiliates |
1,246 | — | 1,361 | — | 1,361 | |||||||||||||||
| Policyholders liabilities: Investment contracts |
2,398 | — | — | 2,510 | 2,510 | |||||||||||||||
| FHLBNY funding agreements |
2,255 | — | 2,202 | — | 2,202 | |||||||||||||||
| Short term and long-term debt |
1,605 | — | 1,716 | — | 1,716 | |||||||||||||||
| Loans from affiliates |
2,904 | — | 3,031 | — | 3,031 | |||||||||||||||
| Policy loans |
3,855 | — | — | 4,742 | 4,742 | |||||||||||||||
| Separate Account liabilities |
6,194 | — | — | 6,194 | 6,194 | |||||||||||||||
Fair values for commercial and agricultural mortgage loans on real estate are measured by discounting future contractual cash flows to be received on the mortgage loan using interest rates at which loans with similar characteristics and credit quality would be made. The discount rate is derived from taking the appropriate U.S. Treasury rate with a like term to the remaining term of the loan and adding a spread reflective of the risk premium associated with the specific loan. Fair values for mortgage loans anticipated to be foreclosed and problem mortgage loans are limited to the fair value of the underlying collateral, if lower.
Fair values for the Company’s long-term debt related to real estate joint ventures is determined by a third party appraisal and assessed for reasonableness. The Company’s short-term debt primarily includes commercial paper with short term maturities and book value approximates fair value. The fair values of the Company’s borrowing and lending arrangements with AXA affiliated entities are determined in the same manner as for such transactions with third parties, including matrix pricing models for debt securities and discounted cash flow analysis for mortgage loans.
The fair value of policy loans is calculated by discounting expected cash flows based upon the U.S. Treasury yield curve and historical loan repayment patterns.
Fair values for FHLBNY funding agreements are determined from a matrix pricing model and are internally assessed for reasonableness. The matrix pricing model for FHLBNY funding agreements utilizes an independently sourced U.S. Treasury curve which is separately sourced from the Barclays’ suite of curves.
The fair values for the Company’s association plans contracts, supplementary contracts not involving life contingencies (“SCNILC”), deferred annuities and certain annuities, which are included in Policyholders’ account balances and liabilities for investment contracts with fund investments in Separate Accounts are estimated using projected cash flows discounted at rates reflecting current market rates. Significant unobservable inputs reflected in the cash flows include lapse rates and withdrawal rates. Incremental adjustments may be made to the fair value to reflect non-performance risk. Certain other products such as Access Accounts and escrow shield plus product reserves are held at book value.
F-74
Table of Contents
| 8) | Insurance Liabilities |
| A) | Variable Annuity Contracts – GMDB, GMIB, GIB and GWBL and Other Features |
The Company has certain variable annuity contracts with GMDB, GMIB, GIB and GWBL and other features in-force that guarantee one of the following:
| • | Return of Premium: the benefit is the greater of current account value or premiums paid (adjusted for withdrawals); |
| • | Ratchet: the benefit is the greatest of current account value, premiums paid (adjusted for withdrawals), or the highest account value on any anniversary up to contractually specified ages (adjusted for withdrawals); |
| • | Roll-Up: the benefit is the greater of current account value or premiums paid (adjusted for withdrawals) accumulated at contractually specified interest rates up to specified ages; |
| • | Combo: the benefit is the greater of the ratchet benefit or the roll-up benefit, which may include either a five year or an annual reset; or |
| • | Withdrawal: the withdrawal is guaranteed up to a maximum amount per year for life. |
The following table summarizes the direct GMDB and GMIB with no NLG features liabilities, before reinsurance ceded, reflected in the consolidated balance sheets in future policy benefits and other policyholders’ liabilities:
| GMDB | GMIB | Total | ||||||||||
| (in millions) | ||||||||||||
| Balance at January 1, 2015 |
$ | 1,732 | 4,703 | $ | 6,435 | |||||||
| Paid guarantee benefits |
(313 | ) | (90 | ) | (403 | ) | ||||||
| Other changes in reserve |
1,580 | (728 | ) | 852 | ||||||||
|
|
|
|
|
|
|
|||||||
| Balance at December 31, 2015 |
2,999 | 3,885 | 6,884 | |||||||||
| Paid guarantee benefits |
(357 | ) | (281 | ) | (638 | ) | ||||||
| Other changes in reserve |
528 | 264 | 792 | |||||||||
|
|
|
|
|
|
|
|||||||
| Balance at December 31, 2016 |
3,170 | 3,868 | 7,038 | |||||||||
| Paid guarantee benefits |
(354 | ) | (151 | ) | (505 | ) | ||||||
| Other changes in reserve |
1,269 | 1,083 | 2,352 | |||||||||
|
|
|
|
|
|
|
|||||||
| Balance at December 31, 2017 |
$ | 4,085 | $ | 4,800 | $ | 8,885 | ||||||
|
|
|
|
|
|
|
|||||||
The following table summarizes the ceded GMDB liabilities, reflected in the consolidated balance sheets in amounts due from reinsurers:
| GMDB | ||||
| (in millions) | ||||
| Balance at January 1, 2015 |
$ | 68 | ||
| Paid guarantee benefits |
(18 | ) | ||
| Other changes in reserve |
48 | |||
|
|
|
|||
| Balance at December 31, 2015 |
98 | |||
| Paid guarantee benefits |
(15 | ) | ||
| Other changes in reserve |
7 | |||
|
|
|
|||
| Balance at December 31, 2016 |
90 | |||
| Paid guarantee benefits |
(14 | ) | ||
| Other changes in reserve |
32 | |||
|
|
|
|||
| Balance at December 31, 2017 |
$ | 108 | ||
|
|
|
|||
F-75
Table of Contents
The following table summarizes the assumed GMDB liabilities, reflected in the consolidated balance sheets in future policy benefits and other policyholders’ liabilities:
| GMDB | ||||
| (in millions) | ||||
| Balance at January 1, 2015 |
$ | 121 | ||
| Paid guarantee benefits |
(32 | ) | ||
| Other changes in reserve |
46 | |||
|
|
|
|||
| Balance at December 31, 2015 |
135 | |||
| Paid guarantee benefits |
(33 | ) | ||
| Other changes in reserve |
19 | |||
|
|
|
|||
| Balance at December 31, 2016 |
121 | |||
| Paid guarantee benefits |
(21 | ) | ||
| Other changes in reserve |
(5 | ) | ||
|
|
|
|||
| Balance at December 31, 2017 |
$ | 95 | ||
|
|
|
|||
The liability for the GMxB derivative features liability, the liability for SCS, SIO, MSO and IUL indexed features and the GMIB reinsurance contracts are considered embedded or freestanding insurance derivatives and are reported at fair value. Summarized in the table below is a summary of the fair value of these liabilities at December 31, 2017 and 2016:
| December 31, | ||||||||
| 2017 | 2016 | |||||||
| (in millions) | ||||||||
| GMIBNLG (1) |
$ | 4,056 | $ | 5,158 | ||||
| SCS, SIO, MSO, IUL features (2) |
1,786 | 940 | ||||||
| Assumed GMIB reinsurance Contracts(1) |
194 | 258 | ||||||
| GWBL/GMWB(1) |
130 | 114 | ||||||
| GIB(1) |
(27 | ) | 30 | |||||
| GMAB(1) |
5 | 20 | ||||||
|
|
|
|
|
|||||
| Total Embedded and Freestanding derivative liability |
$ | 6,144 | $ | 6,520 | ||||
|
|
|
|
|
|||||
| GMIB reinsurance contract asset (3) |
$ | 1,894 | $ | 1,735 | ||||
|
|
|
|
|
|||||
| (1) | Reported in future policyholders’ benefits and other policyholders’ liabilities in the consolidated balance sheets. |
| (2) | Reported in policyholders’ account balances in the consolidated balance sheets. |
| (3) | Reported in GMIB reinsurance contract asset, at fair value in the consolidated balance sheets. |
F-76
Table of Contents
The December 31, 2017 values for direct variable annuity contracts in force on such date with GMDB and GMIB features are presented in the following table. For contracts with the GMDB feature, the net amount at risk in the event of death is the amount by which the GMDB exceed related account values. For contracts with the GMIB feature, the net amount at risk in the event of annuitization is the amount by which the present value of the GMIB benefits exceeds related account values, taking into account the relationship between current annuity purchase rates and the GMIB guaranteed annuity purchase rates. Since variable annuity contracts with GMDB guarantees may also offer GMIB guarantees in the same contract, the GMDB and GMIB amounts listed are not mutually exclusive:
| Return of Premium |
Ratchet | Roll-Up | Combo | Total | ||||||||||||||||
| (in millions; except age and interest rate) | ||||||||||||||||||||
| GMDB |
||||||||||||||||||||
| Account values invested in: |
||||||||||||||||||||
| General Account |
$ | 13,821 | $ | 109 | $ | 65 | $ | 200 | $ | 14,195 | ||||||||||
| Separate Accounts |
$ | 45,815 | $ | 9,556 | $ | 3,515 | $ | 35,784 | $ | 94,670 | ||||||||||
| Net amount at risk, gross |
$ | 169 | $ | 57 | $ | 1,961 | $ | 15,340 | $ | 17,527 | ||||||||||
| Net amount at risk, net of amounts reinsured |
$ | 169 | $ | 53 | $ | 1,344 | $ | 15,340 | $ | 16,906 | ||||||||||
| Average attained age of policyholders |
51.3 | 66.4 | 73.0 | 68.3 | 55.2 | |||||||||||||||
| Percentage of policyholders over age 70 |
9.6 | % | 40.2 | % | 63.1 | % | 46.5 | % | 18.1 | % | ||||||||||
| Range of contractually specified interest rates |
N.A. | N.A. | 3% - 6 | % | 3% - 6.5 | % | 3% - 6.5 | % | ||||||||||||
| GMIB |
||||||||||||||||||||
| Account values invested in: |
||||||||||||||||||||
| General Account |
N.A. | N.A. | $ | 23 | $ | 293 | $ | 316 | ||||||||||||
| Separate Accounts |
N.A. | N.A. | $ | 21,195 | $ | 41,091 | $ | 62,286 | ||||||||||||
| Net amount at risk, gross |
N.A. | N.A. | 918 | 6,337 | $ | 7,255 | ||||||||||||||
| Net amount at risk, net of amounts reinsured |
N.A. | N.A. | $ | 287 | $ | 5,749 | $ | 6,036 | ||||||||||||
| Weighted average years remaining until annuitization |
N.A. | N.A. | 1.7 | 0.8 | 0.9 | |||||||||||||||
| Range of contractually specified interest rates |
N.A. | N.A. | 3% - 6 | % | 3% - 6.5 | % | 3% - 6.5 | % | ||||||||||||
The December 31, 2017 values for assumed variable annuity contracts in force on such date with GMDB and GMIB features are presented in the following table:
| Return of Premium or Reset |
Ratchet | Roll-Up | Combo | Total | ||||||||||||||||
| (in millions, except age and interest rates) | ||||||||||||||||||||
| GMDB |
||||||||||||||||||||
| Reinsured Account values |
$ | 1,071 | $ | 6,102 | $ | 318 | $ | 1,968 | $ | 9,459 | ||||||||||
| Net amount at risk assumed |
$ | 7 | $ | 291 | $ | 24 | $ | 315 | $ | 637 | ||||||||||
| Average attained age of policyholders |
66.8 | 71.8 | 76.8 | 75 | 72.1 | |||||||||||||||
| Percentage of policyholders over age 70 |
40.4 | % | 60.7 | % | 76.4 | % | 73.7 | % | 61.6 | % | ||||||||||
| Range of contractually specified interest rates |
N/A | N/A | 3%-10 | % | 5%-10 | % | 3%-10 | % | ||||||||||||
| GMIB |
||||||||||||||||||||
| Reinsured Account values |
$ | 1,022 | $ | 55 | $ | 289 | $ | 1,390 | $ | 2,756 | ||||||||||
| Net amount at risk assumed |
$ | 2 | $ | — | $ | 38 | $ | 241 | $ | 281 | ||||||||||
| Average attained age of policyholders |
71.2 | 73.4 | 71 | 68.2 | 69.7 | |||||||||||||||
| Percentage of policyholders over age 70 |
61.6 | % | 61.9 | % | 55.5 | % | 47.7 | % | 54.0 | % | ||||||||||
| Range of contractually specified interest rates(1) |
N/A | N/A | 3.3%-6.5 | % | 6%-6 | % | 3.3%-6.5 | % | ||||||||||||
| (1) | In general, for policies with the highest contractual interest rate shown (10%), the rate applied only for the first 10 years after issue, which have now elapsed. |
F-77
Table of Contents
For more information about the reinsurance programs of the Company’s GMDB and GMIB exposure, see “Reinsurance Agreements” in Note 9.
Variable Annuity In-force Management. The Company proactively manages its variable annuity in-force business. Since in 2012, the Company has initiated several programs to purchase from certain policyholders the GMDB and GMIB riders contained in their Accumulator contracts. In March 2016, a program to give policyholders an option to elect a full buyout of their rider or a new partial (50%) buyout of their rider expired. The Company believes that buyout programs are mutually beneficial to both the Company and policyholders who no longer need or want all or part of the GMDB or GMIB rider. To reflect the actual payments from the buyout program that expired in March 2016 the Company recognized an $18 million increase to Net income in 2016.
| B) | Separate Account Investments by Investment Category Underlying GMDB and GMIB Features |
The total account values of variable annuity contracts with GMDB and GMIB features include amounts allocated to the guaranteed interest option, which is part of the General Account and variable investment options that invest through Separate Accounts in variable insurance trusts. The following table presents the aggregate fair value of assets, by major investment category, held by Separate Accounts that support variable annuity contracts with GMDB and GMIB guarantees. The investment performance of the assets impacts the related account values and, consequently, the net amount of risk associated with the GMDB and GMIB benefits and guarantees. Because variable annuity contracts offer both GMDB and GMIB features, GMDB and GMIB amounts are not mutually exclusive.
Investment in Variable Insurance Trust Mutual Funds
| December 31, | ||||||||
| 2017 | 2016 | |||||||
| (in millions) | ||||||||
| GMDB |
||||||||
| Equity |
$ | 78,069 | $ | 69,625 | ||||
| Fixed income |
2,234 | 2,483 | ||||||
| Balanced |
14,084 | 14,434 | ||||||
| Other |
283 | 348 | ||||||
|
|
|
|
|
|||||
| Total |
$ | 94,670 | $ | 86,890 | ||||
|
|
|
|
|
|||||
| GMIB |
||||||||
| Equity |
$ | 50,429 | $ | 45,931 | ||||
| Fixed income |
1,568 | 1,671 | ||||||
| Balanced |
10,165 | 10,097 | ||||||
| Other |
124 | 150 | ||||||
|
|
|
|
|
|||||
| Total |
$ | 62,286 | $ | 57,849 | ||||
|
|
|
|
|
|||||
| C) | Hedging Programs for GMDB, GMIB, GIB and Other Features |
Beginning in 2003, the Company established a program intended to hedge certain risks associated first with the GMDB feature and, beginning in 2004, with the GMIB feature of the Accumulator series of variable annuity products. The program has also been extended to cover other guaranteed benefits as they have been made available. This program utilizes derivative contracts, such as exchange-traded equity, currency and interest rate futures contracts, total return and/or equity swaps, interest rate swap and floor contracts, swaptions, variance swaps as well as equity options, that collectively are managed in an effort to reduce the economic impact of unfavorable changes in guaranteed benefits’ exposures attributable to movements in the capital markets. At the present time, this program hedges certain economic risks on products sold from 2001
F-78
Table of Contents
forward, to the extent such risks are not externally reinsured. At December 31, 2017, the total account value and net amount at risk of the hedged variable annuity contracts were $70,554 million and $15,952 million, respectively, with the GMDB feature and $59,297 million and $6,801 million, respectively, with the GMIB and GIB feature. A hedge program is also used to manage certain capital markets risks associated with the products the Company has assumed that have GMDB and GMIB features. At December 31, 2017, the total account value and net amount at risk of the hedged assumed variable annuity contracts were $9,459 million and $637 million, respectively, with the GMDB feature and $2,756 million and $281 million, respectively, with the GMIB feature.
These programs do not qualify for hedge accounting treatment. Therefore, gains (losses) on the derivatives contracts used in these programs, including current period changes in fair value, are recognized in net investment income (loss) in the period in which they occur, and may contribute to income (loss) volatility.
| D) | Variable and Interest-Sensitive Life Insurance Policies – NLG |
The NLG feature contained in variable and interest-sensitive life insurance policies keeps them in force in situations where the policy value is not sufficient to cover monthly charges then due. The NLG remains in effect so long as the policy meets a contractually specified premium funding test and certain other requirements.
The following table summarizes the NLG liabilities, reflected in the General Account in Future policy benefits and other policyholders’ liabilities, the related reinsurance reserve ceded, reflected in Amounts due from reinsurers and deferred cost of reinsurance, reflected in Other assets in the Consolidated balance sheets:
| Direct Liability(1) |
||||
| (in millions) | ||||
| Balance at January 1, 2015 |
$ | 1,070 | ||
| Other changes in reserves |
174 | |||
|
|
|
|||
| Balance at December 31, 2015 |
1,244 | |||
| Other changes in reserves |
63 | |||
|
|
|
|||
| Balance at December 31, 2016 |
1,307 | |||
| Paid guarantee benefits |
(24 | ) | ||
|
|
|
|||
| Other changes in reserves |
(597 | ) | ||
|
|
|
|||
| Balance at December 31, 2017 |
$ | 686 | ||
|
|
|
|||
| (1) | There were no amounts of reinsurance ceded in any period presented. |
| 9) | REINSURANCE AGREEMENTS |
The Company assumes and cedes reinsurance with other insurance companies. The Company evaluates the financial condition of its reinsurers to minimize its exposure to significant losses from reinsurer insolvencies. Ceded reinsurance does not relieve the originating insurer of liability.
F-79
Table of Contents
The following table summarizes the effect of reinsurance:
| Years ended December 31, | ||||||||||||
| 2017 | 2016 | 2015 | ||||||||||
| (in millions) | ||||||||||||
| Direct premiums |
$ | 1,038 | $ | 998 | $ | 982 | ||||||
| Reinsurance assumed |
225 | 231 | 234 | |||||||||
| Reinsurance ceded |
(139 | ) | (146 | ) | (146 | ) | ||||||
|
|
|
|
|
|
|
|||||||
| Premiums |
$ | 1,124 | $ | 1,083 | $ | 1,070 | ||||||
|
|
|
|
|
|
|
|||||||
| Policy charges and fee income ceded |
$ | 381 | $ | 393 | $ | 378 | ||||||
|
|
|
|
|
|
|
|||||||
| Policyholders’ benefits ceded |
$ | 657 | $ | 871 | $ | 695 | ||||||
|
|
|
|
|
|
|
|||||||
| Interest Credited to Policyholders’ Account Balances Ceded |
$ | 46 | $ | 51 | $ | 62 | ||||||
|
|
|
|
|
|
|
|||||||
Ceded Reinsurance
The Company reinsures most of its new variable life, UL and term life policies on an excess of retention basis. The Company generally retains on a per life basis up to $25 million for single lives and $30 million for joint lives with the excess 100% reinsured. The Company also reinsures risk on certain substandard underwriting risks and in certain other cases.
At December 31, 2017 and 2016, the Company had reinsured with non-affiliates in the aggregate approximately 3.5% and 3.6%, respectively, of its current exposure to the GMDB obligation on annuity contracts in-force and, subject to certain maximum amounts or caps in any one period, approximately 16.8% and 11.8% of its current liability exposure, respectively, resulting from the GMIB feature. For additional information, see Note 8 “Insurance Liabilities.”
Based on management’s estimates of future contract cash flows and experience, the estimated net fair values of the ceded GMIB reinsurance contracts, considered derivatives at December 31, 2017 and 2016 were $1,894 million and $1,735 million, respectively. The increases (decreases) in estimated fair value were $159 million, $(93) million and $(322) million for 2017, 2016 and 2015, respectively.
At December 31, 2017 and 2016, third-party reinsurance recoverables related to insurance contracts amounted to $5,023 million and $5,220 million, respectively. Additionally, $2,962 million and $3,096 million of the amounts due from reinsurers relates to two reinsurers, Zurich Insurance Company, Ltd. (AA- rating by S&P) and Protective Life Insurance Company (AA- rating by S&P). A contingent liability exists with respect to reinsurance, should the reinsurers be unable to meet their obligations the Company continues to have the direct obligation.
At December 31, 2017 and 2016, amounts due to reinsurers were $1,436 million and $1,509 million, respectively. Included in this balance were policy loans ceded to RGA Reinsurance Company of $1,212 million and $1,289 million, respectively and policy loans ceded to Protective Life of $128 million and $130 million, respectively.
The Company cedes substantially all of its group health business to a third party insurer. Insurance liabilities ceded totaled $71 million and $82 million at December 31, 2017 and 2016, respectively.
The Company also cedes a portion of its extended term insurance and paid-up life insurance and substantially all of its individual disability income business through various coinsurance agreements.
Assumed Reinsurance
In addition to the sale of insurance products, the Company currently acts as a professional retrocessionaire by assuming risk from professional reinsurers. The Company also has a run-off portfolio of assumed
F-80
Table of Contents
reinsurance liabilities at ACS Life. The Company assumes accident, life, health, annuity (including products covering GMDB and GMIB benefits), aviation, special risk and space risks by participating in or reinsuring various reinsurance pools and arrangements. Reinsurance assumed reserves were $1,111 million and $1,165 million (including assumed GMIB reserves that have an estimated net fair value of $194 million and $258 million) at December 31, 2017 and 2016, respectively.
For affiliated reinsurance agreements, see “Related Party Transactions” in Note 11.
| 10) | SHORT-TERM AND LONG TERM DEBT |
Short-term and long term debt consists of the following:
| December 31, | ||||||||
| 2017 | 2016 | |||||||
| (in millions) | ||||||||
| Short-term debt: |
||||||||
| AB revolving credit facility (with interest rate of 2.4%) |
$ | 75 | $ | — | ||||
| AB commercial paper (with interest rates of 1.6% and 0.9%) |
491 | 513 | ||||||
| AXA Financial commercial paper (with interest rates of 1.6% and 1.5%) |
1,290 | 743 | ||||||
|
|
|
|
|
|||||
| Total short-term debt |
$ | 1,856 | $ | 1,256 | ||||
|
|
|
|
|
|||||
| Long-term debt: |
||||||||
| AXA Financial Senior Debentures, 7.0%, due 2028 |
349 | 349 | ||||||
| AXA Equitable non-recourse mortgage debt (with interest rate of 4.1%) |
82 | — | ||||||
| AXA Equitable non-recourse mortgage debt (with interest rate of 3.9%) |
121 | — | ||||||
|
|
|
|
|
|||||
| Total Short-term and Long-term debt |
$ | 2,408 | $ | 1,605 | ||||
|
|
|
|
|
|||||
Short-term Debt
On December 1, 2016, AB entered into a $200 million, unsecured 364-day senior revolving credit facility (the “AB Revolver”) with a leading international bank and the other lending institutions that may be party thereto. On November 29, 2017, as part of an amendment and restatement, the maturity date of the AB Revolver was extended from November 29, 2017 to November 28, 2018. There were no other significant changes included in the amendment. The AB Revolver is available for AB’s and SCB LLC’s business purposes, including the provision of additional liquidity to meet funding requirements primarily related to SCB LLC’s operations. Both AB and SCB LLC can draw directly under the AB Revolver and management expects to draw on the AB Revolver from time to time. AB has agreed to guarantee the obligations of SCB LLC under the AB Revolver. The AB Revolver contains affirmative, negative and financial covenants which are identical to those of the AB Credit Facility described below. As of December 31, 2017, AB had $75 million outstanding under the AB Revolver with an interest rate of 2.4%.
As of December 31, 2017 and 2016, AB had $491 million and $513 million, respectively, in commercial paper outstanding with weighted average interest rates of approximately 1.6% and 0.9%, respectively.
In June 2009, AXA Financial and AXA initiated a commercial paper program on a private placement basis under which AXA Financial or AXA may issue short-term unsecured notes in an aggregate amount not to exceed $2,000 million outstanding at any time. The obligations of AXA Financial are guaranteed by AXA. At December 31, 2017 and 2016, $1,290 million and $743 million were outstanding with interest rates of 1.6% and 1.5%, respectively.
Long-term Debt
As of December 31, 2017, AXA Financial had outstanding $349 million aggregate principal amount of 7% Senior Debentures due 2028 (the “Senior Debentures”). The Senior Debentures are the unsecured, senior
F-81
Table of Contents
indebtedness of AXA Financial. The Senior Debentures contain customary affirmative and negative covenants, including a limitation on liens and a limit on AXA Financial’s ability to consolidate, merge or sell or otherwise dispose of all or substantially all of its assets. The Senior Debentures also include customary events of default (with customary grace periods, as applicable), including provisions under which, upon the occurrence of an event of default, all outstanding Senior Debentures may be accelerated. At December 31, 2017, AXA Financial was not in breach of any of the covenants contained in the Senior Debentures.
As of December 31, 2017, AXA Equitable had $121 million on and $82 million in mortgage debt outstanding on two consolidated real estate joint ventures due August 2027 and September 2022 respectively, with a weighted average interest rates of approximately 3.9% and 4.1%, respectively.
Credit facilities available to the Company consist of following:
| Date | Available to Company |
|||||||||||||||||||
| Facilities |
Start | Maturity | Total Facility |
Revolver | Swingline | |||||||||||||||
| (In Millions) | ||||||||||||||||||||
| Bilateral Facilities: |
||||||||||||||||||||
| JP Morgan |
5/7/2014 | 5/7/2019 | $ | 400 | $ | 250 | $ | 250 | ||||||||||||
| Citibank |
12/18/2015 | 12/18/2020 | $ | 300 | $ | 300 | $ | 300 | ||||||||||||
| BAML |
7/28/2016 | 7/28/2021 | $ | 450 | $ | 300 | $ | 300 | ||||||||||||
| Syndicated Facilities: |
||||||||||||||||||||
| Club Deal (HSBC as Agent) |
12/12/2014 | 12/11/2020 | € | 1,570 | € | 1,570 | $ | 1,000 | ||||||||||||
| Club Deal (Citibank as Agent) |
6/26/2015 | 6/26/2021 | $ | 1,295 | $ | 250 | $ | 250 | ||||||||||||
| AB Revolver |
11/29/2017 | 11/28/2018 | $ | 200 | $ | 200 | $ | — | ||||||||||||
| AB Credit Facility |
10/22/2014 | 10/22/2019 | $ | 1,000 | $ | 1,000 | $ | 240 | ||||||||||||
| Affiliated Facilities: |
||||||||||||||||||||
| AXA S.A. |
11/18/2016 | 11/18/2019 | $ | 1,500 | $ | 1,500 | $ | — | ||||||||||||
Additional Credit Facilities Available
In May 2014, AXA and AXA Financial entered into a credit agreement with J. P. Morgan Chase Bank. The credit agreement calls for a $250 million multicurrency revolving credit facility (including a swingline facility). In July 2017, AXA and AXA Financial amended the credit agreement with J.P. Morgan Chase Bank to increase the multicurrency revolving credit facility from $250 million to $400 million. Under the terms of the amended credit agreement, up to $250 million is available to AXA Financial for general corporate purposes and Commercial Paper refinancing (“CP refinancing”). The obligations of AXA Financial are guaranteed by AXA. At December 31, 2017, no borrowings were outstanding.
In December 2015, AXA and AXA Financial entered into a credit agreement with Citibank which calls for a $300 million multicurrency revolving credit facility (including a swingline facility). Under the terms of the credit agreement, up to $300 million is available to AXA Financial for general corporate purpose and CP refinancing until its maturity. The obligations of AXA Financial are guaranteed by AXA. At December 31, 2017, no borrowings were outstanding.
In July 2016, AXA and AXA Financial entered into a credit agreement with Bank of America Merrill Lynch. The credit agreement calls for a $300 million multicurrency revolving credit facility (including a swingline facility). In July 2017, AXA and AXA Financial amended the credit agreement to increase the multicurrency revolving credit facility from $300 million to $450 million. Under the terms of the amended credit agreement, up to $300 million is available to AXA Financial for general corporate purposes and CP refinancing until its maturity. The obligations of AXA Financial are guaranteed by AXA. At December 31, 2017, no borrowings were outstanding.
F-82
Table of Contents
In December 2014, AXA, AXA Financial, AXA Arizona RE and CS Life Re entered into a credit agreement with a number of major European lending institutions. The credit agreement provides for an unsecured revolving credit facility totaling €1,570 million (or its equivalent in optional currencies). The obligations of AXA Financial, AXA Arizona RE and CS Life Re are guaranteed by AXA. Amounts under the credit agreement may be borrowed for general corporate purposes and CP refinancing. At December 31, 2017, no borrowings were outstanding.
In June 2015, AXA and AXA Financial entered into a club deal credit facility with a number of lending institutions. The credit agreement provides for an unsecured revolving credit facility totaling $1,295 million (or its equivalent in optional currencies). The aggregated maximum amount which may be utilized by AXA Financial in respect of revolving loans or swingline advances is $250 million. AXA Financial may only draw loans denominated in U.S. dollars. The obligations of AXA Financial are guaranteed by AXA. Loans drawn under the credit agreement may be borrowed for general corporate purposes and swingline advances for CP refinancing until its maturity. At December 31, 2017, no borrowings were outstanding under this facility.
In November 2016, AXA Arizona RE entered into a revolving facility agreement with AXA. The credit agreement provides for an unsecured revolving credit facility totaling $1,500 million with a 3 year maturity. At December 31, 2017, no borrowings were outstanding under this facility.
AB has a $1,000 million committed, unsecured senior revolving credit facility (“AB Credit Facility”) with a group of commercial banks and other lenders, which matures on October 22, 2019. The AB Credit Facility provides for possible increases in the principal amount by up to an aggregate incremental amount of $250 million; any such increase is subject to the consent of the affected lenders. The AB Credit Facility is available for AB and SCB LLC’s business purposes, including the support of AB’s $1,000 million commercial paper program. Both AB and SCB LLC can draw directly under the AB Credit Facility and management may draw on the AB Credit Facility from time to time. AB has agreed to guarantee the obligations of SCB LLC under the AB Credit Facility.
The AB Credit Facility contains affirmative, negative and financial covenants, which are customary for facilities of this type, including restrictions on dispositions of assets, restrictions on liens, a minimum interest coverage ratio and a maximum leverage ratio. As of December 31, 2017, AB and SCB LLC were in compliance with these covenants. The AB Credit Facility also includes customary events of default (with customary grace periods, as applicable), including provisions under which, upon the occurrence of an event of default, all outstanding loans may be accelerated and/or lender’s commitments may be terminated. Also, under such provisions, upon the occurrence of certain insolvency- or bankruptcy-related events of default, all amounts payable under the AB Credit Facility automatically would become immediately due and payable, and the lender’s commitments automatically would terminate.
Amounts under the AB Credit Facility may be borrowed, repaid and re-borrowed by AB and SBC LLC from time to time until the maturity of the facility. Voluntary prepayments and commitment reductions requested by AB and SBC LLC are permitted at any time without fee (other than customary breakage costs relating to the prepayment of any drawn loans) upon proper notice and subject to a minimum dollar requirement. Borrowings under the AB Credit Facility bear interest at a rate per annum, which will be, at AB and SBC LLC’S option, a rate equal to an applicable margin, which is subject to adjustment based on the credit ratings of AB, plus one of the following indexes: London Interbank Offered Rate; a floating base rate; or the Federal Funds rate.
As of December 31, 2017, AB and SCB LLC had no amounts outstanding under the AB Credit Facility and did not draw upon the AB Credit Facility in 2017.
SCB LLC has three uncommitted lines of credit with three financial institutions. Two of these lines of credit permit SCB LLC to borrow up to an aggregate of approximately $175 million, with AB named as an additional borrower, while one line has no stated limit. As of December 31, 2017, SCB LLC had no bank loans outstanding.
F-83
Table of Contents
In July 2011, AXA, AXA Financial and AXA RE Arizona Company (“AXA Arizona RE”) entered into a multi-currency revolving credit facility with a number of lending institutions. The credit agreement provides for an unsecured revolving credit facility totaling €4,000 million (or its equivalent in optional currencies). In July 2017, AXA Financial, AXA, and AXA Arizona RE voluntarily canceled their participation in this facility.
| 11) | RELATED PARTY TRANSACTIONS |
In the normal course of business, the Company enters into various transactions with affiliated companies. Parties are considered to be related if one party has the ability to control or exercise significant influence over the other party in making financial or operating decisions.
| At December 31, | ||||||||
| 2017 | 2016 | |||||||
| (in millions) | ||||||||
| Loans to Affiliates: |
||||||||
| Loans to AXA |
||||||||
| 2007 Senior Unsecured Note, 5.7%, due 2020 |
$ | 700 | $ | 700 | ||||
| 2008 Senior Unsecured Note, 5.4%, due 2020 |
200 | 201 | ||||||
| Unsecured Loan to AXA IM Holding US, 3 month LIBOR +1.5%, due 2025 |
185 | 185 | ||||||
| Unsecured Loan to Colisée Re. 4.75%, due 2028 |
145 | 145 | ||||||
| Unsecured Loan to AXA Technology Services SAS, 2.0%, due 2017 |
— | 10 | ||||||
| Unsecured Loan to AXA Technology Services Mexico SA, 2.0%, due 2017 |
— | 2 | ||||||
| Unsecured Loan to PT AXA Technology Services Asia Indonesia, 6.0%, due 2028 |
— | 3 | ||||||
|
|
|
|
|
|||||
| Total Loans to Affiliates |
$ | 1,230 | $ | 1,246 | ||||
|
|
|
|
|
|||||
Loans to Affiliates. In September 2007, AXA received a $650 million 5.4% Senior Unsecured Note from AXA Equitable. The note pays interest semi-annually and was scheduled to mature on September 30, 2012. In March 2011, the maturity date of the note was extended to December 30, 2020 and the interest rate was increased to 5.7%. In third quarter 2013, AXA Equitable purchased AXA RE Arizona Company’s (“AXA Arizona”) $50 million note receivable from AXA. AXA Arizona is a wholly-owned subsidiary of AXA Financial. This note pays interest semi-annually at an interest rate of 5.4% and matures on December 15, 2020.
In December 2008, AXA received a $500 million term loan from AXA Financial. In December 2014, AXA repaid $300 million on this term loan to AXA Financial plus accrued interest. This term loan has an interest rate of 5.4% payable semi-annually with a maturity date of December 15, 2020. As of December 31, 2017 there was an outstanding balance of $200 million on this term loan.
In December 2015, AXA IM Holding US received a $185 million 3 month LIBOR plus 1.5% unsecured loan from AXA Financial. The loan pays interest quarterly and is scheduled to mature on December 10, 2025.
In December 2013, Colisée Re received a $145 million 4.75% loan from Holdings. The loan is scheduled to mature on December 19, 2028.
In September 2016, AXA Technology Services SAS received a $12 million 2.0% unsecured loan from AXA Tech. $2 million of this loan was repaid in December 2016, $5 million was repaid in January 2017 and the remainder of the loan was repaid on March 27, 2017.
In June 2016, AXA Technology Services Mexico SA received a $2 million 2.0% unsecured loan from AXA Tech. The loan was repaid on January 3, 2017.
In October 2016, PT AXA Technology Services Asia Indonesia received a $3 million 6.0% unsecured loan from AXA Tech. The loan is scheduled to mature on October 3, 2022. On December 31, 2017, this
F-84
Table of Contents
unsecured loan to PT AXA Technology Services Asia Indonesia was transferred from AXA Tech to AXA US Holdings, Inc.
| At December 31, | ||||||||
| 2017 | 2016 | |||||||
| (in millions) | ||||||||
| Loans from Affiliates: |
||||||||
| AXA S.A. term loan, 3 month LIBOR +1.06%, due 2024 |
$ | 1,007 | $ | 1,007 | ||||
| AXA Japan Subordinated Notes, floating rate of LIBOR +1.20%, due 2020 |
770 | 770 | ||||||
| AXA Belgium €300 million EURIBOR +0.06%, due 2018 |
391 | 391 | ||||||
| AXA S.A. loan, LIBOR + 1.44%, due 2022 |
366 | 366 | ||||||
| Coliseum Reinsurance Company, 4.75%, due 2028 |
387 | 387 | ||||||
| AXA America Corporate Solutions, Inc., 1.85%, due 2018 |
110 | 56 | ||||||
| Foreign Exchange impact of AXA Belgium loan |
(31 | ) | (73 | ) | ||||
| AXA S.A. loan, LIBOR + 0.439%, due 2018 |
622 | — | ||||||
|
|
|
|
|
|||||
| Total Loans From Affiliates |
$ | 3,622 | $ | 2,904 | ||||
|
|
|
|
|
|||||
Loans from Affiliates. In December 2014, AXA Financial issued a $2,727 million, 3 month LIBOR plus 1.06% margin term loan to AXA. The loan has a maturity date of December 18, 2024. In June 2015, AXA Financial repaid $520 million and during 2016 repaid an additional $1,200 million of this loan. The outstanding balance on this loan at December 31, 2017 and 2016 is $1,007 million and $1,007 million, respectively. The interest cost related to this loan totaled approximately $23 million, $23 million, and $33 million in 2017, 2016, and 2015, respectively.
In March 2010, AXA Financial issued Subordinated Notes to AXA Life Insurance Company Ltd., in the amount of $770 million. The Subordinated Notes have a maturity date of March 30, 2020 and a floating interest rate of LIBOR plus 1.20%, which resets semiannually on March 30 and September 30. The 2017, 2016 and 2015 interest cost related to the Subordinated Notes totaled approximately $19 million, $16 million and $12 million, respectively.
In October 2012, AXA Financial issued a note denominated in Euros in the amount of €300 million or $391 million to AXA Belgium S.A. (“AXA Belgium”). This note had an interest rate of Europe Interbank Offered Rate (“EURIBOR”) plus 1.15% and a maturity date of October 23, 2017. Concurrently, AXA Financial entered into a swap with AXA, covering the exchange rate on both the interest and principal payments related to this note. The interest rate on the swap was 6-month LIBOR plus 1.475%. In October 2017, the note was extended to March 30, 2018. The extended note has a floating interest rate of 1-month EURIBOR plus 0.06% with a minimum rate of 0%. Concurrently, AXA Financial entered into a swap with AXA covering the exchange rate on both the interest and principal payments related to the extended note until March 30, 2018. The 2017, 2016, and 2015 interest cost related to this loan totaled approximately $12 million, $9 million, and $7 million, respectively.
The following loans were repaid in 2016:
| • | In December 2015, AXA Financial received a $300 million, 1-month LIBOR plus 0.58% unsecured loan from AXA. The loan was repaid on June 30, 2016. |
| • | In January 2016, AXA Financial pre-paid a $177 million term loan from AXA Insurance UK PLC and a $72 million term loan from AXA France IARD S.A. Both were previously reported in Loans from affiliates on the consolidated balance sheets. As a result of this pre-payment, AXA Financial incurred a prepayment penalty of $43 million. |
| • | In January 2016, AXA Tech repaid a $4 million 12-month LIBOR plus 1.42% loan from AXA Technology Services SAS. |
F-85
Table of Contents
In 2015, AXA America Holdings, Inc. received a $366 million, 3-month LIBOR plus 1.44% loan from AXA. The loan has a maturity date of October 8, 2022. The 2017, 2016, and 2015 interest cost related to this loan totaled approximately $9 million, $8 million, and $2 million, respectively.
In 2013, Holdings received $242 million and $145 million loans from Coliseum Reinsurance Company. The loans have maturity dates in December 2028. The balance at December 31, 2017 and 2016 was $387 million. The 2017, 2016 and 2015 interest cost related to these loans totaled approximately $18 million each year.
In 2017, Holdings repaid a $56 million 1.39% loan from AXA America Corporate Solutions, Inc. (“AXA CS”) originally made in 2015. The 2017, 2016, and 2015 interest cost related to the loan was approximately $2 million, $1 million, and $1 million, respectively. In 2017, Holdings received a $100 million loan and a $10 million loan from AXA CS. The loans have interest rates of 1.86% and 1.76%, respectively, and mature on February 5, 2018.
In December 2017, Holdings received a $622 million, 3-month LIBOR plus 0.439% margin term loan from AXA. The loan has a maturity date of June 8, 2018.
Credit Facilities. In November 2016, AXA Arizona entered into a revolving facility agreement with AXA. The credit agreement provides for an unsecured revolving credit facility totaling $1,500 million with a 3 year maturity. At December 31, 2017, no borrowings were outstanding under this facility.
Cost sharing and service agreements. The Company participates in certain cost sharing and service agreements with AXA and other nonconsolidated affiliates (collectively, “AXA Affiliates”). The costs related to the cost sharing and service agreements are allocated based on methods that management believes are reasonable, including a review of the nature of such costs and the activities performed to support each company.
In addition to the above, AXA allocates a portion of its corporate overhead expenses to the Company. Expenses associated with overhead costs were $35 million, $26 million and $24 million, in 2017, 2016 and 2015, respectively.
Investment management and service expenses. AXA Investment Managers Inc. (“AXA IM”) and AXA Rosenberg Investment Management LLC (“AXA Rosenberg”) provide sub-advisory services with respect to certain portfolios of EQAT, VIP Trust and the Other AXA Trusts. Also, AXA IM and AXA Real Estate Investment Managers (“AXA REIM”) manage certain General Account investments and AXA Strategic Ventures Corporation provides investment management services to AXA Strategic Ventures US, LLC. Fees paid to these affiliates are based on investment advisory service agreements with each affiliate.
Guarantees and Credit Facility. The Company pays fees to AXA for its guarantee of our borrowing under certain third-party credit facilities, AXA Financial’s Commercial Paper Program and AXA Financial’s loan from AXA Belgium. The Company also pays fees for AXA’s credit facility with AXA Arizona RE.
Investment management and service fees. AXA Equitable FMG provides investment management and administrative services to EQAT, VIP Trust, 1290 Funds and the Other AXA Trusts, all of which are considered related parties. Investment management and service fees earned are calculated as a percentage of assets under management and are recorded as revenue as the related services are performed.
F-86
Table of Contents
The table below summarizes the expenses reimbursed to/from the Company and the fees received/paid by the Company in connection with agreements with AXA Affiliates described above for 2017, 2016 and 2015.
| Year ended December 31, | ||||||||||||
| 2017 | 2016 | 2015 | ||||||||||
| (in millions) | ||||||||||||
| Expenses paid or accrued for |
||||||||||||
| General services provided by AXA Affiliates |
$ | 141 | $ | 118 | $ | 96 | ||||||
| Investment management services provided by AXA IM, AXA REIM, and AXA Rosenberg |
5 | 15 | 2 | |||||||||
| Investment management services provided by AXA Strategic Ventures Corporation (“ASV Corp”) |
2 | 2 | — | |||||||||
| Guarantees and credit facility |
9 | 12 | 12 | |||||||||
|
|
|
|
|
|
|
|||||||
| Total |
$ | 157 | $ | 147 | $ | 110 | ||||||
|
|
|
|
|
|
|
|||||||
| Revenue received or accrued for |
||||||||||||
| Investment management and administrative services provided to EQAT, VIP Trust, 1290 Funds and Other AXA Trusts |
$ | 720 | $ | 674 | $ | 707 | ||||||
| General services provided to AXA Affiliates |
27 | 29 | 25 | |||||||||
|
|
|
|
|
|
|
|||||||
| Total |
$ | 747 | $ | 703 | $ | 732 | ||||||
|
|
|
|
|
|
|
|||||||
Insurance related transactions.
Reinsurance Assumed
AXA Global Life retrocedes a quota share portion of certain life and health risks of various AXA affiliates to AXA Equitable Life and MLOA on a one-year term basis. Also, AXA Life Insurance Company Ltd. cedes a portion of its variable deferred annuity business to AXA Equitable Life.
Premiums earned in 2017, 2016 and 2015 were $8 million, $9 million and $8 million, respectively. Claims and expenses paid in 2017, 2016 and 2015 were $2 million, $2 million, and $2 million, respectively.
Reinsurance Ceded
AXA Equitable Life has entered into a stop loss reinsurance agreement with AXA Global Life to protect AXA Equitable Life with respect to a deterioration in its claim experience following the occurrence of an extreme mortality event.
AXA Equitable Life has accepted certain retrocession policies through reinsurance agreements with various reinsurers. AXA Equitable Life retrocedes to AXA Global Life the excess of its first retention layer.
Certain of our subsidiaries have entered into a Life Catastrophe Excess of Loss Reinsurance Agreement with a number of subscribing reinsurers, including AXA Global Life. AXA Global Life participates in 5% of the pool, pro-rata, across the upper and lower layers.
Premiums and expenses paid for the above agreements in 2017, 2016 and 2015 were $4 million, $4 million, and $4 million, respectively.
F-87
Table of Contents
Investment management and service fees. Investment management and service fees includes revenues for services provided by AB to mutual funds sponsored by AB. These revenues earned by AB from providing these services were as follows:
| Years ended December 31, | ||||||||||||
| 2017 | 2016 | 2015 | ||||||||||
| (in millions) | ||||||||||||
| Investment management and services fees |
$ | 1,148 | $ | 999 | $ | 1,056 | ||||||
| Distribution revenues |
398 | 372 | 415 | |||||||||
| Other revenues - shareholder servicing fees |
73 | 76 | 85 | |||||||||
| Other revenues - other |
7 | 6 | 5 | |||||||||
|
|
|
|
|
|
|
|||||||
| Total |
$ | 1,626 | $ | 1,453 | $ | 1,561 | ||||||
|
|
|
|
|
|
|
|||||||
Other Transactions. In 2016, AXA Equitable Life and Saum Sing LLC (“Saum Sing”), an affiliate, formed Broad Vista Partners LLC (“Broad Vista”), of which AXA Equitable Life owns 70% and Saum Sing owns 30%. On June 30, 2016, Broad Vista entered into a real estate joint venture with a third party and AXA Equitable Life invested approximately $25 million, reported in Other equity investments in the consolidated balance sheets.
In 2016, AXA Financial invested in ASV Capital B FPCI, a French Professional Private Equity Fund managed by AXA Venture Partners SAS. As of December 31, 2017 and 2016, the fair value of the investment in the fund was $7 million and $5 million, respectively.
AXA RE Arizona benefited from a $1.5 billion revolving credit facility with AXA prior to the execution of the GMxB Unwind. For the years ended December 31, 2017, 2016 and 2015, fees associated with this facility were $1 million, $5 million, and $5 million, respectively.
Pursuant to a sub-licensing agreement with AXA, we may use the “AXA” trademarks as an umbrella brand, as part of the name of our companies or investment funds managed by us and other specified purposes. For the years ended December 31, 2017, 2016 and 2015, fees associated with this agreement totaled $3 million, $2 million and $1 million, respectively.
In September 2017, AXA Equitable FMG made a 30 million euro capital commitment to ASV Diversified, a French Special Limited Partnership investing in venture funds specialized in both early stage and growth startups with new technologies and business models relevant to AXA’s business. This fund is managed by AXA Venture Partners SAS. As of December 31, 2017, 0.5 million euro in capital had been called.
In December 2017, AXA Tech paid approximately $18 million to AXA US Holdings Inc., a U.S. subsidiary of AXA, which is not a subsidiary of Holdings, in exchange for AXA US Holdings Inc. assuming certain liabilities pertaining to its servicing of AXA companies within the United States not included in the scope of this offering and in Latin America valued at approximately $18 million, including costs and expenses associated with providing infrastructure services to AXA and its subsidiaries.
In the third and fourth quarters of 2017, AEH purchased 2.3 million AB Holdings Units from the former CEO of AB for $55 million in cash, pursuant to a Unit Purchase Agreement, thereby increasing the Company’s economic ownership interest in AB by approximately 0.85%.
| 12) | EMPLOYEE BENEFIT PLANS |
Pension Plans
AXA Financial and AXA Equitable Life Retirement Plans
AXA Equitable Life sponsors the AXA Equitable 401(k) Plan, a qualified defined contribution plan for eligible employees and financial professionals. The plan provides for both a company contribution and a discretionary profit-sharing contribution. Expenses associated with this 401(k) Plan were $28 million, $28 million and $27 million in 2017, 2016 and 2015, respectively.
F-88
Table of Contents
AXA Financial sponsors the MONY Life Retirement Income Security Plan for Employees and AXA Equitable Life sponsors the AXA Equitable Retirement Plan (the “AXA Equitable Life QP”), both of which are qualified defined benefit plans covering eligible employees and financial professionals. These pension plans are non-contributory and their benefits are generally based on a cash balance formula and/or, for certain participants, years of service and average earnings over a specified period. AXA Financial and AXA Equitable Life also sponsor certain nonqualified defined benefit plans, including the AXA Equitable Excess Retirement Plan, that provide retirement benefits in excess of the amount permitted under the tax law for the qualified plans. Effective December 31, 2015, primary liability for the obligations of AXA Equitable Life under the AXA Equitable Life QP was transferred from AXA Equitable Life to AXA Financial under terms of an Assumption Agreement. AXA Equitable Life remains secondarily liable for its obligations under the AXA Equitable Life QP and would recognize such liability in the event AXA Financial does not perform under the terms of the Assumption Agreement.
AXA Financial and AXA Equitable Life use a December 31 measurement date for their pension plans.
AB Retirement Plans
AB maintains the Profit Sharing Plan for Employees of AB, a tax-qualified retirement plan for U.S. employees. Employer contributions under this plan are discretionary and generally are limited to the amount deductible for federal income tax purposes.
AB also maintains a qualified, non-contributory, defined benefit retirement plan covering current and former employees who were employed by AB in the United States prior to October 2, 2000 (the “AB Plan”). Benefits under the AB Plan are based on years of credited service and average final base salary.
AB uses a December 31 measurement date for the AB Plan.
Contributions and Funding Policy
The Company’s funding policy for its qualified pension plans is to satisfy its funding obligations each year in an amount not less than the minimum required by the Employee Retirement Income Security Act of 1974 (“ERISA”), as amended by the Pension Protection Act of 2006 (the “Pension Act”), and not greater than the maximum the Company can deduct for federal income tax purposes. For 2016, no cash contributions were made by AXA Financial, AXA Equitable Life and AB to their respective qualified pension plans. Based on the funded status of the plans at December 31, 2016, AB contributed $4 million to the AB Plan during 2017. AB currently estimates that it will contribute $5 million to the AB Plan during 2018. No minimum funding contributions under ERISA are required to be made to the AXA Financial and AXA Equitable Life plans, and management does not expect to make any discretionary contributions to those plans during 2018.
Net Periodic Pension Expense
Components of net periodic pension expense for the Company’s qualified and non-qualified plans were as follows:
| Years Ended December 31, | ||||||||||||
| 2017 | 2016 | 2015 | ||||||||||
| (in millions) | ||||||||||||
| Service cost |
$ | 10 | $ | 11 | $ | 10 | ||||||
| Interest cost |
105 | 108 | 127 | |||||||||
| Expected return on assets |
(173 | ) | (177 | ) | (174 | ) | ||||||
| Actuarial (gain) loss |
1 | 1 | 1 | |||||||||
| Net amortization |
126 | 133 | 122 | |||||||||
|
|
|
|
|
|
|
|||||||
| Net Periodic Pension Expense |
$ | 69 | $ | 76 | $ | 86 | ||||||
|
|
|
|
|
|
|
|||||||
F-89
Table of Contents
Changes in Projected Benefit Obligation (“PBO”)
Changes in the PBO of the Company’s qualified and non-qualified plans were comprised of:
| December 31, | ||||||||
| 2017 | 2016 | |||||||
| (in millions) | ||||||||
| Projected benefit obligation, beginning of year |
$ | 3,442 | $ | 3,497 | ||||
| Service cost |
— | — | ||||||
| Interest cost |
105 | 108 | ||||||
| Actuarial (gains) losses |
144 | 72 | ||||||
| Benefits paid |
(236 | ) | (235 | ) | ||||
| Plan amendments and curtailments |
— | — | ||||||
|
|
|
|
|
|||||
| Projected Benefit Obligation, end of year |
3,455 | 3,442 | ||||||
|
|
|
|
|
|||||
The following table discloses the change in plan assets and the funded status of the Company’s qualified and non-qualified pension plans:
| December 31, | ||||||||
| 2017 | 2016 | |||||||
| (in millions) | ||||||||
| Pension plan assets at fair value, beginning of year |
$ | 2,679 | $ | 2,709 | ||||
| Actual return on plan assets |
357 | 174 | ||||||
| Contributions |
4 | — | ||||||
| Benefits paid and fees |
(201 | ) | (204 | ) | ||||
|
|
|
|
|
|||||
| Pension plan assets at fair value, end of year |
2,839 | 2,679 | ||||||
| PBO |
3,455 | 3,442 | ||||||
|
|
|
|
|
|||||
| Excess of PBO Over Pension Plan Assets, End of Year |
$ | (616 | ) | $ | (763 | ) | ||
|
|
|
|
|
|||||
Accrued pension costs of $(616) million and $(763) million at December 31, 2017 and 2016, respectively, were recognized in the accompanying consolidated balance sheets to reflect the funded status of these plans. The aggregate PBO/accumulated benefit obligation (“ABO”) and fair value of pension plan assets for plans with PBOs/ABOs in excess of their assets were $3,455 million and $2,839 million, respectively, at December 31, 2017 and $3,442 million and $2,679 million, respectively, at December 31, 2016.
Unrecognized Net Actuarial (Gain) Loss
The following table discloses the amounts included in AOCI at December 31, 2017 and 2016 that have not yet been recognized as components of net periodic pension cost.
| December 31, | ||||||||
| 2017 | 2016 | |||||||
| (in millions) | ||||||||
| Unrecognized net actuarial (gain) loss |
$ | 1,315 | $ | 1,482 | ||||
| Unrecognized prior service cost (credit) |
1 | 1 | ||||||
|
|
|
|
|
|||||
| Total |
$ | 1,316 | $ | 1,483 | ||||
|
|
|
|
|
|||||
The estimated net actuarial (gain) loss and prior service cost (credit) expected to be reclassified from AOCI and recognized as components of net periodic pension cost over the next year are approximately $119 million and $24 thousand, respectively.
F-90
Table of Contents
Pension Plan Assets
The fair values of qualified pension plan assets are measured and ascribed to levels within the fair value hierarchy in a manner consistent with the fair values of the Company’s invested assets that are measured at fair value on a recurring basis. See Note 2 for a description of the fair value hierarchy.
The following table discloses the allocation of the fair value of total qualified pension plan assets at December 31, 2017 and 2016:
| December 31, | ||||||||
| 2017 | 2016 | |||||||
| Fixed Maturities |
46.2 | % | 47.4 | % | ||||
| Equity Securities |
33.9 | 34.2 | ||||||
| Equity real estate |
13.9 | 13.7 | ||||||
| Cash and short-term investments |
1.4 | 1.5 | ||||||
| Other |
4.6 | 3.2 | ||||||
|
|
|
|
|
|||||
| Total |
100.0 | % | 100.0 | % | ||||
|
|
|
|
|
|||||
Qualified pension plan assets are invested with the primary objective of return, giving consideration to prudent risk. Guidelines regarding the allocation of plan assets are established by the respective Investment Committees for the plans and are designed with a long-term investment horizon. At December 31, 2017, the qualified pension plans continued their investment allocation strategy to target a 50%-50% mix of long-duration bonds and “return-seeking” assets, including public equities, real estate, hedge funds, and private equity.
F-91
Table of Contents
The following tables disclose the fair values of qualified pension plan assets and their level of observability within the fair value hierarchy at December 31, 2017 and 2016, respectively.
| December 31, 2017: | Level 1 | Level 2 | Level 3 | Total | ||||||||||||
| (in millions) | ||||||||||||||||
| Fixed Maturities |
||||||||||||||||
| Corporate |
$ | — | $ | 792 | $ | 2 | $ | 794 | ||||||||
| U.S. Treasury, government and agency |
— | 471 | — | 471 | ||||||||||||
| States and political subdivisions |
— | 26 | — | 26 | ||||||||||||
| Foreign governments |
— | 5 | — | 5 | ||||||||||||
| Commercial mortgage-backed |
— | — | 1 | 1 | ||||||||||||
| Asset-backed |
— | — | — | — | ||||||||||||
| Other structured debt |
— | — | — | — | ||||||||||||
| Common and preferred equity |
730 | 98 | — | 828 | ||||||||||||
| Mutual funds |
99 | — | — | 99 | ||||||||||||
| Commercial Papers |
— | 44 | — | 44 | ||||||||||||
| Private real estate investment trusts |
2 | — | — | 2 | ||||||||||||
| Cash and cash equivalents |
12 | — | — | 12 | ||||||||||||
| Short-term investments |
— | 27 | — | 27 | ||||||||||||
| Other Equity Investments |
— | |||||||||||||||
| Other |
— | — | — | — | ||||||||||||
|
|
|
|
|
|
|
|
|
|||||||||
| Total assets in the fair value hierarchy |
843 | 1,463 | 3 | 2,309 | ||||||||||||
| Investments measured at net assets value |
— | — | — | 530 | ||||||||||||
|
|
|
|
|
|
|
|
|
|||||||||
| Investments at fair value |
$ | 843 | $ | 1,463 | $ | 3 | $ | 2,839 | ||||||||
|
|
|
|
|
|
|
|
|
|||||||||
| December 31, 2016: |
||||||||||||||||
| Fixed Maturities: |
||||||||||||||||
| Corporate |
$ | — | $ | 820 | $ | 1 | $ | 821 | ||||||||
| U.S. Treasury, government and agency |
— | 395 | — | 395 | ||||||||||||
| States and political subdivisions |
— | 26 | — | 26 | ||||||||||||
| Foreign governments |
— | 4 | — | 4 | ||||||||||||
| Commercial mortgage-backed |
— | — | 2 | 2 | ||||||||||||
| Asset-backed |
— | — | 1 | 1 | ||||||||||||
| Other structured debt |
— | — | 1 | 1 | ||||||||||||
| Common and preferred equity |
738 | 95 | — | 833 | ||||||||||||
| Mutual funds |
92 | — | — | 92 | ||||||||||||
| Commercial Paper |
— | 7 | — | 7 | ||||||||||||
| Private real estate investment trusts |
3 | — | — | 3 | ||||||||||||
| Cash and cash equivalents |
22 | — | — | 22 | ||||||||||||
| Short-term investments |
— | 20 | — | 20 | ||||||||||||
| Other Equity Investments |
— | — | — | |||||||||||||
| Other |
— | — | — | — | ||||||||||||
|
|
|
|
|
|
|
|
|
|||||||||
| Total assets in the fair value hierarchy |
855 | 1,367 | 5 | 2,227 | ||||||||||||
| Investments measured at net assets value |
— | — | — | 452 | ||||||||||||
|
|
|
|
|
|
|
|
|
|||||||||
| Investments at fair value |
$ | 855 | $ | 1,367 | $ | 5 | $ | 2,679 | ||||||||
|
|
|
|
|
|
|
|
|
|||||||||
The following table lists investments for which net asset value (“NAV”) is calculated; NAV is used as a practical expedient to determine the fair value of these investments at December 31, 2017;
F-92
Table of Contents
Practical Expedient disclosure as of December 31, 2017
| Investment | Fair Value |
Redemption (If currently eligible) |
Redemption Notice Period |
Unfunded Commitments |
||||||||
| (in millions) | ||||||||||||
| Private Equity Fund |
$ | 49 | n/a(1)(2) | n/a | $ | 29 | ||||||
| Private Real Estate Investment Trust |
376 | Quarterly | One Quarter | — | ||||||||
| Hedge Fund |
83 | Calendar Quarters* | Previous Quarter End | $ | 34 | |||||||
|
|
|
|||||||||||
| Total |
$ | 508 | ||||||||||
|
|
|
|||||||||||
*March, June, September, December
| (1) | Cannot sell or transfer ownership interest without prior written consent to transfer, and by meeting several criteria (e.g., does not adversely affect other investors). |
| (2) | Cannot sell interest in the vehicle without prior written consent of the managing member. |
Practical Expedient disclosure as of December 31, 2016
| Investment | Fair Value |
Redemption (If currently eligible) |
Redemption Notice Period |
Unfunded Commitments |
||||||||
| (in millions) | ||||||||||||
| Private Equity Fund |
$ | 25 | n/a(1)(2) | n/a | $ | 65 | ||||||
| Private Real Estate Investment Trust |
349 | Quarterly | One Quarter | — | ||||||||
| Hedge Fund |
60 | Calendar Quarters* | Previous Quarter End | $ | 42 | |||||||
|
|
|
|||||||||||
| Total |
$ | 434 | ||||||||||
|
|
|
|||||||||||
*March, June, September, December
| (1) | Cannot sell or transfer ownership interest without prior written consent to transfer, and by meeting several criteria (e.g., does not adversely affect other investors). |
| (2) | Cannot sell interest in the vehicle without prior written consent of the managing member. |
F-93
Table of Contents
The table below presents a reconciliation for all Level 3 fair values of qualified pension plan assets at December 31, 2017, 2016 and 2015, respectively:
Level 3 Instruments
Fair Value Measurements
| Private Real Estate Investment Trusts |
Other Equity Investments |
Fixed Maturities |
Total | |||||||||||||
| (in millions) | ||||||||||||||||
| Balance, January 1, 2017 |
$ | — | $ | — | $ | 5 | $ | 5 | ||||||||
| Actual return on plan assets: |
||||||||||||||||
| Relating to assets still held at December 31, 2017 |
— | — | — | — | ||||||||||||
| Relating to assets sold during 2017 |
— | — | — | — | ||||||||||||
| Purchases/Issues |
— | — | — | — | ||||||||||||
| Sales/Settlements |
— | — | (2 | ) | (2 | ) | ||||||||||
| Transfers into/out of Level 3 |
— | — | — | — | ||||||||||||
|
|
|
|
|
|
|
|
|
|||||||||
| Balance, December 31, 2017 |
$ | — | $ | — | $ | 3 | $ | 3 | ||||||||
|
|
|
|
|
|
|
|
|
|||||||||
| Balance, January 1, 2016 |
$ | — | $ | — | $ | 8 | $ | 8 | ||||||||
| Actual return on plan assets: |
||||||||||||||||
| Relating to assets still held at December 31, 2016 |
— | — | — | — | ||||||||||||
| Relating to assets sold during 2016 |
— | — | — | — | ||||||||||||
| Purchases/Issues |
— | — | — | — | ||||||||||||
| Sales/Settlements |
— | — | (1 | ) | (1 | ) | ||||||||||
| Transfers into/out of Level 3 |
— | — | (2 | ) | (2 | ) | ||||||||||
|
|
|
|
|
|
|
|
|
|||||||||
| Balance, December 31, 2016 |
$ | — | $ | — | $ | 5 | $ | 5 | ||||||||
|
|
|
|
|
|
|
|
|
|||||||||
| Balance, January 1, 2015 |
$ | — | $ | — | $ | 10 | $ | 10 | ||||||||
| Actual return on plan assets: |
||||||||||||||||
| Relating to assets still held at December 31, 2015 |
— | — | — | — | ||||||||||||
| Relating to assets sold during 2015 |
— | — | — | — | ||||||||||||
| Purchases/Issues |
— | — | — | — | ||||||||||||
| Sales/Settlements |
— | — | (1 | ) | (1 | ) | ||||||||||
| Transfers into/out of Level 3 |
— | — | (1 | ) | (1 | ) | ||||||||||
|
|
|
|
|
|
|
|
|
|||||||||
| Balance, December 31, 2015 |
$ | — | $ | — | $ | 8 | $ | 8 | ||||||||
|
|
|
|
|
|
|
|
|
|||||||||
At December 31, 2017, assets classified as Level 1, Level 2 and Level 3 comprise approximately 29.7%, 51.5% and 0.1%, respectively, of qualified pension plan assets. At December 31, 2016, assets classified as Level 1, Level 2 and Level 3 comprised approximately 31.9%, 51.0% and 0.2%, respectively, of qualified pension plan assets. There are no significant concentrations of credit risk arising within or across categories of qualified pension plan assets.
Assumptions
Discount Rate
The benefits obligations and related net periodic costs of the Company’s qualified and non-qualified pension plans are measured using discount rate assumptions that reflect the rates at which the plans’ benefits could be effectively settled. Projected nominal cash outflows to fund expected annual benefits payments under each of the plans are discounted using a published high-quality bond yield curve as a practical expedient for a matching bond approach. Beginning in 2014, the Company uses the Citigroup Pension Above-Median-AA Curve (the “Citigroup Curve”) for this purpose. The Company has concluded that an adjustment to the
F-94
Table of Contents
Citigroup Curve is not required after comparing the projected benefit streams of the plans to the cash flows and duration of the reference bonds.
At December 31, 2015, the Company refined its calculation of the discount rate to use the discrete single equivalent discount rate for each plan as compared to its previous use of an aggregate, weighted average practical expedient. Use of the discrete approach at December 31, 2015 produced a discount rate for the AXA Equitable Life QP of 3.98% as compared to a 4% aggregate rate, thereby increasing the net unfunded PBO of the AXA Equitable Life QP by approximately $4 million in 2015. Use of the discrete approach at December 31, 2015 produced a discount rate for the AXA Equitable Excess Retirement Plan of 3.86% as compared to a 4.00% aggregate rate, thereby increasing the net unfunded PBO of that plan by approximately $5 million in 2015.
Mortality
At December 31, 2015, the Company concluded to change the mortality projection scale used to measure and report the Company’s defined benefit plan obligations from 125% Scale AA to Scale BB, representing a reasonable “fit” to the results of the plans’ mortality experience study and a closer alignment to current thinking with respect to projections of mortality improvements.
In October 2016, the Society of Actuaries (“SOA”) released MP-2016, its second annual update to the “gold standard” mortality projection scale issued by the SOA in 2014, reflecting three additional years of historical U.S. population historical mortality data (2012 through 2014). Similar to its predecessor (MP-2015), MP-2016 indicated that, while mortality data continued to show longer lives, longevity was increasing at a slower rate and lagging behind that previously suggested both by MP-2015 and MP-2014. The Company considered this new data as well as observations made from current practice regarding how to best estimate improved trends in life expectancies and concluded to continue using the RP-2000 base mortality table projected on a full generational basis with Scale BB mortality improvements for purposes of measuring and reporting its consolidated defined benefit plan obligations at December 31, 2017.
Interest Cost
Beginning January 1, 2016, the Company adopted a spot rate/full yield curve approach for measuring the interest cost component of expense for each of its defined benefit plans, thereby reducing 2016 benefits expense by approximately $76 million.
The following table discloses assumptions used to measure the Company’s pension benefit obligations and net periodic pension cost at and for the years ended December 31, 2017 and 2016.
| December 31, | ||||||||
| 2017 | 2016 | |||||||
| Discount rates: |
||||||||
| AXA Equitable Life QP |
3.4 | % | 3.81 | % | ||||
| AXA Equitable Excess Retirement Plan |
3.32 | % | 3.69 | % | ||||
| MONY Life Retirement Income Security Plan for Employees |
3.5 | % | 3.98 | % | ||||
| AB Qualified Retirement Plan |
4.55 | % | 4.75 | % | ||||
| Other defined benefit plans |
3.00%-3.43 | % | 3.17%-3.86 | % | ||||
| Periodic cost |
3.17%-3.98 | % | 3.29%-4.18 | % | ||||
| Rates of compensation increase: |
||||||||
| Benefit obligation |
5.99 | % | 5.99 | % | ||||
| Periodic cost |
6.38 | % | 6.43 | % | ||||
| Expected long-term rates of return on pension plan assets (periodic cost) |
6.75 | % | 6.75 | % | ||||
The expected long-term rate of return assumption on plan assets is based upon the target asset allocation of the plan portfolio and is determined using forward-looking assumptions in the context of historical returns and volatilities for each asset class.
F-95
Table of Contents
Prior to 1987, participants’ benefits under the AXA Equitable Life QP were funded through the purchase of non-participating annuity contracts from AXA Equitable Life. Benefit payments under these contracts were approximately $6 million and $7 million for 2017 and 2016 respectively.
Post-Retirement Benefits
The Company eliminated any subsidy for post-retirement medical and dental coverage for individuals retiring on or after May 1, 2012. The Company continues to contribute to the cost of post-retirement medical and dental coverage for certain individuals who retired prior to May 1, 2012 based on years of service and age, subject to rights reserved in the plans to change or eliminate these benefits. The Company funds these post-retirement benefits on a pay-as-you-go basis.
The Company sponsors the AXA Equitable Executive Survivor Benefits Plan (the “ESB Plan”) which provides post-retirement life insurance benefits to eligible executives. Eligible executives may choose up to four levels of coverage with each level providing a benefit equal to one times the executive’s compensation, subject to an overall $25 million cap. Aside from the ESB Plan, the Company does not currently offer post-retirement life insurance benefits but continues to provide post-retirement life insurance benefits to certain active and retired employees who were eligible for such benefits under discontinued plans.
For 2017 and 2016, post-retirement benefits payments were $37.1 million and $37 million, respectively, net of employee contributions.
The Company uses a December 31 measurement date for its post-retirement plans.
Components of net post-retirement benefits costs follow:
| Years Ended December 31, | ||||||||||||
| 2017 | 2016 | 2015 | ||||||||||
| (in millions) | ||||||||||||
| Service cost |
$ | 2 | $ | 2 | $ | 2 | ||||||
| Interest cost |
16 | 16 | 20 | |||||||||
| Net amortization |
6 | 7 | 10 | |||||||||
|
|
|
|
|
|
|
|||||||
| Net Periodic Post-Retirement Benefits Costs |
24 | 25 | 32 | |||||||||
|
|
|
|
|
|
|
|||||||
Changes in the accumulated benefits obligation of the Company’s post-retirement plans recognized in the accompanying consolidated financial statements are described in the following table:
| December 31, | ||||||||
| 2017 | 2016 | |||||||
| (in millions) | ||||||||
| Accumulated post-retirement benefits obligation, beginning of year |
$ | 539 | $ | 541 | ||||
| Service cost |
2 | 2 | ||||||
| Interest cost |
16 | 17 | ||||||
| Contributions and benefits paid |
(38 | ) | (37 | ) | ||||
| Plan amendments/curtailments |
— | — | ||||||
| Medicare Part D subsidy |
— | — | ||||||
| Actuarial (gains) losses |
18 | 16 | ||||||
|
|
|
|
|
|||||
| Accumulated Post-Retirement Benefits Obligation, end of year |
$ | 537 | $ | 539 | ||||
|
|
|
|
|
|||||
The post-retirement medical plan obligations of the Company are offset by an anticipated subsidy from Medicare Part D, which is assumed to increase with the healthcare cost trend. If the healthcare cost trend rate assumption was increased by 1.0%, the accumulated post-retirement benefits obligation and the sum of service and interest cost as of December 31, 2017 would increase by $339 thousand. If the healthcare cost trend rate assumption was decreased by 1.0%, the accumulated post-retirement benefits obligation and the sum of service and interest cost as of December 31, 2017 would decrease by $293 thousand.
F-96
Table of Contents
The following table discloses the amounts included in AOCI at December 31, 2017 and 2016 that have not yet been recognized as components of net periodic post-retirement benefits cost:
| December 31, | ||||||||
| 2017 | 2016 | |||||||
| (in millions) | ||||||||
| Unrecognized net actuarial (gains) losses |
$ | 143 | $ | 132 | ||||
| Unrecognized prior service (credit) |
— | — | ||||||
|
|
|
|
|
|||||
| Total |
$ | 143 | $ | 132 | ||||
|
|
|
|
|
|||||
The estimated net actuarial (gains) losses and prior service (credit) expected to be reclassified from AOCI and recognized as components of net periodic post-retirement benefit cost over the next year are $8 million and $7 million, respectively.
The assumed discount rates for measuring the post-retirement benefit obligations at December 31, 2017 and 2016 were determined in substantially the same manner as described above for measuring the pension benefit obligations. The following table discloses the range of discrete single equivalent discount rates for each of the post-retirement plans at December 31, 2015 as compared to previous use of an aggregate, weighted average practical expedient, and related net periodic cost at and for the years ended December 31, 2017 and 2016.
| December 31, | ||||||||
| 2017 | 2016 | |||||||
| Discount rates: |
||||||||
| Benefit obligation |
2.80%-3.52% | 2.86%-4.01% | ||||||
| Periodic cost |
3.17%-3.98% | 3.29%-4.18% | ||||||
The Company provides post-employment medical and life insurance coverage for certain disabled former employees. The accrued liabilities for these post-employment benefits were $11 million and $13 million, respectively, at December 31, 2017 and 2016. Components of net post-employment benefits costs follow:
| Years Ended December 31, | ||||||||||||
| 2017 | 2016 | 2015 | ||||||||||
| (in millions) | ||||||||||||
| Service cost |
$ | 2 | $ | 2 | $ | 2 | ||||||
| Interest cost |
— | — | — | |||||||||
| Net amortization |
(2 | ) | — | (16 | ) | |||||||
|
|
|
|
|
|
|
|||||||
| Net Periodic Post-Employment Benefits Costs |
— | 2 | (14 | ) | ||||||||
|
|
|
|
|
|
|
|||||||
F-97
Table of Contents
The following table provides an estimate of future benefits expected to be paid in each of the next five years, beginning January 1, 2018, and in the aggregate for the five years thereafter. These estimates are based on the same assumptions used to measure the respective benefit obligations at December 31, 2017 and include benefits attributable to estimated future employee service.
| Postretirement Benefits | ||||||||||||||||||||
| Health | ||||||||||||||||||||
| Pension Benefits |
Life Insurance |
Gross Estimate Payment |
Estimated Medicare Part D Subsidy |
Net Estimate Payment |
||||||||||||||||
| (in millions) | ||||||||||||||||||||
| 2018 |
$ | 243 | $ | 27 | $ | 18 | $ | 4 | $ | 14 | ||||||||||
| 2019 |
247 | 27 | 16 | 4 | 12 | |||||||||||||||
| 2020 |
240 | 26 | 15 | 4 | 11 | |||||||||||||||
| 2021 |
236 | 26 | 14 | 4 | 10 | |||||||||||||||
| 2022 |
232 | 25 | 13 | 4 | 9 | |||||||||||||||
| Years 2023-2027 |
1,069 | 119 | 53 | 17 | 36 | |||||||||||||||
| 13) | SHARE-BASED AND OTHER COMPENSATION PROGRAMS |
AXA and the Company sponsor various share-based compensation plans for eligible employees, financial professionals and non-officer directors of Holdings and its subsidiaries. AB also sponsors its own unit option plans for certain of its employees.
Compensation costs for 2017, 2016 and 2015 for share-based payment arrangements as further described herein are as follows:
| 2017 | 2016 | 2015 | ||||||||||
| (in millions) | ||||||||||||
| Performance Shares |
$ | 45 | $ | 37 | $ | 44 | ||||||
| Stock Options (Other than AB stock options) |
1 | 1 | 1 | |||||||||
| AXA Shareplan |
13 | 19 | 20 | |||||||||
| Restricted Awards |
185 | 154 | 174 | |||||||||
| Other Compensation plans(1) |
3 | 2 | 4 | |||||||||
|
|
|
|
|
|
|
|||||||
| Total Compensation Expenses |
$ | 247 | $ | 213 | $ | 243 | ||||||
|
|
|
|
|
|
|
|||||||
(1) Other compensation plans include Stock Appreciation Rights, Restricted Stock and AXA Miles.
U.S. employees are granted AXA ordinary share options under the Stock Option Plan for AXA Financial Employees and Associates (the “Stock Option Plan”) and are granted AXA performance shares under the AXA International Performance Shares Plan (the “Performance Share Plan”). Prior to 2013, they were granted performance units under AXA’s Performance Unit Plan.
Non-officer directors of AXA Financial and certain subsidiaries are granted restricted AXA ordinary shares (prior to 2011, AXA ADRs) and unrestricted AXA ordinary shares (prior to March 15, 2010, AXA ADRs) annually under The Equity Plan for Directors. They also were granted ADR stock options in years prior to 2014.
Performance Units and Performance Shares
2017 Grant. On June 21, 2017, under the terms of the Performance Share Plan, AXA awarded approximately 1.7 million unearned performance shares to employees of the Company. For employees in our retirement and protection businesses, the extent to which 2017-2019 cumulative performance targets measuring the performance of AXA and the retirement and protection businesses are achieved will
F-98
Table of Contents
determine the number of performance shares earned. For employees of AXA Tech, the extent to which 2017-2019 cumulative performance targets measuring the performance of AXA and AXA Group Management Services (a group of AXA’s central functions and internal service companies) are achieved will determine the number of performance shares earned. For all Company employees, the number of performance shares earned may vary between 0% and 130% of the number of performance shares at stake. The performance shares earned during this performance period will vest and be settled on the fourth anniversary of the award date. The plan will settle in AXA ordinary shares to all participants. In 2017, the expense associated with the June 21, 2017 grant of performance shares was approximately $14 million.
Settlement of 2014 Grant in 2017. On March 24, 2017, share distributions totaling of approximately $21 million were made to active and former employees in settlement of 2.3 million performance shares earned under the terms of the AXA Performance Share Plan 2014. On April 7, 2017, cash distributions of approximately $6 million were made to active and former financial professionals of the Company in settlement of 227,703 performance units earned under the terms of the first tranche of the AXA Advisor Performance Unit Plan 2014.
2016 Grant. On June 6, 2016, under the terms of the Performance Share Plan, AXA awarded approximately 1.9 million unearned performance shares to employees of the Company. For employees in our retirement and protection businesses, the extent to which 2017-2019 cumulative performance targets measuring the performance of AXA and the retirement and protection businesses are achieved will determine the number of performance shares earned. For employees of AXA Tech, the extent to which 2017-2019 cumulative performance targets measuring the performance of AXA and AXA Group Management Services (a group of AXA’s central functions and internal service companies) are achieved will determine the number of performance shares earned. For all Company employees, the number of performance shares earned may vary between 0% and 130% of the number of performance shares at stake. The performance shares earned during this performance period will vest and be settled on the fourth anniversary of the award date. The plan will settle in AXA ordinary shares to all participants. In 2017 and 2016, the expense associated with the June 6, 2016 grant of performance shares was approximately $6 million and $15 million, respectively.
Settlement of 2013 Grant in 2016. On March 22, 2016 cash distributions of approximately $55 million were made to active and former employees of the Company in settlement of 2.3 million performance units earned under the terms of the 2013 Performance Share Plan. On April 8, 2016, cash distributions of approximately $10 million were made to active and former financial professionals of the Company in settlement of 0.5 million performance units earned under the terms of the AXA Advisor Performance Unit Plan 2013.
2015 Grant. On June 19, 2015, under the terms of the Performance Share Plan, AXA awarded approximately 1.7 million unearned performance shares to employees of the Company. For employees in our retirement and protection businesses, the extent to which 2017-2019 cumulative performance targets measuring the performance of AXA and the retirement and protection businesses are achieved will determine the number of performance shares earned. For employees of AXA Tech, the extent to which 2017-2019 cumulative performance targets measuring the performance of AXA and AXA Group Management Services (a group of AXA’s central functions and internal service companies) are achieved will determine the number of performance shares earned. For all Company employees, the number of performance shares earned may vary between 0% and 130% of the number of performance shares at stake. The performance shares earned during this performance period will vest and be settled on the fourth anniversary of the award date. The plan will settle in AXA ordinary shares to all participants. In 2017, 2016 and 2015, the expense associated with the June 19, 2015 grant of performance shares were $5 million, $6 million and $14 million, respectively.
Settlement of 2012 Grant in 2015. On April 2, 2015, cash distributions of approximately $55 million were made to active and former employees of the Company in settlement of 2.4 million performance units earned under the terms of the AXA Performance Unit Plan 2012. On April 3, 2015, cash distributions of approximately $10 million were made to active and former financial professionals of the Company in settlement of 0.4 million performance units earned under the terms of the AXA Advisor Performance Unit Plan 2012.
F-99
Table of Contents
The fair values of awards made under these programs are measured at the grant date by reference to the closing price of the AXA ordinary share, and the result, as adjusted for achievement of performance targets and pre-vesting forfeitures, generally is attributed over the shorter of the requisite service period, the performance period, if any, or to the date at which retirement eligibility is achieved and subsequent service no longer is required for continued vesting of the award. Remeasurements of fair value for subsequent price changes until settlement are made only for performance unit awards as they are settled in cash. The fair value of performance units earned and reported in Other liabilities in the consolidated balance sheets at December 31, 2017 and 2016 was $45 million and $31 million, respectively. Approximately 2 million outstanding performance units and shares are at risk to achievement of 2017 performance criteria, primarily representing all of the performance shares granted June 19, 2015 and the second tranche of performance shares granted March 24, 2014, for which cumulative average 2016-2018 and 2015-2017 performance targets will determine the number of performance units and shares earned under those awards, respectively.
Stock Options
2017 Grant. On June 21, 2017, 0.5 million options to purchase AXA ordinary shares were granted to employees of the Company under the terms of the Stock Option Plan at an exercise price of €23.92. All of those options have a five-year graded vesting schedule, with one-third vesting on each of the third, fourth, and fifth anniversaries of the grant date. Of the total options awarded on June 21, 2017, 0.3 million are further subject to conditional vesting terms that require the AXA ordinary share price to outperform the Euro Stoxx Insurance Index over a specified period. All of the options granted on June 21, 2017 have a ten-year term. The weighted average grant date fair value per option award was estimated at €1.78 using a Black-Scholes options pricing model with modification to measure the value of the conditional vesting feature. Key assumptions used in the valuation included expected volatility of 25.05%, a weighted average expected term of 8.8 years, an expected dividend yield of 6.53% and a risk-free interest rate of 0.59%. The total fair value of these options (net of expected forfeitures) of approximately $1 million is charged to expense over the shorter of the vesting term or the period up to the date at which the participant becomes retirement eligible. In 2017, the Company recognized expenses associated with the June 21, 2017 grant of options of approximately $0.6 million.
2016 Grant. On June 6, 2016, 0.6 million options to purchase AXA ordinary shares were granted to employees of the Company under the terms of the Stock Option Plan at an exercise price of €21.52. All of those options have a five-year graded vesting schedule, with one-third vesting on each of the third, fourth, and fifth anniversaries of the grant date. Of the total options awarded on June 6, 2016, 0.3 million are further subject to conditional vesting terms that require the AXA ordinary share price to outperform the Euro Stoxx Insurance Index over a specified period. All of the options granted on June 6, 2016 have a ten-year term. The weighted average grant date fair value per option award was estimated at €1.85 using a Black-Scholes options pricing model with modification to measure the value of the conditional vesting feature. Key assumptions used in the valuation included expected volatility of 26.6%, a weighted average expected term of 8.1 years, an expected dividend yield of 6.5% and a risk-free interest rate of 0.33%. The total fair value of these options (net of expected forfeitures) of approximately $1 million is charged to expense over the shorter of the vesting term or the period up to the date at which the participant becomes retirement eligible. In 2017 and 2016 the Company recognized expenses associated with the June 6, 2016 grant of options of approximately $0.1 million and $0.6 million respectively.
2015 Grant. On June 19, 2015, 0.4 million options to purchase AXA ordinary shares were granted to employees of the Company under the terms of the Stock Option Plan at an exercise price of €22.90. All of those options have a five-year graded vesting schedule, with one-third vesting on each of the third, fourth, and fifth anniversaries of the grant date. Of the total options awarded on June 19, 2015, 0.2 million are further subject to conditional vesting terms that require the AXA ordinary share price to outperform the Euro Stoxx Insurance Index over a specified period. All of the options granted on June 19, 2015 have a ten-year term. The weighted average grant date fair value per option award was estimated at €1.58 using a Black-Scholes options pricing model with modification to measure the value of the conditional vesting
F-100
Table of Contents
feature. Key assumptions used in the valuation included expected volatility of 23.68%, a weighted average expected term of 8.2 years, an expected dividend yield of 6.29% and a risk-free interest rate of 0.92%. The total fair value of these options (net of expected forfeitures) of approximately $1 million is charged to expense over the shorter of the vesting term or the period up to the date at which the participant becomes retirement eligible. In 2017, 2016 and 2015, the Company recognized expenses associated with the June 19, 2015 grant of options of approximately $0.1 million, $0.1 million and $0.4 million, respectively.
Shares Authorized
There is no limitation in the Stock Option Plan or the Equity Plan for Directors on the number of shares that may be issued pursuant to option or other grants.
A summary of the activity in the AXA and the Company’s option plans during 2017 follows:
| Options Outstanding | ||||||||||||||||||||||||
| AXA Ordinary Shares | AXA ADRs(2) | AB Holding Units | ||||||||||||||||||||||
| Number Outstanding (In 000’s) |
Weighted Average Exercise Price |
Number Outstanding (In 000’s) |
Weighted Average Exercise Price |
Number Outstanding (In 000’s) |
Weighted Average Exercise Price |
|||||||||||||||||||
| Options Outstanding at January 1, 2017 |
9,536 | € | 21.02 | 45 | $ | 24.90 | 5,085 | $ | 49.45 | |||||||||||||||
| Options granted |
488 | € | 23.92 | — | $ | — | — | — | ||||||||||||||||
| Options exercised |
(1,996 | ) | € | 18.02 | (2 | ) | $ | 21.35 | (1,180 | ) | $ | 17.04 | ||||||||||||
| Options forfeited, net |
— | € | — | — | $ | — | — | — | ||||||||||||||||
| Options expired |
(2,626 | ) | 33.77 | (8 | ) | 42.62 | (823 | ) | $ | 84.96 | ||||||||||||||
|
|
|
|
|
|
|
|||||||||||||||||||
| Options Outstanding at December 31, 2017 |
5,402 | € | 17.36 | 35 | $ | 20.98 | 3,082 | $ | 52.37 | |||||||||||||||
|
|
|
|
|
|
|
|
|
|
|
|
|
|||||||||||||
| Aggregate Intrinsic Value(1) |
€ | 39,861 | $ | 303 | — | |||||||||||||||||||
|
|
|
|
|
|
|
|||||||||||||||||||
| Weighted Average Remaining Contractual Term (in years) |
4.2 | 1.2 | 1.2 | |||||||||||||||||||||
|
|
|
|
|
|
|
|||||||||||||||||||
| Options Exercisable at December 31, 2017 |
3,406 | € | 14.68 | 35 | $ | 42.62 | 3,018 | $ | 52.97 | |||||||||||||||
|
|
|
|
|
|
|
|
|
|
|
|
|
|||||||||||||
| Aggregate Intrinsic Value(1) |
€ | 34,275 | $ | 303 | — | |||||||||||||||||||
|
|
|
|
|
|
|
|||||||||||||||||||
| Weighted Average Remaining Contractual Term (in years) |
2.8 | 1.2 | 1.1 | |||||||||||||||||||||
|
|
|
|
|
|
|
|||||||||||||||||||
| (1) | Aggregate intrinsic value, presented in thousands, is calculated as the excess of the closing market price on December 31, 2017 of the respective underlying shares over the strike prices of the option awards. |
| (2) | AXA ordinary shares will be delivered to participants in lieu of AXA ADRs at exercise or maturity. |
No stock options were exercised in 2017 and 2016. The intrinsic value related to exercises of stock options during 2015 was approximately $0.2 million, resulting in amounts currently deductible for tax purposes of approximately $0.1 million for the period then ended. In 2015, windfall tax benefits of approximately $0.1 million resulted from exercises of stock option awards.
At December 31, 2017, the Company held 22,974 AXA ordinary shares in treasury at a weighted average cost of $23.14 per share, which were designated to fund future exercises of outstanding stock options.
For the purpose of estimating the fair value of stock option awards, the Company applies the Black-Scholes model and attributes the result over the requisite service period using the graded-vesting method. A Monte-Carlo simulation approach was used to model the fair value of the conditional vesting feature of the awards
F-101
Table of Contents
of options to purchase AXA ordinary shares. Shown below are the relevant input assumptions used to derive the fair values of options awarded in 2017, 2016 and 2015, respectively.
| AXA Ordinary Shares | AB Holding Units(1) | |||||||||||||||||||||||
| 2017 | 2016 | 2015 | 2017 | 2016 | 2015 | |||||||||||||||||||
| Dividend yield |
6.53 | % | 6.50 | % | 6.29 | % | NA | 7.10 | % | 7.10 | % | |||||||||||||
| Expected volatility |
25.05 | % | 26.60 | % | 23.68 | % | NA | 31.00 | % | 32.10 | % | |||||||||||||
| Risk-free interest rates |
0.59 | % | 0.33 | % | 0.92 | % | NA | 1.30 | % | 1.50 | % | |||||||||||||
| Expected life in years |
8.8 | 8.1 | 8.2 | NA | 6.0 | 6.0 | ||||||||||||||||||
| Weighted average fair value per option at grant date |
$ | 2.01 | $ | 2.06 | $ | 1.73 | NA | $ | 2.75 | $ | 4.13 | |||||||||||||
| (1) | There were no options to buy AB Holding Units awarded during 2017. As such, the input assumptions for 2017 are not applicable. |
As of December 31, 2017, approximately $1 million of unrecognized compensation cost related to unvested stock option awards, net of estimated pre-vesting forfeitures, is expected to be recognized by the Company over a weighted average period of 2.8 years.
AXA Options Valuation. The fair value of AXA stock options is calculated using the Black-Scholes option pricing model. The expected AXA dividend yield is based on market consensus. AXA share price volatility is estimated on the basis of implied volatility, which is checked against an analysis of historical volatility to ensure consistency. The risk-free interest rate is based on the Euro Swap Rate curve for the appropriate term. The effect of expected early exercise is taken into account through the use of an expected life assumption based on historical data.
AB Holding Unit Options Valuation. The fair value of units representing assignments of beneficial ownership of limited partnership interests in AB Holding (“AB Holding Units”) options is calculated using the Black-Scholes option pricing model. The expected cash distribution yield is based on the average of our distribution yield over the past four quarters. The volatility factor represents historical AB Holding Units price volatility over the same period as the expected term. The risk-free interest rate is based on the U.S. Treasury bond yield for the appropriate expected term. The expected term was calculated using the simplified method, due to the lack of sufficient historical data.
Restricted Awards
Under The Equity Plan for Directors, the Company grants non-officer directors of AXA Financial and certain subsidiaries restricted AXA ordinary shares. Likewise, AB awards restricted AB Holding Units to independent members of its General Partner.
The Company has also granted restricted AXA ordinary share units (“RSUs”) to certain executives. The RSUs are phantom AXA ordinary shares that, once vested, entitle the recipient to a cash payment based on the average closing price of the AXA ordinary share over the twenty trading days immediately preceding the vesting date.
For 2017, 2016 and 2015, respectively, the Company recognized compensation costs of $185 million, $154 million and $174 million for outstanding restricted stock and RSUs. The fair values of awards made under these programs are measured at the grant date by reference to the closing price of the unrestricted shares, and the result generally is attributed over the shorter of the requisite service period, the performance period, if any, or to the date at which retirement eligibility is achieved and subsequent service no longer is required for continued vesting of the award. Remeasurements of fair value for subsequent price changes until settlement are made only for RSUs. At December 31, 2017, approximately 19.1 million restricted AXA ordinary shares and AB Holding Unit awards remain unvested. At December 31, 2017, approximately $57 million of unrecognized compensation cost related to these unvested awards, net of estimated pre-vesting forfeitures, is expected to be recognized over a weighted average period of 3.0 years.
F-102
Table of Contents
The following table summarizes restricted AXA ordinary share activity for 2017. In addition, approximately 11,069 RSUs were granted during 2017 with graded vesting over a 3-year service period:
| Shares of Restricted Stock |
Weighted Average Grant Date Fair Value |
|||||||
| Unvested as of January 1, 2017 |
36,306 | $ | 24.46 | |||||
| Granted |
12,929 | $ | 27.49 | |||||
| Vested |
11,819 | $ | 24.30 | |||||
|
|
|
|
|
|||||
| Unvested as of December 31, 2017 |
37,416 | $ | 24.04 | |||||
|
|
|
|
|
|||||
Unrestricted Awards
Under the Equity Plan for Directors, the Company provides a stock retainer to non-officer directors of certain subsidiaries. Pursuant to the terms of the retainer, the non-officer directors receive AXA ordinary shares valued at $55,000 each year, paid on a semi-annual basis. These shares are not subject to any vesting requirement or other restriction. For the years ended December 31, 2017 and 2016, the Company recognized compensation expense of approximately $0.4 million and $0.4 million for these unrestricted share awards.
Stock Appreciation Rights
For 2017, 2016 and 2015, respectively, 15,542, 43,606 and 20,337 Stock Appreciation Rights (“SARs”) were granted to certain financial professionals of the Company, each with a 4-year cliff-vesting schedule. These 2017, 2016 and 2015 awards entitle the holder to a cash payment equal to any appreciation in the value of the AXA ordinary share over prices ranging from 18.20 - 33.78 Euros, 18.65-33.78 Euros and 21.00- 33.78 Euros, respectively, as of the date of exercise. At December 31, 2017, 0.4 million SARs were outstanding, having weighted average remaining contractual term of 4.8 years. The accrued value of SARs at December 31, 2017 and 2016 was approximately $4 million and $4 million, respectively, and recorded as liabilities in the consolidated balance sheets. For 2017, 2016 and 2015 the Company recorded compensation expense (credit) for SARs of approximately $0.2 million, $1 million and $2 million, respectively, reflecting the impact in those periods of the changes in their fair values as determined by applying the Black-Scholes formula and assumptions used to price employee stock option awards.
AXA Shareplan
In 2017, eligible employees of participating Company subsidiaries were offered the opportunity to purchase newly issued AXA ordinary shares, subject to plan limits, under the terms of AXA Shareplan 2017. Eligible employees could have reserved a share purchase during the reservation period from August 28, 2017 through September 8, 2017 and could have canceled their reservation or elected to make a purchase for the first time during the retraction/subscription period from October 13, 2017 through October 17, 2017. The U.S. dollar purchase price was determined by applying the U.S. dollar/Euro forward exchange rate on October 11, 2017 to the discounted formula subscription price in Euros. Investment Option A permitted participants to purchase AXA ordinary shares at a 20% formula discounted price of €20.19 per share. Investment Option B permitted participants to purchase AXA ordinary shares at an 8.98% formula discounted price of €22.96 per share on a leveraged basis with a guaranteed return of initial investment plus a portion of any appreciation in the undiscounted value of the total shares purchased. For purposes of determining the amount of any appreciation, the AXA ordinary share price will be measured over a fifty-two week period preceding the scheduled end date of AXA Shareplan 2017, which is July 1, 2022. All subscriptions became binding and irrevocable on October 17, 2017.
The Company recognized compensation expense of $13 million in 2017 , $19 million in 2016 and $20 million in 2015 in connection with each respective year’s offering of AXA stock under the AXA
F-103
Table of Contents
Shareplan, representing the aggregate discount provided to participants for their purchase of AXA stock under each of those plans, as adjusted for the post-vesting, five-year holding period. The Company participants in AXA Shareplan 2017, 2016, and 2015 primarily invested under Investment Option B for the purchase of approximately 4 million, 6 million and 5 million AXA ordinary shares, respectively.
AXA Miles Program 2012
On March 16, 2012, under the terms of the AXA Miles Program 2012, AXA granted 50 AXA Miles to every employee and eligible financial professional of AXA Group for the purpose of enhancing long-term employee-shareholder engagement. Each AXA Mile represents a phantom share of AXA stock that will convert to an actual AXA ordinary share at the end of a four-year vesting period provided the employee or financial professional remains in the employ of the company or has retired from service. Half of each AXA Miles grant, or 25 AXA Miles, were subject to an additional vesting condition that required improvement in at least one of two AXA performance metrics in 2012 as compared to 2011. This vesting condition has been satisfied. On March 16, 2016, AXA ordinary share distributions totaling approximately $4 million were made to active and former employees of the Company in settlement of approximately 0.2 million AXA Miles earned under the terms of the AXA Miles Program 2012.
Stock Purchase Plans
The Company’s stock purchase plan offers eligible employees and financial professionals the opportunity to receive a 10% match on AXA ordinary share purchases. Purchases generally are scheduled to occur at the end of each calendar quarter. The number of AXA ordinary shares reserved for purchase under the plan is 30.0 million. Compensation expense for 2017, 2016 and 2015 were approximately $0.5 million, $0.5 million and $0.4 million, respectively.
AB Long-term Incentive Compensation Plans
AB maintains several unfunded long-term incentive compensation plans for the benefit of certain eligible employees and executives. The AB Capital Accumulation Plan was frozen on December 31, 1987 and no additional awards have been made, however, ACMC, LLC (“ACMC”), an indirect, wholly-owned subsidiary of the Company, is obligated to make capital contributions to AB in amounts equal to benefits paid under this plan as well as other assumed contractual unfunded deferred compensation arrangements covering certain executives. Prior to changes implemented by AB in fourth quarter 2011, as further described below, compensation expense for the remaining active plans was recognized on a straight-line basis over the applicable vesting period. Prior to 2009, participants in these plans designated the percentages of their awards to be allocated among notional investments in AB Holding Units or certain investment products (primarily mutual funds) sponsored by AB. Beginning in 2009, annual awards granted under the Amended and Restated AB Incentive Compensation Award Program were in the form of restricted AB Holding Units.
AB engages in open-market purchases of AB Holding Units to help fund anticipated obligations under its incentive compensation award program, for purchases of AB Holding Units from employees and other corporate purposes. During 2017 and 2016, AB purchased 9 million and 11 million AB Holding Units for $220 million and $236 million, respectively. These amounts reflect open-market purchases of 5 million and 8 million AB Holding Units for $117 million and $176 million, respectively, with the remainder relating to purchases of AB Holding Units from employees to allow them to fulfill statutory tax withholding requirements at the time of distribution of long-term incentive compensation awards, offset by AB Holding Units purchased by employees as part of a distribution reinvestment election.
During 2017, AB granted to employees and eligible directors 8.3 million restricted AB Holding units (including 6.1 million granted in December for 2017 year-end awards to employees).
During 2016, AB granted to employees and eligible directors 7.0 million restricted AB Holding Unit awards (including 6.1 million granted in December for 2016 year-end awards). The cost of awards made in the form of restricted AB Holding Units was measured, recognized, and disclosed as a share-based compensation program.
F-104
Table of Contents
During 2017 and 2016, AB Holding issued 1.2 million and 0.4 million AB Holding Units, respectively, upon exercise of options to buy AB Holding Units. AB Holding used the proceeds of $20 million and $6 million, respectively, received from employees as payment in cash for the exercise price to purchase the equivalent number of newly-issued AB Holding Units.
Effective as of September 30, 2017, AB established the AB 2017 Long Term Incentive Plan (“2017 Plan”), which was adopted at a special meeting of AB Holding Unitholders held on September 29, 2017. The following forms of awards may be granted to employees and Eligible Directors under the 2017 Plan: (i) restricted AB Holding Units or phantom restricted AB Holding Units (a “phantom” award is a contractual right to receive AB Holding Units at a later date or upon a specified event); (ii) options to buy AB Holding Units; and (iii) other AB Holding Unit-based awards (including, without limitation, AB Holding Unit appreciation rights and performance awards). The purpose of the 2017 Plan is to promote the interest of AB by: (i) attracting and retaining talented officers, employees and directors, (ii) motivating such officers, employees and directors by means of performance-related incentives to achieve longer-range business and operational goals, (iii) enabling such officers, employees and directors to participate in the long-term growth and financial success of AB, and (iv) aligning the interests of such officers, employees and directors with those of AB Holding Unitholders. The 2017 Plan will expire on September 30, 2027, and no awards under the 2017 Plan will be made after that date. Under the 2017 Plan, the aggregate number of AB Holding Units with respect to which awards may be granted is 60 million, including no more than 30 million newly-issued AB Holding Units.
As of December 31, 2017, no options to buy AB Holding Units had been granted and 6.1 million AB Holding Units, net of withholding tax requirements, were subject to other AB Holding Unit awards made under the 2017 Plan or an equity compensation plan with similar terms that was canceled in 2017. AB Holding Unit-based awards (including options) in respect of 53.9 million AB Holding Units were available for grant as of December 31, 2017.
The AllianceBernstein 2010 Long Term Incentive Plan, as amended, was canceled on September 30, 2017. The awards and terms under the 2010 Long Term Incentive Plan were substantially similar to the 2017 Plan.
| 14) | INCOME TAXES |
Income (loss) from operations, before income taxes, included income from domestic operations of $1,171 million, $1,935 million and $324 million for the years ended December 31, 2017, 2016 and 2015, and income (losses) from foreign operations of $143 million, $119 million and $117 million for the years ended December 31, 2017, 2016 and 2015. Approximately $30 million, $30 million, and $29 million of the Company’s income tax expense is attributed to foreign jurisdictions for the years ended December 31, 2017, 2016 and 2015.
A summary of the income tax (expense) benefit in the consolidated statements of income (loss) follows:
| 2017 | 2016 | 2015 | ||||||||||
| (In Millions) | ||||||||||||
| Income tax (expense) benefit: |
||||||||||||
| Current (expense) benefit |
$ | 119 | $ | (169 | ) | $ | 136 | |||||
| Deferred (expense) benefit |
(160 | ) | (218 | ) | 81 | |||||||
|
|
|
|
|
|
|
|||||||
| Total |
$ | (41 | ) | $ | (387 | ) | $ | 217 | ||||
|
|
|
|
|
|
|
|||||||
F-105
Table of Contents
The Federal income taxes attributable to consolidated operations are different from the amounts determined by multiplying the earnings before income taxes and noncontrolling interest by the expected Federal income tax rate of 35.0%. The sources of the difference and their tax effects are as follows:
| 2017 | 2016 | 2015 | ||||||||||
| (in millions) | ||||||||||||
| Expected income tax (expense) benefit |
$ | (460 | ) | $ | (719 | ) | $ | (154 | ) | |||
| Noncontrolling interest |
138 | 125 | 96 | |||||||||
| Non-taxable investment income (loss) |
255 | 177 | 191 | |||||||||
| Tax audit interest |
(14 | ) | (32 | ) | (8 | ) | ||||||
| State income taxes |
(16 | ) | (108 | ) | (10 | ) | ||||||
| Tax Settlements/Uncertain Tax Position Release |
228 | 181 | 105 | |||||||||
| Change in Tax Law |
(20 | ) | — | — | ||||||||
| Intangibles |
(138 | ) | (9 | ) | (9 | ) | ||||||
| Other |
(14 | ) | (2 | ) | 6 | |||||||
|
|
|
|
|
|
|
|||||||
| Income tax (expense) benefit |
$ | (41 | ) | $ | (387 | ) | $ | 217 | ||||
|
|
|
|
|
|
|
|||||||
During the second quarter of 2017 the Company agreed to the Internal Revenue Service’s Revenue Agent’s Report for its consolidated 2008 and 2009 Federal corporate income tax returns. The impact on the Company’s financial statements and unrecognized tax benefits was a tax benefit of $228 million. The Company’s financial statements include a tax expense of $129 million related to non-deductible goodwill due to the Company’s early adoption of revised goodwill impairment guidance in the first quarter of 2017.
During the first quarter of 2016, the Company agreed to the Internal Revenue Service’s Revenue Agent’s Report for MONY Life’s consolidated amended 2004-2007 Federal and consolidated 2008 and 2009 Federal corporate income tax returns. The impact on the Company’s statement of income (loss) is an income tax benefit of $21 million. Also during 2016, the Company released an unrecognized tax benefit related to the loss generated by the sale of MONY Life Insurance Company. The benefit recorded in the Company’s financial statements was $160 million.
During the second quarter of 2015, the Company reached a settlement with the IRS on the appeal of proposed adjustments to the Company’s 2004 and 2005 Federal corporate income tax returns. Additionally, on June 30, 2015, the statute of limitations lapsed on certain subsidiaries, resulting in the release of unrecognized tax benefits for timing items and the release of accrued interest thereon. The impact of these events on the Company’s financial statements and unrecognized tax benefits in 2015 was a tax benefit of $105 million.
The Tax Cuts and Jobs Act (the “Tax Reform Act”) was enacted on December 22, 2017. The SEC issued Staff Accounting Bulletin No. 118 (“SAB 118”) to address the application of U.S. GAAP in situations where a company does not have the necessary information available to complete its accounting for certain income tax effects of the Tax Reform Act. In accordance with SAB 118, the Company determined reasonable estimates for certain effects of the Tax Reform Act and recorded those estimates as provisional amounts in the 2017 financial statements due to the need for further analysis, collection and preparation of the relevant data necessary to complete the accounting. These amounts are subject to change as the information necessary to complete the calculations is obtained and as tax authorities issue further guidance.
The following provisional amounts related to the impact of the Tax Reform Act are included in the Company’s financial statements:
| • | An income tax benefit of $3 million from the revaluation of deferred tax assets and liabilities due to lower corporate tax rates. The Company will recognize changes to this estimate as the calculation of cumulative temporary differences is refined. |
| • | An income tax expense of $23 million to account for the deemed repatriation of foreign earnings. The determination of this tax requires further analysis regarding the amount and composition of historical foreign earnings. |
F-106
Table of Contents
The components of the net deferred income taxes are as follows:
| December 31, 2017 | December 31, 2016 | |||||||||||||||
| Assets | Liabilities | Assets | Liabilities | |||||||||||||
| (in millions) | ||||||||||||||||
| Compensation and related benefits |
$ | 328 | $ | — | $ | 605 | $ | — | ||||||||
| Net operating loss |
35 | — | 43 | — | ||||||||||||
| Reserves and reinsurance |
1,454 | — | 1,878 | — | ||||||||||||
| DAC and VOBA |
— | 861 | — | 1,549 | ||||||||||||
| Unrealized investment gains (losses) |
— | 373 | — | 63 | ||||||||||||
| Investments |
— | 891 | — | 859 | ||||||||||||
| Alternative minimum tax credits |
528 | — | 303 | — | ||||||||||||
| Other |
170 | — | 537 | — | ||||||||||||
|
|
|
|
|
|
|
|
|
|||||||||
| Total |
$ | 2,515 | $ | 2,125 | $ | 3,366 | $ | 2,471 | ||||||||
|
|
|
|
|
|
|
|
|
|||||||||
The Company has Federal tax net operating loss carry forwards of $167 million and $123 million, which will expire at various dates from 2029 through 2035 for the years ending December 31, 2017 and 2016, respectively. Realization is dependent on generating sufficient taxable income prior to expiration of the loss carryforwards. Although realization is not assured, management believes it is more likely than not that all of the deferred tax asset will be realized.
The Company had $528 million and $303 million of AMT credits for the years ended December 31, 2017 and 2016, respectively, which do not expire. While the Tax Reform Act repealed the corporate AMT and allows for the refund of a portion of accumulated minimum tax credits, the refundable credits may be subject to a sequestration fee. Included in the deferred tax revaluation is a $35 million charge related to the sequestration of refundable AMT credits.
In accordance with the recently enacted Tax Reform Act, the Company provided a $23 million provisional charge on the deemed repatriation of earnings associated with non-U.S. corporate subsidiaries. Therefore, the Company is no longer asserting permanent reinvestment of earnings overseas. Per SAB 118, the Company continues to evaluate the remaining income tax effects on the reversal of the indefinite reinvestment assertion as a result of the Tax Reform Act.
A reconciliation of unrecognized tax benefits (excluding interest and penalties) follows:
| 2017 | 2016 | 2015 | ||||||||||
| (in millions) | ||||||||||||
| Balance at January 1, |
$ | 729 | $ | 802 | $ | 857 | ||||||
| Additions for tax positions of prior years |
28 | 99 | 44 | |||||||||
| Reductions for tax positions of prior years |
(247 | ) | (172 | ) | (99 | ) | ||||||
| Additions for tax positions of current year |
— | — | — | |||||||||
| Settlements with Tax Authorities |
(33 | ) | — | — | ||||||||
|
|
|
|
|
|
|
|||||||
| Balance at December 31, |
$ | 477 | $ | 729 | $ | 802 | ||||||
|
|
|
|
|
|
|
|||||||
| Unrecognized tax benefits that, if recognized, would impact the effective rate |
$ | 317 | $ | 485 | $ | 620 | ||||||
|
|
|
|
|
|
|
|||||||
The Company recognizes accrued interest and penalties related to unrecognized tax benefits in tax expense. Interest and penalties included in the amounts of unrecognized tax benefits at December 31, 2017 and 2016 were $83 million and $126 million, respectively. For 2017, 2016 and 2015, respectively, there were $(43) million, $25 million and $(47) million in interest expense related to unrecognized tax benefits.
It is reasonably possible that the total amount of unrecognized tax benefits will change within the next 12 months due to the conclusion of IRS proceedings and the addition of new issues for open tax years. The possible change in the amount of unrecognized tax benefits cannot be estimated at this time.
F-107
Table of Contents
As of December 31, 2017, tax years 2010 and subsequent remain subject to examination by the IRS.
| 15) | ACCUMULATED OTHER COMPREHENSIVE INCOME (LOSS) |
AOCI represents cumulative gains (losses) on items that are not reflected in income (loss). The balances for the past three years follow:
| December 31, | ||||||||||||
| 2017 | 2016 | 2015 | ||||||||||
| (in millions) | ||||||||||||
| Unrealized gains (losses) on investments |
$ | 830 | $ | 140 | $ | 414 | ||||||
| Foreign currency translation adjustments |
(35 | ) | (77 | ) | (59 | ) | ||||||
| Defined benefit pension plans |
(955 | ) | (1,055 | ) | (1,089 | ) | ||||||
|
|
|
|
|
|
|
|||||||
| Total accumulated other comprehensive income (loss) |
(160 | ) | (992 | ) | (734 | ) | ||||||
|
|
|
|
|
|
|
|||||||
| Less: Accumulated other comprehensive (income) loss attributable to noncontrolling interest |
52 | 71 | 57 | |||||||||
|
|
|
|
|
|
|
|||||||
| Accumulated other comprehensive income (loss) attributable to Holdings |
$ | (108 | ) | $ | (921 | ) | $ | (677 | ) | |||
|
|
|
|
|
|
|
|||||||
The components of OCI for the past three years, net of tax, follow:
| As of December 31, | ||||||||||||
| 2017 | 2016 | 2015 | ||||||||||
| (in millions) | ||||||||||||
| Foreign currency translation adjustments: |
||||||||||||
| Foreign currency translation gains (losses) arising during the period |
$ | 42 | $ | (18 | ) | $ | (25 | ) | ||||
| (Gains) losses reclassified into net income (loss) during the period |
— | — | — | |||||||||
|
|
|
|
|
|
|
|||||||
| Foreign currency translation adjustment |
42 | (18 | ) | (25 | ) | |||||||
|
|
|
|
|
|
|
|||||||
| Change in net unrealized gains (losses) on investments: |
||||||||||||
| Net unrealized gains (losses) arising during the year |
910 | (227 | ) | (1,202 | ) | |||||||
| (Gains) losses reclassified into net income (loss) during the year(1) |
10 | (55 | ) | 13 | ||||||||
|
|
|
|
|
|
|
|||||||
| Net unrealized gains (losses) on investments |
920 | (282 | ) | (1,189 | ) | |||||||
| Adjustments for policyholders liabilities, DAC, insurance liability loss recognition and other |
(230 | ) | 8 | 250 | ||||||||
|
|
|
|
|
|
|
|||||||
| Change in unrealized gains (losses), net of adjustments (net of deferred income tax expense (benefit) of $(262) million, $(164) million, and $(505) million) |
690 | (274 | ) | (939 | ) | |||||||
|
|
|
|
|
|
|
|||||||
| Change in defined benefit plans: |
||||||||||||
| Less: reclassification adjustments to net income (loss) for:(2) |
||||||||||||
| Amortization of net prior service credit included in net periodic cost |
100 | 34 | 35 | |||||||||
|
|
|
|
|
|
|
|||||||
| Change in defined benefit plans (net of deferred income tax expense (benefit) of $51 million, $19 million, $19 million) |
100 | 34 | 35 | |||||||||
|
|
|
|
|
|
|
|||||||
| Total other comprehensive income (loss), net of income taxes |
832 | (258 | ) | (929 | ) | |||||||
| Less: Other comprehensive (income) loss attributable to noncontrolling interest |
(19 | ) | 14 | 14 | ||||||||
|
|
|
|
|
|
|
|||||||
| Other comprehensive income (loss) attributable to Holdings |
$ | 813 | $ | (244 | ) | $ | (915 | ) | ||||
|
|
|
|
|
|
|
|||||||
| (1) | See “Reclassification adjustments” in Note 3. Reclassification amounts presented net of income tax expense (benefit) of $5 million, $29 million and $(7) million for 2017, 2016 and 2015, respectively. |
| (2) | These AOCI components are included in the computation of net periodic costs (see “Employee Benefit Plans” in Note 12). Reclassification amounts presented net of income tax expense (benefit) of $(51) million, $(19) million and $(19) million for 2017, 2016 and 2015, respectively. |
F-108
Table of Contents
Investment gains and losses reclassified from AOCI to net income (loss) primarily consist of realized gains (losses) on sales and OTTI of AFS securities and are included in Total investment gains (losses), net on the consolidated statements of income (loss). Amounts reclassified from AOCI to net income (loss) as related to defined benefit plans primarily consist of amortizations of net (gains) losses and net prior service cost (credit) recognized as a component of net periodic cost and reported in Compensation and benefit expenses in the consolidated statements of income (loss). Amounts presented in the table above are net of tax.
| 16) | COMMITMENTS AND CONTINGENT LIABILITIES |
Litigation
Litigation, regulatory and other loss contingencies arise in the ordinary course of the Company’s activities as a diversified financial services firm. The Company is a defendant in a number of litigation matters arising from the conduct of its business. In some of these matters, claimants seek to recover very large or indeterminate amounts, including compensatory, punitive, treble and exemplary damages. Modern pleading practice in the U.S. permits considerable variation in the assertion of monetary damages and other relief. Claimants are not always required to specify the monetary damages they seek or they may be required only to state an amount sufficient to meet a court’s jurisdictional requirements. Moreover, some jurisdictions allow claimants to allege monetary damages that far exceed any reasonably possible verdict. The variability in pleading requirements and past experience demonstrates that the monetary and other relief that may be requested in a lawsuit or claim often bears little relevance to the merits or potential value of a claim. Litigation against the Company includes a variety of claims including, among other things, insurers’ sales practices, alleged agent misconduct, alleged failure to properly supervise agents, contract administration, product design, features and accompanying disclosure, cost of insurance increases, the use of captive reinsurers, payments of death benefits and the reporting and escheatment of unclaimed property, alleged breach of fiduciary duties, alleged mismanagement of client funds and other matters.
As with other financial services companies, the Company periodically receives informal and formal requests for information from various state and federal governmental agencies and self-regulatory organizations in connection with inquiries and investigations of the products and practices of the Company or the financial services industry. It is the practice of the Company to cooperate fully in these matters.
The outcome of a litigation or regulatory matter is difficult to predict and the amount or range of potential losses associated with these or other loss contingencies requires significant management judgment. It is not possible to predict the ultimate outcome or to provide reasonably possible losses or ranges of losses for all pending regulatory matters, litigation and other loss contingencies. While it is possible that an adverse outcome in certain cases could have a material adverse effect upon the Company’s financial position, based on information currently known, management believes that neither the outcome of pending litigation and regulatory matters, nor potential liabilities associated with other loss contingencies, are likely to have such an effect. However, given the large and indeterminate amounts sought in certain litigation and the inherent unpredictability of all such matters, it is possible that an adverse outcome in certain of the Company’s litigation or regulatory matters, or liabilities arising from other loss contingencies, could, from time to time, have a material adverse effect upon the Company’s results of operations or cash flows in a particular quarterly or annual period.
For some matters, the Company is able to estimate a possible range of loss. For such matters in which a loss is probable, an accrual has been made. For matters where the Company, however, believes a loss is reasonably possible, but not probable, no accrual is required. For matters for which an accrual has been made, but there remains a reasonably possible range of loss in excess of the amounts accrued or for matters where no accrual is required, the Company develops an estimate of the unaccrued amounts of the reasonably possible range of losses. As of December 31, 2017, the Company estimates the aggregate range of reasonably possible losses, in excess of any amounts accrued for these matters as of such date, to be up to approximately $90 million.
F-109
Table of Contents
For other matters, the Company is currently not able to estimate the reasonably possible loss or range of loss. The Company is often unable to estimate the possible loss or range of loss until developments in such matters have provided sufficient information to support an assessment of the range of possible loss, such as quantification of a damage demand from plaintiffs, discovery from plaintiffs and other parties, investigation of factual allegations, rulings by a court on motions or appeals, analysis by experts and the progress of settlement discussions. On a quarterly and annual basis, the Company reviews relevant information with respect to litigation and regulatory contingencies and updates the Company’s accruals, disclosures and reasonably possible losses or ranges of loss based on such reviews.
In July 2011, a derivative action was filed in the United States District Court for the District of New Jersey entitled Mary Ann Sivolella v. AXA Equitable Life Insurance Company and AXA Equitable Funds Management Group, LLC (“Sivolella Litigation”) and a substantially similar action was filed in January 2013 entitled Sanford et al. v. AXA Equitable FMG (“Sanford Litigation”). These lawsuits were filed on behalf of a total of twelve mutual funds and, among other things, seek recovery under (i) Section 36(b) of the Investment Company Act of 1940, as amended (the “Investment Company Act”), for alleged excessive fees paid to AXA Equitable Life and AXA Equitable FMG for investment management services and administrative services and (ii) a variety of other theories including unjust enrichment. The Sivolella Litigation and the Sanford Litigation were consolidated and a 25-day trial commenced in January 2016 and concluded in February 2016. In August 2016, the District Court issued its decision in favor of AXA Equitable Life and AXA Equitable FMG, finding that the plaintiffs had failed to meet their burden to demonstrate that AXA Equitable Life and AXA Equitable FMG breached their fiduciary duty in violation of Section 36(b) of the Investment Company Act or show any actual damages. In September 2016, the plaintiffs filed a motion to amend the District Court’s trial opinion and to amend or make new findings of fact and/or conclusions of law. In December 2016, the District Court issued an order denying the motion to amend and plaintiffs filed a notice to appeal the District Court’s decision to the U.S. Court of Appeals for the Third Circuit. We are vigorously defending this matter.
In April 2014, a lawsuit was filed in the United States District Court for the Southern District of New York, now entitled Ross v. AXA Equitable Life Insurance Company. The lawsuit is a putative class action on behalf of all persons and entities that, between 2011 and March 11, 2014, directly or indirectly, purchased, renewed or paid premiums on life insurance policies issued by AXA Equitable Life (the “Policies”). The complaint alleges that AXA Equitable Life did not disclose in its New York statutory annual statements or elsewhere that the collateral for certain reinsurance transactions with affiliated reinsurance companies was supported by parental guarantees, an omission that allegedly caused AXA Equitable Life to misrepresent its “financial condition” and “legal reserve system.” The lawsuit seeks recovery under Section 4226 of the New York Insurance Law of all premiums paid by the class for the Policies during the relevant period. In July 2015, the Court granted AXA Equitable Life’s motion to dismiss for lack of subject matter jurisdiction. In April 2015, a second action in the United States District Court for the Southern District of New York was filed on behalf of a putative class of variable annuity holders with “Guaranteed Benefits Insurance Riders,” entitled Calvin W. Yarbrough, on behalf of himself and all others similarly situated v. AXA Equitable Life Insurance Company. The new action covers the same class period, makes substantially the same allegations, and seeks the same relief as the Ross action. In October 2015, the Court, on its own, dismissed the Yarbrough litigation on similar grounds as the Ross litigation. In December 2015, the Second Circuit denied the plaintiffs motion to consolidate their appeals but ordered that the appeals be heard together before a single panel of judges. In February 2017, the Second Circuit affirmed the decisions of the district court in favor of AXA Equitable Life, and that decision is now final because the plaintiffs failed to file a further appeal.
In November 2014, a lawsuit was filed in the Superior Court of New Jersey, Camden County entitled Arlene Shuster, on behalf of herself and all others similarly situated v. AXA Equitable Life Insurance Company. This lawsuit is a putative class action on behalf of all AXA Equitable Life variable life insurance policyholders who allocated funds from their policy accounts to investments in AXA Equitable Life’s Separate Accounts, which were subsequently subjected to the volatility-management strategy and who
F-110
Table of Contents
suffered injury as a result thereof. The action asserts that AXA Equitable Life breached its variable life insurance contracts by implementing the volatility management strategy. In February 2016, the Court dismissed the complaint. In March 2016, the plaintiff filed a notice of appeal. In August 2015, another lawsuit was filed in Connecticut Superior Court, Judicial Division of New Haven entitled Richard T. O’Donnell, on behalf of himself and all others similarly situated v. AXA Equitable Life Insurance Company. This lawsuit is a putative class action on behalf of all persons who purchased variable annuities from AXA Equitable Life, which were subsequently subjected to the volatility-management strategy and who suffered injury as a result thereof. Plaintiff asserts a claim for breach of contract alleging that AXA Equitable Life implemented the volatility management strategy in violation of applicable law. In November 2015, the Connecticut Federal District Court transferred this action to the United States District Court for the Southern District of New York. In March 2017, the Southern District of New York granted AXA Equitable Life’s motion to dismiss the complaint. In April 2017, the plaintiff filed a notice of appeal. In April 2018, the appellate court reversed the trial court’s decision and remanded the case back to Connecticut state court. We are vigorously defending these matters.
In February 2016, a lawsuit was filed in the United States District Court for the Southern District of New York entitled Brach Family Foundation, Inc. v. AXA Equitable Life Insurance Company. This lawsuit is a putative class action brought on behalf of all owners of UL policies subject to AXA Equitable Life’s COI increase. In early 2016, AXA Equitable Life raised COI rates for certain UL policies issued between 2004 and 2007, which had both issue ages 70 and above and a current face value amount of $1 million and above. The current complaint alleges a claim for breach of contract and a claim that AXA Equitable Life made misrepresentations in violation of Section 4226 of the New York Insurance Law (“Section 4226”). Plaintiff seeks (a) with respect to its breach of contract claim, compensatory damages, costs, and, pre- and post-judgment interest, and (b) with respect to its claim concerning Section 4226, a penalty in the amount of premiums paid by the plaintiff and the putative class. AXA Equitable Life’s response to the complaint was filed in February 2017. Additionally, a separate putative class action and seven individual actions challenging the COI increase have been filed against AXA Equitable Life in federal or state courts. Within that group, all of the outstanding federal actions (the second putative class action and three individual actions) have been transferred to the Federal court where the Brach litigation is pending. In October 2017, the Brach court entered an order consolidating the Brach class action and the other putative class action for all purposes and ordered that the three individual actions be consolidated with the Brach litigation for the purposes of coordinating pre-trial activities. We are in various stages of motion practice in each of these matters and are vigorously defending them.
Debt Maturities
At December 31, 2017, aggregate maturities of the long-term debt, based on required principal payments at maturity were $0 million for the next four successive years and $552 million thereafter.
At December 31, 2017, aggregate maturities of the loans from affiliates, based on required principal payments at maturity were $1,092 million for 2018, $0 million for 2019, $770 million in 2020 and $1,760 million for years 2021 and thereafter.
Leases
The Company has entered into operating leases for office space and certain other assets, principally information technology equipment and office furniture and equipment. Future minimum payments under non-cancelable operating leases for 2018 and the four successive years are $214 million, $207 million, $177 million, $169 million, $156 million and $334 million thereafter. Minimum future sublease rental income on these non-cancelable operating leases for 2018 and the four successive years is $56 million, $58 million, $41 million, $40 million, $37 million and $60 million thereafter.
Rent expense, which is amortized on a straight-line basis over the life of the lease, was $142.9 million, $140.2 million, $137.7 million, respectively, for the years ended December 31, 2017, 2016 and 2015, net of
F-111
Table of Contents
sublease income of $16.4 million, $15.8 million, $5.2 million, respectively, for the years ended December 31, 2017, 2016 and 2015.
Obligations under Funding Agreements
Entering into FHLBNY membership, borrowings and funding agreements requires the ownership of FHLBNY stock and the pledge of assets as collateral. The Company has purchased FHLBNY stock of $144 million and pledged collateral with a carrying value of $4.5 billion, as of December 31, 2017. The Company issues short-term funding agreements to the FHLBNY and uses the funds for asset liability and cash management purposes. The Company issues long term funding agreements to the FHLBNY and uses the funds for spread lending purposes. Funding agreements are reported in Policyholders’ account balances in the consolidated balance sheets. For other instruments used for asset/liability and cash management purposes, see “Derivative and offsetting assets and liabilities” included in Note 3. The table below summarizes the Company’s activity of funding agreements with the FHLBNY.
| Outstanding balance at end of period |
Maturity of Outstanding balance |
Issued during the period |
Repaid during the period |
|||||||||||
| (in millions) | ||||||||||||||
| December 31, 2017: |
||||||||||||||
| Short-term FHLBNY funding agreements |
$ | 500 | less than one month | $ | 6,000 | $ | 6,000 | |||||||
| Long-term FHLBNY funding agreements |
1,244 | less than 4 years | 324 | — | ||||||||||
| 377 | Less than 5 years | 303 | — | |||||||||||
| 879 | greater than five years | 135 | — | |||||||||||
|
|
|
|
|
|
|
|||||||||
| Total long term funding agreements |
2,500 | 762 | — | |||||||||||
|
|
|
|
|
|
|
|||||||||
| Total FHLBNY funding agreements at December 31, 2017(1) |
$ | 3,000 | $ | 6,762 | $ | 6,000 | ||||||||
|
|
|
|
|
|
|
|||||||||
| December 31, 2016: |
||||||||||||||
| Short-term FHLBNY funding agreements |
$ | 500 | less than one month | $ | 6,000 | $ | 6,000 | |||||||
| Long-term FHLBNY funding agreements |
58 | less than 4 years | 58 | — | ||||||||||
| 862 | Less than 5 years | 862 | — | |||||||||||
| 818 | greater than five years | 818 | — | |||||||||||
|
|
|
|
|
|
|
|||||||||
| Total long term funding agreements |
1,738 | 1,738 | — | |||||||||||
|
|
|
|
|
|
|
|||||||||
| Total FHLBNY funding agreements at December 31, 2016 |
$ | 2,238 | $ | 7,738 | $ | 6,000 | ||||||||
|
|
|
|
|
|
|
|||||||||
| (1) | The $14 million difference between the funding agreements carrying value shown in fair value table for 2017 and contractual obligation value for 2017 reflects the impact of a hedge implemented to lock in the funding agreements borrowing rate. |
F-112
Table of Contents
Restructuring
As part of the Company’s on-going efforts to reduce costs and operate more efficiently, from time to time, management has approved and initiated plans to reduce headcount and relocate certain operations. In 2017, 2016 and 2015 respectively, the Company recorded $29 million, $21 million and $3 million pre-tax charges related to severance and lease costs. The restructuring costs, included in other operating expenses and liabilities, included in other liabilities, associated with the Company’s initiatives were as follows:
| December 31, | ||||||||
| 2017 | 2016 | |||||||
| (in millions) | ||||||||
| Severance |
||||||||
| Balance, beginning of year |
$ | 22 | $ | 11 | ||||
| Additions |
17 | 20 | ||||||
| Cash payments |
(14 | ) | (9 | ) | ||||
| Other reductions |
(2 | ) | — | |||||
|
|
|
|
|
|||||
| Balance, end of year |
$ | 23 | $ | 22 | ||||
|
|
|
|
|
|||||
| December 31, | ||||||||
| 2017 | 2016 | |||||||
| (in millions) | ||||||||
| Leases |
||||||||
| Balance as of January 1, 2017 |
$ | 170 | $ | 190 | ||||
| Expense incurred |
29 | 12 | ||||||
| Deferred rent |
10 | 5 | ||||||
| Payments made |
(48 | ) | (42 | ) | ||||
| Interest accretion |
4 | 5 | ||||||
|
|
|
|
|
|||||
| Balance as of end of period |
$ | 165 | $ | 170 | ||||
|
|
|
|
|
|||||
In addition to the above, in an effort to further reduce its global real estate footprint, AB completed a comprehensive review of its worldwide office locations and began implementing a global space consolidation plan in 2012. This resulted in the sublease of office space primarily in New York as well as offices in England, Australia and various U.S. locations. In 2017, AB recorded new real estate charges of $37 million, resulting from new charges of $40 million relating to the further consolidation of office space at AB’s New York offices, offset by changes in estimates related to previously recorded real estate charges of $4 million, which reflects the shortening of the lease term of AB’s corporate headquarters from 2029 to 2024. Real estate charges are recorded in Other operating costs and expenses in the Company’s consolidated Statements of income (loss).
Guarantees and Other Commitments
The Company provides certain guarantees or commitments to affiliates and others. At December 31, 2017, these arrangements include commitments by the Company to provide equity financing of $756 million (including $234 million with affiliates and $22 million on consolidated VIEs) to certain limited partnerships and real estate joint ventures under certain conditions. Management believes the Company will not incur material losses as a result of these commitments.
The Company is the obligor under certain structured settlement agreements it had entered into with unaffiliated insurance companies and beneficiaries. To satisfy its obligations under these agreements, the Company owns single premium annuities issued by previously wholly owned life insurance subsidiaries. The Company has directed payment under these annuities to be made directly to the beneficiaries under the structured settlement agreements. A contingent liability exists with respect to these agreements should the previously wholly owned subsidiaries be unable to meet their obligations. Management believes the need for the Company to satisfy those obligations is remote.
F-113
Table of Contents
The Company had $4,489 million of undrawn letters of credit, including $4,260 million at AXA Arizona RE related to reinsurance assumed from AXA Equitable Life, USFL and MLOA at December 31, 2017. Holdings had $636 million of commitments under existing mortgage loan agreements at December 31, 2017.
AXA Equitable Life, USFL and MLOA receive statutory reserve credits for reinsurance treaties with AXA Arizona RE to the extent AXA Arizona holds assets in an irrevocable trust (the “Trust”) ($10.4 billion at December 31, 2017) and/or letters of credit ($4.3 billion at December 31, 2017). These letters of credit are guaranteed by AXA or AXA Financial. Under the reinsurance transactions, AXA Arizona RE is permitted to transfer assets from the Trust under certain circumstances. The level of statutory reserves held by AXA Arizona RE fluctuate based on market movements, mortality experience and policyholder behavior. Increasing reserve requirements may necessitate that additional assets be placed in trust and/or securing additional letters of credit, which could adversely impact AXA Arizona RE’s liquidity.
In addition, AXA Arizona RE utilizes derivative instruments as well as repurchase agreement transactions that are collectively managed in an effort to reduce the economic impact of unfavorable changes to GMDB and GMIB reserves. The use of such instruments are accompanied by agreements which specify the circumstances under which the parties are required to pledge collateral related to the decline in the estimated fair value of specified instruments. Moreover, under the terms of a majority of the transactions, payments to counterparties related to the change in fair value of the instruments may be required. The amount of collateral pledged and the amount of payments required to be made pursuant to such transactions may increase under certain circumstances, which could adversely impact AXA Arizona RE’s liquidity.
AB maintains a guarantee in connection with the AB Credit Facility. If SCB LLC is unable to meet its obligations, AB will pay the obligations when due or on demand. In addition, AB maintains guarantees totaling $375 million for SCB LLC’s three uncommitted lines of credit.
AB maintains a guarantee with a commercial bank, under which it guarantees the obligations in the ordinary course of business of SCB LLC, SCBL and AllianceBernstein Holdings (Cayman) Ltd. (“AB Cayman”). AB also maintains three additional guarantees with other commercial banks under which it guarantees approximately $410 million of obligations for SCBL. In the event that SCB LLC, SCBL or AB Cayman is unable to meet its obligations, AB will pay the obligations when due or on demand.
AB also has two smaller guarantees with a commercial bank totaling approximately $2 million, under which it guarantees certain obligations in the ordinary course of business of one of its foreign subsidiaries.
During 2009, AB entered into a subscription agreement under which it committed to invest up to $35 million, as amended in 2011, in a venture capital fund over a six-year period. As of December 31, 2017, AB had funded all of this commitment.
During 2010, as general partner of the AB U.S. Real Estate L.P. (the “Real Estate Fund”), AB committed to invest $25 million in the Real Estate Fund. As of December 31, 2017, AB had funded $22 million of this commitment. As general partner of the AB U.S. Real Estate II L.P. (“Real Estate Fund II”), AB committed to invest $28 million in Real Estate Fund II. As of December 31, 2017, AB funded $10 million of this commitment.
During 2012, AB entered into an investment agreement under which it committed to invest up to $8 million in an oil and gas fund over a three-year period. As of December 31, 2017, AB had funded $6 million of this commitment.
AB has not been required to perform under any of the above agreements and currently have no liability in connection with these agreements.
| 17) | INSURANCE GROUP STATUTORY FINANCIAL INFORMATION |
AXA Equitable Life, MLOA, USFL, AXA Equitable Life and Annuity (“AXA Equitable L&A”) and ACS Life are restricted as to the amounts they may pay as dividends and amounts it may repay of surplus notes to
F-114
Table of Contents
Holdings. Under the applicable states’ insurance law, a domestic life insurer may not, without prior approval of the Superintendent, pay a dividend to its shareholders exceeding an amount calculated based on a statutory formula. This formula would permit AXA Equitable Life to pay shareholder dividends not greater than approximately $1,242 million during 2018. Payment of dividends exceeding this amount requires the insurer to file a notice of its intent to declare such dividends with the applicable state’s Superintendent who then has 30 days to disapprove the distribution. This formula would not permit MLOA, USFL, AXA Equitable L&A and ACS Life to pay a dividend in 2018. For 2017, 2016, and 2015, respectively, AXA Equitable Life’s, MLOA’s, USFL’s, AXA Equitable L&A’s and ACS Life’s combined statutory net income (loss) totaled $942 million, $656 million and $2,042 million. Statutory surplus, capital stock and Asset Valuation Reserve (“AVR”) totaled $8,573 million and $5,893 million at December 31, 2017 and 2016, respectively. In 2017, AXA Equitable Life did not pay shareholder dividends and in 2016, AXA Equitable Life paid $1,050 million in shareholder dividends. In 2015, AXA Equitable Life paid $767 million in shareholder dividends and transferred approximately 10.0 million in Units of AB (fair value of $245 million) in the form of a dividend to AXA Equitable Financial Services, LLC.
At December 31, 2017, AXA Equitable Life, MLOA, USFL, AXA Equitable L&A and ACS Life, in accordance with various government and state regulations, had $85 million of securities on deposit with such government or state agencies.
In 2015, AXA Equitable Life, with the approval of the NYDFS, repaid $200 million of third party surplus notes at maturity. In 2015 ACS Life with the approval of Delaware Department of Insurance repaid $242 million of surplus notes to Holdings prior to maturity.
At December 31, 2017 and for the year then ended, for AXA Equitable Life, MLOA, USFL and AXA Equitable L&A there were no differences in net income (loss) and capital and surplus resulting from practices prescribed and permitted by NYDFS, the Arizona Department of Insurance (the “AID”) and those prescribed by NAIC Accounting Practices and Procedures effective at December 31, 2017. At December 31, 2017 ACS Life had a difference in capital and surplus based on the investment valuation of the Captive reinsurance subsidiary which follows a special purpose framework for Statutory reporting as agreed to with the AID from practices prescribed and permitted by the Delaware Department of Insurance and those prescribed by NAIC Accounting Practices and Procedures effective at December 31, 2017. The impact of this permitted practice increased the statutory surplus and AVR of ACS Life by $103 million and $157 million at December 31, 2017 and 2016, respectively. ACS Life’s risk-based capital would have triggered a regulatory event without the use of this permitted practice in 2016.
AXA Equitable Life, USFL and MLOA cede a portion of their statutory reserves to AXA Arizona RE, a captive reinsurer, as part of the Company’s capital management strategy. AXA Arizona RE prepares financial statements in a special purpose framework for statutory reporting.
Accounting practices used to prepare statutory financial statements for regulatory filings of stock life insurance companies differ in certain instances from GAAP. The differences between statutory surplus and capital stock determined in accordance with Statutory Accounting Principles (“SAP”) and total equity under GAAP are primarily: (a) the inclusion in SAP of an AVR intended to stabilize surplus from fluctuations in the value of the investment portfolio; (b) future policy benefits and policyholders’ account balances under SAP differ from GAAP due to differences between actuarial assumptions and reserving methodologies; (c) certain policy acquisition costs are expensed under SAP but deferred under GAAP and amortized over future periods to achieve a matching of revenues and expenses; (d) under SAP, Federal income taxes are provided on the basis of amounts currently payable with limited recognition of deferred tax assets while under GAAP, deferred taxes are recorded for temporary differences between the financial statements and tax basis of assets and liabilities where the probability of realization is reasonably assured; (e) the valuation of assets under SAP and GAAP differ due to different investment valuation and depreciation methodologies, as well as the deferral of interest-related realized capital gains and losses on fixed income investments; (f) the valuation of the investment in AB and AB Holding under SAP reflects a portion of the market value appreciation rather than the equity in the underlying net assets as required under GAAP; (g) reporting the
F-115
Table of Contents
surplus notes as a component of surplus in SAP but as a liability in GAAP; (h) computer software development costs are capitalized under GAAP but expensed under SAP; (i) certain assets, primarily prepaid assets, are not admissible under SAP but are admissible under GAAP, (j) the fair valuing of all acquired assets and liabilities including VOBA and intangible assets are required for GAAP purchase accounting and (k) cost of reinsurance which is recognized as expense under SAP and amortized over the life of the underlying reinsured policies under GAAP.
| 18) | BUSINESS SEGMENT INFORMATION |
The Company has four reportable segments: Individual Retirement, Group Retirement, Investment Management and Research and Protection Solutions.
The Company changed its segment presentation in the fourth quarter 2017. The segment disclosures are based on the intention to provide the users of the financial statements with a view of the business from the Company’s perspective. As a result, the Company determined that it is more useful for a user of the financial statements to assess the historical performance on the basis which management currently evaluates the business. The reportable segments are based on the nature of the business activities, as they exist as of the initial filing date.
These segments reflect the manner by which the Company’s chief operating decision maker views and manages the business. A brief description of these segments follows:
| • | The Individual Retirement segment offers a diverse suite of variable annuity products which are primarily sold to affluent and high net worth individuals saving for retirement or seeking retirement income. |
| • | The Group Retirement segment offers tax-deferred investment and retirement plans to sponsored by educational entities, municipalities and not-for-profit entities as well as small and medium-sized businesses. |
| • | The Investment Management and Research segment provides diversified investment management, research and related solutions globally to a broad range of clients through three main client channels- Institutional, Retail and Private Wealth Management-and distributes its institutional research products and solutions through Bernstein Research Services. |
| • | The Protection Solutions segment includes our life insurance and group employee benefits businesses. Our life insurance business offers a variety of variable universal life, universal life and term life products to help affluent and high net worth individuals, as well as small and medium-sized business owners, with their wealth protection, wealth transfer and corporate needs. Our group employee benefits business offers a suite of dental, vision, life, and short- and long-term disability and other insurance products to small and medium-size businesses across the United States. |
Measurement
Operating earnings (loss) is the financial measure which primarily focuses on the Company’s segments’ results of operations as well as the underlying profitability of the Company’s core business. By excluding items that can be distortive and unpredictable such as investment gains (losses) and investment income (loss) from derivative instruments, the Company believes operating earnings (loss) by segment enhances the understanding of the Company’s underlying drivers of profitability and trends in the Company’s segments. Operating earnings is calculated by adjusting each segment’s Net income (loss) attributable to Holdings for the following items:
| • | Adjustments related to GMxB features include changes in the fair value of the derivatives we use to hedge our GMxB features within our variable annuity products, the effect of benefit ratio unlock adjustments and changes in the fair value of the embedded derivatives of our GMxB riders reflected within variable annuity products net derivative result; |
F-116
Table of Contents
| • | Investment (gains) losses, which includes other-than-temporary impairments of securities, sales or disposals of securities/investments, realized capital gains/losses and valuation allowances; |
| • | Derivative (gains) losses from certain derivative instruments, which includes net derivative (gains) losses, excluding derivative instruments used to hedge risks associated with interest margins on interest sensitive life and annuity contracts, replicate credit exposure of fixed maturity securities, replicate a dollar-denominated fixed-coupon cash bonds, Separate Account fee hedges, and freestanding and embedded derivatives associated with products with GMxB features; |
| • | Net actuarial (gains) losses, which includes actuarial gains and losses as a result of differences between actual and expected experience on pension plan assets or projected benefit obligation during a given period related to pension and other postretirement benefit obligations; |
| • | Other adjustments including restructuring costs related to severance, lease write-offs related to non-recurring restructuring activities and write-downs of goodwill; and |
| • | Income tax expense (benefit) related to above adjustments and non-recurring tax items. |
All of the Company’s premiums, UL and investment-type product policy fees and other revenues originated in the United States. Income (loss) from operations, before income taxes included $139 million, $109 million and $111 million generated outside of the United States in 2017, 2016 and 2015, respectively, primarily attributable to our Investment Management and Research Segment.
Revenues derived from any customer did not exceed 10% of revenues for the years ended December 31, 2017, 2016 and 2015.
The table below presents operating earnings (loss) by segment and Corporate and Other and a reconciliation to Net income (loss) attributable to Holdings for the years ended December 31, 2017, 2016 and 2015, respectively:
| Years Ended December 31, | ||||||||||||
| 2017 | 2016 | 2015 | ||||||||||
| (in millions) | ||||||||||||
| Net income (loss) attributable to Holdings |
$ | 850 | $ | 1,272 | $ | 333 | ||||||
| Adjustments related to: |
||||||||||||
| GMxB features |
1,244 | 2,068 | 1,697 | |||||||||
| Investment (gains) losses |
191 | (1,983 | ) | 15 | ||||||||
| Investment income from certain derivative instruments |
18 | 6 | (104 | ) | ||||||||
| Net actuarial (gains) losses related to pension and other postretirement benefit obligations |
135 | 140 | 137 | |||||||||
| Goodwill impairment |
369 | — | — | |||||||||
| Other adjustments |
89 | 12 | (11 | ) | ||||||||
| Income tax expense (benefit) related to above adjustments |
(699 | ) | (76 | ) | (592 | ) | ||||||
| Non-recurring tax items |
(76 | ) | (63 | ) | (103 | ) | ||||||
|
|
|
|
|
|
|
|||||||
| Non-GAAP Operating Earnings |
$ | 2,121 | $ | 1,376 | $ | 1,372 | ||||||
|
|
|
|
|
|
|
|||||||
| Operating earnings (loss) by segment: |
||||||||||||
| Individual Retirement |
$ | 1,287 | $ | 1,153 | $ | 1,060 | ||||||
| Group Retirement |
283 | 167 | 167 | |||||||||
| Investment Management and Research |
211 | 161 | 173 | |||||||||
| Protection Solutions |
536 | 79 | 113 | |||||||||
| Corporate and Other(1) |
(196 | ) | (184 | ) | (141 | ) | ||||||
| (1) | Includes interest expense of $138 million, $161 million, and $131 million, in 2017, 2016 and 2015, respectively. |
F-117
Table of Contents
Segment revenues is a measure of the Company’s revenue by segment as adjusted to exclude certain items. The following table reconciles segment revenues to Total revenues by excluding the following items:
| • | Adjustment related to our GMxB business which includes: changes in the fair value of the derivatives we use to hedge our GMxB riders within our variable annuities, and changes in the fair value of the embedded derivatives of our GMxB riders reflected within variable annuity net derivative result; |
| • | Investment gains (losses), which include other-than-temporary impairments of securities, sales or disposals of securities/investments, realized capital gains/losses, and valuation allowances; and |
| • | Investment income (loss) from certain derivative instruments, which includes net derivative gains (losses), excluding derivative instruments used to hedge risks associated with interest margins on interest sensitive life and annuity contracts, separate account fee hedges, and freestanding and embedded derivatives associated with products with GMxB features. |
The table below presents segment revenues for the years ended December 31, 2017, 2016 and 2015.
| Years Ended December 31, | ||||||||||||
| 2017 | 2016 | 2015 | ||||||||||
| (in millions) | ||||||||||||
| Segment revenues: |
||||||||||||
| Individual Retirement(1) |
$ | 4,356 | $ | 3,731 | $ | 3,204 | ||||||
| Group Retirement(1) |
947 | 801 | 794 | |||||||||
| Investment Management and Research(2) |
3,216 | 2,933 | 3,024 | |||||||||
| Protection Solutions(1) |
3,046 | 3,124 | 2,972 | |||||||||
| Corporate and Other(1) |
1,212 | 1,256 | 1,405 | |||||||||
| Adjustments: |
||||||||||||
| Adjustments related to GMxB features |
(242 | ) | (2,069 | ) | (1,385 | ) | ||||||
| Investment gains (losses) |
(191 | ) | 1,983 | (15 | ) | |||||||
| Investment income (loss) from certain derivative instruments |
(18 | ) | (6 | ) | 104 | |||||||
| Other adjustments to segment revenues |
188 | 169 | (24 | ) | ||||||||
|
|
|
|
|
|
|
|||||||
| Total revenues |
$ | 12,514 | $ | 11,922 | $ | 10,079 | ||||||
|
|
|
|
|
|
|
|||||||
| (1) | Includes investment expenses charged by AB of approximately $68 million, $60 million, and $57 million for 2017, 2016 and 2015, respectively, for services provided to the Company. |
| (2) | Inter-segment investment management and other fees of approximately $96 million, $86 million, and $84 million for 2017, 2016 and 2015, respectively, are included in segment revenues of the Investment Management and Research segment. |
The table below presents total assets by segment as of December 31, 2017 and 2016:
| December 31, | ||||||||
| 2017 | 2016 | |||||||
| (in millions) | ||||||||
| Total assets by segment: |
||||||||
| Individual Retirement |
$ | 121,723 | $ | 104,839 | ||||
| Group Retirement |
38,578 | 32,805 | ||||||
| Investment Management and Research |
8,297 | 10,066 | ||||||
| Protection Solutions |
43,116 | 44,443 | ||||||
| Corporate and Other |
23,934 | 24,461 | ||||||
|
|
|
|
|
|||||
| Total assets |
$ | 235,648 | $ | 216,614 | ||||
|
|
|
|
|
|||||
F-118
Table of Contents
| 19) | EARNINGS PER SHARE |
Basic earnings per share (“EPS”) is calculated by dividing net income (loss) attributable to Holdings common shareholders by the weighted-average number of common shares outstanding during the period. Diluted EPS is calculated by dividing the net income (loss) attributable to Holdings common shareholders adjusted for the incremental dilution from AB by the weighted-average number of common shares used in the basic EPS calculation.
On April 24, 2018, Holdings filed a Certificate of Amendment to amend Holdings’ Certificate of Incorporation in the State of Delaware, authorizing the issuance of 2,000,000,000 shares of common stock, par value $0.01 per share, and effecting a 459.4752645-for-1 common stock split. All applicable share data, per share amounts and related information in the consolidated financial statements and notes thereto have been adjusted retroactively to give effect to the 459.4752645-for-1 common stock split.
The following table presents the weighted average shares used in calculating basic and diluted earnings per common share:
| Years Ended December 31, | ||||||||||||
| 2017 | 2016 | 2015 | ||||||||||
| (in millions) | ||||||||||||
| Weighted Average Shares |
||||||||||||
| Weighted average common stock outstanding for basic and diluted earnings per common share |
561.00 | 561.00 | 561.00 | |||||||||
|
|
|
|
|
|
|
|||||||
The following table presents the reconciliation of the numerator for the basic and diluted net income per share calculations:
| Years Ended December 31, | ||||||||||||
| 2017 | 2016 | 2015 | ||||||||||
| (in millions) | ||||||||||||
| Net income (loss) attributable to Holdings common shareholders: |
||||||||||||
| Net income (loss) attributable to Holdings common shareholders (basic): |
$ | 850 | $ | 1,272 | $ | 333 | ||||||
| Less: Incremental dilution from AB(1) |
$ | 1 | $ | — | $ | 1 | ||||||
| Net income (loss) attributable to Holdings common shareholders (diluted): |
$ | 849 | $ | 1,272 | $ | 332 | ||||||
| (1) | The incremental dilution from AB represents the impact of AB’s dilutive units on the Company’s diluted earnings per share and is calculated based on the Company’s proportionate ownership interest in AB. |
The following table presents both basic and diluted income (loss) per share for each period presented:
| Years Ended December 31, | ||||||||||||
| 2017 | 2016 | 2015 | ||||||||||
| in dollar per share | ||||||||||||
| Net income (loss) attributable to Holdings per common share: |
||||||||||||
| Basic |
$ | 1.52 | $ | 2.27 | $ | 0.59 | ||||||
| Diluted |
$ | 1.51 | $ | 2.27 | $ | 0.59 | ||||||
| 20) | SUBSEQUENT EVENTS |
The Company has evaluated subsequent events through April 6, 2018, the date the financial statements were available to be issued.
In January 2018, AXA pre-paid $50 million of a $700 million note that was issued to the Company in 2007 and $150 million of a $500 million term loan that was received from the Company in 2008.
In December 2013, Colisée Re issued a $145 million 4.75% Senior Unsecured Note to Holdings. The loan was scheduled to mature on December 19, 2028. This loan was repaid on March 26, 2018.
Effective February 1, 2018, AXA Equitable Life entered into a coinsurance reinsurance agreement to cede 90% of its single premium deferred annuities (SPDA) products issued between 1978-2001 and its
F-119
Table of Contents
Guaranteed Growth Annuity (GGA) single premium deferred annuity products issued between 2001-2014. As a result of this agreement, AXA Equitable transferred assets with a market value equal to the statutory reserves of approximately $635 million.
In March 2018, AXA Equitable Life sold its interest in two real estate joint ventures to AXA France for a total purchase price of approximately $143 million, which resulted in the elimination of $203 million of long-term debt on the Company’s balance sheet for the first quarter of 2018.
In February 2018, Holdings entered into the following credit facilities: (i) a $3.9 billion two-year senior unsecured delayed draw term loan agreement; (ii) a $500 million three-year senior unsecured delayed draw term loan agreement; and (iii) a $2.5 billion five-year senior unsecured revolving credit facility with a syndicate of banks. In addition to the credit facilities, Holdings entered into letter of credit facilities with an aggregate principal amount of approximately $1.9 billion, primarily to be used to support our life insurance business reinsured to EQ AZ Life Re following the GMxB Unwind.
Subsequent to entering into these credit facilities, Holdings entered into a waiver letter agreement with the lenders under each of our credit facilities and the letter of credit facilities, pursuant to which the lenders waived any default or event of default under such facilities resulting from the restatement of our annual financial statements for the year ended December 31, 2016, the restatement of our interim financial statements for the nine months ended September 30, 2017 and for the six months ended June 30, 2017, the failure to furnish audited financial statements for the year ended December 31, 2017 on a timely basis as required by such facilities and related matters.
In March 2018, Holdings sold its shares of AXA America Corporate Solutions, Inc. (“AXA CS”) to AXA. Holdings’ repayment obligation to AXA in respect of a $622 million loan made by AXA to Holdings in December 2017 was set off against AXA’s payment obligation to Holdings with respect to the sale of AXA CS shares and AXA paid Holdings the balance of the purchase price in cash.
In March 2018, AXA contributed the 0.5% minority interest in AXA Financial to Holdings so that Holdings now owns 100% of AXA Financial.
In March 2018, the Company entered into an agreement to purchase a group annuity contact with the intent of settling certain retiree qualified pension liabilities. Completion of the transaction is estimated to result in elimination of approximately 8% of the Company’s consolidated projected pension benefit obligation.
Events subsequent to the original issuance of the consolidated financial statements (unaudited):
In connection with the reissuance of the financial statements, the Company has evaluated subsequent events through April 26, 2018, the date the financial statements were available to be reissued.
On April 11, 2018, AXA Equitable Life restated its 2016 financial statements, which caused defaults under certain of AXA Equitable Life’s derivative agreements. AXA Equitable Life sought waivers for these defaults from the relevant counterparties as appropriate and obtained all such waivers on April 11, 2018. We do not consider this to have a material impact on our business, results of operations or financial condition.
On April 20, 2018, Holdings:
| • | issued $800 million aggregate principal amount of 3.900% Senior Notes due 2023, $1.5 billion aggregate principal amount of 4.350% Senior Notes due 2028 and $1.5 billion aggregate principal amount of 5.000% Senior Notes due 2048 (together, the “Notes”); |
| • | delivered a termination notice, to take effect April 23, 2018, for its $3.9 billion two-year senior unsecured delayed draw term loan agreement; and |
| • | settled certain loans issued to or received from AXA and its affiliates resulting in a net payment to AXA and its affiliates of $2,530 million in principal and $11 million of accrued interest. |
On April 20, 2018, AXA pre-paid $650 million of a $700 million note that was issued to the Company in 2007 and $50 million of a $500 million term loan that was received from the Company in 2008.
F-120
Table of Contents
On April 12, 2018, the GMxB Unwind was completed. As a result of the GMxB Unwind, we no longer benefit from the $1.5 billion revolving credit facility with AXA.
On April 23, 2018, Holdings used a portion of the net proceeds from the sale of the Notes, together with available cash, to (i) purchase 100% of the shares of AXA IM Holding US for approximately $873 million and (ii) purchase all of the AB Units held by Coliseum Re for approximately $217 million. The Company’s $185 million loan to AXA IM Holding US was settled as part of the purchase of AXA IM Holding US.
2018 Short-Term Incentive Compensation Program and Equity-Based Awards
STIC Program
On April 25, 2018, the Board of Directors approved a Short-Term Incentive Plan.
Certain executive officers will be eligible for an award under the 2018 program under the STIC Plan (the “2018 STIC Program”). The 2018 STIC Program will differ from prior programs by:
| • | determining funding based solely on the performance of AXA Financial R&P Operations against its targets, rather than a mix of its performance and AXA’s performance; and |
| • | incorporating performance objectives that reflect AXA Financial R&P Operations’ key performance indicators, rather than objectives based on AXA’s strategy and focus. |
The potential funding percentage for the 2018 STIC Program will range from 0% to 200% of target, consistent with peer payout ranges. The funding percentage will be allocated to business units based on the Company’s Chief Executive Officer’s assessment of business unit performance, provided that the funding for corporate staff will solely reflect company performance.
Expected performance objectives and weightings for the 2018 STIC Program are as follows:
| Performance Objective |
Weighting | |
| Non-GAAP Operating Earnings |
50% | |
| Premiums and Flows |
25% | |
| Strategic Goals |
25% |
For this purpose, the “strategic goals” category will focus on the milestones needed to ensure that the Company transitions successfully to a standalone entity such as General Account optimization, IT systems implementations, position relocations and key staffing.
Transaction Incentive Grants
On April 25, 2018, the Board of Directors approved a grant of one-time equity-based awards in connection with this offering.
All Transaction Incentive Awards will be paid in the form of restricted stock units linked to the value of Holdings’ stock to further align the interests of our executive officers with those of our stockholders. The amount of the restricted stock units granted to each executive officer will be determined by dividing the executive officers’ actual award value by the offering price.
F-121
Table of Contents
Fifty percent of each executive officer’s restricted stock units will vest based on continued service (the “Service Units”) and fifty percent will vest based on the performance of the Company’s share price (“Performance Units”) as follows:
| Type of Units |
Vesting Requirements | |
| Service Units |
• 50% of the Service Units will vest upon the expiration of the lock-up period related to this offering (expected to be six months);
• 25% of the Service Units will vest on the first anniversary of the offering date; and
• 25% of the Service Units will vest on the second anniversary of the offering date. | |
| Performance Units |
• Condition #1 - if, prior to the second anniversary of the offering date, the average closing price of the Company’s share for thirty consecutive days is at least equal to 130% of the offering price, all Performance Units will immediately vest;
• Condition #2 - if Condition #1 is not met but, prior to the fifth anniversary of the offering date, the average closing price of the Company’s share for thirty consecutive days is at least equal to 150% of the offering price, all Performance Units will immediately vest; and
• Condition #3 - if neither Condition #1 or Condition #2 is met, fifty percent of the Performance Units will vest on the fifth anniversary of the offering date. The remaining 50% of the Performance Units will be forfeited. | |
Unvested restricted stock units will be forfeited upon termination of employment, except as follows:
| Termination Type |
Retention | |
| Involuntary Termination (without cause) | A pro-rated portion of the Performance Units based on the participant’s full months of service completed during the five-year period from the date of grant will continue to vest subject to the performance criteria. All other units will be forfeited. | |
| Death | All restricted stock units will be immediately vested. | |
| Disability | All restricted stock units will continue to vest as if the individual continued employment. | |
| Other | All restricted stock units will be forfeited. | |
Other Equity-Based Awards
On April 25, 2018, the Board of Directors approved certain other equity-based awards for executive officers.
Certain of the Company’s executive officers will receive an equity-based award in 2018 linked to the Company’s stock as follows.
The award will consist of three components: (a) Company performance shares (50%), (b) Company stock options (25%) and (c) Company restricted stock units (25%).
To determine the amount of Company restricted stock units to be granted to each specified executive officer, the applicable percentage of his total award value will be divided by the fair market value of the Company’s stock on the grant date. To determine the amount of Company stock options to be granted to each specified executive officer, 25% of his or her total award value will be divided by the value of a Company stock
F-122
Table of Contents
option on the grant date which will be determined using a Black-Scholes pricing methodology based on assumptions which may differ from the assumptions used in determining the option’s grant date fair value based on FASB ASC Topic 718.
The Company stock options and restricted stock units will each vest ratably over three years while the Company performance shares grants will cliff vest after three years. Company performance shares will be granted unearned and will be earned over the vesting period based on the Company’s performance against performance objectives based on Relative Total Shareholder Return and Non-GAAP Operating ROE.
Both Company performance shares and restricted stock units will receive dividend equivalents with the same vesting schedule as the related shares or units.
F-123
Table of Contents
SCHEDULE I
SUMMARY OF INVESTMENTS—OTHER THAN INVESTMENTS IN RELATED PARTIES
AS OF DECEMBER 31, 2017
| Cost(1) | Fair Value | Carrying Value |
||||||||||
| (in millions) | ||||||||||||
| Fixed Maturities |
||||||||||||
| U.S. government, agencies and authorities |
$ | 17,759 | $ | 18,508 | $ | 18,508 | ||||||
| State, municipalities and political subdivisions |
422 | 489 | 489 | |||||||||
| Foreign governments |
383 | 405 | 405 | |||||||||
| Public utilities |
4,061 | 4,261 | 4,261 | |||||||||
| All other corporate bonds |
20,448 | 21,217 | 21,217 | |||||||||
| Residential mortgage-backed |
797 | 818 | 818 | |||||||||
| Asset-backed |
740 | 744 | 744 | |||||||||
| Redeemable preferred stocks |
458 | 499 | 499 | |||||||||
|
|
|
|
|
|
|
|||||||
| Total fixed maturities |
$ | 45,068 | $ | 46,941 | $ | 46,941 | ||||||
|
|
|
|
|
|
|
|||||||
| Mortgage loans on real estate |
10,960 | 10,912 | 10,952 | |||||||||
| Real estate held for the production of income |
390 | 390 | 390 | |||||||||
| Policy loans |
3,819 | 4,754 | 3,819 | |||||||||
| Other equity investments |
1,384 | 1,392 | 1,392 | |||||||||
| Trading securities |
14,129 | 14,170 | 14,170 | |||||||||
| Other invested assets |
4,118 | 4,118 | 4,118 | |||||||||
|
|
|
|
|
|
|
|||||||
| Total Investments |
$ | 79,868 | $ | 82,677 | $ | 81,782 | ||||||
|
|
|
|
|
|
|
|||||||
| (1) | Cost for fixed maturities represents original cost, reduced by repayments and writedowns and adjusted for amortization of premiums or accretion of discount; cost for equity securities represents original cost reduced by writedowns; cost for other limited partnership interests represents original cost adjusted for equity in earnings and reduced by distributions. |
F-124
Table of Contents
SCHEDULE II
BALANCE SHEETS (PARENT COMPANY)
DECEMBER 31, 2017 AND 2016
| As Restated |
||||||||
| 2017 | 2016 | |||||||
| (in millions) | ||||||||
| ASSETS |
||||||||
| Investment in consolidated subsidiaries |
$ | 13,836 | $ | 12,060 | ||||
| Total investments |
13,836 | 12,060 | ||||||
|
|
|
|
|
|||||
| Cash and cash equivalents |
$ | 44 | $ | 5 | ||||
| Loans to affiliates |
1,045 | 145 | ||||||
| Other assets |
1 | — | ||||||
| Income taxes receivable |
72 | 58 | ||||||
|
|
|
|
|
|||||
| Total Assets |
$ | 14,998 | $ | 12,268 | ||||
|
|
|
|
|
|||||
| LIABILITIES |
||||||||
| Loans from affiliates |
$ | 1,484 | $ | 809 | ||||
| Accrued liabilities |
29 | 4 | ||||||
|
|
|
|
|
|||||
| Total liabilities |
$ | 1,513 | $ | 813 | ||||
|
|
|
|
|
|||||
| EQUITY ATTRIBUTABLE TO HOLDINGS |
||||||||
| Common stock, $0.01 par value, 2,000,000,000 shares authorized and 561,000,000 issued and outstanding |
$ | 6 | $ | 6 | ||||
| Capital in excess of par value |
1,298 | 931 | ||||||
| Retained earnings |
12,289 | 11,439 | ||||||
| Accumulated other comprehensive income (loss) |
(108 | ) | (921 | ) | ||||
| Treasury Shares |
— | — | ||||||
| Total equity attributable to Holdings |
$ | 13,485 | $ | 11,455 | ||||
|
|
|
|
|
|||||
| Total liabilities and equity attributable for Holdings |
$ | 14,998 | $ | 12,268 | ||||
|
|
|
|
|
|||||
The financial information of AXA Equitable Holdings, Inc. should be read in conjunction with the
Consolidated Financial Statements and Notes thereto.
F-125
Table of Contents
AXA EQUITABLE HOLDINGS, INC.
SCHEDULE II
STATEMENTS OF INCOME (LOSS) AND COMPREHENSIVE INCOME (LOSS)
(PARENT COMPANY)
YEARS ENDED DECEMBER 31, 2017, 2016, AND 2015
| As Restated |
||||||||||||
| 2017 | 2016 | 2015 | ||||||||||
| (in millions) | ||||||||||||
| REVENUES |
||||||||||||
| Equity in income (losses) from continuing operations of consolidated subsidiaries |
$ | 879 | $ | 1,311 | $ | 361 | ||||||
| Total net investment income (loss) |
8 | 7 | 15 | |||||||||
| Other income |
— | — | 2 | |||||||||
|
|
|
|
|
|
|
|||||||
| Total revenues |
$ | 887 | $ | 1,318 | $ | 378 | ||||||
|
|
|
|
|
|
|
|||||||
| EXPENSES |
||||||||||||
| Interest expense |
$ | 31 | $ | 27 | $ | 23 | ||||||
| Other operating costs and expenses |
22 | 26 | 24 | |||||||||
|
|
|
|
|
|
|
|||||||
| Total expenses |
$ | 53 | $ | 53 | $ | 47 | ||||||
|
|
|
|
|
|
|
|||||||
| Income (loss) from continuing operations, before income taxes |
834 | 1,265 | 331 | |||||||||
| Income tax (expense) benefit |
16 | 7 | 2 | |||||||||
|
|
|
|
|
|
|
|||||||
| Net income (loss) attributable to Holdings |
$ | 850 | $ | 1,272 | $ | 333 | ||||||
|
|
|
|
|
|
|
|||||||
| Other comprehensive income (loss) |
$ | 832 | $ | (258 | ) | $ | (929 | ) | ||||
|
|
|
|
|
|
|
|||||||
| Total comprehensive income (loss) attributable to Holdings |
$ | 1,663 | $ | 1,028 | $ | (582 | ) | |||||
|
|
|
|
|
|
|
|||||||
The financial information of AXA Equitable Holdings, Inc. should be read in conjunction with the
Consolidated Financial Statements and Notes thereto.
F-126
Table of Contents
AXA EQUITABLE HOLDINGS, INC.
SCHEDULE II
STATEMENTS OF CASH FLOWS (PARENT COMPANY)
YEARS ENDED DECEMBER 31, 2017, 2016, AND 2015
| As Restated |
||||||||||||
| 2017 | 2016 | 2015 | ||||||||||
| (in millions) | ||||||||||||
| Net income (loss) attributable to Holdings |
$ | 850 | $ | 1,272 | $ | 333 | ||||||
| Adjustments to reconcile net income (loss) to net cash provided by (used in) operating activities: |
||||||||||||
| Equity in net (earnings) loss of subsidiaries |
(879 | ) | (1,311 | ) | (361 | ) | ||||||
| Change in income tax receivable |
(14 | ) | (6 | ) | (258 | ) | ||||||
| Other |
24 | 27 | 23 | |||||||||
|
|
|
|
|
|
|
|||||||
| Net cash provided by (used in) operating activities |
$ | (19 | ) | $ | (18 | ) | $ | (263 | ) | |||
|
|
|
|
|
|
|
|||||||
| Cash flows from investing activities: |
||||||||||||
| Repayments of loans to affiliates |
— | — | 242 | |||||||||
| Additional loans to affiliates |
(900 | ) | — | — | ||||||||
| Purchase of shares of consolidated subsidiaries |
(55 | ) | — | — | ||||||||
|
|
|
|
|
|
|
|||||||
| Net cash provided by (used in) investing activities |
$ | (955 | ) | $ | — | $ | 242 | |||||
|
|
|
|
|
|
|
|||||||
| Cash flows from financing activities: |
||||||||||||
| Change in short-term financings |
— | — | 1 | |||||||||
| Proceeds from loans from affiliates |
731 | — | 394 | |||||||||
| Repayments of loans from affiliates |
(56 | ) | — | (933 | ) | |||||||
| Dividend from Subsidiary |
20 | — | — | |||||||||
| Capital Contribution from Parent |
318 | — | — | |||||||||
|
|
|
|
|
|
|
|||||||
| Net cash provided by (used in) financing activities |
$ | 1,013 | $ | — | $ | (538 | ) | |||||
|
|
|
|
|
|
|
|||||||
| Change in cash and cash equivalents |
39 | (18 | ) | (559 | ) | |||||||
| Cash and cash equivalents, beginning of year |
5 | 23 | 582 | |||||||||
|
|
|
|
|
|
|
|||||||
| Cash and cash equivalents, end of year |
$ | 44 | $ | 5 | $ | 23 | ||||||
|
|
|
|
|
|
|
|||||||
The financial information of AXA Equitable Holdings, Inc. should be read in conjunction with the Consolidated Financial Statements and Notes thereto.
F-127
Table of Contents
| 1) | BASIS OF PRESENTATION |
The financial information of Holdings should be read in conjunction with the Consolidated Financial Statements and Notes thereto. AXA, the ultimate parent company of Holdings, is the holding company for the AXA Group, a worldwide leader in life, property and casualty and health insurance, and asset management.
| 2) | LOANS TO AFFILIATES |
Holdings maintains reciprocal loan agreements with affiliates to facilitate unanticipated short-term cash requirements that arise in the ordinary course of business. In December 2013, Colisée Re issued a $145 million 4.75% Senior Unsecured Note to Holdings. The loan is scheduled to mature on December 19, 2028.
In 2017, AXA Financial issued a $900 million 1.55% Senior Unsecured Note to Holdings. The loan was scheduled to mature on March 12, 2018.
| 3) | LOANS FROM AFFILIATES |
In 2015, AXA America Holdings, Inc. received a $366 million, 3-month LIBOR plus 1.44% loan from AXA. The loan has a maturity date of October 8, 2022.
In 2013, Holdings received $242 million and $145 million loans from Coliseum Reinsurance Company. The loans have maturity dates in December 2028. The balance at December 31, 2017 and 2016 was $387 million.
In 2017, Holdings repaid a $56 million 1.39% loan from AXA America Corporate Solutions, Inc. (“AXA CS”) originally made in 2015.
In 2017, Holdings received a $100 million loan and a $10 million loan from AXA CS. The loans had interest rates of 1.86% and 1.76%, respectively, and were repaid on their maturity date of February 5, 2018.
In December 2017, Holdings received a $622 million, 3-month LIBOR plus 0.439% margin term loan from AXA. The loan has a maturity date of June 8, 2018.
Interest cost related to these loans totaled $31 million, $27 million, and $23 million for the years ended December 31, 2017, 2016, and 2015, respectively.
| 4) | INCOME TAXES |
Holdings and certain of its consolidated subsidiaries and affiliates file a consolidated federal income tax return. Holdings has tax sharing agreements with certain of its subsidiaries and generally will either receive or pay these subsidiaries for utilization of the subsidiaries’ tax benefits or expense. Holdings settles these amounts annually.
| 5) | RESTATEMENT OF PRIOR PERIOD FINANCIAL STATEMENTS |
Management has identified errors in its previously issued financial statements, and has determined that the impact of the errors was material to these condensed Parent Company financial statements as of and for the year ended December 31, 2016, which therefore are restated herein. The impact of the errors to these financial statements for the year ended December 31, 2015 was not considered to be material either individually or in the aggregate. These errors primarily relate to errors in the calculation of policyholders’ benefit reserves and the calculation of DAC amortization for certain variable and interest sensitive life products. See Note 1 to the Company’s consolidated financial statements.
F-128
Table of Contents
SCHEDULE III
SUPPLEMENTARY INSURANCE INFORMATION
AS OF AND FOR THE YEAR ENDED DECEMBER 31, 2017
| Segment |
Deferred Policy Acquisition Costs |
Policyholders’ Account Balances |
Future Policy Benefits and Other Policyholders’ Funds |
Policy Charges And Premium Revenue |
Net Investment Income (Loss)(1) |
Policyholders’ Benefits and Interest Credited |
Amortization of Deferred Policy Acquisition Costs, Net(2) |
All Other Operating Expense(3) |
||||||||||||||||||||||||
| (in millions) | ||||||||||||||||||||||||||||||||
| Individual Retirement |
2,901 | 19,414 | 15,186 | 2,156 | 1,315 | 2,854 | (297 | ) | 1,291 | |||||||||||||||||||||||
| Group Retirement |
678 | 11,318 | 2 | 248 | 525 | 284 | (61 | ) | 526 | |||||||||||||||||||||||
| Investment Management and Research |
— | — | — | — | 118 | — | — | 2,517 | ||||||||||||||||||||||||
| Protection Solutions |
2,329 | 13,862 | 5,433 | 1,995 | 839 | 1,412 | 128 | 938 | ||||||||||||||||||||||||
| Corporate and Other |
61 | 2,577 | 9,678 | 458 | 513 | 912 | (9 | ) | 705 | |||||||||||||||||||||||
|
|
|
|
|
|
|
|
|
|
|
|
|
|
|
|
|
|||||||||||||||||
| Total |
$ | 5,969 | $ | 47,171 | $ | 30,299 | $ | 4,857 | $ | 3,310 | $ | 5,462 | $ | (239 | ) | $ | 5,977 | |||||||||||||||
|
|
|
|
|
|
|
|
|
|
|
|
|
|
|
|
|
|||||||||||||||||
| (1) | Net investment income (loss) is allocated to segments. Includes net derivative gains (losses). |
| (2) | Net of capitalization of Deferred Policy Acquisition Costs by segment of $400 for Individual Retirement, $87 for Group Retirement, $0 for Investment Management and Research, $200 for Protection Solutions, and $0 for Corporate and Other. |
| (3) | Operating expenses are allocated to segments. |
F-129
Table of Contents
AXA EQUITABLE HOLDINGS, INC.
SCHEDULE III
SUPPLEMENTARY INSURANCE INFORMATION
AS OF AND FOR THE YEAR ENDED DECEMBER 31, 2016, AS RESTATED
| Segment |
Deferred Policy Acquisition Costs |
Policyholders’ Account Balances |
Future Policy Benefits and Other Policyholders’ Funds |
Policy Charges And Premium Revenue |
Net Investment Income (Loss)(1) |
Policyholders’ Benefits and Interest Credited |
Amortization of Deferred Policy Acquisition Costs, Net(2) |
All Other Operating Expense(3) |
||||||||||||||||||||||||
| (in millions) | ||||||||||||||||||||||||||||||||
| Individual Retirement |
2,602 | 15,551 | 14,189 | 2,014 | (932 | ) | 1,324 | (281 | ) | 1,240 | ||||||||||||||||||||||
| Group Retirement |
614 | 10,996 | (2 | ) | 217 | 434 | 271 | (32 | ) | 378 | ||||||||||||||||||||||
| Investment Management and Research |
— | — | — | — | 133 | — | — | 2,306 | ||||||||||||||||||||||||
| Protection Solutions |
2,752 | 13,617 | 5,939 | 2,156 | 758 | 1,934 | 363 | 793 | ||||||||||||||||||||||||
| Corporate and Other |
76 | 1,792 | 10,152 | 458 | 550 | 905 | 39 | 628 | ||||||||||||||||||||||||
|
|
|
|
|
|
|
|
|
|
|
|
|
|
|
|
|
|||||||||||||||||
| Total |
$ | 6,044 | $ | 41,956 | $ | 30,278 | $ | 4,845 | $ | 943 | $ | 4,434 | $ | 89 | $ | 5,345 | ||||||||||||||||
|
|
|
|
|
|
|
|
|
|
|
|
|
|
|
|
|
|||||||||||||||||
| (1) | Net investment income (loss) is allocated to segments. Includes net derivative gains (losses). |
| (2) | Net of capitalization of Deferred Policy Acquisition Costs by segment of $421 for Individual Retirement, $82 for Group Retirement, $0 for Investment Management and Research, $193 for Protection Solutions, and $0 for Corporate and Other. |
| (3) | Operating expenses are allocated to segments. |
F-130
Table of Contents
AXA EQUITABLE HOLDINGS, INC.
SCHEDULE III
SUPPLEMENTARY INSURANCE INFORMATION
FOR THE YEAR ENDED DECEMBER 31, 2015
| Segment |
Policy Charges And Premium Revenue |
Net Investment Income (Loss)(1) |
Policyholders’ Benefits and Interest Credited |
Amortization of Deferred Policy Acquisition Costs, Net(2) |
All Other Operating Expense(3) |
|||||||||||||||
| (in millions) | ||||||||||||||||||||
| Individual Retirement |
1,968 | (867 | ) | 1,159 | (291 | ) | 1,246 | |||||||||||||
| Group Retirement |
220 | 424 | 261 | (28 | ) | 379 | ||||||||||||||
| Investment Management and Research |
— | 35 | — | — | 2,394 | |||||||||||||||
| Protection Solutions |
2,025 | 738 | 2,044 | (5 | ) | 819 | ||||||||||||||
| Corporate and Other |
510 | 727 | 987 | 39 | 634 | |||||||||||||||
|
|
|
|
|
|
|
|
|
|
|
|||||||||||
| Total |
$ | 4,723 | $ | 1,057 | $ | 4,451 | $ | (285 | ) | $ | 5,472 | |||||||||
|
|
|
|
|
|
|
|
|
|
|
|||||||||||
| (1) | Net investment income (loss) is allocated to segments. Includes net derivative gains (losses). |
| (2) | Net of capitalization of Deferred Policy Acquisition Costs by segment of $419 for Individual Retirement, $76 for Group Retirement, $0 for Investment Management and Research, $228 for Protection Solutions, and $0 for Corporate and Other. |
| (3) | Operating expenses are allocated to segments. |
F-131
Table of Contents
SCHEDULE IV
REINSURANCE(1)
AS OF AND FOR THE YEARS ENDED DECEMBER 31, 2017, 2016 AND 2015
| Gross Amount |
Ceded to Other Companies |
Assumed from Other Companies |
Net Amount |
Percentage of Amount Assumed to Net |
||||||||||||||||
| (in millions) | ||||||||||||||||||||
| 2017 |
||||||||||||||||||||
| Life insurance in-force |
$ | 483,010 | $ | 73,049 | $ | 31,886 | $ | 441,847 | 7.2 | % | ||||||||||
|
|
|
|
|
|
|
|
|
|
|
|||||||||||
| Premiums: |
||||||||||||||||||||
| Life insurance and annuities |
$ | 984 | $ | 103 | $ | 216 | $ | 1,097 | 19.7 | % | ||||||||||
| Accident and health |
54 | 36 | 9 | 27 | 33.3 | % | ||||||||||||||
|
|
|
|
|
|
|
|
|
|
|
|||||||||||
| Total Premiums |
$ | 1,038 | $ | 139 | $ | 225 | $ | 1,124 | 20.0 | % | ||||||||||
|
|
|
|
|
|
|
|
|
|
|
|||||||||||
| 2016 (As Restated) |
||||||||||||||||||||
| Life insurance in-force |
$ | 485,888 | $ | 77,306 | $ | 30,688 | $ | 439,270 | 7.0 | % | ||||||||||
|
|
|
|
|
|
|
|
|
|
|
|||||||||||
| Premiums: |
||||||||||||||||||||
| Life insurance and annuities |
$ | 937 | $ | 106 | $ | 222 | $ | 1,053 | 21.1 | % | ||||||||||
| Accident and health |
61 | 40 | 9 | 30 | 30.0 | % | ||||||||||||||
|
|
|
|
|
|
|
|
|
|
|
|||||||||||
| Total Premiums |
$ | 998 | $ | 146 | $ | 231 | $ | 1,083 | 21.3 | % | ||||||||||
|
|
|
|
|
|
|
|
|
|
|
|||||||||||
| 2015 |
||||||||||||||||||||
| Life insurance in-force |
$ | 492,061 | $ | 80,536 | $ | 30,677 | $ | 442,202 | 6.9 | % | ||||||||||
|
|
|
|
|
|
|
|
|
|
|
|||||||||||
| Premiums: |
||||||||||||||||||||
| Life insurance and annuities |
$ | 915 | $ | 101 | $ | 224 | $ | 1,038 | 21.6 | % | ||||||||||
| Accident and health |
67 | 45 | 10 | 32 | 31.3 | % | ||||||||||||||
|
|
|
|
|
|
|
|
|
|
|
|||||||||||
| Total Premiums |
$ | 982 | $ | 146 | $ | 234 | $ | 1,070 | 21.9 | % | ||||||||||
|
|
|
|
|
|
|
|
|
|
|
|||||||||||
| (1) | Includes amounts related to the discontinued group life and health business. |
F-132
Table of Contents
RESTATED OR REVISED UNAUDITED INTERIM FINANCIAL INFORMATION
AS OF AND FOR THE NINE MONTHS ENDED SEPTEMBER 30, 2017 AND 2016 AND
AS OF AND FOR THE SIX MONTHS ENDED JUNE 30, 2017 AND 2016
Management identified errors in its previously issued financial statements. These errors primarily relate to errors in the calculation of policyholders’ benefit reserves for the Company’s life products and the calculation of DAC amortization for certain variable and interest sensitive life products. Based upon quantitative and qualitative factors, management determined that the impact of the errors was material to the consolidated financial statements as of and for the nine months ended September 30, 2017 and as of and for the six months ended June 30, 2017. Management has restated the consolidated balance sheets as of September 30, 2017 and June 30, 2017 and the related consolidated statements of income (loss), statements of comprehensive income (loss), statements of equity and statements of cash flow for the six months ended June 30, 2017 and for the nine months ended September 30, 2017 to include restatements related to the errors discussed above. The impact of these errors to the consolidated financial statements for the nine months ended September 30, 2016 and for the six months ended June 30, 2016, was not considered to be material, either individually or in the aggregate. Therefore, management has voluntarily revised the consolidated statements of income (loss), statements of comprehensive income (loss), statements of equity and statements of cash flow for the nine months ended September 30, 2016, and for the six months ended June 30, 2016. The effects of the adjustments on the Company’s financial statements are as follows:
| As Previously Reported | Impact of Adjustments | As Restated | ||||||||||||||||||||||
| September 30, 2017 |
June 30, 2017 |
September 30, 2017 |
June 30, 2017 |
September 30, 2017 |
June 30, 2017 |
|||||||||||||||||||
| (in millions) | ||||||||||||||||||||||||
| Assets: |
||||||||||||||||||||||||
| Deferred policy acquisition costs |
$ | 5,933 | $ | 5,906 | $ | 181 | $ | 195 | $ | 6,114 | $ | 6,101 | ||||||||||||
| Loans to affiliates |
1,245 | 1,257 | (11 | ) | (22 | ) | 1,234 | 1,235 | ||||||||||||||||
| GMIB reinsurance contract asset, at fair value |
2,011 | 2,091 | — | 2 | 2,011 | 2,093 | ||||||||||||||||||
| Current and deferred income taxes |
339 | 362 | (73 | ) | (64 | ) | 266 | 298 | ||||||||||||||||
| Other assets |
2,610 | 2,606 | 18 | 14 | 2,628 | 2,620 | ||||||||||||||||||
|
|
|
|
|
|
|
|
|
|
|
|
|
|||||||||||||
| Total Assets |
$ | 230,825 | $ | 226,564 | $ | 115 | $ | 125 | $ | 230,940 | $ | 226,689 | ||||||||||||
|
|
|
|
|
|
|
|
|
|
|
|
|
|||||||||||||
| Liabilities: |
||||||||||||||||||||||||
| Future policy benefits and other policyholders’ liabilities |
31,179 | 31,113 | (99 | ) | (84 | ) | 31,080 | 31,029 | ||||||||||||||||
|
|
|
|
|
|
|
|
|
|
|
|
|
|||||||||||||
| Total Liabilities |
$ | 215,164 | $ | 210,974 | $ | (99 | ) | $ | (84 | ) | $ | 215,065 | $ | 210,890 | ||||||||||
|
|
|
|
|
|
|
|
|
|
|
|
|
|||||||||||||
| Equity: |
||||||||||||||||||||||||
| Capital in excess of par value(1) |
1,007 | 964 | (9 | ) | (9 | ) | 998 | 955 | ||||||||||||||||
| Retained earnings |
11,548 | 11,558 | 203 | 199 | 11,751 | 11,757 | ||||||||||||||||||
| Accumulated other comprehensive income (loss) |
(350 | ) | (350 | ) | 20 | 17 | (330 | ) | (333 | ) | ||||||||||||||
|
|
|
|
|
|
|
|
|
|
|
|
|
|||||||||||||
| Total equity attributable to Holdings |
12,211 | 12,178 | 214 | 207 | 12,425 | 12,385 | ||||||||||||||||||
| Noncontrolling interest |
3,010 | 3,051 | — | 2 | 3,010 | 3,053 | ||||||||||||||||||
| Total Equity |
$ | 15,221 | $ | 15,229 | $ | 214 | $ | 209 | $ | 15,435 | $ | 15,438 | ||||||||||||
|
|
|
|
|
|
|
|
|
|
|
|
|
|||||||||||||
| (1) | Previously reported amounts have been adjusted to give retrospective effect to the 459.4752645-for-1 stock split effected on April 24, 2018. |
F-133
Table of Contents
| As Previously Reported |
Impact of Adjustments |
As Restated |
As Revised |
|||||||||||||||||||||
| Nine Months Ended September 30, | ||||||||||||||||||||||||
| 2017 | 2016 | 2017 | 2016 | 2017 | 2016 | |||||||||||||||||||
| (in millions) | ||||||||||||||||||||||||
| Statements of Income (Loss): |
||||||||||||||||||||||||
| Revenues: |
||||||||||||||||||||||||
| Policy charges and fee income |
$ | 2,853 | $ | 2,760 | $ | 8 | $ | 2 | $ | 2,861 | $ | 2,762 | ||||||||||||
| Premiums |
805 | 789 | 20 | 14 | 825 | 803 | ||||||||||||||||||
| Net derivative gains (losses) |
166 | (685 | ) | 6 | 9 | 172 | (676 | ) | ||||||||||||||||
| Total revenues |
9,495 | 10,403 | 34 | 25 | 9,529 | 10,428 | ||||||||||||||||||
|
|
|
|
|
|
|
|
|
|
|
|
|
|||||||||||||
| Benefits and other deductions: |
||||||||||||||||||||||||
| Policyholders’ benefits |
3,909 | 3,232 | 15 | 18 | 3,924 | 3,250 | ||||||||||||||||||
| Interest credited to policyholders’ account balances |
794 | 732 | (7 | ) | (5 | ) | 787 | 727 | ||||||||||||||||
| Amortization of deferred policy acquisition costs, net |
(31 | ) | (42 | ) | (125 | ) | 8 | (156 | ) | (34 | ) | |||||||||||||
| Total benefits and other deductions |
9,187 | 7,877 | (117 | ) | 21 | 9,070 | 7,898 | |||||||||||||||||
|
|
|
|
|
|
|
|
|
|
|
|
|
|||||||||||||
| Income (loss) from operations, before income taxes |
308 | 2,526 | 151 | 4 | 459 | 2,530 | ||||||||||||||||||
| Income tax (expense) benefit |
163 | (640 | ) | (31 | ) | (7 | ) | 132 | (647 | ) | ||||||||||||||
| Net income (loss) |
471 | 1,886 | 120 | (3 | ) | 591 | 1,883 | |||||||||||||||||
| Less: net (income) loss attributable to the noncontrolling interest |
(279 | ) | (248 | ) | — | (21 | ) | (279 | ) | (269 | ) | |||||||||||||
|
|
|
|
|
|
|
|
|
|
|
|
|
|||||||||||||
| Net income (loss) attributable to Holdings |
$ | 192 | $ | 1,638 | $ | 120 | $ | (24 | ) | $ | 312 | $ | 1,614 | |||||||||||
|
|
|
|
|
|
|
|
|
|
|
|
|
|||||||||||||
| As Previously Reported |
Impact of Adjustments |
As Restated |
As Revised |
|||||||||||||||||||||
| Six Months Ended June 30, | ||||||||||||||||||||||||
| 2017 | 2016 | 2017 | 2016 | 2017 | 2016 | |||||||||||||||||||
| (in millions) | ||||||||||||||||||||||||
| Revenues: |
||||||||||||||||||||||||
| Policy charges and fee income |
$ | 1,888 | $ | 1,799 | $ | 3 | $ | 1 | $ | 1,891 | $ | 1,800 | ||||||||||||
| Premiums |
542 | 542 | 16 | 8 | 558 | 550 | ||||||||||||||||||
| Net derivative gains (losses) |
524 | (25 | ) | 4 | 8 | 528 | (17 | ) | ||||||||||||||||
| Total revenues |
$ | 6,723 | $ | 8,154 | $ | 23 | $ | 17 | $ | 6,746 | $ | 8,171 | ||||||||||||
|
|
|
|
|
|
|
|
|
|
|
|
|
|||||||||||||
| Benefits and other deductions: |
||||||||||||||||||||||||
| Policyholders’ benefits |
2,821 | 2,528 | 13 | 12 | 2,834 | 2,540 | ||||||||||||||||||
| Interest credited to policyholders’ account balances |
526 | 448 | (4 | ) | (7 | ) | 522 | 441 | ||||||||||||||||
| Amortization of deferred policy acquisition costs, net |
(43 | ) | (53 | ) | (125 | ) | 20 | (168 | ) | (33 | ) | |||||||||||||
| Total benefits and other deductions |
$ | 6,415 | $ | 5,607 | $ | (116 | ) | $ | 25 | $ | 6,299 | $ | 5,632 | |||||||||||
|
|
|
|
|
|
|
|
|
|
|
|
|
|||||||||||||
| Income (loss) from operations, before income taxes |
308 | 2,547 | 139 | (8 | ) | 447 | 2,539 | |||||||||||||||||
| Income tax (expense) benefit |
77 | (730 | ) | (23 | ) | (2 | ) | 54 | (732 | ) | ||||||||||||||
| Net income (loss) |
385 | 1,817 | 116 | (10 | ) | 501 | 1,807 | |||||||||||||||||
| Less: net (income) loss attributable to the noncontrolling interest |
(183 | ) | (171 | ) | — | 1 | (183 | ) | (170 | ) | ||||||||||||||
|
|
|
|
|
|
|
|
|
|
|
|
|
|||||||||||||
| Net income (loss) attributable to Holdings |
$ | 202 | $ | 1,646 | $ | 116 | $ | (9 | ) | $ | 318 | $ | 1,637 | |||||||||||
|
|
|
|
|
|
|
|
|
|
|
|
|
|||||||||||||
| As Previously Reported |
Impact of Adjustments |
As Restated |
As Revised |
|||||||||||||||||||||
| Nine Months Ended September 30, | ||||||||||||||||||||||||
| 2017 | 2016 | 2017 | 2016 | 2017 | 2016 | |||||||||||||||||||
| (in millions) | ||||||||||||||||||||||||
| Statements of Comprehensive Income (Loss): |
||||||||||||||||||||||||
| Net income (loss) |
$ | 471 | $ | 1,886 | $ | 120 | $ | (3 | ) | $ | 591 | $ | 1,883 | |||||||||||
| Change in unrealized gains (losses), net of reclassification |
519 | 1,603 | 20 | 22 | 539 | 1,625 | ||||||||||||||||||
| Total other comprehensive income (loss), net of income taxes |
611 | 1,675 | 20 | 22 | 631 | 1,697 | ||||||||||||||||||
| Comprehensive income (loss) |
1,082 | 3,561 | 140 | 19 | 1,222 | 3,580 | ||||||||||||||||||
|
|
|
|
|
|
|
|
|
|
|
|
|
|||||||||||||
| Less: comprehensive (income) loss attributable to the noncontrolling interest |
(297 | ) | (257 | ) | — | (21 | ) | (297 | ) | (278 | ) | |||||||||||||
| Comprehensive income (loss) attributable to Holdings |
$ | 785 | $ | 3,304 | $ | 140 | $ | (2 | ) | $ | 925 | $ | 3,302 | |||||||||||
|
|
|
|
|
|
|
|
|
|
|
|
|
|||||||||||||
F-134
Table of Contents
| As Previously Reported |
Impact of Adjustments |
As Restated |
As Revised |
|||||||||||||||||||||
| Six Months Ended June 30, | ||||||||||||||||||||||||
| 2017 | 2016 | 2017 | 2016 | 2017 | 2016 | |||||||||||||||||||
| (in millions) | ||||||||||||||||||||||||
| Statements of Comprehensive Income (Loss): |
||||||||||||||||||||||||
| Net income (loss) |
$ | 385 | $ | 1,817 | $ | 116 | $ | (10 | ) | $ | 501 | $ | 1,807 | |||||||||||
| Change in unrealized gains (losses), net of reclassification adjustment |
540 | 1,677 | 17 | (8 | ) | 557 | 1,669 | |||||||||||||||||
| Total other comprehensive income (loss), net of income taxes |
608 | 1,726 | 17 | (8 | ) | 625 | 1,718 | |||||||||||||||||
| Comprehensive income (loss) |
993 | 3,543 | 133 | (18 | ) | 1,126 | 3,525 | |||||||||||||||||
| Less: comprehensive (income) loss attributable to the noncontrolling interest |
(198 | ) | (179 | ) | — | 1 | (198 | ) | (178 | ) | ||||||||||||||
| Comprehensive income (loss) attributable to Holdings |
$ | 795 | $ | 3,364 | $ | 133 | $ | (17 | ) | $ | 928 | $ | 3,347 | |||||||||||
| As Previously Reported |
Impact of Adjustments |
As Restated |
As Revised |
|||||||||||||||||||||
| Nine Months Ended September 30, | ||||||||||||||||||||||||
| 2017 | 2016 | 2017 | 2016 | 2017 | 2016 | |||||||||||||||||||
| (in millions) | ||||||||||||||||||||||||
| Statements of Equity: |
||||||||||||||||||||||||
| Capital in excess of par value, beginning of year(1) |
$ | 942 | $ | 952 | $ | (11 | ) | $ | (11 | ) | $ | 931 | $ | 941 | ||||||||||
| Changes in capital in excess of par value |
65 | (48 | ) | 2 | (2 | ) | 67 | (50 | ) | |||||||||||||||
| Capital in excess of par value, end of period(1) |
1,007 | 904 | (9 | ) | (13 | ) | 998 | 891 | ||||||||||||||||
| Retained earnings, beginning of year |
11,356 | 10,159 | 83 | 8 | 11,439 | 10,167 | ||||||||||||||||||
| Net income (loss) attributable to Holdings |
192 | 1,638 | 120 | (24 | ) | 312 | 1,614 | |||||||||||||||||
| Retained earnings, end of period |
11,548 | 11,797 | 203 | (16 | ) | 11,751 | 11,781 | |||||||||||||||||
| Accumulated other comprehensive income (loss), beginning of year |
(943 | ) | (677 | ) | 22 | — | (921 | ) | (677 | ) | ||||||||||||||
| Other comprehensive income (loss) |
593 | 1,666 | (2 | ) | 22 | 591 | 1,688 | |||||||||||||||||
| Accumulated other comprehensive income (loss), end of year |
(350 | ) | 989 | 20 | 22 | (330 | ) | 1,011 | ||||||||||||||||
| Total Holdings’ equity, end of period |
12,211 | 13,696 | 214 | (7 | ) | 12,425 | 13,689 | |||||||||||||||||
| Noncontrolling interest, end of period |
3,010 | 3,089 | — | 2 | 3,010 | 3,091 | ||||||||||||||||||
| Total equity, end of period |
$ | 15,221 | $ | 16,785 | $ | 214 | $ | (5 | ) | $ | 15,435 | $ | 16,780 | |||||||||||
| As Previously Reported |
Impact of Adjustments |
As Restated |
As Revised |
|||||||||||||||||||||
| Six Months Ended June 30, | ||||||||||||||||||||||||
| 2017 | 2016 | 2017 | 2016 | 2017 | 2016 | |||||||||||||||||||
| (in millions) | ||||||||||||||||||||||||
| Statements of Equity: |
||||||||||||||||||||||||
| Capital in excess of par value, beginning of year(1) |
$ | 942 | $ | 952 | $ | (11 | ) | $ | (11 | ) | $ | 931 | $ | 941 | ||||||||||
| Changes in capital in excess of par value |
22 | (51 | ) | 2 | 1 | 24 | (50 | ) | ||||||||||||||||
| Capital in excess of par value, end of period(1) |
964 | 901 | (9 | ) | (10 | ) | 955 | 891 | ||||||||||||||||
| Retained earnings, beginning of year |
11,356 | 10,159 | 83 | 8 | 11,439 | 10,167 | ||||||||||||||||||
| Net income (loss) attributable to Holdings |
202 | 1,646 | 116 | (9 | ) | 318 | 1,637 | |||||||||||||||||
| Retained earnings, end of period |
11,558 | 11,805 | 199 | (1 | ) | 11,757 | 11,804 | |||||||||||||||||
| Accumulated other comprehensive income (loss), beginning of year |
(943 | ) | (677 | ) | 22 | — | (921 | ) | (677 | ) | ||||||||||||||
| Other comprehensive income (loss) |
593 | 1,718 | (5 | ) | (8 | ) | 588 | 1,710 | ||||||||||||||||
| Accumulated other comprehensive income (loss), end of year |
(350 | ) | 1,041 | 17 | (8 | ) | (333 | ) | 1,033 | |||||||||||||||
| Total Holdings’ equity, end of period |
12,178 | 13,753 | 207 | (19 | ) | 12,385 | 13,734 | |||||||||||||||||
| Noncontrolling interest, end of period |
3,051 | 3,101 | 2 | (22 | ) | 3,053 | 3,079 | |||||||||||||||||
| Total equity, end of period |
$ | 15,229 | $ | 16,854 | $ | 209 | $ | (41 | ) | $ | 15,438 | $ | 16,813 | |||||||||||
| (1) | Previously reported amounts have been adjusted to give retrospective effect to the 459.4752645-for-1 stock split effected on April 24, 2018. |
F-135
Table of Contents
| As Previously Reported |
Impact of Adjustments |
As Restated |
As Revised |
|||||||||||||||||||||
| Nine Months Ended September 30, | ||||||||||||||||||||||||
| 2017 | 2016 | 2017 | 2016 | 2017 | 2016 | |||||||||||||||||||
| (in millions) | ||||||||||||||||||||||||
| Statements of Cash flows: |
||||||||||||||||||||||||
| Cash flow from operating activities: |
||||||||||||||||||||||||
| Net income (loss) |
$ | 471 | $ | 1,886 | $ | 120 | $ | (3 | ) | $ | 591 | $ | 1,883 | |||||||||||
| Policy charges and fee income |
(2,853 | ) | (2,760 | ) | (8 | ) | (2 | ) | (2,861 | ) | (2,762 | ) | ||||||||||||
| Interest credited to policyholders’ account balances |
794 | 732 | (7 | ) | (5 | ) | 787 | 727 | ||||||||||||||||
| Net derivative (gains) loss |
(166 | ) | 685 | (6 | ) | (9 | ) | (172 | ) | 676 | ||||||||||||||
| Changes in: |
||||||||||||||||||||||||
| Deferred Policy Acquisition costs |
(31 | ) | (42 | ) | (125 | ) | 8 | (156 | ) | (34 | ) | |||||||||||||
| Future policy benefits |
1,616 | 1,329 | (5 | ) | 6 | 1,611 | 1,335 | |||||||||||||||||
| Current and deferred income taxes |
435 | (385 | ) | 31 | 5 | 466 | (380 | ) | ||||||||||||||||
| As Previously Reported |
Impact of Adjustments |
As Restated |
As Revised |
|||||||||||||||||||||
| Six Months Ended June 30, | ||||||||||||||||||||||||
| 2017 | 2016 | 2017 | 2016 | 2017 | 2016 | |||||||||||||||||||
| (in millions) | ||||||||||||||||||||||||
| Statements of Cash flows: |
||||||||||||||||||||||||
| Cash flow from operating activities: |
||||||||||||||||||||||||
| Net income (loss) |
$ | 385 | $ | 1,817 | $ | 116 | $ | (10 | ) | $ | 501 | $ | 1,807 | |||||||||||
| Policy charges and fee income |
(1,888 | ) | (1,799 | ) | (3 | ) | (1 | ) | (1,891 | ) | (1,800 | ) | ||||||||||||
| Interest credited to policyholders’ account balances |
526 | 448 | (4 | ) | (7 | ) | 522 | 441 | ||||||||||||||||
| Net derivative (gains) loss |
(524 | ) | 25 | (4 | ) | (8 | ) | (528 | ) | 17 | ||||||||||||||
| Changes in: |
||||||||||||||||||||||||
| Deferred Policy Acquisition costs |
(43 | ) | (53 | ) | (125 | ) | 20 | (168 | ) | (33 | ) | |||||||||||||
| Future policy benefits |
1,519 | 994 | (3 | ) | 3 | 1,516 | 997 | |||||||||||||||||
| Current and deferred income taxes |
100 | 395 | 23 | 3 | 123 | 398 | ||||||||||||||||||
F-136
Table of Contents
137,250,000 Shares
AXA Equitable Holdings, Inc.
Common Stock
| Morgan Stanley | J.P. Morgan | Barclays | Citigroup |
| BofA Merrill Lynch | Credit Suisse | Deutsche Bank Securities | Goldman Sachs & Co. LLC |
| BNP PARIBAS | SOCIETE GENERALE | ING | Credit Agricole CIB | HSBC | Natixis | RBC Capital Markets |
| Lazard | BBVA | COMMERZBANK | Mizuho Securities | MUFG | PNC Capital Markets LLC |
| SMBC Nikko | SunTrust Robinson Humphrey | UniCredit Capital Markets |
, 2018
Through and including , 2018 (25 days after the date of this prospectus), all dealers that buy, sell or trade our common stock, whether or not participating in this offering, may be required to deliver a prospectus. This delivery requirement is in addition to the obligation of dealers to deliver a prospectus when acting as underwriters and with respect to their unsold allotments or subscriptions.
Table of Contents
PART II
INFORMATION NOT REQUIRED IN PROSPECTUS
| Item 13. | Other Expenses of Issuance and Distribution. |
The following table sets forth the estimated expenses payable by us in connection with the sale and distribution of the securities registered hereby, other than underwriting discounts or commissions. All amounts are estimates except for the SEC registration fee and the FINRA filing fee.
| SEC Registration Fee |
$ | 530,571 | ||
| FINRA Filing Fee |
225,500 | |||
| Listing Fee |
259,000 | |||
| Printing Fees and Expenses |
2,000,000 | |||
| Accounting Fees and Expenses |
50,000,000 | |||
| Actuarial Fees and Expenses |
20,000,000 | |||
| Legal Fees and Expenses |
15,000,000 | |||
| Transfer Agent Fees and Expenses |
10,000 | |||
| Miscellaneous |
74,929 | |||
|
|
|
|||
| Total: |
$ | 88,100,000 | ||
|
|
|
| * | To be filed by amendment. |
| Item 14. | Indemnification of Directors and Officers. |
AXA Equitable Holdings, Inc. is incorporated under the laws of the State of Delaware.
Section 145(a) of the DGCL provides that a corporation may indemnify any person who was or is a party or is threatened to be made a party to any threatened, pending or completed action, suit or proceeding, whether civil, criminal, administrative or investigative (other than an action by or in the right of the corporation) by reason of the fact that the person is or was a director, officer, employee or agent of the corporation, or is or was serving at the request of the corporation as a director, officer, employee or agent of another corporation, partnership, joint venture, trust or other enterprise, against expenses (including attorneys’ fees), judgments, fines and amounts paid in settlement actually and reasonably incurred by the person in connection with such action, suit or proceeding if the person acted in good faith and in a manner the person reasonably believed to be in or not opposed to the best interests of the corporation, and, with respect to any criminal action or proceeding, had no reasonable cause to believe the person’s conduct was unlawful.
Section 145(b) of the DGCL provides that a corporation may indemnify any person who was or is a party or is threatened to be made a party to any threatened, pending or completed action or suit by or in the right of the corporation to procure a judgment in its favor by reason of the fact that the person is or was a director, officer, employee or agent of the corporation, or is or was serving at the request of the corporation as a director, officer, employee or agent of another corporation, partnership, joint venture, trust or other enterprise, against expenses (including attorneys’ fees) actually and reasonably incurred by the person in connection with the defense or settlement of such action or suit if the person acted in good faith and in a manner the person reasonably believed to be in or not opposed to the best interests of the corporation and except that no indemnification shall be made in respect of any claim, issue or matter as to which such person shall have been adjudged to be liable to the corporation unless and only to the extent that the Delaware Court of Chancery or the court in which such action or suit was brought shall determine upon application that, despite the adjudication of liability but in view of all of the circumstances of the case, such person is fairly and reasonably entitled to indemnity for such expenses which the Delaware Court of Chancery or such other court shall deem proper.
Section 145(c) of the DGCL provides that to the extent that a present or former director or officer of a corporation has been successful on the merits or otherwise in defense of any action, suit or proceeding referred to
II-1
Table of Contents
in subsections (a) and (b) of Section 145 of the DGCL, or in defense of any claim, issue or matter therein, such person shall be indemnified against expenses (including attorneys’ fees) actually and reasonably incurred by such person in connection therewith.
Section 145(e) of the DGCL provides that expenses (including attorneys’ fees) incurred by an officer or director of the corporation in defending any civil, criminal, administrative or investigative action, suit or proceeding may be paid by the corporation in advance of the final disposition of such action, suit or proceeding upon receipt of an undertaking by or on behalf of such director or officer to repay such amount if it shall ultimately be determined that such person is not entitled to be indemnified by the corporation as authorized in Section 145 of the DGCL. Such expenses, including attorneys’ fees, incurred by former directors and officers or other employees and agents of the corporation or by persons serving at the request of the corporation as directors, officers, employees or agents of another corporation, partnership, joint venture, trust or other enterprise may be so paid upon such terms and conditions, if any, as the corporation deems appropriate.
Section 145(g) of the DGCL specifically allows a Delaware corporation to purchase liability insurance on behalf of its directors and officers and to insure against potential liability of such directors and officers regardless of whether the corporation would have the power to indemnify such directors and officers under Section 145 of the DGCL.
Section 102(b)(7) of the DGCL permits a Delaware corporation to include a provision in its certificate of incorporation eliminating or limiting the personal liability of directors to the corporation or its stockholders for monetary damages for breach of fiduciary duty as a director. This provision, however, may not eliminate or limit a director’s liability (1) for breach of the director’s duty of loyalty to the corporation or its stockholders, (2) for acts or omissions not in good faith or involving intentional misconduct or a knowing violation of law, (3) under Section 174 of the DGCL, which provides for liability of directors for unlawful payments of dividends or unlawful stock purchases, redemptions or other distributions, or (4) for any transaction from which the director derived an improper personal benefit.
Section 174 of the DGCL provides, among other things, that a director who willfully and negligently approves of an unlawful payment of dividends or an unlawful stock purchase or redemption may be held liable for such actions. A director who was either absent when the unlawful actions were approved or dissented at the time may avoid liability by causing his or her dissent to such actions to be entered in the books containing the minutes of the meetings of the board of directors at the time the action occurred or immediately after the absent director receives notice of the unlawful acts.
Our amended and restated certificate of incorporation will contain provisions permitted under the DGCL relating to the liability of directors. These provisions will eliminate a director’s personal liability for monetary damages resulting from a breach of fiduciary duty, except in circumstances involving:
| • | any breach of the director’s duty of loyalty; |
| • | acts or omissions not in good faith or which involve intentional misconduct or a knowing violation of the law; |
| • | unlawful payments of dividends or unlawful stock purchases, redemptions or other distributions; or |
| • | any transaction from which the director derives an improper personal benefit. |
Our amended and restated certificate of incorporation and our amended and restated by-laws will require us to indemnify and advance expenses to our directors and officers to the fullest extent not prohibited by the DGCL and other applicable law, except in the case of a proceeding instituted by the director without the approval of our Board. Our amended and restated certificate of incorporation and our amended and restated by-laws will provide that we are required to indemnify our directors and officers, to the fullest extent permitted by law, for all judgments, fines, settlements, legal fees and other expenses incurred in connection with pending or threatened
II-2
Table of Contents
legal proceedings because of such director’s or officer’s positions with us or another entity that the director or officer serves at our request, subject to various conditions, and to advance funds to our directors and officers to enable them to defend against such proceedings. To receive indemnification, the director or officer must have been successful in the legal proceeding or have acted in good faith and in what was reasonably believed to be a lawful manner in our best interest and, with respect to any criminal proceeding, had no reasonable cause to believe his or her conduct was unlawful.
Indemnification Agreements
Prior to the settlement of this offering, we will enter into indemnification agreements with our directors. The indemnification agreements will provide the directors with contractual rights to the indemnification and expense advancement rights provided under our amended and restated by-laws, as well as contractual rights to additional indemnification as provided in the indemnification agreements.
The indemnification agreements will provide for the advancement or payment of all expenses to the indemnitee and for reimbursement to us if it is found that such indemnitee is not entitled to such indemnification under applicable law and our amended and restated certificate of incorporation and amended and restated by-laws.
Directors’ and Officers’ Liability Insurance
Prior to the settlement of this offering, we will have obtained directors’ and officers’ liability insurance that insures against certain liabilities that our directors and officers and the directors and officers of our subsidiaries may, in such capacities, incur.
| Item 15. | Recent Sales of Unregistered Securities. |
On April 20, 2018, Holdings sold $800,000,000 aggregate principal amount of its 3.900% Senior Notes due 2023 (the “2023 Notes”). The 2023 Notes were sold to qualified institutional buyers in the United States in reliance on Rule 144A and to non-U.S. persons outside the United States in reliance on Regulation S. The 2023 Notes were offered to investors at 99.852% of the principal amount thereof. Citigroup Global Markets Inc., J.P. Morgan Securities LLC and Wells Fargo Securities, LLC acted as joint book-running managers for the initial purchasers. The aggregate initial purchasers’ discount was $4,800,000.
On April 20, 2018, Holdings sold $1,500,000,000 aggregate principal amount of its 4.350% Senior Notes due 2028 (the “2028 Notes”). The 2028 Notes were sold to qualified institutional buyers in the United States in reliance on Rule 144A and to non-U.S. persons outside the United States in reliance on Regulation S. The 2023 Notes were offered to investors at 99.815% of the principal amount thereof. Citigroup Global Markets Inc., J.P. Morgan Securities LLC and Wells Fargo Securities, LLC acted as joint book-running managers for the initial purchasers. The aggregate initial purchasers’ discount was $9,750,000.
On April 20, 2018, Holdings sold $1,500,000,000 aggregate principal amount of its 5.000% Senior Notes due 2048 (the “2048 Notes”). The 2048 Notes were sold to qualified institutional buyers in the United States in reliance on Rule 144A and to non-U.S. persons outside the United States in reliance on Regulation S. The 2023 Notes were offered to investors at 99.707% of the principal amount thereof. Citigroup Global Markets Inc., J.P. Morgan Securities LLC and Wells Fargo Securities, LLC acted as joint book-running managers for the initial purchasers. The aggregate initial purchasers’ discount was $13,125,000.
| Item 16. | Exhibits and Financial Statement Schedules. |
(a) Exhibits.
The Exhibits to this Registration Statement on Form S-1 are listed in the Exhibit Index which precedes the signature pages to this Registration Statement and is herein incorporated by reference.
II-3
Table of Contents
(b) Financial Statement Schedules:
Schedule I—Summary of Investments—Other than Investments in Related Parties, as of December 31, 2017 beginning on page F-124.
Schedule II—Parent Company, as of December 31, 2017 and 2016 and for the Years Ended December 31, 2017, 2016 and 2015 beginning on page F-125.
Schedule III—Supplementary Insurance Information, as of December 31, 2017 and for the Years Ended December 31, 2017, 2016 and 2015 beginning on page F-129.
Schedule IV—Reinsurance, as of December 31, 2017 and for the Years Ended December 31, 2017, 2016 and 2015 beginning on page F-132.
| Item 17. | Undertakings. |
| (a) | The undersigned registrant hereby undertakes to provide to the underwriters at the closing specified in the underwriting agreements certificates in such denominations and registered in such names as required by the underwriters to permit prompt delivery to each purchaser. |
| (b) | Insofar as indemnification for liabilities arising under the Securities Act of 1933 may be permitted to directors, officers and controlling persons of the registrant pursuant to the foregoing provisions, or otherwise, the registrant has been advised that in the opinion of the U.S. Securities and Exchange Commission such indemnification is against public policy as expressed in the Act and is, therefore, unenforceable. In the event that a claim for indemnification against such liabilities (other than the payment by the registrant of expenses incurred or paid by a director, officer or controlling person of the registrant in the successful defense of any action, suit or proceeding) is asserted by such director, officer or controlling person in connection with the securities being registered, the registrant will, unless in the opinion of its counsel the matter has been settled by controlling precedent, submit to a court of appropriate jurisdiction the question of whether such indemnification by it is against public policy as expressed in the Act and will be governed by the final adjudication of such issue. |
| (c) | The undersigned registrant hereby undertakes that: |
| (1) | For purposes of determining any liability under the Securities Act of 1933, the information omitted from the form of prospectus filed as part of this registration statement in reliance upon Rule 430A and contained in a form of prospectus filed by the registrant pursuant to Rule 424(b)(1) or (4) or 497(h) under the Securities Act shall be deemed to be part of this registration statement as of the time it was declared effective. |
| (2) | For the purpose of determining any liability under the Securities Act of 1933, each post-effective amendment that contains a form of prospectus shall be deemed to be a new registration statement relating to the securities offered therein, and the offering of such securities at that time shall be deemed to be the initial bona fide offering thereof. |
II-4
Table of Contents
EXHIBIT INDEX
In reviewing the agreements included as exhibits to this Registration Statement on Form S-1, please remember that they are included to provide you with information regarding their terms. The agreements contain representations and warranties by each of the parties to the applicable agreement. These representations and warranties were made for the benefit of the other parties to the applicable agreement and (i) were not intended to be treated as categorical statements of fact, but rather as a way of allocating the risk to one of the parties if those statements prove to be inaccurate; (ii) may have been qualified in such agreement by disclosures that were made to the other party in connection with the negotiation of the applicable agreement, which disclosures are not necessarily reflected in the agreement; (iii) may apply contract standards of “materiality” that are different from “materiality” under applicable securities laws; and (iv) were made only as of the date of the applicable agreement or such other date or dates as may be specified in the agreement and are subject to more recent developments. Additional information about AXA Equitable Holdings, Inc., its subsidiaries and affiliates may be found elsewhere in this Registration Statement on Form S-1.
II-5
Table of Contents
II-6
Table of Contents
II-7
Table of Contents
II-8
Table of Contents
| * | Previously filed on November 13, 2017. |
| ** | Previously filed on April 6, 2018. |
| *** | Previously filed on April 23, 2018. |
| **** | Filed herewith. |
| † | Identifies each management contract or compensatory plan or arrangement. |
| # | To be filed by amendment. |
II-9
Table of Contents
Pursuant to the requirements of the Securities Act of 1933, as amended, AXA Equitable Holdings, Inc. has duly caused this registration statement to be signed on its behalf by the undersigned, thereunto duly authorized, in the City of New York, State of New York on April 26, 2018.
| AXA EQUITABLE HOLDINGS, INC. | ||
| By: | /s/ Anders Malmström | |
| Name: Anders Malmström | ||
| Title: Senior Executive Vice President and Chief Financial Officer | ||
Pursuant to the requirements of the Securities Act of 1933, this registration statement has been signed on April 26, 2018 by the following persons in the capacities indicated.
| Signature |
Title | |
| * Mark Pearson |
President and Chief Executive Officer; Director (Principal Executive Officer) | |
| /s/ Anders Malmström Anders B. Malmström |
Senior Executive Vice President and Chief Financial Officer (Principal Financial Officer) | |
| * Andrea M. Nitzan |
Executive Vice President, Chief Accounting Officer and Controller (Principal Accounting Officer) | |
| * Thomas Buberl |
Director | |
| * Gérald Harlin |
Director | |
| * George Stansfield |
Director | |
| * Karima Silvent |
Director | |
| * Bertrand Poupart-Lafarge |
Director | |
| * Daniel G. Kaye |
Director | |
| * Ramon de Oliveira |
Director | |
| * Charles G. T. Stonehill |
Director | |
| *By: | /s/ Anders Malmström | |
| Anders Malmström | ||
| as Attorney-in-Fact | ||
S-1