Attached files
| file | filename |
|---|---|
| 8-K - FORM 8-K - Franklin Financial Network Inc. | tv492038_8k.htm |
| EX-99.1 - EXHIBIT 99.1 - Franklin Financial Network Inc. | tv492038_ex99-1.htm |
Exhibit 99.2

Franklin Financial Network, Inc. (NYSE:FSB) First Quarter 2018 Investor Call April 26, 2018
Forward - Looking Statements Except for the historical information contained herein, this presentation contains forward - looking statements within the meaning of Section 27A of the Securities Act of 1933, as amended, and Section 21E of the Securities Exchange Act of 1934, as amended. The forward - looking statements include, among other things, statements regarding intent, belief or expectations of the Company and can be identified by the use of words such as "may," "will," "should," "would," "assume," "outlook," "seek," "plan," "believe," "expect," "anticipate," "intend," "estimate," "forecast," and other comparable terms. The Company intends that all such statements be subject to the “safe harbor” provisions of those Acts. Because forward - looking statements involve risks and uncertainties, actual results may differ materially from those expressed or implied. Investors are cautioned not to place undue reliance on these forward - looking statements and are advised to carefully review the discussion of forward - looking statements and risk factors in documents the Company files with the Securities and Exchange Commission. The Company undertakes no obligation to publicly update or revise any forward - looking statements, whether as a result of new information, future events or otherwise.
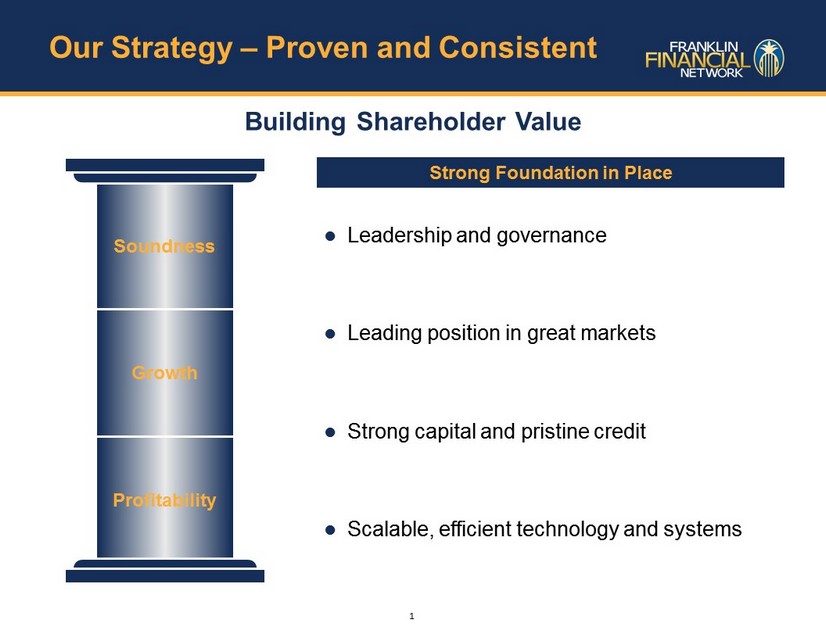
Our Strategy – Proven and Consistent Strong Foundation in Place Leadership and governance Leading position in great markets Strong capital and pristine credit Scalable, efficient technology and systems Building Shareholder Value Soundness Growth Profitability 1

Experienced Leadership Team 2 Industry Experience Years at FSB Richard E. Herrington Chairman, CEO & President 48 11 Sarah Meyerrose Executive VP & Chief Financial Officer 40 2 J. Myers Jones, III Executive VP & Chief Credit Officer 43 9 Lee M. Moss* President, Franklin Synergy Bank 45 4 David McDaniel Executive VP, Chief Lending Officer & Williamson County President 26 7 Kevin A. Herrington Executive VP & Chief Operating Officer, Franklin Synergy Bank 21 11 Terry R. Howell Executive VP & Corporate Risk Officer 36 2 Sally E. Bowers Executive VP & Chief Mortgage Officer 47 11 Sally P. Kimble Executive VP & Chief Administrative Officer 39 6 * Joined FSB as part of MidSouth Bank acquisition in July 2014.

Ranked 30 th in Forbes 2016 Best Places for Business and Careers Metro Population of 1.9 million Nashville ranked 6th among nation’s top cities for real estate investing in 2017 Leading Industries: tourism, health care management, logistics, publishing, insurance, music and entertainment Source: Nashville Chamber of Commerce, the Council for Community and Economic Research, Bureau of Economic Analysis, U.S. Dep art ment of Commerce, Forbes, Fortune, Red Report, Bureau of Labor Statistics, and SNL Financial Nashville - Davidson - Murfreesboro - Franklin, TN Metropolitan Statistical Area No state personal income tax on wages or estate tax Nashville ranked 3rd for best cities for jobs in 2017 by Forbes Davidson County unemployment 2.6% as of February 2018 21 accredited 4 - year colleges/universities Wealthiest county in Tennessee and the 7 th wealthiest county nationwide Fastest growing county (2014 to 2016) in Tennessee Home to 40 corporate HQs and 7 Fortune 1,000 companies Three AAA rated government entities County ranked #1 fastest growing job market in the US at 6.7% County unemployment rate: 2.4% as of February 2018 Median household income $113,712 (2018E) Williamson Rutherford One of the wealthiest counties in Tennessee Murfreesboro 10th fastest growing large city in U.S. 2015 / 2016 Home of Nissan USA’s largest manufacturing facility; regional headquarters of General Mills, Amazon Fulfillment Center County unemployment rate: 2.7% as of February 2018 Median household income $65,746 (2018E) Ranked 5th in U.S. for job growth June 2015 through June 2016 577878_1.WOR / NY00813G 577878_1.WOR / NY00813G 577878_1.WOR / NY00813G 577878_1.WOR / NY00813G 577878_1.WOR / NY00813G 577878_1.WOR / NY00813G 577878_1.WOR / NY00813G 577878_1.WOR / NY00813G 577878_1.WOR / NY00813G 577878_1.WOR / NY00813G 577878_1.WOR / NY00813G 577878_1.WOR / NY00813G 577878_1.WOR / NY00813G 577878_1.WOR / NY00813G 577878_1.WOR / NY00813G 577878_1.WOR / NY00813G 577878_1.WOR / NY00813G 577878_1.WOR / NY00813G 577878_1.WOR / NY00813G 577878_1.WOR / NY00813G 577878_1.WOR / NY00813G 577878_1.WOR / NY00813G 577878_1.WOR / NY00813G 577878_1.WOR / NY00813G 577878_1.WOR / NY00813G 577878_1.WOR / NY00813G 577878_1.WOR / NY00813G 577878_1.WOR / NY00813G 577878_1.WOR / NY00813G 577878_1.WOR / NY00813G 577878_1.WOR / NY00813G 577878_1.WOR / NY00813G 577878_1.WOR / NY00813G 577878_1.WOR / NY00813G 577878_1.WOR / NY00813G 577878_1.WOR / NY00813G 577878_1.WOR / NY00813G 577878_1.WOR / NY00813G 577878_1.WOR / NY00813G 577878_1.WOR / NY00813G 577878_1.WOR / NY00813G 577878_1.WOR / NY00813G 577878_1.WOR / NY00813G 577878_1.WOR / NY00813G 577878_1.WOR / NY00813G 577878_1.WOR / NY00813G 577878_1.WOR / NY00813G 577878_1.WOR / NY00813G 577878_1.WOR / NY00813G Nashville Nashville Nashville Nashville Nashville Nashville Nashville Nashville Nashville Nashville Nashville Nashville Nashville Nashville Nashville Nashville Nashville Nashville Nashville Nashville Nashville Nashville Nashville Nashville Nashville Nashville Nashville Nashville Nashville Nashville Nashville Nashville Nashville Nashville Nashville Nashville Nashville Nashville Nashville Nashville Nashville Nashville Nashville Nashville Nashville Nashville Nashville Nashville Nashville Brentwood Brentwood Brentwood Brentwood Brentwood Brentwood Brentwood Brentwood Brentwood Brentwood Brentwood Brentwood Brentwood Brentwood Brentwood Brentwood Brentwood Brentwood Brentwood Brentwood Brentwood Brentwood Brentwood Brentwood Brentwood Brentwood Brentwood Brentwood Brentwood Brentwood Brentwood Brentwood Brentwood Brentwood Brentwood Brentwood Brentwood Brentwood Brentwood Brentwood Brentwood Brentwood Brentwood Brentwood Brentwood Brentwood Brentwood Brentwood Brentwood Franklin Franklin Franklin Franklin Franklin Franklin Franklin Franklin Franklin Franklin Franklin Franklin Franklin Franklin Franklin Franklin Franklin Franklin Franklin Franklin Franklin Franklin Franklin Franklin Franklin Franklin Franklin Franklin Franklin Franklin Franklin Franklin Franklin Franklin Franklin Franklin Franklin Franklin Franklin Franklin Franklin Franklin Franklin Franklin Franklin Franklin Franklin Franklin Franklin Murfreesboro Murfreesboro Murfreesboro Murfreesboro Murfreesboro Murfreesboro Murfreesboro Murfreesboro Murfreesboro Murfreesboro Murfreesboro Murfreesboro Murfreesboro Murfreesboro Murfreesboro Murfreesboro Murfreesboro Murfreesboro Murfreesboro Murfreesboro Murfreesboro Murfreesboro Murfreesboro Murfreesboro Murfreesboro Murfreesboro Murfreesboro Murfreesboro Murfreesboro Murfreesboro Murfreesboro Murfreesboro Murfreesboro Murfreesboro Murfreesboro Murfreesboro Murfreesboro Murfreesboro Murfreesboro Murfreesboro Murfreesboro Murfreesboro Murfreesboro Murfreesboro Murfreesboro Murfreesboro Murfreesboro Murfreesboro Murfreesboro Knoxville Knoxville Knoxville Knoxville Knoxville Knoxville Knoxville Knoxville Knoxville Knoxville Knoxville Knoxville Knoxville Knoxville Knoxville Knoxville Knoxville Knoxville Knoxville Knoxville Knoxville Knoxville Knoxville Knoxville Knoxville Knoxville Knoxville Knoxville Knoxville Knoxville Knoxville Knoxville Knoxville Knoxville Knoxville Knoxville Knoxville Knoxville Knoxville Knoxville Knoxville Knoxville Knoxville Knoxville Knoxville Knoxville Knoxville Knoxville Knoxville Memphis Memphis Memphis Memphis Memphis Memphis Memphis Memphis Memphis Memphis Memphis Memphis Memphis Memphis Memphis Memphis Memphis Memphis Memphis Memphis Memphis Memphis Memphis Memphis Memphis Memphis Memphis Memphis Memphis Memphis Memphis Memphis Memphis Memphis Memphis Memphis Memphis Memphis Memphis Memphis Memphis Memphis Memphis Memphis Memphis Memphis Memphis Memphis Memphis Highly Attractive Markets 3

Financial Highlights and Recent Developments For the First Quarter 2018 As of March 31, 2018 Net interest income of $25.1 million +6.2% vs. 1Q’17 Net income of $10.1 million +26.7% vs. 1Q’17 Earnings per share of $0.73 +25.9% vs. 1Q’17 Return on average assets of 1.03% Return on average tangible common equity of 14.1% Net charge - offs of only 0.01% Loans (1) of $2,310 million +18.5% vs. 1Q’17 Retail deposit growth of 26.6% vs. 1Q’17 Ratio of nonperforming loans only 15 bps of total loans and ratio of allowance for loan losses to total loans steady at 0.94% Tangible book value per share of $22.23 +8.4% vs. 1Q’17 Common equity tier 1 ratio of 11.5% Total risk - based capital of 14.4% Recent Developments Closed Civic acquisition on April 1, 2018 Opening of Murfreesboro, TN branch 4 Note: $ in millions, except per share data (1) Excludes loans held for sale. 1Q’18 was characterized by record earnings per share, net interest income and total loans

1Q'18 4Q'17 UBPR Peer (4Q'17) Nonperforming Assets / Assets 0.12% 0.12% 0.61% Net Charge-offs / Loans 0.01% (0.00%) 0.14% Common Equity Tier 1 11.5% 11.4% 11.6% Tier 1 11.5% 11.4% 12.2% Total 14.4% 14.4% 13.9% Cash & Securities / Assets 40.3% 38.1% 21.3% Loans / Deposits 68.8% 71.2% 93.3% Risk Weight Risk-weighted Assets / Assets 66.3% 68.5% 77.6% Asset Quality Capacity Liquidity Solid Credit and Low Risk Balance Sheet 5 Source: SNL Financial Note: Peers include select high - performing publicly traded Southeast U.S. banks (ex - Florida) with $3bn - $25bn assets, inclu des: ABCB, BXS, CTBI, FBK, PNFP, RNST, SFBS, SSB, STBZ, SYBT, TOWN, UCBI U.S. Mid Cap includes: ASB, BOH, BOKF, CBSH, CMA, CFR, EWBC, FHN, FRC, FULT, HBAN, PB, PBCT, SBNY, SIVB, SNV, TCBI, VLY, WBS, ZION Low risk, liquid balance sheet Growth Profitability Soundness

Well Diversified Loan Portfolio Loan Growth ($ mm) Diversified Portfolio Real Estate 80% 6 Franchise defined by strong loan growth while maintaining diversification and credit discipline < Construction 21% Acquisition & Development 2% Commercial Real Estate 31% Residential 26% Warehouse Mortgage 1% Commercial 20% Consumer & Other 0% $296 $432 $806 $1,318 $1,797 $2,269 $2,323 2012 2013 2014 2015 2016 2017 1Q'18 Growth Profitability Soundness

Year - Over - Year Loan Growth Loan Type 1Q2018 1Q2017 Growth % Growth Construction 480,933$ 453,658$ 27,275$ 6.0% Acquisition & development 42,727 45,614 (2,887) -6.3% Commercial real estate - owner-occupied 212,519 188,632 23,887 12.7% Commercial real estate - other 504,459 360,526 143,933 39.9% Residential - closed end 1-4 family 430,563 299,628 130,935 43.7% Residential - open end 1-4 family 172,216 151,530 20,686 13.7% Warehouse mortgage 12,871 12,682 189 1.5% Total real estate 1,856,288 1,512,270 344,018 22.7% Commercial 464,927 447,245 17,682 4.0% Consumer & other 3,899 3,853 46 1.2% Total Gross Loans 2,325,114 1,963,368 361,746 18.4% Less: Deferred fees (2,225) (971) (1,254) 129.1% Total Net Loans 2,322,889$ 1,962,397$ 360,492$ 18.4% ($ in thousands) 7 Growth Profitability Soundness
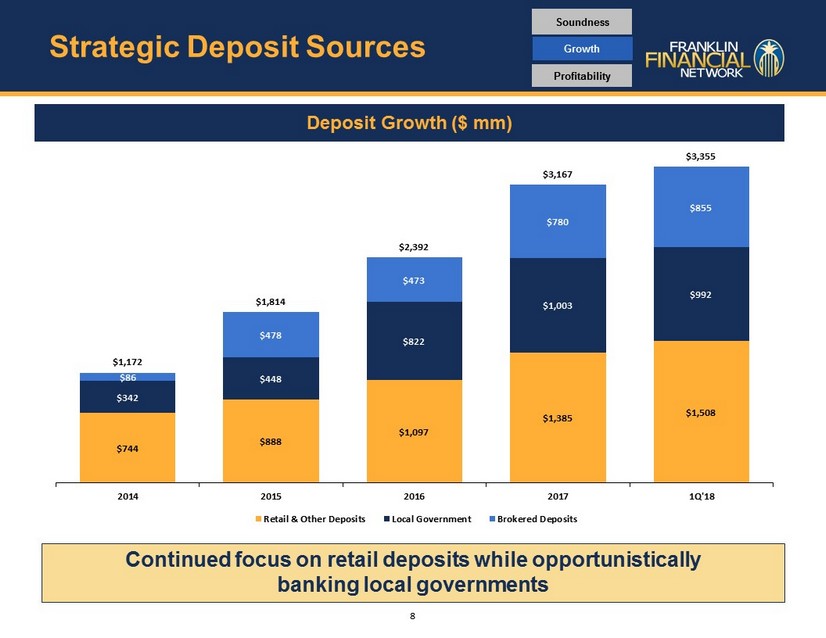
Strategic Deposit Sources Deposit Growth ($ mm) 8 Continued focus on retail deposits while opportunistically banking local governments Growth Profitability Soundness $744 $888 $1,097 $1,385 $1,508 $342 $448 $822 $1,003 $992 $86 $478 $473 $780 $855 $1,172 $1,814 $2,392 $3,167 $3,355 2014 2015 2016 2017 1Q'18 Retail & Other Deposits Local Government Brokered Deposits

Building Earnings Momentum and Tangible Book Value Diluted Earnings Per Share Tangible Book Value Per Share 9 Note: 2017 metrics adjusted for DTA write - down that was recorded in December 2017 related to the change in income tax regula tions that resulted from the Tax Cuts and Jobs At that was passed in late December 2017 Record earnings continue to support the growth and future profitability of the franchise while building tangible book value per share $1.02 $1.10 $1.27 $1.54 $2.42 $2.04 $0.58 $0.73 2012 2013 2014 2015 2016 2017 1Q'17 1Q'18 $11.37 $11.29 $12.88 $15.85 $19.91 $22.24 $22.23 2012 2013 2014 2015 2016 2017 1Q'18 Growth Profitability Soundness

Continued Performance Net Income Net Interest Income $16.0 $21.0 $37.7 $59.4 $81.6 $97.0 $23.6 $25.1 2012 2013 2014 2015 2016 2017 1Q'17 1Q'18 10 Note: 2017 metrics adjusted for DTA write - down that was recorded in December 2017 related to the change in income tax regula tions that resulted from the Tax Cuts and Jobs At that was passed in late December 2017 NIM: 3.17% 3.41% 3.74% 3.62% 3.42% 3.06% 3.18% 2.71% Return on Average Tangible Common Equity Non - Interest Expenses Strong, sustainable earnings and return metrics driven by loan growth and disciplined credit and expenses $3.7 $4.5 $8.3 $16.0 $28.0 $28.1 $7.9 $10.1 0.80% 0.72% 0.80% 0.92% 1.10% 0.82% 0.99% 1.03% 2012 2013 2014 2015 2016 2017 1Q'17 1Q'18 Net Income ROAA 10.5% 10.1% 10.1% 10.8% 14.4% 10.1% 12.3% 14.1% 2012 2013 2014 2015 2016 2017 1Q'17 1Q'18 $16.9 $19.7 $31.8 $42.1 $51.7 $60.8 $14.3 $15.5 69% 71% 67% 58% 53% 54% 52% 54% 2012 2013 2014 2015 2016 2017 1Q'17 1Q'18 Non-Int. Expenses Efficiency Ratio Growth Profitability Soundness
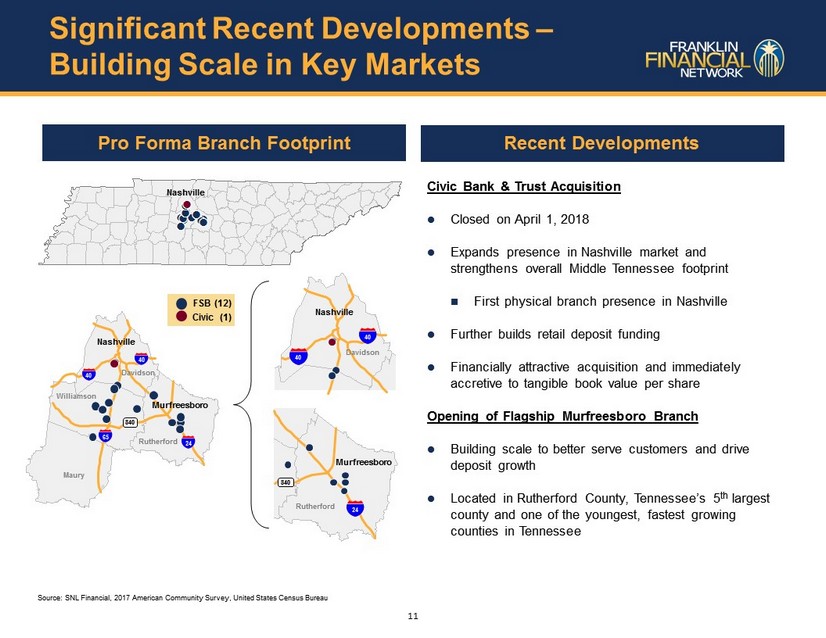
l l l l l l l l l l l l l l l l l l l l l l l l l l l l l l l l l l l l l l l l l l l l l l l l l l l l l l l l l l l l l l l l l l l l l l l l l l l l l l l l l l l l l l l l l ll l l l l l l l l l l l l l l l l l l l l l l l l l l l l l l l l l l l l l l l l l l l l F:\Word Processing\MapInfo\MapInfo Jobs\Van Meter, Cliff\04-11-18\Combined_v02.WOR Significant Recent Developments – Building Scale in Key Markets Recent Developments 11 Civic Bank & Trust Acquisition Approved by regulators and closed on April 1, 2018 Expands presence in Nashville market and strengthens overall Middle Tennessee footprint First physical branch presence in Nashville Further builds retail deposit funding Financially attractive acquisition and immediately accretive to tangible book value per share Opening of Flagship Murfreesboro Branch Building scale to better serve customers and drive deposit growth Located in Rutherford County, Tennessee’s 5 th largest county and one of the youngest, fastest growing counties in Tennessee Source: SNL Financial, 2017 American Community Survey, United States Census Bureau FSB (12) Civic (1) Nashville Pro Forma Branch Footprint F:\Word Processing\MapInfo\MapInfo Jobs\Van Meter, Cliff\04-11-18\Combined_v02.WOR Davidson Williamson Rutherford Maury Nashville 65 24 40 40 840 Davidson Nashville 40 40 F:\Word Processing\MapInfo\MapInfo Jobs\Van Meter, Cliff\04-11-18\Combined_v02.WOR Rutherford 24 840 Murfreesboro Murfreesboro
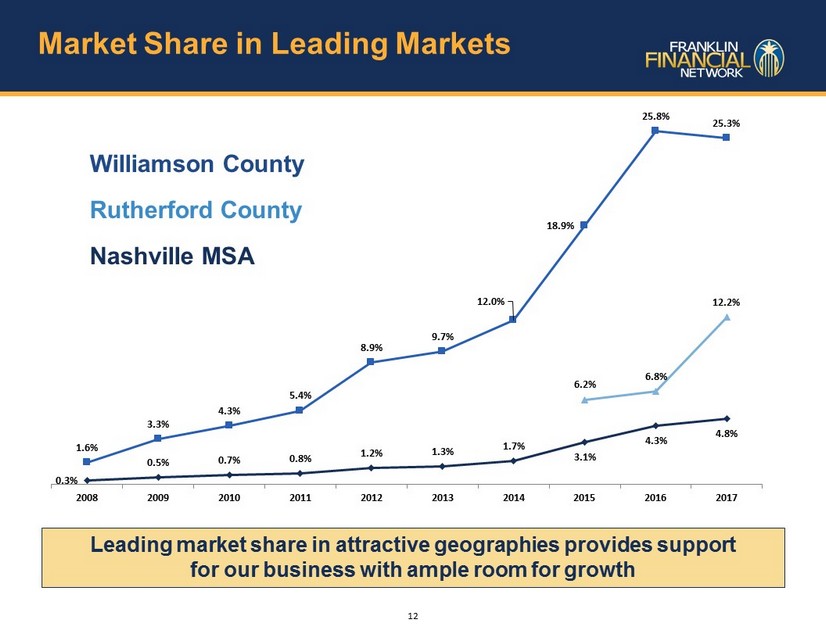
Market Share in Leading Markets 0.3% 0.5% 0.7% 0.8% 1.2% 1.3% 1.7% 3.1% 4.3% 4.8% 1.6% 3.3% 4.3% 5.4% 8.9% 9.7% 12.0% 18.9% 25.8% 25.3% 6.2% 6.8% 12.2% 2008 2009 2010 2011 2012 2013 2014 2015 2016 2017 Williamson County Rutherford County Nashville MSA Leading market share in attractive geographies provides support for our business with ample room for growth 12

Growth Real Estate Lending Asset Quality Proven, Successful Banking Model Key Elements of FSB Performance 13