Attached files
| file | filename |
|---|---|
| 8-K - 8-K ANNUAL MEETING PRESENTATION - EMCLAIRE FINANCIAL CORP | a425188-kannualmeetingpres.htm |
2018 ANNUAL MEETING OF SHAREHOLDERS
EMCLAIRE FINANCIAL CORP
PARENT COMPANY OF: THE FARMERS NATIONAL BANK OF EMLENTON
Emlenton, Pennsylvania
April 25, 2018
William C. Marsh
Chairman, President and
Chief Executive Officer

ANNUAL MEETING OF SHAREHOLDERS
Agenda &
Contents
2
Topic Page
Legal 3
Corporate Overview 4
Financial Performance 11
Looking Ahead 20
Question & Answer 26

This presentation contains certain forward-looking statements and
information relating to the Company that are based on the beliefs of
management as well as assumptions made by and information
currently available to management. These forward-looking statements
relate to, among other things, expectations of the business
environment in which we operate, projections of future performance,
potential future credit experience, perceived opportunities in the
market and statements regarding our mission and vision. Such
statements reflect the current views of the Company with respect to
future looking events and are subject to certain risks, uncertainties and
assumptions. Should one or more of these risks or uncertainties
materialize or should underlying assumptions prove incorrect, actual
results may vary materially from those described herein as anticipated,
believed, estimated, expected or intended. The Company does not
intend to update these forward-looking statements.
NOTE: This presentation will be available online at www.emclairefinancial.com.
LEGAL
3

4
Corporate Overview• • • • • •

CORPORATE OVERVIEW HISTORY
5
• The Farmers National Bank of Emlenton is a full-service financial institution operating 17 banking offices across nine counties in
Pennsylvania and one county in West Virginia.
• We achieved a significant milestone in 2017 – reaching $750 million in total assets
• Our expansion over the last 10 years has included these three strategies:
– Acquisitions: One branch (PNC Titusville 2009) and three whole institutions (ECSLA in 2008, UASB in 2016 and NHBT in
2017)
– Organic growth: $170 million of organic deposit growth since 12/31/2007 (excludes acquisitions and de novos)
– De novo offices: Grove City (2008), St. Marys (2013), Cranberry Township (2014) and Aspinwall (2016)
$50,000 ~ $70 millionMarket Capitalization

CORPORATE OVERVIEW MISSION, VISION, CULTURE
6
In developing strategic plans, we remain focused on our commitment to the Corporate Mission of
our Bank, our Vision for the future and the strength of the Culture through which we intend to
execute these strategies.
Mission
• Remain a strong, independent
community bank
• Optimize value
• Engage customers
• Empower employees
• Make a positive impact
Vision
• Reach $1 billion in total
assets
• Exceed ROAA of 0.80%
• Exceed ROAE of 9.00%
• Continued sensible growth
Culture
• Customer first mentality
• Large bank capabilities with
local decision making
• Invest in our people
• Be an employer of choice
• Commitment to community
investment and involvement

• Record earnings, despite tax impact
• Record asset levels
• Record deposit levels
• Strong asset quality
• Strategic expansion
– Northern Hancock Bank & Trust Co. merger completed
– Aspinwall & South Side offices contributing as expected
– Cranberry Township office continues exceptional growth
✓ Expanded platform for growth
• Continued need for scale
CORPORATE OVERVIEW 2017 SNAPSHOT
7

$250
$300
$350
$400
$450
$500
$550
$600
$250
$300
$350
$400
$450
$500
$550
$600
$650
$700
$750
$800
12/31/2008 12/31/2009 12/31/2010 12/31/2011 12/31/2012 12/31/2013 12/31/2014 12/31/2015 12/31/2016 12/31/2017
Lo
an
s,
n
e
t
(
in
M
ill
io
n
s)
To
ta
l A
ss
et
s
&
De
p
o
si
ts
(
In
M
ill
io
n
s)
CORPORATE OVERVIEW CONSISTENT GROWTH
8
Doubled Asset Size – 12/31/2008 to 12/31/2017
In millions
Total Assets $376 $468 $482 $492 $509 $526 $582 $601 $692 $750
Deposits 287 385 10 16 432 432 0 490 585 6 5
L ans, net 65 293 306 3 3 3 4 35 3 0 3 16 578
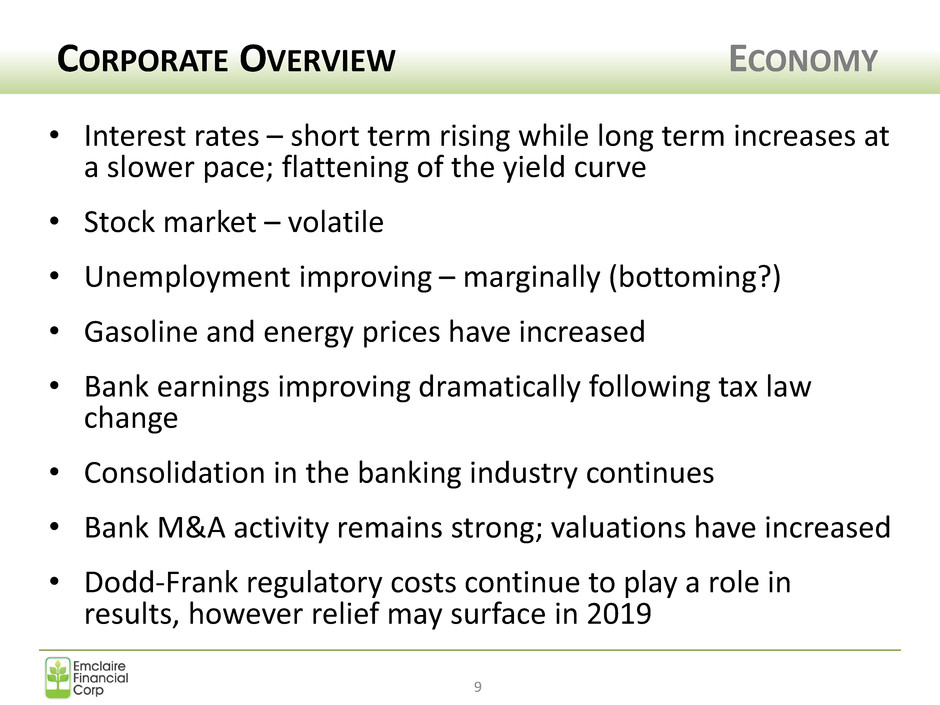
• Interest rates – short term rising while long term increases at
a slower pace; flattening of the yield curve
• Stock market – volatile
• Unemployment improving – marginally (bottoming?)
• Gasoline and energy prices have increased
• Bank earnings improving dramatically following tax law
change
• Consolidation in the banking industry continues
• Bank M&A activity remains strong; valuations have increased
• Dodd-Frank regulatory costs continue to play a role in
results, however relief may surface in 2019
CORPORATE OVERVIEW ECONOMY
9

Last 12 months (LTM):
▪ $28.25 (4/16/2017) to $33.50 (4/16/2018)
▪ Outperformed the S&P 500 index & Nasdaq Bank index
▪ Dividends earned during the period = $1.09 (3.9% yield)
CORPORATE OVERVIEW STOCK PERFORMANCE
10
✓ Total return = 22.5%
✓ Stock price appreciation (LTM) = 18.6%
Blue shaded area = Emclaire Financial Corp Black Line = NASDAQ Bank Index Green Line = S&P 500 Index

11
Financial Performance• • • • • •

Since December 31, 2013:
• 43% asset growth
• 64% loan growth
• 31% increase in equity
• $8.2 million in common equity raised in 2015 private placement ($4.6 million raised in 2011 not shown)
FINANCIAL PERFORMANCE
AS REPORTED (DOLLAR AMOUNTS IN THOUSANDS, EXCEPT PER SHARE DATA)
12
2017 2016 2015 2014 2013
Total assets 750,084$ 692,135$ 600,595$ 581,909$ 525,842$
Loans receivable, net 577,234 515,435 429,891 379,648 352,430
Deposits 654,643 584,940 489,887 501,819 432,006
Borrowed funds 26,000 44,000 49,250 21,500 44,150
Stockholders' equity 59,091 54,073 52,839 47,990 45,072
Stockholders' equity per common share $26.02 $25.12 $24.64 $24.14 $22.66
Tangible stockholders' equity per common
share $21.28 $20.08 $22.67 $21.66 $20.04
Market value per common share $30.35 $29.25 $24.00 $25.00 $25.14
Price to tangible book 142.6% 145.7% 105.9% 115.4% 125.4%
Common shares outstanding 2,271,139 2,152,358 2,144,808 1,780,658 1,768,658
Balance Sheet:
As of the year ended December 31,

• Strong growth in net interest income despite margin pressure
• ROAA and ROAE in 2016 were adversely impacted by merger costs and costs related to the opening of the Aspinwall office
• ROAA and ROAE in 2017 were adversely impacted by an $827,000 tax provision related to the Tax Cuts and Jobs Act of 2017
• Continued annual increase in common dividend (increased quarterly dividend to $0.28 per share in 2018)
FINANCIAL PERFORMANCE
AS REPORTED (DOLLAR AMOUNTS IN THOUSANDS, EXCEPT PER SHARE DATA)
13
2017 2016 2015 2014 2013
Net interest income 21,907$ 19,480$ 17,747$ 17,235$ 15,921$
Noninterest income 5,022 3,655 4,094 4,087 3,860
Net income 4,277 3,986 4,154 4,017 3,808
Diluted earnings per common share $1.93 $1.85 $2.05 $2.20 $1.91
Cash dividends per common share $1.08 $1.04 $0.96 $0.88 $0.80
Return on average assets 0.59% 0.60% 0.70% 0.70% 0.73%
Return on average equity 7.52% 7.32% 7.89% 8.47% 7.73%
Return on average common equity 7.52% 7.32% 8.34% 9.24% 8.32%
Net interest margin 3.29% 3.23% 3.33% 3.35% 3.40%
Nonperforming assets to total assets 0.56% 0.52% 0.54% 1.21% 1.01%
Efficiency ratio 71.49% 72.78% 73.67% 72.13% 70.48%
Key Ratios:
For the year ended December 31,
Income Statement:

FINANCIAL PERFORMANCE 2017 VS. 2016
14
Notes:
• Net interest margin expansion driven by strong loan growth
• Bargain purchase gain of $1.3 million and merger costs of $1.1 million were recognized in 2017 related to the acquisition of Northern Hancock Bank & Trust
Co.
• Tax Cuts and Jobs Act of 2017 resulted in an $827,000 increase in the provision for income taxes.
In $000's, except per share data 2017 2016 % Change
Net interest income 21,907 19,480 12.5% Strong loan growth
Provision for loan losses 903 464 94.6% Loan growth
Noninterest income, excl. security loss and bargain purchase gain 3,868 3,573 8.3% Overdraft revenues
Security losses, net (162) 82 -297.6% Impairment charge
Bargain purchase gain 1,316 - NM $1.3mm bargain purchase gain
Noninterest expense, excluding merger costs 18,516 17,036 8.7% New offices & general increases
Merger costs 1,119 401 179.1% Northern Hancock & UASB
Net income before taxes 6,391 5,234 22.1%
Provision for taxes 2,114 1,248 69.4% Tax Cuts and Jobs Act of 2017
Net income 4,277 3,986 7.3%
Earnings per common share, fully diluted $1.93 $1.85 4.3%
Return on average assets 0.59% 0.60%
Return on average common equity 7.52% 7.32%
Yield on earning assets 3.95% 3.86%
Cost of funds 0.68% 0.65%
Net interest margin, fully taxable equivalent 3.29% 3.23%
Efficiency ratio 71.49% 72.78%
For the years ended December 31,

FINANCIAL PERFORMANCE ASSET QUALITY
15
• Of the $3.7 million in remaining nonperforming loans:
– One relationship represents 23% ($839,000). The borrower, however, continues to make monthly
payments in a timely manner.
– Another relationship represents 15% ($559,000). The borrower is no longer making payments.
• Of the 7,000 loans outstanding at 12/31/2017, 59 (0.8%) were nonperforming.
Asset Quality Metrics
In $000's 12/31/2017 12/31/2016 12/31/2015 12/31/2014 12/31/2013 12/31/2012
Total delinquency (> 30 days) $8,071 $5,841 $3,183 $4,413 $5,913 $7,789
Nonperforming assets:
Accruing loans 90 or more days past due $689 $44 $0 $93 $62 $21
Nonaccrual loans 3,003 3,278 3,069 6,849 5,146 6,967
Total nonperforming loans $3,693 $3,322 $3,069 $6,942 $5,208 $6,988
Repossessed assets & OREO 492 291 160 124 107 180
Total nonperforming assets $4,185 $3,613 $3,229 $7,066 $5,315 $7,168
Nonperforming assets / assets 0.56% 0.52% 0.54% 1.21% 1.01% 1.41%
Allowance for loan losses $6,127 $5,545 $5,205 $5,224 $4,869 $5,350
Allowance / loans 1.05% 1.06% 1.20% 1.36% 1.36% 1.58%
Allowance / nonperforming loans 165.93% 166.92% 169.60% 75.25% 93.49% 76.56%
Charge-offs:
Charge-offs / average loans 0.06% 0.06% 0.10% 0.10% 0.33% 0.15%
As of
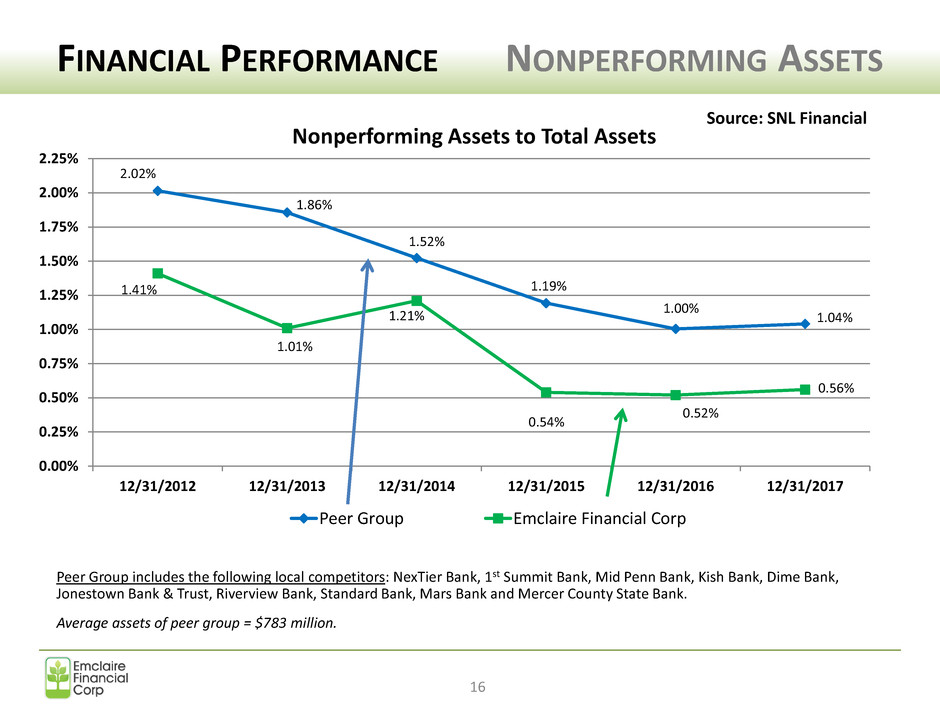
2.02%
1.86%
1.52%
1.19%
1.00%
1.04%
1.41%
1.01%
1.21%
0.54%
0.52%
0.56%
0.00%
0.25%
0.50%
0.75%
1.00%
1.25%
1.50%
1.75%
2.00%
2.25%
12/31/2012 12/31/2013 12/31/2014 12/31/2015 12/31/2016 12/31/2017
Nonperforming Assets to Total Assets
Peer Group Emclaire Financial Corp
FINANCIAL PERFORMANCE NONPERFORMING ASSETS
16
Peer Group includes the following local competitors: NexTier Bank, 1st Summit Bank, Mid Penn Bank, Kish Bank, Dime Bank,
Jonestown Bank & Trust, Riverview Bank, Standard Bank, Mars Bank and Mercer County State Bank.
Average assets of peer group = $783 million.
Source: SNL Financial

FINANCIAL PERFORMANCE DIVIDEND RECAP
17
• Dividend yield = dividends for the year / stock price at the beginning of the year
• 2018E dividends projected at $0.28 per quarter
• 2018E yield = 3.69% based on closing price of $30.35 per share at 12/31/2017
Average yield
= 3.82%
3.84%
3.50%
3.84%
4.33%
3.69% 3.69%
1.00%
1.50%
2.00%
2.50%
3.00%
3.50%
4.00%
4.50%
$0.20
$0.30
$0.40
$0.50
$0.60
$0.70
$0.80
$0.90
$1.00
$1.10
$1.20
2013 2014 2015 2016 2017 2018E
Di
vi
d
en
d
Y
ie
ld
C
as
h
D
iv
id
e
n
d
p
e
r
C
o
m
m
o
n
S
h
ar
e
Regular Dividends Dividend Yield
FINANCIAL PERFORMANCE Q1-2018 BALANCE SHEET
18
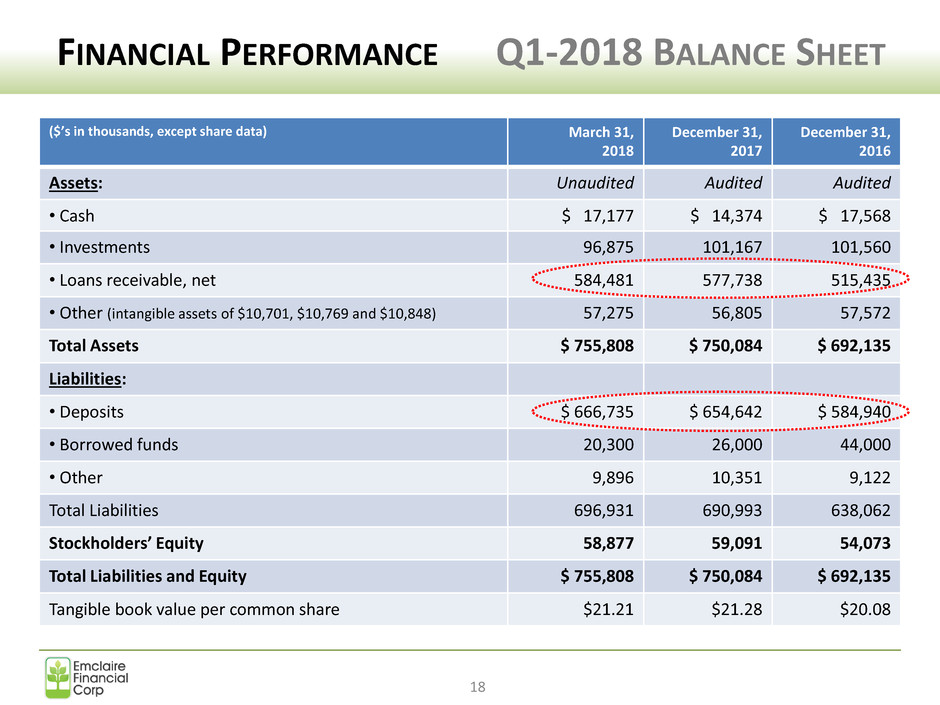
($’s in thousands, except share data) March 31,
2018
December 31,
2017
December 31,
2016
Assets: Unaudited Audited Audited
• Cash $ 17,177 $ 14,374 $ 17,568
• Investments 96,875 101,167 101,560
• Loans receivable, net 584,481 577,738 515,435
• Other (intangible assets of $10,701, $10,769 and $10,848) 57,275 56,805 57,572
Total Assets $ 755,808 $ 750,084 $ 692,135
Liabilities:
• Deposits $ 666,735 $ 654,642 $ 584,940
• Borrowed funds 20,300 26,000 44,000
• Other 9,896 10,351 9,122
Total Liabilities 696,931 690,993 638,062
Stockholders’ Equity 58,877 59,091 54,073
Total Liabilities and Equity $ 755,808 $ 750,084 $ 692,135
Tangible book value per common share $21.21 $21.28 $20.08

FINANCIAL PERFORMANCE Q1-2018 EARNINGS
19
Notes:
• Net interest margin expansion driven by strong loan growth
• Tax Cuts and Jobs Act of 2017 resulted in Q1-2018 savings of approximately $175,000
In $000's, except per share data (unaudited) 2018 2017 % Change
Net interest income $5,845 $5,156 13.4% Strong loan growth
Provision for loan losses 380 162 134.6% Loan growth
Noninterest income, excluding security losses 933 856 9.0% Overdraft revenues
Security losses, net (34) - NM
Noninterest expense 4,736 4,621 2.5% New office & general increases
Net income before taxes 1,628 1,229 32.5%
Provision for taxes 266 273 -2.6% Tax Cuts and Jobs Act of 2017
Net income $1,362 $956 42.5%
Earnings per common share, fully diluted $0.60 $0.44 36.4%
Return on average assets 0.74% 0.56%
Return on average common equity 9.38% 7.12%
Yield on earning assets 4.08% 3.94%
Cost of funds 0.69% 0.65%
Net interest margin, fully taxable equivalent 3.41% 3.31%
Efficiency ratio 68.32% 74.20%
For the 3 months ended March 31,

20
Looking Ahead• • • • • •

OUR FRANCHISE
21
Pennsylvania:
• Aspinwall
• Brookville
• Butler
• Clarion
• Cranberry
Township
• DuBois
• East Brady
• Eau Claire
• Emlenton
• Grove City
• Knox
• Pittsburgh
• Ridgway
• Seneca
• St. Marys
• Titusville
West Virginia:
• Chester
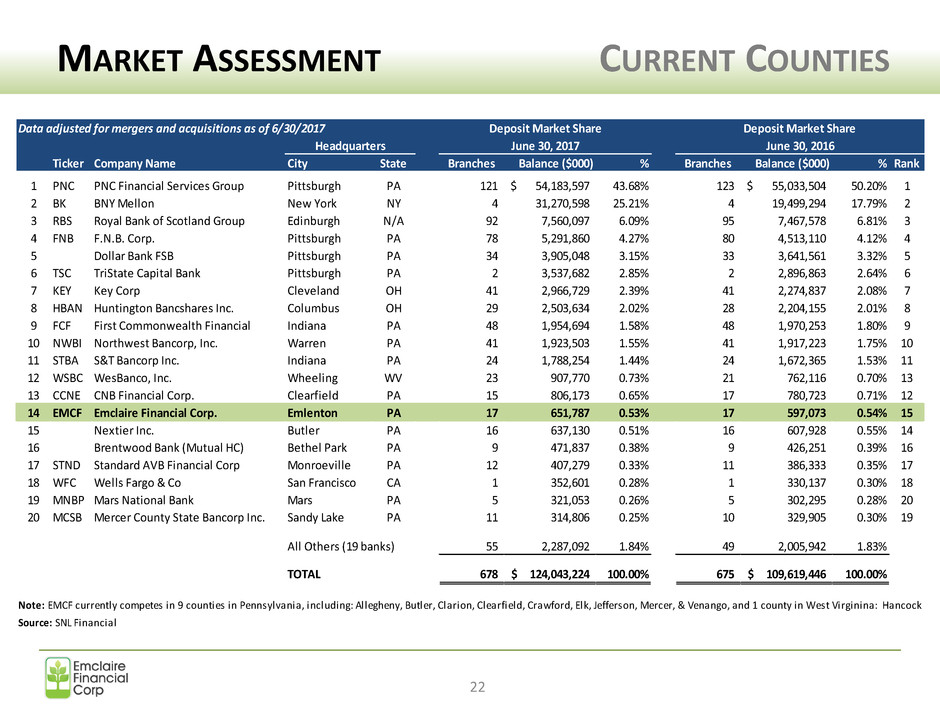
MARKET ASSESSMENT CURRENT COUNTIES
Data adjusted for mergers and acquisitions as of 6/30/2017
Ticker Company Name City State Branches Balance ($000) % Branches Balance ($000) % Rank
1 PNC PNC Financial Services Group Pittsburgh PA 121 54,183,597$ 43.68% 123 55,033,504$ 50.20% 1
2 BK BNY Mellon New York NY 4 31,270,598 25.21% 4 19,499,294 17.79% 2
3 RBS Royal Bank of Scotland Group Edinburgh N/A 92 7,560,097 6.09% 95 7,467,578 6.81% 3
4 FNB F.N.B. Corp. Pittsburgh PA 78 5,291,860 4.27% 80 4,513,110 4.12% 4
5 Dollar Bank FSB Pittsburgh PA 34 3,905,048 3.15% 33 3,641,561 3.32% 5
6 TSC TriState Capital Bank Pittsburgh PA 2 3,537,682 2.85% 2 2,896,863 2.64% 6
7 KEY Key Corp Cleveland OH 41 2,966,729 2.39% 41 2,274,837 2.08% 7
8 HBAN Huntington Bancshares Inc. Columbus OH 29 2,503,634 2.02% 28 2,204,155 2.01% 8
9 FCF First Commonwealth Financial Indiana PA 48 1,954,694 1.58% 48 1,970,253 1.80% 9
10 NWBI Northwest Bancorp, Inc. Warren PA 41 1,923,503 1.55% 41 1,917,223 1.75% 10
11 STBA S&T Bancorp Inc. Indiana PA 24 1,788,254 1.44% 24 1,672,365 1.53% 11
12 WSBC WesBanco, Inc. Wheeling WV 23 907,770 0.73% 21 762,116 0.70% 13
13 CCNE CNB Financial Corp. Clearfield PA 15 806,173 0.65% 17 780,723 0.71% 12
14 EMCF Emclaire Financial Corp. Emlenton PA 17 651,787 0.53% 17 597,073 0.54% 15
15 Nextier Inc. Butler PA 16 637,130 0.51% 16 607,928 0.55% 14
16 Brentwood Bank (Mutual HC) Bethel Park PA 9 471,837 0.38% 9 426,251 0.39% 16
17 STND Standard AVB Financial Corp Monroeville PA 12 407,279 0.33% 11 386,333 0.35% 17
18 WFC Wells Fargo & Co San Francisco CA 1 352,601 0.28% 1 330,137 0.30% 18
19 MNBP Mars National Bank Mars PA 5 321,053 0.26% 5 302,295 0.28% 20
20 MCSB Mercer County State Bancorp Inc. Sandy Lake PA 11 314,806 0.25% 10 329,905 0.30% 19
All Others (19 banks) 55 2,287,092 1.84% 49 2,005,942 1.83%
TOTAL 678 124,043,224$ 100.00% 675 109,619,446$ 100.00%
Note: EMCF currently competes in 9 counties in Pennsylvania, including: Allegheny, Butler, Clarion, Clearfield, Crawford, Elk, Jefferson, Mercer, & Venango, and 1 county in West Virginina: Hancock
Source: SNL Financial
Deposit Market Share Deposit Market Share
Headquarters June 30, 2017 June 30, 2016
22
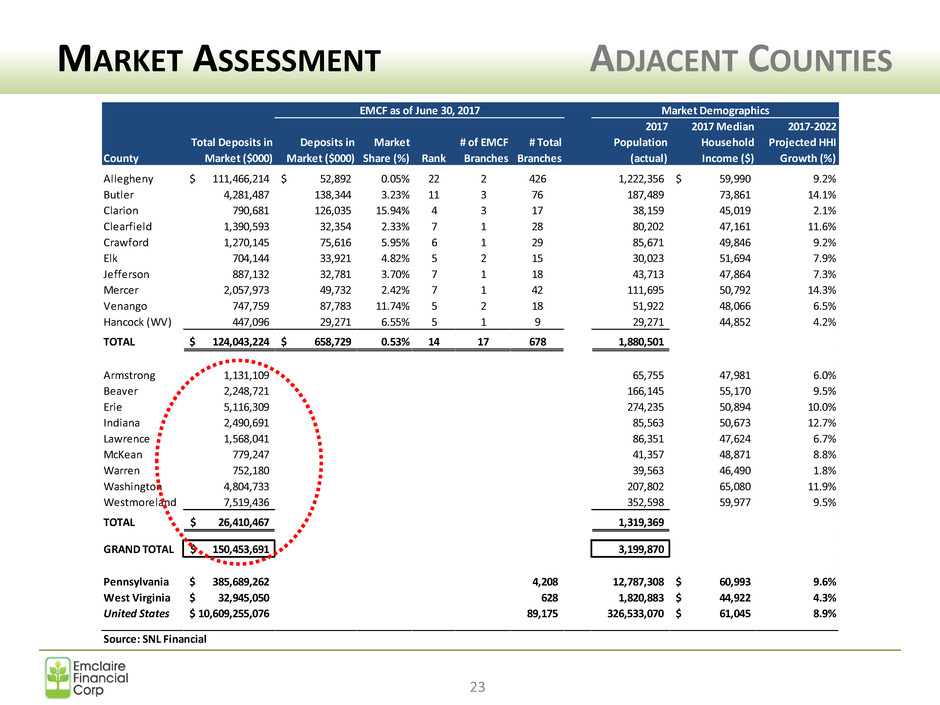
County
Allegheny 111,466,214$ 52,892$ 0.05% 22 2 426 1,222,356 59,990$ 9.2%
Butler 4,281,487 138,344 3.23% 11 3 76 187,489 73,861 14.1%
Clarion 790,681 126,035 15.94% 4 3 17 38,159 45,019 2.1%
Clearfield 1,390,593 32,354 2.33% 7 1 28 80,202 47,161 11.6%
Crawford 1,270,145 75,616 5.95% 6 1 29 85,671 49,846 9.2%
Elk 704,144 33,921 4.82% 5 2 15 30,023 51,694 7.9%
Jefferson 887,132 32,781 3.70% 7 1 18 43,713 47,864 7.3%
Mercer 2,057,973 49,732 2.42% 7 1 42 111,695 50,792 14.3%
Venango 747,759 87,783 11.74% 5 2 18 51,922 48,066 6.5%
Hancock (WV) 447,096 29,271 6.55% 5 1 9 29,271 44,852 4.2%
TOTAL 124,043,224$ 658,729$ 0.53% 14 17 678 1,880,501
Armstrong 1,131,109 65,755 47,981 6.0%
Beaver 2,248,721 166,145 55,170 9.5%
Erie 5,116,309 274,235 50,894 10.0%
Indiana 2,490,691 85,563 50,673 12.7%
Lawrence 1,568,041 86,351 47,624 6.7%
McKean 779,247 41,357 48,871 8.8%
Warren 752,180 39,563 46,490 1.8%
Washington 4,804,733 207,802 65,080 11.9%
Westmoreland 7,519,436 352,598 59,977 9.5%
TOTAL 26,410,467$ 1,319,369
GRAND TOTAL 150,453,691$ 3,199,870
Pennsylvania 385,689,262$ 4,208 12,787,308 60,993$ 9.6%
West Virginia 32,945,050$ 628 1,820,883 44,922$ 4.3%
United States 10,609,255,076$ 89,175 326,533,070 61,045$ 8.9%
Source: SNL Financial
2017
Population
(actual)
2017 Median
Household
Income ($)
2017-2022
Projected HHI
Growth (%)
Total Deposits in
Market ($000)
EMCF as of June 30, 2017 Market Demographics
Deposits in
Market ($000)
Market
Share (%) Rank
# of EMCF
Branches
# Total
Branches
MARKET ASSESSMENT ADJACENT COUNTIES
23

STRATEGY RECAP
• Corporate growth & expansion
– Expand in newly entered markets
– Continue organic growth
– Execute sensible mergers, as available
• Continue focusing on earnings growth
• Continue focusing on balance sheet growth & mix
• Maintain strong asset quality
• Optimize systems, personnel and technology
• Focus on key regulatory changes
24

STRATEGIC ELEMENTS FOR SUCCESS
25
Capital
Monitor • Protect • Achieve
Franchise
Seek • Promote • Expand
Systems and Technology
Accessible • Innovative • Secure
People
Motivate • Develop • Retain
Questions and Answers
Q&A SESSION
26
CLOSING AND THANK YOU
27
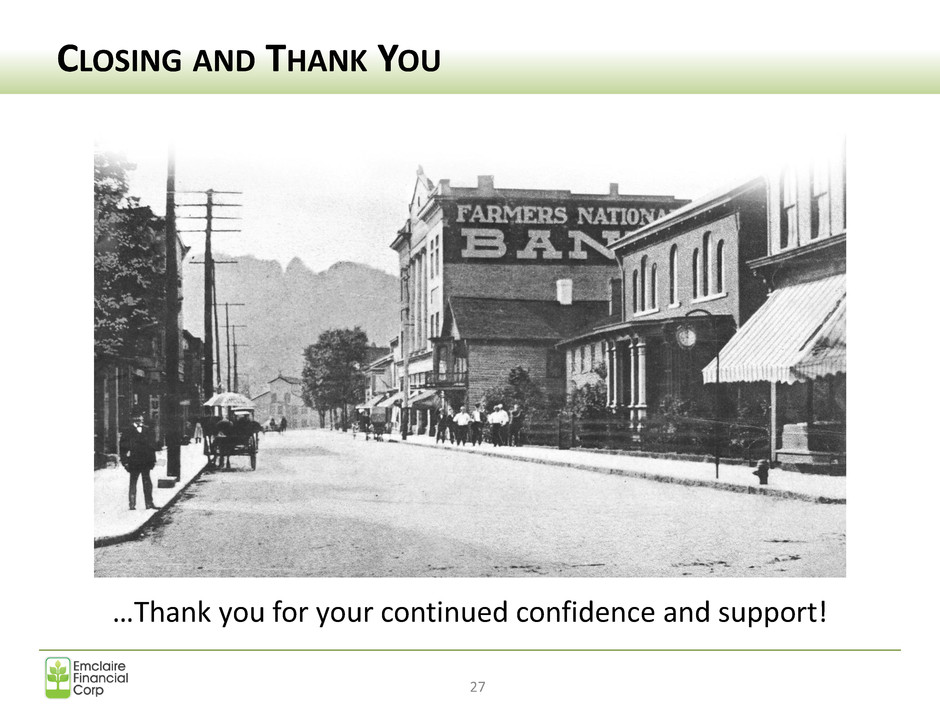
…Thank you for your continued confidence and support!

SPECIAL THANK YOU
Administrative Professionals Day
28
