Attached files
| file | filename |
|---|---|
| EX-99.1 - EXHIBIT 99.1 - SMARTFINANCIAL INC. | a33118earningsrelease-ex991.htm |
| 8-K - 8-K 033118 EARNINGS RELEASE COVER - SMARTFINANCIAL INC. | a33118earningsreleasecover.htm |

First Quarter 2018 Earnings Call
April 25, 2018

Important Information
Forward Looking Statements
This presentation contains forward-looking statements. SmartFinancial cautions you that a number of important factors could cause actual results to differ materially from
those currently anticipated in any forward-looking statement. Such factors include, but are not limited to: the expected revenue synergies and cost savings from the proposed
merger with Tennessee Bancshares, Inc. (the “Tennessee Bancshares merger”) or the recently completed merger with Capstone Bancshares, Inc. (the “Capstone merger”) may
not be fully realized or may take longer than anticipated to be realized; the disruption from either the Tennessee Bancshares merger or the Capstone merger with customers,
suppliers or employees or other business partners’ relationships; the risk of successful integration of our business with that of Tennessee Bancshares or Capstone; the amount
of costs, fees, expenses, and charges related to Tennessee Bancshares merger; risks of expansion into new geographic or product markets, like the proposed expansion into
the Nashville, TN MSA associated with the proposed Tennessee Bancshares merger; changes in management’s plans for the future, prevailing economic and political
conditions, particularly in our market area; credit risk associated with our lending activities; changes in interest rates, loan demand, real estate values and competition;
changes in accounting principles, policies, and guidelines; changes in any applicable law, rule, regulation or practice with respect to tax or legal issues; and other economic,
competitive, governmental, regulatory and technological factors affecting our operations, pricing, products and services and other factors that may be described in our
annual report on Form 10-K and quarterly reports on Form 10-Q as filed with the Securities and Exchange Commission from time to time.
The forward-looking statements are made as of the date of this presentation, and, except as may be required by applicable law or regulation, SmartFinancial assumes no
obligation to update the forward-looking statements or to update the reasons why actual results could differ from those projected in the forward-looking statements.
Non-GAAP Measures
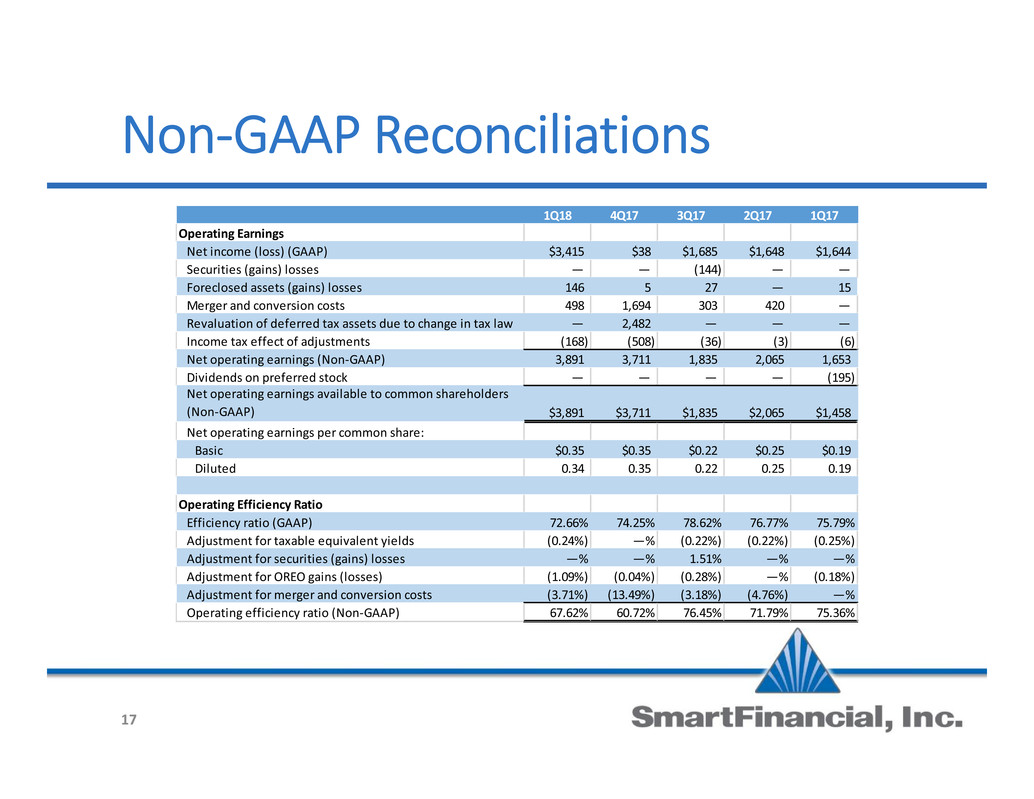
Statements included in this presentation include non-GAAP financial measures and should be read along with the accompanying tables, which provide a reconciliation of non-
GAAP financial measures to GAAP financial measures. SmartFinancial management uses several non-GAAP financial measures, including: (i) net operating earnings available
to common shareholders; (ii) operating efficiency ratio; (iii) tangible common equity, and (iv) net interest income –ex purchase accounting. adjustments in its analysis of the
company's performance. Net operating earnings available to common shareholders excludes the following from net income available to common shareholders: securities
gains and losses, merger and conversion costs, OREO gain and losses, the effect of the December, 2017 tax law change, and the income tax effect of adjustments. The
operating efficiency ratio excludes securities gains and losses, merger and conversion costs, and adjustment for OREO gains and losses from the efficiency ratio. Adjusted
allowance for loan losses adds net acquisition accounting fair value discounts to the allowance for loan losses. Tangible common equity excludes total preferred stock,
preferred stock paid in capital, goodwill, and other intangible assets. Net interest income –ex purchase accounting adjustments adds the taxable equivalent adjustment for
tax free yielding assets and removes loan purchase accounting adjustments that are above the contractual loan interest amount. Management believes that non-GAAP
financial measures provide additional useful information that allows readers to evaluate the ongoing performance of the company and provide meaningful comparisons to its
peers. Non-GAAP financial measures should not be considered as an alternative to any measure of performance or financial condition as promulgated under GAAP, and
investors should consider SmartFinancial's performance and financial condition as reported under GAAP and all other relevant information when assessing the performance
or financial condition of the company. Non-GAAP financial measures have limitations as analytical tools, and investors should not consider them in isolation or as a substitute
for analysis of the results or financial condition as reported under GAAP.
2

SMBK at-a-glance
• Core franchise in East Tennessee – SmartBank founded in 2007
• Corporate Headquarters – Knoxville, Tennessee
• 22 Branch Offices located in Knoxville, Pigeon Forge/Gatlinburg and
Chattanooga/Cleveland regions in TN; in Tuscaloosa and southern AL; and in Pensacola,
Destin and Panama City, FL.
• SmartBank is currently a $1.7B+ and expected to be approximately $2B by 2Q18, after
closing the Southern Community acquisition.
• Business Strategy
• Create a valuable Southeastern banking franchise through organic growth in strong markets coupled with an
acquisition model positioning our company as a partner of choice for banks in our region.
• Continually improve earnings and efficiency metrics as we build out our model.
• Disciplined growth strategy with a focus on strong credit metrics.
• Build a solid franchise in all of our markets focusing on strong core deposit growth.
• Create a strong, consistent culture with an environment where top performers want to work.
3

First Quarter 2018 Highlights
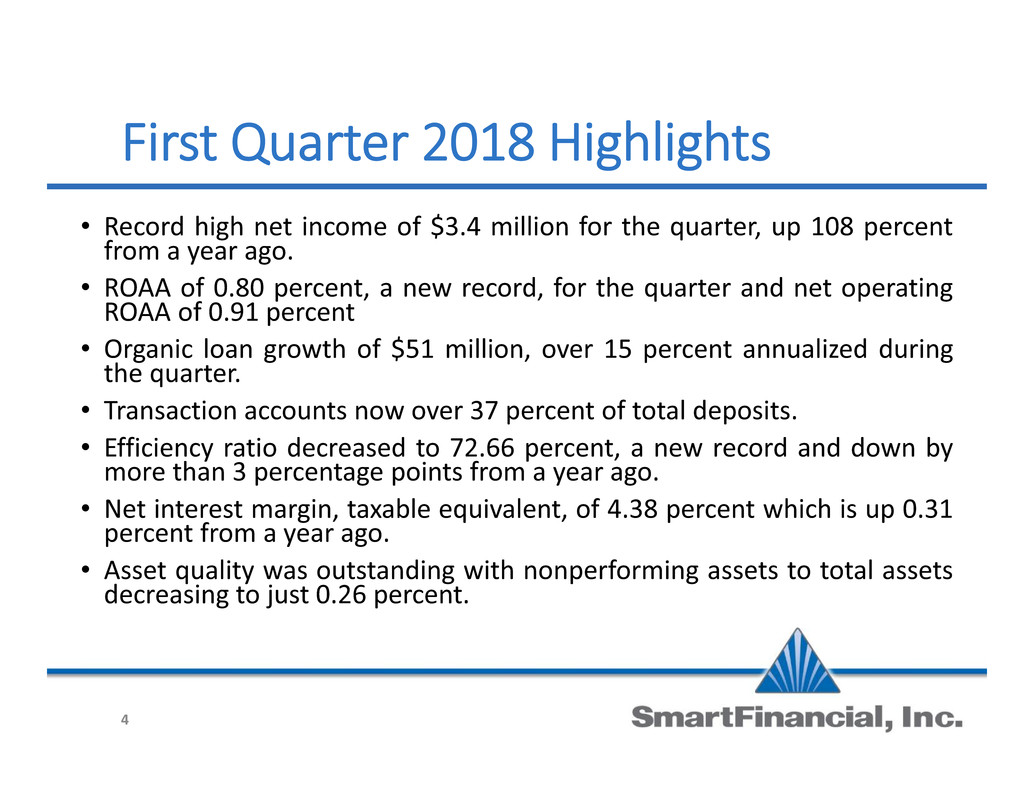
• Record high net income of $3.4 million for the quarter, up 108 percentfrom a year ago.
• ROAA of 0.80 percent, a new record, for the quarter and net operatingROAA of 0.91 percent
• Organic loan growth of $51 million, over 15 percent annualized duringthe quarter.
• Transaction accounts now over 37 percent of total deposits.
• Efficiency ratio decreased to 72.66 percent, a new record and down bymore than 3 percentage points from a year ago.
• Net interest margin, taxable equivalent, of 4.38 percent which is up 0.31percent from a year ago.
• Asset quality was outstanding with nonperforming assets to total assetsdecreasing to just 0.26 percent.
4

Summary Results
0.00%
0.25%
0.50%
0.75%
1.00%
1.25%
ROAA Net Operating ROAA
3.60%
3.70%
3.80%
3.90%
4.00%
4.10%
4.20%
Net interest income / average assets
0.00%
0.10%
0.20%
0.30%
0.40%
0.50%
Noninterest income / average assets
3.00%
3.10%
3.20%
3.30%
3.40%
Noninterest expense / average assets
5

Earnings Profile – First Quarter 2018
• EPS up over 55% year over year.
• Earnings before taxes up over 65%
year over year.
• Net interest income up over 70%
year over year primarily due higher
average earning asset balances and
higher earning asset yields.
• Increases in noninterest expense
primarily driven by salaries from the
increased headcount from three full
months of post Capstone
acquisition headcount and merger
and conversion expenses.
1Q18 4Q17 1Q17
Total interest income 19,378$ 17,244$ 10,944$
Total interest expense 2,567 1,902 1,129
Net interest income 16,811 15,342 9,815
Provision for loan losses 689 442 12
Net interest income after provision for loan losses 16,123 14,898 9,803
Total noninterest income 1,642 1,581 947
Total noninterest expense 13,409 12,566 8,160
Earnings before income taxes 4,355 3,913 2,590
Income tax expense 940 3,875 946
Net income 3,415 38 1,644
Dividends on preferred stock — — 195
Net income available to common shareholders 3,415$ 38$ 1,449$
Net income per common share
Basic $0.30 $— $0.19
Diluted $0.30 $— $0.19
Net operating earnings per common share (Non-GAAP):
Basic $0.35 $0.35 $0.19
Diluted $0.34 $0.35 $0.19
6

Net Interest Income
• Net interest margin, taxable equivalent, decreased quarter to
quarter primarily due to lower purchase accounting adjustments on
acquired loans.
• Compared to a year ago earning asset yields are up 51bps while cost
of interest bearing liabilities are up 22bps.
• Excluding the effect of purchase accounting adjustments net interest
margin, taxable equivalent, increased 0.25% quarter to quarter
1Q18 4Q17 1Q17
Loans 5.49% 5.61% 5.11%
Investment securities and interest-bearing due
from banks 2.11% 1.73% 1.70%
Federal funds and other 4.87% 4.68% 4.47%
Earning Asset Yields 5.05% 5.09% 4.54%
Total interest-bearing deposits 0.79% 0.68% 0.60%
Securities sold under agreement to repurchase 0.33% 0.30% 0.35%
Federal Home Loan Bank advances and other
borrowings 2.33% 3.90% 0.82%
Total interest-bearing liabilities 0.82% 0.70% 0.60%
Net interest margin 4.38% 4.52% 4.07%
Cost of Funds 0.68% 0.59% 0.50%
Average Yields and Rates
3.50%
3.75%
4.00%
4.25%
4.50%
4.75%
1Q17 2Q17 3Q17 4Q17 1Q18
Net Interest Margin
Net interest margin, TEY
Net interest margin, TEY- ex purchase acct. adj
1Q18 4Q17 1Q17
Net interest income 16,811$ 15,341$ 9,815$
Average Earning Assets 1,558,516 1,317,719 979,535
7

Noninterest Income
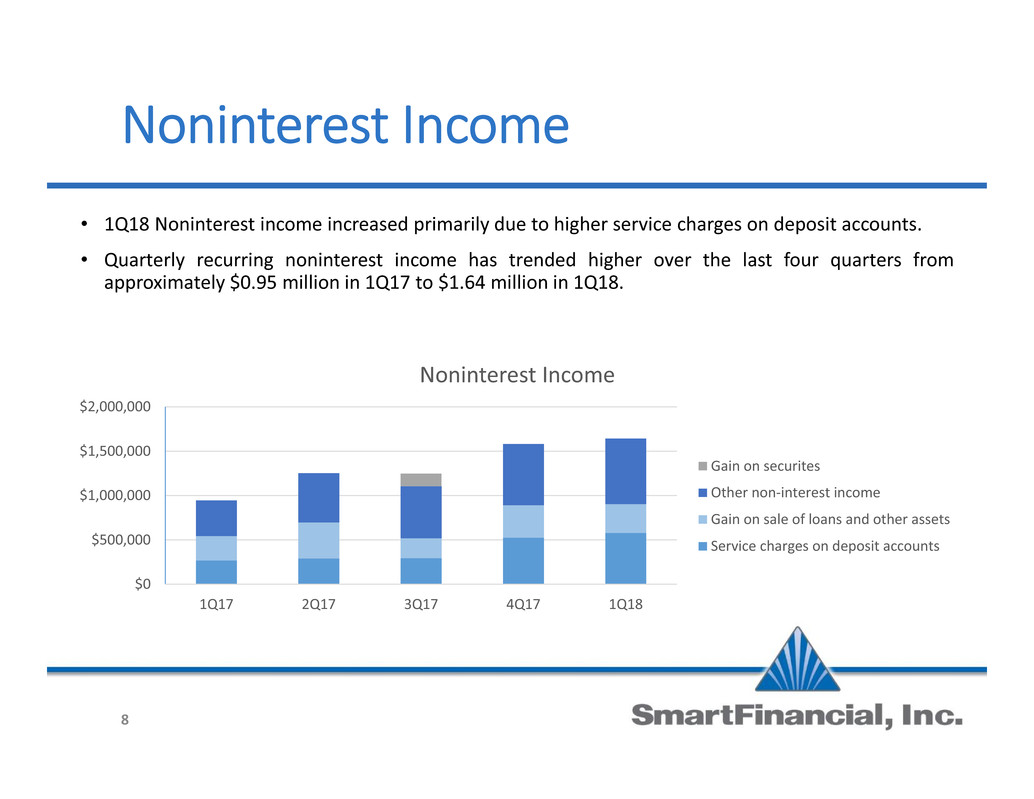
• 1Q18 Noninterest income increased primarily due to higher service charges on deposit accounts.
• Quarterly recurring noninterest income has trended higher over the last four quarters from
approximately $0.95 million in 1Q17 to $1.64 million in 1Q18.
$0
$500,000
$1,000,000
$1,500,000
$2,000,000
1Q17 2Q17 3Q17 4Q17 1Q18
Noninterest Income
Gain on securites
Other non-interest income
Gain on sale of loans and other assets
Service charges on deposit accounts
8

Noninterest Expense
• Efficiency ratio dropped to 72.66%, the lowest of any quarter since the Cornerstone merger in 2015.
• Salary increases are primarily due three months of Alabama associates vs. two in the prior quarter.
• Data processing slightly elevated due to operating two core systems for half of the quarter.
68.0%
70.0%
72.0%
74.0%
76.0%
78.0%
80.0%
$0
$5,000,000
$10,000,000
$15,000,000
1Q17 2Q17 3Q17 4Q17 1Q18
Noninterest Expense
Merger Expense
Other
Amortization of Intangibles
Data Processing
Occupancy
Salaries & Benefits
Efficiency Ratio
9

Balance Sheet
• Assets increased primarily due to organic loan
growth.
• Cash & cash equivalents drawn down to fund
loans.
• Securities held fairly flat to allocate funds to
loans.
• Deposit composition shifted to DDAs as a result
of conversion related reclassifications and
organic growth.
• FHLB & other borrowings includes $10 million
in holding company line of credit, with the
remaining balance in short term FHLB
borrowings.
1Q18 4Q17 1Q17
Cash & cash equivalents 96,710$ 113,027$ 55,548$
Securities available for sale 156,210 151,945 137,133
Other investments 7,808 6,431 5,628
Total loans 1,374,257 1,323,258 807,539
Allowance for loan losses (6,477) (5,860) (5,152)
Premises and equipment 44,202 43,000 30,802
Foreclosed assets 2,665 3,254 2,371
Goodwill and other intangibles 50,660 50,837 6,583
Cash surrender value of life insurance 21,797 21,647 1,329
Other assets 12,593 13,232 9,305
Total assets 1,760,425$ 1,720,771$ 1,051,086$
Non-interest demand 276,249$ 220,520$ 160,673$
Interest-bearing demand 278,965 231,644 167,433
Money market and savings 491,243 543,645 274,994
Time deposits 453,276 442,774 286,600
Total deposits 1,499,733 1,438,583 889,700
Repurchase agreements 15,968 24,055 23,153
FHLB & other borrowings 30,000 43,600 60
Other liabilities 5,775 8,681 5,622
Total liabilities 1,551,476$ 1,514,919$ 918,535$
Total shareholders' equity 208,949$ 205,852$ 132,551$
Total liabilities & shareholders' equity 1,760,425$ 1,720,770$ 1,051,086$
10

Loan Portfolio
• Loan balance increases due to strong organic growth, over 15% annualized.
• Loan composition shifted slightly with of C&I increasing 1%, with an equivalent decrease in non-
owner occupied CRE.
$0
$200,000
$400,000
$600,000
$800,000
$1,000,000
$1,200,000
$1,400,000
$1,600,000
1Q17 2Q17 3Q17 4Q17 1Q18
Portfolio Composition
Other
Consumer RE
CRE, non-owner occupied
CRE, owner occupied
C&D
C&I
11

CRE Ratios
• C&D levels still well below regulatory guidance levels.
• 300 ratio up slightly as a result of taking advantage of attractive growth opportunities.
50.00%
75.00%
100.00%
125.00%
150.00%
Q4
20
14
Q1
20
15
Q2
20
15
Q3
20
15
Q4
20
15
Q1
20
16
Q2
20
16
Q3
20
16
Q4
20
16
Q1
20
17
Q2
20
17
Q3
20
17
Q4
20
17
Q1
20
18
100 Ratio
12
200.00%
250.00%
300.00%
350.00%
400.00%
Q4
20
14
Q1
20
15
Q2
20
15
Q3
20
15
Q4
20
15
Q1
20
16
Q2
20
16
Q3
20
16
Q4
20
16
Q1
20
17
Q2
20
17
Q3
20
17
Q4
20
17
Q1
20
18
300 Ratio

Asset Quality
• Excellent asset quality with nonperforming assets at just 0.26% of total assets.
• Purchase accounting discounts on acquired loans are over 2.5x current Allowance.
0.10%
0.30%
0.50%
0.70%
$0
$1,000
$2,000
$3,000
$4,000
$5,000
1Q17 2Q17 3Q17 4Q17 1Q18
Nonperforming Assets
Foreclosed assets
Nonperforming loans
Nonperforming assets to total assets
13
0.30%
0.40%
0.50%
0.60%
0.70%
0.80%
0.90%
$0
$4,000
$8,000
$12,000
$16,000
$20,000
1Q17 2Q17 3Q17 4Q18 1Q18
Loan Discounts
Allowance for loan losses (GAAP)
Net acquisition accounting fair value discounts to loans
Allowance for loan losses to loans

Deposits
• Well diversified deposit mix with growth of money market, savings, and noninterest demand
replacing mostly wholesale time deposits.
• About 30% of the growth in DDAs was organic, 70% being conversion related reclassifcations
• Cost of funds up just 18bps while Fed Funds has increased 75bps over the last year.
0.40%
0.60%
0.80%
1.00%
1.20%
1.40%
1.60%
$0
$200,000
$400,000
$600,000
$800,000
$1,000,000
$1,200,000
$1,400,000
$1,600,000
1Q17 2Q17 3Q17 4Q17 1Q18
Deposit Composition
Time deposits
Money market and savings
Interest-bearing demand
Noninterest demand
Cost of Funds
Fed Funds Target
14

Conclusions
• Record high net income of $3.4 million for the quarter, up 108 percent from a year ago.
• ROAA of 0.80 percent, a new record, for the quarter and net operating ROAA of 0.91 percent
• Organic loan growth of $51 million, over 15 percent annualized during the quarter.
• Transaction accounts are over 37 percent of total deposits.
• Efficiency ratio decreased to 72.66 percent, a new record and down by more than 3percentage points from a year ago.
• Net interest margin, taxable equivalent, of 4.38 percent which is up 0.31 percent from a yearago.
• Asset quality was outstanding with nonperforming assets to total assets decreasing to just0.26 percent.
• Tennessee Bancshares acquisition closing second quarter.
• SMBK continues focus on long-term shareholder value by:
• Building the foundation for organic growth and profitability.
• Exploring expansion to strategic markets.
• Q&A
15

Non-GAAP Reconciliations
1Q18 4Q17 3Q17 2Q17 1Q17
Net interest income -ex purchase acct. adj.
Net interest income (GAAP) 16,811$ 15,341$ 10,924$ 10,249$ 9,815$
Taxable equivalent adjustment 32 16 22 21 21
Net interest income TEY (Non-GAAP) 16,823 $15,357 $10,946 10,270 $9,836
Purchase accounting adjustments 1,274 2,411 888 696 540
Net interest income -ex purchase acct. adj. (Non-GAAP) 15,549$ 12,947$ 10,058$ 9,574$ 9,296$
Loan Discount Data
Allowance for loan losses (GAAP) 6,477$ 5,860$ 5,498$ 5,393$ 5,152$
Net acquisition accounting fair value discounts to loans 16,323 17,862 9,086 8,167 9,831
Tangible Common Equity
Shareholders' equity (GAAP) 208,949$ 205,852$ 136,588$ 134,734$ 132,551$
Less goodwill and other intangible assets 50,660 50,837 7,414 7,492 6,583
Tangible common equity (Non-GAAP) 158,289$ 155,015$ 129,174$ 127,242$ 125,968$
16

Non-GAAP Reconciliations
1Q18 4Q17 3Q17 2Q17 1Q17
Operating Earnings
Net income (loss) (GAAP) $3,415 $38 $1,685 $1,648 $1,644
Securities (gains) losses — — (144) — —
Foreclosed assets (gains) losses 146 5 27 — 15
Merger and conversion costs 498 1,694 303 420 —
Revaluation of deferred tax assets due to change in tax law — 2,482 — — —
Income tax effect of adjustments (168) (508) (36) (3) (6)
Net operating earnings (Non-GAAP) 3,891 3,711 1,835 2,065 1,653
Dividends on preferred stock — — — — (195)
Net operating earnings available to common shareholders
(Non-GAAP) $3,891 $3,711 $1,835 $2,065 $1,458
Net operating earnings per common share:
Basic $0.35 $0.35 $0.22 $0.25 $0.19
Diluted 0.34 0.35 0.22 0.25 0.19
Operating Efficiency Ratio
Efficiency ratio (GAAP) 72.66% 74.25% 78.62% 76.77% 75.79%
Adjustment for taxable equivalent yields (0.24%) —% (0.22%) (0.22%) (0.25%)
Adjustment for securities (gains) losses —% —% 1.51% —% —%
Adjustment for OREO gains (losses) (1.09%) (0.04%) (0.28%) —% (0.18%)
Adjustment for merger and conversion costs (3.71%) (13.49%) (3.18%) (4.76%) —%
Operating efficiency ratio (Non-GAAP) 67.62% 60.72% 76.45% 71.79% 75.36%
17

First Quarter 2018
18
Supplemental Information

Loan & Deposit Composition 1Q18
C&I
19%
C&D
10%
CRE,
owner
occupied
21%
CRE, non-
owner
occupied
27%
Consumer
RE
22%
Other
1%
Loans
Noninterest
demand
15%
Interest-
bearing
demand
19%
Money market
and savings
33%
Time
deposits
30%
Deposits
19

Loan Composition History
C&I 256,333$ 238,690$ 119,782$ 105,129$ 90,649$
C&D 142,702 135,409 98,212 101,151 115,675
CRE, owner occupied 288,666 281,297 210,489 211,469 197,032
CRE, non-owner occupied 375,028 361,536 237,131 233,707 210,901
Consumer RE 299,148 292,795 199,704 206,667 186,344
Other 12,380 13,555 6,361 7,298 6,938
Total Loans, gross 1,374,257$ 1,323,283$ 871,679$ 865,421$ 807,539$
20

Deposit Composition History
1Q18 4Q17 3Q17 2Q17 1Q17
Deposits
Noninterest demand 276,249$ 220,520$ 185,386$ 183,324$ 160,673$
Interest-bearing demand 278,965 231,643 156,953 156,150 167,433
Money market and savings 491,243 543,645 306,358 324,014 274,994
Time deposits 453,276 442,774 311,490 318,147 286,600
Total Deposits 1,499,733$ 1,438,582$ 960,187$ 981,635$ 889,700$
21

Management Team
22
Billy Carroll
President & CEO
Miller Welborn
Chairman of the Board
C. Bryan Johnson
Chief Financial Officer
Rhett Jordan
Chief Credit Officer
Gary Petty
Chief Risk Officer
Greg Davis
Chief Lending Officer
