Attached files
| file | filename |
|---|---|
| 8-K - 8-K EARNINGS RELEASE APRIL 23, 2018 - SUN COMMUNITIES INC | form8-kearningsreleaseq120.htm |
Table of Contents
Summary - Earnings Press Release | i - v |
Investor Information | |
Portfolio Overview | |
Financial Information | |
Balance Sheets | |
Statements of Operations | |
Outstanding Securities and Capitalization | |
Reconciliations to Non-GAAP Financial Measures | |
Reconciliation of Net Income to Funds from Operations | |
Reconciliation of Net Income to Recurring EBITDA | |
Reconciliation of Net Income to Net Operating Income | |
Non-GAAP and Other Financial Measures | |
Financial and Operating Highlights | |
Debt Analysis | |
Selected Financial Information | |
Statements of Operations – Same Community | |
Rental Program Summary | |
Home Sales Summary | |
Acquisitions and Other Summary | |
Other Information | |
Property Summary | 17 - 18 |
Capital Improvements, Development, and Acquisitions | |
Operating Statistics for Manufactured Homes and Annual RV’s | |
Footnotes and Definitions | 21 - 23 |

NEWS RELEASE
April 23, 2018
Sun Communities, Inc. Reports 2018 First Quarter Results
Southfield, Michigan, April 23, 2018 – Sun Communities, Inc. (NYSE: SUI) (the “Company”), a real estate investment trust (“REIT”) that owns and operates, or has an interest in, manufactured housing (“MH”) and recreational vehicle (“RV”) communities, today reported its first quarter results for 2018.
Financial Results for the Three Months Ended March 31, 2018
For the three months ended March 31, 2018, total revenues increased $23.5 million, or 10.0 percent, to $257.9 million compared to $234.4 million for the same period in 2017. Net income attributable to common stockholders was $30.0 million, or $0.38 per diluted common share, for the three months ended March 31, 2018, as compared to net income attributable to common stockholders of $21.1 million, or $0.29 net income per diluted common share, for the same period in 2017.
Non-GAAP Financial Measures and Portfolio Performance
• | Core Funds from Operations (“Core FFO”)(1) for the three months ended March 31, 2018, was $1.14 per diluted share and OP unit (“Share”) as compared to $1.10 in the prior year, an increase of 3.6 percent. |
• | Same Community(2) Net Operating Income (“NOI”)(1) increased by 5.3 percent for the three months ended March 31, 2018, as compared to the same period in 2017. |
• | Recurring EBITDA(1) increased by 8.0 percent for the three months ended March 31, 2018, as compared to the same period in 2017. |
• | Home sales volumes increased 1.3 percent for the three months ended March 31, 2018, as compared to the same period in 2017. New home sales volumes increased 39.5 percent to 106 for the three months ended March 31, 2018, as compared to 76 in the same period in 2017. |
• | Revenue producing sites increased by 616 sites for the three months ended March 31, 2018, as compared to a 687 site increase in the same period in 2017. |
“Our positive results in the first quarter of 2018 were driven by solid occupancy gains, strong home sales and rentals, and a robust winter RV season,” said Gary A. Shiffman, Chairman and Chief Executive Officer. “Our continued revenue growth underscores the ongoing demand for Sun’s communities. Furthermore, we delivered 246 new expansion sites in the quarter, which should contribute to our growth as they become revenue producing sites over time. Finally, our well positioned balance sheet supports an active pipeline of acquisition opportunities as we continue to pursue single asset and small portfolio investments. These combined elements are essential to Sun’s ability to generate superior total shareholder return over time.”
i
OPERATING HIGHLIGHTS
Community Occupancy
Total portfolio occupancy was 95.8 percent at March 31, 2018, compared to 95.9 percent at March 31, 2017. The slight decline in occupancy was primarily attributable to recently completed but vacant MH expansion sites.
During the three months ended March 31, 2018, revenue producing sites increased by 616 sites, as compared to a 687 revenue producing site increase during the first quarter of 2017.
Same Community(2) Results
For the 336 stabilized communities owned and operated by the Company since January 1, 2017, NOI(1) for the three months ended March 31, 2018 increased 5.3 percent over the same period in 2017, as a result of a 5.7 percent increase in revenues and a 6.6 percent increase in operating expenses. Operating expenses during the quarter increased primarily due to higher than expected insurance and utility expenses. Same Community occupancy(3) increased to 97.6 percent at March 31, 2018 from 95.4 percent at March 31, 2017.
Home Sales
During the three months ended March 31, 2018, the Company sold 837 homes as compared to 826 homes sold during the same period in 2017, a 1.3 percent increase.
Rental homes sales, which are included in total home sales, were 234 and 240 for the three months ended March 31, 2018 and 2017, respectively.
ii
BALANCE SHEET AND CAPITAL MARKETS ACTIVITY
Debt Transactions
During the quarter ended March 31, 2018, the Company repaid four collateralized term loans totaling $24.4 million with a weighted average interest rate of 6.36 percent, releasing three encumbered communities. The loans were due to mature in March 2019.
As of March 31, 2018, the Company had $3.1 billion of debt outstanding. The weighted average interest rate was 4.45 percent and the weighted average maturity was 8.5 years. The Company had $15.2 million of unrestricted cash on hand. At period-end the Company’s net debt to trailing twelve month Recurring EBITDA(1) ratio was 6.2 times.
Equity Transactions
After quarter end, the Company issued 220,000 shares of common stock through its At-the-Market equity sales program at a weighted average price of $91.31 per share. Net proceeds from the sales were $19.8 million.
2018 Distributions
As previously announced, the Company increased its annual distribution by 6.0 percent to $2.84 per common share from $2.68 per common share. The increase began with the distribution declared in March 2018 that was paid after quarter end.
GUIDANCE 2018
The Company affirms full year 2018 net income per diluted share to be in the range of $1.26 to $1.42 and Core FFO(1) per Share to be in the range of $4.48 to $4.58. The Company anticipates second quarter 2018 net income per diluted share to be in the range of $0.24 to $0.28 and Core FFO(1) per Share to be in the range of $1.03 to $1.06.
The Company is adjusting its 2018 Same Community NOI(1) growth guidance for the year by 25 basis points to 6.75 percent to 7.25 percent from the prior range of 7.0 percent to 7.5 percent. Guidance does not include prospective acquisitions or capital markets activity.
Core FFO(1) per Share estimates assume certain gain and loss items that management considers unrelated to the operational and financial performance of our core business will be adjusted from FFO(1). The estimates and assumptions presented above represent a range of possible outcomes and may differ materially from actual results. The estimates and assumptions are forward looking based on the Company’s current assessment of economic and market conditions, as well as other risks outlined below under the caption “Forward-Looking Statements.”
iii
EARNINGS CONFERENCE CALL
A conference call to discuss first quarter operating results will be held on Tuesday, April 24, 2018 at 1:00 P.M. (ET). To participate, call toll-free 877-407-9039. Callers outside the U.S. or Canada can access the call at 201-689-8470. A replay will be available following the call through May 8, 2018 and can be accessed toll-free by calling 844-512-2921 or 412-317-6671. The Conference ID number for the call and the replay is 13677309. The conference call will be available live on Sun Communities’ website www.suncommunities.com. Replay will also be available on the website.
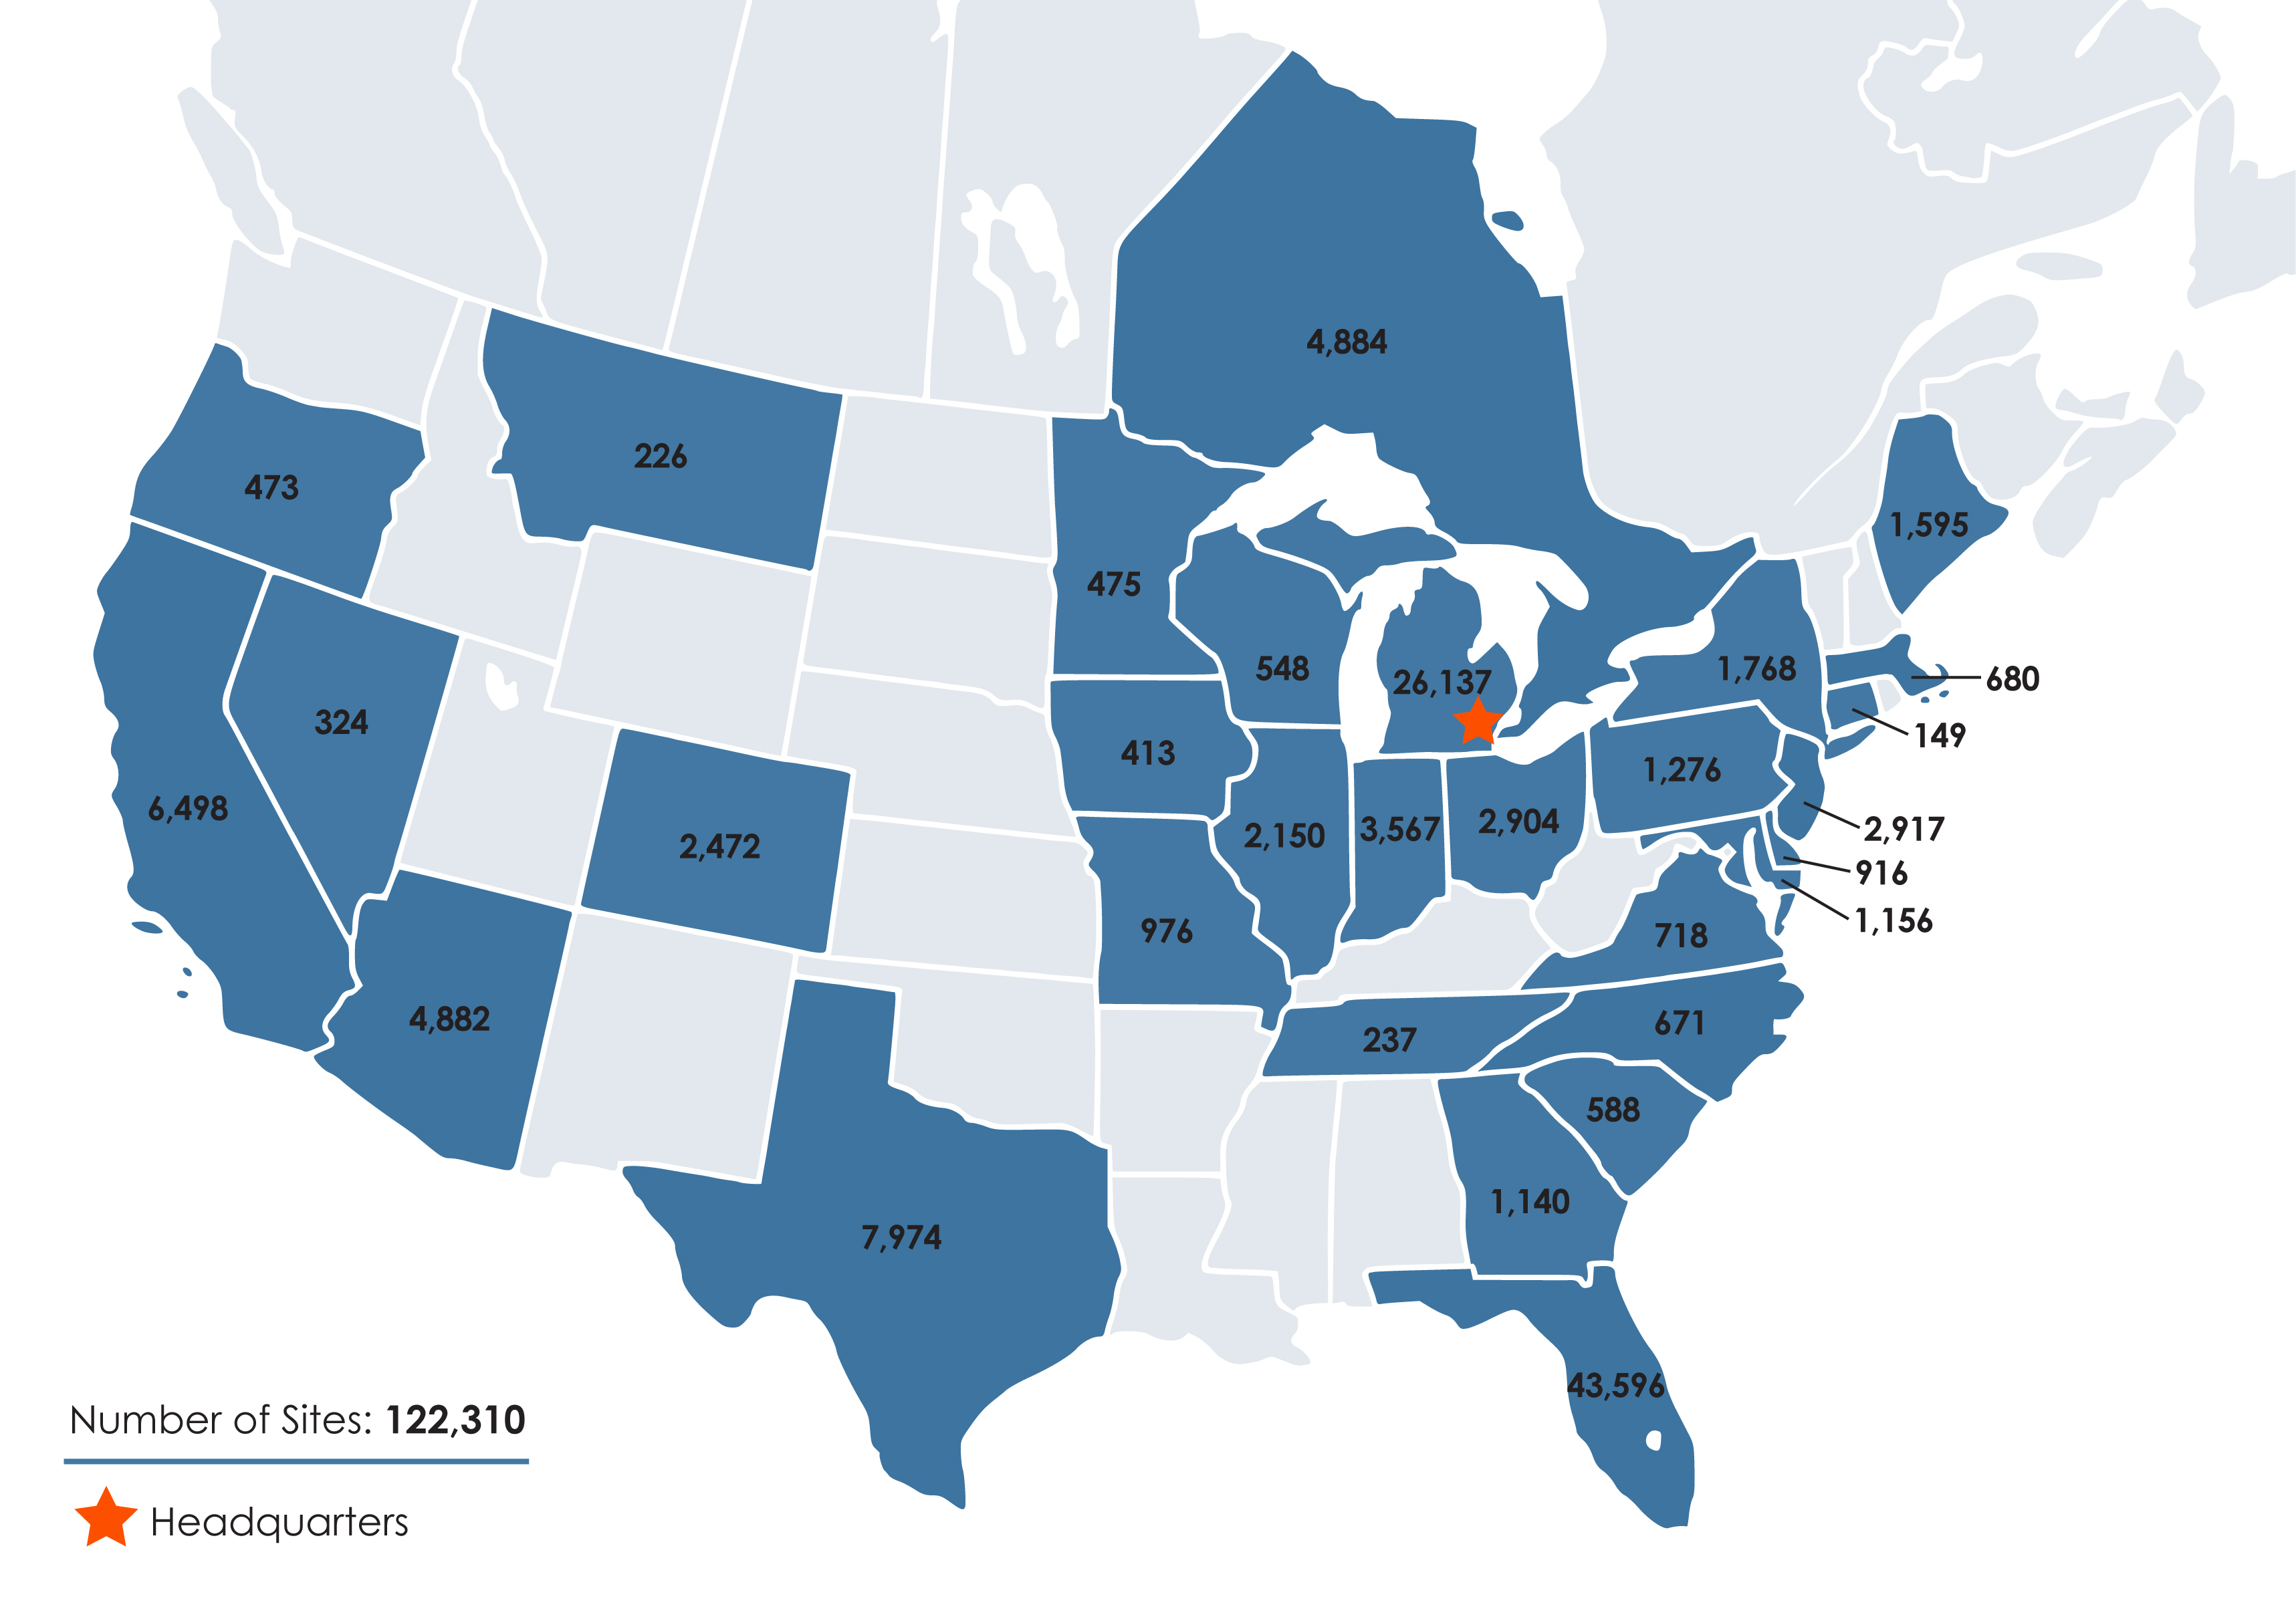
Sun Communities, Inc. is a REIT that, as of March 31, 2018, owned, operated, or had an interest in a portfolio of 350 communities comprising approximately 122,000 developed sites in 29 states and Ontario, Canada.
For more information about Sun Communities, Inc., please visit www.suncommunities.com.
CONTACT
Please address all inquiries to our investor relations department at our website www.suncommunities.com, by phone (248) 208-2500, by email investorrelations@suncommunities.com or by mail Sun Communities, Inc. Attn: Investor Relations, 27777 Franklin Road, Ste. 200, Southfield, MI 48034.
iv
Forward-Looking Statements
This press release contains various “forward-looking statements” within the meaning of the Securities Act of 1933, as amended, and the Securities Exchange Act of 1934, as amended, and the Company intends that such forward-looking statements will be subject to the safe harbors created thereby. Forward-looking statements can be identified by words such as “will,” “may,” “could,” “expect,” “anticipate,” “believes,” “intends,” “should,” “plans,” “estimates,” “approximate,” “guidance,” and similar expressions in this press release that predict or indicate future events and trends and that do not report historical matters.
These forward-looking statements reflect the Company’s current views with respect to future events and financial performance, but involve known and unknown risks, uncertainties, and other factors, some of which are beyond the Company’s control. These risks, uncertainties, and other factors may cause the actual results of the Company to be materially different from any future results expressed or implied by such forward-looking statements. Such risks and uncertainties include national, regional and local economic climates, the ability to maintain rental rates and occupancy levels, competitive market forces, the performance of recent acquisitions, the ability to integrate future acquisitions smoothly and efficiently, changes in market rates of interest, changes in foreign currency exchange rates, the ability of manufactured home buyers to obtain financing and the level of repossessions by manufactured home lenders. Further details of potential risks that may affect the Company are described in its periodic reports filed with the U.S. Securities and Exchange Commission, including in the “Risk Factors” section of the Company’s Annual Report on Form 10-K.
The forward-looking statements contained in this press release speak only as of the date hereof and the Company expressly disclaims any obligation to provide public updates, revisions or amendments to any forward-looking statements made herein to reflect changes in the Company’s assumptions, expectations of future events, or trends.
v
Investor Information
RESEARCH COVERAGE | ||||||
Firm | Analyst | Phone | Email | |||
Bank of America Merrill Lynch | Joshua Dennerlein | (646) 855-1681 | joshua.dennerlein@baml.com | |||
BMO Capital Markets | John Kim | (212) 885-4115 | johnp.kim@bmo.com | |||
Citi Research | Michael Bilerman | (212) 816-1383 | michael.bilerman@citi.com | |||
Nicholas Joseph | (212) 816-1909 | nicholas.joseph@citi.com | ||||
Evercore ISI | Steve Sakwa | (212) 446-9462 | steve.sakwa@evercoreisi.com | |||
Samir Khanal | (212) 888-3796 | samir.khanal@evercoreisi.com | ||||
Green Street Advisors | John Pawlowski | (949) 640-8780 | jpawlowski@greenstreetadvisors.com | |||
Ryan Lumb | (949) 640-8780 | rlumb@greenstreetadvisors.com | ||||
RBC Capital Markets | Wes Golladay | (440) 715-2650 | wes.golladay@rbccm.com | |||
Robert W. Baird & Co. | Drew Babin | (610) 238-6634 | dbabin@rwbaird.com | |||
Wells Fargo | Todd Stender | (562) 637-1371 | todd.stender@wellsfargo.com | |||
INQUIRIES | ||||||
Sun Communities welcomes questions or comments from stockholders, analysts, investment managers, media, or any prospective investor. Please address all inquiries to our Investor Relations department. | ||||||
At Our Website | www.suncommunities.com | |||||
By Email | investorrelations@suncommunities.com | |||||
By Phone | (248) 208-2500 | |||||
1st Quarter 2018 Supplemental Information 1 Sun Communities, Inc.
Portfolio Overview
(As of March 31, 2018)
1st Quarter 2018 Supplemental Information 2 Sun Communities, Inc.
Balance Sheets
(amounts in thousands)
3/31/2018 | 12/31/2017 | |||||||
ASSETS: | ||||||||
Land | $ | 1,114,609 | $ | 1,107,838 | ||||
Land improvements and buildings | 5,128,186 | 5,102,014 | ||||||
Rental homes and improvements | 538,672 | 528,074 | ||||||
Furniture, fixtures and equipment | 148,197 | 144,953 | ||||||
Investment property | 6,929,664 | 6,882,879 | ||||||
Accumulated depreciation | (1,287,010 | ) | (1,237,525 | ) | ||||
Investment property, net | 5,642,654 | 5,645,354 | ||||||
Cash and cash equivalents | 15,153 | 10,127 | ||||||
Inventory of manufactured homes | 36,311 | 30,430 | ||||||
Notes and other receivables, net | 193,851 | 163,496 | ||||||
Collateralized receivables, net (4) | 123,155 | 128,246 | ||||||
Other assets, net | 138,529 | 134,304 | ||||||
Total assets | $ | 6,149,653 | $ | 6,111,957 | ||||
LIABILITIES: | ||||||||
Mortgage loans payable | $ | 2,826,225 | $ | 2,867,356 | ||||
Secured borrowings (4) | 124,077 | 129,182 | ||||||
Preferred OP units - mandatorily redeemable | 37,338 | 41,443 | ||||||
Lines of credit | 141,800 | 41,257 | ||||||
Distributions payable | 58,663 | 55,225 | ||||||
Other liabilities | 282,993 | 270,741 | ||||||
Total liabilities | 3,471,096 | 3,405,204 | ||||||
Series A-4 preferred stock | 32,414 | 32,414 | ||||||
Series A-4 preferred OP units | 10,492 | 10,652 | ||||||
STOCKHOLDERS' EQUITY: | ||||||||
Common stock | 799 | 797 | ||||||
Additional paid-in capital | 3,759,066 | 3,758,533 | ||||||
Accumulated other comprehensive (loss) / income | (670 | ) | 1,102 | |||||
Distributions in excess of accumulated earnings | (1,187,563 | ) | (1,162,001 | ) | ||||
Total SUI stockholder's equity | 2,571,632 | 2,598,431 | ||||||
Noncontrolling interests: | ||||||||
Common and preferred OP units | 59,268 | 60,971 | ||||||
Consolidated variable interest entities | 4,751 | 4,285 | ||||||
Total noncontrolling interest | 64,019 | 65,256 | ||||||
Total stockholders' equity | 2,635,651 | 2,663,687 | ||||||
Total liabilities & stockholders' equity | $ | 6,149,653 | $ | 6,111,957 | ||||
1st Quarter 2018 Supplemental Information 3 Sun Communities, Inc.
Statements of Operations - Quarter to Date Comparison
(amounts in thousands, except per share amounts)
Three Months Ended March 31, | ||||||||||||||
2018 | 2017 | Change | % Change | |||||||||||
REVENUES: | ||||||||||||||
Income from real property (excluding transient revenue) | $ | 175,210 | $ | 161,876 | $ | 13,334 | 8.2 | % | ||||||
Transient revenue | 22,001 | 21,178 | 823 | 3.9 | % | |||||||||
Revenue from home sales | 34,900 | 27,263 | 7,637 | 28.0 | % | |||||||||
Rental home revenue | 13,020 | 12,339 | 681 | 5.5 | % | |||||||||
Ancillary revenues | 6,568 | 6,219 | 349 | 5.6 | % | |||||||||
Interest | 5,316 | 4,646 | 670 | 14.4 | % | |||||||||
Brokerage commissions and other revenues, net | 901 | 879 | 22 | 2.5 | % | |||||||||
Total revenues | 257,916 | 234,400 | 23,516 | 10.0 | % | |||||||||
EXPENSES: | ||||||||||||||
Property operating and maintenance | 51,630 | 47,166 | 4,464 | 9.5 | % | |||||||||
Real estate taxes | 13,836 | 13,143 | 693 | 5.3 | % | |||||||||
Cost of home sales | 26,571 | 20,883 | 5,688 | 27.2 | % | |||||||||
Rental home operating and maintenance | 5,170 | 5,102 | 68 | 1.3 | % | |||||||||
Ancillary expenses | 5,266 | 4,668 | 598 | 12.8 | % | |||||||||
Home selling expenses | 3,290 | 3,111 | 179 | 5.8 | % | |||||||||
General and administrative | 19,931 | 17,932 | 1,999 | 11.1 | % | |||||||||
Transaction costs (5) | — | 2,386 | (2,386 | ) | 100.0 | % | ||||||||
Catastrophic weather related charges, net | (2,213 | ) | 87 | (2,300 | ) | (2,643.7 | )% | |||||||
Depreciation and amortization | 66,437 | 62,766 | 3,671 | 5.8 | % | |||||||||
Loss on extinguishment of debt | 196 | 466 | (270 | ) | (57.9 | )% | ||||||||
Interest | 31,138 | 31,322 | (184 | ) | (0.6 | )% | ||||||||
Interest on mandatorily redeemable preferred OP units | 619 | 784 | (165 | ) | (21.0 | )% | ||||||||
Total expenses | 221,871 | 209,816 | 12,055 | 5.7 | % | |||||||||
Income before other items | 36,045 | 24,584 | 11,461 | 46.6 | % | |||||||||
Other (expense) / income, net (6) | (2,617 | ) | 839 | (3,456 | ) | (411.9 | )% | |||||||
Current tax expense | (174 | ) | (178 | ) | 4 | 2.2 | % | |||||||
Deferred tax benefit | 347 | 300 | 47 | 15.7 | % | |||||||||
Net income | 33,601 | 25,545 | 8,056 | 31.5 | % | |||||||||
Less: Preferred return to preferred OP units | (1,080 | ) | (1,174 | ) | 94 | (8.0 | )% | |||||||
Less: Amounts attributable to noncontrolling interests | (2,094 | ) | (1,088 | ) | (1,006 | ) | 92.5 | % | ||||||
Less: Preferred stock distribution | (441 | ) | (2,179 | ) | 1,738 | (79.8 | )% | |||||||
NET INCOME ATTRIBUTABLE TO SUI | $ | 29,986 | $ | 21,104 | $ | 8,882 | 42.1 | % | ||||||
Weighted average common shares outstanding: | ||||||||||||||
Basic | 78,855 | 72,677 | 6,178 | 8.5 | % | |||||||||
Diluted | 79,464 | 73,120 | 6,344 | 8.7 | % | |||||||||
Earnings per share: | ||||||||||||||
Basic | $ | 0.38 | $ | 0.29 | $ | 0.09 | 31.0 | % | ||||||
Diluted | $ | 0.38 | $ | 0.29 | $ | 0.09 | 31.0 | % | ||||||
1st Quarter 2018 Supplemental Information 4 Sun Communities, Inc.
Outstanding Securities and Capitalization
(in thousands except for *)
Outstanding Securities - As of March 31, 2018 | |||||||||
Number of Units/Shares Outstanding | Conversion Rate* | If Converted | Issuance Price per unit* | Annual Distribution Rate* | |||||
Convertible Securities | |||||||||
Series A-1 preferred OP units | 342 | 2.4390 | 834 | $100 | 6.0% | ||||
Series A-3 preferred OP units | 40 | 1.8605 | 74 | $100 | 4.5% | ||||
Series A-4 preferred OP units | 422 | 0.4444 | 188 | $25 | 6.5% | ||||
Series C preferred OP units | 316 | 1.1100 | 351 | $100 | 4.5% | ||||
Common OP units | 2,739 | 1.0000 | 2,739 | N/A | Mirrors common shares distributions | ||||
Series A-4 cumulative convertible preferred stock | 1,085 | 0.4444 | 482 | $25 | 6.5% | ||||
Non-Convertible Securities | |||||||||
Common shares | 79,885 | N/A | N/A | N/A | $2.84^ | ||||
^ Annual distribution is based on the last quarterly distribution annualized. | |||||||||
Capitalization - As of March 31, 2018 | |||||||||||
Equity | Shares | Share Price* | Total | ||||||||
Common shares | 79,885 | $ | 91.37 | $ | 7,299,092 | ||||||
Common OP units | 2,739 | $ | 91.37 | 250,262 | |||||||
Subtotal | 82,624 | $ | 7,549,354 | ||||||||
Series A-1 preferred OP units | 834 | $ | 91.37 | 76,203 | |||||||
Series A-3 preferred OP units | 74 | $ | 91.37 | 6,761 | |||||||
Series A-4 preferred OP units | 188 | $ | 91.37 | 17,178 | |||||||
Series C preferred OP units | 351 | $ | 91.37 | 32,071 | |||||||
Total diluted shares outstanding | 84,071 | $ | 7,681,567 | ||||||||
Debt | |||||||||||
Mortgage loans payable | $ | 2,826,225 | |||||||||
Secured borrowings (4) | 124,077 | ||||||||||
Preferred OP units - mandatorily redeemable | 37,338 | ||||||||||
Lines of credit | 141,800 | ||||||||||
Total Debt | $ | 3,129,440 | |||||||||
Preferred | |||||||||||
A-4 preferred stock | 1,085 | $ | 25.00 | $ | 27,125 | ||||||
Total Capitalization | $ | 10,838,132 | |||||||||
1st Quarter 2018 Supplemental Information 5 Sun Communities, Inc.
Reconciliations to Non-GAAP Financial Measures
1st Quarter 2018 Supplemental Information 6 Sun Communities, Inc.
Reconciliation of Net Income Attributable to Sun Communities, Inc. Common Stockholders to Funds from Operations
(amounts in thousands except for per share data)
Three Months Ended March 31, | |||||||
2018 | 2017 | ||||||
Net income attributable to Sun Communities, Inc. common stockholders | $ | 29,986 | $ | 21,104 | |||
Adjustments: | |||||||
Depreciation and amortization | 66,646 | 62,817 | |||||
Amounts attributable to noncontrolling interests | 1,889 | 900 | |||||
Preferred return to preferred OP units | 553 | 586 | |||||
Preferred distribution to Series A-4 preferred stock | 441 | 665 | |||||
Gain on disposition of assets, net | (4,539 | ) | (2,681 | ) | |||
FFO attributable to Sun Communities, Inc. common stockholders and dilutive convertible securities (1) (8) | $ | 94,976 | $ | 83,391 | |||
Adjustments: | |||||||
Transaction costs (5) | — | 2,386 | |||||
Other acquisition related costs (7) | 135 | 844 | |||||
Loss on extinguishment of debt | 196 | 466 | |||||
Catastrophic weather related charges, net | (2,213 | ) | 87 | ||||
Loss of earnings - catastrophic weather related (9) | 325 | — | |||||
Other expense / (income), net (6) | 2,617 | (839 | ) | ||||
Debt premium write-off | (782 | ) | (414 | ) | |||
Deferred tax benefit | (347 | ) | (300 | ) | |||
Core FFO attributable to Sun Communities, Inc. common stockholders and dilutive convertible securities (1) (8) | $ | 94,907 | $ | 85,621 | |||
Weighted average common shares outstanding - basic: | 78,855 | 72,677 | |||||
Add: | |||||||
Common stock issuable upon conversion of stock options | 2 | 2 | |||||
Restricted stock | 607 | 561 | |||||
Common OP units | 2,741 | 2,754 | |||||
Common stock issuable upon conversion of Series A-1 preferred OP units | 836 | 892 | |||||
Common stock issuable upon conversion of Series A-3 preferred OP units | 75 | 75 | |||||
Common stock issuable upon conversion of Series A-4 preferred stock | 482 | 727 | |||||
Weighted average common shares outstanding - fully diluted | 83,598 | 77,688 | |||||
FFO attributable to Sun Communities, Inc. common stockholders and dilutive convertible securities (1) (8) per share - fully diluted | $ | 1.14 | $ | 1.07 | |||
Core FFO attributable to Sun Communities, Inc. common stockholders and dilutive convertible securities (1) (8) per share - fully diluted | $ | 1.14 | $ | 1.10 | |||
1st Quarter 2018 Supplemental Information 7 Sun Communities, Inc.
Reconciliation of Net Income Attributable to Sun Communities, Inc. Common Stockholders to Recurring EBITDA
(amounts in thousands)
Three Months Ended March 31, | |||||||
2018 | 2017 | ||||||
Net income attributable to Sun Communities, Inc., common stockholders | $ | 29,986 | $ | 21,104 | |||
Adjustments: | |||||||
Interest expense (net of debt premium write-offs of $0.8 million and $0.4 million in Q1 2018 and Q1 2017, respectively) | 31,757 | 32,106 | |||||
Loss on extinguishment of debt | 196 | 466 | |||||
Current tax expense | 174 | 178 | |||||
Deferred tax benefit | (347 | ) | (300 | ) | |||
Depreciation and amortization | 66,437 | 62,766 | |||||
Gain on disposition of assets, net | (4,539 | ) | (2,681 | ) | |||
EBITDAre (1) | $ | 123,664 | $ | 113,639 | |||
Adjustments: | |||||||
Transaction costs (5) | — | 2,386 | |||||
Other expense / (income), net (6) | 2,617 | (839 | ) | ||||
Catastrophic weather related charges, net | (2,213 | ) | 87 | ||||
Amounts attributable to noncontrolling interests | 2,094 | 1,088 | |||||
Preferred return to preferred OP units | 1,080 | 1,174 | |||||
Preferred stock distribution | 441 | 2,179 | |||||
Plus: Gain on dispositions of assets, net | 4,539 | 2,681 | |||||
Recurring EBITDA (1) | $ | 132,222 | $ | 122,395 | |||
1st Quarter 2018 Supplemental Information 8 Sun Communities, Inc.
Reconciliation of Net Income Attributable to Sun Communities, Inc. Common Stockholders to Net Operating Income
(amounts in thousands)
Three Months Ended March 31, | |||||||
2018 | 2017 | ||||||
Net income attributable to Sun Communities, Inc., common stockholders: | $ | 29,986 | $ | 21,104 | |||
Other revenues | (6,217 | ) | (5,525 | ) | |||
Home selling expenses | 3,290 | 3,111 | |||||
General and administrative | 19,931 | 17,932 | |||||
Transaction costs (5) | — | 2,386 | |||||
Depreciation and amortization | 66,437 | 62,766 | |||||
Loss on extinguishment of debt | 196 | 466 | |||||
Interest expense | 31,757 | 32,106 | |||||
Catastrophic weather related charges, net | (2,213 | ) | 87 | ||||
Other expense / (income), net (6) | 2,617 | (839 | ) | ||||
Current tax expense | 174 | 178 | |||||
Deferred tax benefit | (347 | ) | (300 | ) | |||
Preferred return to preferred OP units | 1,080 | 1,174 | |||||
Amounts attributable to noncontrolling interests | 2,094 | 1,088 | |||||
Preferred stock distributions | 441 | 2,179 | |||||
NOI(1) / Gross Profit | $ | 149,226 | $ | 137,913 | |||
Three Months Ended March 31, | |||||||
2018 | 2017 | ||||||
Real Property NOI (1) | $ | 131,745 | $ | 122,745 | |||
Rental Program NOI (1) | 24,159 | 22,956 | |||||
Home Sales NOI (1) / Gross Profit | 8,329 | 6,380 | |||||
Ancillary NOI (1) / Gross Profit | 1,302 | 1,551 | |||||
Site rent from Rental Program (included in Real Property NOI) (1)(10) | (16,309 | ) | (15,719 | ) | |||
NOI (1) / Gross profit | $ | 149,226 | $ | 137,913 | |||
1st Quarter 2018 Supplemental Information 9 Sun Communities, Inc.
Non-GAAP and Other Financial Measures
1st Quarter 2018 Supplemental Information 10 Sun Communities, Inc.
Financial and Operating Highlights
(amounts in thousands, except for *)
Quarter Ended | |||||||||||||||||||
3/31/2018 | 12/31/2017 | 9/30/2017 | 6/30/2017 | 3/31/2017 | |||||||||||||||
FINANCIAL INFORMATION | |||||||||||||||||||
Total revenues | $ | 257,916 | $ | 242,026 | $ | 268,245 | $ | 237,899 | $ | 234,400 | |||||||||
Net income | $ | 33,601 | $ | 10,342 | $ | 28,958 | $ | 16,974 | $ | 25,545 | |||||||||
Net income attributable to common stockholders | $ | 29,986 | $ | 7,438 | $ | 24,115 | $ | 12,364 | $ | 21,104 | |||||||||
Earnings per share basic* | $ | 0.38 | $ | 0.09 | $ | 0.31 | $ | 0.16 | $ | 0.29 | |||||||||
Earnings per share diluted* | $ | 0.38 | $ | 0.09 | $ | 0.31 | $ | 0.16 | $ | 0.29 | |||||||||
Recurring EBITDA (1) | $ | 132,222 | $ | 119,408 | $ | 132,524 | $ | 114,324 | $ | 122,395 | |||||||||
FFO attributable to Sun Communities, Inc. common stockholders and dilutive convertible securities (1) (8) | $ | 94,976 | $ | 76,609 | $ | 86,917 | $ | 73,202 | $ | 83,391 | |||||||||
Core FFO attributable to Sun Communities, Inc. common stockholders and dilutive convertible securities (1) (8) | $ | 94,907 | $ | 81,812 | $ | 93,757 | $ | 76,194 | $ | 85,621 | |||||||||
FFO attributable to Sun Communities, Inc. common stockholders and dilutive convertible securities (1) (8) per share - fully diluted* | $ | 1.14 | $ | 0.92 | $ | 1.05 | $ | 0.92 | $ | 1.07 | |||||||||
Core FFO attributable to Sun Communities, Inc. common stockholders and dilutive convertible securities (1) (8) per share - fully diluted* | $ | 1.14 | $ | 0.98 | $ | 1.13 | $ | 0.96 | $ | 1.10 | |||||||||
BALANCE SHEETS | |||||||||||||||||||
Total assets | $ | 6,149,653 | $ | 6,111,957 | $ | 6,157,836 | $ | 6,178,713 | $ | 5,902,447 | |||||||||
Total debt | $ | 3,129,440 | $ | 3,079,238 | $ | 3,003,427 | $ | 3,018,653 | $ | 3,140,547 | |||||||||
Total liabilities | $ | 3,471,096 | $ | 3,405,204 | $ | 3,351,021 | $ | 3,373,695 | $ | 3,478,132 | |||||||||
Quarter Ended | ||||||||||||||
3/31/2018 | 12/31/2017 | 9/30/2017 | 6/30/2017 | 3/31/2017 | ||||||||||
OPERATING INFORMATION* | ||||||||||||||
New home sales | 106 | 103 | 102 | 81 | 76 | |||||||||
Pre-owned home sales | 731 | 747 | 703 | 720 | 750 | |||||||||
Total homes sold | 837 | 850 | 805 | 801 | 826 | |||||||||
Communities | 350 | 350 | 348 | 344 | 342 | |||||||||
Developed sites | 106,617 | 106,036 | 104,359 | 103,377 | 102,268 | |||||||||
Transient RV sites | 15,693 | 15,856 | 15,915 | 16,187 | 16,282 | |||||||||
Total sites | 122,310 | 121,892 | 120,274 | 119,564 | 118,550 | |||||||||
MH occupancy | 94.7 | % | 94.6 | % | 95.2 | % | 95.1 | % | 94.8 | % | ||||
RV occupancy | 100.0 | % | 100.0 | % | 100.0 | % | 100.0 | % | 100.0 | % | ||||
Total blended MH and RV occupancy | 95.8 | % | 95.8 | % | 96.2 | % | 96.1 | % | 95.9 | % | ||||
1st Quarter 2018 Supplemental Information 11 Sun Communities, Inc.
Debt Analysis
(amounts in thousands)
Quarter Ended | |||||||||||||||||||
3/31/2018 | 12/31/2017 | 9/30/2017 | 6/30/2017 | 3/31/2017 | |||||||||||||||
DEBT OUTSTANDING | |||||||||||||||||||
Mortgage loans payable | $ | 2,826,225 | $ | 2,867,356 | $ | 2,822,640 | $ | 2,832,819 | $ | 2,774,645 | |||||||||
Secured borrowings (4) | 124,077 | 129,182 | 134,884 | 139,496 | 141,671 | ||||||||||||||
Preferred OP units - mandatorily redeemable | 37,338 | 41,443 | 45,903 | 45,903 | 45,903 | ||||||||||||||
Lines of credit (11) | 141,800 | 41,257 | — | 435 | 178,328 | ||||||||||||||
Total debt | $ | 3,129,440 | $ | 3,079,238 | $ | 3,003,427 | $ | 3,018,653 | $ | 3,140,547 | |||||||||
% FIXED/FLOATING | |||||||||||||||||||
Fixed | 90.6 | % | 93.7 | % | 94.9 | % | 94.9 | % | 89.4 | % | |||||||||
Floating | 9.4 | % | 6.3 | % | 5.1 | % | 5.1 | % | 10.6 | % | |||||||||
Total | 100.0 | % | 100.0 | % | 100.0 | % | 100.0 | % | 100.0 | % | |||||||||
WEIGHTED AVERAGE INTEREST RATES | |||||||||||||||||||
Mortgage loans payable | 4.25 | % | 4.25 | % | 4.26 | % | 4.26 | % | 4.26 | % | |||||||||
Preferred OP units - mandatorily redeemable | 6.61 | % | 6.75 | % | 6.87 | % | 6.87 | % | 6.87 | % | |||||||||
Lines of credit (11) | 3.01 | % | 2.79 | % | — | % | — | % | 2.52 | % | |||||||||
Average before Secured borrowings (4) | 4.22 | % | 4.26 | % | 4.30 | % | 4.30 | % | 4.19 | % | |||||||||
Secured borrowings (4) | 9.97 | % | 9.97 | % | 9.98 | % | 9.99 | % | 10.01 | % | |||||||||
Total average | 4.45 | % | 4.50 | % | 4.56 | % | 4.56 | % | 4.45 | % | |||||||||
DEBT RATIOS | |||||||||||||||||||
Net Debt / Recurring EBITDA (1) (TTM) | 6.2 | 6.3 | 6.0 | 6.0 | 7.0 | ||||||||||||||
Net Debt / Enterprise Value | 28.8 | % | 28.2 | % | 28.3 | % | 27.2 | % | 32.8 | % | |||||||||
Net Debt + Preferred Stock / Enterprise Value | 29.0 | % | 28.5 | % | 29.4 | % | 28.4 | % | 34.2 | % | |||||||||
Net Debt / Gross Assets | 41.9 | % | 41.8 | % | 39.0 | % | 38.0 | % | 44.8 | % | |||||||||
COVERAGE RATIOS | |||||||||||||||||||
Recurring EBITDA (1) (TTM) / Interest | 3.6 | 3.6 | 3.5 | 3.4 | 3.3 | ||||||||||||||
Recurring EBITDA (1) (TTM) / Interest + Pref. Distributions + Pref. Stock Distribution | 3.4 | 3.3 | 3.2 | 3.1 | 3.0 | ||||||||||||||
MATURITIES/PRINCIPAL AMORTIZATION NEXT FIVE YEARS | Remaining 2018 | 2019 | 2020 | 2021 | 2022 | ||||||||||||||
Mortgage loans payable: | |||||||||||||||||||
Maturities | $ | 26,186 | $ | 40,407 | $ | 58,078 | $ | 270,680 | $ | 82,544 | |||||||||
Weighted average rate of maturities | 6.13 | % | 6.17 | % | 5.92 | % | 5.53 | % | 4.46 | % | |||||||||
Principal amortization | 40,672 | 56,820 | 57,593 | 56,612 | 54,001 | ||||||||||||||
Secured borrowings (4) | 4,081 | 5,866 | 6,396 | 6,867 | 7,085 | ||||||||||||||
Preferred OP units - mandatorily redeemable | 1,500 | 1,175 | — | — | — | ||||||||||||||
Lines of credit (11) | — | 2,311 | — | 140,000 | — | ||||||||||||||
Total | $ | 72,439 | $ | 106,579 | $ | 122,067 | $ | 474,159 | $ | 143,630 | |||||||||
1st Quarter 2018 Supplemental Information 12 Sun Communities, Inc.
Statements of Operations – Same Community(2)
(amounts in thousands except for Other Information)
Three Months Ended March 31, | ||||||||||||||
2018 | 2017 | Change | % Change | |||||||||||
REVENUES: | ||||||||||||||
Income from real property (12) | 185,119 | 175,206 | $ | 9,913 | 5.7 | % | ||||||||
PROPERTY OPERATING EXPENSES: | ||||||||||||||
Payroll and benefits | 15,041 | 14,845 | 196 | 1.3 | % | |||||||||
Legal, taxes & insurance | 2,424 | 1,513 | 911 | 60.2 | % | |||||||||
Utilities (12) | 13,881 | 12,377 | 1,504 | 12.2 | % | |||||||||
Supplies and repair (13) | 5,028 | 4,670 | 358 | 7.7 | % | |||||||||
Other | 5,430 | 5,236 | 194 | 3.7 | % | |||||||||
Real estate taxes | 13,360 | 13,107 | 253 | 1.9 | % | |||||||||
Total property operating expenses | 55,164 | 51,748 | 3,416 | 6.6 | % | |||||||||
NET OPERATING INCOME (NOI)(1) | $ | 129,955 | $ | 123,458 | $ | 6,497 | 5.3 | % | ||||||
As of March 31, | |||||||||||||||
2018 | 2017 | Change | % Change | ||||||||||||
OTHER INFORMATION | |||||||||||||||
Communities | 336 | 336 | — | ||||||||||||
MH occupancy (3) | 96.9 | % | 96.0 | % | |||||||||||
RV occupancy (3) | 100.0 | % | 100.0 | % | |||||||||||
MH & RV blended occupancy % (3) | 97.6 | % | 95.4 | % | 2.2 | % | |||||||||
Sites available for development | 7,602 | 6,421 | 1,181 | 18.4 | % | ||||||||||
Monthly base rent per site - MH | $ | 542 | $ | 523 | $ | 19 | 3.8 | % | (15) | ||||||
Monthly base rent per site - RV (14) | $ | 446 | $ | 426 | $ | 20 | 4.6 | % | (15) | ||||||
Monthly base rent per site - Total (14) | $ | 521 | $ | 502 | $ | 19 | 3.8 | % | (15) | ||||||
1st Quarter 2018 Supplemental Information 13 Sun Communities, Inc.
Rental Program Summary
(amounts in thousands except for *)
Three Months Ended March 31, | ||||||||||||||
2018 | 2017 | Change | % Change | |||||||||||
REVENUES: | ||||||||||||||
Rental home revenue | $ | 13,020 | $ | 12,339 | $ | 681 | 5.5 | % | ||||||
Site rent included in Income from real property | 16,309 | 15,719 | 590 | 3.8 | % | |||||||||
Rental program revenue | 29,329 | 28,058 | 1,271 | 4.5 | % | |||||||||
EXPENSES: | ||||||||||||||
Commissions | 330 | 610 | (280 | ) | (45.9 | )% | ||||||||
Repairs and refurbishment | 2,314 | 2,281 | 33 | 1.5 | % | |||||||||
Taxes and insurance | 1,535 | 1,437 | 98 | 6.8 | % | |||||||||
Marketing and other | 991 | 774 | 217 | 28.0 | % | |||||||||
Rental program operating and maintenance | 5,170 | 5,102 | 68 | 1.3 | % | |||||||||
NET OPERATING INCOME (NOI) (1) | $ | 24,159 | $ | 22,956 | $ | 1,203 | 5.2 | % | ||||||
Occupied rental home information as of March 31, 2018 and 2017: | |||||||||||||||
Number of occupied rentals, end of period* | 11,074 | 10,888 | 186 | 1.7 | % | ||||||||||
Investment in occupied rental homes, end of period | $ | 504,402 | $ | 465,479 | $ | 38,923 | 8.4 | % | |||||||
Number of sold rental homes (YTD)* | 234 | 240 | (6 | ) | (2.5 | )% | |||||||||
Weighted average monthly rental rate, end of period* | $ | 933 | $ | 889 | $ | 44 | 5.0 | % | |||||||
1st Quarter 2018 Supplemental Information 14 Sun Communities, Inc.
Home Sales Summary
(amounts in thousands except for *)
Three Months Ended March 31, | ||||||||||||||
2018 | 2017 | Change | % Change | |||||||||||
REVENUES AND EXPENSES: | ||||||||||||||
New home sales | $ | 11,893 | $ | 6,883 | $ | 5,010 | 72.8 | % | ||||||
Pre-owned home sales | 23,007 | 20,380 | 2,627 | 12.9 | % | |||||||||
Revenue from home sales | 34,900 | 27,263 | 7,637 | 28.0 | % | |||||||||
New home cost of sales | 10,197 | 5,848 | 4,349 | 74.4 | % | |||||||||
Pre-owned home cost of sales | 16,374 | 15,035 | 1,339 | 8.9 | % | |||||||||
Cost of home sales | 26,571 | 20,883 | 5,688 | 27.2 | % | |||||||||
NOI / Gross Profit (1) | $ | 8,329 | $ | 6,380 | $ | 1,949 | 30.6 | % | ||||||
Gross profit – new homes | $ | 1,696 | $ | 1,035 | $ | 661 | 63.9 | % | ||||||
Gross margin % – new homes | 14.3 | % | 15.0 | % | (0.7 | )% | ||||||||
Average selling price – new homes* | $ | 112,198 | $ | 90,566 | $ | 21,632 | 23.9 | % | ||||||
Gross profit – pre-owned homes | $ | 6,633 | $ | 5,345 | $ | 1,288 | 24.1 | % | ||||||
Gross margin % – pre-owned homes | 28.8 | % | 26.2 | % | 2.6 | % | ||||||||
Average selling price – pre-owned homes* | $ | 31,473 | $ | 27,173 | $ | 4,300 | 15.8 | % | ||||||
Home sales volume: | ||||||||||||||
New home sales* | 106 | 76 | 30 | 39.5 | % | |||||||||
Pre-owned home sales* | 731 | 750 | (19 | ) | (2.5 | )% | ||||||||
Total homes sold* | 837 | 826 | 11 | 1.3 | % | |||||||||
1st Quarter 2018 Supplemental Information 15 Sun Communities, Inc.
Acquisitions and Other Summary (16)
(amounts in thousands except for statistical data)
Three Months Ended March 31, 2018 | ||||
REVENUES: | ||||
Income from real property | $ | 4,052 | ||
PROPERTY AND OPERATING EXPENSES: | ||||
Payroll and benefits | 618 | |||
Legal, taxes & insurance | 58 | |||
Utilities | 632 | |||
Supplies and repair | 147 | |||
Other | 331 | |||
Real estate taxes | 476 | |||
Property operating expenses | 2,262 | |||
NET OPERATING INCOME (NOI) (1) | $ | 1,790 | ||
As of March 31, 2018 | ||||
Other information: | ||||
Number of properties | 14 | |||
Occupied sites (17) | 1,929 | |||
Developed sites (17) | 2,038 | |||
Occupancy % (17) | 94.7 | % | ||
1st Quarter 2018 Supplemental Information 16 Sun Communities, Inc.
Property Summary | |||||||||||||||
(includes MH and Annual RV’s) | |||||||||||||||
COMMUNITIES | 3/31/2018 | 12/31/2017 | 9/30/2017 | 6/30/2017 | 3/31/2017 | ||||||||||
FLORIDA | |||||||||||||||
Communities | 123 | 123 | 121 | 121 | 121 | ||||||||||
Developed sites (17) | 37,726 | 37,254 | 36,587 | 36,661 | 36,533 | ||||||||||
Occupied (17) | 36,546 | 36,170 | 35,414 | 35,479 | 35,257 | ||||||||||
Occupancy % (17) | 96.9 | % | 97.1 | % | 96.8 | % | 96.8 | % | 96.5 | % | |||||
Sites for development | 1,397 | 1,485 | 1,469 | 1,368 | 1,359 | ||||||||||
MICHIGAN | |||||||||||||||
Communities | 68 | 68 | 68 | 68 | 67 | ||||||||||
Developed sites (17) | 25,881 | 25,881 | 25,498 | 25,496 | 25,024 | ||||||||||
Occupied (17) | 24,319 | 24,147 | 23,996 | 23,924 | 23,443 | ||||||||||
Occupancy % (17) | 94.0 | % | 93.3 | % | 94.1 | % | 93.8 | % | 93.7 | % | |||||
Sites for development | 1,371 | 1,371 | 1,752 | 1,752 | 1,798 | ||||||||||
TEXAS | |||||||||||||||
Communities | 21 | 21 | 21 | 21 | 21 | ||||||||||
Developed sites (17) | 6,614 | 6,601 | 6,410 | 6,312 | 6,292 | ||||||||||
Occupied (17) | 6,191 | 6,152 | 6,041 | 6,021 | 5,943 | ||||||||||
Occupancy % (17) | 93.6 | % | 93.2 | % | 94.2 | % | 95.4 | % | 94.5 | % | |||||
Sites for development | 1,100 | 1,100 | 1,277 | 1,345 | 1,387 | ||||||||||
CALIFORNIA | |||||||||||||||
Communities | 27 | 27 | 27 | 23 | 23 | ||||||||||
Developed sites (17) | 5,692 | 5,692 | 5,693 | 4,894 | 4,865 | ||||||||||
Occupied (17) | 5,646 | 5,639 | 5,630 | 4,834 | 4,804 | ||||||||||
Occupancy % (17) | 99.2 | % | 99.1 | % | 98.9 | % | 98.8 | % | 98.8 | % | |||||
Sites for development | 389 | 389 | 379 | 367 | 411 | ||||||||||
ONTARIO, CANADA | |||||||||||||||
Communities | 15 | 15 | 15 | 15 | 15 | ||||||||||
Developed sites (17) | 3,650 | 3,634 | 3,620 | 3,564 | 3,451 | ||||||||||
Occupied (17) | 3,650 | 3,634 | 3,620 | 3,564 | 3,451 | ||||||||||
Occupancy % (17) | 100.0 | % | 100.0 | % | 100.0 | % | 100.0 | % | 100.0 | % | |||||
Sites for development | 1,664 | 1,696 | 1,628 | 1,628 | 1,628 | ||||||||||
ARIZONA | |||||||||||||||
Communities | 11 | 11 | 11 | 11 | 11 | ||||||||||
Developed sites (17) | 3,797 | 3,786 | 3,602 | 3,589 | 3,582 | ||||||||||
Occupied (17) | 3,468 | 3,446 | 3,410 | 3,383 | 3,370 | ||||||||||
Occupancy % (17) | 91.3 | % | 91.0 | % | 94.7 | % | 94.3 | % | 94.1 | % | |||||
Sites for development | — | — | 269 | 269 | 269 | ||||||||||
INDIANA | |||||||||||||||
Communities | 11 | 11 | 11 | 11 | 11 | ||||||||||
Developed sites (17) | 3,048 | 2,900 | 2,900 | 2,900 | 2,900 | ||||||||||
Occupied (17) | 2,785 | 2,756 | 2,759 | 2,758 | 2,741 | ||||||||||
Occupancy % (17) | 91.4 | % | 95.0 | % | 95.1 | % | 95.1 | % | 94.5 | % | |||||
Sites for development | 318 | 466 | 330 | 330 | 330 | ||||||||||
1st Quarter 2018 Supplemental Information 17 Sun Communities, Inc.
Property Summary | |||||||||||||||
(includes MH and Annual RV’s) | |||||||||||||||
COMMUNITIES | 3/31/2018 | 12/31/2017 | 9/30/2017 | 6/30/2017 | 3/31/2017 | ||||||||||
OHIO | |||||||||||||||
Communities | 9 | 9 | 9 | 9 | 9 | ||||||||||
Developed sites (17) | 2,756 | 2,759 | 2,757 | 2,735 | 2,719 | ||||||||||
Occupied (17) | 2,672 | 2,676 | 2,676 | 2,643 | 2,623 | ||||||||||
Occupancy % (17) | 97.0 | % | 97.0 | % | 97.1 | % | 96.6 | % | 96.5 | % | |||||
Sites for development | 75 | 75 | 75 | 75 | 75 | ||||||||||
COLORADO | |||||||||||||||
Communities | 8 | 8 | 8 | 8 | 8 | ||||||||||
Developed sites (17) | 2,335 | 2,335 | 2,335 | 2,335 | 2,335 | ||||||||||
Occupied (17) | 2,327 | 2,325 | 2,318 | 2,326 | 2,329 | ||||||||||
Occupancy % (17) | 99.7 | % | 99.6 | % | 99.3 | % | 99.6 | % | 99.7 | % | |||||
Sites for development | 650 | 650 | 670 | 656 | 656 | ||||||||||
OTHER STATES | |||||||||||||||
Communities | 57 | 57 | 57 | 57 | 56 | ||||||||||
Developed sites (17) | 15,118 | 15,194 | 14,957 | 14,891 | 14,567 | ||||||||||
Occupied (17) | 14,544 | 14,587 | 14,532 | 14,439 | 14,130 | ||||||||||
Occupancy % (17) | 96.2 | % | 96.0 | % | 97.2 | % | 97.0 | % | 97.0 | % | |||||
Sites for development | 2,381 | 2,385 | 2,540 | 2,582 | 1,977 | ||||||||||
TOTAL - PORTFOLIO | |||||||||||||||
Communities | 350 | 350 | 348 | 344 | 342 | ||||||||||
Developed sites (17) | 106,617 | 106,036 | 104,359 | 103,377 | 102,268 | ||||||||||
Occupied (17) | 102,148 | 101,532 | 100,396 | 99,371 | 98,091 | ||||||||||
Occupancy % (17)(18) | 95.8 | % | 95.8 | % | 96.2 | % | 96.1 | % | 95.9 | % | |||||
Sites for development | 9,345 | 9,617 | 10,389 | 10,372 | 9,890 | ||||||||||
% Communities age restricted | 33.7 | % | 33.7 | % | 33.6 | % | 32.8 | % | 33.0 | % | |||||
TRANSIENT RV PORTFOLIO SUMMARY | |||||||||||||||
Location | |||||||||||||||
Florida | 5,870 | 6,074 | 6,133 | 6,244 | 6,467 | ||||||||||
Texas | 1,360 | 1,373 | 1,392 | 1,403 | 1,412 | ||||||||||
Ontario, Canada | 1,234 | 1,248 | 1,262 | 1,314 | 1,451 | ||||||||||
Arizona | 1,085 | 1,096 | 1,012 | 1,025 | 1,032 | ||||||||||
New Jersey | 931 | 917 | 1,016 | 1,028 | 1,059 | ||||||||||
California | 806 | 806 | 808 | 808 | 840 | ||||||||||
New York | 610 | 614 | 623 | 630 | 588 | ||||||||||
Maine | 591 | 596 | 529 | 533 | 543 | ||||||||||
Indiana | 519 | 520 | 520 | 520 | 520 | ||||||||||
Michigan | 256 | 256 | 258 | 260 | 210 | ||||||||||
Ohio | 148 | 145 | 147 | 169 | 194 | ||||||||||
Other locations | 2,283 | 2,211 | 2,215 | 2,253 | 1,966 | ||||||||||
Total transient RV sites | 15,693 | 15,856 | 15,915 | 16,187 | 16,282 | ||||||||||
1st Quarter 2018 Supplemental Information 18 Sun Communities, Inc.
Capital Improvements, Development, and Acquisitions
(amounts in thousands except for *)
Recurring Capital Expenditures | Recurring Capital | Lot | Expansion & | Revenue | ||||||||||||||||||||
Average/Site* | Expenditures (19) | Modifications (20) | Acquisitions (21) | Development (22) | Producing (23) | |||||||||||||||||||
YTD 2018 | $ | 36 | $ | 3,254 | $ | 5,050 | $ | 9,205 | $ | 24,637 | $ | 400 | ||||||||||||
2017 | $ | 214 | $ | 14,166 | $ | 18,049 | $ | 204,375 | $ | 88,331 | $ | 1,990 | ||||||||||||
2016 | $ | 211 | $ | 17,613 | $ | 19,040 | $ | 1,822,564 | $ | 47,958 | $ | 2,631 | ||||||||||||
1st Quarter 2018 Supplemental Information 19 Sun Communities, Inc.
Operating Statistics for Manufactured Homes and Annual RV’s
LOCATIONS | Resident Move-outs | Net Leased Sites (24) | New Home Sales | Pre-owned Home Sales | Brokered Re-sales | ||||||||||
Florida | 263 | 376 | 59 | 73 | 343 | ||||||||||
Michigan | 136 | 172 | 7 | 367 | 24 | ||||||||||
Ontario, Canada | 264 | 16 | 2 | 3 | 12 | ||||||||||
Texas | 53 | 39 | 8 | 99 | 7 | ||||||||||
Arizona | 25 | 22 | 11 | — | 51 | ||||||||||
Indiana | 12 | 29 | — | 63 | 1 | ||||||||||
Ohio | 35 | (4 | ) | — | 34 | 3 | |||||||||
California | 7 | 7 | 6 | 2 | 21 | ||||||||||
Colorado | — | 2 | 1 | 24 | 8 | ||||||||||
Other locations | 413 | (43 | ) | 12 | 66 | 20 | |||||||||
Three Months Ended March 31, 2018 | 1,208 | 616 | 106 | 731 | 490 | ||||||||||
TOTAL FOR YEAR ENDED | Resident Move-outs | New Leased Sites (24) | New Home Sales | Pre-owned Home Sales | Brokered Re-sales | ||||||||||
2017 | 2,739 | 2,406 | 362 | 2,920 | 2,006 | ||||||||||
2016 | 1,722 | 1,686 | 329 | 2,843 | 1,655 | ||||||||||
PERCENTAGE TRENDS | Resident Move-outs | Resident Re-sales | ||||
2018 (TTM) | 2.3 | % | 7.0 | % | ||
2017 | 1.9 | % | 6.6 | % | ||
2016 | 2.0 | % | 6.1 | % | ||
1st Quarter 2018 Supplemental Information 20 Sun Communities, Inc.
Footnotes and Definitions
(1) | Investors in and analysts following the real estate industry utilize funds from operations (“FFO”), net operating income (“NOI”), and earnings before interest, tax, depreciation and amortization (“EBITDA”) as supplemental performance measures. The Company believes that FFO, NOI, and EBITDA are appropriate measures given their wide use by and relevance to investors and analysts. Additionally, FFO, NOI, and EBITDA are commonly used in various ratios, pricing multiples, yields and returns and valuation calculations used to measure financial position, performance and value. |
• | FFO, reflecting the assumption that real estate values rise or fall with market conditions, principally adjusts for the effects of generally accepted accounting principles (“GAAP”) depreciation and amortization of real estate assets. |
• | NOI provides a measure of rental operations that does not factor in depreciation, amortization and non-property specific expenses such as general and administrative expenses. |
• | EBITDA provides a further measure to evaluate ability to incur and service debt and to fund dividends and other cash needs. |
FFO is defined by the National Association of Real Estate Investment Trusts (“NAREIT”) as GAAP net income (loss), excluding gains (or losses) from sales of depreciable operating property, plus real estate-related depreciation and amortization, and after adjustments for unconsolidated partnerships and joint ventures. FFO is a non-GAAP financial measure that management believes is a useful supplemental measure of the Company’s operating performance. By excluding gains and losses related to sales of previously depreciated operating real estate assets, impairment and excluding real estate asset depreciation and amortization (which can vary among owners of identical assets in similar condition based on historical cost accounting and useful life estimates), FFO provides a performance measure that, when compared period-over-period, reflects the impact to operations from trends in occupancy rates, rental rates, and operating costs, providing perspective not readily apparent from GAAP net income (loss). Management believes the use of FFO has been beneficial in improving the understanding of operating results of REITs among the investing public and making comparisons of REIT operating results more meaningful. The Company also uses FFO excluding certain gain and loss items that management considers unrelated to the operational and financial performance of our core business (“Core FFO”). The Company believes that Core FFO provides enhanced comparability for investor evaluations of period-over-period results.
The Company believes that GAAP net income (loss) is the most directly comparable measure to FFO. The principal limitation of FFO is that it does not replace GAAP net income (loss) as a performance measure or GAAP cash flow from operations as a liquidity measure. Because FFO excludes significant economic components of GAAP net income (loss) including depreciation and amortization, FFO should be used as a supplement to GAAP net income (loss) and not as an alternative to it. Further, FFO is not intended as a measure of a REIT’s ability to meet debt principal repayments and other cash requirements, nor as a measure of working capital. FFO is calculated in accordance with the Company’s interpretation of standards established by NAREIT, which may not be comparable to FFO reported by other REITs that interpret the NAREIT definition differently.
NOI is derived from revenues minus property operating expenses and real estate taxes. NOI is a non-GAAP financial measure that the Company believes is helpful to investors as a supplemental measure of operating performance because it is an indicator of the return on property investment, and provides a method of comparing property performance over time. The Company uses NOI as a key measure when evaluating performance and growth of particular properties and/or groups of properties. The principal limitation of NOI is that it excludes depreciation, amortization, interest expense and non-property specific expenses such as general and administrative expenses, all of which are significant costs. Therefore, NOI is a measure of the operating performance of the properties of the Company rather than of the Company overall.
The Company believes that GAAP net income (loss) is the most directly comparable measure to NOI. NOI should not be considered to be an alternative to GAAP net income (loss) as an indication of the Company’s financial performance or GAAP cash flow from operating activities as a measure of the Company’s liquidity; nor is it indicative of funds available for the Company’s cash needs, including its ability to make cash distributions. Because of the inclusion of items such as interest, depreciation, and amortization, the use of GAAP net income (loss) as a performance measure is limited as these items may not accurately reflect the actual change in market value of a property, in the case of depreciation and in the case of interest, may not necessarily be linked to the operating performance of a real estate asset, as it is often incurred at a parent company level and not at a property level.
EBITDA as defined by NAREIT (referred to as “EBITDAre”) is calculated as GAAP net income (loss), plus interest expense, plus income tax expense, plus depreciation and amortization, plus or minus losses or gains on the disposition of depreciated property (including losses or gains on change of control), plus impairment write-downs of depreciated
1st Quarter 2018 Supplemental Information 21 Sun Communities, Inc.
property and of investments in unconsolidated affiliates caused by a decrease in value of depreciated property in the affiliate, and adjustments to reflect the entity’s share of EBITDAre of unconsolidated affiliates. EBITDAre is a non-GAAP financial measure that the Company uses to evaluate its ability to incur and service debt, fund dividends and other cash needs and cover fixed costs. Investors utilize EBITDAre as a supplemental measure to evaluate and compare investment quality and enterprise value of REITs. The Company also uses EBITDAre excluding certain gain and loss items that management considers unrelated to measurement of the Company’s performance on a basis that is independent of capital structure (“Recurring EBITDA”).
The Company believes that GAAP net income (loss) is the most directly comparable measure to EBITDAre. EBITDAre is not intended to be used as a measure of the Company’s cash generated by operations or its dividend-paying capacity, and should therefore not replace GAAP net income (loss) as an indication of the Company’s financial performance or GAAP cash flow from operating, investing and financing activities as measures of liquidity.
(2) Same Community results reflect constant currency for comparative purposes. Canadian currency figures in the prior comparative period have been translated at 2018 actual exchange rates.
(3) The Same Community occupancy percentage for 2018 is derived from 102,732 developed sites, of which 100,219 where occupied. The number of developed sites excludes RV transient sites and approximately 1,800 recently completed but vacant MH expansion sites. The Same Community occupancy percentage for 2017 has been adjusted to reflect incremental period-over-period growth from filled expansion sites and the conversion of transient RV sites to annual RV sites.
(4) This is a transferred asset transaction which has been classified as collateralized receivables and the cash received from this transaction has been classified as a secured borrowing. The interest income and interest expense accrue at the same rate and amount.
(5) In January 2018, new accounting guidance became effective, which clarified the definition of a business with the objective of assisting entities in evaluating whether transactions should be accounted for as acquisitions of assets or businesses. Under previous guidance, substantially all of the Company’s property acquisitions were accounted for as business combinations with identifiable assets and liabilities measured at fair value, and acquisition related costs expensed as incurred and reported as Transaction costs. Under the new guidance, the Company expects that substantially all of its future property acquisitions will be accounted for as asset acquisitions. The purchase price of these properties will be allocated on a relative fair value basis and direct acquisition related costs will be capitalized as part of the purchase price. Acquisitions costs that do not meet the criteria for capitalization will be expensed as incurred and reported as General and administrative costs.
(6) Other income / (expense), net for the three months ended March 31, 2018 was comprised primarily of a foreign currency translation loss of $2.5 million. For the three months ended March 31, 2017, the balance was comprised primarily of a foreign currency translation gain of $0.8 million.
(7) These costs represent the expenses incurred to bring recently acquired properties up to the Company’s operating standards, including items such as tree trimming and painting costs that do not meet the Company’s capitalization policy.
(8) The effect of certain anti-dilutive convertible securities is excluded from these items.
(9) | Core FFO(1) for the three months ended March 31, 2018, includes an adjustment of $0.3 million for estimated loss of earnings in excess of the applicable business interruption deductible in relation to our Florida Keys communities that require redevelopment due to damages sustained from Hurricane Irma in September 2017, as previously announced. |
(10) The renter’s monthly payment includes the site rent and an amount attributable to the home lease. Site rent is reflected in Real Property NOI. For purposes of management analysis, site rent is included in Rental Program revenue to evaluate the incremental revenue gains associated with implementation of the Rental Program, and to assess the overall growth and performance of the Rental Program and financial impact on the Company’s operations.
(11) Lines of credit includes the Company’s MH floor plan facility. The effective interest rate on the MH floor plan facility was 7.0 percent for all periods presented. However, the Company pays no interest if the floor plan balance is repaid within 60 days.
(12) Same Community results net $7.9 million and $7.6 million of utility revenue against the related utility expense in property operating and maintenance expense for the three months ended March 31, 2018 and 2017, respectively.
1st Quarter 2018 Supplemental Information 22 Sun Communities, Inc.
(13) Same Community property operating and maintenance expense for the three months ended March 31, 2017, excludes $0.8 million of expenses incurred for recently acquired properties to bring the properties up to the Company’s operating standards, including items such as tree trimming and painting costs that do not meet the Company’s capitalization policy.
(14) Monthly base rent per site pertains to annual RV sites and excludes transient RV sites.
(15) Calculated using actual results without rounding.
(16) Acquisitions and other is comprised of nine properties acquired in 2017, three Florida Keys properties that require redevelopment as a result of damage sustained from Hurricane Irma in 2017, one property undergoing redevelopment, and one property that we have an interest in but do not operate.
(17) Includes MH and annual RV sites, and excludes transient RV sites, as applicable. Total sites for development were comprised of approximately 81.6 percent for expansion, 12.6 percent for greenfield development and 5.8 percent for redevelopment.
(18) At March 31, 2018, total portfolio MH occupancy was 94.7 percent (including the impact of approximately 1,800 recently completed but vacant expansion sites) and annual RV occupancy was 100.0 percent.
(19) Recurring capital expenditures are necessary to maintain asset quality, including purchasing and replacing assets used to operate the community. These capital expenditures include items such as: major road, driveway, pool improvements; clubhouse renovations; adding or replacing street lights; playground equipment; signage; maintenance facilities; manager housing and property vehicles. The minimum capitalized amount is five hundred dollars.
(20) Lot modification capital expenditures improve the asset quality of the community. These costs are incurred when an existing older home moves out, and the site is prepared for a new home, more often than not, a multi-sectional home. These activities, which are mandated by strict manufacturer’s installation requirements and state building code, include items such as new foundations, driveways, and utility upgrades.
(21) Capital expenditures related to acquisitions represent the purchase price of existing operating communities and land parcels to develop expansions or new communities. These costs for the three months ended March 31, 2018 include $6.8 million of capital improvements identified during due diligence that are necessary to bring a community to the Company’s standards. These include items such as: upgrading clubhouses; landscaping; new street light systems; new mail delivery systems; pool renovation including larger decks, heaters, and furniture; new maintenance facilities; and new signage including main signs and internal road signs. These are considered acquisition costs and although identified during due diligence, often require 24 to 36 months after closing to complete.
(22) Expansion and development expenditures consist primarily of construction costs and costs necessary to complete home site improvements.
(23) Capital costs related to revenue generating activities consist primarily of garages, sheds, sub-metering of water, sewer and electricity. Revenue generating attractions at our RV resorts are also included here and, occasionally, a special capital project requested by residents and accompanied by an extra rental increase will be classified as revenue producing.
(24) Net leased sites do not include occupied sites acquired during that year.
Certain financial information has been revised to reflect reclassifications in prior periods to conform to current period presentation.
1st Quarter 2018 Supplemental Information 23 Sun Communities, Inc.