Attached files
| file | filename |
|---|---|
| EX-99.2 - EX-99.2 - RBB Bancorp | rbb-ex992_26.htm |
| EX-2.1 - EX-2.1 - RBB Bancorp | rbb-ex21_24.htm |
| 8-K - 8-K - RBB Bancorp | rbb-8k_20180423.htm |

April 23, 2018 Strategic Acquisition of First American International Corp. Exhibit 99.1
Forward-Looking Statements Certain matters set forth herein (including the exhibits hereto) constitute forward-looking statements within the meaning of the Private Securities Litigation Reform Act of 1995, including forward-looking statements relating to RBB’s current business plans, its future financial position and operating results and RBB’s and First American’s expectations. Forward-looking statements are typically identified by words such as "believe," "expect," "anticipate," "intend," "target," "estimate," "continue," "positions," "prospects" or "potential," by future conditional verbs such as "will," "would," "should," "could" or "may", or by variations of such words or by similar expressions. These forward-looking statements are subject to numerous assumptions, risks and uncertainties which change over time. Forward-looking statements speak only as of the date they are made and we assume no duty to update forward-looking statements. These forward-looking statements are subject to risks and uncertainties that could cause actual results, performance and/or achievements to differ materially from those projected. These risks and uncertainties include, but are not limited to, local, regional, national and international economic and market conditions and events and the impact they may have on RBB and/or First American, on our customers and our assets and liabilities; our ability to attract deposits and other sources of funding or liquidity; supply and demand for real estate and periodic deterioration in real estate prices and/or values in California, New York or other states where RBB or First American lends, including both residential and commercial real estate; a prolonged slowdown or decline in real estate construction, sales or leasing activities; changes in the financial performance and/or condition of our borrowers, depositors or key vendors or counterparties; changes in our levels of delinquent loans, nonperforming assets, allowance for loan losses and charge-offs; the costs or effects of acquisitions or dispositions we may make, whether we are able to obtain any required governmental approvals in connection with any such acquisitions or dispositions, and/or RBB’s ability to realize the contemplated financial or business benefits associated with any such acquisitions or dispositions; the effect of changes in laws, regulations and applicable judicial decisions (including laws, regulations and judicial decisions concerning financial reforms, taxes, banking capital levels, consumer, commercial or secured lending, securities and securities trading and hedging, compliance, employment, executive compensation, insurance, vendor management and information security) with which we and our subsidiaries must comply or believe we should comply; changes in estimates of future reserve requirements and minimum capital requirements based upon the periodic review thereof under relevant regulatory and accounting requirements, including changes in the Basel Committee framework establishing capital standards for credit, operations and market risk; inflation, interest rate, securities market and monetary fluctuations; changes in government interest rates or monetary policies; changes in the amount and availability of deposit insurance; cyber-security threats, including loss of system functionality or theft or loss of company or customer data or money; political instability; acts of war or terrorism, or natural disasters, such as earthquakes, drought, or the effects of pandemic diseases; the timely development and acceptance of new banking products and services and the perceived overall value of these products and services by our customers and potential customers; our relationships with and reliance upon vendors with respect to the operation of certain key internal and external systems and applications; changes in commercial or consumer spending, borrowing and savings preferences or behaviors; technological changes and the expanding use of technology in banking (including the adoption of mobile banking and funds transfer applications); the ability to retain and increase market share, retain and grow customers and control expenses; changes in the competitive and regulatory environment among financial and bank holding companies, banks and other financial service providers; volatility in the credit and equity markets and its effect on the general economy or local or regional business conditions; fluctuations in the price of the our common stock or other securities; and the resulting impact on our ability to raise capital or RBB’s ability to make acquisitions, the effect of changes in accounting policies and practices, as may be adopted from time-to-time by our regulatory agencies, as well as by the Public Company Accounting Oversight Board, the Financial Accounting Standards Board and other accounting standard-setters; changes in our organization, management, compensation and benefit plans, and our ability to retain or expand our workforce, management team and/or our board of directors; the costs and effects of legal, compliance and regulatory actions, changes and developments, including the initiation and resolution of legal proceedings (such as securities, consumer or employee class action litigation), regulatory or other governmental inquiries or investigations, and/or the results of regulatory examinations or reviews; our ongoing relations with our various federal and state regulators; our success at managing the risks involved in the foregoing items and all other factors set forth in RBB Bancorp’s public reports filed with the Securities and Exchange Commission (the “SEC”), including its Annual Report on Form 10-K for the year ended December 31, 2017, and particularly the discussion of risk factors within that document applicable to RBB. In addition, the following risks related to the transaction in particular could cause actual results to differ materially from these forward-looking statements: ability to obtain regulatory approvals and meet other closing conditions to the merger, including approval by First American shareholders, on the expected terms and schedule; delay in closing the merger; difficulties and delays in integrating the RBB and First American businesses or fully realizing cost savings and other benefits; business disruption following the proposed transaction Any statements about future operating results, such as those concerning accretion and dilution to RBB’s earnings or shareholders, are for illustrative purposes only, are not forecasts, and actual results may differ. RBB and First American do not undertake, and specifically disclaim any obligation, to update any forward-looking statements to reflect occurrences or unanticipated events or circumstances after the date of such statements except as required by law. Annualized, pro forma, projected and estimated numbers are used for illustrative purpose only, are not forecasts and may not reflect actual results.
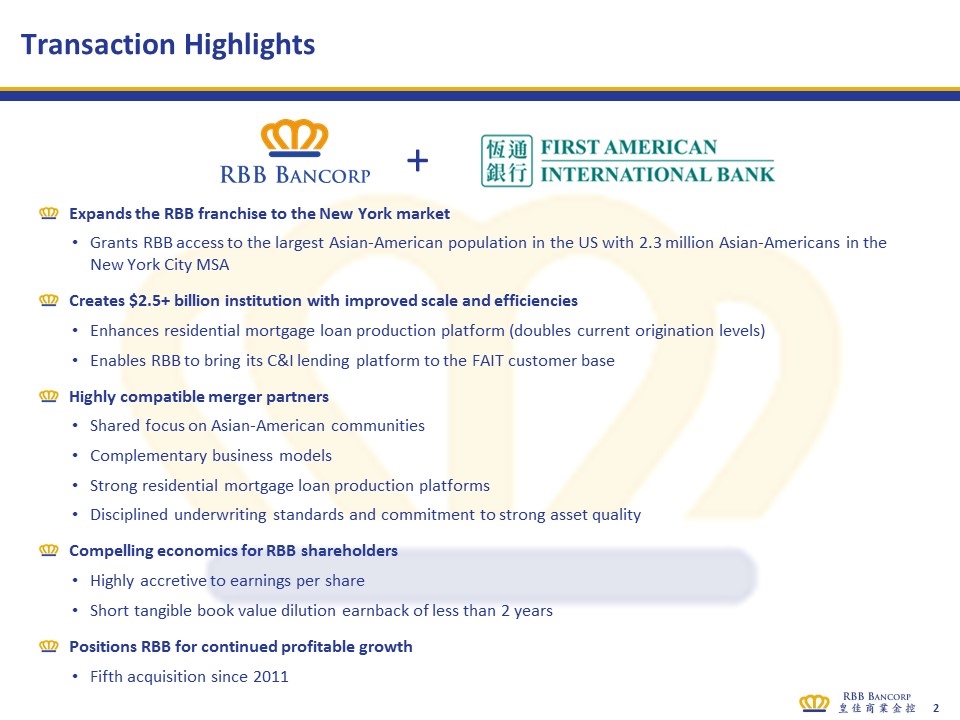
Expands the RBB franchise to the New York market Grants RBB access to the largest Asian-American population in the US with 2.3 million Asian-Americans in the New York City MSA Creates $2.5+ billion institution with improved scale and efficiencies Enhances residential mortgage loan production platform (doubles current origination levels) Enables RBB to bring its C&I lending platform to the FAIT customer base Highly compatible merger partners Shared focus on Asian-American communities Complementary business models Strong residential mortgage loan production platforms Disciplined underwriting standards and commitment to strong asset quality Compelling economics for RBB shareholders Highly accretive to earnings per share Short tangible book value dilution earnback of less than 2 years Positions RBB for continued profitable growth Fifth acquisition since 2011 Transaction Highlights +
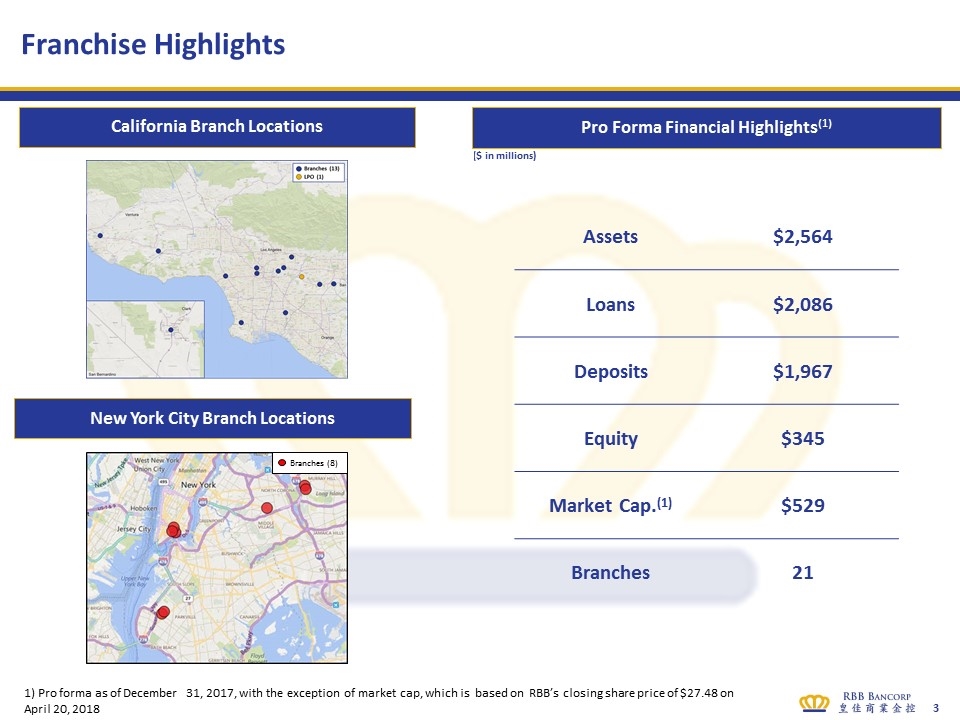
Franchise Highlights ($ in millions) Assets $2,564 Loans $2,086 Deposits $1,967 Equity $345 Market Cap.(1) $529 Branches 21 Pro Forma Financial Highlights(1) New York City Branch Locations California Branch Locations Branches (8) 1) Pro forma as of December 31, 2017, with the exception of market cap, which is based on RBB’s closing share price of $27.48 on April 20, 2018
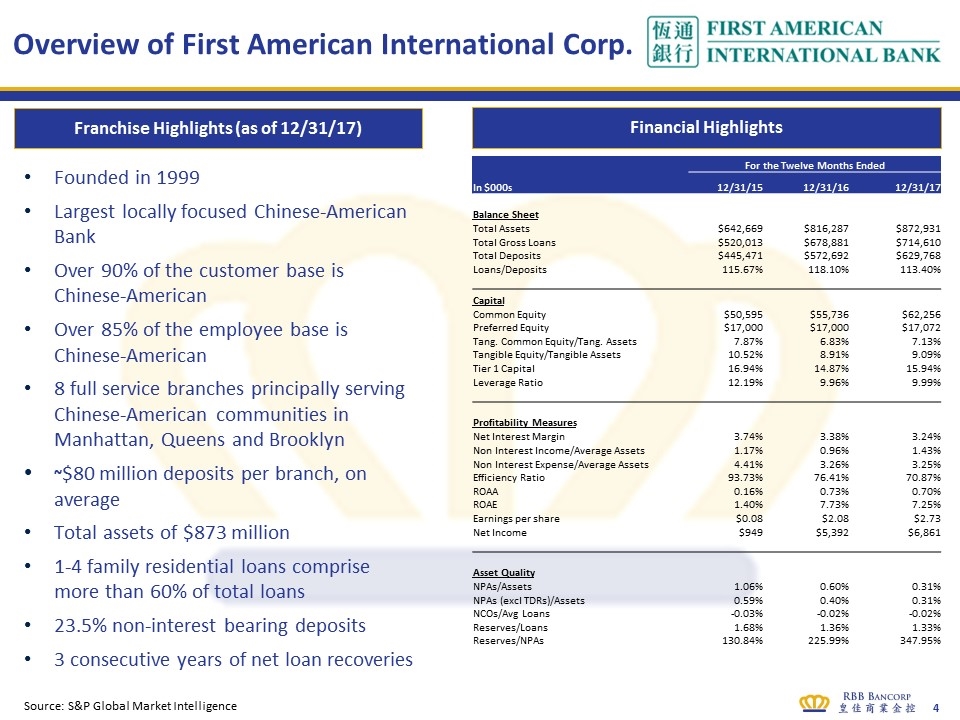
Overview of First American International Corp. Founded in 1999 Largest locally focused Chinese-American Bank Over 90% of the customer base is Chinese-American Over 85% of the employee base is Chinese-American 8 full service branches principally serving Chinese-American communities in Manhattan, Queens and Brooklyn ~$80 million deposits per branch, on average Total assets of $873 million 1-4 family residential loans comprise more than 60% of total loans 23.5% non-interest bearing deposits 3 consecutive years of net loan recoveries Financial Highlights Franchise Highlights (as of 12/31/17) Source: S&P Global Market Intelligence For the Twelve Months Ended In $000s 12/31/15 12/31/16 12/31/17 Balance Sheet Total Assets $642,669 $816,287 $872,931 Total Gross Loans $520,013 $678,881 $714,610 Total Deposits $445,471 $572,692 $629,768 Loans/Deposits 115.67% 118.10% 113.40% Capital Common Equity $50,595 $55,736 $62,256 Preferred Equity $17,000 $17,000 $17,072 Tang. Common Equity/Tang. Assets 7.87% 6.83% 7.13% Tangible Equity/Tangible Assets 10.52% 8.91% 9.09% Tier 1 Capital 16.94% 14.87% 15.94% Leverage Ratio 12.19% 9.96% 9.99% Profitability Measures Net Interest Margin 3.74% 3.38% 3.24% Non Interest Income/Average Assets 1.17% 0.96% 1.43% Non Interest Expense/Average Assets 4.41% 3.26% 3.25% Efficiency Ratio 93.73% 76.41% 70.87% ROAA 0.16% 0.73% 0.70% ROAE 1.40% 7.73% 7.25% Earnings per share $0.08 $2.08 $2.73 Net Income $949 $5,392 $6,861 Asset Quality NPAs/Assets 1.06% 0.60% 0.31% NPAs (excl TDRs)/Assets 0.59% 0.40% 0.31% NCOs/Avg Loans -0.03% -0.02% -0.02% Reserves/Loans 1.68% 1.36% 1.33% Reserves/NPAs 130.84% 225.99% 347.95%
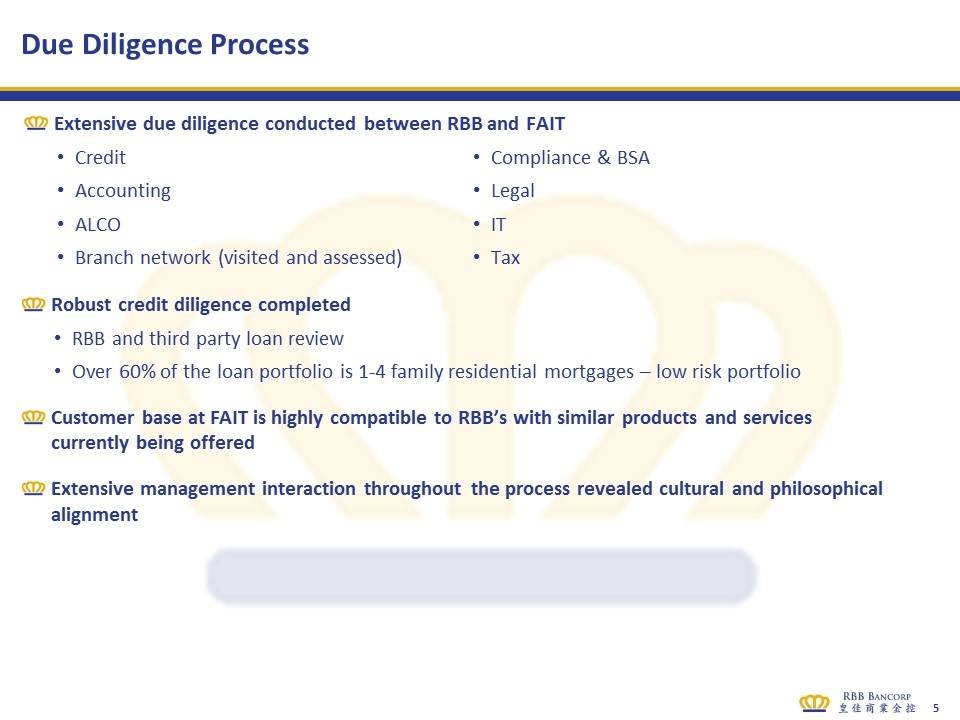
Extensive due diligence conducted between RBB and FAIT Credit Accounting ALCO Branch network (visited and assessed) Due Diligence Process Robust credit diligence completed RBB and third party loan review Over 60% of the loan portfolio is 1-4 family residential mortgages – low risk portfolio Customer base at FAIT is highly compatible to RBB’s with similar products and services currently being offered Extensive management interaction throughout the process revealed cultural and philosophical alignment Compliance & BSA Legal IT Tax
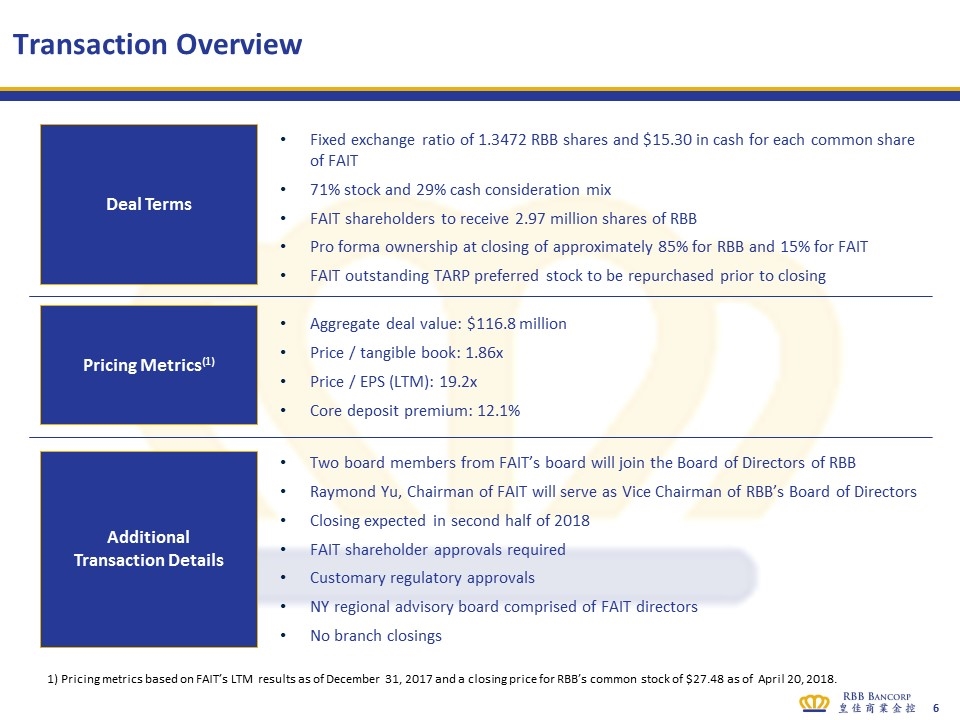
Transaction Overview Two board members from FAIT’s board will join the Board of Directors of RBB Raymond Yu, Chairman of FAIT will serve as Vice Chairman of RBB’s Board of Directors Closing expected in second half of 2018 FAIT shareholder approvals required Customary regulatory approvals NY regional advisory board comprised of FAIT directors No branch closings Deal Terms Pricing Metrics(1) Additional Transaction Details Aggregate deal value: $116.8 million Price / tangible book: 1.86x Price / EPS (LTM): 19.2x Core deposit premium: 12.1% Fixed exchange ratio of 1.3472 RBB shares and $15.30 in cash for each common share of FAIT 71% stock and 29% cash consideration mix FAIT shareholders to receive 2.97 million shares of RBB Pro forma ownership at closing of approximately 85% for RBB and 15% for FAIT FAIT outstanding TARP preferred stock to be repurchased prior to closing 1) Pricing metrics based on FAIT’s LTM results as of December 31, 2017 and a closing price for RBB’s common stock of $27.48 as of April 20, 2018.
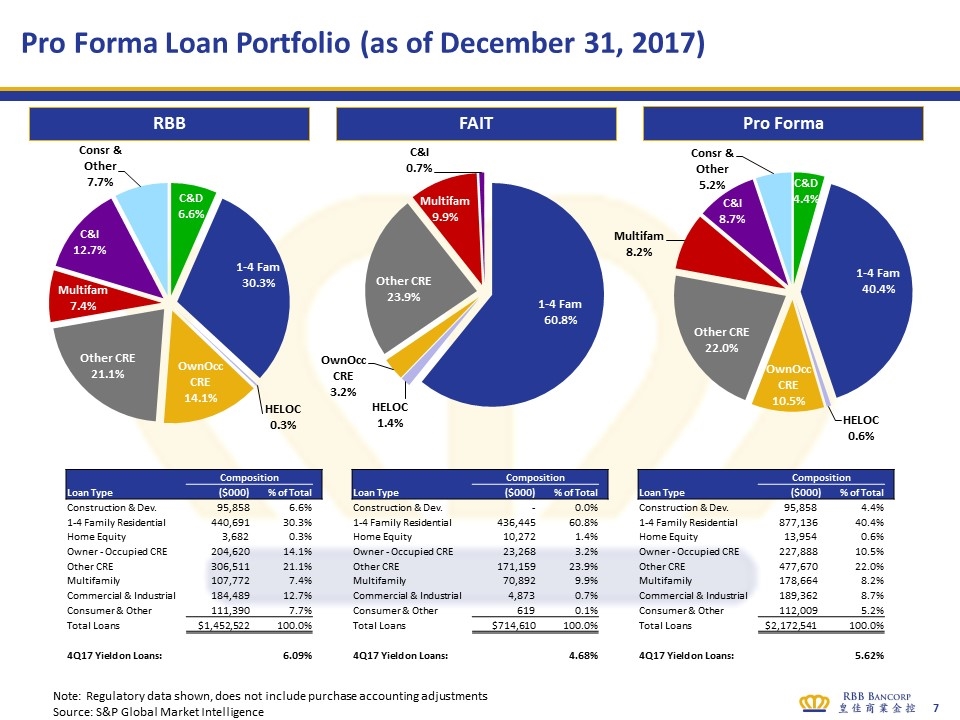
Pro Forma Loan Portfolio (as of December 31, 2017) Note: Regulatory data shown, does not include purchase accounting adjustments Source: S&P Global Market Intelligence RBB FAIT Pro Forma Composition Composition Composition Loan Type ($000) % of Total Loan Type ($000) % of Total Loan Type ($000) % of Total Construction & Dev. 95,858 6.6% Construction & Dev. - 0.0% Construction & Dev. 95,858 4.4% 1-4 Family Residential 440,691 30.3% 1-4 Family Residential 436,445 60.8% 1-4 Family Residential 877,136 40.4% Home Equity 3,682 0.3% Home Equity 10,272 1.4% Home Equity 13,954 0.6% Owner - Occupied CRE 204,620 14.1% Owner - Occupied CRE 23,268 3.2% Owner - Occupied CRE 227,888 10.5% Other CRE 306,511 21.1% Other CRE 171,159 23.9% Other CRE 477,670 22.0% Multifamily 107,772 7.4% Multifamily 70,892 9.9% Multifamily 178,664 8.2% Commercial & Industrial 184,489 12.7% Commercial & Industrial 4,873 0.7% Commercial & Industrial 189,362 8.7% Consumer & Other 111,390 7.7% Consumer & Other 619 0.1% Consumer & Other 112,009 5.2% Total Loans $1,452,522 100.0% Total Loans $714,610 100.0% Total Loans $2,172,541 100.0% 4Q17 Yield on Loans: 6.09% 4Q17 Yield on Loans: 4.68% 4Q17 Yield on Loans: 5.62%
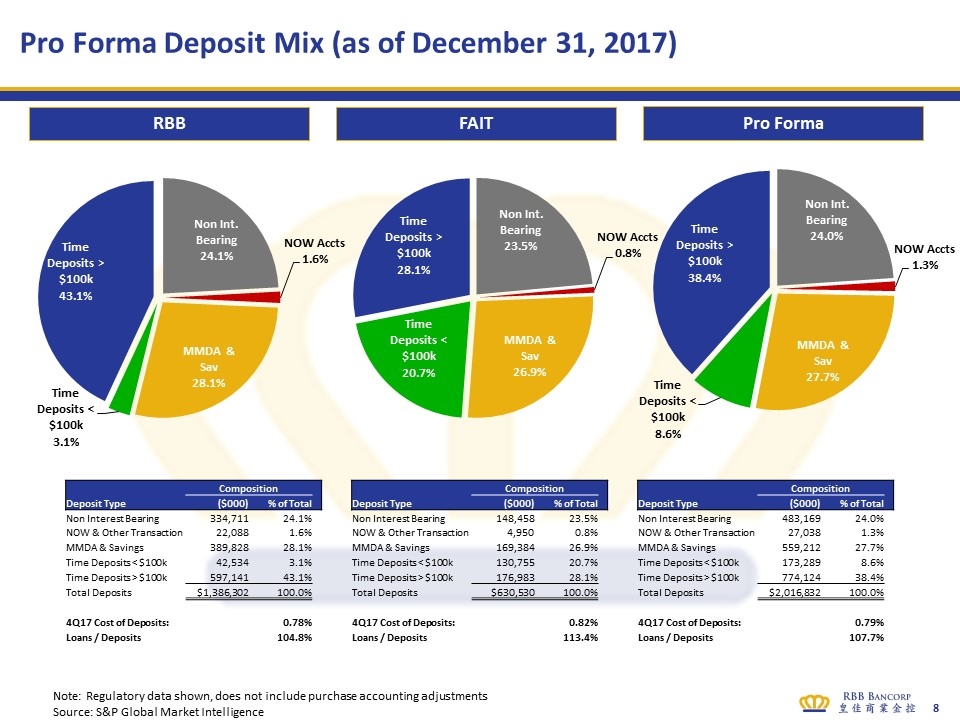
RBB FAIT Pro Forma Pro Forma Deposit Mix (as of December 31, 2017) Note: Regulatory data shown, does not include purchase accounting adjustments Source: S&P Global Market Intelligence Composition Composition Composition Deposit Type ($000) % of Total Deposit Type ($000) % of Total Deposit Type ($000) % of Total Non Interest Bearing 334,711 24.1% Non Interest Bearing 148,458 23.5% Non Interest Bearing 483,169 24.0% NOW & Other Transaction 22,088 1.6% NOW & Other Transaction 4,950 0.8% NOW & Other Transaction 27,038 1.3% MMDA & Savings 389,828 28.1% MMDA & Savings 169,384 26.9% MMDA & Savings 559,212 27.7% Time Deposits < $100k 42,534 3.1% Time Deposits < $100k 130,755 20.7% Time Deposits < $100k 173,289 8.6% Time Deposits > $100k 597,141 43.1% Time Deposits > $100k 176,983 28.1% Time Deposits > $100k 774,124 38.4% Total Deposits $1,386,302 100.0% Total Deposits $630,530 100.0% Total Deposits $2,016,832 100.0% 4Q17 Cost of Deposits: 0.78% 4Q17 Cost of Deposits: 0.82% 4Q17 Cost of Deposits: 0.79% Loans / Deposits 104.8% Loans / Deposits 113.4% Loans / Deposits 107.7%
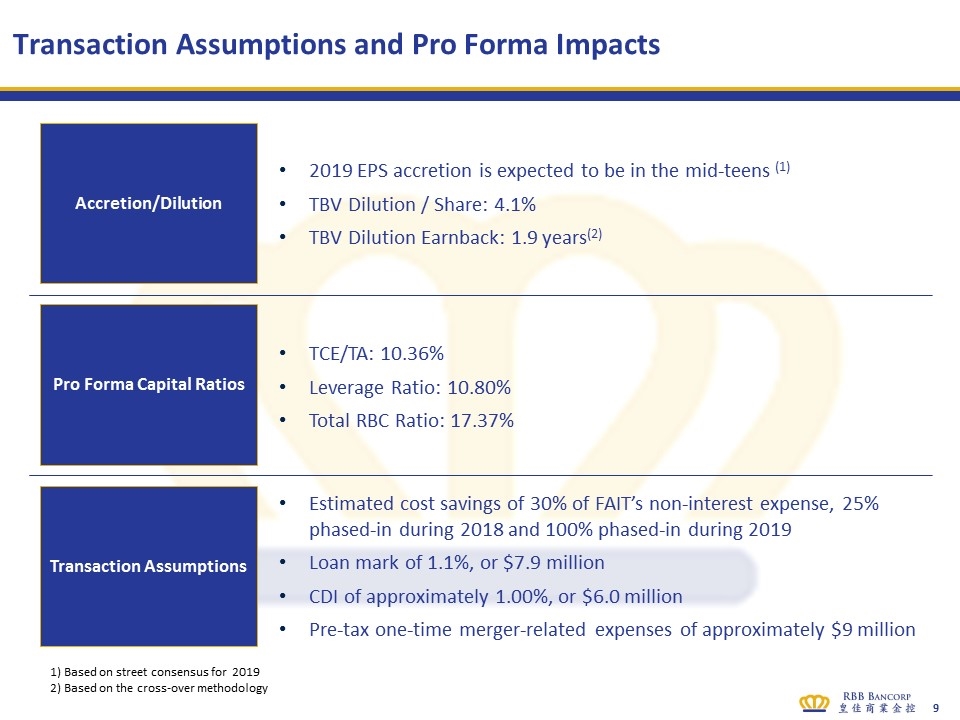
Transaction Assumptions and Pro Forma Impacts Accretion/Dilution Pro Forma Capital Ratios Transaction Assumptions Estimated cost savings of 30% of FAIT’s non-interest expense, 25% phased-in during 2018 and 100% phased-in during 2019 Loan mark of 1.1%, or $7.9 million CDI of approximately 1.00%, or $6.0 million Pre-tax one-time merger-related expenses of approximately $9 million TCE/TA: 10.36% Leverage Ratio: 10.80% Total RBC Ratio: 17.37% 2019 EPS accretion is expected to be in the mid-teens (1) TBV Dilution / Share: 4.1% TBV Dilution Earnback: 1.9 years(2) 1) Based on street consensus for 2019 2) Based on the cross-over methodology

Contact Yee Phong (Alan) Thian Chairman, President and CEO (626) 307-7559 or David Morris Executive Vice President and CFO (714) 670-2488
