Attached files
| file | filename |
|---|---|
| 8-K - 8-K - Mellanox Technologies, Ltd. | d572926d8k.htm |
Exhibit 99.1

|
Corporate Update
April 23, 2018
1
|
Disclaimers
These slides and the accompanying oral presentation contain forward-looking statements and information. The use of words such as “may”, “might”,
“will”, “should”, “expect”, “plan”, “anticipate”, “believe”, “estimate”, “project”, “intend”, “future”, “potential” or
“continued”, and other similar expressions are intended to identify forward-looking statements. All of these forward-looking statements are based on estimates and assumptions by our management that, although we believe to be reasonable,
are inherently uncertain. Forward-looking statements involve risks and uncertainties, including, but not limited to, economic, competitive, governmental and technological factors outside of our control, that may cause our business, industry,
strategy or actual results to differ materially from the forward-looking statement. These risks and uncertainties may include those discussed under the heading “Risk Factors” in the
Company’s most recent 10-K and 10-Qs on file with the Securities and Exchange Commission, and
other factors which may not be known to us. Any forward-looking statement speaks only as of its date. We undertake no obligation to publicly update or revise any forward-looking statement, whether as a result of new information, future events or
otherwise, except as required by law.
We have neither sought nor obtained the consent from any third party to use any statements or information contained in this
presentation that have been obtained or derived from statements made or published by such third parties. Any such statements or information should not be viewed as indicating the support of such third parties for the views expressed herein.
© 2018 Mellanox Technologies
2
|
Important Additional Information and Where You Can
Find It
The Company and certain of its directors and executive officers may be deemed to be participants in a solicitation of proxies in connection with the
matters to be considered at the extraordinary general meeting of shareholders (“Extraordinary General Meeting”) and the 2018 annual general meeting of shareholders (“Annual General Meeting”). Information regarding the names of
the Company’s directors and executive officers and their respective interests in the Company by security holdings or otherwise is set forth in the Company’s Amendment No. 1 to the Annual Report on Form
10-K/A and reports filed by the Company and Forms 3 and Forms 4 filed by the Company’s executive officers and directors with the SEC after April 17, 2018. These documents are available free of charge
at the SEC’s website at www.sec.gov. Additional information regarding the identity of participants, and their direct or indirect interests, by security holdings or otherwise, will be set forth in the Company’s proxy statements for its
Extraordinary General Meeting and its Annual General Meeting, including the schedules and appendices thereto.
The Company intends to furnish its definitive proxy
statements and WHITE proxy cards for the Extraordinary General Meeting and the Annual General Meeting to each shareholder entitled to delivery of a proxy, and intends to file such definitive proxy statements and WHITE proxy cards with the SEC. THE
COMPANY URGES ITS SHAREHOLDERS TO CAREFULLY READ SUCH DEFINITIVE
PROXY STATEMENTS (INCLUDING ANY SUPPLEMENTS OR AMENDMENTS THERETO), ACCOMPANYING WHITE PROXY CARDS
AND ANY OTHER RELEVANT DOCUMENTS THAT THE COMPANY MAY FILE WITH THE SEC, WHEN THEY BECOME AVAILABLE BECAUSE THEY WILL CONTAIN IMPORTANT INFORMATION. Copies of the definitive proxy statements, any solicitation materials and any other documents filed
by the Company with the SEC will be made available free of charge at the SEC’s website at www.sec.gov. These documents will also be made available free of charge on the Company’s website at www.mellanox.com or by contacting the
Company’s proxy solicitor, Mackenzie Partners, Inc. at mlnxproxy@mackenziepartners.com.
© 2018 Mellanox Technologies 3
|
Mellanox Investment Highlights
Provider of critical leading technology for significant market opportunity
Diversification of
business and beginning of investment monetization
Mellanox at front end of a growth wave driven by large multi-year technology transition Measures taken to enhance
operating performance and keen focus on returns Visibility on significant growth in revenues, operating margins and EPS
© 2018 Mellanox Technologies 4
|
Interconnect Represents A Key Enabling Technology
For Large, Rapidly Growing Markets
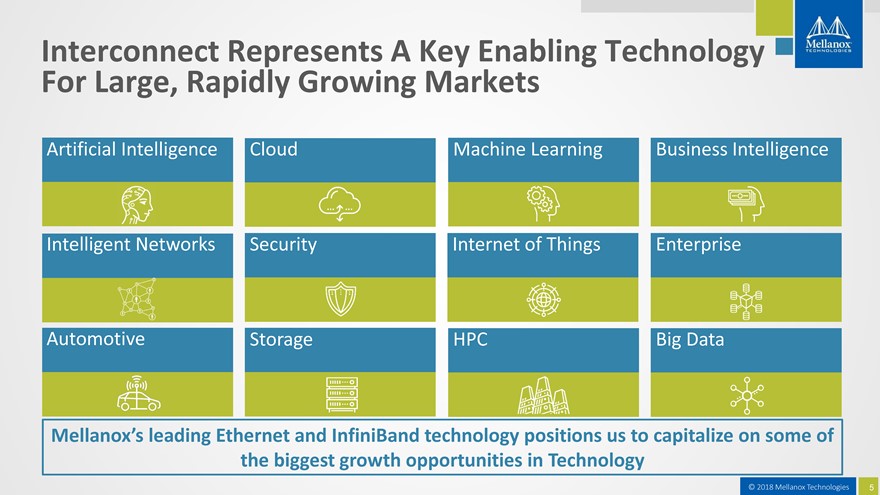
Artificial Intelligence Cloud Machine Learning Business Intelligence Intelligent Networks Security Internet of Things Enterprise
Automotive Storage HPC Big Data
Mellanox’s leading Ethernet and InfiniBand technology positions us to capitalize on some of the biggest growth opportunities
in Technology
© 2018 Mellanox Technologies 5
|
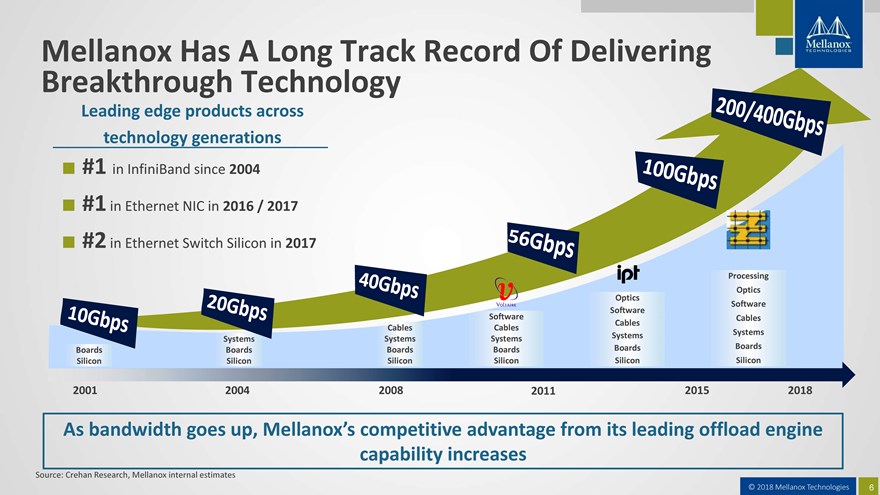
© 2018 Mellanox Technologies 6 #1 in InfiniBand since 2004 #1 in Ethernet NIC in 2016 / 2017 #2 in Ethernet Switch Silicon in 2017 Boards Silicon Systems Boards Silicon Cables Systems Boards Silicon Software Cables Systems Boards Silicon Optics Software Cables Systems Boards Silicon Processing Optics Software Cables Systems Boards Silicon 2001 2015 2004 2008 2011 2018 Mellanox Has A Long Track Record Of Delivering Breakthrough Technology Leading edge products across technology generations As bandwidth goes up, Mellanox’s competitive advantage from its leading offload engine capability increases Source: Crehan Research, Mellanox internal estimates
|
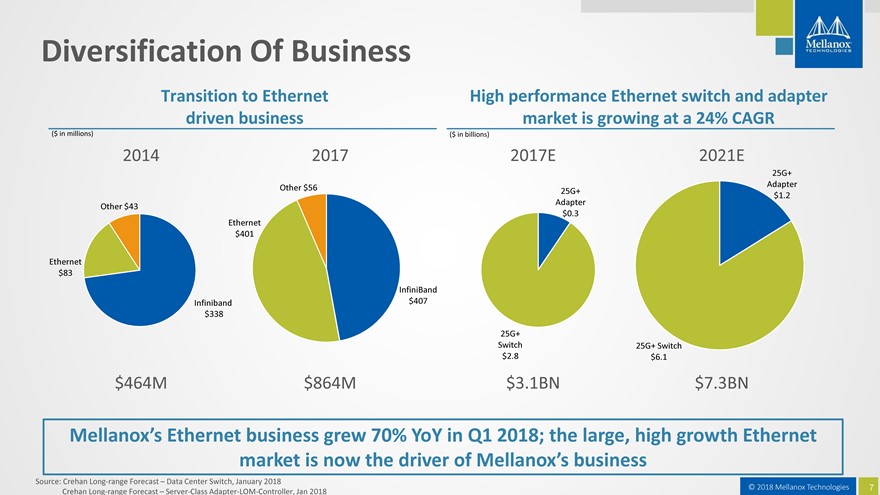
Diversification Of Business
Transition to Ethernet High performance Ethernet switch and adapter driven business market is growing at a 24% CAGR
($ in millions) ($ in billions)
2014 2017 2017E 2021E
25G+ Adapter Other $56 25G+ Adapter $1.2 Other $43 $0.3 Ethernet $401
Ethernet $83
InfiniBand Infiniband $407 $338
25G+
Switch 25G+ Switch $2.8 $6.1
$464M $864M $3.1BN $7.3BN
Mellanox’s Ethernet business grew 70% YoY in Q1 2018; the large, high growth Ethernet market is now the driver of Mellanox’s business
Source: Crehan Long-range Forecast – Data Center Switch, January 2018
Crehan Long-range
Forecast – Server-Class Adapter-LOM-Controller, Jan 2018
© 2018 Mellanox
Technologies 7
|
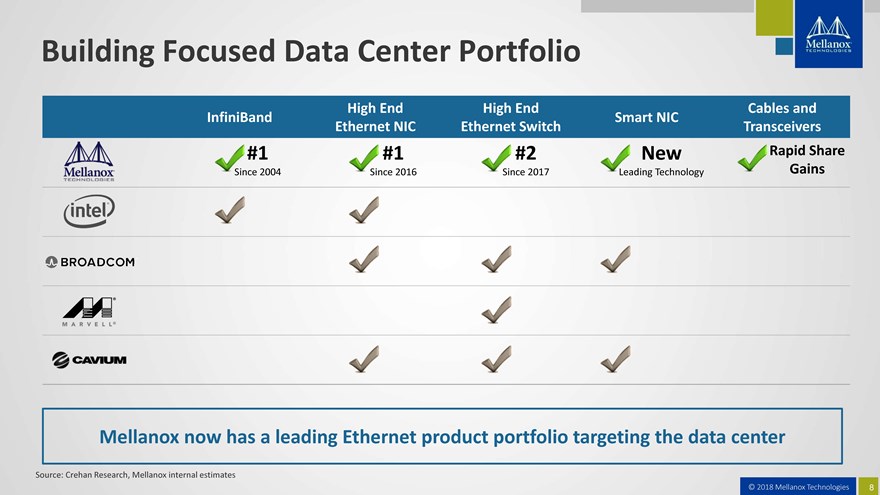
Building Focused Data Center Portfolio
High End High End Cables and InfiniBand Smart NIC
Ethernet NIC Ethernet Switch Transceivers
#1 #1 #2 New Rapid Share
Since 2004 Since 2016 Since 2017 Leading Technology
Gains
Mellanox now has a leading Ethernet product portfolio targeting the data center
© 2018 Mellanox Technologies 8
|
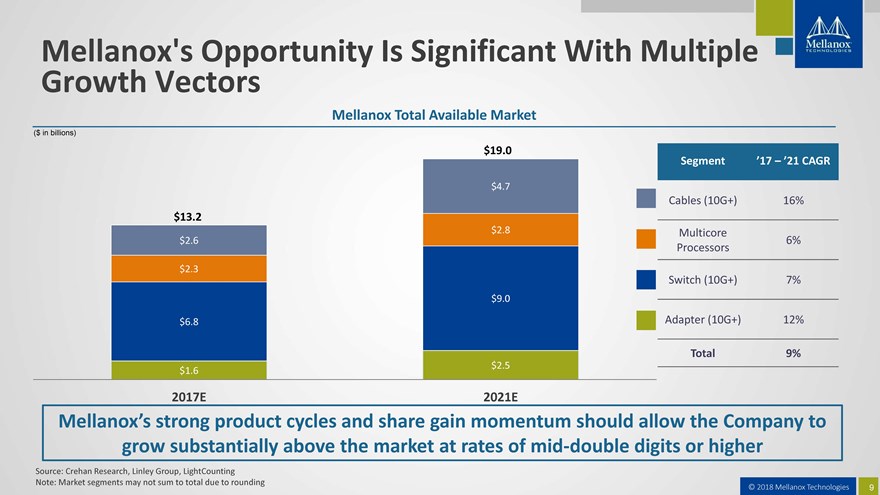
Mellanox’s Opportunity Is Large With Multiple
Growth Vectors
Mellanox Total Available Market
($ in billions)
$19.0
Segment ’17 – ’21 CAGR
$4.7
Cables (10G+) 16% $13.2 $2.8 Multicore $2.6 6%
Processors
$2.3
Switch (10G+) 7% $9.0
$6.8 Adapter (10G+) 12%
Total 9% $2.5 $1.6
2017E 2021E
Mellanox’s strong product cycles and share gain momentum should allow the Company to grow substantially above the market at rates of
mid-double digits or higher
Source: Crehan Research, Linley Group, LightCounting Note: Market segments may not sum to total
due to rounding
© 2018 Mellanox Technologies 9
|
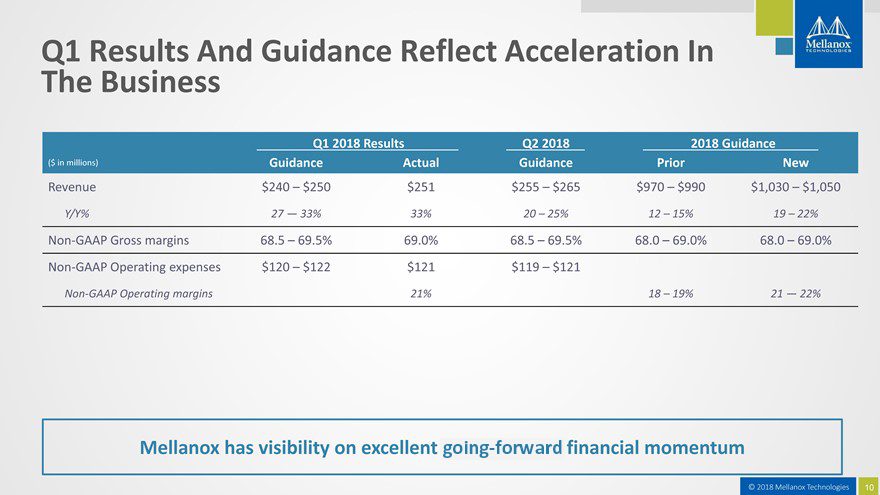
Q1 Results And Guidance Reflect Acceleration In The
Business
Q1 2018 Results Q2 2018 2018 Guidance ($ in millions) Guidance Actual Guidance Prior New
Revenue $240 – $250 $251 $255 – $265 $970 – $990 $1,030 – $1,050
Y/Y% 27
— 33% 33% 20 – 25% 12 – 15% 19 – 22%
Non-GAAP Gross margins 68.5 – 69.5% 69.0% 68.5 – 69.5%
68.0 – 69.0% 68.0 – 69.0%
Non-GAAP Operating expenses $120 – $122 $121 $119 – $121
Non-GAAP Operating margins 21% 18 – 19% 21 — 22%
Mellanox has visibility on excellent going-forward financial momentum
© 2018 Mellanox
Technologies 10
|
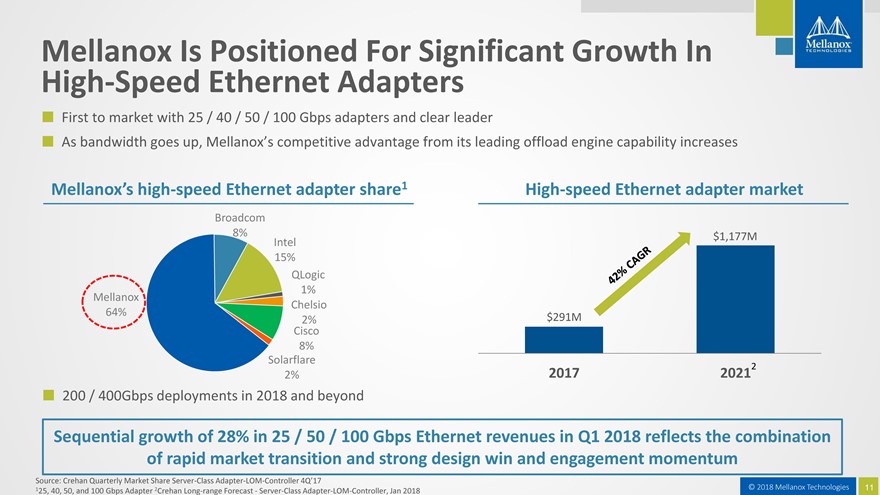
Mellanox Is Positioned For Significant Growth In
High-Speed Ethernet Adapters
First to market with 25 / 40 / 50 / 100 Gbps adapters and clear leader
As bandwidth goes up, Mellanox’s competitive advantage from its leading offload engine capability increases
Mellanox’s high-speed Ethernet adapter share1 High-speed Ethernet adapter market
Broadcom
8% Intel $1,177M 15% QLogic 1% Mellanox Chelsio 64%
2% $291M
Cisco 8% Solarflare
2
2% 2017 2021
200 / 400Gbps deployments in 2018 and beyond
Sequential growth of 28% in 25 / 50 / 100 Gbps Ethernet revenues in Q1 2018 reflects the combination of rapid market transition and strong design win and engagement momentum
Source: Crehan Quarterly Market Share Server-Class Adapter-LOM-Controller
4Q’17
125, 40, 50, and 100 Gbps Adapter 2Crehan Long-range Forecast—Server-Class
Adapter-LOM-Controller, Jan 2018
© 2018 Mellanox Technologies 11
|
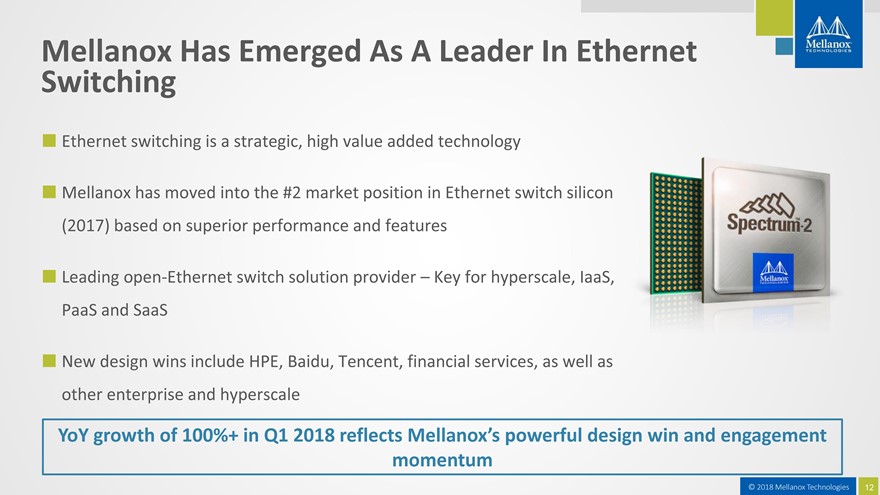
Mellanox Has Emerged As A Leader In Ethernet
Switching
Ethernet switching is a strategic, high value added technology
Mellanox has moved into the #2 market position in Ethernet switch silicon (2017) based on superior performance and features
Leading open-Ethernet switch solution provider – Key for hyperscale, IaaS,
PaaS and SaaS
New design wins include HPE, Baidu, Tencent, financial services, as well as other enterprise and hyperscale
YoY growth of 100%+ in Q1 2018 reflects Mellanox’s powerful design win and engagement momentum
© 2018 Mellanox Technologies
12
|
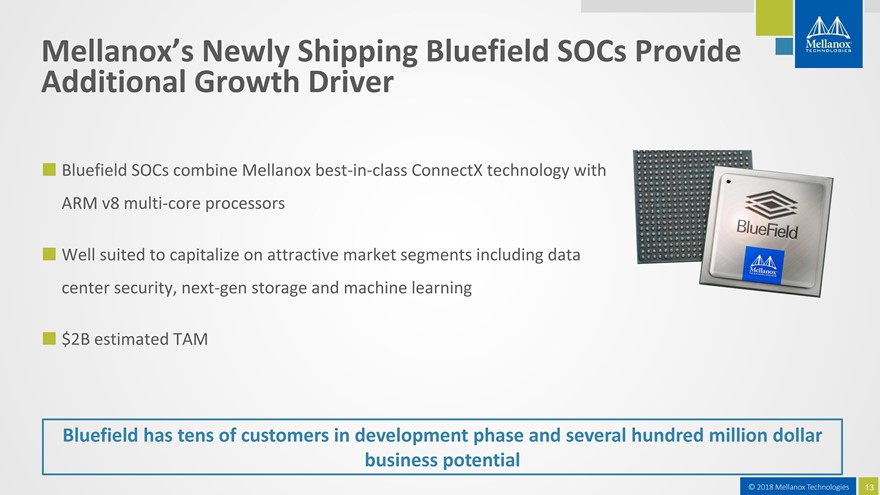
Mellanox’s Newly Shipping Bluefield SOCs
Provide
Additional Growth Driver
Bluefield SOCs combine Mellanox best-in-class ConnectX technology with ARM v8 multi-core processors
Well suited to
capitalize on attractive market segments including data center security, next-gen storage and machine learning
$2B
estimated TAM
Bluefield has tens of customers in development phase and several hundred million dollar business potential
© 2018 Mellanox Technologies 13
|
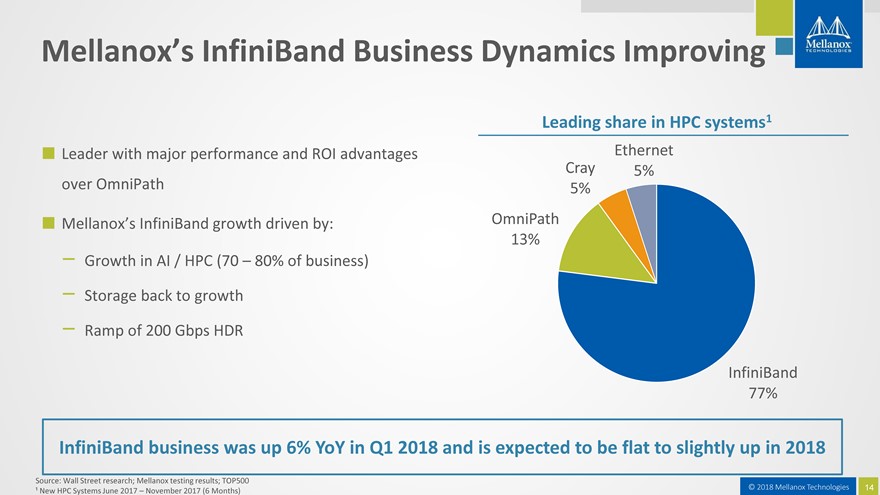
Mellanox’s InfiniBand Business Dynamics
Improving
Leading share in HPC systems1
Leader with major performance and ROI
advantages Ethernet Cray 5% over OmniPath 5%
Mellanox’s InfiniBand growth driven by: OmniPath
13%
Growth in AI / HPC (70 – 80% of business)
Storage back to growth
Ramp of 200 Gbps HDR
InfiniBand 77%
InfiniBand business was up 6% YoY in Q1 2018 and is expected to be flat to
slightly up in 2018
Source: Wall Street research; Mellanox testing results; TOP500 ¹ New HPC Systems June 2017 – November 2017 (6 Months)
© 2018 Mellanox Technologies 14
|
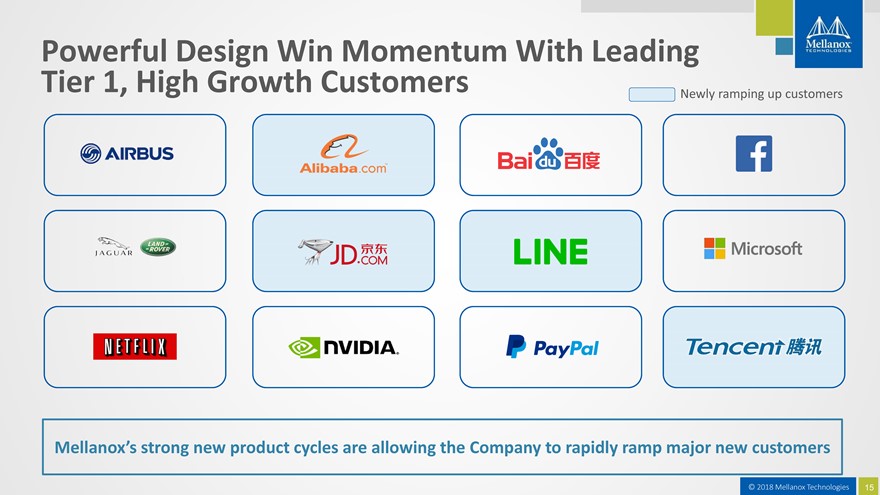
Powerful Design Win Momentum With Leading Tier 1,
High Growth Customers
Newly ramping up customers
Mellanox’s strong new
product cycles are allowing the Company to rapidly ramp major new customers
© 2018 Mellanox Technologies 15
|
Measures Taken To Enhance Operating
Performance
Addition of experienced, new independent board members
Investment reduction and rationalization (NPS, 1550nm Silicon Photonics, R&D and SG&A headcount
reduction)
Addition of a new SVP of Silicon Engineering to drive efficiencies
Portfolio and operational cost review by PwC to identify additional efficiencies and cost reduction
opportunities
© 2018 Mellanox Technologies 16
|
Disciplined ROl-driven Approach To R&D
Investment
Mellanox’s product portfolio and investments are focused on businesses with the greatest potential for high ROI
Mellanox regularly reviews operating expenses and investments on a project-by-project basis
After period of significant investment, Mellanox’s Ethernet business is solidly profitable, with expanding operating margins
As Mellanox’s revenue expands, the strong returns on its R&D investments are becoming increasingly clear
© 2018 Mellanox Technologies 17
|
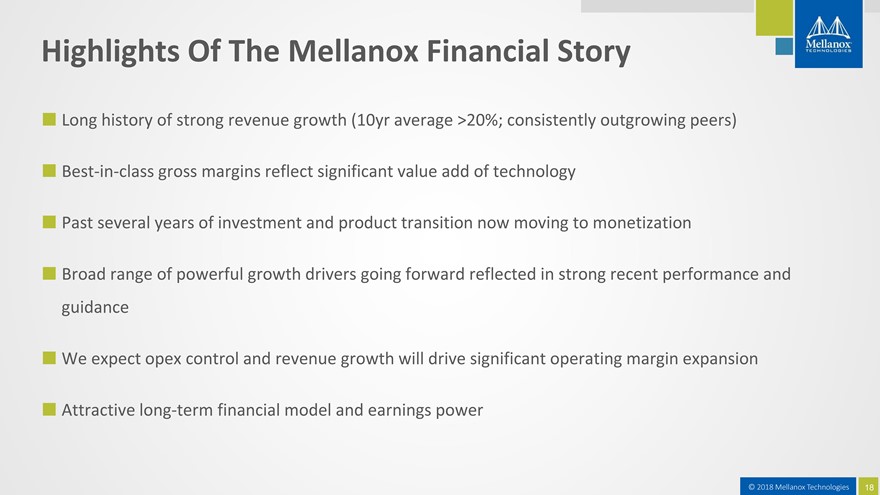
Highlights Of The Mellanox Financial Story
Long history of strong revenue growth (10yr average >20%; consistently outgrowing peers)
Best-in-class gross margins reflect significant value add of technology
Past several years of investment and product transition now moving to monetization
Broad range
of powerful growth drivers going forward reflected in strong recent performance and guidance
We expect opex control and revenue growth will drive significant
operating margin expansion
Attractive long-term financial model and earnings power
© 2018 Mellanox Technologies 18
|
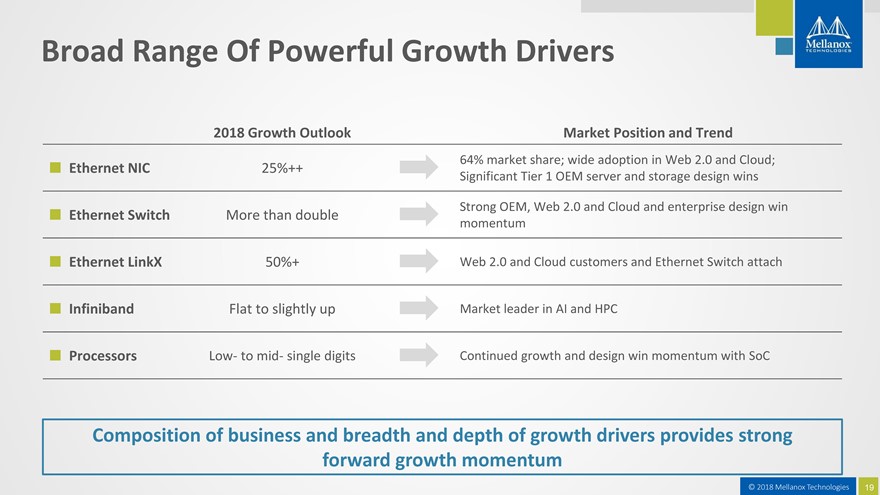
Broad Range Of Powerful Growth Drivers
2018 Growth Outlook Market Position and Trend
64% market share; wide adoption in Web 2.0 and
Cloud;
Ethernet NIC 25%++
Significant Tier 1 OEM server and storage design
wins
Strong OEM, Web 2.0 and Cloud and enterprise design win
Ethernet Switch
More than double
momentum
Ethernet LinkX 50%+ Web 2.0 and Cloud customers and
Ethernet Switch attach
Infiniband Flat to slightly up Market leader in AI and HPC
Processors Low- to mid- single digits Continued growth and design win momentum with SoC
Composition of business and breadth and depth of growth drivers provides strong
forward growth
momentum
© 2018 Mellanox Technologies 19
|
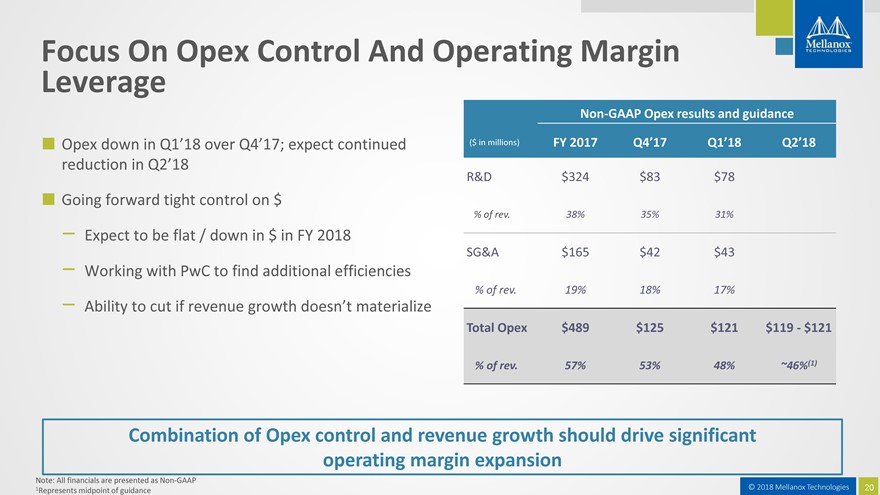
Focus On Opex Control And Operating Margin Leverage
Non-GAAP Opex results and guidance
Opex down in Q1’18 over Q4’17; expect continued ($ in millions) FY 2017 Q4’17 Q1’18 Q2’18 reduction in Q2’18
R&D $324 $83 $78
Going forward tight control on $
% of rev. 38% 35% 31%
Expect to be flat / down in $ in FY 2018
SG&A $165 $42 $43
Working with PwC to find additional efficiencies
% of rev. 19% 18% 17%
Ability to cut if revenue growth doesn’t materialize
Total Opex $489 $125 $121 $119—$121
% of rev. 57% 53% 48% ~46%(1)
Combination of Opex control and revenue growth should drive significant operating margin expansion
Note: All financials are presented as Non-GAAP Represents midpoint of guidance
1 © 2018 Mellanox Technologies 20
|
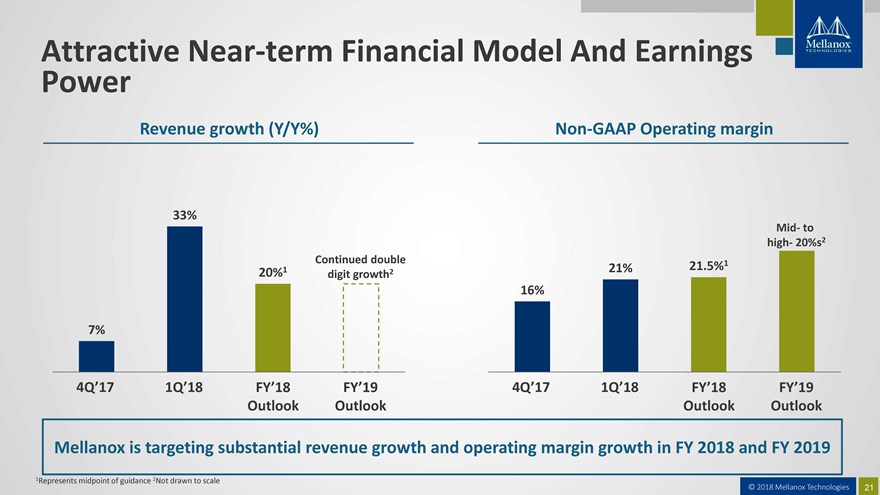
Attractive Near-term Financial Model And Earnings
Power
Revenue growth (Y/Y%) Non-GAAP Operating margin
33%
Mid- to high- 20%s2 Continued double 1
1 21% 21.5%
20% digit growth2
16%
7%
4Q’17 1Q’18 FY’18 FY’19 4Q’17 1Q’18 FY’18 FY’19
Outlook Outlook Outlook Outlook
Mellanox is targeting substantial revenue growth and operating
margins growth in FY 2018 and FY 2019
1Represents midpoint of guidance 2Not drawn to scale
© 2018 Mellanox Technologies 21

|
Mellanox Investment Highlights
Provider of critical leading technology for significant market opportunity
Diversification of
business and beginning of investment monetization
Mellanox at front end of a growth wave driven by large multi-year technology transition
Measures taken to enhance operating performance and keen focus on returns
Visibility on
significant growth in revenues, operating margins and EPS
© 2018 Mellanox Technologies 22
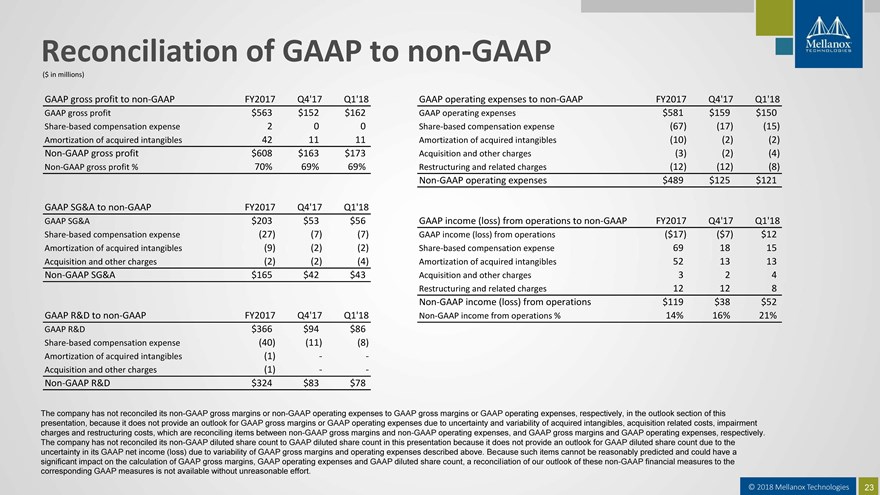
Reconciliation of GAAP to non-GAAP ($ in millions) GAAP gross profit to non-GAAP FY2017 Q4’17 Q1’18 GAAP operating expenses to non-GAAP FY2017 Q4’17 Q1’18 GAAP gross profit $563 $152 $162 GAAP operating expenses $581 $159 $150 Share-based compensation expense 2 0 0 Share-based compensation expense (67) (17) (15) Amortization of acquired intangibles 42 11 11 Amortization of acquired intangibles (10) (2) (2) Non-GAAP gross profit $608 $163 $173 Acquisition and other charges (3) (2) (4) Non-GAAP gross profit % 70% 69% 69% Restructuring and related charges (12) (12) (8) Non-GAAP operating expenses $489 $125 $121 GAAP SG&A to non-GAAP FY2017 Q4’17 Q1’18 GAAP SG&A $203 $53 $56 GAAP income (loss) from operations to non-GAAP FY2017 Q4’17 Q1’18 Share-based compensation expense (27) (7) (7) GAAP income (loss) from operations ($17) ($7) $12 Amortization of acquired intangibles (9) (2) (2) Share-based compensation expense 69 18 15 Acquisition and other charges (2) (2) (4) Amortization of acquired intangibles 52 13 13 Non-GAAP SG&A $165 $42 $43 Acquisition and other charges 3 2 4 Restructuring and related charges 12 12 8 Non-GAAP income (loss) from operations $119 $38 $52 GAAP R&D to non-GAAP FY2017 Q4’17 Q1’18 Non-GAAP income from operations % 14% 16% 21% GAAP R&D $366 $94 $86 Share-based compensation expense (40) (11) (8) Amortization of acquired intangibles (1) - - Acquisition and other charges (1) - - Non-GAAP R&D $324 $83 $78 [Graphic Appears Here] The company has not reconciled its non-GAAP gross margins or non-GAAP operating expenses to GAAP gross margins or GAAP operating expenses, respectively, in the outlook section of this presentation, because it does not provide an outlook for GAAP gross margins or GAAP operating expenses due to uncertainty and variability of acquired intangibles, acquisition related costs, impairment charges and restructuring costs, which are reconciling items between non-GAAP gross margins and non-GAAP operating expenses, and GAAP gross margins and GAAP operating expenses, respectively. The company has not reconciled its non-GAAP diluted share count to GAAP diluted share count in this presentation because it does not provide an outlook for GAAP diluted share count due to the uncertainty in its GAAP net income (loss) due to variability of GAAP gross margins and operating expenses described above. Because such items cannot be reasonably predicted and could have a significant impact on the calculation of GAAP gross margins, GAAP operating expenses and GAAP diluted share count, a reconciliation of our outlook of these non-GAAP financial measures to the corresponding GAAP measures is not available without unreasonable effort. © 2018 Mellanox Technologies 23