Attached files
| file | filename |
|---|---|
| EX-99.1 - EX-99.1 - VALMONT INDUSTRIES INC | a18-11192_1ex99d1.htm |
| 8-K - 8-K - VALMONT INDUSTRIES INC | a18-11192_18k.htm |
Forward-looking Statement Disclosure These slides contain (and the accompanying oral discussion will contain) “forward-looking statements” within the meaning of the Private Securities Litigation Reform Act of 1995. Such statements involve known and unknown risks, uncertainties and other factors that could cause the actual results of the Company to differ materially from the results expressed or implied by such statements, including general economic and business conditions, conditions affecting the industries served by the Company and its subsidiaries, conditions affecting the Company’s customers and suppliers, competitor responses to the Company’s products and services, the overall market acceptance of such products and services, the integration of acquisitions and other factors disclosed in the Company’s periodic reports filed with the Securities and Exchange Commission. Consequently such forward-looking statements should be regarded as the Company’s current plans, estimates and beliefs. The Company does not undertake and specifically declines any obligation to publicly release the results of any revisions to these forward-looking statements that may be made to reflect any future events or circumstances after the date of such statements or to reflect the occurrence of anticipated or unanticipated events. 2 April 19, 2018 Valmont Industries, Inc. Q1 2018 Earnings Presentation
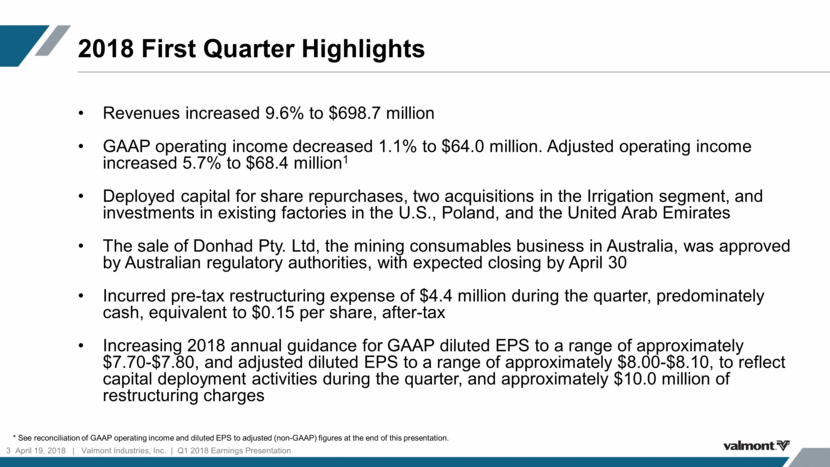
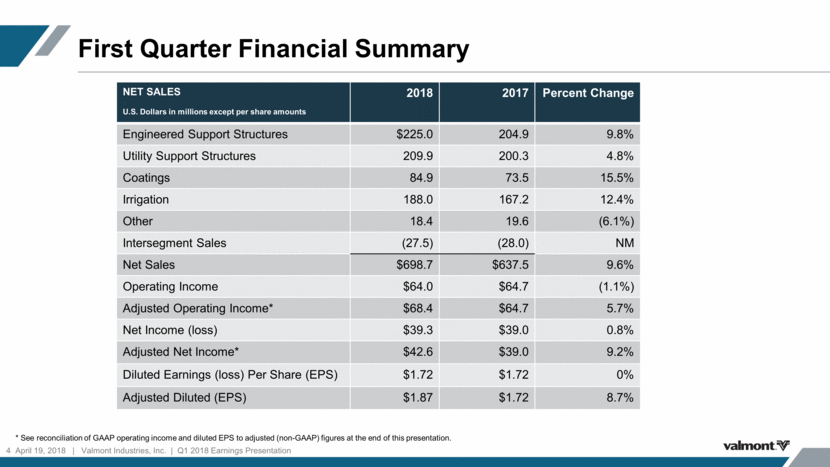
2018 First Quarter Highlights Revenues increased 9.6% to $698.7 million GAAP operating income decreased 1.1% to $64.0 million. Adjusted operating income increased 5.7% to $68.4 million1 Deployed capital for share repurchases, two acquisitions in the Irrigation segment, and investments in existing factories in the U.S., Poland, and the United Arab Emirates The sale of Donhad Pty. Ltd, the mining consumables business in Australia, was approved by Australian regulatory authorities, with expected closing by April 30 Incurred pre-tax restructuring expense of $4.4 million during the quarter, predominately cash, equivalent to $0.15 per share, after-tax Increasing 2018 annual guidance for GAAP diluted EPS to a range of approximately $7.70-$7.80, and adjusted diluted EPS to a range of approximately $8.00-$8.10, to reflect capital deployment activities during the quarter, and approximately $10.0 million of restructuring charges 3 April 19, 2018 Valmont Industries, Inc. Q1 2018 Earnings Presentation * See reconciliation of GAAP operating income and diluted EPS to adjusted (non-GAAP) figures at the end of this presentation.
First Quarter Financial Summary 4 April 19, 2018 Valmont Industries, Inc. Q1 2018 Earnings Presentation * See reconciliation of GAAP operating income and diluted EPS to adjusted (non-GAAP) figures at the end of this presentation. NET SALES U.S. Dollars in millions except per share amounts 2018 2017 Percent Change Engineered Support Structures $225.0 204.9 9.8% Utility Support Structures 209.9 200.3 4.8% Coatings 84.9 73.5 15.5% Irrigation 188.0 167.2 12.4% Other 18.4 19.6 (6.1%) Intersegment Sales (27.5) (28.0) NM Net Sales $698.7 $637.5 9.6% Operating Income $64.0 $64.7 (1.1%) Adjusted Operating Income* $68.4 $64.7 5.7% Net Income (loss) $39.3 $39.0 0.8% Adjusted Net Income* $42.6 $39.0 9.2% Diluted Earnings (loss) Per Share (EPS) $1.72 $1.72 0% Adjusted Diluted (EPS) $1.87 $1.72 8.7%
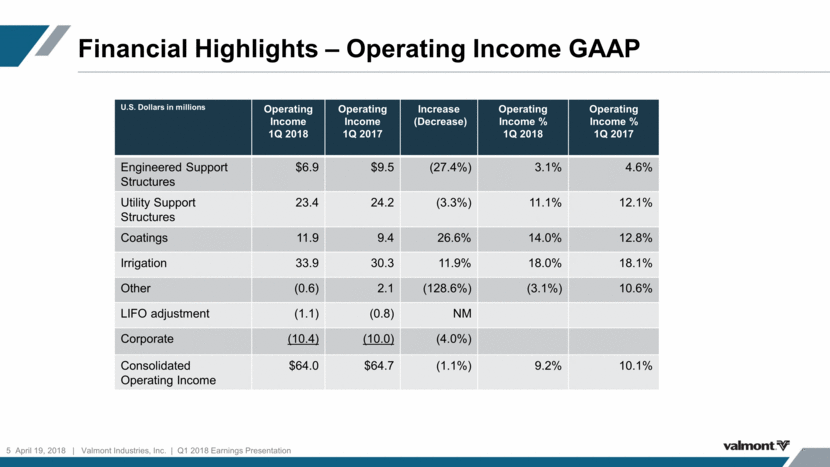
Financial Highlights – Operating Income GAAP 5 April 19, 2018 Valmont Industries, Inc. Q1 2018 Earnings Presentation U.S. Dollars in millions Operating Income 1Q 2018 Operating Income 1Q 2017 Increase (Decrease) Operating Income % 1Q 2018 Operating Income % 1Q 2017 Engineered Support Structures $6.9 $9.5 (27.4%) 3.1% 4.6% Utility Support Structures 23.4 24.2 (3.3%) 11.1% 12.1% Coatings 11.9 9.4 26.6% 14.0% 12.8% Irrigation 33.9 30.3 11.9% 18.0% 18.1% Other (0.6) 2.1 (128.6%) (3.1%) 10.6% LIFO adjustment (1.1) (0.8) NM Corporate (10.4) (10.0) (4.0%) Consolidated Operating Income $64.0 $64.7 (1.1%) 9.2% 10.1%
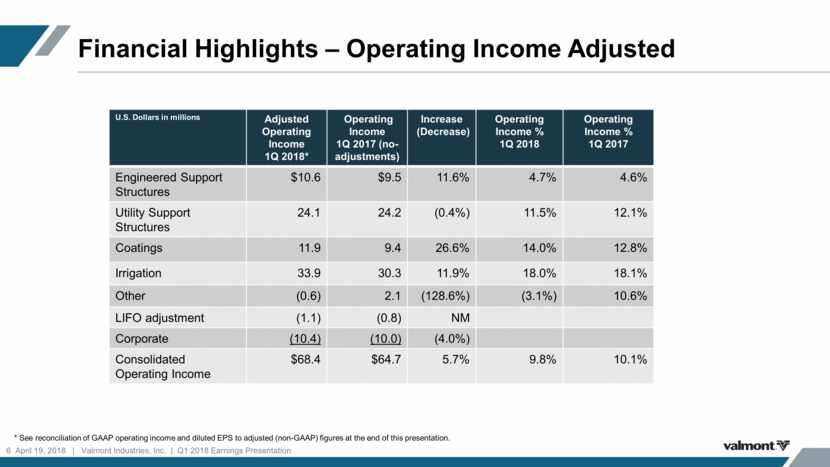
Financial Highlights – Operating Income Adjusted 6 April 19, 2018 Valmont Industries, Inc. Q1 2018 Earnings Presentation * See reconciliation of GAAP operating income and diluted EPS to adjusted (non-GAAP) figures at the end of this presentation. U.S. Dollars in millions Adjusted Operating Income 1Q 2018* Operating Income 1Q 2017 (no-adjustments) Increase (Decrease) Operating Income % 1Q 2018 Operating Income % 1Q 2017 Engineered Support Structures $10.6 $9.5 11.6% 4.7% 4.6% Utility Support Structures 24.1 24.2 (0.4%) 11.5% 12.1% Coatings 11.9 9.4 26.6% 14.0% 12.8% Irrigation 33.9 30.3 11.9% 18.0% 18.1% Other (0.6) 2.1 (128.6%) (3.1%) 10.6% LIFO adjustment (1.1) (0.8) NM Corporate (10.4) (10.0) (4.0%) Consolidated Operating Income $68.4 $64.7 5.7% 9.8% 10.1%
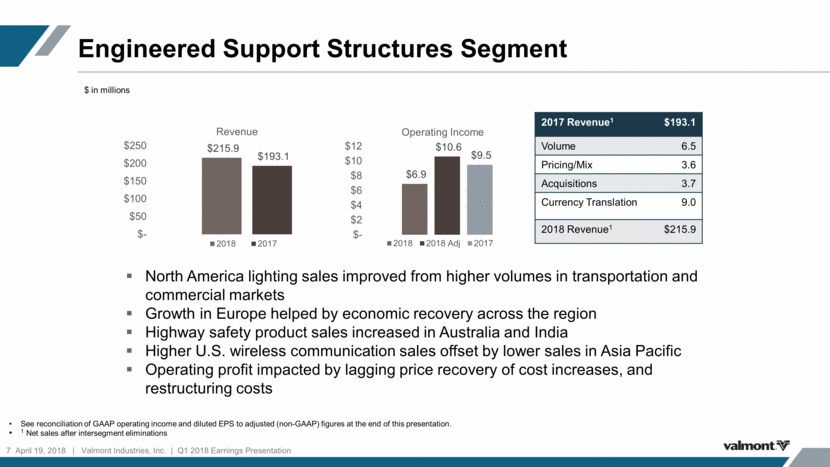
Engineered Support Structures Segment 7 April 19, 2018 Valmont Industries, Inc. Q1 2018 Earnings Presentation 2017 Revenue1 $193.1 Volume 6.5 Pricing/Mix 3.6 Acquisitions 3.7 Currency Translation 9.0 2018 Revenue1 $215.9 North America lighting sales improved from higher volumes in transportation and commercial markets Growth in Europe helped by economic recovery across the region Highway safety product sales increased in Australia and India Higher U.S. wireless communication sales offset by lower sales in Asia Pacific Operating profit impacted by lagging price recovery of cost increases, and restructuring costs See reconciliation of GAAP operating income and diluted EPS to adjusted (non-GAAP) figures at the end of this presentation. 1 Net sales after intersegment eliminations $ in millions $6.9 $10.6 $9.5 $- $2 $4 $6 $8 $10 $12 Operating Income 2018 2018 Adj 2017 $215.9 $193.1 $- $50 $100 $150 $200 $250 Revenue 2018 2017
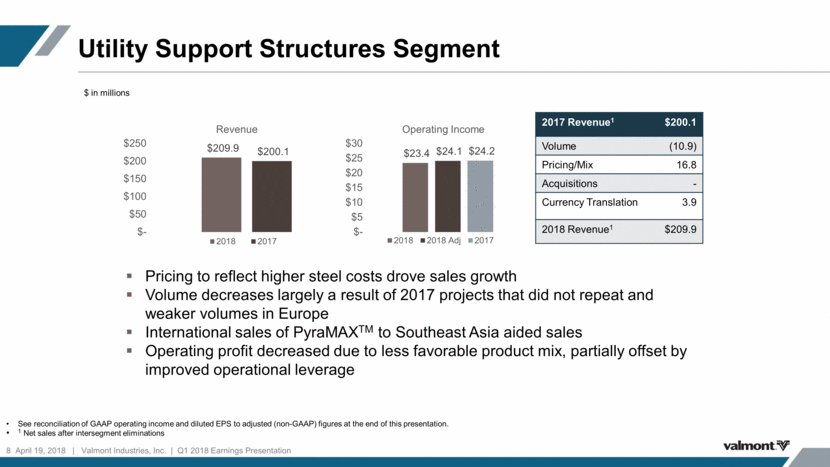
Utility Support Structures Segment 8 April 19, 2018 Valmont Industries, Inc. Q1 2018 Earnings Presentation See reconciliation of GAAP operating income and diluted EPS to adjusted (non-GAAP) figures at the end of this presentation. 1 Net sales after intersegment eliminations 2017 Revenue1 $200.1 Volume (10.9) Pricing/Mix 16.8 Acquisitions - Currency Translation 3.9 2018 Revenue1 $209.9 $ in millions Pricing to reflect higher steel costs drove sales growth Volume decreases largely a result of 2017 projects that did not repeat and weaker volumes in Europe International sales of PyraMAXTM to Southeast Asia aided sales Operating profit decreased due to less favorable product mix, partially offset by improved operational leverage $23.4 $24.1 $24.2 $- $5 $10 $15 $20 $25 $30 Operating Income 2018 2018 Adj 2017 $209.9 $200.1 $- $50 $100 $150 $200 $250 Revenue 2018 2017
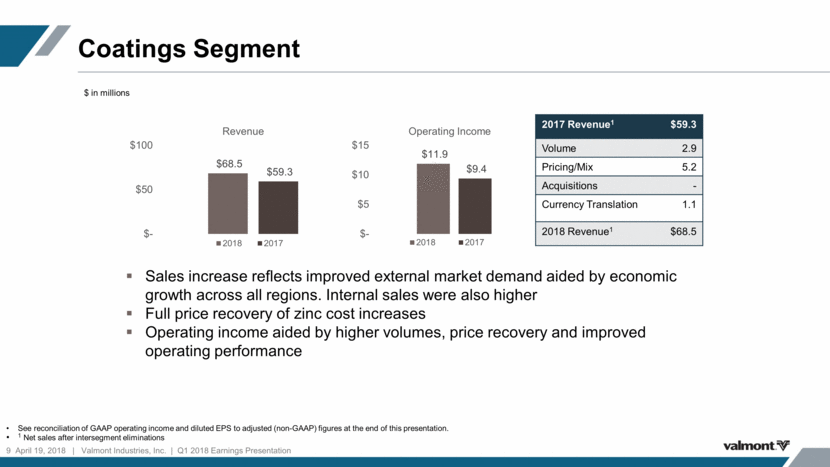
Coatings Segment 9 April 19, 2018 Valmont Industries, Inc. Q1 2018 Earnings Presentation See reconciliation of GAAP operating income and diluted EPS to adjusted (non-GAAP) figures at the end of this presentation. 1 Net sales after intersegment eliminations 2017 Revenue1 $59.3 Volume 2.9 Pricing/Mix 5.2 Acquisitions - Currency Translation 1.1 2018 Revenue1 $68.5 $ in millions Sales increase reflects improved external market demand aided by economic growth across all regions. Internal sales were also higher Full price recovery of zinc cost increases Operating income aided by higher volumes, price recovery and improved operating performance $11.9 $9.4 $- $5 $10 $15 Operating Income 2018 2017 $68.5 $59.3 $- $50 $100 Revenue 2018 2017
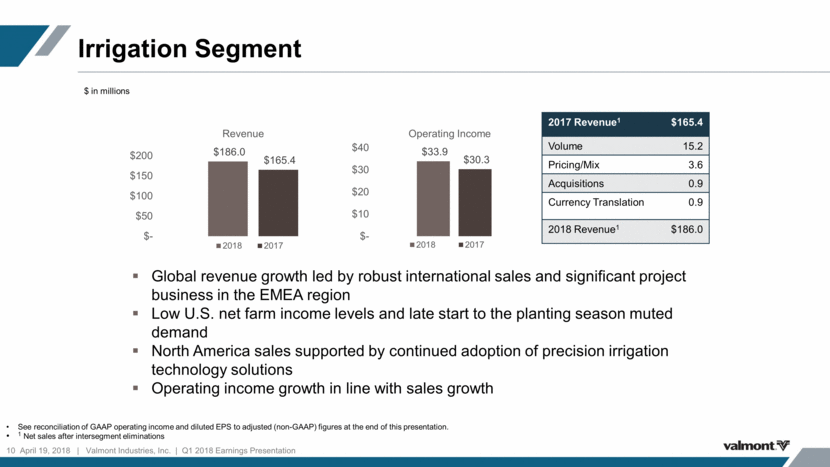
Irrigation Segment 10 April 19, 2018 Valmont Industries, Inc. Q1 2018 Earnings Presentation See reconciliation of GAAP operating income and diluted EPS to adjusted (non-GAAP) figures at the end of this presentation. 1 Net sales after intersegment eliminations 2017 Revenue1 $165.4 Volume 15.2 Pricing/Mix 3.6 Acquisitions 0.9 Currency Translation 0.9 2018 Revenue1 $186.0 $ in millions Global revenue growth led by robust international sales and significant project business in the EMEA region Low U.S. net farm income levels and late start to the planting season muted demand North America sales supported by continued adoption of precision irrigation technology solutions Operating income growth in line with sales growth $33.9 $30.3 $- $10 $20 $30 $40 Operating Income 2018 2017 $186.0 $165.4 $- $50 $100 $150 $200 Revenue 2018 2017
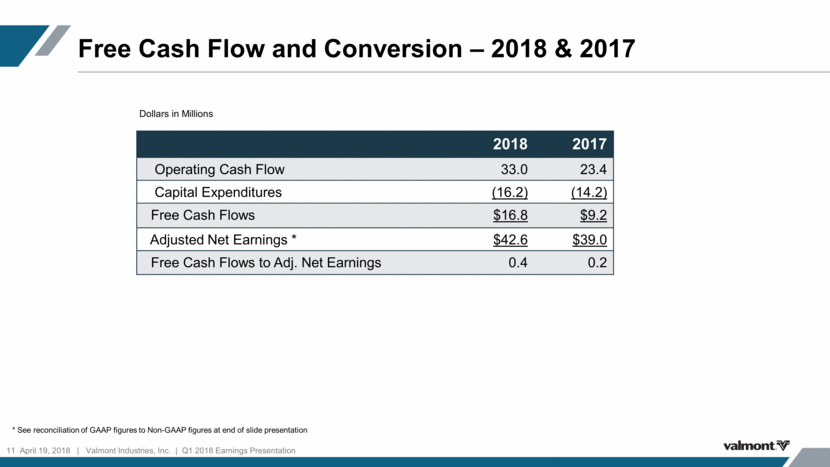
Free Cash Flow and Conversion – 2018 & 2017 11 April 19, 2018 Valmont Industries, Inc. Q1 2018 Earnings Presentation 2018 2017 Operating Cash Flow 33.0 23.4 Capital Expenditures (16.2) (14.2) Free Cash Flows $16.8 $9.2 Adjusted Net Earnings * $42.6 $39.0 Free Cash Flows to Adj. Net Earnings 0.4 0.2 * See reconciliation of GAAP figures to Non-GAAP figures at end of slide presentation Dollars in Millions
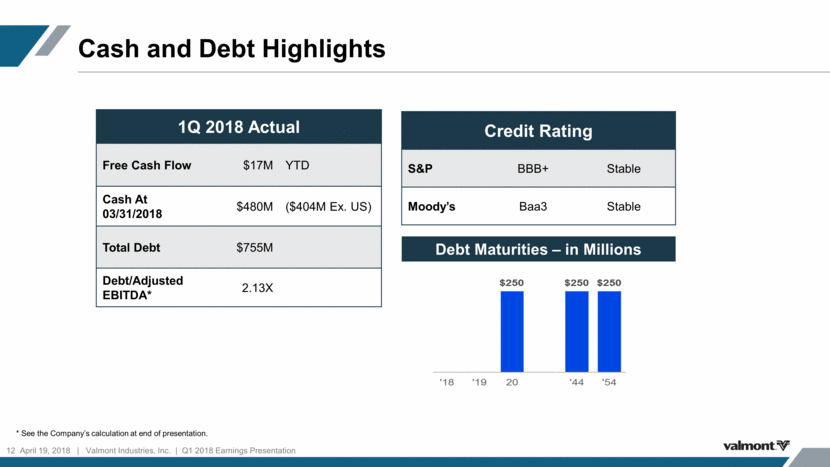
Cash and Debt Highlights 12 April 19, 2018 Valmont Industries, Inc. Q1 2018 Earnings Presentation 1Q 2018 Actual Free Cash Flow $17M YTD Cash At 03/31/2018 $480M ($404M Ex. US) Total Debt $755M Debt/Adjusted EBITDA* 2.13X Credit Rating S&P BBB+ Stable Moody’s Baa3 Stable * See the Company’s calculation at end of presentation. Debt Maturities – in Millions
ApPENDIX 13 April 19, 2018 Valmont Industries, Inc. Q1 2018 Earnings Presentation
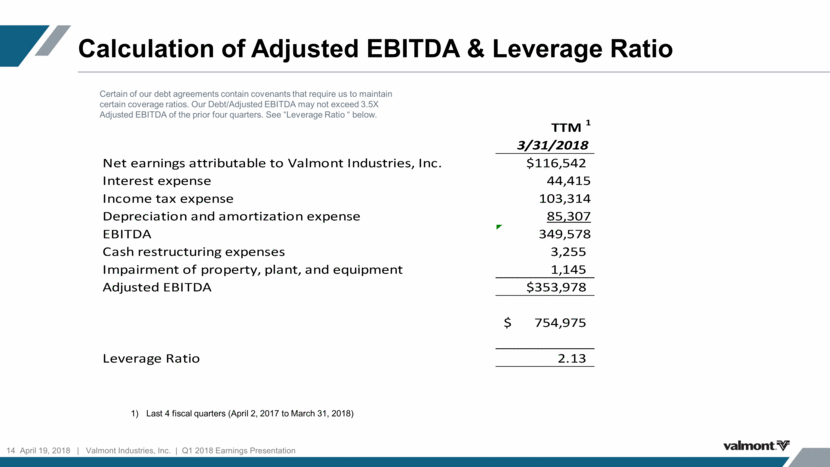
Calculation of Adjusted EBITDA & Leverage Ratio 14 April 19, 2018 Valmont Industries, Inc. Q1 2018 Earnings Presentation Last 4 fiscal quarters (April 2, 2017 to March 31, 2018) Certain of our debt agreements contain covenants that require us to maintain certain coverage ratios. Our Debt/Adjusted EBITDA may not exceed 3.5X Adjusted EBITDA of the prior four quarters. See “Leverage Ratio “ below. TTM 1 3/31/2018 Net earnings attributable to Valmont Industries, Inc. $116,542 Interest expense 44,415 Income tax expense 103,314 Depreciation and amortization expense 85,307 EBITDA 349,578 Cash restructuring expenses 3,255 Impairment of property, plant, and equipment 1,145 Adjusted EBITDA $353,978 $ 754,975 Leverage Ratio 2.13
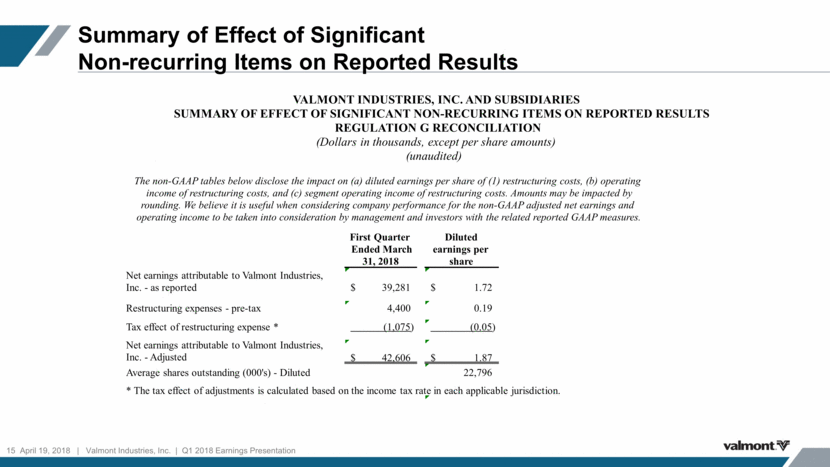
Summary of Effect of Significant Non-recurring Items on Reported Results 15 April 19, 2018 Valmont Industries, Inc. Q1 2018 Earnings Presentation First Quarter Ended March 31, 2018 Diluted earnings per share Net earnings attributable to Valmont Industries, Inc. - as reported 39,281 $ 1.72 $ Restructuring expenses - pre-tax 4,400 0.19 Tax effect of restructuring expense * (1,075) (0.05) Net earnings attributable to Valmont Industries, Inc. - Adjusted 42,606 $ 1.87 $ Average shares outstanding (000's) - Diluted 22,796 * The tax effect of adjustments is calculated based on the income tax rate in each applicable jurisdiction. The non-GAAP tables below disclose the impact on (a) diluted earnings per share of (1) restructuring costs, (b) operating income of restructuring costs, and (c) segment operating income of restructuring costs. Amounts may be impacted by rounding. We believe it is useful when considering company performance for the non-GAAP adjusted net earnings and operating income to be taken into consideration by management and investors with the related reported GAAP measures. VALMONT INDUSTRIES, INC. AND SUBSIDIARIES SUMMARY OF EFFECT OF SIGNIFICANT NON-RECURRING ITEMS ON REPORTED RESULTS REGULATION G RECONCILIATION (Dollars in thousands, except per share amounts) (unaudited)
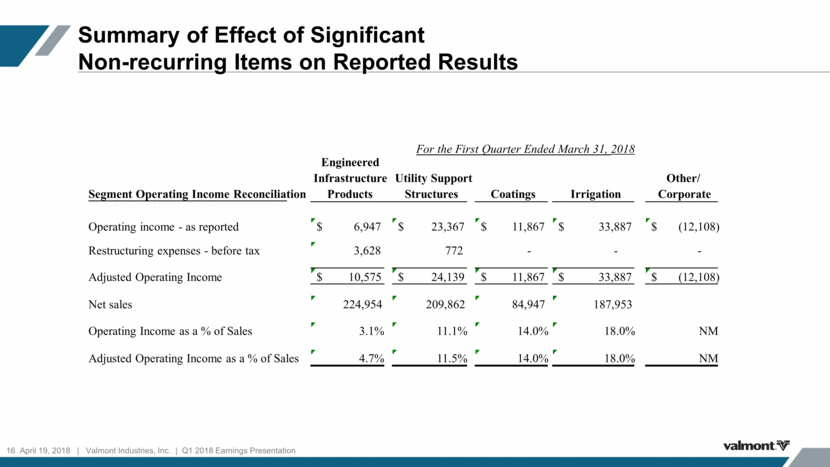
Summary of Effect of Significant Non-recurring Items on Reported Results 16 April 19, 2018 Valmont Industries, Inc. Q1 2018 Earnings Presentation Segment Operating Income Reconciliation Engineered Infrastructure Products Utility Support Structures Coatings Irrigation Other/ Corporate Operating income - as reported 6,947 $ 23,367 $ 11,867 $ 33,887 $ (12,108) $ Restructuring expenses - before tax 3,628 772 - - - Adjusted Operating Income 10,575 $ 24,139 $ 11,867 $ 33,887 $ (12,108) $ Net sales 224,954 209,862 84,947 187,953 Operating Income as a % of Sales 3.1% 11.1% 14.0% 18.0% NM Adjusted Operating Income as a % of Sales 4.7% 11.5% 14.0% 18.0% NM For the First Quarter Ended March 31, 2018
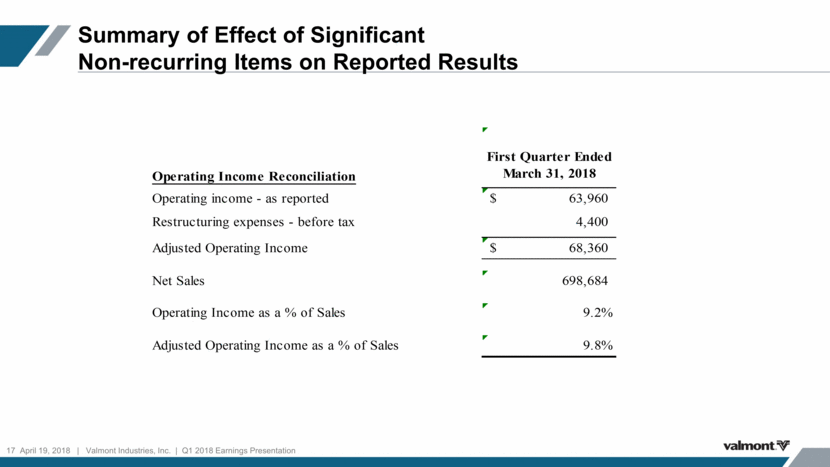
Summary of Effect of Significant Non-recurring Items on Reported Results 17 April 19, 2018 Valmont Industries, Inc. Q1 2018 Earnings Presentation Operating Income Reconciliation First Quarter Ended March 31, 2018 Operating income - as reported 63,960 $ Restructuring expenses - before tax 4,400 Adjusted Operating Income 68,360 $ Net Sales 698,684 Operating Income as a % of Sales 9.2% Adjusted Operating Income as a % of Sales 9.8%