Attached files
| file | filename |
|---|---|
| 8-K - 8-K - REPUBLIC BANCORP INC /KY/ | f8-k.htm |
Exhibit 99.1
|
|
Annual Meeting of Shareholders April 19, 2018 republic Bancorp It’s just easier here. RBCAA NASDAQ LISTED |
|
|
During the course of this presentation, we will be providing you with a discussion of some of the factors we currently anticipate may influence the future results of Republic Bancorp, Inc. (“Republic” or the “Company”), as well as certain financial projections. We want to emphasize that these forward-looking statements involve judgment, and that individual judgments may vary. Moreover, these statements are based on limited information available to us now, which is subject to change. Actual results may differ substantially from what we say today and no one should assume later that the comments we provide today are still valid. They speak only as of today. Specific risk factors that could change causing our projections not to be achieved are discussed in the “Risk Factors” section of our Form 10-K filed with the Securities and Exchange Commission (“SEC”) on March 9, 2018, and other reports filed with the SEC from time to time. 2 Safe Harbor |
|
|
STEVE TRAGER Chairman and Chief Executive Officer 3 |
|
|
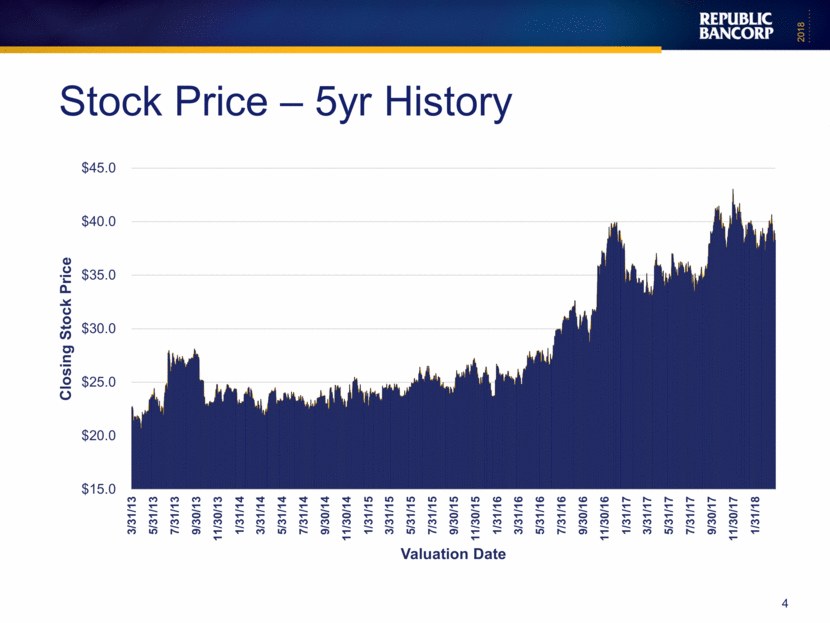
4 Stock Price – 5yr History $45.0 $40.0 $35.0 $30.0 $25.0 $20.0 $15.0 3/31/13 5/31/13 7/31/13 9/30/13 11/30/13 1/31/14 3/31/14 5/31/14 7/31/14 9/30/14 11/30/14 1/31/15 3/31/15 5/31/15 7/31/15 9/30/15 11/30/15 1/31/16 3/31/16 5/31/16 7/31/16 9/30/16 11/30/16 1/31/17 3/31/17 5/31/17 7/31/17 9/30/17 11/30/17 1/31/18 Closing Stock Price Valuation Date |
|
|
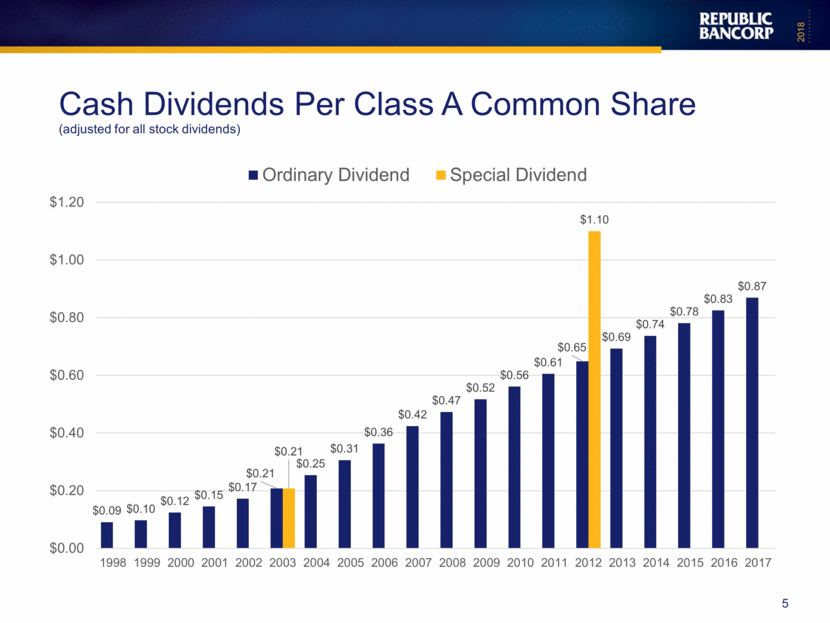
5 Cash Dividends Per Class A Common Share (adjusted for all stock dividends) Ordinary dividend Special dividend $1.20 $1.00 $0.80 $0.60 $0.40 $0.20 $0.00 1998 1999 2000 2001 2002 2003 2004 2005 2006 2007 2008 2009 2010 2011 2012 2013 2014 2015 2016 2017 $0.09 $0.10 $0.12 $0.15 $0.17 $0.21 $0.25 $0.31 $0.36 $0.42 $0.47 $0.52 $0.56 $0.61 $0.65 $1.10 $0.69 $0.74 $0.78 $0.83 $0.87 |
|
|
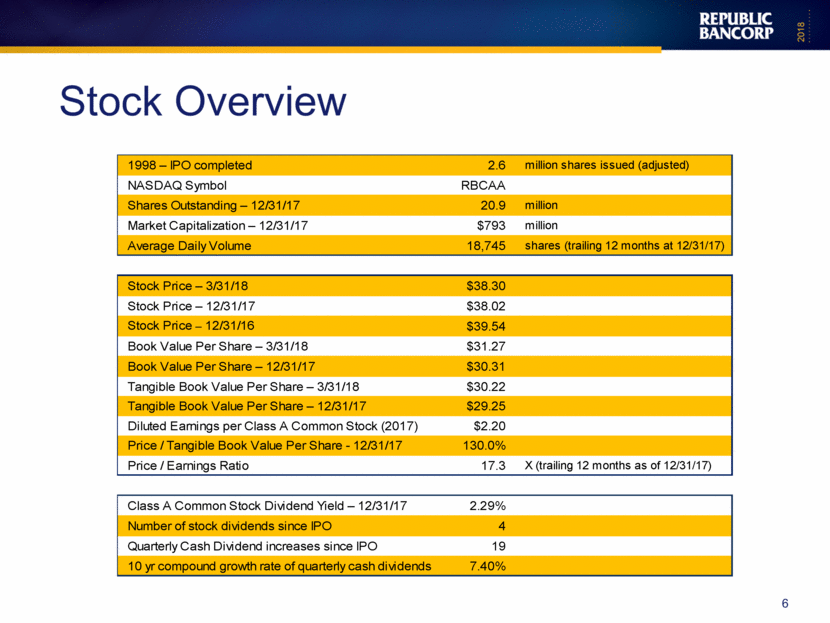
6 Stock Overview 1998 – IPO completed 2.6 million shares issued (adjusted) NASDAQ Symbol RBCAA Shares Outstanding – 12/31/17 20.9 million Market Capitalization – 12/31/17 $793 million Average Daily Volume 18,745 shares (trailing 12 months at 12/31/17) Stock Price – 3/31/18 $38.30 Stock Price – 12/31/17 $38.02 Stock Price – 12/31/16 $39.54 Book Value Per Share – 3/31/18 $31.27 Book Value Per Share – 12/31/17 $30.31 Tangible Book Value Per Share – 3/31/18 $30.22 Tangible Book Value Per Share – 12/31/17 $29.25 Diluted Earnings per Class A Common Stock (2017) $2.20 Price / Tangible Book Value Per Share - 12/31/17 130.0% Price / Earnings Ratio 17.3 X (trailing 12 months as of 12/31/17) Class A Common Stock Dividend Yield – 12/31/17 2.29% Number of stock dividends since IPO 4 Quarterly Cash Dividend increases since IPO 19 10 yr compound growth rate of quarterly cash dividends 7.40% |
|
|
Highlights Year ended December 31, 2017 7 |
|
|
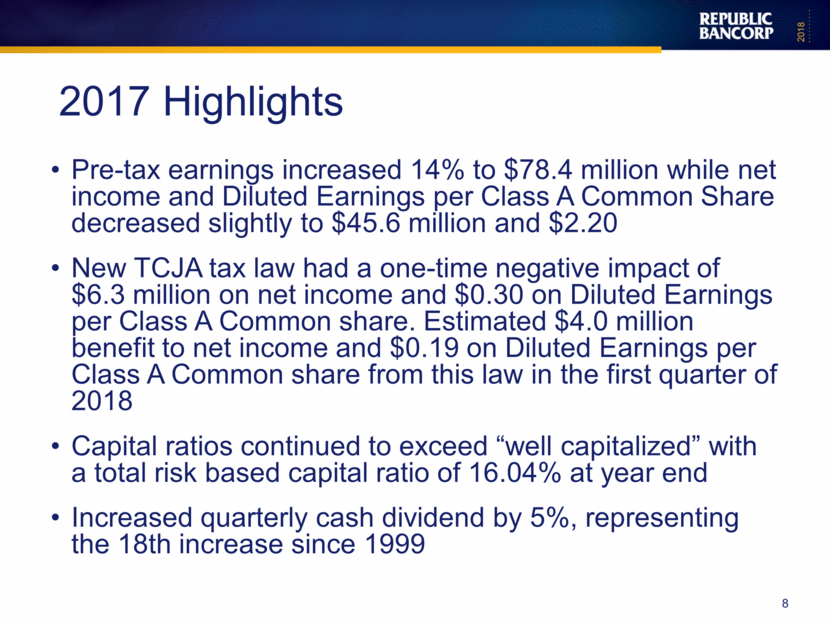
2017 Highlights Pre-tax earnings increased 14% to $78.4 million while net income and Diluted Earnings per Class A Common Share decreased slightly to $45.6 million and $2.20 New TCJA tax law had a one-time negative impact of $6.3 million on net income and $0.30 on Diluted Earnings per Class A Common share. Estimated $4.0 million benefit to net income and $0.19 on Diluted Earnings per Class A Common share from this law in the first quarter of 2018 Capital ratios continued to exceed “well capitalized” with a total risk based capital ratio of 16.04% at year end Increased quarterly cash dividend by 5%, representing the 18th increase since 1999 8 2017 Highlights |
|
|
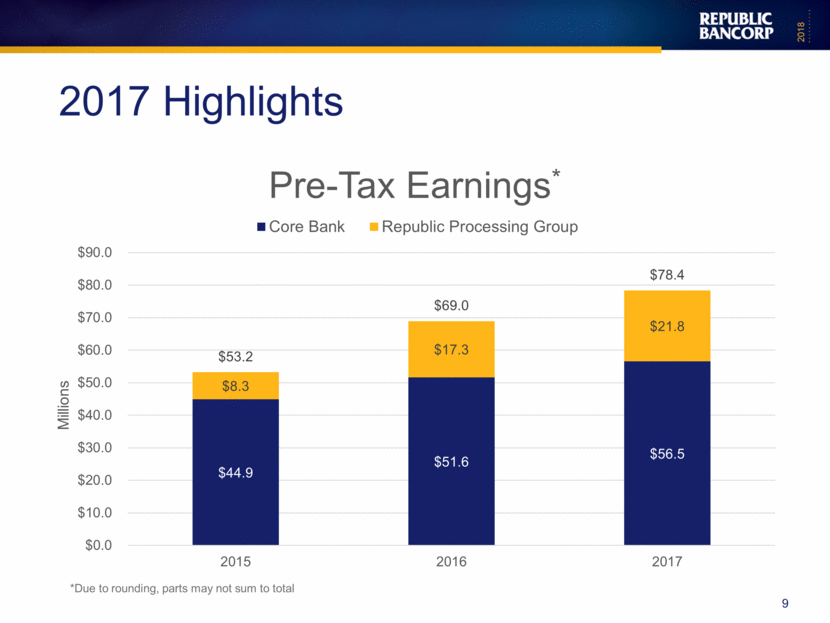
9 2017 Highlights *Due to rounding, parts may not sum to total Pre-Tax Earnings* Core Bank Republic Processing Group $90.0 $80.0 $70.0 $60.0 $50.0 $40.0 $30.0 $20.0 $10.0 $0.0 $53.0 $8.3 $44.9 2015 $69.0 $17.3 $51.6 2016 $78.4 $21.8 $56.5 2017 Millions |
|
|
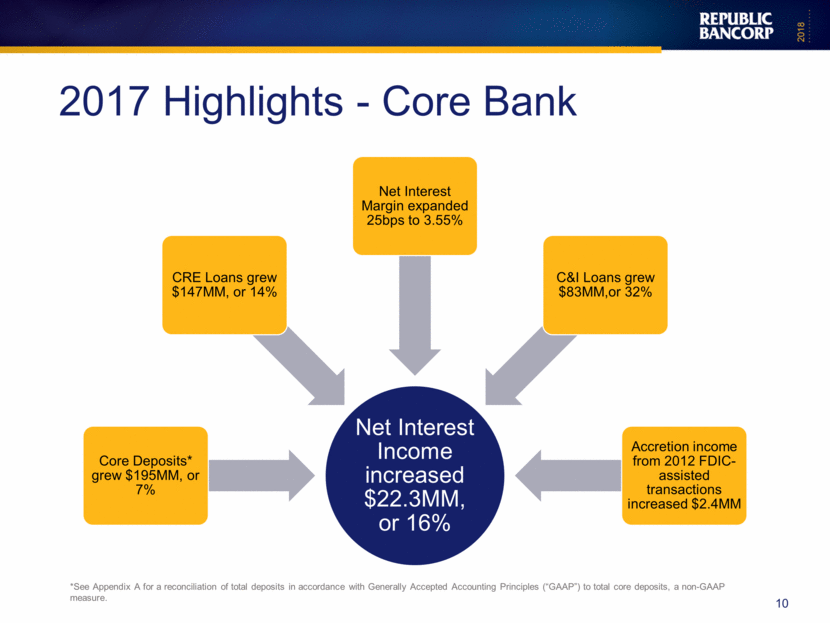
10 2017 Highlights - Core Bank *See Appendix A for a reconciliation of total deposits in accordance with Generally Accepted Accounting Principles (“GAAP”) to total core deposits, a non-GAAP measure. Net Interest Income increased $22.3MM, or 16% Core Deposits* grew $195MM, or 7% CRE Loans grew $147MM, or 14% Net Interest Margin expanded 25bps to 3.55% C&I Loans grew $83MM,or 32% Accretion income from 2012 FDIC-assisted transactions increased $2.4MM |
|
|
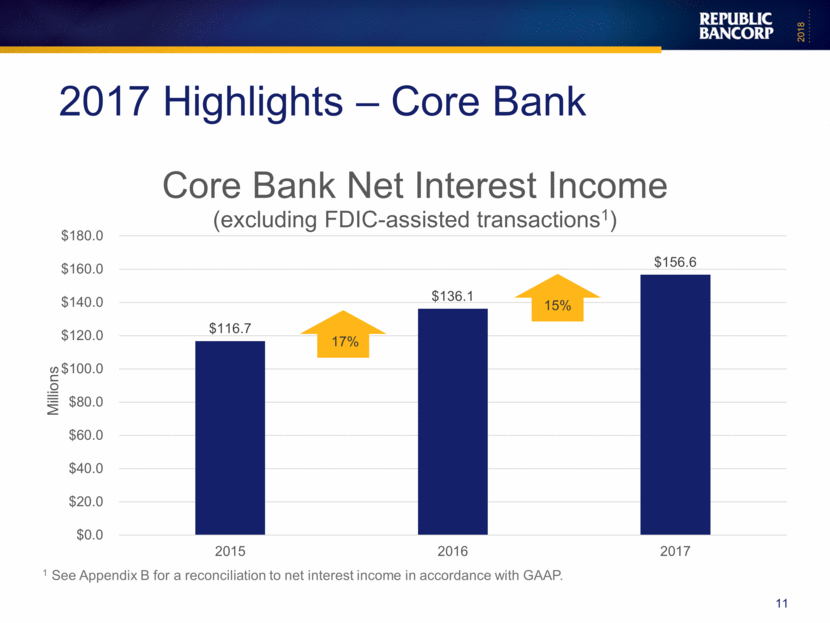
11 2017 Highlights – Core Bank 17% 15% 1 See Appendix B for a reconciliation to net interest income in accordance with GAAP. $0.0 $20.0 $40.0 $60.0 $80.0 $100.0 $120.0 $140.0 $160.0 $180.0 $116.7 2015 2016 2017 $136.1 $156.6 |
|
|
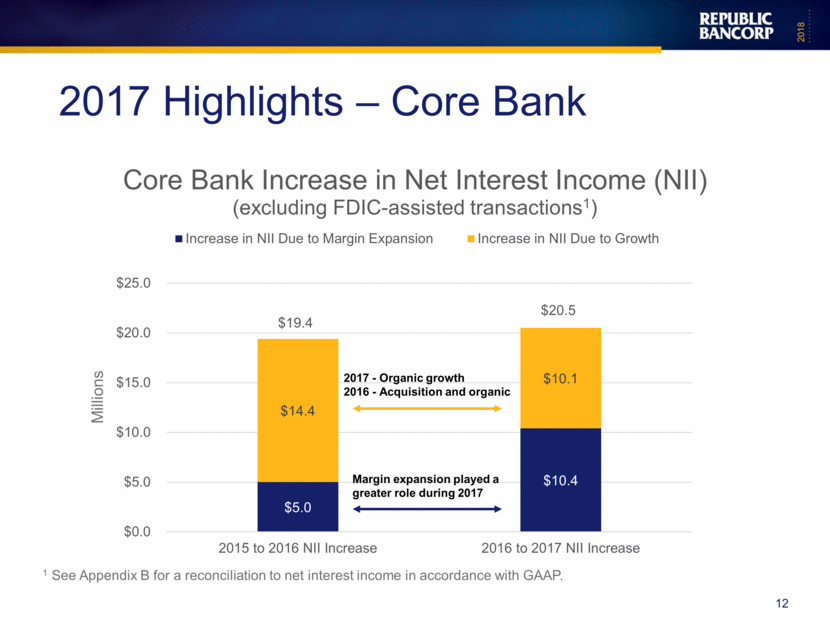
12 2017 Highlights – Core Bank Millions Margin expansion played a greater role during 2017 2017 - Organic growth 2016 - Acquisition and organic 1 See Appendix B for a reconciliation to net interest income in accordance with GAAP. $19.4 $20.5 $0.0 $50.0 $10.0 $15.0 $20.0 $25.0 2015 to 2016 NII increase 2016 to 2017 NII Increase $14.4 $10.1 |
|
|
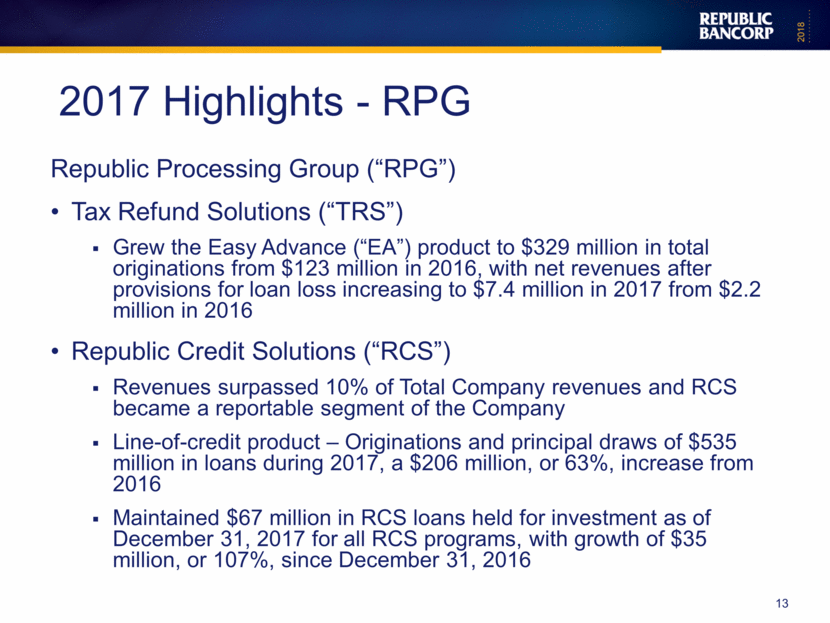
Republic Processing Group (“RPG”) Tax Refund Solutions (“TRS”) Grew the Easy Advance (“EA”) product to $329 million in total originations from $123 million in 2016, with net revenues after provisions for loan loss increasing to $7.4 million in 2017 from $2.2 million in 2016 Republic Credit Solutions (“RCS”) Revenues surpassed 10% of Total Company revenues and RCS became a reportable segment of the Company Line-of-credit product – Originations and principal draws of $535 million in loans during 2017, a $206 million, or 63%, increase from 2016 Maintained $67 million in RCS loans held for investment as of December 31, 2017 for all RCS programs, with growth of $35 million, or 107%, since December 31, 2016 13 2017 Highlights - RPG |
|
|
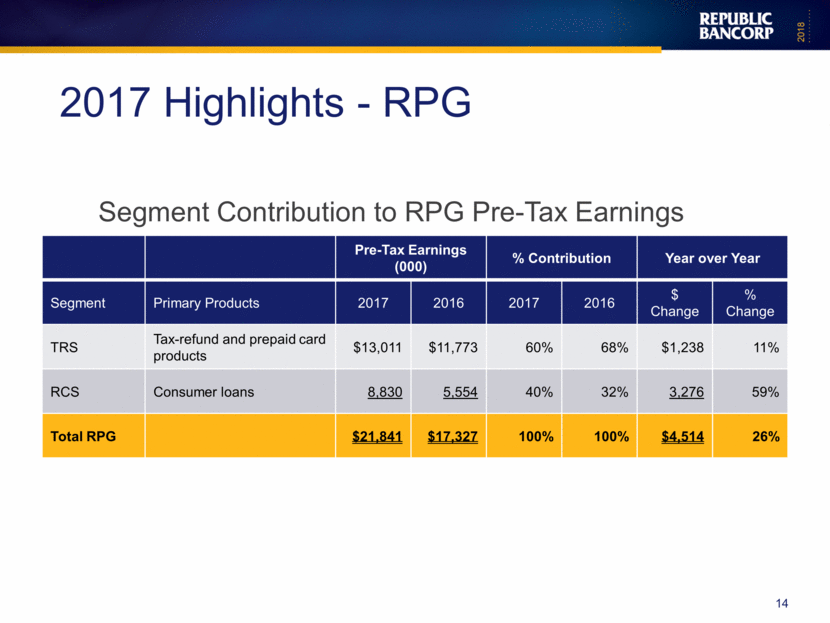
Pre-Tax Earnings (000) % Contribution Year over Year Segment Primary Products 2017 2016 2017 2016 $ Change % Change TRS Tax-refund and prepaid card products $13,011 $11,773 60% 68% $1,238 11% RCS Consumer loans 8,830 5,554 40% 32% 3,276 59% Total RPG $21,841 $17,327 100% 100% $4,514 26% 14 2017 Highlights - RPG Segment Contribution to RPG Pre-Tax Earnings |
|
|
Balance Sheet 15 |
|
|
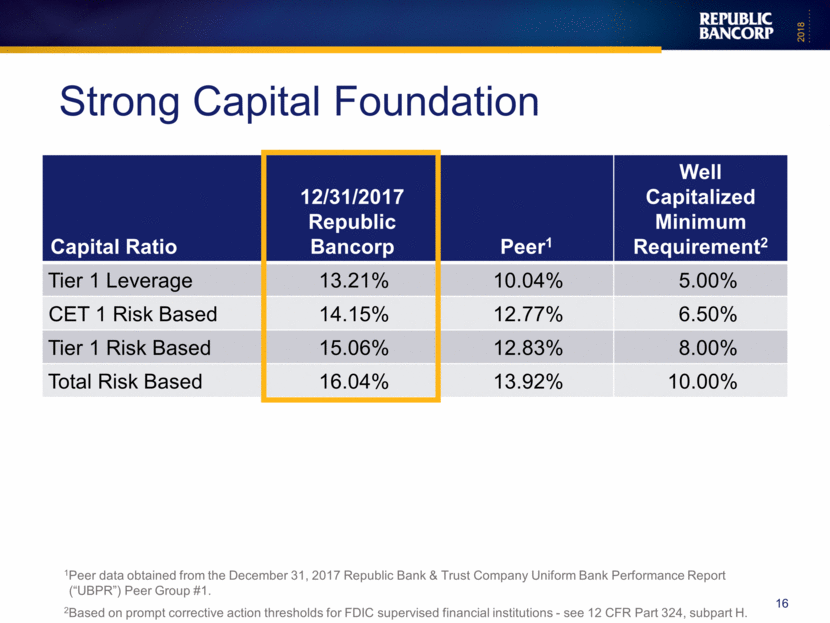
Capital Ratio 12/31/2017 Republic Bancorp Peer1 Well Capitalized Minimum Requirement2 Tier 1 Leverage 13.21% 10.04% 5.00% CET 1 Risk Based 14.15% 12.77% 6.50% Tier 1 Risk Based 15.06% 12.83% 8.00% Total Risk Based 16.04% 13.92% 10.00% 16 Strong Capital Foundation 1Peer data obtained from the December 31, 2017 Republic Bank & Trust Company Uniform Bank Performance Report (“UBPR”) Peer Group #1. 2Based on prompt corrective action thresholds for FDIC supervised financial institutions - see 12 CFR Part 324, subpart H. |
|
|
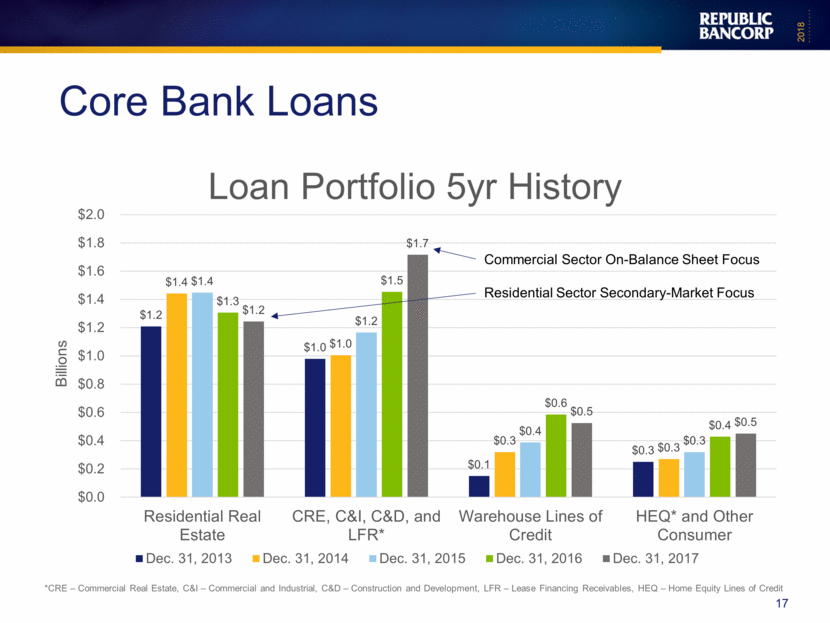
17 Core Bank Loans *CRE – Commercial Real Estate, C&I – Commercial and Industrial, C&D – Construction and Development, LFR – Lease Financing Receivables, HEQ – Home Equity Lines of Credit Commercial Sector On-Balance Sheet Focus Residential Sector Secondary-Market Focus Billions $0.0 $0.2 $0.4 $0.6 $0.8 $1.0 $1.2 $1.4 $1.6 $1.8 $2.0 Residential Real Estate CRE, C&I, C&D, and LFR* Warehouse Lines of Credit HEQ* and Other Consumer $1.2 $1.4 $1.4 $1.3 $1.2 $1.0 $1.0 $1.2 $1.5 $1.7 Dec. 31, 2014 Dec. 31, 2015 Dec. 31, 2016 Dec. 31, 2017 |
|
|
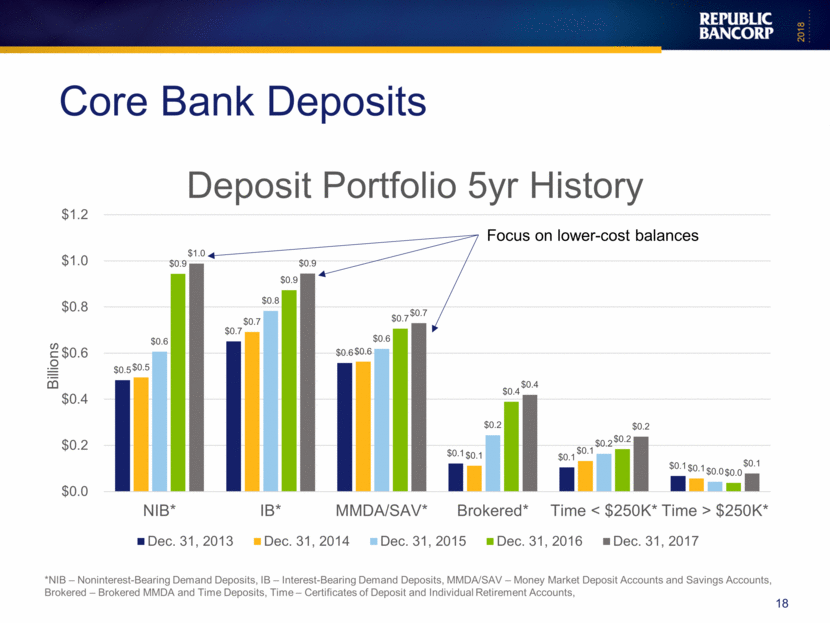
18 Core Bank Deposits *NIB – Noninterest-Bearing Demand Deposits, IB – Interest-Bearing Demand Deposits, MMDA/SAV – Money Market Deposit Accounts and Savings Accounts, Brokered – Brokered MMDA and Time Deposits, Time – Certificates of Deposit and Individual Retirement Accounts, Focus on lower-cost balances $0.0 $0.2 $0.4 $0.6 $0.8 $1.0 $1.2 Dec. 31, 2014 Dec. 31, 2015 Dec. 31, 2016 Dec. 31, 2017 NIB* IB* MMDA/SAV* Brokered* Time < $250K* Time > $250K* |
|
|
Industry Strong Credit Quality 19 |
|
|
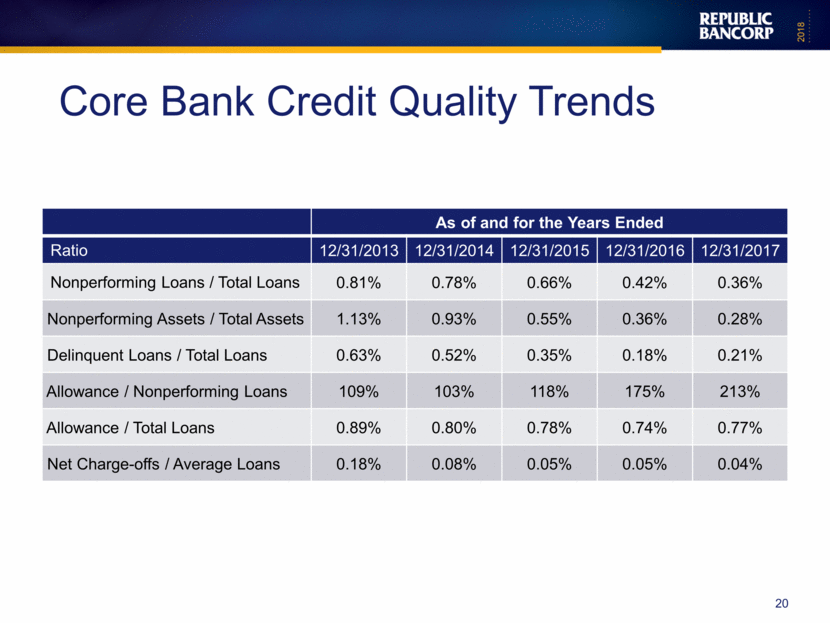
As of and for the Years Ended Ratio 12/31/2013 12/31/2014 12/31/2015 12/31/2016 12/31/2017 Nonperforming Loans / Total Loans 0.81% 0.78% 0.66% 0.42% 0.36% Nonperforming Assets / Total Assets 1.13% 0.93% 0.55% 0.36% 0.28% Delinquent Loans / Total Loans 0.63% 0.52% 0.35% 0.18% 0.21% Allowance / Nonperforming Loans 109% 103% 118% 175% 213% Allowance / Total Loans 0.89% 0.80% 0.78% 0.74% 0.77% Net Charge-offs / Average Loans 0.18% 0.08% 0.05% 0.05% 0.04% 20 Core Bank Credit Quality Trends |
|
|
Interest Rate Management Strategy 21 |
|
|
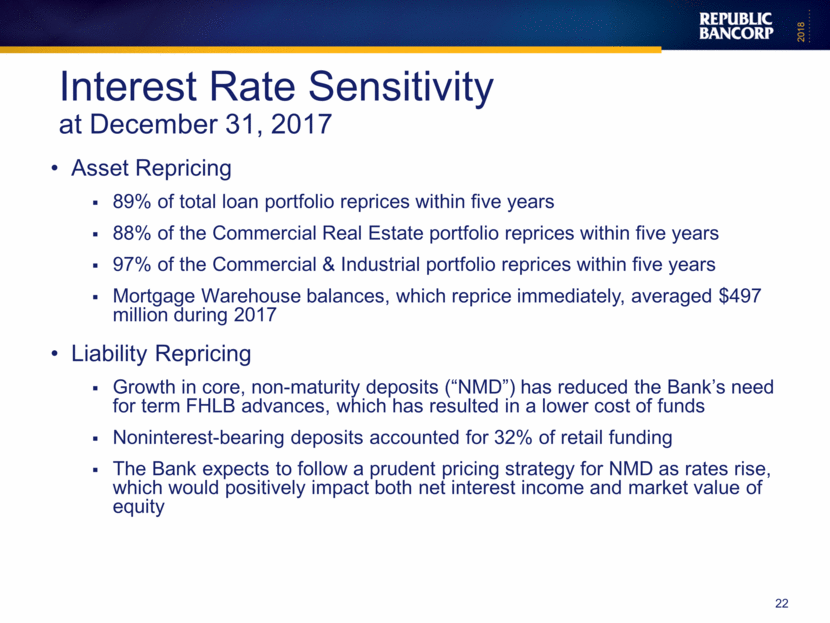
Asset Repricing 89% of total loan portfolio reprices within five years 88% of the Commercial Real Estate portfolio reprices within five years 97% of the Commercial & Industrial portfolio reprices within five years Mortgage Warehouse balances, which reprice immediately, averaged $497 million during 2017 Liability Repricing Growth in core, non-maturity deposits (“NMD”) has reduced the Bank’s need for term FHLB advances, which has resulted in a lower cost of funds Noninterest-bearing deposits accounted for 32% of retail funding The Bank expects to follow a prudent pricing strategy for NMD as rates rise, which would positively impact both net interest income and market value of equity 22 Interest Rate Sensitivity at December 31, 2017 |
|
|
Strategic Investments 23 |
|
|
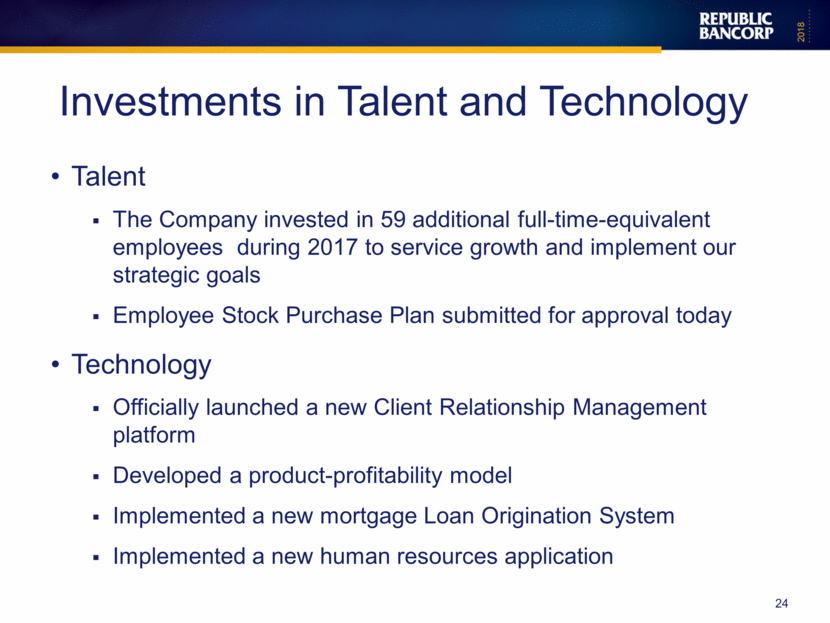
Talent The Company invested in 59 additional full-time-equivalent employees during 2017 to service growth and implement our strategic goals Employee Stock Purchase Plan submitted for approval today Technology Officially launched a new Client Relationship Management platform Developed a product-profitability model Implemented a new mortgage Loan Origination System Implemented a new human resources application 24 Investments in Talent and Technology |
|
|
Cultural Highlights 25 |
|
|
Innovate for Future Make it Easy Provide Exceptional service Acknowledge & Celebrate Success Commit to Caring Thrive Together Welcome 2017 Roar winners celebration 26 |
|
|
Best Places to Work IN KENTUCKY 2018 WINNER 27 |
|
|
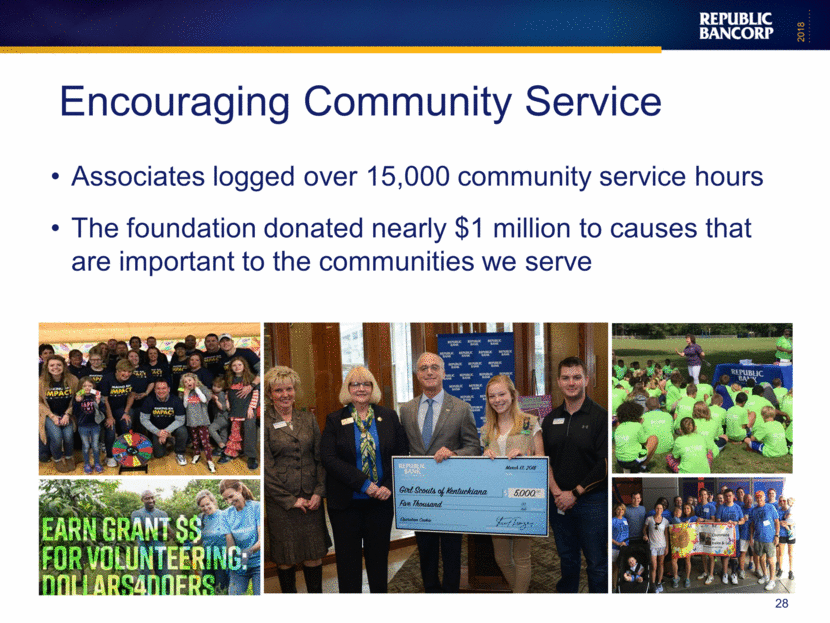
Associates logged over 15,000 community service hours The foundation donated nearly $1 million to causes that are important to the communities we serve 28 Encouraging Community Service |
|
|
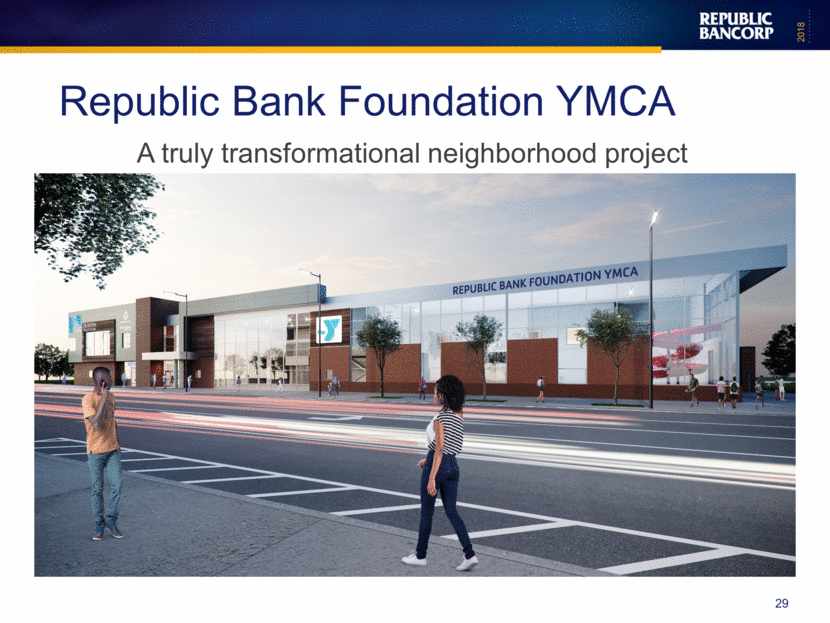
29 Republic Bank Foundation YMCA A truly transformational neighborhood project |
|
|
Highlights First Quarter 2018 30 |
|
|
Net income of $27.5 million, an increase of 37% over the first quarter of 2017 Return On Average Assets of 2.08% Return On Average Equity of 17.12% Capital ratios continued to exceed “well capitalized” Increased quarterly cash dividend by 10%, representing the 19th consecutive increase since 1999, and the largest quarterly increase since 2009 31 1Q 2018 Highlights |
|
|
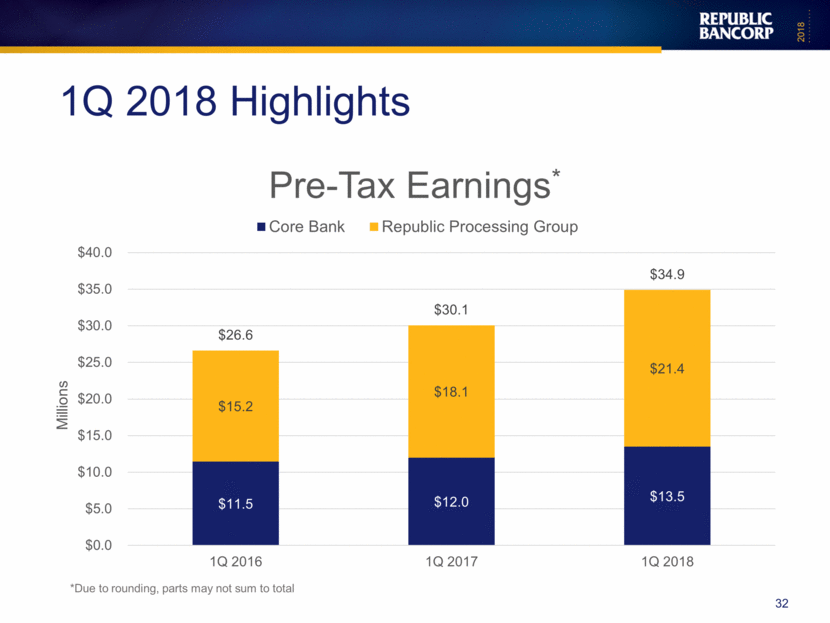
32 1Q 2018 Highlights *Due to rounding, parts may not sum to total Pre-Tax Earnings* Core Bank Republic Processing Group $0.0 $5.0 $10.0 $15.0 $20.0 $25.0 $30.0 $35.0 $40.0 $26.6 $15.2 $11.5 $30.1 $18.1 $12.0 $34.9 $21.4 $13.5 1Q 2016 1Q 2017 1Q 2018 |
|
|
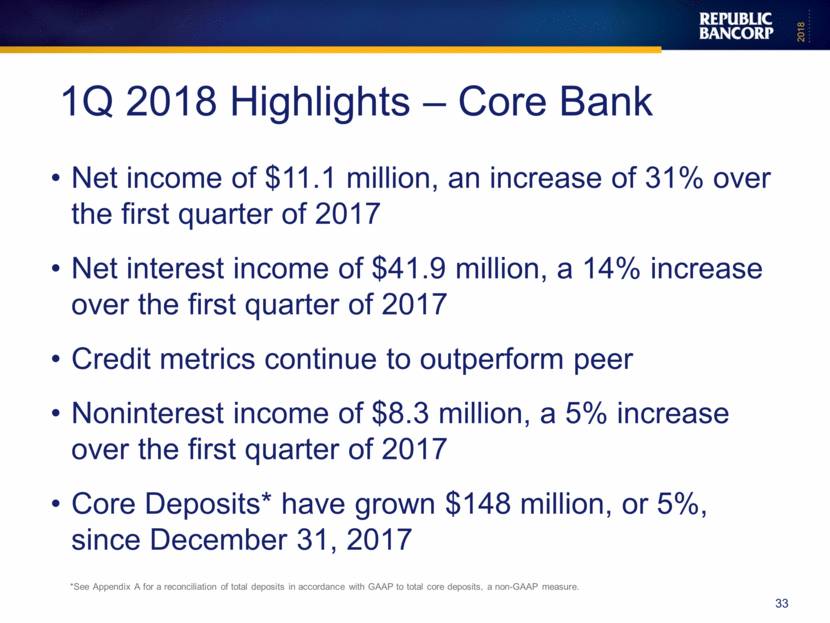
Net income of $11.1 million, an increase of 31% over the first quarter of 2017 Net interest income of $41.9 million, a 14% increase over the first quarter of 2017 Credit metrics continue to outperform peer Noninterest income of $8.3 million, a 5% increase over the first quarter of 2017 Core Deposits* have grown $148 million, or 5%, since December 31, 2017 33 1Q 2018 Highlights – Core Bank *See Appendix A for a reconciliation of total deposits in accordance with GAAP to total core deposits, a non-GAAP measure. |
|
|
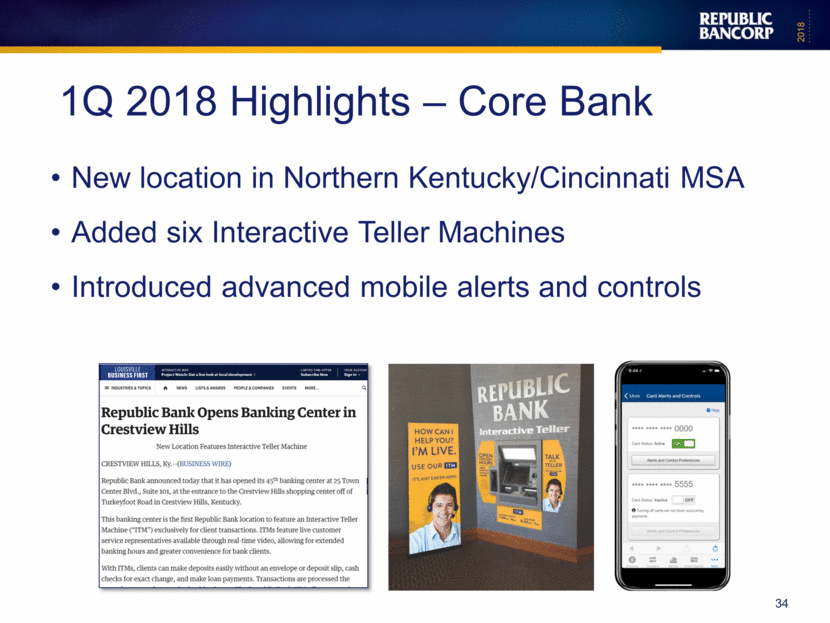
New location in Northern Kentucky/Cincinnati MSA Added six Interactive Teller Machines Introduced advanced mobile alerts and controls 34 1Q 2018 Highlights – Core Bank Republic Bank Opens Banking Center in Crestview Hills |
|
|
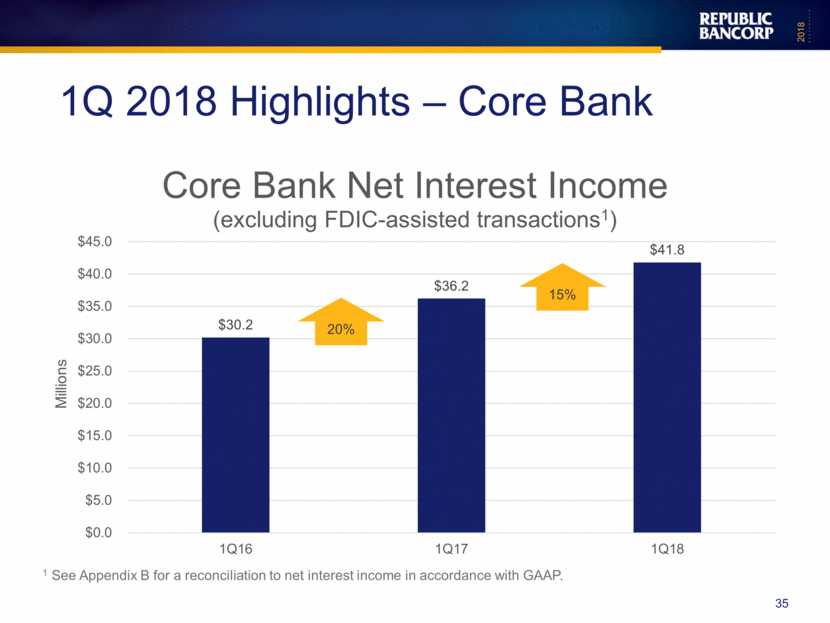
35 1Q 2018 Highlights – Core Bank 1 See Appendix B for a reconciliation to net interest income in accordance with GAAP. $0.0 $5.0 $10.0 $15.0 $20.0 $25.0 $30.0 $35.0 $40.0 $45.0 1Q16 2Q17 1Q18 $30.2 20% $36.2 15% $41.8 Core Bank Net Interest Income (excluding FDIC-assisted transaction1) |
|
|
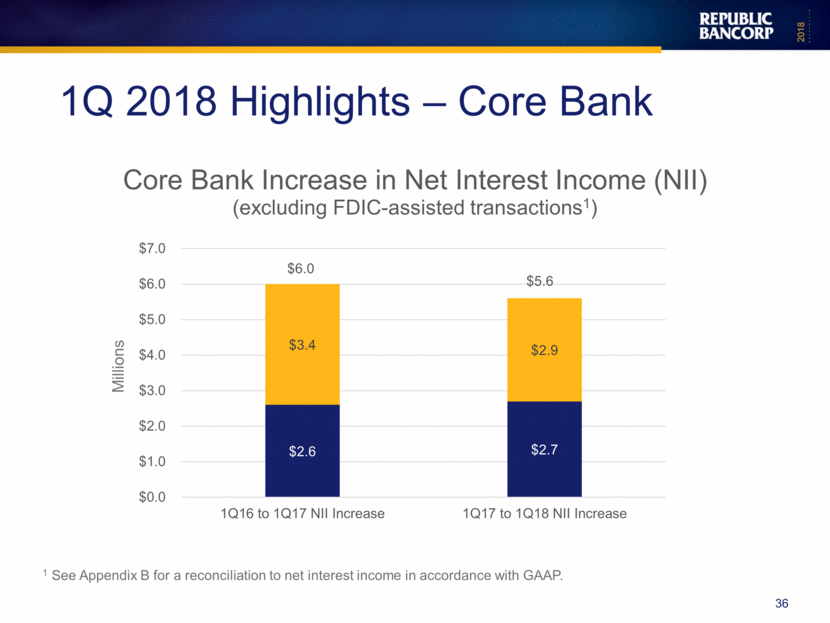
36 1Q 2018 Highlights – Core Bank Millions 1 See Appendix B for a reconciliation to net interest income in accordance with GAAP. $6.0 $5.6 $2.9 $2.7 $3.4 $2.6 1Q16 to 1Q17 NII Increase 1Q17 to 1Q18 NII Increase $0.0 $1.0 $2.0 $3.0 $4.0 $5.0 $6.0 $7.0 |
|
|
|
|
|
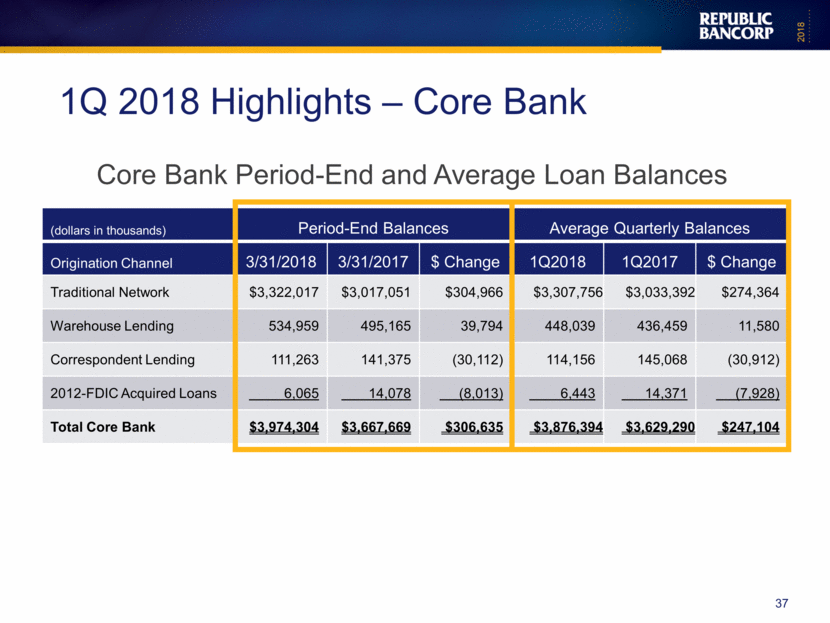
(dollars in thousands) Period-End Balances Average Quarterly Balances Origination Channel 3/31/2018 3/31/2017 $ Change 1Q2018 1Q2017 $ Change Traditional Network $3,322,017 $3,017,051 $304,966 $3,307,756 $3,033,392 $274,364 Warehouse Lending 534,959 495,165 39,794 448,039 436,459 11,580 Correspondent Lending 111,263 141,375 (30,112) 114,156 145,068 (30,912) 2012-FDIC Acquired Loans 6,065 14,078 (8,013) 6,443 14,371 (7,928) Total Core Bank $3,974,304 $3,667,669 $306,635 $3,876,394 $3,629,290 $247,104 37 1Q 2018 Highlights – Core Bank Core Bank Period-End and Average Loan Balances |
|
|
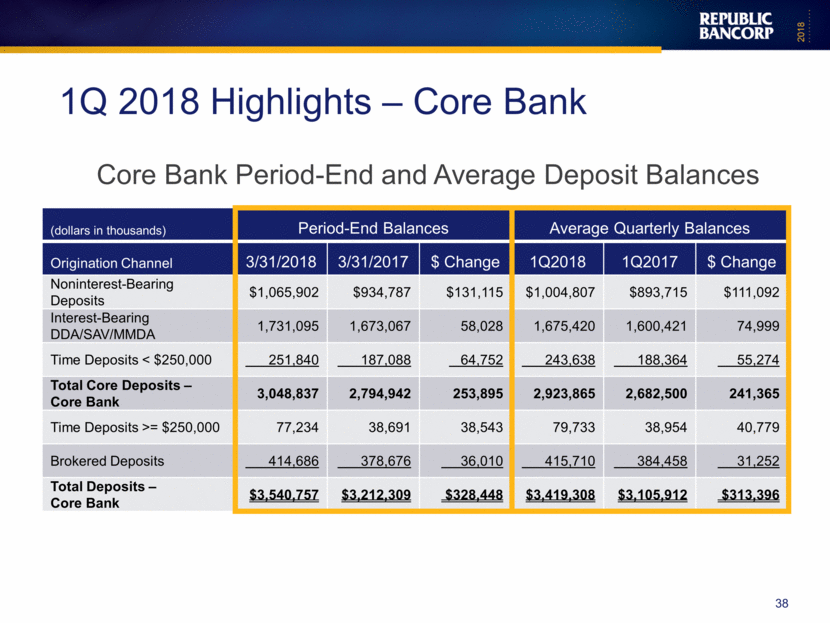
(dollars in thousands) Period-End Balances Average Quarterly Balances Origination Channel 3/31/2018 3/31/2017 $ Change 1Q2018 1Q2017 $ Change Noninterest-Bearing Deposits $1,065,902 $934,787 $131,115 $1,004,807 $893,715 $111,092 Interest-Bearing DDA/SAV/MMDA 1,731,095 1,673,067 58,028 1,675,420 1,600,421 74,999 Time Deposits < $250,000 251,840 187,088 64,752 243,638 188,364 55,274 Total Core Deposits – Core Bank 3,048,837 2,794,942 253,895 2,923,865 2,682,500 241,365 Time Deposits >= $250,000 77,234 38,691 38,543 79,733 38,954 40,779 Brokered Deposits 414,686 378,676 36,010 415,710 384,458 31,252 Total Deposits – Core Bank $3,540,757 $3,212,309 $328,448 $3,419,308 $3,105,912 $313,396 38 1Q 2018 Highlights – Core Bank Core Bank Period-End and Average Deposit Balances |
|
|
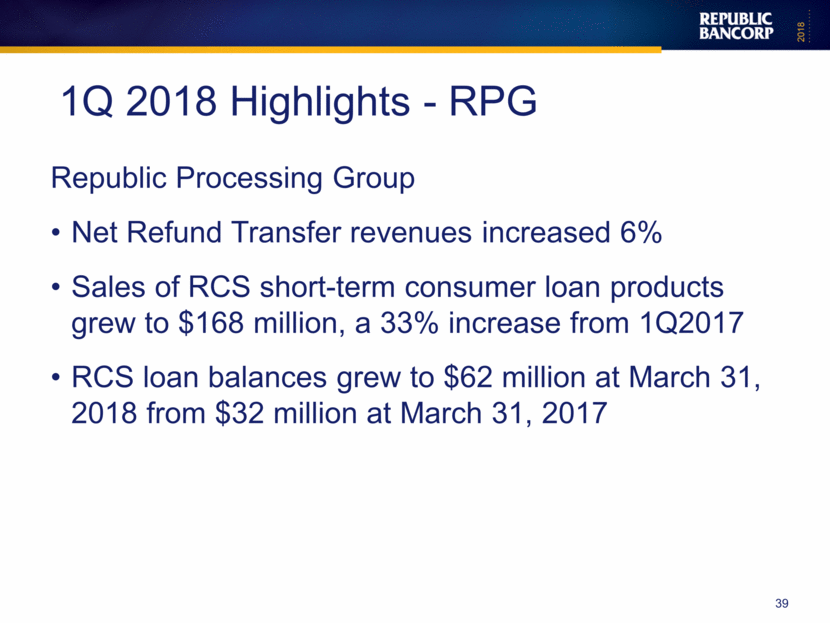
Republic Processing Group Net Refund Transfer revenues increased 6% Sales of RCS short-term consumer loan products grew to $168 million, a 33% increase from 1Q2017 RCS loan balances grew to $62 million at March 31, 2018 from $32 million at March 31, 2017 39 1Q 2018 Highlights - RPG |
|
|
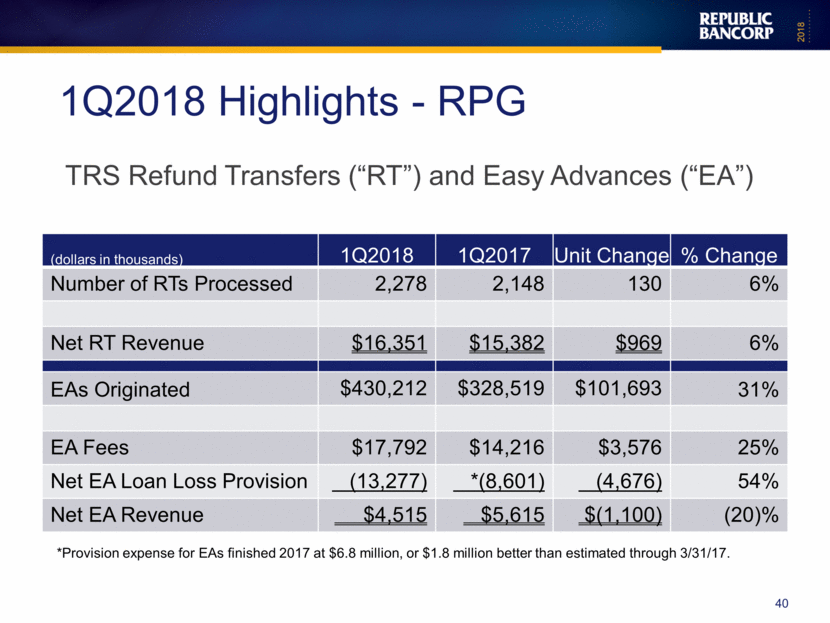
(dollars in thousands) 1Q2018 1Q2017 Unit Change % Change Number of RTs Processed 2,278 2,148 130 6% Net RT Revenue $16,351 $15,382 $969 6% EAs Originated $430,212 $328,519 $101,693 31% EA Fees $17,792 $14,216 $3,576 25% Net EA Loan Loss Provision (13,277) *(8,601) (4,676) 54% Net EA Revenue $4,515 $5,615 $(1,100) (20)% 40 1Q2018 Highlights - RPG TRS Refund Transfers (“RT”) and Easy Advances (“EA”) *Provision expense for EAs finished 2017 at $6.8 million, or $1.8 million better than estimated through 3/31/17. |
|
|
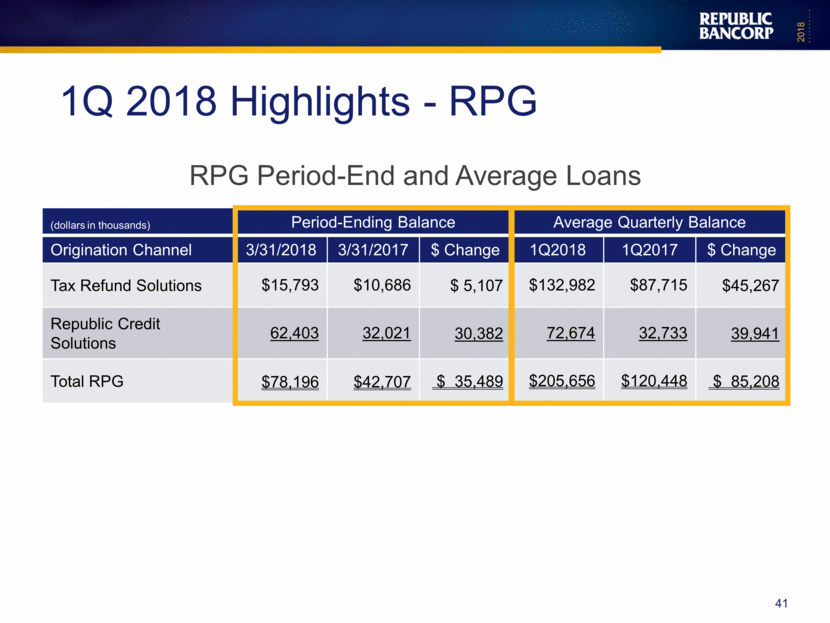
(dollars in thousands) Period-Ending Balance Average Quarterly Balance Origination Channel 3/31/2018 3/31/2017 $ Change 1Q2018 1Q2017 $ Change Tax Refund Solutions $15,793 $10,686 $ 5,107 $132,982 $87,715 $45,267 Republic Credit Solutions 62,403 32,021 30,382 72,674 32,733 39,941 Total RPG $78,196 $42,707 $ 35,489 $205,656 $120,448 $ 85,208 41 1Q 2018 Highlights - RPG RPG Period-End and Average Loans |
|
|
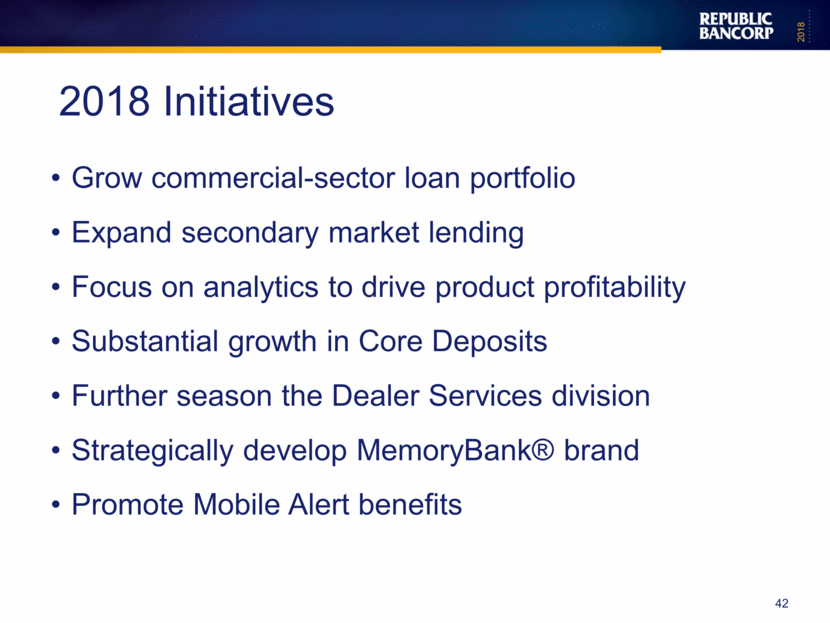
Grow commercial-sector loan portfolio Expand secondary market lending Focus on analytics to drive product profitability Substantial growth in Core Deposits Further season the Dealer Services division Strategically develop MemoryBank® brand Promote Mobile Alert benefits 42 2018 Initiatives |
|
|
It’s just easier here. REPUBLIC BANK 43 |
|
|
Thank You 44 |
|
|
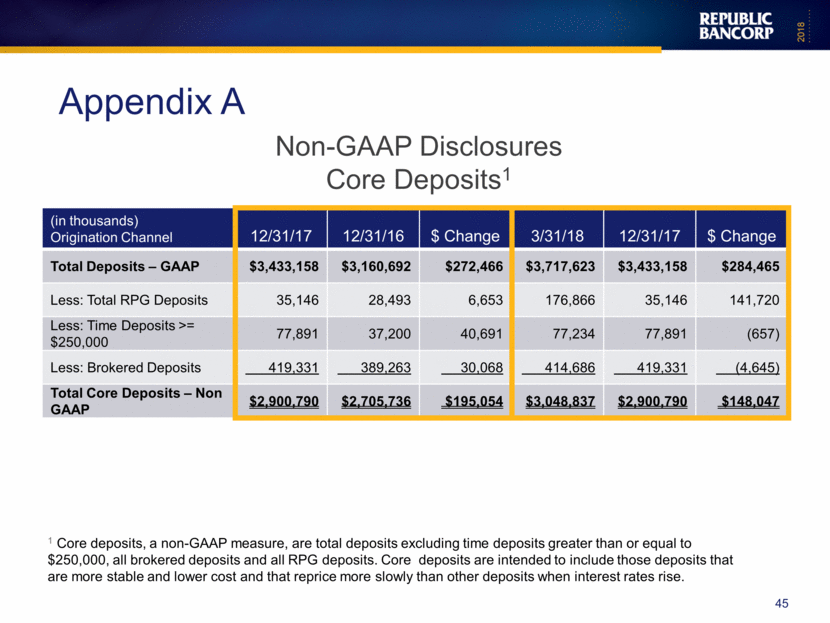
(in thousands) Origination Channel 12/31/17 12/31/16 $ Change 3/31/18 12/31/17 $ Change Total Deposits – GAAP $3,433,158 $3,160,692 $272,466 $3,717,623 $3,433,158 $284,465 Less: Total RPG Deposits 35,146 28,493 6,653 176,866 35,146 141,720 Less: Time Deposits >= $250,000 77,891 37,200 40,691 77,234 77,891 (657) Less: Brokered Deposits 419,331 389,263 30,068 414,686 419,331 (4,645) Total Core Deposits – Non GAAP $2,900,790 $2,705,736 $195,054 $3,048,837 $2,900,790 $148,047 45 Appendix A Non-GAAP Disclosures Core Deposits1 1 Core deposits, a non-GAAP measure, are total deposits excluding time deposits greater than or equal to $250,000, all brokered deposits and all RPG deposits. Core deposits are intended to include those deposits that are more stable and lower cost and that reprice more slowly than other deposits when interest rates rise. |
|
|
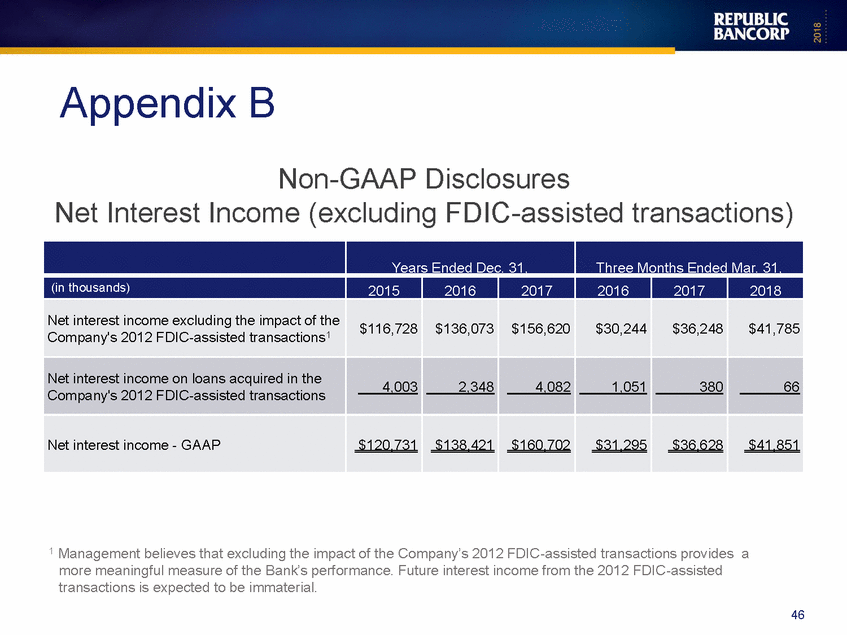
Appendix B Non-GAAP Disclosures Net Interest Income (excluding FDIC-assisted transactions) 1 Management believes that excluding the impact of the Company’s 2012 FDIC-assisted transactions provides a more meaningful measure of the Bank’s performance. Future interest income from the 2012 FDIC-assisted transactions is expected to be immaterial. 46 Years Ended Dec. 31, Three Months Ended Mar. 31, (in thousands) 2015 2016 2017 2016 2017 2018 Net interest income excluding the impact of the Company's 2012 FDIC-assisted transactions1 $116,728 $136,073 $156,620 $30,244 $36,248 $41,785 Net interest income on loans acquired in the Company's 2012 FDIC-assisted transactions 4,003 2,348 4,082 1,051 380 66 Net interest income - GAAP $120,731 $138,421 $160,702 $31,295 $36,628 $41,851 |

