Attached files
| file | filename |
|---|---|
| EX-32.2 - EX-32.2 - DAVIDsTEA Inc. | dtea-20180203ex3228346c9.htm |
| EX-32.1 - EX-32.1 - DAVIDsTEA Inc. | dtea-20180203ex3219f2d3e.htm |
| EX-31.2 - EX-31.2 - DAVIDsTEA Inc. | dtea-20180203ex3129af8a5.htm |
| EX-31.1 - EX-31.1 - DAVIDsTEA Inc. | dtea-20180203ex31106b277.htm |
| EX-23.1 - EX-23.1 - DAVIDsTEA Inc. | dtea-20180203ex2312c5512.htm |
| EX-21.1 - EX-21.1 - DAVIDsTEA Inc. | dtea-20180203ex21155d6f9.htm |
UNITED STATES
SECURITIES AND EXCHANGE COMMISSION
Washington, D.C. 20549
Form 10-K
☑ANNUAL REPORT PURSUANT TO SECTION 13 OR 15(d) OF THE SECURITIES EXCHANGE ACT OF 1934
For the fiscal year ended February 3, 2018
OR
☐TRANSITION REPORT PURSUANT TO SECTION 13 OR 15(d) OF THE SECURITIES EXCHANGE ACT OF 1934
For the transition period from to
Commission file number 001-37404
DAVIDsTEA Inc.
(Exact name of registrant as specified in its charter)
|
Canada |
|
98-1048842 |
|
(State or other jurisdiction of |
|
(I.R.S. Employer |
|
5430 Ferrier |
||
|
(Address of principal executive offices) |
||
(888) 873-0006
(Registrant's telephone number, including area code)
Securities registered pursuant to Section 12(b) of the Act:
|
Title of Each Class |
|
Name of Each Exchange on Which |
|
Common shares, |
|
NASDAQ Global Market |
Indicate by check mark if the registrant is a well-known seasoned issuer, as defined in Rule 405 of the Securities Act. Yes ☐ No ☑
Indicate by check mark if the registrant is not required to file reports pursuant to Section 13 or Section 15(d) of the Act. Yes ☐ No ☑
Indicate by check mark whether the registrant (1) has filed all reports required to be filed by Section 13 or 15(d) of the Securities Exchange Act of 1934 during the preceding 12 months (or for such shorter period that the registrant was required to file such reports), and (2) has been subject to such filing requirements for the past 90 days. Yes ☑ No ☐
Indicate by check mark whether the registrant has submitted electronically and posted on its corporate Web site, if any, every Interactive Data File required to be submitted and posted pursuant to Rule 405 of Regulation S-T (§ 232.405 of this chapter) during the preceding 12 months (or for such shorter period that the registrant was required to submit and post such files). Yes ☑ No ☐
Indicate by check mark if disclosure of delinquent filers pursuant to Item 405 of Regulation S-K (§ 229.405 of this chapter) is not contained herein, and will not be contained, to the best of registrant’s knowledge, in definitive proxy or information statements incorporated by reference in Part III of this Form 10-K or any amendment to this Form 10-K. ☑
Indicate by check mark whether the registrant is a large accelerated filer, an accelerated filer, a non-accelerated filer, smaller reporting company, or an emerging growth company. See the definitions of “large accelerated filer,” “accelerated filer,” “smaller reporting company,” and “emerging growth company” in Rule 12b-2 of the Exchange Act.
|
Large accelerated filer |
☐ |
|
Accelerated filer |
|
☑ |
|
Non-accelerated filer |
☐ |
|
(Do not check if a smaller reporting company) |
|
|
|
|
|
|
Smaller reporting company |
|
☐ |
|
|
|
|
Emerging growth company |
|
☑ |
If an emerging growth company, indicate by check mark if the registrant has elected not to use the extended transition period for complying with any new or revised financial accounting standards provided pursuant to Section 13(a) of the Exchange Act. ☑
Indicate by check mark whether the registrant is a shell company (as defined in rule 12b-2 of the Act). Yes ☐ No ☑
As of July 29, 2017, the last business day of our most recently completed second fiscal quarter, the aggregate market value of the registrant’s Common Shares held by non-affiliates was US$77,549,363.
As of April 18, 2018, 25,897,837 common shares of the registrant were outstanding.
DOCUMENTS INCORPORATED BY REFERENCE: N/A
EXPLANATORY NOTE
DAVIDsTEA Inc. (the “Company”), a corporation incorporated under the Canada Business Corporations Act, qualifies as a foreign private issuer in the United States for purposes of the Securities Exchange Act of 1934, as amended (the “Exchange Act”). As a foreign private issuer, the Company has chosen to file annual reports on Form 10-K, quarterly reports on Form 10-Q and current reports on Form 8-K with the United States Securities and Exchange Commission (“SEC”) instead of filing on the reporting forms available to foreign private issuers, although the Company is not required to do so. We are permitted to file our audited consolidated financial statements with the SEC under International Financial Reporting Standards (“IFRS”), without a reconciliation to U.S. generally accepted accounting principles (“GAAP”). As a result, we do not prepare a reconciliation of our results to U.S. GAAP. It is possible that certain of our accounting policies could be different from U.S. GAAP.
The Company prepares and files a management proxy circular and related material under Canadian requirements. As the Company’s management proxy circular is not filed pursuant to Regulation 14A, the Company may not incorporate by reference information required by Part III of this Form 10-K from its management proxy circular.
In this annual report on Form 10-K, unless otherwise specified, all monetary amounts are in Canadian dollars, all references to “$,” “C$,” “CAD”, “CND$”, “CDN$,” “CDN,” “Canadian dollars” and “dollars” mean Canadian dollars and all references to “U.S. dollars,” “US$” and “USD” mean U.S. dollars.
All references to our website contained herein do not constitute incorporation by reference of information contained on such websites and such information should not be considered part of this document.
1
2
Exchange Rate Data
The following table sets forth, for the periods indicated, the high and low exchange rates between the Canadian dollar and the U.S. dollar expressed in the Canadian dollar equivalent of one U.S. dollar, and the average exchange rate for the periods indicated. Averages for year-end periods are calculated by using the exchange rates on the last day of each full month during the relevant period and the last available exchange rate in January during the relevant fiscal year. These rates are based on the noon buying rate certified for customs purposes by the U.S. Federal Reserve Bank of New York set forth in the H.10 statistical release of the Federal Reserve Board.
On April 13, 2018, the noon buying rate certified for customs purposes by the U.S. Federal Reserve Bank of New York was US$1.00 = $1.2604.
|
Year Ended |
Period End Rate |
Period Average Rate |
High Rate |
Low Rate |
|
January 26, 2013 |
$1.01 |
$1.00 |
$0.97 |
$1.04 |
|
January 25, 2014 |
$1.11 |
$1.04 |
$1.00 |
$1.11 |
|
January 31, 2015 |
$1.27 |
$1.11 |
$1.06 |
$1.27 |
|
January 30, 2016 |
$1.41 |
$1.30 |
$1.46 |
$1.20 |
|
January 28, 2017 |
$1.31 |
$1.32 |
$1.40 |
$1.25 |
|
February 3, 2018 |
$1.24 |
$1.29 |
$1.37 |
$1.21 |
Cautionary Note Regarding Forward-Looking Statements
This Annual Report on Form 10-K includes statements that express our opinions, expectations, beliefs, plans, objectives, assumptions or projections regarding future events or future results and there are, or may be deemed to be, “forward-looking statements” within the meaning of the Private Securities Litigation Reform Act of 1995 (the “Act”). The following cautionary statements are being made pursuant to the provisions of the Act and with the intention of obtaining the benefits of the “safe harbor” provisions of the Act. These forward-looking statements can generally be identified by the use of forward-looking terminology, including the terms “believes,” “expects,” “may,” “will,” “should,” “could,” “seeks,” “projects,” “approximately,” “intends,” “plans,” “estimates” or “anticipates,” or, in each case, their negatives or other variations or comparable terminology. These forward-looking statements include all matters that are not historical facts. They appear in a number of places throughout this Annual Report and include statements regarding our intentions, beliefs or current expectations concerning, among other things, our results of operations, financial condition, liquidity, prospects, competitive strengths and differentiators, strategy, long-term Adjusted EBITDA margin potential, dividend policy, impact of the macroeconomic environment, properties, outcome of litigation and legal proceedings, use of cash and operating and capital expenditures, impact of new accounting pronouncements, impact of improvements to internal control and financial reporting.
While we believe these expectations and projections are based on reasonable assumptions, such forward-looking statements are inherently subject to risks, uncertainties and assumptions about us, including the risk factors listed under Item 1A. Risk Factors, as well as other cautionary language in this Form 10-K.
Actual results may differ materially from those in the forward-looking statements as a result of various factors, including but not limited to, the following:
|
· |
Our ability to implement our shift in business strategy; |
|
· |
Our efforts to expand beyond retail stores; |
|
· |
Significant competition within our industry; |
|
· |
The effect of a decrease in customer traffic to the shopping malls, centers and street locations where our stores are located; |
|
· |
Our ability to attract and retain employees that embody our culture, including Tea Guides and store and district managers and regional directors; |
|
· |
Changes in consumer preferences and economic conditions affecting disposable income; |
3
|
· |
Our ability to source, develop and market new varieties of teas, tea accessories and food and beverages; |
|
· |
Our reliance upon the continued retention of key personnel; |
|
· |
The impact from real or perceived quality or safety issues with our teas, tea accessories and food and beverages; |
|
· |
Our ability to obtain quality products from third-party manufacturers and suppliers on a timely basis or in sufficient quantities; |
|
· |
The impact of weather conditions, natural disasters and manmade disasters on the supply and price of tea; |
|
· |
Actual or attempted breaches of data security; |
|
· |
The impact of a regional, national or global health epidemic; |
|
· |
The costs of protecting and enforcing our intellectual property rights and defending against intellectual property claims brought by others; |
|
· |
Adverse publicity as a result of public disagreements with our shareholders; |
|
· |
Fluctuations in exchange rates; and |
|
· |
The seasonality of our business. |
All forward-looking statements should be evaluated with the understanding of their inherent uncertainty. We will not undertake and specifically decline any obligation to publicly update or revise any forward-looking statements, whether as a result of new information, future events or otherwise. In light of these risks, uncertainties and assumptions, the forward-looking events discussed in this Annual Report on Form 10-K might not occur.
Forward-looking statements speak only as of the date of this Form 10-K. Except as required under federal securities laws and the rules and regulations of the SEC, we do not have any intention to update any forward-looking statements to reflect events or circumstances arising after the date of this Form 10-K, whether as a result of new information, future events or otherwise. As a result of these risks and uncertainties, readers are cautioned not to place undue reliance on the forward-looking statements included in this Form 10-K or that may be made elsewhere from time to time by, or on behalf of, us. All forward-looking statements attributable to us are expressly qualified by these cautionary statements.
DAVIDsTEA’s common shares trade on the NASDAQ Global Market under the symbol “DTEA”. Unless the context otherwise requires, the terms “we,” “our,” “us,” “DAVIDsTEA” and the “Company” refer to DAVIDsTEA Inc. and its subsidiary. All references to “Fiscal 2015” are to the Company’s fiscal year ended January 30, 2016. All references to “Fiscal 2016” are to the Company’s fiscal year ended January 28, 2017. All references to “Fiscal 2017” are to the Company’s fiscal year ended February 3, 2018. The Company’s fiscal year ends on the Saturday closest to the end of January, typically resulting in a 52-week year, but occasionally giving rise to an additional week, resulting in a 53-week year. The years ended January 30, 2016 and January 28, 2017 cover a 52-week period. The year ended February 3, 2018 covers a 53-week fiscal period.
Our Company
DAVIDsTEA is a branded retailer of specialty tea, offering a differentiated selection of proprietary loose-leaf teas, pre-packaged teas, tea sachets and tea-related gifts, accessories, food and beverages primarily through 240 company-operated DAVIDsTEA stores as of February 3, 2018, and our website, davidstea.com. Our passion for and knowledge of tea permeates our culture and is rooted in an excitement to explore the taste, health and lifestyle elements of tea.
We strive to make tea a multi‑sensory experience by facilitating interaction with our products through education and sampling so that our customers appreciate the compelling attributes of tea as well as the ease of preparation. We design our stores with a modern and simple aesthetic that, coupled with our teal‑colored logo, create an inviting atmosphere and stand in stark contrast to common perceptions of tea as a more traditional product. We are also bringing this experience online to enhance our consumers’
4
interaction with tea. Our in‑store “Tea Guides” help novice and experienced tea drinkers alike select from the approximately 135 premium teas and tea blends featured on our “Tea Wall,” which is the focal point of our stores. We replicate our store experience online by engaging users with rich content that allows them to easily explore their options amongst our many tea and tea‑related offerings. Consistent with our stores, davidstea.com features our innovative products while offering expertise, community and numerous tools to aid the discovery and exploration of tea.
We sell our products primarily through our company-operated retail stores and e-commerce site, giving us control of the presentation of our brand as well as greater interaction with the customer. We have a dedicated and highly experienced product development team that is constantly creating new tea blends using high‑quality ingredients from around the world. We capitalize on our product development capabilities with approximately 75 new tea blends each year that we rotate into our offering on a continuous basis. We also focus on product innovation in our pre-packaged teas, tea sachets and tea-related gifts, accessories and food and beverages, providing our customers with fun, inventive and more convenient ways to enjoy tea.
During Fiscal 2017, 70% of our revenue was driven by the sale of loose‑leaf teas, pre-packaged teas, tea sachets and tea‑related gifts that consumers enjoy at home, on‑the‑go or at work. The balance of our revenue was driven by tea accessories, 22%, and food and beverages, 8%. See Note 23 to our consolidated financial statements for information regarding our revenues by product category for each of the past three fiscal years as well as information about our geographic operating segments.
Our Market and Competition
The Canadian and U.S. tea markets are highly fragmented. We compete with a large number of relatively small independently owned tea retailers and a number of regional tea retailers, as well as retailers of grocery products, including loose‑leaf teas, tea sachets and tea-related beverages. We also compete with other vendors of loose‑leaf teas, tea sachets and ready‑to‑drink teas, such as club stores, wholesalers and Internet suppliers, as well as with houseware retailers and suppliers that offer teawares and related accessories.
We believe we differentiate ourselves from our competitors on the basis of our distinct retail experience, the broad demographic appeal of our brand, innovative tea products driven by customer insights, the effectiveness of our e-commerce website and grassroots marketing strategy, our versatile store economics and our passionate customer-focused culture supported by our experienced management team and dedicated board members.
Our Stores and Operations
Our Stores
As of February 3, 2018, our retail footprint consisted of 190 stores in Canada and 50 stores in the United States. Our retail stores are located primarily within malls, including lifestyle centers and outlets, and on street locations. Each store exterior prominently displays the DAVIDsTEA teal signage. In Fiscal 2017, our average store was approximately 900 square feet. See Note 23 to our consolidated financial statements for information regarding our long-lived assets in Canada and the US.
Distinctive Retail Experience
The DAVIDsTEA experience starts with our people both in stores, our Tea Guides, and at our service support center. Our people’s knowledge and passion permeate our culture and are rooted in a deep knowledge of, and desire to share, the compelling attributes of tea. A key element of the retail experience is our “Tea Wall,” a focal point of the store, which displays approximately 135 premium teas and tea blends. Our Tea Guides help create a highly interactive and immersive customer experience and we strive to make tea a multi‑sensory experience. Indeed, they facilitate the interaction with our products through education and sampling so that our customers appreciate the compelling attributes of tea as well as the ease of preparation. Every visit to our stores is designed to create a sense of adventure for our customers, from novice and experienced tea drinkers alike, as our knowledgeable, personable and passionate Tea Guides assist our customers in navigating the “Tea Wall” by selecting a variety of teas for customers to smell based on their taste preferences.
In fiscal 2018, we expect to renovate up to five of our stores to be similar to our new DT 2.0 hybrid concept store, which enables customers to “self-shop” and buy pre-packaged teas, helping accelerate service levels and reduce wait times. We currently anticipate that elements of these concept stores will become key components of our future store renovation program.
5
Site Selection and Store Portfolio
We seek to maintain our stores in strategic locations that support the brand image, targeting high customer traffic locations primarily within malls, including lifestyle centers and outlets, and on street locations. We regularly review our store portfolio, identifying new store locations and monitoring existing locations for sufficient levels of customer traffic to maintain a successful store. We actively monitor and manage the performance of our stores and increasingly seek to incorporate information learned through the monitoring process into our analytic process and future site selection and store retention decisions.
Store Management, Culture and Training
We are guided by a philosophy that recognizes customer service and the importance of delivering optimal performance, allowing us to identify and reward teams that meet our high performance standards. We use store-level scorecards that report key performance indicators. We provide our store managers with a number of analytical tools to support our store operations and assist them in attaining optimum store performance. These tools include key performance indicator reports, coaching logs for one‑on‑one meetings, weekly one‑on‑one meetings between our store managers and district managers and annual evaluations. While our focus is on the overall performance of the team and our stores, we provide incentives to team members, store managers and district managers.
|
· |
Passion for Tea. We believe our passionate and fun Tea Guides are a major element of our retail experience. We seek to recruit, hire, train, retain and promote qualified, knowledgeable and enthusiastic team members who share our passion for tea and strive to deliver an extraordinary retail experience to our customers. |
|
· |
Extensive Training. We have specific training and certification requirements for all new team members, including undergoing food handlers’ certification and foundational training. This process helps ensure that all team members educate our customers and execute our standards accurately and consistently. As team members progress to the assistant manager and manager levels, they undergo additional weeks of training in sales, operations and management. |
|
· |
Career Development and Individual Enrichment. We track and reward team member performance, which we believe incentivizes excellence and helps us identify top performers and thus maintain a sufficient talent pool to support our growth. Many of our store managers and district managers are promoted from within our organization. We are guided by a philosophy that recognizes performance, allowing us to identify and reward teams who meet our high performance standards. |
Our core values and distinctive corporate culture allow us to attract passionate and friendly employees who share a vision of making tea fun and accessible. We have a strong focus on community engagement, and our culture reflects our belief in doing right by our customers and our communities. We provide our employees with extensive training, career development, individual enrichment, and empowerment, which we believe is a key contributor for our success.
Our Digital Platform
Our digital platform is primarily comprised of our website, www.davidstea.com. Our e‑commerce sales represented 12.2% of total sales for Fiscal 2017, compared to 10.6% and 9.4% of sales for Fiscal 2016 and Fiscal 2015, respectively. Our new e-commerce platform, launched in April 2018, is a core part of DAVIDsTEA`s plans to grow online sales and will support further growth.
Our website features our full assortment of premium loose‑leaf teas, pre-packaged teas, tea sachets and tea-related gifts, accessories and food. To drive increased sales through our digital platform, we utilize online‑specific marketing and promotions. In addition, we employ banner advertisements, search engine optimization and pay‑per‑click arrangements to help drive customer traffic to our website. In Fiscal 2018, we are introducing new marketing and core gap features that will further enhance the website experience, improve its accessibility for mobile users, and provide a solid platform to start selling on Amazon, which we anticipate will happen before the 2018 holiday season.
Through our e-commerce platform, we can reach customers who may not live near one of our retail locations. We believe our digital platform and our stores are complementary, as our digital platform provides our store customers an additional channel through which to purchase our teas and tea‑related products while also helping drive awareness of and customer traffic to our stores.
Our digital platform also includes our social media platform on Facebook, Instagram, Twitter, Google+, Pinterest, LinkedIn, YouTube, Snapchat and Yelp. We will continue to leverage our growing social media presence to increase our e‑commerce site sales and drive additional store visits within existing and new markets.
6
Our Wholesale Distribution
We currently sell tea products to HRI (Hotel, Restaurant and Institution) distribution channels. As part of our strategic initiatives in 2018, we are exploring potential growth opportunities in wholesale distribution to other channels including grocery and club.
Our Product Categories
We offer approximately 135 premium loose‑leaf teas, pre-packaged teas, tea sachets and tea-related gifts, accessories and food primarily through our retail stores and e-commerce site. Additionally, we offer on‑the‑go tea beverages in our retail stores.
Teas
Our loose‑leaf teas, pre-packaged teas, tea sachets and tea-related gifts that consumers can enjoy at home, on‑the‑go or at work, represented 70% of our sales in Fiscal 2017, 66% in Fiscal 2016 and 66% in Fiscal 2015. Our different flavors of loose-leaf tea span eight different tea categories: white, green, oolong, black, pu’erh, mate, rooibos and herbal tea. Furthermore, approximately 80% of our teas are blended with other ingredients while approximately 20% are straight teas. Our teas and ingredients used in our tea blends are sourced from various regions around the world, including but not limited to, China, South Korea, Japan, Taiwan, Vietnam, India, Nepal, Kenya, Sri Lanka and South Africa. In addition to loose‑leaf teas, we sell pre‑packaged teas and tea sachets to make the tea experience more convenient for some customers. Our tea-related gifts include special edition seasonal and holiday gift packages.
Tea Accessories
Our tea accessories, representing 22% of our sales in Fiscal 2017, 25% in Fiscal 2016 and 24% in Fiscal 2015, are created to make the tea preparation process and tea experience more convenient and fun and easy at home or on-the-go for customers. Tea accessories include tea mugs, travel mugs, teacup sets, teapots, tea makers, kettles, infusers, filters, frothers, tins and spoons. Many of our accessories are crafted with unique features to improve tea preparation and consumption. Most of our accessories are crafted with unique colors and designs.
Food and Beverages
Our retail stores offer tea beverages for on‑the‑go consumption and our retail stores and e-commerce site offer food products, which together represented 8% of our sales in Fiscal 2017, 9% in Fiscal 2016 and 10% in Fiscal 2015. Our beverages range from the standard hot or iced tea to our Tea Lattes.
Product Development and Design
Our tea and merchandising teams travel throughout the world seeking premium teas and tea-related products. These teams consist of Tea Blend Developers, Product Designers, Category Merchants and Quality Control Personnel, who leverage our extensive experience in selecting and developing our product assortment. We are constantly exploring different ingredients, flavors and trends that are popular in a variety of cultures from which we introduce new teas to our customers. Our research and development team works with our blenders and suppliers to create new and exciting flavors of tea, which we rotate into our product offering to attract new customers and keep current customers coming back. Our blending process is very focused on magnifying the senses and bringing smell and taste to the forefront. We introduce new flavors and blends each month as well as around seasonal holidays. In Fiscal 2017, we conducted extensive research to identify key customer segments and preferences to help re-evaluate our product assortment and institute a more effective product release cadence. We believe our focus on innovation and product development is a key differentiating factor for our brand that drives our customer’s loyalty.
Our innovation also extends to creating new and exciting merchandise to make the tea consumption and experience more convenient and easy at home or on-the-go. We have a competitive advantage in that our merchandising team designs and develops most of our products in‑house. Therefore, we are better positioned to create unique and proprietary designs to make consuming loose‑leaf tea easier and more fun for our customers. We believe our combination of product selection and product innovation allows us to offer customers a distinctive assortment that differentiates us from other specialty tea retailers.
7
Marketing and Advertising
We differentiate our business through a field‑based marketing approach to build brand awareness and drive customers to our stores and e‑commerce site in both new and existing markets. Our marketing and advertising efforts are led by a strong marketing and merchandising team, which was solidified in Fiscal 2017.
We customize our marketing mix for each of our markets and purposes through our events sponsorship group. Our events sponsorship group engages directly in the communities around our stores and drives store visits by offering product samplings and beverage coupons, and by participating in both hyper‑local and large‑scale events. These events are identified and coordinated by our local store managers and Tea Guides with support from our dedicated corporate events team.
Sourcing and Manufacturing
We do not own or operate any tea estates or blending operations; instead, we work with vendors who source ingredients for our teas and tea blends from all over the world. The majority of our tea blenders are in either Germany or the United States. Since we founded the Company in 2008, we have developed strong relationships with our vendors. These relationships are important as we depend on our vendors to provide us with the highest quality teas and ingredients from around the world. We have a process of quality control, which includes in-house testing and vendor testing. In addition to bringing our designs for tea blends to fruition, our vendors are important to the quality control process and ensuring our teas meet applicable regulatory guidelines.
Warehouse and Distribution Facilities
We distribute our loose-leaf teas, pre-packaged teas, tea sachets and tea-related gifts, accessories and food to our stores and our e‑commerce customers from distribution centers in Montréal, Quebec, Sherbrooke, Quebec and Champlain, New York. We use third party shipping facilities in Sherbrooke, Quebec and Champlain, New York. The Sherbrooke facility ships to our Canadian stores and e‑commerce customers. The Champlain, New York facility ships to all our U.S. stores and to our U.S. e-commerce customers. Our products are typically shipped to our stores and our e‑commerce customers via a third‑party national transportation provider multiple times per week.
Management Information Systems
Our management information systems provide a full range of business process supports to our stores, our store operations and service support center teams. Additionally, we operate our e‑commerce site on an independent platform. We utilize a combination of industry‑standard and customized software systems to provide various functions related to:
|
· |
point of sales; |
|
· |
inventory management; |
|
· |
warehouse management, and; |
|
· |
accounting and financial reporting. |
Government Regulation
We are subject to labor and employment laws, import and trade restrictions laws, laws governing advertising, privacy and data security laws, safety regulations and other laws, including consumer protection regulations that apply to retailers and/or the promotion and sale of merchandise and the operation of stores and warehouse facilities. In the United States, we are subject to the regulatory authority of, among other agencies, the Federal Trade Commission (“FTC”) and U.S. Food and Drug Administration (“FDA”). We are also subject to the laws of Canada, including the Canadian Food Inspection Agency, as well as provincial and local regulations. We monitor changes in these laws and believe that we are in material compliance with applicable laws.
Insurance
We maintain third-party insurance for a number of risk management activities including but not limited to a worker’s compensation, general liability, property, directors and officers, cyber insurance and employee-related health care benefits. We evaluate our insurance requirements on an ongoing basis to ensure we maintain adequate levels of coverage.
8
Trademarks and Other Intellectual Property
We regard intellectual property and other proprietary rights as important to our success. We own several trademarks and servicemarks that have been registered with the Canadian Intellectual Property Office and the U.S. Patent and Trademark Office, including DAVIDsTEA®. We have also registered our stylized logos. We also own domain names, including davidstea.com. In addition, we have registered or made application to register one or more of our marks in a number of foreign countries and expect to continue to do so in the future. There can be no assurance that we can obtain the registration for the marks in every country where registration has been sought.
We also rely upon trade secrets and know‑how to develop and maintain our competitive position. We protect our intellectual property rights through a variety of methods including trademark and trade secret laws, as well as confidentiality agreements with vendors, employees, consultants and others who have access to our proprietary information.
We must constantly protect against any infringement by competitors. If a competitor infringes on our trademark rights, we may take action to protect our rights, which could result in litigation, in which case, we may incur significant expenses and divert significant attention from our business operations.
Employees
As of the end of Fiscal 2017, we had 2,988 employees. As of February 3, 2018, we employed a total of 481 full‑time employees and 2,507 part‑time employees, with 512 in the United States and 2,476 in Canada. Of all those employees, 2,763 were employed in our retail channel and 225 were employed in corporate, distribution and direct channel support functions. None of our employees is represented by a labor union. We believe we have a good relationship with our employees.
Seasonality
Our business experiences seasonal fluctuations, reflecting increased sales during the year-end holiday season. Our sales and income are generally highest in the fourth quarter, which includes the year-end holiday sales period, and tends to be lowest in the second and third fiscal quarters. Therefore, operating results for any fiscal quarter are not necessarily indicative of results for the full fiscal year. To prepare for the year-end holiday season, we must order and keep in inventory more merchandise than we carry during other parts of the year. We expect inventory levels, along with an increase in accounts payable and accrued expenses, to reach their highest levels in the third and fourth quarters in anticipation of the increased net sales during the year-end holiday season. As a result of this seasonality, and generally because of variations in consumer spending habits, we experience fluctuations in net sales, net income and working capital requirements during the year.
Corporate Information
DAVIDsTEA Inc. was incorporated under the Canada Business Corporations Act, or the CBCA, on April 29, 2008 and our principal executive offices are located at 5430 Ferrier Street, Mount‑Royal, Québec, Canada, H4P 1M2. Our telephone number at our principal executive offices is (888) 873‑0006. Our website address is www.davidstea.com.
DAVIDsTEA Inc. owns a 100% equity interest in its sole subsidiary, DAVIDsTEA (USA) Inc., a corporation organized under the laws of Delaware.
Available Information
Our Annual Report on Form 10-K, Quarterly Reports on Form 10-Q, and Current Reports on Form 8-K, and any amendments to these reports are filed with the Securities and Exchange Commission (the “SEC”) and the Autorité des Marchés Financiers (the “AMF”). We are subject to the informational requirements of the Exchange Act and Securities Act, and file or furnish reports, proxy statements and other information with the SEC and/or the AMF, as required by applicable law.
For more information about us, visit our website www.davidstea.com. The contents of our website are not part of this Annual Report on Form 10-K. Our electronic filings with the SEC and the AMF (including all annual reports on Form 10-K, quarterly reports on Form 10-Q, and current reports on Form 8-K, and any amendments to these reports), including the exhibits, are available, free of charge, through our website as soon as reasonably practicable after we electronically file them with the SEC and the AMF. To request a printed copy of this Annual Report on Form 10-K or consolidated financial statements and related MD&A as of and for the year
9
ended February 3, 2018, which we will provide to you without charge, please contact the Company's Chief Financial Officer at 5430, Ferrier Street, Town of Mount-Royal, H4P 1M2, or send an email to investors@davidstea.com. Additional information relating to the Company, including directors’ and officers’ remuneration and indebtedness, principal holders of the Company’s securities and securities authorized for issuance under equity compensation plans is also contained in the Company’s information circular, which will be available on SEDAR at www.sedar.com or on EDGAR at www.sec.gov.
You should carefully consider the risks and uncertainties described below together with all of the other information contained in this Annual Report on Form 10-K and in our other public disclosures. If any of the following risks actually occurs, our business, prospects, operating results and financial condition could suffer materially, the trading price of our common shares could decline and you could lose all or part of your investment. Although we believe that we have identified and discussed below the key risk factors affecting our business, there may be additional risks and uncertainties that are not presently known to us or that are currently deemed immaterial that may adversely affect our business and financial condition.
Risks Related to Our Business and Our Industry
We are implementing a shift in our business strategy, and our efforts may not result in a successful growth strategy or strategic alternatives.
Previously, we had relied on a retail-based growth strategy in Canada and the United States; however, we believe that centering our momentum around new store openings is less likely to be successful in the current retail environment. We believe there is merit in continuing a retail strategy in conjunction with an advanced e-commerce platform, enhanced marketing and merchandising, and expanded wholesale distribution and grocery strategy. We have not completed our transition to a new multi channel strategy and have not set a timetable for the completion of the strategic review process. If we are not able to commit to a strategy on a timely basis, our operating results will likely be adversely affected.
In addition, our Board of Directors announced in December 2017 that it would be reviewing and considering strategic alternatives. These could include, but are not limited to, a potential financing, refinancing, restructuring, merger, acquisition, joint venture, divestiture or disposition of some or all of the Company’s assets outside of the ordinary course of business. There can be no assurance that this evaluation will result in a significant shift in our strategy. Our board has spent substantial time engaging with our significant shareholders following this announcement. Our management team and other employees may be required to spend a significant additional amount of time addressing potential strategic alternatives, which could mean that our normal operations receive less time and attention.
Expanding our focus to e-commerce, concept stores, and grocery alongside retail will require us to continue to expand and improve our operations and could strain our operational, managerial and administrative resources, which may adversely affect our business.
Growing our business in historically non-core channels will place increased demands on our operational, managerial, administrative and other resources, which may be inadequate to support our expansion. Our senior management team may be unable to effectively address challenges involved with expansion forecasts for the future. It may also require us to enhance our store management systems, financial and management controls and information systems, and to hire, train and retain regional directors, district managers, store managers and other personnel. Implementing new systems, controls and procedures, these additions to our infrastructure and any changes to our existing operational, managerial, administrative and other resources could negatively affect our results of operations and financial condition.
Our business largely depends on a strong brand image, and if we are unable to maintain and enhance our brand image, particularly in new markets where we have limited brand recognition, we may be unable to increase or maintain our level of sales.
We believe that our brand image and brand awareness are important to our business and potential future growth. We also believe that maintaining and enhancing our brand image is important to maintaining and expanding our customer base and retaining our employees. Our ability to successfully integrate our strategy to expand into new channels or to maintain the strength and distinctiveness of our brand in our existing markets will be adversely impacted if we fail to connect with our target customers. Maintaining and enhancing our brand image may require us to continue to make substantial investments in areas such as merchandising, marketing, store operations, and employee training, which could adversely affect our cash flow and which may
10
ultimately be unsuccessful. Furthermore, our brand image could be jeopardized if we fail to maintain high standards for merchandise quality, if we fail to comply with local laws and regulations if we experience negative publicity or other negative events that affect our image and reputation or as a result of communications by our shareholders. Some of these risks may be beyond our ability to control, such as the effects of negative publicity regarding our suppliers or our shareholders. Failure to successfully market and maintain our brand image could harm our business, results of operations and financial condition.
The retail industry in the United States and Canada has changed rapidly. If we are unable to adapt our business to these changes successfully, our results of operations may suffer.
In recent years, the retail industry has experienced dramatic changes. Online retail shopping is rapidly growing as a percentage of overall retail sales, and we expect the consumer shift to the e-commerce market will intensify. As a greater portion of consumer expenditures with retailers occurs online and through mobile commerce applications, failure to successfully integrate our physical retail stores with digital retail may result in financial difficulties, including store closures, impairments, bankruptcies or liquidations. This could, in turn, have a material adverse effect on our results of operations, financial condition and cash flows. Our future success will be determined, in part, on our ability to identify and capitalize on retail trends, including technology, e-commerce and other process efficiencies that will better service our customers. Although our e-commerce sales have grown in Fiscal 2017 as compared to Fiscal 2016, if we fail to compete online, our businesses, market share, results of operations and financial condition will be materially and adversely affected. There can be no assurance as to the future effect of such changes in the retail industry on our business or financial condition, results of operations or liquidity.
We have experienced a slowdown in the growth rate of our business during the past few years, and our former high levels of growth may not be achieved in future periods.
We have experienced significant fluctuation in the growth rate of our business during the last several years. Any potential future initiatives to support the growth of our business can negatively affect our gross margins in the short term and may amplify fluctuations in our growth rate from quarter to quarter depending on the timing and extent of our realization of the costs and benefits of such initiatives. Some factors affecting our business are not within our control, including macroeconomic conditions and consumer behavior. Our business performance is also linked to the overall strength of consumer discretionary spending in markets in which we operate. Economic conditions affecting selected markets in which we operate can have an impact on the strength of our business in those local markets.
Unique factors in any given quarter may affect period-to-period comparisons such as seasonal fluctuations, promotional events and store openings, among other things. The results for any quarter are not necessarily indicative of the results that we may achieve for a full fiscal year. Our results of operations may also vary relative to corresponding periods in prior years. We may take certain pricing, merchandising or marketing actions that could have a disproportionate effect on our business, financial condition and results of operations in a particular quarter or selling season, and as a result we believe that period-to-period comparisons of our results of operations are not necessarily meaningful and cannot be relied upon as indicators of future performance. Numerous other factors affect period-to-period comparisons in our revenue and comparable brand revenue growth, including: the overall economic and general retail sales environment, including the effects of uncertainty or stock market volatility on consumer spending, consumer preferences and demand, the number, size and location of stores we open, close, remodel or expand in any period; our ability to efficiently source and distribute products, changes in our product offerings and the introduction and timing of introduction of new products and new product categories, promotional events, our competitors introducing similar products or merchandise formats, the timing of various holidays, including holidays with potentially heavy retail impact and the success of any marketing programs. We cannot assure you that we will succeed in offsetting any such expenses with increased efficiency or that cost increases associated with our business will not have an adverse effect on our financial results.
We face significant competition from other specialty tea and beverage retailers and retailers of grocery products, which could adversely affect our growth plans and us.
The U.S. and Canadian tea markets are highly fragmented. We compete directly with a large number of relatively small independently owned tea retailers and a number of regional tea retailers, as well as retailers of grocery products, including loose‑leaf teas, tea sachets and other beverages. We must spend considerable resources to differentiate our customer and product experience. Some of our competitors may have greater financial, marketing and operating resources than we do. Therefore, despite our efforts, our competitors may be more successful than us in attracting customers.
We are subject to customer payment-related risks that could increase operating costs or exposure to fraud or theft, subject us to potential liability and potentially disrupt our business.
11
We accept payments using a variety of methods, including cash, credit and debit cards and gift cards. Acceptance of these payment options subjects us to rules, regulations, contractual obligations and compliance requirements, including payment network rules and operating guidelines, data security standards and certification requirements, and rules governing electronic funds transfers. For certain payment methods, including credit and debit cards, we pay interchange and other fees, which may increase over time and raise our operating costs. We rely on third parties to provide payment processing services, including the processing of credit cards, debit cards, and other forms of electronic payment. If these companies become unable to provide these services to us, or if their systems are compromised, it could potentially disrupt our business. The payment methods that we offer also subject us to potential fraud and theft by criminals, who are becoming increasingly more sophisticated, seeking to obtain unauthorized access to or exploit weaknesses that may exist in the payment systems. If we fail to comply with applicable rules or requirements for the payment methods we accept, or if payment-related data is compromised due to a breach or misuse of data, we may be liable for costs incurred by payment card issuing banks and other third parties or subject to fines and higher transaction fees, or our ability to accept or facilitate certain types of payments may be impaired. In addition, our customers could lose confidence in certain payment types, which may result in a shift to other payment types or potential changes to our payment systems that may result in higher costs. As a result, our business and operating results could be adversely affected.
Like many other retailers, we have experienced negative comparable store sales. If we are unable to modify our retail-based strategy and grow our e-commerce business, we expect that our results of operations will continue to be adversely affected.
We may not be able to regain the levels of comparable sales that we have experienced historically. If our future comparable sales continue to decline our financial results will suffer. A variety of factors affect comparable sales including increasing consumer use of e-commerce, consumer tastes, competition, current economic conditions, pricing, competitive, inflation and weather conditions. These factors may cause our comparable sales results to be materially lower than previous periods and our expectations, which could harm our results of operations and result in a decline in the price of our common shares.
Continued decrease in customer traffic in the shopping malls or other locations in which our stores are located could cause our store-based sales suffer.
Our stores are located in shopping malls, including lifestyle centers and outlets, and on street locations. Sales at these stores are derived, to a significant degree, from the volume of customer traffic in those locations and in the surrounding area. Our stores historically benefited from the ability of shopping malls and centers to generate customer traffic near our stores. Our sales volume and customer traffic may be adversely affected by, among other things:
|
· |
continued shift of consumer shopping to e-commerce; |
|
· |
economic downturns in Canada, the United States or regionally; |
|
· |
increases in fuel prices; |
|
· |
changes in consumer demographics; |
|
· |
a decrease in popularity of shopping malls or centers in which a significant number of our stores are located; |
|
· |
the closing of a shopping mall’s or center’s “anchor” store or the stores of other key tenants, or; |
|
· |
deterioration in the financial condition of shopping mall and center operators or developers that could, for example, limit their ability to maintain and improve their facilities. |
A reduction in customer traffic as a result of these or any other factors could have a material adverse effect on our business and results of operations.
In addition, severe weather conditions and other catastrophic occurrences in areas in which we have stores may have a material adverse effect on our results of operations at those locations. Such conditions may result in physical damage to our stores, loss of inventory, decreases in customer traffic and closure of one or more of our stores. Any of these factors may disrupt our business and have a material adverse effect on our financial condition and results of operations.
12
If we are unable to attract, train, assimilate and retain employees that embody our culture, including store personnel, store and district managers and regional directors, we may not be able to grow or successfully operate our business.
Our success depends in part upon our ability to attract, train, assimilate and retain a sufficient number of employees, including Tea Guides, store managers, district managers and regional directors, who understand and appreciate our culture, are able to represent our brand effectively and establish credibility with our customers. If we are unable to hire and retain store personnel capable of consistently providing a high-level of customer service, as demonstrated by their enthusiasm for our culture, understanding of our customers and knowledge of the loose‑leaf teas, pre-packaged teas, tea sachets and tea-related gifts, accessories, food and beverages we offer, our ability to open new stores may be impaired, the performance of our existing and new stores could be materially adversely affected and our brand image may be negatively impacted. In addition, the rate of employee turnover in the retail industry is typically high and finding qualified candidates to fill positions may be difficult. Any failure to meet our staffing needs or any material increases in team member turnover rates could have a material adverse effect on our business or results of operations. We also rely on temporary or seasonal personnel to staff our stores and distribution centers. We may not be able to find adequate temporary or seasonal personnel to staff our operations when needed, which may strain our existing personnel and negatively affect our operations.
Because our business is highly concentrated on a single, discretionary product category, namely tea, which includes loose-leaf teas, pre-packaged teas, tea sachets, and tea-related gifts, accessories, food and beverages, we are vulnerable to changes in consumer preferences and in economic conditions affecting disposable income that could harm our financial results.
Our business is not diversified and consists primarily of developing, sourcing, marketing and selling loose-leaf teas, pre-packaged teas, tea sachets and tea-related gifts, accessories, food and beverages. Consumer preferences often change rapidly and without warning, moving from one trend to another among many retail concepts. Therefore, our business is substantially dependent on our ability to educate consumers on the many positive attributes of tea and anticipate shifts in consumer tastes. Any future shifts in consumer preferences away from the consumption of beverages brewed from premium loose‑leaf teas would also have a material adverse effect on our results of operations. In particular, there has been an increasing focus on health and wellness by consumers, which we believe has increased demand for products, such as our teas, that are perceived to be healthier than other beverage alternatives. If such consumer preference trends change, or if our teas are not perceived to be healthier than other beverage alternatives, our financial results could be adversely affected.
Consumer purchases of specialty retail products, including our products, are historically affected by economic conditions such as changes in employment, salary and wage levels, the availability of consumer credit, inflation, interest rates, tax rates, fuel prices and the level of consumer confidence in prevailing and future economic conditions. These discretionary consumer purchases may decline during recessionary periods or at other times when disposable income is lower. Our financial performance may become susceptible to economic and other conditions in regions where we have a significant number of stores. Our continued success will depend, in part, on our ability to anticipate, identify and respond quickly to changing consumer preferences and economic conditions.
We rely on independent certification for a number of our products and our marketing of products marked “organic”, “fair trade” and “Kosher”. Loss of certification within our supply chain or as related to our manufacturing process or failure to comply with government regulations pertaining to the use of the term organic could harm our business.
We rely on independent certification, such as certifications of our products as “organic,” “Fair Trade,” or “Kosher,” to differentiate some of our products from others. We offer one of the largest certified organic collections of tea in North America amongst branded tea retailers. We must comply with the requirements of independent organizations or certification authorities in order to label our products as certified. The loss of any independent certifications could adversely affect our marketplace position, which could harm our business.
In addition, the U.S. Department of Agriculture and the Canadian Food Inspection Agency require that our certified organic products meet certain consistent, uniform standards. Compliance with such regulations could pose a significant burden on some of our suppliers, which could cause a disruption in some of our product offerings. Moreover, in the event of actual or alleged non‑compliance, we might be forced to find an alternative supplier, which could adversely affect our business, results of operations and financial condition.
Our success depends, in part, on our ability to source, develop and market new varieties of teas and tea blends, tea-related gifts, accessories, food and beverages that meet our high standards and customer preferences.
We currently offer approximately 135 varieties of teas and tea blends, including 75 new teas and tea blends each year, and a wide assortment of tea-related gifts, accessories and food. Our success depends in part on our ability to continually innovate, develop,
13
source and market new varieties of loose-leaf teas, pre-packaged teas, tea sachets and tea-related gifts, accessories, food and beverages that both meet our standards for quality and appeal to customers’ preferences. We have conducted extensive customer market research in order to target our development, however, failure to innovate, develop, source and market new varieties of loose-leaf teas, pre-packaged teas, tea sachets and tea-related gifts, accessories, food and beverages that consumers want to buy could lead to a decrease in our sales and profitability.
We may experience negative effects to our brand and reputation from real or perceived quality or safety issues with our tea, tea accessories and food and beverages, which could have an adverse effect on our operating results.
We believe our customers rely on us to provide them with high‑quality teas, tea accessories and food and beverages. Concerns regarding the safety of our teas, tea accessories and food and beverages or the safety and quality of our supply chain could cause consumers to avoid purchasing certain products from us or to seek alternative sources of tea, tea accessories and food and beverages, even if the basis for the concern has been addressed or is outside of our control. Adverse publicity about these concerns, whether or not ultimately based on fact, and whether or not involving teas, tea accessories and food and beverages sold at our stores, could discourage consumers from buying our teas, tea accessories and food and beverages and have an adverse effect on our brand, reputation and operating results.
Furthermore, the sale of teas, tea accessories and food and beverages entails a risk of product liability claims and the resulting negative publicity. For example, tea supplied to us could contain contaminants that, if not detected by us, could result in illness or death upon their consumption. Similarly, tea accessories and food and beverages could contain contaminants or contain design or manufacturing defects that could result in illness, injury or death. It is possible that product liability claims will be asserted against us in the future.
We may also be subject to involuntary product recalls or may voluntarily conduct a product recall. The costs associated with any future product recall could, individually and in the aggregate, be significant in any given fiscal year. In addition, any product recall, regardless of direct costs of the recall, may harm consumer perceptions of our teas, tea accessories and food and beverages and have a negative impact on our future sales and results of operations.
Any loss of confidence on the part of our customers in the safety and quality of our teas, tea accessories and food and beverages would be difficult and costly to overcome. Any such adverse effect could be exacerbated by our position in the market as a purveyor of quality teas, tea accessories and food and beverages and could significantly reduce our brand value. Issues regarding the safety of any teas, tea accessories and food and beverages sold by us, regardless of the cause, could have a substantial and adverse effect on our sales and operating results.
Use of social media may adversely affect our reputation or subject us to fines or other penalties.
Use of social media platforms and similar devices, including blogs, social media platforms, and other forms of Internet‑based communications allows individuals access to a broad audience of consumers and other interested persons. As laws and regulations rapidly evolve to govern the use of these platforms and devices, the failure by us, our employees or third parties acting at our direction to abide by applicable laws and regulations in the use of these platforms and devices could adversely affect our reputation or subject us to fines or other penalties.
Consumers value readily available information concerning retailers and their goods and services and often act on such information without further investigation and without regard to its accuracy. Information concerning us may be posted on social media platforms and similar devices by unaffiliated third parties, whether seeking to pass themselves off as us or not, at any time, which may be adverse to our reputation or business. The harm may be immediate without affording us an opportunity for redress or correction.
Because we rely on a limited number of third‑party suppliers and manufacturers, we may not be able to obtain quality products on a timely basis or in sufficient quantities.
We rely on a limited number of vendors to supply us with straight tea and specially blended teas on a continuous basis. Our financial performance depends in large part on our ability to purchase tea in sufficient quantities at competitive prices from these vendors. In general, we do not have long‑term purchase contracts or other contractual assurances of continued supply, pricing or exclusive access to products from these vendors.
14
Any of our suppliers or manufacturers could discontinue supplying us with teas in sufficient quantities for a variety of reasons. The benefits we currently experience from our supplier and manufacturer relationships could be adversely affected if they:
|
· |
raise the prices they charge us; |
|
· |
discontinue selling products to us; |
|
· |
sell similar or identical products to our competitors; or |
|
· |
enter into arrangements with competitors that could impair our ability to sell our suppliers’ and manufacturers’ products, including by giving our competitors exclusive licensing arrangements or exclusive access to tea blends or limiting our access to such arrangements or blends. |
During Fiscal 2017, our five largest vendors represented approximately 78% of our total loose‑leaf tea inventory purchases. Any disruption to these relationships could have a material adverse effect on our business.
Events that adversely affect our vendors could impair our ability to obtain inventory in the quantities and at the quality that we desire. Such events include difficulties or problems with our vendors’ businesses, finances, labor relations, ability to import raw materials, costs, production, insurance and reputation, as well as natural disasters or other catastrophic occurrences.
More generally, if we experience significant increased demand for our loose-leaf teas, pre-packaged teas, tea sachets and tea-related gifts, accessories, food and beverages, or need to replace an existing vendor, additional supplies or additional manufacturing capacity may not be available when required on terms that are acceptable to us, or at all, and that any new vendor may not allocate sufficient capacity to us in order to meet our requirements, fill our orders in a timely manner or meet our strict quality requirements. In the event we are required to find new sources of supply, we may encounter delays in production, inconsistencies in quality and added costs as a result of the time it takes to train our suppliers and manufacturers in our methods, products and quality control standards. In particular, the loss of a tea vendor would necessitate that we work with our new vendors to replicate our tea blends, which could result in our inability to sell such tea blends for a period of time or in a change of quality in our tea blends. Any delays, interruption or increased costs in the supply of loose‑leaf teas or the manufacture of our pre-packaged teas, tea sachets and tea-related gifts, accessories and food could have an adverse effect on our ability to meet customer demand for our products and result in lower sales and profitability both in the short and long term.
A shortage in the supply, a decrease in the quality or an increase in the price of tea and ingredients used in our tea blends, as a result of weather conditions, earthquakes, crop disease, pests or other natural or manmade causes could impose significant costs and losses on our business.
The supply and price of tea and ingredients used in our tea blends are subject to fluctuation, depending on demand and other factors outside of our control. The supply, quality and price of our teas and other ingredients can be affected by multiple factors in countries that produce tea or other ingredients, including political and economic conditions, civil and labor unrest, adverse weather conditions, including floods, drought and temperature extremes, earthquakes, tsunamis, and other natural disasters and related occurrences. This risk is particularly true with respect to regions or countries from which we source a significant percentage of our products. In extreme cases, entire tea harvests may be lost or may be negatively impacted in some geographic areas. These factors can increase costs and decrease sales, which may have a material adverse effect on our business, results of operations and financial condition.
Tea and other ingredients may be vulnerable to crop disease and pests, which may vary in severity and effect. The costs to control disease and pest damage vary depending on the severity of the damage and the extent of the plantings affected. Moreover, available technologies to control such conditions may not continue to be effective. These conditions can increase costs and decrease sales, which may have a material adverse effect on our business, results of operations and financial condition.
Our success depends substantially upon the retention of our senior management, and turnover of senior management could harm our business.
Our future success is substantially dependent on continued contributions of our senior management team and the retention of key members of our senior management, including Joel Silver, our current President and Chief Executive Officer, Howard Tafler, our current Chief Financial Officer and the other members of our executive team. We have had significant management turnover over the past 18 months. While we rebuilt almost 50% of the management team and filled all open positions in Fiscal 2017, our largest shareholder, Rainy Day, has publicly attacked the efforts of our management team. Significant turnover in our senior management could further deplete our institutional knowledge held by our existing senior management team. If we lose key executives or if any
15
such personnel fails to perform in his or her current position, or if we are unable to attract and retain skilled personnel as needed, our business could suffer. We depend on the skills and abilities of these key personnel in managing the development, manufacturing, technical, marketing and sales aspects of our business, any part of which could be harmed by further turnover. In addition, investors and analysts could view any such departure negatively, which could cause the price of our common shares to decline.
We rely significantly on information technology systems and any failure, inadequacy, interruption or security failure of those systems could harm our ability to operate our business effectively.
We rely on our information technology systems to effectively manage our business data, communications, point‑of‑sale, supply chain, order entry and fulfillment, inventory and warehouse and distribution centers and other business processes. The failure of our systems to perform as we anticipate could disrupt our business and result in transaction errors, processing inefficiencies and the loss of sales, causing our business to suffer. Despite any precautions we may take, our information technology systems may be vulnerable to damage or interruption from circumstances beyond our control, including fire, natural disasters, systems failures, power outages, viruses, security breaches, cyber-attacks and terrorism, including breaches of our transaction processing or other systems that could result in the compromise of confidential company, customer or employee data. We maintain disaster recovery procedures, but there is no guarantee that these will be adequate in all circumstances. Any such damage or interruption could have a material adverse effect on our business, cause us to face significant fines, customer notice obligations or costly litigation, harm our reputation with our customers, require us to expend significant time and expense developing, maintaining or upgrading our information technology systems or prevent us from paying our vendors or employees, receiving payments from our customers or performing other information technology, administrative or outsourcing services on a timely basis. Furthermore, our ability to conduct our website operations may be affected by changes in foreign, state, provincial and federal privacy laws and we could incur significant costs in complying with the multitude of foreign, state, provincial and federal laws regarding the unauthorized disclosure of personal information. Although we carry business interruption insurance, our coverage may not be sufficient to compensate us for potentially significant losses in connection with the risks described above.
In addition, we are dependent on third‑party hardware and software providers, including our website. We sell merchandise over the Internet through our website, which represents a growing percentage of our overall net sales. The successful operation of our e-commerce business depends on our ability to maintain the efficient and continuous operation of our website and our fulfillment operations, and to provide a shopping experience that will generate orders and return visits to our site. Our e-commerce operations are subject to numerous risks, including rapid technology change, unanticipated operating problems, credit card fraud and system failures or security breaches and the costs to address and remedy such failures or breaches. Additionally, our website operations as well as other information systems, may be affected by our reliance on third‑party hardware and software providers, whose products and services are not within our control, making it more difficult for us to correct any defects; technology changes; risks related to the failure of computer systems through which we conduct our website operations; telecommunications failures; security breaches or attempts thereof; and, similar disruptions. Third‑party hardware and software providers may not continue to make their products available to us on acceptable terms or at all and such providers may not maintain policies and practices regarding data privacy and security in compliance with all applicable laws. Any impairment in our relationships with such providers could have an adverse effect on our business.
Our marketing programs, digital initiatives and use of consumer information are governed by an evolving set of laws and enforcement trends and unfavorable changes in those laws or trends, or our failure to comply with existing or future laws, could substantially harm our business and results of operations.
We collect, maintain and use data, including personally identifiable information, provided to us through online activities and other customer interactions in our business. Our current and future marketing programs depend on our ability to collect, maintain and use this information, and our ability to do so is subject to evolving international and U.S. and Canadian federal, state and/or provincial laws and enforcement trends with respect to the foregoing. We strive to comply with all applicable laws and other legal obligations relating to privacy, data protection and consumer protection, including those relating to the use of data for marketing purposes. It is possible, however, that these requirements may be interpreted and applied in a manner that is inconsistent from one jurisdiction to another, may conflict with other rules or may conflict with our practices. If so, we may suffer damage to our reputation and be subject to proceedings or actions against us by governmental entities or others. Any such proceeding or action could hurt our reputation, force us to spend significant amounts to defend our practices, distract our management, increase our costs of doing business and result in monetary liability.
In addition, as data privacy and marketing laws change, we may incur additional costs to ensure we remain in compliance. If applicable data privacy and marketing laws become more restrictive at the international, federal, state or provincial levels, our compliance costs may increase, our ability to effectively engage customers via personalized marketing may decrease, our investment
16
in our e‑commerce platform may not be fully realized, our opportunities for growth may be curtailed by our compliance capabilities or reputational harm and our potential liability for security breaches may increase.
Data security breaches could negatively affect our reputation, credibility and business.
We collect and store personal information relating to our customers and employees, including their personally identifiable information, and rely on third parties for the operation of our e‑commerce site and for the various social media tools and websites we use as part of our marketing strategy. Consumers are increasingly concerned over the security of personal information transmitted over the Internet (or through other mechanisms), consumer identity theft and user privacy. Any perceived, attempted or actual unauthorized disclosure of personally identifiable information regarding our employees, customers or website visitors could harm our reputation and credibility, reduce our e‑commerce sales, impair our ability to attract website visitors, reduce our ability to attract and retain customers and result in litigation against us or the imposition of significant fines or penalties and could require us to expend significant time and expense developing, maintaining or upgrading our information technology systems or prevent us from paying our vendors or employees, receiving payments from our customers or performing other information. We cannot assure you that any of our third‑party service providers with access to such personally identifiable information will maintain policies and practices regarding data privacy and security in compliance with all applicable laws, or that they will not experience data security breaches or attempts thereof which could have a corresponding adverse effect on our business.
Recently, data security breaches suffered by well‑known companies and institutions have attracted a substantial amount of media attention, prompting new foreign, federal, provincial and state laws and legislative proposals addressing data privacy and security, as well as increased data protection obligations imposed on merchants by credit card issuers. As a result, we may become subject to more extensive requirements to protect the customer information that we process in connection with the purchase of our products, resulting in increased compliance costs.
Fluctuations in our results of operations for the fourth fiscal quarter have a disproportionate effect on our overall financial condition and results of operations.
Our business is seasonal and, historically, we have realized a higher portion of our sales, net income and cash flow from operations in the fourth fiscal quarter, due to the impact of the holiday selling season. Any factors that harm our fourth fiscal quarter operating results, including disruptions in our supply chain, ability of our supply chain to handle higher volumes, adverse weather or unfavorable economic conditions, could have a disproportionate effect on our results of operations for the entire fiscal year.
In order to prepare for our peak shopping season, we must order and maintain higher quantities of inventory than we would carry at other times of the year. As a result, our working capital requirements also fluctuate during the year, increasing in the second and third fiscal quarters in anticipation of the fourth fiscal quarter. Any unanticipated decline in demand for our loose‑leaf teas, pre‑packaged teas, tea sachets, tea-related gifts, accessories and food during our peak shopping season could require us to sell excess inventory at a substantial markdown, which could diminish our brand and reduce our sales and gross profit.
Our quarterly results of operations may also fluctuate significantly as a result of a variety of other factors, including the timing of new store openings and the sales contributed by new stores. As a result, historical period‑to‑period comparisons of our sales and operating results are not necessarily indicative of future period‑to‑period results. You should not rely on the results of a single fiscal quarter, particularly the fourth fiscal quarter holiday season, as an indication of our annual results or our future performance.
Third‑party failure to adequately receive, warehouse and ship our merchandise to our stores and e‑commerce customers could result in lost sales or reduced demand for our teas, tea accessories and food and beverages.
We currently rely upon third‑party warehouse facilities for the majority of our product receipts from vendors and shipments to our stores and e‑commerce customers. Our utilization of third‑party warehouse services for our merchandise is subject to risks, including employee strikes or their information technology systems failure. If we change warehousing companies, we could face logistical difficulties that could adversely affect our receipts and delivery of merchandise and we would incur costs and expend resources in connection with such change. Moreover, we may not be able to obtain terms as favorable as those we receive from our current third‑party transportation providers in Canada and the United States that we currently use, which in turn would increase our costs and thereby adversely affect our operating results.
In addition, we currently rely upon third-party transportation providers for all of our product shipments from our distribution centers to our stores and e-commerce customers. Our utilization of third-party delivery services for our shipments is subject to risk, including increases in fuel prices, which would increase our shipping costs, employee strikes and inclement weather, which may affect
17
third parties’ abilities to provide delivery services that adequately meet our shipping needs. If we change shipping companies, we could face logistical difficulties that could adversely affect deliveries, and we would incur costs and expend resources in connection with such change. Moreover, we may not be able to obtain terms as favorable as those we receive from the third-party transportation providers in Canada and the United States that we currently use, which in turn would increase our costs and thereby adversely affect our operating results.
Our ability to source our loose-leaf teas, pre-packaged teas, tea sachets and tea-related gifts, accessories and food profitably or at all could be hurt if new trade restrictions are imposed or existing trade restrictions become more burdensome.
All of our teas and ingredients used in our blends are currently grown, and a substantial majority of our pre-packaged teas, tea sachets and tea-related gifts, accessories and food is currently manufactured outside of the United States and Canada. The United States, Canada, and the countries in which our products are produced or sold internationally have imposed and may impose additional quotas, duties, tariffs, or other restrictions or regulations, or may adversely adjust prevailing quota, duty or tariff levels. Countries impose, modify and remove tariffs and other trade restrictions in response to a diverse array of factors, including global and national economic and political conditions that make it impossible for us to predict future developments regarding tariffs and other trade restrictions. Trade restrictions, including tariffs, quotas, embargoes, safeguards and customs restrictions, could increase the cost or reduce the supply of teas, tea accessories and food available to us or may require us to modify our supply chain organization or other current business practices, any of which could harm our business, financial condition and results of operations.
In addition, there is a risk that our suppliers and manufacturers could fail to comply with applicable regulations, which could lead to investigations by the United States, Canadian or foreign government agencies responsible for international trade compliance. Resulting penalties or enforcement actions could delay future imports or exports or otherwise negatively affect our business.
Fluctuations in foreign currency exchange rates could harm our results of operations as well as the price of common shares and any dividends that we may pay.
Sales in the United States accounted for approximately 14%, 16%, and 17% of our total sales for Fiscal 2015, Fiscal 2016 and Fiscal 2017, respectively. The reporting currency for our combined consolidated financial statements is the Canadian dollar. Changes in exchange rates between the Canadian dollar and the U.S. dollar may have a significant, and potentially adverse, effect on our results of operations. Because we recognize sales in the United States in U.S. dollars, if the U.S. dollar weakens against the Canadian dollar, it would have a negative impact on our U.S. operating results upon translation of those results into Canadian dollars for the purposes of consolidation. Any hypothetical reduction in sales could be partially or completely offset by lower cost of sales and lower selling, general and administration expenses that are generated in U.S. dollars.
In addition, a majority of the purchases we make from our suppliers are denominated in U.S. dollars. As a result, a depreciation of the Canadian dollar against the U.S. dollar increases the cost of acquiring those supplies in Canadian dollars, which negatively affects our gross profit margin. During the year, we have entered into forward contracts to fix the exchange rate of our expected U.S. dollar purchases in respect to our inventory. However, these may be inadequate in offsetting any gains and losses in foreign currency transactions, and such gains or losses could have a significant, and potentially adverse, effect on our results of operations.
Our earnings per share are reported in Canadian dollars, and accordingly may be translated into U.S. dollars by analysts or our investors. Given the foregoing, the value of an investment in our common shares to a U.S. shareholder will fluctuate as the U.S. dollar rises and falls against the Canadian dollar. Our decision to declare a dividend depends on results of operations reported in Canadian dollars, and we will declare dividends, if any, in Canadian dollars. As a result, U.S. and other shareholders seeking U.S. dollar total returns, including increases in the share price and dividends paid, are subject to foreign exchange risk as the U.S. dollar rises and falls against the Canadian dollar.
A widespread health epidemic could adversely affect our business.
Our business could be severely affected by a widespread regional, national or global health epidemic. A widespread health epidemic may cause customers to avoid public gathering places such as our stores or otherwise change their shopping behaviors. Additionally, a widespread health epidemic could adversely affect our business by disrupting production of products to our stores and by affecting our ability to appropriately staff our stores.
18
Changes in accounting standards may materially affect reporting of our financial condition and results from operations.
Accounting principles as per the International Financial Reporting Standards (“IFRS”) and related accounting pronouncements, implementation guidelines, and interpretations for many aspects of our business, such as accounting for inventories, intangible assets, store closures, sales, leases, insurance, income taxes, stock-based compensation, are complex and involved subjective judgements. Changes in these rules or their interpretation may significantly change or add significant volatility to our reported income or loss without a comparable underlying change in cash flows from operations. As a result, changes in accounting standards may materially affect our reported financial condition and results from operations.
Specifically, changes to financial accounting standards will require operating leases to be recognized on our balance sheet. We have significant obligations relating to our current operating leases, as all our existing stores are subject to leases, which have an average remaining term of approximately 6.2 years, and as of February 3, 2018, we had undiscounted operating lease commitments of approximately $135.0 million, scheduled through 2030, related primarily to our stores, including stores that are not yet open. These commitments represent the minimum lease payments due under our operating leases, excluding common area maintenance, insurance and taxes related to our operating lease obligations, and do not reflect fair market value rent reset provisions in the leases. These leases are classified as operating leases and disclosed in Note 13 to our consolidated financial statements included elsewhere in this Annual Report on Form 10-K, but are not reflected in liabilities on our consolidated balance sheets. During Fiscal 2017, our rent expense charged under operating leases was approximately $31.6 million.
The International Accounting Standards Board (“IASB”) released IFRS 16, “Leases” (“IFRS 16”) replacing IAS 17, “Leases”. This standard requires lessees to recognize assets and liabilities for most leases. The new standard will be effective for annual periods beginning on or after January 1, 2019. Early application is permitted, provided the new revenue standard, IFRS 15, has been applied, or is applied at the same date as IFRS 16. The Company has performed a preliminary assessment of the potential impact of the adoption of IFRS 16 on its consolidated financial statements. The Company expects the adoption of IFRS 16 will have a significant impact as the Company will recognize new assets and liabilities for its operating leases of retail stores. In addition, the nature and timing of expenses related to those leases will change as IFRS 16 replaces the straight-line operating lease expense with a depreciation charge for right-of use assets and interest expense on lease liabilities. The Company has not yet determined which transition method it will apply or whether it will use the optional exemptions or practical expedients under the standard. The Company expects to disclose additional detailed information, including its transition method, any practical expedients elected and estimated quantitative financial effects, before the adoption of IFRS 16.
Changes to estimates related to our property, fixtures and equipment or operating results that are lower than our current estimates at certain shop locations may cause us to incur impairment charges on certain long-lived assets, which may adversely affect our results of operations.
In accordance with accounting guidance as it relates to the impairment of long-lived assets, we make certain estimates and projections with regard to individual store operations, as well as our overall performance, in connection with our impairment analyses for long-lived assets. When impairment triggers are deemed to exist for any location, the recoverable amount is compared to its carrying value. If the carrying value exceeds the recoverable amount, an impairment charge equal to the difference between the carrying value and recoverable amount is recorded. The projections of future cash flows used in these analyses require the use of judgment and a number of estimates and projections of future operating results. If actual results differ from our estimates, additional charges for asset impairments may be required in the future. We have experienced significant impairment charges in past years and the current fiscal year. If future impairment charges are significant, our reported operating results would be adversely affected.
We are subject to potential challenges relating to overtime pay and other regulations that affect our employees, which could cause our business, financial condition, results of operations or cash flows to suffer.
Various labor laws, including Canadian federal and provincial laws and U.S. federal and state laws, among others, govern our relationship with our employees and affect our operating costs. These laws include minimum wage requirements, overtime pay, unemployment tax rates, workers’ compensation rates and citizenship requirements. These laws change frequently and may be difficult to interpret and apply. In particular, as a retailer, we may be subject to challenges regarding the application of overtime and related pay regulations to our employees. A determination that we do not comply with these laws could harm our brand image, business, financial condition and results of operation. Additional government‑imposed increases in minimum wages, overtime pay, paid leaves of absence or mandated health benefits could also cause our business, financial condition, results of operations or cash flows to suffer.
19
If we face labor shortages or increased labor costs, our results of operations and our growth could be adversely affected.
Labor is a significant component of the cost of operating our business. Our ability to meet labor needs while controlling labor costs is subject to external factors, such as employment levels, prevailing wage rates, minimum wage legislation, changing demographics, health and other insurance costs and governmental labor and employment requirements. In the event of increasing wage rates, if we fail to increase our wages competitively, the quality of our workforce could decline, while increasing our wages could cause our earnings to decrease. If we face labor shortages or increased labor costs because of increased competition for employees from our competitors and other industries, higher employee-turnover rates, unionization of farm workers or increases in the federal- or state-mandated minimum wage, change in exempt and non-exempt status, or other employee benefits costs (including costs associated with health insurance coverage or workers’ compensation insurance), our operating expenses could increase and our business, financial condition and results of operations could be materially and adversely affected.
Litigation may adversely affect our business, financial condition, results of operations or liquidity.
Our business is subject to the risk of litigation by employees, consumers, vendors, competitors, intellectual property rights holders, shareholders, government agencies and others through private actions, class actions, administrative proceedings, regulatory actions or other litigation. The outcome of litigation, particularly class action lawsuits, regulatory actions and intellectual property claims, is inherently difficult to assess or quantify. Plaintiffs in these types of lawsuits may seek recovery of very large or indeterminate amounts, and the magnitude of the potential loss relating to these lawsuits may remain unknown for substantial periods of time. In addition, certain of these lawsuits, if decided adversely to us or settled by us, may result in liability material to our financial statements as a whole or may negatively affect our operating results if changes to our business operation are required. Regardless of the outcome or merit, the cost to defend future litigation may be significant and result in the diversion of management and other company resources. There also may be adverse publicity associated with litigation that could negatively affect customer perception of our business, regardless of whether the allegations are valid or whether we are ultimately found liable. As a result, litigation may adversely affect our business, financial condition, results of operations or liquidity.
Our failure to comply with existing or new regulations, both in the United States and Canada, or an adverse action regarding product claims or advertising could have a material adverse effect on our results of operations and financial condition.
Our business operations, including labeling, advertising, sourcing, distribution and sale of our products, are subject to regulation by various federal, state and local government entities and agencies, particularly the Food and Drug Administration (“FDA”), the Federal Trade Commission (“FTC”) and the Office of Foreign Asset Control (“OFAC”) in the United States, as well as Canadian entities and agencies, including the Canadian Food Inspection Agency. From time to time, we may be subject to challenges to our marketing, advertising or product claims in litigation or governmental, administrative or other regulatory proceedings. Failure to comply with applicable regulations or withstand such challenges could result in changes in our supply chain, product labeling, packaging or advertising, loss of market acceptance of the product by consumers, additional recordkeeping requirements, injunctions, product withdrawals, recalls, product seizures, fines, monetary settlements or criminal prosecution. Any of these actions could have a material adverse effect on our results of operations and financial condition.
In addition, consumers who allege that they were deceived by any statements that were made in advertising or labeling could bring a lawsuit against us under consumer protection laws. If we were subject to any such claims, while we would defend ourselves against such claims, we may ultimately be unsuccessful in our defense. Defending ourselves against such claims, regardless of their merit and ultimate outcome, would likely result in a significant distraction for management, be lengthy and costly and could adversely affect our results of operations and financial condition. In addition, the negative publicity surrounding any such claims could harm our reputation and brand image.
We may not be able to protect our intellectual property adequately, which could harm the value of our brand and adversely affect our business.
We believe that our intellectual property has substantial value and has contributed significantly to the success of our business. We pursue the registration of our domain names, trademarks, service marks and patentable technology in Canada, the United States and in certain other jurisdictions. In particular, our trademarks, including our registered DAVIDsTEA and DAVIDsTEA logo design trademarks and the unregistered names of a significant number of the varieties of specially blended teas that we sell, are valuable assets that reinforce the distinctiveness of our brand and our customers’ favorable perception of our stores.
20
We also strive to protect our intellectual property rights by relying on federal, state and common law rights, as well as contractual restrictions with our employees, contractors (including those who develop, source, manufacture, store and distribute our tea blends, tea accessories and other tea‑related merchandise), vendors and other third parties. However, we may not enter into confidentiality and/or invention assignment agreements with every employee, contractor and service provider to protect our proprietary information and intellectual property ownership rights. Those agreements that we do execute may be breached, resulting in the unauthorized use or disclosure of our proprietary information. Individuals not subject to invention assignments agreements may make adverse ownership claims to our current and future intellectual property, and even the existence of executed confidentiality agreements may not deter independent development of similar intellectual property by others. In addition, although we have exclusivity agreements with each of our significant suppliers who performs blending services for us, or who has access to our designs, we may not be able to successfully protect the tea blends and designs to which such suppliers have access under trade secret laws, and the periods for exclusivity governing our tea blends last for periods as brief as 18 months. Unauthorized disclosure of or claims to our intellectual property or confidential information may adversely affect our business.
From time to time, third parties have used our trade dress and/or sold our products using our name without our consent, and, we believe, have infringed or misappropriated our intellectual property rights. We respond to these actions on a case‑by‑case basis and where appropriate may commence litigation to protect our intellectual property rights. However, we may not be able to detect unauthorized use of our intellectual property or to take appropriate steps to enforce, defend and assert our intellectual property in all instances.
Effective trade secret, patent, copyright, trademark and domain name protection is expensive to obtain, develop and maintain, in terms of both initial and ongoing registration or prosecution requirements and expenses and the costs of defending our rights. Our trademark rights and related registrations may be challenged in the future and could be opposed, canceled or narrowed. Our failure to register or protect our trademarks could prevent us in the future from using our trademarks or challenging third parties who use names and logos similar to our trademarks, which may in turn cause customer confusion, impede our marketing efforts, negatively affect customers’ perception of our brand, stores and products, and adversely affect our sales and profitability. Moreover, intellectual property proceedings and infringement claims brought by or against us could result in substantial costs and a significant distraction for management and have a negative impact on our business. We cannot assure you that we are not infringing or violating, and have not infringed or violated, any third‑party intellectual property rights, or that we will not be accused of doing so in the future.
In addition, although we have also taken steps to protect our intellectual property rights internationally, the laws of certain foreign countries may not protect intellectual property to the same extent as do the laws of the United States and Canada and mechanisms for enforcement of intellectual property rights may be inadequate in those countries. Other entities may have rights to trademarks that contain portions of our marks or may have registered similar or competing marks in foreign countries. There may also be other prior registrations in other foreign countries of which we are not aware. We may need to expend additional resources to defend our trademarks in these countries, and the inability to defend such trademarks could impair our brand or adversely affect the growth of our business internationally.
We are subject to the risks associated with leasing substantial amounts of space and are required to make substantial lease payments under our operating leases. Any failure to make these lease payments when due would likely harm our business, profitability and results of operations.
We do not own any real estate. Instead, we lease all of our store locations, our corporate offices in Montréal, Canada and a distribution center in Montréal, Canada. Our store leases typically have ten‑year terms and generally require us to pay total rent per square foot that is reflective of our small average store square footage and premium locations. Many of our lease agreements have defined escalating rent provisions over the initial term and any extensions. Our substantial operating lease obligations could have significant negative consequences, including:
|
· |
requiring that an increased portion of our cash from operations and available cash on hand be applied to pay our lease obligations, thus reducing liquidity available for other purposes; |
|
· |
increasing our vulnerability to adverse general economic and industry conditions; |
|
· |
limiting our flexibility to plan for or react to changes in our business or in the industry in which we compete; and |
|
· |
limiting our ability to obtain additional financing. |
We depend on cash flow from operations to pay our lease expenses, finance our growth capital requirements and fulfill our other cash needs. If our business does not generate sufficient cash flow from operating activities to fund these requirements, we may
21
not be able to achieve our growth plans, fund our other liquidity and capital needs or ultimately service our lease expenses, which would harm our business.
If an existing or future store is not profitable, and we decide to close it, we may nonetheless remain committed to perform our obligations under the applicable lease including, among other things, paying the base rent for the balance of the lease term. Moreover, even if a lease has an early cancellation clause, we may not satisfy the contractual requirements for early cancellation under that lease. In addition, as our leases expire, we may fail to negotiate renewals on commercially acceptable terms or at all, which could cause us to close stores in desirable locations. Even if we are able to renew existing leases, the terms of such renewal may not be as attractive as the expiring lease, which could materially and adversely affect our results of operations. Of our current stores, two (2) store lease expire without an option to renew in Fiscal 2018 and two (2) store leases expire without an option to renew in Fiscal 2019. Our inabilities to enter into new leases, renew existing leases on terms acceptable to us, or be released from our obligations under leases for stores that we close could materially adversely affect us.
Our ability to use our net operating loss carryforwards in the United States may be subject to limitation in the event we experience an “ownership change.”
As of February 3, 2018, we had U.S. federal net operating loss carryforwards of US$14.2 million. Our U.S. federal net operating loss carryforwards begin to expire during the years 2033 and 2038.
Under Section 382 of the Internal Revenue Code of 1986, as amended, our ability to utilize net operating loss carryforwards in any taxable year may be limited if we experience an “ownership change.” A Section 382 “ownership change” generally occurs if one or more shareholders or groups of shareholders who own at least 5% of our common shares increase their ownership by more than 50 percentage points over their lowest ownership percentage within a rolling three‑year period. Any such limitation on the timing of utilizing our net operating loss carryforwards would increase the use of cash to settle our tax obligations. Accordingly, the application of Section 382 could have a material effect on the use of our net operating loss carryforwards, which could adversely affect our future cash flow from operations.
Changes in effective tax rates or adverse outcomes resulting from examination of our income or other tax returns could adversely affect our results from operations and financial condition.
We are subject to taxes by the U.S. federal and state tax authorities as well as Canadian federal, provincial and local tax authorities, and our tax liabilities will be affected by the allocation of profits and expenses to differing jurisdictions. Our future effective tax rates could be subject to volatility or adversely affected by a number of factors, including:
|
· |
changes in the valuation of our deferred tax assets and liabilities, including as a result of the tax reform bill in the United States known as the Tax Cuts and Jobs Act; |
|
· |
expected timing and amount of the release of any tax valuation allowance; |
|
· |
tax effects of stock-based compensation; |
|
· |
changes in tax laws, regulations or interpretations thereof; or |
|
· |
future earnings being lower than anticipated in jurisdictions where we have lower statutory tax rates and higher than anticipated earnings in jurisdictions where we have higher statutory tax rates. |
In addition, we may be subject to audits of our income, sales and other transaction taxes by these tax authorities. Outcomes from these audits could have an adverse effect on our operating results and financial condition.
Risks Relating to Ownership of Our Common Shares
Our largest shareholder owns 46% of our common shares, which may limit our minority shareholders’ ability to influence corporate matters.
Our largest shareholder, Rainy Day Investments, Ltd. (“Rainy Day”) owns 46% of our common shares. Rainy Day may have the ability to influence the outcome of any corporate transaction or other matter submitted to shareholders for approval and the interests of Rainy Day may differ from the interests of our other shareholders.
Rainy Day, as our largest shareholder, has significant influence in electing our directors and, consequently, has a substantial say in the appointment of our executive officers, our management policies and strategic direction. In addition, certain matters, such as amendments to our articles of incorporation or votes regarding a potential merger or a sale of all or substantially all of our assets,
22
require approval of at least two thirds of our shareholders; Rainy Day’s approval will be required to achieve any such threshold. Accordingly, should the interests of Rainy Day differ from those of other shareholders, the other shareholders are highly susceptible to the influence of Rainy Day’s votes.
Shareholder activism, including public criticism of our company or our management team or litigation, may adversely affect our stock price.
Responding to actions by activist stockholders can be costly and time-consuming and may divert the attention of management and our employees. The review, consideration, and response to public announcements or criticism by any activist shareholder, or litigation initiated by such shareholders, requires the expenditure of significant time and resources by us. As previously announced, we have received nominations for an alternative slate of directors from our largest shareholder, to which our other significant shareholders have expressed disagreement. Such public disagreements, or a proxy contest for the election of directors at our annual meeting, could require us to incur significant legal fees and proxy solicitation expenses, may negatively affect our stock price, potentially result in litigation, and may have other material adverse effects on our business.
If we are unable to implement and maintain effective internal control over financial reporting in the future, we may fail to prevent or detect material misstatements in our financial statements, in which case investors may lose confidence in the accuracy and completeness of our financial reports and the market price of our common shares may be negatively affected.
As a public company, we are required to maintain internal controls over financial reporting and to report any material weaknesses in such internal controls. In addition, beginning with our second Annual Report on Form 10-K, we are required to furnish a report by management on the effectiveness of our internal control over financial reporting, pursuant to Section 404 of the Sarbanes‑Oxley Act. Our independent registered public accounting firm is not required to express an opinion as to the effectiveness of our internal control over financial reporting until after we are no longer an “emerging growth company,” as defined in the JOBS Act. At such time, however, our independent registered public accounting firm may issue a report that is adverse in the event it is not satisfied with the level at which our internal control over financial reporting is documented, designed or operating.
The process of designing, implementing, and testing the internal control over financial reporting required to comply with this obligation is time‑consuming, costly and complicated. If we identify material weaknesses in our internal control over financial reporting, if we are unable to comply with the requirements of Section 404 of the Sarbanes‑Oxley Act in a timely manner or if our management is unable to report that our internal control over financial reporting is effective, or if our independent registered public accounting firm is unable to express an opinion as to the effectiveness of our internal control over financial reporting once we are no longer an “emerging growth company,” investors may lose confidence in the accuracy and completeness of our financial reports and the market price of our common shares could be negatively affected. We could also become subject to investigations by the NASDAQ Global Market on which our securities are listed, the SEC, or other regulatory authorities, which could require additional financial and management resources.
Our stock price may be volatile or may decline
Our common shares have traded as high as US$29.97 and as low as US$3.20 during the period from our IPO to April 18, 2018.
An active, liquid and orderly market for our common shares may not be sustained, which could depress the trading price of our common shares. An inactive market may also impair our ability to raise capital to continue to fund operations by selling shares and may impair our ability to acquire other companies or technologies by using our shares as consideration. In addition, broad market and industry factors, most of which we cannot control, may harm the price of our common shares, regardless of our actual operating performance. In addition, securities markets worldwide have experienced, and are likely to continue to experience, significant price and volume fluctuations. This market volatility, as well as general economic, market and political conditions and Canadian dollar exchange rate relative to the U.S. dollar, could subject the market price of our shares to wide price fluctuations regardless of our operating performance. Our operating results and the trading price of our shares may fluctuate in response to various factors, including:
|
· |
conditions or trends affecting our industry or the economy globally; in particular, in the retail sales environment; |
|
· |
stock market price and volume fluctuations of other publicly traded companies and, in particular, those that are in the retail industry; |
|
· |
fluctuations of the Canadian dollar exchange rate relative to the U.S. dollar; |
23
|
· |
variations in our operating performance and the performance of our competitors; |
|
· |
seasonal fluctuations; |
|
· |
our entry into new markets; |
|
· |
timing of new store openings and our levels of comparable sales; |
|
· |
actual or anticipated fluctuations in our quarterly financial and operating results or other operating metrics, such as comparable store sales, that may be used by the investment community; |
|
· |
changes in financial estimates by us or by any securities analysts who might cover our shares; |
|
· |
issuance of new or changed securities analysts’ reports or recommendations; |
|
· |
loss of visibility as to investor expectations as a result of a lack of published reports from industry analysts; |
|
· |
actions and announcements by us or our competitors, including new product offerings, significant acquisitions, strategic partnerships or divestitures; |
|
· |
sales, or anticipated sales, of large blocks of our shares, including sales by our directors, officers or significant shareholders; |
|
· |
additions or departures of key personnel; |
|
· |
significant developments relating to our relationships with business partners, vendors and distributors; |
|
· |
regulatory developments negatively affecting our industry; |
|
· |
changes in accounting standards, policies, guidance, interpretation or principles; |
|
· |
volatility in our share price, which may lead to higher share-based compensation expense under applicable accounting standards; |
|
· |
speculation about our business in the press or investment community; |
|
· |
investors’ perception of the retail industry in general and our Company in particular; and |
|
· |
other events beyond our control such as major catastrophic events, weather and war. |
These and other factors, many of which are beyond our control, may cause our operating results and the market price and demand for our shares to fluctuate substantially. Fluctuations in our quarterly operating results could limit or prevent investors from readily selling their shares and may otherwise negatively affect the market price and liquidity of our shares. In addition, in the past, securities class action litigation has often been instituted against companies following periods of volatility in their stock price. If any of our shareholders brought a lawsuit against us, we could incur substantial costs defending the lawsuit. Such a lawsuit could also divert the time and attention of our management from our business, which could significantly harm our profitability and reputation.
Our articles, bylaws and certain Canadian legislation contain provisions that may have the effect of delaying or preventing a change in control.
Certain provisions of our articles of amendment and bylaws, together or separately, could discourage potential acquisition proposals, delay or prevent a change in control and limit the price that certain investors may be willing to pay for our common shares.
For instance, our bylaws contain provisions that establish certain advance notice procedures for nomination of candidates for election as directors at shareholders’ meetings.
The Investment Canada Act requires that a “non‑Canadian,” as defined therein, file an application for review with the Minister responsible for the Investment Canada Act and obtain approval of the Minister prior to acquiring control of a Canadian business, where prescribed financial thresholds are exceeded. Otherwise, there are no limitations either under the laws of Canada or in our articles on the rights of non‑Canadians to hold or vote our common shares.
Any of these provisions may discourage a potential acquirer from proposing or completing a transaction that may have otherwise presented a premium to our shareholders.
24
Because we are a federally incorporated Canadian corporation and the majority of our directors and officers are resident in Canada, it may be difficult for investors in the United States to enforce civil liabilities against us based solely upon the federal securities laws of the United States.
We are a federally incorporated Canadian corporation with our principal place of business in Canada. A majority of our directors and officers and the auditors named herein are residents of Canada and all or a substantial portion of our assets and those of such persons are located outside the United States. Consequently, it may be difficult for U.S. investors to effect service of process within the United States upon us or our directors or officers or such auditors who are not residents of the United States, or to realize in the United States upon judgments of courts of the United States predicated upon civil liabilities under the Securities Act. Investors should not assume that Canadian courts: (1) would enforce judgments of U.S. courts obtained in actions against us or such persons predicated upon the civil liability provisions of the U.S. federal securities laws or the securities or “blue sky” laws of any state within the United States or (2) would enforce, in original actions, liabilities against us or such persons predicated upon the U.S. federal securities laws or any such state securities or blue sky laws.
We may lose our foreign private issuer status in the future, which could result in significant additional costs and expenses.
As discussed above, we are a foreign private issuer, and therefore, we are not required to comply with all of the periodic disclosure and current reporting requirements of the Exchange Act. The determination of foreign private issuer status is made annually on the last business day of an issuer’s most recently completed second fiscal quarter, and, accordingly, the next determination will be made with respect to us on August 4, 2018. We would lose our foreign private issuer status if, for example, more than 50% of our common shares is directly or indirectly held by residents of the United States on August 4, 2018 and we fail to meet additional requirements necessary to maintain our foreign private issuer status. If we lose our foreign private issuer status on this date, we will be required to file with the SEC periodic reports and registration statements on U.S. domestic issuer forms beginning at the end of Fiscal 2018, which are more detailed and extensive than the forms available to a foreign private issuer. We will also have to mandatorily comply with U.S. federal proxy requirements, and our officers, directors and principal shareholders will become subject to the short‑swing profit disclosure and recovery provisions of Section 16 of the Exchange Act. In addition, we will lose our ability to rely upon exemptions from certain corporate governance requirements under the listing rules of The NASDAQ Global Market. As a U.S. listed public company that is not a foreign private issuer, we will incur significant additional legal, accounting and other expenses that we do not incur as a foreign private issuer, and accounting, reporting and other expenses in order to maintain a listing on a U.S. securities exchange. These expenses will relate to, among other things, the obligation to reconcile our financial information that is reported according to IFRS to U.S. GAAP and to report future results according to U.S. GAAP.
There could be adverse tax consequence for our shareholders in the United States if we are a passive foreign investment company.
Under United States federal income tax laws, if a company is, or for any past period was, a passive foreign investment company (“PFIC”), it could have adverse United States federal income tax consequences to U.S. shareholders even if the company is no longer a PFIC. The determination of whether we are a PFIC is a factual determination made annually based on all the facts and circumstances and thus is subject to change, and the principles and methodology used in determining whether a company is a PFIC are subject to interpretation. While we do not believe that we currently are or have been a PFIC, we could be a PFIC in the future. United States purchasers of our common shares are urged to consult their tax advisors concerning United States federal income tax consequences of holding our common shares if we are considered to be a PFIC.
If we are a PFIC, U.S. holders would be subject to adverse U.S. federal income tax consequences, such as ineligibility for any preferred tax rates on capital gains or on actual or deemed dividends, interest charges on certain taxes treated as deferred, and additional reporting requirements under U.S. federal income tax laws or regulations. Whether or not U.S. holders make a timely qualified electing fund, or QEF, election or mark‑to‑market election may affect the U.S. federal income tax consequences to U.S. holders with respect to the acquisition, ownership and disposition of our common shares and any distributions such U.S. holders may receive. Investors should consult their own tax advisors regarding all aspects of the application of the PFIC rules to our common shares.
ITEM 1B. UNRESOLVED STAFF COMMENTS
None.
25
Properties
Our principal executive and administrative offices are located at 5430 Ferrier Street, Mount‑Royal, Québec, Canada, H4P 1M2. We currently lease one warehouse and distribution center located in Montréal, Québec, which we opened in July 2010. See “Item 1. Business — Warehouse and Distribution Facilities” above for further information.
The general location, use, approximate size and lease renewal date of our properties, none of which is owned by us, are set forth below:
|
|
|
|
|
Approximate |
|
Lease |
|
|
Location |
|
Use |
|
Square Feet |
|
Renewal Date |
|
|
Montréal, Québec |
|
Executive and Administrative Offices |
|
22,000 |
|
October 31, 2018 |
|
|
Montréal, Québec |
|
Distribution Center |
|
60,000 |
|
June 30, 2021 |
|
As of February 3, 2018, we operated 240 company-operated stores consisting of approximately 224,000 gross square feet. All of our stores are leased from third parties and the leases typically have 10-year terms. Most leases for our retail stores provide for a minimum rent, typically including rent increases, plus a percentage rent based upon sales after certain minimum thresholds are achieved. The leases generally require us to pay insurance, utilities, real estate taxes and repair and maintenance expenses.
The following table summarizes the locations of our stores as of February 3, 2018:
|
|
|
Number of |
|
|
Location |
|
Stores |
|
|
Alberta, Canada |
|
26 |
|
|
British Columbia, Canada |
|
30 |
|
|
Manitoba, Canada |
|
6 |
|
|
Newfoundland, Canada |
|
2 |
|
|
New Brunswick, Canada |
|
3 |
|
|
Nova Scotia, Canada |
|
5 |
|
|
Ontario, Canada |
|
65 |
|
|
Prince Edward Island, Canada |
|
1 |
|
|
Québec, Canada |
|
49 |
|
|
Saskatchewan, Canada |
|
3 |
|
|
California |
|
9 |
|
|
Connecticut |
|
2 |
|
|
Florida |
|
1 |
|
|
Illinois |
|
8 |
|
|
Indiana |
|
1 |
|
|
Massachusetts |
|
10 |
|
|
Maryland |
|
2 |
|
|
Minnesota |
|
1 |
|
|
New Jersey |
|
2 |
|
|
New York |
|
7 |
|
|
Ohio |
|
3 |
|
|
Pennsylvania |
|
1 |
|
|
Vermont |
|
1 |
|
|
Washington |
|
1 |
|
|
Wisconsin |
|
1 |
|
We are, from time to time, subject to claims and suits arising in the ordinary course of business. Although the outcome of these and other claims cannot be predicted with certainty, management does not believe that the ultimate resolution of these matters will have a material adverse effect on our financial position or on our results of operations.
26
27
ITEM 5. MARKET FOR REGISTRANT’S COMMON EQUITY, RELATED STOCKHOLDER MATTERS AND ISSUER PURCHASES OF EQUITY SECURITIES
Market Information
The shares of the Company consist of an unlimited number of Common Shares. The rights, privileges, restrictions and conditions attaching to the Common Shares of the Company are as follows:
|
1. |
Voting Rights |
Each holder of Common Shares shall be entitled to receive notice of and to attend all meetings of shareholders of the Company and to vote thereat, except meetings at which only holders of a specified class of shares (other than Common Shares) or specified series of share are entitled to vote. At all meetings of which notice must be given to the holders of the Common Shares, each holder of Common Shares shall be entitled to one vote in respect of each Common Share held by such holder.
|
2. |
Dividends |
The holders of the Common Shares shall be entitled, subject to the rights, privileges, restrictions and conditions attaching to any other class of shares of the Company, to receive any dividend declared by the Company.
|
3. |
Liquidation, Dissolution or Winding-up |
The holders of the Common Shares shall be entitled, subject to the rights, privileges, restrictions and conditions attaching to any other class of shares of the Company, to receive the remaining property of the Company on a liquidation, dissolution or winding-up of the Company, whether voluntary or involuntary, or on any other return of capital or distribution of assets of the Company among its shareholders for the purpose of winding-up its affairs.
Our common shares have been listed on the NASDAQ Global Market under the symbol "DTEA" since June 2015. The following table sets forth, for the periods indicated, the high and low sale prices of our common shares reported by the NASDAQ Global Market for the periods indicated:
|
|
|
Common Share Price (US$) |
|
||||
|
|
|
(NASDAQ Stock Market) |
|
||||
|
|
|
High |
|
Low |
|
||
|
Fiscal Year Ended February 3, 2018 |
|
|
|
|
|
|
|
|
Fourth Quarter |
|
$ |
4.60 |
|
$ |
3.65 |
|
|
Third Quarter |
|
|
6.30 |
|
|
4.00 |
|
|
Second Quarter |
|
|
6.75 |
|
|
4.90 |
|
|
First Quarter |
|
|
7.95 |
|
|
6.03 |
|
|
Fiscal Year Ended January 28, 2017 |
|
|
|
|
|
|
|
|
Fourth Quarter |
|
$ |
11.20 |
|
$ |
6.30 |
|
|
Third Quarter |
|
|
13.95 |
|
|
10.50 |
|
|
Second Quarter |
|
|
14.30 |
|
|
10.76 |
|
|
First Quarter |
|
|
12.27 |
|
|
8.88 |
|
As of April 18, 2018, there were approximately 12 holders of record of our common shares.
We have never declared or paid regular cash dividends on our common shares. The declaration and payment of any dividends in the future will be determined by our Board of Directors, in its discretion, and will depend on a number of factors, including our earnings, capital requirements, overall financial condition, and contractual restrictions, including restrictions contained in any agreements governing any indebtedness we may incur.
28
Stock Performance Graph
The stock performance graph below compares cumulative total return on DAVIDsTEA common shares to the cumulative total return of the NASDAQ Composite Index, S&P 500 Index and S&P 500 Consumer Discretionary Sector Index from June 5, 2015 through February 3, 2018. The graph assumes an initial investment of $100 in DAVIDsTEA and the NASDAQ Composite Index, S&P 500 Index and S&P 500 Consumer Discretionary Sector Index as of June 5, 2015. The performance shown on the graph below is not intended to forecast or be indicative of possible future performance of our common shares.
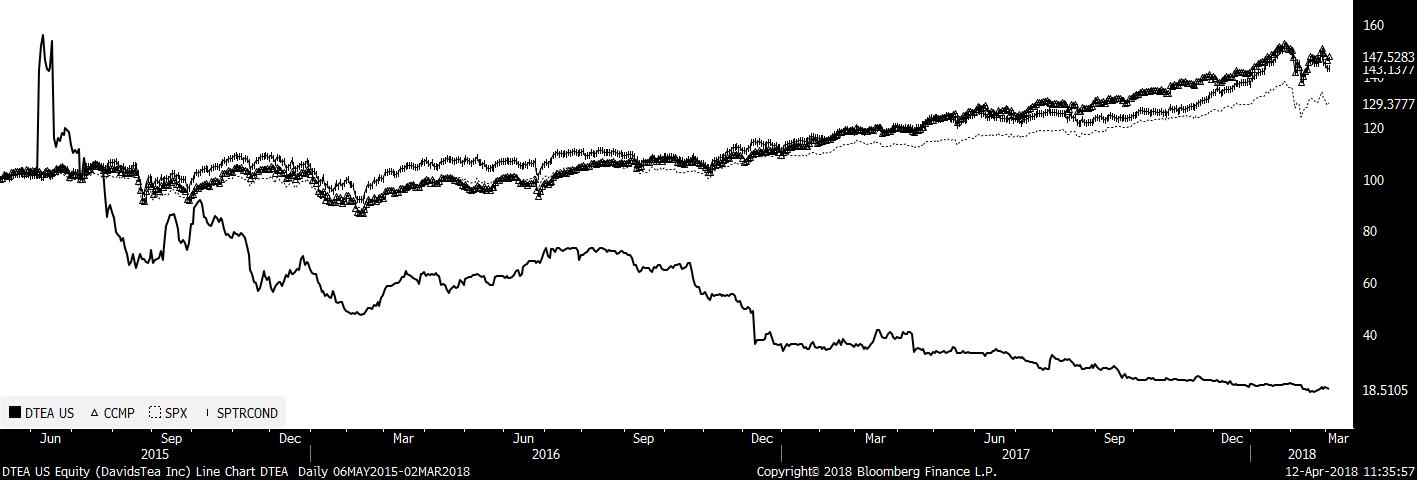
29
ITEM 6. SELECTED CONSOLIDATED FINANCIAL DATA
The following table sets forth our selected consolidated financial data as of the dates and for the periods indicated. The selected consolidated financial data as of February 3, 2018, January 28, 2017 and January 30, 2016 and for the years ended February 3, 2018, January 28, 2017, January 30, 2016, January 31, 2015 and January 25, 2014 presented in this table has been derived from our audited consolidated financial statements included elsewhere in this Annual Report on Form 10-K. Historical results are not necessarily indicative of the results to be expected for future periods. Our financial statements have been prepared in accordance with International Financial Reporting Standards (“IFRS”), as issued by the International Accounting Standards Board (“IASB”). These principles differ in certain respects from U.S. GAAP.
This selected consolidated financial data should be read in conjunction with the disclosures set forth under “Risk Related to Our Business and Our Industry” and “Management’s Discussion and Analysis of Financial Condition and Results of Operations” and the consolidated financial statements and the related notes thereto.
|
|
|
For the year ended |
|
|||||||||||||
|
|
|
February 3, |
|
January 28, |
|
January 30, |
|
January 31, |
|
January 25, |
|
|||||
|
|
|
2018 |
|
2017 |
|
2016 |
|
2015 |
|
2014 |
|
|||||
|
|
|
|
|
|
|
|
|
|
|
|
|
|
|
|
|
|
|
(in thousands, except share information) |
|
|
|
|
|
|
|
|
|
|
|
|
|
|
|
|
|
Consolidated statements of income (loss) data: |
|
|
|
|
|
|
|
|
|
|
|
|
|
|
|
|
|
Sales |
|
$ |
224,015 |
|
$ |
215,984 |
|
$ |
180,690 |
|
$ |
141,883 |
|
$ |
108,169 |
|
|
Cost of sales |
|
|
116,772 |
|
|
107,534 |
|
|
85,359 |
|
|
64,185 |
|
|
48,403 |
|
|
Gross profit |
|
|
107,243 |
|
|
108,450 |
|
|
95,331 |
|
|
77,698 |
|
|
59,766 |
|
|
Selling, general and administration expenses |
|
|
131,930 |
|
|
114,756 |
|
|
80,116 |
|
|
66,565 |
|
|
52,369 |
|
|
Results from operating activities |
|
|
(24,687) |
|
|
(6,306) |
|
|
15,215 |
|
|
11,133 |
|
|
7,397 |
|
|
Finance costs |
|
|
2,371 |
|
|
76 |
|
|
1,051 |
|
|
2,345 |
|
|
1,967 |
|
|
Finance income |
|
|
(567) |
|
|
(479) |
|
|
(348) |
|
|
(133) |
|
|
(45) |
|
|
Accretion of preferred shares |
|
|
— |
|
|
— |
|
|
401 |
|
|
1,044 |
|
|
514 |
|
|
Loss from embedded derivative on Series A, A-1 and A-2 preferred shares |
|
|
— |
|
|
— |
|
|
140,874 |
|
|
380 |
|
|
8,058 |
|
|
IPO-related costs |
|
|
— |
|
|
— |
|
|
— |
|
|
856 |
|
|
— |
|
|
Settlement cost related to former option holder |
|
|
— |
|
|
— |
|
|
— |
|
|
520 |
|
|
— |
|
|
Income (loss) before income taxes |
|
|
(26,491) |
|
|
(5,903) |
|
|
(126,763) |
|
|
6,121 |
|
|
(3,097) |
|
|
Provision for income tax (recovery) |
|
|
2,010 |
|
|
(2,235) |
|
|
4,668 |
|
|
(333) |
|
|
3,067 |
|
|
Net income (loss) |
|
$ |
(28,501) |
|
$ |
(3,668) |
|
$ |
(131,431) |
|
$ |
6,454 |
|
$ |
(6,164) |
|
|
|
|
|
|
|
|
|
|
|
|
|
|
|
|
|
|
|
|
Weighted average number of shares outstanding - basic |
|
|
25,716,186 |
|
|
24,699,290 |
|
|
19,776,946 |
|
|
11,984,763 |
|
|
11,982,626 |
|
|
Net income (loss) per share: |
|
|
|
|
|
|
|
|
|
|
|
|
|
|
|
|
|
Basic |
|
|
(1.11) |
|
|
(0.15) |
|
|
(6.65) |
|
|
0.54 |
|
|
(0.52) |
|
|
Fully diluted |
|
|
(1.11) |
|
|
(0.15) |
|
|
(6.65) |
|
|
0.54 |
|
|
(0.52) |
|
|
|
|
|
|
|
|
|
|
|
|
|
|
|
|
|
|
|
|
Consolidated balance sheet data (at year end): |
|
|
|
|
|
|
|
|
|
|
|
|
|
|
|
|
|
Cash |
|
$ |
63,484 |
|
$ |
64,440 |
|
$ |
72,514 |
|
|
|
|
|
|
|
|
Total assets |
|
|
147,936 |
|
|
174,334 |
|
|
158,972 |
|
|
|
|
|
|
|
|
Total liabilities |
|
|
46,568 |
|
|
40,884 |
|
|
24,935 |
|
|
|
|
|
|
|
|
Total equity |
|
|
101,368 |
|
|
133,450 |
|
|
134,037 |
|
|
|
|
|
|
|
30
ITEM 7. MANAGEMENT’S DISCUSSION AND ANALYSIS OF FINANCIAL CONDITION AND RESULTS OF OPERATIONS
Preface
In preparing this Management’s Discussion and Analysis of Financial Condition and Results of Operations (“MD&A”), we have taken into account all information available to us up to April 19, 2018, the date of this MD&A. The audited annual consolidated financial statements and this MD&A were reviewed by the Company’s Audit Committee and were approved and authorized for issuance by our Board of Directors on April 19, 2018.
All financial information contained in this annual MD&A and in the audited annual consolidated financial statements has been prepared in accordance with International Financial Reporting Standards (“IFRS”), as issued by the IASB, except for certain non-GAAP information discussed in this Annual Report on Form 10-K. As a foreign private issuer, we are permitted to file our audited consolidated financial statements with the SEC under IFRS without a reconciliation to U.S. generally accepted accounting principle (“GAAP”). As a result, we do not prepare a reconciliation of our results to GAAP. It is possible that certain of our accounting policies could be different from GAAP. All monetary amounts in this MD&A are expressed in Canadian dollars, except for share and per share data and where otherwise indicated.
This MD&A should be read in conjunction with the audited consolidated financial statements and the notes thereto of the Company as at February 3, 2018 and January 28, 2017 and for the years February 3, 2018, January 28, 2017 and January 30, 2016 which are contained in this Annual Report on Form 10-K.
Accounting Periods
All references to “Fiscal 2017” are to the Company’s fiscal year ended February 3, 2018. All references to “Fiscal 2016” are to the Company’s fiscal year ended January 28, 2017 and all references to “Fiscal 2015” are to the Company’s fiscal year ended January 30, 2016.
The Company’s fiscal year ends on the Saturday closest to the end of January, typically resulting in a 52-week year, but occasionally giving rise to an additional week, resulting in a 53-week year. The years ended January 30, 2016 and January 28, 2017 cover a 52-week period. The year ended February 3, 2018 covers a 53-week fiscal period.
Overview
We are a branded retailer of specialty tea, offering a differentiated selection of proprietary loose-leaf teas, pre-packaged teas, tea sachets and tea-related gifts, accessories, food and beverages primarily through 240 company-operated DAVIDsTEA stores as of February 3, 2018, and our website, davidstea.com. We are building a brand that seeks to expand the definition of tea with innovative products that consumers can explore in an open and inviting retail environment. We strive to make tea a multi-sensory experience by facilitating interaction with our products through education and sampling so that our customers appreciate the compelling attributes of tea as well as the ease of preparation.
Factors affecting our performance
We believe that our performance and future success depend on a number of factors that present significant opportunities for us and may pose risks and challenges, including those discussed below and in the “Risk Factors” section of this Form 10-K.
31
|
· |
E-Commerce. We expect to capitalize on consumer’s shift from brick and mortar stores to e commerce. In Fiscal 2017, we made a significant investment in our e-commerce website, which is a core part of DAVIDsTEA’s plans to grow online sales. This has begun to show results, with double digit growth in our e-commerce sales as compared to the fourth quarter of Fiscal 2016. In Fiscal 2018, we expect to continue to improve our web presence by focusing on site capacity and page load times, improving additional mobile functionality, and adding marketing features and functionality. We also anticipate that our e-commerce platform will enable us to start selling on Amazon before Holiday 2018. These initiatives will require significant investment, and if we are unable to implement them in a timely fashion, our operating results may suffer. |
|
· |
Store philosophy. We are focused on improving the productivity of existing stores and evaluating the closure of non-performing stores. In Fiscal 2017, we looked critically at the performance of our stores, including their locations and the lease terms, resulting in an impairment charge of $15.1 million. We expect to continue critical management of our store portfolio. In addition, in 2018, we expect to renovate up to five of our stores to be similar to our DT 2.0, hybrid concept. These stores enable customers to “self-explore” and buy pre-packaged teas, helping accelerate service levels and reduce wait times. Elements of these concept stores will become key components of our future store renovation program. Impairments, closures and renovations will have a significant cash and non-cash impact on our financial results, and, if our efforts our unsuccessful, our operating results may suffer. |
|
· |
Distribution and merchandise. We are in the process of exploring ways in which our customers can interact with our product beyond our stores and e-commerce, including opportunities to expand wholesale distribution from HRI (Hotel, Restaurant and Institution) to other channels including grocery and wholesale. We are also in the process of re-focusing our product mix to focus on our loose-leaf tea and to streamline our offering of tea accessories. These efforts are preliminary and, once fully adopted, may not impact our revenue, preliminarily or at all. |
Fiscal 2017 Highlights
During Fiscal 2017, we grew our sales from $216.0 million to $224.0 million, representing growth of 3.7% over the prior year. We added 9 net new stores, increasing our store base from 231 to 240 stores, representing growth of 3.9%.
How we assess our performance
The key measures we use to evaluate the performance of our business and the execution of our strategy are set forth below:
Sales. Sales consist primarily of sales from our retail stores and e-commerce site. Our business is seasonal and, as a result, our sales fluctuate from quarter to quarter. Sales are traditionally highest in the fourth fiscal quarter, which includes the holiday sales period, and tend to be lowest in the second and third fiscal quarter because of lower customer traffic in our locations in the summer months.
The specialty retail industry is cyclical, and our sales are affected by general economic conditions. A number of factors that influence the level of consumer spending, including economic conditions and the level of disposable consumer income, consumer debt, interest rates and consumer confidence can affect purchases of our products.
Sales also include gift card breakage income.
Comparable Sales. Comparable sales refer to year-over-year comparison information for comparable stores and e-commerce. Our stores are added to the comparable sales calculation in the beginning of their thirteenth month of operation. As a result, data regarding comparable sales may not be comparable to similarly titled data from other retailers.
The 53rd week in Fiscal 2017 caused a one-week shift in our fiscal calendar. As a result, comparable sales for Fiscal 2017 are calculated using the comparable 52 weeks of Fiscal 2016. We compare the 52-week period ended January 27, 2018 with the 52-week period ended January 28, 2017. As such, changes in comparable store sales are not consistent with changes in net sales reported for the fiscal periods.
Measuring the change in year-over-year comparable sales allows us to evaluate how our business is performing. Various factors affect comparable sales, including:
|
· |
our ability to anticipate and respond effectively to consumer preference, buying and economic trends; |
32
|
· |
our ability to provide a product offering that generates new and repeat visits to our stores and online; |
|
· |
the customer experience we provide in our stores and online; |
|
· |
the level of customer traffic near our locations in which we operate; |
|
· |
the number of customer transactions and average ticket in our stores and online; |
|
· |
the pricing of our tea, tea accessories, and food and beverages; |
|
· |
our ability to obtain and distribute product efficiently; |
|
· |
our opening of new stores in the vicinity of our existing stores; and |
|
· |
the opening or closing of competitor stores near our stores. |
Non-Comparable Sales. Non-comparable sales include sales from stores prior to the beginning of their thirteenth fiscal month of operation and wholesale sales channel, which includes sales to grocery, hotels, restaurants and institutions, office and workplace locations and food services, as well as corporate gifting. As we pursue our growth strategy, we expect that a significant percentage of our sales will continue to come from non-comparable sales.
Gross Profit. Gross profit is equal to our sales less our cost of sales. Cost of sales includes product costs, freight costs, store occupancy costs and distribution costs.
Selling, General and Administration Expenses. Selling, general and administration expenses consist of store operating expenses and other general and administration expenses, including store impairments and provision for onerous contracts. Store operating expenses consist of all store expenses excluding occupancy related costs (which are included in costs of sales). General and administration costs consist of salaries and other payroll costs, travel, professional fees, stock compensation, marketing expenses, information technology and other operating costs.
General and administration costs, which are generally fixed in nature, do not vary proportionally with sales to the same degree as our cost of sales. We believe that these costs will decrease as a percentage of sales over time. Accordingly, this expense as a percentage of sales is usually higher in lower volume quarters and lower in higher volume quarters.
We present Adjusted selling, general and administration expenses as a supplemental measure because we believe it facilitates a comparative assessment of our selling, general and administration expenses under IFRS, while isolating the effects of some items that vary from period to period. It is reconciled to its nearest IFRS measure on page 35 of this Annual Report on Form 10-K.
Results from Operating Activities. Results from operating activities consist of our gross profit less our selling, general and administration expenses.
We present Adjusted results from operating activities as a supplemental measure because we believe it facilitates a comparative assessment of our operating performance relative to our performance based on our results under IFRS, while isolating the effects of some items that vary from period to period. It is reconciled to its nearest IFRS measure on page 36 of this Annual Report on Form 10-K.
Finance Costs. Finance costs consists of cash and imputed non-cash charges related to our credit facility, long-term debt, finance lease obligations, the loan from the controlling shareholder and the Series A, A-1 and A-2 preferred shares.
Finance Income. Finance income consists of interest income on cash balances.
Provision for Income Tax. Provision for income tax consists of federal, provincial, state and local current and deferred income taxes.
Adjusted EBITDA. We present Adjusted EBITDA as a supplemental performance measure because we believe it facilitates a comparative assessment of our operating performance relative to our performance based on our results under IFRS, while isolating the effects of some items that vary from period to period. Specifically, Adjusted EBITDA allows for an assessment of our operating performance and our ability to service or incur indebtedness without the effect of non-cash charges, such as depreciation, amortization, finance costs, deferred rent, non-cash compensation expense, costs related to onerous contracts or contracts where we expect the costs of the obligations to exceed the economic benefit, gain (loss) on derivative financial instruments, loss on disposal of
33
property and equipment, impairment of property and equipment and certain non-recurring expenses. This measure also functions as a benchmark to evaluate our operating performance. For a reconciliation of net income (loss) to Adjusted EBITDA, refer to page 36 of this Annual Report on Form 10-K.
Selected Operating and Financial Highlights
Results of Operations
The following table summarizes key components of our results of operations for the year indicated:
|
|
|
For the year ended |
|||||||
|
|
|
February 3, |
|
January 28, |
|
January 30, |
|||
|
|
|
2018 |
|
2017 |
|
2016 |
|||
|
|
|
|
|
|
|
|
|
|
|
|
Consolidated statement of income (loss) data: |
|
|
|
|
|
|
|
|
|
|
Sales |
|
$ |
224,015 |
|
$ |
215,984 |
|
$ |
180,690 |
|
Cost of sales |
|
|
116,772 |
|
|
107,534 |
|
|
85,359 |
|
Gross profit |
|
|
107,243 |
|
|
108,450 |
|
|
95,331 |
|
Selling, general and administration expenses |
|
|
131,930 |
|
|
114,756 |
|
|
80,116 |
|
Results from operating activities |
|
|
(24,687) |
|
|
(6,306) |
|
|
15,215 |
|
Finance costs |
|
|
2,371 |
|
|
76 |
|
|
1,051 |
|
Finance income |
|
|
(567) |
|
|
(479) |
|
|
(348) |
|
Accretion of preferred shares |
|
|
— |
|
|
— |
|
|
401 |
|
Loss from embedded derivative on Series A, A-1 and A-2 preferred shares |
|
|
— |
|
|
— |
|
|
140,874 |
|
Loss before income taxes |
|
|
(26,491) |
|
|
(5,903) |
|
|
(126,763) |
|
Provision for income tax (recovery) |
|
|
2,010 |
|
|
(2,235) |
|
|
4,668 |
|
Net loss |
|
$ |
(28,501) |
|
$ |
(3,668) |
|
$ |
(131,431) |
|
Percentage of sales: |
|
|
|
|
|
|
|
|
|
|
Sales |
|
|
100.0% |
|
|
100.0% |
|
|
100.0% |
|
Cost of sales |
|
|
52.1% |
|
|
49.8% |
|
|
47.2% |
|
Gross profit |
|
|
47.9% |
|
|
50.2% |
|
|
52.8% |
|
Selling, general and administration expenses |
|
|
58.9% |
|
|
53.1% |
|
|
44.3% |
|
Results from operating activities |
|
|
(11.0%) |
|
|
(2.9%) |
|
|
8.5% |
|
Finance costs |
|
|
1.1% |
|
|
0.0% |
|
|
0.6% |
|
Finance income |
|
|
(0.3%) |
|
|
(0.2%) |
|
|
(0.2%) |
|
Accretion of preferred shares |
|
|
0.0% |
|
|
0.0% |
|
|
0.2% |
|
Loss from embedded derivative on Series A, A-1 and A-2 preferred shares |
|
|
0.0% |
|
|
0.0% |
|
|
78.0% |
|
Loss before income taxes |
|
|
(11.8%) |
|
|
(2.7%) |
|
|
(70.1%) |
|
Provision for income tax (recovery) |
|
|
0.9% |
|
|
(1.0%) |
|
|
2.6% |
|
Net loss |
|
|
(12.7%) |
|
|
(1.7%) |
|
|
(72.7%) |
|
Other financial and operations data: |
|
|
|
|
|
|
|
|
|
|
Adjusted EBITDA (1) |
|
$ |
12,819 |
|
$ |
22,957 |
|
$ |
24,606 |
|
Adjusted EBITDA as a percentage of sales |
|
|
5.7% |
|
|
10.6% |
|
|
13.6% |
|
Number of stores at end of year |
|
|
240 |
|
|
231 |
|
|
193 |
|
Comparable sales growth (decline) for year (2) |
|
|
(6.0%) |
|
|
2.2% |
|
|
6.6% |
|
(1) |
For a reconciliation of Adjusted EBITDA to net income see “—Non-IFRS Metrics” below. |
|
(2) |
Comparable sales refer to year-over-year comparison information for comparable stores and e-commerce. Our stores are added to the comparable sales calculation in the beginning of their thirteenth month of operation. |
Non-IFRS Metrics
Adjusted selling, general and administration expenses, Adjusted results from operating activities and Adjusted EBITDA is not a presentation made in accordance with IFRS, and the use of the term Adjusted selling, general and administration expenses, Adjusted results from operating activities and Adjusted EBITDA may differ from similar measures reported by other companies. We believe that Adjusted selling, general and administration expenses, Adjusted results from operating activities and Adjusted EBITDA provides investors with useful information with respect to our historical operations. Adjusted selling, general and administration expenses, Adjusted results from operating activities and Adjusted EBITDA are not measurements of our financial performance under IFRS and should not be considered in
34
isolation or as an alternative to net income, net cash provided by operating, investing or financing activities or any other financial statement data presented as indicators of financial performance or liquidity, each as presented in accordance with IFRS. We understand that although Adjusted selling, general and administration expenses, Adjusted results from operating activities and Adjusted EBITDA are frequently used by securities analysts, lenders and others in their evaluation of companies, it has limitations as an analytical tool, and should not be considered in isolation, or as a substitute for analysis of our results as reported under IFRS. Some of these limitations are:
|
· |
Adjusted selling, general and administration expenses, Adjusted results from operating activities and Adjusted EBITDA does not reflect changes in, or cash requirements for, our working capital needs; |
|
· |
Adjusted selling, general and administration expenses, Adjusted results from operating activities and Adjusted EBITDA does not reflect the cash requirements necessary to service interest or principal payments on our debt; and |
|
· |
Although depreciation and amortization are non-cash charges, the assets being depreciated and amortized will often have to be replaced in the future, and Adjusted EBITDA does not reflect any cash requirements for such replacements. |
Because of these limitations, Adjusted selling, general and administration expenses, Adjusted results from operating activities and Adjusted EBITDA should not be considered as discretionary cash available to us to reinvest in the growth of our business or as a measure of cash that will be available to us to meet our obligations.
The following tables present a reconciliation of Adjusted selling, general and administration expenses, Adjusted results from operating activities and Adjusted EBITDA to our net income (loss) determined in accordance with IFRS:
Reconciliation of Adjusted selling, general and administration expenses
|
|
|
For the year ended |
|||||||
|
|
|
February 3, |
|
January 28, |
|
January 30, |
|||
|
(in thousands) |
|
2018 |
|
2017 |
|
2016 |
|||
|
|
|
|
|
|
|
|
|
|
|
|
Selling, general and administration expenses |
|
|
131,930 |
|
|
114,756 |
|
|
80,116 |
|
Executive and employee separation costs (a) |
|
|
2,225 |
|
|
1,267 |
|
|
— |
|
Impairment of property and equipment (b) |
|
|
15,069 |
|
|
7,516 |
|
|
— |
|
Impact of onerous contracts (c) |
|
|
7,854 |
|
|
8,140 |
|
|
— |
|
Loss on disposal of property and equipment (d) |
|
|
— |
|
|
311 |
|
|
292 |
|
Adjusted selling, general and administration expenses |
|
$ |
106,782 |
|
$ |
97,522 |
|
|
79,824 |
|
(a) |
Executive and employee separation costs represent salary owed to certain former executives and employees of $2,033 [Fiscal 2016 - $835] payable as part of their separation of employment from the Company and stock-based compensation expense of $192 [Fiscal 2016 - $432] relating to the vesting of equity awards as part of their separation of employment from the Company. |
|
(b) |
Represents costs related to impairment of property and equipment for stores. |
|
(c) |
Represents provision, non-cash reversals, and utilization related to certain stores where the unavoidable costs of meeting the obligations under the lease agreements are expected to exceed the economic benefits expected to be received from the contract. |
|
(d) |
For Fiscal 2016, represents non-cash costs related to the loss on disposal of property and equipment due to construction of a new store concept at an existing store location. For Fiscal 2015, represents non-cash costs related to the loss on disposal of property and equipment due to the closure of one store due to termination of sub-lease. |
35
Reconciliation of Adjusted results from operating activities
|
|
|
For the year ended |
|
|||||||
|
|
|
February 3, |
|
January 28, |
|
January 30, |
|
|||
|
(in thousands) |
|
2018 |
|
2017 |
|
2016 |
|
|||
|
|
|
|
|
|
|
|
|
|
|
|
|
Results from operating activities |
|
|
(24,687) |
|
|
(6,306) |
|
|
15,215 |
|
|
Executive and employee separation costs (a) |
|
|
2,225 |
|
|
1,267 |
|
|
— |
|
|
Impairment of property and equipment (b) |
|
|
15,069 |
|
|
7,516 |
|
|
— |
|
|
Impact of onerous contracts (c) |
|
|
7,854 |
|
|
8,140 |
|
|
— |
|
|
Loss on disposal of property and equipment (d) |
|
|
— |
|
|
311 |
|
|
292 |
|
|
Adjusted results from operating activities |
|
$ |
461 |
|
$ |
10,928 |
|
$ |
15,507 |
|
|
(a) |
Executive and employee separation costs represent salary owed to certain former executives and employees of $2,033 [Fiscal 2016 - $835] payable as part of their separation of employment from the Company and stock-based compensation expense of $192 [Fiscal 2016 - $432] relating to the vesting of equity awards as part of their separation of employment from the Company. |
|
(b) |
Represents costs related to impairment of property and equipment for stores. |
|
(c) |
Represents provision, non-cash reversals, and utilization related to certain stores where the unavoidable costs of meeting the obligations under the lease agreements are expected to exceed the economic benefits expected to be received from the contract. |
|
(d) |
For Fiscal 2016, represents non-cash costs related to the loss on disposal of property and equipment due to construction of a new store concept at an existing store location. For Fiscal 2015, represents non-cash costs related to the loss on disposal of property and equipment due to the closure of one store due to termination of sub-lease. |
Reconciliation of Adjusted EBITDA to our net income (loss)
|
|
|
For the year ended |
|||||||
|
|
|
February 3, |
|
January 28, |
|
January 30, |
|||
|
(in thousands) |
|
2018 |
|
2017 |
|
2016 |
|||
|
|
|
|
|
|
|
|
|
|
|
|
Net loss |
|
$ |
(28,501) |
|
$ |
(3,668) |
|
$ |
(131,431) |
|
Finance costs |
|
|
2,371 |
|
|
76 |
|
|
1,051 |
|
Finance income |
|
|
(567) |
|
|
(479) |
|
|
(348) |
|
Depreciation and amortization |
|
|
9,905 |
|
|
8,827 |
|
|
6,445 |
|
Loss on disposal of property and equipment |
|
|
82 |
|
|
45 |
|
|
5 |
|
Provision for income tax (recovery) |
|
|
2,010 |
|
|
(2,235) |
|
|
4,668 |
|
EBITDA |
|
$ |
(14,700) |
|
$ |
2,566 |
|
$ |
(119,610) |
|
Additional adjustments: |
|
|
|
|
|
|
|
|
|
|
Stock-based compensation expense (a) |
|
|
2,021 |
|
|
2,264 |
|
|
1,749 |
|
Executive and employee separation costs related to salary (b) |
|
|
2,033 |
|
|
835 |
|
|
— |
|
Impairment of property and equipment (c) |
|
|
15,069 |
|
|
7,516 |
|
|
— |
|
Impact of onerous contracts (d) |
|
|
7,854 |
|
|
8,140 |
|
|
(265) |
|
Deferred rent (e) |
|
|
542 |
|
|
1,325 |
|
|
1,165 |
|
Loss on disposal of property and equipment (f) |
|
|
— |
|
|
311 |
|
|
292 |
|
Accretion of preferred shares (g) |
|
|
— |
|
|
— |
|
|
401 |
|
Loss from embedded derivative on Series A, A-1 and A-2 preferred shares (h) |
|
|
— |
|
|
— |
|
|
140,874 |
|
Adjusted EBITDA |
|
$ |
12,819 |
|
$ |
22,957 |
|
$ |
24,606 |
|
(a) |
Represents non-cash stock-based compensation expense. |
|
(b) |
Executive and employee separation costs related to salary represent salary owed to certain former executives and employees as part of their separation of employment from the Company. |
|
(c) |
Represents costs related to impairment of property and equipment for stores. |
|
(d) |
Represents provision, non-cash reversals, and utilization related to certain stores where the unavoidable costs of meeting the obligations under the lease agreements are expected to exceed the economic benefits expected to be received from the contract. |
36
|
(e) |
Represents the extent to which our annual rent expense has been above or below our cash rent payments. |
|
(f) |
For Fiscal 2016, represents non-cash costs related to the loss on disposal of property and equipment due to construction of a new store concept at an existing store location. For Fiscal 2015, represents non-cash costs related to the loss on disposal of property and equipment due to the closure of one store due to termination of sub-lease. |
|
(g) |
Represents non-cash accretion expense on our preferred shares. In connection with the completion of our IPO on June 10, 2015, all of our outstanding preferred shares were converted automatically into common shares. |
|
(h) |
Represents non-cash market loss for the conversion feature of the Series A, A-1 and A-2 preferred shares. In connection with our IPO, this liability was converted into equity. |
Fiscal Year Ended February 3, 2018 Compared to Fiscal Year Ended January 28, 2017
Sales. Sales for Fiscal 2017 increased 3.7%, or $8.0 million, to $224.0 million from $216.0 million in Fiscal 2016, comprising $12.1 million in comparable sales decrease and $20.1 million increase in non‑comparable sales. For Fiscal 2017, comparable sales decreased by 6.0% and non‑comparable sales increased primarily due to an additional 9 net stores opened as of the end of Fiscal 2017 as compared to the end of Fiscal 2016 and due to non‑comparable sales for the 38 net stores opened in Fiscal 2016.
Gross Profit. Gross profit decreased by 1.2%, or $1.3 million, to $107.2 million in Fiscal 2017 from $108.5 million in Fiscal 2016. Gross profit as a percentage of sales decreased to 47.9% in Fiscal 2017 from 50.2% in Fiscal 2016. The decrease in gross profit as a percent of sales was primarily due to additional promotional activity and deleveraging of fixed costs due to the negative 6.0% comparative sales for the year.
Selling, General and Administration Expenses. Selling, general and administration expenses increased by 14.9%, or $17.1 million, to $131.9 million in Fiscal 2017 from $114.8 million in Fiscal 2016. As a percentage of sales, selling, general and administration expenses increased to 58.9% in Fiscal 2017 from 53.1% in Fiscal 2016. Excluding employee separation costs, impairment of property and equipment, impact of onerous contracts, as well as loss on disposal of property and equipment in Fiscal 2016, selling, general and administration expenses increased 9.5% to $106.8 million in Fiscal 2017 from $97.5 million in Fiscal 2016, due primarily to the hiring of additional staff to support the growth of the Company, including new stores, and higher store operating expenses to support the operations of 240 stores as of February 3, 2018 as compared to 231 stores as of January 28, 2017. As a percentage of sales, selling, general and administration expenses excluding the impacts referenced above increased to 47.7% from 45.1%.
Results from Operating Activities. Results from operating activities decreased by $18.4 million, to $(24.7) million in Fiscal 2017 from $(6.3) million in Fiscal 2016. Excluding executive separation costs, impairment of property and equipment, impact of onerous contracts, as well as the loss on disposal of property and equipment in Fiscal 2016, results from operating activities decreased to $0.5 million in Fiscal 2017 from $10.9 million in Fiscal 2016.
Finance Costs. Finance costs increased by $2.3 million to $2.4 million in Fiscal 2017 from $0.1 million in Fiscal 2016, as a result of a higher accretion expense on the provision for onerous contracts.
Finance Income. Finance income increased by $0.1 million, or 20.0%, to $0.6 million in Fiscal 2017 from $0.5 million in Fiscal 2016, as a result of interest income generated on cash on hand.
Provision (Recovery) for Income Tax. Provision for income tax increased by $4.2 million, to $2.0 million in Fiscal 2017 from a recovery for income taxes of $(2.2) million in Fiscal 2016. The increase in the provision for income taxes was due primarily to a write-down of the deferred income tax assets related to the U.S. entity, as well as a decrease in the U.S. statutory income tax rates. In December 2017, the Tax Cuts and Jobs Act (“U.S. Tax Reform”) was signed into law, which reduced the U.S. federal corporate income tax rate from 35% to 21%, effective January 1, 2018. As a result, the Company’s net deferred taxes reported on the balance sheet were required to be re-measured using the newly enacted rates. Our effective tax rates were (7.6)% and 37.9% in Fiscal 2017 and 2016, respectively. The effective tax rate decreased as a result of the write-down of the deferred income tax assets related to the U.S. entity, as well as a decrease in the U.S. statutory income tax rates.
Fiscal Year Ended January 28, 2017 Compared to Fiscal Year Ended January 30, 2016
Sales. Sales for Fiscal 2016 increased 19.5%, or $35.3 million, to $216.0 million from $180.7 million in Fiscal 2015, comprising $3.9 million in comparable sales and $31.4 million in non‑comparable sales. For Fiscal 2016, comparable sales increased
37
by 2.2% and non‑comparable sales increased primarily due to an additional 38 net stores opened as of the end of Fiscal 2016 as compared to the end of Fiscal 2015 and due to non‑comparable sales for the 39 net stores opened in Fiscal 2015.
Gross Profit. Gross profit increased by 13.9%, or $13.2 million, to $108.5 million in Fiscal 2016 from $95.3 million in Fiscal 2015. Gross profit as a percentage of sales decreased to 50.2% in Fiscal 2016 from 52.8% in Fiscal 2015, driven by additional promotional activity, a shift in product sales mix and the adverse impact from the stronger U.S. dollar on U.S. dollar denominated purchases.
Selling, General and Administration Expenses. Selling, general and administration expenses increased by 43.3%, or $34.7 million, to $114.8 million in Fiscal 2016 from $80.1 million in Fiscal 2015. As a percentage of sales, selling, general and administration expenses increased to 53.1% in Fiscal 2016 from 44.3% in Fiscal 2015. Excluding executive separation costs, impairment of property and equipment, provision for onerous contracts and loss on disposal of property and equipment in Fiscal 2016, as well as loss on disposal of property and equipment in Fiscal 2015, selling, general and administration expenses increased 22.2% to $97.5 million in Fiscal 2016 from $79.8 million in Fiscal 2015, due primarily to the hiring of additional staff to support the growth of the Company, including new stores, and higher store operating expenses to support the operations of 231 stores as of January 28, 2017 as compared to 193 stores as of January 30, 2016, as well a full year of public company costs. As a percentage of sales, selling, general and administration expenses excluding the impacts referenced above increased to 45.1% from 44.2%.
Results from Operating Activities. Results from operating activities decreased by $21.5 million, to $(6.3) million in Fiscal 2016 from $15.2 million in Fiscal 2015. Excluding executive separation costs, impairment of property and equipment, provision for onerous contracts and loss on disposal of property and equipment in Fiscal 2016, as well as the loss on disposal of property and equipment in Fiscal 2015, results from operating activities decreased to $10.9 million in Fiscal 2016 from $15.5 million in Fiscal 2015.
Finance Costs. Finance costs decreased by $1.0 million, or 90.9%, to $0.1 million in Fiscal 2016 from $1.1 million in Fiscal 2015, as a result of the repayment of the then-outstanding term loans, loan from the controlling shareholder and amounts borrowed under our Revolving Facility and no accrued dividends due to the conversion of Series A, A-1 and A-2 preferred shares to common shares, during the second quarter of Fiscal 2016.
Finance Income. Finance income increased by $0.2 million, or 66.7%, to $0.5 million in Fiscal 2016 from $0.3 million in Fiscal 2015, as a result of interest income generated on cash on hand.
Provision for Income Tax. Provision (recovery) for income tax decreased by $6.9 million, to $(2.2) million in Fiscal 2016 from $4.7 million in Fiscal 2015. The decrease in the provision for income taxes was due primarily to lower results from operating activities. Our effective tax rates were 37.9% and (3.7%) in Fiscal 2016 and 2015, respectively. The effective tax rate increased as a result of the loss from embedded derivative on Series A, A-1 and A-2 preferred shares not recurring in Fiscal 2016 due to their conversion and cancellation.
Liquidity and Capital Resources
As of February 3, 2018 we had $63.5 million of cash primarily held with major Canadian financial institutions. Our working capital was $77.2 million as of February 3, 2018, compared to $78.7 million as at January 28, 2017.
Our primary sources of liquidity are cash on hand, cash flows from operations and borrowings under our revolving credit facility. Our primary cash needs are to support the increase in inventories as we expand the number of our stores, and for capital expenditures related to new stores and store renovations.
Capital expenditures typically vary depending on the timing of new stores openings and infrastructure-related investments. During Fiscal 2017, capital expenditures totaled $12.6 million. We devoted approximately 80% of our capital expenditures to construct, lease and open 11 new stores in Canada and 5 new stores in the United States, as well as renovate a number of existing stores. The remainder of the capital expenditures was used to make continued investments in our infrastructure.
Our primary working capital requirements are for the purchase of store inventory and payment of payroll, rent and other store operating costs. Our working capital requirements fluctuate during the year, rising in the second and third fiscal quarters as we take title to increasing quantities of inventory in anticipation of our peak selling season in the fourth fiscal quarter. Historically, we have funded our capital expenditures and working capital requirements with borrowings under our long-term debt and finance lease
38
facilities and revolving credit facilities. Following our IPO, we funded our capital expenditures and working capital requirements with cash from our IPO and net cash from our operating activities.
We believe that our cash position, net cash provided by operating activities and available borrowings under our revolving credit facility will be adequate to finance our planned capital expenditures and working capital requirements for the foreseeable future.
Cash Flow
A summary of our cash flows from operating, investing and financing activities is presented in the following table:
|
|
|
For the year ended |
|||||||
|
|
|
February 3, |
|
January 28, |
|
January 30, |
|||
|
|
|
2018 |
|
2017 |
|
2016 |
|||
|
Cash flows provided by (used in): |
|
|
|
|
|
|
|
|
|
|
Operating activities |
|
$ |
9,858 |
|
$ |
11,162 |
|
$ |
15,592 |
|
Investing activities |
|
|
(12,596) |
|
|
(22,015) |
|
|
(18,024) |
|
Financing activities |
|
|
1,782 |
|
|
2,779 |
|
|
55,162 |
|
Increase (decrease) in cash |
|
$ |
(956) |
|
$ |
(8,074) |
|
$ |
52,730 |
Cash Flows Provided by Operating Activities
|
|
|
For the year ended |
|
|||||||
|
|
|
February 3, |
|
January 28, |
|
January 30, |
|
|||
|
|
|
2018 |
|
2017 |
|
2016 |
|
|||
|
Cash flows provided by (used in) operating activities: |
|
|
|
|
|
|
|
|
|
|
|
Net loss |
|
$ |
(28,501) |
|
$ |
(3,668) |
|
$ |
(131,431) |
|
|
Depreciation of property and equipment |
|
|
8,431 |
|
|
8,069 |
|
|
5,832 |
|
|
Amortization of intangible assets |
|
|
1,474 |
|
|
758 |
|
|
613 |
|
|
Loss on disposal of property and equipment |
|
|
82 |
|
|
356 |
|
|
297 |
|
|
Impairment of property and equipment |
|
|
15,069 |
|
|
7,516 |
|
|
— |
|
|
Deferred rent |
|
|
542 |
|
|
1,325 |
|
|
1,165 |
|
|
Provision (recovery) for onerous contracts |
|
|
10,321 |
|
|
8,140 |
|
|
(265) |
|
|
Stock-based compensation expense |
|
|
2,021 |
|
|
2,264 |
|
|
1,749 |
|
|
Settlement related to cashless exercise of stock options, net of income taxes recovered |
|
|
— |
|
|
— |
|
|
(2,976) |
|
|
Amortization of financing fees |
|
|
79 |
|
|
75 |
|
|
241 |
|
|
Accretion on provisions |
|
|
2,292 |
|
|
— |
|
|
— |
|
|
Accretion of preferred shares |
|
|
— |
|
|
— |
|
|
401 |
|
|
Loss from embedded derivative on Series A, A-1, A-2 preferred shares |
|
|
— |
|
|
— |
|
|
140,874 |
|
|
Deferred income taxes (recovered) |
|
|
3,585 |
|
|
(4,380) |
|
|
1,364 |
|
|
Net change in other non-cash working capital balances related to operations |
|
|
(5,537) |
|
|
(9,293) |
|
|
(2,272) |
|
|
Cash flows provided by operating activities |
|
$ |
9,858 |
|
$ |
11,162 |
|
$ |
15,592 |
|
Net cash provided by operating activities decreased to $9.9 million in Fiscal 2017 from $11.2 million in Fiscal 2016. The decrease in the cash flows provided by operating activities was due mainly to lower results from operating activities, partially offset by lower investment in working capital, primarily inventory.
The decrease in inventories of $6.8 million in Fiscal 2017 reflects a planned reduction due to excess inventories in Fiscal 2016 that were related primarily to sales shortfalls. The decrease in trade and other payables of $5.3 million is mainly due to decrease in inventories in Fiscal 2017 compared to Fiscal 2016.
Net cash provided by operating activities decreased to $11.2 million in Fiscal 2016 from $15.6 million in Fiscal 2015. The decrease in the cash flows provided by operating activities was due to lower results from operating activities and investments in working capital, primarily inventory.
39
The increase in inventories of $13.5 million in Fiscal 2016 reflects excess inventories related to sales shortfalls, the increase in the number of stores in our network, higher inventory costs due to higher U.S. dollar, and investment in new merchandising initiatives. The increase in trade and other payables of $5.2 million is mainly due to the higher inventory levels and other expenses to support higher volume of sales in Fiscal 2016 compared to Fiscal 2015.
Cash Flows Used in Investing Activities
Capital expenditures decreased $9.4 million, to $12.6 million in Fiscal 2017 from $22.0 million in Fiscal 2016. This decrease was due primarily to a reduction in new store openings costs and renovations of existing stores, partially offset by an increase in the investment in information systems.
Capital expenditures increased $4.0 million, to $22.0 million in Fiscal 2016 from $18.0 million in Fiscal 2015. This increase was due primarily to renovations of existing stores as well as investment in information systems.
Cash Flows Provided by Financing Activities
|
|
|
For the year ended |
|
|||||||
|
|
|
February 3, |
|
January 28, |
|
January 30, |
|
|||
|
|
|
2018 |
|
2017 |
|
2016 |
|
|||
|
Cash flows provided by (used in) financing activities: |
|
|
|
|
|
|
|
|
|
|
|
Repayment of finance lease obligations |
|
$ |
— |
|
$ |
— |
|
$ |
(552) |
|
|
Proceeds from issuance of long-term debt |
|
|
— |
|
|
— |
|
|
9,996 |
|
|
Repayment of long-term debt |
|
|
— |
|
|
— |
|
|
(20,010) |
|
|
Repayment of loan from the controlling shareholder |
|
|
— |
|
|
— |
|
|
(2,952) |
|
|
Proceeds from issuance of common shares pursuant to exercise of stock options |
|
|
1,782 |
|
|
2,779 |
|
|
143 |
|
|
Gross proceeds of initial public offering ("IPO") |
|
|
— |
|
|
— |
|
|
79,370 |
|
|
IPO-related expenses |
|
|
— |
|
|
— |
|
|
(10,661) |
|
|
Financing fees |
|
|
— |
|
|
— |
|
|
(172) |
|
|
Cash flows provided by financing activities |
|
$ |
1,782 |
|
$ |
2,779 |
|
$ |
55,162 |
|
Net cash provided by financing activities decreased by $1.0 million to $1.8 million in Fiscal 2017 from $2.8 million in Fiscal 2016 due to a decrease in the proceeds from issuance of common shares upon exercise of stock options.
Net cash provided by financing activities decreased by $52.4 million to $2.8 million in Fiscal 2016 from $55.2 million in Fiscal 2015 due to our initial public offering that occurred on June 10, 2015. Cash flows from financing activities in Fiscal 2015 consisted primarily of borrowing and payments on our term facilities and their related financing costs and proceeds from share issuances.
Credit Facility with Bank of Montreal
The Company has a credit arrangement (hereinafter referred to as “Credit Agreement”) with the Bank of Montreal (“BMO”) that provides for a three-year revolving term facility, maturing October 31, 2019, in the principal amount of $20.0 million (which we refer to as the “Revolving Facility”) or the equivalent amount in U.S. dollars, repayable at any time. The Credit Agreement also provides for an accordion feature whereby we may, at any time prior to the end of the three-year term and with the permission of BMO, request an increase to the Revolving Facility by an amount not greater than $10.0 million.
On June 11, 2015, immediately following our IPO, we fully repaid the advances under the Revolving Facility using proceeds from the offering and cash on hand. As at February 3, 2018, we did not have any borrowings on the Revolving Facility.
The Credit Agreement subjects us to certain financial covenants. Without the prior written consent of BMO, our fixed charge coverage ratio may not be less than 1.25:1.00 and our leverage ratio may not exceed 3.00:1.00. In addition, our net tangible worth may not be less than $30.0 million.
Borrowings under the Revolving Facility are available in the form of Canadian dollar advances, U.S. dollar advances, prime rate loans, banker’s acceptances, U.S. base rate loans and LIBOR loans. Further, up to an aggregate maximum amount of $2.0 million, or the equivalent amount in other currencies authorized by BMO, is available by way of letters of credit or letters of guarantees for
40
terms of not more than 364 days. The Revolving Facility bears interest based on our adjusted leverage ratio. In the event our adjusted leverage ratio is equal to or less than 3.00:1.00, the Revolving Facility bears interest at (a) the bank’s prime rate plus 0.50% per annum, (b) the bank’s U.S. base rate plus 0.50% per annum, (c) LIBOR plus 1.50% per annum, subject to availability, or (d) 1.50% on the face amount of each banker’s acceptance, letter of credit or letter of guarantee, as applicable. A standby fee of 0.30% will be paid on the daily principal amount of the unused portion of the Revolving Facility. Should our adjusted leverage ratio be greater than 3.00:1.00 but less than 4.00:1.00, the Revolving Facility bears interest at (a) the bank’s prime rate plus 0.75% per annum, (b) the bank’s U.S. base rate plus 0.75% per annum, (c) LIBOR plus 1.75% per annum, subject to availability, or (d) 1.75% on the face amount of each banker’s acceptance, letter of credit or letter of guarantee, as applicable. A standby fee of 0.35% will be paid on the daily principal amount of the unused portion of the Revolving Facility. If our adjusted leverage ratio is greater than 4.00:1.00, the Revolving Facility bears interest at (a) bank’s prime rate plus 1.25% per annum, (b) the bank’s U.S. base rate plus 1.25% per annum, (c) LIBOR plus 2.25% per annum, subject to availability, or (d) 2.25% on the face amount of each banker’s acceptance, letter of credit or letter of guarantee, as applicable. A standby fee of 0.45% will be paid on the daily principal amount of the unused portion of the Revolving Facility.
The Credit Agreement is collateralized by a first lien security interest in all of our assets in the amount of $37.5 million, a general security agreement, registered in each Canadian province in which we do business, creating a first priority charge on all assets.
The Credit Agreement contains a number of covenants that, among other things and subject to certain exceptions, restrict our ability to become guarantor or endorser or otherwise become liable upon any note or other obligation other than in the normal course of business. We also cannot make any dividend payments. As at February 3, 2018, we are in compliance with these covenants.
Term Loan with Rainy Day Investments Ltd.
On June 11, 2015, immediately following our IPO, we fully repaid the term loan with Rainy Day Investments Ltd. (referred to as “Loan from the controlling shareholder” in this Annual Report) using proceeds from our IPO and cash on hand. As at February 3, 2018, we did not have any borrowings with Rainy Day Investments Ltd.
Off‑Balance Sheet Arrangements
Other than operating lease obligations, we have no off‑balance sheet obligations.
Contractual Obligations and Commitments
In the normal course of business, we enter into contractual obligations that will require us to disburse cash over future periods. All commitments have been recorded in our consolidated balance sheets, except for purchase obligations and minimum annual lease payments under operating leases. The following table summarizes our contractual obligations as of February 3, 2018, and the effect such obligations are expected to have on our liquidity and cash flows in future periods.
|
|
|
Payments due by period |
|
||||||||
|
|
|
|
|
less than |
|
Between |
|
Between |
|
More than |
|
|
(dollars in thousands) |
|
Total |
|
1 year |
|
1 and 3 years |
|
3 and 5 years |
|
5 years |
|
|
Trade and other payables |
|
14,392 |
|
14,392 |
|
— |
|
— |
|
— |
|
|
Operating lease obligations (1) |
|
134,965 |
|
19,840 |
|
56,892 |
|
29,952 |
|
28,281 |
|
|
Purchase obligations (2) |
|
8,820 |
|
8,820 |
|
— |
|
— |
|
— |
|
|
Total |
|
158,177 |
|
43,052 |
|
56,892 |
|
29,952 |
|
28,281 |
|
|
(1) |
Operating lease obligations under long‑term operating leases is exclusive of certain operating costs for which the Company is responsible. Certain of the operating lease agreements provide for additional rentals based on sales. |
|
(2) |
Includes amounts pertaining to agreements to purchase goods or services that are enforceable and legally binding on the Company. |
Critical Accounting Policies and Estimates
Our discussion and analysis of operating results and financial condition are based upon our financial statements. The preparation of financial statements requires us to estimate the effect of various matters that are inherently uncertain as of the date of the financial statements. Each of these required estimates varies in regard to the level of judgment involved and its potential impact on
41
our reported financial results. Estimates are deemed critical when a different estimate could have reasonably been used or where changes in the estimates are reasonably likely to occur from period to period, and would materially impact our financial position, changes in financial position or results of operations. Our significant accounting policies are discussed under Note 3 to our consolidated financial statements included elsewhere in this Annual Report.
Key sources of estimation uncertainty
Key sources of estimation uncertainty that have a significant risk of resulting in a material adjustment to the carrying amount of assets and liabilities within the next financial year are as follows:
Recoverability and impairment of non-financial assets. Leasehold improvements and furniture and equipment are reviewed for impairment if events or changes in circumstances indicate that the carrying amount may not be recoverable. A review for impairment is conducted by comparing the carrying amount of the Cash Generating Units (CGU)’ assets with their respective recoverable amounts based on value in use. Value in use is determined based on management’s best estimate of expected future cash flows, which includes estimates of growth rates, from use over the remaining lease term and discounted using a pre‑tax weighted average cost of capital.
Income taxes. To determine the extent to which deferred income tax assets can be recognized, management estimates the amount of probable future taxable profits that will be available against which deductible temporary differences and unused tax losses can be used. Such estimates are made as part of the budget and strategic plan by tax jurisdiction. Management exercises judgment to determine the extent to which realization of future taxable benefits is probable considering factors such as the number of years included in the forecast period and prudent tax planning strategies.
Critical judgments in applying accounting policies
We believe the following are critical judgments that management has made in the process of applying accounting policies that have the most significant effect on the amounts recognized in our consolidated financial statements:
Impairment of non‑financial assets. Management is required to make significant judgments in determining if individual commercial premises in which it carries out its activities are individual CGUs, or if these units should be aggregated at a district or regional level to form a CGU. The significant judgments applied by management in determining if stores should be aggregated in a given geographic area to form a CGU include the determination of expected customer behavior and whether customers could interchangeably shop in any of the stores in a given area and whether management views the cash flows of the stores in the group as interdependent.
Income taxes. We may be subject to audits related to tax risks, and uncertainties exist with respect to the interpretation of tax regulations, changes in tax laws, and the amount and timing of future taxable income. Differences arising between the actual results and the assumptions made, or future changes to such assumptions, could necessitate future adjustments to taxable income and income tax expense already recorded. We establish provisions if required, based on reasonable estimates, for possible consequences of audits by the tax authorities. The amount of such provisions is based on various factors, such as experience of previous tax audits and differing interpretations of tax regulations by the entity and the responsible tax authority, which may arise on a wide variety of issues.
Recently Issued Accounting Standards
Information on significant new accounting standards and amendments issued but not yet adopted is described below.
IFRS 9, “Financial Instruments”, for which the final version was issued in July 2014 by the IASB, replaces IAS 39, “Financial Instruments: Recognition and Measurement” and all previous versions of IFRS 9. IFRS 9 brings together all three aspects of the accounting for financial instruments project: classification and measurement, impairment and hedge accounting. IFRS 9 is effective for annual periods beginning on or after January 1, 2018, with early adoption permitted. Except for hedge accounting, retrospective application is required but providing comparative information is not compulsory. For hedge accounting, the requirements are generally applied prospectively, with some limited exceptions. The Company plans to adopt the new standard on the required effective date. The Company is currently assessing the impact of the adoption of this standard on its consolidated financial statements and related note disclosures. The Company has performed a high-level impact assessment of all three aspects of IFRS 9. This preliminary assessment is based on currently available information and may be subject to changes arising from further detailed analyses. Overall, the Company does not expect a material impact on its consolidated financial statements.
42
|
a) |
Classification and measurement. The Company does not expect a material impact on its consolidated financial statements in applying the classification and measurement requirements of IFRS 9. |
|
b) |
Impairment. IFRS 9 requires the Company to record expected credit losses on all of its debt securities, loans and trade receivables, either on a 12-month or lifetime basis. The Company expects to apply the simplified approach and record lifetime expected losses on all trade receivables. The Company will need to perform a detailed analysis which considers all reasonable and supportable information, including forward-looking elements to determine the extent of the impact. Based on its existing trade receivables, the Company does not expect the IFRS 9 expected credit loss model to have a material impact on its consolidated financial statements. |
|
c) |
Hedge accounting. The Company believes that all existing hedge relationships that are currently designated in effective hedging relationships still qualify for hedge accounting under IFRS 9. As IFRS 9 does not change the general principles of how an entity accounts for effective hedges, the adoption of IFRS 9 will not have a material impact on the Company’s hedge accounting. |
IFRS 15, “Revenue from Contracts with Customers” (“IFRS 15”) replaces IAS 11, “Construction Contracts”, and IAS 18, “Revenue”, as well as various interpretations regarding revenue. This standard introduces a single model for recognizing revenue that applies to all contracts with customers, except for contracts that are within the scope of standards on leases, insurance and financial instruments. This standard also requires enhanced disclosures. Adoption of IFRS 15 is mandatory and will be effective for annual periods beginning on or after January 1, 2018. The Company has completed an assessment of significant contracts with customers and has determined the preliminary expected impacts of the adoption of IFRS 15 on its consolidated financial statements. The implementation of IFRS 15 will impact the allocation of revenue that is deferred in relation to its customer loyalty award programs. Revenue is currently allocated to the customer loyalty awards using the residual fair value method. Under IFRS 15, consideration will be allocated between the loyalty program awards and the goods on which the awards were earned, based on their relative stand-alone selling prices. The Company does not expect that the change in allocation of revenue that is deferred in relation to its customer loyalty program will have a material impact on retained earnings as at February 4, 2018. The Company continues to assess the impact of the disclosure requirements under IFRS 15 on the its consolidated financial statements.
IFRS 16, “Leases” (“IFRS 16”) replaces IAS 17, “Leases”. This standard provides a single model for leases abolishing the current distinction between finance and operating leases, with most leases being recognized on the balance sheet. Certain exemptions will apply for short-term leases and leases of low value assets. The new standard will be effective for annual periods beginning on or after January 1, 2019. Early application is permitted, provided the new revenue standard, IFRS 15, has been applied, or is applied at the same date as IFRS 16. The Company has performed a preliminary assessment of the potential impact of the adoption of IFRS 16 on its consolidated financial statements. The Company expects the adoption of IFRS 16 will have a significant impact as the Company will recognize new assets and liabilities for its operating leases of retail stores. In addition, the nature and timing of expenses related to those leases will change as IFRS 16 replaces the straight-line operating lease expense with a depreciation charge for right-of use assets and interest expense on lease liabilities. The Company has not yet determined which transition method it will apply or whether it will use the optional exemptions or practical expedients under the standard. The Company expects to disclose additional detailed information, including its transition method, any practical expedients elected and
estimated quantitative financial effects, before the adoption of IFRS 16.
IFRIC 22, “Foreign Currency Transactions and Advance Consideration” (“IFRIC 22”). In December 2016, the IASB issued IFRIC 22, which addresses how to determine the date of the transaction for the purpose of determining the exchange rate to use on initial recognition of the related asset, expense or income (or part of it) and on the derecognition of a non-monetary asset or non-monetary liability arising from the payment or receipt of advance consideration in a foreign currency. IFRIC 22 is effective for annual periods beginning on or after January 1, 2018. Early adoption is permitted. The Company is in the process of evaluating the impact of adopting the interpretation of IFRIC 22 on its consolidated financial statements.
IFRIC 23, “Uncertainty over Income Tax Treatments”, was issued by the IASB in June 2017. The Interpretation provides guidance on the accounting for current and deferred tax liabilities and assets in circumstances in which there is uncertainty over income tax treatments. The Interpretation is effective for annual periods beginning on or after January 1, 2019. Earlier application is permitted. The Interpretation requires an entity to:
|
· |
Contemplate whether uncertain tax treatments should be considered separately, or together as a group, based on which approach provides better predictions of the resolution; |
|
· |
Reflect an uncertainty in the amount of income tax payable (recoverable) if it is probable that it will pay (or recover) an amount for the uncertainty; and |
|
· |
Measure a tax uncertainty based on the most likely amount or expected value depending on whichever method better predicts the amount payable (recoverable). |
The Company does not expect a material impact from the adoption of IFRIC 23 on its consolidated financial statements.
43
JOBS Act Exemptions and Foreign Private Issuer Status
We qualify as an “emerging growth company” as defined in the JOBS Act. An emerging growth company may take advantage of specified reduced reporting and other burdens that are otherwise applicable generally to public companies. This includes an exemption from the auditor attestation requirement in the assessment of our internal control over financial reporting pursuant to the Sarbanes‑Oxley Act. We may take advantage of this exemption for up to five years or such earlier time that we are no longer an emerging growth company. We will cease to be an emerging growth company if we (1) have US$1.0 billion or more in annual revenue as of the end of our fiscal year, (2) are a large accelerated filer and have more than US$700.0 million in market value of our common shares held by non‑affiliates as of the end of our second fiscal quarter or (3) issue more than US$1.0 billion of non‑convertible debt securities over a three‑year period. We may choose to take advantage of some but not all of these reduced burdens.
We do not take advantage of the extended transition period provided under Section 7(a)(2)(B) of the Securities Act for complying with new or revised accounting standards. We report under the Exchange Act as a non‑U.S. company with foreign private issuer status. Even after we no longer qualify as an emerging growth company, as long as we qualify as a foreign private issuer under the Exchange Act we will be exempt from certain provisions of the Exchange Act that are applicable to U.S. domestic public companies, including:
|
· |
the sections of the Exchange Act regulating the solicitation of proxies, consents or authorizations in respect of a security registered under the Exchange Act; |
|
· |
the sections of the Exchange Act requiring insiders to file public reports of their stock ownership and trading activities and liability for insiders who profit from trades made in a short period of time; |
|
· |
the rules under the Exchange Act requiring the filing with the SEC of quarterly reports on Form 10‑Q containing unaudited financial and other specified information, or current reports on Form 8‑K, upon the occurrence of specified significant events; and |
|
· |
Regulation FD, which regulates selective disclosures of material information by issuers. |
ITEM 7A. Quantitative and Qualitative Disclosures about Market Risk
We are exposed to market risk in interest rates on debt and foreign currency on purchases of our teas and tea accessories.
Interest Rate Risk
Our borrowings under our Revolving Facility carry floating interest rates tied to our lender’s prime rate, and therefore, our consolidated statements of income (loss) and cash flows will be exposed to changes in interest rates in fiscal periods in which we have debt outstanding. As at February 3, 2018, we have no indebtedness under our Revolving Facility.
Foreign Exchange Risk
A significant portion of our tea and tea accessory purchases are in U.S. dollars as is our revenue from U.S. stores and U.S. e‑commerce customers. As a result, our statement of income (loss) and cash flows could be adversely impacted by changes in exchange rates, primarily between the U.S. dollar and the Canadian dollar. During the year, in order to protect ourselves from the risk of losses should the value of the Canadian dollar decline in relation to the U.S. dollar, we entered into forward contracts of $30.0 million to fix the exchange rate of 80% to 90% of our expected February 2018 to September 2018 U.S. dollar purchases in respect of our inventory.
44
ITEM 8. FINANCIAL STATEMENTS AND SUPPLEMENTARY DATA
INDEX TO CONSOLIDATED FINANCIAL STATEMENTS
|
|
|
Page |
|
Audited Consolidated Financial Statements |
|
|
|
|
46 | |
|
|
|
|
|
|
47 | |
|
For the years ended February 3, 2018, January 28, 2017 and January 30, 2016: |
|
|
|
Consolidated Statements of Income (Loss) and Comprehensive Income (Loss) |
|
48 |
|
|
49 | |
|
|
50 | |
|
|
51 |
45
REPORT OF INDEPENDENT REGISTERED PUBLIC ACCOUNTING FIRM
To the Shareholders and the Board of Directors of DAVIDsTEA Inc.
Opinion on the Financial Statements
We have audited the accompanying consolidated balance sheets of DAVIDsTEA Inc. (the Company) as of February 3, 2018 and January 28, 2017, the related consolidated statements of income (loss) and comprehensive income (loss), cash flows and equity (deficiency) for each of the three years in the period ended February 3, 2018, and the related notes (collectively referred to as the “consolidated financial statements”). In our opinion, the consolidated financial statements present fairly, in all material respects, the financial position of the Company at February 3, 2018 and January 28, 2017, and the results of its operations and its cash flows for each of the three years in the period ended February 3, 2018, in conformity with International Financial Reporting Standards as issued by the International Accounting Standards Board.
Basis for Opinion
These consolidated financial statements are the responsibility of the Company's management. Our responsibility is to express an opinion on the Company’s financial statements based on our audits. We are a public accounting firm registered with the Public Company Accounting Oversight Board (United States) (“PCAOB”) and are required to be independent with respect to the Company in accordance with the U.S. federal securities laws and the applicable rules and regulations of the Securities and Exchange Commission and the PCAOB.
We conducted our audits in accordance with the standards of the PCAOB. Those standards require that we plan and perform the audit to obtain reasonable assurance about whether the consolidated financial statements are free of material misstatement, whether due to error or fraud. The Company is not required to have, nor were we engaged to perform, an audit of its internal control over financial reporting. As part of our audits we are required to obtain an understanding of internal control over financial reporting but not for the purpose of expressing an opinion on the effectiveness of the Company's internal control over financial reporting. Accordingly, we express no such opinion.
Our audits included performing procedures to assess the risks of material misstatement of the consolidated financial statements, whether due to error or fraud, and performing procedures that respond to those risks. Such procedures included examining, on a test basis, evidence regarding the amounts and disclosures in the consolidated financial statements. Our audits also included evaluating the accounting principles used and significant estimates made by management, as well as evaluating the overall presentation of the consolidated financial statements. We believe that our audits provide a reasonable basis for our opinion.
/s/ Ernst & Young LLP1
We have served as the Company’s auditor since 2011.
Montréal, Canada
April 19, 2018
1 CPA, Auditor, CA, public accountancy permit no. A123806
46
DAVIDsTEA Inc.
Incorporated under the laws of Canada
[In thousands of Canadian dollars]
|
|
|
|
|
As at |
||
|
|
|
|
|
February 3, |
|
January 28, |
|
|
|
|
|
2018 |
|
2017 |
|
|
|
|
|
$ |
|
$ |
|
|
|
|
|
|
|
|
|
ASSETS |
|
|
|
|
|
|
|
Current |
|
|
|
|
|
|
|
Cash |
|
|
|
63,484 |
|
64,440 |
|
Accounts and other receivables |
|
[Note 6] |
|
3,131 |
|
3,485 |
|
Inventories |
|
[Note 7] |
|
24,450 |
|
31,264 |
|
Income tax receivable |
|
[Note 19] |
|
2,968 |
|
539 |
|
Prepaid expenses and deposits |
|
|
|
7,712 |
|
5,659 |
|
Derivative financial instruments |
|
[Note 24] |
|
— |
|
454 |
|
Total current assets |
|
|
|
101,745 |
|
105,841 |
|
Property and equipment |
|
[Note 8] |
|
36,558 |
|
51,160 |
|
Intangible assets |
|
[Note 9] |
|
4,439 |
|
2,958 |
|
Deferred income tax assets |
|
[Note 19] |
|
5,194 |
|
14,375 |
|
Total assets |
|
|
|
147,936 |
|
174,334 |
|
LIABILITIES AND EQUITY |
|
|
|
|
|
|
|
Current |
|
|
|
|
|
|
|
Trade and other payables |
|
[Note 10] |
|
14,392 |
|
19,681 |
|
Deferred revenue |
|
[Note 11] |
|
5,186 |
|
4,885 |
|
Current portion of provisions |
|
[Note 12] |
|
4,693 |
|
2,562 |
|
Derivative financial instruments |
|
[Note 24] |
|
229 |
|
— |
|
Total current liabilities |
|
|
|
24,500 |
|
27,128 |
|
Deferred rent and lease inducements |
|
|
|
8,608 |
|
7,824 |
|
Provisions |
|
[Note 12] |
|
13,460 |
|
5,932 |
|
Total liabilities |
|
|
|
46,568 |
|
40,884 |
|
Commitments and contingencies |
|
[Note 13] |
|
|
|
|
|
Equity |
|
|
|
|
|
|
|
Share capital |
|
[Note 17] |
|
111,692 |
|
263,828 |
|
Contributed surplus |
|
|
|
2,642 |
|
8,833 |
|
Deficit |
|
|
|
(14,721) |
|
(142,398) |
|
Accumulated other comprehensive income |
|
|
|
1,755 |
|
3,187 |
|
Total equity |
|
|
|
101,368 |
|
133,450 |
|
|
|
|
|
147,936 |
|
174,334 |
See accompanying notes
47
DAVIDsTEA Inc.
Incorporated under the laws of Canada
CONSOLIDATED STATEMENTS OF INCOME (LOSS) AND COMPREHENSIVE INCOME (LOSS)
[In thousands of Canadian dollars, except share information]
|
|
|
|
|
For the year ended |
|
||||
|
|
|
|
|
February 3, |
|
January 28, |
|
January 30, |
|
|
|
|
|
|
2018 |
|
2017 |
|
2016 |
|
|
|
|
|
|
$ |
|
$ |
|
$ |
|
|
|
|
|
|
|
|
|
|
|
|
|
Sales |
|
[Note 23] |
|
224,015 |
|
215,984 |
|
180,690 |
|
|
Cost of sales |
|
|
|
116,772 |
|
107,534 |
|
85,359 |
|
|
Gross profit |
|
|
|
107,243 |
|
108,450 |
|
95,331 |
|
|
Selling, general and administration expenses |
|
[Note 20] |
|
131,930 |
|
114,756 |
|
80,116 |
|
|
Results from operating activities |
|
|
|
(24,687) |
|
(6,306) |
|
15,215 |
|
|
Finance costs |
|
[Note 18] |
|
2,371 |
|
76 |
|
1,051 |
|
|
Finance income |
|
|
|
(567) |
|
(479) |
|
(348) |
|
|
Accretion of preferred shares |
|
[Note 16] |
|
— |
|
— |
|
401 |
|
|
Loss from embedded derivative on Series A, A-1 and A-2 preferred shares |
|
[Note 16] |
|
— |
|
— |
|
140,874 |
|
|
Loss before income taxes |
|
|
|
(26,491) |
|
(5,903) |
|
(126,763) |
|
|
Provision for income tax (recovery) |
|
[Note 19] |
|
2,010 |
|
(2,235) |
|
4,668 |
|
|
Net loss |
|
|
|
(28,501) |
|
(3,668) |
|
(131,431) |
|
|
Other comprehensive income (loss) |
|
|
|
|
|
|
|
|
|
|
Items to be reclassified subsequently to income: |
|
|
|
|
|
|
|
|
|
|
Unrealized net gain (loss) on forward exchange contracts |
|
[Note 24] |
|
(992) |
|
(2,247) |
|
5,253 |
|
|
Realized net (gain) loss on forward exchange contracts reclassified to inventory |
|
|
|
309 |
|
(742) |
|
(1,811) |
|
|
Provision for income tax recovery (income tax) on comprehensive income |
|
|
|
183 |
|
793 |
|
(913) |
|
|
Cumulative translation adjustment |
|
|
|
(932) |
|
(820) |
|
1,388 |
|
|
Other comprehensive income (loss), net of tax |
|
|
|
(1,432) |
|
(3,016) |
|
3,917 |
|
|
Total comprehensive loss |
|
|
|
(29,933) |
|
(6,684) |
|
(127,514) |
|
|
Net loss per share: |
|
|
|
|
|
|
|
|
|
|
Basic |
|
[Note 21] |
|
(1.11) |
|
(0.15) |
|
(6.65) |
|
|
Fully diluted |
|
[Note 21] |
|
(1.11) |
|
(0.15) |
|
(6.65) |
|
|
Weighted average number of shares outstanding |
|
|
|
|
|
|
|
|
|
|
— basic |
|
[Note 21] |
|
25,716,186 |
|
24,699,290 |
|
19,776,946 |
|
|
— fully diluted |
|
[Note 21] |
|
25,716,186 |
|
24,699,290 |
|
19,776,946 |
|
See accompanying notes
48
DAVIDsTEA Inc.
Incorporated under the laws of Canada
CONSOLIDATED STATEMENTS OF CASH FLOWS
[In thousands of Canadian dollars]
|
|
|
For the year ended |
|
||||
|
|
|
February 3, |
|
January 28, |
|
January 30, |
|
|
|
|
2018 |
|
2017 |
|
2016 |
|
|
|
|
$ |
|
$ |
|
$ |
|
|
OPERATING ACTIVITIES |
|
|
|
|
|
|
|
|
Net loss |
|
(28,501) |
|
(3,668) |
|
(131,431) |
|
|
Items not affecting cash: |
|
|
|
|
|
|
|
|
Depreciation of property and equipment |
|
8,431 |
|
8,069 |
|
5,832 |
|
|
Amortization of intangible assets |
|
1,474 |
|
758 |
|
613 |
|
|
Loss on disposal of property and equipment |
|
82 |
|
356 |
|
297 |
|
|
Impairment of property and equipment |
|
15,069 |
|
7,516 |
|
— |
|
|
Deferred rent |
|
542 |
|
1,325 |
|
1,165 |
|
|
Provision (recovery) for onerous contracts |
|
10,321 |
|
8,140 |
|
(265) |
|
|
Stock-based compensation expense |
|
2,021 |
|
2,264 |
|
1,749 |
|
|
Settlement related to cashless exercise of stock options, net of income taxes recovered |
|
— |
|
— |
|
(2,976) |
|
|
Amortization of financing fees |
|
79 |
|
75 |
|
241 |
|
|
Accretion on provisions |
|
2,292 |
|
— |
|
— |
|
|
Accretion of preferred shares |
|
— |
|
— |
|
401 |
|
|
Loss from embedded derivative on Series A, A-1 and A-2 preferred shares |
|
— |
|
— |
|
140,874 |
|
|
Deferred income taxes (recovered) |
|
3,585 |
|
(4,380) |
|
1,364 |
|
|
|
|
15,395 |
|
20,455 |
|
17,864 |
|
|
Net change in other non-cash working capital balances related to operations |
|
(5,537) |
|
(9,293) |
|
(2,272) |
|
|
Cash flows related to operating activities |
|
9,858 |
|
11,162 |
|
15,592 |
|
|
FINANCING ACTIVITIES |
|
|
|
|
|
|
|
|
Repayment of finance lease obligations |
|
— |
|
— |
|
(552) |
|
|
Proceeds from issuance of long-term debt |
|
— |
|
— |
|
9,996 |
|
|
Repayment of long-term debt |
|
— |
|
— |
|
(20,010) |
|
|
Repayment of loan from the controlling shareholder |
|
— |
|
— |
|
(2,952) |
|
|
Proceeds from issuance of common shares pursuant to exercise of stock options |
|
1,782 |
|
2,779 |
|
143 |
|
|
Gross proceeds of initial public offering ("IPO") |
|
— |
|
— |
|
79,370 |
|
|
IPO-related expenses |
|
— |
|
— |
|
(10,661) |
|
|
Financing fees |
|
— |
|
— |
|
(172) |
|
|
Cash flows related to financing activities |
|
1,782 |
|
2,779 |
|
55,162 |
|
|
INVESTING ACTIVITIES |
|
|
|
|
|
|
|
|
Additions to property and equipment |
|
(9,634) |
|
(20,531) |
|
(16,852) |
|
|
Additions to intangible assets |
|
(2,962) |
|
(1,484) |
|
(1,172) |
|
|
Cash flows related to investing activities |
|
(12,596) |
|
(22,015) |
|
(18,024) |
|
|
Decrease in cash during the year |
|
(956) |
|
(8,074) |
|
52,730 |
|
|
Cash, beginning of year |
|
64,440 |
|
72,514 |
|
19,784 |
|
|
Cash, end of year |
|
63,484 |
|
64,440 |
|
72,514 |
|
|
Supplemental Information |
|
|
|
|
|
|
|
|
Cash paid for: |
|
|
|
|
|
|
|
|
Interest |
|
— |
|
1 |
|
372 |
|
|
Income taxes (classified as operating activity) |
|
880 |
|
2,437 |
|
2,675 |
|
|
Cash received for: |
|
|
|
|
|
|
|
|
Interest |
|
574 |
|
486 |
|
378 |
|
|
Income taxes (classified as operating activity) |
|
68 |
|
532 |
|
662 |
|
See accompanying notes
49
DAVIDsTEA Inc.
Incorporated under the laws of Canada
CONSOLIDATED STATEMENTS OF EQUITY (DEFICIENCY)
[In thousands of Canadian dollars]
|
|
|
|
|
|
|
|
|
Accumulated Other Comprehensive Income |
|
|
|
||||
|
|
|
|
|
|
|
|
|
Accumulated |
|
Accumulated |
|
|
|
|
|
|
|
|
|
|
|
|
|
|
Derivative |
|
Foreign |
|
Accumulated |
|
|
|
|
|
|
|
|
|
|
|
|
Financial |
|
Currency |
|
Other |
|
|
|
|
|
|
Share |
|
Contributed |
|
|
|
Instrument |
|
Translation |
|
Comprehensive |
|
Total |
|
|
|
|
Capital |
|
Surplus |
|
Deficit |
|
Adjustment |
|
Adjustment |
|
Income |
|
Equity |
|
|
|
|
$ |
|
$ |
|
$ |
|
$ |
|
$ |
|
$ |
|
$ |
|
|
|
|
|
|
|
|
|
|
|
|
|
|
|
|
|
|
|
Balance, January 30, 2016 |
|
259,205 |
|
7,094 |
|
(138,465) |
|
2,529 |
|
3,674 |
|
6,203 |
|
134,037 |
|
|
Net loss for the year ended January 28, 2017 |
|
— |
|
— |
|
(3,668) |
|
— |
|
— |
|
— |
|
(3,668) |
|
|
Other comprehensive loss |
|
— |
|
— |
|
— |
|
(2,196) |
|
(820) |
|
(3,016) |
|
(3,016) |
|
|
Total comprehensive loss |
|
— |
|
— |
|
(3,668) |
|
(2,196) |
|
(820) |
|
(3,016) |
|
(6,684) |
|
|
Issuance of common shares |
|
4,175 |
|
(1,396) |
|
— |
|
— |
|
— |
|
— |
|
2,779 |
|
|
Common shares issued on vesting of restricted stock units |
|
448 |
|
(922) |
|
(265) |
|
— |
|
— |
|
— |
|
(739) |
|
|
Stock-based compensation expense |
|
— |
|
2,264 |
|
— |
|
— |
|
— |
|
— |
|
2,264 |
|
|
Income tax impact associated with stock options |
|
— |
|
1,793 |
|
— |
|
— |
|
— |
|
— |
|
1,793 |
|
|
Balance, January 28, 2017 |
|
263,828 |
|
8,833 |
|
(142,398) |
|
333 |
|
2,854 |
|
3,187 |
|
133,450 |
|
|
|
|
|
|
|
|
|
|
|
|
|
|
|
|
|
|
|
Balance, January 28, 2017 |
|
263,828 |
|
8,833 |
|
(142,398) |
|
333 |
|
2,854 |
|
3,187 |
|
133,450 |
|
|
Net loss for the year ended February 3, 2018 |
|
— |
|
— |
|
(28,501) |
|
— |
|
— |
|
— |
|
(28,501) |
|
|
Other comprehensive loss |
|
— |
|
— |
|
— |
|
(500) |
|
(932) |
|
(1,432) |
|
(1,432) |
|
|
Total comprehensive loss |
|
— |
|
— |
|
(28,501) |
|
(500) |
|
(932) |
|
(1,432) |
|
(29,933) |
|
|
Issuance of common shares |
|
2,669 |
|
(887) |
|
— |
|
— |
|
— |
|
— |
|
1,782 |
|
|
Common shares issued on vesting of restricted stock units |
|
1,142 |
|
(1,984) |
|
231 |
|
— |
|
— |
|
— |
|
(611) |
|
|
Write-down of deferred income tax assets |
|
— |
|
(3,412) |
|
— |
|
— |
|
— |
|
— |
|
(3,412) |
|
|
Stock-based compensation expense |
|
— |
|
2,021 |
|
— |
|
— |
|
— |
|
— |
|
2,021 |
|
|
Income tax impact associated with stock options |
|
— |
|
(1,797) |
|
— |
|
— |
|
— |
|
— |
|
(1,797) |
|
|
Impact of change in foreign tax rate associated with stock options |
|
— |
|
(132) |
|
— |
|
— |
|
— |
|
— |
|
(132) |
|
|
Reduction of stated capital |
|
(155,947) |
|
— |
|
155,947 |
|
— |
|
— |
|
— |
|
— |
|
|
Balance, February 3, 2018 |
|
111,692 |
|
2,642 |
|
(14,721) |
|
(167) |
|
1,922 |
|
1,755 |
|
101,368 |
|
See accompanying notes
50
DAVIDsTEA Inc.
NOTES TO CONSOLIDATED FINANCIAL STATEMENTS
For the years ended February 3, 2018, January 28, 2017 and January 30, 2016
[Amounts in thousands of Canadian dollars except per share amounts and where otherwise indicated]
1. CORPORATE INFORMATION
The consolidated financial statements of DAVIDsTEA Inc. and its subsidiary (collectively, the “Company”) for the year ended February 3, 2018 were authorized for issue in accordance with a resolution of the Board of Directors on April 19, 2018. The Company is incorporated and domiciled in Canada and its shares are publicly traded on the NASDAQ Global Market under the symbol “DTEA”. The registered office is located at 5430, Ferrier Street, Town of Mount-Royal, Quebec, Canada, H4P 1M2.
The Company is engaged in the retail and online sale of tea, tea accessories and food and beverages in Canada and in the United States. Sales fluctuate from quarter to quarter. Sales are traditionally higher in the fourth fiscal quarter due to the year-end holiday season, and tend to be lowest in the second and third fiscal quarters because of lower customer traffic during the summer months.
2. BASIS OF PREPARATION
The consolidated financial statements of the Company have been prepared in accordance with International Financial Reporting Standards (“IFRS”) as issued by the International Accounting Standards Board (“IASB”). The accounting policies were consistently applied to all periods presented.
The Company’s fiscal year ends on the Saturday closest to the end of January, typically resulting in a 52-week year, but occasionally giving rise to an additional week, resulting in a 53-week year. The years ended January 30, 2016 and January 28, 2017 cover a 52-week period. The year ended February 3, 2018 covers a 53-week fiscal period.
Basis of consolidation
The consolidated financial statements include the accounts of the Company and its wholly owned U.S. subsidiary, DAVIDsTEA (USA) Inc. The financial statements of the subsidiary are prepared for the same reporting period as the parent company, using consistent accounting policies. All intercompany transactions, balances and unrealized gains or losses have been eliminated.
Basis of measurement
These consolidated financial statements have been prepared on the historical cost basis except for the following material items:
|
· |
Derivative financial instruments are measured at fair value; and |
|
· |
Provisions for onerous contracts are measured at the present value of the expenditures expected to settle the obligations. |
Functional and presentation currency
These consolidated financial statements are presented in Canadian dollars, which is the parent Company’s functional currency.
3. SIGNIFICANT ACCOUNTING POLICIES
Cash
Cash on the consolidated balance sheet comprises cash at banks and on hand.
51
Inventory valuation
Inventories are measured at the lower of cost and net realizable value. Cost is determined using the weighted average cost method. Costs include the cost of purchase and transportation costs that are directly incurred to bring the inventories to their present location, and duty. Net realizable value is the estimated selling price of inventory in the ordinary course of business, less any estimated selling costs. Cost also includes realized gains and losses on forward contracts designated as cash flow hedges of U.S. inventory purchases.
Property and equipment
Property and equipment are initially recorded at cost and are depreciated over their useful economic life. Cost includes expenditures that are directly attributable to the acquisition of the asset, including any costs directly related to bringing the asset to a working condition for its intended use. The residual values, useful lives and methods of depreciation of property and equipment are reviewed at each financial year end and adjusted prospectively, if appropriate. All repair and maintenance costs are recognized in net income (loss) as incurred.
Depreciation of an asset begins once it becomes available for use. Depreciation is charged to income on the following bases:
|
Furniture and equipment |
|
20 |
% declining balance |
|
Computer hardware |
|
30 |
% declining balance |
Leasehold improvements are depreciated on a straight‑line basis over the lesser of the useful economic life and the initial term of the leases, plus one renewal option period, not to exceed 10 years.
Any gain or loss arising on the disposal or derecognition of the asset (calculated as the difference between the net disposal proceeds and the carrying amount of the asset) is included in net income (loss) when the asset is derecognized.
Intangible assets
Intangible assets consist of computer software, trademarks and patents.
Intangible assets are initially recorded at cost. Intangible assets with finite lives are amortized over their useful economic life. The amortization period and the amortization method for an intangible asset with a finite useful life are reviewed at least at the end of each reporting period. Changes in the expected useful life are considered to modify the amortization period or method, as appropriate, and are treated as changes in accounting estimates. The amortization expense on intangible assets with finite lives is recognized in income (loss) as the expense category that is consistent with the function of the intangible assets.
Any gain or loss arising on the disposal or derecognition of the intangible asset (calculated as the difference between the net disposal proceeds and the carrying amount of the intangible asset) is included in net income (loss) when the intangible asset is derecognized.
When computer software is not an integral part of a related item of computer hardware, the software is treated as an intangible. Computer software is amortized on the basis of its estimated useful life using the declining method at the rate of 30%.
Leases
Leases are classified as either operating or finance, based on the substance of the transaction at inception of the lease. Classification is re‑assessed if the terms of the lease are changed.
Leases in which a significant portion of the risks and rewards of ownership are not assumed by the Company are classified as operating leases. The Company carries on its operations in premises under leases of varying terms and renewal options, which are accounted for as operating leases. Payments under an operating lease are recognized in net income (loss) on a straight‑line basis over the term of the lease. When a lease contains a predetermined fixed escalation of the minimum rent, the Company recognizes the related rent expense on a straight‑line basis and, consequently, records the difference between the recognized rental expense and the amounts payable under the lease as deferred rent. Contingent (sales‑based) rentals are recognized as an expense when incurred.
52
Store opening costs
Store opening costs are expensed as incurred.
Impairment
i.Impairment of financial assets
The Company assesses, at each reporting date, whether there is objective evidence that a financial asset or a group of financial assets is impaired. An impairment exists if one or more events that has occurred since the initial recognition of the asset (an incurred “loss event”) has an impact on the estimated future cash flows of the financial asset or the group of financial assets that can be reliably estimated. Evidence of impairment may include indications that the debtors or a group of debtors is experiencing significant financial difficulty, default or delinquency in interest or principal payments, the probability that they will enter bankruptcy or other financial reorganization and observable data indicating that there is a measurable decrease in the estimated future cash flows, such as changes in arrears or economic conditions that correlate with defaults.
ii.Impairment of non‑financial assets
The Company assesses, at each reporting date, whether there is an indication that an item of property and equipment or an intangible asset may be impaired. If any indication exists, the Company estimates the asset’s recoverable amount. An asset’s recoverable amount is the higher of an asset’s or cash‑generating unit’s (“CGU”) fair value less costs of disposal and its value in use. When the carrying amount of an asset or CGU exceeds its recoverable amount, the asset is considered impaired and is written down to its recoverable amount.
In determining fair value less costs of disposal, recent market transactions are taken into account. If no such transactions can be identified, an appropriate valuation model is used. In assessing value in use, the estimated future cash flows are discounted to their present value using a pre‑tax discount rate that reflects current market assessments of the time value of money. Recoverable amount is determined for an individual asset, unless the asset does not generate cash inflows that are largely independent of those from other assets or corporate assets. The discount rate applied to an asset or CGU is the weighted average cost of capital (“WACC”). Management considers factors such as risk-free rate, equity risk premium, size premium, specific business risk premium and cost of debt to derive the WACC.
The Company bases its impairment calculation on detailed budgets and forecast calculations, which are prepared separately for each of the Company’s CGUs to which the individual assets are allocated. These budgets and forecast calculations generally cover the lease term.
Based on the management of operations, the Company has defined each of the commercial premises in which it carries out its activities as a CGU, although where appropriate these premises are aggregated at a district or regional level to form a CGU.
An assessment is made at each reporting date as to whether there is any indication that previously recognized impairment losses may no longer exist or may have decreased and if there has been a change in the assumptions used to determine the asset’s recoverable amount. The reversal is limited to the extent that an asset’s carrying amount does not exceed the carrying amount that would have been determined, net of depreciation or amortization, had no impairment loss been recognized. Such reversal is recognized in net income (loss).
Derivative financial instruments and hedge accounting
The Company enters into foreign exchange forward contracts to hedge its foreign currency risks, resulting from variability in foreign currency exchange rates on inventory purchases, as described in Note 24.
Derivative financial instruments are initially recognized at fair value on the date on which a derivative contract is entered into and are subsequently remeasured at fair value. Derivatives are carried as financial assets when the fair value is positive and as financial liabilities when the fair value is negative.
For the purpose of hedge accounting, hedges are classified as cash flow hedges when hedging the exposure to variability in cash flows that is either attributable to a particular risk associated with a recognized asset or liability or a highly probable forecast transaction.
53
At the inception of a hedge relationship, the Company formally designates and documents the hedge relationship to which it wishes to apply hedge accounting and the risk management objective and strategy for undertaking the hedge. The documentation includes identification of the hedging instrument, the hedged item or transaction, the nature of the risk being hedged and how the entity will assess the effectiveness of changes in the hedging instrument’s fair value in offsetting the exposure to changes in the hedged item’s fair value or cash flows attributable to the hedged risk. Such hedges are expected to be highly effective in achieving offsetting changes in fair value or cash flows and are assessed on an ongoing basis to determine that they actually have been highly effective throughout the financial reporting periods for which they were designated.
The Company has applied hedge accounting for its foreign exchange forward contracts and has designated them as cash flow hedges. The effective portion of the gain or loss on the hedging instrument is recognized directly in Other Comprehensive Income (Loss) (“OCI”), while any ineffective portion is recognized immediately in net income (loss). The amounts recognized in OCI are reclassified to inventory when such non-financial asset is recognized on the balance sheet, and to net income (loss) when inventory is subsequently sold.
Provisions
Provisions are recognized when the Company has a present obligation as a result of a past event, it is probable that an outflow of resources embodying economic benefits will be required to settle the obligation and a reliable estimate can be made of the amount of the obligation. When the Company expects some or all of a provision to be reimbursed, the reimbursement is recognized as a separate asset, but only when the reimbursement is virtually certain. The expense relating to a provision is presented in the statement of income (loss) net of any reimbursement. All provisions are reviewed at each reporting date and adjusted to reflect the current best estimates.
If the effect of the time value of money is material, provisions are discounted using a current pre‑tax rate that reflects, when appropriate, the risks specific to the liability. When discounting is used, the increase in the provision due to the passage of time is recognized as a finance cost.
Deferred lease inducements
The deferred lease inducements are composed of free rent and construction allowances obtained upon signing of lease agreements for certain retail stores. They are amortized on a straight‑line basis over the term of the related leases, plus one renewal option, to a maximum of 10 years.
Share capital
i.Common shares
Common shares are classified as equity. Incremental costs directly attributable to the issue of common shares are recognized as a deduction from equity, net of any tax effects.
Common shares are classified as equity if they are non‑redeemable or redeemable only at the Company’s option, and any dividends are discretionary. Dividends thereon are recognized as distributions within equity on approval by the Company’s Board of Directors.
ii.Preferred shares
Preferred shares are classified as a financial liability if they are redeemable on a specific date or at the option of the shareholders. Dividends thereon are recognized as interest expense in net income (loss) as accrued.
.
iii.Hybrid financial instruments
Hybrid financial instruments issued by the Company comprise convertible preferred shares that can be converted to common shares at the option of the holders, when the number of shares to be issued is not fixed.
54
The equity components on such instruments are separated from the debt host contract (preferred shares redeemable at the option of the holders) and accounted for separately if the economic characteristics and risks of the debt host contract and the embedded derivative (equity components) are not closely related.
iv.Derivative and embedded derivative financial instruments
The Company issued liability‑classified derivatives and embedded derivatives over its Series A, A‑1 and A‑2 preferred shares. Embedded derivatives are separated from the host contract and accounted for separately if the economic characteristics and risks of the host contract and the embedded derivative are not closely related, a separate instrument with the same terms as the embedded derivative would meet the definition of a derivative and the combined instrument is not measured at fair value through income (loss).
Derivatives and separable embedded derivatives are recognized initially at fair value and attributable transaction costs are recognized in income (loss) as incurred. Subsequent to initial recognition, derivatives and separable embedded derivatives are measured at fair value and all changes in their fair value are recognized immediately in income (loss).
Stock‑based compensation
The Company has a stock option plan for employees and directors from which options to purchase common shares are issued (the “Plan”). Options may not be granted with an exercise price of less than the fair value of the underlying shares at the grant date. The awards have no cash settlement alternatives. The vesting requirements are typically service‑based and the options normally have a contractual life of seven years.
The fair value of stock‑based compensation awards granted to employees is measured at the grant date using the Black Scholes option pricing model. Measurement inputs include the share price of the underlying shares on the measurement date, the exercise price of the option, the expected volatility (based on weighted average historical volatility of comparable companies adjusted for changes expected based on publicly available information), the weighted average expected life of the option (based on historical experience), expected dividends, and the risk‑free interest rate (based on government bonds).
The value of the compensation expense is recognized over the vesting period of the stock options as an expense included in selling and general administration expenses, with a corresponding increase to contributed surplus in equity. The amount recognized as an expense is adjusted to reflect the Company’s best estimate of the number of awards that will ultimately vest. No expense is recognized for awards that do not ultimately vest.
Any consideration paid by plan participants on the exercise of stock options and the previously recognized compensation cost of the options exercised included in contributed surplus are credited to share capital.
Under the Company’s 2015 Omnibus Equity Incentive Plan (the “2015 Omnibus Plan”), selected employees and directors are granted RSUs where each RSU has a value equal to one common share. The compensation expense is recorded at the fair value of the Company’s common shares at the grant date over the vesting period (generally one to three years) with a corresponding credit to contributed surplus for equity-settled RSUs and a corresponding credit to a liability for cash-settled RSUs. RSUs may be settled in shares, cash, or a combination of cash or shares upon vesting at the discretion of the Company. Cash settled RSUs are revalued at each reporting date to reflect their fair value at that date. Fair value is determined using the closing price of the Company’s common shares on the NASDAQ Global Market prior to the date of the grant. The Company has not issued any cash settled awards to date.
Revenue recognition
Revenue from retail sales is recorded upon delivery to the customer. Revenue is recognized on e-commerce sales when merchandise is delivered. Revenues are recorded net of discounts, rebates, estimated returns, sales taxes and amounts deferred related to the issuance of Frequent Steeper points.
i.Gift card breakage
Gift cards sold are recorded as deferred revenue and revenue is recognized at the time of redemption or in accordance with the Company’s accounting policy for breakage. Breakage income represents the estimated value of gift cards that is not expected to be redeemed by customers and is estimated based on historical redemption patterns. Gift card breakage is included in sales in the consolidated statement of income (loss).
55
ii.Loyalty program
The Frequent Steeper loyalty and rewards program allows customers to earn points when they purchase products in the Company’s retail stores and on the Company’s website. Points can be redeemed for free tea or free beverages, depending on the number of points a customer has obtained over a limited collection period. Free tea offers are issued at the end of each collection period and must be redeemed within 60 days from the effective date. Free beverage offers are issued at the end of the calendar collection period and must be redeemed within 60 days from the effective date.
The fair value of points issued is recorded as deferred revenue and recognized as revenue only when the points are redeemed for free products or when the related points expire. The fair value of Frequent Steeper points is determined based on the estimated selling price of the product for which the point is expected to be redeemed, net of points we do not expect to be redeemed. On an ongoing basis, the Company monitors historical redemption rates. Points revenue is included with total sales in the consolidated statement of income (loss).
Finance income
Interest income is recognized as interest accrues using the effective interest method.
Income taxes
Income tax expense comprises current and deferred tax. Current tax and deferred tax are recognized in net income (loss) except to the extent that they relate to items recognized directly in equity or in other comprehensive income.
Current income tax assets and liabilities for the current and prior periods are measured at the amount expected to be recovered or paid. The tax rates and tax laws used to compute the amount are those that are enacted or substantively enacted by the balance sheet date. Management periodically evaluates positions taken in the tax returns with respect to situations in which applicable tax regulations are subject to interpretation and establishes provisions where appropriate.
The Company uses the liability method of accounting for deferred income taxes, which requires the establishment of deferred tax assets and liabilities for all temporary differences caused when the tax bases of assets and liabilities differ from their carrying amounts reported in the consolidated financial statements. Deferred income tax assets and liabilities are measured at the tax rates that are expected to apply to the temporary differences when they reverse, based on tax rates that have been enacted or substantively enacted at the end of the reporting period. The Company recognizes deferred income tax assets for unused tax losses and deductible temporary differences only to the extent that, in management’s opinion, it is probable that future taxable income will be available against which they can be utilized. Deferred income tax assets are reviewed at each reporting date and are reduced to the extent that it is no longer probable that the related tax benefit will be realized.
Deferred income tax assets and liabilities are offset when there is a legally enforceable right to offset and when the deferred income tax assets and liabilities relate to income taxes levied by the same taxation authority and the Company intends either to settle on a net basis or to realize the asset and settle the liability simultaneously.
Earnings per share
Basic earnings per share are calculated using the weighted average number of shares outstanding during the period.
The diluted earnings per share are calculated by adjusting the weighted average number of shares outstanding to include additional shares issued from the assumed conversion of preferred shares and the exercise of stock options and RSUs, if dilutive. For stock options, the number of additional shares is calculated by assuming that the proceeds from such exercises, as well as the amount of unrecognized stock-based compensation which is considered to be assumed proceeds, are used to purchase common shares at the average market price during the reporting period.
Financial instruments
A financial instrument is any contract that gives rise to a financial asset of one entity and a financial liability or equity instrument of another entity. Financial instruments are recognized depending on their classification with changes in subsequent measurements being recognized in income or loss or in other comprehensive income (“OCI”).
56
The Company has made the following classifications:
|
· |
Cash and derivative financial instruments are classified as “Fair Value through Profit or Loss”, and measured at fair value. Changes in fair value are recorded in income (loss). |
|
· |
Accounts and other receivables are classified as “Loans and Receivables”. After their initial fair value measurement, they are measured at amortized cost using the effective interest rate method. |
|
· |
Trade and other payables are classified as “Other Financial Liabilities”. After their initial fair value measurement, they are measured at amortized cost using the effective interest rate method. |
Foreign currency translation
Revenues, expenses and non-monetary assets and liabilities denominated in foreign currencies are recorded at the rate of exchange prevailing at the transaction date. Monetary assets and liabilities denominated in foreign currencies are translated at exchange rates prevailing at the balance sheet date. Unrealized and realized translation gains and losses are reflected in net income (loss).
The assets and liabilities of the Company’s U.S. wholly owned subsidiary, whose functional currency is the U.S. dollar, are translated into Canadian dollars at the exchange rates in effect at the balance sheet date. Revenues and expenses are translated at average exchange rates for the year. Differences arising from the exchange rate changes are included in OCI in the cumulative translation account.
Foreign exchange gains or losses arising from a monetary item receivable from or payable to a foreign operation, the settlement of which is neither planned nor likely to occur in the foreseeable future and which in substance is considered to form part of the net investment in the foreign operation, are recognized in other comprehensive income in the cumulative translation account and reclassified from equity to net income (loss) on disposal of the net investment.
4. CHANGES IN ACCOUNTING PRINCIPLES
Standards issued but not yet effective
IFRS 9, “Financial Instruments”, for which the final version was issued in July 2014 by the IASB, replaces IAS 39, “Financial Instruments: Recognition and Measurement” and all previous versions of IFRS 9. IFRS 9 brings together all three aspects of the accounting for financial instruments project: classification and measurement, impairment and hedge accounting. IFRS 9 is effective for annual periods beginning on or after January 1, 2018, with early adoption permitted. Except for hedge accounting, retrospective application is required but providing comparative information is not compulsory. For hedge accounting, the requirements are generally applied prospectively, with some limited exceptions. The Company plans to adopt the new standard on the required effective date. The Company is currently assessing the impact of the adoption of this standard on its consolidated financial statements and related note disclosures. The Company has performed a high-level impact assessment of all three aspects of IFRS 9. This preliminary assessment is based on currently available information and may be subject to changes arising from further detailed analyses. Overall, the Company does not expect a material impact on its consolidated financial statements.
|
a) |
Classification and measurement. The Company does not expect a material impact on its consolidated financial statements in applying the classification and measurement requirements of IFRS 9. |
|
b) |
Impairment. IFRS 9 requires the Company to record expected credit losses on all of its debt securities, loans and trade receivables, either on a 12-month or lifetime basis. The Company expects to apply the simplified approach and record lifetime expected losses on all trade receivables. The Company will need to perform a detailed analysis which considers all reasonable and supportable information, including forward-looking elements to determine the extent of the impact. Based on its existing trade receivables, the Company does not expect the IFRS 9 expected credit loss model to have a material impact on its consolidated financial statements. |
|
c) |
Hedge accounting. The Company believes that all existing hedge relationships that are currently designated in effective hedging relationships still qualify for hedge accounting under IFRS 9. As IFRS 9 does not change the general principles of how an entity accounts for effective hedges, the adoption of IFRS 9 will not have a material impact on the Company’s hedge accounting. |
57
IFRS 15, “Revenue from Contracts with Customers” (“IFRS 15”) replaces IAS 11, “Construction Contracts”, and IAS 18, “Revenue”, as well as various interpretations regarding revenue. This standard introduces a single model for recognizing revenue that applies to all contracts with customers, except for contracts that are within the scope of standards on leases, insurance and financial instruments. This standard also requires enhanced disclosures. Adoption of IFRS 15 is mandatory and will be effective for annual periods beginning on or after January 1, 2018. The Company has completed an assessment of significant contracts with customers and has determined the preliminary expected impacts of the adoption of IFRS 15 on its consolidated financial statements. The implementation of IFRS 15 will impact the allocation of revenue that is deferred in relation to its customer loyalty award programs. Revenue is currently allocated to the customer loyalty awards using the residual fair value method. Under IFRS 15, consideration will be allocated between the loyalty program awards and the goods on which the awards were earned, based on their relative stand-alone selling prices. The Company does not expect that the change in allocation of revenue that is deferred in relation to its customer loyalty program will have a material impact on retained earnings as at February 4, 2018. The Company continues to assess the impact of the disclosure requirements under IFRS 15 on the its consolidated financial statements.
IFRS 16, “Leases” (“IFRS 16”) replaces IAS 17, “Leases”. This standard provides a single model for leases abolishing the current distinction between finance and operating leases, with most leases being recognized on the balance sheet. Certain exemptions will apply for short-term leases and leases of low value assets. The new standard will be effective for annual periods beginning on or after January 1, 2019. Early application is permitted, provided the new revenue standard, IFRS 15, has been applied, or is applied at the same date as IFRS 16. The Company has performed a preliminary assessment of the potential impact of the adoption of IFRS 16 on its consolidated financial statements. The Company expects the adoption of IFRS 16 will have a significant impact as the Company will recognize new assets and liabilities for its operating leases of retail stores. In addition, the nature and timing of expenses related to those leases will change as IFRS 16 replaces the straight-line operating lease expense with a depreciation charge for right-of use assets and interest expense on lease liabilities. The Company has not yet determined which transition method it will apply or whether it will use the optional exemptions or practical expedients under the standard. The Company expects to disclose additional detailed information, including its transition method, any practical expedients elected and
estimated quantitative financial effects, before the adoption of IFRS 16.
IFRIC 22, “Foreign Currency Transactions and Advance Consideration” (“IFRIC 22”). In December 2016, the IASB issued IFRIC 22, which addresses how to determine the date of the transaction for the purpose of determining the exchange rate to use on initial recognition of the related asset, expense or income (or part of it) and on the derecognition of a non-monetary asset or non-monetary liability arising from the payment or receipt of advance consideration in a foreign currency. IFRIC 22 is effective for annual periods beginning on or after January 1, 2018. Early adoption is permitted. The Company is in the process of evaluating the impact of adopting the interpretation of IFRIC 22 on its consolidated financial statements.
IFRIC 23, “Uncertainty over Income Tax Treatments”, was issued by the IASB in June 2017. The Interpretation provides guidance on the accounting for current and deferred tax liabilities and assets in circumstances in which there is uncertainty over income tax treatments. The Interpretation is effective for annual periods beginning on or after January 1, 2019. Earlier application is permitted. The Interpretation requires an entity to:
|
· |
Contemplate whether uncertain tax treatments should be considered separately, or together as a group, based on which approach provides better predictions of the resolution; |
|
· |
Reflect an uncertainty in the amount of income tax payable (recoverable) if it is probable that it will pay (or recover) an amount for the uncertainty; and |
|
· |
Measure a tax uncertainty based on the most likely amount or expected value depending on whichever method better predicts the amount payable (recoverable). |
The Company does not expect a material impact from the adoption of IFRIC 23 on its consolidated financial statements.
5. SIGNIFICANT ACCOUNTING JUDGEMENTS, ESTIMATES AND ASSUMPTIONS
The preparation of the consolidated financial statements in conformity with IFRS requires the Company to make judgments, apart from those involving estimation, in applying accounting policies that affect the recognition and measurement of assets, liabilities, revenues, and expenses. Actual results may differ from the judgments made by the Company. Information about judgments that have the most significant effect on recognition and measurement of assets, liabilities, revenues, and expenses are discussed below. Information about significant estimates is discussed in the following section.
58
Key sources of estimation uncertainty
Recoverability and impairment of non‑financial assets
Leasehold improvements and furniture and equipment are reviewed for impairment if events or changes in circumstances indicate that the carrying amount may not be recoverable. A review for impairment is conducted by comparing the carrying amount of the CGU’s assets with their respective recoverable amounts based on value in use. Value in use is determined based on management’s best estimate of expected future cash flows, which includes estimates of growth rates, from use over the remaining lease term and discounted using a pre‑tax weighted average cost of capital (Note 8).
Critical judgements in applying accounting policies
|
i. |
Impairment of non‑financial assets |
Management is required to make significant judgments in determining if individual commercial premises in which it carries out its activities are individual CGUs, or if these units should be aggregated at a district or regional level to form a CGU. The significant judgments applied by management in determining if stores should be aggregated in a given geographic area to form a CGU include the determination of expected customer behavior, the allocation basis of e-commerce sales to CGUs, and whether customers could interchangeably shop in any of the stores in a given area and whether management views the cash flows of the stores in the group as interdependent.
|
ii. |
Income taxes |
The Company may be subject to audits related to tax risks, and uncertainties exist with respect to the interpretation of tax regulations, changes in tax laws, and the amount and timing of future taxable income. Differences arising between the actual results and the assumptions made, or future changes to such assumptions, could necessitate future adjustments to taxable income and income tax expense already recorded. The Company establishes provisions if required, based on reasonable estimates, for possible consequences of audits by the tax authorities. The amount of such provisions is based on various factors, such as experience of previous tax audits and differing interpretations of tax regulations by the entity and the responsible tax authority, which may arise on a wide variety of issues.
To determine the extent to which deferred income tax assets can be recognized, management estimates the amount of probable future taxable profits that will be available against which deductible temporary differences and unused tax losses can be used. Such estimates are made as part of the budget and strategic plan by tax jurisdiction. Management exercises judgment to determine the extent to which realization of future taxable benefits is probable considering factors such as the number of years included in the forecast period and prudent tax planning strategies. See Note 19—Income Taxes for more details.
6. ACCOUNTS AND OTHER RECEIVABLES
|
|
|
February 3, |
|
January 28, |
|
|
|
|
2018 |
|
2017 |
|
|
|
|
$ |
|
$ |
|
|
Credit card cash clearing receivables |
|
1,291 |
|
1,537 |
|
|
Other receivables |
|
1,840 |
|
1,948 |
|
|
|
|
3,131 |
|
3,485 |
|
7. INVENTORIES
|
|
|
February 3, |
|
January 28, |
|
|
|
2018 |
|
2017 |
|
|
|
$ |
|
$ |
|
Finished goods |
|
17,600 |
|
24,504 |
|
Goods in transit |
|
4,608 |
|
5,463 |
|
Packaging |
|
2,242 |
|
1,297 |
|
|
|
24,450 |
|
31,264 |
During the year ended February 3, 2018, inventories recognized as cost of sales amounted to $64,611 [January 28, 2017 —$62,995]. The cost of inventory includes a write‑down of nil [January 28, 2017 — write-down of $869] recorded as a result of net
59
realizable value being lower than cost. During the year, $730 of inventory write-downs recognized in previous years were reversed.
8. PROPERTY AND EQUIPMENT
|
|
|
Leasehold |
|
Furniture and |
|
Computer |
|
|
|
|
|
|
improvements |
|
equipment |
|
hardware |
|
Total |
|
|
|
|
$ |
|
$ |
|
$ |
|
$ |
|
|
Cost |
|
|
|
|
|
|
|
|
|
|
Balance, January 30, 2016 |
|
60,520 |
|
8,270 |
|
3,156 |
|
71,946 |
|
|
Acquisitions |
|
16,571 |
|
3,135 |
|
825 |
|
20,531 |
|
|
Disposals |
|
(404) |
|
(104) |
|
— |
|
(508) |
|
|
Cumulative translation adjustment |
|
(1,132) |
|
(116) |
|
(33) |
|
(1,281) |
|
|
Balance, January 28, 2017 |
|
75,555 |
|
11,185 |
|
3,948 |
|
90,688 |
|
|
Acquisitions |
|
6,581 |
|
1,808 |
|
1,245 |
|
9,634 |
|
|
Disposals |
|
— |
|
(187) |
|
— |
|
(187) |
|
|
Cumulative translation adjustment |
|
(1,503) |
|
(167) |
|
(49) |
|
(1,719) |
|
|
Balance, February 3, 2018 |
|
80,633 |
|
12,639 |
|
5,144 |
|
98,416 |
|
|
|
|
Leasehold |
|
Furniture and |
|
Computer |
|
|
|
|
|
|
improvements |
|
equipment |
|
hardware |
|
Total |
|
|
|
|
$ |
|
$ |
|
$ |
|
$ |
|
|
Accumulated depreciation and impairment |
|
|
|
|
|
|
|
|
|
|
Balance, January 30, 2016 |
|
19,918 |
|
3,332 |
|
1,366 |
|
24,616 |
|
|
Depreciation |
|
6,210 |
|
1,211 |
|
648 |
|
8,069 |
|
|
Impairment |
|
6,764 |
|
615 |
|
137 |
|
7,516 |
|
|
Disposals |
|
(91) |
|
(61) |
|
— |
|
(152) |
|
|
Cumulative translation adjustment |
|
(459) |
|
(49) |
|
(13) |
|
(521) |
|
|
Balance, January 28, 2017 |
|
32,342 |
|
5,048 |
|
2,138 |
|
39,528 |
|
|
Depreciation |
|
6,394 |
|
1,357 |
|
680 |
|
8,431 |
|
|
Impairment |
|
13,491 |
|
1,148 |
|
430 |
|
15,069 |
|
|
Disposals |
|
— |
|
(105) |
|
— |
|
(105) |
|
|
Cumulative translation adjustment |
|
(931) |
|
(102) |
|
(32) |
|
(1,065) |
|
|
Balance, February 3, 2018 |
|
51,296 |
|
7,346 |
|
3,216 |
|
61,858 |
|
|
|
|
|
|
|
|
|
|
|
|
|
Net Carrying Value |
|
|
|
|
|
|
|
|
|
|
Balance, January 28, 2017 |
|
43,213 |
|
6,137 |
|
1,810 |
|
51,160 |
|
|
Balance, February 3, 2018 |
|
29,337 |
|
5,293 |
|
1,928 |
|
36,558 |
|
For the year ended February 3, 2018, an assessment of impairment indicators was performed which caused the Company to review the recoverable amount of the property and equipment for certain CGUs with an indication of impairment. CGUs reviewed included stores performing below the Company’s expectations. As a result, an impairment loss of $15,935 [January 28, 2017 — $7,516; January 30, 2016 — nil] related to store leasehold improvements, furniture and equipment, and computer hardware was recorded in the Canada and U.S. segments for $5,114 and $10,821, respectively [January 28, 2017 —$1,116 and $6,400, respectively; January 30, 2016 — nil and nil, respectively]. These losses were determined by comparing the carrying amount of the CGU’s net assets with their respective recoverable amounts based on value in use. Value in use of $1,097 [January 28, 2017 —$472; January 30, 2016 —nil] was determined based on management’s best estimate of expected future cash flows from use over the remaining lease terms, considering historical experience as well as current economic conditions, and was then discounted using a pre‑tax discount rate of 11.9% [January 28, 2017 — 13.4%; January 30, 2016 — 13.4%]. A reversal of impairment occurs when previously impaired CGUs see improved financial results. For the year ended February 3, 2018, $866 of impairment losses were reversed following a change in the expected future cash flows of certain CGUs in the U.S. segment [January 28, 2017 — nil; January 30, 2016 — nil]. Value in use of $848 for these CGU’s was determined in the same manner as described above. Impairment losses were reversed only to the extent that the carrying amounts of the CGU’s net assets do not exceed the carrying amount that would have been determined, net of depreciation, if no impairment loss had been recognized.
For the year ended February 3, 2018, the depreciation expense was $8,431 [January 28, 2017 —$8,069 ; January 30, 2016 — $5,832]; with $6,387 recorded in the Canada segment [January 28, 2017 — $5,583; January 30, 2016 — $4,384], $1,508 recorded in the U.S. segment [January 28, 2017 — $1,930; January 30, 2016 — $1,080], and $536 recorded in corporate selling, general and administration expenses [January 28, 2017 — $556; January 30, 2016 — $368]. Depreciation expense and net impairment losses are
60
reported in the consolidated statement of income (loss) and comprehensive income (loss) under selling, general and administration expenses (Note 20).
9. INTANGIBLE ASSETS
|
|
|
Computer |
|
|
|
|
|
|
|
|
software |
|
Other |
|
Total |
|
|
|
|
$ |
|
$ |
|
$ |
|
|
Cost |
|
|
|
|
|
|
|
|
Balance, January 30, 2016 |
|
4,856 |
|
275 |
|
5,131 |
|
|
Acquisitions |
|
1,468 |
|
16 |
|
1,484 |
|
|
Cumulative translation adjustment |
|
(3) |
|
(12) |
|
(15) |
|
|
Balance, January 28, 2017 |
|
6,321 |
|
279 |
|
6,600 |
|
|
Acquisitions |
|
2,962 |
|
— |
|
2,962 |
|
|
Cumulative translation adjustment |
|
(4) |
|
(10) |
|
(14) |
|
|
Balance, February 3, 2018 |
|
9,279 |
|
269 |
|
9,548 |
|
|
|
|
|
|
|
|
|
|
|
Accumulated amortization |
|
|
|
|
|
|
|
|
Balance, January 30, 2016 |
|
2,828 |
|
61 |
|
2,889 |
|
|
Amortization |
|
739 |
|
19 |
|
758 |
|
|
Cumulative translation adjustment |
|
(2) |
|
(3) |
|
(5) |
|
|
Balance, January 28, 2017 |
|
3,565 |
|
77 |
|
3,642 |
|
|
Amortization |
|
1,456 |
|
18 |
|
1,474 |
|
|
Cumulative translation adjustment |
|
(2) |
|
(5) |
|
(7) |
|
|
Balance, February 3, 2018 |
|
5,019 |
|
90 |
|
5,109 |
|
|
|
|
|
|
|
|
|
|
|
Net Carrying Value |
|
|
|
|
|
|
|
|
Balance, January 28, 2017 |
|
2,756 |
|
202 |
|
2,958 |
|
|
Balance, February 3, 2018 |
|
4,260 |
|
179 |
|
4,439 |
|
Amortization expense is reported in the consolidated statement of income (loss) under selling, general and administration expenses (Note 20).
10. TRADE AND OTHER PAYABLES
|
|
|
February 3, |
|
January 28, |
|
|
|
|
2018 |
|
2017 |
|
|
|
|
$ |
|
$ |
|
|
Trade payable and accrued liabilities |
|
11,221 |
|
13,990 |
|
|
Government remittances |
|
186 |
|
1,860 |
|
|
Wages, salaries and employee benefits payable |
|
2,985 |
|
3,831 |
|
|
|
|
14,392 |
|
19,681 |
|
11. DEFERRED REVENUE
|
|
|
February 3, |
|
January 28, |
|
|
|
|
2018 |
|
2017 |
|
|
|
|
$ |
|
$ |
|
|
Gift cards liability |
|
3,982 |
|
3,263 |
|
|
Loyalty program liability |
|
1,204 |
|
1,622 |
|
|
|
|
5,186 |
|
4,885 |
|
During the year, the Company recorded gift card breakage income of $575 [January 28, 2017 - $850]. Gift card breakage is included in sales in the consolidated statement of income (loss).
61
12. PROVISIONS
|
|
|
For the year ended |
|
|
|
February 3, |
|
|
|
2018 |
|
|
|
$ |
|
Opening balance |
|
8,494 |
|
Utilization |
|
(2,467) |
|
Additions |
|
14,073 |
|
Reversals |
|
(3,752) |
|
Settlements |
|
(132) |
|
Accretion expense |
|
2,292 |
|
Cumulative translation adjustment |
|
(355) |
|
Ending balance |
|
18,153 |
|
Less: Current portion |
|
(4,693) |
|
Long-term portion of provisions |
|
13,460 |
Provisions for onerous contracts have been recognized in respect of store leases where the unavoidable costs of meeting the obligations under the lease agreements exceed the economic benefits expected to be received from the contract. The unavoidable costs reflect the present value of the lower of the expected cost of terminating the contract and the expected net cost of operating under the contract. For the year ended February 3, 2018, additions to the onerous provisions were recorded in the amount of $14,073, while the provisions for other stores were fully or partially reversed by $3,752.
13. COMMITMENTS AND CONTINGENCIES
Operating lease commitments
The commercial premises at which the Company carries out its retail operations, its head office and its primary warehouse location are leased from third parties. These rental contracts are classified as operating leases since there is no transfer of risks and rewards inherent to ownership.
These leases have varying terms and renewal rights. In many cases, the amounts payable to the lessor include a fixed rental payment as well as a percentage of sales obtained by the Company in the leased premises. Many leases include escalating rental payments, whereby cash outflows increase over the lease term. Free rental periods are also sometimes included.
The minimum rentals payable under long‑term operating leases are exclusive of certain operating costs for which the Company is responsible. For the year ended February 3, 2018, the Company has recognized in income (loss) contingent rent amounting to $1,742 [January 28, 2017 — $2,312; January 30, 2016 — $1,829] and accrued for a contingent rent liability of $725 [January 28, 2017 —$1,001].
Included in the cost of sales and selling, general and administration expenses for the year ended February 3, 2018 is rent expense of $31,565 [January 28, 2017 — $29,173; January 30, 2016 — $22,679].
The following is a schedule of future minimum lease payments under operating leases:
|
|
|
February 3, |
|
January 28, |
|
|
|
|
2018 |
|
2017 |
|
|
|
|
$ |
|
$ |
|
|
Within one year |
|
19,840 |
|
19,306 |
|
|
After one year but not more than five years |
|
86,844 |
|
90,891 |
|
|
More than five years |
|
28,281 |
|
38,239 |
|
|
|
|
134,965 |
|
148,436 |
|
14. REVOLVING FACILITY
The Company has a credit agreement (the “Credit Agreement”) with the Bank of Montreal (“BMO”). The Credit Agreement provides for a three-year revolving term facility, maturing October 31, 2019, in the principal amount of $20,000 (which the Company refers to as the “Revolving Facility”) or the equivalent amount in U.S. Dollars, repayable at any time. The Credit Agreement also
62
provides for an accordion feature whereby the Company may, at any time prior to the end of the three-year term and with permission from BMO, request an increase to the Revolving Facility by an amount not greater than $10,000. As at February 3, 2018 and January 28, 2017, the Company did not have any borrowings on the Revolving Facility.
The Credit Agreement subjects the Company to certain financial covenants. Without the prior written consent of BMO, the Company’s fixed charge coverage ratio may not be less than 1.25:1.00 and the Company’s leverage ratio may not exceed 3.00:1.00. In addition, the Company’s net tangible worth may not be less than $30,000. Borrowings under the Revolving Facility are available in the form of Canadian dollar advances, U.S. dollar advances, prime rate loans, banker’s acceptances, U.S. base rate loans and LIBOR loans. Further, up to an aggregate maximum amount of $2,000, or the equivalent amount in other currencies authorized by BMO, is available by way of letters of credit or letters of guarantees for terms of not more than 364 days. The Revolving Facility bears interest based on the Company’s adjusted leverage ratio. In the event the Company’s adjusted leverage ratio is equal to or less than 3.00:1.00, the Revolving Facility bears interest at (a) the bank’s prime rate plus 0.50% per annum, (b) the bank’s U.S. base rate plus 0.50% per annum, (c) LIBOR plus 1.50% per annum, subject to availability, or (d) 1.50% on the face amount of each banker’s acceptance, letter of credit or letter of guarantee, as applicable. A standby fee of 0.30% will be paid on the daily principal amount of the unused portion of the Revolving Facility. Should the Company’s adjusted leverage ratio be greater than 3.00:1.00 but less than 4.00:1.00, the Revolving Facility bears interest at (a) the bank’s prime rate plus 0.75% per annum, (b) the bank’s U.S. base rate plus 0.75% per annum, (c) LIBOR plus 1.75% per annum, subject to availability, or (d) 1.75% on the face amount of each banker’s acceptance, letter of credit or letter of guarantee, as applicable. A standby fee of 0.35% will be paid on the daily principal amount of the unused portion of the Revolving Facility. If the Company’s adjusted leverage ratio is greater than 4.00:1.00, the Revolving Facility bears interest at (a) the bank’s prime rate plus 1.25% per annum, (b) the bank’s U.S. base rate plus 1.25% per annum, (c) LIBOR plus 2.25% per annum, subject to availability, or (d) 2.25% on the face amount of each banker’s acceptance, letter of credit or letter of guarantee, as applicable. A standby fee of 0.45% will be paid on the daily principal amount of the unused portion of the Revolving Facility. As at February 3, 2018, the bank’s prime rate was 3.45% [January 28, 2017 — 2.70%] and the bank’s U.S base rate was 5.00% [January 28, 2017 — 4.50%].
The Credit Agreement is collateralized by a first lien security interest in all of the Company’s assets in the amount of $37,500, a general security agreement, registered in each Canadian province in which the Company does business, creating a first priority charge on all assets. The Revolving Facility contains a number of covenants that, among other things and subject to certain exceptions, restrict the Company’s ability to become guarantor or endorser or otherwise become liable upon any note or other obligation other than in the normal course of business. The Company also cannot make any dividend payments. As at February 3, 2018, the Company is in compliance with these covenants.
15. LOAN FROM THE CONTROLLING SHAREHOLDER
On June 11, 2015, immediately following the Company’s IPO, the advances under the loan from the controlling shareholder were fully repaid using proceeds from the IPO and cash on hand. As at February 3, 2018, the Company did not have any borrowings from the controlling shareholder [January 28, 2017 — nil].
16. MANDATORILY REDEEMABLE PREFERENCE SHARES
Prior to the Company’s IPO on June 10, 2015, the Series A, A-1, and A-2 redeemable preferred shares liability was being accreted to their nominal value and the financial derivative liability embedded in the preferred shares was being measured at fair value with all changes recognized immediately in income (loss). For the year ended January 30, 2016, the accretion on preferred shares was $401 and the changes in the carrying value of the financial derivative liability embedded in preferred shares amounted to $140,874. The amounts were recorded as a loss in the consolidated statement of income (loss) for the year ended January 30, 2016.
63
17. SHARE CAPITAL
Authorized
A unlimited number of common shares.
|
|
|
|
|
|
|
|
Common |
|
|
|
|
shares |
|
|
|
|
# |
|
|
Number of shares in issuance |
|
|
|
|
Balance, January 30, 2016 |
|
24,037,472 |
|
|
Issuance of common shares upon exercise of options |
|
1,236,154 |
|
|
Issuance of common shares upon vesting of restricted stock units |
|
57,325 |
|
|
Balance, January 28, 2017 |
|
25,330,951 |
|
|
Issuance of common shares upon exercise of options |
|
456,773 |
|
|
Issuance of common shares upon vesting of restricted stock units |
|
97,648 |
|
|
Balance, February 3, 2018 |
|
25,885,372 |
|
Issued and outstanding
|
|
|
February 3, |
|
January 28, |
|
|
|
2018 |
|
2017 |
|
|
|
$ |
|
$ |
|
25,885,372 Common shares [January 28, 2017 - 25,330,951 shares] |
|
111,692 |
|
263,828 |
|
|
|
111,692 |
|
263,828 |
In June 2017, the shareholders of the Company approved a resolution to reduce the stated capital maintained in respect of the common shares by an amount of $155,947, which resulted in a corresponding reduction of the deficit.
During the year ended February 3, 2018, 456,773 stock options were exercised for common shares, for cash proceeds of $1,782 [January 28, 2017 — 1,236,154 stock options for cash proceeds of $2,779]. The carrying value of common shares during the year ended February 3, 2018 includes $887 which corresponds to a reduction in the contributed surplus associated to options exercised during the period.
In addition, during the year ended February 3, 2018, 97,648 common shares [January 28, 2017 —57,325] were issued in relation to the vesting of restricted stock units (“RSU”), resulting in an increase in share capital of $1,142, net of tax [January 28, 2017 —$448].
Stock‑based compensation
The 2015 Omnibus Plan provides for awards of stock options, stock appreciation rights (“SARs”), restricted stock, unrestricted stock, stock units (including restricted stock units, “RSUs”), performance awards, deferred share units, elective deferred share units and other awards convertible into or otherwise based on the Company’s common shares. Eligibility for stock options intended to be incentive stock options (“ISOs”) is limited to the Company’s employees. Dividend equivalents may also be provided in connection with an award under the 2015 Omnibus Plan. The maximum term of stock options and SARs is seven years. The options vest evenly over a period of 36 or 48 months, with some options vesting monthly and some options vesting annually. There are no cash settlement alternatives.
The maximum number of the Company’s common shares that are available for issuance under the 2015 Omnibus Plan is 1,440,000 shares. Common shares issued under the 2015 Omnibus Plan may be shares held in treasury or authorized but unissued shares of the Company not reserved for any other purpose. As at February 3, 2018, 770,827 common shares remain available for issuance under the 2015 Omnibus Plan.
64
The weighted average fair value of options granted of $2.39 for the year ended February 3, 2018 [January 28, 2017 — $3.72] was estimated using the Black Scholes option pricing model, using the following assumptions:
|
|
|
For the year ended |
||||||
|
|
|
February 3, |
|
January 28, |
||||
|
|
|
2018 |
|
2017 |
||||
|
Risk-free interest rate |
|
|
1.79 |
% |
|
|
1.23 |
% |
|
Expected volatility |
|
|
27.4 |
% |
|
|
29.8 |
% |
|
Expected option life |
|
|
4.0 |
years |
|
|
4.0 |
years |
|
Expected dividend yield |
|
|
0 |
% |
|
|
0 |
% |
|
Exercise price |
|
$ |
9.76 |
|
|
$ |
14.67 |
|
Expected volatility was estimated using historical volatility of similar companies whose share prices were publicly available.
A summary of the status of the Company’s stock option plan and changes during the year is presented below.
|
|
|
For the year ended |
||||||
|
|
|
February 3, |
|
January 28, |
||||
|
|
|
2018 |
|
2017 |
||||
|
|
|
|
|
Weighted |
|
|
|
Weighted |
|
|
|
|
|
average |
|
|
|
average |
|
|
|
Options |
|
exercise |
|
Options |
|
exercise |
|
|
|
outstanding |
|
price |
|
outstanding |
|
price |
|
|
|
# |
|
$ |
|
# |
|
$ |
|
Outstanding, beginning of year |
|
933,195 |
|
5.63 |
|
2,146,880 |
|
3.04 |
|
Issued |
|
161,980 |
|
9.76 |
|
174,031 |
|
14.67 |
|
Exercised |
|
(456,773) |
|
3.90 |
|
(1,236,154) |
|
2.25 |
|
Forfeitures |
|
(190,623) |
|
9.63 |
|
(151,562) |
|
6.99 |
|
Outstanding, end of year |
|
447,779 |
|
7.18 |
|
933,195 |
|
5.63 |
|
Exercisable, end of year |
|
304,415 |
|
5.57 |
|
624,813 |
|
4.69 |
The weighted average share price at the date of exercise for options exercised during the year ended February 3, 2018 was $8.51 [January 28, 2017 — $14.24].
The following table summarizes information about the stock options outstanding at February 3, 2018 and January 28, 2017:
|
|
|
|
|
|
|
|
|
|
|
|
|
|
|
|
|
|
|
|
|
|
|
|
|
|
|
|
|
|
|
Weighted |
|
|
|
Number of |
|
|
|
|
|
|
Number |
|
average |
|
Weighted |
|
options |
|
Weighted |
|
|
|
|
outstanding at |
|
contractual |
|
average |
|
exercisable at |
|
average |
|
|
|
|
February 3, |
|
remaining |
|
exercise |
|
February 3, |
|
exercise |
|
|
|
|
2018 |
|
life |
|
price |
|
2018 |
|
price |
|
|
Range of exercise prices |
|
# |
|
(years) |
|
$ |
|
# |
|
$ |
|
|
$0.77 |
|
50,600 |
|
2.3 |
|
0.77 |
|
50,600 |
|
0.77 |
|
|
$3.33 - $4.31 |
|
172,396 |
|
3.7 |
|
3.91 |
|
161,395 |
|
3.89 |
|
|
$8.76 - $10.28 |
|
161,980 |
|
6.4 |
|
9.76 |
|
55,530 |
|
8.76 |
|
|
$14.39 - $17.99 |
|
62,803 |
|
4.3 |
|
14.68 |
|
36,890 |
|
14.72 |
|
|
As at February 3, 2018 |
|
447,779 |
|
4.6 |
|
7.18 |
|
304,415 |
|
5.57 |
|
|
|
|
|
|
|
|
|
|
|
|
|
|
|
|
|
|
|
|
|
|
|
|
|
|
|
|
|
|
|
|
Weighted |
|
|
|
Number of |
|
|
|
|
|
|
Number |
|
average |
|
Weighted |
|
options |
|
Weighted |
|
|
|
|
outstanding at |
|
contractual |
|
average |
|
exercisable at |
|
average |
|
|
|
|
January 28, |
|
remaining |
|
exercise |
|
January 28, |
|
exercise |
|
|
|
|
2017 |
|
life |
|
price |
|
2017 |
|
price |
|
|
Range of exercise prices |
|
# |
|
(years) |
|
$ |
|
# |
|
$ |
|
|
$0.77 |
|
97,600 |
|
3.1 |
|
0.77 |
|
39,600 |
|
0.77 |
|
|
$3.33 - $4.31 |
|
671,804 |
|
4.4 |
|
4.10 |
|
537,203 |
|
4.08 |
|
|
$14.39 - $17.99 |
|
163,791 |
|
4.6 |
|
14.78 |
|
48,010 |
|
15 |
|
|
As at January 28, 2017 |
|
933,195 |
|
4.3 |
|
5.63 |
|
624,813 |
|
4.69 |
|
65
A summary of the status of the Company’s RSU plan and changes during the year ended February 3, 2018 is presented below.
|
|
|
For the year ended |
|
||||||
|
|
|
February 3, |
|
January 28, |
|
||||
|
|
|
2018 |
|
2017 |
|
||||
|
|
|
|
|
Weighted |
|
|
|
Weighted |
|
|
|
|
|
|
average |
|
|
|
average |
|
|
|
|
RSUs |
|
fair value |
|
RSUs |
|
fair value |
|
|
|
|
outstanding |
|
per unit (1) |
|
outstanding |
|
per unit (1) |
|
|
|
|
# |
|
$ |
|
# |
|
$ |
|
|
Outstanding, beginning of year |
|
252,233 |
|
12.42 |
|
252,720 |
|
7.39 |
|
|
Granted |
|
298,897 |
|
8.59 |
|
194,855 |
|
15.11 |
|
|
Forfeitures |
|
(89,035) |
|
10.03 |
|
(78,184) |
|
9.68 |
|
|
Vested |
|
(97,648) |
|
11.85 |
|
(57,325) |
|
7.82 |
|
|
Vested, withheld for tax |
|
(75,031) |
|
11.28 |
|
(59,833) |
|
7.90 |
|
|
Outstanding, end of year |
|
289,416 |
|
9.70 |
|
252,233 |
|
12.42 |
|
|
(1) |
Weighted average fair value per unit as at date of grant. |
During the year ended February 3, 2018, the Company recognized a stock-based compensation expense of $2,021 [January 28, 2017 — $2,264; January 30, 2016 — $1,749].
18. FINANCE COSTS
|
|
|
February 3, |
|
January 28, |
|
January 30, |
|
|
|
|
2018 |
|
2017 |
|
2016 |
|
|
|
|
$ |
|
$ |
|
$ |
|
|
Interest on loan from the controlling shareholder [note 15] |
|
— |
|
— |
|
48 |
|
|
Interest and financing fees on term loan and Revolving Facility [note 14] |
|
79 |
|
75 |
|
544 |
|
|
Interest on finance lease |
|
— |
|
— |
|
19 |
|
|
Accrued dividends on preferred shares — Series A, A-1 and A-2 [note 16] |
|
— |
|
— |
|
438 |
|
|
Other finance costs |
|
— |
|
1 |
|
2 |
|
|
Accretion on provisions |
|
2,292 |
|
— |
|
— |
|
|
|
|
2,371 |
|
76 |
|
1,051 |
|
66
19. INCOME TAXES
A reconciliation of the statutory income tax rate to the effective tax rate is as follows:
|
|
|
For the year ended |
||||||||||
|
|
|
February 3, |
|
January 28, |
|
January 30, |
||||||
|
|
|
2018 |
|
2017 |
|
2016 |
||||||
|
|
|
% |
|
$ |
|
% |
|
$ |
|
% |
|
$ |
|
Income tax recovery — statutory rate |
|
26.8 |
|
(7,097) |
|
26.5 |
|
(1,564) |
|
26.5 |
|
(34,729) |
|
Increase (decrease) in provision for income tax (recovery) resulting from: |
|
|
|
|
|
|
|
|
|
|
|
|
|
Non-deductible items |
|
(1.6) |
|
437 |
|
(10.1) |
|
598 |
|
— |
|
— |
|
Loss from embedded derivative and accretion of Series A, A-1, and A-2 preferred shares |
|
— |
|
— |
|
— |
|
— |
|
(28.7) |
|
37,506 |
|
Stock based compensation |
|
— |
|
— |
|
— |
|
— |
|
(0.6) |
|
769 |
|
Effect of substantively enacted income tax rate changes |
|
(7.9) |
|
2,090 |
|
— |
|
— |
|
— |
|
— |
|
Unrecognized deferred income tax assets |
|
(16.7) |
|
4,415 |
|
— |
|
— |
|
|
|
|
|
Write-down of deferred income tax assets |
|
(7.8) |
|
2,054 |
|
— |
|
— |
|
|
|
|
|
Other |
|
(0.4) |
|
111 |
|
21.5 |
|
(1,269) |
|
(0.9) |
|
1,122 |
|
Income tax provision (recovery) — effective tax rate |
|
(7.6) |
|
2,010 |
|
37.9 |
|
(2,235) |
|
(3.7) |
|
4,668 |
A breakdown of the income tax provision (recovery) on the consolidated income statement is as follows:
|
|
|
For the year ended |
||||
|
|
|
February 3, |
|
January 28, |
|
January 30, |
|
|
|
2018 |
|
2017 |
|
2016 |
|
|
|
$ |
|
$ |
|
$ |
|
Income tax provision (recovery) |
|
|
|
|
|
|
|
Current |
|
(1,575) |
|
2,145 |
|
3,304 |
|
Deferred |
|
3,585 |
|
(4,380) |
|
1,364 |
|
|
|
2,010 |
|
(2,235) |
|
4,668 |
On December 22, 2017, the Tax Cuts and Jobs Act (“U.S. Tax Reform”) was signed into law, which reduced the U.S. federal corporate income tax rate from 35% to 21%, effective January 1, 2018. As a result of the U.S. Tax Reform, The Company’s net deferred taxes reported on the balance sheet were required to be re-measured using the newly enacted rates. The effect of this re-evaluation resulted in a decrease in the net deferred tax assets in the amount of $4,892.
The U.S. Tax Reform introduces other important changes in the U.S. corporate income tax laws that may significantly affect the Company in future years, including the creation of a new Base Erosion Anti-Abuse Tax that subjects certain payments from U.S. corporations to foreign related parties to additional taxes, and limitations to certain deductions for net interest expense incurred by U.S. corporations. The U.S. Tax Reform also includes an increase in bonus depreciation from 50% to 100% for qualified property placed in service after September 27, 2017 and before 2023. Future regulations and interpretations to be issued by U.S. authorities may also impact the Company’s estimates and assumptions used in calculating its income tax provisions.
67
The tax effects of temporary differences and net operating losses that give rise to deferred income tax assets and liabilities are as follows:
|
|
|
February 3, |
|
January 28, |
|
|
|
|
2018 |
|
2017 |
|
|
|
|
$ |
|
$ |
|
|
Deferred income tax assets |
|
|
|
|
|
|
U.S. operating losses carried forward |
|
1,259 |
|
2,439 |
|
|
Deferred rent |
|
1,662 |
|
1,885 |
|
|
Stock options |
|
3,401 |
|
5,647 |
|
|
Financing fees and IPO-related costs |
|
1,197 |
|
1,801 |
|
|
Lease inducements |
|
515 |
|
664 |
|
|
Provisions |
|
4,812 |
|
3,365 |
|
|
Others |
|
2,346 |
|
1,175 |
|
|
Total deferred income tax assets |
|
15,192 |
|
16,976 |
|
|
Deferred income tax liabilities |
|
|
|
|
|
|
Carrying values of property and equipment in excess of tax basis |
|
(158) |
|
(2,171) |
|
|
Unrealized foreign exchange gain on derivative financial instruments |
|
62 |
|
(121) |
|
|
Unrecognized deferred income tax asset |
|
(9,789) |
|
— |
|
|
Unrealized foreign exchange gain related to intercompany advances |
|
(113) |
|
(309) |
|
|
Total deferred income tax liabilities |
|
(9,998) |
|
(2,601) |
|
|
Net deferred income tax assets (liabilities) |
|
5,194 |
|
14,375 |
|
As at February 3, 2018, the Company’s U.S. subsidiary has accumulated losses amounting to US$14.2 million [January 28, 2017 — US$14.9 million; January 30, 2016 — US$9.7 million], which expire during the years 2033 to 2038. Based upon the projections for future taxable income and prudent tax planning strategies, management believes it is no longer probable the Company will realize the benefits of these operating tax losses carried forward. Therefore, a portion of its deferred income tax assets was not recognized this year. See Note 5 for how the Company determines the extent to which the deferred income tax assets are recognized.
The changes in the net deferred income tax asset were as follows for the fiscal years:
|
|
|
February 3, |
|
January 28, |
|
|
|
|
2018 |
|
2017 |
|
|
|
|
$ |
|
$ |
|
|
Balance net, beginning of year |
|
14,375 |
|
7,877 |
|
|
Deferred rent |
|
(222) |
|
385 |
|
|
Recognition of U.S. operating losses carried forward |
|
(1,180) |
|
(1,340) |
|
|
Carrying value of property and equipment in excess of tax losses |
|
2,013 |
|
554 |
|
|
Stock options |
|
(2,245) |
|
1,493 |
|
|
Financing fees and IPO-related costs |
|
(604) |
|
(664) |
|
|
Foreign exchange gain on derivative financial instrument |
|
183 |
|
793 |
|
|
Unrealized foreign exchange gain on intercompany advances |
|
196 |
|
668 |
|
|
Lease inducement |
|
(149) |
|
437 |
|
|
Unrecognized deferred income tax asset |
|
(9,789) |
|
— |
|
|
Provisions |
|
1,447 |
|
3,090 |
|
|
Others |
|
1,169 |
|
1,082 |
|
|
Deferred income tax assets net, end of year |
|
5,194 |
|
14,375 |
|
68
20. SELLING, GENERAL AND ADMINISTRATION EXPENSES
Included in selling, general and administration expenses are the following expenses:
|
|
|
For the year ended |
||||
|
|
|
February 3, |
|
January 28, |
|
January 30, |
|
|
|
2018 |
|
2017 |
|
2016 |
|
|
|
$ |
|
$ |
|
$ |
|
Wages, salaries and employee benefits |
|
65,888 |
|
61,143 |
|
50,671 |
|
Depreciation of property and equipment |
|
8,431 |
|
8,069 |
|
5,832 |
|
Amortization of intangible assets |
|
1,474 |
|
758 |
|
613 |
|
Loss on disposal of property and equipment |
|
82 |
|
356 |
|
297 |
|
Impairment of property and equipment |
|
15,069 |
|
7,516 |
|
— |
|
Provision (recovery) for onerous contracts |
|
10,321 |
|
8,140 |
|
(265) |
|
Stock-based compensation |
|
2,021 |
|
2,264 |
|
1,749 |
|
Executive and employee separation costs related to salary |
|
2,033 |
|
835 |
|
— |
|
Other selling, general and administration |
|
26,611 |
|
25,675 |
|
21,219 |
|
|
|
131,930 |
|
114,756 |
|
80,116 |
21. EARNINGS PER SHARE
Basic earnings per share (“EPS”) amounts are calculated by dividing the net income (loss) for the year attributable to ordinary equity holders by the weighted average number of ordinary shares outstanding during the year. Diluted EPS amounts are calculated by dividing the net income (loss) attributable to ordinary equity holders (after adjusting for dividends, accretion interest on the mandatorily redeemable preference shares and gain/loss from embedded derivative on preferred shares) by the weighted average number of ordinary shares outstanding during the year plus the weighted average number of ordinary shares that would be issued on conversion of all the dilutive potential ordinary shares into ordinary shares, unless these would be anti‑dilutive.
The following reflects the income and share data used in the basic and diluted EPS computations:
|
|
|
February 3, |
|
January 28, |
|
January 30, |
|
|
|
2018 |
|
2017 |
|
2016 |
|
|
|
$ |
|
$ |
|
$ |
|
Net loss for basic EPS |
|
(28,501) |
|
(3,688) |
|
(131,431) |
|
|
|
|
|
|
|
|
|
Weighted average number of shares outstanding — basic and diluted |
|
25,716,186 |
|
24,699,290 |
|
19,776,946 |
For the years ended February 3, 2018, January 28, 2017, and January 30, 2016, as a result of the net loss during the year, the stock options and RSUs disclosed in Note 17 are anti‑dilutive.
22. RELATED PARTY DISCLOSURES
During the year ended February 3, 2018, the Company purchased merchandise from a company controlled by one of its executive employees amounting to $87 [January 28, 2017 — nil; January 30, 2016 — nil].
During the year ended January 30, 2016, interest was incurred on the loan from the controlling shareholder amounting to $48, of which $48 was paid on June 11, 2015. In addition, dividends on Series A, A-1 and A-2 preferred shares were accrued for $438. On June 11, 2015, immediately following the Company’s IPO, the advances under the loan from the controlling shareholder were fully repaid using the proceeds from the IPO and cash on hand, and the Series A, A-1 and A-2 preferred shares were converted into common shares.
The transactions referred to above are measured at the exchange amount, being the consideration established and agreed to by the related parties.
69
Transactions with key management personnel
Key management of the Company includes members of the Board as well as members of the Executive Committee. The compensation earned by key management in aggregate was as follows:
|
|
|
February 3, |
|
January 28, |
|
January 30, |
|
|
|
|
2018 |
|
2017 |
|
2016 |
|
|
|
|
$ |
|
$ |
|
$ |
|
|
|
|
|
|
|
|
|
|
|
Wages, salaries and bonus |
|
3,255 |
|
2,741 |
|
3,600 |
|
|
Termination benefits |
|
1,485 |
|
719 |
|
— |
|
|
Stock-based compensation |
|
1,035 |
|
1,377 |
|
1,177 |
|
|
Total compensation earned by key management personnel |
|
5,775 |
|
4,837 |
|
4,777 |
|
23. SEGMENT INFORMATION
An operating segment is a component of the Company that engages in business activities from which it may earn revenues and incur expenses. The Company has reviewed its operations and determined that each of its retail stores represents an operating segment. However, because its retail stores have similar economic characteristics, sell similar products, have similar types of customers, and use similar distribution channels, the Company has determined that these operating segments can be aggregated at a geographic level. As a result, the Company has concluded that it has two reportable segments, Canada and the U.S., that derive their revenues from the retail and online sale of tea, tea accessories and food and beverages. The Company’s Chief Executive Officer (the chief operating decision maker or “CODM”) makes decisions about resources to be allocated to the segments and assesses performance, and for which discrete financial information is available.
The Company derives revenue from the following products:
|
|
|
February 3, |
|
January 28, |
|
January 30, |
|
|
|
2018 |
|
2017 |
|
2016 |
|
|
|
$ |
|
$ |
|
$ |
|
Tea |
|
156,125 |
|
143,280 |
|
120,022 |
|
Tea accessories |
|
49,470 |
|
53,807 |
|
43,191 |
|
Food and beverages |
|
18,420 |
|
18,897 |
|
17,477 |
|
|
|
224,015 |
|
215,984 |
|
180,690 |
Property and equipment and intangible assets by country are as follows:
|
|
|
February 3, |
|
January 28, |
|
January 30, |
|
|
|
2018 |
|
2017 |
|
2016 |
|
|
|
$ |
|
$ |
|
$ |
|
Canada |
|
37,234 |
|
41,432 |
|
35,915 |
|
US |
|
3,763 |
|
12,686 |
|
13,657 |
|
Total |
|
40,997 |
|
54,118 |
|
49,572 |
During the fourth quarter, the Company changed the measure of profit used by the CODM in measuring performance. Management believes that the new measure, being results from operating activities before corporate expenses by country, excluding intercompany profit, is the most relevant in evaluating results. The Company has retroactively revised the results by segment for the
70
years ended January 28, 2017 and January 30, 2016. Results from operating activities before corporate expenses per country are as follows:
|
|
|
For the year ended |
||||
|
|
|
February 3, 2018 |
||||
|
|
|
Canada |
|
US |
|
Consolidated |
|
|
|
$ |
|
$ |
|
$ |
|
Sales |
|
185,287 |
|
38,728 |
|
224,015 |
|
Cost of sales |
|
93,383 |
|
23,389 |
|
116,772 |
|
Gross profit |
|
91,904 |
|
15,339 |
|
107,243 |
|
Selling, general and administration expenses (allocated) |
|
54,884 |
|
18,302 |
|
73,186 |
|
Impairment of property and equipment |
|
5,114 |
|
9,955 |
|
15,069 |
|
Provision for onerous contracts |
|
1,752 |
|
6,102 |
|
7,854 |
|
Results from operating activities before corporate expenses |
|
30,154 |
|
(19,020) |
|
11,134 |
|
Selling, general and administration expenses (non-allocated) |
|
|
|
|
|
35,821 |
|
Results from operating activities |
|
|
|
|
|
(24,687) |
|
Finance costs |
|
|
|
|
|
2,371 |
|
Finance income |
|
|
|
|
|
(567) |
|
Loss before income taxes |
|
|
|
|
|
(26,491) |
|
|
|
For the year ended |
||||
|
|
|
January 28, 2017 |
||||
|
|
|
Canada |
|
US |
|
Consolidated |
|
|
|
$ |
|
$ |
|
$ |
|
Sales |
|
180,380 |
|
35,604 |
|
215,984 |
|
Cost of sales |
|
86,473 |
|
21,061 |
|
107,534 |
|
Gross profit |
|
93,907 |
|
14,543 |
|
108,450 |
|
Selling, general and administration expenses (allocated) |
|
49,466 |
|
16,584 |
|
66,050 |
|
Impairment of property and equipment |
|
1,116 |
|
6,400 |
|
7,516 |
|
Provision for onerous contracts |
|
427 |
|
7,713 |
|
8,140 |
|
Results from operating activities before corporate expenses |
|
42,898 |
|
(16,154) |
|
26,744 |
|
Selling, general and administration expenses (non-allocated) |
|
|
|
|
|
33,050 |
|
Results from operating activities |
|
|
|
|
|
(6,306) |
|
Finance costs |
|
|
|
|
|
76 |
|
Finance income |
|
|
|
|
|
(479) |
|
Loss before income taxes |
|
|
|
|
|
(5,903) |
|
|
|
For the year ended |
||||
|
|
|
January 30, 2016 |
||||
|
|
|
Canada |
|
US |
|
Consolidated |
|
|
|
$ |
|
$ |
|
$ |
|
Sales |
|
156,186 |
|
24,504 |
|
180,690 |
|
Cost of sales |
|
71,657 |
|
13,702 |
|
85,359 |
|
Gross profit |
|
84,529 |
|
10,802 |
|
95,331 |
|
Selling, general and administration expenses (allocated) |
|
41,174 |
|
11,405 |
|
52,579 |
|
Recovery for onerous contracts |
|
— |
|
(265) |
|
(265) |
|
Results from operating activities before corporate expenses |
|
43,355 |
|
(338) |
|
43,017 |
|
Selling, general and administration expenses (non-allocated) |
|
|
|
|
|
27,802 |
|
Results from operating activities |
|
|
|
|
|
15,215 |
|
Finance costs |
|
|
|
|
|
1,051 |
|
Finance income |
|
|
|
|
|
(348) |
|
Accretion of preferred shares |
|
|
|
|
|
401 |
|
Loss from embedded derivative on Series A, A-1 and A-2 Preferred Shares |
|
|
|
|
|
140,874 |
|
Loss before income taxes |
|
|
|
|
|
(126,763) |
71
24. FINANCIAL RISK MANAGEMENT
The Company’s activities expose it to a variety of financial risks, including risks related to foreign exchange, interest rate, credit, and liquidity.
Currency risk — foreign exchange risk
Currency risk is the risk that the fair value or future cash flows of a financial instrument will fluctuate because of changes in foreign exchange rates. Given that some of its purchases are denominated in U.S. dollars, the Company is exposed to foreign exchange risk. The Company’s foreign exchange risk is largely limited to currency fluctuations between the Canadian and U.S. dollars. The Company is exposed to currency risk through its cash, accounts receivable and accounts payable denominated in U.S. dollars.
Assuming that all other variables remain constant, a revaluation of these monetary assets and liabilities due to a 5% rise or fall in the Canadian dollar against the U.S. dollar would have resulted in an increase or decrease to net income (loss) in the amount of $201.
The Company’s foreign exchange exposure is as follows:
|
|
|
February 3, |
|
January 28, |
|
|
|
2018 |
|
2017 |
|
|
|
US$ |
|
US$ |
|
Cash |
|
5,686 |
|
690 |
|
Accounts receivable |
|
882 |
|
1,188 |
|
Accounts payable |
|
2,555 |
|
2,461 |
The Company’s U.S. subsidiary’s transactions are denominated in U.S. dollars.
In order to protect itself from the risk of losses should the value of the Canadian dollar decline in relation to the U.S. dollar, the Company has entered into forward contracts to fix the exchange rate of 80% to 90% of its expected U.S. dollar inventory purchasing requirements, through September 2018. A forward foreign exchange contract is a contractual agreement to buy a specific currency at a specific price and date in the future. The Company designated the forward contracts as cash flow hedging instruments under International Accounting Standard 39. This has resulted in mark-to-market foreign exchange adjustments, for qualifying hedged instruments, being recorded as a component of other comprehensive income (loss) for the years ended February 3, 2018 and January 28, 2017. As at February 3, 2018 and January 28, 2017, the designated portion of these hedges was considered effective.
The nominal and contract values of foreign exchange contracts outstanding as at February 3, 2018 are as follows:
|
|
|
|
|
|
|
|
|
|
|
|
|
|
|
Range of |
|
Nominal |
|
Nominal |
|
|
|
Unrealized |
|
|
|
Contractual |
|
value |
|
value |
|
|
|
gain/(loss) |
|
|
|
exchange rate |
|
US$ |
|
C$ |
|
Term |
|
C$ |
|
Purchase contracts |
|
|
|
|
|
|
|
|
|
|
|
U.S. dollar |
|
1.2221 - 1.3050 |
|
24,100 |
|
30,033 |
|
February 2018 to September 2018 |
|
(229) |
The nominal and contract values of foreign exchange contracts outstanding as at January 28, 2017 are as follows:
|
|
|
|
|
|
|
|
|
|
|
|
|
|
|
Range of |
|
Nominal |
|
Nominal |
|
|
|
Unrealized |
|
|
|
Contractual |
|
value |
|
value |
|
|
|
gain |
|
|
|
exchange rate |
|
US$ |
|
C$ |
|
Term |
|
C$ |
|
Purchase contracts |
|
|
|
|
|
|
|
|
|
|
|
U.S. dollar |
|
1.2696 - 1.3098 |
|
32,700 |
|
42,404 |
|
February 2017 to October 2017 |
|
454 |
Market risk — interest rate risk
Interest rate risk is the risk that the fair value of future cash flows of a financial instrument will fluctuate because of changes in market interest rates. Financial instruments that potentially subject the Company to cash flow interest rate risk include financial assets and liabilities with variable interest rates and consist of cash. The Company is exposed to cash flow risk on its Revolving Facility which bears interest at variable interest rates (see Note 14). As at February 3, 2018, the Company did not have any borrowings on the Revolving Facility.
72
Liquidity risk
Liquidity risk is the risk that the Company will encounter difficulty in meeting obligations associated with financial liabilities. The Company’s approach to managing liquidity risk is to ensure, to the extent possible, that it will always have sufficient liquidity to meet liabilities when due. The Company’s liquidity follows a seasonal pattern based on the timing of inventory purchases and capital expenditures. The Company is exposed to this risk mainly in respect of its trade and other payables.
As at February 3, 2018, the Company had $63,484 in cash. In addition, as outlined in Note 14, the Company has a Revolving Facility of $20,000, of which nil was drawn as at February 3, 2018. The Revolving Facility also provides for an accordion feature whereby the Company may, at any time prior to the end of the three-year term, and with the permission of BMO, request an increase to the Revolving Facility by an amount not greater than $10,000.
The Company expects to finance its growth in store base, store renovations, and investments in infrastructure through cash flows from operations, the Revolving Facility (Note 14) and cash on hand. The Company expects that its trade and other payables will be discharged within 90 days.
The following table summarizes the obligations as of February 3, 2018 and January 28, 2017, and the effect such obligations are expected to have on liquidity and cash flows in future periods.
|
|
|
February 3, 2018 |
|
||||||
|
|
|
Payments due by period |
|
||||||
|
|
|
|
|
less than |
|
Between |
|
More than |
|
|
|
|
Total |
|
1 year |
|
1 and 5 years |
|
5 years |
|
|
Trade and other payables |
|
14,392 |
|
14,392 |
|
— |
|
— |
|
|
Operating lease obligations |
|
134,965 |
|
19,840 |
|
86,844 |
|
28,281 |
|
|
Purchase obligations |
|
8,820 |
|
8,820 |
|
— |
|
— |
|
|
|
|
158,177 |
|
43,052 |
|
86,844 |
|
28,281 |
|
|
|
|
January 28, 2017 |
|
||||||
|
|
|
Payments due by period |
|
||||||
|
|
|
|
|
less than |
|
Between |
|
More than |
|
|
|
|
Total |
|
1 year |
|
1 and 5 years |
|
5 years |
|
|
Trade and other payables |
|
19,681 |
|
19,681 |
|
— |
|
— |
|
|
Operating lease obligations |
|
148,436 |
|
19,306 |
|
90,891 |
|
38,239 |
|
|
Purchase obligations |
|
5,842 |
|
5,842 |
|
— |
|
— |
|
|
|
|
173,959 |
|
44,829 |
|
90,891 |
|
38,239 |
|
Credit risk
The Company is exposed to credit risk resulting from the possibility that counterparties may default on their financial obligations to the Company. The Company’s maximum exposure to credit risk at the reporting date is equal to the carrying value of accounts receivable and derivative financial instruments. Accounts receivable primarily consists of receivables from retail customers who pay by credit card, recoveries of credits from suppliers for returned or damaged products, and receivables from other companies for sales of products, gift cards and other services. Credit card payments have minimal credit risk and the limited number of corporate receivables is closely monitored.
Fair values
Financial assets and financial liabilities are measured on an ongoing basis at fair value or amortized cost. The disclosures in the “Financial instruments” section of Note 3 describe how the categories of financial instruments are measured and how income and expenses, including fair value gains and losses, are recognized. The fair values of derivative financial instruments have been determined by reference to forward exchange rates at the end of the reporting period and classified in Level 2 of the fair value hierarchy.
73
The classification of financial instruments, as well as their carrying values and fair values, are shown in the tables below:
|
|
|
February 3, 2018 |
|
January 28, 2017 |
|
||||
|
|
|
Carrying |
|
Fair |
|
Carrying |
|
Fair |
|
|
|
|
value |
|
value |
|
value |
|
value |
|
|
|
|
$ |
|
$ |
|
$ |
|
$ |
|
|
Financial assets |
|
|
|
|
|
|
|
|
|
|
Derivative financial instruments — foreign forward exchange contracts |
|
239 |
|
239 |
|
463 |
|
463 |
|
|
Financial liabilities |
|
|
|
|
|
|
|
|
|
|
Derivative financial instruments — foreign forward exchange contracts |
|
468 |
|
468 |
|
9 |
|
9 |
|
The Company has determined the estimated fair values of its financial instruments based on appropriate valuation methodologies; however, considerable judgment is required to develop these estimates. Accordingly, the estimated fair values are not necessarily indicative of the amounts the Company could realize or would pay in a current market exchange. The estimated fair value amounts can be materially affected by the use of different assumptions or methodologies. The methods and assumptions used to estimate the fair value of financial instruments are described below:
|
· |
The estimated fair value of long‑term debt bearing variable rates is considered to approximate its carrying value [Level 2]. |
|
· |
The estimated fair value of loan from controlling shareholder was determined by discounting expected cash flows rates currently offered to the Company for similar debt [Level 2]. |
|
· |
The estimated fair value of Series A, A‑1 and A‑2 preferred shares was determined by discounting expected future cash flows rates at the discount rates which represent the cost of borrowing those cash flows [Level 3]. |
|
· |
The carrying value of the financial derivative liability is its fair value [Level 3]. |
|
· |
The estimated fair value of forward contracts is determined using forward exchange rates at the end of the reporting period [Level 2]. |
The Company categorizes its financial assets and liabilities measured at fair value into one of three different levels depending on the observability of the inputs used in the measurement.
Level 1: This level includes assets and liabilities measured at fair value based on unadjusted quoted prices for identical assets and liabilities in active markets that are accessible at the measurement date.
Level 2: This level includes valuations determined using directly (i.e. as prices) or indirectly (i.e. derived from prices) observable inputs other than quoted prices included within Level 1. Derivative instruments in this category are valued using models or other standard valuation techniques derived from observable market inputs.
Level 3: This level includes valuations based on inputs which are less observable, unavailable or where the observable data does not support a significant portion of the instruments’ fair value.
There were no significant transfers between Level 1, Level 2 and Level 3 of the fair value hierarchy during the years ended February 3, 2018 and January 28, 2017.
74
25. MANAGEMENT OF CAPITAL
As at February 3, 2018, the Company’s capital is composed of shareholders’ equity as follows:
|
|
|
February 3, |
|
January 28, |
|
|
|
|
2018 |
|
2017 |
|
|
|
|
$ |
|
$ |
|
|
Total debt |
|
— |
|
— |
|
|
Shareholder’s equity [excluding accumulated other comprehensive income] |
|
99,613 |
|
130,263 |
|
|
Total capital under management |
|
99,613 |
|
130,263 |
|
The Company’s objectives in managing capital are to ensure sufficient liquidity to pursue its organic growth, to establish a strong capital base so as to maintain investor, creditor and market confidence and to provide an adequate return to shareholders.
The Company’s primary uses of capital are to finance increases in non‑cash working capital, capital expenditures for its store expansion and renovation program as well as information technology and infrastructure improvements.
The Company currently funds these requirements from cash flows from operations as well as its financial resources, which include a cash balance of $63,484 as at February 3, 2018, the Revolving Facility (Note 14) and through its issuances of common shares (Note 17). The Board does not establish quantitative return on capital criteria for management, but rather promotes year-over-year sustainable profitable growth. The Company is not subject to any externally imposed capital requirements.
The Company is subject to certain non‑financial covenants related to its Revolving Facility, all of which were met as at February 3, 2018 and January 28, 2017. There has been no change with respect to the overall capital risk management strategy during the years ended February 3, 2018 and January 28, 2017.
26. GUARANTEES
Some agreements to which the Company is party, specifically those related to debt agreements and the leasing of its premises, include indemnification provisions that may require the Company to make payments to a third party for breach of fundamental representation and warranty terms in the agreements, with respect to matters such as corporate status, title of assets, environmental issues, consents to transfer, employment matters, litigation, taxes payable and other potential material obligations. The maximum potential amount of future payments that the Company could be required to make under these indemnification provisions is not reasonably quantifiable as certain indemnifications are not subject to a monetary limitation. As at February 3, 2018, management does not believe that these indemnification provisions would require any material cash payment by the Company, and insurance coverage, estimated by management to be reasonable and sufficient, exists in order to minimize the previously mentioned risks.
The Company indemnifies its directors and officers against claims reasonably incurred and resulting from the performance of their services to the Company, and maintains liability insurance for its directors and officers as well as those of its subsidiary.
75
ITEM 9. CHANGES IN AND DISAGREEMENTS WITH ACCOUNTANTS ON ACCOUNTING AND FINANCIAL DISCLOSURE
Not applicable.
ITEM 9A. CONTROLS AND PROCEDURES
Evaluation of Disclosure Controls and Procedures
Under the supervision and with the participation of management, including our principal executive and principal financial officer, we conducted an evaluation of the effectiveness of our disclosure controls and procedures, as such term is defined in Rule 13a-15(e) and 15d-15(e) under the Securities Exchange Act of 1934 (the “Exchange Act”), as of the end of the period covered by this report, or the Evaluation Date. Based upon the evaluation, our principal executive officer and principal financial officer concluded that our disclosure controls and procedures were effective as of the Evaluation Date. Disclosure controls and procedures are controls and procedures designed to ensure that information required to be disclosed by us in our reports filed under the Exchange Act, such as this report, is recorded, processed, summarized and reported within the time periods specified in the SEC’s rules and forms. Disclosure controls and procedures include, without limitation, controls and procedures designed to ensure that such information is accumulated and communicated to our management, including our principal executive and principal financial officers as appropriate, to allow timely decisions regarding required disclosure.
Management’s Report on Internal Control over Financial Reporting
Management of the Company is responsible for establishing and maintaining adequate internal control over financial reporting. Internal control over financial reporting is defined in Rule 13a-15(f) promulgated under the Exchange Act as a process, designed by, or under the supervision of the Company’s principal executive and principal financial officers and effected by the Company’s board of directors, management, and other personnel, to provide reasonable assurance regarding the reliability of financial reporting and the preparation of financial statements for external purposes in accordance with IFRS. Internal control over financial reporting includes maintaining records that in reasonable detail accurately and fairly reflect our transactions and disposition of assets; providing reasonable assurance that transactions are recorded as necessary for preparation of our financial statements; providing reasonable assurance that receipts and expenditures are made only in accordance with management and board authorizations; and providing reasonable assurance regarding prevention or timely detection of unauthorized acquisition, use, or disposition of our assets that could have a material effect on our financial statements.
Because of its inherent limitations, internal control over financial reporting may not prevent or detect misstatements, and even when determined to be effective, can only provide reasonable assurance with respect to financial statement preparation and presentation.
Management, with the participation of the Company’s principal executive and financial officers, assessed our internal control over financial reporting as of February 3, 2018, the end of our fiscal year. Management based its assessment on the 2013 framework established in Internal Control-Integrated Framework issued by the Committee of Sponsoring Organizations of the Treadway Commission. Management’s assessment included evaluation of elements such as the design and operating effectiveness of key financial reporting controls, process documentation, accounting policies, and our overall control environment. Based on this assessment, management has concluded that our internal control over financial reporting was effective as of the end February 3, 2018.
Changes in Internal Control over Financial Reporting
There were no changes in our internal control over financial reporting (as defined in Rule 13a-15(f) under the Exchange Act) during the year ended February 3, 2018 that have materially affected or are reasonably likely to materially affect, our internal control over financial reporting.
Not applicable.
76
ITEM 10. DIRECTORS, EXECUTIVE OFFICERS AND CORPORATE GOVERNANCE
Below is a list of the names and ages of our directors and officers as of April 18, 2018, and a brief account of the business experience of each of them. Unless otherwise stated, the business address for our directors and officers is c/o DAVIDsTEA Inc., 5430 Ferrier Street, Mount‑Royal, Québec, Canada H4P 1M2.
|
Name |
Age |
Position |
|
Joel Silver................................................................... |
47 |
President, Chief Executive Officer and Director |
|
Howard Tafler............................................................. |
48 |
Chief Financial Officer |
|
Douglas Higginbotham................................................. |
53 |
Head of Supply Chain |
|
Maurice Tousson......................................................... |
69 |
Director and Chairman |
|
Emilia Di Raddo........................................................... |
60 |
Director |
|
Michael J. Mardy......................................................... |
69 |
Director |
|
Kathleen C. Tierney..................................................... |
72 |
Director |
|
Gary O’Connor............................................................. |
70 |
Director |
|
Tyler Gage................................................................... |
32 |
Director |
Joel Silver, President, Chief Executive Officer and Director (2017 to present). Mr. Silver, 47, joined our company in March 2017. Prior to that, Mr. Silver has served in a variety of leadership roles for various consumer goods companies. From 2011 to 2016, Mr. Silver served as General Partner and a member of the board of directors of TrilogyGrowth, a venture capital fund he co-founded. From 2003 to 2011, Mr. Silver held several positions of increasing responsibility at Indigo Books & Music Inc. (TSX:IDG), ultimately serving as President and served as a member of its board of directors from 2011 to 2017. Mr. Silver earned his Bachelor’s degree from Wilfrid-Laurier University in Canada and his Master’s degree of Business Administration from Harvard University. Mr. Silver brings diverse experience with consumer-centric and lifestyle brands. Mr. Silver is a resident of Québec, Canada.
Howard Tafler, Chief Financial Officer (2017 to present). Mr. Tafler, 48, joined our Company in January 2010 and served as our Chief Accounting Officer until August 13, 2017. Prior to joining the Company, Mr. Tafler worked at a national accounting firm and was the Chief Financial Officer of a manufacturing company from 2003 to 2009. Mr. Tafler received a Bachelor of Commerce in Accounting from McGill University. Mr. Tafler is also a chartered accountant and a CPA. Mr. Tafler is a resident of Québec, Canada.
Douglas Higginbotham, Head of Supply Chain (2013 to present). Mr. Higginbotham, 53, became our Head of Supply Chain in August 2013. From 2010 to 2013, Mr. Higginbotham was with McNairn Packaging based in Ontario, Canada, in the role of Vice President of Supply Chain for North America Operations. Prior to that, Mr. Higginbotham held various roles at Yankee Candle over a ten year span, including Vice President of Purchasing & Logistics, Vice President of Purchasing & Quality, and Vice President of Logistics. Mr. Higginbotham received a BS in Business Administration/Management from the University of Phoenix and a MBA in Global Management from the University of Phoenix. Mr. Higginbotham is a resident of Massachusetts, USA.
Maurice Tousson, Chairman (2016 to present). Mr. Tousson, 69, has served as President and Chief Executive Officer of CDREM Group Inc., a Canada based chain of retail stores known as Centre du Rasoir or Personal Edge from January 2000 to December 2016. Mr. Tousson has held senior executive positions at well-known Canadian specialty stores, including Chateau Stores of Canada, Consumers Distributing and Sports Experts, with responsibilities for operations, finance, marketing and corporate development. Mr. Tousson currently sits on the Board of Directors of Dorel Industries (TSE: DII), a multinational public company where he acts as Lead Director. Mr. Tousson holds an MBA degree from Long Island University in New York. Mr. Tousson brings valuable management and retail experience to the Board. Mr. Tousson is a resident of Ontario, Canada.
Emilia Di Raddo, Director (2014 to present). Ms. Di Raddo, 60, has been a director since 2012, except between January 2013 to March 2014. She has been the President of Le Chateau Inc. (TSX: CTU/A) since 2000, where she has been serving on the Board of Directors since 2001, and was Chief Financial Officer from 1996 to 2000. Prior to that, Ms. Di Raddo was a partner at Ernst & Young LLP where she practiced for more than 15 years for companies operating in the retail and consumer products’ industry. Ms. Di Raddo received a Bachelor of Commerce and a Diploma in Accountancy from Concordia University and is also a chartered accountant and a CPA. Ms. Di Raddo brings valuable retail industry experience to the Board. Ms. Di Raddo is a resident of Québec, Canada.
Michael J. Mardy, Director (2016 to present). Mr. Mardy, 69, was Executive Vice President and Director of specialty retailer, Tumi Inc. until August 2016. Prior to joining Tumi, from 1996 to 2002, he served as Executive Vice President and CFO of Keystone Food LLC, a processor and distributor. From 1982 to 1996, he served as Senior Vice President, Chief Financial Officer and
77
in various other finance positions at Nabisco Biscuit Company, a snack food and consumer products company. Mr. Mardy served on the board of directors of Keurig Green Mountain Inc. (Nasdaq: GMCR) and ModusLink Global Solutions (Nasdaq: MLNK), Inc. acting as audit committee chair and a member of their respective compensation committees. Mr. Mardy joined the board of Vince Holding Corp. in April 2018. Mr. Mardy also served on the NYSE Advisory Board and is a trustee of the New Jersey chapter of the Financial Executive Institute, as well as a member of the board of the Eden Institute for Autism. Mr. Mardy holds an MBA from Rutgers University and undergraduate degree from Princeton University. He is a member of the American institute of Certified Public Accountants, and the New Jersey Society of Certified Public Accountants. Mr. Mardy brings valuable management, retail and finance experience to the Board. Mr. Mardy is a resident of New Jersey, USA.
Kathleen C. Tierney, Director (2016 to present) . Ms. Tierney, 72, has served as Chief Executive Officer of specialty retailer Sur La Table, Inc. from August 2004 to 2008 and served as its Executive Vice Chairman from 2008 to 2011. From 2001 to 2003, she served as Chief Executive Officer of Fitch North America. She served as an Independent Consultant with a client roster including The Home Depot, Vinquiry, Yoga Works and Hirsch Bedner Design. Prior to this, Ms. Tierney was the Chief Executive Officer at Smith & Hawken from 1993 to 1999. During her tenure at The Nature Company, she served as an Executive Vice President, overseeing their growth from 3 locations to 120 stores nationwide. She has a rich background in the Retail Industry and International business and travel. Ms. Tierney earned a B.A. in English Literature from Dominican College in California, served two years in the Peace Corps, holds a lifetime teaching credential from the State of California and a Strategic Marketing Certificate from Harvard University. Ms. Tierney brings valuable management and retail experience to the Board. Ms. Tierney is a resident of California, USA.
Gary O’Connor, Director (2017 to present). Mr. O’Connor, 70, was an audit partner at KPMG Barbados from September 2009 to September 2012, at which time he retired. He served on the Board of Imvescor Restaurant Group Inc. from March 2014 to March 2018, where he also chaired the Audit and Risks Committee. Since March 2018, Mr. O’Connor currently sits on the Board of Directors of MTY Food Group Inc. (TSE: MTY), one of the largest franchisors in Canada’s restaurant industry. Mr. O’Connor received a Bachelor of Commerce in Accounting from Concordia University and and is also a chartered accountant and a CPA. Mr. O’Connor brings accounting experience to the Board. Mr. O’Connor is a resident of Québec, Canada.
Tyler Gage, Director (2017 to present). Mr. Gage, 32, is the Managing Director for North America and Europe for Terrafertil, the largest natural foods company in Latin America. Prior to that, from 2008 to 2017, Mr. Gage served as Co-Founder and CEO of Runa, LLC, a privately-held beverage company that makes organic energy drinks from an Amazonian tea leaf called guayusa. Mr. Gage received a Bachelor of Literary Arts from Brown University in December 2008. Mr. Gage was featured as 30 Under 30 Entrepreneurs 2013, by Forbes Magazine, as well as Big Apple Entrepreneur of the Year 2016. Mr. Gage brings valuable beverage and tea development experience to the Board. Mr. Gage is a resident of Washington, USA.
Family Relationships
Sarah Segal, an employee of DAVIDsTEA, is the daughter of Herschel Segal, a former director who resigned on March 5, 2018, and the owner of Rainy Day Investments Ltd. Rainy Day Investments Ltd. controls approximately 46% of the outstanding shares of DAVIDsTEA Inc.
Audit Committee
Function of Audit Committee
The Audit Committee of the Board of Directors (the “Audit Committee”) operates under a written charter adopted by the Board of Directors. The charter contains a detailed description of the scope of the Audit Committee’s responsibilities and how they will be carried out. The Audit Committee’s charter is available on our Investor Relations website at http://ir.davidstea.com under “Corporate Governance” and on SEDAR at www.sedar.com. The Audit Committee’s primary responsibilities and duties include:
|
· |
appointing, compensating, retaining and overseeing the work of any registered public accounting firm engaged for the purpose of preparing or issuing an audit report or performing other audit, review or attest services and reviewing and appraising the audit efforts of our independent accountants; |
|
· |
establishing procedures for (i) the receipt, retention and treatment of complaints regarding accounting, internal accounting controls or auditing matters and (ii) confidential and anonymous submissions by our employees of concerns regarding questionable accounting or auditing matters; |
|
· |
engaging independent counsel and other advisers, as necessary; |
|
· |
determining funding of various services provided by accountants or advisers retained by the committee; |
|
· |
reviewing our financial reporting processes and internal controls; |
78
|
· |
establishing, maintaining and overseeing the Company’s related party transaction policy, including overseeing the process for approval of all related-party transactions involving executive officers and directors; and |
|
· |
providing an open avenue of communication among the independent accountants, financial and senior management and the Board. |
Independence of Audit Committee Members
Our Audit Committee consists of Michael J. Mardy, Gary O’Connor and Tyler Gage, with Michael J. Mardy serving as Chairman of the committee. The Board determined that each of them meets the independence requirements under the rules of The NASDAQ Global Market and under Rule 10A-3 under the Exchange Act.
Audit Committee Financial Expert
The Board has determined that Michael J. Mardy and Gary O’Connor are “Audit Committee financial experts.” All members of our Audit Committee meet the requirements for financial literacy under the applicable rules and regulations of the SEC and The NASDAQ Global Market.
Audited Financial Statements Included in Annual Report
Management has the primary responsibility for establishing and maintaining adequate internal financial controls, for preparing the financial statements and for the public reporting process. Ernst & Young LLP (“EY”), the Company’s independent registered public accounting firm, is responsible for expressing an opinion on the conformity of the Company’s audited consolidated financial statements with International Financial Reporting Standards.
The Audit Committee has reviewed and discussed with management and EY the Company’s audited consolidated financial statements for the year ended February 3, 2018 and Management’s Discussion and Analysis of Financial Condition and Results of Operation.
The Audit Committee also has discussed with EY the matters required to be discussed by the Public Company Accounting Oversight Board (“PCAOB”) AU Section 380, “Communication with Audit Committees.” The Audit Committee also received the written disclosures and the letter from EY that are required by PCAOB Rule 3526, “Communication with Audit Committees Concerning Independence,” and has discussed with EY its independence. The Audit Committee also considered whether EY’s provision of non-audit services to the Company is compatible with maintaining EY’s independence. This discussion and disclosure informed the Audit Committee of EY’s independence and assisted the Audit Committee in evaluating that independence. On the basis of the foregoing, the Audit Committee concluded that EY is independent from the Company, its affiliates and management.
Based upon its review of the Company’s audited consolidated financial statements and the discussions noted above, the Audit Committee recommended to the Board of Directors that our audited consolidated financial statements for the year ended February 3, 2018 be included in the Company’s Annual Report on Form 10-K for such fiscal year for filing with the SEC. This report has been furnished by the members of the Audit Committee.
Michael J. Mardy, Chair
Gary O’Connor
Tyler Gage
79
Corporate Governance
Statement of Corporate Governance Practices
As a Canadian reporting issuer with securities listed on the NASDAQ, DAVIDsTEA complies with all applicable rules adopted by the Canadian Securities Administrators (the “CSA”) and the SEC. As a Canadian issuer, DAVIDsTEA is exempt from complying with many of the NASDAQ Corporate Governance Standards (the “NASDAQ Standards”), provided that DAVIDsTEA complies with Canadian governance requirements. DAVIDsTEA also complies with National Instrument 58-101 - Disclosure of Corporate Governance Practices (the “CSA Disclosure Instrument”) and National Policy 58-201 (Corporate Governance Guidelines (the “CSA Governance Policy”). The CSA Governance Policy provides guidance on governance practices for Canadian issuers. The CSA Disclosure Instrument requires issuers to make the prescribed disclosure regarding their governance practices. The Board is of the view that DAVIDsTEA’s corporate governance practices satisfy the requirements of the CSA Disclosure Instrument and the Corporate Governance Policy, as reflected in the disclosure made hereunder. The Board of Directors has approved the disclosure of DAVIDsTEA’s corporate governance practices described below, on the recommendation of the Corporate Governance and Nominating Committee.
Board of Directors
Independence
The Board of Directors consists of seven directors, six of whom are non‑employee directors. Each director was elected at the Annual Shareholders’ meeting held on June 8, 2017. Our directors are appointed for a one‑year term to hold office until the next annual general meeting of Shareholders or until their earlier resignation or removal from office in accordance with the Company’s by-laws.
Five of our seven directors that make up the Board of Directors are considered “independent” pursuant to Section 1.4 of the CSA’s Audit Committee Rules. Under these rules, Maurice Tousson, the Chairman of the Board of Directors, Michael J. Mardy, Gary O’Connor, Tyler Gage and Kathleen C. Tierney are considered independent, whereas Emilia Di Raddo and Joel Silver are not considered to be independent as a result of their respective relationships with the Company or their relationships with shareholders. The independence of directors is determined by the Board based on the results of independence questionnaires completed by each director annually, as well as other factual circumstances reviewed on an ongoing basis.
To enhance the independent judgment of the Board of Directors, the independent members of the Board of Directors may meet in the absence of members of management and the non‑independent directors. An in camera session is scheduled as part of every meeting of the Board of Directors and its committees to allow independent directors to meet without non-independent directors and members of management, as necessary. All non‑independent directors are responsible to the Board of Directors as a whole and have a duty of care to the Company.
The Board of Directors has a written mandate delineating its roles and responsibilities. It can be found on the Company’s website at http://ir.davidstea.com and on SEDAR at www.sedar.com.
Chair of the Board
The Board of Directors is led by a non-executive, independent Chairman, which the Company believes contributes to the Board’s ability to function independently of management. Mr. Maurice Tousson has been a director of the Company since 2016 at which time he also became the Chairman of the Board. As Chairman of the Board, Mr. Maurice Tousson is responsible for overseeing the Board in carrying out its roles and responsibilities, which includes overseeing that the Board’s duties and responsibilities are carried out independently of management. See “Formal Position Descriptions” below for further detail on the role of the Chairman.
Conflicts of Interest
In accordance with applicable law and DAVIDsTEA’s policy, each director is required to disclose to the Board any potential conflict of interest he or she may have in a matter before the Board or a Committee thereof at the beginning of the Board or committee meeting. A director who is in a potential conflict of interest must not attend any part of the meeting during which the matter is discussed or participate in a vote on such matter.
80
Formal Position Descriptions
The Board has adopted formal position descriptions for the Chairman of the Board and the Board Committee Chairs, as well as for the President and CEO.
Chairman of the Board
The Board of Directors has adopted a written position description for the Chairman of the Board of Directors and each of the Committee chairs, which sets out each of the chairs’ key responsibilities, including duties relating to setting meeting agendas, chairing meetings and working with the respective committee and management to ensure, to the greatest extent possible, the effective functioning of the committee and the Board of Directors.
The primary responsibility of the Chairman is to provide leadership to the Board to enhance Board effectiveness. The Chair of the Board must oversee that the relationship between the Board, management, Shareholders and other stakeholders are effective, efficient and further to the best interests of the Company.
Committee Chairs
The position descriptions of each Committee Chair provide that each Chair’s key role is to manage his or her respective Committee and ensure that the Committee carries out its mandate effectively. Like the Chairman of the Board, each Committee Chair is expected to provide leadership to enhance the Committee’s effectiveness and must oversee the Committee’s discharge of its duties and responsibilities. Committee Chairs must report regularly to the Board on the business of their respective committee.
President and CEO
The primary responsibility of the President and CEO is to lead the Company by providing strategic direction that includes the development and implementation of plans, policies, strategies and budgets for the growth and profitable operation of the Company. The Board of Directors has, together with the CEO, developed a written position description for the CEO which sets out the Chief Executive Officer’s key responsibilities, including duties relating to strategic planning, operational direction, Board of Directors interaction, building an effective management team and communication with shareholders.
The HRCC, together with the Chairman of the Board and the President and CEO, develop yearly goals and objectives that the President and CEO is responsible for meeting. The HRCC and the Chairman of the Board evaluate the President and CEO’s performance in light of such goals and objectives and establish his compensation based on this evaluation. The corporate objectives that the President and CEO is responsible for meeting, with the rest of management placed under his supervision, are determined by the strategic plans and the budgets as they are approved each year by the Board.
Election of Directors
The articles of the Company (the “Articles”) provide that the Board shall consist of not less than three (3) and not more than fifteen (15) directors. If prior to the Meeting, any of the nominees shall be unable or, for any reason, become unwilling to serve as a director, it is intended that the discretionary power granted by the form of proxy or voting instruction form shall be used to vote for any other person or persons as directors. Each director is elected for a one-year term ending at the next annual meeting of Shareholders or when his or her successor is elected, unless he or she resigns or his or her office otherwise becomes vacant.
Committees of the Board
The Board has established the Audit Committee, the HRCC and the Corporate Governance and Nominating Committee and has delegated to each of these committees certain responsibilities that are set forth in their respective mandates.
Human Resources and Compensation Committee
The HRCC’s primary purpose, with respect to compensation, is to assist the Board of Directors in fulfilling its oversight responsibilities and to make recommendations to the Board of Directors with respect to the compensation of the directors and executive officers. Independent consultants may also be periodically retained to assist the HRCC in fulfilling its responsibilities when needed. As required in its mandate, the HRCC is composed of a majority of independent directors, including the Chairman of the committee that must qualify as an independent director. The three current members of the HRCC are Ms. Tierney (Chair), Mr. Tousson and Mr. Mardy.
81
A copy of the charter of the HRCC is available on the Company’s website at http://ir.davidstea.com and on SEDAR at www.sedar.com.
Corporate Governance and Nominating Committee
The four current members of the Corporate Governance and Nominating Committee are Mr. O’Connor (Chair), Mssrs. Mardy, Gage, as well as Ms. Thierney. A copy of the charter of the Corporate Governance and Nominating Committee is available on the Company’s website at http://ir.davidstea.com and on SEDAR at www.sedar.com.
Board and Committee Meetings
In Camera Sessions
To maintain independence from management, the independent Board members meet at least annually and may meet at each quarterly and special Board meeting, without the presence of management and under the chairmanship of the independent Chairman of the Board. Similarly, each of the Company’s committees may hold separate sessions without management present under the chairmanship of its committee Chair at least annually and may hold one at each quarterly and special committee meeting.
Ethical Business Conduct
The Company’s Code of Ethics (the “Code of Ethics”) is applicable to all DAVIDsTEA’s directors, senior managers and financial officers and has been developed to promote the honest and ethical conduct of our directors, senior managers and financial officers, including the ethical handling of actual or apparent conflicts of interest between personal and professional relationships; to promote full, fair, accurate, timely and understandable disclosure in periodic reports required to be filed by the Company; and to promote compliance with all applicable rules and regulations that apply to the Company and its officers. A copy of the Code of Ethics is available on the Company’s website at http://ir.davidstea.com and on SEDAR at www.sedar.com. The Code of Ethics addresses several matters, including conflicts of interest, integrity of corporate records, confidentiality of corporate information, protection and use of corporate assets and opportunities, insider trading, compliance with laws and reporting of unethical or illegal behaviour. No waiver has ever been granted to a director or executive officer in connection with the Code of Ethics.
In addition to monitoring compliance with the Code of Ethics, the Board has adopted whistleblowing procedures for reporting unethical or questionable acts by the Company or employees thereof. Complaints can be made via telephone at a confidential line called the integrity line. Any Human Resources-related question is redirected to our Head of Human Resources while any issue of misconduct or fraud is redirected to the Chair of the Audit Committee who is responsible to oversee the whistleblowing procedures.
Board, Committees and Directors Performance Assessment
On an annual basis, the Chairman of the Board is responsible for the process of assessing the performance and effectiveness of the Board as a whole, the Board Committees, Committee Chairs and individual directors. Questionnaires are distributed to each director for the purpose of (i) evaluating the Board’s responsibilities and functions, its operations, how it compares with boards of other companies on which the directors serve and the performance of the Board’s Committees and (ii) inviting directors to make suggestions for improving the performance of the Chairman of the Board, Committee Chairs and individual directors. The questionnaire completed by the Chairman of the Board is submitted to the Chair of the HRCC Committee. The results of the questionnaires are compiled by the Corporate Secretary on a confidential basis to encourage full and frank commentary. In addition, the Chairman of the Board discusses with each Board member individually in order to discuss the questionnaires and also meets the Chair of the HRCC Committee who is responsible for his assessment. The results of the questionnaires as well as any issues raised during individual discussions are presented and discussed at a following meeting of the Board. At all times, Board members are free to discuss among themselves the performance of a fellow director, or submit such a matter to the Chairman of the Board. Based on the outcome of the discussion, the Chairman of the Board then presents to the Board the assessment’s findings and its recommendations to enhance the performance and effectiveness of the Board and its Committees.
Director Selection
Skills and Experience of Directors
The process by which the Board establishes new candidates for Board nominations lies within the discretion of the Board of Directors with a view of the best interests of the Company and in accordance with the corporate governance guidelines. Pursuant to the
82
governing statutes, Articles and by‑laws, new candidates for Board nominations can be proposed by the Shareholders and will be voted on by the Shareholders at each annual meeting of Shareholders.
Nomination of Directors
Before making a recommendation on a new director candidate, the Chairman of the Board and members of the Corporate Governance and Nominating Committee meet with the candidate to discuss the candidate’s interest and ability to devote the time and commitment required to serve on the Board. In certain circumstances, the Board may also retain an independent recruiting firm to identify director candidates and fix such firm’s fees and other retention terms.
The Board does not impose nor does it believe that it should establish term limits or retirement age limits on its directors, as such limits may cause the loss of experience and expertise important to the optimal operation of the Board.
Diversity and Gender Diversity
The Company does not have a formal policy on diversity on the Board of Directors or in senior management positions. The Company is, however, mindful of the benefit of diversity of the Board of Directors and senior management, including the representation of women on the Board and in senior management positions, and the need to maximize their effectiveness and respective decision‑making abilities. Accordingly, in searches for new candidates, while the Company seeks to recruit or appoint the most qualified individuals for particular positions, it considers the merit of potential candidates based on a balance of skills, background, experience and knowledge, including taking into consideration diversity such as gender, age and geographic areas.
Director Orientation and Continuing Education
Orientation
The HRCC Committee is responsible for developing, monitoring and reviewing the Company’s orientation and continuing education programs for directors. New directors are provided with an information package on the Company’s business, its strategic and operational business plans, its operating performance, its governance system and its financial position. Also, new directors meet individually with the President and Chief Executive Officer and other senior executives to discuss these matters. The Board ensures that prospective candidates fully understand the role of the Board and its Committees and the contribution that individual directors are expected to make, including, in particular, the personal commitment that the Company expects of its directors.
Continuing Education
All Board members have visited our DAVIDsTEA’s stores. Management makes presentations to the Board members on a range of topics that are relevant to the operations. Senior management makes regular presentations to the Board and its committees to educate them and keep them informed of developments within the Company’s main areas of business and operations, as well as on key legal, regulatory and industry developments. Directors attend an annual strategic planning meeting, where management presents the Company’s short, mid and long-term strategic plan. Directors are also provided with Board and Board committee materials in advance of regularly scheduled meetings. Directors also receive periodic updates between Board meetings on matters that affect the Company’s business. Finally, Board members have full access to the Company’s senior management and employees.
ITEM 11. EXECUTIVE COMPENSATION
This section discusses the material components of the executive compensation program for our executive officers who are named in the "2017 Summary Compensation Table" below. In Fiscal 2017, our "named executive officers" and their positions were as follows:
|
· |
Joel Silver, President and Chief Executive Officer |
|
· |
Howard Tafler, Chief Financial Officer |
|
· |
Luis Borgen, Chief Financial Officer until his departure effective July 31, 2017 |
|
· |
Christine Bullen, Interim Chief Executive Officer until March 19, 2017 and Chief Operating Officer and President of DAVIDsTEA USA Inc. from April 12, 2017 until her departure effective October 26, 2017 |
|
· |
Edmund Noonan III, Head of Global Real Estate and Store Development until his departure effective October 26, 2017 |
|
· |
Douglas Higginbotham, Head of Supply Chain |
83
This discussion may contain forward-looking statements that are based on our current plans, considerations, expectations and determinations regarding future compensation programs. Actual compensation programs that we adopt may differ materially from the currently planned programs summarized in this discussion. See Part I on Form 10-K "Cautionary Note Regarding Forward-Looking Statements."
Summary Compensation Table
Executive and Director Compensation
The following relates to the compensation of our named executive officers for the fiscal year ended February 3, 2018. Our “Named Executive Officers”, for fiscal 2017 were: our President and Chief Executive Officer of the Company (“CEO”), our Interim CEO, our Chief Financial Officer (“CFO”), and the three most highly compensated executive officers of the Company, including any of its subsidiaries, who each earned total compensation that exceeded $100,000 for the fiscal year ended February 3, 2018, are:
|
· |
Mr. Silver, President and CEO; |
|
· |
Mr. Tafler, CFO; |
|
· |
Mr. Borgen, CFO until his departure effective July 31, 2017; |
|
· |
Ms. Bullen, Interim CEO until the arrival of Mr. Silver on March 20, 2017 and Chief Operating Officer and President of DAVIDsTEA USA Inc. from April 12, 2017 until her departure effective October 26, 2017; |
|
· |
Mr. Noonan III, Head of Global Real Estate and Store Development until his departure effective October 26, 2017; and |
|
· |
Mr. Higginbotham, Head of Supply Chain. |
Each year, the HRCC reviews and determines the compensation of the Named Executive Officers.
Compensation Philosophy and Overview of Components
The objectives of the compensation program are to attract, retain and motivate highly skilled executives, to reward them for their performance and contributions to the Company’s short‑ and long‑term success, and to align the interests of our executive officers with those of the shareholders. The compensation of each executive officer is determined based on a number of factors, including the executive officer’s qualifications and experience, role, responsibilities and contributions, as well as the market and our financial condition.
The compensation program includes incentive programs intended to align executive compensation with the Company’s performance, to motivate our executive officers to work toward the achievement of our short‑ and long‑term corporate objectives, including strategic goals and increasing shareholder value and, where appropriate, to reward superior performance. The named executive officers are also entitled to receive benefits and executive perquisites in accordance with the Company’s policies.
The compensation program aims at striking the right balance between fixed and variable compensation so as to keep the executives motivated to thrive in achieving the operating and financial goals, while promoting a prudent risk-taking culture.
84
Below are the main compensation components we use, as well as the reasoning behind their utilization.
|
Fixed Compensation Component |
Variable Compensation Component |
||||
|
Base Salary |
Group Insurance Benefits |
Perquisites |
Annual Incentive Program |
Long-Term Incentives |
|
|
Objective and Basis |
Attract and retain qualified and competent executives Provide base compensation that is competitive for each role |
Provide for the wellness of the executives Protect executives and their families |
Limited executive perquisites to stimulate performance |
Drive Company performance where appropriate Align executive compensation with Company performance Reward superior performance |
Attract and retain executives through long-term vesting and potential wealth accumulation Drive long-term Shareholder returns, promote growth and sustainability Align executive compensation with Shareholder interests by making a significant portion of compensation variable |
|
Positioning |
Target market median; adjusted for individual experience and competencies |
Target slightly below general market practices |
Target slightly below market |
Target market median for design/payouts depends on performance |
Opportunity commensurate with developing, high growth companies |
|
Form and Timing |
Cash |
Health insurance Group Insurance Program |
Employee product discount |
Cash |
Generally, (as determined annually by the HRCC): Stock options (50%) with a 7‑year term, vesting between three and four years depending on the award. Restricted stock units (50%) vesting over 3 years. |
The table below illustrates the proportion of each compensation component comprising the total direct compensation of the named executive officers at target level.
|
|
|
|
Target |
|
|
Base |
Target |
Long-Term |
|
|
Salary |
Bonus |
Incentives |
|
Name |
(%) |
(%) |
(%) |
|
Joel Silver |
36.4% |
27.3% |
36.4% |
|
Howard Tafler |
60.6% |
18.2% |
21.2% |
|
Douglas Higginbotham |
66.7% |
16.7% |
16.7% |
Benchmarking
To ensure that its compensation programs are competitive, we conduct periodic benchmarking studies based on compensation data included in management proxy circulars and published surveys from known firms, with an objective that the target total direct compensation for the senior management team be positioned in line with the Company’s compensation philosophy and components detailed below. The current compensation comparator group was developed from Canadian and U.S. publicly-traded companies that either specialize in beverage and/or drinks, packaged food or specialty retail outlets following analysis done by the Company’s independent compensation consultants. In choosing the companies, attention was also given to the size of revenues, EBITDA and market
85
capitalization to ensure they were in a range comparable with DAVIDsTEA. Below is the list of the 12 organizations comprising the compensation comparator group:
|
U.S. Food and Beverage Sector |
U.S. Specialty Retailers |
Canada Food and Beverage Sector |
|||
|
Nature’s Sunshine Products Inc. |
MGP Ingredients Inc. |
Medifast Inc. |
Andrew Peller Ltd |
||
|
Crystal Rock Holding Inc. |
LifeVantage Corp. |
Corby Spirit and Wine Ltd |
|||
|
Lifeway Foods Inc. |
Craft Bew Alliance Inc. |
Ten Peaks Coffee Company |
|||
|
Bridgford Foods Corp. |
Coffee Holding Co. Inc. |
||||
Compensation Risk Oversight
The Board of Directors and the HRCC are very mindful of risks associated with the Company’s compensation policies and practices and take into account their implications when making compensation decisions. At this time, the HRCC has not identified any material risks related to or arising from the Company’s compensation policies that are likely to have material adverse effects on the Company, its operations or finances.
In order to limit the chances of creating compensation policies that would encourage named executive officers to take excessive or inappropriate risks, the Board and the HRCC have adopted a number of practices and policies designed to safeguard the Company’s and its Shareholders’ interests.
The Use of an Independent Compensation Consultant
The HRCC retained the services of PCI – Perrault Consulting (“PCI”), an independent compensation consultant, to assist the Board and the committee with executive and other compensation matters. During the fiscal year ended February 3, 2018, PCI assisted the HRCC in developing and reviewing the compensation practices for such year.
The table below presents the fees paid to PCI during the three most recent fiscal years:
|
|
|
Executive |
Other |
Total |
|
Year |
Consultant |
Compensation |
Mandates |
Fees |
|
2017 |
PCI |
C$5,477 |
C$11,121 |
C$16,598 |
|
|
% of total fees |
33% |
67% |
100% |
|
2016 |
PCI |
C$3,396 |
─ |
C$3,396 |
|
|
% of total fees |
100% |
0% |
100% |
|
2015 |
PCI |
C$36,634 |
─ |
C$36,634 |
|
|
% of total fees |
100% |
0% |
100% |
The Balance between Fixed and Variable Compensation
While the HRCC believes it is important to link a significant portion of each named executive officers’ total direct compensation to goals related to the Company’s share price and financial results, the HRCC also works to ensure that it does not create incentives to take excessive risks to achieve such goals. As such, the HRCC make sure that the fixed portion of compensation represents a sufficient portion of the named executive officers’ compensation. The HRCC has approved for Fiscal 2017, a cap on the maximum amount payable under the annual incentive program at two times target level, which limits the upside from the plan at a reasonable level to motivate the executives, while remaining within the Company’s risk appetite framework.
The Choice of Performance Measures
The HRCC decided to apply the same performance measures and objectives to the annual awards for all of the named executive officers, which promotes a culture of collaboration and prioritizes efforts to achieve the desired results, while reducing the risks of an individual taking excessive risks for personal benefit. The HRCC believes that Comparable Sales growth and selected other financial objectives in line with the Company’s short-term corporate goals are significant measures of the Company’s growth and are well understood by employees, shareholders and investors and therefore represent a logical choice of performance measure for the annual incentive program.
86
The Insider Trading Policy
The Company has adopted an insider trading policy that applies to the equity transactions of all of the employees, including most notably of directors and officers, including Named Executive Officers. Under the policy, transactions by covered individuals in the Company’s securities are authorized to trade the Company’s securities only during insider trading windows (which open the second full day after financial results are released each quarter to permit market adjustments), and all transactions must be pre-approved and cleared by the Corporate Secretary so as to avoid even the appearance of trading based on non-public information.
Hedging Prohibition
Hedging transactions can be accomplished through a variety of mechanisms including prepaid forward contracts, equity swaps and collars and other similar devices. Because hedging transactions permit the holder of the securities to continue to own the securities without the full risks and rewards of ownership, such transactions can cause the interests of such holder not to be aligned with our other Shareholders and therefore the employees, officers and directors are prohibited from hedging any equity-based compensation or Company shares.
Automatic Securities Disposition Plan (10b5-1 Plan)
Automatic Securities Disposition Plans are permitted under the Insider Trading Policy and must be approved by the Corporate Secretary and meet the requirements of the Securities Act (Québec) and similar rules and regulations in other applicable Canadian securities laws as well as with Rule 10b5-1(c)(1)(i)(B) under the Exchange Act. In general, such plans must be entered into at a time when the person entering into the plan is not aware of any material non-public information.
Elements of Compensation Program
The following presents in greater detail the Company’s compensation components and illustrates its application for the most recently completed financial year.
Base salaries
Base salaries of the Named Executive Officers are determined annually by the HRCC. When determining base salary each year, the HRCC takes the following factors into account: each executive’s experience and individual performance, the Company’s performance as a whole, cost of living adjustments and other industry conditions, but does not assign any specific weighting to any factor. As a guideline, the HRCC targets the salary component of the compensation program at the median of our comparator group.
For the fiscal year ended February 3, 2018, based on benchmarking exercises, the HRCC approved base salary increases varying from 0% to 19.2% for the Named Executive Officers, for an average increase of 9.2%. This includes Mr. Tafler’s increase, which was primarily as a result of his promotion to Interim CFO and then CFO during Fiscal 2017.
|
|
Salary |
Increase |
|
|
|
as at |
during |
|
|
|
February 3, |
last fiscal |
|
|
|
2018 |
year |
|
|
Name |
($) |
(%) |
Currency |
|
Joel Silver |
400,000 |
0.0% |
CDN |
|
Howard Tafler |
265,000 |
19.2% |
CDN |
|
Luis Borgen |
─ |
─ |
USD |
|
Christine Bullen |
─ |
─ |
USD |
|
Edmund Noonan III |
─ |
─ |
USD |
|
Douglas Higginbotham |
220,000 |
8.4% |
USD |
Short-Term Incentive Plan
The annual incentive program is a cash bonus intended to compensate officers for achieving short‑term corporate goals. It is also intended to reward the named executive officers for both the overall performance of the Company and individual performance during the year. The Company believes that establishing cash bonus opportunities is an important factor in both attracting and retaining the services of qualified and highly skilled executives. The HRCC determined that the most meaningful measure of successful growth
87
was Comparable Sales and selected other financial objectives in line with the Company’s short-term corporate goals, which, together with Comparable Sales, would form the basis for the annual incentive program. The HRCC reviews annually the weight attributed to each financial objective. Therefore, for fiscal 2017, the annual incentive formula attributed 75% to corporate Comparable Sales growth and 25% to other financial objectives. Notwithstanding the above formula, the HRCC may, in its sole discretion, adjust the calculated payment, as much as to cancel payment altogether, should it determine that the calculated payment requires adjustment.
For the fiscal year ended February 3, 2018 the Company did not meet the annual incentive program targets. The HRCC exercised its discretion to pay out a portion of the bonus to incentivize management. In addition, under the terms of Mr. Silver’s employment agreement, he was entitled to guaranteed payment of 50% of his target bonus.
|
(expressed as a percentage of base salary) |
|
|
|
|
|
|
|
|
Corporate |
|
|
|
Target |
Maximum |
Performance |
Actual |
|
|
Bonus |
Bonus |
Factor |
Payout |
|
Name |
(%) |
(%) |
(%) |
(%) |
|
Joel Silver |
67% |
100% |
0% |
33% |
|
Howard Tafler |
30% |
60% |
0% |
8% |
|
Douglas Higginbotham |
25% |
50% |
0% |
6% |
Mid- and Long-Term Incentive Plans
In 2015, the Board and the shareholders of the Company adopted the 2015 Omnibus Equity Incentive Plan (the “2015 Omnibus Plan”) in connection with our IPO. All equity and equity‑based awards, including awards to the named executive officers, are made under the 2015 Omnibus Plan. Accordingly, the restricted stock unit and option awards made in Fiscal 2017 to executive officers were all made under the 2015 Omnibus Plan. As our common shares are currently traded solely on the NASDAQ Global Market, the grant value and number of units awarded are determined based on the U.S. dollar share price and are not subject to currency conversion.
The target award values for the named executive officers are indicated in the table below. Actual Fiscal 2017 awards can be found in the summary compensation table set out below. Under the 2015 Omnibus Plan, when calculating the number of stock options and/or restricted share units/performance share units granted based on the target award values, the Company does not convert for U.S.-Canadian currency rates.
|
|
Target |
Maximum |
|
Name |
Value |
Value |
|
|
(% of salary) |
|
|
Joel Silver |
100% |
150% |
|
Howard Tafler |
35% |
50% |
|
Douglas Higginbotham |
25% |
35% |
Fiscal 2017 Stock Options
Stock option awards serve to align the interests of our named executive officers with the interests of the shareholders because no value is created unless the value of the common shares appreciates after the grant. Stock options also encourage retention through the use of time‑based vesting, as vesting is generally subject to the executive’s continued employment with the Company. Stock options may also build share ownership among our named executive officers if the executive retains the shares following exercise. Stock options are granted at an exercise price equal to the closing price of our common shares on the NASDAQ Global Market on the day of the grant. Stock options are generally granted with a seven-year term and vest in equal instalments over four years.
Fiscal 2017 Restricted Stock Units
Restricted stock units serve to align the interests of our named executive officers with the interests of our shareholders as their value is tied to the price of our common shares. Restricted stock units with a multi-year vesting schedule also promote employee retention and, therefore, are a valuable tool in assisting the Company roll out its strategy in the longer term. The number of units granted is calculated by dividing the value of the award by closing price of a share of our common stock on the NASDAQ Global Market. Restricted stock units generally vest as to 25% of the units on the first and second anniversaries and 50% of the units on the third anniversary. Restricted stock units may be settled at the HRCC’s discretion in shares of our common stock, cash or in a combination of both shares and cash.
88
Benefits
We provide modest benefits to the named executive officers, which are limited to participation in the basic health and welfare plans. These benefits are available to all salaried employees of the Company.
Perquisites
All the named executive officers are eligible to a discount on DAVIDsTEA products, which discount is offered to all of our regular employees. In addition, the Company pays car allowance and annual professional association fees to certain of our named executive officers.
Retirement Plans
We do not maintain any qualified or non‑qualified defined benefit plans or supplemental executive retirement plans that cover the named executive officers. In addition, the executives do not participate in a defined contribution pension plan, a collective RRSP or a 401K in the U.S., to which the Company contributes.
Summary Compensation Table
The following table illustrates the compensation paid to the named executive officers for the last three completed fiscal years, as applicable. All compensation is disclosed in U.S. dollars. For employees who receive all or a portion of their compensation in Canadian dollars, unless otherwise indicated, an exchange of 1.2393 for 2017, 1.3108 for 2016, and 1.4074 for 2015 has been used to
89
convert to U.S. dollars, which represents the exchange rate of the U.S. Federal Reserve Bank of New York at noon on the last day of each fiscal year, and which, in the Company’s opinion, is an appropriate reflection of exchange rates variation during the year.
|
|
|
|
|
|
|
Non-equity incentive |
|
|
|
|
|
|
|
|
|
|
plan compensation |
|
|
|
|
|
|
|
|
|
|
Annual |
Long-term |
All |
|
|
|
|
|
|
Stock |
Option |
incentive |
incentive |
other |
Total |
|
|
|
Salary(7) |
Bonus(8) |
Awards(9) |
Awards(10) |
plan(11) |
plan |
compensation(12) |
Compensation |
|
Name and principal position |
Year |
($) |
($) |
($) |
($) |
($) |
($) |
($) |
($) |
|
Joel Silver (1) |
2017 |
285,521 |
— |
199,969 |
200,126 |
107,480 |
─ |
8,069 |
801,165 |
|
President and Chief |
2016 |
— |
— |
— |
— |
— |
— |
— |
— |
|
Executive Officer |
2015 |
— |
— |
— |
— |
— |
— |
— |
— |
|
Howard Tafler (2) |
2017 |
194,515 |
14,903 |
55,544 |
— |
18,953 |
— |
813 |
284,728 |
|
Chief Financial |
2016 |
166,233 |
— |
27,192 |
13,490 |
4,967 |
— |
763 |
212,645 |
|
Officer |
2015 |
154,823 |
— |
36,169 |
— |
42,652 |
— |
714 |
234,358 |
|
Luis Borgen (3) |
2017 |
180,565 |
— |
88,753 |
89,015 |
─ |
─ |
639,153 |
997,486 |
|
Former Chief Financial |
2016 |
355,000 |
— |
79,897 |
39,590 |
─ |
─ |
─ |
474,487 |
|
Officer |
2015 |
350,000 |
— |
138,245 |
─ |
196,700 |
─ |
— |
684,945 |
|
Christine Bullen (4) |
2017 |
259,123 |
58,723 |
157,986 |
— |
— |
─ |
372,317 |
848,149 |
|
Former Chief Operating Officer and President of |
2016 |
214,615 |
— |
232,495 |
115,091 |
16,277 |
─ |
─ |
578,478 |
|
DAVIDsTEA (USA) Inc. |
2015 |
─ |
— |
─ |
─ |
─ |
─ |
─ |
— |
|
Edmund Noonan III (5) |
2017 |
194,723 |
23,489 |
104,387 |
— |
— |
─ |
144,850 |
467,449 |
|
Former Head of Global Real |
2016 |
258,000 |
— |
51,586 |
25,588 |
6,511 |
─ |
─ |
341,685 |
|
Estate and Store Development |
2015 |
253,000 |
— |
58,674 |
— |
106,640 |
— |
— |
418,314 |
|
Douglas Higginbotham (6) |
2017 |
203,000 |
19,874 |
50,763 |
— |
9,850 |
─ |
— |
283,487 |
|
Head of |
2016 |
262,160 |
|
24,954 |
12,382 |
5,426 |
─ |
─ |
304,922 |
|
Supply Chain |
2015 |
277,258 |
|
32,150 |
─ |
77,909 |
─ |
─ |
387,317 |
Notes:
|
(1) |
Mr. Silver joined the Company as President and Chief Executive Officer on March 20, 2017. Accordingly, the amounts reported in the table for 2017 reflect compensation earned by or paid to Mr. Silver for such year from such date. |
|
(2) |
Mr. Tafler became Interim Chief Financial Officer effective August 14, 2017 and Chief Financial Officer effective December 7, 2017. |
|
(3) |
Mr. Borgen ceased to act as Chief Financial Officer effective July 31, 2017. Accordingly, the amounts reported in the table for 2017 reflect compensation earned by or paid to Mr. Borgen for such year until such date. |
|
(4) |
Ms. Bullen acted as Interim President and CEO until the arrival of Mr. Silver effective March 20, 2017. Effective April 12, 2017, she became Chief Operating Officer and President of DAVIDsTEA (USA) Inc. Ms. Bullen ceased to act as Chief Operating Officer and President of DAVIDsTEA (USA) Inc. effective October 26, 2017. Accordingly, the amounts reported in the table for 2017 reflect compensation earned by or paid to Ms. Bullen for such year until such date. |
|
(5) |
Mr. Noonan joined the Company as Head of Global Real Estate and Store Development on October 13, 2014. Mr. Noonan ceased to act as Head of Global Real Estate and Store Development on October 26, 2017. Accordingly, the amounts reported in the table for 2017 reflect compensation earned by or paid to Mr. Noonan for such year until such date. |
|
(6) |
Mr. Higginbotham joined the Company on August 12, 2013 as Head of Supply Chain. |
|
(7) |
Mr. Silver and Mr. Tafler were paid in Canadian dollars (their base salaries in effect as of March 20, 2017 and January 29, 2017 were respectively C$400,000 and C$222,256). Mr. Borgen received a portion of his base salary and annual bonus in Canadian dollars. His base salary in effect as of January 31, 2017 was US$355,000. |
|
(8) |
Amounts shown represent retention bonuses paid to certain Named Executive Officers. |
|
(9) |
Amounts shown reflect the aggregate grant date fair market value of time-vesting restricted stock units granted to all Named Executive Officers on April 18, 2017 (except for Mr. Silver whose grant was made on March 20, 2017 upon his start date), under the 2015 Omnibus Plan, excluding the value of estimated forfeitures on the shares. Assumptions used in the calculation of these amounts are disclosed in note 17 to the Company’s Consolidated Financial Statements for the year ended February 3, 2018. |
|
(10) |
Amounts shown reflect the aggregate grant date fair value of time-vesting stock options, using a Black-Scholes option pricing model, and exclude the value of estimated forfeitures. Assumptions used in the calculation of these amounts are included below for grants received by the named executive officers over the last three fiscal years and have been adjusted to reflect the May 12, 2015 1for 1.6 stock split on the Shares. Prior to the IPO, the fair market value of stock options was determined by an independent third party. The stock option value used for accounting and financial statement purposes is equal to the above-disclosed compensation value. |
|
|
2017-04-18 |
2017-03-20 |
2016-03-30 |
2015-01-14 |
2014-10-09 |
2014-07-25 |
2014-06-02 |
2013-08-12 |
2012-04-19 |
|
Exercise price ($ CDN) |
6.55$ USD |
7.70$ USD |
11.99$ USD |
4.30 |
4.31 |
4.25 |
4.25 |
3.33 |
0.77 |
|
Term (years) |
4.0 |
4.0 |
7.0 |
3.65 |
7.0 |
7.0 |
7.0 |
7.0 |
7.0 |
|
Dividend yield (%) |
0.0 |
0.0 |
0.0 |
0.0 |
0.0 |
0.0 |
0.0 |
0.0 |
0.0 |
|
Risk-free interest rate (%) |
1.79 |
1.79 |
1.23 |
1.15 |
1.52 |
1.52 |
1.52 |
2.03 |
1.44 |
|
Volatility (%) |
27.4% |
27.4% |
29.8% |
30.6% |
39.0% |
39.0% |
39.0% |
45.0% |
45.0% |
|
Fair market value ($ CDN) |
1.60$ USD |
1.88$ USD |
2.84$ USD |
1.06 |
1.84 |
1.85 |
1.85 |
1.63 |
0.37 |
|
Exchange rate |
- |
- |
- |
1.1932 |
1.1149 |
1.0814 |
1.0895 |
1.0297 |
1.0224 |
|
Fair market value ($ USD) |
1.60 |
1.88 |
2.84 |
0.89 |
1.65 |
1.71 |
1.70 |
1.58 |
0.36 |
|
(11) |
Represents the awards earned during the year under the Short-Term Annual Incentive Program. |
90
|
(12) |
The amounts shown represent amounts paid to Mr. Borgen, Ms. Bullen and Mr. Noonan pursuant to their separation agreements, the monthly car allowance for Mr. Silver, and the professional association fees for Mr. Tafler. |
Incentive Plan Awards
Outstanding share-based awards and option-based awards
The following table sets forth information regarding outstanding awards held by the named executive officers as of February 3, 2018. All outstanding stock options and restricted stock units were adjusted to reflect the May 12, 2015 stock split of 1.6-for-1 on the Common Shares.
|
|
Option Awards |
Share Awards |
||||||
|
|
|
|
|
|
|
|
Number of |
Market value |
|
|
|
Number of |
Number of |
|
|
|
shares |
of shares |
|
|
|
securities |
securities |
|
|
|
or units of |
or units of |
|
|
|
underlying |
underlying |
|
|
|
stock |
stock |
|
|
|
unexercised |
unexercised |
Option |
Option |
|
that |
that |
|
|
|
options - |
options - |
exercise |
expiration |
|
have not |
have not |
|
|
Grant |
exercisable(1) |
unexercisable |
price(2) |
date(3) |
Grant |
vested(4) |
vested(5) |
|
Name |
Date |
(#) |
(#) |
($) |
|
Date |
(#) |
($) |
|
Joel Silver |
2017-03-20 |
— |
106,450 |
7.70 |
2024-03-20 |
2017-03-20 |
25,970 |
101,283 |
|
President and Chief |
|
|
|
|
|
|
|
|
|
Executive Officer |
|
|
|
|
|
|
|
|
|
Howard Tafler |
2016-04-15 |
1,188 |
3,562 |
11.19 |
2023-04-15 |
2017-04-18 |
8,480 |
33,072 |
|
Chief Financial |
2013-02-22 |
10,000 |
— |
0.62 |
2020-02-22 |
2016-04-15 |
1,823 |
7,110 |
|
Officer |
|
11,188 |
3,562 |
|
|
2015-03-31 |
3,600 |
14,040 |
|
|
|
|
|
|
|
|
13,903 |
54,222 |
|
Luis Borgen |
2017-04-18 |
55,530 |
— |
6.55 |
2024-04-18 |
|
|
|
|
Former Chief Financial |
2016-04-15 |
13,940 |
— |
11.19 |
2023-04-15 |
|
|
|
|
Officer |
|
69,470 |
— |
|
|
|
|
|
|
Christine Bullen |
2016-05-24 |
9,655 |
— |
11.76 |
2018-10-26 |
|
|
|
|
Former Chief Operating Officer and |
|
|
|
|
|
|
|
|
|
President of DAVIDsTEA (USA) Inc. |
|
|
|
|
|
|
|
|
|
Edmund Noonan III |
2016-04-15 |
2,253 |
— |
11.19 |
2018-10-26 |
|
|
|
|
Former Head of Global Real Estate |
|
|
|
|
|
|
|
|
|
and Store Development |
|
|
|
|
|
|
|
|
|
Douglas Higginbotham |
2016-04-15 |
1,090 |
3,270 |
11.19 |
2023-04-15 |
2017-04-18 |
7,750 |
30,225 |
|
Head of Supply Chain |
2015-01-14 |
4,000 |
2,000 |
3.47 |
2022-01-14 |
2016-04-15 |
1,673 |
6,525 |
|
|
2013-08-12 |
20,000 |
— |
2.69 |
2020-08-12 |
2015-03-31 |
3,200 |
12,480 |
|
|
|
25,090 |
5,270 |
|
|
|
12,623 |
49,230 |
Notes:
|
(1) |
Unless earlier terminated, forfeited, relinquished or expired, the options will vest as to ¼th of the Shares on each of the first four anniversaries of the grant date and the option becoming vested as to 100% of the Shares on the final vesting date. Shares subject to the option will not vest on any vesting date unless the NEO has remained in continuous service from the date of grant through such vesting date, unless otherwise provided in the LTIP plan further discussed in Item 11 – Executive Compensation. |
|
(2) |
For option awards granted after the IPO, the exercise price is equal to the closing price of our common stock on the NASDAQ Global Market on the day the award was granted. For option awards granted prior to the IPO, the exercise price was determined by our Board based on an independent third party valuation and was denominated in Canadian dollars. As our shares are currently traded only on the NASDAQ in USD, the exercise prices of the pre-IPO awards have been converted to U.S. dollars based on the U.S. dollar/Canadian dollar exchange rate in effect as of February 2, 2018, the last business day of Fiscal 2017 of C$1 = US$1.2393. The actual exchange rate in effect at the time of exercise for options granted with a Canadian dollar exercise price will be used to convert the option exercise price to U.S. dollars. |
|
(3) |
All stock options have a seven‑year term. |
|
(4) |
Unless earlier terminated, forfeited, relinquished or expired, the RSUs will vest as to one quarter of the shares on each of the first two anniversaries of the grant date and remaining half of the RSUs will vest on the third anniversary of the grand date. Shares subject to the RSUs will not vest on any vesting date unless the NEO has remained in continuous service from the date of grant through such vesting date, unless otherwise provided in the LTIP plan further discussed in Item 11 – Executive Compensation. |
|
(5) |
The market value is calculated by multiplying the closing price of the Shares on the NASDAQ Global Market on February 2, 2018, being the last business day of the fiscal year, which closing price was US$3.90 per Share, by the number of restricted stock units that had not vested as of such date. |
91
Value vested or earned during the year
The following table sets forth information regarding option-based awards and share-based awards that vested in the fiscal year ended February 3, 2018 for the Named Executive Officers.
|
|
|
|
Non-equity |
|
|
|
|
incentive |
|
|
Option-based |
Share-based |
plan |
|
|
awards - |
awards - |
compensation |
|
|
Value vested |
Value vested |
Value earned |
|
|
during the |
during the |
during the |
|
|
year(1) |
year(2) |
year |
|
Name |
(US$) |
($) |
($) |
|
Joel Silver |
─ |
─ |
─ |
|
Howard Tafler |
61,787 |
16,754 |
─ |
|
Luis Borgen |
5,768 |
256,682 |
─ |
|
Christine Bullen |
— |
99,303 |
─ |
|
Edmund Noonan III |
6,722 |
85,178 |
─ |
|
Douglas Higginbotham |
31,284 |
15,001 |
─ |
Notes:
|
(1) |
The value is calculated as if the stock options were exercised on the vesting date of each relevant grant. The value represents the difference between the option’s exercise price and the closing share price on the NASDAQ on the vesting date, multiplied by the number of shares underlying the options that vested. As the Shares are traded only on the NASDAQ in US dollars, the exercise prices of the pre-IPO awards have been converted to USD based on the noon buying rate of the U.S. Federal Reserve Bank of New York on February 2, 2018, the last business day of this fiscal year, being $1.2393. For vesting dates prior to the IPO, the quarterly share valuation, as determined by our Board based in part on an independent third party valuation, was used. The actual value earned, if any, will be different and will be based on the closing price of the Shares on the actual date of exercise. |
|
(2) |
The value is calculated by multiplying the number of RSUs vested by the closing Share price on the NASDAQ on the vesting date. |
Equity Compensation Plan Information
The table below illustrates the status of the shares reserved for issuance under the Company’s equity-based incentive plans.
|
|
|
|
|
Number of |
|
|
|
Number of |
Weighted |
securities available |
|
|
|
securities to be |
average |
for future issuance |
|
|
|
issued upon |
exercise price |
under equity |
|
|
|
exercise of |
of |
compensation plans |
|
|
|
outstanding |
outstanding |
(excluding |
|
|
|
options, warrants |
options, warrants |
securities reflected |
|
|
|
and rights(2) |
and rights(3)(4) |
in column (a)) |
|
|
|
(#) |
($USD) |
(#) |
|
Plan Category |
Plan Name |
|
|
(c) |
|
Equity compensation plans |
Amended and Restated Equity Incentive Plan(1) |
222,996 |
3.20 |
— |
|
|
2015 Omnibus Equity Incentive Plan |
669,173 |
11.13 |
770,827 |
|
Equity compensation plans |
N/A |
— |
— |
— |
|
Total |
892,169 |
|
770,827 |
|
|
(1) |
Since the adoption of the 2015 Omnibus Plan in connection with the IPO, no awards have been or will be made under the Equity Plan. Outstanding options previously granted under the Equity Plan remain subject to the terms of the Equity Plan. |
|
(2) |
Reflects outstanding stock options and restricted stock units. |
|
(3) |
Restricted stock units have no exercise price and, therefore, the weighted average price does not take these awards into account. |
|
(4) |
The weighted average exercise price of outstanding options have been converted from CAD to USD at an exchange rate of 1.2393. |
92
Termination and change in control benefits
The Named Executive Officers would be entitled to the following payments and benefits in the event of termination of the executive’s employment pursuant to the employment agreement between the executive and the Company.
Mr. Joel Silver
In March 2017, the Company entered into an employment agreement with Mr. Silver, the President and CEO of the Company. Pursuant to his employment agreement, if Mr. Silver’s employment is terminated by the Company without cause, he will be entitled to a severance equivalent to 12 months of base salary plus an amount equal to the performance bonus awarded to the Executive in the fiscal year immediately preceding the year in which the termination of the Executive’s employment occurs. The value of such salary continuance was estimated at $400,000 had termination of employment happened on February 2, 2018. Should the Executive not commence Alternate Employment before the expiry of the First Severance Pay Period, the Corporation shall continue payment of the Executive's Base Salary on a monthly basis less applicable statutory deductions, for a period of twelve (12) additional months commencing on the expiry the Severance Pay Period up until the first to occur of the following: i) the date the Executive commences Alternate Employment; or ii) the last day of the twelve (12) month period following the expiry of the First Severance Pay Period. There is no specific change in control provision agreed upon between the Company and Mr. Silver in his employment agreement.
Mr. Howard Tafler
In August 2017, the Company entered into an employment agreement with Mr. Tafler, the Chief Financial Officer of the Company. Pursuant to his employment agreement, if Mr. Tafler’s employment is terminated by the Company without cause, he will be entitled to a severance equivalent to 12 months of base salary and a pro rata portion of his annual cash performance bonus for the year in which the termination occurs paid at expected actual payout level. The value of such salary continuance was estimated at $265,000 had termination of employment happened on February 2, 2018. There is no specific change in control provision agreed upon between the Company and Mr. Tafler in his employment agreement.
Mr. Luis Borgen
On December 7, 2016, the Company entered into an agreement which modified, in part, Mr. Luis Borgen’s existing equity and employment agreements with the Company. The agreement provided for a term of employment until July 31, 2017. As per this agreement, Mr. Borgen was entitled to receive on July 31, 2017 the severance benefits under his existing employment agreement, as well as acceleration of all his unvested options and unvested restricted stock units. Mr. Borgen received $639,653 which includes (a) twelve months’ Base Salary (i.e., $359,000USD), (b) an amount equal to the average annual cash performance bonus paid to the Executive for the two fiscal years ending in each of 2014 and 2015, which is $208,353USD, and (c) an amount determined by multiplying the Executive’s target annual cash performance bonus for fiscal year 2017, which is 40% of his Base Salary which is $71,800USD. Also on July 31, 2017, outstanding equity awards held by Mr. Borgen became fully vested, and exercisable or payable.
Ms. Christine Bullen
Ms. Bullen’s employment with the Company was terminated on October 26, 2017 and she was entitled to a severance payment of $372,317USD which included (a) an amount of $255,000USD which equal to nine months of Base Salary, (b) an amount of $102,000USD which was determined by multiplying her target annual cash performance bonus for fiscal year 2017 by a fraction, the numerator of which is the number of days worked in fiscal 2017 and the denominator of which is 365, and (c) an amount equal to nine months’ coverage under COBRA.
Mr. Edmund Noonan III
Mr. Noonan’s employment with the Company was terminated on October 26, 2017. Pursuant to his employment agreement, he was entitled to a severance payment of $144,850, an amount equivalent to 6 months of base salary and a pro rata portion of his annual cash bonus for the year.
Voluntary Resignation
Unvested options granted under the Equity Incentive Plan will be forfeited upon a termination of employment due to a voluntary resignation and vested options will remain exercisable for a period of 30 days following such termination. Under the 2015 Omnibus Plan, vested options will remain exercisable until the earlier of the one-year anniversary of the termination of employment or the award’s normal expiration date. Unvested awards under the 2015 Omnibus Plan will be forfeited at the time of such termination.
93
Termination for Cause
Vested and unvested awards under both the Equity Incentive Plan and the 2015 Omnibus Plan will be forfeited immediately at time of termination.
Termination Due to Death
Unvested options granted under the Equity Incentive Plan will be forfeited upon death while vested options will remain exercisable by the estate for a period of 180 days following death. Under the 2015 Omnibus Plan, upon death, all time-based awards will immediately vest and performance awards will vest at the target level of performance. Options will remain exercisable until the earlier of the one-year anniversary of the executive’s death or the award’s normal expiration date.
Termination Due to Disability
Unvested options granted under the Equity Incentive Plan will be forfeited upon termination of employment while vested options will remain exercisable for a period of 180 days following termination. Under the 2015 Omnibus Plan, upon a termination of employment due to disability, all time-based awards will immediately vest and performance awards will remain eligible to vest to the extent the applicable performance goals are achieved. Options will remain exercisable until the earlier of the one-year anniversary of the participant’s termination of employment due to disability or the award’s normal expiration date.
Retirement
Unvested options granted under the Equity Incentive Plan be will be forfeited upon retirement while vested options will remain exercisable for a period of 90 days. Awards other than stock options made under the 2015 Omnibus Plan will vest based on a pro rata of elapsed days between the start of the performance period and the complete 3-year period. If a performance condition is attached to the vesting, the outstanding awards will be treated as per the achievement of the performance criterion at the time of retirement. Vested options will remain exercisable for a period of 5 years following retirement or until the original option expiry date. For purposes of the plan, retirement is defined as 65 years of age and 55 years of age with 10 years of service or more.
Involuntary Termination
Unvested options granted under the Equity Incentive Plan will be forfeited upon an involuntary termination of employment by the Company while vested options will remain exercisable for a period of 30 days. Under the 2015 Omnibus Plan, upon an involuntary termination of employment by the Company, options will be forfeited to the extent then unvested and vested options will remain exercisable until the earlier of the one-year anniversary of the participant’s termination of service or the award’s normal expiration date. RSUs and performance awards will be deemed vested pro rata based on the number of days in a specified period (i.e. the period from the date of grant to the third anniversary of the grant date) that have elapsed from the date of grant to the six-month anniversary of the date of the termination of employment, with the vesting of performance awards to be subject to performance assessed as of the date of such termination of employment.
Change in Control
Under the Equity Incentive Plan, upon the occurrence of a trigger event (as defined in the Equity Plan, generally a liquidation or change of control), participants holding vested options or options that would vest upon the completion of the trigger event will have the right to exercise such options on a basis that allows the participants to tender the common shares delivered upon such exercise in the transaction and any options not so exercised will expire and be cancelled upon the completion of the trigger event. In the event of a trigger event in which the purchase price in the transaction will be paid in cash, in lieu of a participant exercising his or her vested options prior to the trigger event, the participant may require us to purchase his or her options for a purchase price per common share equal to the purchase price per common share in the transaction times the number of common shares subject to the option, minus the aggregate exercise price for such common shares, subject to the completion of the trigger event.
Under the 2015 Omnibus Plan, upon a termination by the Company other than for Cause within 12 months following a change in control, to the extent granted prior to the time of the change in control and then outstanding, all time-based awards will vest and performance awards will vest at the target level of performance. Options will remain exercisable until the earlier of the one-year anniversary of the participant’s termination of employment or service due to disability or the award’s normal expiration date.
94
Director Compensation
Compensation of Directors
In connection with the Company’s listing on the NASDAQ, the Board adopted a non-employee director compensation policy. On February 15, 2017, the Board approved amendments that came into effect on June 8, 2017. The policy is designed to enable the Company to attract and retain highly qualified non-employee directors. Under the policy effective during the year ended February 3, 2018, all non-employee directors received the cash and equity compensation set forth below.
Effective from January 29, 2017 until June 8, 2017
|
Board Chair |
|
||
|
Annual retainer |
C$100,000 |
||
|
Annual target equity grant |
US$85,000 |
||
|
Board member |
|
||
|
Annual retainer |
C$50,000 |
||
|
Annual target equity grant |
US$85,000 |
||
|
Board meeting fees |
C$1,000 (C$500 for teleconference) payable only after the fourth Board meeting in a year |
||
|
Audit Committee Chair |
|
||
|
Additional annual retainer |
C$15,000 minimum |
||
|
Audit Committee meeting fees |
C$1,000 (C$500 for teleconference) |
||
|
|
|
||
|
Human Resources and Compensation Committee Chair |
|
||
|
Additional annual retainer |
C$10,000 minimum |
||
|
Human Resources and Compensation Committee meeting fees |
C$1,000 ($500 for teleconference) |
||
|
|
|
||
|
Corporate Governance and Nominating Committee meeting fees |
C$1,000 ($500 for teleconference) |
Effective since June 8, 2017
|
Board Chair |
|
||
|
Annual retainer |
C$100,000 |
||
|
Annual target equity grant |
15,000 RSUs or DSUs, at the option of the Director |
||
|
Board member |
|
||
|
Annual retainer |
C$50,000 |
||
|
Annual target equity grant |
7,500 RSUs or DSUs, at the option of the Director |
||
|
Board meeting fees |
C$500 for teleconference meetings only and payable after the fourth Board meeting in a year |
||
|
Audit Committee Chair |
|
||
|
Additional annual retainer |
C$15,000 minimum |
||
|
Audit Committee meeting fees |
None |
||
|
|
|
||
|
Human Resources and Compensation Committee Chair |
|
||
|
Additional annual retainer |
C$10,000 minimum |
||
|
Human Resources and Compensation Committee meeting fees |
None |
||
|
|
|
||
|
Corporate Governance and Nominating Committee Chair |
|
||
|
Additional annual retainer |
C$10,000 minimum |
||
|
Corporate Governance and Nominating Committee meeting fees |
None |
||
|
|
|
||
|
Special Committee Chair(1) |
|
||
|
Monthly retainer |
C$7,800 |
||
|
Special Committee member |
|
||
|
Monthly retainer |
C$3,900 (US$3,000 for US Directors) |
Notes:
|
(1) |
On February 26, 2018, the Board formed a Special Committee of independent directors for the purpose of reviewing strategic alternatives on behalf of the Company. |
Under our non‑employee director compensation policy in effect on February 3, 2018, annual retainers and meeting fees are paid in quarterly cash payments. Equity grants generally will be made in the form of restricted stock units or deferred share units granted
95
under the 2015 Omnibus Plan and will generally vest in full on the first anniversary of the grant date. Equity awards under the non‑employee director compensation policy will be made at a date following the Company’s annual Meeting of Shareholders.
The following table sets forth information concerning the compensation earned by our non‑employee directors during the fiscal year ending February 3, 2018. Mr. Silver received no additional compensation for services as director and, consequently, is not included in this table. The compensation received by Mr. Silver as our President and Chief Executive Officer can be found in the Summary Compensation Table above.
Director Compensation Table
The following table sets forth information concerning all amounts of compensation provided to the directors of the Company who are not members of the management of the Company for the fiscal year ended February 3, 2018.
|
|
|
|
|
|
Change in |
|
|
|
|
|
|
|
|
pension |
|
|
|
|
|
|
|
|
value and |
|
|
|
|
|
|
|
Non-equity |
non-qualified |
|
|
|
|
Fees earned |
|
|
incentive |
deferred |
All |
|
|
|
or paid |
Stock |
Option |
compensation |
compensation |
other |
|
|
Name |
in cash(12) |
awards(13) |
awards |
plan |
earnings |
compensation |
Total |
|
|
($) |
($) |
($) |
($) |
($) |
($) |
($) |
|
Emilia Di Raddo(1) |
42,363 |
46,500 |
─ |
─ |
─ |
─ |
88,863 |
|
Tom Folliard(2) |
26,224 |
— |
─ |
─ |
─ |
─ |
26,224 |
|
Tyler Gage(3) |
30,374 |
46,500 |
─ |
─ |
─ |
─ |
76,874 |
|
Michael J Mardy(4) |
57,694 |
46,500 |
─ |
─ |
─ |
─ |
104,194 |
|
David W. McCreight(5) |
45,590 |
46,500 |
─ |
─ |
─ |
─ |
92,090 |
|
Gary O'Connor(6) |
31,527 |
46,500 |
─ |
─ |
─ |
─ |
31,527 |
|
Lorenzo Salvaggio(7) |
39,140 |
37,500 |
─ |
─ |
─ |
─ |
76,640 |
|
Herschel Segal(8) |
43,976 |
46,500 |
─ |
─ |
─ |
─ |
90,476 |
|
Sarah Segal(9) |
27,833 |
46,500 |
─ |
─ |
─ |
─ |
74,333 |
|
Kathleen C. Tierney(10) |
60,115 |
46,500 |
─ |
─ |
─ |
─ |
106,615 |
|
Maurice Tousson(11) |
211,006 |
178,019 |
─ |
─ |
─ |
─ |
389,025 |
Notes:
|
(1) |
Ms. Di Raddo ceased to be a member of the HRCC effective June 7, 2017. She was a member of the Corporate Governance and Nominating Committee effective September 7, 2017 until March 22, 2018. |
|
(2) |
Mr. Folliard was not nominated for re-election and ceased to be a director of the Board effective June 8, 2017 and a member of the HRCC and the Governance and Nominating Committee effective June 7, 2017. |
|
(3) |
Mr. Gage was elected as a director of the Board on June 8, 2017. He was appointed a member of the Governance and Nominating committee effective September 7, 2017 and a member of the Audit Committee effective February 20, 2018. |
|
(4) |
Mr. Mardy is a director of the Board and Chair of the Audit Committee. He was appointed a member of the Governance and Nominating committee effective September 7, 2017 and a member of the HRCC effective April 18, 2018. |
|
(5) |
Mr. McCreight ceased to be a member of the Corporate Governance and Nominating Committee effective June 7, 2017. He ceased to be a director of the Board and a member of the HRCC and Audit Committee effective February 20, 2018. |
|
(6) |
Mr. O’Connor was elected as a director of the Board on June 8, 2017. He was also appointed a member of the Audit Committee and Chair of the Governance and Nominating committee effective June 8, 2017. |
|
(7) |
Mr. Salvaggio ceased to be a director of the Board and a member of the HRCC effective March 5, 2018. |
|
(8) |
Mr. Segal ceased to be a member of the Corporate Governance and Nominating Committee effective June 7, 2017. He ceased to be a director of the Board effective March 5, 2018. |
|
(9) |
Ms. Segal ceased to be a member of the Corporate Governance and Nominating Committee effective June 6, 2017. She ceased to be a director of the Board effective September 7, 2017. |
|
(10) |
Ms. Tierney was appointed a member of the Corporate Governance and Nominating Committee effective March 28, 2018. |
|
(11) |
Mr. Tousson was elected as a director of the Board on June 9, 2016 and was then appointed Chairman, as well as a member of the HRCC and Audit committee, effective June 9, 2016. He ceased to be a member of the Audit Committee effective June 7, 2017. The fees and share-based awards for Mr. Tousson include special fees and equity grants approved by the Board in acknowledgement of Mr. Tousson’s additional responsibilities in his role as Chairman of the Board mainly with regards to the transition period related to the departure of the Former President and CEO, Mr. Toutant, and the appointment of the new President and CEO, Mr. Joel Silver. |
|
(12) |
Director fees were paid in cash in Canadian dollars except for Ms. Tierney and Messrs. Folliard, Gage, Mardy and McCreight, who are all US residents. Their respective compensation was converted to U.S. dollars at the time of payment. |
|
(13) |
Stock awards are made based on the closing price of the shares on the NASDAQ on the grant date which price is in US dollars. For the Board members receiving their compensation in Canadian dollars, the fair market value of stock awards was converted to Canadian dollars using the noon exchange rate from the U.S. Federal Reserve Bank of New York of on such date. |
96
The directors are reimbursed by the Company for the reasonable costs and expenses incurred in connection with attending meetings of the Board of Directors and its committees including, to the extent applicable, the cost of travel on commercial or leased aircraft.
Outstanding option-based awards for directors
In fiscal years prior to fiscal 2017, some of the Company’s directors were granted options to buy Common Shares in exchange for their service on the Board of Directors. As of the end of the fiscal year ended February 3, 2018, these options are still outstanding and presented in the table below.
|
|
Option-based Awards(1) |
|||
|
|
Number of |
|
|
|
|
|
securities |
|
|
Value of |
|
|
underlying |
Option |
Option |
unexercised |
|
|
unexercised |
exercise |
expiration |
in-the-money |
|
Name |
options |
price(2) |
date(3) |
options(4) |
|
|
(#) |
(C$) |
|
(US$) |
|
Emilia Di Raddo |
48,635 |
3.33 |
2021-03-03 |
58,994 |
|
David W. McCreight |
49,761 |
4.31 |
2021-12-02 |
21,161 |
Notes:
|
(1) |
Mmes. Tierney and Segal, Messrs. Gage, O’Connor, Mardy, Salvaggio, Segal, and Tousson have not been granted stock options and therefore are not represented in this table. |
|
(2) |
The exercise price is denominated in Canadian dollars as the options were awarded prior to the IPO. Upon exercise of the options, the exercise price will be converted to USD. |
|
(3) |
All stock options have a seven-year (7) term and generally vest in 36 monthly installments. |
|
(4) |
The aggregate dollar value of the in the-money unexercised options is the positive difference between the exercise price and the closing price of the Shares on the NASDAQ on February 2, 2018, the last business day of the fiscal year, which closing price was $3.90USD per Share. Actual gains, if any, on exercise day will depend on the value of the Shares on the date of exercise. There is no guarantee that gains will be realized. |
Value vested or earned during the year for directors
The following table sets forth information regarding option-based awards and share-based awards the vesting in the fiscal year ended February 3, 2018 for our directors.
|
|
|
|
Non-equity incentive |
|
|
Option-based awards - |
Share-based awards - |
plan compensation - |
|
|
Value vested during |
Value vested during |
Value earned during |
|
Name |
the year(1)(2) |
the year |
the year |
|
|
(US$) |
($) |
($) |
|
Emilia Di Raddo |
10,839 |
22,289 |
─ |
|
Tom Folliard |
10,839 |
22,289 |
─ |
|
Michael J. Mardy |
─ |
22,289 |
─ |
|
David W. McCreight |
33,583 |
22,289 |
─ |
|
Lorenzo Salvaggio |
─ |
44,219 |
─ |
|
Herschel Segal |
─ |
22,289 |
─ |
|
Sarah Segal |
─ |
22,289 |
─ |
|
Kathleen C. Tierney |
─ |
22,289 |
─ |
|
Maurice Tousson |
─ |
141,277 |
─ |
Notes:
|
(1) |
Mmes. Tierney and Sarah Segal and well as Messrs. Gage, Mardy, O’Connor, Salvaggio, Herschel Segal and Tousson have not been granted stock options. |
|
(2) |
The value is calculated as if the stock options were exercised on the vesting date of each relevant grant. The value represents the difference between the option’s exercise price and the closing share price on the NASDAQ on the vesting date, multiplied by the number of shares underlying the options that vested. As the Shares are traded only on the NASDAQ in US dollars, the exercise prices of the pre-IPO awards have been converted to USD based on the noon buying rate of the U.S. Federal Reserve Bank of New York on February 2, 2018, the last business day of this fiscal year, being $1.2393. For vesting dates prior to the IPO, the quarterly share valuation, as determined by our Board based in part on an independent third party valuation, was used. The actual value earned, if any, will be different and will be based on the closing price of the Shares on the actual date of exercise. |
97
Indebtedness of Directors and Officers
As of April 12, 2018, no executive officer, director, proposed nominee for election as a director or employee, former or present, of the Company was indebted to the Company including in respect of indebtedness to others where the indebtedness is the subject of a guarantee, support agreement, letter of credit or other similar arrangement provided by the Company.
ITEM 12. SECURITY OWNERSHIP OF CERTAIN BENEFICIAL OWNERS AND MANAGEMENT AND RELATED STOCKHOLDER MATTERS
The following table shows, as of April 12, 2018, the number of common shares beneficially owned by each director, director nominee and executive officer named in the Summary Compensation Table in Item 11 and all directors, director nominees and executive officers as a group.
The following table and accompanying footnotes set forth information relating to the beneficial ownership of our common shares as of April 12, 2018 by:
|
· |
each person, or group of affiliated persons, known by us to beneficially own more than 5% of our outstanding common shares; |
|
· |
each of our directors and director nominees; |
|
· |
each of our named executive officers; |
|
· |
all directors and executive officers as a group. |
Our major shareholders do not have voting rights that are different from our shareholders in general.
Each shareholder’s percentage ownership is based on 25,897,837 common shares outstanding as of April 12, 2018.
Beneficial ownership is determined in accordance with SEC rules. In general, under these rules a beneficial owner of a security includes any person who, directly or indirectly, through any contract, arrangement, understanding, relationship or otherwise has or shares voting power or investment power with respect to such security. A person is also deemed to be a beneficial owner of a security if that person has the right to acquire beneficial ownership of such security within 60 days. Except as otherwise indicated, and subject to applicable community property laws, the persons named in the table have sole voting and investment power with respect to all common shares held by that person. Our common shares that a person has the right to acquire within 60 days of April 12, 2018 are deemed outstanding for purposes of computing the percentage ownership of such person holding, but are not deemed outstanding for purposes of computing the percentage ownership of any other person, except with respect to the percentage ownership of all directors, director nominees and executive officers as a group. As of April 12, 2018, 8,016,234 shares were owned by 4 United States holders of record.
Unless otherwise indicated below, the address for each beneficial owner listed is c/o DAVIDsTEA Inc., 5430 Ferrier, Mount‑Royal, Québec, Canada, H4P 1M2.
98
Transfer Agent and Registrar
The Company’s transfer agent and registrar is AST Trust Company, Montréal.
|
|
|
|
|
|
Shares Beneficially Owned |
|
|
|
as at April 12, 2018 |
|
|
|
Number of |
Percentage |
|
|
shares |
of shares |
|
Name of beneficial owner |
(#) |
(%) |
|
|
|
|
|
Beneficial Owners of more than 5% of our common shares and/or selling shareholders: |
|
|
|
Rainy Day Investments Ltd.(1) |
11,910,833 |
46.0% |
|
Porchlight Equity Management, LLC |
3,304,306 |
12.8% |
|
TDM Asset Management PTY Ltd. |
3,162,520 |
12.2% |
|
Edgepoint Investment Group |
2,984,352 |
11.5% |
|
|
|
|
|
Named Executive Officers and Directors: |
|
|
|
Joel Silver(2) |
33,105 |
* |
|
Howard Tafler(3) |
22,026 |
* |
|
Douglas Higginbotham(4) |
28,675 |
* |
|
Maurice Tousson(5) |
10,909 |
* |
|
Emilia Di Raddo(6) |
50,158 |
* |
|
Michael J. Mardy(7) |
4,595 |
* |
|
Kathleen C. Tierney(8) |
3,595 |
* |
|
Gary O'Connor |
— |
— |
|
Tyler Gage |
— |
— |
|
All executive officers and directors as a group(9) |
153,063 |
* |
|
|
|
|
Notes:
*represents less than 1%.
|
(1) |
Rainy Day Investments Ltd. (“Rainy Day”) is a company controlled by Herschel Segal, who holds voting and investment control over the shares held by Rainy Day. The principal business address for Rainy Day is 5695 Ferrier, Mount Royal, Québec, Canada, H4P 1N1. |
|
(2) |
Consists of 6,493 RSUs and options to purchase 26,613 common shares held by Mr. Silver. |
|
(3) |
Consists of 6,923 common shares owned by Mr. Tafler, as well as 2,728 RSUs and options to purchase 12,375 common shares held by Mr. Tafler. |
|
(4) |
Consists of 2,495 RSUs and options to purchase 26,180 common shares held by Mr. Higginbotham. |
|
(5) |
Consists of 10,909 common shares owned by Mr. Tousson. |
|
(6) |
Consists of 1,523 common shares owned by Ms. Di Raddo and options to purchase 48,635 common shares held by Ms. Di Raddo. |
|
(7) |
Consists of 4,595 common shares owned by Mr. Mardy. |
|
(8) |
Consists of 3,595 common shares owned by Ms. Tierney. |
|
(9) |
Includes RUSs vesting and options to purchase common shares exercisable within 60 days of April 12, 2018. |
ITEM 13. CERTAIN RELATIONSHIPS AND RELATED TRANSACTIONS, AND DIRECTOR INDEPENDENCE
Our audit committee reviews and approves related party transactions or recommends related party transactions for review by independent members of our Board of Directors. Each of the transactions described below have been reviewed by our audit committee.
Arrangements with Our Investors
We have entered into an amended and restated investors’ rights agreement with certain of our shareholders.
Investors’ Rights Agreement
In February 2014, in connection with the issuance of our Series A-1 preferred shares, we entered into an amended and restated investors’ rights agreement, which was amended in December 2014 in connection with our issuance of our Series A-2 preferred shares. The agreement contains provisions related to registration rights, information and observation rights, rights to future share issuances and approval rights by certain investors and/or their board designees. The information and observation rights, rights to future share issuance and approval rights terminated as a result of our IPO.
Subject to certain conditions, holders of 20% or more of the Investor Registrable Shares or 20% or more of the Rainy Day Registrable Securities (as those terms are defined in the agreement) have the right to demand that we register under the Securities Act
99
or under Canadian securities laws all or a portion of such shareholder or shareholders’ Registrable Securities at our expense. Such rights became effective as of April 3, 2015. Upon the exercise of this right, we must give notice to all other parties who then hold registrable securities, as defined in the agreement, to permit them to participate in the offering.
In addition, if we propose to register our common shares under the Securities Act or under any Canadian securities laws, we must give prompt notice to each holder of registrable securities of our intent to do so and each such holder has piggyback registration rights and is entitled to include any part of its registrable securities in such registration, subject to certain conditions.
Finally, at times when we are eligible to use a shelf registration statement on Form S-3 or Form F-3, holders of registrable securities may demand that we file a Form S-3, F-3 or S-10 registration statement with respect to any or a portion of such holder’s registrable securities having an anticipated aggregate offering price, net of all underwriting discounts, selling commissions, share transfer taxes and certain other expenses, of at least $1 million. Upon receiving notice of such a demand, we must notify all other holders to permit them to exercise piggyback registration rights with respect to such demand.
Director Independence
Five of our seven directors that make up our board of directors are considered independent under Canadian securities laws and the NASDAQ rules. Under these rules, Maurice Tousson, the chairman of our Board of Directors, as well as Tyler Gage, Gary O’Connor, Kathleen C. Tierney and Michael J. Mardy are considered independent, whereas Emilia Di Raddo and Joel Silver are not considered to be independent as a result of their respective relationships with the Company or their relationships with other non‑independent members of our board of directors. The independence of directors is determined by the Board based on the results of independence questionnaires completed by each director annually, as well as other factual circumstances reviewed on an ongoing basis.
To enhance the independent judgment of the Board of Directors the independent members of the Board of Directors frequently meet in the absence of members of management and the non-independent directors. An in camera session is now scheduled as part of every meeting of the Board of Directors and its committees to allow independent directors to meet without non-independent directors and members of management, as necessary. All non-independent directors are responsible to the Board of Directors as a whole and have a duty of care to the Company.
ITEM 14. PRINCIPAL ACCOUNTANT FEES AND SERVICES
The following table sets forth the aggregate fees billed to the Company for the fiscal years ended February 3, 2018 and January 28, 2017 by EY:
|
|
|
For the year ended |
||
|
|
|
February 3, |
|
January 28, |
|
|
|
2018 |
|
2017 |
|
|
|
$ |
|
$ |
|
|
|
|
|
|
|
Audit fees (1) |
|
478,000 |
|
385,250 |
|
Audit-related fees (2) |
|
15,000 |
|
40,000 |
|
Tax fees (3) |
|
73,845 |
|
19,366 |
|
All other fees (4) |
|
— |
|
— |
|
|
|
566,845 |
|
444,616 |
Notes:
|
(1) |
Audit fees consist of fees billed for professional services rendered for the audit of our consolidated annual financial statements and review of the interim consolidated financial statements included in our quarterly reports, consultation concerning financial reporting and accounting standards, translation services, and services provided in connection with statutory and regulatory filings or engagements, including consent procedures in connection with public filings. |
|
(2) |
Audit-related fees consist of fees billed for related services that are reasonably related to the performance of the audit or review of our consolidated financial statements and that are not reported under "Audit Fees", including fees billed in relation to our initial public offering. |
|
(3) |
Tax fees consist of fees billed for professional services rendered for tax compliance, tax advice and tax planning (domestic and international). These services include assistance regarding federal, state and international tax compliance, and transfer pricing studies and advisory services. |
|
(4) |
All other fees consist of fees for all other professional services and products rendered by EY. |
100
All fees paid and payable by the Company to EY in Fiscal 2017 and Fiscal 2016 were pre-approved by the Company’s Audit Committee pursuant to the procedures and policies set forth in the Audit Committee mandate. The Audit Committee's policy is to pre-approve all audit and permissible non-audit services provided by our independent registered public accounting firm. These services may include audit services, audit-related services, tax services and other services. Pre-approval is generally provided for up to one year and any pre-approval is detailed as to the particular service or category of services. The independent registered public accounting firm and management are required to periodically report to the Audit Committee regarding the extent of services provided by the independent registered public accounting firm in accordance with this pre-approval. The Chairperson of the Audit Committee is also authorized, pursuant to delegated authority, to pre-approve additional services on a case-by-case basis, and such approvals are communicated to the full Audit Committee at its next meeting.
101
ITEM 15. EXHIBITS AND FINANCIAL STATEMENT SCHEDULES
The following documents are filed as part of this Form 10-K:
(a)(1) Financial Statements
The audited consolidated financial statements of the Company filed as part of this Annual Report on Form 10-K are included in Part II, Item 8, and include:
|
Report of Independent Registered Public Accounting Firm |
|
As of February 3, 2018 and January 28, 2017: |
|
Consolidated Balance Sheets |
|
For the years ended February 3, 2018, January 28, 2017 and January 30, 2016: |
|
Consolidated Statements of Income (Loss) and Comprehensive Income (Loss) |
|
Consolidated Statements of Cash Flows |
|
Consolidated Statements of Equity |
|
Notes to Consolidated Financial Statements |
(a)(2) Financial Statement Schedule
All other schedules are omitted because they are not applicable or the required information is shown in the consolidated financial statements or notes thereto.
102
(a)(3) Exhibits
103
|
|
|
Incorporated by Reference (File No. 333-203219, unless otherwise indicated) |
||
|
Exhibit Number |
Description of Document |
Form |
Filing Date |
Exhibit Number |
|
10.27 |
Executive Employment Agreement between DAVIDsTEA Inc. and Howard Tafler, dated September 7, 2017 |
10-Q |
9/7/2017 |
10.1 |
|
21.1 |
|
4/19/2018 |
Filed herewith |
|
|
23.1 |
|
4/19/2018 |
Filed herewith |
|
|
31.1 |
|
4/19/2018 |
Filed herewith |
|
|
31.2 |
|
4/19/2018 |
Filed herewith |
|
|
32.1 |
|
4/19/2018 |
Filed herewith |
|
|
32.2 |
|
4/19/2018 |
Filed herewith |
|
|
101.INS |
101.INS XBRL Instance |
|
4/19/2018 |
Filed herewith |
|
101.SCH |
101.SCH XBRL Taxonomy Extension Schema |
|
4/19/2018 |
Filed herewith |
|
101.CAL |
101.CAL XBRL Taxonomy Extension Calculation |
|
4/19/2018 |
Filed herewith |
|
101.LAB |
101.LAB XBRL Taxonomy Extension Labels |
|
4/19/2018 |
Filed herewith |
|
101.PRE |
101.PRE XBRL Taxonomy Extension Presentation |
|
4/19/2018 |
Filed herewith |
|
101.DEF |
101.DEF XBRL Taxonomy Extension Definition |
|
4/19/2018 |
Filed herewith |
None
104
Pursuant to the requirements of Section 13 or 15(d) of the Securities Exchange Act of 1934, the registrant has duly caused this report to be signed on its behalf by the undersigned, thereunto duly authorized.
|
|
DAVIDsTEA INC. |
|||
|
|
|
|||
|
|
|
|||
|
|
By: |
/s/ Joel Silver |
||
|
Date: April 19, 2018 |
Name: |
Joel Silver |
||
|
|
Title: |
President and Chief Executive Officer |
||
105
Pursuant to the requirements of the Securities Act of 1934, this report has been signed below by the following persons on behalf of the registrant and in the capacities and on the date indicated.
|
/s/ Maurice Tousson |
|
Chairman of the Board of Directors |
|
Name: Maurice Tousson |
|
|
|
|
|
|
|
|
|
|
|
/s/ Joel Silver |
|
President, Chief Executive Officer and Director (principal executive officer) |
|
Name: Joel Silver |
|
|
|
|
|
|
|
/s/ Howard Tafler |
|
Chief Financial Officer (principal financial officer and principal accounting officer) |
|
Name: Howard Tafler |
|
|
|
|
|
|
|
/s/ Michael J. Mardy |
|
Director |
|
Name: Michael J. Mardy |
|
|
|
|
|
|
|
/s/ Kathleen C. Tierney |
|
Director |
|
Name: Kathleen C. Tierney |
|
|
|
/s/ Emilia Di Raddo |
|
Director |
|
Name: Emilia Di Raddo |
|
|
|
|
|
|
|
|
|
|
|
/s/ Gary O’Connor |
|
Director |
|
Name: Gary O’Connor |
|
|
|
|
|
|
|
/s/ Tyler Gage |
|
Director |
|
Name: Tyler Gage |
|
|
Date: April 19, 2018
106