Attached files
| file | filename |
|---|---|
| 8-K - FORM 8-K - CITIZENS & NORTHERN CORP | tv491422_8k.htm |

Today, Tomorrow and the Future 2018 Annual Shareholders’ Meeting Thursday, April 19, 2018 Exhibit 99.1

Welcome • Procedural Agenda • Election of Four Class I Directors • Other Proposals on the Ballot • Chairman’s Comments • CEO Comments • Financial Review • Shareholder Value • Q&A 2

Procedural Agenda • Appointments • Determination of Quorum • Minutes of 2017 Annual Meeting • Judges of Election 3
Election of Directors Bobbi J. Kilmer Terry L. Lehman Frank G. Pellegrino James E. Towner 4
Other Proposals on the Ballot • Second Amendment to the Citizens & Northern Corporation Independent Directors Stock Incentive Plan • Say on Pay • Appointment of Independent Auditor • Baker Tilly Virchow Krause, LLP 5
Chairman’s Comments Leo F. Lambert Chairman of the Board 6
Chairman’s Comments • Chuck Ferry – Stevens & Lee Law Firm • Ivan Cilik , CPA – Baker Tilly Virchow Krause, LLP 7
Chairman’s Comments • The Board • Retirements • R. Bruce Haner • Edward H. Owlett, III • Appointments • Bobbi J. Kilmer 8
CEO Comments Brad Scovill President & Chief Executive Officer 9
Mission, Vision & Values Mission : Creating Value Through Lifelong Relationships Vision : Every Customer Says , “ C&N is the ONLY bank I need.” Values : Teamwork Respect Responsibility & Accountability Excellence Integrity Client - Focus Have Fun 10
External Influences • Economic Indicators • GDP • Employment • Energy • Equity Markets • Inflation • Housing • Monetary Policy & Interest Rates • Policy - Making & Banking Regulation • Tax Reform • Advancing Technology 11
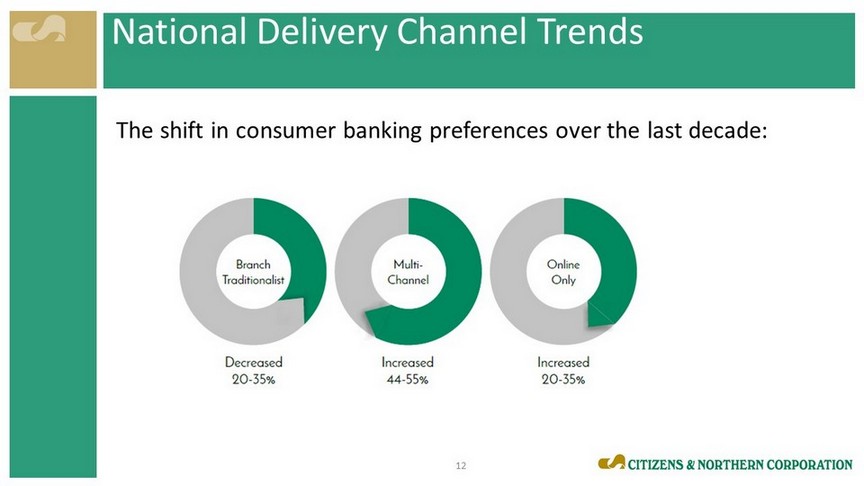
National Delivery Channel Trends The shift in consumer banking preferences over the last decade: 12
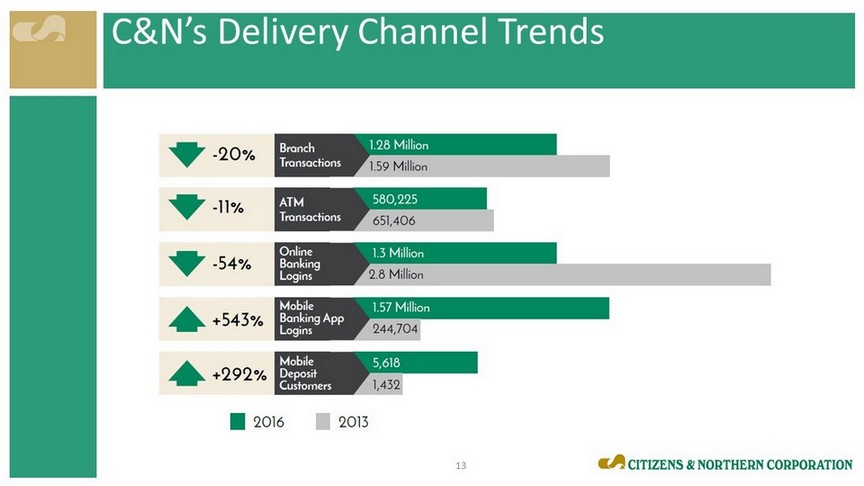
C&N’s Delivery Channel Trends 13

Supporting our Vision, Mission & Values • Strategic Investments in • Technology • Delivery Channels • C&N Team 14
Producing Results • Loan and Deposit Growth • Trust Assets Under Management Growth • Revenue Growth • Non - Interest Expenses • Capital 15
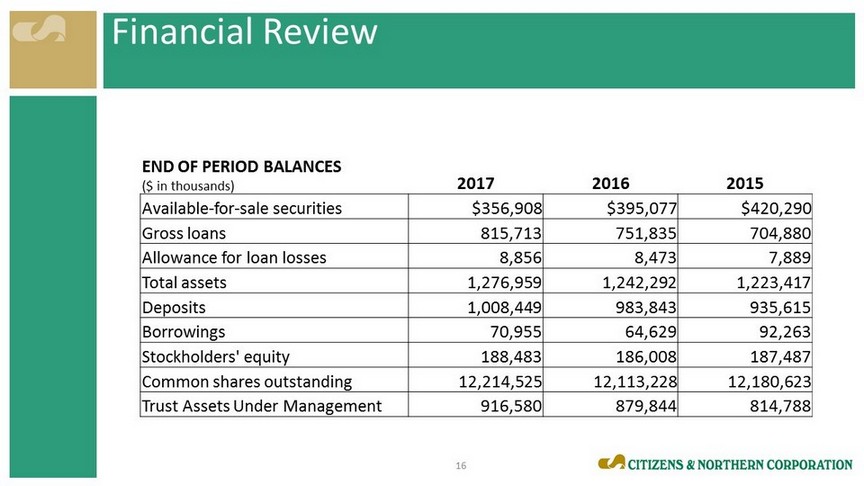
Financial Review END OF PERIOD BALANCES ($ in thousands) 2017 2016 2015 Available - for - sale securities $356,908 $395,077 $420,290 Gross loans 815,713 751,835 704,880 Allowance for loan losses 8,856 8,473 7,889 Total assets 1,276,959 1,242,292 1,223,417 Deposits 1,008,449 983,843 935,615 Borrowings 70,955 64,629 92,263 Stockholders' equity 188,483 186,008 187,487 Common shares outstanding 12,214,525 12,113,228 12,180,623 Trust Assets Under Management 916,580 879,844 814,788 16
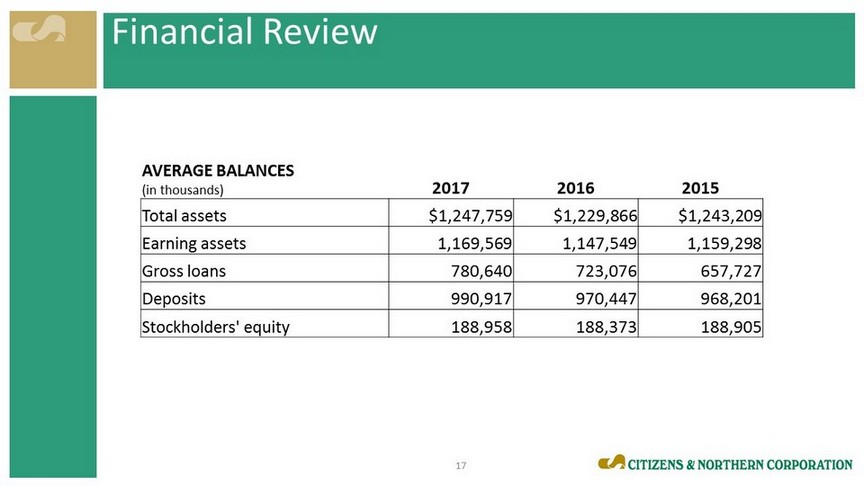
Financial Review AVERAGE BALANCES (in thousands) 2017 2016 2015 Total assets $1,247,759 $1,229,866 $1,243,209 Earning assets 1,169,569 1,147,549 1,159,298 Gross loans 780,640 723,076 657,727 Deposits 990,917 970,447 968,201 Stockholders' equity 188,958 188,373 188,905 17
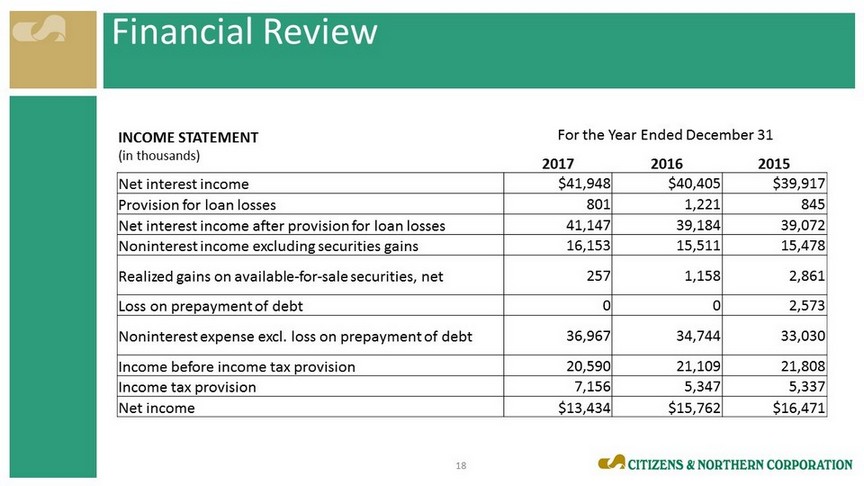
Financial Review INCOME STATEMENT (in thousands) For the Year Ended December 31 2017 2016 2015 Net interest income $41,948 $40,405 $39,917 Provision for loan losses 801 1,221 845 Net interest income after provision for loan losses 41,147 39,184 39,072 Noninterest income excluding securities gains 16,153 15,511 15,478 Realized gains on available - for - sale securities, net 257 1,158 2,861 Loss on prepayment of debt 0 0 2,573 Noninterest expense excl. loss on prepayment of debt 36,967 34,744 33,030 Income before income tax provision 20,590 21,109 21,808 Income tax provision 7,156 5,347 5,337 Net income $13,434 $15,762 $16,471 18
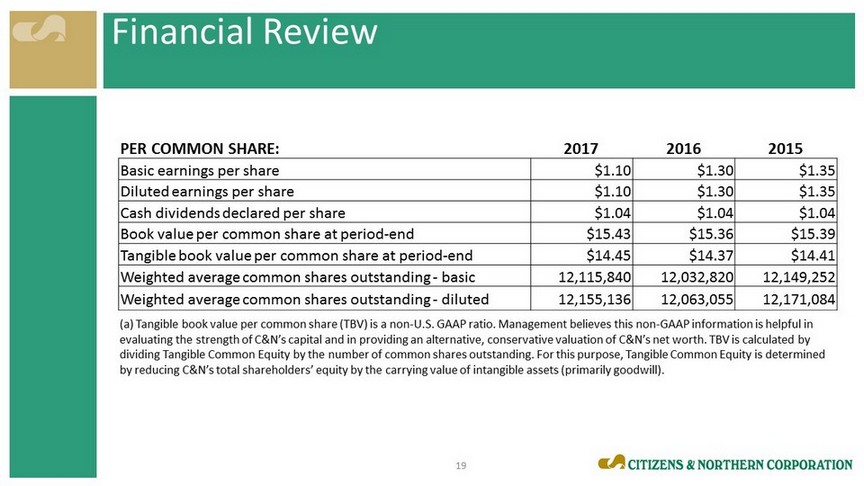
Financial Review PER COMMON SHARE: 2017 2016 2015 Basic earnings per share $1.10 $1.30 $1.35 Diluted earnings per share $1.10 $1.30 $1.35 Cash dividends declared per share $1.04 $1.04 $1.04 Book value per common share at period - end $15.43 $15.36 $15.39 Tangible book value per common share at period - end $14.45 $14.37 $14.41 Weighted average common shares outstanding - basic 12,115,840 12,032,820 12,149,252 Weighted average common shares outstanding - diluted 12,155,136 12,063,055 12,171,084 (a) Tangible book value per common share (TBV) is a non - U.S. GAAP ratio. Management believes this non - GAAP information is helpfu l in evaluating the strength of C&N’s capital and in providing an alternative, conservative valuation of C&N’s net worth. TBV is c alc ulated by dividing Tangible Common Equity by the number of common shares outstanding. For this purpose, Tangible Common Equity is deter min ed by reducing C&N’s total shareholders’ equity by the carrying value of intangible assets (primarily goodwill). 19
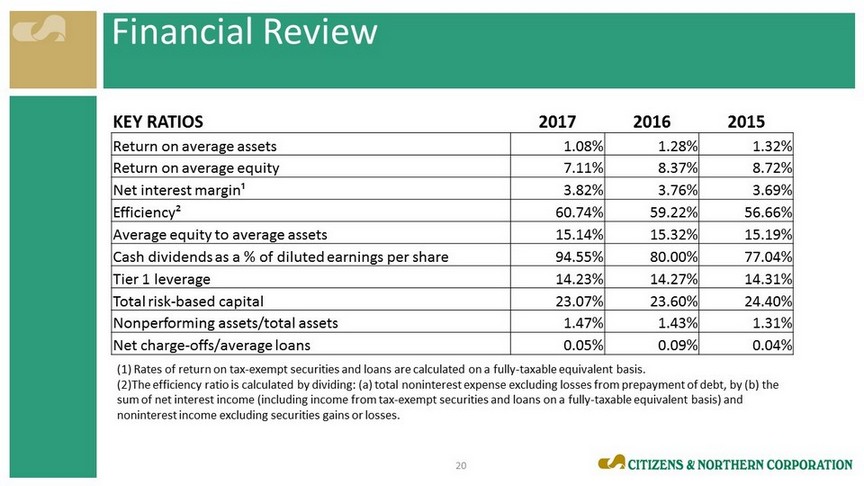
Financial Review KEY RATIOS 2017 2016 2015 Return on average assets 1.08% 1.28% 1.32% Return on average equity 7.11% 8.37% 8.72% Net interest margin¹ 3.82% 3.76% 3.69% Efficiency² 60.74% 59.22% 56.66% Average equity to average assets 15.14% 15.32% 15.19% Cash dividends as a % of diluted earnings per share 94.55% 80.00% 77.04% Tier 1 leverage 14.23% 14.27% 14.31% Total risk - based capital 23.07% 23.60% 24.40% Nonperforming assets/total assets 1.47% 1.43% 1.31% Net charge - offs/average loans 0.05% 0.09% 0.04% (1) Rates of return on tax - exempt securities and loans are calculated on a fully - taxable equivalent basis. (2)The efficiency ratio is calculated by dividing: (a) total noninterest expense excluding losses from prepayment of debt, by (b ) the sum of net interest income (including income from tax - exempt securities and loans on a fully - taxable equivalent basis) and noninterest income excluding securities gains or losses. 20
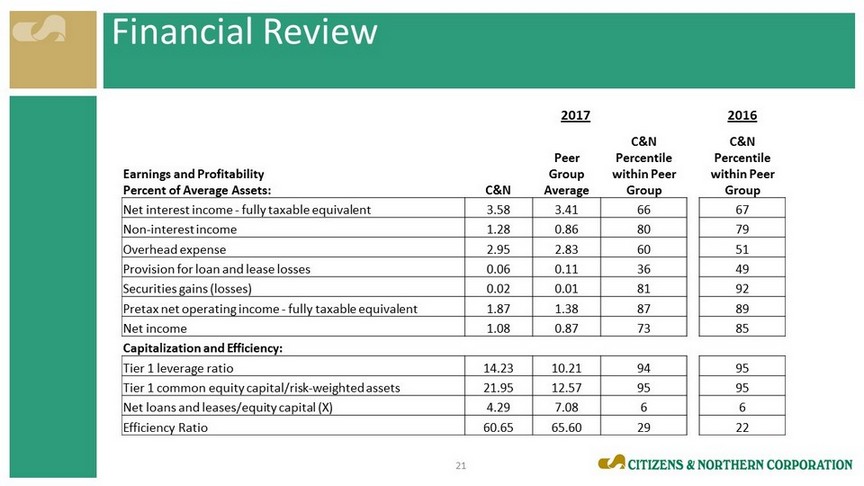
Financial Review 2017 2016 C&N Peer Group Average C&N Percentile within Peer Group C&N Percentile within Peer Group Earnings and Profitability Percent of Average Assets: Net interest income - fully taxable equivalent 3.58 3.41 66 67 Non - interest income 1.28 0.86 80 79 Overhead expense 2.95 2.83 60 51 Provision for loan and lease losses 0.06 0.11 36 49 Securities gains (losses) 0.02 0.01 81 92 Pretax net operating income - fully taxable equivalent 1.87 1.38 87 89 Net income 1.08 0.87 73 85 Capitalization and Efficiency : Tier 1 leverage ratio 14.23 10.21 94 95 Tier 1 common equity capital/risk - weighted assets 21.95 12.57 95 95 Net loans and leases/equity capital (X) 4.29 7.08 6 6 Efficiency Ratio 60.65 65.60 29 22 21
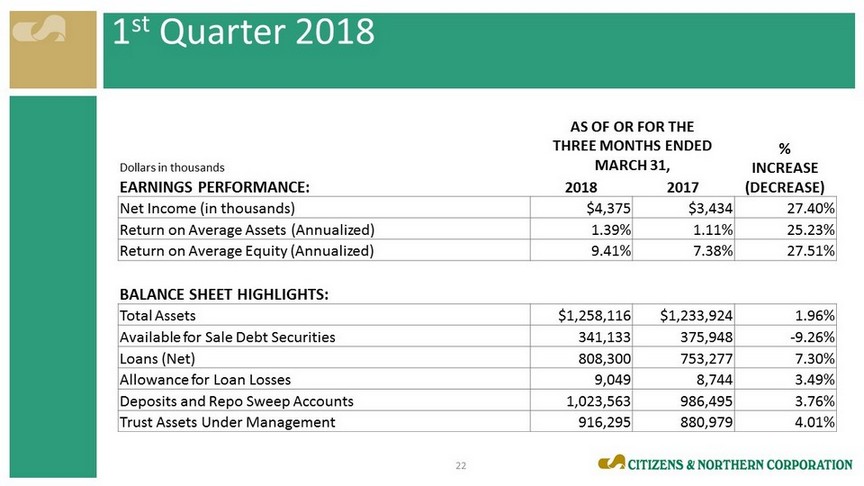
1 st Quarter 2018 Dollars in thousands AS OF OR FOR THE THREE MONTHS ENDED MARCH 31, % INCREASE (DECREASE) EARNINGS PERFORMANCE: 2018 2017 Net Income (in thousands) $4,375 $3,434 27.40% Return on Average Assets (Annualized) 1.39% 1.11% 25.23% Return on Average Equity (Annualized) 9.41% 7.38% 27.51% BALANCE SHEET HIGHLIGHTS: Total Assets $1,258,116 $1,233,924 1.96% Available for Sale Debt Securities 341,133 375,948 - 9.26% Loans (Net) 808,300 753,277 7.30% Allowance for Loan Losses 9,049 8,744 3.49% Deposits and Repo Sweep Accounts 1,023,563 986,495 3.76% Trust Assets Under Management 916,295 880,979 4.01% 22
Shareholder Value • Valuation • Attractive Dividend • Share repurchase • Strong Currency 23
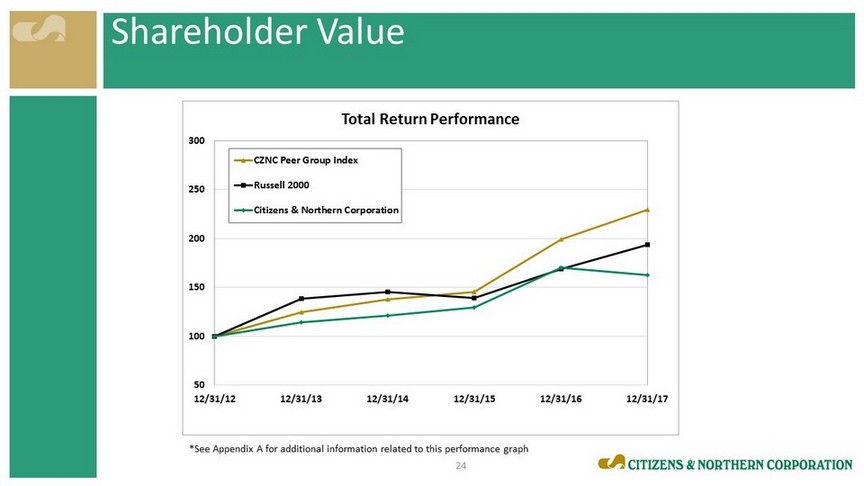
Shareholder Value *See Appendix A for additional information related to this performance graph 50 100 150 200 250 300 12/31/12 12/31/13 12/31/14 12/31/15 12/31/16 12/31/17 Total Return Performance CZNC Peer Group Index Russell 2000 Citizens & Northern Corporation 24
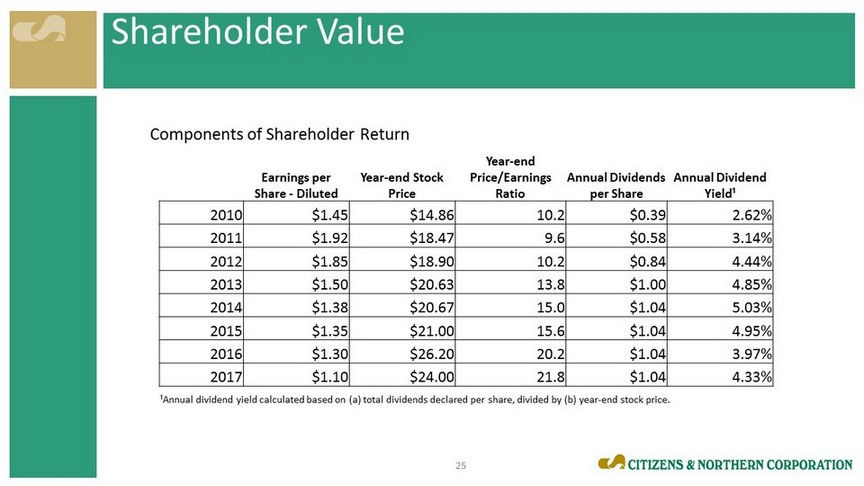
Shareholder Value Earnings per Share - Diluted Year - end Stock Price Year - end Price/Earnings Ratio Annual Dividends per Share Annual Dividend Yield¹ 2010 $1.45 $14.86 10.2 $0.39 2.62% 2011 $1.92 $18.47 9.6 $0.58 3.14% 2012 $1.85 $18.90 10.2 $0.84 4.44% 2013 $1.50 $20.63 13.8 $1.00 4.85% 2014 $1.38 $20.67 15.0 $1.04 5.03% 2015 $1.35 $21.00 15.6 $1.04 4.95% 2016 $1.30 $26.20 20.2 $1.04 3.97% 2017 $1.10 $24.00 21.8 $1.04 4.33% Components of Shareholder Return ¹Annual dividend yield calculated based on (a) total dividends declared per share, divided by (b) year - end stock price. 25
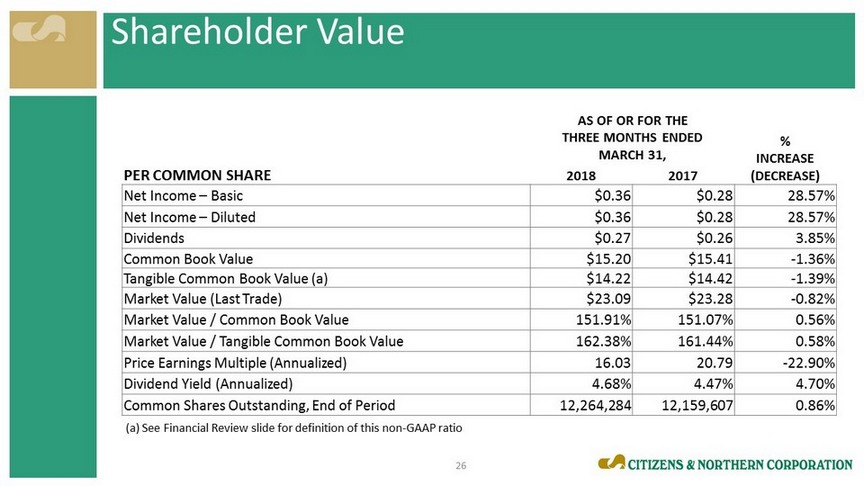
Shareholder Value AS OF OR FOR THE THREE MONTHS ENDED MARCH 31, % INCREASE (DECREASE) PER COMMON SHARE 2018 2017 Net Income – Basic $0.36 $0.28 28.57% Net Income – Diluted $0.36 $0.28 28.57% Dividends $0.27 $0.26 3.85% Common Book Value $15.20 $15.41 - 1.36% Tangible Common Book Value (a) $14.22 $14.42 - 1.39% Market Value (Last Trade) $23.09 $23.28 - 0.82% Market Value / Common Book Value 151.91% 151.07% 0.56% Market Value / Tangible Common Book Value 162.38% 161.44% 0.58% Price Earnings Multiple (Annualized) 16.03 20.79 - 22.90% Dividend Yield (Annualized) 4.68% 4.47% 4.70% Common Shares Outstanding, End of Period 12,264,284 12,159,607 0.86% (a) See Financial Review slide for definition of this non - GAAP ratio 26
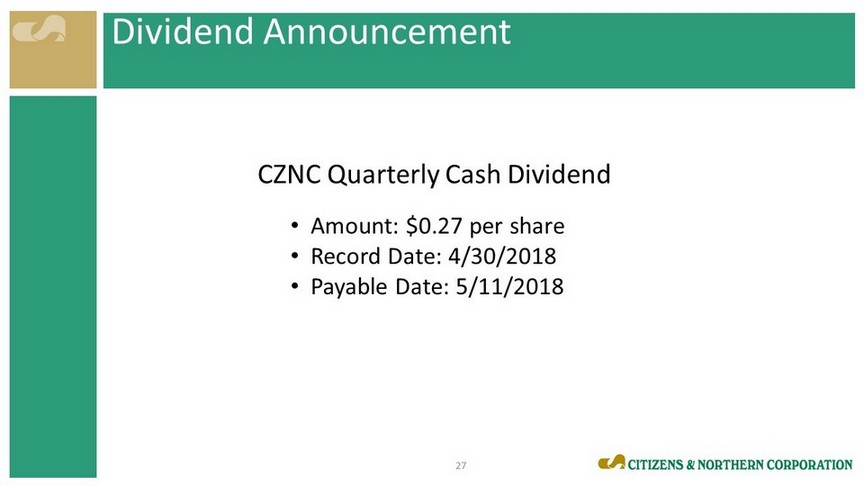
Dividend Announcement CZNC Quarterly Cash Dividend • Amount: $0.27 per share • Record Date: 4/30/2018 • Payable Date: 5/11/2018 27

Optimism for the Future • Building Momentum • Future Growth & Expansion • Team Engagement and Culture • Maturing Investments in Products, Technology and Data Management • Capacity for Acquisition/Market Expansion • External Factors Remain Positive • Commitment to Community 28

Today, Tomorrow and the Future Q&A 29

Thank You Creating Value Through Lifelong Relationships