Attached files
| file | filename |
|---|---|
| EX-99.1 - EXHIBIT 99.1 - ALLIANCE DATA SYSTEMS CORP | exhibit_99-1.htm |
| 8-K - FORM 8-K - ALLIANCE DATA SYSTEMS CORP | form_8k.htm |
Exhibit 99.2

Alliance Data NYSE: ADS First Quarter 2018 ResultsApril 19, 2018

11 2 Forward-Looking StatementsThis presentation contains forward-looking statements within the meaning of Section 27A of the Securities Act of 1933 and Section 21E of the Securities Exchange Act of 1934. Forward-looking statements give our expectations or forecasts of future events and can generally be identified by the use of words such as “believe,” “expect,” “anticipate,” “estimate,” “intend,” “project,” “plan,” “likely,” “may,” “should” or other words or phrases of similar import. Similarly, statements that describe our business strategy, outlook, objectives, plans, intentions or goals also are forward-looking statements. Examples of forward-looking statements include, but are not limited to, statements we make regarding our expected operating results, future economic conditions including currency exchange rates, future dividend declarations and the guidance we give with respect to our anticipated financial performance. We believe that our expectations are based on reasonable assumptions. Forward-looking statements, however, are subject to a number of risks and uncertainties that could cause actual results to differ materially from the projections, anticipated results or other expectations expressed in this presentation, and no assurances can be given that our expectations will prove to have been correct. These risks and uncertainties include, but are not limited to, factors set forth in the Risk Factors section in our Annual Report on Form 10-K for the most recently ended fiscal year, which may be updated in Item 1A of, or elsewhere in, our Quarterly Reports on Form 10-Q filed for periods subsequent to such Form 10-K. Our forward-looking statements speak only as of the date made, and we undertake no obligation, other than as required by applicable law, to update or revise any forward-looking statements, whether as a result of new information, subsequent events, anticipated or unanticipated circumstances or otherwise.

Agenda Speakers: Ed Heffernan President and CEO Charles Horn EVP and CFO Consolidated ResultsSegment ResultsCredit Metrics2018 Guidance 1 3
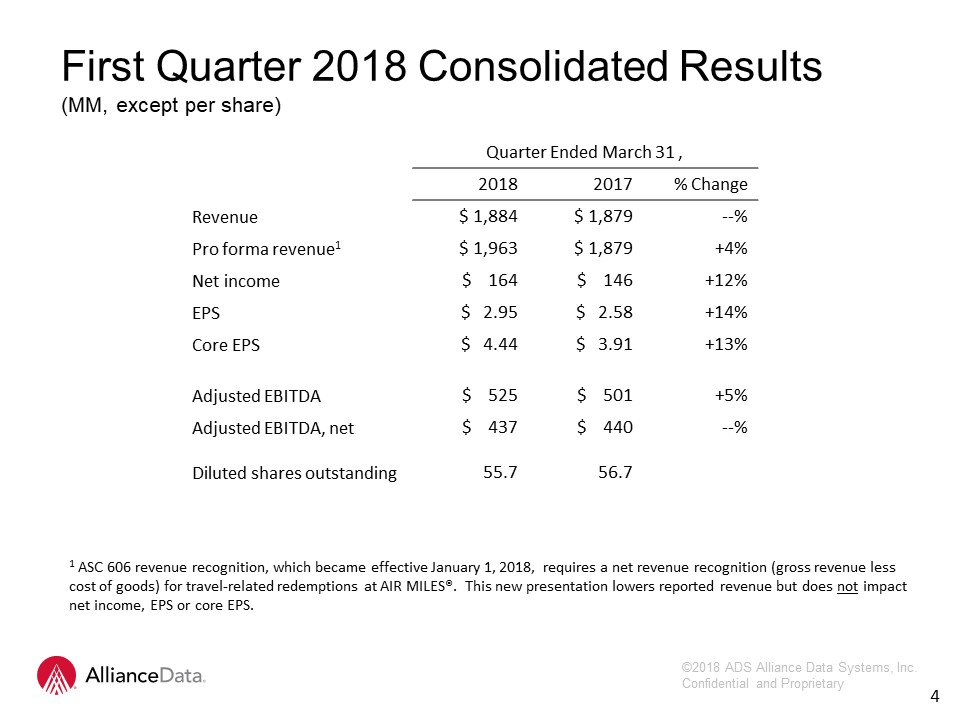
First Quarter 2018 Consolidated Results(MM, except per share) 2 4 Quarter Ended March 31 , 2018 2017 % Change Revenue $ 1,884 $ 1,879 --% Pro forma revenue1 $ 1,963 $ 1,879 +4% Net income $ 164 $ 146 +12% EPS $ 2.95 $ 2.58 +14% Core EPS $ 4.44 $ 3.91 +13% Adjusted EBITDA $ 525 $ 501 +5% Adjusted EBITDA, net $ 437 $ 440 --% Diluted shares outstanding 55.7 56.7 1 ASC 606 revenue recognition, which became effective January 1, 2018, requires a net revenue recognition (gross revenue less cost of goods) for travel-related redemptions at AIR MILES®. This new presentation lowers reported revenue but does not impact net income, EPS or core EPS.

Quarter Ended March 31, 2018 2017 % Change Revenue: LoyaltyOne® $ 226 $ 333 ASC 606 adjustment 79 -- Change to net revenue presentation Pro forma 305 333 -8% Epsilon® 509 529 -4% Weakness in Agency offering Card Services 1,155 1,023 +13% Other (6) (6) $ 1,963 $ 1,879 +4% Adjusted EBITDA, net: LoyaltyOne $ 54 $ 59 -8% Epsilon 92 85 +8% Positive change in revenue mix Card Services 319 331 -4% Higher reserve rate dampened Q1 adj. EBITDA, net by ~$44mm and core EPS by ~$0.60 Other (28) (35) $ 437 $ 440 --% First Quarter 2018 Segment Results(MM) 5

Credit Metrics (MM) Quarter Ended March 31, 2018 2017 Change Credit sales $ 6,806 $ 6,579 +3% Average card receivables $ 17,722 $ 15,685 +13% Total gross yield 24.8% 25.5% -0.7% Operating expenses as % of average card receivables 8.8% 7.9% +0.9% Principal loss rates 6.7% 6.3% +0.4% Delinquency rate 5.3% 4.8% +0.5% Reserve rate 6.8% 6.6% +0.2% 6 6

50 bps 15 bps Q1 17 Recovery Rates(Timing) Hurricanes -25 bps 6.3% CreditNormalization 6.7% Q1 18 Net loss rates were elevated in Q1 primarily due to shift to internal recovery of charged-off accounts (timing). Credit Metrics Q1 Loss Rate Bridge 7

8 2018 Guidance Consolidated 2017 2018 Revenue $7.72 BN $8.35 BN +8% Pro forma Revenue $7.72 BN $8.70 BN +12% Core EPS $ 19.35 $22.50 - $23.00 +16 to 19% Growth Rates by Quarter Q1 (Act) Q2 (Guide) Revenue --% Mid-single Pro forma Revenue +4% Low-double Core EPS +13% Mid-teens

High single-digit pro forma revenue, low double-digit adjusted EBITDA growthBrandLoyalty returns to strong double-digit growth in Q2AIR MILES issued was essentially flat in Q1, 2018 and trending to solid back-half growthMid-single-digit revenue and adjusted EBITDA growthMid-teens revenue and adjusted EBITDA, net growthMid-teens portfolio growth ($2.5BN)‘15 to ’17 signings ramping ($2.5 BN) plus core ($1.0 BN) less non-core ($1.0 BN) = 15 percent growthNet principal loss rate of 6 percentQ1: 6.7 percent ↑ 40 basis points due to ramping of internal recoveriesFlat net loss and reserve rates would have produced 11 percent adjusted EBITDA, net and 30 percent core EPS growth Q2: Flow-through remaining hurricane impact (40 basis points)2nd half: all noise gone – flat to better loss rates compared to 2017 2018 Guidance 9 LoyaltyOne: Epsilon: Card Services:

12 10 Financial MeasuresIn addition to the results presented in accordance with generally accepted accounting principles, or GAAP, the Company may present financial measures that are non-GAAP measures, such as constant currency financial measures, adjusted EBITDA, adjusted EBITDA margin, adjusted EBITDA, net of funding costs, core earnings and core earnings per diluted share (core EPS). Constant currency excludes the impact of fluctuations in foreign exchange rates. The Company calculates constant currency by converting our current period local currency financial results using the prior period exchange rates. The Company uses adjusted EBITDA and adjusted EBITDA, net as an integral part of internal reporting to measure the performance and operational strength of reportable segments and to evaluate the performance of senior management. Adjusted EBITDA eliminates the uneven effect across all reportable segments of non-cash depreciation of tangible assets and amortization of intangible assets, including certain intangible assets that were recognized in business combinations, and the non-cash effect of stock compensation expense. Similarly, core earnings and core EPS eliminate non-cash or non-operating items, including, but not limited to, stock compensation expense, amortization of purchased intangibles, amortization of debt issuance and hedging costs. The Company believes that these non-GAAP financial measures, viewed in addition to and not in lieu of the Company’s reported GAAP results, provide useful information to investors regarding the Company’s performance and overall results of operations. Reconciliations to comparable GAAP financial measures are available in the Company’s earnings release, which is posted in both the News and Investors sections on the Company’s website (www.alliancedata.com). No reconciliation is provided with respect to forward-looking annual guidance for 2018 core EPS as the Company cannot reliably predict all necessary components or their impact to reconcile core EPS to GAAP EPS without unreasonable effort. The events necessitating a non-GAAP adjustment are inherently unpredictable and may have a material impact on the Company’s future results. The financial measures presented are consistent with the Company’s historical financial reporting practices. Core earnings and core EPS represent performance measures and are not intended to represent liquidity measures. The non-GAAP financial measures presented herein may not be comparable to similarly titled measures presented by other companies, and are not identical to corresponding measures used in other various agreements or public filings.

Q & A 11