Attached files
| file | filename |
|---|---|
| EX-32 - EXHIBIT 32 - iMedia Brands, Inc. | ex3202032018.htm |
| EX-31.2 - EXHIBIT 31.2 - iMedia Brands, Inc. | ex31202032018.htm |
| EX-31.1 - EXHIBIT 31.1 - iMedia Brands, Inc. | ex31102032018.htm |
| EX-23 - EXHIBIT 23 - iMedia Brands, Inc. | ex2302032018.htm |
| EX-21 - EXHIBIT 21 - iMedia Brands, Inc. | ex2102032018.htm |
UNITED STATES SECURITIES AND EXCHANGE COMMISSION
Washington, D.C. 20549
_____________________________________________
Form 10-K
þ | ANNUAL REPORT PURSUANT TO SECTION 13 OR 15(d) OF THE SECURITIES EXCHANGE ACT OF 1934 | |
For the Fiscal Year Ended February 3, 2018 | ||
or | ||
o | TRANSITION REPORT UNDER SECTION 13 OR 15(d) OF THE SECURITIES EXCHANGE ACT OF 1934 | |
For the transition period from to | ||
Commission file number 001-37495
____________________________________________

EVINE Live Inc.
(Exact name of Registrant as Specified in Its Charter)
Minnesota (State or Other Jurisdiction of Incorporation or Organization) | 41-1673770 (I.R.S. Employer Identification No.) | |
6740 Shady Oak Road, Eden Prairie, MN (Address of Principal Executive Offices) | 55344-3433 (Zip Code) | |
952-943-6000
(Registrant’s Telephone Number, Including Area Code)
Securities registered under Section 12(b) of the Exchange Act: | ||
Title of each class | Name of exchange on which registered | |
Common Stock, $0.01 par value | Nasdaq Global Market | |
Securities registered under Section 12(g) of the Exchange Act: None | ||
Indicate by check mark if the registrant is a well-known seasoned issuer, as defined in Rule 405 of the Securities Act. Yes o No þ
Indicate by check mark if the registrant is not required to file reports pursuant to Section 13 or Section 15(d) of the Exchange Act. Yes o No þ
Indicate by check mark whether the registrant: (1) has filed all reports required to be filed by Section 13 or 15(d) of the Securities Exchange Act of 1934 during the preceding 12 months (or for such shorter period that the registrant was required to file such reports), and (2) has been subject to such filing requirements for the past 90 days. Yes þ No o
Indicate by check mark whether the registrant has submitted electronically and posted on its corporate Web site, if any, every Interactive Data File required to be submitted and posted pursuant to Rule 405 of Regulation S-T during the preceding 12 months (or for such shorter period that the registrant was required to submit and post such files). Yes þ No o
Indicate by check mark if disclosure of delinquent filers pursuant to Item 405 of Regulation S-K is not contained herein, and will not be contained, to the best of registrant’s knowledge, in definitive proxy or information statements incorporated by reference in Part III of this Form 10-K or any amendment to this Form 10-K. o
Indicate by check mark whether the registrant is a large accelerated filer, an accelerated filer, a non-accelerated filer, or a smaller reporting company. See the definitions of "large accelerated filer," "accelerated filer", "smaller reporting company" and "emerging growth company" in Rule 12b-2 of the Exchange Act. (Check one):
Large accelerated filer | o | Accelerated filer | þ | |
Non-accelerated filer | o (Do not check if a smaller reporting company) | Smaller reporting company | o | |
Emerging growth company | o | |||
Indicate by check mark whether the registrant is a shell company (as defined in Rule 12b-2 of the Exchange Act. Yes o No þ
As of April 4, 2018, 65,380,809 shares of the registrant’s common stock were outstanding. The aggregate market value of the common stock held by non-affiliates of the registrant on July 28, 2017, the last business day of the registrant’s most recently completed second quarter, based upon the closing sale price for the registrant’s common stock as reported by the Nasdaq Global Market on July 28, 2017 was approximately $70,876,530. For purposes of determining such aggregate market value, all officers and directors of the registrant are considered to be affiliates of the registrant, as well as shareholders deemed to be affiliates under Rule 12b-2 of the Securities Exchange Act of 1934 either by holding 10% or more of the outstanding common stock as reflected on Schedules 13D or 13G filed with the registrant or by having certain contractual relationships with the registrant related to control. This number is provided only for the purpose of this annual report on Form 10-K and does not represent an admission by either the registrant or any such person as to the status of such person.
DOCUMENTS INCORPORATED BY REFERENCE
Portions of the registrant’s definitive proxy statement to be filed with the Securities and Exchange Commission pursuant to Regulation 14A not later than 120 days after the close of its fiscal year ended February 3, 2018 are incorporated by reference in Part III of this annual report on Form 10-K.
EVINE Live Inc.
ANNUAL REPORT ON FORM 10-K
For the Fiscal Year Ended
February 3, 2018
TABLE OF CONTENTS
Page | ||
Item 1. | ||
Item 1A. | ||
Item 1B. | ||
Item 2. | ||
Item 3. | ||
Item 4. | ||
Item 5. | ||
Item 6. | ||
Item 7. | ||
Item 7A. | ||
Item 8. | ||
Item 9. | ||
Item 9A. | ||
Item 9B. | ||
Item 10. | ||
Item 11. | ||
Item 12. | ||
Item 13. | ||
Item 14. | ||
Item 15. | ||
2
CAUTIONARY STATEMENT CONCERNING FORWARD-LOOKING STATEMENTS
This annual report on Form 10-K and other materials we file with the Securities and Exchange Commission (the “SEC”) (as well as information included in oral statements or other written statements made or to be made by us) contain certain “forward-looking statements” within the meaning of the Private Securities Litigation Reform Act of 1995. Any statements contained herein that are not statements of historical fact, including statements regarding guidance, industry prospects or future results of operations or financial position made in this report are forward-looking. We often use words such as anticipates, believes, estimates, expects, intends, predicts, hopes, should, plans, will and similar expressions to identify forward-looking statements. These statements are based on management’s current expectations and accordingly are subject to uncertainty and changes in circumstances. Actual results may vary materially from the expectations contained herein due to various important factors, including (but not limited to): variability in consumer preferences, shopping behaviors, spending and debt levels; the general economic and credit environment; interest rates; seasonal variations in consumer purchasing activities; the ability to achieve the most effective product category mixes to maximize sales and margin objectives; competitive pressures on sales and sales promotions; pricing and gross sales margins; the level of cable and satellite distribution for our programming and the associated fees or estimated cost savings from contract renegotiations; our ability to establish and maintain acceptable commercial terms with third-party vendors and other third parties with whom we have contractual relationships, and to successfully manage key vendor and shipping relationships and develop key partnerships and proprietary and exclusive brands; our ability to manage our operating expenses successfully and our working capital levels; our ability to remain compliant with our credit facilities covenants; customer acceptance of our branding strategy and our repositioning as a video commerce company; our ability to respond to changes in consumer shopping patterns and preferences, and changes in technology and consumer viewing patterns; changes to our management and information systems infrastructure; challenges to our data and information security; changes in governmental or regulatory requirements, including without limitation, regulations of the Federal Communications Commission and Federal Trade Commission, and adverse outcomes from regulatory proceedings; litigation or governmental proceedings affecting our operations; significant events (including disasters, weather events or events attracting significant television-coverage) that either cause an interruption of television coverage or that divert viewership from our programming; disruptions in our distribution of our network broadcast to our customers; our ability to protect our intellectual property rights; our ability to obtain and retain key executives and employees; our ability to attract new customers and retain existing customers; changes in shipping costs; expenses relating to the actions of activist or hostile shareholders; our ability to offer new or innovative products and customer acceptance of the same; changes in customer viewing habits of television programming; and the risks identified under Item 1A (Risk Factors) in this annual report on Form 10-K. You are cautioned not to place undue reliance on forward-looking statements, which speak only as of the date of this filing. We are under no obligation (and expressly disclaim any such obligation) to update or alter our forward-looking statements whether as a result of new information, future events or otherwise.
3
PART I
Item 1. Business
When we refer to "we," "our," "us" or the "Company," we mean EVINE Live Inc. and its subsidiaries unless the context indicates otherwise. EVINE Live Inc. is a Minnesota corporation with principal and executive offices located at 6740 Shady Oak Road, Eden Prairie, Minnesota 55344-3433. EVINE Live Inc. was incorporated on June 25, 1990.
The Company's fiscal year ends on the Saturday nearest to January 31 and results in either a 52-week or 53-week fiscal year. Our most recently completed fiscal year, fiscal 2017, ended on February 3, 2018, and consisted of 53 weeks. Fiscal 2016 ended on January 28, 2017 and consisted of 52 weeks. Fiscal 2015 ended on January 30, 2016 and consisted of 52 weeks. Fiscal 2018 will end on February 2, 2019 and will consist of 52 weeks.
A. General
We are a multiplatform interactive digital commerce company that offers a mix of proprietary, exclusive and name-brand merchandise in the categories of jewelry & watches, home & consumer electronics, beauty and fashion & accessories directly to consumers in an engaging and informative shopping experience via television, online and mobile devices. Evine reaches more than 87 million television homes, primarily on cable and satellite systems, with entertaining content in a comprehensive digital shopping experience 24 hours a day. In addition, we also operate evine.com, a comprehensive digital commerce platform that sells products which appear on our television shopping network as well as an extended assortment of online-only merchandise. Our programming and products are also marketed via mobile devices, including smartphones and tablets, and through the leading social media channels.
On November 18, 2014, we announced that we had changed our corporate name to EVINE Live Inc. from ValueVision Media, Inc. Effective November 20, 2014, our NASDAQ trading symbol also changed to EVLV from VVTV. We transitioned from doing business as "ShopHQ" and rebranded to "Evine Live", "Evine" and evine.com on February 14, 2015.
In May 2013, we previously announced a rebranding of our 24-hour television shopping network and digital commerce internet website from ShopNBC and ShopNBC.com to ShopHQ and ShopHQ.com, respectively.
Multiplatform Video Commerce Retailing
The primary form of our multiplatform interactive digital commerce retail business is our 24-hour television shopping network, Evine, which is the third largest television shopping network in the United States. Our comprehensive online website, evine.com, complements our network with a combination of products featured on TV as well as a strong collection of online-only products. Consolidated net sales, including shipping and handling revenues, totaled $648.2 million, $666.2 million and $693.3 million for fiscal 2017, fiscal 2016 and fiscal 2015. We have several convenient methods for a customer to purchase items they want, including our toll-free telephone number, directly online, or using mobile devices. Our television programming is primarily produced at our Eden Prairie, Minnesota headquarters facility and we also produce programming remotely on location during special events. The programming is transmitted nationally via satellite to cable system operators, direct-to-home satellite providers, broadcast television station operators, a full-power television station in Boston and over-the-top platforms.
Products and Product Mix
Products sold on our digital commerce platforms include jewelry & watches; home & consumer electronics; beauty; and fashion & accessories. Historically jewelry & watches has been our largest merchandise category. While changes in our product mix have occurred as a result of customer demand and other factors including our efforts to diversify our offerings within our major merchandise categories, jewelry & watches remained our largest merchandise category in fiscal 2017. We are focused on diversifying our merchandise assortment within our existing product categories as well as by offering potentially new complementary product categories. We also regularly review the proprietary, exclusive and name-brands we offer within each product category to ensure we have fresh and compelling products which we believe will increase our revenues and grow our active customer base. The following table shows our merchandise mix as a percentage of consolidated net merchandise sales for the years indicated by product category group.
Net Merchandise Sales by Category | Fiscal 2017 | Fiscal 2016 | Fiscal 2015 | |||
Jewelry & Watches | 39% | 41% | 39% | |||
Home & Consumer Electronics | 27% | 25% | 31% | |||
Beauty | 16% | 16% | 14% | |||
Fashion & Accessories | 18% | 18% | 16% | |||
4
Jewelry & Watches. We feature a broad assortment of jewelry from fine to fashion, silver to gold, genuine gemstones to simulated diamonds. In addition, we offer an extensive collection of men’s and women’s watches from classic to modern designs.
Home & Consumer Electronics. We feature home décor, bed and bath textiles, cookware, kitchen electrics, tabletop accessories and home furnishings. With consumer electronics, we offer current technology trends and solutions to consumers from some of the world's most recognized brands.
Beauty. Our assortment features a variety of skincare, cosmetics, hair care and bath & body products.
Fashion & Accessories. We offer fashionable looks that strike a balance between current trends and essentials with an assortment of apparel, outerwear, intimates, handbags, accessories and footwear.
B. Company Strategy
As a multiplatform video commerce company, our strategy includes offering an exciting assortment of proprietary, exclusive (i.e., products that are not readily available elsewhere) and name-brand products using our video commerce infrastructure, which includes television access to more than 87 million homes in the United States, primarily on cable and satellite systems. We are also focused on growing our high lifetime value customer file and growing our revenues, through social, mobile, online, and over-the-top platforms.
Our merchandising plan is focused on delivering a balanced assortment of profitable proprietary, exclusive and name-brand products presented in an engaging, entertaining, shopping-centric format. To enhance the shopping experience for our customers, we will continue to work hard to engage our customers intelligently by leveraging the use of predictive analytics and interactive marketing to drive personalization and relevancy to each experience. In addition, we will continue to find new methods, territories, technologies and channels to distribute our video commerce programming beyond the television screen, including "live on location" entertainment and enhancing our social advertising. We believe these initiatives will position us as a multiplatform interactive digital commerce company that delivers a more engaging and enjoyable customer experience with sales and service that exceed customer expectations.
C. Television Program Distribution and Online Operations
Our television programming continues to be the most significant medium through which we reach our customers, and we believe that our television shopping program is a key driver of traffic to our evine.com website and mobile platforms. Our online business represents an important component of our future growth opportunities, and we will continue to invest in and enhance our online-based capabilities and mobile presence. Consolidated net sales, including shipping and handling revenues, totaled $648.2 million, $666.2 million and $693.3 million for fiscal 2017, fiscal 2016 and fiscal 2015. Our digital sales penetration, or, the percentage of net sales that are generated from our evine.com website and mobile platforms, which are primarily ordered directly online, was 51.9%, 49.5% and 46.9% in fiscal 2017, fiscal 2016 and fiscal 2015. Our mobile penetration increased to 49.9%, 45.4% and 42.3% of total online sales during fiscal 2017, fiscal 2016 and fiscal 2015.
Television Shopping Network
Satellite Delivery of Programming. Our television programming is presently distributed via communications satellite transponder to cable systems and direct-to-home satellite providers and a full-power television station in Boston. We have a long-term satellite lease agreement with our present provider of satellite services. Pursuant to the terms of this agreement, we distribute our television programming via a satellite that was launched in August 2005. The agreement provides us, under certain circumstances, with preemptible back-up services if satellite transmission is interrupted.
Television Distribution. We operate under distribution agreements with cable operators, direct-to-home satellite providers and telecommunications companies to distribute our television programming over their systems. The terms of the distribution agreements typically range from one to five years. During any fiscal year, certain agreements with cable, satellite or other distributors may expire. Under certain circumstances, we or our distributors may cancel the agreements prior to their expiration. The distribution agreements generally provide that we will pay each operator a monthly access fee, and in some cases marketing support payments, based on the number of homes receiving our programming. We frequently review distribution opportunities with cable system operators and broadcast stations providing for full- or part-time carriage of our programming.
During fiscal 2017, there were approximately 122 million homes in the United States with at least one television set. Of those homes, there were approximately 58 million cable television subscribers, approximately 32 million direct-to-home satellite subscribers and approximately 10 million homes which receive programming through telecommunications companies, such as AT&T and Verizon.
5
Our 24-hour television shopping networks, Evine and Evine Too, which are distributed primarily on cable and satellite systems, reached more than 87 million homes, or full time equivalent subscribers (“FTEs”), during fiscal 2017, fiscal 2016 and fiscal 2015.
Online Presence
Our website, evine.com, as well as our mobile platform, provide customers with a shop anytime, anywhere experience and offers a broad array of consumer merchandise, including all products featured on our television programming as well as merchandise found only on evine.com. The website includes additional resources, including a live stream of our television programming, an archive of segments of recent past programming, videos of many individual products that the customer can view on demand, an online program guide, customer-generated product reviews as well as information about our Evine show hosts and guest personalities. The FCC has required that all full-length television programming redistributed over the internet is captioned, and it is considering requiring captioning of programming segments. We currently provide closed captioning on full-length programming redistributed over the internet and a limited amount of programming segments.
Our e-commerce activities are subject to a number of general business regulations and laws regarding taxation and online commerce. There have been continuing efforts to increase the legal and regulatory obligations and restrictions on companies conducting commerce through the internet, primarily in the areas of taxation, consumer privacy and protection of consumer personal information. A number of states impose data security requirements on companies that collect certain types of information concerning their residents and other states may adopt similar requirements in the future. A patchwork of state laws imposing differing security requirements depending on the residence of our customers could impose added compliance costs.
In November 2002, a number of states approved a multi-state agreement to simplify state sales tax laws by establishing one uniform system to administer and collect sales taxes on traditional retailers and electronic commerce merchants (“Remote Sellers”). The agreement became effective on October 3, 2005. To date, 24 of the 45 states that impose sales tax have passed conforming legislation. A number of states and the U.S. Congress are considering other legislative initiatives that would impose enhanced tax collection obligations for Remote Sellers. In January 2018, the Supreme Court of the United States agreed to hear a case (South Dakota v. Wayfair, Inc.) which could dramatically increase the ability of states to impose sales tax collection responsibilities on Remote Sellers including the Company. We cannot predict the outcome of this case or whether individual states or the U.S. Congress will enact legislation requiring retailers such as us to collect and remit sales taxes on electronic commerce transactions in additional jurisdictions. We already collect and remit sales tax in the several states where we have determined that we are required to do so under current law, and continue to monitor state requirements.
There are a number of federal laws that limit our ability to pursue certain direct marketing activities, including the Telephone Consumer Protection Act, or TCPA, and the Controlling the Assault of Non-Solicited Pornography and Marketing Act of 2003, or the CAN-SPAM Act. The statutes govern when and how we may contact consumers through various communication methods, including email, phone calls, faxes and texts, in some cases requiring consent and in others allowing a consumer to opt out of certain communications. These types of regulation may limit our ability to pursue certain direct marketing activities, thus potentially limiting our sales and number of customers.
Changes in consumer protection laws also may impose additional burdens on those companies conducting business online. The adoption of additional laws or regulations may decrease the growth of the internet or other online services, which could, in turn, decrease the demand for our products and services and increase our cost of doing business through the internet.
In addition, since our website is available over the internet in all states, various states may claim that we are required to qualify to do business as a foreign corporation in such state, a requirement that could result in fees and taxes as well as penalties for the failure to comply. Any new legislation or regulation, the application of laws and regulations from jurisdictions whose laws do not currently apply to our business or the application of existing laws and regulations to the internet and other online services could have a material adverse effect on the growth of our business in this area.
D. Relationship with GE Equity, Comcast and NBCU
Until April 29, 2016, we were a party to an amended and restated shareholder agreement, dated February 25, 2009 (the “GE/NBCU Shareholder Agreement”), with GE Capital Equity Investments, Inc. (“GE Equity”) and NBCUniversal Media, LLC (“NBCU”), which provided for certain corporate governance and standstill matters. We have a significant cable distribution agreement with Comcast, of which NBCU is an indirect subsidiary, and believe that the terms of the agreement are comparable to those with other cable system operators.
In an SEC filing made on August 18, 2015 (SEC File No. 005-41757), GE Equity disclosed that on August 14, 2015, GE Equity and ASF Radio, who was an independent third party to us as of that time, entered into a Stock Purchase Agreement pursuant to which GE Equity agreed to sell 3,545,049 shares of our common stock, which was all of the shares GE Equity had then owned,
6
to ASF Radio for $2.15 per share. According to the SEC filing, ASF Radio is an affiliate of Ardian, an independent private equity investment company. The closing of this sale (the “GE/ASF Radio Sale”) occurred on April 29, 2016. In connection with the GE/ASF Radio Sale, the GE/NBCU Shareholder Agreement was terminated and we entered into a new Shareholder Agreement (the “NBCU Shareholder Agreement”) with NBCU described below.
Stock Purchase from NBCU
On January 31, 2017, we purchased from NBCU 4,400,000 shares of our common stock, representing approximately 6.7% of shares then outstanding, for approximately $5 million or $1.12 per share pursuant to a Repurchase Letter Agreement between us and NBCU. Immediately following our share purchase, NBCU's direct equity ownership of our shares consisted of 2,741,849 shares of common stock, or 4.5% of our outstanding common stock. As of February 3, 2018, we believe that NBCU sold its remaining shares of our common stock. The NBCU Shareholder Agreement was terminated pursuant to the Repurchase Letter Agreement.
NBCU Shareholder Agreement
We were a party to the NBCU Shareholder Agreement until it was terminated pursuant to the Repurchase Letter Agreement on January 31, 2017. The NBCU Shareholder Agreement replaced the GE/NBCU Shareholder Agreement. The NBCU Shareholder Agreement provided that as long as NBCU or its affiliates beneficially own at least 5% of our outstanding common stock, NBCU was entitled to designate one individual to be nominated to our Board of Directors. In addition, the NBCU Shareholder Agreement provided that NBCU was able to designate its director designee to be an observer of the audit, human resources and compensation, and corporate governance and nominating committees of our Board of Directors. In addition, the NBCU Shareholder Agreement required us to obtain the consent of NBCU prior to our adoption or amendment of any shareholder’s rights plan or certain other actions that would impede or restrict the ability of NBCU to acquire our voting stock or our taking any action that would result in NBCU being deemed to be in violation of the Federal Communications Commission multiple ownership regulations.
The NBCU Shareholder Agreement also provided that unless NBCU beneficially owned less than 5% or more than 90% of the adjusted outstanding shares of common stock, NBCU could not sell, transfer or otherwise dispose of any securities of the Company subject to limited exceptions for (i) transfers to affiliates, (ii) third party tender offers, (iii) mergers, consolidations and reorganizations and (iv) transfers pursuant to underwritten public offerings or transfers exempt from registration under the Securities Act (provided, in the case of (iv), such transfers would not result in the transferee acquiring beneficial ownership in excess of 20%).
Registration Rights Agreement
On February 25, 2009, we entered into an amended and restated registration rights agreement that, as further amended, provided GE Equity, NBCU and their affiliates and any transferees and assigns, an aggregate of five demand registrations and unlimited piggy-back registration rights. In connection with the GE/ASF Radio Sale, an amendment to the Amended and Restated Registration Rights Agreement was entered into removing GE Equity as a party and adding ASF Radio as a party.
2015 Letter Agreement with GE Equity
On July 9, 2015, we entered into a letter agreement with GE Equity (the “GE Letter Agreement”) pursuant to which GE Equity consented to our adoption of a Shareholder Rights Plan in consideration for our agreement to provide GE Equity, NBCU and certain of their respective affiliates with exemptions from the Shareholder Rights Plan. GE Equity’s consent was required pursuant to the terms of the GE/NBCU Shareholder Agreement. This discussion is a summary of the terms of the letter agreement. In the GE Letter Agreement, we agreed that if any of GE Equity, NBCU or any of their respective affiliates that holds shares of our common stock from time to time (each a “Grandfathered Investor”) sells or otherwise transfers shares of our common stock currently owned by such Grandfathered Investor to any third party identified to us in writing (any such third party, an “Exempt Purchaser”), we will take all actions necessary under the Shareholder Rights Plan so that such third party will not be deemed an Acquiring Person (as defined in the Shareholder Rights Plan) by virtue of the acquisition of such shares. We further agreed that, subject to certain limitations, upon request of any Grandfathered Investor or Exempt Purchaser, and in connection with a transfer by such Grandfathered Investor or Exempt Purchaser of shares of our common stock to an Exempt Purchaser, we will enter into an agreement with the acquiring Exempt Purchaser granting such acquiring Exempt Purchaser substantially the same rights as set forth above with respect to any sale of our outstanding shares of common stock to any other third party. Additionally, we agreed that without the consent of any Grandfathered Investor that is an affiliate of GE Equity and any Grandfathered Investor that is an affiliate of NBCU, we will not (i) amend the Shareholder Rights Plan in any material respect, other than to accelerate the Expiration Date (as defined in the Shareholder Rights Plan) or the Final Expiration Date (as defined in the Shareholder Rights Plan), (ii) adopt another shareholders' rights plan or (iii) amend the letter agreement.
7
E. Marketing and Merchandising
Television and Online Retailing
Our television and online revenues are generated from sales of merchandise offered through our interactive digital platforms, which includes cable and satellite television, online at evine.com, mobile devices and social media channels. Our television shopping business utilizes live and selected taped television programming 24 hours a day, seven days a week, to create an interactive, entertaining, and engaging experience that brings our merchandise to life through demonstration. Our product strategy is to continue to develop and expand new product offerings across multiple merchandise categories based on customer demand, as well as to offer competitive pricing and special values in order to attract new customers and optimize margin dollars per minute. Our core video commerce customers - those who interact with our network and transact through television, online and mobile devices - are primarily women between the ages of 45 and 70. We also have a strong presence of male customers of a similar age range. We believe our customers make purchases based on our unique products, quality merchandise and value. We develop our programming schedule with product categories that appeal to specific viewer and customer profiles targeting days of week and times of day they are most likely to be viewing our network. We feature announced and unannounced promotions to drive interest and incremental sales, including "Today’s Top Value," a sales promotion that features a special offer every day. In addition, we also feature major and special promotional events and inventory-clearance sales during different times of the year.
We continually introduce new products that are easily accessible to customers via our television, online and mobile platforms. Inventory sources include manufacturers, wholesalers, distributors and importers. We intend to continue to develop and promote proprietary brands and exclusive products, which generally have higher margins than widely sold merchandise, across multiple product categories.
Evine Private Label Consumer Credit Card Program
We have a private label consumer credit card program (the "Program"). The Program is made available to all qualified consumers to finance Evine purchases and provides benefits including instant purchase credits, free or reduced shipping promotions throughout the year and promotional low-interest financing on qualifying purchases. We believe use of the Evine credit card furthers customer loyalty, reduces total credit card expense and reduces the Company’s overall bad debt exposure since Synchrony Financial ("Synchrony"), the issuing bank for the program, bears the risk of non-payment on Evine credit card transactions except those in our ValuePay installment payment program. In July 2017, we extended the Program through 2020 by entering into a Private Label Consumer Credit Card Program Agreement Amendment with Synchrony. During fiscal 2017, 2016 and 2015, customer use of the private label consumer credit card accounted for approximately 21%, 20% and 18% of our television and online sales.
Synchrony was previously indirectly majority-owned by the General Electric Company ("GE"), which is also the parent company of GE Equity. Prior to GE Equity's sale of our common stock to ASF Radio on April 29, 2016, GE Equity had a beneficial ownership in us and had certain rights as further described under "Relationship with GE Equity, Comcast and NBCU".
Purchasing Terms
We obtain products for our interactive digital commerce businesses from domestic and foreign manufacturers and/or their suppliers and are often able to make purchases on more favorable terms due to the volume of products purchased or sold. Some of our purchasing arrangements with our vendors include inventory terms that allow for return privileges for a portion of the order or stock balancing. We generally do not have long-term commitments with our vendors, and a variety of sources are available for each category of merchandise sold. During fiscal 2017, products purchased from one vendor accounted for approximately 15% of our consolidated net sales. We believe that we could find alternative products for this vendor’s merchandise assortment if this vendor ceased supplying merchandise; however, the unanticipated loss of any large supplier could negatively impact our sales and earnings.
F. Order Entry, Fulfillment and Customer Service
Our products are available for purchase via toll-free telephone numbers, on our website and through mobile platforms. We maintain agreements with third party service providers to support us with volume peaks in demand for telephone order-entry operators and automated order-processing services to take customer orders. We receive orders with our own home-based phone agents, agents at our Bowling Green, Kentucky distribution center, and at our Eden Prairie, Minnesota corporate headquarters.
We own an approximately 600,000 square foot distribution facility in Bowling Green, Kentucky, used primarily for the fulfillment of customer orders for merchandise purchased and sold by us and for certain call center operations.
8
During fiscal 2014, we began a significant operational expansion initiative with respect to overall warehousing capacity and new equipment and system technology upgrades at our Bowling Green, Kentucky distribution facility. During fiscal 2015, we expanded our 262,000 square foot facility to our current approximately 600,000 square foot facility and moved out of our leased satellite warehouse space. The updated facilities and technology upgrade included a new high-speed parcel shipping and item sortation system coupled with a new warehouse management system to support our increased level of shipments and units and a new call center facility to better serve our customers. The new sortation and warehouse management systems were phased into production through fiscal 2016.
The majority of customer purchases are paid for by credit or debit cards, including our private label credit card discussed above. Purchases and installment charges made with the Evine private label credit card are non-recourse to us, however, we still maintain credit collection risk from the potential inability to collect future ValuePay installments. Our ValuePay program is an interest-free installment payment program which allows customers to pay by credit card for certain merchandise in two or more equal monthly installments. The percentage of our net sales in which our customer utilized our ValuePay payment program over the past three fiscal years ranged from 68% to 72%. We intend to continue to sell merchandise using the ValuePay program due to its significant promotional value.
We maintain a product inventory, which consists primarily of consumer merchandise held for resale. The product inventory is valued at the lower of average cost or realizable value. As of February 3, 2018 and January 28, 2017, we had inventory balances of $68.8 million and $70.2 million. We do not have any material amounts of backlog orders.
Merchandise is shipped to customers by the United States Postal Service, UPS, Federal Express or other recognized carriers. We also have arrangements with certain vendors who drop-ship merchandise directly to our customers after an approved customer order is processed.
We perform our customer service functions primarily at our Eden Prairie, Minnesota and Bowling Green, Kentucky facilities, as well as with our own home-based phone agents.
Our standard return policy allows a 30-day refund period from the date of customer receipt for all customer purchases. Our return rate averaged 19% in both fiscal 2017 and fiscal 2016 and 20% in fiscal 2015. We continue to monitor our return rates in an effort to keep our overall return rates in line and commensurate with our current product sales mix and our average selling price levels.
G. Competition
The digital commerce retail business is highly competitive and we are in direct competition with numerous retailers, including online retailers, many of whom are larger, better financed and have a broader customer base than we do. In our television shopping and digital commerce operations, we compete for customers with other television shopping and e-commerce retailers, infomercial companies, other types of consumer retail businesses, including traditional "brick and mortar" department stores, discount stores, warehouse stores and specialty stores; catalog and mail order retailers and other direct sellers.
Our direct competitors within the television shopping industry include QVC, Inc. and HSN, Inc. QVC, Inc. is owned by Liberty Interactive Corporation (to be renamed Qurate Retail Group, Inc.), which recently completed the purchase of the remaining 62% of HSN, Inc. to increase its holdings in HSN, Inc. to 100%. Both QVC, Inc. and HSN, Inc. are substantially larger than we are in terms of annual revenues and customers, and the programming of each is carried more broadly to U.S. households, including high definition bands and multi-channel carriage, than our programming. Multimedia Commerce Group, Inc., which operates Jewelry Television, also competes with us for customers in the jewelry category. In addition, there are a number of smaller niche retailers and startups in the television shopping arena who compete with us. We believe that our major competitors incur cable and satellite distribution fees representing a significantly lower percentage of their sales attributable to their television programming than we do, and that their fee arrangements are substantially on a commission basis (in some cases with minimum guarantees) rather than on the predominantly fixed-cost basis that we currently have. At our current sales level, our distribution costs as a percentage of total consolidated net sales are higher than those of our competition. However, we have the ability to leverage this fixed expense with sales growth to accelerate improvement in our profitability.
We anticipate continued competition for viewers and customers, for experienced video commerce and e-commerce personnel, for distribution agreements with cable and satellite systems and for vendors and suppliers - not only from television shopping companies, but also from other companies that seek to enter the video commerce and online retail industries, including telecommunications and cable companies, television networks, and other established retailers. We believe that our ability to be successful in the video commerce industry will be dependent on a number of key factors, including continuing to expand our digital footprint to meet our customers' needs, increasing the lifetime value of our customer base by a combination of growing the number of customers who purchase products from us and maximizing the dollar value of sales and profitability per customer.
9
H. Federal Regulation
The cable television industry is subject to extensive regulation by the Federal Communications Commission, or FCC. The following does not purport to be a complete summary of all of the provisions of the Communications Act of 1934, as amended, known as the Communications Act; the Cable Television Consumer Protection Act of 1992, known as the Cable Act; the Telecommunications Act of 1996, known as the Telecommunications Act; or other laws and FCC rules or policies that may affect our operations. Proposals for additional or revised regulations and requirements are pending before, are being considered by, and may in the future be considered by, Congress and federal regulatory agencies from time to time. We cannot predict the effect of any existing or proposed federal legislation, regulations or policies on our business.
Cable Television
The cable industry is regulated by the FCC under the Cable Act and FCC regulations promulgated thereunder, as well as by state or local governments with respect to certain franchising matters. The FCC regulates the terms of cable programming networks that are distributed by satellite, as ours is. Those regulations require, among other things, that programming channels be provided to all competing multichannel video programming distributors (“MVPDs”). FCC rules also require that all video programming distributed over MVPDs include captioning for the hearing-impaired, and that all programs that were originally produced to be viewed over MVPD facilities include captions if they are subsequently distributed over the internet.
Product Marketing
We offer our customers a broad range of merchandise through television, online and mobile. The manner in which we promote and sell our merchandise, including claims and representations made in connection with these efforts, is regulated by a wide variety of federal, state and local laws, regulations, rules, policies and procedures. Some examples of these that affect the manner in which we sell and promote merchandise or otherwise operate our businesses include, but are not limited to, the following:
• | The Food and Drug Administration’s regulations regarding marketing claims that can be made about cosmetic beauty products and over-the-counter drugs, which include products for treating acne or medical products, and claims that can be made about food products and dietary supplements; |
• | The Federal Trade Commission’s regulations requiring that marketing claims across all product and service categories are truthful, not misleading, and substantiated, as well as its related regulations requiring disclosures concerning the seller’s material connections with or compensation to endorsers and influencers. |
• | Regulations related to product safety issues and product recalls including, but not limited to, the Consumer Product Safety Act, the Consumer Product Safety Improvement Act of 2008, the Federal Hazardous Substance Act, the Flammable Fabrics Act and regulations promulgated pursuant to these acts; and |
• | Laws governing the collection, use, retention, security and transfer of personally-identifiable information about our customers. |
These laws, regulations, rules, policies and procedures are subject to change at any time. Unfavorable changes applicable to us could decrease demand for merchandise offered by us, increase costs which we may not be able to offset, subject us to additional liabilities and/or otherwise adversely affect our businesses.
I. Intellectual Property
We regard our intellectual property, including trademarks, service marks, copyright patents, domain names, trade dress, trade secrets and proprietary technologies, as critical to our success. We rely on intellectual property protections and on confidentiality and/or license agreements with our employees, vendors, partners and others to protect our proprietary rights. We have registered, or applied for the registration of, a number of U.S. domain names, trademarks and service marks. Our registered trademarks and service marks are presumed valid in the United States, as long as they are in use, their registrations are properly maintained, and they have not been found to have become generic. Registrations of trademarks and service marks can also generally be renewed indefinitely as long as the trademarks and service marks are in use.
J. Seasonality and Economic Sensitivity
Our business is subject to seasonal fluctuation, with the highest sales activity normally occurring during our fourth fiscal quarter of the year, namely November through January. Our business is also sensitive to general economic conditions and business conditions affecting consumer spending. Additionally, our television audience (and therefore sales revenue) can be significantly
10
impacted by major world or domestic television-covering events which attract viewership and divert audience attention away from our programming.
K. Employees
At February 3, 2018, we had approximately 1,200 employees, the majority of whom are employed in customer service, order fulfillment and television production. Approximately 12% of our employees work part-time. We are not a party to any collective bargaining agreement with respect to our employees.
L. Executive Officers of the Registrant
Set forth below are the names, ages and titles of the persons serving as our executive officers.
Name | Age | Position(s) Held | ||
Robert J. Rosenblatt | 60 | Chief Executive Officer and Director | ||
Timothy A. Peterman | 50 | Executive Vice President — Chief Operating Officer / Chief Financial Officer | ||
Nicole R. Ostoya | 48 | Executive Vice President — Chief Marketing Officer | ||
Michael A. Henry | 60 | Senior Vice President — Chief Merchandising Officer | ||
Andrea M. Fike | 57 | Senior Vice President — General Counsel and Corporate Secretary | ||
Nicholas J. Vassallo | 54 | Senior Vice President — Corporate Controller | ||
Robert J. Rosenblatt joined the Company in June 2014 as Chairman of the Board. In February 2016, Mr. Rosenblatt was appointed Interim Chief Executive Officer and permanent Chief Executive Officer in August 2016. Previously, Mr. Rosenblatt served as Chief Executive Officer of Rosenblatt Consulting, LLC, a private company he formed in 2006, which specializes in helping investment firms determine value in both public and private consumer companies as well as helping retail firms bring their product to market. From 2012 to 2013, Mr. Rosenblatt served as the interim President of ideeli Inc., a members-only e-retailer that sells women's fashion and décor items during limited-time sales. From 2004 to 2006, he was Group President and Chief Operating Officer of Tommy Hilfiger Corp. (then a public company), a worldwide apparel and retail company. He co-managed the process that culminated in the successful sale of Tommy Hilfiger Corp. to Apax Partners in 2006. From 1997 to 2004, Mr. Rosenblatt was an executive at HSN, Inc., a multi-channel retailer and television network specializing in home shopping. He served as Chief Financial Officer from 1997 to 1999, Chief Operating Officer from 2000 to 2001 and President from 2001 to 2004. Previously, from 1983 to 1996, he was an executive at Bloomingdale's, an upscale chain of department stores owned by Macy's Inc., and served as Chief Financial Officer and Vice President of Stores. He currently serves on the board of RetailNext, a provider of technology and analytics solutions to the retail industry. Mr. Rosenblatt also served on the Board of Directors of Newgistics, Inc., I.Predictus, debShops, PepBoys and the Electronic Retailing Association, and was an adjunct professor at Fashion Institute of Technology where he taught entrepreneurial studies. Mr. Rosenblatt holds a BS in Accounting from Brooklyn College.
Timothy A. Peterman joined the Company as Chief Financial Officer in March 2015, and was promoted to Chief Operating Officer / Chief Financial Officer in June 2017. Most recently, Mr. Peterman served as the Chief Operating Officer and Chief Financial Officer for The J. Peterman Company, an ecommerce apparel brand, since 2011 until he joined the Company in March 2015. From 2009 to 2011, he served as Chief Operating Officer and Chief Financial Officer of Synacor, a media technology company. Previously, Mr. Peterman served almost six years at The E.W. Scripps Company in various senior roles, including Senior Vice President of Corporate Development. From 1999 to 2002, he was Chief Operating Officer and Chief Financial Officer of IAC’s broadcasting and cable divisions, which included USA Network & Sci-Fi Channel. Mr. Peterman also spent almost six years in senior financial roles at Tribune Company. Mr. Peterman began his career at KPMG in Chicago in 1989, is a CPA and holds a BS in accounting from the University of Kentucky.
Nicole R. Ostoya joined the Company as Executive Vice President and Chief Marketing Officer in April 2016. Most recently, Ms. Ostoya co-founded The Cocktail Lab in January 2014, a gourmet craft cocktail emporium catering to both the professional bartending community and the adventurous home cocktailer. Previously, Ms. Ostoya co-founded and served as Chief Executive Officer of BoldFace, a celebrity beauty license holding company from May 2012 to October 2014. In July of 2010, Ms. Ostoya co-founded and owned Gold Grenade, a brand management company specializing in product development, strategic marketing and executing, which covered all channels of distribution including the luxury markets, specialty retailers and masstige including
11
direct to consumer until September 2014. Previously, Ms. Ostoya was Director of Business Development, Benefit Cosmetics for LVMH; she co-founded and served as Chief Executive Officer of iDTV Studios, an online shopping network; co-owned Harlot, a bar and lounge in San Francisco; and served as Chief Executive Officer of Studio USA LLC. Ms. Ostoya began her career at Nordstrom where she spent over 18 years, including serving as full line Store Manager. Ms. Ostoya received her Associate of Arts degree from the Fashion Institute of Design and Merchandising in San Francisco, CA.
Michael A. Henry joined the Company as Senior Vice President and Chief Merchandising Officer in May 2016. Most recently, Mr. Henry served as an executive consultant to Shopping Live, a 24-hour television shopping network operating in Russia from November 2015 until May 2016. In 2015, Mr. Henry served as Chief Merchandising Officer at Eastern Home Shopping, Taiwan. From 2012 to 2015, Mr. Henry served as Director of Merchandising, Planning and Programming at QVC Italia S.r.l. Mr. Henry also served eight years as Senior Vice President Merchandising at HSN, Inc., a multi-channel retailer and television network specializing in home shopping. Prior to HSN, Mr. Henry spent several years in the beauty industry holding key leadership positions in sales and marketing, including Vice President Promotional Marketing of Lancôme, and Executive Director of Marketing and Creative at Yves Saint Laurent Beauty. He began his career as an executive for Saks Fifth Avenue. Mr. Henry holds an MBA in Marketing from Columbia University and a BS degree from Georgetown University.
Andrea M. Fike joined the Company as Senior Vice President and General Counsel in May 2017. Most recently, Ms. Fike served as Senior Vice President and General Counsel at Regency Corporation, an educational institution offering cosmetology education through numerous campuses, from 2008 to 2017. At Regency Corporation, Ms. Fike was responsible for management of the Legal and Compliance, Campus Operations, and Human Resources functions. Previous to that, she spent eight years at FICO, a leading analytics software company where she was responsible for oversight of the Legal Department and was the P&L Leader for the Fraud Group and the Consumer Group. Ms. Fike also spent 10 years at Faegre Baker Daniels LLP, where, as a partner, her work primarily focused on financial institutions regulatory law. She holds a JD from Stanford Law School and a BA in Political Science from the University of Wisconsin, Madison.
Nicholas J. Vassallo has served as the Company's Corporate Controller since 1999, and as Senior Vice President since October 2015. He first joined the Company as director of financial reporting in October 1996. Mr. Vassallo was named corporate controller in 1999 and the following year was promoted to vice president. Prior to joining the Company, he served as corporate controller for Fourth Shift Corporation, a software development company. Mr. Vassallo began his career with Arthur Anderson, LLP where he spent eight years in its audit practice group. Mr. Vassallo is a CPA and holds a BS in Accounting from St. John's University in New York.
M. Segments and Geographic Information
We have only one reporting segment, which encompasses interactive digital commerce retailing, and our operations are conducted primarily in the United States. The segment and geographic information required herein is contained in Note 10 - "Business Segments and Sales by Product Group" in the notes to our consolidated financial statements.
N. Available Information
Our annual report on Form 10-K, quarterly reports on Form 10-Q and current reports on Form 8-K, proxy and information statements, and amendments to these reports if applicable, are available, without charge, on our investor relations website as soon as reasonably practicable after they are electronically filed with or furnished to the SEC. Copies also are available, without charge, by contacting the General Counsel, EVINE Live Inc., 6740 Shady Oak Road, Eden Prairie, Minnesota 55344-3433.
Our investor relations website address is investors.evine.com. Our goal is to maintain the investor relations website as a way for investors to easily find information about us, including press releases, announcements of investor conferences, investor and analyst presentations and corporate governance. The information found on our website is not part of this or any other report we file with, or furnish to, the SEC.
You may also read and copy these materials at the SEC’s Public Reference Room at 100 F Street, N.E., Washington, D.C. 20549. You may obtain information on the operation of the Public Reference Room by calling the SEC at 1-800-SEC-0330. The SEC also maintains a website at www.sec.gov that contains reports, proxy and information statements and other information regarding us and other companies that file materials with the SEC electronically.
12
Item 1A. Risk Factors
In addition to the general investment risks and those factors set forth throughout this document, including those set forth under the caption "Cautionary Statement Concerning Forward-Looking Information," the following risks should be considered regarding our company.
We have a history of losses and a high fixed cost operating base and may not be able to achieve or maintain profitable operations in the future.
We experienced operating income (losses) of approximately $3.2 million, $(2.0) million and $(8.7) million in fiscal 2017, fiscal 2016 and fiscal 2015. We reported net income (losses) of $0.1 million, $(8.7) million and $(12.3) million in fiscal 2017, fiscal 2016 and fiscal 2015. There is no assurance that we will be able to achieve or maintain profitable operations in future fiscal years.
Our television shopping business operates with a high fixed cost base, primarily driven by fixed fees under distribution agreements with cable and direct-to-home satellite providers to carry our programming. In order to operate on a profitable basis, we must reach and maintain sufficient annual sales revenues to cover our high fixed cost base and/or negotiate a reduction in this cost structure. If our sales levels are not sufficient to cover our operating expenses, our ability to reduce operating expenses in the near term will be limited by the fixed cost base. In that case, our earnings, cash balance and growth prospects could be materially adversely affected.
We have had a historic trend of operating losses, which, if not reversed, could reduce our operating cash resources to the point where we will not have sufficient liquidity to meet the ongoing cash commitments and obligations to continue operating our business.
As of February 3, 2018, we had approximately $23.9 million in unrestricted cash, with an additional $0.5 million of restricted cash and investments. We expect to use our cash and available credit line to finance our working capital requirements and to make necessary capital expenditures in order to operate our business and to fund any further operating losses. We have had a historic trend of operating losses, which, if not reversed, could reduce our operating cash resources to the point where we would not be able to adequately fund working capital requirements or necessary capital expenditures.
The Company has a credit and security agreement (as amended through September 25, 2017, the "PNC Credit Facility") with PNC Bank, N.A. ("PNC"), a member of The PNC Financial Services Group, Inc., as lender and agent. The PNC Credit Facility, which includes CIBC Bank USA (formerly known as The Private Bank) as part of the facility, provides a revolving line of credit of $90.0 million and provides for a term loan on which we had originally drawn to fund improvements at our distribution facility in Bowling Green, Kentucky and subsequently, to pay down our GACP Term Loan (as defined below). The PNC Credit Facility also provides an accordion feature that would allow us to expand the size of the revolving line of credit by an additional $25.0 million at the discretion of the lenders and upon certain conditions being met. On March 21, 2017, the Company entered into the Eighth Amendment to the PNC Credit Facility, which among other things, increased the term loan by $6,000,000, extended the term of the PNC Credit Facility from May 1, 2020 to March 21, 2022, and authorized the proceeds from the term loan to be used as part of a voluntary prepayment of $9,500,000 on its GACP Term Loan.
All borrowings under the PNC Credit Facility mature and are payable on March 21, 2022. Maximum borrowings and available capacity under the amended revolving PNC Credit Facility are equal to the lesser of $90 million or a calculated borrowing base comprised of eligible accounts receivable and eligible inventory. Remaining capacity under the PNC Credit Facility, was $18.4 million as of February 3, 2018.
On March 10, 2016, we entered into a five-year term loan credit and security agreement (as amended through September 25, 2017, the "GACP Credit Agreement") with GACP Finance Co., LLC ("GACP") for a term loan of $17 million. Proceeds from the GACP Term Loan were used to provide for working capital and general corporate purposes and to help strengthen our total liquidity position. During fiscal 2017, we made three voluntary principal prepayments which satisfied all outstanding debt under the GACP Term Loan.
We have significant future commitments for our cash, which primarily include payments for cable and satellite program distribution obligations and the eventual repayment of the PNC Credit Facility. Based on our current projections for fiscal 2018, we believe that our existing cash balances and available credit line will be sufficient to maintain liquidity to fund our normal business operations over the next twelve months. However, the PNC Credit Facility includes certain restrictions on our ability to incur additional indebtedness or prepay existing indebtedness, to create liens or other encumbrances, to sell or otherwise dispose of assets, and to merge or consolidate with other entities, which may be necessary in times of liquidity constraints. Therefore, there can be no assurance that, if required, we would be able to raise additional capital or reduce spending to have sufficient liquidity to meet our ongoing cash commitments and obligations to continue operating our business.
13
Our stock price has experienced a significant decline, which could further adversely affect our ability to raise additional capital and/or cause us to be subject to securities class action litigation.
The market price of our common stock has experienced a significant decline from which it has not fully recovered. In 2015, the sales price of our common stock, as reported on the Nasdaq Global Market, declined from a high of $6.99 in the first quarter of 2015 to a low of $0.41 in the first quarter of 2016. Most recently, on April 4, 2018, the market price of our common stock, as reported on the Nasdaq Global Market, closed at a price of $0.99 per share. Our progress in developing and commercializing our products, our quarterly operating results, announcements of new products by us or our competitors, our perceived prospects, changes in securities’ analysts’ recommendations or earnings estimates, changes in general conditions in the economy or the financial markets, adverse events related to our strategic relationships, significant sales of our common stock by existing stockholders and other developments affecting us or our competitors could cause the market price of our common stock to fluctuate substantially. In addition, in recent years the stock market has experienced extreme price and volume fluctuations. This volatility has had a significant effect on the market prices of securities issued by many companies for reasons unrelated to their operating performance. These market fluctuations, regardless of the cause, may materially and adversely affect our stock price, regardless of our operating results. In addition, we may be subject to securities class action litigation as a result of volatility in the price of our common stock, which could result in substantial costs and diversion of management’s attention and resources and could harm our stock price, business, prospects, results of operations and financial condition.
Although we are currently in compliance with the Nasdaq Global Market listing standards, we may not be able to meet the continued listing requirements in the future, which require, among other things, a minimum bid price of $1.00 per share for our listed common stock. While we would consider implementation of customary options, including a reverse stock split, if our common stock does not trade at the required level that regains compliance, if our efforts are unsuccessful or we are otherwise unable to satisfy the Nasdaq criteria for maintaining our listing, our common stock could be subject to delisting. In the event of a delisting, we could face significant material adverse consequences including: increased difficulty in our shareholders’ ability to dispose of our common stock; a limited availability of market quotations for our common stock; a limited amount of news and analyst coverage for our company; a decrease in the market price of our common stock; and a decreased ability to issue additional securities or obtain additional financing in the future.
Our long-term success depends, in large part, on our continued ability to attract new and retain existing customers in a cost-effective manner.
In an effort to attract and retain customers, we use considerable funds and resources for various marketing and merchandising initiatives, particularly for the production and distribution of television programming and the updating of our digital strategy to increasingly engage customers through digital channels and social media. These initiatives, however, may not resonate with existing customers or consumers generally or may not be cost-effective.
We believe that costs associated with the production and distribution of our television programming and costs associated with digital marketing, including search engine marketing and social media marketing, are likely to increase in the foreseeable future. Our digital business depends on a high degree of website traffic, which is dependent on many factors, including the availability of appealing website content, user loyalty and new user generation from search engine portals. In obtaining a significant amount of website traffic through search engines, we utilize techniques such as search engine optimization and search engine marketing to improve our placement in relevant search queries. Search engines, including Google, frequently update and change the logic that determines the placement and display of a user's search, such that the purchased or algorithmic placement of links to our websites can be negatively affected. Moreover, a search engine could, for competitive or other purposes, alter its search algorithms or results causing our website to place lower in search query results. If a major search engine changes its algorithms in a manner that negatively affects our paid or unpaid search ranking, or if competitive dynamics impact the effectiveness of our search engine optimization and search engine marketing in a negative manner, the business and financial performance of our digital commerce business could be adversely affected. Furthermore, the failure to successfully manage our search engine optimization and search engine marketing strategies could result in a substantial decrease in traffic to our website, as well as increased costs if we were to replace free traffic with paid traffic. Even if our online commerce businesses are successful in generating a high level of website traffic, no assurance can be given that our business will be successful in achieving repeat user loyalty or that new visitors will explore the offerings on our site. Monetizing this traffic by converting users to consumers is dependent on many factors, including availability of inventory, consumer preferences, price, ease of use and website quality. No assurance can be given that the fees paid to search portals will not exceed the revenue generated by our website visitors. Any failure to sustain user traffic or to monetize such traffic could materially adversely affect the financial performance of our business and, as a result, adversely affect our financial results. In addition, customers continue to increase their expectations for faster delivery times with free or reduced shipping prices. Increased delivery costs, particularly if we are unable to offset them by increasing prices without a detrimental effect on customer demand, and the extent to which we offer shipping promotions to our customers, could have an adverse effect on our business, financial condition and results of operations.
14
Covenants in our debt agreements restrict our business in many ways.
The PNC Credit Facility contains various covenants that limit our ability and/or our subsidiaries' ability to, among other things, incur additional indebtedness or prepay existing indebtedness, to create liens or other encumbrances, to sell or otherwise dispose of assets, to merge or consolidate with other entities, and to make certain restricted payments, including payments of dividends to common shareholders. In addition, certain financial covenants, including minimum EBITDA levels and a minimum fixed charge coverage ratio, become applicable if unrestricted cash plus facility availability falls below $10.8 million or upon an event of default. Please refer to Item 7, “Management’s Discussion and Analysis of Financial Condition and Results of Operations-Financial Condition, Liquidity and Capital Resources-Sources of Liquidity” below for a discussion of the PNC Credit Facility. Upon the occurrence of an event of default under the PNC Credit Facility, the lender could elect to declare all amounts outstanding under the PNC Credit Facility to be immediately due and payable and terminate all commitments to extend further credit. If we were unable to repay those amounts, the lender could proceed against the collateral granted to them to secure that indebtedness. The PNC Credit Facility is secured by substantially all of the Company’s personal property, as well as the Company’s real properties located in Eden Prairie, Minnesota and Bowling Green, Kentucky. If the lender and counter parties under the PNC Credit Facility accelerate the repayment of obligations, we may not have sufficient assets to repay such obligations. Our borrowings under the PNC Credit Facility are at variable rates of interest and expose us to interest rate risk. If interest rates increase, our debt service obligations on the variable rate indebtedness will also increase even though the amount borrowed remains the same, and our net income would decrease.
Our inability to recruit and retain key employees may adversely impact our ability to sustain growth.
Our growth is contingent, in part, on our ability to retain and recruit employees who have the distinct skills necessary for a business that demands knowledge of the general retail industry, merchandising and product sourcing, television production, televised and internet-based marketing and fulfillment. In recent years, we have experienced significant senior management turnover, including the resignation of Mark C. Bozek as our Chief Executive Officer and as a member of our board of directors and the appointment of Robert Rosenblatt as interim Chief Executive Officer, effective February 8, 2016, and permanent Chief Executive Officer, effective August 18, 2016. The marketplace for such key employees is very competitive and limited. Our growth may be adversely impacted if we are unable to attract and retain key employees. In addition, turnover of senior management can adversely impact our stock price, our results of operations, our vendor relationships and may make recruiting for future management positions more difficult. Further we may incur significant expenses related to any executive transition costs that may impact our operating results. For example, in fiscal 2017, fiscal 2016 and fiscal 2015, the Company recorded charges to income of $2.1 million, $4.4 million and $3.5 million related to executive and management transition costs incurred, which included severance payments that our former Chief Executive Officer and certain other terminated executive and senior officers received.
Changes in technology and in consumer viewing patterns may negatively impact our video content viewing and could result in a decrease in revenue.
As a multiplatform interactive digital commerce retail business, we are dependent on our ability to attract and retain viewers and must successfully adapt to technological advances in the media entertainment industry, including the emergence of alternative distribution platforms, such as digital video recorders, video-on-demand and subscription video-on-demand (e.g., Netflix, Hulu, Amazon Prime). New technologies affect the manner in which our programming is distributed to consumers, the sources and nature of competing content offerings, and the time and manner in which consumers view our programming. This trend has impacted the traditional forms of distribution, as evidenced by the industry-wide decline in ratings for broadcast television, the development of alternative distribution channels for broadcast and cable programming and declines in cable and satellite subscriber levels across the industry. In order to respond to these developments, we have developed a multiplatform distribution approach, including delivering our content over various streaming applications such as Roku and Apple TV and distribution through social media platforms. However, there can be no assurance that we will successfully respond to these changes which could result in a loss of viewership and a decrease in revenue.
The failure to secure suitable placement for our television programming could adversely affect our ability to attract and retain television viewers and could result in a decrease in revenue.
We are dependent upon our ability to compete for television viewers. Effectively competing for television viewers is dependent, in part, on our ability to secure placement of our television programming within a suitable programming tier at a desirable channel position. The majority of multi-video programming distributors now offer programming on a digital basis, which has resulted in increased channel capacity. While the growth of digital cable and these other systems may over time make it possible for our programming to be more widely distributed, there are several risks as well. The primary risks associated with the growth of digital cable and alternative digital platforms are demonstrated by the following:
• | we could experience declines in sales per digital tier subscriber because of the increased number of channels offered on digital systems competing for the same number of viewers and the less desirable location we typically are assigned in digital tiers; |
15
• | more competitors may enter the marketplace as additional channel capacity is added; |
• | we may not be able to successfully negotiate renewal terms for our programming distribution agreements that are favorable to us or that offer our programming to viewers within a suitable programming tier at a desirable channel position; |
• | more programming options being available to the viewing public in the form of new television networks and time-shifted viewing (e.g., personal video recorders, video-on-demand, interactive television and streaming video over broadband internet connections as well as increased access to various media through wireless devices); |
• | cable, satellite, and telecommunication providers are facing competition from new services which could result in a loss of subscribers; and |
• | our effective costs of distribution may increase as we deliver programming in multiple channel locations unless we secure increases in customers. |
New technologies have been and are expected to continue to be developed that increase the number of entertainment choices available and the manners in which they are delivered. Failure to adapt to these risks will result in lower revenue and may adversely impact our results of operations. In addition, failure to anticipate and adapt to technological changes in a cost-effective manner that meets customer demands and evolving industry standards will also reduce our revenue, adversely impact our results of operations and financial condition and have a negative impact on our business.
We may not be able to expand or could lose some of our existing programming distribution if we cannot negotiate profitable distribution agreements.
We continue to seek reductions in the costs associated with our cable and satellite distribution agreements. However, there can be no assurance that we will achieve cost reductions in the future or that we will be able to maintain or grow our households on financial terms that are profitable to us. Terms of certain of our distribution agreements allow for increases or decreases in our distribution costs as a result of a variety of factors, not all of which are within our control. These factors include, but are not limited to, increases or decreases in the number of subscribers receiving our programming, channel placement changes, the addition of a second channel or other factors. Significant changes to these factors could result in a material increase in our cost of distribution. If we are unable to negotiate new or renewal terms in our distribution agreements that are equal or more favorable to us, our distribution costs could increase. In addition, the continued consolidation of the pay television operator industry could cause us to lose leverage when negotiating new agreements or result in less favorable terms. Further, it is possible that we may need to reduce our programming distribution in certain systems if we are unable to obtain appropriate financial contract terms. Failure to successfully renew agreements covering a material portion of our existing cable and satellite households on acceptable financial and other terms could adversely affect our future growth, sales revenues and earnings unless we are able to arrange for alternative means of broadly distributing our television programming.
Competition in the general merchandise retailing industry and particularly the live television shopping and e-commerce sectors could limit our growth and reduce our profitability.
As a general merchandise retailer, we compete for consumers with other forms of retail businesses, including other television shopping and e-commerce retailers, infomercial companies, other types of consumer retail businesses, including traditional "brick and mortar" department stores, discount stores, warehouse stores, specialty stores, catalog and mail order retailers and other direct sellers. In the competitive television shopping sector, we compete with QVC, HSN, and Jewelry Television, as well as a number of smaller start-up and "niche" television shopping competitors. QVC and HSN both are substantially larger than we are in terms of annual revenues and customers, their programming is more broadly available to U.S. households than is our programming and in many markets they have more favorable channel positions than we have. The video commerce industry is also highly competitive, with numerous e-commerce websites competing in every product category we carry, in addition to the websites operated by the other television shopping companies. This competition in the internet retailing sector makes it more challenging and expensive for us to attract new customers, retain existing customers and maintain desired gross margin levels.
Our business, financial condition and results of operations are negatively influenced by economic conditions that impact consumer spending. If macroeconomic conditions do not continue to improve or if conditions worsen, our business could be adversely affected.
Retailers generally are particularly sensitive to adverse economic and business conditions, in particular to the extent they result in a loss of consumer confidence and a decrease in consumer spending, particularly discretionary spending. If macroeconomic conditions do not continue to improve or if conditions worsen, it could have a negative impact on our business, financial condition and results of operations.
16
We may not be able to maintain our satellite services in certain situations, beyond our control, which may cause our programming to go off the air for a period of time and cause us to incur substantial additional costs.
Our programming is presently distributed to cable systems, full-power television stations and satellite dish operators via a leased communications satellite transponder. Satellite service may be interrupted due to a variety of circumstances beyond our control, such as satellite transponder failure, satellite fuel depletion, governmental action, preemption by the satellite service provider, solar activity and service failure. Our satellite transponder agreement provides us with preemptible back-up service if satellite transmission is interrupted under certain conditions. In the event of a serious transmission interruption where back-up service is not available, we may need to enter into new arrangements, resulting in substantial additional costs and the inability to broadcast our signal for some period of time.
We may be subject to product liability claims if people or properties are harmed by products sold by us, or we may be subject to voluntary or involuntary product recalls, or subject to liability for on-air statements made by our hosts or guest-hosts.
Products sold by us may expose us to product liability or product safety claims relating to personal injury, death or property damage caused by such products and may require us to take actions such as product recalls, which could involve significant expense incurred by the Company.
We maintain, and have generally required the manufacturers and vendors of these products to carry, product liability and errors and omissions insurance. We also require that our vendors fully indemnify us for such claims. There can be no assurance that we will maintain this insurance coverage or obtain additional coverage on acceptable terms, or that this insurance will provide adequate coverage against all potential claims or even be available with respect to any particular claim. There also can be no assurance that our suppliers will continue to maintain this insurance or that this coverage will be adequate or available with respect to any particular claims or will fulfill their contractual indemnification duties. Product liability claims could result in a material adverse impact on our financial performance.
We may also be subject to involuntary product recalls or we may voluntarily conduct a product recall. The costs associated with product recalls individually or in the aggregate in any given fiscal year, or for any particular recall event, could be significant. Although we maintain product recall insurance and we require that our vendors fully indemnify us for such events, an involuntary product recall could result in a material adverse impact on our financial performance. In addition, any product recall, regardless of direct costs of the recall, may harm consumer perceptions of our products and have a negative impact on our future revenues and results of operations.
In addition, the live unscripted nature of our television broadcasting may subject us to misrepresentation or false advertising claims by our customers, the Federal Trade Commission and state attorneys general. Our Company is subject to two FTC consent decrees, one issued in 2001 and one issued in 2003; both have a duration of 20 years. They consist of claims involving recordkeeping, compliance policies, and attention to detail on claim substantiation. Violations of these decrees could result in significant civil fines and penalties.
Our ValuePay installment payment program could lead to significant unplanned credit losses if our credit loss rate materially deteriorates.
We utilize an installment payment program called ValuePay that enables customers to purchase merchandise and pay for the merchandise in two or more monthly installments. Our ValuePay installment program is a key element of our promotional strategy. As of February 3, 2018, we had approximately $88.5 million due from customers under the ValuePay installment program. We maintain allowances for doubtful accounts for estimated losses resulting from the inability of our customers to make required payments. There is no guarantee that we will continue to experience the same credit loss rate that we have in the past or that losses will be within current provisions. A significant increase in our credit losses above what we have been experiencing could result in a material adverse impact on our financial performance.
Failure to comply with existing laws, rules and regulations applicable to our company, or to obtain and maintain required licenses and rights, could subject us to additional liabilities.
We market and provide a broad range of merchandise and services through multiple channels. As a result, we are subject to a wide variety of statutes, rules, regulations, policies and procedures in various jurisdictions which are subject to change at any time, including laws regarding consumer protection, privacy, the regulation of retailers generally, the labeling, importation, sale and advertising or promotion of merchandise, sweepstakes and contests and the operation of warehouse facilities, as well as laws and regulations applicable to the internet, electronic devices and businesses engaged in e-commerce. These laws and regulations may cover subject matters including taxation, privacy, data protection, pricing, payment processing, employment, content, intellectual property, distribution, mobile communications, electronic device certification, electronic contracts and other communications, consumer protection, unencumbered internet access to our services, the design and operation of websites and the characteristics and quality of our products and services. Although we undertake to monitor changes in these laws, if these
17
laws change without our knowledge, or are violated by importers, designers, vendors, manufacturers or distributors or other third-parties with which we do business, we could experience delays in shipments and receipt of goods or be subject to fines or other penalties under the controlling regulations, any of which could adversely affect our business. In addition, our failure to comply with these laws and regulations could result in fines and proceedings against us by governmental agencies and consumers, which could adversely affect our business, financial condition and results of operations. Moreover, unfavorable changes in the laws, rules and regulations applicable to us could decrease demand for merchandise offered by us, increase costs and subject us to additional liabilities. Finally, certain of these regulations impact our marketing efforts.
We may be subject to claims by consumers and state and federal authorities for security breaches involving customer information, which could materially harm our reputation and business or add significant administrative and compliance cost to our operations.
In order to operate our business, which includes multiple retail channels, we take orders for our products from customers. This requires us to obtain personal information from these customers including, but not limited to, credit card numbers. Although we take reasonable and appropriate security measures to protect customer information, there is still the risk that external or internal security breaches or digital or telecommunications spoofing could occur, including cyber incidents. In addition, new tools and discoveries by third parties in computer or communications technology or software or other developments may facilitate or result in a future compromise or breach of our computer systems. Such compromises or breaches could result in data loss and/or identity theft leading to significant liability or costs to us from notification requirements, lawsuits brought by consumers, shareholders or other businesses seeking monetary redress, state and federal authorities for fines and penalties, and could also lead to interruptions in our operations and negative publicity causing damage to our reputation and limiting customers’ willingness to purchase products from us. Businesses in the retail industry have experienced material sales declines after discovering data breaches, and our business could be similarly impacted. Reputational value is based in large part on perceptions of subjective qualities. While reputations may take decades to build, a significant negative incident can erode trust and confidence, particularly if it results in adverse mainstream and social media publicity, governmental investigations or litigation. Theft of credit card numbers of consumers could result in significant fines and consumer settlement costs, litigation costs, FTC audit requirements, and significant internal administrative costs.
In addition to possible claims for security breaches involving customer information, the secure processing, maintenance and transmission of customer information is critical to our operations and business strategy, and we devote significant resources to protect our customer information. The expenses associated with complying with a patchwork of state laws imposing differing security requirements depending on the residence of our customers could reduce our operating margins. As mentioned above, there have been continuing efforts to increase the legal and regulatory obligations and restrictions on companies conducting commerce, primarily in the areas of taxation, consumer privacy and protection of consumer personal information, and we may have to devote significant resources to information security.
Nearly all of our sales are paid for by customers using credit or debit cards and the increasingly heightened Payment Card Industry (PCI) standards regarding the storage and security of customer information could potentially impact our ability to accept card brands.
Nearly all of our customers pay for purchases via a credit or debit card. Credit and debit card brand issuers continue to heighten PCI standards that are applicable to all merchants who accept these cards. These standards primarily pertain to the processes and procedures for encrypted use and secure storage of customer data. By virtue of the volume of our overall credit card transactions, we are a Level 1 merchant which requires the annual completion of a formal Report of Compliance ("ROC") by a Qualified Security Assessor. Failure to comply with PCI standards, as required by card issuers, could result in card brand fines and/or the possible inability for us to accept a card brand. Our inability to accept one or all card brands could materially adversely affect sales. Although we received an approved ROC on July 28, 2017, there is no guarantee that we will continue to receive such approvals.
We depend on relationships with numerous manufacturers and suppliers for our products and proprietary brands; a decrease in product quality or an increase in product cost, the unanticipated loss of our larger suppliers, or the lack of customer receptivity or brand acceptance to our proprietary brands could impact our sales.
We procure merchandise from numerous manufacturers and suppliers generally pursuant to short-term contracts and purchase orders. Our ability to identify, establish and maintain relationships with these parties, as well as access quality merchandise in a timely and efficient manner on acceptable terms and at acceptable costs, can be challenging. We depend on the ability of these parties to timely produce and deliver goods that meet applicable quality standards, which is impacted by a number of factors not within the control of these parties, such as political or financial instability, trade restrictions, tariffs, currency exchange rates, and transport capacity and costs, among others, and to deliver products that meet or exceed our customers’ expectations.
18
Our failure to identify new vendors and manufacturers, maintain relationships with a significant number of existing vendors and manufacturers and/or access quality merchandise in a timely and efficient manner could cause us to miss customer delivery dates or delay scheduled promotions, which could result in the failure to meet customer expectations and could cause customers to cancel orders or cause us to be unable to source merchandise in sufficient quantities, which could result in lost sales.
It is possible that one or more of our larger suppliers could experience financial difficulties, including bankruptcy, or otherwise could determine to cease doing business with us. During fiscal 2017, products purchased from one vendor accounted for approximately 15% of our consolidated net sales. The unanticipated loss of this supplier or any other large supplier could impact our sales and earnings. We have periodically experienced the loss of a major vendor and if a number of our larger vendors ceased doing business with us, this could materially and adversely impact our sales and profitability.
Our efforts to accelerate the development of proprietary brands may require working capital investments for the development and promotion of new brands and concepts. In addition, factors such as minimum purchase quantities and reduced merchandise return rights, typically associated with the purchasing of products associated with proprietary brands, can lead to excess on-hand inventory if sales of these brands do not meet our expectations due to a lack of customer receptivity or brand acceptance. Our ability to successfully offer a wider assortment of proprietary merchandise may also be adversely impacted if any of the risks mentioned above related to our manufacturers and suppliers materialize.
If we do not manage our inventory effectively, our sales, gross profit and profitability could be adversely affected
Our profitability depends on our ability to manage appropriate inventory levels and respond quickly to shifts in consumer demand patterns. We are also exposed to significant inventory risks that may adversely affect our operating results as a result of seasonality, new product launches, rapid changes in product cycles, trends and pricing, defective merchandise, spoilage, and other factors. Additionally, the acquisition of certain types of inventory may require significant lead-time and prepayment and they may not be returnable. If we do not identify and respond to emerging trends in consumer spending and preferences quickly enough, we may harm our ability to retain our existing customers or attract new customers. If we purchase too much inventory, we may be forced to sell our merchandise at lower average margins through increased markdowns, which could adversely affect our results of operations, our overall gross margins and our profitability.
A natural disaster or significant weather event could seriously impact our ability to operate, including our ability to broadcast, operate websites, process and fulfill transactions, respond to customer inquiries and generally maintain cost-efficient operations.
Our television broadcast studios, internet operations, IT systems, merchandising team, inventory control systems, executive offices and finance/accounting functions, among others, are centralized in our adjacent offices at 6740 and 6690, Shady Oak Road in Eden Prairie, Minnesota. In addition, our only fulfillment and distribution facility is centralized at a location in Bowling Green, Kentucky. Fire, flood, power loss, telecommunications failure, hurricanes, tornadoes, earthquakes, acts of war or terrorism, acts of God and similar events or disruptions may damage or interrupt our broadcast, computer, broadband or other communications systems and infrastructures, including the distribution of our network to our customers, at any time. While we have certain business continuity plans in place, no assurances can be given as to how quickly we would be able to resume operations and how long it may take to return to normal operations. We could incur substantial financial losses above and beyond what may be covered by applicable insurance policies, and may experience a loss of sales, customers, vendors and employees during the recovery period.
A natural disaster or significant weather event could materially interfere with our customers’ ability to receive our broadcast or reach us to purchase our products and services.
Our operations rely on our customers’ access to third party content distribution networks, communications providers and utilities like cable, satellite and over-the-top television services, as well as internet, telephone and power utilities. A natural disaster or significant weather event could make one or more of these third-party services unavailable to our customers and could lead to the deferral or loss of sales of our goods and services.
We could be subject to additional sales tax collection obligations and claims for uncollected amounts.
Over the past several years, a number of states have adopted legislation that require out-of-state retailers to collect and remit sales tax on transactions originating on the internet or by other remote means such as television shopping, infomercial and catalog distribution (“Remote Sellers”). These new laws seek to assert indirect physical "nexus" by the out-of-state retailer based on (i) the presence in the state of e-commerce "click-thru" affiliates who are paid by the retailer to direct e-commerce traffic to the retailer through independent websites or (ii) by the presence in the state of companies with which the out-of-state retailer shares common ownership or (iii) by generating sales above certain thresholds within the state. These laws are being challenged by internet and other retailers under federal constitutional grounds, but court challenges have to date been largely unsuccessful. We continually monitor this legislation and, depending upon our facts in the state, have either registered to collect tax (such as in New York, North Carolina, Colorado, Pennsylvania and Alabama) or have confirmed that we have no direct or indirect physical relationships with
19
the state at the time such legislation becomes effective. In January 2018, the Supreme Court of the United States agreed to hear a case (South Dakota v. Wayfair, Inc.) which could dramatically increase the ability of states to impose sales tax collection responsibilities on Remote Sellers including the Company. In addition, several new state legislatures are introducing similar legislation each year, and federal legislation, which could require nationwide collection from all of our customers, has also been introduced in the federal House and Senate. If the Supreme Court upholds South Dakota's broad nexus statute for Remote Sellers or the trend toward expanded nexus continues at the federal and state legislative level and the laws are upheld after legal challenges, we could be required to collect additional state and local sales taxes in many additional jurisdictions. Adding sales tax to our transactions could negatively impact consumer demand, create a competitive disadvantage (if all retailers are not equally impacted), and create an additional costly administrative burden of complying with the collection laws of multiple jurisdictions. While we believe we comply with current state sales tax regulations, a successful assertion by one or more states requiring us to collect taxes where we do not do so could result in substantial tax liabilities, including for past sales, as well as penalties and interest.
We significantly rely on technology and information management tools and operational applications to run our existing businesses, the failure of which could adversely impact our operations.
Our businesses are dependent, in part, on the use of sophisticated technology, some of which is provided to us by third parties. These technologies include, but are not necessarily limited to, satellite based transmission of our programming, use of the internet and other mobile commerce devices in relation to our on-line business, new digital technology used to manage and supplement our television broadcast operations, the age of our legacy operational applications to distribute product to our customers and a network of complex computer hardware and software to manage an ever increasing need for information and information management tools. The failure of any of these legacy systems or operational infrastructure elements, technologies, or our inability to have this technology supported, updated, expanded or integrated into new business processes or other technologies, could adversely impact our operations. Although we have, when possible, developed alternative sources of technology and built redundancy into our computer networks and tools, there can be no assurance that these efforts to date would protect us against all potential issues or disaster occurrences related to the loss of any such technologies or their use. Further, we may face challenges in keeping pace with rapid technological changes and adopting new products or platforms and migrating to new systems.
We rely on a limited number of independent shipping companies to deliver our merchandise. If our independent shipping companies fail to deliver our merchandise in a timely and accurate manner, our reputation and brand may be damaged. If relationships with our independent shipping companies are terminated, we may experience an increase in delivery costs.
We rely on a limited number of shipping companies to deliver inventory to us and completed orders to our customers. If we are not able to negotiate acceptable terms with these companies or they experience performance problems or other difficulties, it could negatively impact our operating results and customer experience. In addition, our ability to receive inbound inventory efficiently and ship completed orders to customers also may be negatively affected by inclement weather, fire, flood, power loss, earthquakes, labor disputes, acts of war or terrorism, acts of God, and similar factors.
The seasonality of our business places increased strain on our operations.
A disproportional amount of our sales activity normally occurs in our fourth fiscal quarter of the year, namely November through January. If we do not stock or restock popular products sufficient to meet customer demand, our business would be adversely affected. If we overstock products, we may be required to take significant inventory markdowns or write-offs, which could reduce profitability. We may experience an increase in our net shipping cost due to complimentary upgrades, split-shipments and additional long-zone shipments necessary to ensure timely delivery for the holiday season. Additionally, we may be unable to adequately staff our fulfillment and customer service centers during peak periods, and delivery services and other fulfillment companies and customer service providers may be unable to meet the seasonal demand. The occurrence of any of these factors could have an adverse effect on our business.
We may fail to adequately protect our intellectual property rights or may be accused of infringing upon the intellectual property rights of third parties.
We regard our intellectual property rights, including patents, service marks, trademarks and domain names, copyrights and trade secrets, as critical to our success. We rely heavily upon software, databases and other systemic components that are necessary to manage and support our business operations, many of which utilize or incorporate third party products, services or technologies. In addition, we license intellectual property rights in connection with the various products and services we offer to consumers. As a result, we are subject to legal proceedings and claims in the ordinary course of business, including claims of alleged infringement of the trademarks, copyrights, patents and other intellectual property rights of third parties. In addition, litigation may be necessary to enforce our intellectual property rights, protect trade secrets or to determine the validity and scope of proprietary rights claimed by others. Any litigation of this nature, regardless of outcome or merit, could result in substantial costs and diversion of management and technical resources, any of which could adversely affect our business, financial condition and results of operations. Patent litigation tends to be particularly protracted and expensive. Our failure to protect our intellectual property rights in a meaningful
20
manner or challenges to third party intellectual property we utilize or that is related to our contractual rights could result in erosion of brand names; limit our ability to control marketing on or through the internet using our various domain names; disrupt normal business operations or result in unanticipated costs, which could adversely affect our business, financial condition and results of operations.
Any acquisition we make could adversely impact the Company's performance.
From time to time we may acquire other businesses. An acquisition involves certain inherent risks, including the failure to retain key personnel from an acquired business; undisclosed or subsequently arising liabilities; failure to successfully integrate operations of the acquired business into our existing business, such as new product offerings or information technology systems; failure to generate expected synergies such as cost reductions or revenue gains; and the potential diversion of management resources from existing operations to respond to unforeseen issues arising in the context of the integration of a new business. Additionally, we may incur significant expenses in connection with acquisitions and our overall profitability could be adversely affected if our associated investments and expenses are not justified by the revenues and profits, if any.
Our business could be negatively affected as a result of the actions of activist or hostile shareholders.
Our business could be negatively affected as a result of shareholder activism, which could cause us to incur significant expense, hinder execution of our business strategy, and impact the trading value of our securities. Shareholder activism, which could take many forms or arise in a variety of situations, has been increasing in publicly traded companies in recent years and we are subject to the risks associated with such activism. In 2014, our company was the subject of a proxy contest. Shareholder activism, including potential proxy contests, requires significant time and attention by management and the board of directors, potentially interfering with our ability to execute our strategic plan. Additionally, such shareholder activism could give rise to perceived uncertainties as to our future direction, adversely affect our relationships with key executives and business partners, and make it more difficult to attract and retain qualified personnel. Also, we may be required to incur significant legal fees and other expenses related to activist shareholder matters. Any of these impacts could materially and adversely affect our business and operating results. Further, the market price of our common stock could be subject to significant fluctuation or otherwise be adversely affected by the events, risks and uncertainties described in this “Risk Factors” section.
It may be difficult for a third party to acquire us, even if doing so may be beneficial to our shareholders.
During the second quarter of fiscal 2015, we adopted a Shareholder Rights Plan to preserve the value of certain deferred tax benefits, including those generated by net operating losses, as described further under Part II, Item 5 below. The Shareholder Rights Plan may have anti-takeover effects. The provisions of the Shareholder Rights Plan could have the effect of delaying, deferring, or preventing a change of control of us and could discourage bids for our common stock at a premium over the market price of our common stock.
Item 1B. Unresolved Staff Comments
None.
Item 2. Properties
We own two commercial buildings occupying approximately 209,000 square feet and the related land they occupy in Eden Prairie, Minnesota (a suburb of Minneapolis). These buildings are used for office space including executive offices, television studios, broadcast facilities, call center operations and administrative offices. We own an approximately 600,000 square foot distribution facility in Bowling Green, Kentucky, which we use primarily for the fulfillment of merchandise purchased and sold by us and for certain call center operations. Our owned real property in Eden Prairie, Minnesota and Bowling Green, Kentucky is currently pledged as collateral under our PNC Credit Facility.
During fiscal 2014, we began a significant operational expansion initiative with respect to overall warehousing capacity and new equipment and system technology upgrades at our Bowling Green, Kentucky distribution facility. During fiscal 2015, we expanded our 262,000 square foot facility to an approximately 600,000 square foot facility and moved out of our leased satellite warehouse space. The updated facilities and technology upgrade includes a new high-speed parcel shipping and item sortation system coupled with a new warehouse management system to support our increased level of shipments and a new call center facility to better serve our customers. The new sortation and warehouse management systems were phased into production through fiscal 2016.
We believe that our existing facilities are adequate to meet our current needs and that suitable additional alternative space will be available as needed to accommodate expansion of operations.
21
Item 3. Legal Proceedings
We are involved from time to time in various claims and lawsuits in the ordinary course of business, including claims related to products, product warranties, employment, intellectual property and consumer protection matters. In the opinion of management, none of the claims and suits, either individually or in the aggregate will have a material adverse effect on our operations or consolidated financial statements.
Item 4. Mine Safety Disclosures
Not Applicable.
22
PART II
Item 5. Market for Registrant's Common Equity, Related Shareholder Matters and Issuer Purchases of Equity Securities
Market Information for Common Stock
Our common stock is traded on the Nasdaq Global Market under the symbol "EVLV." The following table sets forth the range of high and low sales prices of our common stock as quoted by the Nasdaq Global Market for the periods indicated.
High | Low | |||||||
Fiscal 2017 | ||||||||
First Quarter | $ | 1.58 | $ | 1.11 | ||||
Second Quarter | 1.45 | 0.89 | ||||||
Third Quarter | 1.27 | 0.91 | ||||||
Fourth Quarter | 1.62 | 1.09 | ||||||
Fiscal 2016 | ||||||||
First Quarter | $ | 1.60 | $ | 0.41 | ||||
Second Quarter | 2.03 | 0.98 | ||||||
Third Quarter | 2.40 | 1.53 | ||||||
Fourth Quarter | 2.20 | 1.11 | ||||||
Holders
As of April 4, 2018, we had approximately 680 common shareholders of record.
Dividends
We have never declared or paid any dividends with respect to our common stock. Any future determination by us to pay cash dividends on our common stock will be at the discretion of our board of directors and will be dependent upon our results of operations, financial condition, any contractual restrictions then existing and other factors deemed relevant at the time by the board of directors. We currently expect to retain our earnings for the development and expansion of our business and do not anticipate paying cash dividends on the common stock in the foreseeable future.
We are restricted from paying dividends on our common stock by the PNC Credit Facility, as discussed in "Management's Discussion and Analysis of Financial Condition and Results of Operations - Sources of Liquidity".
Issuer Purchases of Equity Securities
On January 31, 2017, we purchased from NBCU 4,400,000 shares of our common stock, representing approximately 6.7% of shares then outstanding, for approximately $5 million or $1.12 per share pursuant to a Repurchase Letter Agreement between us and NBCU. Following our share purchase, NBCU's direct equity ownership of our shares consisted of 2,741,849 shares of common stock, or 4.5% of our outstanding common stock. As of February 3, 2018, we believe that NBCU sold its remaining shares of our common stock. The NBCU Shareholder Agreement was terminated pursuant to the Repurchase Letter Agreement.
There were no authorizations for repurchase programs or repurchases made by or on behalf of us or any affiliated purchaser for shares of any class of our equity securities in any fiscal month within the fourth quarter of fiscal 2017, except as disclosed in the table below:
23
Period | Total Number of Shares Purchased (1) | Average Price Paid per Share (1) | Total Number of Shares Purchased as Part of Publicly Announced Plans or Programs | Approximate Dollar Value of Shares That May Yet Be Purchased Under the Plans or Programs | ||||||||||
October 29, 2017 through November 25, 2017 | 1,853 | $ | 1.26 | — | $ | — | ||||||||
November 26, 2017 through December 30, 2017 | 1,253 | $ | 1.47 | — | $ | — | ||||||||
December 31, 2017 through February 3, 2018 | — | N/A | — | $ | — | |||||||||
Total | 3,106 | $ | 1.34 | — | $ | — | ||||||||
(1) The purchases in this column include 3,106 shares that were repurchased by the Company to satisfy tax withholding obligations related to vesting of restricted stock.
Sale of Unregistered Securities
During the past three fiscal years, we did not sell any equity securities that were not registered under the Securities Act, that were not previously reported in a quarterly report on Form 10-Q or in a current report on Form 8-K.
Stock Performance Graph
The graph below compares the cumulative five-year total return to our shareholders (based on appreciation or depreciation of the market price of our common stock) on an indexed basis with (i) a broad equity market index and (ii) two published industry indices. The presentation compares the common stock price in the period from February 2, 2013 to February 3, 2018 to the Nasdaq Composite Index, the S&P 500 Retailing Index and the Morningstar Specialty Retail Index. The cumulative return is calculated assuming an investment of $100 on February 2, 2013, and reinvestment of all dividends. You should not consider shareholder return over the indicated period to be indicative of future shareholder returns.
The following performance graph and related information shall not be deemed "soliciting material" or to be "filed" with the SEC, nor shall such information be incorporated by reference into any of our future filings under the Securities Act or Securities Exchange Act of 1934, as amended, except to the extent that we specifically incorporate it by reference into such filing.
COMPARISON OF 5 YEAR CUMULATIVE TOTAL RETURN
Among EVINE Live Inc., The Nasdaq Composite Index,
S&P 500 Retailing Index and the Morningstar Specialty Retail Index
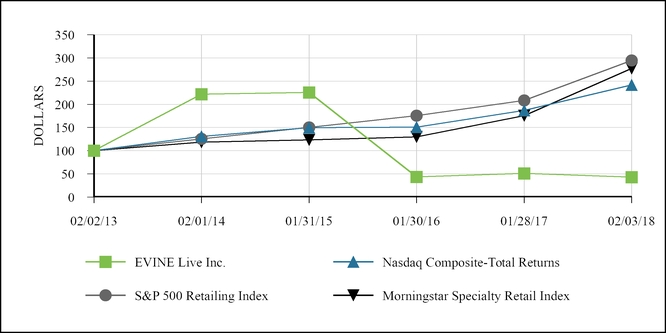
24
ASSUMES $100 INVESTED ON FEBRUARY 2, 2013
ASSUMES DIVIDENDS REINVESTED
FISCAL YEAR ENDING FEBRUARY 3, 2018
February 2, 2013 | February 1, 2014 | January 31, 2015 | January 30, 2016 | January 28, 2017 | February 3, 2018 | |||||||||||||||||||
EVINE Live Inc. | $ | 100.00 | $ | 221.94 | $ | 225.54 | $ | 43.88 | $ | 51.08 | $ | 43.17 | ||||||||||||
Nasdaq Composite - Total Returns | $ | 100.00 | $ | 130.80 | $ | 149.50 | $ | 150.55 | $ | 187.02 | $ | 241.85 | ||||||||||||
S&P 500 Retailing Index | $ | 100.00 | $ | 125.31 | $ | 150.49 | $ | 175.76 | $ | 208.37 | $ | 294.43 | ||||||||||||
Morningstar Specialty Retail Index | $ | 100.00 | $ | 118.38 | $ | 123.41 | $ | 129.68 | $ | 175.48 | $ | 277.36 | ||||||||||||
Equity Compensation Plan Information
The following table provides information as of February 3, 2018 for our compensation plans under which securities may be issued:
Plan Category | Number of Securities to be Issued Upon Exercise of Outstanding Options, Warrants and Rights | Weighted-Average Exercise Price of Outstanding Options, Warrants and Rights | Number of Securities Remaining Available for Future Issuance under Equity Compensation Plans (excluding securities reflected in 1st column) | |||||||||
Equity Compensation Plans Approved by Security Holders | 3,495,041 | $1.75 | 1,852,344 | (1) | ||||||||
Equity Compensation Plans Not Approved by Security Holders | — | N/A | — | |||||||||
Total | 3,495,041 | $1.75 | 1,852,344 | |||||||||
_______________________________________
(1) | Includes securities available for future issuance under shareholder approved compensation plans other than upon the exercise of outstanding options, warrants or rights, as follows: 1,852,344 shares under the 2011 Omnibus Stock Plan. |
Shareholder Rights Plan
During the second quarter of fiscal 2015, we adopted a Shareholder Rights Plan to preserve the value of certain deferred tax benefits, including those generated by net operating losses. On July 10, 2015, we declared a dividend distribution of one purchase right (a “Right”) for each outstanding share of our common stock to shareholders of record as of the close of business on July 23, 2015 and issuable as of that date. On July 13, 2015, we entered into a Shareholder Rights Plan (the “Rights Plan”) with Wells Fargo Bank, N.A., a national banking association, with respect to the Rights. Except in certain circumstances set forth in the Rights Plan, each Right entitles the holder to purchase from us one one-thousandth of a share of Series A Junior Participating Cumulative Preferred Stock, $0.01 par value, of the Company (“Preferred Stock” and each one one-thousandth of a share of Preferred Stock, a “Unit”) at a price of $9.00 per Unit.
The Rights initially trade together with the common stock and are not exercisable. Subject to certain exceptions specified in the Rights Plan, the Rights will separate from the common stock and become exercisable following (i) the tenth calendar day after a public announcement or filing that a person or group has become an “Acquiring Person,” which is defined as a person who has acquired, or obtained the right to acquire, beneficial ownership of 4.99% or more of the common stock then outstanding, subject to certain exceptions, or (ii) the tenth calendar day (or such later date as may be determined by the board of directors) after any person or group commences a tender or exchange offer, the consummation of which would result in a person or group becoming an Acquiring Person. If a person or group becomes an Acquiring Person, each Right will entitle its holders (other than such Acquiring Person) to purchase one Unit at a price of $9.00 per Unit. A Unit is intended to give the shareholder approximately the same dividend, voting and liquidation rights as would one share of common stock, and should approximate the value of one share of common stock. At any time after a person becomes an Acquiring Person, the board of directors may exchange all or part of the outstanding Rights (other than those held by an Acquiring Person) for shares of common stock at an exchange rate of one share of common stock (and, in certain circumstances, a Unit) for each Right. We will promptly give public notice of any exchange (although failure to give notice will not affect the validity of the exchange).
25
The Rights will expire upon certain events described in the Rights Plan, including the close of business on the date of the third annual meeting of shareholders following the last annual meeting of our shareholders at which the Rights Plan was most recently approved by shareholders, unless the Rights Plan is re-approved by shareholders at that third annual meeting of shareholders. However, in no event will the Rights Plan expire later than the close of business on July 13, 2025. The Plan was approved by our shareholders at the 2016 annual meeting of shareholders.
Until the close of business on the tenth calendar day after the day a public announcement or a filing is made indicating that a person or group has become an Acquiring Person, we may in our sole and absolute discretion amend the Rights or the Rights Plan agreement without the approval of any holders of the Rights or shares of common stock in any manner, including without limitation, amendments that increase or decrease the purchase price or redemption price or accelerate or extend the final expiration date or the period in which the Rights may be redeemed. We may also amend the Rights Plan after the close of business on the tenth calendar day after the day such public announcement or filing is made to cure ambiguities, to correct defective or inconsistent provisions, to shorten or lengthen time periods under the Rights Plan or in any other manner that does not adversely affect the interests of holders of the Rights. No amendment of the Rights Plan may extend its expiration date.
The foregoing summary of the Rights Plan does not purport to be complete and is qualified in its entirety by reference to the full text of the Rights Plan agreement, which has been filed as an exhibit to this Annual Report on Form 10-K and is incorporated herein by reference.
Item 6. Selected Financial Data
The selected financial data for the five years ended February 3, 2018 have been derived from our audited consolidated financial statements. The selected financial data presented below should be read in conjunction with the financial statements and notes thereto and other financial and statistical information referenced elsewhere herein including the information referenced under the caption "Management’s Discussion and Analysis of Financial Condition and Results of Operations."
Year Ended | ||||||||||||||||||||
February 3, 2018(a) | January 28, 2017(b) | January 30, 2016(c) | January 31, 2015(d) | February 1, 2014(e) | ||||||||||||||||
(In thousands, except per share data) | ||||||||||||||||||||
Statement of Operations Data: | ||||||||||||||||||||
Net sales | $ | 648,220 | $ | 666,213 | $ | 693,312 | $ | 674,618 | $ | 640,489 | ||||||||||
Gross profit | 235,112 | 241,527 | 238,480 | 245,048 | 230,024 | |||||||||||||||
Operating income (loss) | 3,222 | (2,018 | ) | (8,738 | ) | 1,003 | 77 | |||||||||||||
Net income (loss) | 143 | (8,745 | ) | (12,284 | ) | (1,378 | ) | (2,515 | ) | |||||||||||
Per Share Data: | ||||||||||||||||||||
Net income (loss) per common share | $ | 0.00 | $ | (0.15 | ) | $ | (0.22 | ) | $ | (0.03 | ) | $ | (0.05 | ) | ||||||
Net income (loss) per common share — assuming dilution | $ | 0.00 | $ | (0.15 | ) | $ | (0.22 | ) | $ | (0.03 | ) | $ | (0.05 | ) | ||||||
Weighted average shares outstanding: | ||||||||||||||||||||
Basic | 63,870 | 59,785 | 57,004 | 53,459 | 49,505 | |||||||||||||||
Diluted | 63,968 | 59,785 | 57,004 | 53,459 | 49,505 | |||||||||||||||
February 3, 2018 | January 28, 2017 | January 30, 2016 | January 31, 2015 | February 1, 2014 | ||||||||||||||||
(In thousands) | ||||||||||||||||||||
Balance Sheet Data: | ||||||||||||||||||||
Cash | $ | 23,940 | $ | 32,647 | $ | 11,897 | $ | 19,828 | $ | 29,177 | ||||||||||
Restricted cash and investments | 450 | 450 | 450 | 2,100 | 2,100 | |||||||||||||||
Current assets | 195,104 | 207,861 | 199,049 | 200,943 | 195,857 | |||||||||||||||
Property, equipment and other assets (f) | 54,154 | 66,919 | 66,448 | 56,748 | 37,848 | |||||||||||||||
Total assets | 249,258 | 274,780 | 265,497 | 257,691 | 233,705 | |||||||||||||||
Current liabilities | 93,621 | 106,981 | 115,349 | 119,961 | 115,916 | |||||||||||||||
Long term credit facilities | 71,573 | 82,146 | 70,271 | 50,971 | 38,000 | |||||||||||||||
Other long term obligations (g) | 68 | 3,950 | 2,898 | 2,231 | 1,581 | |||||||||||||||
Shareholders’ equity | 83,996 | 81,703 | 76,979 | 84,528 | 78,208 | |||||||||||||||
26
Year Ended | ||||||||||||||||||||
February 3, 2018 | January 28, 2017 | January 30, 2016 | January 31, 2015 | February 1, 2014 | ||||||||||||||||
(In thousands, except statistical data) | ||||||||||||||||||||
Other Data: | ||||||||||||||||||||
Gross profit | 36.3 | % | 36.3 | % | 34.4 | % | 36.3 | % | 35.9 | % | ||||||||||
Working capital | $ | 101,483 | $ | 100,880 | $ | 83,700 | $ | 80,982 | $ | 79,941 | ||||||||||
Current ratio | 2.1 | 1.9 | 1.7 | 1.7 | 1.7 | |||||||||||||||
Adjusted EBITDA (as defined below)(h) | $ | 18,011 | $ | 16,225 | $ | 9,206 | $ | 22,773 | $ | 18,012 | ||||||||||
Cash Flows: | ||||||||||||||||||||
Operating | $ | 3,278 | $ | 7,284 | $ | (9,411 | ) | $ | (1,315 | ) | $ | 13,953 | ||||||||
Investing | $ | 2,239 | $ | (10,769 | ) | $ | (20,364 | ) | $ | (25,178 | ) | $ | (11,077 | ) | ||||||
Financing | $ | (14,224 | ) | $ | 24,235 | $ | 21,844 | $ | 17,144 | $ | (176 | ) | ||||||||
________________
(a) | Results of operations for fiscal 2017 includes executive and management transition costs of $2.1 million, loss on debt extinguishment of $1.5 million and a pre-income tax gain of $551,000 for the sale of the Company's television broadcast station. Also, as a result of the Company's retail accounting calendar, fiscal 2017 includes 53 weeks of operations as compared to 52 weeks for the other periods presented. See Note 2 - "Summary of Significant Accounting Policies" in the notes to our consolidated financial statements. |
(b) | Results of operations for fiscal 2016 includes executive and management transition costs of approximately $4.4 million and distribution facility consolidation and technology upgrade costs of $677,000. |
(c) | Results of operations for fiscal 2015 includes executive and management transition costs of approximately $3.5 million, distribution facility consolidation and technology upgrade costs of $1.3 million and Shareholder Rights Plan costs of $446,000. |
(d) | Results of operations for fiscal 2014 includes activist shareholder response charges of approximately $3.5 million and executive transition costs of $5.5 million. |
(e) | Results of operations for fiscal 2013 includes activist shareholder response charges of approximately $2.1 million. |
(f) | Property, equipment and other assets includes the following consolidated balance sheet line items: property & equipment, net; and other assets. |
(g) | Other long term obligations includes the following consolidated balance sheet line items: deferred tax liability, capital lease liability, long term portion of deferred revenue and other long term liabilities. |
(h) | EBITDA as defined represents net income (loss) for the respective periods excluding depreciation and amortization expense, interest income (expense) and income taxes. We define Adjusted EBITDA as EBITDA excluding non-operating gains (losses); executive and management transition costs; loss on debt extinguishment; gain on sale of television station; distribution facility consolidation and technology upgrade costs; activist shareholder response costs; Shareholder Rights Plan costs; and non-cash share-based compensation expense. Management has included the term Adjusted EBITDA in its EBITDA reconciliation in order to adequately assess the operating performance of our television and digital businesses and in order to maintain comparability to our analyst’s coverage and financial guidance, when given. Management believes that Adjusted EBITDA allows investors to make a meaningful comparison between our core business operating results over different periods of time with those of other similar companies. In addition, management uses Adjusted EBITDA as a metric to evaluate operating performance under its management and executive incentive compensation programs. Adjusted EBITDA should not be construed as an alternative to operating income (loss), net income (loss) or to cash flows from operating activities as determined in accordance with generally accepted accounting principles and should not be construed as a measure of liquidity. Adjusted EBITDA may not be comparable to similarly entitled measures reported by other companies. |
27
A reconciliation of the comparable GAAP measurement, net income (loss), to Adjusted EBITDA follows:
Year Ended | ||||||||||||||||||||
February 3, 2018 | January 28, 2017 | January 30, 2016 | January 31, 2015 | February 1, 2014 | ||||||||||||||||
(In thousands) | ||||||||||||||||||||
Net income (loss) | $ | 143 | $ | (8,745 | ) | $ | (12,284 | ) | $ | (1,378 | ) | $ | (2,515 | ) | ||||||
Adjustments: | ||||||||||||||||||||
Depreciation and amortization | 10,307 | 11,209 | 10,327 | 8,872 | 12,585 | |||||||||||||||
Interest income | (17 | ) | (11 | ) | (8 | ) | (10 | ) | (18 | ) | ||||||||||
Interest expense | 5,084 | 5,937 | 2,720 | 1,572 | 1,437 | |||||||||||||||
Income taxes | (3,445 | ) | 801 | 834 | 819 | 1,173 | ||||||||||||||
EBITDA (as defined) | $ | 12,072 | $ | 9,191 | $ | 1,589 | $ | 9,875 | $ | 12,662 | ||||||||||
A reconciliation of EBITDA to Adjusted EBITDA is as follows: | ||||||||||||||||||||
EBITDA (as defined) | $ | 12,072 | $ | 9,191 | $ | 1,589 | $ | 9,875 | $ | 12,662 | ||||||||||
Adjustments: | ||||||||||||||||||||
Executive and management transition costs | 2,145 | 4,411 | 3,549 | 5,520 | — | |||||||||||||||
Loss on debt extinguishment | 1,457 | — | — | — | — | |||||||||||||||
Gain on sale of television station | (551 | ) | — | — | — | — | ||||||||||||||
Distribution facility consolidation and technology upgrade costs | — | 677 | 1,347 | — | — | |||||||||||||||
Activist shareholder response costs | — | — | — | 3,518 | 2,133 | |||||||||||||||
Shareholder Rights Plan costs | — | — | 446 | — | — | |||||||||||||||
Non-cash share-based compensation expense | 2,888 | 1,946 | 2,275 | 3,860 | 3,217 | |||||||||||||||
Adjusted EBITDA | $ | 18,011 | $ | 16,225 | $ | 9,206 | $ | 22,773 | $ | 18,012 | ||||||||||
28
ITEM 7. Management's Discussion and Analysis of Financial Condition and Results of Operations
Introduction
The following discussion and analysis of financial condition and results of operations is qualified by reference to and should be read in conjunction with our audited consolidated financial statements and notes thereto included elsewhere in this annual report.
Cautionary Statement Concerning Forward-Looking Statements
This annual report on Form 10-K, including the following Management’s Discussion and Analysis of Financial Condition and Results of Operations and other materials we file with the SEC (as well as information included in oral statements or other written statements made or to be made by us) contain certain "forward-looking statements" within the meaning of the Private Securities Litigation Reform Act of 1995. Any statements contained herein that are not statements of historical fact, including statements regarding guidance, industry prospects or future results of operations or financial position made in this report are forward-looking. We often use words such as anticipates, believes, estimates, expects, intends, predicts, hopes, should, plans, will and similar expressions to identify forward-looking statements. These statements are based on management’s current expectations and accordingly are subject to uncertainty and changes in circumstances. Actual results may vary materially from the expectations contained herein due to various important factors, including (but not limited to): variability in consumer preferences, shopping behaviors, spending and debt levels; the general economic and credit environment; interest rates; seasonal variations in consumer purchasing activities; the ability to achieve the most effective product category mixes to maximize sales and margin objectives; competitive pressures on sales and sales promotions; pricing and gross sales margins; the level of cable and satellite distribution for our programming and the associated fees or estimated cost savings from contract renegotiations; our ability to establish and maintain acceptable commercial terms with third-party vendors and other third parties with whom we have contractual relationships, and to successfully manage key vendor and shipping relationships and develop key partnerships and proprietary and exclusive brands; our ability to manage our operating expenses successfully and our working capital levels; our ability to remain compliant with our credit facilities covenants; customer acceptance of our branding strategy and our repositioning as a video commerce company; our ability to respond to changes in consumer shopping patterns and preferences, and changes in technology and consumer viewing patterns; changes to our management and information systems infrastructure; challenges to our data and information security; changes in governmental or regulatory requirements, including without limitation, regulations of the Federal Communications Commission and Federal Trade Commission, and adverse outcomes from regulatory proceedings; litigation or governmental proceedings affecting our operations; significant events (including disasters, weather events or events attracting significant television-coverage) that either cause an interruption of television coverage or that divert viewership from our programming; disruptions in our distribution of our network broadcast to our customers; our ability to protect our intellectual property rights; our ability to obtain and retain key executives and employees; our ability to attract new customers and retain existing customers; changes in shipping costs; expenses relating to the actions of activist or hostile shareholders; our ability to offer new or innovative products and customer acceptance of the same; changes in customer viewing habits of television programming; and the risks identified under Item 1A (Risk Factors) in this annual report on Form 10-K. You are cautioned not to place undue reliance on forward-looking statements, which speak only as of the date of this filing. We are under no obligation (and expressly disclaim any such obligation) to update or alter our forward-looking statements whether as a result of new information, future events or otherwise.
Overview
Our Company
We are a multiplatform interactive digital commerce company that offers a mix of proprietary, exclusive and name-brands directly to consumers in an engaging and informative shopping experience through TV, online and mobile devices. We operate a 24-hour television shopping network, Evine, which is distributed primarily on cable and satellite systems, through which we offer proprietary, exclusive and name-brand merchandise in the categories of jewelry & watches; home & consumer electronics; beauty; and fashion & accessories. We also operate evine.com, a comprehensive digital commerce platform that sells products which appear on our television shopping network as well as an extended assortment of online-only merchandise. Our programming and products are also marketed via mobile devices, including smartphones and tablets, and through the leading social media channels.
29
Products and Customers
Products sold on our digital commerce platforms include jewelry & watches, home & consumer electronics, beauty and fashion & accessories. Historically jewelry & watches has been our largest merchandise category. While changes in our product mix have occurred as a result of customer demand and other factors including our efforts to diversify our offerings within our major merchandise categories, jewelry & watches remained our largest merchandise category in fiscal 2017. We are focused on diversifying our merchandise assortment within our existing product categories as well as by offering potential new product categories, including proprietary, exclusive and name-brands, in an effort to increase revenues, gross profits and to grow our new and active customer base. The following table shows our merchandise mix as a percentage of total digital commerce net merchandise sales for the years indicated by product category group.
For the Years Ended | ||||||
February 3, 2018 | January 28, 2017 | January 30, 2016 | ||||
Net Merchandise Sales by Category | ||||||
Jewelry & Watches | 39% | 41% | 39% | |||
Home & Consumer Electronics | 27% | 25% | 31% | |||
Beauty | 16% | 16% | 14% | |||
Fashion & Accessories | 18% | 18% | 16% | |||
Our product strategy is to continue to develop and expand new product offerings across multiple merchandise categories based on customer demand, as well as to offer competitive pricing and special values in order to drive new customers and maximize margin dollars per minute. Our core digital commerce customers — those who interact with our network and transact through television, online and mobile devices — are primarily women between the ages of 45 and 70. We also have a strong presence of male customers of similar age. We believe our customers make purchases based on our unique products, quality merchandise and value.
Company Strategy
As a multiplatform interactive digital commerce company, our strategy includes offering an exciting assortment of proprietary, exclusive (i.e., products that are not readily available elsewhere) and name-brand products using our video commerce infrastructure, which includes television access to more than 87 million homes in the United States, primarily on cable and satellite systems. We are also focused on growing our high lifetime value customer file and growing our revenues, through social, mobile, online, and over-the-top platforms.
Our merchandising plan is focused on delivering a balanced assortment of profitable proprietary, exclusive and name-brand products presented in an engaging, entertaining, shopping-centric format. To enhance the shopping experience for our customers, we will continue to work hard to engage our customers intelligently by leveraging the use of predictive analytics and interactive marketing to drive personalization and relevancy to each experience. In addition, we will continue to find new methods, territories, technologies and channels to distribute our video commerce programming beyond the television screen, including "live on location" entertainment and enhancing our social advertising. We believe these initiatives will position us as a multiplatform interactive digital commerce company that delivers a more engaging and enjoyable customer experience with sales and service that exceed customer expectations.
Our Competition
The digital commerce retail business is highly competitive and we are in direct competition with numerous retailers, including online retailers, many of whom are larger, better financed and have a broader customer base than we do. In our television shopping and digital commerce operations, we compete for customers with other television shopping and e-commerce retailers, infomercial companies, other types of consumer retail businesses, including traditional "brick and mortar" department stores, discount stores, warehouse stores and specialty stores; catalog and mail order retailers and other direct sellers.
Our direct competitors within the television shopping industry include QVC, Inc. and HSN, Inc. QVC, Inc. is owned by Liberty Interactive Corporation (to be renamed Qurate Retail Group, Inc.), which recently completed the purchase of the remaining 62% of HSN, Inc. to increase its holdings in HSN, Inc. to 100%. Both QVC, Inc. and HSN, Inc. are substantially larger than we are in terms of annual revenues and customers, and the programming of each is carried more broadly to U.S. households, including high definition bands and multi-channel carriage, than our programming. Multimedia Commerce Group, Inc., which operates Jewelry Television, also competes with us for customers in the jewelry category. In addition, there are a number of smaller niche retailers and startups in the television shopping arena who compete with us. We believe that our major competitors incur cable and satellite distribution fees representing a significantly lower percentage of their sales attributable to their television programming than we do, and that their fee arrangements are substantially on a commission basis (in some cases with minimum guarantees)
30
rather than on the predominantly fixed-cost basis that we currently have. At our current sales level, our distribution costs as a percentage of total consolidated net sales are higher than those of our competition. However, we have the ability to leverage this fixed expense with sales growth to accelerate improvement in our profitability.
We anticipate continued competition for viewers and customers, for experienced television shopping and e-commerce personnel, for distribution agreements with cable and satellite systems and for vendors and suppliers - not only from television shopping companies, but also from other companies that seek to enter the television shopping and online retail industries, including telecommunications and cable companies, television networks, and other established retailers. We believe that our ability to be successful in the video commerce industry will be dependent on a number of key factors, including continuing to expand our digital footprint to meet our customers' needs, increasing the lifetime value of our customer base by a combination of growing the number of customers who purchase products from us and maximizing the dollar value of sales profitability per customer.
Results for Fiscal 2017, 2016 and 2015
Consolidated net sales during the 53-week fiscal 2017 were $648.2 million compared to $666.2 million during the 52-week fiscal 2016, a 3% decrease. Consolidated net sales in fiscal 2016 were $666.2 million compared to $693.3 million in the 52-week fiscal 2015, a 4% decrease. We reported operating income of $3.2 million and net income of $143,000 for fiscal 2017. The operating and net income for fiscal 2017 include executive and management transition costs of $2.1 million and a gain of $551,000 related to the sale of our Boston television station. The net income for fiscal 2017 also included a loss on debt extinguishment of $1.5 million and an income tax benefit of $3.4 million, which primarily resulted from the reversal of our long-term deferred tax liability in connection with our television station sale. We reported an operating loss of $2.0 million and a net loss of $8.7 million for fiscal 2016. Results of operations for fiscal 2016 include executive and management transition costs of $4.4 million and distribution facility consolidation and technology upgrade costs of $677,000. We reported an operating loss of $8.7 million and a net loss of $12.3 million for fiscal 2015. Results of operations for fiscal 2015 include executive and management transition costs of $3.5 million and distribution facility consolidation and technology upgrade costs of $1.3 million.
Sale of Boston Television Station, WWDP
On August 28, 2017, we entered into a channel sharing and facilities agreement (the “Channel Sharing Agreement”) with NRJ Boston OpCo, LLC and NRJ TV Boston License Co., LLC (collectively, “NRJ”) to allow NRJ to operate its local Boston television station on one-third of the spectrum used in the operation of our television broadcast station, WWDP(TV), Norwell, Massachusetts (the “Station”), in perpetuity. The total consideration payable to us under the Channel Sharing Agreement was $3,500,000, of which $2,500,000 was received in October 2017 upon the grant of a required construction permit by the FCC and $1.0 million was received in December 2017 upon the closing of the sale of substantially all of the remaining television station assets.
On August 28, 2017, we also entered into an asset purchase agreement to sell substantially all of the assets primarily related to the Station to affiliates of WRNN-TV Associates Limited Partnership (“Buyers”). The purchase price for the Station's assets was $10,000,000 in cash, subject to an escrow holdback amount of $1,000,000, which is payable to us when the Station is being carried by certain designated carriers at or following the closing of the transaction. The escrow holdback is payable back to the Buyers in monthly installments beginning approximately 14 months after the closing if the station is not being carried by certain designated carriers. The asset purchase agreement includes customary representations, warranties, covenants and indemnification obligations of the parties. The sale of assets pursuant to the purchase agreement closed during the fourth quarter of fiscal 2017 and $9,333,000 of the purchase price was received, which included $333,000 of the escrow holdback amount. We used the proceeds received from the transaction to pay off the remaining amounts due under our term loan with GACP Finance Co., LLC ("GACP"), with the remaining proceeds used for general working capital purposes.
We recorded a pre-tax operating gain on the television station sale of $551,000 during the fourth quarter of fiscal 2017 upon the closing of the transaction. As of February 3, 2018, $667,000 of the sales price remained in escrow pending the Station being carried by certain designated carriers. We have not recorded any additional gain relating to the remaining escrow amount and will not record the remaining gain until the contingency is resolved.
Prepayment on GACP Term Loan
During fiscal 2017, we fully retired our term loan with GACP Finance Co., LLC ("GACP"), with voluntary principal prepayments of $9.5 million, $2.5 million and $3.5 million on March 21, 2017, October 18, 2017 and December 6, 2017. The principal payments were funded through cash on hand, an increase in our term loan under the PNC Credit Agreement, proceeds from the Channel Sharing Agreement and the sale of our Boston television station, WWDP, as discussed in Note 4 - "Intangible Assets" in the notes to our consolidated financial statements. We recorded losses on each partial and final extinguishment of $913,000, $221,000 and $323,000 for the payments made on March 21, 2017, October 18, 2017 and December 6, 2017.
31
Registered Direct Offering
On May 30, 2017, we sold 4,008,273 shares of common stock in a registered direct offering to certain accredited investors. The shares were sold at a price of $1.12 per share, except for shares purchased by our directors or executive officers, which were sold at a price of $1.15 per share. We received gross proceeds of approximately $4.5 million and incurred approximately $323,000 of issuance costs. We have used the proceeds for general working capital purposes.
Executive & Management Transition Costs
On March 23, 2017, we announced the elimination of the position of Senior Vice President of Sales & Product Planning. In conjunction with this executive change as well as other executive and management terminations made during fiscal 2017, we recorded charges to income of $2.1 million, which relate primarily to severance payments to be made as a result of the executive officer and other management terminations and other direct costs associated with the Company's 2017 executive and management transition.
On February 8, 2016, we announced the resignation and departure of Mark Bozek, our Chief Executive Officer, and of our Executive Vice President - Chief Strategy Officer and Interim General Counsel. On August 18, 2016, we announced that Robert Rosenblatt, was appointed permanent Chief Executive Officer, effective immediately, and entered into an executive employment agreement with Mr. Rosenblatt. In conjunction with these executive changes as well as other executive and management terminations made during fiscal 2016, we recorded charges to income of $4.4 million, which relate primarily to severance payments to be made as a result of the executive officer terminations and other direct costs associated with our 2016 executive and management transition.
On March 26, 2015, we announced the termination and departure of three executive officers, namely our Chief Financial Officer, our Senior Vice President and General Counsel, and President. In addition, during the first quarter of fiscal 2015, we also announced the hiring of a new Chief Financial Officer and a new Chief Merchandising Officer. In conjunction with these executive changes as well as other management terminations made during fiscal 2015, we recorded charges to income of $3.5 million, which relate primarily to severance payments made as a result of the executive officer terminations and other direct costs associated with our 2015 executive and management transition.
Results of Operations
The following table sets forth, for the periods indicated, certain statement of operations data expressed as a percentage of net sales.
Year Ended (a) | |||||||||
February 3, 2018 | January 28, 2017 | January 30, 2016 | |||||||
Net sales | 100.0 | % | 100.0 | % | 100.0 | % | |||
Gross margin | 36.3 | % | 36.3 | % | 34.4 | % | |||
Operating expenses: | |||||||||
Distribution and selling | 30.8 | % | 31.1 | % | 30.3 | % | |||
General and administrative | 3.8 | % | 3.5 | % | 3.5 | % | |||
Depreciation and amortization | 1.0 | % | 1.2 | % | 1.2 | % | |||
Executive and management transition costs | 0.3 | % | 0.7 | % | 0.5 | % | |||
Distribution facility consolidation and technology upgrade costs | — | % | 0.1 | % | 0.2 | % | |||
Gain on sale of television station | (0.1 | )% | — | % | — | % | |||
Total operating expenses | 35.8 | % | 36.6 | % | 35.7 | % | |||
Operating income (loss) | 0.5 | % | (0.3 | )% | (1.3 | )% | |||
Interest expense, net | (0.8 | )% | (0.9 | )% | (0.4 | )% | |||
Loss on debt extinguishment | (0.2 | )% | — | % | — | % | |||
Loss before income taxes | (0.5 | )% | (1.2 | )% | (1.7 | )% | |||
Income tax benefit (provision) | 0.5 | % | (0.1 | )% | (0.1 | )% | |||
Net income (loss) | 0.0 | % | (1.3 | )% | (1.8 | )% | |||
32
Key Operating Metrics
Year Ended (a) | ||||||||||
February 3, 2018 | Change | January 28, 2017 | Change | January 30, 2016 | ||||||
Merchandise Metrics | ||||||||||
Gross margin % | 36.3% | — | 36.3% | 190 bps | 34.4% | |||||
Net shipped units (000's) | 10,397 | 1% | 10,263 | 4% | 9,853 | |||||
Average selling price | $56 | (2)% | $57 | (11)% | $64 | |||||
Return rate | 19.0% | (40) bps | 19.4% | (40) bps | 19.8% | |||||
Digital net sales % (b) | 51.9% | 240 bps | 49.5% | 260 bps | 46.9% | |||||
Total Customers - 12 Month Rolling (000's) | 1,295 | (9)% | 1,429 | (0)% | 1,436 | |||||
(a) The Company’s most recently completed fiscal year, fiscal 2017, ended on February 3, 2018, and consisted of 53 weeks. Fiscal 2016 ended on January 28, 2017 and consisted of 52 weeks. Fiscal 2015 ended on January 30, 2016 and consisted of 52 weeks.
(b) Digital net sales percentage is calculated based on net sales that are generated from our evine.com website and mobile platforms, which are primarily ordered directly online.
Impact of 53rd Week in Fiscal 2017
Because we follow a 4-5-4 retail calendar, every five or six years we have an extra week of operations within our fiscal year, and this occurred in fiscal 2017. Therefore, operations for our fourth quarter and full year fiscal 2017 have 14 and 53 weeks, as compared to operations for fourth quarter and full year fiscal 2016 which have 13 and 52 weeks. To facilitate a comparison with fiscal 2016 results, we calculated the fiscal 2017 fourth quarter results on a 13-week basis by excluding discrete items and then dividing actual Q4 2017 results by 14 and multiplying the quotients by 13. Fiscal 2017 results on a 52-week basis were calculated by adding our fourth quarter 13-week basis calculation to previously reported fiscal year-to-date third quarter results of operations. Using this calculation, fiscal 2017 net sales decreased 4.8% from fiscal 2016. Fiscal 2017 net income per common share, basic and diluted, were not impacted as a result of the calculation.
Program Distribution
Our 24-hour television shopping networks, Evine and Evine Too, which are distributed primarily on cable and satellite systems, reached more than 87 million homes during fiscal 2017, fiscal 2016 and fiscal 2015. Our television home shopping programming is also simulcast 24 hours a day, 7 days a week on our online website, evine.com, broadcast over-the-air in certain markets and is also available on all mobile channels and on various video streaming applications, such as Roku and Apple TV. This multiplatform distribution approach, complemented by our strong mobile and online efforts, will ensure that Evine is available wherever and whenever our customers choose to shop.
In addition to our total homes reached, we continue to increase the number of channels on existing distribution platforms, alternative distribution methods and part-time carriage in strategic markets, including securing a deal in the second quarter of fiscal 2017 to launch our network in more than 10 million high definition ("HD") television homes during the second half of 2017. We believe that our distribution strategy of pursuing additional channels in productive homes already receiving our programming is a more balanced approach to growing our business than merely adding new television homes in untested areas. We also invested in HD equipment and, starting in the third quarter of fiscal 2017, transitioned to a full HD signal. We believe that having an HD feed of our service allows us to attract new viewers and customers.
Cable and Satellite Distribution Agreements
We have entered into distribution agreements with cable operators, direct-to-home satellite providers and telecommunications companies to distribute our television programming over their systems. The terms of the distribution agreements typically range from one to five years. During the fiscal year, certain agreements with cable, satellite or other distributors may expire. Under certain circumstances, the cable operators or we may cancel the agreements prior to their expiration. Additionally, we may elect not to renew distribution agreements whose terms result in sub-standard or negative contribution margins. If the operator drops our service or if either we or the operator fails to reach mutually agreeable business terms concerning the distribution of our service so that the agreements are terminated, our business may be materially adversely affected. Failure to maintain our distribution agreements covering a material portion of our existing households on acceptable financial and other terms could materially and adversely affect our future growth, sales revenues and earnings unless we are able to arrange for alternative means of broadly distributing our television programming.
33
Net Shipped Units
The number of net shipped units (shipped units less returned units) during fiscal 2017 increased 1% from fiscal 2016 to 10.4 million from 10.3 million. The number of net shipped units during fiscal 2016 increased 4% from fiscal 2015 to 10.3 million from 9.9 million. We believe the increase in net units shipped during fiscal 2017 was driven primarily from a decline in our average selling price (as discussed below) and the effect of the sales attributable to the 53rd week of fiscal 2017.
Average Selling Price
The average selling price, or ASP, per net unit was $56 in fiscal 2017, a 2% decrease from fiscal 2016. The decrease in the ASP during fiscal 2017 was primarily driven by a sales mix shift out of our jewelry & watches product category, which typically have a higher average selling price. The decrease was partially offset by an ASP increase in our jewelry and home & consumer electronics product categories. These ASP decreases contributed to our increase in net shipped units of 1%. For fiscal 2016, the ASP was $57, an 11% decrease from fiscal 2015. The decrease in ASP during fiscal 2016 was primarily driven by a sales mix shift into fashion & accessories and beauty product categories, which typically have lower average selling prices, and out of our home & consumer electronics product category as well as broad based ASP decreases within most product categories. These ASP decreases contributed to our increase in net shipped units of 4% during fiscal 2016.
Return Rates
Our return rate was 19.0% in fiscal 2017 as compared to 19.4% in fiscal 2016, a 40 basis point ("bps") decrease. The decrease in the return rate was driven primarily by rate improvements in our watches and beauty product categories. We believe that the decreases in the category return rates were driven by improvements in our product assortment. We continue to monitor our return rates in an effort to keep our overall return rates commensurate with our current product mix and our average selling price levels. Our return rate was 19.4% in fiscal 2016 compared to 19.8% in fiscal 2015, a 40 bps decrease. The decrease in the fiscal 2016 return rate was primarily driven by rate improvements in our fashion & accessories, beauty and home & consumer electronics categories. We believe that the decreases in the category return rates were driven by the decreases in ASP as described above, improved quality of merchandise and improvements in the execution of our returns policy, partially offset by an increase in our jewelry sales mix, which typically has a higher return rate.
Total Customers
Total customers purchasing over the last twelve months, as of February 3, 2018, decreased 9% over prior year to 1,295,000. The decrease was driven by a reduction in new customers over the prior year, partially offset by improvements achieved in our customer retention. As a result of our efforts during fiscal 2016 and 2017 to re-balance our merchandising mix, including the reduction of our offering of consumer electronic products, we believe our twelve-month customer file is now comprised of customers who have a significantly higher purchase frequency and lifetime value. Total customers purchasing over the last twelve months, as of January 28, 2017, was relatively flat over the prior year at 1,429,000. Our customer file experienced growth in our wearables categories compared to customers within our consumer electronics customer file, which decreased in fiscal 2016.
Net Sales
Consolidated net sales, inclusive of shipping and handling revenue, for fiscal 2017 were $648.2 million, a 2.7% decrease over consolidated net sales of $666.2 million for fiscal 2016. As noted above, fiscal 2017 had 53 weeks compared to 52 weeks for fiscal 2016, and consolidated net sales for fiscal 2017 on a calculated 52-week basis decreased 4.8% over consolidated net sales for fiscal 2016. The decrease in consolidated net sales was driven primarily by decreases in our jewelry & watches product category and a decrease in shipping and handling revenue, partially offset by an increase in our home & consumer electronics product category. The decrease in watches was a result of a shift in airtime from our watches category into the fashion & accessories and home categories and testing of some lower watch price point offerings designed to grow our customers with a high lifetime value. The increase in the home product category was a result of a shift in airtime described above and an increase in consumer electronics sales productivity per minute. Our digital sales penetration, or, the percentage of net sales that are generated from our evine.com website and mobile platforms, which are primarily ordered directly online, was 51.9% in fiscal 2017 as compared to 49.5% in fiscal 2016. Overall, we continue to deliver strong digital sales penetration. We believe the increase in penetration during the period was driven by our improved digital marketing initiatives and an enhanced responsive customer experience on mobile devices. Our mobile penetration increased to 49.9% of total online sales during fiscal 2017 versus 45.4% of total online sales during fiscal 2016.
Consolidated net sales, inclusive of shipping and handling revenue, for fiscal 2016 were $666.2 million, a 4% decrease over consolidated net sales of $693.3 million for fiscal 2015. The decrease in consolidated net sales was driven primarily by a 53% decrease in our consumer electronics category as part of our strategy to proactively eliminate low contribution margin consumer electronics merchandise, such as the hoverboard, as we shift our airtime and product mix to higher margin product categories. These decreases were offset by growth in our wearable categories, which include jewelry & watches, beauty and fashion &
34
accessories product categories. In addition, we also experienced an increase in shipping and handling revenue as a result of more disciplined shipping promotions during the year. Our digital sales penetration, or the percentage of net sales that are generated from our evine.com website and mobile platforms, which are primarily ordered directly online, was 49.5% in fiscal 2016 as compared to 46.9% in fiscal 2015. We believe the increase in penetration during fiscal 2016 was driven by our digital marketing initiatives and strong performance of online promotions. Our mobile penetration increased to 45.4% of total online sales during fiscal 2016 versus 42.3% of total online sales during fiscal 2015.
Gross Profit
Gross profit for fiscal 2017 was $235.1 million, a decrease of 3%, compared to $241.5 million for fiscal 2016. The decrease in gross profit experienced during fiscal 2017 was primarily driven by a 3% decrease in consolidated net sales (as discussed above). Gross profit for fiscal 2016 was $241.5 million, an increase of 1%, compared to $238.5 million for fiscal 2015. The increase in the gross profit experienced during fiscal 2016 was driven by higher gross margin percentages experienced, offset by a 4% decrease in consolidated net sales. Gross margin percentages for fiscal 2017, fiscal 2016 and fiscal 2015 were 36.3%, 36.3% and 34.4%, representing a 0 bps change from fiscal 2016 to fiscal 2017, and a 190 bps increase from fiscal 2015 to fiscal 2016. The consistency in the gross margin percentage experienced in fiscal 2017 reflects the following: a 20 basis point basis point margin increase attributable to increased gross profit rates across all product categories, offset by a 15 basis point decrease attributable to increased fulfillment depreciation as a result of upgrades made to our Bowling Green facility and a 5 basis point decrease due to lower shipping and handling margins. The increase in the gross margin percentage experienced in fiscal 2016, compared to fiscal 2015, reflects the following: a 150 basis point increase due to a shift in product mix from consumer electronics to beauty and fashion & accessories, which typically have higher margins; a 70 basis point increase due to higher shipping and handling margins achieved as a result of more disciplined shipping promotions, partially offset by a 20 basis point decrease attributable to increased fulfillment depreciation as a result of upgrades made to our Bowling Green facility.
Operating Expenses
Total operating expenses were $231.9 million, $243.5 million and $247.2 million for fiscal 2017, fiscal 2016 and fiscal 2015, representing a decrease of $11.7 million or 5% from fiscal 2016 to fiscal 2017, and a decrease of $3.7 million, or 1% from fiscal 2015 to fiscal 2016. Total operating expenses as a percentage of net sales were 35.8%, 36.6% and 35.7% for fiscal 2017, fiscal 2016 and fiscal 2015. Total operating expense for fiscal 2017 includes executive and management transition costs of $2.1 million and a gain of $551,000 from the sale of our Boston television station. Total operating expenses for fiscal 2016 includes executive and management transition costs of $4.4 million and distribution facility consolidation and technology upgrade costs of $677,000. Total operating expenses for fiscal 2015 includes executive and management transition costs of $3.5 million and distribution facility consolidation and technology upgrade costs of $1.3 million. Excluding executive and management transition costs, the gain on sale of television station, and distribution facility consolidation and technology upgrade costs, total operating expenses as a percentage of net sales were 35.6%, 35.8% and 35.0% for fiscal 2017, fiscal 2016 and fiscal 2015.
Distribution and selling expense for fiscal 2017 decreased $7.5 million, or 4%, to $199.5 million or 30.8% of net sales compared to $207.0 million or 31.1% of net sales in fiscal 2016. Distribution and selling expense decreased during fiscal 2017 due to decreased program distribution expense of $6.7 million relating to contract negotiations and channel positioning, partially offset by an increase in HD distribution, over-the-air and other forms of distribution. The decrease over the comparable period was also due to decreased variable expenses of $5.3 million and decreased software service fees of $472,000, partially offset by increased salaries and wages of $4.0 million and increased online selling and search fees of $767,000. The decrease in variable costs was primarily driven by decreased variable credit card processing fees and bad debt credit expense of $2.8 million, decreased variable fulfillment and customer service salaries and wages of $2.4 million and decreased Bowling Green rent expense of $416,000, partially offset by increased customer services telecommunications expense of $290,000. Total variable expenses during fiscal 2017 were approximately 9.3% of total net sales versus 9.9% of total net sales for the prior year comparable period. The decrease in variable expenses as a percentage of net sales was primarily due to improved efficiencies at our fulfillment center.
Distribution and selling expense for fiscal 2016 decreased $2.3 million, or 1%, to $207.0 million, or 31.1% of net sales compared to $209.3 million or 30.3% of net sales in fiscal 2015. Distribution and selling expense decreased during fiscal 2016 due to decreased program distribution expense of $2.6 million relating to contract negotiations and channel positioning, partially offset by the launch of Evine Too and broadened HD carriage. The decrease over the comparable period was also due to a decreased salaries and wages of $1.2 million, decreased rebranding expense of $260,000, decreased production expenses of $256,000 and decreased accrued incentive compensation of $169,000, offset by an increase in variable expense of $1.9 million and increased online selling and search fees of $444,000. The increase in variable costs was primarily driven by increased variable fulfillment and customer service salaries and wages of $2.7 million and increased variable credit card processing fees and credit expenses of $567,000, partially offset by decreased customer services telecommunications service expense of $1.1 million and decreased Bowling Green rent expense of $221,000. Total variable expenses in fiscal 2016 were approximately 9.9% of total net sales versus approximately 9.2% of total net sales in fiscal 2015. The increase in variable expense as a percentage of net sales was primarily
35
due to a 4% increase in net shipped units compared with a 4% decrease in consolidated net sales and the 11% decline in our average selling price during fiscal 2016.
To the extent that our average selling price continues to decline, our variable expense as a percentage of net sales could increase as the number of our shipped units increase. Program distribution expense is primarily a fixed cost per household, however, this expense may be impacted by changes in the number of average homes or channels reached or by rate changes associated with changes in our channel position with carriers.
General and administrative expense for fiscal 2017 increased $1.1 million, or 5%, to $24.4 million, or 3.8% of net sales compared to $23.4 million or 3.5% of net sales in fiscal 2016. General and administrative expense increased during fiscal 2017 primarily as a result of increased salaries and wages of $1.7 million and increased share-based compensation expense of $816,000, partially offset by a decrease in software maintenance and services fees of $1.1 million and legal settlement receipts of $564,000. General and administrative expense for fiscal 2016 decreased $1.1 million, or 5%, to $23.4 million or 3.5% of net sales compared to $24.5 million or 3.5% of net sales in fiscal 2015. General and administrative expense decreased from fiscal 2015 primarily as a result of a decrease in costs incurred for the implementation of our Shareholder Rights Plan of $446,000, decreased share-based compensation expense of $324,000, decreased professional fees of $260,000 and decreased rebranding expense of $115,000.
Depreciation and amortization expense was $6.4 million, $8.0 million and $8.5 million for fiscal 2017, fiscal 2016 and fiscal 2015, representing a decrease of $1.7 million, or 21% from fiscal 2016 to fiscal 2017 and a decrease of $433,000, or 5% from fiscal 2015 to fiscal 2016. Depreciation and amortization expense as a percentage of net sales was 1.0% for fiscal 2017, 1.2% for fiscal 2016 and 1.2% for fiscal 2015. The decrease in depreciation and amortization expense of $1.7 million during fiscal 2017 was primarily due to decreased depreciation expense of $1.7 million as a result of a reduction in our non-fulfillment depreciable asset base year over year, partially offset by increased amortization expense of $74,000. The decrease in depreciation and amortization expense of $433,000 during fiscal 2016 was primarily due to decreased depreciation expense of $464,000 as a result of a reduction in our non-fulfillment depreciable asset base year over year, partially offset by increased amortization expense of $30,000.
Operating Income (Loss)
We reported operating income of $3.2 million in fiscal 2017 compared to an operating loss of $2.0 million for fiscal 2016, representing a $5.2 million improvement. Our operating income increased during fiscal 2017 primarily as a result of a decrease in distribution and selling, a decrease in executive and management transition costs, a decrease in depreciation and amortization expense, a decrease in distribution facility consolidation and technology upgrade costs, and a gain on sale of television station, offset by decreased gross profit and an increase in general and administrative expense.
We reported an operating loss of $2.0 million for fiscal 2016 compared to an operating loss of $8.7 million for fiscal 2015, representing a $6.7 million improvement. Our operating results increased during fiscal 2016 primarily as a result of increased gross profit, a decrease in distribution and selling, a decrease in general and administrative, a decrease in distribution facility consolidation and technology upgrade costs, and a decrease in depreciation and amortization expense, offset by an increase in executive and management transition costs.
Income Taxes
For fiscal 2017, net income reflects an income tax benefit of $3.4 million. The fiscal 2017 tax benefit includes a non-cash charge of approximately $643,000 relating to changes in our long-term deferred tax liability related to the tax amortization of our indefinite-lived intangible FCC license asset that is not available to offset existing deferred tax assets in determining changes to our income tax valuation allowance. The fiscal 2017 tax benefit also includes a non-cash tax benefit of approximately $4.1 million generated by a reversal of our long-term deferred tax liability related to the sale of the FCC license (discussed further in Note 4 - “Intangible Assets” in the notes to our consolidated financial statements). We recognized a tax gain in conjunction with this transaction which will be largely offset with our available NOLs, creating an income tax benefit attributable to the reversal of the related long-term deferred tax liability. The fiscal 2017 income tax benefit was partially offset by state income taxes payable on certain income for which there is no loss carryforward benefit available.
The Tax Cuts and Jobs Act was signed into law on December 22, 2017. The tax reform legislation (discussed further in Note 12 - “Income Taxes” in the notes to our consolidated financial statements), which included a reduction in the corporate tax rate to 21% from 35%, did not have an impact on our tax provision for fiscal 2017 due to the full valuation allowance against our deferred tax assets. We remeasured our net deferred tax assets and valuation allowance to reflect the lower corporate tax rate.
For fiscal 2016, net loss reflects an income tax provision of $801,000. The fiscal 2016 tax provision includes a non-cash charge of approximately $788,000 relating to changes in our long-term deferred tax liability related to the tax amortization of our indefinite-lived intangible FCC license asset that is not available to offset existing deferred tax assets in determining changes to our income tax valuation allowance. The remaining fiscal 2016 income tax provision relates to state income taxes payable on
36
certain income for which there is no loss carryforward benefit available. For fiscal 2015, net loss reflects an income tax provision of $834,000. The fiscal 2015 tax provision includes a non-cash charge of approximately $788,000 relating to changes in our long-term deferred tax liability related to the tax amortization of our indefinite-lived intangible FCC license asset that is not available to offset existing deferred tax assets in determining changes to our income tax valuation allowance. The remaining fiscal 2015 income tax provision relates to state income taxes payable on certain income for which there is no loss carryforward benefit available.
We have not recorded any income tax benefit on the losses recorded during fiscal 2016 and fiscal 2015 due to the uncertainty of realizing income tax benefits in the future as indicated by our recording of an income tax valuation allowance. Based on our recent history of losses, a full valuation allowance has been recorded and was calculated in accordance with GAAP, which places primary importance on our most recent operating results when assessing the need for a valuation allowance. We will continue to maintain a valuation allowance against our net deferred tax assets, including those related to net operating loss carryforwards, until we believe it is more likely than not that these assets will be realized in the future.
Net Income (Loss)
For fiscal 2017, we reported net income of $143,000 or $0.00 per basic and dilutive share, on 63,870,046 weighted average common shares outstanding (63,968,299 diluted shares). For fiscal 2016 we reported a net loss of $8.7 million or $0.15 per basic and dilutive share, on 59,784,594 weighted average common shares outstanding. For fiscal 2015, we reported a net loss of $12.3 million, or $0.22 per basic and dilutive share, on 57,004,321 weighted average common shares outstanding. Fiscal 2017 net income per common share, basic and diluted, were not impacted as a result of the 53rd week. Net income for fiscal 2017 includes executive and management transition costs of $2.1 million, loss on debt extinguishment of $1.5 million, a gain on the sale of our Boston television station of $551,000, and interest expense of $5.1 million, relating primarily to interest on our credit facilities. Net loss for fiscal 2016 includes executive and management transition costs of $4.4 million, distribution facility consolidation and technology upgrade costs of $677,000 and interest expense of $5.9 million, relating primarily to interest on our credit facilities. Net loss for fiscal 2015 includes executive and management transition costs of $3.5 million, distribution facility consolidation and technology upgrade costs of $1.3 million and interest expense of $2.7 million, relating primarily to interest on outstanding advances under the PNC Credit Facility and the amortization of fees paid to obtain the PNC Credit Facility.
Financial Condition, Liquidity and Capital Resources
As of February 3, 2018, we had cash of $23.9 million and had restricted cash and investments of $450,000. Our restricted cash and investments are generally restricted for a period ranging from 30-60 days. In addition, under the PNC Credit Facility, we are required to maintain a minimum of $10 million of unrestricted cash plus facility availability at all times. As our unused line availability is greater than $10 million at February 3, 2018, no additional cash is required to be restricted. As of January 28, 2017, we had cash of $32.6 million and had restricted cash and investments of $450,000. During fiscal 2017, working capital increased $603,000 to $101.5 million compared to working capital of $100.9 million for fiscal 2016. The current ratio (our total current assets over total current liabilities) was 2.1 at February 3, 2018 and 1.9 at January 28, 2017.
Sources of Liquidity
Our principal source of liquidity is our available cash of $23.9 million as of February 3, 2018, which was held in bank depository accounts primarily for the preservation of cash liquidity.
PNC Credit Facility
On February 9, 2012, we entered into a credit and security agreement (as amended through September 25, 2017, the "PNC Credit Facility") with PNC Bank, N.A. ("PNC"), a member of The PNC Financial Services Group, Inc., as lender and agent. The PNC Credit Facility, which includes CIBC Bank USA (formerly known as The Private Bank) as part of the facility, provides a revolving line of credit of $90.0 million and provides for a term loan on which we had originally drawn to fund improvements at our distribution facility in Bowling Green, Kentucky and to partially pay down our GACP Term Loan (as defined below). The PNC Credit Facility also provides for an accordion feature that would allow us to expand the size of the revolving line of credit by an additional $25.0 million at the discretion of the lenders and upon certain conditions being met. On March 21, 2017, we entered into the Eighth Amendment to the PNC Credit Facility, which among other things, increased the term loan by $6,000,000, extended the term of the PNC Credit Facility from May 1, 2020 to March 21, 2022, and authorized the proceeds from the term loan to be used for a voluntary prepayment of $9,500,000 on our GACP Term Loan.
All borrowings under the PNC Credit Facility mature and are payable on March 21, 2022. Subject to certain conditions, the PNC Credit Facility also provides for the issuance of letters of credit in an aggregate amount up to $6.0 million which, upon issuance, would be deemed advances under the PNC Credit Facility. Maximum borrowings and available capacity under the
37
revolving line of credit under the PNC Credit Facility are equal to the lesser of $90.0 million or a calculated borrowing base comprised of eligible accounts receivable and eligible inventory.
The revolving line of credit under the PNC Credit Facility bears interest at LIBOR plus a margin of between 3% and 4.5% based on our trailing twelve-month reported EBITDA (as defined in the Credit Facility) measured quarterly in fiscal 2017 and semi-annually thereafter as demonstrated in its financial statements. The term loan bears interest at either a Base Rate or LIBOR plus a margin consisting of between 4% and 5% on Base Rate term loans and 5% to 6% on LIBOR term loans based on our leverage ratio as demonstrated in our audited financial statements.
As of February 3, 2018, we had borrowings of $59.9 million under our revolving line of credit. As of February 3, 2018, the term loan under the PNC Credit Facility had $14.1 million outstanding, of which $2.3 million was classified as current in the accompanying balance sheet, and was used to fund our expansion initiative and to partially pay down our GACP Term Loan. Remaining available capacity under the revolving credit facility as of February 3, 2018 was approximately $18.4 million, and provides liquidity for working capital and general corporate purposes. In addition, as of February 3, 2018, our unrestricted cash plus unused line availability was $42.4 million and we were in compliance with applicable financial covenants of the PNC Credit Facility and expect to be in compliance with applicable financial covenants over the next twelve months.
Principal borrowings under the term loan are to be payable in monthly installments over an 84-month amortization period commencing on April 1, 2017 and are also subject to mandatory prepayment in certain circumstances, including, but not limited to, upon receipt of certain proceeds from dispositions of collateral. Borrowings under the term loan are also subject to mandatory prepayment in an amount equal to fifty percent (50%) of excess cash flow for such fiscal year, with any such payment not to exceed $2.0 million in any such fiscal year.
The PNC Credit Facility contains customary covenants and conditions, including, among other things, maintaining a minimum of unrestricted cash plus facility availability of $10.0 million at all times and limiting annual capital expenditures. Certain financial covenants, including minimum EBITDA levels (as defined in the PNC Credit Facility) and a minimum fixed charge coverage ratio of 1.1 to 1.0, become applicable only if unrestricted cash plus facility availability falls below $10.8 million. In addition, the PNC Credit Facility places restrictions on our ability to incur additional indebtedness or prepay existing indebtedness, to create liens or other encumbrances, to sell or otherwise dispose of assets, to merge or consolidate with other entities, and to make certain restricted payments, including payments of dividends to common shareholders.
GACP Term Loan
On March 10, 2016, we entered into a term loan credit and security agreement (as amended through September 25, 2017, the "GACP Credit Agreement") with GACP Finance Co., LLC ("GACP") for a term loan of $17 million which was fully paid off during fiscal 2017 (as described below). Proceeds from the GACP Term Loan were used to provide for working capital and general corporate purposes and to help strengthen our total liquidity position. The term loan under the GACP Credit Agreement (the "GACP Term Loan") was secured on a first lien priority basis by the proceeds of any sale of our Boston television station FCC license and on a second lien priority basis by our accounts receivable, equipment, inventory and certain real estate as well as other assets as described in the GACP Credit Agreement. The Company had also pledged the stock of certain subsidiaries to secure such obligations on a second lien priority basis.
On March 21, 2017, we made a voluntary principal prepayment of $9.5 million on our GACP Credit Agreement. The principal payment was funded by a combination of cash on hand and $6.0 million from our lower interest PNC Credit Facility term loan. We recorded a loss on extinguishment of debt totaling $913,000 in connection with the principal prepayment, which includes early termination and lender fees of $199,000 and a write-off of unamortized debt issuance costs of $714,000, which represents the proportionate amount of unamortized debt issuance costs attributable to the settled debt.
On October 18, 2017, we made a voluntary principal prepayment of $2.5 million on our GACP Term Loan. The principal payment was funded by proceeds received under the Channel Sharing Agreement. We recorded a loss on extinguishment of debt totaling $221,000 in connection with the principal prepayment, which includes early termination and lender fees of $50,000 and unamortized debt issuance costs of $171,000, which represents the proportionate amount of unamortized debt issuance costs attributable to the settled debt.
On December 6, 2017, we made a voluntary principal prepayment of $3.5 million to fully retire our GACP Term Loan. The principal payment was funded by proceeds received upon the sale of the Boston television station, WWDP, as discussed in Note 4 - "Intangible Assets" in the notes to our consolidated financial statements. The Company recorded a loss on extinguishment of debt totaling $323,000 in connection with the principal prepayment, which includes early termination and lender fees of $85,000 and unamortized debt issuance costs of $238,000, which represents the remaining amount of unamortized debt issuance costs attributable to the GACP Term Loan.
The GACP Term Loan bore interest at either i) a fixed rate based on the greater of LIBOR for interest periods of one, two or three months or 1% plus a margin of 11.0%, or (ii) a daily floating Alternate Base Rate plus a margin of 10.0%. Principal
38
borrowings under the GACP Term Loan were payable in consecutive monthly installments of $70,833 each, commencing on April 1, 2016, with a final installment due at the end of the five-year term equal to the aggregate principal amount of all loans outstanding on such date.
Registered Direct Offering
On May 23, 2017, we entered into Common Stock Purchase Agreements (the “Purchase Agreements”) with certain accredited investors to which we sold, in the aggregate, 4,008,273 shares of common stock in a registered direct offering pursuant to a shelf registration statement on Form S-3 (File No. 333-203209), filed with the SEC on May 13, 2015. The shares were sold at a price of $1.12 per share, except for shares purchased by investors who are directors or executive officers of the Company, which were sold at a price of $1.15 per share. The closing of this sale occurred on May 30, 2017 and we received gross proceeds of approximately $4.5 million and incurred approximately $323,000 of issuance costs. We have used the proceeds for general working capital purposes.
Sale of Boston Television Station, WWDP
During fiscal 2017, we sold the Boston television station, WWDP, including our FCC broadcast license, for an aggregate of $13.5 million. We still have the opportunity to receive additional consideration of $667,000, which is subject to an escrow holdback and is payable to us when the station is being carried by designated carriers. See Note 4 - "Intangible Assets" in the notes to our consolidated financial statements for additional information. We used the proceeds received from the transaction to pay in full the remaining amounts due under our term loan with GACP, with the remaining proceeds used for general working capital purposes.
Private Placement Securities Purchase Agreements
On September 14, 2016, we entered into private placement securities purchase agreements with certain accredited investors to which we: (a) sold, in the aggregate, 5,952,381 shares of our common stock at a price of $1.68 per share; (b) Warrants to purchase 2,976,190 shares of our common stock at an exercise price of $2.90 per share, and (c) issued Options.
We received gross proceeds of $10.0 million and incurred approximately $852,000 of issuance costs. The Warrants will expire on September 19, 2021 and were not exercisable until March 19, 2017. The term of each option is six months and expire on March 19, 2017, provided, however, that an option may not be exercised for the first 30 days following issuance. Each option may only be exercised once, in whole or in part, and the future potential investment offering will have a price equal to the five-day volume weighted average price per share of our common stock as of the day immediately prior to exercise. Upon exercise of the Options, two-thirds of the option securities will be issued in the form of common stock, and one-third will be issued as Option Warrants. These Option Warrants will have an exercise price at a 50% premium to our closing stock price one-day prior to the option exercise and will expire five years after issuance. If all of the Warrants, Options and Option Warrants issued by us are all exercised, the total shares of common stock issued in connection with this offering will not be more than approximately 19.99% of our total issued and outstanding shares following such exercises.
During the fourth quarter of fiscal 2016, three investors exercised their Options. These exercises resulted in our issuance, in the aggregate, of (a) 1,646,350 shares of our common stock at a price ranging from $1.20 - $1.94 per share, resulting in aggregate proceeds of $2.5 million; and (b) five-year warrants to purchase an additional 823,175 shares of our common stock at an exercise price ranging from $1.76 - $3.00 per share and expire between November 10, 2021 and January 23, 2022. The Company incurred, in the aggregate, approximately $49,000 of issuance costs related to the Options exercised during the fourth quarter of fiscal 2016.
Other
Our ValuePay program is an installment payment program which allows customers to pay by credit card for certain merchandise in two or more equal monthly installments. Another potential source of near-term liquidity is our ability to increase our cash flow resources by reducing the percentage of our sales offered under our ValuePay installment program or by decreasing the length of time we extend credit to our customers under this installment program. However, any such change to the terms of our ValuePay installment program could impact future sales, particularly for products sold with higher price points. Please see "Cash Requirements" below for a discussion of our ValuePay installment program.
Cash Requirements
Currently, our principal cash requirements are to fund our business operations, which consist primarily of purchasing inventory for resale, funding accounts receivable, funding our basic operating expenses, particularly our contractual commitments for cable and satellite programming distribution, and the funding of necessary capital expenditures. We closely manage our cash resources and our working capital. We attempt to manage our inventory receipts and reorders in order to ensure our inventory investment levels remain commensurate with our current sales trends. We also monitor the collection of our credit card and ValuePay installment receivables and manage our vendor payment terms in order to more effectively manage our working capital which includes matching cash receipts from our customers, to the extent possible, with related cash payments to our vendors. ValuePay remains a cost
39
effective promotional tool for us. We continue to make strategic use of our ValuePay program in an effort to increase sales and to respond to similar competitive programs.
We also have significant future commitments for our cash, primarily payments for cable and satellite program distribution obligations and the eventual repayment of our credit facilities. We believe that our existing cash balances, together with our availability under the PNC Credit Facility, will be sufficient to fund our normal business operations over the next twelve months. We currently have total contractual cash obligations and commitments primarily with respect to our cable and satellite agreements, credit facility, and operating leases totaling approximately $315.0 million over the next five fiscal years.
For fiscal 2017, net cash provided by operating activities totaled $3.3 million compared to net cash provided by operating activities of $7.3 million in fiscal 2016 and net cash used for operating activities of $9.4 million in fiscal 2015. Net cash provided by operating activities for fiscal 2017 reflects net income, as adjusted for depreciation and amortization, share-based payment compensation, gain from disposal of assets, loss on debt extinguishment, long-term deferred income taxes and the amortization of deferred revenue and deferred financing costs. In addition, net cash provided by operating activities for fiscal 2017 reflects a decrease in accounts receivable, inventories and prepaid expenses; partially offset by a decrease in accounts payable and accrued liabilities. Accounts receivable decreased primarily due to lower sales levels, as well as a slight decrease in the utilization of our ValuePay installment program. Inventories decreased primarily as a result of disciplined management of overall working capital components commensurate with sales. Accounts payable and accrued liabilities decreased during fiscal 2017 primarily due to a decrease in inventory accounts payable as a result of the timing of inventory receipts at the end of fiscal 2017 compared to the end of fiscal 2016, a decrease in freight payables and a decrease in accrued salaries due to timing of payments.
Net cash provided by operating activities for fiscal 2016 reflects a net loss, as adjusted for depreciation and amortization, share-based payment compensation, long-term deferred income taxes and the amortization of deferred revenue and deferred financing costs. In addition, net cash provided by operating activities for fiscal 2016 reflects a decrease in accounts receivable and prepaid expenses; partially offset by a decrease in accounts payable and accrued liabilities and an increase in inventory. Accounts receivable decreased primarily due to lower sales levels, as well as a slight decrease in the utilization of our ValuePay installment program. Inventory increased as a result of our decrease in sales, particularly in the consumer electronics category, which is primarily drop-shipped from our vendors. This product category shift away from consumer electronics required the need to carry additional inventory on-hand to service expected demand. Accounts payable and accrued liabilities decreased during fiscal 2016 primarily due to a decrease in inventory accounts payable as a result of the timing of inventory receipts at the end of fiscal 2016 compared to the end of fiscal 2015, offset by an increase in accrued cable distribution fees due to the timing of payments.
Net cash used for operating activities for fiscal 2015 reflects a net loss, as adjusted for depreciation and amortization, share-based payment compensation, long-term deferred income taxes and the amortization of deferred revenue and other financing costs. In addition, net cash used for operating activities for fiscal 2015 reflects an increase in accounts receivable, inventories and prepaid expenses and a decrease in accounts payable and accrued liabilities. Accounts receivable increased due to increased sales levels, primarily in the fourth quarter. Inventory increased as a result of planned purchases in support of higher sales levels and in preparation for fiscal 2016 sales growth initiatives. Accounts payable and accrued liabilities decreased during fiscal 2015 primarily due to a decrease in accounts payables related to customer shipments made directly by vendors in the fourth quarter which had shorter payment terms, a decrease in accrued incentive compensation and accrued severance.
Net cash provided by investing activities totaled $2.2 million for fiscal 2017 compared to net cash used for investing activities of $10.8 million and $20.4 million for fiscal 2016 and fiscal 2015. Expenditures for property and equipment were $10.5 million in fiscal 2017 compared to $10.3 million in fiscal 2016 and $22.0 million in fiscal 2015. The decrease in capital expenditures in fiscal 2016 primarily relates to expenditures made in connection with our distribution facility expansion, which totaled $10.1 million during fiscal 2015. Additional capital expenditures made during the periods presented relate primarily to expenditures made for the development, upgrade and replacement of computer software, order management, merchandising and warehouse management systems, related computer equipment, digital broadcasting equipment, including high definition equipment, and other office equipment, warehouse equipment and production equipment. Principal future capital expenditures are expected to include: the development, upgrade and replacement of various enterprise software systems; equipment improvements and technology upgrades at our distribution facility in Bowling Green, Kentucky; security upgrades to our information technology; upgrades in our customer service call routing technology; the upgrade of television production and transmission equipment; and related computer equipment associated with the expansion of our television shopping business and digital commerce initiatives. During fiscal 2017, we received $12.7 million relating to the sale of the Boston television station, WWDP. During fiscal 2016, we paid $508,000 for the acquisition of an online watch retailer. During fiscal 2015, we decreased our restricted cash and investment collateral balance by $1.7 million.
Net cash used for financing activities totaled $14.2 million in fiscal 2017 and related primarily to principal payments on PNC revolving loan of $96.8 million, principal payments on the term loans of $18.8 million, payments for the repurchases of common stock of $5.1 million, payments for common stock issuance costs of $452,000, payments for debt extinguishment costs of $334,000, payments for deferred financing costs of $265,000 and payments for restricted stock issuance of $45,000, partially
40
offset by proceeds from the PNC revolving loan of $96.8 million, proceeds from the PNC term loan of $6.0 million, proceeds from the issuance of common stock and warrants of $4.6 million and proceeds from the exercise of stock options of $79,000. Net cash provided by financing activities totaled $24.2 million in fiscal 2016 and related primarily to proceeds from the GACP term loan of $17.0 million and proceeds from the issuance of common stock and warrants of $12.5 million, partially offset by principal payments on the term loans of $2.9 million, payments for deferred financing costs of $1.5 million, payments for common stock issuance costs of $786,000, payments for restricted stock issuance of $46,000 and capital lease payments of $39,000. Net cash provided by financing activities totaled $21.8 million in fiscal 2015 and related primarily to proceeds from the revolving loan under the PNC Credit Facility of $19.2 million, proceeds from the term loan under the PNC Credit Facility of $2.8 million and proceeds from the exercise of stock option of $2.5 million, partially offset by payments on the term loan of $2.1 million, payments for deferred financing costs of $537,000 and capital lease payments of $52,000.
Financial Covenants
The PNC Credit Facility contains customary covenants and conditions, including, among other things, maintaining a minimum of unrestricted cash plus facility availability of $10.0 million at all times and limiting annual capital expenditures. Certain financial covenants, including minimum EBITDA levels (as defined in the PNC Credit Facility) and a minimum fixed charge coverage ratio of 1.1 to 1.0, become applicable only if unrestricted cash plus facility availability falls below $10.8 million or upon an event of default. As of February 3, 2018, our unrestricted cash plus unused line availability was $42.4 million, and we were in compliance with applicable financial covenants of the PNC Credit Facility and expect to be in compliance with applicable financial covenants over the next twelve months.
Off-Balance Sheet Arrangements
We do not have any off-balance sheet arrangements, investments in special purpose entities or undisclosed borrowings or debt. Additionally, we are not party to any derivative contracts or synthetic leases.
Contractual Cash Obligations and Commitments
The following table summarizes our obligations and commitments as of February 3, 2018, and the effect these obligations and commitments are expected to have on our liquidity and cash flow in future periods:
Payments Due by Period | ||||||||||||||||||||
Total | Less than 1 Year | 1-3 Years | 3-5 Years | More than 5 Years | ||||||||||||||||
(In thousands) | ||||||||||||||||||||
Cable and satellite agreements (a) | $ | 143,636 | $ | 64,758 | $ | 77,515 | $ | 1,363 | $ | — | ||||||||||
Long term credit facilities (b) | 77,067 | 3,320 | 5,926 | 67,821 | — | |||||||||||||||
Operating leases | 2,611 | 1,159 | 1,452 | — | — | |||||||||||||||
Employment agreements | 2,271 | 2,268 | 3 | — | — | |||||||||||||||
Purchase order obligations | 89,405 | 89,405 | — | — | — | |||||||||||||||
Total | $ | 314,990 | $ | 160,910 | $ | 84,896 | $ | 69,184 | $ | — | ||||||||||
_______________________________________
(a) | Future cable and satellite payment commitments are based on subscriber levels as of February 3, 2018 and commitments entered into as of the date of this report. Future payment commitment amounts could increase or decrease as the number of cable and satellite subscribers increase or decrease, or with changes in channel position. Under certain circumstances, operators or we may cancel the agreements prior to expiration. |
(b) | Includes interest on variable rate debt estimated using the rate in effect as of February 3, 2018. |
Impact of Inflation
We believe that inflation has not had a material impact on our results of operations for each of the fiscal years in the three-year period ended February 3, 2018. We cannot assure you that inflation will not have an adverse impact on our operating results and financial condition in future periods.
41
Recently Issued Accounting Pronouncements
See Note 2 - "Summary of Significant Accounting Policies" in the notes to our consolidated financial statements for a discussion of recent accounting pronouncements.
Critical Accounting Policies and Estimates
Management’s Discussion and Analysis of Financial Condition and Results of Operations discusses our consolidated financial statements, which have been prepared in accordance with accounting principles generally accepted in the United States of America. The preparation of these financial statements requires management to make estimates and assumptions that affect the reported amounts of assets and liabilities and the disclosure of contingent assets and liabilities at the date of the financial statements and the reported amounts of revenues and expenses during the reporting periods. On an on-going basis, management evaluates its estimates and assumptions, including those related to the realizability of accounts receivable, inventory and product returns. Management bases its estimates and assumptions on historical experience and on various other factors that are believed to be reasonable under the circumstances, the results of which form the basis for making judgments about the carrying values of assets and liabilities that are not readily apparent from other sources. There can be no assurance that actual results will not differ from these estimates under different assumptions or conditions.
Management believes the following critical accounting policies affect the more significant assumptions and estimates used in the preparation of the consolidated financial statements:
• | Accounts receivable. We utilize an installment payment program called ValuePay that entitles customers to purchase merchandise and generally pay for the merchandise in two or more equal monthly credit card installments in which we bear the risk of collection. The percentage of our net sales generated utilizing our ValuePay payment program over the past three fiscal years ranged from 68% to 72%. As of February 3, 2018 and January 28, 2017, we had approximately $88.5 million and $91.8 million due from customers under the ValuePay installment program. We maintain allowances for doubtful accounts for estimated losses resulting from the inability of our customers to make required payments. Estimates are used in determining the provision for doubtful accounts and are based on historical rates of actual write offs and delinquency rates, historical collection experience, credit policy, current trends in the credit quality of our customer base, average length of ValuePay offers, average selling prices, our sales mix and accounts receivable aging. The provision for doubtful accounts receivable, which is primarily related to our ValuePay program, for fiscal 2017, fiscal 2016 and fiscal 2015 was $9.9 million, $11.9 million and $11.8 million. Based on our fiscal 2017 bad debt experience, a one-half point increase or decrease in our bad debt experience as a percentage of total net sales would have an impact of approximately $3.2 million on consolidated distribution and selling expense. |
• | Inventory. We value our inventory, which consists primarily of consumer merchandise held for resale, principally at the lower of average cost or net realizable value. As of February 3, 2018 and January 28, 2017, we had inventory balances of $68.8 million and $70.2 million. We regularly review inventory quantities on hand and record a provision for excess and obsolete inventory based primarily on the following factors: age of the inventory, estimated required sell-through time, stage of product life cycle and whether items are selling below cost. In determining appropriate reserve percentages, we look at our historical write off experience, the specific merchandise categories affected, our historic recovery percentages on various methods of liquidations, forecasts of future product airings and current markdown processes. Provision for excess and obsolete inventory for fiscal 2017, fiscal 2016 and fiscal 2015 was $3.8 million, $5.6 million and $7.2 million. Based on our fiscal 2017 inventory write down experience, a 10% increase or decrease in inventory write downs would have had an impact of approximately $376,000 on consolidated gross profit. |
• | Product returns. We record a reserve as a reduction of gross sales for anticipated product returns at each month-end and must make estimates of potential future product returns related to current period product revenue. Our return rates on our total net sales were 19.0% in fiscal 2017, 19.4% in fiscal 2016, and 19.8% in fiscal 2015. We estimate and evaluate the adequacy of our returns reserve by analyzing historical returns by merchandise category, looking at current economic trends and changes in customer demand and by analyzing the acceptance of new product lines. Assumptions and estimates are made and used in connection with establishing the sales returns reserve in any accounting period. Reserves for future product returns, included in accrued liabilities in the accompanying balance sheets at the end of fiscal 2017 and fiscal 2016 were $3.5 million and $3.7 million. Based on our fiscal 2017 sales returns, a one-point increase or decrease in our returns rate would have had an impact of approximately $3.1 million on gross profit. |
42
Item 7A. Quantitative and Qualitative Disclosures About Market Risk
We do not enter into financial instruments for trading or speculative purposes and do not currently utilize derivative financial instruments as a hedge to offset market risk. Our operations are conducted primarily in the United States and are not subject to foreign currency exchange rate risk. Some of our products are sourced internationally and may fluctuate in cost as a result of foreign currency swings; however, we believe these fluctuations have not been significant. We currently have exposure to interest rate risk under the PNC Credit Facility. Please refer to Item 7, “Management’s Discussion and Analysis of Financial Condition and Results of Operations-Financial Condition, Liquidity and Capital Resources-Sources of Liquidity” above for a discussion of the PNC Credit Facility. Changes in market interest rates could impact the level of interest expense and income earned on our cash portfolio. Based on our indebtedness in fiscal 2017, and assuming no changes to our consolidated balance sheet at February 3, 2018, a hypothetical increase in LIBOR by 100 basis points would increase our interest expense by $740,000, or 17%, compared to fiscal 2017. A hypothetical 100 basis point decrease in LIBOR would decrease our interest expense by $740,000, or 17%, compared to fiscal 2017.
43
Item 8. Financial Statements and Supplementary Data
INDEX TO CONSOLIDATED FINANCIAL STATEMENTS
OF EVINE Live Inc.
AND SUBSIDIARIES
Page | |
44
REPORT OF INDEPENDENT REGISTERED PUBLIC ACCOUNTING FIRM
To the Shareholders and the Board of Directors of
EVINE Live Inc. and Subsidiaries
Eden Prairie, Minnesota
Opinion on the Financial Statements
We have audited the accompanying consolidated balance sheets of EVINE Live Inc. and subsidiaries (the "Company") as of February 3, 2018 and January 28, 2017, and the related consolidated statements of operations, shareholders' equity, and cash flows for each of the three years in the period ended February 3, 2018, and the related notes and the schedule listed in the Index at Item 15 (collectively referred to as the "financial statements"). In our opinion, the financial statements present fairly, in all material respects, the financial position of the Company as of February 3, 2018 and January 28, 2017, and the results of its operations and its cash flows for each of the three years in the period ended February 3, 2018, in conformity with accounting principles generally accepted in the United States of America.
We have also audited, in accordance with the standards of the Public Company Accounting Oversight Board (United States) (PCAOB), the Company's internal control over financial reporting as of February 3, 2018, based on criteria established in Internal Control - Integrated Framework (2013) issued by the Committee of Sponsoring Organizations of the Treadway Commission and our report dated April 9, 2018, expressed an unqualified opinion on the Company's internal control over financial reporting.
Basis for Opinion
These financial statements are the responsibility of the Company's management. Our responsibility is to express an opinion on the Company's financial statements based on our audits. We are a public accounting firm registered with the PCAOB and are required to be independent with respect to the Company in accordance with the U.S. federal securities laws and the applicable rules and regulations of the Securities and Exchange Commission and the PCAOB.
We conducted our audits in accordance with the standards of the PCAOB. Those standards require that we plan and perform the audit to obtain reasonable assurance about whether the financial statements are free of material misstatement, whether due to error or fraud. Our audits included performing procedures to assess the risks of material misstatement of the financial statements, whether due to error or fraud, and performing procedures that respond to those risks. Such procedures included examining, on a test basis, evidence regarding the amounts and disclosures in the financial statements. Our audits also included evaluating the accounting principles used and significant estimates made by management, as well as evaluating the overall presentation of the financial statements. We believe that our audits provide a reasonable basis for our opinion.
/s/ DELOITTE & TOUCHE LLP
Minneapolis, Minnesota
April 9, 2018
We have served as the Company's auditor since 2002.
45
EVINE Live Inc. AND SUBSIDIARIES
CONSOLIDATED BALANCE SHEETS
February 3, 2018 | January 28, 2017 | |||||||
(In thousands, except share and per share data) | ||||||||
ASSETS | ||||||||
Current assets: | ||||||||
Cash | $ | 23,940 | $ | 32,647 | ||||
Restricted cash and investments | 450 | 450 | ||||||
Accounts receivable, net | 96,559 | 99,062 | ||||||
Inventories | 68,811 | 70,192 | ||||||
Prepaid expenses and other | 5,344 | 5,510 | ||||||
Total current assets | 195,104 | 207,861 | ||||||
Property & equipment, net | 52,048 | 52,715 | ||||||
FCC broadcasting license | — | 12,000 | ||||||
Other assets | 2,106 | 2,204 | ||||||
TOTAL ASSETS | $ | 249,258 | $ | 274,780 | ||||
LIABILITIES AND SHAREHOLDERS’ EQUITY | ||||||||
Current liabilities: | ||||||||
Accounts payable | $ | 55,614 | $ | 65,796 | ||||
Accrued liabilities | 35,646 | 37,858 | ||||||
Current portion of long term credit facilities | 2,326 | 3,242 | ||||||
Deferred revenue | 35 | 85 | ||||||
Total current liabilities | 93,621 | 106,981 | ||||||
Other long term liabilities | 68 | 428 | ||||||
Deferred tax liability | — | 3,522 | ||||||
Long term credit facilities | 71,573 | 82,146 | ||||||
Total liabilities | 165,262 | 193,077 | ||||||
Commitments and contingencies | ||||||||
Shareholders' equity: | ||||||||
Preferred stock, $.01 per share par value, 400,000 shares authorized; zero shares issued and outstanding | — | — | ||||||
Common stock, $.01 per share par value, 99,600,000 shares authorized; 65,290,458 and 65,192,314 shares issued and outstanding | 653 | 652 | ||||||
Additional paid-in capital | 439,111 | 436,962 | ||||||
Accumulated deficit | (355,768 | ) | (355,911 | ) | ||||
Total shareholders’ equity | 83,996 | 81,703 | ||||||
TOTAL LIABILITIES AND SHAREHOLDERS' EQUITY | $ | 249,258 | $ | 274,780 | ||||
The accompanying notes are an integral part of these consolidated financial statements.
46
EVINE Live Inc. AND SUBSIDIARIES
CONSOLIDATED STATEMENTS OF OPERATIONS
For the Years Ended | |||||||||||||
February 3, 2018 | January 28, 2017 | January 30, 2016 | |||||||||||
(In thousands, except share and per share data) | |||||||||||||
Net sales | $ | 648,220 | $ | 666,213 | $ | 693,312 | |||||||
Cost of sales | 413,108 | 424,686 | 454,832 | ||||||||||
Gross profit | 235,112 | 241,527 | 238,480 | ||||||||||
Operating expense: | |||||||||||||
Distribution and selling | 199,484 | 207,030 | 209,328 | ||||||||||
General and administrative | 24,442 | 23,386 | 24,520 | ||||||||||
Depreciation and amortization | 6,370 | 8,041 | 8,474 | ||||||||||
Executive and management transition costs | 2,145 | 4,411 | 3,549 | ||||||||||
Distribution facility consolidation and technology upgrade costs | — | 677 | 1,347 | ||||||||||
Gain on sale of television station | (551 | ) | — | — | |||||||||
Total operating expense | 231,890 | 243,545 | 247,218 | ||||||||||
Operating income (loss) | 3,222 | (2,018 | ) | (8,738 | ) | ||||||||
Other income (expense): | |||||||||||||
Interest income | 17 | 11 | 8 | ||||||||||
Interest expense | (5,084 | ) | (5,937 | ) | (2,720 | ) | |||||||
Loss on debt extinguishment | (1,457 | ) | — | — | |||||||||
Total other expense, net | (6,524 | ) | (5,926 | ) | (2,712 | ) | |||||||
Loss before income taxes | (3,302 | ) | (7,944 | ) | (11,450 | ) | |||||||
Income tax benefit (provision) | 3,445 | (801 | ) | (834 | ) | ||||||||
Net income (loss) | $ | 143 | $ | (8,745 | ) | $ | (12,284 | ) | |||||
Net income (loss) per common share | $ | 0.00 | $ | (0.15 | ) | $ | (0.22 | ) | |||||
Net income (loss) per common share — assuming dilution | $ | 0.00 | $ | (0.15 | ) | $ | (0.22 | ) | |||||
Weighted average number of common shares outstanding: | |||||||||||||
Basic | 63,870,046 | 59,784,594 | 57,004,321 | ||||||||||
Diluted | 63,968,299 | 59,784,594 | 57,004,321 | ||||||||||
The accompanying notes are an integral part of these consolidated financial statements.
47
EVINE Live Inc. AND SUBSIDIARIES
CONSOLIDATED STATEMENT OF SHAREHOLDERS’ EQUITY
For the Years Ended February 3, 2018, January 28, 2017 and January 30, 2016
Common Stock | Additional Paid-In Capital | Total Shareholders' Equity | ||||||||||||||||
Number of Shares | Par Value | Accumulated Deficit | ||||||||||||||||
(In thousands, except share data) | ||||||||||||||||||
BALANCE, January 31, 2015 | 56,448,663 | $ | 564 | $ | 418,846 | $ | (334,882 | ) | $ | 84,528 | ||||||||
Net loss | — | — | — | (12,284 | ) | (12,284 | ) | |||||||||||
Common stock issuances pursuant to equity compensation plans | 721,582 | 7 | 2,453 | — | 2,460 | |||||||||||||
Share-based payment compensation | — | — | 2,275 | — | 2,275 | |||||||||||||
BALANCE, January 30, 2016 | 57,170,245 | 571 | 423,574 | (347,166 | ) | 76,979 | ||||||||||||
Net loss | — | — | — | (8,745 | ) | (8,745 | ) | |||||||||||
Common stock issuances pursuant to equity compensation plans | 423,338 | 5 | (51 | ) | — | (46 | ) | |||||||||||
Share-based payment compensation | — | — | 1,946 | — | 1,946 | |||||||||||||
Common stock and warrant issuance | 7,598,731 | 76 | 11,493 | — | 11,569 | |||||||||||||
BALANCE, January 28, 2017 | 65,192,314 | 652 | 436,962 | (355,911 | ) | 81,703 | ||||||||||||
Net income | — | — | — | 143 | 143 | |||||||||||||
Repurchases of common stock | (4,400,000 | ) | (44 | ) | (5,011 | ) | — | (5,055 | ) | |||||||||
Common stock issuances pursuant to equity compensation plans | 389,871 | 4 | 30 | — | 34 | |||||||||||||
Share-based payment compensation | — | — | 2,888 | — | 2,888 | |||||||||||||
Common stock and warrant issuance | 4,108,273 | 41 | 4,242 | — | 4,283 | |||||||||||||
BALANCE, February 3, 2018 | 65,290,458 | $ | 653 | $ | 439,111 | $ | (355,768 | ) | $ | 83,996 | ||||||||
The accompanying notes are an integral part of these consolidated financial statements.
48
EVINE Live Inc. AND SUBSIDIARIES
CONSOLIDATED STATEMENTS OF CASH FLOWS
For the Years Ended | ||||||||||||
February 3, 2018 | January 28, 2017 | January 30, 2016 | ||||||||||
(in thousands) | ||||||||||||
OPERATING ACTIVITIES: | ||||||||||||
Net income (loss) | $ | 143 | $ | (8,745 | ) | $ | (12,284 | ) | ||||
Adjustments to reconcile net loss to net cash provided by operating activities: | ||||||||||||
Depreciation and amortization | 10,307 | 11,209 | 10,327 | |||||||||
Share-based payment compensation | 2,888 | 1,946 | 2,275 | |||||||||
Gain on sale of television station | (551 | ) | — | — | ||||||||
Amortization of deferred revenue | (60 | ) | (86 | ) | (85 | ) | ||||||
Amortization of deferred financing costs | 366 | 558 | 271 | |||||||||
Loss on debt extinguishment | 1,457 | — | — | |||||||||
Deferred income taxes | (3,522 | ) | 788 | 788 | ||||||||
Changes in operating assets and liabilities: | ||||||||||||
Accounts receivable, net | 2,503 | 15,978 | (2,674 | ) | ||||||||
Inventories | 1,381 | (3,181 | ) | (4,384 | ) | |||||||
Prepaid expenses and other | 166 | 423 | (565 | ) | ||||||||
Accounts payable and accrued liabilities | (11,800 | ) | (11,606 | ) | (3,080 | ) | ||||||
Net cash provided by (used for) operating activities | 3,278 | 7,284 | (9,411 | ) | ||||||||
INVESTING ACTIVITIES: | ||||||||||||
Property and equipment additions | (10,499 | ) | (10,261 | ) | (22,014 | ) | ||||||
Proceeds from the sale of assets | 12,738 | — | — | |||||||||
Cash paid for acquisition | — | (508 | ) | — | ||||||||
Change in restricted cash and investments | — | — | 1,650 | |||||||||
Net cash provided by (used for) investing activities | 2,239 | (10,769 | ) | (20,364 | ) | |||||||
FINANCING ACTIVITIES: | ||||||||||||
Proceeds from issuance of revolving loan | 96,800 | — | 19,200 | |||||||||
Proceeds of term loans | 6,000 | 17,000 | 2,849 | |||||||||
Proceeds from issuance of common stock and warrants | 4,628 | 12,470 | — | |||||||||
Proceeds from exercise of stock options | 79 | — | 2,460 | |||||||||
Payments on revolving loan | (96,800 | ) | — | — | ||||||||
Payments on term loans | (18,780 | ) | (2,852 | ) | (2,076 | ) | ||||||
Payments for repurchases of common stock | (5,055 | ) | — | — | ||||||||
Payments for common stock issuance costs | (452 | ) | (786 | ) | — | |||||||
Payments for debt extinguishment costs | (334 | ) | — | — | ||||||||
Payments for deferred financing costs | (265 | ) | (1,512 | ) | (537 | ) | ||||||
Payments for restricted stock issuance | (45 | ) | (46 | ) | — | |||||||
Payments on capital leases | — | (39 | ) | (52 | ) | |||||||
Net cash provided by (used for) financing activities | (14,224 | ) | 24,235 | 21,844 | ||||||||
Net increase (decrease) in cash | (8,707 | ) | 20,750 | (7,931 | ) | |||||||
BEGINNING CASH | 32,647 | 11,897 | 19,828 | |||||||||
ENDING CASH | $ | 23,940 | $ | 32,647 | $ | 11,897 | ||||||
The accompanying notes are an integral part of these consolidated financial statements.
49
EVINE Live Inc. AND SUBSIDIARIES
NOTES TO CONSOLIDATED FINANCIAL STATEMENTS
Years Ended February 3, 2018, January 28, 2017 and January 30, 2016
(1) The Company
EVINE Live Inc. and its subsidiaries ("we," "our," "us," or the "Company") are collectively a multiplatform interactive digital commerce company that offers a mix of proprietary, exclusive and name-brand merchandise in the categories of jewelry & watches, home & consumer electronics, beauty, and fashion & accessories directly to consumers 24 hours a day in an engaging and informative shopping experience via television, online and mobile devices. Evine is distributed in more than 87 million homes, primarily through cable and satellite distribution agreements and agreements with telecommunications companies. The network is also streamed live online at evine.com, is available on mobile channels and over-the-top platforms and is also distributed through a full-power television station in Boston.
The Company also operates evine.com, a comprehensive digital commerce platform that sells products which appear on its television shopping network as well as an extended assortment of online-only merchandise. The live programming and products are also marketed via mobile devices, including smartphones and tablets, and through the leading social media channels.
(2) Summary of Significant Accounting Policies
Fiscal Year
The Company's fiscal year ends on the Saturday nearest to January 31 and results in either a 52-week or 53-week fiscal year. References to years in this report relate to fiscal years, rather than to calendar years. The Company’s most recently completed fiscal year, fiscal 2017, ended on February 3, 2018, and consisted of 53 weeks. Fiscal 2016 ended on January 28, 2017 and consisted of 52 weeks. Fiscal 2015 ended on January 30, 2016 and consisted of 52 weeks.
Principles of Consolidation
The accompanying consolidated financial statements include the accounts of the Company and its wholly owned subsidiaries. Intercompany accounts and transactions have been eliminated in consolidation.
Revenue Recognition and Accounts Receivable
Revenue is recognized at the time merchandise is shipped or when services are provided. Shipping and handling fees charged to customers are recognized as merchandise is shipped and are classified as revenue in the accompanying statements of operations in accordance with generally accepted accounting principles ("GAAP"). The Company classifies shipping and handling costs in the accompanying statements of operations as a component of cost of sales. Revenue is reported net of estimated sales returns and excludes sales taxes. Sales returns are estimated and provided for at the time of sale based on historical experience.
Accounts receivable consist primarily of amounts due from customers for merchandise sales and from credit card companies, and are reflected net of reserves for estimated uncollectible amounts of $6,008,000 at February 3, 2018 and $6,022,000 at January 28, 2017. The Company utilizes an installment payment program called ValuePay that entitles customers to purchase merchandise and generally pay for the merchandise in two or more equal monthly credit card installments. As of February 3, 2018 and January 28, 2017, the Company had approximately $88,452,000 and $91,839,000 of net receivables due from customers under the ValuePay installment program. The Company maintains allowances for doubtful accounts for estimated losses resulting from the inability of its customers to make required payments. Provision for doubtful accounts receivable primarily related to the Company’s ValuePay program were $9,852,000, $11,949,000 and $11,795,000 for fiscal 2017, fiscal 2016 and fiscal 2015.
Cost of Sales and Other Operating Expenses
Cost of sales includes primarily the cost of merchandise sold, shipping and handling costs, inbound freight costs, excess and obsolete inventory charges, distribution facility depreciation and customer courtesy credits. Purchasing and receiving costs, including costs of inspection, are included as a component of distribution and selling expense and were approximately $10,660,000, $9,557,000 and $10,730,000 for fiscal 2017, fiscal 2016 and fiscal 2015. Distribution and selling expense consists primarily of cable and satellite access fees, credit card fees, bad debt expense and costs associated with purchasing and receiving, inspection, marketing and advertising, show production, website marketing and merchandising, telemarketing, customer service, warehousing and fulfillment. General and administrative expense consists primarily of costs associated with executive, legal, accounting and
50
EVINE Live INC. AND SUBSIDIARIES
NOTES TO CONSOLIDATED FINANCIAL STATEMENTS - (Continued)
finance, information systems and human resources departments, software and system maintenance contracts, insurance, investor and public relations and director fees.
Cash
Cash consists of cash on deposit. The Company maintains its cash balances at financial institutions in demand deposit accounts that are federally insured. The Company has not experienced losses in such accounts and believes it is not exposed to any significant credit risk on its cash.
Restricted Cash and Investments
The Company had restricted cash and investments of $450,000 for both fiscal 2017 and fiscal 2016. The Company’s restricted cash and investments consist of certificates of deposit. Interest income is recognized when earned.
Inventories
Inventories, which consists of consumer merchandise held for resale, are stated at the lower of average cost or net realizable value, giving consideration to obsolescence provision write downs of $3,757,000, $5,589,000 and $7,172,000 for fiscal 2017, fiscal 2016 and fiscal 2015.
Marketing and Advertising Costs
Marketing and advertising costs are expensed as incurred and consist primarily of contractual marketing fees paid to certain cable operators for cross channel promotions and online advertising, including amounts paid to online search engine operators and customer mailings. Total marketing and advertising costs and online search marketing fees totaled $4,530,000, $3,723,000 and $3,300,000 for fiscal 2017, fiscal 2016 and fiscal 2015. The Company includes advertising costs as a component of distribution and selling expense in the Company’s consolidated statement of operations.
Property and Equipment
Property and equipment are stated at cost, net of accumulated depreciation. Improvements and renewals that extend the life of an asset are capitalized and depreciated. Repairs and maintenance are charged to expense as incurred. The cost and accumulated depreciation of property and equipment retired or otherwise disposed of are removed from the related accounts, and any residual values are charged or credited to operations. Depreciation and amortization for financial reporting purposes are provided on a straight-line method based upon estimated useful lives. Costs incurred to develop software for internal use and for the Company’s websites are capitalized and amortized over the estimated useful life of the software. Costs related to maintenance of internal-use software and for the Company’s website are expensed as incurred.
Intangible Assets
The Company’s primary identifiable intangible assets include the Evine trademark and brand name; and an acquired online watch retailer customer list and trade name. Identifiable intangibles with finite lives are amortized and those identifiable intangibles with indefinite lives are not amortized. Identifiable intangible assets that are subject to amortization are evaluated for impairment whenever events or changes in circumstances indicate that the carrying amount may not be recoverable. Identifiable intangible assets not subject to amortization are tested for impairment annually or more frequently if events warrant. The impairment test consists of a comparison of the fair value of the intangible asset with its carrying amount.
Stock-Based Compensation
Compensation is recognized for all stock-based compensation arrangements by the Company, including employee and non-employee stock option and restricted stock unit grants. The estimated grant date fair value of each stock-based award is recognized as compensation over the requisite service period, which is generally the vesting period. The estimated fair value of each option is calculated using the Black-Scholes option-pricing model for time-based vesting awards and a Monte Carlo valuation model for market-based vesting awards. The estimated fair value of restricted stock grants is based on the grant date closing price of the Company's stock for time-based vesting awards and a Monte Carlo valuation model for market-based vesting awards.
Income Taxes
The Company accounts for income taxes under the liability method of accounting whereby deferred tax assets and liabilities are recognized for the expected future tax consequences of temporary differences between financial statement and tax basis of assets and liabilities. Deferred tax assets and liabilities are adjusted for the effects of changes in tax laws and rates on the date of the enactment of such laws. The Company assesses the recoverability of its deferred tax assets in accordance with GAAP.
The Company recognizes interest and penalties related to uncertain tax positions within income tax expense.
51
EVINE Live INC. AND SUBSIDIARIES
NOTES TO CONSOLIDATED FINANCIAL STATEMENTS - (Continued)
Net Income (Loss) Per Common Share
Basic income (loss) per share is computed by dividing reported income (loss) by the weighted average number of common shares outstanding for the reported period. Diluted net income (loss) per share reflects the potential dilution that could occur if securities or other contracts to issue common stock were exercised or converted into common stock of the Company during reported periods.
A reconciliation of net income (loss) per share calculations and the number of shares used in the calculation of basic net income (loss) per share and diluted net income (loss) per share is as follows:
For the Years Ended | ||||||||||||
February 3, 2018 | January 28, 2017 | January 30, 2016 | ||||||||||
Net income (loss) (a) | $ | 143,000 | $ | (8,745,000 | ) | $ | (12,284,000 | ) | ||||
Weighted average number of common shares outstanding — Basic | 63,870,046 | 59,784,594 | 57,004,321 | |||||||||
Dilutive effect of stock options, non-vested shares and warrants (b) | 98,253 | — | — | |||||||||
Weighted average number of common shares outstanding — Diluted | 63,968,299 | 59,784,594 | 57,004,321 | |||||||||
Net income (loss) per common share | $ | 0.00 | $ | (0.15 | ) | $ | (0.22 | ) | ||||
Net income (loss) per common share — assuming dilution | $ | 0.00 | $ | (0.15 | ) | $ | (0.22 | ) | ||||
(a) The net income (loss) for fiscal 2017, fiscal 2016 and fiscal 2015 includes executive and management transition costs of $2,145,000, $4,411,000 and $3,549,000. The net income for fiscal 2017 includes a loss on debt extinguishment of $1,457,000 and a gain on the sale of television station of $551,000. In addition, fiscal 2016 and fiscal 2015 net losses include distribution facility consolidation and technology upgrade costs of $677,000 and $1,347,000.
(b) For fiscal 2016 and fiscal 2015, approximately 119,000 and -0- incremental in-the-money potentially dilutive common share stock options and, with respect to fiscal 2016, warrants have been excluded from the computation of diluted earnings per share, as the effect of their inclusion would be anti-dilutive.
Fair Value of Financial Instruments
GAAP requires disclosures of fair value information about financial instruments for which it is practicable to estimate that value. In cases where quoted market prices are not available, fair values are based on estimates using present value or other valuation techniques. Those techniques are significantly affected by the assumptions used, including discount rate and estimates of future cash flows. In that regard, the derived fair value estimates cannot be substantiated by comparison to independent markets and, in many cases, could not be realized in immediate settlement of the instrument. GAAP excludes certain financial instruments and all non-financial instruments from its disclosure requirements.
The Company used the following methods and assumptions in estimating its fair values for financial instruments. The carrying amounts reported in the accompanying consolidated balance sheets approximate the fair value for cash, short-term investments, accounts receivable, trade payables and accrued liabilities, due to the short maturities of those instruments. The fair value of the Company’s $74 million PNC Credit Facility is estimated based on rates available to the Company for issuance of debt. As of February 3, 2018 and January 28, 2017, the Company's Credit Facilities had a carrying amount and an estimated fair value of $74 million and $85 million.
Fair Value Measurements on a Nonrecurring Basis
Assets and liabilities that are measured at fair value on a nonrecurring basis relate primarily to the Company's tangible fixed assets and intangible FCC broadcasting license asset, which was sold during the fourth quarter of fiscal 2017 as discussed further in Note 4 - "Intangible Assets". These assets and liabilities are remeasured when estimated fair value is below carrying value on the consolidated balance sheets. For these assets, the Company does not periodically adjust its carrying value to fair value except in the event of impairment. If the Company determines that impairment has occurred, the carrying value of the asset is reduced to fair value and the difference is recorded as a loss within operating income in the consolidated statement of operations. The Company had no remeasurements of such assets or liabilities to fair value during fiscal 2017, fiscal 2016 and fiscal 2015.
Use of Estimates
The preparation of financial statements in conformity with GAAP in the United States of America requires management to make estimates and assumptions that affect the reported amounts of assets and liabilities, the disclosure of contingent assets and liabilities as of the date of the financial statements and the reported amounts of revenues and expenses during reporting periods.
52
EVINE Live INC. AND SUBSIDIARIES
NOTES TO CONSOLIDATED FINANCIAL STATEMENTS - (Continued)
These estimates relate primarily to the carrying amounts of accounts receivable and inventories, the realizability of certain long-term assets and the recorded balances of certain accrued liabilities and reserves. Ultimate results could differ from these estimates.
Recently Adopted Accounting Standards
In July 2015, the Financial Accounting Standards Board issued Simplifying the Measurement of Inventory, Topic 330 (ASU No 2015-11). ASU 2015-11 changes the measurement principle for inventory from the lower of cost or market to lower of cost or net realizable value. The new standard is effective for the Company for fiscal years and interim periods beginning after December 15, 2016. The Company adopted this standard in the first quarter of fiscal 2017, applying it prospectively. The adoption of ASU 2015-11 did not have a material impact on the Company's consolidated financial statements.
In March 2016, the Financial Accounting Standards Board issued Compensation-Stock Compensation, Topic 718 (ASU No. 2016-09). This standard makes several modifications to Topic 718 related to the accounting for forfeitures, employer tax withholding on share-based compensation and the financial statement presentation of excess tax benefits or deficiencies. In addition, the ASU also clarifies the statement of cash flows presentation for certain components of share-based awards. The new standard is effective for the Company for fiscal years and interim periods beginning after December 15, 2016, with early adoption permitted. The Company adopted ASU 2016-09 in the first quarter of fiscal 2017 and has elected to continue estimating forfeitures each period. Prospectively, beginning January 29, 2017, excess tax benefits/deficiencies, along with the full valuation allowance, have been reflected as income tax benefit/expense in the statement of operations resulting in no impact on the tax provision in fiscal 2017. Additionally, the statement of cash flows classification of prior periods has not changed as a result of adoption.
In August 2016, the Financial Accounting Standards Board issued Statement of Cash Flows, Topic 230 (ASU No. 2016-15). This amendment provides guidance on the presentation and classification of specific cash flow items to improve consistency in practice. The standard provides guidance in a number of situations including, among others, contingent consideration payments made after a business combination, proceeds from the settlement of insurance claims and debt prepayment or extinguishment costs. The new standard is effective retrospectively for the Company for fiscal years and interim periods beginning after December 15, 2017, with early adoption permitted. The Company elected to early adopt this standard in the first quarter of fiscal 2017, applying it retrospectively. The adoption of ASU 2016-15 had no impact on the Company's consolidated financial statements.
Recently Issued Accounting Pronouncements
In May 2014, the Financial Accounting Standards Board issued Revenue from Contracts with Customers, Topic 606 (ASU No. 2014-09), which provides a framework for the recognition of revenue, with the objective that recognized revenues properly reflect amounts an entity is entitled to receive in exchange for goods and services. The guidance also includes additional disclosure requirements regarding revenue, cash flows and obligations related to contracts with customers. In July 2015, the Financial Accounting Standards Board approved a one year deferral of the effective date of ASU 2014-09. The standard will now become effective for interim and annual reporting periods beginning after December 15, 2017.
The Company will adopt the accounting guidance in the first quarter of fiscal 2018. The Company has completed its evaluation of the impact of ASU 2014-09, including related amendments and interpretive guidance, on the Company's consolidated financial statements, financial systems and controls. The Company has concluded that it will recognize revenue at the time merchandise is shipped, which is consistent with current practice. The Company has also concluded that it will continue to act as principal in certain vendor arrangements. The Company will make certain changes to its accounting policies, including the presentation of estimated merchandise returns as both an asset (equal to the inventory value expected to be returned) and a corresponding return liability, compared to the current practice of recording an estimated net return liability. In addition, the Company will elect the practical expedient to not adjust the promised amount of consideration for the effects of a significant financing component when its payment terms are less than one year, as well as the practical expedient to exclude from the measurement of the transaction price sales taxes collected from customers. The Company will apply the modified retrospective method of transition, which will not have a material cumulative adjustment to retained earnings.
In February 2016, the Financial Accounting Standards Board issued Leases, Topic 842 (ASU No 2016-02). ASU 2016-02 establishes a right-of-use model that requires a lessee to record a right-of-use asset and a lease liability on the balance sheet for all leases with terms longer than 12 months. Leases will be classified as either finance or operating, with classification affecting the pattern of expense recognition in the income statement. The new standard is effective for the Company for fiscal years and interim periods beginning after December 15, 2018, with early adoption permitted. The Company is currently evaluating the impact of adopting ASU 2016-02 on the Company's consolidated financial statements.
53
(3) Property and Equipment
Property and equipment in the accompanying consolidated balance sheets consisted of the following:
Estimated Useful Life (In Years) | February 3, 2018 | January 28, 2017 | ||||||||
Land and improvements | — | $ | 3,236,000 | $ | 3,394,000 | |||||
Buildings and improvements | 5-40 | 39,087,000 | 38,358,000 | |||||||
Transmission and production equipment | 5-10 | 6,918,000 | 7,308,000 | |||||||
Office and warehouse equipment | 3-15 | 18,827,000 | 18,942,000 | |||||||
Computer hardware, software and telephone equipment | 3-10 | 86,421,000 | 88,478,000 | |||||||
Leasehold improvements | 3-5 | 2,637,000 | 2,681,000 | |||||||
157,126,000 | 159,161,000 | |||||||||
Less — Accumulated depreciation | (105,078,000 | ) | (106,446,000 | ) | ||||||
$ | 52,048,000 | $ | 52,715,000 | |||||||
Depreciation expense in fiscal 2017, fiscal 2016 and fiscal 2015 was $10,141,000, $11,118,000 and $10,266,000.
(4) Intangible Assets
Intangible assets in the accompanying consolidated balance sheets consisted of the following:
Estimated Useful Life (In Years) | February 3, 2018 | January 28, 2017 | ||||||||||||||||
Gross Carrying Amount | Accumulated Amortization | Gross Carrying Amount | Accumulated Amortization | |||||||||||||||
Finite-lived intangible assets | 5-15 | $ | 1,786,000 | $ | (336,000 | ) | $ | 1,786,000 | $ | (171,000 | ) | |||||||
Indefinite-lived intangible assets: | ||||||||||||||||||
FCC broadcast license | $ | — | $ | 12,000,000 | ||||||||||||||
Finite-lived Intangible Assets
The finite-lived intangible assets are included in Other Assets in the accompanying balance sheets and consist of the Evine trademark and the Princeton Watches trade name and customer list (as further described below). Amortization expense related to the finite-lived intangible assets was $165,000, $91,000 and $62,000 for fiscal 2017, fiscal 2016 and fiscal 2015. Estimated amortization expense is $165,000 for each fiscal year through fiscal 2020, $157,000 for fiscal 2021 and $96,000 for fiscal 2022.
On December 16, 2016, the Company completed the acquisition of Princeton Enterprises, LTD (dba Princeton Watches, "Princeton Watches"), an online retail enterprise engaged in the sale of watches, clocks and related accessories. The Company acquired substantially all of Princeton's assets and select liabilities. The assets acquired include the Princeton Watches trade name and Princeton Watches customer list valued at $336,000 and $347,000 and are being amortized over their estimated useful lives of 15 and five years. The acquisition of Princeton was intended to help expand on the Company's strong watch and clock offerings as well as to broaden the Company's online distribution channels. See Note 11 - "Business Acquisition" for additional information.
FCC Broadcast License and Sale of Boston Television Station, WWDP
As of January 28, 2017, the Company had an intangible FCC broadcasting license with a carrying value of $12,000,000 and an estimated fair value of $13,400,000. On August 28, 2017, the Company entered into two agreements with unrelated parties to sell its Boston television station, WWDP, including the Company's FCC broadcast license, for an aggregate of $13,500,000.
On August 28, 2017, the Company entered into a channel sharing and facilities agreement (the “Channel Sharing Agreement”) with NRJ Boston OpCo, LLC and NRJ TV Boston License Co., LLC (collectively, “NRJ”) to allow NRJ to operate its local Boston television station on one-third of the spectrum used in the operation of the Company's television broadcast station, WWDP(TV), Norwell, Massachusetts (the “Station”), in perpetuity. The total consideration payable to the Company under the Channel Sharing Agreement was $3,500,000, of which $2,500,000 was received in October 2017 upon the grant of a required construction permit by the FCC and $1,000,000 was received in December 2017 upon the closing of the sale of substantially all of the remaining television station assets.
54
EVINE Live INC. AND SUBSIDIARIES
NOTES TO CONSOLIDATED FINANCIAL STATEMENTS - (Continued)
On August 28, 2017, the Company also entered into an asset purchase agreement to sell substantially all of the assets primarily related to the Station to affiliates of WRNN-TV Associates Limited Partnership (“Buyers”). The purchase price for the Station's assets was $10,000,000 in cash, subject to an escrow holdback amount of $1,000,000, which is payable to the Company when the Station is being carried by certain designated carriers at or following the closing of the transaction. The escrow holdback is payable back to the Buyers in monthly installments beginning approximately 14 months after the closing if the station is not being carried by certain designated carriers. The asset purchase agreement includes customary representations, warranties, covenants and indemnification obligations of the parties. The sale of assets pursuant to the purchase agreement closed during the fourth quarter of fiscal 2017 and $9,333,000 of the purchase price was received, which included $333,000 of the escrow holdback amount. The Company used the proceeds received from the transaction to pay off the remaining amounts due under the Company's term loan with GACP Finance Co., LLC, with the remaining proceeds used for general working capital purposes.
The Company recorded a pre-tax operating gain on the television station sale of $551,000 during the fourth quarter of fiscal 2017 upon the closing of the transaction. As of February 3, 2018, $667,000 of the sales price remained in escrow pending the Station being carried by certain designated carriers. The Company has not recorded any additional gain relating to the remaining escrow amount and will not record the remaining gain until the contingency is resolved.
(5) Accrued Liabilities
Accrued liabilities in the accompanying consolidated balance sheets consisted of the following:
February 3, 2018 | January 28, 2017 | |||||||
Accrued cable access fees | $ | 22,120,000 | $ | 19,480,000 | ||||
Accrued salaries and related | 2,105,000 | 4,406,000 | ||||||
Reserve for product returns | 3,544,000 | 3,723,000 | ||||||
Other | 7,877,000 | 10,249,000 | ||||||
$ | 35,646,000 | $ | 37,858,000 | |||||
(6) Evine Private Label Consumer Credit Card Program
The Company has a private label consumer credit card program (the "Program"). The Program is made available to all qualified consumers to finance Evine purchases and provides benefits including instant purchase credits, free or reduced shipping promotions throughout the year and promotional low-interest financing on qualifying purchases. Use of the Evine credit card enhances customer loyalty, reduces total credit card expense and reduces the Company’s overall bad debt exposure since the credit card issuing bank bears the risk of loss on Evine credit card transactions except those in the Company's ValuePay installment payment program. In July 2017, the Company extended the Program through 2020 by entering into a Private Label Consumer Credit Card Program Agreement Amendment with Synchrony Financial, the issuing bank for the Program.
Synchrony Financial was previously indirectly majority-owned by the General Electric Company ("GE"), which is also the parent company of GE Equity. Prior to the sale of Evine common stock to ASF Radio on April 29, 2016, GE Equity had a beneficial ownership in Evine and had certain rights as further described in Note 18 - "Related Party Transactions".
(7) Fair Value Measurements
GAAP utilizes a fair value hierarchy that prioritizes the inputs to valuation techniques used to measure fair value into three broad levels. The fair value hierarchy gives the highest priority to observable quoted prices (unadjusted) in active markets for identical assets and liabilities (Level 1 measurement), then priority to quoted prices for similar instruments in active markets, quoted prices for identical or similar instruments in markets that are not active and model-based valuation techniques for which all significant assumptions are observable in the market (Level 2 measurement) and the lowest priority to unobservable inputs (Level 3 measurement).
As of February 3, 2018 and January 28, 2017 the Company had $450,000 in Level 2 investments in the form of bank certificates of deposit. The Company's investments in certificates of deposits were measured using inputs based upon quoted prices for similar instruments in active markets and, therefore, were classified as Level 2 investments. As of February 3, 2018 and January 28, 2017 the Company also had long-term variable rate Credit Facilities, classified as Level 2, with carrying values of $73,899,000 and $85,388,000. As of February 3, 2018 and January 28, 2017, $2,326,000 and $3,242,000 was classified as current. The fair value of the variable rate Credit Facilities approximates and is based on its carrying value. The Company has no Level 3 investments that use significant unobservable inputs.
55
EVINE Live INC. AND SUBSIDIARIES
NOTES TO CONSOLIDATED FINANCIAL STATEMENTS - (Continued)
Non Financial Assets Measured at Fair Value - Nonrecurring Basis
As of January 28, 2017 the Company had an intangible FCC broadcasting license asset with a carrying value of $12,000,000. The intangible FCC broadcasting license, which was included in the Boston television station sale, WWDP, was sold during the fourth quarter of fiscal 2017. See Note 4 - "Intangible Assets" for additional information. Prior to such sale, the Company estimated the fair value of its FCC television broadcast license asset primarily by using income-based discounted cash flow models. In determining fair value, the Company considered, among other factors, the advice of an independent outside fair value consultant. The discounted cash flow models utilized a range of assumptions including revenues, operating profit margin, projected capital expenditures and an unobservable input discount rate of 10.0%. The Company concluded that the inputs used in its intangible FCC broadcasting license asset valuation were Level 3 inputs.
The following table provides a reconciliation of the beginning and ending balances of non-financial assets measured at fair value on a nonrecurring basis that use significant unobservable inputs (Level 3):
February 3, 2018 | January 28, 2017 | |||||||
Intangible FCC Broadcasting License Asset: | ||||||||
Beginning balance | $ | 12,000,000 | $ | 12,000,000 | ||||
Losses included in earnings (asset impairment) | — | — | ||||||
Net gain recognized in earnings upon sale | 551,000 | — | ||||||
Sale | (12,551,000 | ) | — | |||||
Ending balance | $ | — | $ | 12,000,000 | ||||
(8) Credit Agreements
The Company's long-term credit facilities consist of:
February 3, 2018 | January 28, 2017 | |||||||
PNC Credit Facility | ||||||||
PNC revolving loan due March 21, 2022, principal amount | $ | 59,900,000 | $ | 59,900,000 | ||||
PNC term loan due March 21, 2022, principal amount | 14,148,000 | 10,637,000 | ||||||
Less unamortized debt issuance costs | (149,000 | ) | (181,000 | ) | ||||
PNC term loan due March 21, 2022, carrying amount | 13,999,000 | 10,456,000 | ||||||
GACP Credit Agreement | ||||||||
GACP term loan due March 9, 2021, principal amount | — | 16,292,000 | ||||||
Less unamortized debt issuance costs | — | (1,260,000 | ) | |||||
GACP term loan due March 9, 2021, carrying amount | — | 15,032,000 | ||||||
Total long-term credit facilities | 73,899,000 | 85,388,000 | ||||||
Less current portion of long-term credit facilities | (2,326,000 | ) | (3,242,000 | ) | ||||
Long-term credit facilities, excluding current portion | $ | 71,573,000 | $ | 82,146,000 | ||||
PNC Credit Facility
On February 9, 2012, the Company entered into a credit and security agreement (as amended through September 25, 2017, the "PNC Credit Facility") with PNC Bank, N.A. ("PNC"), a member of The PNC Financial Services Group, Inc., as lender and agent. The PNC Credit Facility, which includes CIBC Bank USA (formerly known as The Private Bank) as part of the facility, provides a revolving line of credit of $90.0 million and provides for a term loan on which the Company had originally drawn to fund improvements at the Company's distribution facility in Bowling Green, Kentucky and subsequently to pay down the Company's GACP Term Loan (as defined below). The PNC Credit Facility also provides an accordion feature that would allow the Company to expand the size of the revolving line of credit by another $25.0 million at the discretion of the lenders and upon certain conditions being met. On March 21, 2017, the Company entered into the Eighth Amendment to the PNC Credit Facility, which among other
56
EVINE Live INC. AND SUBSIDIARIES
NOTES TO CONSOLIDATED FINANCIAL STATEMENTS - (Continued)
things, increased the term loan by $6,000,000, extended the term of the PNC Credit Facility from May 1, 2020 to March 21, 2022, and authorized the proceeds from the term loan to be used as part of a voluntary prepayment on its GACP Term Loan.
All borrowings under the PNC Credit Facility mature and are payable on March 21, 2022. Subject to certain conditions, the PNC Credit Facility also provides for the issuance of letters of credit in an aggregate amount up to $6.0 million which, upon issuance, would be deemed advances under the PNC Credit Facility. Maximum borrowings and available capacity under the revolving line of credit under the PNC Credit Facility are equal to the lesser of $90.0 million or a calculated borrowing base comprised of eligible accounts receivable and eligible inventory. The PNC Credit Facility is secured by a first security interest in substantially all of the Company’s personal property, as well as the Company’s real properties located in Eden Prairie, Minnesota and Bowling Green, Kentucky. Under certain circumstances, the borrowing base may be adjusted if there were to be a significant deterioration in value of the Company’s accounts receivable and inventory.
The revolving line of credit under the PNC Credit Facility bears interest at LIBOR plus a margin of between 3% and 4.5% based on the Company's trailing twelve-month reported EBITDA (as defined in the PNC Credit Facility) measured quarterly in fiscal 2016 and semi-annually thereafter as demonstrated in its financial statements. The term loan bears interest at either a Base Rate or LIBOR plus a margin consisting of between 4% and 5% on Base Rate term loans and 5% to 6% on LIBOR Rate term loans based on the Company’s leverage ratio as demonstrated in its audited financial statements.
As of February 3, 2018, the Company had borrowings of $59.9 million under its revolving credit facility. Remaining available capacity under the revolving credit facility as of February 3, 2018 is approximately $18.4 million, and provides liquidity for working capital and general corporate purposes. The PNC Credit Facility also provides for a term loan on which the Company has drawn to fund an expansion and improvements at the Company's distribution facility in Bowling Green, Kentucky and to partially pay down the Company's GACP Term Loan. As of February 3, 2018, there was approximately $14.1 million outstanding under the PNC Credit Facility term loan of which $2.3 million was classified as current in the accompanying balance sheet.
Principal borrowings under the term loan are to be payable in monthly installments over an 84-month amortization period commencing on April 1, 2017 and are also subject to mandatory prepayment in certain circumstances, including, but not limited to, upon receipt of certain proceeds from dispositions of collateral. Borrowings under the term loan are also subject to mandatory prepayment in an amount equal to fifty percent (50%) of excess cash flow for such fiscal year, with any such payment not to exceed $2.0 million in any such fiscal year. The PNC Credit Facility is also subject to other mandatory prepayment in certain circumstances. In addition, if the total PNC Credit Facility is terminated prior to maturity, the Company would be required to pay an early termination fee of 3.0% if terminated on or before March 21, 2018, 1.0% if terminated on or before March 21, 2019, 0.5% if terminated on or before March 21, 2020; and no fee if terminated after March 21, 2020. As of February 3, 2018, the imputed effective interest rate on the PNC term loan was 8.0%.
Interest expense recorded under the PNC Credit Facility was $4,128,000, $3,819,000 and $2,702,000 for fiscal 2017, fiscal 2016 and fiscal 2015.
The PNC Credit Facility contains customary covenants and conditions, including, among other things, maintaining a minimum of unrestricted cash plus unused line availability of $10.0 million at all times and limiting annual capital expenditures. As the Company's unused line availability was greater than $10.0 million at February 3, 2018, no additional cash was required to be restricted. Certain financial covenants, including minimum EBITDA levels (as defined in the PNC Credit Facility) and a minimum fixed charge coverage ratio of 1.1 to 1.0, become applicable only if unrestricted cash plus unused line availability falls below $10.8 million. As of February 3, 2018, the Company's unrestricted cash plus unused line availability was $42.4 million and the Company was in compliance with applicable financial covenants of the PNC Credit Facility and expects to be in compliance with applicable financial covenants over the next twelve months. In addition, the PNC Credit Facility places restrictions on the Company’s ability to incur additional indebtedness or prepay existing indebtedness, to create liens or other encumbrances, to sell or otherwise dispose of assets, to merge or consolidate with other entities, and to make certain restricted payments, including payments of dividends to common shareholders.
Costs incurred to obtain amendments to the PNC Credit Facility totaling $1,406,000 and unamortized costs incurred to obtain the original PNC Credit Facility totaling $466,000 have been deferred and are being expensed as additional interest over the five-year term of the PNC Credit Facility. Deferred financing costs, net of amortization, related to the revolving line of credit are included within other assets within the Company's balance sheet.
Great American Capital Partners Credit Agreement
On March 10, 2016, the Company entered into a term loan credit and security agreement (as amended through September 25, 2017, the "GACP Credit Agreement") with GACP Finance Co., LLC ("GACP") for a term loan of $17.0 million which was fully paid off during fiscal 2017 (as described below). Proceeds from the GACP Term Loan were used to provide for working capital and general corporate purposes and to help strengthen the Company's total liquidity position. The term loan under the GACP Credit Agreement (the "GACP Term Loan") was secured on a first lien priority basis by the proceeds of any sale of the
57
EVINE Live INC. AND SUBSIDIARIES
NOTES TO CONSOLIDATED FINANCIAL STATEMENTS - (Continued)
Company's Boston television station FCC license and on a second lien priority basis by the Company's accounts receivable, equipment, inventory and certain real estate as well as other assets as described in the GACP Credit Agreement. The Company had also pledged the stock of certain subsidiaries to secure such obligations on a second lien priority basis.
On March 21, 2017, the Company made a voluntary principal prepayment of $9,500,000 on its GACP Term Loan. The principal payment was funded by a combination of cash on hand and $6,000,000 from the Company’s lower interest PNC Credit Facility term loan. The Company recorded a loss on extinguishment of debt totaling $913,000 in connection with the principal prepayment, which includes early termination and lender fees of $199,000 and unamortized debt issuance costs of $714,000, which represents the proportionate amount of unamortized debt issuance costs attributable to the extinguished debt.
On October 18, 2017, the Company made a voluntary principal prepayment of $2,500,000 on its GACP Term Loan. The principal payment was funded by proceeds received by the Company under the Channel Sharing Agreement, as discussed in Note 4 - "Intangible Assets". The Company recorded a loss on extinguishment of debt totaling $221,000 in connection with the principal prepayment, which includes early termination and lender fees of $50,000 and unamortized debt issuance costs of $171,000, which represents the proportionate amount of unamortized debt issuance costs attributable to the extinguished debt.
On December 6, 2017, the Company made a voluntary principal prepayment of $3,513,000 to fully retire its GACP Term Loan. The principal payment was funded by proceeds received upon the sale of the Boston television station, WWDP, as discussed in Note 4 - "Intangible Assets". The Company recorded a loss on extinguishment of debt totaling $323,000 in connection with the principal prepayment, which includes early termination and lender fees of $85,000 and unamortized debt issuance costs of $238,000, which represents the remaining amount of unamortized debt issuance costs attributable to the GACP Term Loan.
The GACP Term Loan bore interest at either (i) a fixed rate based on the greater of LIBOR for interest periods of one, two or three months or 1% plus a margin of 11.0%, or (ii) a daily floating Alternate Base Rate plus a margin of 10.0%. Principal borrowings under the GACP Term Loan were payable in consecutive monthly installments of $70,833 each, commencing on April 1, 2016, with a final installment due at the end of the five- year term equal to the aggregate principal amount of all loans outstanding on such date. The GACP Term Loan could be prepaid voluntarily at any time and, if terminated prior to maturity, the Company would be required to pay an early termination fee of 2.0% if terminated on or before March 10, 2018; 1.0% if terminated on or before March 10, 2019; and no fee if terminated after March 10, 2019. Interest expense recorded under the GACP Credit Agreement was $940,000 and $2,099,000 for fiscal 2017 and fiscal 2016.
Costs incurred to obtain the GACP Credit Agreement totaled $1,565,000, which were deferred and expensed as additional interest over the original five-year term of the GACP Credit Agreement, less costs written-off for the March 21, 2017 and October 18, 2017 partial debt extinguishments totaling $885,000. The remaining $238,000 of deferred costs were written-off as a loss on debt extinguishment in December 2017, when the remaining principal was paid in full.
The aggregate maturities of the Company's long-term credit facilities as of February 3, 2018 are as follows:
PNC Credit Facility | ||||||||||||
Fiscal year | Term loan | Revolving loan | Total | |||||||||
2018 | $ | 2,326,000 | $ | — | $ | 2,326,000 | ||||||
2019 | 2,132,000 | — | 2,132,000 | |||||||||
2020 | 2,326,000 | — | 2,326,000 | |||||||||
2021 | 2,326,000 | — | 2,326,000 | |||||||||
2022 | 5,038,000 | 59,900,000 | 64,938,000 | |||||||||
$ | 14,148,000 | $ | 59,900,000 | $ | 74,048,000 | |||||||
(9) Shareholders' Equity
Common Stock
The Company currently has authorized 99,600,000 shares of undesignated capital stock, of which 65,290,458 shares were issued and outstanding as common stock as of February 3, 2018. The board of directors may establish new classes and series of capital stock by resolution without shareholder approval; however, in certain circumstances the Company is required to obtain approval under our PNC Credit Facility.
58
EVINE Live INC. AND SUBSIDIARIES
NOTES TO CONSOLIDATED FINANCIAL STATEMENTS - (Continued)
Preferred Stock
The Company authorized 400,000 Series A Junior Participating Cumulative Preferred Stock, $0.01 par value, during fiscal 2015 as part of the Shareholder Rights Plan. As of February 3, 2018, there were zero shares issued and outstanding. See Note 12 - "Income Taxes" for additional information.
Dividends
The Company has never declared or paid any dividends with respect to its capital stock. The Company is restricted from paying dividends on its stock by its PNC Credit Facility.
Registered Direct Offering
On May 23, 2017, the Company entered into Common Stock Purchase Agreements with certain accredited investors to which the Company sold, in the aggregate, 4,008,273 shares of common stock in a registered direct offering pursuant to a shelf registration statement on Form S-3 (File No. 333-203209), filed with the SEC on May 13, 2015. The shares were sold at a price of $1.12 per share, except for shares purchased by investors who are directors or executive officers of the Company, which were sold at a price of $1.15 per share. The closing of this sale occurred on May 30, 2017 and the Company received gross proceeds of approximately $4.5 million and incurred approximately $323,000 of issuance costs. The Company has used the proceeds for general working capital purposes.
Private Placement Securities Purchase Agreements
On September 14, 2016, the Company entered into private placement securities purchase agreements ("Purchase Agreements") with certain accredited investors to which the Company: (a) sold, in the aggregate, 5,952,381 shares of the Company's common stock at a price of $1.68 per share; (b) issued five-year warrants ("Warrants") to purchase 2,976,190 shares of the Company's common stock at an exercise price of $2.90 per share, and (c) issued an option by which certain investors may purchase additional shares of Company's common stock and additional warrants to purchase shares of common stock ("Options").
The Company received gross proceeds of $10.0 million and incurred approximately $852,000 of issuance costs. The Warrants will expire on September 19, 2021 and were not exercisable until March 19, 2017. Except as noted below, the term of each option was six months and expired on March 19, 2017. The option exercise price was equal to the five-day volume weighted average price per share of the Company's common stock as of the day immediately prior to exercise. Upon exercise of the Options, two-thirds of the option securities would be issued in the form of common stock, and one-third would be issued in the form of warrants ("Option Warrants"). These Option Warrants have an exercise price at a 50% premium to the Company's closing stock price one-day prior to the option exercise and will expire five years after issuance. If all of the Warrants, Options and Option Warrants issued by the Company are all exercised, the total shares of common stock issued in connection with this offering cannot be more than approximately 19.99% of the Company's total issued and outstanding shares following such exercises.
The Company allocated the $10 million proceeds of the stock offering to each of the issued freestanding financial instruments based on their fair value at the time of issuance. The Warrants are indexed to the Company's publicly traded stock and were classified as equity. As a result, the portion of the proceeds allocated to the fair value of the Warrants was recorded as an increase to additional paid-in capital. The fair value of the Options was determined to be nominal. The par value of the shares issued was recorded within common stock, with the remainder of the proceeds, less offering costs, recorded as additional paid in capital in the Company's balance sheet. The Company has used the proceeds for general working capital purposes.
As part of the Purchase Agreements, the Company agreed to register the shares of common stock sold in the private placement and the shares of common stock issuable upon exercise of the Warrants, Options and certain of the Option Warrants. The Company has filed registration statements on Form S-3 to register the common stock sold in the private placement and issuable upon exercise of the Warrants, Options and the outstanding Option Warrants. The Company agreed to keep the shelf registration statement effective until the earlier of the second anniversary of the closing or such time as all registrable securities may be sold pursuant to Rule 144 under the Securities Act of 1933, without the need for current public information or other restriction.
During the fourth quarter of fiscal 2016, three investors exercised their Options. These exercises resulted in the Company's issuance, in the aggregate, of (a) 1,646,350 shares of the Company's common stock at a price ranging from $1.20 - $1.94 per share, resulting in aggregate proceeds of $2.5 million; and (b) five-year Option Warrants to purchase an additional 823,175 shares of the Company's common stock at an exercise price ranging from $1.76 - $3.00 per share and expire between November 10, 2021 and January 23, 2022. The Company incurred, in the aggregate, approximately $49,000 of issuance costs related to the Options exercised during the fourth quarter of fiscal 2016.
On March 16, 2017, the Company entered into the First Amendment and Restated Option (the "Amended Option") with TH Media Partners, LLC, one of the September 14, 2016 Securities Purchase Agreement investors. Under the terms of the Amended Option, the investor has the right to exercise its Option in two tranches. The first tranche reflects rights to purchase 150,000 shares
59
EVINE Live INC. AND SUBSIDIARIES
NOTES TO CONSOLIDATED FINANCIAL STATEMENTS - (Continued)
of the Company’s common stock, which were issuable in the form of 100,000 common shares and a warrant to purchase an additional 50,000 common shares and was exercised on March 16, 2017. The exercise resulted in the issuance of (a) 100,000 shares of the Company's common stock at a price of $1.33 per share, resulting in aggregate proceeds of $133,000; and (b) a five-year Option Warrant to purchase an additional 50,000 shares of the Company's common stock at an exercise price of $1.92 per share and expiring on March 16, 2022. The second tranche reflected the right to purchase up to 1,073,945 shares of the Company’s common stock issuable in the form of 715,963 common shares and an Option Warrant to purchase an additional 357,982 common shares. The second tranche expired unexercised on September 19, 2017. The exercise price of the Option and Option Warrants for the first and second tranches were not modified by the Amended Option. The Company incurred, in the aggregate, approximately $23,000 of issuance costs related to the Options exercised during the first quarter of fiscal 2017.
Stock Purchase from NBCU
On January 31, 2017, the Company purchased from NBCUniversal Media, LLC (“NBCU”) 4,400,000 shares of the Company's common stock for approximately $5 million or $1.12 per share pursuant to the Repurchase Letter Agreement. Immediately following the Company's share purchase, the direct equity ownership of NBCU in the Company consisted of 2,741,849 shares of common stock, or 4.5% of the Company's outstanding common stock. Upon the settlement, the NBCU Shareholder Agreement was terminated pursuant to the Repurchase Letter Agreement. As of February 3, 2018, the Company believes that NBCU sold its remaining shares of the Company's common stock. See Note 18 - "Related Party Transactions" for additional information.
Stock-Based Compensation - Stock Options
Compensation is recognized for all stock-based compensation arrangements by the Company. Stock-based compensation expense for fiscal 2017, fiscal 2016 and fiscal 2015 related to stock option awards was $915,000, $522,000 and $611,000. The Company has not recorded any income tax benefit from the exercise of stock options due to the uncertainty of realizing income tax benefits in the future.
As of February 3, 2018, the Company had one omnibus stock plan for which stock awards can be currently granted: the 2011 Omnibus Incentive Plan that provides for the issuance of up to 9,500,000 shares of the Company's stock. The 2004 Omnibus Stock Plan expired on June 22, 2014. No further awards may be made under the 2004 Omnibus Plan, but any award granted under the 2004 Omnibus Plan and outstanding on June 22, 2014 will remain outstanding in accordance with its terms. The 2001 Omnibus Stock Plan expired on June 21, 2011 and as of February 3, 2018, there were no stock awards outstanding under the 2001 Omnibus Plan. The 2011 plan is administered by the human resources and compensation committee of the board of directors and provides for awards for employees, directors and consultants. All employees and directors of the Company and its affiliates are eligible to receive awards under the plan. The types of awards that may be granted under this plan include restricted and unrestricted stock, restricted stock units, incentive and nonstatutory stock options, stock appreciation rights, performance units, and other stock-based awards. Incentive stock options may be granted to employees at such exercise prices as the human resources and compensation committee may determine but not less than 100% of the fair market value of the underlying stock as of the date of grant. No incentive stock option may be granted more than 10 years after the effective date of the respective plan's inception or be exercisable more than 10 years after the date of grant. Options granted to outside directors are nonstatutory stock options with an exercise price equal to 100% of the fair market value of the underlying stock as of the date of grant. With the exception of market-based options, options granted generally vest over three years in the case of employee stock options and vest immediately on the date of grant in the case of director options, and have contractual terms of 10 years from the date of grant.
The fair value of each time-based vesting option award is estimated on the date of grant using the Black-Scholes option pricing model that uses assumptions noted in the following table. Expected volatilities are based on the historical volatility of the Company's stock. Expected term is calculated using the simplified method taking into consideration the option's contractual life and vesting terms. The Company uses the simplified method in estimating its expected option term because it believes that historical exercise data cannot be accurately relied upon at this time to provide a reasonable basis for estimating an expected term due to the extreme volatility of its stock price and the resulting unpredictability of its stock option exercises. The risk-free interest rate for periods within the contractual life of the option is based on the U.S. Treasury yield curve in effect at the time of grant. Expected dividend yields were not used in the fair value computations as the Company has never declared or paid dividends on its common stock and currently intends to retain earnings for use in operations.
Fiscal 2017 | Fiscal 2016 | Fiscal 2015 | ||||||||||||
Expected volatility | 81% | 81 | % | - | 84% | 75 | % | - | 82% | |||||
Expected term (in years) | 6 years | 6 years | 6 years | |||||||||||
Risk-free interest rate | 2.0 | % | - | 2.2% | 1.4 | % | - | 2.2% | 1.7 | % | - | 1.9% | ||
60
EVINE Live INC. AND SUBSIDIARIES
NOTES TO CONSOLIDATED FINANCIAL STATEMENTS - (Continued)
A summary of the status of the Company’s stock option activity as of February 3, 2018 and changes during the year then ended is as follows:
2011 Incentive Stock Option Plan | Weighted Average Exercise Price | 2004 Incentive Stock Option Plan | Weighted Average Exercise Price | 2001 Incentive Stock Option Plan | Weighted Average Exercise Price | ||||||||||||||||
Balance outstanding, January 28, 2017 | 2,543,000 | $ | 2.19 | 301,000 | $ | 5.41 | 77,000 | $ | 10.73 | ||||||||||||
Granted | 1,627,000 | $ | 1.31 | — | $ | — | — | $ | — | ||||||||||||
Exercised | (72,000 | ) | $ | 1.08 | — | $ | — | — | $ | — | |||||||||||
Forfeited or canceled | (714,000 | ) | $ | 2.90 | (189,000 | ) | $ | 5.73 | (77,000 | ) | $ | 10.73 | |||||||||
Balance outstanding, February 3, 2018 | 3,384,000 | $ | 1.64 | 112,000 | $ | 4.86 | — | $ | — | ||||||||||||
Options exercisable at: | |||||||||||||||||||||
February 3, 2018 | 927,000 | $ | 2.35 | 112,000 | $ | 4.86 | — | $ | — | ||||||||||||
January 28, 2017 | 648,000 | $ | 3.53 | 292,000 | $ | 5.43 | 77,000 | $ | 10.73 | ||||||||||||
January 30, 2016 | 995,000 | $ | 3.97 | 652,000 | $ | 6.22 | 399,000 | $ | 7.78 | ||||||||||||
The following table summarizes information regarding stock options outstanding at February 3, 2018:
Options Outstanding | Options Vested or Expected to Vest | |||||||||||||||||||||||||
Option Type | Number of Shares | Weighted Average Exercise Price | Weighted Average Remaining Contractual Life (Years) | Aggregate Intrinsic Value | Number of Shares | Weighted Average Exercise Price | Weighted Average Remaining Contractual Life (Years) | Aggregate Intrinsic Value | ||||||||||||||||||
2011 Incentive: | 3,384,000 | $ | 1.64 | 8.4 | $ | 58,000 | 3,078,000 | $ | 1.67 | 8.2 | $ | 55,000 | ||||||||||||||
2004 Incentive: | 112,000 | $ | 4.86 | 5.8 | $ | — | 112,000 | $ | 4.86 | 5.8 | $ | — | ||||||||||||||
2001 Incentive: | — | $ | — | 0.0 | $ | — | — | $ | — | 0.0 | $ | — | ||||||||||||||
The weighted average grant-date fair value of options granted in fiscal 2017, fiscal 2016 and fiscal 2015 was $0.91, $0.96 and $3.95. The total intrinsic value of options exercised during fiscal 2017, fiscal 2016 and fiscal 2015 was $15,000, $0 and $1,441,000. As of February 3, 2018, total unrecognized compensation cost related to stock options was $1,454,000 and is expected to be recognized over a weighted average period of approximately 1.9 years.
Stock Option Tax Benefit
The exercise of certain stock options granted under the Company’s stock option plans give rise to compensation, which is included in the taxable income of the applicable employees and deductible by the Company for federal and state income tax purposes. Such compensation results from increases in the fair market value of the Company’s common stock subsequent to the date of grant of the applicable exercised stock options and these increases are not recognized as an expense for financial accounting purposes, as the options were originally granted at the fair market value of the Company’s common stock on the date of grant. The related tax benefits will be recorded if and when realized, and totaled $6,000, $0 and $526,000 in fiscal 2017, fiscal 2016 and fiscal 2015. The Company has not recorded any income tax benefit from the exercise of stock options in these fiscal years, due to the uncertainty of realizing income tax benefits in the future.
Stock-Based Compensation - Restricted Stock
Compensation expense recorded in fiscal 2017, fiscal 2016 and fiscal 2015 relating to restricted stock grants was $1,973,000, $1,424,000 and $1,664,000. As of February 3, 2018, there was $1,700,000 of total unrecognized compensation cost related to non-vested restricted stock grants. That cost is expected to be recognized over a weighted average period of 1.5 years. The total fair value of restricted stock vested during fiscal 2017, fiscal 2016 and fiscal 2015 was $409,000, $761,000 and $378,000.
During the fourth quarters of fiscal 2017, fiscal 2016 and fiscal 2015, the Company granted a total of 20,000, 10,000 and 37,000 shares of time-based restricted stock units to certain key employees as part of the Company's long-term incentive program. The restricted stock vests in three equal annual installments beginning one year from the grant date. The aggregate market value of the restricted stock at the date of grant was $28,000, $21,000 and $86,360 for the fourth quarters of fiscal 2017, fiscal 2016 and fiscal 2015. The grants are being amortized as compensation expense over the three-year vesting period. During the fourth quarter
61
EVINE Live INC. AND SUBSIDIARIES
NOTES TO CONSOLIDATED FINANCIAL STATEMENTS - (Continued)
of fiscal 2016, the Company also granted a total of 20,045 shares of restricted stock units to a new board member as part of the Company's annual director compensation program. The restricted stock vested on June 13, 2017, the day immediately preceding the Company's 2017 annual meeting of shareholders. The aggregate market value of the restricted stock at the date of grant was $40,000 and was amortized as director compensation expense over the vesting period.
During the third quarters of fiscal 2017, fiscal 2016 and fiscal 2015, the Company granted a total of 3,000, 34,563 and 32,000 shares of time-based restricted stock units to certain key employees as part of the Company's long-term incentive program. The restricted stock vests in three equal annual installments beginning one year from the grant date. The aggregate market value of the restricted stock at the date of grant was $3,000, $57,000 and $80,640 for the third quarters of fiscal 2017, fiscal 2016 and fiscal 2015. The awards are being amortized as compensation expense over the three-year vesting period. During the third quarter of fiscal 2016, the Company also granted a total of 28,119 shares of restricted stock units to a board member as part of the Company's annual director compensation program. The restricted stock vested on June 13, 2017, the day immediately preceding the Company's 2017 annual meeting of shareholders. The aggregate market value of the restricted stock at the date of grant was $51,000 and was amortized as director compensation expense over the vesting period.
During the third quarter of fiscal 2016, Robert Rosenblatt was appointed as permanent Chief Executive Officer and entered into an executive employment agreement. In conjunction with the employment agreement, the Company granted to Mr. Rosenblatt 231,799 shares of market-based restricted stock performance units as part of the Company's long-term incentive program. The number of restricted stock units earned is based on the Company's total shareholder return ("TSR") relative to a group of industry peers over a three-year performance measurement period. The total grant date fair value was estimated to be $422,000, or $1.82 per share and is being amortized over the three-year performance period. Grant date fair values were determined using a Monte Carlo valuation model based on assumptions, which included a weighted average risk-free interest rate of 0.76%, a weighted average expected life of three years and an implied volatility of 77%. The percent of the target market-based performance vested restricted stock unit award that will be earned based on the Company's TSR relative to the peer group is as follows:
Percentile Rank | Percentage of Units Vested | |
< 33% | 0% | |
33% | 50% | |
50% | 100% | |
100% | 150% | |
On August 18, 2016 the Company granted an additional 625,000 shares of restricted stock in conjunction with Mr. Rosenblatt's employment agreement. The restricted stock vests in three tranches. Tranche 1 (one-third of the shares subject to the award) vested on the date of grant. Tranche 2 (one-third) will vest on the date the Company's average closing stock price for 20 consecutive trading days equals or exceeds $4.00 per share and the executive has been continuously employed at least one year. Tranche 3 (one-third) will vest on the date the Company's average closing stock price for 20 consecutive trading days equals or exceeds $6.00 per share and the executive has been continuously employed at least two years. The vesting of the second and third tranches can occur any time on or before the tenth anniversary of the grant date. The total grant date fair value was estimated to be $958,000 and is being amortized over the derived service periods for each tranche.
Grant date fair values and derived service periods for each tranche were determined using a Monte Carlo valuation model based on assumptions, which included a weighted average risk-free interest rate of 1.5%, a weighted average expected life of 1.2 years and an implied volatility of 86% and were as follows for each tranche:
Fair Value (Per Share) | Derived Service Period | |||
Tranche 1 (immediate) | $1.60 | 0 Years | ||
Tranche 2 ($4.00/share) | $1.52 | 1.46 Years | ||
Tranche 3 ($6.00/share) | $1.48 | 2.22 Years | ||
During the second quarters of fiscal 2017, fiscal 2016 and fiscal 2015, the Company granted a total of 472,720, 167,142 and 182,334 shares of restricted stock units to non-employee directors as part of the Company's annual director compensation program. Each restricted stock grant vests or vested on the day immediately preceding the next annual meeting of shareholders following the date of grant. The aggregate market value of the restricted stock at the date of grant was $520,000, $292,000 and $520,000 for the second quarters of fiscal 2017, fiscal 2016 and fiscal 2015. The grants are amortized as director compensation expense over the twelve-month vesting period. During the second quarters of fiscal 2017, fiscal 2016 and fiscal 2015, the Company also granted a total of 318,360, 60,916 and 26,810 shares of time-based restricted stock units to certain key employees as part of the Company's long-term incentive program. The restricted stock vests in three equal annual installments beginning one year from the grant date. The aggregate market value of the restricted stock at the date of grant was $395,000, $78,000 and $158,000 for the
62
EVINE Live INC. AND SUBSIDIARIES
NOTES TO CONSOLIDATED FINANCIAL STATEMENTS - (Continued)
second quarters of fiscal 2017, fiscal 2016 and fiscal 2015. The grants are being amortized as compensation expense over the three-year vesting period.
During the first quarters of fiscal 2017, fiscal 2016 and fiscal 2015, the Company granted a total of 317,219, 188,991 and 67,786 shares of time-based restricted stock units to certain key employees as part of the Company's long-term incentive program. The restricted stock vests in three equal annual installments beginning one year from the grant date. The aggregate market value of the restricted stock at the date of grant was $422,000, $187,000 and $417,593 for the first quarters of fiscal 2017, fiscal 2016 and fiscal 2015. The grants are being amortized as compensation expense over the three-year vesting period. During the first quarter of fiscal 2017, the Company also granted a total of 327,738 shares of time-based restricted stock units to employees as part of the Company's annual merit process. The restricted stock vests one year after the date of the grant on April 24, 2018. The aggregate market value of the restricted stock at the date of grant was $446,000 and is being amortized as compensation expense over the one-year vesting period.
During the first quarter of fiscal 2017, the Company also granted a total of 7,096 shares of restricted stock units to a newly appointed board member as part of the Company's annual director compensation program. The restricted stock vested on June 13, 2017, the day immediately preceding the Company's 2017 annual meeting of shareholders. The aggregate market value of the restricted stock at the date of grant was $9,000 and was amortized as director compensation expense over the vesting period.
During the first quarters of fiscal 2017, fiscal 2016 and fiscal 2015, the Company granted a total of 561,981, 179,156 and 106,963 shares of market-based restricted stock performance units to certain executives as part of the Company's long-term incentive program. The number of restricted stock units earned is based on the Company's total shareholder return ("TSR") relative to a group of industry peers over a three-year performance measurement period. Grant date fair values were determined using a Monte Carlo valuation model based on assumptions as follows:
Fiscal 2017 | Fiscal 2016 | Fiscal 2015 | |||||||||||
Total grant date fair value | $860,000 | $224,000 | $777,000 | ||||||||||
Total grant date fair value per share | $1.53 | $0.98 | - | $1.72 | $7.26 | ||||||||
Expected volatility | 75% | 71 | % | - | 73% | 54 | % | - | 55% | ||||
Weighted average expected life (in years) | 3 years | 3 years | 3 years | ||||||||||
Risk-free interest rate | 1.5% | 0.9 | % | - | 1.0% | 0.9% | |||||||
The percent of the target market-based performance vested restricted stock unit award that will be earned based on the Company's TSR relative to the peer group is as follows:
Percentile Rank | Percentage of Units Vested | |
< 33% | 0% | |
33% | 50% | |
50% | 100% | |
100% | 150% | |
A summary of the status of the Company’s non-vested restricted stock activity as of February 3, 2018 and changes during the twelve-month period then ended is as follows:
Shares | Weighted Average Grant Date Fair Value | ||||
Non-vested outstanding, January 28, 2017 | 1,620,000 | $2.00 | |||
Granted | 2,028,000 | $1.32 | |||
Vested | (352,000 | ) | $1.95 | ||
Forfeited | (467,000 | ) | $2.72 | ||
Non-vested outstanding, February 3, 2018 | 2,829,000 | $1.40 | |||
63
EVINE Live INC. AND SUBSIDIARIES
NOTES TO CONSOLIDATED FINANCIAL STATEMENTS - (Continued)
(10) Business Segments and Sales by Product Group
The Company has one reporting segment, which encompasses its interactive digital commerce retailing. The Company markets, sells and distributes its products to consumers primarily through its video commerce television, online website, evine.com and mobile platforms. The Company's television shopping, online and mobile platforms have similar economic characteristics with respect to products, product sourcing, vendors, marketing and promotions, gross margins, customers, and methods of distribution. In addition, the Company believes that its television shopping program is a key driver of traffic to both the evine.com website and mobile applications whereby many of the online sales originate from customers viewing the Company's television program and then placing their orders online or through mobile devices. All of the Company's sales are made to customers residing in the United States. The chief operating decision maker is the Chief Executive Officer of the Company.
Information on net sales by significant product groups are as follows (in thousands):
For the Years Ended | |||||||||||||
February 3, 2018 | January 28, 2017 | January 30, 2016 | |||||||||||
Jewelry & Watches | $ | 230,376 | $ | 245,202 | $ | 248,951 | |||||||
Home & Consumer Electronics | 155,619 | 151,313 | 193,931 | ||||||||||
Beauty | 92,979 | 94,451 | 87,184 | ||||||||||
Fashion & Accessories | 108,409 | 109,615 | 105,616 | ||||||||||
All other (primarily shipping & handling revenue) | 60,837 | 65,632 | 57,630 | ||||||||||
Total | $ | 648,220 | $ | 666,213 | $ | 693,312 | |||||||
(11) Business Acquisition
On December 16, 2016, Evine entered into an asset purchase agreement and acquired substantially all the assets and select liabilities of Princeton Enterprises, LTD (dba Princeton Watches, "Princeton"), an online retail enterprise engaged in the sale of watches, clocks and related accessories. The acquisition of Princeton will help expand on the Company's strong watch and clock offerings as well as broaden the Company's online distribution channels.
The acquisition has been accounted for under the purchase method of accounting, and accordingly, the purchase price has been allocated to the identifiable assets and liabilities assumed pursuant to the asset purchase agreement based on fair values at the acquisition date. The operating results of Princeton have been included in the consolidated financial statements of the Company since December 16, 2016, the date of acquisition. The supplementary proforma information, assuming this acquisition occurred as of the beginning of the prior period, and the operations of Princeton for the period from the December 16, 2016 acquisition date through the end of fiscal 2016 were immaterial.
The terms of the asset purchase agreement included an upfront cash payment of $508,000, a working capital holdback of $67,000 together with earn-out payments. The earn-out payments are scheduled to be paid in two annual installments based on Princeton's EBITDA for each of two years after the closing date.
The following table summarizes the fair value of consideration transferred as of the acquisition date:
Cash consideration | $ | 575,000 | ||
Fair value of contingent consideration | 600,000 | |||
$ | 1,175,000 | |||
The following table summarizes our allocation of the Princeton purchase consideration:
Inventories | $ | 1,171,000 | ||
Identifiable intangible assets acquired: | ||||
Existing customer list | 347,000 | |||
Trade Names | 336,000 | |||
Accounts payable | (796,000 | ) | ||
All other net tangible assets and liabilities | 117,000 | |||
$ | 1,175,000 | |||
64
EVINE Live INC. AND SUBSIDIARIES
NOTES TO CONSOLIDATED FINANCIAL STATEMENTS - (Continued)
The fair value of identifiable intangible assets were determined using an income-based approach, which includes market participant expectations of cash flows that an asset will generate over the remaining useful life discounted to present value using an appropriate rate of return.
The Company incurred $22,000 of acquisition-related costs and are included in general and administrative expense in the accompanying fiscal 2016 consolidated statement of operations.
(12) Income Taxes
The Company records deferred taxes for differences between the financial reporting and income tax bases of assets and liabilities, computed in accordance with tax laws in effect at that time. The deferred taxes related to such differences as of February 3, 2018 and January 28, 2017 were as follows (in thousands):
February 3, 2018 | January 28, 2017 | |||||||
Accruals and reserves not currently deductible for tax purposes | $ | 4,220 | $ | 6,632 | ||||
Inventory capitalization | 1,354 | 2,207 | ||||||
Differences in depreciation lives and methods | (475 | ) | 1,151 | |||||
Differences in basis of intangible assets | 23 | (3,522 | ) | |||||
Differences in investments and other items | 629 | 447 | ||||||
Net operating loss carryforwards | 80,880 | 125,279 | ||||||
Valuation allowance | (86,631 | ) | (135,716 | ) | ||||
Net deferred tax liability | $ | — | $ | (3,522 | ) | |||
The income tax benefit (provision) consisted of the following (in thousands):
For the Years Ended | ||||||||||||
February 3, 2018 | January 28, 2017 | January 30, 2016 | ||||||||||
Current | $ | (60 | ) | $ | (13 | ) | $ | (46 | ) | |||
Deferred | 3,505 | (788 | ) | (788 | ) | |||||||
$ | 3,445 | $ | (801 | ) | $ | (834 | ) | |||||
A reconciliation of the statutory tax rates to the Company’s effective tax rate is as follows:
For the Years Ended | |||||||||
February 3, 2018 | January 28, 2017 | January 30, 2016 | |||||||
Taxes at federal statutory rates | 33.8 | % | 35.0 | % | 35.0 | % | |||
State income taxes, net of federal tax benefit | 40.4 | 11.9 | (0.6 | ) | |||||
Reestablishment of state net operating losses | — | — | 6.0 | ||||||
Provision to return true-up | (41.6 | ) | 18.1 | — | |||||
Non-cash stock option vesting expense | (12.2 | ) | (2.3 | ) | (1.9 | ) | |||
FCC license deferred tax liability impact on valuation allowance | 100.4 | (9.4 | ) | (6.5 | ) | ||||
Impact of Tax Act on deferred tax valuation | (1,382.3 | ) | — | — | |||||
Valuation allowance and NOL carryforward benefits | 1,365.3 | (60.9 | ) | (44.2 | ) | ||||
Other | 0.5 | (2.5 | ) | 4.9 | |||||
Effective tax rate | 104.3 | % | (10.1 | )% | (7.3 | )% | |||
Based on the Company’s recent history of losses, the Company has recorded a full valuation allowance for its net deferred tax assets as of February 3, 2018 and January 28, 2017 in accordance with GAAP, which places primary importance on the Company’s most recent operating results when assessing the need for a valuation allowance. The ultimate realization of these deferred tax assets depends on the ability of the Company to generate sufficient taxable income in the future, as well as the timing of such income. The Company intends to maintain a full valuation allowance for its net deferred tax assets until sufficient positive
65
EVINE Live INC. AND SUBSIDIARIES
NOTES TO CONSOLIDATED FINANCIAL STATEMENTS - (Continued)
evidence exists to support reversal of the allowance. As of February 3, 2018, the Company has federal net operating loss carryforwards (NOLs) of approximately $321 million and state NOLs of approximately $260 million which are available to offset future taxable income. The Company's federal NOLs expire in varying amounts each year from 2023 through 2037 in accordance with applicable federal tax regulations and the timing of when the NOLs were incurred.
In the first quarter of fiscal 2011, the Company had a change in ownership (as defined in Section 382 of the Internal Revenue Code) as a result of the issuance of common stock coupled with the redemption of all the Series B preferred stock held by GE Equity. Sections 382 and 383 limit the annual utilization of certain tax attributes, including NOL carryforwards, incurred prior to a change in ownership. Currently, the limitations imposed by Sections 382 and 383 are not expected to impair the Company's ability to fully realize its NOLs; however, the annual usage of NOLs incurred prior to the change in ownership is limited. In addition, if the Company were to experience another ownership change, as defined by Sections 382 and 383, its ability to utilize its NOLs could be further substantially limited and depending on the severity of the annual NOL limitation, the Company could permanently lose its ability to use a significant amount of its accumulated NOLs.
For the year ended February 3, 2018, the income tax benefit included a non-cash tax charge of approximately $643,000 relating to changes in the Company's long-term deferred tax liability related to the tax amortization of the Company's indefinite-lived intangible FCC license asset that is not available to offset existing deferred tax assets in determining changes to the Company's income tax valuation allowance. The income tax benefit also included a net, non-cash benefit of approximately $4,147,000 generated by the reversal of the Company’s long-term deferred tax liability relating to the Company's FCC license asset. This deferred tax reversal was the result of the payments received during fiscal 2017 in connection with the sale of the Company's television broadcast station, WWDP(TV), discussed further in Note 4 - "Intangible Assets". The Company recognized a tax gain in conjunction with this transaction which will be largely offset with the Company’s available NOLs.
For the years ended January 28, 2017 and January 30, 2016, the income tax provision included a non-cash tax charge of approximately $788,000, for each fiscal year, relating to changes in the Company's long-term deferred tax liability related to the tax amortization of the Company's indefinite-lived intangible FCC license asset that is not available to offset existing deferred tax assets in determining changes to the Company's income tax valuation allowance.
As of February 3, 2018 and January 28, 2017, there were no unrecognized tax benefits for uncertain tax positions. Accordingly, a tabular reconciliation from beginning to ending periods is not provided. Further, to date, there have been no interest or penalties charged or accrued in relation to unrecognized tax benefits. The Company will classify any future interest and penalties as a component of income tax expense if incurred. The Company does not anticipate that the amount of unrecognized tax benefits will change significantly in the next twelve months.
The Company is subject to U.S. federal income taxation and the taxing authorities of various states. The Company’s tax years for 2014, 2015, and 2016 are currently subject to examination by taxing authorities. With limited exceptions, the Company is no longer subject to U.S. federal, state, or local examinations by tax authorities for years before 2014.
On December 22, 2017, the Tax Cuts and Jobs Act (the "Tax Act") was enacted. The Tax Act significantly revised U.S. corporate tax law by, among other things, (i) reducing the corporate tax rate to 21% from 35%, (ii) a repeal of the corporate alternative minimum tax (AMT), (iii) changes to tax depreciation for first-year property, (iv) a partial limitation on the deductibility of business interest expense and (v) for losses incurred in tax years beginning after December 31, 2017 the NOL deduction is limited to 80% of taxable income with an indefinite carry forward.
The phase-in of the lower corporate tax rate has resulted in a blended rate of 33.8% for fiscal 2017, as compared to the previous 35%. The income tax effects of the Tax Act required the remeasurement of our deferred tax assets and liabilities in accordance ASC Topic 740. The Securities and Exchange Commission ('SEC') staff issued Staff Accounting Bulletin No. 118 ('SAB 118') that allows companies to record provisional estimates of the impacts of the Tax Act during a measurement period of up to one year from the enactment which is similar to the measurement period used when accounting for business combinations. The Company has estimated the effects of the Tax Act, which have been reflected in our fiscal 2017 financial statements. The Tax Act did not have an impact on the Company's tax benefit for fiscal 2017 due to the full valuation allowance against the Company's deferred tax assets.
Shareholder Rights Plan
During the second quarter of fiscal 2015, the Company adopted a Shareholder Rights Plan to preserve the value of certain deferred tax benefits, including those generated by net operating losses. On July 10, 2015, the Company declared a dividend distribution of one purchase right (a “Right”) for each outstanding share of the Company’s common stock to shareholders of record as of the close of business on July 23, 2015 and issuable as of that date. On July 13, 2015, the Company entered into a Shareholder Rights Plan (the “Rights Plan”) with Wells Fargo Bank, N.A., a national banking association, with respect to the Rights. Except in certain circumstances set forth in the Rights Plan, each Right entitles the holder to purchase from the Company one one-
66
EVINE Live INC. AND SUBSIDIARIES
NOTES TO CONSOLIDATED FINANCIAL STATEMENTS - (Continued)
thousandth of a share of Series A Junior Participating Cumulative Preferred Stock, $0.01 par value, of the Company (“Preferred Stock” and each one one-thousandth of a share of Preferred Stock, a “Unit”) at a price of $9.00 per Unit.
The Rights initially trade together with the common stock and are not exercisable. Subject to certain exceptions specified in the Rights Plan, the Rights will separate from the common stock and become exercisable following (i) the tenth calendar day after a public announcement or filing that a person or group has become an “Acquiring Person,” which is defined as a person who has acquired, or obtained the right to acquire, beneficial ownership of 4.99% or more of the common stock then outstanding, subject to certain exceptions, or (ii) the tenth calendar day (or such later date as may be determined by the board of directors) after any person or group commences a tender or exchange offer, the consummation of which would result in a person or group becoming an Acquiring Person. If a person or group becomes an Acquiring Person, each Right will entitle its holders (other than such Acquiring Person) to purchase one Unit at a price of $9.00 per Unit. A Unit is intended to give the shareholder approximately the same dividend, voting and liquidation rights as would one share of Common Stock, and should approximate the value of one share of Common Stock. At any time after a person becomes an Acquiring Person, the board of directors may exchange all or part of the outstanding Rights (other than those held by an Acquiring Person) for shares of common stock at an exchange rate of one share of common stock (and, in certain circumstances, a Unit) for each Right. The Company will promptly give public notice of any exchange (although failure to give notice will not affect the validity of the exchange).
The Rights will expire upon certain events described in the Rights Plan, including the close of business on the date of the third annual meeting of shareholders following the last annual meeting of shareholders of the Company at which the Rights Plan was most recently approved by shareholders, unless the Rights Plan is re-approved by shareholders at that third annual meeting of shareholders. However, in no event will the Rights Plan expire later than the close of business on July 13, 2025. The Rights Plan was approved by the Company’s shareholders at the 2016 annual meeting of shareholders.
Until the close of business on the tenth calendar day after the day a public announcement or a filing is made indicating that a person or group has become an Acquiring Person, the Company may in its sole and absolute discretion amend the Rights or the Rights Plan agreement without the approval of any holders of the Rights or shares of common stock in any manner, including without limitation, amendments that increase or decrease the purchase price or redemption price or accelerate or extend the final expiration date or the period in which the Rights may be redeemed. The Company may also amend the Rights Plan after the close of business on the tenth calendar day after the day such public announcement or filing is made to cure ambiguities, to correct defective or inconsistent provisions, to shorten or lengthen time periods under the Rights Plan or in any other manner that does not adversely affect the interests of holders of the Rights. No amendment of the Rights Plan may extend its expiration date.
In connection with the issuance, administration and monitoring of the Plan, the Company incurred $446,000 of professional fees, included within general and administrative expense, during fiscal 2015.
(13) Commitments and Contingencies
Cable and Satellite Distribution Agreements
As of February 3, 2018, the Company has entered into distribution agreements with cable operators, direct-to-home satellite providers, telecommunications companies and broadcast television stations to distribute our television network over their systems. The terms of the distribution agreements typically range from one to five years. During the fiscal year, certain agreements with cable, satellite or other distributors may expire. Under certain circumstances, the television operators or the Company may cancel the agreements prior to their expiration. Additionally, the Company may elect not to renew distribution agreements whose terms result in sub-standard or negative contribution margins. The distribution agreements generally provide that the Company will pay each operator a monthly access fee and in some cases a marketing support payment based on the number of homes receiving the Company's programming. For fiscal 2017, fiscal 2016 and fiscal 2015 the Company expensed approximately $91,270,000, $98,317,000 and $100,830,000 under these distribution agreements.
Over the past years, each of the material cable and satellite distribution agreements up for renewal have been renegotiated and renewed. Failure to maintain the cable agreements covering a material portion of the Company’s existing cable households on acceptable financial and other terms could adversely affect future growth, revenues and earnings unless the Company is able to arrange for alternative means of broadly distributing its television programming. Cable operators serving a large majority of cable households offer cable programming on a digital basis. The use of digital compression technology provides cable companies with greater channel capacity. While greater channel capacity increases the opportunity for distribution and, in some cases, reduces access fees paid by us, it also may adversely impact the Company's ability to compete for television viewers to the extent it results in less desirable channel positioning for us, placement of the Company's programming in separate programming tiers, the broadcast of additional competitive channels or viewer fragmentation due to a greater number of programming alternatives.
The Company has entered into, and will continue to enter into, distribution agreements with other television operators providing for full- or part-time carriage of the Company’s television shopping programming.
67
EVINE Live INC. AND SUBSIDIARIES
NOTES TO CONSOLIDATED FINANCIAL STATEMENTS - (Continued)
Future cable and satellite distribution cash commitments at February 3, 2018 are as follows:
Fiscal Year | Amount | ||
2018 | $ | 64,758,000 | |
2019 | 39,774,000 | ||
2020 | 37,741,000 | ||
2021 | 1,363,000 | ||
2022 and thereafter | — | ||
Employment Agreements
The Company has entered into employment agreements with some of its on-air hosts with original terms of 12 months with automatic annual one-year renewals and with the chief executive officer of the Company with an original term of 24 months followed by automatic one-year renewals. These agreements specify, among other things, the term and duties of employment, compensation and benefits, termination of employment (including for cause, which would reduce the Company’s total obligation under these agreements), severance payments and non-disclosure and non-compete restrictions. The aggregate commitment for future base compensation related to these agreements at February 3, 2018 was approximately $2,271,000.
On August 18, 2016, the Company entered into an executive employment agreement with Mr. Rosenblatt, the Company's Chief Executive Officer. Among other things, the employment agreement provides for a two-year initial term, followed by automatic one-year renewals, an initial base salary of $750,000, annual bonus stipulations, a temporary living expense allowance and participation in the Company's executive relocation program. In conjunction with the employment agreement, the Company granted Mr. Rosenblatt an award of restricted stock units, performance restricted stock units and incentive stock options under the Company's 2011 Omnibus Incentive Plan with an aggregate fair value of $1.8 million. The chief executive officer’s employment agreement also provides for severance in the event of employment termination of (i) 1.5 times the amount of his base salary, plus (ii) one times his target bonus. In the event of a change of control, as defined in the agreement, the severance shall be two times his base salary and two times his target bonus.
The Company has established guidelines regarding severance for its senior executive officers. If a senior executive officer's employment terminates for reasons other than change of control, whereby, up to 15 months of the executive's highest annual rate of base salary for those serving as Executive Vice President and up to 12 months of the executive's highest annual rate of base salary for those serving as Senior Vice President may become payable. If an Executive Vice President's employment terminates within a one-year period commencing on the date of a change in control or within six months preceding the date of a change in control, up to 18 months of the executive's highest annual rate of base salary, plus 1.5 times the target annual incentive bonus determined from such base salary may become payable. If a Senior Vice President's employment terminates within a one-year period commencing on the date of a change in control or within six months preceding the date of a change in control, up to 15 months of the executive's highest annual rate of base salary, plus 1.25 times the target annual incentive bonus determined from such base salary may become payable.
Operating Lease Commitments
The Company leases certain property and equipment under non-cancelable operating lease agreements. Property and equipment covered by such operating lease agreements include offices at subsidiary locations, satellite transponder and office equipment.
Future minimum lease payments at February 3, 2018 are as follows:
Future Minimum Lease Payments: | Amount | ||
2018 | $ | 1,159,000 | |
2019 | 893,000 | ||
2020 | 559,000 | ||
2021 | — | ||
2022 and thereafter | — | ||
Total rent expense under such agreements was approximately $1,408,000 in fiscal 2017, $1,898,000 in fiscal 2016 and $1,853,000 in fiscal 2015.
68
EVINE Live INC. AND SUBSIDIARIES
NOTES TO CONSOLIDATED FINANCIAL STATEMENTS - (Continued)
Retirement Savings Plan
The Company maintains a qualified 401(k) retirement savings plan covering substantially all employees. The plan allows the Company’s employees to make voluntary contributions to the plan. Beginning in fiscal 2016, matching contributions were contributed to the plan on a per pay period basis. In fiscal 2015, matching contributions were contributed annually to the plan in February of the following fiscal year. The Company currently provides a contribution match of $0.50 for every $1.00 contributed by eligible participants up to a maximum of 6% of eligible compensation. Company plan contributions expense totaled approximately $1,268,000, $1,321,000 and $1,156,000 for fiscal 2017, fiscal 2016 and fiscal 2015, of which $0, $0 and $1,156,000 were accrued and outstanding at February 3, 2018, January 28, 2017 and January 30, 2016.
(14) Litigation
The Company is involved from time to time in various claims and lawsuits in the ordinary course of business, including claims related to products, product warranties, employment, intellectual property and consumer protection matters. In the opinion of management, none of the claims and suits, either individually or in the aggregate will have a material adverse effect on the Company's operations or consolidated financial statements.
(15) Supplemental Cash Flow Information
Supplemental cash flow information and noncash investing and financing activities were as follows:
For the Years Ended | ||||||||||||
February 3, 2018 | January 28, 2017 | January 30, 2016 | ||||||||||
Supplemental Cash Flow Information: | ||||||||||||
Interest paid | $ | 4,818,000 | $ | 5,061,000 | $ | 2,353,000 | ||||||
Income taxes paid | $ | 36,000 | $ | 51,000 | $ | 33,000 | ||||||
Supplemental non-cash investing and financing activities: | ||||||||||||
Property and equipment purchases included in accounts payable | $ | 213,000 | $ | 1,060,000 | $ | 138,000 | ||||||
Common stock issuance costs included in accrued liabilities | $ | — | $ | 115,000 | $ | — | ||||||
Deferred financing costs included in accrued liabilities | $ | — | $ | 14,000 | $ | — | ||||||
(16) Distribution Facility Expansion, Consolidation & Technology Upgrade
During fiscal 2014, the Company began a significant operational expansion initiative with respect to overall warehousing capacity and new equipment and system technology upgrades at the Company's Bowling Green, Kentucky distribution facility. During fiscal 2015, the Company expanded its 262,000 square foot facility to an approximately 600,000 square foot facility and moved out of the Company's leased satellite warehouse space. The updated facilities and technology upgrade includes a new high-speed parcel shipping and item sortation system coupled with a new warehouse management system to support the Company's increased level of shipments and a new call center facility to better serve our customers. The new sortation and warehouse management system were phased into production through fiscal 2016. Total cost of the physical building expansion, new sortation equipment and call center facility was approximately $25 million and was financed with our expanded PNC revolving line of credit and a $15 million PNC term loan.
As a result of the Company's distribution facility expansion, consolidation and technology upgrade initiative, the Company incurred approximately $0, $677,000 and $1,347,000 in incremental expenses during fiscal 2017, fiscal 2016 and fiscal 2015. In fiscal 2016, the expenses related primarily to increased labor and training costs associated with the Company's warehouse management system migration. For fiscal 2015, the expenses related primarily to increased labor, inventory and other warehousing transportation costs, training costs and increased equipment rental costs associated with: the move into the new expanded warehouse building, the move out of previously leased warehouse space and the preparation of our expanded facility for the new high-speed parcel shipping and item sortation system and upgraded warehouse management system.
69
EVINE Live INC. AND SUBSIDIARIES
NOTES TO CONSOLIDATED FINANCIAL STATEMENTS - (Continued)
(17) Executive and Management Transition Costs
On March 23, 2017, the Company announced the elimination of the position of Senior Vice President of Sales & Product Planning. In conjunction with this executive change as well as other executive and management terminations made during fiscal 2017, the Company recorded charges to income totaling $2,145,000, which relate primarily to severance payments made as a result of the executive officer and other management terminations and other direct costs associated with the Company's 2017 executive and management transition.
On February 8, 2016, the Company announced the resignation and departure of Mark Bozek, its Chief Executive Officer, and of its Executive Vice President - Chief Strategy Officer & Interim General Counsel. On August 18, 2016, the Company announced that Robert Rosenblatt, was appointed permanent Chief Executive Officer, effective immediately and entered into an executive employment agreement with Mr. Rosenblatt. Among other things, the employment agreement provides for a two-year initial term, followed by automatic one-year renewals, an initial base salary of $750,000, annual bonus stipulations, a temporary living expense allowance and participation in the Company's executive relocation program. In conjunction with the employment agreement, the Company granted Mr. Rosenblatt an award of restricted stock units, performance restricted stock units and incentive stock options under the Company's 2011 Omnibus Incentive Plan with an aggregate fair value of $1.8 million. The chief executive officer’s employment agreement also provides for severance in the event of employment termination of (i) 1.5 times the amount of his base salary, plus (ii) one times his target bonus. In the event of a change of control, as defined in the agreement, the severance shall be two times his base salary and two times his target bonus.
In conjunction with these executive changes as well as other executive and management terminations made during fiscal 2016, the Company recorded charges to income totaling $4,411,000, which relate primarily to severance payments to be made as a result of the executive officer terminations and other direct costs associated with the Company's 2016 executive and management transition.
On March 26, 2015, the Company announced the termination and departure of three executive officers, namely its Chief Financial Officer, its Senior Vice President and General Counsel, and President. In addition, during the first quarter of fiscal 2015, the Company also announced the hiring of a new Chief Financial Officer and a new Chief Merchandising Officer. In conjunction with these executive changes as well as other management terminations made during fiscal 2015, the Company recorded charges to income of $3,549,000, which relate primarily to severance payments made as a result of the executive officer terminations and other direct costs associated with the Company's 2015 executive and management transition.
(18) Related Party Transactions
Relationship with GE Equity, Comcast and NBCU
Until April 29, 2016, the Company was a party to an amended and restated shareholder agreement, dated February 25, 2009 (the “GE/NBCU Shareholder Agreement”), with GE Equity and NBCU, which provided for certain corporate governance and standstill matters. The Company has a significant cable distribution agreement with Comcast, of which NBCU is an indirect subsidiary, and believes that the terms of the agreement are comparable to those with other cable system operators. During the third quarter of fiscal 2016, the Company received a $500,000 cash payment from a wholly owned subsidiary of NBCU for the right to use a specified channel in the Boston, Massachusetts' designated market area.
In an SEC filing made on August 18, 2015, GE Equity disclosed that on August 14, 2015, GE Equity and ASF Radio, L.P. (“ASF Radio”), who was an independent third party to Evine as of that time, entered into a Stock Purchase Agreement pursuant to which GE Equity agreed to sell 3,545,049 shares of the Company’s common stock, which was all of the shares GE Equity had then owned, to ASF Radio for $2.15 per share. According to the SEC filing, ASF Radio is an affiliate of Ardian, an independent private equity investment company. The closing of this sale (the “GE/ASF Radio Sale”) occurred on April 29, 2016. In connection with the GE/ASF Radio Sale, the GE/NBCU Shareholder Agreement was terminated and the Company entered into a new Shareholder Agreement (the “NBCU Shareholder Agreement”) with NBCU described below.
Stock Purchase from NBCU
On January 31, 2017, the Company purchased from NBCU 4,400,000 shares of the Company's common stock, representing approximately 6.7% of shares then outstanding, for approximately $5 million or $1.12 per share, pursuant to a Repurchase Letter Agreement between the Company and NBCU. Following the Company's share purchase, NBCU's direct equity ownership of the Company consisted of 2,741,849 shares of common stock, or 4.5% of the Company's outstanding common stock. As of February 3, 2018, the Company believes that NBCU sold its remaining shares of the Company's common stock. The NBCU Shareholder Agreement was terminated pursuant to the Repurchase Letter Agreement.
70
EVINE Live INC. AND SUBSIDIARIES
NOTES TO CONSOLIDATED FINANCIAL STATEMENTS - (Continued)
NBCU Shareholder Agreement
The Company was a party to the NBCU Shareholder Agreement until it was terminated pursuant to the Repurchase Letter Agreement on January 31, 2017. The NBCU Shareholder Agreement replaced the GE/NBCU Shareholder Agreement. The NBCU Shareholder Agreement provided that as long as NBCU or its affiliates beneficially own at least 5% of the Company's outstanding common stock, NBCU was entitled to designate one individual to be nominated to the Company’s Board of Directors. In addition, the NBCU Shareholder Agreement provided that NBCU was able to designate its director designee to be an observer of the audit, human resources and compensation, and corporate governance and nominating committees of the Company's Board of Directors. In addition, the NBCU Shareholder Agreement required the Company to obtain the consent of NBCU prior to the Company's adoption or amendment of any shareholder’s rights plan or certain other actions that would impede or restrict the ability of NBCU to acquire the Company's voting stock or the Company taking any action that would result in NBCU being deemed to be in violation of the Federal Communications Commission multiple ownership regulations.
The NBCU Shareholder Agreement also provided that unless NBCU beneficially owned less than 5% or more than 90% of the adjusted outstanding shares of common stock, NBCU could not sell, transfer or otherwise dispose of any securities of the Company subject to limited exceptions for (i) transfers to affiliates, (ii) third party tender offers, (iii) mergers, consolidations and reorganizations and (iv) transfers pursuant to underwritten public offerings or transfers exempt from registration under the Securities Act (provided, in the case of (iv), such transfers would not result in the transferee acquiring beneficial ownership in excess of 20%).
Registration Rights Agreement
On February 25, 2009, the Company entered into an amended and restated registration rights agreement that, as further amended, provided GE Equity, NBCU and their affiliates and any transferees and assigns, an aggregate of five demand registrations and unlimited piggy-back registration rights. In connection with the GE/ASF Radio Sale, an amendment to the Amended and Restated Registration Rights Agreement was entered into removing GE Equity as a party and adding ASF Radio as a party.
2015 Letter Agreement with GE Equity
On July 9, 2015, the Company entered into a letter agreement with GE Equity (the “GE Letter Agreement”) pursuant to which GE Equity consented to the Company's adoption of a Shareholder Rights Plan in consideration for the Company's agreement to provide GE Equity, NBCU and certain of their respective affiliates with exemptions from the Shareholder Rights Plan. GE Equity’s consent was required pursuant to the terms of the GE/NBCU Shareholder Agreement. This discussion is a summary of the terms of the letter agreement. In the GE Letter Agreement, the Company agreed that if any of GE Equity, NBCU or any of their respective affiliates that holds shares of the Company's common stock from time to time (each a “Grandfathered Investor”) sells or otherwise transfers shares of the Company's common stock currently owned by such Grandfathered Investor to any third party identified to us in writing (any such third party, an “Exempt Purchaser”), the Company will take all actions necessary under the Shareholder Rights Plan so that such third party will not be deemed an Acquiring Person (as defined in the Shareholder Rights Plan) by virtue of the acquisition of such shares. The Company further agreed that, subject to certain limitations, upon request of any Grandfathered Investor or Exempt Purchaser, and in connection with a transfer by such Grandfathered Investor or Exempt Purchaser of shares of the Company's common stock to an Exempt Purchaser, the Company will enter into an agreement with the acquiring Exempt Purchaser granting such acquiring Exempt Purchaser substantially the same rights as set forth above with respect to any sale of the Company's outstanding shares of common stock to any other third party. Additionally, the Company agreed that without the consent of any Grandfathered Investor that is an affiliate of GE Equity and any Grandfathered Investor that is an affiliate of NBCU, the Company will not (i) amend the Shareholder Rights Plan in any material respect, other than to accelerate the Expiration Date (as defined in the Shareholder Rights Plan) or the Final Expiration Date (as defined in the Shareholder Rights Plan), (ii) adopt another shareholders' rights plan or (iii) amend the letter agreement.
Director Relationships
The Company entered into a service agreement with Newgistics, Inc. ("Newgistics") in fiscal 2004. Newgistics provides offsite customer returns consolidation and delivery services to the Company. The Company's Chief Executive Officer, Robert Rosenblatt, was a member of Newgistics Board of Directors until October 2017, when Newgistics was acquired by a third party. The Company made payments to Newgistics totaling approximately $4,474,000, $4,910,000 and $4,517,000 during fiscal 2017, fiscal 2016 and fiscal 2015.
One of the Company's directors, Thomas Beers, has a minority interest in one of the Company's on air food suppliers. The Company made inventory payments to this supplier totaling approximately $1,156,000, $1,866,000 and $3,467,000 during fiscal 2017, fiscal 2016 and fiscal 2015.
71
EVINE Live INC. AND SUBSIDIARIES
NOTES TO CONSOLIDATED FINANCIAL STATEMENTS - (Continued)
(19) Quarterly Results (Unaudited)
The following summarized unaudited results of operations for the quarters in fiscal 2017 and fiscal 2016 have been prepared on the same basis as the annual financial statements and reflect normal recurring adjustments that we consider necessary for a fair presentation of results of operations for the periods presented. Our results of operations have varied and may continue to fluctuate significantly from quarter to quarter due to seasonality and the timing of operating expenses. Results of operations in any period should not be considered indicative of the results to be expected for any future period.
First Quarter | Second Quarter | Third Quarter | Fourth Quarter (a) | Total | ||||||||||||||||
(In thousands, except percentages and per share amounts) | ||||||||||||||||||||
Fiscal 2017 | ||||||||||||||||||||
Net sales | $ | 156,343 | $ | 148,949 | $ | 150,212 | $ | 192,716 | $ | 648,220 | ||||||||||
Gross profit | 56,286 | 56,480 | 57,294 | 65,052 | 235,112 | |||||||||||||||
Gross profit margin | 36.0 | % | 37.9 | % | 38.1 | % | 33.8 | % | 36.3 | % | ||||||||||
Operating expenses | 56,867 | 56,951 | 57,648 | 60,424 | 231,890 | |||||||||||||||
Operating income (loss) (b) | (581 | ) | (471 | ) | (354 | ) | 4,628 | 3,222 | ||||||||||||
Other expense, net | (2,406 | ) | (1,311 | ) | (1,373 | ) | (1,434 | ) | (6,524 | ) | ||||||||||
Income tax (provision) benefit | (209 | ) | (209 | ) | 624 | 3,239 | 3,445 | |||||||||||||
Net income (loss) (b) | $ | (3,196 | ) | $ | (1,991 | ) | $ | (1,103 | ) | $ | 6,433 | $ | 143 | |||||||
Net income (loss) per share | $ | (0.05 | ) | $ | (0.03 | ) | $ | (0.02 | ) | $ | 0.10 | $ | 0.00 | |||||||
Net income (loss) per share — assuming dilution | $ | (0.05 | ) | $ | (0.03 | ) | $ | (0.02 | ) | $ | 0.10 | $ | 0.00 | |||||||
Weighted average shares outstanding: | ||||||||||||||||||||
Basic | 60,919 | 64,091 | 65,191 | 65,279 | 63,870 | |||||||||||||||
Diluted | 60,919 | 64,091 | 65,191 | 65,672 | 63,968 | |||||||||||||||
Fiscal 2016 | ||||||||||||||||||||
Net sales | $ | 166,920 | $ | 157,139 | $ | 151,636 | $ | 190,518 | $ | 666,213 | ||||||||||
Gross profit | 61,448 | 59,828 | 55,431 | 64,820 | 241,527 | |||||||||||||||
Gross profit margin | 36.8 | % | 38.1 | % | 36.6 | % | 34.0 | % | 36.3 | % | ||||||||||
Operating expenses | 64,982 | 60,002 | 57,510 | 61,051 | 243,545 | |||||||||||||||
Operating income (loss) (c) | (3,534 | ) | (174 | ) | (2,079 | ) | 3,769 | (2,018 | ) | |||||||||||
Other expense, net | (1,203 | ) | (1,604 | ) | (1,583 | ) | (1,536 | ) | (5,926 | ) | ||||||||||
Income tax provision | (205 | ) | (205 | ) | (205 | ) | (186 | ) | (801 | ) | ||||||||||
Net income (loss) (c) | $ | (4,942 | ) | $ | (1,983 | ) | $ | (3,867 | ) | $ | 2,047 | $ | (8,745 | ) | ||||||
Net income (loss) per share | $ | (0.09 | ) | $ | (0.03 | ) | $ | (0.06 | ) | $ | 0.03 | $ | (0.15 | ) | ||||||
Net income (loss) per share — assuming dilution | $ | (0.09 | ) | $ | (0.03 | ) | $ | (0.06 | ) | $ | 0.03 | $ | (0.15 | ) | ||||||
Weighted average shares outstanding: | ||||||||||||||||||||
Basic | 57,181 | 57,259 | 60,513 | 64,185 | 59,785 | |||||||||||||||
Diluted | 57,181 | 57,259 | 60,513 | 64,492 | 59,785 | |||||||||||||||
(a) | As a result of the Company's retail calendar, the fourth quarter of fiscal 2017 includes 14 weeks of operations as compared to 13 weeks in the fourth quarter of fiscal 2016. |
(b) | Net income (loss) and operating income (loss) for the first, second, third and fourth quarters of fiscal 2017 includes executive and management transition costs of $506,000, $572,000, $893,000 and $174,000. In addition, net income (loss) for the first, third and fourth quarters of fiscal 2017 includes loss on debt extinguishment of $913,000, $221,000 and $323,000. Net income for the fourth quarter of fiscal 2017 also includes a $551,000 gain on the television station sale. |
72
EVINE Live INC. AND SUBSIDIARIES
NOTES TO CONSOLIDATED FINANCIAL STATEMENTS - (Continued)
(c) Net income (loss) and operating income (loss) for the first, second, third and fourth quarters of fiscal 2016 includes distribution facility consolidation and technology upgrade costs of approximately $80,000, $300,000, $150,000 and $147,000. In addition, net loss and operating loss for the first, second and third quarters of fiscal 2016 includes executive and management transition costs of $3,601,000, $242,000 and $568,000.
Item 9. Changes in and Disagreements with Accountants on Accounting and Financial Disclosure
None
Item 9A. Controls and Procedures
Disclosure Controls and Procedures
As of February 3, 2018, management conducted an evaluation, under the supervision and with the participation of our chief executive officer and chief financial officer of the effectiveness of our disclosure controls and procedures (as defined in Rule 13a-15(e) and 15d-15(e) under the Securities Exchange Act of 1934 (the "Exchange Act")). Based on this evaluation, the chief executive officer and chief financial officer concluded that our disclosure controls and procedures are effective to ensure that information required to be disclosed by us in reports that we file or submit under the Exchange Act is recorded, processed, summarized and reported within the time periods specified in Securities and Exchange Commission's rules and forms, and to ensure that information required to be disclosed by us in the reports we file or submit under the Exchange Act is accumulated and communicated to management, including our principal executive and principal financial officers, as appropriate to allow timely decisions regarding required disclosures.
73
MANAGEMENT’S ANNUAL REPORT ON INTERNAL CONTROL OVER FINANCIAL REPORTING
The management of EVINE Live Inc. is responsible for establishing and maintaining adequate internal control over financial reporting as defined in Rules 13a-15(f) under the Securities Exchange Act 1934. Our company’s internal control system was designed to provide reasonable assurance regarding the reliability of financial reporting and the preparation of financial statements for external purposes in accordance with generally accepted accounting principles.
All internal control systems, no matter how well designed, have inherent limitations. Therefore, even those systems determined to be effective can provide only reasonable assurance with respect to financial statement preparation and presentation. Because of its inherent limitations, internal control over financial reporting may not prevent or detect misstatements. Also, projections of any evaluation of effectiveness to future periods are subject to the risk that controls may become inadequate because of changes in conditions, or that the degree of compliance with the policies or procedures may deteriorate.
Management assessed the effectiveness of our company’s internal control over financial reporting as of February 3, 2018. In making this assessment, management used the criteria set forth by the Committee of Sponsoring Organizations of the Treadway Commission in Internal Control — Integrated Framework (2013).
Based on management’s evaluation under the framework in Internal Control — Integrated Framework (2013), management concluded that our internal control over financial reporting was effective as of February 3, 2018.
Our independent registered public accounting firm, Deloitte & Touche LLP, has issued an attestation report on our company’s internal control over financial reporting as of February 3, 2018. The Deloitte & Touche LLP attestation report is set forth below.
/s/ ROBERT J. ROSENBLATT | |
Robert J. Rosenblatt | |
Chief Executive Officer | |
(Principal Executive Officer) | |
/s/ TIMOTHY A. PETERMAN | |
Timothy A. Peterman | |
Executive Vice President, Chief Operating Officer / Chief Financial Officer | |
(Principal Financial Officer) | |
April 9, 2018
Changes in Internal Controls over Financial Reporting
Management, with the participation of the chief executive officer and chief financial officer, performed an evaluation as to whether any change in the internal controls over financial reporting (as defined in Rules 13a-15 and 15d-15 under the Securities Exchange Act of 1934) occurred during the fourth fiscal quarter of 2017. Based on that evaluation, the chief executive officer and chief financial officer concluded that no change occurred in the internal controls over financial reporting during the fourth fiscal quarter of 2017 that materially affected, or is reasonably likely to materially affect, the internal controls over financial reporting.
74
REPORT OF INDEPENDENT REGISTERED PUBLIC ACCOUNTING FIRM
To the Shareholders and the Board of Directors of
EVINE Live Inc. and Subsidiaries
Eden Prairie, Minnesota
Opinion on Internal Control over Financial Reporting
We have audited the internal control over financial reporting of EVINE Live Inc. and subsidiaries (the "Company") as of February 3, 2018, based on criteria established in Internal Control - Integrated Framework (2013) issued by the Committee of Sponsoring Organizations of the Treadway Commission (COSO). In our opinion, the Company maintained, in all material respects, effective internal control over financial reporting as of February 3, 2018, based on the criteria established in Internal Control - Integrated Framework (2013) issued by COSO.
We have also audited, in accordance with the standards of the Public Company Accounting Oversight Board (United States) (PCAOB), the consolidated financial statements as of and for the year ended February 3, 2018 of the Company and our report dated April 9, 2018 expressed an unqualified opinion on those financial statements.
Basis for Opinion
The Company's management is responsible for maintaining effective internal control over financial reporting and for its assessment of the effectiveness of internal control over financial reporting, included in the accompanying Management’s Annual Report on Internal Control over Financial Reporting. Our responsibility is to express an opinion on the Company's internal control over financial reporting based on our audit. We are a public accounting firm registered with the PCAOB and are required to be independent with respect to the Company in accordance with the U.S. federal securities laws and the applicable rules and regulations of the Securities and Exchange Commission and the PCAOB.
We conducted our audit in accordance with the standards of the PCAOB. Those standards require that we plan and perform the audit to obtain reasonable assurance about whether effective internal control over financial reporting was maintained in all material respects. Our audit included obtaining an understanding of internal control over financial reporting, assessing the risk that a material weakness exists, testing and evaluating the design and operating effectiveness of internal control based on the assessed risk, and performing such other procedures as we considered necessary in the circumstances. We believe that our audit provides a reasonable basis for our opinion.
Definition and Limitations of Internal Control over Financial Reporting
A company's internal control over financial reporting is a process designed to provide reasonable assurance regarding the reliability of financial reporting and the preparation of financial statements for external purposes in accordance with generally accepted accounting principles. A company's internal control over financial reporting includes those policies and procedures that (1) pertain to the maintenance of records that, in reasonable detail, accurately and fairly reflect the transactions and dispositions of the assets of the company; (2) provide reasonable assurance that transactions are recorded as necessary to permit preparation of financial statements in accordance with generally accepted accounting principles, and that receipts and expenditures of the company are being made only in accordance with authorizations of management and directors of the company; and (3) provide reasonable assurance regarding prevention or timely detection of unauthorized acquisition, use, or disposition of the company's assets that could have a material effect on the financial statements.
Because of its inherent limitations, internal control over financial reporting may not be prevent or detect misstatements. Also, projections of any evaluation of effectiveness to future periods are subject to the risk that controls may become inadequate because of changes in conditions, or that the degree of compliance with the policies or procedures may deteriorate.
/s/ DELOITTE & TOUCHE LLP
Minneapolis, Minnesota
April 9, 2018
75
Item 9B. Other Information
None.
76
PART III
Item 10. Directors, Executive Officers and Corporate Governance
Information in response to this item with respect to certain information relating to our executive officers is contained in Item 1 under the heading "Executive Officers of the Registrant" and with respect to other information relating to our executive officers and directors and our audit and other committees is incorporated herein by reference to the sections titled "Proposal 1 — Election of Directors," "Board of Directors, Corporate Governance and Executive Officers" and "Section 16(a) Beneficial Ownership Reporting Compliance" in our definitive proxy statement to be filed pursuant to Regulation 14A within 120 days after the end of the fiscal year covered by this Form 10-K.
Code of Business Conduct and Ethics
We have adopted a code of business conduct and ethics applicable to all of our directors and employees, including our principal executive officer, principal financial officer, principal accounting officer, controller and other employees performing similar functions. A copy of this code of business conduct and ethics is available on our website at investors.evine.com, under "Governance — Governance Documents — Business Ethics Policy." In addition, we have adopted a code of ethics policy for our senior financial management; this policy is also available on our website at investors.evine.com, under "Governance — Governance Documents — Code of Ethics Policy for Chief Executive and Senior Financial Officers."
We intend to satisfy the disclosure requirements under Form 8-K regarding an amendment to, or waiver from, a provision of our code of business conduct and ethics by posting such information on our website at the address specified above.
Item 11. Executive Compensation
Information in response to this item is incorporated herein by reference to the sections titled "Director Compensation for Fiscal 2017," "Executive Compensation," "Executive Compensation - CEO Pay Ratio" and "Board of Directors, Corporate Governance and Executive Officers" in our definitive proxy statement to be filed pursuant to Regulation 14A within 120 days after the end of the fiscal year covered by this Form 10-K.
Item 12. Security Ownership of Certain Beneficial Owners and Management and Related Shareholder Matters
Information in response to this item is incorporated herein by reference to the section titled "Security Ownership of Principal Shareholders and Management" in our definitive proxy statement to be filed pursuant to Regulation 14A within 120 days after the end of the fiscal year covered by this Form 10-K.
Item 13. Certain Relationships and Related Transactions, and Director Independence
Information in response to this item is incorporated herein by reference to the sections titled "Certain Relationships and Transactions" and "Board of Directors, Corporate Governance and Executive Officers" in our definitive proxy statement to be filed pursuant to Regulation 14A within 120 days after the end of the fiscal year covered by this Form 10-K.
Item 14. Principal Accountant Fees and Services
Information in response to this item is incorporated herein by reference to the section titled "Proposal 2 — Ratification of the Independent Registered Public Accounting Firm" in our definitive proxy statement to be filed pursuant to Regulation 14A within 120 days after the end of the fiscal year covered by this Form 10-K.
77
PART IV
Item 15. Exhibits and Financial Statement Schedule
1. Financial Statements
• | Report of Independent Registered Public Accounting Firm |
• | Consolidated Balance Sheets as of February 3, 2018 and January 28, 2017 |
• | Consolidated Statements of Operations for the Years Ended February 3, 2018, January 28, 2017 and January 30, 2016 |
• | Consolidated Statements of Shareholders’ Equity for the Years Ended February 3, 2018, January 28, 2017 and January 30, 2016 |
• | Consolidated Statements of Cash Flows for the Years Ended February 3, 2018, January 28, 2017, and January 30, 2016 |
• | Notes to Consolidated Financial Statements |
2. Financial Statement Schedule
EVINE Live Inc. AND SUBSIDIARIES
SCHEDULE II VALUATION AND QUALIFYING ACCOUNTS
Column C | ||||||||||||||||
Column B | Additions | |||||||||||||||
Balances at | Charged to | Column E | ||||||||||||||
Beginning of | Costs and | Column D | Balance at | |||||||||||||
Column A | Year | Expenses | Deductions | End of Year | ||||||||||||
For the year ended February 3, 2018: | ||||||||||||||||
Allowance for doubtful accounts | $ | 6,022,000 | 9,852,000 | (9,866,000 | ) | (1) | $ | 6,008,000 | ||||||||
Reserve for returns | $ | 3,723,000 | 59,173,000 | (59,352,000 | ) | (2) | $ | 3,544,000 | ||||||||
For the year ended January 28, 2017: | ||||||||||||||||
Allowance for doubtful accounts | $ | 6,870,000 | 11,949,000 | (12,797,000 | ) | (1) | $ | 6,022,000 | ||||||||
Reserve for returns | $ | 4,726,000 | 61,935,000 | (62,938,000 | ) | (2) | $ | 3,723,000 | ||||||||
For the year ended January 30, 2016: | ||||||||||||||||
Allowance for doubtful accounts | $ | 6,706,000 | 11,795,000 | (11,631,000 | ) | (1) | $ | 6,870,000 | ||||||||
Reserve for returns | $ | 5,585,000 | 66,533,000 | (67,392,000 | ) | (2) | $ | 4,726,000 | ||||||||
_______________________________________
(1) | Write off of uncollectible receivables, net of recoveries. |
(2) | Refunds or credits on products returned. |
78
3. Exhibits
Exhibit No. | Description | Method of Filing |
3.1 | Incorporated by reference(A) | |
3.2 | Incorporated by reference(B) | |
3.3 | Incorporated by reference(C) | |
3.4 | Incorporated by reference(D) | |
4.1 | Incorporated by reference(E) | |
10.1 | Incorporated by reference(F)† | |
10.2 | Incorporated by reference(G)† | |
10.3 | Incorporated by reference(H)† | |
10.4 | Incorporated by reference(I)† | |
10.5 | Incorporated by reference(J)† | |
10.6 | Incorporated by reference(K)† | |
10.7 | Incorporated by reference(L)† | |
10.8 | Incorporated by reference(M)† | |
10.9 | Incorporated by reference(N)† | |
10.10 | Incorporated by reference(O)† | |
10.11 | Incorporated by reference(P)† | |
10.12 | Incorporated by reference(Q)† | |
10.13 | Incorporated by reference(R)† | |
10.14 | Incorporated by reference(S)† | |
10.15 | Incorporated by reference(T)† | |
10.16 | Incorporated by reference(U)† | |
10.17 | Incorporated by reference(V)† | |
10.18 | Incorporated by reference(W)† | |
10.19 | Incorporated by reference(X)† | |
10.20 | Incorporated by reference(Y)† | |
10.21 | Incorporated by reference(Z)† | |
10.22 | Incorporated by reference(AA)† | |
10.23 | Incorporated by reference(BB)† | |
10.24 | Incorporated by reference(CC)† | |
10.25 | Incorporated by reference(DD)† | |
79
Exhibit No. | Description | Method of Filing |
10.26 | Incorporated by reference(EE)† | |
10.27 | Incorporated by reference(FF)† | |
10.28 | Incorporated by reference(GG)† | |
10.29 | Incorporated by reference(HH) | |
10.30 | Incorporated by reference(II) | |
10.31 | Incorporated by reference(JJ) | |
10.32 | Incorporated by reference(KK) | |
10.33 | Incorporated by reference(LL) | |
10.34 | Incorporated by reference(MM) | |
10.35 | Incorporated by reference(NN) | |
10.36 | Incorporated by reference(OO) | |
10.37 | Incorporated by reference(PP) | |
10.38 | Incorporated by reference(QQ) | |
10.39 | Incorporated by reference(RR) | |
10.40 | Incorporated by reference(SS) | |
10.41 | Incorporated by reference(TT) | |
10.42 | Incorporated by reference(UU) | |
80
Exhibit No. | Description | Method of Filing |
10.43 | Incorporated by reference(VV) | |
10.44 | Incorporated by reference(WW) | |
10.45 | Incorporated by reference(XX) | |
10.46 | Incorporated by reference(YY) | |
10.47 | Incorporated by reference(ZZ) | |
10.48 | Incorporated by reference(AAA) | |
10.49 | Incorporated by reference(BBB) | |
10.50 | Incorporated by reference(CCC) | |
10.51 | Incorporated by reference(DDD) | |
10.52 | Incorporated by reference(EEE) | |
10.53 | Incorporated by reference(FFF)† | |
21 | Filed herewith | |
23 | Filed herewith | |
24 | Included with signature pages | |
31.1 | Filed herewith | |
31.2 | Filed herewith | |
32 | Filed herewith | |
101.INS | XBRL Instance Document | Filed herewith |
101.SCH | XBRL Taxonomy Extension Schema | Filed herewith |
101.CAL | XBRL Taxonomy Extension Calculation Linkbase | Filed herewith |
101.DEF | XBRL Taxonomy Extension Definition Linkbase | Filed herewith |
101.LAB | XBRL Taxonomy Extension Label Linkbase | Filed herewith |
101.PRE | XBRL Taxonomy Extension Presentation Linkbase | Filed herewith |
_______________________________________
† | Management compensatory plan/arrangement. |
A | Incorporated herein by reference to Exhibit 3.1 to the Registrant’s Current Report on Form 8-K dated November 17, 2014 filed on November 18, 2014, File No. 0-20243. |
B | Incorporated herein by reference to Exhibit 3.1 to the Registrant’s Current Report on Form 8-K dated June 17, 2014, filed on June 20, 2014, File No. 0-20243. |
C | Incorporated herein by reference to Exhibit 3.1 to the Registrant’s Current Report on Form 8-K dated and filed on July 7, 2016, File No. 001-37495. |
D | Incorporated herein by reference to Exhibit 3.1 to the Registrant’s Current Report on Form 8-K dated July 9, 2015, filed on July 13, 2015, File No. 0-20243. |
81
E | Incorporated herein by reference to Exhibit 4.1 to the Registrant’s Current Report on Form 8-K dated July 9, 2015, filed on July 13, 2015, File No. 0-20243. |
F | Incorporated herein by reference to Exhibit 99(a) to the Registrant’s Registration Statement on Form S-8 filed on January 25, 2002, File No. 333-81438. |
G | Incorporated herein by reference to Appendix B to the Registrant’s Proxy Statement in connection with its annual meeting of shareholders held on June 20, 2002, filed on May 23, 2002, File No. 0-20243. |
H | Incorporated herein by reference to Exhibit 10.7 to the Registrant’s Annual Report on Form 10-K for the fiscal year ended January 31, 2003 and filed on April 30, 2003, File No. 0-20243. |
I | Incorporated herein by reference to Exhibit 10.8 to the Registrant’s Annual Report on Form 10-K for the fiscal year ended January 31, 2003 and filed on April 30, 2003, File No. 0-20243. |
J | Incorporated herein by reference to Annex A to the Registrant’s Proxy Statement in connection with its annual meeting of shareholders held on June 21, 2006, filed on May 23, 2006, File No. 0-20243. |
K | Incorporated herein by reference to Exhibit 10.1 to the Registrant’s Current Report on Form 8-K dated January 14, 2005, filed on January 14, 2005, File No. 0-20243. |
L | Incorporated herein by reference to Exhibit 10.2 to the Registrant’s Current Report on Form 8-K dated January 14, 2005, filed on January 14, 2005, File No. 0-20243. |
M | Incorporated herein by reference to Exhibit 10.3 to the Registrant’s Current Report on Form 8-K dated January 14, 2005, filed on January 14, 2005, File No. 0-20243. |
N | Incorporated herein by reference to Exhibit 10.4 to the Registrant’s Current Report on Form 8-K dated January 14, 2005, filed on January 14, 2005, File No. 0-20243. |
O | Incorporated herein by reference to Exhibit 10.5 to the Registrant’s Current Report on Form 8-K dated January 14, 2005, filed on January 14, 2005, File No. 0-20243. |
P | Incorporated herein by reference to Exhibit 10 to the Registrant’s Current Report on Form 8-K dated June 21, 2006, filed on June 23, 2006, File No. 0-20243. |
Q | Incorporated herein by reference to Appendix A to the Registrant’s Proxy Statement in connection with its annual meeting of shareholders held on June 15, 2011, filed on May 5, 2011, File No. 0-20243. |
R | Incorporated herein by reference to Exhibit 10.13 to the Registrant’s Annual Report on Form 10-K for the fiscal year ended January 28, 2012 and filed on April 5, 2012, File No. 0-20243. |
S | Incorporated herein by reference to Exhibit 10.14 to the Registrant’s Annual Report on Form 10-K for the fiscal year ended January 28, 2012 and filed on April 5, 2012, File No. 0-20243. |
T | Incorporated herein by reference to Exhibit 10.2 to the Registrant’s Quarterly Report on Form 10-Q for the period ended July 30, 2016, filed on August 26, 2016, File No. 001-37495. |
U | Incorporated herein by reference to Exhibit 10.1 to the Registrant’s Quarterly Report on Form 10-Q for the period ended October 27, 2012, filed on November 29, 2012, File No. 0-20243. |
V | Incorporated herein by reference to Exhibit 10.2 to the Registrant’s Quarterly Report on Form 10-Q for the period ended May 3, 2014 and filed on June 6, 2014, File No. 0-20243. |
W | Incorporated herein by reference to Exhibit 10.1 to the Registrant’s Current Report on Form 8-K dated July 25, 2016, filed July 27, 2016, File No. 001-37495. |
X | Incorporated herein by reference to Exhibit 10.1 to the Registrant’s Current Report on Form 8-K dated September 27, 2010, filed on September 27, 2010, File No. 0-20243. |
Y | Incorporated herein by reference to Exhibit 10.24 to the Registrant’s Annual Report on Form 10-K for the fiscal year ended January 31, 2015, filed on March 26, 2015, File No. 0-20243. |
Z | Incorporated herein by reference to Exhibit 10.25 to the Registrant’s Annual Report on Form 10-K for the fiscal year ended January 31, 2015, filed on March 26, 2015, File No. 0-20243. |
AA | Incorporated herein by reference to Exhibit 4.9 to the Registration’s Registration Statement on Form S-8 filed on July 1, 2011, File No. 333-175320. |
BB | Incorporated herein by reference to Exhibit 10.36 to the Registrant’s Annual Report on Form 10-K for the fiscal year ended January 31, 2015, filed on March 26, 2015, File No. 0-20243. |
CC | Incorporated herein by reference to Exhibit 10.1 to the Registrant’s Current Report on Form 8-K dated August 18, 2016, filed August 24, 2016, File No. 001-37495. |
DD | Incorporated herein by reference to Exhibit 10.1 to the Registrant’s Form 8-K dated February 18, 2016, filed February 23, 2016, File No. 001-37495. |
EE | Incorporated herein by reference to Exhibit 10.2 to the Registrant’s Form 8-K dated February 18, 2016, filed February 23, 2016, File No. 001-37495. |
FF | Incorporated herein by reference to Exhibit 10.1 to the Registrant’s Current Report on Form 8-K dated March 26, 2015, filed March 26, 2015, File No. 0-20243. |
82
GG | Incorporated herein by reference to Exhibit 10.1 to the Registrant’s Current Report on Form 8-K dated April 15, 2015, filed April 15, 2015, File No. 0-20243. |
HH | Incorporated herein by reference to Exhibit 10.1 to the Registrant’s Current Report on Form 8-K dated April 29, filed on May 2, 2016, File No. 001-37495. |
II | Incorporated herein by reference to Exhibit 10.2 to the Registrant’s Current Report on Form 8-K dated February 25, 2009, filed on February 26, 2009, File No. 0-20243. |
JJ | Incorporated herein by reference to Exhibit 10.2 to the Registrant’s Current Report on Form 8-K dated April 29, filed on May 2, 2016; file no. 001-37495. |
KK | Incorporated herein by reference to Exhibit 10.1 to the Registrant’s Current Report on Form 8-K dated February 10, 2012, filed on February 10, 2012, File No. 0-20243. |
LL | Incorporated herein by reference to Exhibit 10.1 to the Registrant’s Current Report on Form 8-K dated May 7, 2013, filed on May 7, 2013, File No. 0-20243. |
MM | Incorporated herein by reference to Exhibit 10.1 to the Registrant’s Quarterly Report on Form 10-Q dated September 6, 2013, filed on September 6, 2013, File No. 0-20243. |
NN | Incorporated herein by reference to Exhibit 10.1 to the Registrant’s Current Report on Form 8-K dated February 5, 2014, filed on February 5, 2014, File No. 0-20243. |
OO | Incorporated herein by reference to Exhibit 10.1 to the Registrant’s Current Report on Form 8-K dated March 6, 2015, filed on March 9, 2015, File No. 0-20243. |
PP | Incorporated herein by reference to Exhibit 10.1 to the Registrant’s Current Report on Form 8-K dated October 8, 2015, filed on October 13, 2015, File No. 001-37495. |
QQ | Incorporated herein by reference to Exhibit 10.1 to the Registrant’s Current Report on Form 8-K dated March 10, 2016, filed on March 10, 2016, File No. 001-37495. |
RR | Incorporated herein by reference to Exhibit 10.3 to the Registrant’s Quarterly Report on Form 10-Q for the period ended October 29, 2016, filed on November 30, 2016, File No. 001-37495. |
SS | Incorporated herein by reference to Exhibit 10.1 to the Registrant’s Current Report on Form 8-K dated March 16, 2017, filed on March 21, 2017, File No. 001-37495. |
TT | Incorporated herein by reference to Exhibit 10.2 to the Registrant’s Current Report on Form 8-K dated March 10, 2016, filed on March 10, 2016, File No. 001-37495. |
UU | Incorporated herein by reference to Exhibit 10.4 to the Registrant’s Quarterly Report on Form 10-Q for the period ended October 29, 2016, filed on November 30, 2016, File No. 001-37495. |
VV | Incorporated herein by reference to Exhibit 10.2 to the Registrant’s Current Report on Form 8-K dated March 16, 2017, filed on March 21, 2017, File No. 001-37495. |
WW | Incorporated herein by reference to Exhibit 10.1 to the Registrant’s Current Report on Form 8-K dated July 9, 2015, filed on July 13, 2015, File No. 0-20243. |
XX | Incorporated herein by reference to Exhibit 10.1 to the Registrant’s Current Report on Form 8-K dated November 17, 2014, filed on November 18, 2014, File No. 0-20243. |
YY | Incorporated herein by reference to Exhibit 10.1 to the Registrant’s Current Report on Form 8-K dated September 14, 2016, filed on September 15, 2016, File No. 001-37495. |
ZZ | Incorporated herein by reference to Exhibit 10.1 to the Registrant’s Current Report on Form 8-K dated November 1, 2016, filed on November 4, 2016, File No. 001-37495. |
AAA | Incorporated herein by reference to Exhibit 10.1 to the Registrant’s Current Report on Form 8-K dated December 13, 2016, filed on December 16, 2016, File No. 001-37495. |
BBB | Incorporated herein by reference to Exhibit 10.3 to the Registrant’s Current Report on Form 8-K dated March 16, 2017, filed on March 21, 2017, File No. 001-37495. |
CCC | Incorporated herein by reference to Exhibit 10.1 to the Registrant’s Current Report on Form 8-K dated January 30, 2017, filed on January 31, 2017, File No. 001-37495. |
DDD | Incorporated herein by reference to Exhibit 10.1 to the Registrant’s Current Report on Form 8-K dated March 19, 2018, filed on March 20, 2018, File No. 001-37495. |
EEE | Incorporated herein by reference to Exhibit 10.1 to the Registrant’s Current Report on Form 8-K dated May 23, 2017, filed on May 25, 2017, File No. 001-37495. |
FFF | Incorporated herein by reference to Exhibit 10.1 to the Registrant’s Current Report on Form 8-K dated March 15, 2018, filed on March 15, 2018, File No. 001-37495. |
83
SIGNATURES
Pursuant to the requirements of the Securities Exchange Act of 1934 as amended, the registrant has duly caused this report to be signed on its behalf by the undersigned thereunto duly authorized on April 9, 2018.
EVINE Live Inc. (Registrant) | |
By: | /s/ ROBERT J. ROSENBLATT |
Robert J. Rosenblatt | |
Chief Executive Officer | |
84
Each of the undersigned hereby appoints Robert Rosenblatt and Timothy Peterman, and each of them (with full power to act alone), as attorneys and agents for the undersigned, with full power of substitution, for and in the name, place and stead of the undersigned, to sign and file with the Securities and Exchange Commission under the Securities Exchange Act of 1934, as amended, any and all amendments and exhibits to this annual report on Form 10-K and any and all applications, instruments, and other documents to be filed with the Securities and Exchange Commission pertaining to this annual report on Form 10-K or any amendments thereto, with full power and authority to do and perform any and all acts and things whatsoever requisite and necessary or desirable. Pursuant to the requirements of the Securities Exchange Act of 1934, as amended, this report has been signed below by the following persons on behalf of the registrant and in the capacities indicated on April 9, 2018.
Name | Title | |||
/s/ ROBERT J. ROSENBLATT | Chief Executive Officer and Director (Principal Executive Officer) | |||
Robert J. Rosenblatt | ||||
/s/ TIMOTHY A. PETERMAN | Executive Vice President, Chief Operating Officer / Chief Financial Officer (Principal Financial Officer) | |||
Timothy A. Peterman | ||||
/s/ LANDEL C. HOBBS | Chairman of the Board | |||
Landel C. Hobbs | ||||
Director | ||||
Scott R. Arnold | ||||
Director | ||||
Thomas D. Beers | ||||
/s/ NEAL S. GRABELL | Director | |||
Neal S. Grabell | ||||
/s/ MARK K. HOLDSWORTH | Director | |||
Mark K. Holdsworth | ||||
/s/ LISA A. LETIZIO | Director | |||
Lisa A. Letizio | ||||
/s/ LOWELL W. ROBINSON | Director | |||
Lowell W. Robinson | ||||
/s/ FRED R. SIEGEL | Director | |||
Fred R. Siegel | ||||
85