Attached files
| file | filename |
|---|---|
| 8-K - 8-K - OGLETHORPE POWER CORP | a18-9735_18k.htm |
4th Quarter and Year End 2017 Investor Briefing Oglethorpe Power Corporation April 9, 2018
Notice to Recipients Cautionary Note Regarding Forward Looking Statements Certain of the information contained in this presentation, including certain of the statements made by representatives of Oglethorpe Power Corporation (An Electric Membership Corporation) (“Oglethorpe”), that are not historical facts are forward-looking statements. Although Oglethorpe believes that in making these forward-looking statements its expectations are based on reasonable assumptions, Oglethorpe cautions the reader not to put undue reliance on these forward-looking statements, which are not guarantees of future performance. Forward-looking statements involve uncertainties and there are important factors, many of which are outside management’s control, which could cause actual results to differ materially from those expressed or implied by these forward-looking statements. Some of the risks, uncertainties and assumptions that may cause actual results to differ from these forward-looking statements are described under the headings “CAUTIONARY STATEMENT REGARDING FORWARD-LOOKING STATEMENTS” and “Risk Factors” in our Annual Report on Form 10-K for the fiscal year ended December 31, 2017, filed with the Securities and Exchange Commission on March 29, 2018. This electronic presentation is provided as of April 9, 2018. If you are viewing this presentation after that date, there may have been events that occurred subsequent to such date that could have a material adverse effect on the information that was presented. Oglethorpe undertakes no obligation to publicly update any forward-looking statements. 2
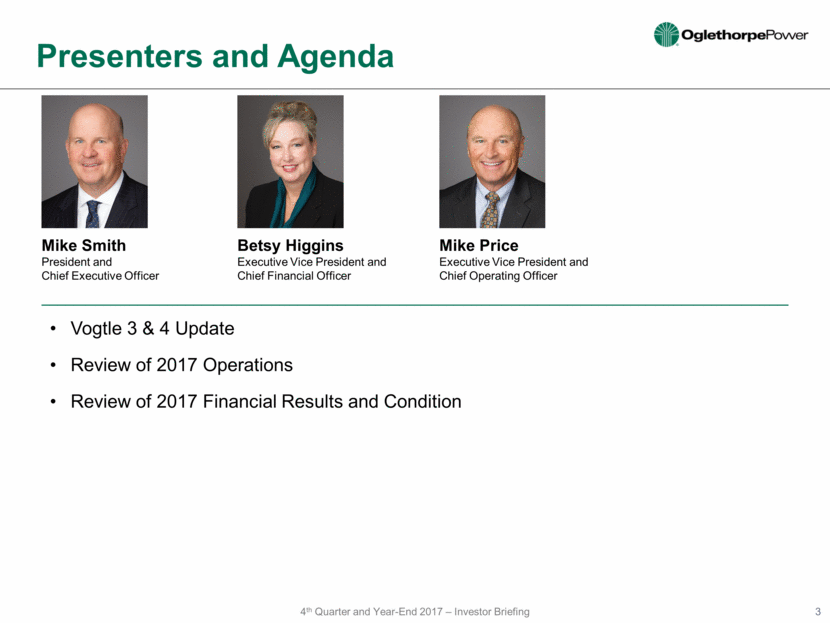
Vogtle 3 & 4 Update Review of 2017 Operations Review of 2017 Financial Results and Condition Presenters and Agenda Mike Price Executive Vice President and Chief Operating Officer Betsy Higgins Executive Vice President and Chief Financial Officer Mike Smith President and Chief Executive Officer 3
Largest electric cooperative in the United States by assets, among other measures. Generating assets total approximately 7,843 MW. Includes 728 MW of Member-owned generation managed by us. Also schedule 562 MW of federal hydropower for Members. Manage 120 MW of renewable PPAs through Green Power EMC. 30% of Vogtle 3&4 expanding generation by 660 MW in 2022. Senior Secured/ Outlook/ Short-Term Moody’s: Baa1/Stable/ P-2 S&P: A-/Negative/A-2 Fitch: A-/Stable/F2 2017 revenues of over $1.4 billion. Total assets approaching $11 billion. SEC filing company. Member-owned not-for-profit Georgia electric membership corporation. Wholesale electric provider to 38 Member distribution co-ops in Georgia. Take or pay, joint and several Wholesale Power Contracts with Members through December 2050. Allows for recovery of all costs, including debt service. Members’ peak load: 2017: 8,717 MW (August) Highest peak load: 9,354 MW, Winter 2014 Overview of Oglethorpe Power Corporation Business Power Supply Resources Ratings Financial 4
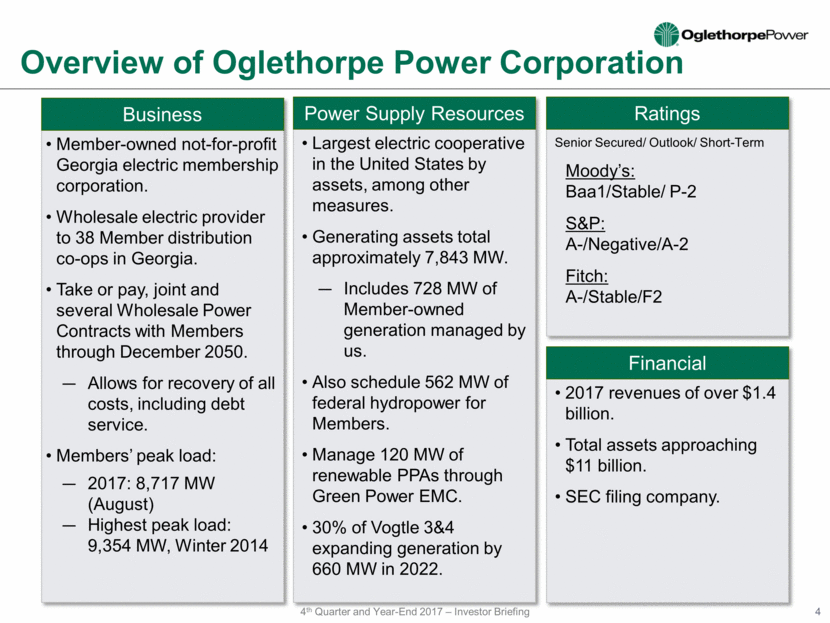
Members’ Load MWh Sales of 36.7 million in 2017. Average Residential Revenue of 11.4 cents/kWh in 2017. 65% of sales were to residential class. Serve 1.9 million meters, representing approximately 4.1 million people. Covers 38,000 square miles, or 65% of Georgia. Includes 151 out of 159 counties in Georgia. No residential competition. Exclusive right to provide retail service in designated service territories. Competition only at inception for C&I loads in excess of 900kW. Member Systems at a Glance = Oglethorpe’s Members Members’ Service Territory and Competition Member Average Financial Ratios1 TIER: 2.43x Equity/Assets: 41% Equity/Total Capitalization: 51% Members’ Aggregate Financial Metrics1 Total Annual Revenues: $4.0 billion Total Net Margins: $228 million Total Patronage Capital: $3.5 billion Total Assets: $8.4 billion 1Estimate for year ended 12/31/2017. Oglethorpe’s debt is not the direct obligation of the Members and, as a result, the capital of the Members does not directly support the principal and interest payments to be made by Oglethorpe on its outstanding indebtedness. Revenue Contribution to Oglethorpe In 2017, Jackson EMC and Cobb EMC accounted for 14.7% and 14.3% of our total revenues, respectively. No other Member over 10%. 2017 Member Customer Base by MWh Sales 5 Residential Service 65% Commercial & Industrial 31% Other 4%
Vogtle 3 & 4: Recent Positive Developments Georgia PSC decision to proceed with project in December 2017. Receipt of full Toshiba Settlement Agreement payment ($1.1 billion) ahead of schedule. Congress passed modifications to nuclear production tax credit legislation allowing Oglethorpe to access these benefits (nominal value $660 million). DOE conditional commitment for an additional $1.6 billion in guaranteed loans; when combined with our first loan of $3.1 billion exceeds $500 million in net present value benefits. Affirmation of Oglethorpe’s credit ratings and outlook for Moody’s and Fitch changed from negative to stable. 6
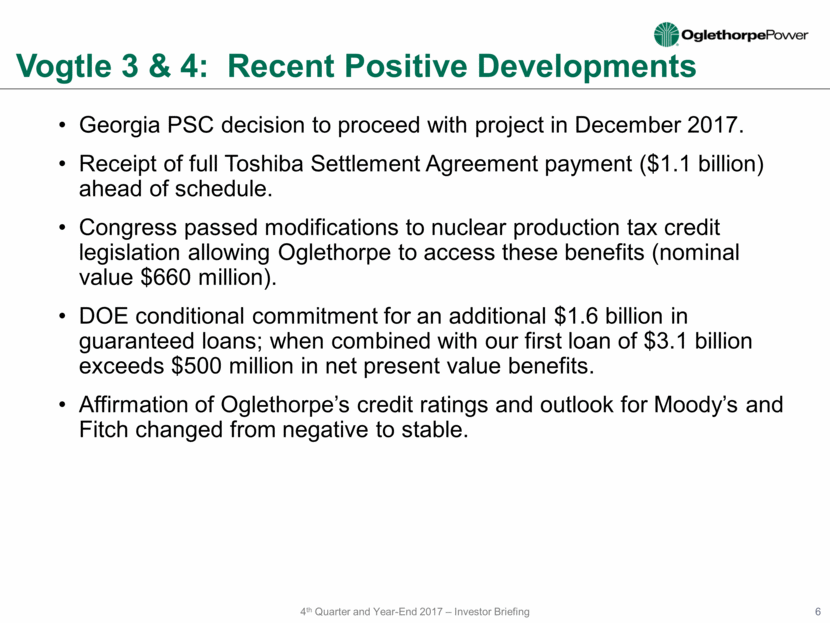
Vogtle 3 & 4: Schedule and Budget Oglethorpe Project Budget $7.0 Billion (net of $1.1 billion Toshiba payment) Includes financing costs (interest during construction) Includes contingency Projected Completion Dates: UNIT 3 Nov. 2021 UNIT 4 Nov. 2022 7
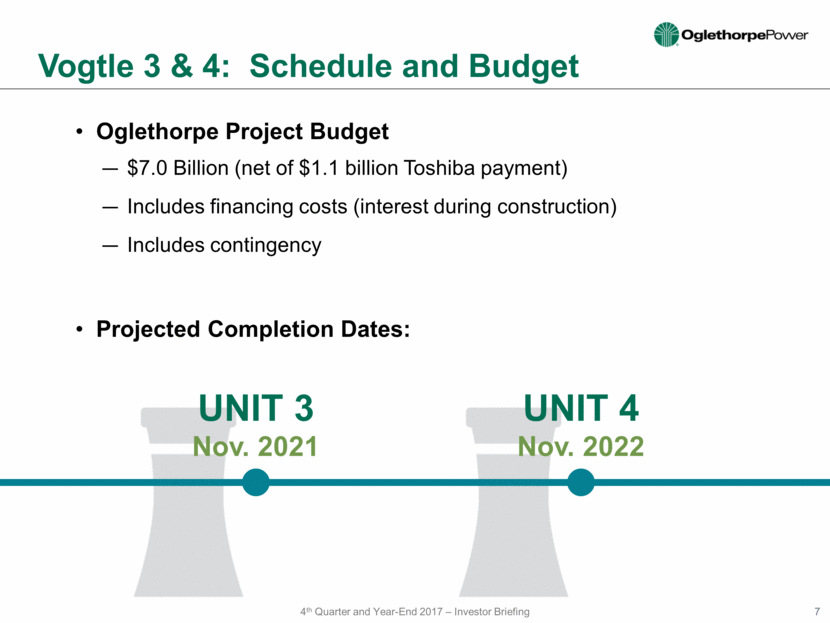
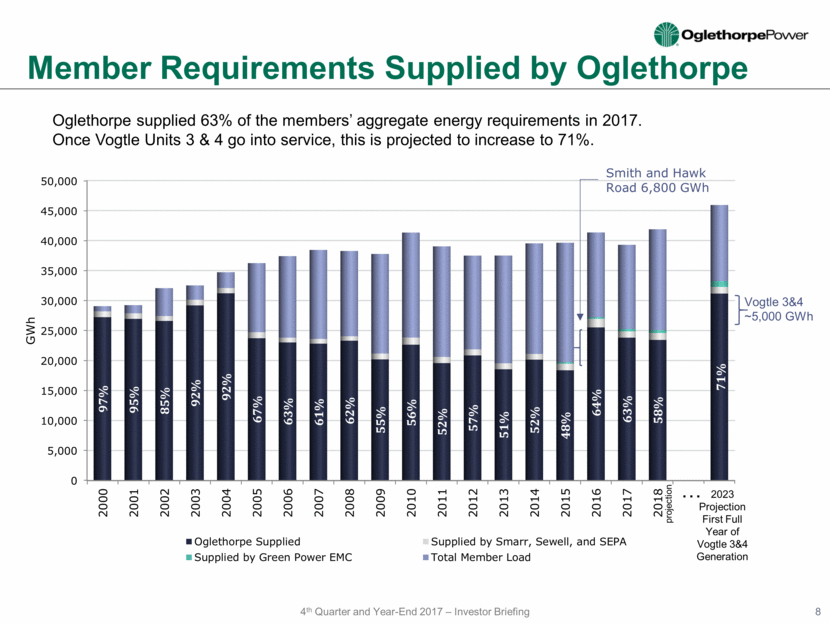
Member Requirements Supplied by Oglethorpe Oglethorpe supplied 63% of the members’ aggregate energy requirements in 2017. Once Vogtle Units 3 & 4 go into service, this is projected to increase to 71%. 2023 Projection First Full Year of Vogtle 3&4 Generation Vogtle 3&4 ~5,000 GWh Smith and Hawk Road 6,800 GWh 8 projection 0 5,000 10,000 15,000 20,000 25,000 30,000 35,000 40,000 45,000 50,000 2000 2001 2002 2003 2004 2005 2006 2007 2008 2009 2010 2011 2012 2013 2014 2015 2016 2017 2018 2023 97% 95% 85% 92% 92% 67% 63% 61% 62% 55% 56% 52% 57% 51% 52% 48% 64% 63% 58% 71% GWh Oglethorpe Supplied Supplied by Smarr, Sewell, and SEPA Supplied by Green Power EMC Total Member Load
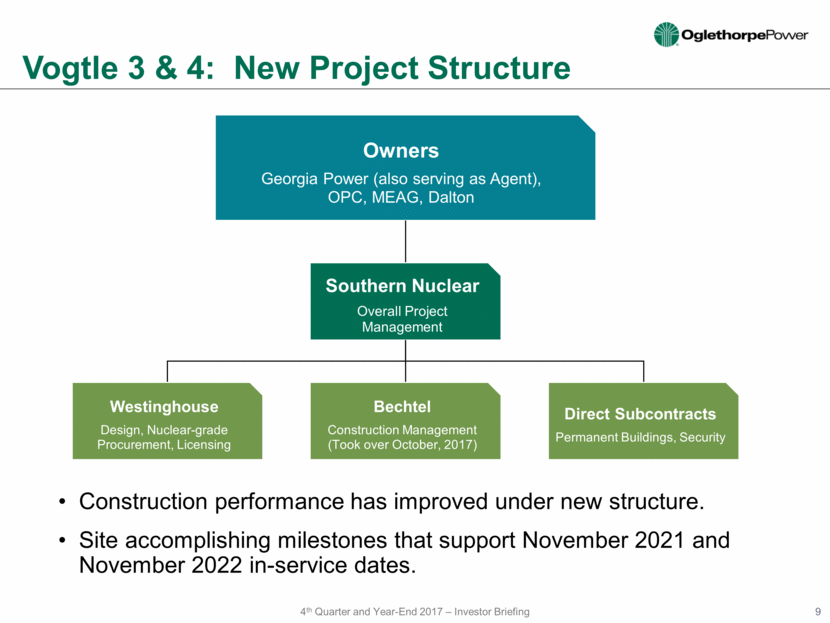
Vogtle 3 & 4: New Project Structure 9 Construction performance has improved under new structure. Site accomplishing milestones that support November 2021 and November 2022 in-service dates. Owners Georgia Power (also serving as Agent), OPC, MEAG, Dalton Southern Nuclear Overall Project Management Westinghouse Design, Nuclear-grade Procurement, Licensing Bechtel Construction Management (Took over October, 2017) Direct Subcontracts Permanent Buildings, Security
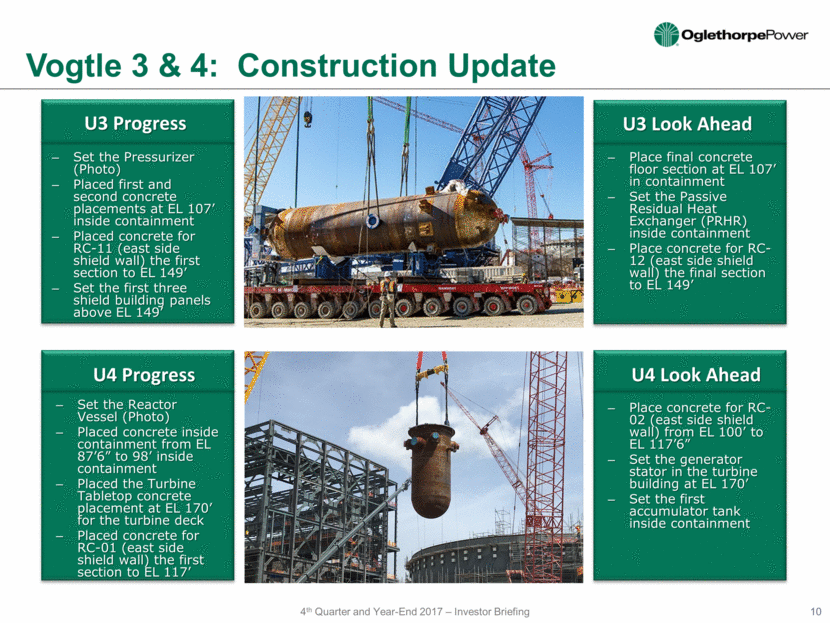
Vogtle 3 & 4: Construction Update 10 Place final concrete floor section at EL 107’ in containment Set the Passive Residual Heat Exchanger (PRHR) inside containment Place concrete for RC-12 (east side shield wall) the final section to EL 149’ Place concrete for RC-02 (east side shield wall) from EL 100’ to EL 117’6” Set the generator stator in the turbine building at EL 170’ Set the first accumulator tank inside containment Set the Pressurizer (Photo) Placed first and second concrete placements at EL 107’ inside containment Placed concrete for RC-11 (east side shield wall) the first section to EL 149’ Set the first three shield building panels above EL 149’ U3 Progress Set the Reactor Vessel (Photo) Placed concrete inside containment from EL 87’6” to 98’ inside containment Placed the Turbine Tabletop concrete placement at EL 170’ for the turbine deck Placed concrete for RC-01 (east side shield wall) the first section to EL 117’ U4 Progress U3 Look Ahead U4 Look Ahead
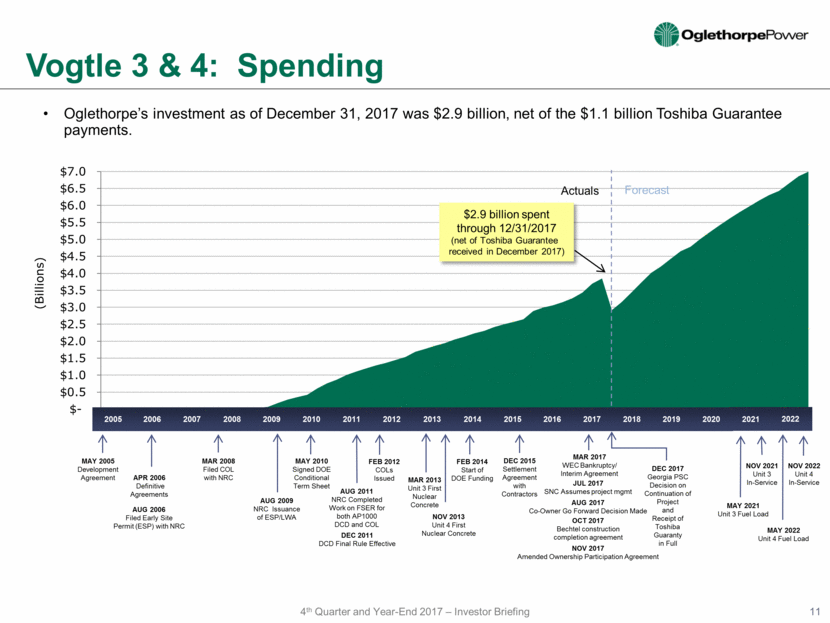
DEC 2017 Georgia PSC Decision on Continuation of Project and Receipt of Toshiba Guaranty in Full Oglethorpe’s investment as of December 31, 2017 was $2.9 billion, net of the $1.1 billion Toshiba Guarantee payments. $2.9 billion spent through 12/31/2017 (net of Toshiba Guarantee received in December 2017) Actuals Forecast DEC 2011 DCD Final Rule Effective MAY 2005 Development Agreement MAR 2008 Filed COL with NRC APR 2006 Definitive Agreements MAY 2010 Signed DOE Conditional Term Sheet AUG 2006 Filed Early Site Permit (ESP) with NRC AUG 2009 NRC Issuance of ESP/LWA AUG 2011 NRC Completed Work on FSER for both AP1000 DCD and COL FEB 2012 COLs Issued MAR 2013 Unit 3 First Nuclear Concrete FEB 2014 Start of DOE Funding NOV 2013 Unit 4 First Nuclear Concrete NOV 2022 Unit 4 In-Service DEC 2015 Settlement Agreement with Contractors MAY 2021 Unit 3 Fuel Load MAY 2022 Unit 4 Fuel Load NOV 2021 Unit 3 In-Service 2017 2016 2015 2014 2013 2012 2011 2010 2009 2018 2019 2020 2021 2022 2007 2008 2006 2005 MAR 2017 WEC Bankruptcy/ Interim Agreement JUL 2017 SNC Assumes project mgmt AUG 2017 Co-Owner Go Forward Decision Made OCT 2017 Bechtel construction completion agreement NOV 2017 Amended Ownership Participation Agreement Vogtle 3 & 4: Spending 11 $- $0.5 $1.0 $1.5 $2.0 $2.5 $3.0 $3.5 $4.0 $4.5 $5.0 $5.5 $6.0 $6.5 $7.0 (Billions)
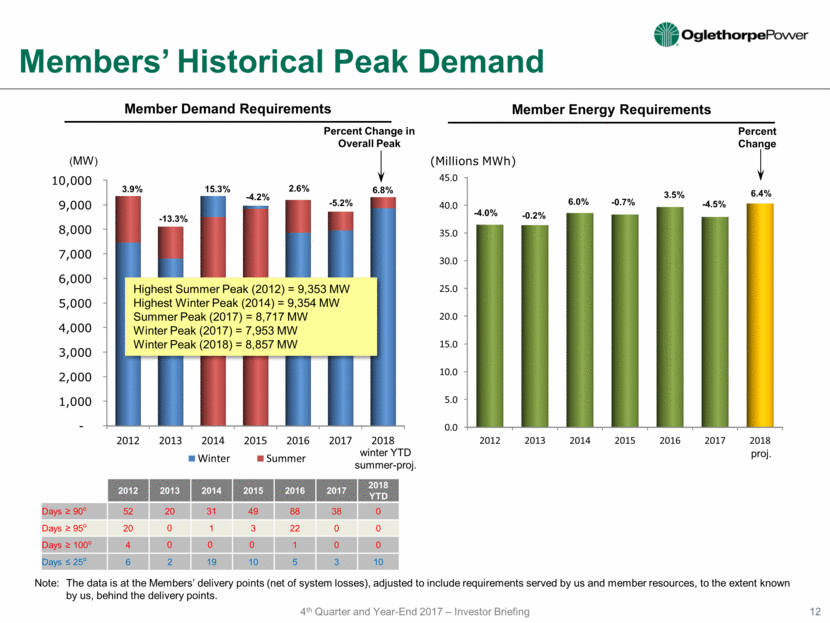
Members’ Historical Peak Demand Member Demand Requirements Member Energy Requirements Percent Change -0.2% Note: The data is at the Members’ delivery points (net of system losses), adjusted to include requirements served by us and member resources, to the extent known by us, behind the delivery points. -4.0% 6.0% -0.7% (MW) Percent Change in Overall Peak -13.3% 3.9% 15.3% -4.2% Highest Summer Peak (2012) = 9,353 MW Highest Winter Peak (2014) = 9,354 MW Summer Peak (2017) = 8,717 MW Winter Peak (2017) = 7,953 MW Winter Peak (2018) = 8,857 MW 2.6% 3.5% 2012 2013 2014 2015 2016 2017 2018 YTD Days 90o 52 20 31 49 88 38 0 Days > 95o 20 0 1 3 22 0 0 Days > 100o 4 0 0 0 1 0 0 Days < 25o 6 2 19 10 5 3 10 -5.2% -4.5% 6.4% 6.8% proj. winter YTD summer-proj. 12 - 1,000 2,000 3,000 4,000 5,000 6,000 7,000 8,000 9,000 10,000 2012 2013 2014 2015 2016 2017 2018 Winter Summer 2012 2013 2014 2015 2016 2017 2018 (Millions MWh)
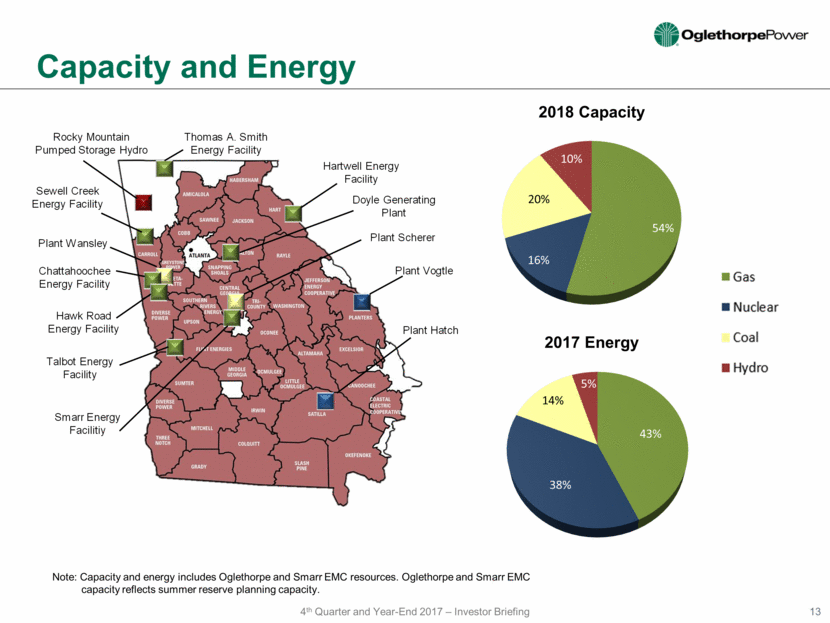
Capacity and Energy Note: Capacity and energy includes Oglethorpe and Smarr EMC resources. Oglethorpe and Smarr EMC capacity reflects summer reserve planning capacity. 2017 Energy 2018 Capacity 13 Rocky Mountain Pumped Storage Hydro Sewell Creek Energy Facility Chattahoochee Energy Facility Hawk Road Energy Facility Plant Wansley Talbot Energy Facility Hartwell Energy Facility Plant Vogtle Plant Hatch Doyle Generating Plant Smarr Energy Facilitiy Plant Scherer Thomas A. Smith Energy Facility 43% 38% 14% 5% 54% 16% 20% 10%
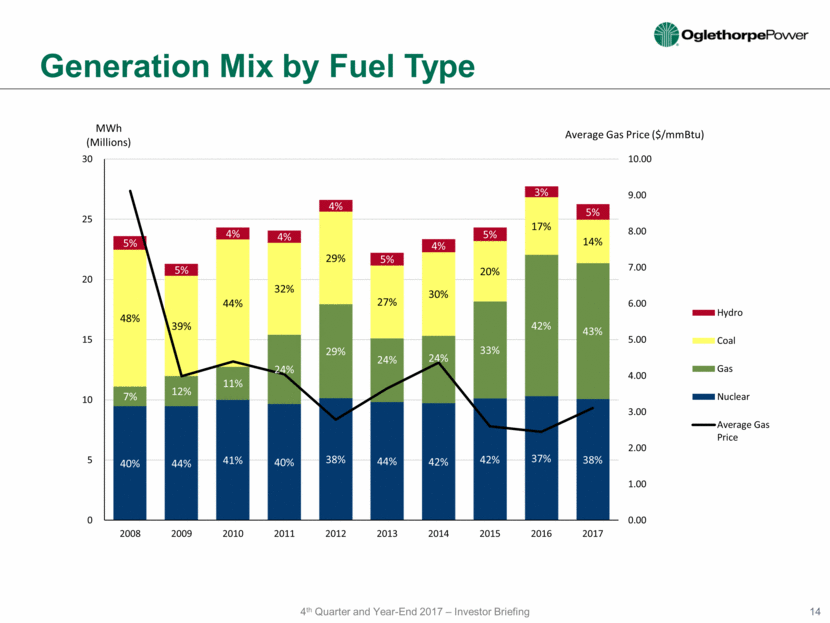
Generation Mix by Fuel Type 14
Annual Capacity Factor Comparison Nuclear Coal Gas - CC Gas - CT Pumped Storage Hydro 15 0% 25% 50% 75% 100% Hatch Vogtle Scherer Wansley Chatt Smith Doyle Hawk Road Hartwell Talbot Rocky Mountain 2016 2017
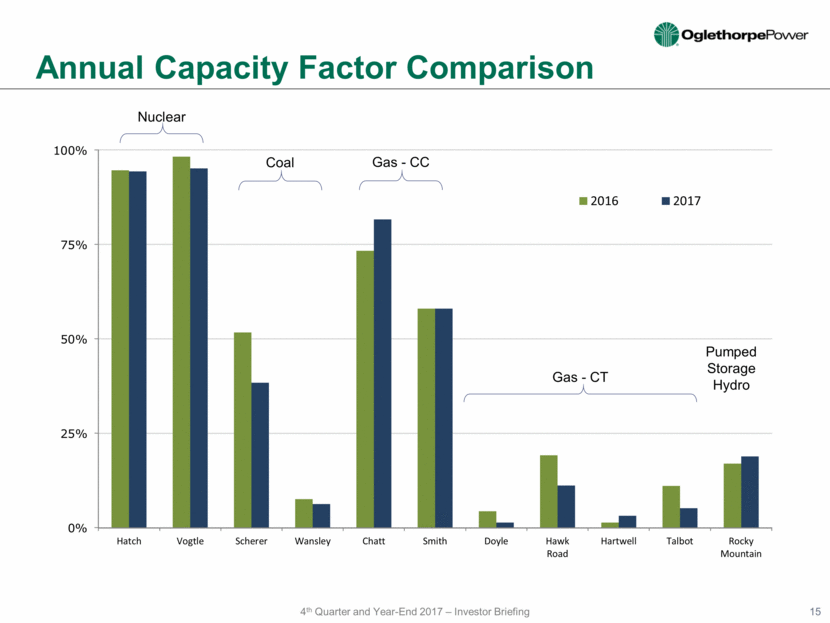
Operational Highlights Record Setting Performance for CC Gas Units T.A. Smith: 58% capacity factor Chattahoochee: 82% capacity factor 16
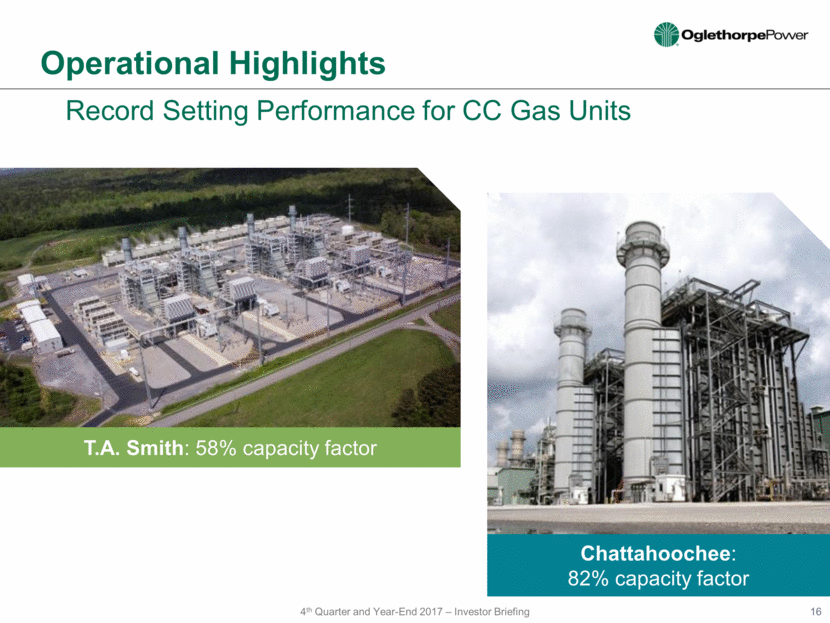
Operational Excellence Highlights Rocky Mountain Pumped Storage Hydro Generated more power than all other years since 2004 17
Operational Highlights 18 More than 70% of the OPC-operated fleet performed in the top quartile for summer availability CT starts totaled 1,814 – the second highest in OPC history 15 of the 22 CT units achieved 100% start reliability Hatch 2 and Vogtle 2 completed outages in record time
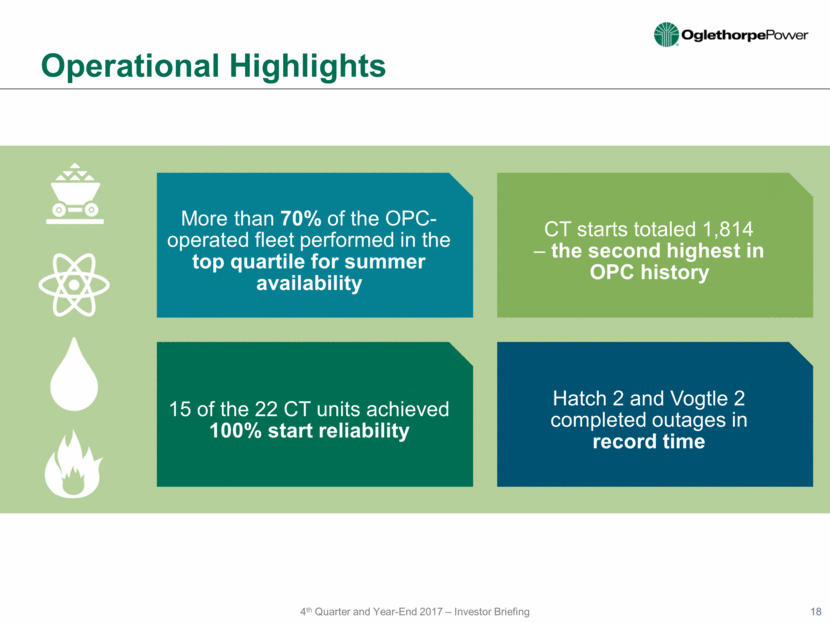
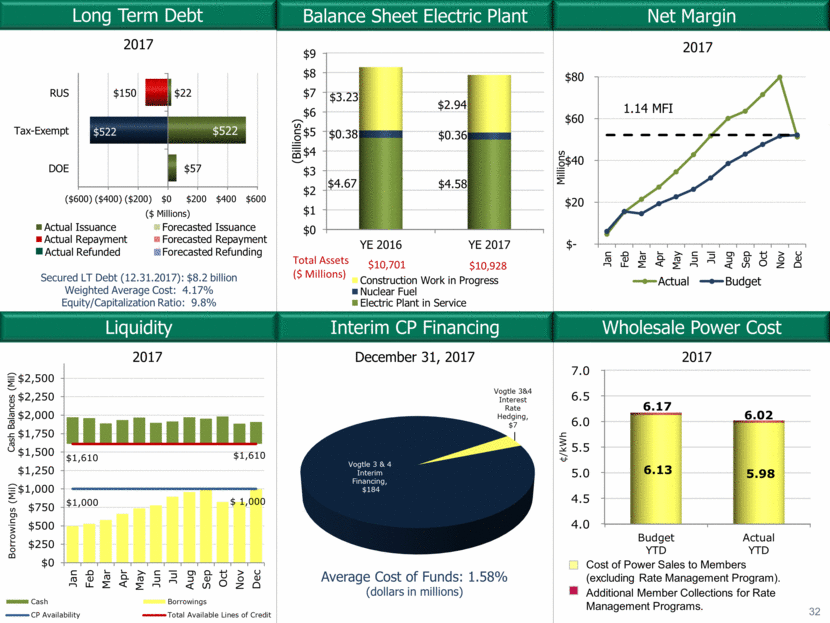
Rate Structure Assures Recovery of All Costs + Margin Formulary Rate under Wholesale Power Contract Minimum MFI ratio requirement of 1.10x under First Mortgage Indenture Expense Type Components Recovery Timeframe Variable Fuel, Variable O&M 30 – 60 days Fixed Margin, Interest, Depreciation, Fixed O&M, A&G Billed on levelized annual budget Trued up to actuals at year end Oglethorpe budgets conservatively Key Points: Cost inputs not subject to any regulatory approvals Formula changes subject to RUS & DOE approval, but are infrequent Prior period adjustment mechanism covers any year-end shortfall below the required 1.10 MFI ratio (board approval not required; to date, has never needed to be used). Margin Coverage 19 1.12 1.14 1.14 1.14 1.14 1.14 1.14 1.14 1.14 1.14 $26.4 $33.7 $37.7 $39.3 $41.5 $46.6 $48.3 $50.3 $51.3 $52.2 $0.0 $20.0 $40.0 $60.0 1.05 1.10 1.15 1.20 2009 2010 2011 2012 2013 2014 2015 2016 2017 2018 Net Margin (MM) MFI Coverage
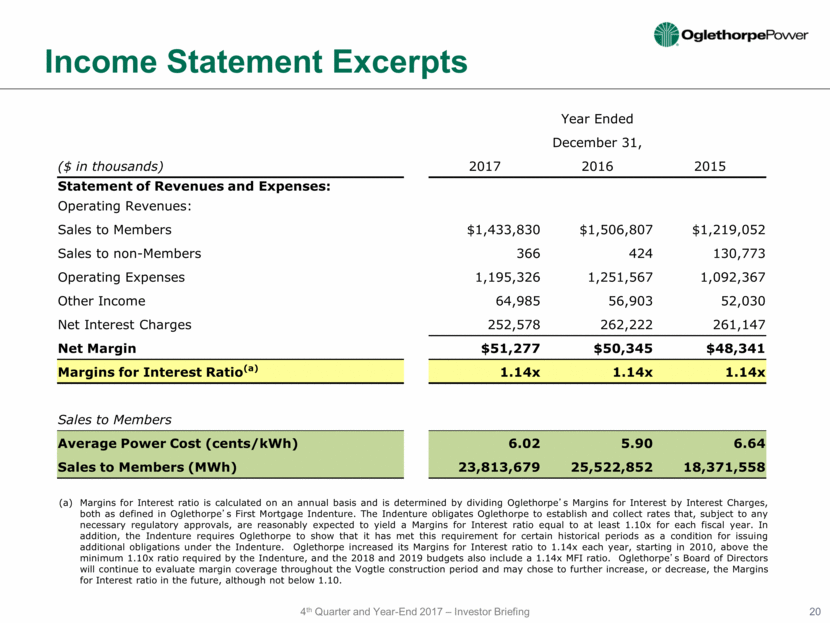
Income Statement Excerpts Margins for Interest ratio is calculated on an annual basis and is determined by dividing Oglethorpe’s Margins for Interest by Interest Charges, both as defined in Oglethorpe’s First Mortgage Indenture. The Indenture obligates Oglethorpe to establish and collect rates that, subject to any necessary regulatory approvals, are reasonably expected to yield a Margins for Interest ratio equal to at least 1.10x for each fiscal year. In addition, the Indenture requires Oglethorpe to show that it has met this requirement for certain historical periods as a condition for issuing additional obligations under the Indenture. Oglethorpe increased its Margins for Interest ratio to 1.14x each year, starting in 2010, above the minimum 1.10x ratio required by the Indenture, and the 2018 and 2019 budgets also include a 1.14x MFI ratio. Oglethorpe’s Board of Directors will continue to evaluate margin coverage throughout the Vogtle construction period and may chose to further increase, or decrease, the Margins for Interest ratio in the future, although not below 1.10. Year Ended December 31, ($ in thousands) 2017 2016 2015 Statement of Revenues and Expenses: Operating Revenues: Sales to Members $1,433,830 $1,506,807 $1,219,052 Sales to non-Members 366 424 130,773 Operating Expenses 1,195,326 1,251,567 1,092,367 Other Income 64,985 56,903 52,030 Net Interest Charges 252,578 262,222 261,147 Net Margin $51,277 $50,345 $48,341 Margins for Interest Ratio(a) 1.14x 1.14x 1.14x Sales to Members Average Power Cost (cents/kWh) 6.02 5.90 6.64 Sales to Members (MWh) 23,813,679 25,522,852 18,371,558 20
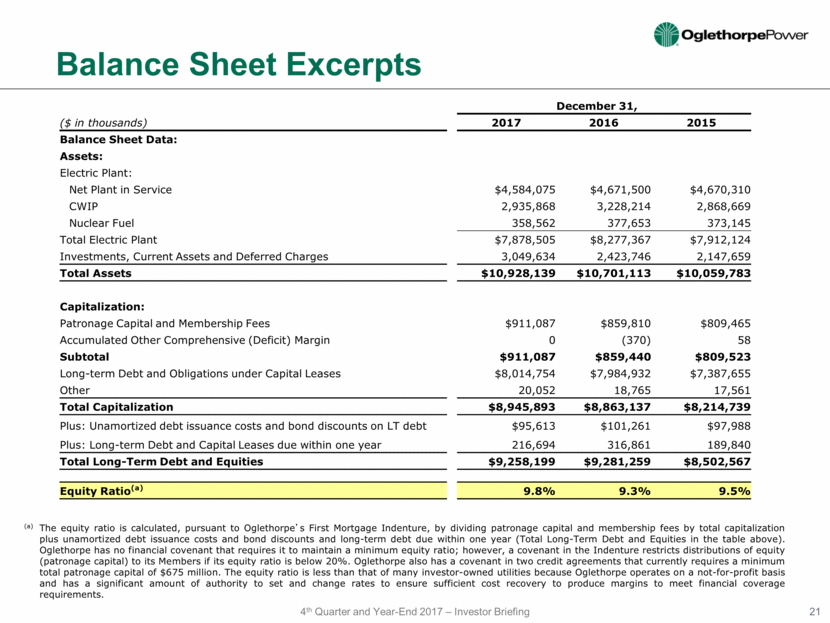
Balance Sheet Excerpts (a) The equity ratio is calculated, pursuant to Oglethorpe’s First Mortgage Indenture, by dividing patronage capital and membership fees by total capitalization plus unamortized debt issuance costs and bond discounts and long-term debt due within one year (Total Long-Term Debt and Equities in the table above). Oglethorpe has no financial covenant that requires it to maintain a minimum equity ratio; however, a covenant in the Indenture restricts distributions of equity (patronage capital) to its Members if its equity ratio is below 20%. Oglethorpe also has a covenant in two credit agreements that currently requires a minimum total patronage capital of $675 million. The equity ratio is less than that of many investor-owned utilities because Oglethorpe operates on a not-for-profit basis and has a significant amount of authority to set and change rates to ensure sufficient cost recovery to produce margins to meet financial coverage requirements. 21 December 31, ($ in thousands) 2017 2016 2015 Balance Sheet Data: Assets: Electric Plant: Net Plant in Service $4,584,075 $4,671,500 $4,670,310 CWIP 2,935,868 3,228,214 2,868,669 Nuclear Fuel 358,562 377,653 373,145 Total Electric Plant $7,878,505 $8,277,367 $7,912,124 Investments, Current Assets and Deferred Charges 3,049,634 2,423,746 2,147,659 Total Assets $10,928,139 $10,701,113 $10,059,783 Capitalization: Patronage Capital and Membership Fees $911,087 $859,810 $809,465 Accumulated Other Comprehensive (Deficit) Margin 0 (370) 58 Subtotal $911,087 $859,440 $809,523 Long-term Debt and Obligations under Capital Leases $8,014,754 $7,984,932 $7,387,655 Other 20,052 18,765 17,561 Total Capitalization $8,945,893 $8,863,137 $8,214,739 Plus: Unamortized debt issuance costs and bond discounts on LT debt $95,613 $101,261 $97,988 Plus: Long-term Debt and Capital Leases due within one year 216,694 316,861 189,840 Total Long-Term Debt and Equities $9,258,199 $9,281,259 $8,502,567 Equity Ratio(a) 9.8% 9.3% 9.5%
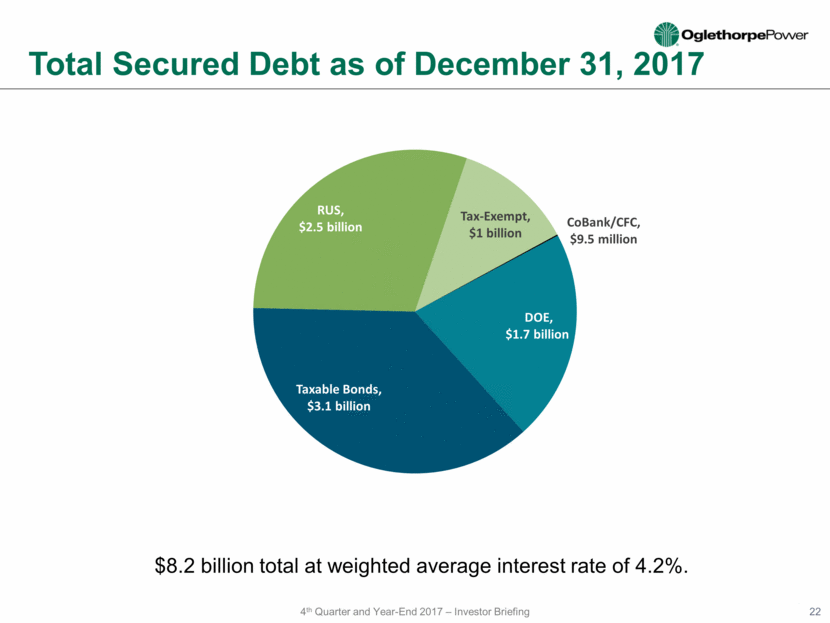
Total Secured Debt as of December 31, 2017 $8.2 billion total at weighted average interest rate of 4.2%. 22 DOE, $1.7 billion Taxable Bonds, $3.1 billion RUS, $2.5 billion Tax - Exempt, $1 billion CoBank/CFC, $9.5 million
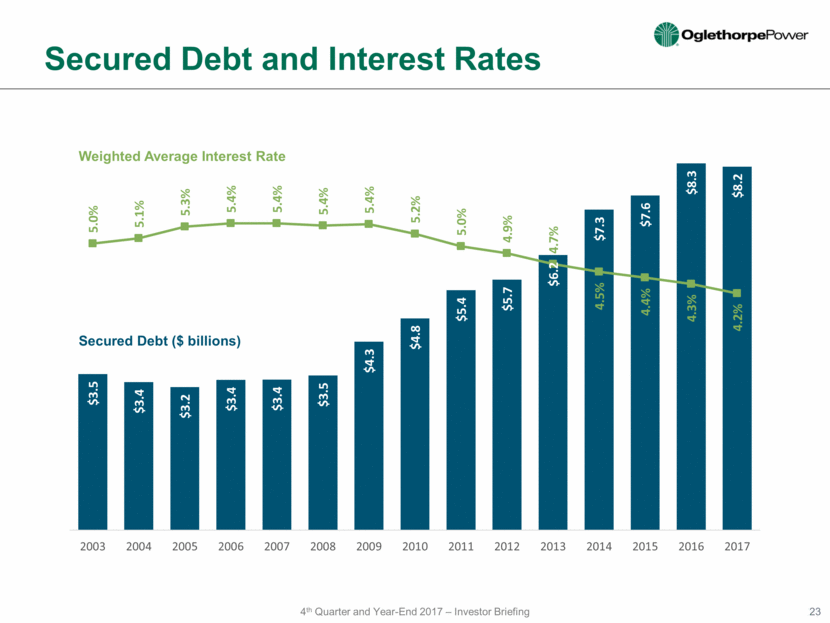
Secured Debt and Interest Rates 23 Weighted Average Interest Rate Secured Debt ($ billions)
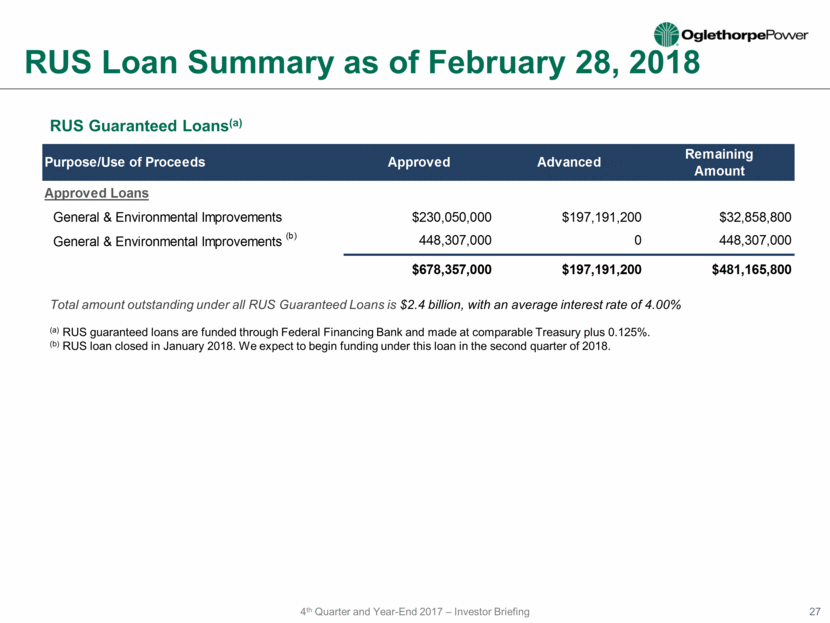
DOE Loan Summary as of February 28, 2018 DOE Guaranteed Loan(a) Average interest rate on all advances to-date under this loan is 3.36% Oglethorpe’s last advance under this loan was $150 million in December 2016. An amendment made to the DOE loan agreement in July 2017 suspended our ability to advance funds under this loan until certain conditions are met. The remaining condition to be met is approval and incorporation of the Bechtel agreement and other replacement agreements into the loan agreements. We expect to satisfy these conditions by the end of second quarter 2018. (a) DOE guaranteed loans are funded through Federal Financing Bank and made at comparable Treasury plus 0.375%. (b) $918 million is available to be advanced under the existing loan based on eligible project expenses incurred through 12/31/17. However, until certain conditions are met we are unable to make further advances. We expect these conditions to be satisfied by end of Q2 2018. (c) Represents accrued capitalized interest being financed with the DOE guaranteed loan. (d) Conditional loan commitment received September 28, 2017 for up to $1.62 billion. Expect to close loan by end of Q2 2018. 24 Purpose/Use of Proceeds Approved(b) Advanced Remaining Amount(b) Vogtle Units 3 & 4 Principal - 2014 Loan $2,721,597,857 $1,570,000,000 $1,151,597,857 Capitalized Interest(c) - 2014 Loan 335,471,604 174,996,762 160,474,842 New DOE Conditional Commitment(d) 1,619,679,706 0 1,619,679,706 $4,676,749,167 $1,744,996,762 $2,931,752,405 Purpose/Use of Proceeds Approved Advanced Remaining Amount Vogtle Units 3 & 4 Principal $2,721,597,857 $1,120,000,000 $1,601,597,857 Capitalized Interest 335,471,604 60,627,989 274,843,615 $3,057,069,461 $1,180,627,989 $1,876,441,472
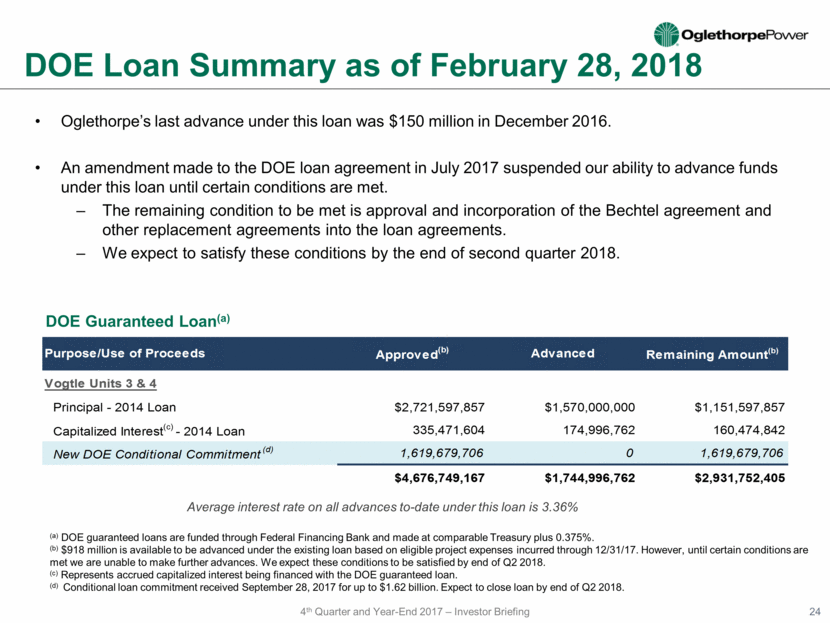
In September 2017, Oglethorpe received a conditional commitment from the DOE in the amount of $1.62 billion for an additional loan guarantee for Vogtle 3&4. If closed, this increases Oglethorpe’s DOE loan financing from $3.06 billion to $4.68 billion. Initial estimate of subsidy fee for new loan is zero (same as original DOE loan). Closing is anticipated by end of the second quarter of 2018. Savings estimates for this loan are ~$200 million net present value; combined with the first loan, savings will exceed $500 million net present value. Final approval of additional commitment is subject to various conditions and cannot be assured. Vogtle 3 & 4 Financing Plan Source Without New DOE Loan With New DOE Loan Taxable Bonds (issued 2009-2016) $1.39 billion $1.39 billion Existing DOE Loan (2014) $3.06 billion $3.06 billion(a) New DOE Loan (2018) --------------- $1.62 billion(a) Future Taxable Bonds $2.55 billion(b) $0.93 billion(b) Total $7.00 billion $7.00 billion New DOE Loan for Vogtle 3 & 4 (a) Advances may not occur after December 31, 2020 for the 2014 Loan and November 30, 2023 for the 2018 Loan. We expect to use additional taxable bonds for amounts, if any, not fully advanced under these loan facilities. (b) These amounts would be reduced by unspent contingency, if any, Member expensed interest during construction, and investment earnings from the Toshiba guarantee payment. 25
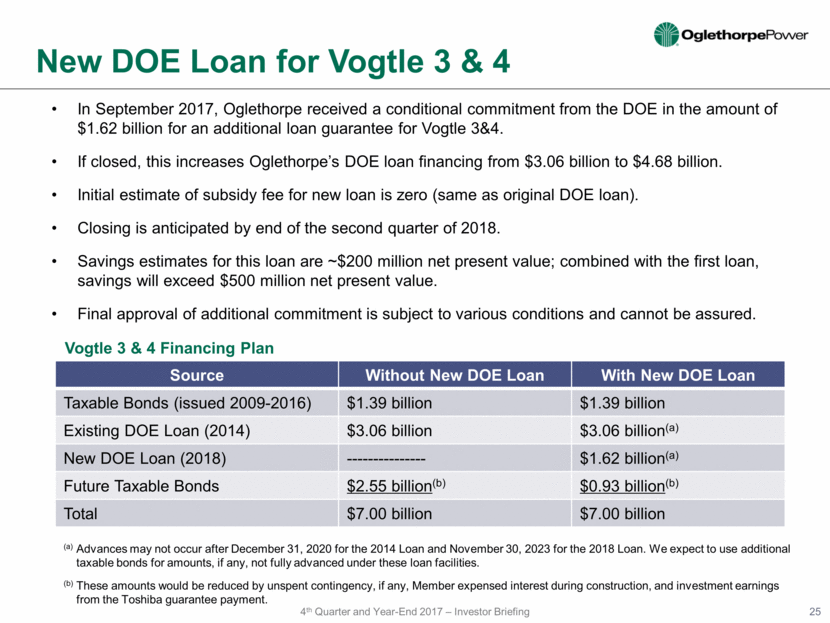
5.95% 30 Yr Bullet 5.39% 30 Yr Bullet 5.26% 39 Yr Bullet $3.1 billion long term debt issued to date. Interest rates set on $3.2 billion(a) at weighted average rate of 4.21%. Using commercial paper for interim financing. 4.23% 30 Yr Bullet(b) (a) In addition to the $1.7 billion in advances from the DOE, the interest rate on future DOE borrowings of $113 million for capitalized interest was set when initial funds were advanced. Weighted average interest rate includes this DOE debt and $1.39 billion of first mortgage bonds issued from 2009-2016. $211 million of the $250 million Series 2012A First Mortgage Bonds and $26 million of the $250 million Series 2016A First Mortgage Bonds were used for Vogtle 3 & 4. Weighted average rate applies to principal borrowings in each year. In 2017, there were only capitalized interest advances and no DOE principal borrowings. As of 12/31/2017 (2018 excludes capitalized interest accrued since 12/31/2017). Amount of first mortgage bonds would be reduced by unspent contingency, if any, Member expensed interest during construction, and investment earnings from the Toshiba guarantee payment, and would be increased to the extent the DOE loans were not fully advanced. 3.74% weighted avg. (30 Yr amortizing) (c) 3.15% weighted avg. (29 Yr amortizing) Vogtle 3 & 4 Financing Plan 26 4.35% 30 Yr Bullet(b) 2.71% weighted avg. (28 Yr amortizing) (c) (c) (c) (d) (e) - 200 400 600 800 1,000 1,200 2009 2010 2011 2012 2013 2014 2015 2016 2017 2018 2019 2020 2021 2022 2023 $ millions First Mortgage Bonds Issued to Date 2014 DOE Loan Advanced to Date 2014 DOE Loan to be Advanced 2018 DOE Loan to be Advanced First Mortgage Bonds to be Issued
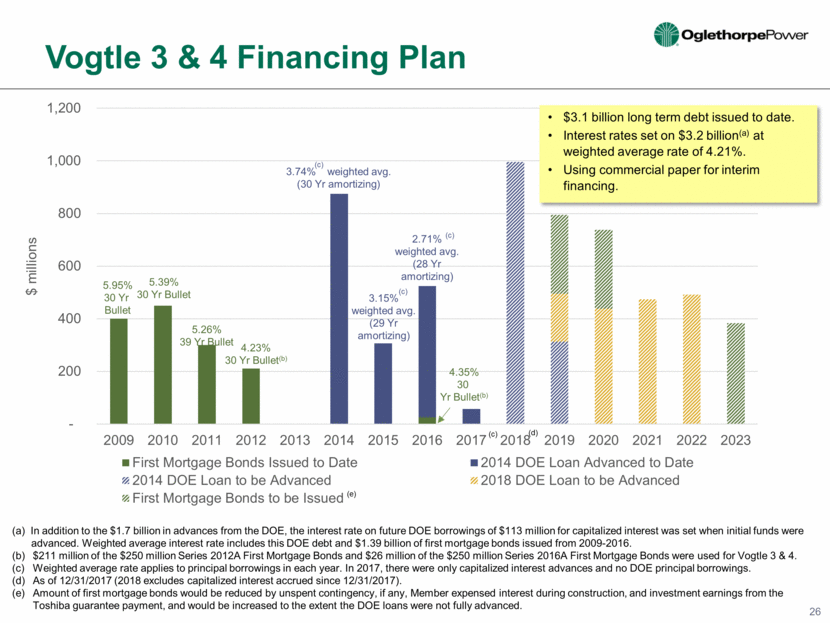
RUS Loan Summary as of February 28, 2018 Total amount outstanding under all RUS Guaranteed Loans is $2.4 billion, with an average interest rate of 4.00% RUS Guaranteed Loans(a) (a) RUS guaranteed loans are funded through Federal Financing Bank and made at comparable Treasury plus 0.125%. (b) RUS loan closed in January 2018. We expect to begin funding under this loan in the second quarter of 2018. 27 Purpose/Use of Proceeds Approved Advanced Remaining Amount Approved Loans General & Environmental Improvements $230,050,000 $197,191,200 $32,858,800 General & Environmental Improvements (b) 448,307,000 0 448,307,000 $678,357,000 $197,191,200 $481,165,800
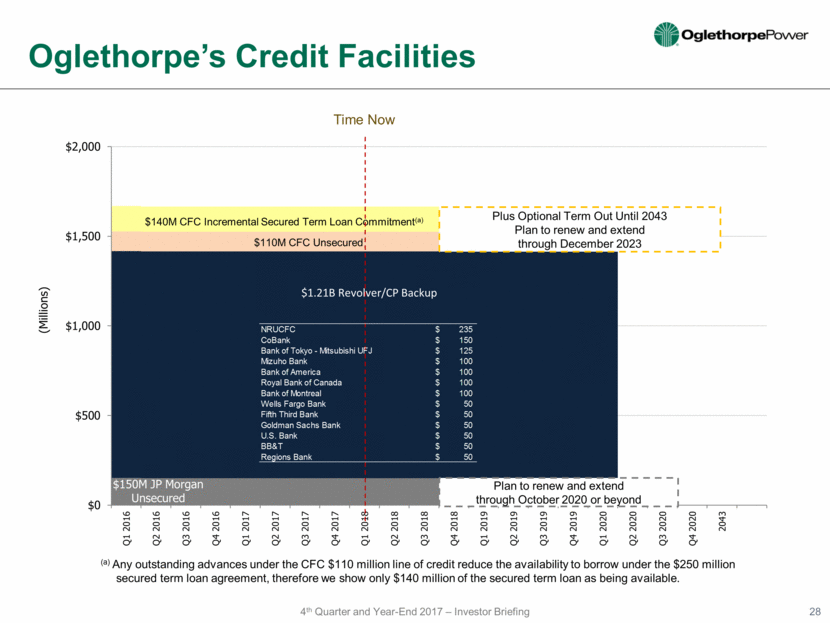
$110M CFC Unsecured $140M CFC Incremental Secured Term Loan Commitment(a) Time Now (a) Any outstanding advances under the CFC $110 million line of credit reduce the availability to borrow under the $250 million secured term loan agreement, therefore we show only $140 million of the secured term loan as being available. Oglethorpe’s Credit Facilities Plus Optional Term Out Until 2043 Plan to renew and extend through December 2023 Plan to renew and extend through October 2020 or beyond 28 3.31.2011 6.30.2011 9.30.2011 CFC Secured 250 250 250 Revolver/CP Backup 475 1265 1265 CFC Unsecured 50 50 110 JPMorgan Unsecured 150 150 150 CoBank Secured 150 150 150 CoBank Unsecured 50 1125 1865 1925 NRUCFC $ 235 CoBank $ 150 Bank of Tokyo - Mitsubishi UFJ $ 125 Mizuho Bank $ 100 Bank of America $ 100 Royal Bank of Canada $ 100 Bank of Montreal $ 100 Wells Fargo Bank $ 50 Fifth Third Bank $ 50 Goldman Sachs Bank $ 50 U.S. Bank $ 50 BB&T $ 50 Regions Bank $ 50
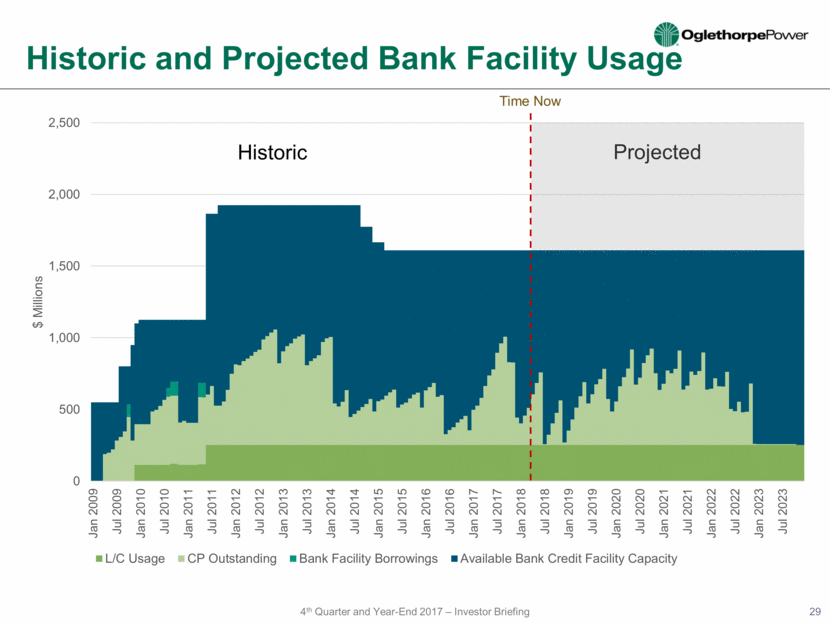
Historic and Projected Bank Facility Usage 29 Historic Projected Time Now 0 500 1,000 1,500 2,000 2,500 Jan 2009 Jul 2009 Jan 2010 Jul 2010 Jan 2011 Jul 2011 Jan 2012 Jul 2012 Jan 2013 Jul 2013 Jan 2014 Jul 2014 Jan 2015 Jul 2015 Jan 2016 Jul 2016 Jan 2017 Jul 2017 Jan 2018 Jul 2018 Jan 2019 Jul 2019 Jan 2020 Jul 2020 Jan 2021 Jul 2021 Jan 2022 Jul 2022 Jan 2023 Jul 2023 $ Millions L/C Usage CP Outstanding Bank Facility Borrowings Available Bank Credit Facility Capacity Series4 Series5
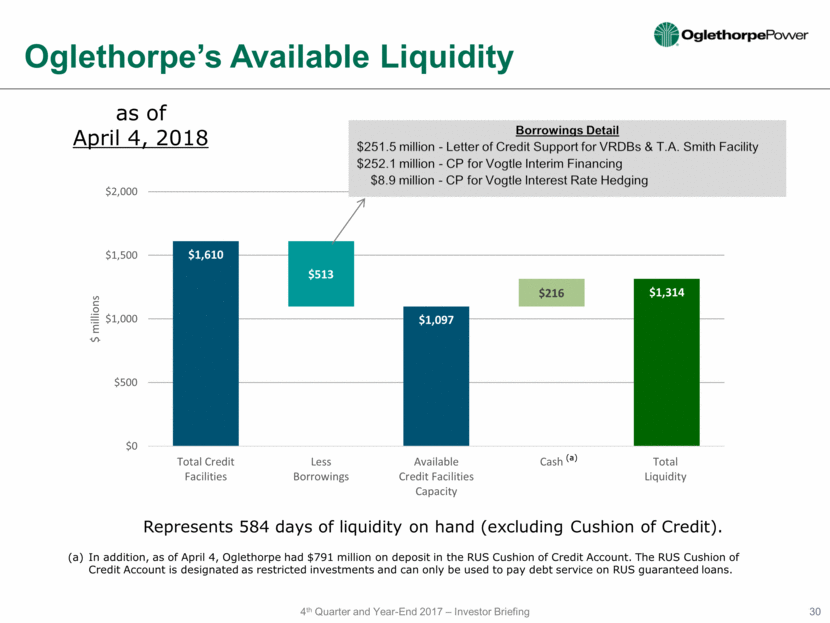
Oglethorpe’s Available Liquidity as of April 4, 2018 Borrowings Detail $251.5 million - Letter of Credit Support for VRDBs & T.A. Smith Facility $252.1 million - CP for Vogtle Interim Financing $8.9 million - CP for Vogtle Interest Rate Hedging Represents 584 days of liquidity on hand (excluding Cushion of Credit). In addition, as of April 4, Oglethorpe had $791 million on deposit in the RUS Cushion of Credit Account. The RUS Cushion of Credit Account is designated as restricted investments and can only be used to pay debt service on RUS guaranteed loans. (a) 30 $1,610 $513 $1,097 $216 $1,314 $0 $500 $1,000 $1,500 $2,000 Total Credit Facilities Less Borrowings Available Credit Facilities Capacity Cash Total Liquidity $ millions
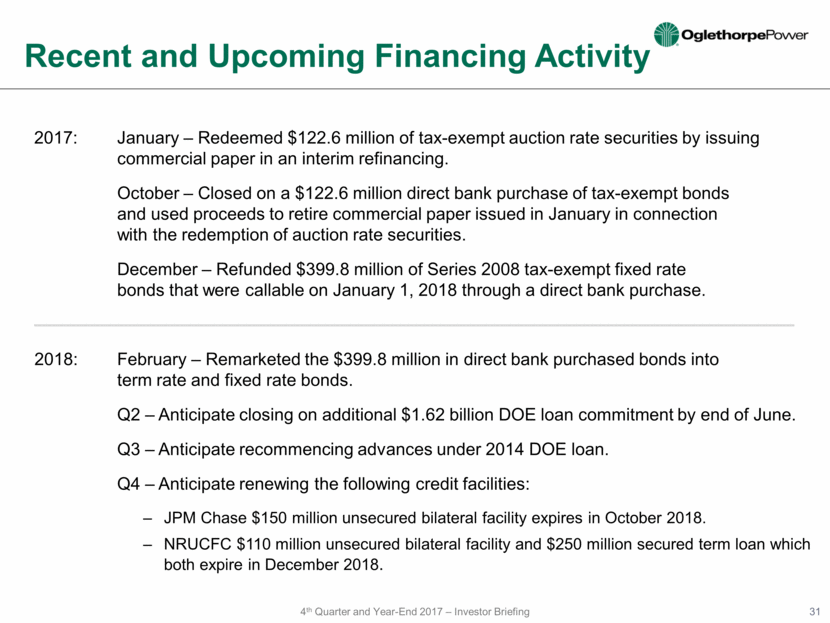
2017: January – Redeemed $122.6 million of tax-exempt auction rate securities by issuing commercial paper in an interim refinancing. October – Closed on a $122.6 million direct bank purchase of tax-exempt bonds and used proceeds to retire commercial paper issued in January in connection with the redemption of auction rate securities. December – Refunded $399.8 million of Series 2008 tax-exempt fixed rate bonds that were callable on January 1, 2018 through a direct bank purchase. 2018: February – Remarketed the $399.8 million in direct bank purchased bonds into term rate and fixed rate bonds. Q2 – Anticipate closing on additional $1.62 billion DOE loan commitment by end of June. Q3 – Anticipate recommencing advances under 2014 DOE loan. Q4 – Anticipate renewing the following credit facilities: JPM Chase $150 million unsecured bilateral facility expires in October 2018. NRUCFC $110 million unsecured bilateral facility and $250 million secured term loan which both expire in December 2018. Recent and Upcoming Financing Activity 31
Liquidity Net Margin Wholesale Power Cost Interim CP Financing Balance Sheet Electric Plant Average Cost of Funds: 1.58% (dollars in millions) Secured LT Debt (12.31.2017): $8.2 billion Weighted Average Cost: 4.17% Equity/Capitalization Ratio: 9.8% 2017 1.14 MFI December 31, 2017 2017 Cost of Power Sales to Members (excluding Rate Management Program). Additional Member Collections for Rate Management Programs. 2017 2017 Long Term Debt Actual Refunded Forecasted Refunding 32 ($600) ($400) ($200) $0 $200 $400 $600 DOE Tax-Exempt RUS $522 $57 $22 $150 $522 ($ Millions) Actual Issuance Forecasted Issuance Actual Repayment Forecasted Repayment $1,000 $ 1,000 $1,610 $1,610 $0 $250 $500 $750 $1,000 $1,250 $1,500 $1,750 $2,000 $2,250 $2,500 Jan Feb Mar Apr May Jun Jul Aug Sep Oct Nov Dec Borrowings (Mil) Cash Borrowings CP Availability Total Available Lines of Credit Cash Balances (Mil) Vogtle 3&4 Interest Rate Hedging , $7 Vogtle 3 & 4 Interim Financing , $184 $- $20 $40 $60 $80 Jan Feb Mar Apr May Jun Jul Aug Sep Oct Nov Dec Millions Actual Budget 4.0 4.5 5.0 5.5 6.0 6.5 7.0 Budget YTD Actual YTD 6.13 5.98 6.17 6.02 ¢/kWh $0 $1 $2 $3 $4 $5 $6 $7 $8 $9 YE 2016 YE 2017 $4.67 $4.58 $0.38 $0.36 $3.23 $2.94 (Billions) Construction Work in Progress Nuclear Fuel Electric Plant in Service Total Assets ($ Millions) $10,701 $10,928
One of the largest electric cooperatives in the United States. Oglethorpe has take-or-pay, joint and several Wholesale Power Contracts with its Members through 2050. Primarily residential customer base — approximately 2/3 of Members’ MWh sales and operating revenue. Oglethorpe’s formulary rate structure assures cost recovery. Inputs to rate formula are not subject to any regulatory approval. Changes to formulary rate schedule are subject to RUS and DOE approval. Members are not subject to regulation for rate setting purposes. Strong liquidity position. Well diversified power supply portfolio. Substantial value in existing resources. Strong, consistent operational and financial performance. Strong emphasis on risk management and corporate compliance. Oglethorpe is a Strong, Stable Credit 33
A link to this presentation will be posted on Oglethorpe’s website www.opc.com. Oglethorpe’s SEC filings, including its annual reports on Form 10-K, quarterly reports on Form 10-Q, current reports on Form 8-K are made available on its website. Member information is filed as an exhibit to Form 10-Q for the first quarter of each year. (Exhibits are available on EDGAR but not on Oglethorpe’s website.) For additional information please contact: Additional Information Investor Contacts Media Contact 34 Name Title Email Address Phone Number Terri Statham Manager, Media Relations terri.statham@georgiaemc.com 770-270-6990 Name Title Email Address Phone Number Betsy Higgins Executive Vice President and Chief Financial Officer betsy.higgins@opc.com 770-270-7168 Tom Brendiar Director, Bank and Investor Relations tom.brendiar@opc.com 770-270-7173 Joe Rick Director, Capital Markets joe.rick@opc.com 770-270-7240
