Attached files
| file | filename |
|---|---|
| EX-31.2 - EX-31.2 - CANADIAN PACIFIC RAILWAY LTD/CN | d553694dex312.htm |
| EX-31.1 - EX-31.1 - CANADIAN PACIFIC RAILWAY LTD/CN | d553694dex311.htm |
Table of Contents
UNITED STATES
SECURITIES AND EXCHANGE COMMISSION
Washington, D.C. 20549
FORM 10-K/A
AMENDMENT NO. 1
| ☒ | ANNUAL REPORT PURSUANT TO SECTION 13 OR 15(d) OF THE SECURITIES EXCHANGE ACT OF 1934 |
For the fiscal year ended December 31, 2017
OR
| ☐ | TRANSITION REPORT PURSUANT TO SECTION 13 OR 15(d) OF THE SECURITIES EXCHANGE ACT OF 1934 |
For the transition period from to .
Commission File Number 001-01342
Canadian Pacific Railway Limited
(Exact name of registrant as specified in its charter)
| Canada | 98-0355078 | |
| (State or Other Jurisdiction of Incorporation or Organization) |
(IRS Employer Identification No.) | |
| 7550 Ogden Dale Road S.E., Calgary, Alberta, Canada |
T2C 4X9 | |
| (Address of Principal Executive Offices) | (Zip Code) | |
Registrant’s Telephone Number, Including Area Code: (403) 319-7000
Securities registered pursuant to Section 12(b) of the Act:
| Title of each class |
Name of each exchange on which registered | |
| Common Shares, without par value | New York Stock Exchange |
Securities registered pursuant to Section 12(g) of the Act: None
Indicate by check mark if the registrant is a well-known seasoned issuer, as defined in Rule 405 of the Securities Act. Yes ☒ No ☐
Indicate by check mark if the registrant is not required to file reports pursuant to Section 13 or Section 15(d) of the Exchange Act. Yes ☐ No ☒
Indicate by check mark whether the registrant (1) has filed all reports required to be filed by Section 13 or 15(d) of the Securities Exchange Act of 1934 during the preceding 12 months (or for such shorter period that the registrant was required to file such reports), and (2) has been subject to such filing requirements for the past 90 days. Yes ☒ No ☐
Indicate by check mark whether the registrant has submitted electronically and posted on its corporate Web site, if any, every Interactive Data File required to be submitted and posted pursuant to Rule 405 of Regulation S-T during the preceding 12 months (or for such shorter period that the registrant was required to submit and post such files) Yes ☒ No ☐
Indicate by check mark if disclosure of delinquent filers pursuant to Item 405 of Regulation S-K is not contained herein, and will not be contained, to the best of registrant’s knowledge, in definitive proxy or information statements incorporated by reference in Part III of this Form 10-K or any amendment to this Form 10-K. ☐
Indicate by check mark whether the registrant is a large accelerated filer, an accelerated filer, a non-accelerated filer, a smaller reporting company, or an emerging growth company. See the definitions of “large accelerated filer,” “accelerated filer,” “smaller reporting company” and “emerging growth company” in Rule 12b-2 of the Exchange Act. (Check one):
| Large accelerated filer | ☒ | Accelerated filer | ☐ | |||
| Non-accelerated filer | ☐ (Do not check if a smaller reporting company) | Smaller reporting company | ☐ | |||
| Emerging growth company | ☐ | |||||
If an emerging growth company, indicate by check mark if the registrant has elected not to use the extended transition period for complying with any new or revised financial accounting standards provided pursuant to Section 13(a) of the Exchange Act. ☐
Indicate by check mark whether the registrant is a shell company (as defined in Rule 12b-2 of the Exchange Act). Yes ☐ No ☒
As of June 30, 2017, the last business day of the registrant’s most recently completed second fiscal quarter, the aggregate market value of the voting stock held by non-affiliates of the registrant, in U.S. dollars, was $23,490,374,139, based on the closing sales price per share as reported by the New York Stock Exchange on such date.
As of the close of business on February 14, 2018, there were 144,212,716 shares of the registrant’s Common Stock outstanding.
Table of Contents
EXPLANATORY NOTE
Canadian Pacific Railway Limited, a corporation incorporated under the Canada Business Corporations Act (the “Company”), qualifies as a foreign private issuer in the U.S. for purposes of the Securities Exchange Act of 1934, as amended (the “Exchange Act”). Although as a foreign private issuer the Company is not required to do so, the Company currently continues to file annual reports on Form 10-K, quarterly reports on Form 10-Q, and current reports on Form 8-K with the Securities and Exchange Commission (“SEC”) instead of filing the reports available to foreign private issuers. The Company prepares and files a management proxy circular and related material under Canadian requirements. As the Company’s management proxy circular is not filed pursuant to Regulation 14A, the Company may not incorporate by reference information required by Part III of its Form 10- K from its management proxy circular.
The Company filed its Annual Report on Form 10-K for the fiscal year ended December 31, 2017 (“2017 Form 10-K”) on February 16, 2018. In reliance upon and as permitted by Instruction G(3) to Form 10-K, the Company is filing this Amendment No. 1 on Form 10-K/A in order to include in the 2017 Form 10-K the Part III information not previously included in the 2017 Form 10-K.
No attempt has been made in this Amendment No. 1 on Form 10-K/A to modify or update the other disclosures presented in the 2017 Form 10-K. This Amendment No. 1 on Form 10-K/A does not reflect events occurring after the filing of the 2017 Form 10-K. Accordingly, this Amendment No. 1 on Form 10-K/A should be read in conjunction with the 2017 Form 10-K and the Company’s other filings with the SEC.
In this Amendment No. 1 on Form 10-K/A, we also refer to Canadian Pacific Railway Limited as “Canadian Pacific,” “we,” “us,” “our,” “our corporation,” or “the corporation.” References to “GAAP” mean generally accepted accounting principles in the United States.
All references to our websites and to our Canadian management proxy circular filed with the SEC on March 16, 2018 as Exhibit 99.1 to our Current Report on Form 8-K (the “Circular”) contained herein do not constitute incorporation by reference of information contained on such websites and the Circular and such information should not be considered part of this document.
Table of Contents
CANADIAN PACIFIC RAILWAY LIMITED
FORM 10-K/A
| PART III | ||||
| Item 10 |
Directors, Executive Officers and Corporate Governance | 1 | ||
| Item 11 |
Executive Compensation | 5 | ||
| Item 12 |
Security Ownership of Certain Beneficial Owners and Management and Related Stockholder Matters | 53 | ||
| Item 13 |
Certain Relationships and Related Transactions, and Director Independence | 53 | ||
| Item 14 |
Principal Accounting Fees and Services | 54 | ||
| PART IV | ||||
| Item 15 |
Exhibits, Financial Statement Schedules | 55 | ||
| Signatures | 56 | |||
Table of Contents


Table of Contents


2
Table of Contents


3
Table of Contents

4
Table of Contents
Executive Officers
The information regarding executive officers is included in Part I of our 2017 Form 10-K under Executive Officers of the Registrant, following Item 4. Mine Safety Disclosures
Section 16(a) Beneficial Ownership Reporting Compliance
Section 16(a) of the Exchange Act required our directors and executive officers, and any certain persons owning more than 10% of our common shares, to file certain reports of ownership and changes in ownership with the SEC. As of June 30, 2017, Section 16(a) of the Exchange Act no longer applied to us because we qualified as a foreign private issuer under U.S. securities laws. Based solely on our review of the copies of Forms 3, 4 and 5 filed between January 1, 2017 and June 30, 2017, we believe that all reports required to be filed under Section 16(a) were made on a timely basis with respect to transactions that occurred during such period.
Code of Business Ethics
Our code of business ethics sets out our expectations for conduct. It covers confidentiality, protecting our assets, avoiding conflicts of interest, fair dealing with third parties, compliance with laws, rules and regulations, as well as reporting any illegal or unethical behaviour, among other things. The code applies to everyone at CP and our subsidiaries: directors, officers, employees (unionized and non-unionized) and contractors who do work for us.
Directors, officers and non-union employees must sign an acknowledgement every year that they have read, understood and agree to comply with the code. Directors must also confirm annually that they have complied with the code. The code is part of the terms and conditions of employment for non-union employees, and contractors must agree to follow principles of standards of business conduct consistent with those set out in our code as part of the terms of engagement.
We also have a supplemental code of ethics for the CEO and senior financial officers (the CFO and the Controller) which sets out our longstanding principles of conduct for these senior roles.
A copy of the code (and any amendments) is posted on our website (www.cpr.ca). Only the Board or Governance Committee (audit committee in the case of the CEO and senior financial officers) can waive an aspect of the code. Any waivers are posted on our website. None were granted in 2017.
Corporate Governance
As a U.S. and Canadian listed company, our corporate governance practices comply with or exceed the requirements of the Canadian Securities Administrators (CSA) National Policy 58-201 Effective Corporate Governance and the Toronto Stock Exchange (TSX), Item 407 of Regulation S-K of the SEC and the corporate governance guidelines of the New York Stock Exchange (NYSE). If significant corporate governance differences between CP’s governance practices and Item 303A of the NYSE arise, they will be disclosed on our website at investor.cpr.ca/governance.
CP’s audit committee has been established in accordance with Section 3(a)(58)(A) the Exchange Act and NYSE standards and CSA National Instrument 52-110. The current members of the audit committee are Jane Peverett (chair), Jill Denham and Andrew Reardon, all of whom are independent. All members of the audit committee are “financially literate” as required by the NYSE and CSA. Ms. Peverett and Mr. Reardon have been determined to meet the audit committee financial expert criteria prescribed by the SEC.
ITEM 11. EXECUTIVE COMPENSATION
As a foreign private issuer in the United States, we are deemed to comply with this Item if we provide information required by Items 6.B and 6.E.2 of Form 20-F, with more detailed information provided if otherwise made publicly available or required to be disclosed in Canada. We have provided information required by Items 6.B and 6.E.2 of Form 20-F in our management proxy circular related to the Meeting (the “proxy circular”) and have filed it through the Canadian System for Electronic Document Analysis and Retrieval (“SEDAR”), the Canadian equivalent of the SEC’s Next-Generation EDGAR system, at www.sedar.com. In addition, our proxy circular has been furnished to the SEC on Form 8-K. As a foreign private issuer in the U.S., we are not required to disclose executive compensation according to the requirements of Regulation S-K that apply to U.S. domestic
5
Table of Contents
issuers, and we are otherwise not required to adhere to the U.S. requirements relative to certain other proxy disclosures and requirements. Our executive compensation disclosure complies with Canadian requirements, which are, in most respects, substantially similar to the U.S. rules. We generally attempt to comply with the spirit of the U.S. proxy rules when possible and to the extent that they do not conflict, in whole or in part, with required Canadian corporate or securities requirements or disclosure.
All dollar amounts included in this Item 11 are in Canadian dollars, unless otherwise expressly stated to be in U.S. dollars.
EXECUTIVE COMPENSATION
Our executive compensation program is designed to pay for performance, and to align management’s interests with our business strategy and the interests of our shareholders.
The next section describes our compensation program and explains the 2017 compensation decisions for our named executives:
| • | Keith E. Creel, President and Chief Executive Officer |
| • | Nadeem S. Velani, Executive Vice-President and Chief Financial Officer |
| • | Robert A. Johnson, Executive Vice-President Operations |
| • | Laird J. Pitz, Senior Vice-President and Chief Risk Officer |
| • | Jeffrey J. Ellis, Chief Legal Officer and Corporate Secretary |
| • | E. Hunter Harrison, former Chief Executive Officer (resigned on January 31, 2017) |
Compensation Committee Report
The management resources and compensation committee has reviewed and discussed the Compensation Discussion and Analysis with management. Based on its review and on the discussion described above, on February 14, 2018, the Compensation Committee recommended to the full Board that the Compensation Discussion and Analysis be included in the Circular and this Annual Report on Form 10-K/A.
Compensation Committee
Isabelle Courville (Chair)
John Baird
Rebecca MacDonald
Matthew Paull
Andrew Reardon
Gordon Trafton
Where to find it
6
Table of Contents
COMPENSATION DISCUSSION AND ANALYSIS
Our approach to executive compensation
We believe in the importance of paying for performance and aligning management’s interests with those of our shareholders.
Our executive compensation program supports our railroad-focused culture, is closely linked to the critical metrics that drive the achievement of our strategic plan without taking on undue risk, and is designed to create long-term sustainable value for our shareholders.
We have five key performance drivers designed to focus us on our goal of being the best railroad company in North America:
| 1. | Provide customers with industry-leading rail service |
| 2. | Control costs |
| 3. | Optimize our assets |
| 4. | Remain a leader in rail safety |
| 5. | Develop our people |
We implemented several changes to our compensation program in 2017, as disclosed in last year’s proxy circular. These changes were the result of an extensive shareholder engagement program and an extensive review of executive compensation by the Compensation Committee, the Board and our human resources group. You can read about the program changes starting on page 15, and in the letter of the Compensation Committee chair beginning on page 5 of the Circular.
We received a 71.11% vote for our 2017 advisory vote on executive compensation, compared to 49.9% in 2016. The Compensation Committee continues to focus on making sure our compensation program pays for performance, reflects sound principles, supports long-term sustainable value, is clear and transparent and aligns with shareholder interests.
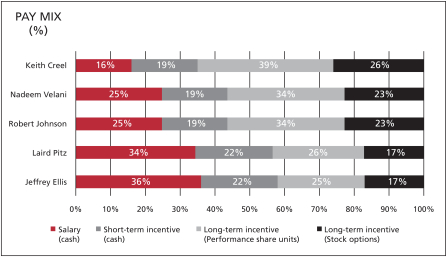
Compensation mix
Attracting and retaining high calibre executives is key to our long-term success.
We believe strong performance should yield significant rewards. Our executive compensation includes fixed and variable (at-risk) pay and the proportion of at-risk pay increases by level. Executives earn more if we perform well, and less when performance is not as strong. A significant portion of executive pay is tied to the value of our shares, aligning with shareholder interests. We require our executives to own CP equity and our share ownership guidelines increase by executive level (see page 10).
Variable cash compensation is more focused on corporate results for executives (75% of target) than for other employees (50% of target) who have more emphasis placed on individual and departmental goals.
This supports our view that the short-term incentive plan should be tied to overall corporate performance and the areas of our business that each employee influences directly.
7
Table of Contents
The table below shows the pay mix for our current named executives based on their total target compensation.
Benchmarking
We benchmark the compensation for our named executives against a peer group of companies that consists of BNSF Railway, CN, CSX Corporation, Kansas City Southern Railroad, Norfolk Southern Corporation and Union Pacific Corporation.
These companies are the Class 1 railroads, the North American railroad companies that we compete with for executive talent. Benchmarking against this peer group ensures that each component of our compensation program is competitive and in line with our strongest competitors, so we can attract and retain experienced railroad executives with highly specialized skills. We reviewed the peer group in 2017 to make sure it is still a relevant and appropriate benchmark in the context of our growth strategy and operations and do not plan to make changes to the comparator group for 2018.
8
Table of Contents
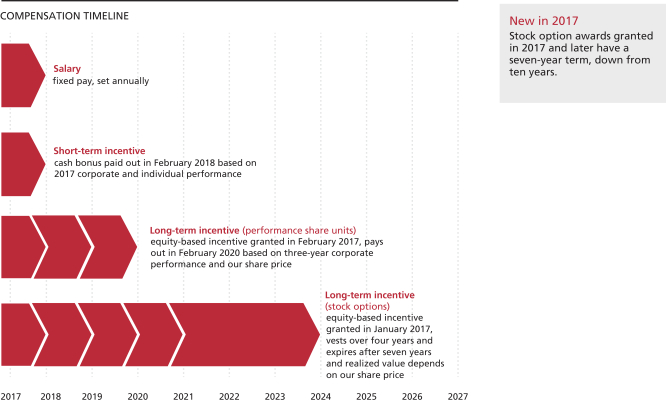
Compensation pays out over time
|
Variable pay includes short and long-term incentive awards to drive annual and longer-term performance and align with shareholder interests.
Incentive awards are cash and equity-based. Equity-based awards vest at the end of three years for performance share units and over four years for stock options. Stock options expire at the end of seven years.
The Compensation Committee ensures the performance objectives for the incentive plans align directly with our strategic plan, which is reviewed and approved by the Board.
Executives are CP shareholders
We require executives and senior management employees to own equity in the company so they have a stake in our future success. Share ownership requirements are set as a multiple of base salary and increase by level. Executives must satisfy the requirement within five years of being appointed to their position and can meet the requirements by holding common shares or deferred share units (DSUs). The CEO must maintain the ownership level of six times his base salary for one year after he retires or leaves CP.
DSUs are redeemed for cash no earlier than six months after the executive retires or leaves the company or until the end of the following calendar year for Canadian executives. Payment to U.S. executives who participate in the DSU plan is made after the six-month waiting period to be in compliance with U.S. tax regulations.
9
Table of Contents
The table below shows the ownership requirement by level, which applied to approximately 77 executives and senior management employees in 2017.
| Ownership requirement (as a multiple of base salary) |
||||
| CEO |
6x | |||
| Executive Vice-President |
3x | |||
| Senior Vice-President |
2x | |||
| Vice-President |
1.5 to 2x | |||
| Senior management |
1x | |||
We use the acquisition value or our closing share price on the last trading day of the year (whichever is higher) to value the holdings.
Mr. Creel, Mr. Velani, Mr. Johnson, Mr. Pitz and Mr. Ellis are expected to meet their requirement within the five-year period following their appointment. We used our closing share price on December 29, 2017 to value their share ownership: $229.66 for the TSX or US$182.76 on the NYSE, depending on whether the executive is paid in Canadian or U.S. dollars. You can read about each executive’s share ownership in the profiles beginning on page 27.
Disciplined decision-making process
Executive compensation decisions involve management, the Compensation Committee and the Board. The Compensation Committee also receives advice and support from an external consultant from time to time.
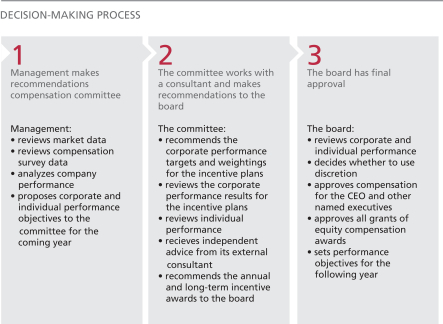
The Board has final approval on all matters relating to executive compensation. It can also use its discretion to adjust pay decisions as appropriate.
10
Table of Contents
Qualified and experienced Compensation Committee
Compensation Committee Interlocks and Insider Participation
The Compensation Committee is responsible for our compensation philosophy and strategy, and for program design. The Compensation Committee consists of six independent directors.
The Compensation Committee has the relevant skills, background and experience for carrying out its duties. The table below shows the key skills and experience of each member:
| Human resources/ succession planning |
CEO/senior management |
Governance and policy development |
Transportation industry |
Risk management |
Engagement (shareholders and others) |
|||||||||||||||||||
| Isabelle Courville (Committee Chair) |
✓ | ✓ | ✓ | ✓ | ✓ | |||||||||||||||||||
| John Baird |
✓ | ✓ | ✓ | ✓ | ✓ | |||||||||||||||||||
| Rebecca MacDonald |
✓ | ✓ | ✓ | ✓ | ||||||||||||||||||||
| Andrew Reardon (Chairman of the Board) |
✓ | ✓ | ✓ | ✓ | ✓ | ✓ | ||||||||||||||||||
| Matthew Paull |
✓ | ✓ | ✓ | ✓ | ✓ | |||||||||||||||||||
| Gordon Trafton |
✓ | ✓ | ✓ | ✓ | ✓ | |||||||||||||||||||
Compensation Committee members also have specific human resources and compensation-related experience, including:
| • | direct responsibility for executive compensation matters |
| • | membership on other human resources committees |
| • | compensation plan design and administration, compensation decision-making and understanding the Board’s role in the oversight of these practices |
| • | understanding the principles and practices related to leadership development, talent management, succession planning and employment contracts |
| • | engagement with investors on compensation issues |
| • | oversight of financial analysis related to compensation plan design and practices |
| • | oversight of labour matters and a unionized workforce |
| • | pension benefit oversight |
| • | recruitment of senior executives |
The Compensation Committee has no interlocks or insider participation. None of the members were employed by or had any relationship with CP during 2017 requiring disclosure under Item 404 or Item 407(e)(4) of Regulation S-K of the Exchange Act. You can read about the background and experience of each member in the director profiles beginning on page 1.
11
Table of Contents
Independent advice
The Compensation Committee and management retain separate independent executive compensation advisors to avoid any conflicts of interest:
| Committee advisor | Management advisor | |
| • The Compensation Committee retained Meridian Compensation Partners LLC (Meridian) as its independent compensation consultant for early 2017 • In 2017 Meridian advised the Compensation Committee on various matters relating to executive compensation and assisted the Compensation Committee with the 2016 compensation risk review • The Compensation Committee has also engaged Kingsdale Advisors as a compensation consultant on an as needed basis • The Compensation Committee chair approves all fees and work performed by the external consultant |
• Management engages Willis Towers Watson to provide market survey data and advice relating to executive compensation |
The next table shows the fees paid to Meridian and Willis Towers Watson in 2016 and 2017. Fees paid to Meridian in 2017 reflect work conducted early in the year, prior to ending the engagement. Any fees paid to Kingsdale for executive compensation services in 2017 were part of the overall retainer described on page 13 of the Circular.
| 2017 | 2016 | |||||||||||||||||||
| Meridian | Willis Towers Watson | Meridian | Willis Towers Watson | |||||||||||||||||
| Executive compensation-related fees |
$ | 50,751 | $ | 78,923 | $ | 170,267 | $ | 59,264 | ||||||||||||
| Other fees |
- | $ | 1,975,629 | - | $ | 2,215,142 | ||||||||||||||
| Total fees |
$ | 50,751 | $ | 2,054,552 | $ | 170,267 | $ | 2,274,406 | ||||||||||||
Fees paid
In 2016, $170,267 was paid to Meridian for executive compensation advisory fees provided to the Compensation Committee. This is 100% of the total fees paid to Meridian in 2016. In 2017, $50,751 was paid to Meridian for executive compensation advisory fees. This is 100% of the total fees paid to Meridian in 2017.
In 2017, $78,923 was paid to Willis Towers Watson for executive compensation advisory fees provided to management. The total executive compensation fees represent 4% of the $2,054,552 paid in total to Willis Towers Watson for all services provided to management including actuarial, pension and benefits consulting, corporate risk and insurance broking services.
Compensation risk
Effective risk management is integral to achieving our business strategies and to our long-term success.
The Board believes that our executive compensation program should not increase our risk profile. The Compensation Committee is responsible for overseeing compensation risk. It reviews the executive compensation program, incentive plan design and our policies and practices to make sure they encourage the right decisions and actions to reward performance and align with shareholder interests.
Incentive plan targets are linked to our corporate objectives and our corporate risk profile. The Compensation Committee believes that our approach to goal setting, establishing performance measures and targets and evaluating performance results helps mitigate risk-taking that could reward poor judgment by executives or have a negative effect on shareholder value.
All of the Compensation Committee members other than Mr. Paull are also a member of the Governance Committee. Mr. Reardon and Mr. Paull are also members of the finance committee and Mr. Reardon is a member of the audit committee. This cross-membership strengthens risk oversight because it gives the directors a broader perspective of risk oversight and a deeper understanding of our enterprise risks.
12
Table of Contents
Regular risk review
The Compensation Committee conducts a comprehensive compensation risk review every two years to make sure that we have identified the compensation risks and have appropriate measures in place to mitigate those risks. An independent consultant assists the Compensation Committee with the review, which includes looking at:
| • | the targets for the short-term incentive and performance share unit plan, anticipated payout levels and the risks associated with achieving target performance |
| • | the design of the long-term incentive awards, which rewards sustainable financial and operating performance |
| • | the compensation program, policies and practices to ensure alignment with our enterprise risk management practices. |
The last review was completed at the end of 2016 in conjunction with all the changes that were being proposed to the 2017 compensation plans. Based on the findings of the review, the Compensation Committee concluded that our compensation program, policies and practices are not reasonably likely to have an adverse effect on our business or the company overall.
Managing compensation risk
We mitigate risk in three ways:
| 1. Plan design | • We use a mix of fixed and variable (at-risk) compensation and a significant proportion is at-risk pay • Short and long-term incentive plans have specific performance measures that are closely aligned with the achievement of our business strategy and performance required to achieve results in accordance with guidance provided to the market • The payout curve for the short-term incentive plan is designed asymmetrically to reflect the significant stretch in target performance • The payout under the short-term incentive plan is capped and not guaranteed, and the Compensation Committee has discretion to reduce the awards • The long-term incentive plan has overlapping vesting periods to address longer-term risks and maintain executives’ exposure to the risks of their decision-making through unvested share based awards | |
| 2. Policies | • We promote an ethical culture and everyone is subject to a code of business ethics • We have share ownership requirements for executives and senior management so they have a stake in our future success • We have a disclosure and insider trading/reporting policy to protect our interests and ensure high business standards and appropriate conduct • Our anti-hedging policy prohibits directors, officers and employees from hedging our shares and share-based awards • Our anti-pledging policy prohibits directors and senior officers from holding our shares in a margin account or otherwise pledging them as security • We also have a policy that prohibits employees from forward selling shares that may be delivered on the future exercise of stock options, or otherwise monetizing their option awards, other than through exercising the options and subsequently selling the shares through a public venue or the company’s cashless exercise option • Our clawback policy allows us to recoup incentive pay from current and former senior executives as appropriate (see below) • DSUs held by the CEO and executives are not settled for cash until six months after leaving the company • Our whistleblower policy applies to all employees and prohibits retaliation against anyone who makes a complaint acting in good faith | |
| 3. Mitigation measures | • More senior roles have a significant portion of their compensation deferred • We must achieve a specific threshold of operating income, otherwise no short-term incentive awards are granted • Financial performance is verified by our external auditor (completion of annual financial statement audit) before the Board makes any decisions about short-term incentive • The Compensation Committee adopted principles for adjusting payout under the short-term incentive plan, and provides them to the Board as part of their review of the Compensation Committee’s recommendations and performance overall • Environmental principles are fundamental to how we achieve our financial and operational objectives, and the Compensation Committee takes them into account when exercising discretion and determining the short-term incentive awards • Safety is considered as part of individual performance under the short-term incentive for the CEO and executives in operations roles in addition to being a specific STIP measure • We regularly benchmark executive compensation against our comparator group of companies • Different performance scenarios are stress tested and back tested to understand possible outcomes |
13
Table of Contents
Key policies
In addition to CP’s code of business ethics, a number of other policies act to mitigate compensation risk. You can read more about ethical behaviour at CP and our code of business ethics and other policies beginning on page 5 of this Annual Report on Form 10-K/A and page 84 of the Circular.
Clawbacks
Our clawback policy allows the Board to recoup short and long-term incentive compensation paid to a current or former senior executive if:
| • | the incentive compensation received was calculated based on financial results that were subsequently materially restated or corrected, in whole or in part; |
| • | the executive engaged in gross negligence, fraud or intentional misconduct that caused or contributed to the need for the restatement or correction, as admitted by the executive or as reasonably determined by the Board; and |
| • | the incentive compensation would have been lower based on the restated or corrected results. |
The Board has sole discretion to determine whether it is in our best interests to pursue reimbursement of all or part of the incentive compensation and these actions would be separate from any actions by law enforcement agencies, regulators or other authorities.
Anti-hedging
Our disclosure and insider trading and reporting policy prohibits directors, executive officers and employees from buying financial instruments that are designed to hedge or offset a decrease in the market value of equity awards or CP shares they hold directly or indirectly.
Anti-pledging
Our anti-pledging policy prohibits directors and executive officers from holding any CP securities in a margin account or otherwise pledging the securities as collateral for a loan.
14
Table of Contents
Total direct compensation consists of salary, an annual short-term incentive and a long-term incentive award that focus executives on driving strong financial, operational and customer satisfaction results and building shareholder value. Executives also receive pension benefits and perquisites as part of their overall compensation.
| Element | Purpose | Risk mitigating features | Link to business and talent strategies |
New in 2017 | ||||||
|
|
Salary Cash (see page 16) |
• competitive level of fixed pay • reviewed annually |
• external advisor benchmarks against our comparator group to ensure appropriate levels and fairness |
• attract and retain talent • no automatic or guaranteed increases to promote a performance culture |
||||||
|
|
Short-term incentive Cash bonus (see page 16) |
• annual performance incentive to attract and retain highly qualified leaders • set target awards based on level |
• set target performance at the beginning of the year to assess actual performance at the end of the year • actual payouts are based on the achievement of pre-determined corporate and individual objectives • corporate performance has an operating income hurdle • payouts are capped • no guarantee of a minimum payout |
• attract and retain highly qualified leaders • motivate high corporate and individual performance • use metrics that are based on the strategic plan and approved annually • align personal objectives with area of responsibility and role in achieving operating results |
New measures and weightings:
• operating ratio reduced from 50% to 40% • operating income increased from 25% to 40% • added a safety measure at 10% • added an operational | |||||
| Deferred compensation Deferred share units (see page 48) |
• encourages share ownership • executives can elect to receive the short-term incentive in DSUs if they have not yet met their share ownership requirement • company provides a 25% match of the deferral amount in DSUs |
• deferral limited to the amount needed to meet the executive’s share ownership guidelines • aligns management interests with growth in shareholder value • helps retain key talent • company contributions vest after three years |
• sustained alignment of executive and shareholder interests because the value of DSUs is tied directly to our share price • cannot be redeemed for cash until six months after the executive leaves CP |
|||||||
| Long-term incentive (LTIP) (see page 20) |
New allocation | |||||||||
| Performance share units (see page 22) |
• equity-based incentive aligns with shareholder interests and focuses on three-year performance • accounts for 60% of an executive’s long-term incentive award (up from 50% in 2016) |
• use pre-defined market and financial metrics • the number of units that vest is based on a performance multiplier that is capped • no guarantee of a minimum payout |
• focuses the leadership team on achieving challenging performance goals • ultimate value based on share price and company performance • attract and retain highly qualified leaders |
Represents 60% of LTIP award for executives (100% for other levels of management)
New measures and weightings:
• return on invested capital replaces operating ratio • update of peer group for assessing relative TSR • increased the weighting of TSR from 20% to 40% | ||||||
| Stock options (see page 23) |
• accounts for 40% of an executive’s long-term incentive award (down from 50% in 2016) • vest over four years, term is now seven years |
• focuses on appreciation in our share price, aligning with shareholder interests • only granted to executives |
• focuses the leadership team on creating sustainable long-term value |
Represents 40% of LTIP award for executives
Grants in 2017 and later have a seven-year term, down from | ||||||
|
|
Pension Defined contribution pension plan (see page 47) |
• pension benefit based on pay and service and competitive with the market • supplemental plan for executives and senior managers |
• balances risk management of highly performance-focused pay package |
• attract and retain highly qualified leaders |
||||||
| Perquisites Flexible spending account (see page 42) |
• competitive with the market |
• new restrictions for the CEO |
• attract and retain highly qualified leaders |
No tax equalization for the CEO
Use of aircraft limited to corporate travel and family visits within North America | ||||||


15
Table of Contents
Salary
Salaries are set every year based on the executive’s performance, leadership abilities, responsibilities and experience as well as succession and retention considerations. The Compensation Committee also considers the economic outlook and the median salary and practices of the comparator group before making its decisions.
The table below shows the annual salaries the named executives were paid as at December 31, 2017.
| 2017 | % change from 2016 | |||||
| Keith Creel |
US$1,125,000 | 17.6% | ||||
| Nadeem Velani |
$460,000 | 10.8% | ||||
| Robert Johnson |
US$435,000 | 0% | ||||
| Laird Pitz |
US$366,000 | 4.6% | ||||
| Jeff Ellis |
$445,000 | 0% | ||||
Mr. Creel received a 17.6% increase when he became CEO on January 31, 2017. Mr. Velani received a step increase to bring his salary closer to the market median as a result of his appointment as Executive Vice-President and CFO. Mr. Pitz received an increase in 2017 when he was promoted to Senior Vice-President and Chief Risk Officer.
Short-term incentive plan
The short-term incentive award is an annual incentive that focuses executives on achieving strong financial, safety and operational results.
| What it is | • Cash bonus for achieving pre-determined annual corporate and individual performance objectives that are tied directly to our strategy and operational requirements • Target awards are based on the executive’s level, benchmarked at the 50th percentile of our peer group and expressed as a percentage of base salary | |
| Payout | • Corporate performance is assessed against financial, safety and operational measures • Individual performance is assessed against individual performance objectives • No guarantee of a minimum payout | |
| Restrictions | • Must meet minimum level of performance • Must achieve corporate operating income hurdle for any payout on individual or corporate performance to occur • Performance multiplier is capped for exceptional performance • Actual award is capped as a percentage of base salary | |
| If the executive retires | • Executive must give three months’ notice • Award for the current year is pro-rated to the retirement date |
16
Table of Contents
The table below shows the 2017 short-term incentive awarded to the named executives. Salaries in U.S. dollars have been converted into Canadian dollars using an average exchange rate of $1.2986.
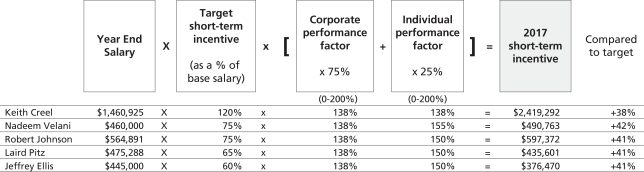
We use financial and non-financial measures to assess corporate performance. Individual performance is assessed against individual performance objectives for the year and other pre-determined goals that reflect the strategic and operational priorities critical to each executive’s role.
Corporate and individual performance factors are at capped at 200% to limit payouts and avoid excessive risk-taking.
An employee’s payout on the individual component of the STIP may be zero or range from 50% to 200%. Any award payable under the individual component is subject to a minimum level of corporate performance. No award is payable unless the minimum corporate hurdle is achieved.
| We created a balanced scorecard to assess performance and support our focus on growth by: • increasing the emphasis on operating income and reducing the emphasis on cost reduction so the two metrics have equal weighting • introducing two non-financial measures to the scorecard: safety and operating performance.
Safety and operating performance had previously formed part of the individual performance assessment. Including the two measures in the scorecard with specific targets and weightings creates more rigour and transparency in the performance assessment. |
New in 2017 We changed the weightings of two core financial measures to support our growth strategy and introduced two non-financial measures to create a more balanced assessment of performance.
Free cash flow was removed as a metric given its volatility from year to year. The weighting of ROIC was increased as a long-term measure to ensure we deploy free cash flow in a responsible manner.
|
17
Table of Contents
Corporate performance
The table below shows the 2017 scorecard and results. The targets were set with adequate stretch to motivate strong performance.
The Board sets a corporate hurdle for operating income. There is no payout if we do not achieve that corporate hurdle. If we achieve the hurdle but corporate performance is below threshold for all measures, then only the individual performance factor is used to calculate the awards. Corporate results between 50% and 200% of target are interpolated. For 2017, the operating income hurdle was set at $2 billion.
| Performance measure |
Why it’s important | Threshold (50%) |
Target (100%) |
Exceptional (200%) |
2017 reported result |
2017 STIP result |
Weighting | Score | ||||||||||||||||||||||
| Financial measures |
||||||||||||||||||||||||||||||
| STIP Operating ratio Operating expenses divided by total revenues based on an assumed fuel price and foreign exchange rate |
Continues our focus on driving down costs while focusing on growth strategy |
57.50 | % | 57.25 | % | 56.75 | % | 57.4 | % | adj. 57.1 | % | |
40% (new) (reduced |
|
137 | % | ||||||||||||||
| STIP Operating income ($ millions) Total revenues less total operating expenses based on an assumed foreign exchange rate |
Highlights the importance of revenue growth to our corporate strategy |
2,705 | 2,745 | 2,865 | 2,793 | |
adj. 2,816 |
|
|
40% (new) (increased |
|
159 | % | |||||||||||||||||
| Safety measure (new) |
||||||||||||||||||||||||||||||
| Federal Railroad Administration’s (FRA) frequency of train accidents per million train miles relative to Class 1 railroads |
Safety is our top priority, and the measure pays out at maximum only if we achieve the stretch target and remain the best in the industry
Introducing this measure recognizes the feedback we received from shareholders who asked for safety to be explicitly included as a performance measure |
1.30 | 1.19 | 1.15 | 0.99 | 0.99 | 10% | 200 | % | |||||||||||||||||||||
| Operating measure (new) |
||||||||||||||||||||||||||||||
| Train speed measures the time and movement of trains in miles per hour from origin to destination It is a key component of trip plan compliance and critical to the service we provide customers and to our growth strategy. Trip plan compliance, as a stand-alone measure, is a relatively new measure at CP. In 2018, now that we have built up enough historical data, we plan to use it as an operating performance measure for STIP rewards. |
Train speed reflects our operating performance and is a key measure for improved asset utilization and delivery times, leading to an enhanced customer experience
Introducing this measure incorporates feedback from shareholders and provides a more balanced scorecard of performance criteria |
23.7 | 24.0 | 24.6 | 23.4 | 23.4 | 10% | 0 | % | |||||||||||||||||||||
| Corporate performance factor |
138 | % | ||||||||||||||||||||||||||||
Notes:
| • | The measurement of train speed excludes bulk trains, local trains, passenger trains and trains used for repairing track. Hours of delay caused by customer and foreign railroad issues are removed from the transit time. For all mainline trains, total train hours (excluding foreign railway and customer delays), divided by total train miles. |
| • | The target for train speed recognized that 2016 was a record year supported by an environment with softer volumes. Maintaining the target reflected an expectation that speed would be maintained as the network gained more volume. |
| • | The 2017 target for the frequency of train accidents per million train miles relative to Class 1 railroads was based on the three-year average. CP has been a leader in safety for over a decade, and 2016 was a record safety year by CP and industry standards. The 2017 target reflected an expectation that CP would maintain its industry-leading safety performance. |
18
Table of Contents
CP delivered record financial performance in 2017. A growing top line coupled with disciplined cost control measures produced record operating income and adjusted earnings for the company. The reported operating ratio came in at 57.4% and reported operating income was $2,793 million – both are all-time bests for the company. From a safety perspective, CP’s personal injury rate improved one percent and our train accident frequency led the industry in this key safety metric. In 2017, CP continued to invest significantly in the capital program with an overall investment of $1.34 billion during 2017 while at the same time maintaining its strong commitment to shareholders by returning $691 million through share buybacks and dividends.
The Compensation Committee may adjust the results for unusual or non-recurring items that are outside our normal business and do not accurately reflect our ongoing operating results or business trends and affect the comparability of our financial performance year over year. Results under the short-term incentive plan may therefore differ from our reported GAAP results. Significant items that were adjusted so that they do not impact, either favourably or unfavourably, the assumptions made when the STIP targets were planned include: a management transition recovery related to the retirement of Hunter Harrison as CEO; foreign exchange; fuel price; and land sales, all of which were adjusted to reflect assumptions made in our 2017 budget in order to incent good business decisions, made at the right time, to receive the best return.
Assessing individual performance
Executives set individual performance objectives before the start of every financial year.
The individual performance factor is based on the executive’s performance against those objectives and other pre-defined quantitative and qualitative goals that reflect the strategic and operational priorities critical to each executive’s role, including operational management, safety, financial and other objectives.
Each objective has a minimum, target and maximum. The individual performance factor ranges from 0% to 200%.
| 2017 individual performance factor |
In response to shareholder feedback, in 2016 we introduced a cap on the
This makes sure that the payout factor | |||||||||||||
| Keith Creel |
138% | |||||||||||||
| Nadeem Velani |
155% | |||||||||||||
| Robert Johnson |
150% | |||||||||||||
| Laird Pitz |
150% | |||||||||||||
| Jeffrey Ellis |
150% | |||||||||||||
| The Compensation Committee sets the individual performance factor for the CEO. The CEO reviews the performance of his direct reports against their objectives, and recommends their individual performance factors to the Compensation Committee. | ||||||||||||||
See the profiles beginning on page 27 to read about each executive’s individual performance in 2017.
Compensation Committee Discretion
The Compensation Committee has developed principles for the use of discretion. Adjustments should not relieve management from the consequences of their decision-making. Adjustments should also neither reward nor penalize management for decisions on discretionary transactions, events outside their control (such as foreign exchange rates and fuel prices that are beyond the assumptions used in the planning process) or transactions outside normal corporate planning and budgeting.
As a result, the Compensation Committee can reduce the corporate performance factor for any executive officer as it deems appropriate, as long as it follows the principles. The Board can also use its discretion to adjust the targets and payouts up or down, following the principles set out by the Compensation Committee.
19
Table of Contents
Long-term incentive plan
| Long-term incentive awards focus executives on medium and longer-term performance to create sustainable shareholder value.
Target awards are set based on the competitive positioning of each executive’s compensation and the practices of companies in our peer group in order to attract and retain experienced railroad executives with highly specialized skills. |
New in 2017 To ensure a stronger link between pay and performance, the allocation of performance share units was increased to 60% and the allocation of stock options was reduced to 40% (previously the weighting was 50% for each).
The stock option term was shortened from ten years to seven years
|
| Performance share units (60%) | Stock options (40%) | |||
| What they are | • Notional share units that vest at the end of three years based on absolute and relative performance and the price of CP common shares |
• Rights to buy CP shares at a specified price in the future | ||
| Vesting and payout |
• Cliff vest at the end of three years based on performance against three pre-defined financial and market metrics
• No guarantee of a minimum payout |
• Vest 25% every year beginning on the anniversary of the grant date
• Expire at the end of seven years (down from ten years)
• Only have value if our share price increases above the exercise price | ||
| Dividend equivalents | • Earned quarterly and compound over the three-year period |
• Do not earn dividend equivalents | ||
| Restrictions | • Must meet minimum level of performance
• Performance multiplier is capped for exceptional performance |
• Cannot be exercised during a blackout period | ||
| If the executive retires |
• Must give three months’ notice
• Award continues to vest and executive is entitled to receive the full value as long as they have worked for six months of the performance period, otherwise the award is forfeited |
• Must give three months’ notice
• Options continue to vest, but expire five years after the retirement date or on the normal expiry date, whichever is earlier |
Stock options are usually granted in January immediately after the fourth quarter financial statement blackout period ends, while performance share units (PSUs) are awarded in February after the Compensation Committee has reviewed the year-end financial results in detail.
At the CEO’s recommendation, the Board may eliminate or adjust an executive’s actual grant (but may not increase a grant more than 25% above an executive’s target). In determining adjustments, the Compensation Committee considers the competitive positioning of each individual’s compensation, among other factors.
The Board does not take into consideration the amount or terms of previous awards when making grants because:
| • | it could encourage an option holder to exercise their options earlier than planned to avoid a reduction in future grants because of a significant number of outstanding options |
| • | it might disadvantage long-serving employees and others who are committed to the stock |
| • | long-term incentive awards are granted to motivate and the value is contingent on strong future performance |
20
Table of Contents
Grants are also made for special situations like retention or new hires. Special grants can include PSUs, RSUs, DSUs or options. These grants are made on the first Tuesday of the month following approval. If we are in a blackout period, the grant is made after the blackout has been lifted.
2017 long-term incentive awards
To determine the appropriate value of long-term incentive grants provided to the named executives, the Compensation Committee considers the practices of our comparator group and external market data as well as internal factors including executive retention, dilutive impact and long-term value creation. The CEO did not recommend any adjustments to the 2017 awards.
The table below shows the 2017 long-term incentives awarded to the named executives.
| Target as a % of base salary | ||||
| Keith Creel |
400% | |||
| Nadeem Velani |
225% | |||
| Robert Johnson |
225% | |||
| Laird Pitz |
115% | |||
| Jeffery Ellis |
115% | |||
| 2017 long-term |
||||||||||||||||||||||||||||
| incentive | > | Allocation | ||||||||||||||||||||||||||
| award | Performance share units | Stock options | ||||||||||||||||||||||||||
| (grant value) | $ | # | $ | # | ||||||||||||||||||||||||
| Keith Creel |
14,924,418 | 4,407,788 | 22,294 | 10,516,630 | 229,871 | |||||||||||||||||||||||
| Nadeem Velani |
985,045 | 782,395 | 3,903 | 202,650 | 4,644 | |||||||||||||||||||||||
| Robert Johnson |
1,514,778 | 958,705 | 4,849 | 556,073 | 11,557 | |||||||||||||||||||||||
| Laird Pitz |
622,931 | 394,237 | 1,994 | 228,694 | 4,753 | |||||||||||||||||||||||
| Jeffrey Ellis |
604,199 | 386,888 | 1,930 | 217,311 | 4,980 | |||||||||||||||||||||||
Notes:
| • | See the summary compensation table on page 41 for details about how we calculated the grant date fair values of the performance share units and stock options. Both were calculated in accordance with FASB ASC Topic 718. |
| • | The amount for Mr. Creel includes the performance stock option grant that he received in 2017 as described below. |
| • | The grant value of the awards based on the NYSE trading price has been converted to Canadian dollars using a 2017 average exchange rate of $1.2986. |
As disclosed in last year’s proxy, when Mr. Creel became CEO on January 31, 2017, he received a special grant of performance stock options, designed to motivate strong CEO performance, build his equity ownership and retain him during a period of significant change in the railroad industry. To make the upfront grant, the Compensation Committee reduced Mr. Creel’s target long-term incentive award to 400% of salary for the next five years (from the market median of 500% among the Class 1 railroads), and used the difference (5 years x 100%) to make the award, which was allocated 100% to performance stock options (see page 23 for details about the vesting and performance conditions).
21
Table of Contents
Performance share units (PSUs)
| PSU awards focus executives on achieving medium-term goals within a three-year performance period.
The Board sets performance measures, thresholds and targets at the beginning of the performance period.
The number of units that vest is based on our performance over the three-year period. We must achieve threshold performance on a measure, otherwise the payout factor for that measure is zero and a portion of the award is forfeited. If performance is exceptional on a measure, the Board may approve a payout of up to 200%. |
New in 2017 We are putting more emphasis on return on invested capital and total shareholder return to better align incentive pay with shareholder interests.
Based on shareholder feedback, we eliminated operating ratio as a long-term measure to reduce overlap with the STIP measures.
|
PSUs earn additional units as dividend equivalents at the same rate as dividends paid on our common shares.
The award is paid out in cash based on the number of units that are earned and the average closing share price for the 30 trading days prior to the end of the performance period on the TSX or NYSE, as applicable. The award may be paid out in shares, on the CEO’s recommendation, using the after-tax value.
2017 PSU awards
The performance period for the 2017 PSU awards is January 1, 2017 to December 31, 2019. Performance will be assessed against the measures in the table below. Awards will be prorated if results fall between threshold and exceptional.
| 2017 PSU performance measures | Why the measure is important | Threshold (50%) |
Target (100%) |
Exceptional (200%) |
Weighting | |||||||||||||
| PSU three-year average return on invested capital (ROIC) Net operating profit after tax divided by average invested capital |
Focuses executives on the effective use of capital as we grow. Ensures shareholders’ capital is employed in a value-accretive manner |
14.5% | 15% | 15.5% | |
60% (new) (increased |
| |||||||||||
| Total shareholder return Measured over three years. The percentile ranking of CP’s CAGR relative to the companies that make up the S&P TSX Capped Industrial Index |
Compares our TSR to a broad range of Canadian investment alternatives Aligns long-term incentive compensation with long-term shareholder interests
|
|
25th percentile |
|
|
50th percentile |
|
|
75th percentile |
|
|
20% (new) (increased |
| |||||
| Total shareholder return Measured over three years. The percentile ranking of CP’s CAGR relative to the companies that make up the S&P 1500 Road and Rail Index |
Compares our TSR to the companies that make up the S&P 1500 Road and Rail Index, a broad range of transportation peers, rather than the narrow group of publicly traded Class 1 peers making the payout less volatile and more consistent with the broader industry
Aligns long-term incentive compensation with long-term shareholder interests |
|
25th percentile |
|
|
50th percentile |
|
|
75th percentile |
|
|
20% (new) (increased |
| |||||
At the end of the three-year performance period, the starting point for determining relative TSR will be the 10-day trading average of the closing price of CP shares on the two indices prior to January 1, 2017 and the closing point will be the 10-day trading average of the closing price of CP shares on the two indices prior to December 31, 2019. TSR is adjusted over the period to reflect dividends paid and the multiplier is interpolated if our performance falls between the ranges. If results are below the threshold level for any of the performance measures, units for that specific measure will be forfeited.
22
Table of Contents
Stock options
| Stock options focus executives on longer-term performance. Options have a seven-year term and vest 25% each year beginning on the anniversary date of the grant. The grant price is the last closing price of our common shares on the TSX or the NYSE on the grant date. Options only have value for the holder if our share price increases above the grant price.
2017 stock option awards
The table below shows the details of the 2017 annual option award grant. |
New in 2017 We reduced the term of stock options granted in 2017 and later to seven years from ten years.
|
| Grant value ($) | # of options | Grant price | ||||||||||
| Keith Creel |
1,630,352 | 33,884 | US$150.99 (NYSE) | |||||||||
| 896,816 | 18,762 | US$151.14 (NYSE) | ||||||||||
| Nadeem Velani |
202,650 | 4,644 | $201.49 (TSX) | |||||||||
| Robert Johnson |
556,073 | 11,557 | US$150.99 (NYSE) | |||||||||
| Laird Pitz |
228,694 | 4,753 | US$150.99 (NYSE) | |||||||||
| Jeffrey Ellis |
217,311 | 4,980 | $201.49 (TSX) | |||||||||
The grant value of the stock option awards based on the NYSE trading price have been converted to Canadian dollars using a 2017 average exchange rate of $1.2986.
As disclosed in last year’s proxy, when Mr. Creel became CEO on January 31, 2017, he received a special grant of performance stock options, designed to motivate strong CEO performance, build his equity ownership and retain him during a period of significant change in the railroad industry (see below and the details on page 29). Mr. Creel also received an annual option award of $1,630,352 that was granted on January 20, 2017, and his grant of $896,816 on February 1, 2017 reflects the additional options he received to bring him to the CEO level of 400% of salary. See summary compensation table on page 41 for more information.
We calculated the number of options to be granted to each executive by dividing the grant value by the theoretical value of an option (using the Willis Towers Watson binomial option pricing methodology), applied to our 30-day average closing share price on the TSX or the NYSE prior to the day of the grant.
CEO performance stock options
Mr. Creel’s performance stock options cliff vest on February 1, 2022 (five years from the grant date) based on our five-year total shareholder return relative to two equally weighted measures:
| • | 50% of the options will vest if our TSR is at or above the 60th percentile of the companies that make up the S&P/TSX Capped Industrial Index |
| • | the other 50% of the options will vest if our TSR is at or above the 60th percentile of the companies that make up the S&P 1500 Road and Rail Index. |
Performance will be assessed over a five-year period. The starting point for determining relative TSR will be the 10-day trading average of the closing price of CP shares and the two indices prior to February 1, 2017 and the closing point will be the 10-day trading average of the closing price of CP shares and the two indices prior to January 31, 2022. The options expire on February 1, 2024. The table below shows the details of the special, upfront grant of performance stock options.
| Grant value ($) | # of options | Exercise price | ||||||||||
| Keith Creel |
7,989,462 | 177,225 | US$151.14 (NYSE) | The performance stock options expire after seven years. | ||||||||
The grant value of the performance stock options is based on our shares traded on the NYSE and have been converted to Canadian dollars using a 2017 average exchange rate of $1.2986.
23
Table of Contents
About the stock option plan
The management stock option incentive plan (stock option plan) was introduced in October 2001.
Regular stock options granted before 2017 expire 10 years from the date of grant and generally vest 25% each year over four years, beginning on the anniversary of the grant date.
Stock options awarded January 1, 2017 and later have a seven-year term (reduced from 10 years). If the expiry date falls within a blackout period, the expiry date will be extended to 10 business days after the end of the blackout period date. If a further blackout period is imposed before the end of the extension, the term will be extended another 10 days after the end of the additional blackout period.
The table below sets out the limits for issuing options under the plan:
| As a % of the number of shares outstanding | ||
| Maximum number of shares that may be reserved for issuance to insiders as options |
10% | |
| Maximum number of options that may be granted to insiders in a one-year period |
10% | |
| Maximum number of options that may be granted to any insider in a one-year period |
5% | |
| As a % of the number of shares outstanding at the time the shares were reserved | ||
| Maximum number of options that may be granted to any person |
5% |
We measure dilution by determining the number of options available for issuance as a percentage of outstanding shares. Our potential dilution at the end of 2017 was 2%. The maximum dilution allowed by the Board is 7%.
The option grant price is the last closing market price of shares on the grant date on the TSX or the NYSE (for grants after December 15, 2014 depending on the currency of the grant).
The table below shows the burn rate for the last three fiscal years, calculated by dividing the number of stock options granted in the fiscal year by the weighted average number of outstanding shares for the year.
| (as at December 31) | 2015 | 2016 | 2017 | |||||||||
| Number of options granted |
317,202 | 403,740 | 396,980 | |||||||||
| Weighted number of shares outstanding |
159,733,222 | 149,565,498 | 145,863,318 | |||||||||
| Burn rate |
0.20% | 0.27% | 0.25% | |||||||||
The table below shows the options outstanding and available for grant as at December 31, 2017.
| Number of options/shares | Percentage of outstanding shares | |||||||
| Options outstanding (as at December 31, 2017) |
1,361,950 | 0.94 | ||||||
| Options available to grant (as at December 31, 2017) |
1,555,922 | 1.07 | ||||||
| Shares issued on exercise of options in 2017 |
319,403 | 0.22 | ||||||
| Options granted in 2017 |
369,980 | 0.26 | ||||||
Since the launch of the management stock option incentive plan in October 2001, a total of 18,078,642 shares have been available for issuance under the plan and 15,160,770 shares have been issued through the exercise of options.
A stand-alone option award was granted to Mr. Creel in 2013, as disclosed in prior proxy circulars. The award was not granted under the management stock option incentive plan.
We do not provide financial assistance to option holders to facilitate the purchase of shares under the plan.
24
Table of Contents
Other things to know
There is a double trigger on options so that if there is a change of control and only if an option holder is terminated without cause, all of his or her stock options will vest immediately according to the change in control provisions in the stock option plan.
If an employee retires, the options continue to vest and expire on the original expiry date or five years from retirement, whichever is earlier.
If an employee is terminated without cause, the employee has six months to exercise any vested options. If the employee resigns, the employee has 30 days to exercise any vested options. If an employee is terminated with cause all options are cancelled.
Options will continue to vest and expire on its normal expiry date if the holder’s employment ends due to permanent disability.
If an option holder dies, the options will expire 12 months following his death and may be exercised by the holder’s estate. Options can only be assigned to the holder’s family trust, personal holding corporation or retirement trust, or a legal representative of an option holder’s estate or a person who acquires the option holder’s rights by bequest or inheritance.
The CEO, the Chairman of the Board and the Compensation Committee chair have authority to grant options to certain employees based on defined parameters, such as the position of the employee and the expected value of the option award:
| • | In 2016, the Compensation Committee authorized a pool of 100,000 options for allocation by the CEO, who granted 3,150 options to one employee to recognize performance and for retention. |
| • | The Compensation Committee reduced the approved amount in 2017 to 50,000 for allocation by the CEO and 3,998 were granted from this pool. |
The Compensation Committee has again approved 50,000 options that the CEO may allocate at his discretion in 2018.
Making changes to the plan
The Board can make the following changes to the plan without shareholder approval:
| • | changes to clarify information or to correct an error or omission |
| • | changes of an administrative or a housekeeping nature |
| • | changes to eligibility to participate in the plan |
| • | terms, conditions and mechanics of granting stock option awards |
| • | changes to vesting, exercise, early expiry or cancellation |
| • | amendments that are designed to comply with the law or regulatory requirements. |
The Board must receive shareholder approval to make other changes, including the following, among other things:
| • | an increase to the maximum number of shares that may be issued under the plan |
| • | a decrease in the exercise price |
| • | a grant of options in exchange for, or related to, options being cancelled or surrendered. |
The Board has made two amendments to the plan since it was introduced in 2001:
| • | On February 28, 2012, the plan was amended so that a change of control would not trigger accelerated vesting of options held by a participant, unless the person is terminated without cause or constructively dismissed |
| • | On November 19, 2015, the plan was amended to provide net stock settlement as a method of exercise, which allows an option holder to exercise options without the need for us to sell the securities on the open market, resulting in less dilution. |
25
Table of Contents
Payout of 2015 PSU award
The 2015 PSU grant for the period of January 1, 2015 to December 31, 2017 was paid out on February 23, 2018. The named executives received a payout of 160% on the award which includes dividends earned up to the payment date. The table below shows the difference between the actual payout value and the grant value for each named executive.
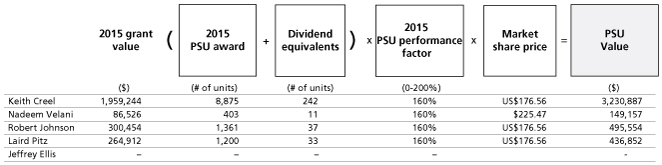
For Mr. Velani, the market share price was calculated using $225.47, the average 30-day trading price of our shares prior to December 31, 2017 on the TSX. For Mr. Creel, Mr. Johnson and Mr. Pitz, the market share price was US$176.56, the average 30-day trading price of our shares prior to December 31, 2017 on the NYSE, and the value of these shares were converted to Canadian dollars using the year-end exchange rate of $1.2545. For comparability, for Mr. Creel, Mr. Johnson and Mr. Pitz, the 2015 grant value was converted using an exchange rate of 1.2787.
Mr. Ellis was not eligible for the 2015 Performance Plan payout as he was not an employee of CP at the time of grant.
How we calculated the 2015 PSU performance factor
The PSU performance factor for the three-year period from January 1, 2015 to December 31, 2017 is 160%, as shown in the table below. The payout value has been calculated in accordance with the terms of the performance share unit plan and the 2015 award agreement.
| PSU measures | Threshold 50% |
Target 100% |
Maximum 200% |
PSU Result |
Weighting | Factor | ||||||||||||||||||
| PSU Operating ratio Operating expenses divided by total revenues |
64% | 62% | 60% | adj. 57.1% | 50% | 200% | ||||||||||||||||||
| PSU 2015 to 2017 average ROIC Net operating profit after tax divided by average invested capital |
13% | 14% | 15% | adj. 15.1% | 30% | 200% | ||||||||||||||||||
| Total shareholder return Three-year CAGR relative to the S&P/TSX 60 Index |
0% | 1% | 5% | -5.6% | 10% | 0% | ||||||||||||||||||
| Total shareholder return Ranking at the end of the three years relative to Class 1 Railroads |
4 | 3 | 1 | 5 | 10% | 0% | ||||||||||||||||||
| PSU performance factor |
160% | |||||||||||||||||||||||
We make certain assumptions when we set the plan targets. Results under the PSU plan are adjusted to reflect changes to those assumptions so we measure the true operating performance of the business. Operating ratio was adjusted to reflect the following items: foreign exchange, the impact of a higher than forecast on-highway diesel (OHD) and land sales. ROIC was adjusted for the performance of the pension plan as its impact on the balance sheet was not a good indication of management’s ability to deliver returns from the core business on its invested capital.
26
Table of Contents
KEITH E. CREEL PRESIDENT AND CHIEF EXECUTIVE OFFICER
|
|
Mr. Creel was appointed as the President and Chief Executive Officer (CEO) on January 31, 2017. Mr. Creel was previously CP’s President and Chief Operating Officer (COO).
Prior to joining Canadian Pacific, Mr. Creel had a very successful operating career which began at Burlington Northern as a management trainee in operations and eventually led to his becoming the EVP and COO at CN in 2010.
Mr. Creel obtained a Bachelor of Science in marketing from Jacksonville State University and has completed the Advanced Management Program at the Harvard Business School. He served as a commissioned officer in the U.S. Army during which time he served in the Persian Gulf War. |

2017 performance
Keith Creel was appointed President and CEO on January 31, 2017, a planned transition that had been in place since he was recruited to CP in February 2013 as President and COO. As President and CEO, Mr. Creel is responsible for providing leadership and strategic vision for CP leading CP’s transition from a corporate turnaround to a growth-focused company.
In 2017 Mr. Creel focused on the following key areas:
| 1. | Strategic direction |
| 2. | Employee engagement and team development |
| 3. | Business development |
| 4. | Operating and safety performance |
| 5. | Stakeholder engagement |
2017 highlights
CP delivered record financial and safety performance in 2017.
Our total revenues grew by 5% to $6.55 billion which, combined with our disciplined operating model, produced record operating income and an all-time best operating ratio.
We invested $1.34 billion in our capital program and demonstrated our commitment to shareholders by returning approximately $691 million through share buybacks and dividends. We also increased our quarterly dividend by 12.5%, from $0.50 to $0.5625, and announced a new share repurchase program. Our total shareholder return for 2017 was 21%.
Throughout, we remained steadfast in our commitment to safety. We improved our train accident frequency rates by 12%, which marked the 12th consecutive year that we have led the industry on this key safety metric.
Strategic direction
Mr. Creel’s planned succession to the President and CEO role began when he arrived at CP in 2013 to work alongside the late legendary railroader Hunter Harrison and lay out a path for CP. CP achieved an extraordinary turnaround under the leadership of Mr. Harrison and Mr. Creel.
As President and CEO, Mr. Creel quickly began setting the direction for the next chapter of the CP story. CP has spent the last five years right sizing the organization and our asset base and improving our operations and service using CP’s precision railroading model. Our network now has the fastest and shortest transit times in the key markets we serve. Mr. Creel is leveraging those strengths and applying his 20-plus years of railroading experience and the talent of his leadership team to grow our top line and achieve long term sustainable growth.
Our focus on safety, service and innovation, combined with our financial strength and our ability to capitalize on our network and deliver in a disciplined and cost-effective way, are key elements for achieving our strategy.
Employee engagement and team development
Building on his commitment to our people when he joined CP, Mr. Creel has devoted a significant amount of time in 2017 to deepen our relationship with employees in all areas of the business and support retention to help our future growth. He hosted a series of town halls and implemented CEO round tables to hear first-hand from employees across our network and respond to their questions, concerns and ideas about our strategy and our business. Under Mr. Creel’s leadership, CP conducted an employee engagement survey for non-union employees, to solicit feedback and identify areas for opportunity. Mr. Creel is leading our efforts to increase diversity throughout the organization. At Mr. Creel’s direction we are also introducing new programs and tools to strengthen leadership and accountability, improve retention and outreach, and support the recruitment of women and indigenous peoples.
27
Table of Contents
Significant work was done in 2017 to collaborate proactively with our union partners to reach a number of long-term labour agreements before expiry. Ratification of the new five-year agreements with the Canadian Pacific Police Association, the United Steelworkers (USW) and the Teamsters Canada Rail Conference Maintenance of Way Employees Division (TCRC-MWED) bring labour stability for the company and our employees and align employees’ interests with our growth objectives, while supporting a common vision that was in the best interest of all stakeholders.
As part of his appointment as President and CEO, Mr. Creel established a new leadership team and structure that better leverages our best-in-class service to meet the needs of current and future customers and support our long term sustainable growth strategy in the years ahead. These changes include the appointment of John Brooks as Chief Marketing Officer and the recruitment of two new vice-presidents in sales and marketing.
Business development
CP is creating the foundation for top line growth by focusing on new business opportunities and enhancing service. In 2017 we expanded our market reach through initiatives such as our sales presence in Asia, daily service from Vancouver to Detroit, and expansion into the Ohio Valley. CP is the first railroad to offer a direct route from Vancouver to the Ohio Valley. We are already experiencing gains in market share through these enhanced offerings.
Additionally, we enhanced our service offerings such as our new “live” lift operation at Portal, North Dakota, our new large-scale, multi-commodity transload facility in Vancouver, and the roll out of our Auto Grate technology at all of our intermodal terminals. These initiatives makes it easier and faster for our customers to do business, provide more efficient transload services and increase network fluidity which provides our customers with a strategic advantage.
Operating and safety performance
We remain grounded in our foundations of precision railroading and continue to fine-tune our operations in our constant pursuit of operational, service and safety excellence while controlling costs. In 2017, CP moved 5% more volume, while sustaining key operating metrics and improving overall safety performance. CP ended 2017 with an industry-leading FRA train accident rate of 0.99. This result not only represents a 12% improvement over 2016, but also represents the 12th consecutive year that CP has led the industry on this metric. CP’s FRA personal injury rate was 1.65, a 1% improvement over 2016.
In 2017, CP continued to roll out its Home Safe program – an initiative designed to take CP’s safety culture to the next level. Home Safe is a commitment to be vigilant about personal safety and the safety of co-workers. It is based on 100% compliance to operating rules and safety practices, partnering with all employees, and treating each other with mutual respect. It is the commitment each employee makes to watch out for each other and to let someone know if they are at risk.
Mr. Creel also championed our trip plan effort. His leadership has involved setting clear direction and expectations on how to set and measure trip plans, and hold Operations accountable for execution. In 2017, CP continued to develop and refine our ability to measure trip plan. Trip plan is a detailed schedule for a shipment that has become CP’s cornerstone operating principle. It aligns our service plan and customer expectations, from cut-off to local service, through to the delivery at destination. Through trip plan, CP is generating superior service that is consistent and aligned with market requirements, while controlling costs through improved efficiencies. CP will continue to refine and enhance our trip planning processes in 2018, by modifying schedules and business rules to ensure we meet market needs.
Stakeholder engagement
Mr. Creel led a range of engagement activities in 2017 with a broad group of external stakeholders, including shareholders, senior legislators and policy makers, regulators, First Nations, and industry associations. Mr. Creel had numerous meetings in Ottawa and other locations to advocate for a balanced approach to industry regulation and legal changes to allow the proactive use of locomotive voice and video recorders to prevent incidents and improve rail safety. He had discussions with senior government officials in Canada and the U.S. to discuss the importance of the North American Free Trade Agreement to the North American economy. In addition, Mr. Creel met with current and prospective shareholders to thoroughly communicate our growth strategy and build confidence in the new management team.
All of these initiatives support our efforts to build on our operating efficiency, customer service and safety record, without compromise, and focus on growing CP into the future and creating long-term value for our customers, our employees and our shareholders. The Compensation Committee completed the assessment of CEO performance, which was discussed with and approved by the Board. Mr. Creel was assessed as exceeding his overall individual performance objectives and leading the company to achieve strong corporate performance.
28
Table of Contents
2017 compensation
The table below shows the compensation awarded to Mr. Creel for 2017, compared to the previous two years.
|
|
Compensation ($’000) | 2017 | 2016 | 2015 | ||||||||||
| Fixed |
||||||||||||||
| Base earnings |
1,437 | 1,261 | 1,164 | |||||||||||
| Variable |
||||||||||||||
| Short-term incentive |
2,419 | 1,901 | 1,602 | |||||||||||
| Long-term incentive |
||||||||||||||
| - PSUs |
4,408 | 2,404 | 1,959 | |||||||||||
| - Stock options |
10,517 | 2,131 | 2,130 | |||||||||||
| Total direct compensation |
18,781 | 7,697 | 6,855 | |||||||||||
| Total target direct compensation |
9,058 | 6,336 | 5,836 | |||||||||||
|
Notes: Salary is the actual amount received that year. Payments made in U.S. dollars have been converted to Canadian dollars using an average exchange rate for the year: $1.2986 for 2017, $1.3248 for 2016 and $1.2787 for 2015.
In 2017, Mr. Creel received 177,225 performance stock options that cliff vest in five years based on our relative TSR against the companies that make up the S&P/TSX Capped Industrial Index and the companies that make up the S&P 1500 Road and Rail Index (see the 2017 Long-term incentive – CEO grant on page 23 and the summary compensation table on page 41 for details). |
| |||||||||||||
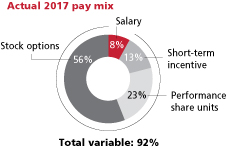
We signed a new employment agreement with Mr. Creel effective January 31, 2017, which sets out the terms of his compensation as CEO. The new agreement was designed to align his compensation closer to the market median of our peer group, does not include tax equalization and limits his use of the corporate aircraft to corporate travel and family visits within North America.
Salary
Mr. Creel received a 17.6% increase to US$1.125 million when he became CEO on January 31, 2017.
Short-term incentive
Based on our 2017 corporate performance and the assessment of his individual performance, Mr. Creel received a cash bonus of $2,419,292 for 2017, calculated as follows:
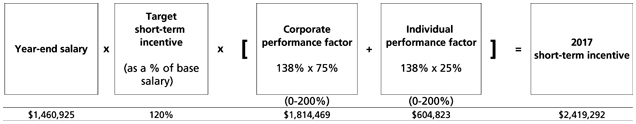
Year-end salary and the 2017 STIP award were paid in U.S. dollars and have been converted to Canadian dollars using an average exchange rate of $1.2986 for 2017.
Long-term incentive
Mr. Creel received annual 2017 long-term incentive awards with a total grant value of $6,934,956, 100% of his target award. The grant was allocated 60% PSUs and 40% stock options.
As disclosed in last year’s proxy, when Mr. Creel became CEO on January 31, 2017, he received a special grant of performance stock options, designed to motivate strong CEO performance, build his equity ownership and retain him during a period of significant change in the railroad industry. To make the upfront grant, the Compensation Committee reduced Mr. Creel’s target long-term incentive award to 400% of salary for the next five years (from the market median of 500% among the Class 1 railroads), and used the difference (5 years x 100%) to make the award, which was allocated 100% to performance stock options (see page 23 for details about the vesting and performance conditions).
29
Table of Contents
Realized and realizable pay
The value of Mr. Creel’s incentive compensation is based on our performance over the period and, for the long-term incentive, our share price when the awards vest.
The graph below shows the three-year average of Mr. Creel’s granted and realized and realizable pay from 2015 to 2017.
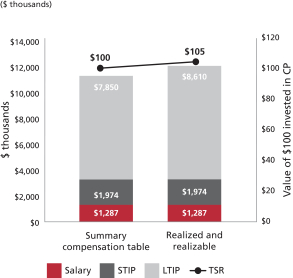
Notes:
Summary compensation table: average of salary earned, actual cash bonus received, and long-term incentives granted (using the grant date fair value from 2015 to 2017 as disclosed in the summary compensation table on page 41). The compensation figures have been converted to Canadian dollars using the following average exchange rates: $1.2787 for 2015, $1.3248 for 2016 and $1.2986 for 2017.
Realized and realizable: average of salary earned, actual cash bonus received, the value of long-term incentive awards that have vested or been exercised, and the estimated current value of unvested long-term incentive awards granted from 2015 to 2017:
| • | vested PSUs and stock options are valued at the time of vesting or exercise |
| • | the value of vested 2015 PSUs payable in February 2018 was calculated using the 30-day average trading price of our shares prior to December 31, 2017 of US$176.56 on the NYSE with a performance multiplier of 1.6 and includes dividends earned up to the payment date |
| • | the value of unvested 2016 and 2017 PSU’s are based on the closing price of our shares on December 29, 2017 of US$182.76 on the NYSE with a performance multiplier of 1.0. PSUs include reinvestment of additional units received as dividend equivalents |
| • | the value of unvested/unexercised stock options is based on the closing price of our shares on December 29, 2017 of US$182.76 on the NYSE |
| • | the compensation figures for salary earned and actual bonus received have been converted to Canadian dollars using the following average exchange rates: $1.2787 for 2015, $1.3248 for 2016 and $1.2986 for 2017. |
| • | the value of any realized and realizable PSUs and Options have been converted into Canadian dollars using the 2017 year-end exchange rate of $1.2545 |
We also compare the realized and realizable value of $100 awarded in total direct compensation to Mr. Creel in each year to the value of $100 invested in CP shares on the first trading day of the period, assuming reinvestment of dividends, to show a meaningful comparison of shareholder value.
30
Table of Contents
Pay linked to shareholder value
The table below shows Mr. Creel’s total direct compensation in Canadian dollars in each of the last three years, compared to its realized and realizable value as at December 31, 2017. We also compare the realized and realizable value of $100 awarded in total direct compensation to Mr. Creel in each year to the value of $100 invested in CP shares on the first trading day of the period, assuming reinvestment of dividends, to show a meaningful comparison of shareholder value.
| (Cdn$) | Value of $100 | |||||||||||||||||||
| Compensation awarded |
Realized and realizable value of compensation as at December 31, 2017 |
Period | Keith Creel | Shareholder | ||||||||||||||||
| 2015 |
$ | 6,855,631 | $ | 6,288,021 | Jan 1, 2015 to Dec 31, 2017 | 92 | 105 | |||||||||||||
| 2016 |
$ | 7,696,926 | $ | 11,193.523 | Jan 1, 2016 to Dec 31, 2017 | 145 | 132 | |||||||||||||
| 2017 |
$ | 18,780,304 | $ | 18,131,928 | Jan 1, 2017 to Dec 31, 2017 | 97 | 121 | |||||||||||||
Mr. Creel’s compensation awarded is as disclosed in the summary compensation table. He receives his compensation in U.S. dollars. Annual compensation figures have been converted to Canadian dollars using the following average exchange rates: $1.2787 for 2015, $1.3248 for 2016 and $1.2986 for 2017.
Mr. Creel’s realized and realizable value for salary earned and actual bonus received have been converted to Canadian dollars using the following average exchange rates: $1.2787 for 2015, $1.3248 for 2016 and $1.2986 for 2017. The value of any realized and realizable long-term incentive is converted into Canadian dollars using the 2017 year-end exchange rate of $1.2545.
Equity ownership (at December 31, 2017)
| Requirement (as a multiple of salary) |
Minimum ownership value ($) |
Shares ($) | Deferred share units ($) |
Total ownership value ($) |
Total ownership (as a multiple of salary) |
|||||||||
| 6x |
$ | 8,467,875 | 552,707 | 7,157,512 | 7,710,219 | 5.46x | ||||||||
Mr. Creel is on track to meeting his share ownership requirements by January 2022. Values are based on US$182.76, the closing price of our common shares on the NYSE on December 29, 2017 and have been converted using a year-end exchange rate of $1.2545.
Mr. Creel received a special make-whole DSU grant when he was hired in 2013. These vested in 2016, but he cannot redeem them until six months after he retires or leaves the company.
31
Table of Contents
NADEEM S. VELANI EXECUTIVE VICE-PRESIDENT AND CHIEF FINANCIAL OFFICER
|
|
Mr. Velani was appointed Vice-President and Chief Financial Officer on October 18, 2016 and was appointed Executive Vice-President and Chief Financial Officer on October 17, 2017. Mr. Velani is a key member of the senior management team responsible for the long-term strategic direction of the Company. Other responsibilities include financial planning, reporting and accounting systems, as well as pension, treasury, investor relations and tax functions.
Mr. Velani joined CP in March 2013 and most recently served as Vice-President Investor Relations. Prior to CP, Mr. Velani spent approximately 15 years at CN where he worked in a variety of positions in financial planning, sales and marketing, investor relations and the Office of the President and CEO. |

2017 performance
The CEO assessed Mr. Velani’s performance in 2017 against his individual performance objectives, which included developing a culture and organizational structure in finance better aligned to support an operations-focused company, building a strong team of financial leaders, reviewing the pension plan investment strategy and improving the financial planning, budgeting and forecasting process. In addition, Mr. Velani was responsible for leading an update of the company’s strategic multi-year plan.
All aspects of these functions were taken into consideration as part of the assessment. Mr. Velani was assessed as exceeding his individual performance objectives for the year.
The assessment was reviewed by the Compensation Committee, and approved by the Board.
2017 compensation
The table below is a summary of the compensation awarded to Mr. Velani for 2017, compared to the two previous years.
|
|
Compensation ($’000) | 2017 | 2016 | 2015 | ||||||||||
| Fixed |
||||||||||||||
| Base earnings |
451 | 299 | 224 | |||||||||||
| Variable |
||||||||||||||
| Short-term incentive |
491 | 374 | 153 | |||||||||||
| Long-term incentive |
||||||||||||||
| - PSUs |
782 | 132 | 87 | |||||||||||
| - Stock options |
203 | 105 | 72 | |||||||||||
| - DSUs |
24 | - | 15 | |||||||||||
| Total direct compensation |
1,951 | 910 | 551 | |||||||||||
| Total target direct compensation |
1,840 | 1,141 | 576 | |||||||||||
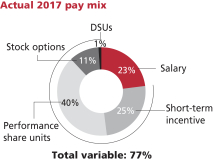
Salary
Mr. Velani received a 10.8% step increase in 2017 to bring his salary closer to the market median and as a result of his appointment as Executive Vice-President and CFO on October 17, 2017.
2017 short-term incentive
Based on our 2017 corporate performance and the assessment of his individual performance, Mr. Velani received a cash bonus of $490,763 for 2017, calculated as follows:
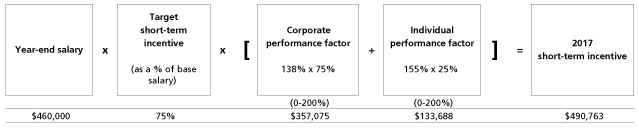
32
Table of Contents
2017 long-term incentive
Mr. Velani also received annual 2017 long-term incentive awards in the form of PSUs and Options with a total grant value of $985,045. When options were granted on January 20, 2017, Mr. Velani’s target was 115% of base salary of $415,000. This grant was allocated at 40% of target in stock options. When PSUs were granted, Mr. Velani’s target increased to 225% of base salary. This grant was allocated at 60% of target in PSUs.
Equity ownership (at December 31, 2017)
| Requirement (as a multiple of salary) |
Minimum ownership value ($) |
Shares ($) | Deferred share units ($) |
Total ownership value ($) |
Total ownership (as a multiple of salary) |
|||||||||||||||
| 3x |
1,380,000 | 184,354 | 368,825 | 553,179 | 1.20x | |||||||||||||||
Mr. Velani is on track to meeting his share ownership requirements by February 2022. Values are based on $229.66, the closing price of our common shares on the TSX on December 29, 2017.
33
Table of Contents
ROBERT A. JOHNSON EXECUTIVE VICE-PRESIDENT, OPERATIONS
|
|
Mr. Johnson was appointed as Executive Vice-President, Operations in April of 2016. In this role, Mr. Johnson has overall operational responsibility for CP’s rail network, including aspects of operational safety, service, engineering and mechanical services in both Canada and the U.S. with a focus on train performance and overall fluidity of the network.
Prior to this appointment, Robert was CP’s Senior Vice-President Operations, Southern Region.
Mr. Johnson’s railroad career spans over 36 years. He spent 32 of those years were spent with BNSF where he held successively more responsible roles in operations, transportation, engineering, and service excellence. His most recent position at BNSF was General Manager, Northwest Division, overseeing day-to-day operations for that region. |

2017 performance
The CEO assessed Mr. Johnson’s performance in 2017 against his individual performance objectives in the areas of operational performance, cost control and safety. Mr. Johnson was instrumental in the implementation of our new “live” lift operation which enhances our cross-border operations at Portal, North Dakota for our intermodal traffic moving between Western Canada and the U.S. Midwest. Live lift allows us to lift single containers off trains for inspection by Canadian and U.S. authorities rather than having intermodal cars set-off. Mr. Johnson led the development of our new large-scale, multi-commodity transload facility in Vancouver as well as the implementation of operational efficiencies within that region to provide customers with more efficient services for imported and exported goods. Mr. Johnson championed our operational safety in 2017 which lead to a new all-time low train accident frequency. Mr. Johnson was assessed as having exceeded his overall individual performance objectives.
The assessment was reviewed by the Compensation Committee and reviewed and approved by the Board.
2017 compensation
The table below is summary of the compensation awarded to Mr. Johnson for 2017, compared to the two previous years.
|
|
Compensation ($’000) | 2017 | 2016 | 2015 | ||||||||||
| Fixed |
||||||||||||||
| Base earnings |
565 | 532 | 425 | |||||||||||
| Variable |
||||||||||||||
| Short-term incentive |
597 | 648 | 362 | |||||||||||
| Long-term incentive |
||||||||||||||
| - PSUs |
959 | 359 | 300 | |||||||||||
| - Stock options |
556 | 318 | 327 | |||||||||||
| Total direct compensation |
2,677 | 1,857 | 1,414 | |||||||||||
| Total target direct compensation |
2,260 | 2,305 | 1,203 | |||||||||||
| Notes: Salary is the actual amount received that year. Payments made in U.S. dollars have been converted to Canadian dollars using an average exchange rate for the year: $1.2986 for 2017, $1.3248 for 2016 and $1.2787 for 2015. |
| |||||||||||||
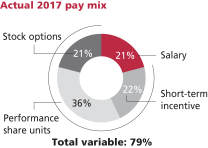
Salary
Mr. Johnson did not receive a salary increase in 2017. Variances are due to foreign exchange.
2017 short-term incentive
Based on our 2017 corporate performance and the assessment of his individual performance, Mr. Johnson received a cash bonus of $597,372 for 2017, calculated as follows:
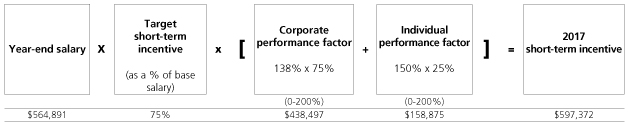
34
Table of Contents
Year end salary and the 2017 STIP award were made in U.S. dollars have been converted to Canadian dollars using an average exchange rate of $1.2986 for 2017.
2017 long-term incentive
Mr. Johnson received 2017 long-term incentive awards in the form of PSUs and Options with a total grant value of $1,514,778, 100% of his target award. The grant was allocated 60% PSUs and 40% stock options.
Equity ownership (at December 31, 2017)
| Requirement (as a multiple of salary) |
Minimum ownership value ($) |
Shares ($) | Deferred share units ($) |
Total ownership value ($) |
Total ownership (as a multiple of salary) |
|||||||||||||||
| 3x |
1,637,123 | 52,649 | 1,275,641 | 1,328,290 | 2.43x | |||||||||||||||
Mr. Johnson is on track to meeting his share ownership requirements by April 2021. Values are based on the US$182.76 closing price of our shares on the NYSE on December 29, 2017 and have been converted using a year-end exchange rate of $1.2545.
35
Table of Contents
LAIRD J. PITZ VICE-PRESIDENT AND CHIEF RISK OFFICER

|
Mr. Pitz was promoted to Senior Vice-President and Chief Risk Officer in October of 2017. This was part of the overall realignment of the risk and insurance functions for succession purposes, and to retain Mr. Pitz for the necessary developments of the succession candidates. He is responsible for all aspects of risk-management in Canada and the U.S., including police services, casualty and general claims, environmental risk, field safety and systems, operational regulatory affairs and training, disability management and forensic audit investigations. Mr. Pitz joined CP on April 2, 2014, as Vice-President of Security and Risk Management.
Mr. Pitz, a Vietnam War veteran and former FBI special agent, is a 40-year career professional who has directed strategic and operational risk-mitigation, security and crisis-management functions for companies operating in a wide range of fields including defence, logistics and transportation. |
2017 individual performance
The CEO assessed Mr. Pitz’s performance in 2017 against his individual performance objectives, which focused mainly on reducing risk and liability for the company. This included mitigating risk in several key areas: safety, environmental, police security, casualty management, regulatory/operating practices, forensic and internal audit and disability management. Under Mr. Pitz’s leadership, CP has made significant progress in mitigating its overall risk, including the following results in 2017: $200,000 settlement of a $250 million class action lawsuit, claims recoveries in excess of $40 million including a 40% reduction in CP’s Federal Employers Liability Act (FELA) liability ($4.8 million). Mr. Pitz was assessed as having exceeded his overall individual performance objectives.
The assessment was reviewed by the Compensation Committee, and reviewed and approved by the Board.
2017 compensation
The table below is a summary of the compensation awarded to Mr. Pitz for 2017, compared to the two previous years. Mr. Pitz was promoted to Senior Vice-President & Chief Risk Officer on October 17, 2017, and received a 4.6% increase in base salary and an increase in short-term and long-term incentive awards to recognize his increased areas of responsibility.

|
Compensation ($’000) | 2017 | 2016 | 2015 | ||||||||||
| Fixed |
||||||||||||||
| Base earnings |
458 | 438 | 406 | |||||||||||
| Variable |
||||||||||||||
| Short-term incentive |
436 | 417 | 331 | |||||||||||
| Long-term incentive |
||||||||||||||
| - PSUs |
394 | 315 | 265 | |||||||||||
| - Stock options |
229 | 279 | 288 | |||||||||||
| - DSUs |
- | 83 | 83 | |||||||||||
| Total direct compensation |
1,517 | 1,531 | 1,373 | |||||||||||
| Total target direct compensation |
1,331 | 1,275 | 1,126 | |||||||||||
| Notes: Salary is the actual amount received that year. Payments made in U.S. dollars have been converted to Canadian dollars using an average exchange rate for the year: $1.2986 for 2017, $1.3248 for 2016 and $1.2787 for 2015.
Mr. Pitz received a company matching contribution of DSUs in 2016 and 2015 as a result of deferring 100% of his 2015 and 2014 short-term incentive (see page 48 for information about deferred compensation). |
| |||||||||||||
Salary
Mr. Pitz received a 4.6% increase in base salary when he was promoted to Senior Vice-President and Chief Risk Officer on October 17, 2017.
36
Table of Contents
2017 short-term incentive
Based on our 2017 corporate performance and the assessment of his individual performance, Mr. Pitz received a cash bonus of $435,601 for 2017, calculated as follows:
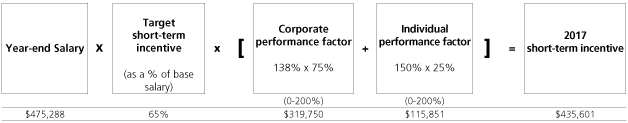
Year-end salary and 2017 STIP award were made in U.S. dollars and have been converted to Canadian dollars using an average exchange rate of $1.2986 for 2017.
2017 long-term incentive
Mr. Pitz also received 2017 annual long-term incentive awards in the form of PSUs and Options with a total grant value of $622,931, 100% of his target award. The grant was allocated 60% PSUs and 40% stock options.
Equity ownership (at December 31, 2017)
| Requirement (as a multiple of salary) |
Minimum ownership value ($) |
Shares ($) | Deferred share units ($) |
Total ownership value ($) |
Total ownership (as a multiple of salary) |
|||||||||||||||
| 2x |
918,294 | 7,107 | 996,557 | 1,003,664 | 2.19x | |||||||||||||||
Mr. Pitz has met his share ownership requirements. Values are based on US$182.76, the closing price of our shares on the NYSE on December 29, 2017 and have been converted using a year-end exchange rate of $1.2545.
37
Table of Contents
JEFFREY J. ELLIS CHIEF LEGAL OFFICER AND CORPORATE SECRETARY
|
|
Mr. Ellis was appointed Chief Legal Officer and Corporate Secretary effective November 23, 2015.
Mr. Ellis is accountable for the overall strategic leadership, oversight and performance of the legal, corporate secretarial, government relations and public affairs functions of CP in Canada and the U.S.
Prior to joining CP in 2015, Mr. Ellis was the U.S. General Counsel at BMO Financial Group. Before joining BMO in 2006, Mr. Ellis was with the law firm of Borden Ladner Gervais LLP in Toronto, Canada.
Mr. Ellis has B.A. and M.A. degrees from the University of Toronto, J.D. and LL.M. degrees from Osgoode Hall Law School, and an MBA from the Richard Ivey School of Business, University of Western Ontario. He is a member of the bars of New York, Illinois and Ontario. |

2017 performance
The CEO assessed Mr. Ellis’ performance in 2017 against his individual performance objectives, which included managing the company’s legal risk to achieve optimal outcomes across a variety of litigation matters, helping CP’s business achieve its goals through legal support on transactions and commercial contracts and creating conditions for success in communication and public affairs, marketing and government affairs by providing executive leadership and support on key issues such as brand awareness, rail safety and other external affairs priorities, while encouraging a balanced, fair and market-driven regulatory environment in Canada and the U.S. Mr. Ellis was assessed as having exceeded his overall individual performance objectives.
The assessment was reviewed by the Compensation Committee, and reviewed and approved by the Board.
2017 compensation
The table below is summary of the compensation awarded to Mr. Ellis for 2017, compared to the two previous years.
|
|
Compensation ($’000) | 2017 | 2016 | 2015 | ||||||||||
| Fixed |
||||||||||||||
| Base earnings |
443 | 422 | 27 | |||||||||||
| Variable |
||||||||||||||
| Short-term incentive |
376 | 401 | 29 | |||||||||||
| Long-term incentive |
||||||||||||||
| - PSUs |
387 | 269 | - | |||||||||||
| - Stock options |
217 | 215 | - | |||||||||||
| Make Whole Hiring Costs |
||||||||||||||
| - Cash Payment |
- | - | 244 | |||||||||||
| - PSU |
- | 126 | - | |||||||||||
| - Stock options |
- | 101 | - | |||||||||||
| - DSU |
- | 60 | - | |||||||||||
| Total direct compensation |
1,423 | 1,594 | 300 | |||||||||||
| Total target direct compensation |
1,224 | 1,224 | 1,018 | |||||||||||
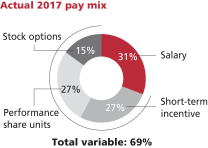
Salary
Mr. Ellis did not receive an increase in salary in 2017. Salary as shown above reflects actual salary earned in the year. Mr. Ellis’ last salary increase was effective April 1, 2016.
2017 short-term incentive
Based on our 2017 corporate performance and the CEO’s assessment of his individual performance, Mr. Ellis received for a cash bonus of $376,470 for 2017, calculated as follows:
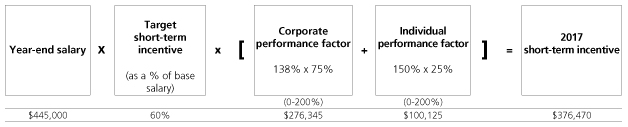
38
Table of Contents
2017 long-term incentive
Mr. Ellis also received 2017 long-term incentive awards with a total grant value of $604,199, 100% of his target award. The grant was allocated 60% PSUs and 40% stock options.
Equity ownership (at December 31, 2017)
| Requirement (as a multiple of salary) |
Minimum ownership value ($) |
Shares ($) | Deferred share units ($) |
Total ownership value ($) |
Total ownership (as a multiple of salary) |
|||||||||||||||
| 2x |
890,000 | 73,154 | 84,596 | 157,750 | 0.35x | |||||||||||||||
Mr. Ellis is on track to meeting his share ownership requirements by November 2020. Values are based on $229.66, the closing price of our shares on the TSX on December 29, 2017.
39
Table of Contents
Share performance and cost of management
The graph below shows the total shareholder return of $100 invested in CP shares compared to the two major market indices over the last five years ending December 31, 2017 and assumes reinvestment of dividends.
CP shares have outperformed the S&P/TSX Composite Index and the S&P 500 Index over the last five years. It shows a strong correlation between shareholder value and the total direct compensation paid to our named executives over the same period. Our share price on the TSX was $160.65 at the beginning of the performance period (US$151.32 on the NYSE) compared to $229.66 at the end of 2017 (US$182.76 on the NYSE), a growth in share appreciation of 43.0%, creating significant value for shareholders. Our total shareholder return over the five year period was 48.2%, assuming reinvestment of dividends.
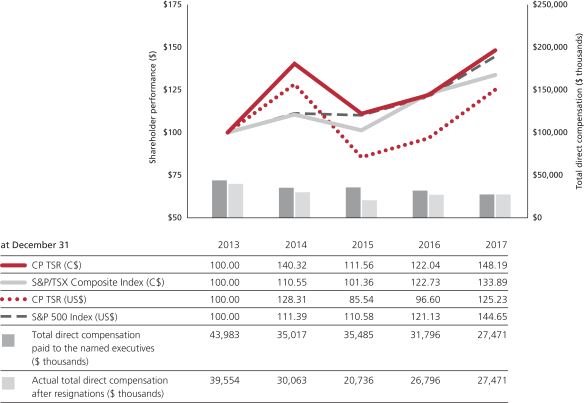
Notes:
| • | Total direct compensation is the total compensation awarded to the named executives, as reported in the summary compensation table in prior years. In years where there were more than five named executives, we used the following to calculate total direct compensation in the table above: |
| • | 2017: Keith Creel, Nadeem Velani, Robert Johnson, Laird Pitz and Jeffrey Ellis |
| • | 2016: Hunter Harrison, Nadeem Velani, Keith Creel, Robert Johnson and Laird Pitz |
| • | 2015: Hunter Harrison, Mark Erceg, Keith Creel, Laird Pitz and Mark Wallace |
| • | 2014: Hunter Harrison, Bart Demosky, Keith Creel, Robert Johnson and Anthony Marquis |
| • | 2013: Hunter Harrison, Keith Creel, Brian Grassby, Paul Guthrie and Jane O’Hagan |
| • | Mr. Harrison, Mr. Creel, Mr. Johnson and Mr. Pitz are paid in U.S. dollars and their amounts have been converted using the following average exchange rates: $1.2986 for 2017, $1.3248 for 2016, $1.2787 for 2015, $1.1045 for 2014 and $1.0299 for 2013. |
| • | Actual total direct compensation after resignations are the net amounts after Mr. Harrison, Mr. Erceg and Mr. Demosky left CP and forfeited amounts reported in the summary compensation table in prior proxy statements. |
40
Table of Contents
EXECUTIVE COMPENSATION DETAILS
The table below shows compensation for our six named executives for the three fiscal years ended December 31, 2017. Keith Creel succeeded Hunter Harrison as Chief Executive Officer on January 31, 2017, when Mr. Harrison resigned from CP.
All of the named executives except Mr. Velani and Mr. Ellis were paid in U.S. dollars. Their compensation has been converted to Canadian dollars using the average exchange rates for the year: $1.2986 for 2017, $1.3248 for 2016 and $1.2787 for 2015.
| Non-equity Incentive plan compensation ($) |
||||||||||||||||||||||||||||||||||||
| Name and principal position | Year | Salary ($) | Share-based awards ($) |
Option-based awards ($) |
Annual incentive plans |
Long-term incentive plans |
Pension value ($) |
All other compensation ($) |
Total compensation ($) |
|||||||||||||||||||||||||||
| Keith E. Creel |
2017 | 1,436,594 | 4,407,788 | 10,516,630 | 2,419,292 | - | 398,894 | 926,402 | 20,105,600 | |||||||||||||||||||||||||||
| President and Chief |
2016 | 1,261,123 | 2,403,912 | 2,131,126 | 1,900,765 | - | 348,529 | 833,257 | 8,878,712 | |||||||||||||||||||||||||||
| Executive Officer |
2015 | 1,164,270 | 1,959,244 | 2,130,228 | 1,601,889 | - | 328,426 | 486,557 | 7,670,614 | |||||||||||||||||||||||||||
| E. Hunter Harrison |
2017 | 361,369 | - | - | - | - | - | 6,452,479 | 6,813,848 | |||||||||||||||||||||||||||
| Former Chief |
2016 | 2,904,595 | - | 4,999,757 | 6,557,760 | - | - | 4,367,682 | 18,829,794 | |||||||||||||||||||||||||||
| Executive Officer |
2015 | 2,803,522 | 4,887,846 | 5,314,137 | 6,002,537 | - | 13,492 | 1,173,789 | 20,195,323 | |||||||||||||||||||||||||||
| Nadeem S. Velani |
2017 | 451,355 | 806,073 | 202,650 | 490,763 | - | 101,027 | 49,523 | 2,101,391 | |||||||||||||||||||||||||||
| Executive Vice-President |
2016 | 298,838 | 131,634 | 105,305 | 373,500 | - | 49,682 | 42,015 | 1,000,974 | |||||||||||||||||||||||||||
| and Chief Financial Officer |
2015 | 223,972 | 102,039 | 78,833 | 152,819 | - | 33,308 | 30,457 | 621,428 | |||||||||||||||||||||||||||
| Robert A. Johnson |
2017 | 564,891 | 958,705 | 556,073 | 597,372 | - | 114,037 | 54,819 | 2,845,897 | |||||||||||||||||||||||||||
| Executive Vice-President, |
2016 | 532,056 | 358,674 | 317,991 | 648,324 | - | 86,189 | 54,931 | 1,998,165 | |||||||||||||||||||||||||||
| Operations |
2015 | 425,160 | 300,454 | 326,539 | 362,141 | - | 88,425 | 57,035 | 1,559,754 | |||||||||||||||||||||||||||
| Laird J. Pitz |
2017 | 457,901 | 394,237 | 228,694 | 435,601 | - | 82,361 | 41,137 | 1,639,931 | |||||||||||||||||||||||||||
| Senior Vice-President |
2016 | 437,720 | 397,394 | 279,071 | 417,312 | - | 74,178 | 41,203 | 1,646,878 | |||||||||||||||||||||||||||
| and Chief Risk Officer |
2015 | 406,126 | 347,920 | 287,967 | 331,166 | - | 70,499 | 37,901 | 1,481,579 | |||||||||||||||||||||||||||
| Jeffrey J. Ellis |
2017 | 443,479 | 386,888 | 217,311 | 376,470 | - | 101,277 | 50,540 | 1,575,965 | |||||||||||||||||||||||||||
| Chief Legal Officer and |
2016 | 421,918 | 455,239 | 316,312 | 400,500 | - | 50,275 | 50,638 | 1,694,882 | |||||||||||||||||||||||||||
| Corporate Secretary |
2015 | 26,946 | - | - | 28,922 | - | 2,964 | 247,468 | 306,300 | |||||||||||||||||||||||||||
Notes:
Salary
Salary earned during the year. Salary differs from annualized salary because annual increases generally go into effect on April 1.
Share-based awards
PSUs were granted on February 21, 2017. The grant date fair value of share awards granted to each named executive has been calculated in accordance with FASB ASC Topic 718: Compensation – Stock Compensation, which represents the grant date fair value (with reference to the Shares underlying the awards), measured using a latticed-based valuation model assuming the probable outcome of the applicable performance conditions and excluding the effect for estimated forfeitures during the applicable vesting periods. The 2017 grant date accounting fair value of the awards is $200.46 per share granted on the TSX or $152.25 per share granted on the NYSE. See Item 8, Financial Statements and Supplementary Data, Note 21: Stock-based compensation of our 2017 Form 10-K for more details.
We value our PSUs using the binomial lattice model methodology. The grant date expected fair value was $162.37 on the TSX and US$123.32 on the NYSE.
Mr. Velani’s amount includes the value of matching DSU’s granted in 2017.
Mr. Harrison forfeited his 2015 PSU grant when he resigned from CP.
Option awards
Stock options were granted on January 20, 2017. The grant date fair value of stock option awards granted to each named executive has been calculated in accordance with FASB ASC Topic 718: Compensation – Stock Compensation. We used the Black-Scholes option-pricing model (with reference to the shares underlying the options). The grant date accounting fair value of the awards is $43.64 per share granted on the TSX or $37.05 per share granted on the NYSE. Additional options were granted to Mr. Creel on February 1, 2017 to bring him to the CEO level. The grant date accounting fair value is US$36.81 per
41
Table of Contents
share. For the special performance grant made on February 1, 2017, the grant date accounting fair value is US$34.72 per share. See Incentive plan awards on page 44 for details about the 2018 awards. See Item 8, Financial Statements and Supplementary Data, Note 21: Stock-based compensation of our 2017 Form 10-K for more details.
To calculate the number of options that an executive receives, we use Willis Towers Watson’s binomial Option pricing methodology which is fundamentally similar to the methodology used to determine the accounting fair value; however, some of the underlying assumptions are different. For example, the binomial methodology assumes a slightly lower historical volatility, a higher risk-free rate and includes a discount to account for vesting restrictions. The grant price on January 20, 2017 was $201.49 on the TSX with an underlying value of $42.31 and was US $150.99 on the NYSE with an underlying value of US$34.73.
Mr. Harrison forfeited his option awards when he resigned from CP.
Non-equity incentive plan compensation
Cash bonus earned under our short-term incentive plan for 2017 and paid in February 2018.
Pension value
Mr. Creel, Mr. Velani and Mr. Ellis participate in the Canadian defined contribution plan (DC plan) and in the defined contribution supplemental plan (DC SERP).
Mr. Creel, Mr. Johnson and Mr. Pitz participate in the U.S. defined contribution plan and the U.S. supplemental executive retirement plan.
See Retirement plans on page 47 for more details.
All other compensation
The named executives also receive certain benefits and perquisites. The table below shows the breakdown of all other compensation for 2017:
| Perquisites | Other compensation | |||||||||||||||||||||||||||||||||||||||||||
| Name | Personal use of company aircraft |
Auto benefits |
Housing allowance |
Financial and tax planning |
Additional medical |
Club memberships |
401K Plan |
Employer share purchase plan match |
Tax reimbursement |
Post- employment payments |
Total | |||||||||||||||||||||||||||||||||
| Keith Creel |
570,649 | 28,387 | 77,270 | 29,708 | - | 33,023 | 7,012 | 27,843 | 152,510 | - | 926,402 | |||||||||||||||||||||||||||||||||
| Hunter Harrison |
83,361 | - | 3,921 | - | 42,286 | - | - | - | - | 6,322,911 | 6,452,479 | |||||||||||||||||||||||||||||||||
| Nadeem Velani |
- | 20,432 | - | - | - | 11,200 | - | 8,937 | 8,954 | - | 49,523 | |||||||||||||||||||||||||||||||||
| Robert Johnson |
- | 22,091 | - | - | - | 14,544 | 8,863 | 9,321 | - | - | 54,819 | |||||||||||||||||||||||||||||||||
| Laird Pitz |
- | 17,178 | - | - | - | 14,544 | 9,415 | - | - | - | 41,137 | |||||||||||||||||||||||||||||||||
| Jeffrey Ellis |
- | 19,679 | - | - | - | 11,200 | - | 8,781 | 10,880 | - | 50,540 | |||||||||||||||||||||||||||||||||
42
Table of Contents
Notes:
| Use of company aircraft | The value is calculated by multiplying the variable cost per air hour by the number of hours used for travel and includes costs for fuel, maintenance, landing fees and other miscellaneous costs. As an executive of a Calgary-based company, enabling the CEO to visit his family in the Eastern and Southern United States is an important retention tool. Non-corporate use of the corporate jet has been limited to personal and family visits for Mr. Creel only. | |
| Auto benefits | Includes a company-leased vehicle and reimbursement of related operating costs. | |
| Housing allowance | For reasonable accommodation for Mr. Creel and Mr. Harrison in Calgary. The value is based on the total incremental operating costs for condo fees, housekeeping and other miscellaneous costs paid by us. | |
| Financial and tax planning | For Mr. Creel, financial and tax planning services according to his current contract. | |
| Additional medical | For executive physical examinations and other fees related to medical expenses for Mr. Harrison that are not covered under our group health plans. | |
| Club memberships | Included in the perquisites program available to all executives. | |
| 401K plan | Mr. Creel, Mr. Johnson and Mr. Pitz also receive matching contributions to the 401k plan. | |
| ESPP match | Includes company contributions to the employee share purchase plan (ESPP). The named executives participate in the ESPP on the same terms and using the same formulas as for other participants.
The ESPP is available to all employees and provides the opportunity to purchase common shares on the open market through payroll deductions. Employees contribute between 1% and 10% of their base salary to the plan every pay period. We match 33% on the first 6% of non-unionized employees’ contributions that vest after four consecutive quarters. Employees must be participants in the plan at the time of vesting in order to receive the company match. As of December 31, 2017, approximately 34% of our employees participated in the plan. | |
| Tax reimbursements | Includes automobile-related gross-ups (if the executive is eligible). As well, Mr. Creel received a tax equalization payment for taxes incurred in 2016. He is no longer eligible for such payment in 2017. | |
| Post-employment payments | Mr. Harrison received a lower cash payout in lieu of the vested 2014 PSUs. |
Employment agreements
Except for Mr. Creel, employment agreements for executive officers are set out in a standard offer letter template. The letters contain the standard terms as described in the CD&A and include an annual salary, participation in the short and long-term incentive plans as approved annually by the Compensation Committee, participation in the benefit plans or programs generally available to management employees, and modest perquisites.
Mr. Creel’s 2017 employment agreement includes:
| • | reasonable living accommodation in Calgary |
| • | use of the corporate jet for business commuting and family visits within North America |
| • | non-disclosure, non-solicitation covenants |
| • | severance provisions as described on page 49 |
| • | reimbursement for club memberships of up to US$25,000 annually |
| • | reimbursement for financial services of up to US$25,000 annually |
As of the 2017 tax year, Mr. Creel no longer receives tax equalization benefits as a result of working for CP in Canada, and cannot use the corporate jet for purposes other than for corporate travel and family visits within North America.
Mr. Ellis has an offer letter that also includes a modest severance package for a termination without cause. The letter also includes a non-compete/non-solicit agreement.
43
Table of Contents
Outstanding share-based awards and option-based awards
The table below shows all vested and unvested equity incentive awards that are outstanding as of December 31, 2017. See Long-term incentives beginning on page 20 for more information about our stock option and share-based awards.
| Option-based awards | Share-based awards | |||||||||||||||||||||||||||||||||
| Name | Grant date | Number of securities |
Option exercise price ($) |
Option Date |
Value of in-the-money |
Grant type |
Number of shares or units of shares that have not vested (#) |
Market or payout value of share-based awards that have not vested ($) |
Market or payout value of vested share-based awards not paid out or distributed ($) |
|||||||||||||||||||||||||
| Keith Creel |
4-Feb-2013 | 119,325 | 115.78 | 4-Feb-2023 | 13,588,731 | |||||||||||||||||||||||||||||
| 22-Feb-2013 | 53,350 | 119.18 | 22-Feb-2023 | 5,894,108 | ||||||||||||||||||||||||||||||
| 31-Jan-2014 | 39,900 | 168.84 | 31-Jan-2024 | 2,426,718 | ||||||||||||||||||||||||||||||
| 24-Jul-2014 | 47,940 | 210.32 | 24-Jul-2024 | 927,160 | ||||||||||||||||||||||||||||||
| 23-Jan-2015 | 33,910 | 175.92 | 23-Jan-2025 | 290,974 | ||||||||||||||||||||||||||||||
| 22-Jan-2016 | 55,250 | 116.80 | 22-Jan-2026 | 4,571,762 | ||||||||||||||||||||||||||||||
| 20-Jan-2017 | 33,884 | 150.99 | 20-Jan-2024 | 1,350,463 | ||||||||||||||||||||||||||||||
| 1-Feb-2017 | 18,762 | 151.14 | 1-Feb-2024 | 744,238 | ||||||||||||||||||||||||||||||
| 1-Feb-2017 | 177,225 | 151.14 | 1-Feb-2024 | 7,030,035 | ||||||||||||||||||||||||||||||
| 6-Feb-2013 | DSU | 7,157,512 | ||||||||||||||||||||||||||||||||
| 23-Jan-2015 | PSU | 3,230,887 | ||||||||||||||||||||||||||||||||
| 23-Feb-2016 | PSU | 15,091 | 3,459,873 | |||||||||||||||||||||||||||||||
| 21-Feb-2017 | PSU | 22,468 | 5,151,306 | |||||||||||||||||||||||||||||||
| Total |
579,546 | 36,824,189 | 37,559 | 8,611,179 | 10,388,399 | |||||||||||||||||||||||||||||
| Nadeem Velani |
2-Apr-2013 | 2,310 | 126.34 | 2-Apr-2023 | 238,669 | |||||||||||||||||||||||||||||
| 31-Jan-2014 | 1,820 | 168.84 | 31-Jan-2024 | 110,692 | ||||||||||||||||||||||||||||||
| 23-Jan-2015 | 1,539 | 218.78 | 23-Jan-2025 | 16,744 | ||||||||||||||||||||||||||||||
| 22-Jan-2016 | 2,927 | 165.74 | 22-Jan-2026 | 187,094 | ||||||||||||||||||||||||||||||
| 20-Jan-2017 | 4,644 | 201.49 | 20-Jan-2024 | 130,821 | ||||||||||||||||||||||||||||||
| 26-Feb-2014 | DSU | 152,164 | ||||||||||||||||||||||||||||||||
| 23-Jan-2015 | PSU | 149,157 | ||||||||||||||||||||||||||||||||
| 19-Feb-2015 | DSU | 67 | 15,397 | 61,589 | ||||||||||||||||||||||||||||||
| 23-Feb-2016 | PSU | 796 | 182,733 | |||||||||||||||||||||||||||||||
| 21-Feb-2017 | PSU | 3,933 | 903,367 | |||||||||||||||||||||||||||||||
| 24-Feb-2017 | DSU | 122 | 27,935 | 111,741 | ||||||||||||||||||||||||||||||
| Total |
13,240 | 684,020 | 4,918 | 1,129,432 | 474,651 | |||||||||||||||||||||||||||||
| Robert Johnson |
2-Jul-2013 | 3,640 | 129.54 | 2-Jul-2023 | 364,437 | |||||||||||||||||||||||||||||
| 31-Jan-2014 | 5,870 | 168.84 | 31-Jan-2024 | 357,013 | ||||||||||||||||||||||||||||||
| 23-Jan-2015 | 5,198 | 175.92 | 23-Jan-2025 | 44,603 | ||||||||||||||||||||||||||||||
| 22-Jan-2016 | 8,244 | 116.80 | 22-Jan-2026 | 682,165 | ||||||||||||||||||||||||||||||
| 20-Jan-2017 | 11,557 | 150.99 | 20-Jan-2024 | 460,610 | ||||||||||||||||||||||||||||||
| 24-Jun-2013 | DSU | 1,275,641 | ||||||||||||||||||||||||||||||||
| 23-Jan-2015 | PSU | 495,554 | ||||||||||||||||||||||||||||||||
| 23-Feb-2016 | PSU | 2,252 | 516,228 | |||||||||||||||||||||||||||||||
| 21-Feb-2017 | PSU | 4,887 | 1,120,422 | |||||||||||||||||||||||||||||||
| Total |
34,509 | 1,908,828 | 7,139 | 1,636,650 | 1,771,195 | |||||||||||||||||||||||||||||
| Laird Pitz |
3-Jun-2014 | 3,150 | 187.00 | 3-Jun-2024 | 134,379 | |||||||||||||||||||||||||||||
| 23-Jan-2015 | 4,584 | 175.92 | 23-Jan-2025 | 39,334 | ||||||||||||||||||||||||||||||
| 22-Jan-2016 | 5,426 | 116.80 | 22-Jan-2026 | 448,984 | ||||||||||||||||||||||||||||||
| 20-Jan-2017 | 4,753 | 150.99 | 20-Jan-2024 | 189,433 | ||||||||||||||||||||||||||||||
| 19-Feb-2015 | DSU | 351 | 80,374 | 321,498 | ||||||||||||||||||||||||||||||
| 23-Jan-2015 | PSU | 436,852 | ||||||||||||||||||||||||||||||||
| 23-Feb-2016 | DSU | 519 | 118,937 | 475,748 | ||||||||||||||||||||||||||||||
| 23-Feb-2016 | PSU | 1,976 | 453,012 | |||||||||||||||||||||||||||||||
| 21-Feb-2017 | PSU | 2,010 | 460,739 | |||||||||||||||||||||||||||||||
| Total |
17,913 | 812,130 | 4,856 | 1,113,062 | 1,234,098 | |||||||||||||||||||||||||||||
| Jeffrey Ellis |
22-Jan-2016 | 5,981 | 165.74 | 22-Jan-2026 | 382,306 | |||||||||||||||||||||||||||||
| 22-Jan-2016 | 2,811 | 165.74 | 22-Jan-2026 | 179,679 | ||||||||||||||||||||||||||||||
| 20-Jan-2017 | 4,980 | 201.49 | 20-Jan-2024 | 140,287 | ||||||||||||||||||||||||||||||
| 22-Jan-2016 | DSU | 74 | 16,919 | 67,677 | ||||||||||||||||||||||||||||||
| 23-Feb-2016 | PSU | 2,389 | 548,668 | |||||||||||||||||||||||||||||||
| 21-Feb-2017 | PSU | 1,945 | 446,707 | |||||||||||||||||||||||||||||||
| Total |
13,772 | 702,272 | 4,408 | 1,012,294 | 67,677 | |||||||||||||||||||||||||||||
44
Table of Contents
Notes:
Options
In general regular options granted before 2017 vest 25% each year for four years beginning on the anniversary of the grant date and expire 10 years from the grant date. Grants made in 2017 expire seven years from grant date. Exercise prices are shown in Canadian dollars, except that, with respect to Mr. Creel, Mr. Johnson and Mr. Pitz option awards that were made in 2015 or later, exercise prices are in U.S dollars.
Value of unexercised in-the-money options at 2017 year-end
Based on $229.66, our closing share price on the TSX on December 29, 2017. For all the named executives except Mr. Velani and Mr. Ellis, option awards made in 2015 or later have been valued based on US$182.76, our closing share price on the NYSE on December 29, 2017 and converted into Canadian dollars using a year-end exchange rate of $1.2545.
Mr. Creel was awarded performance stock options on July 24, 2014. These options vested upon meeting certain performance hurdles: 50% of the options vested upon CP achieving an annual operating ratio of 63%, and the other 50% vested upon CP achieving an annual operating income of $2,618 million. The options are not exercisable until June 1, 2018.
Mr. Creel was also awarded performance stock options on February 1, 2017. These options will vest on February 1, 2022 provided certain performance metrics are achieved. See page 23 for details. Amount reflects the market value of shares or units of shares that have not vested.
Mr. Velani and Mr. Ellis: the value of unvested PSUs and DSUs is based on $229.66, our closing share price on the TSX on December 29, 2017.
Mr. Creel, Mr. Johnson and Mr. Pitz: the value of PSUs or DSUs is based on US$182.76, our closing share price on the NYSE on December 29, 2017, converted into Canadian dollars using a year-end exchange rate of $1.2545.
PSUs assume a payout at target (100%) for the 2016 and 2017 grants. The 2015 PSU value reflects a payout at 160% on the award which includes dividends earned up to the payment date. The DSU awards are deferred and cannot be redeemed until the executive leaves the company.
Incentive plan awards – value vested or earned during the year
The table below shows the amount of incentive compensation that vested or was paid in 2017.
| Name |
Option-based awards – Value vested during the year ($) |
Share-based awards – Value vested during the year ($) |
Non-equity incentive plan compensation – Value earned during the year ($) |
|||||||||
| Keith Creel |
7,825,458 | 3,230,887 | 2,419,292 | |||||||||
| Nadeem Velani |
138,267 | 436,074 | 490,763 | |||||||||
| Robert Johnson |
362,089 | 995,884 | 597,372 | |||||||||
| Laird Pitz |
193,139 | 436,852 | 435,601 | |||||||||
| Jeffrey Ellis |
140,560 | 67,677 | 376,470 | |||||||||
Notes:
Share-based awards – value vested during the year
Includes 2015 PSUs that vested at 160% on December 31, 2017 and includes dividends earned up to the payment date. The value realized on vesting is calculated by multiplying the number of shares acquired on vesting by $225.47, the average 30-day trading price of our shares prior to December 31, 2017 on the TSX for Mr. Velani, and US$176.56 on the NYSE for Mr. Creel, Mr. Johnson and Mr. Pitz converted to Canadian dollars using the year-end exchange rate of $1.2545 and by multiplying the achieved performance factor.
Mr. Velani’s amount includes the value of DSUs that vested in 2017 and RSUs that vested on May 8, 2017. Mr. Ellis’ amount includes the value of DSUs that vested in 2017. Mr. Johnson’s amount includes the value of RSUs that vested on May 8, 2017.
45
Table of Contents
Option exercises and vested stock awards
The table below shows the options exercised and sold by the named executives in 2017.
| Name | Number of options exercised and sold | Option exercise price ($) | Value realized ($) | |||||||||
| Keith Creel |
- | - | - | |||||||||
| Nadeem Velani |
- | - | - | |||||||||
| Robert Johnson |
- | - | - | |||||||||
| Laird Pitz |
1,809 | US$ | 116.80 | 89,745 | ||||||||
| Jeffrey Ellis |
- | - | - | |||||||||
Value realized is calculated using the market price of the shares acquired on exercise of the respective options less the exercise price for those options. The value has been converted to Canadian dollars using the exercise date exchange rate of $1.2182.
Equity compensation plan information
The table below shows the securities authorized for issuance under equity compensation plans at December 31, 2017. These include the issuance of securities upon exercise of options outstanding under the management stock option incentive plan and the director stock option plan.
The table also shows the remaining number of shares available for issuance and includes 340,000 shares under the director plan. On July 21, 2003, the Board suspended any additional grants of options under the director plan.
| Plan category | Number of securities to be issued upon exercise of outstanding options, warrants and rights |
Weighted-average exercise price of outstanding options, warrants and rights |
Number of securities remaining available for future issuance under equity compensation plans (excluding securities reflected in the first column) |
|||||||||
| Equity compensation plans approved by security holders | 1,481,275 | $ | 150.54 | 1,895,922 | ||||||||
| Equity compensation plans not approved by security holders | - | - | - | |||||||||
| Total |
1,481,275 | $ | 150.54 | 1,895,922 | ||||||||
See page 24 to read more about the management stock option incentive plan. You can also read about the two equity compensation plans in our audited consolidated financial statements for the year ended December 31, 2017, available on our website (www.cpr.ca), and on SEDAR (www.sedar.com) and EDGAR (www.sec.gov).
46
Table of Contents
Canadian pension plans
Mr. Creel, Mr. Velani and Mr. Ellis participated in our defined contribution plan (DC plan) in 2017.
Participants contribute between 4% and 6% of their earnings depending on their age and years of service, and the company contributes between 4% and 8% of earnings. Total contributions are limited to the maximum allowed under the Income Tax Act (Canada) ($26,010 for 2017).
Defined contribution plan table
| Accumulated value at start of year ($) | Compensatory ($) | Accumulated value at year end ($) | ||||||||||
| Keith Creel |
402,371 | 376,688 | 842,518 | |||||||||
| Nadeem Velani |
186,475 | 101,027 | 315,592 | |||||||||
| Jeffrey Ellis |
66,157 | 101,277 | 183,455 | |||||||||
Mr. Creel, Mr. Velani and Mr. Ellis also participate in a defined contribution supplemental plan (DC SERP), a non-registered plan that provides benefits in excess of the Income Tax Act (Canada) limits for the DC plan. Specifically, the SERP provides a company contribution equal to 6% of a participant’s base salary and annual bonus. Company contributions vest after two years and employees do not contribute to the plan.
U.S. retirement plans
Our U.S. retirement program has three elements:
| • | a voluntary qualified 401(k) plan with employer match |
| • | a qualified defined contribution plan which provides automatic employer contributions |
| • | a nonqualified defined contribution plan for certain employees whose compensation exceeds the U.S. Internal Revenue Code (IRS) limits (US$270,000 for 2017). |
401(k) plan
Individuals can make pre-tax contributions to the 401(k) plan subject to limitations imposed by the IRS in the U.S. The company provides a matching contribution of 50% on the first 6% of eligible earnings. All contributions vest immediately.
U.S. Salaried Retirement Income Plan
The U.S. Salaried Retirement Income Plan is employer-funded with an annual contribution amount equal to 3.5% of eligible earnings, which include base salary and annual bonus. These earnings are subject to compensation limitations imposed by the IRS in the U.S. These amounts are included in the summary compensation table under All other compensation.
Supplemental defined contribution plan (U.S. DC SERP)
The U.S. DC SERP is an unfunded, nonqualified defined contribution plan that provides an additional company contribution equal to 6% of eligible earnings without regard to the limitations imposed by the IRS in the U.S. Eligible earnings include base salary and annual bonus. In addition, for earnings in excess of the limitations imposed by the U.S. Internal Revenue Code, an additional 3.5% contribution is made. Company contributions cliff vest at the end of three years.
Mr. Creel, Mr. Johnson and Mr. Pitz participated in the U.S. SERP in 2017.
| Accumulated value at start of year ($) | Compensatory ($) | Accumulated value at year end ($) | ||||||||||
| Keith Creel |
705,262 | 22,206 | 846,244 | |||||||||
| Robert Johnson |
176,959 | 114,037 | 299,094 | |||||||||
| Laird Pitz |
99,062 | 82,361 | 187,811 | |||||||||
47
Table of Contents
The values in the table have been converted to Canadian dollars using the 2017 average exchange rate of $1.2986.
About deferred compensation
Executive officers and members of senior management who have not met their share ownership requirement can choose to defer all or part of their short-term incentive by receiving it as deferred share units. They cannot defer more than the amount needed to meet the requirement, which includes our 25% match of the amount deferred in the year the bonus is actually paid. The matching units vest after three years.
Elections must be made before the beginning of the new fiscal year. The amount is converted to DSUs using the average market price of a CP common share for the 10 trading days immediately before December 31 of the performance year.
The table below shows the number of DSUs outstanding and their value based on our closing share price on December 29, 2017.
| Unvested DSUs (#) | Vested DSUs (#) | Total units ($) | Value as at December 31, 2017 ($) |
|||||||||||||
| Keith Creel |
- | 31,218 | 31,218 | 7,157,426 | ||||||||||||
| Nadeem Velani |
189 | 1,417 | 1,606 | 368,834 | ||||||||||||
| Robert Johnson |
- | 5,564 | 5,564 | 1,275,672 | ||||||||||||
| Laird Pitz |
869 | 3,477 | 4,346 | 996,418 | ||||||||||||
| Jeffrey Ellis |
74 | 295 | 369 | 84,745 | ||||||||||||
Mr. Creel received a special make-whole DSU grant when he was hired in 2013.
We valued the outstanding DSUs using $229.66, our closing share price on the TSX on December 29, 2017 for Mr. Velani and Mr. Ellis, and US$182.76, our closing share price on the NYSE and converted to Canadian dollars using a year-end exchange rate of $1.2545 for Mr. Creel, Mr. Johnson and Mr. Pitz.
DSUs are redeemed for cash six months after the executive retires or leaves the company, or up until the end of the following calendar year for Canadian executives. U.S. executives who participate in the DSU plan must redeem their DSUs after the six-month waiting period to be in compliance with U.S. tax regulations. We use the average market price of a CP common share for the 10 trading days immediately before the payment date to calculate the amount, which the participant receives in a lump sum.
48
Table of Contents
Termination and change in control
Termination of employment
We have policies to cover different kinds of termination of employment.
Mr. Creel is covered under the terms of the new employment agreement effective January 31, 2017 that includes non-competition, non-solicitation and confidentiality restrictions. Mr. Ellis has an agreement for termination without cause which also includes non-competition, non-solicitation and confidentiality restrictions. Mr. Velani, Mr. Johnson and Mr. Pitz are subject to the same terms as all other employees for voluntary termination, retirement and termination for cause.
| Resignation | Retirement | Termination with cause |
Termination without cause | Change in control | ||||||
| Severance | None | None | None | Mr. Creel: 24 months of base salary Mr. Ellis: 12 months of base salary Other named executives: per legislative requirements
|
None | |||||
| Short-term incentive |
Forfeited | Award for current year is pro-rated to retirement date | Forfeited | Equal to the target award for severance period for Mr. Creel Equal to target bonus for 12 months for Mr. Ellis. Other named executives: award for current year is pro-rated to termination date as per plan
|
None | |||||
| DSUs | Unvested DSUs are forfeited | Unvested DSUs are forfeited | Unvested DSUs are forfeited | Unvested DSUs are forfeited | Unvested units vest early if the holder is terminated following change of control
| |||||
| Performance share units |
Forfeited | Award continues to vest based on performance factors and executive is entitled to receive the full value as long as they have worked for six months of the performance period, otherwise the award is forfeited
|
Forfeited | Pro-rated based on active service within the performance period | Only vest if the executive is terminated following a change of control PSUs vest at target, pro-rated based on active service within the performance period | |||||
| Stock options | Vested options are exercisable for 30 days or until the expiry date, whichever comes first. Unvested options are forfeited Performance stock options are forfeited
|
Options continue to vest Award expires five years after the retirement date or the normal expiry date, whichever is earlier Performance stock options are forfeited | Forfeited | Vested options are exercisable for six months as well as any options that vest during the six-month period Performance stock options are forfeited | Options only vest early if the option holder is terminated following the change of control. Performance stock options are forfeited | |||||
| Pension | No additional value
|
No additional value | No additional value | No additional value | No additional value | |||||
| ESPP shares | Unvested shares are forfeited
|
Unvested shares vest | Unvested shares vest if holder is terminated without cause | Unvested shares vest | ||||||
| Benefits | End on resignation | Post-retirement life insurance of $50,000 and a health spending account based on years of service (same for all employees)
|
End on resignation | 12 months health and dental for Mr. Ellis | None | |||||
| Perquisites | Any unused flex perquisite dollars are forfeited
|
Any unused flex perquisite dollars are forfeited | Any unused flex perquisite dollars are forfeited | Any unused flex perquisite dollars are forfeited | Any unused flex perquisite dollars are forfeited |
We entered into a separation agreement with Mr. Harrison on January 18, 2017, under which he resigned from CP as CEO effective January 31, 2017. He was the only named executive with a change in control agreement with CP.
49
Table of Contents
The next table shows the estimated incremental amounts that would be paid to Mr. Creel and Mr. Ellis if their employment had been terminated without cause on December 31, 2017. None of the named executive receives an excise tax gross-up provision for any termination benefit.
| Severance payment | ||||||||||||||||||||||||||||
| Name | Severance period (# of months) |
Base pay ($) |
Short-term Incentive ($) |
Additional retirement benefits ($) |
Other benefits ($) |
Value of vesting of options and equity-based awards ($) |
Payable on termination without cause ($) |
|||||||||||||||||||||
| Keith Creel |
24 | 2,822,625 | 3,387,150 | - | 34,169 | 6,369,723 | 12,613,667 | |||||||||||||||||||||
| Jeffrey Ellis |
12 | 445,000 | 267,000 | - | 14,592 | 690,249 | 1,416,841 | |||||||||||||||||||||
| Total |
3,267,625 | 3,654,150 | - | 48,761 | 7,059,972 | 14,030,508 | ||||||||||||||||||||||
Notes:
| • | Other benefits include the cost of group benefits for Mr. Ellis for the severance period, and the value of accelerated vesting of shares purchased under the Employee Share Purchase Plan for Mr. Creel and Mr. Ellis. |
| • | For Mr. Creel, the value of vesting of options and equity-based awards is the value of options vesting within six months following termination and the prorated value as of the termination date of PSU awards. It is based on $229.66, our closing share price on the TSX on December 29, 2017 and US$182.76, the closing price of our shares on the NYSE, converted into Canadian dollars using a year-end exchange rate of $1.2545. |
| • | For Mr. Ellis, the value of vesting of options and equity-based awards is based on $229.66, our closing share price on the TSX on December 29, 2017. |
50
Table of Contents
| Our director compensation program shares the same objective as our executive compensation program: to attract and retain qualified directors and to align the interests of directors and shareholders.
Flat fee retainer We pay directors a flat fee, which is easy to administer and reflects the director’s ongoing oversight and responsibilities throughout the year and attendance at Board and committee meetings.
Directors receive 100% of their annual retainer in Director Deferred Share Units (DDSUs) until they have met their share ownership requirements. After that they must receive at least 50% of their retainer in DDSUs, and can receive the balance in cash. Directors must make their election before the beginning of each calendar year.
Directors must meet their share ownership requirements within five years of joining the Board, and must hold their DDSUs for one year after they retire from the Board.
The table below shows the flat fee retainers for 2017. In 2017 Canadian directors were paid in Canadian dollars and the number of DDSUs was based on the trading price of our shares on the TSX, while U.S. directors were paid in U.S. dollars and the number of DDSUs they receive was based on the trading price of our shares on the NYSE.
|
Aligning director and shareholder interests Directors receive their annual retainer in deferred share units so they have an ongoing stake in our future success, aligning their interests with those of our shareholders.
About DDSUs DDSUs are granted to directors under the director deferred share unit plan. Only non-employee directors participate in the plan.
A DDSU is a bookkeeping entry that has the same value as one CP common share. DDSUs earn additional units as dividend equivalents at the same rate as dividends paid on our shares. Directors receive a cash amount for their DDSUs, one year after they leave the Board, based on the market value of our shares at the time of redemption, less any withholding taxes.
| |||||||
| Annual retainer | ||||||||
| Board Chair retainer |
$395,000 | |||||||
| Director retainer |
$235,000 | |||||||
| Committee chair retainer |
$30,000 | |||||||
We reimburse directors for travel and out-of-pocket expenses related to attending their Board and committee meetings and other business on behalf of CP.
Mr. Creel does not receive any director compensation because he is compensated in his role as President and CEO.
Benchmarking
Similar to executive compensation, we benchmark director compensation so we can attract the right director talent and be competitive with the market.
We use a comparator group of 21 companies, which are capital-intensive Canadian businesses ranging from one-third to three times the size of CP based on size of assets.
The 2017 compensation comparator group included the following companies:
| Agrium Air Canada ATCO Group Bell Canada (new) Bombardier Canadian Tire (new) CGI Group Inc. (new) |
Canadian National Railway Canadian Natural Resources Limited (new) Cenovus Energy Encana Finning International Inc. Kinross Gold Corp. Maple Leaf Foods |
PotashCorp Rogers Communications SNC-Lavalin Group Suncor Energy (new) Teck Resources Telus TransAlta Corporation |
51
Table of Contents
We also look at the director compensation of the Class 1 railroads as a secondary reference.
Independent advice
The Governance Committee may engage an independent consultant with respect to director compensation. The Governance Committee makes its own decisions, which may reflect factors and considerations other than the information and recommendations provided by its external consultant. The Governance Committee did not engage an external compensation consultant in 2017.
2017 director compensation
We paid directors a total of approximately $2,650,506 in 2017 as shown in the table below. Directors receive a flat fee retainer to cover their ongoing oversight and responsibilities throughout the year and their attendance at Board and committee meetings.
All of our directors are required to receive at least 50% of their compensation in director deferred share units (DDSUs). The total represents the approximate dollar value of DDSUs credited to each director’s DDSU account in 2017, based on the closing fair market value of our common shares on the grant date plus the cash portion paid where a director elected to receive a portion of compensation in cash.
Mr. Creel does not receive director compensation because he is compensated in his role as President and CEO (see pages 27 and 41 for details). Former director Hunter Harrison also received no director compensation as he was compensated as CEO during his tenure.
| Name | Fees earned ($) |
Share-based awards ($) |
Option-based awards ($) |
Non-equity incentive plan compensation ($) |
Pension value |
All other compensation ($) |
Total ($) |
|||||||||||||||||||||
| John Baird |
- | 235,987 | - | - | - | 1,000 | 236,987 | |||||||||||||||||||||
| Isabelle Courville |
132,500 | 133,056 | - | - | - | 1,000 | 266,556 | |||||||||||||||||||||
| Jill Denham |
- | 235,987 | - | - | - | 1,000 | 236,987 | |||||||||||||||||||||
| William Fatt |
- | 228,846 | - | - | - | 1,000 | 229,846 | |||||||||||||||||||||
| Rebecca MacDonald |
- | 266,113 | - | - | - | 1,000 | 267,113 | |||||||||||||||||||||
| Matthew Paull |
- | 326,824 | - | - | - | 1,000 | 327,824 | |||||||||||||||||||||
| Jane Peverett |
- | 255,391 | - | - | - | 1,000 | 256,391 | |||||||||||||||||||||
| Andrew Reardon |
- | 518,392 | - | - | - | 1,000 | 519,392 | |||||||||||||||||||||
| Gordon Trafton |
- | 308,410 | - | - | - | 1,000 | 309,410 | |||||||||||||||||||||
| • | Ms. Courville elected to receive 50% of her annual director compensation in DDSUs with the remaining 50% paid in cash. |
| • | The value of the share-based awards has been calculated in accordance with Financial Accounting Standards Board Accounting Standards Codification Topic 718 (FASB ASC 718) using the grant date fair value. |
| • | Each director was provided with a $1,000 donation to the charity of their choice in December 2017 in gratitude for their year of service. This amount appears under All other compensation. |
| • | Mr. Paull, Mr. Reardon and Mr. Trafton were paid in U.S. dollars and their share-based awards have been converted to Canadian dollars using the 2017 average exchange rate of $1.2986. |
The Governance Committee reviews director compensation every two to three years based on the directors’ responsibilities and time commitment and the compensation provided by comparable companies. In 2017 the committee completed a review of our director compensation program and based on its recommendation, the Board amended the director compensation program to pay all directors fees in U.S. dollars instead of the past practice of paying directors in their local currency. As a result, the Board approved that, effective January 1, 2018, each director will be paid an annual retainer of US$200,000. Committee chairs receive an additional US$30,000 per year and the Board Chair receives an annual retainer of US$395,000. No other changes were made to the director compensation program in 2017.
52
Table of Contents
ITEM 12. SECURITY OWNERSHIP OF CERTAIN BENEFICIAL OWNERS AND MANAGEMENT AND RELATED STOCKHOLDER MATTERS
Equity Compensation Plan Information
See Item 11 – “Executive Compensation—Equity Compensation Plan Information” for information regarding our equity compensation plans on page 46.
Beneficial Ownership Table
The table below sets forth the number and percentage of outstanding Shares of Common Stock beneficially owned by each person, or group of persons, known by Canadian Pacific based on publicly available information as of March 15, 2017, to own beneficially more than five percent of our Common Stock, each of our directors, each of our NEOs and all directors and executive officers as a group.
Unless otherwise indicated in the table, the address of each of the individuals named below is c/o Canadian Pacific, 7550 Ogden Dale Road S.E., Calgary, Alberta, T2C 4X9.
| Name of Beneficial Owner | Shares of Common Stock Beneficially Owned | Percent of Common Stock Outstanding | ||||||
| John Baird(a) |
- | - | ||||||
| Isabelle Courville(a) |
900 | - | ||||||
| Jill Denham(a) |
- | - | ||||||
| William Fatt(a) |
- | - | ||||||
| Rebecca MacDonald(a) |
- | - | ||||||
| Matthew Paull(a) |
1,000 | - | ||||||
| Jane Peverett(a) |
- | - | ||||||
| Andrew Reardon(a) |
4,031 | - | ||||||
| Gordon T. Trafton II(a) |
- | - | ||||||
| Keith Creel(b) |
2,561 | * | ||||||
| Jeffrey Ellis(b) |
360 | * | ||||||
| Robert Johnson(b) |
300 | * | ||||||
| Laird Pitz(b) |
52 | * | ||||||
| Nadeem Velani(b) |
852 | * | ||||||
| All current executive officers and directors as a group |
18,744 | * | ||||||
| * | Represents less than one percent of the outstanding Common Stock. |
| (a) | See Directors’ Profiles in “Item 10. Directors, Executive Officers and Corporate Governance” above for disclosure with respect to DDSUs. |
| (b) | See “Compensation Details – Deferred Compensation Plans” in Item 11. Executive Compensation, for disclosure with respect to NEO DSUs. |
ITEM 13. CERTAIN RELATIONSHIPS AND RELATED TRANSACTIONS, AND DIRECTOR INDEPENDENCE
Related party transactions
Directors, officers and employees are required to report any related party transactions to comply with the code.
In 2017, there were no transactions between CP and a related person as described in Item 404 of Regulation S-K, which defines a related person as:
| • | a director, nominated director or executive officer of CP |
| • | an immediate family member of a director, nominated director or executive officer, or |
| • | someone who beneficially owns more than 5% of our shares or a member of their immediate family. |
Any director who has a material interest in a transaction or agreement involving CP must disclose the interest to the CEO and the Chairman of the Board immediately, and does not participate in any discussions or votes on the matter.
The Board reviews related party transactions when it does its annual review of director independence. Our accounting and legal departments review any related party transactions reported by officers and employees.
53
Table of Contents
Independence
The Board has adopted standards for director independence based on the criteria of the NYSE, SEC and CSA.
It reviews director independence annually using director questionnaires, reviewing updated biographical information, meeting with directors individually, and conducting a comprehensive assessment of all business and other relationships and interests of each director with respect to CP and our subsidiaries. In 2017 the Board determined that each director, except for Mr. Creel, is independent in accordance with the standards for independence established by the NYSE, and NI 58-101 Disclosure of Corporate Governance Practices. Mr. Creel is not independent because of his position as President and Chief Executive Officer of CP.
The Board has also determined that each member of the audit committee meets the additional independence standards for audit committee members under the NYSE, Section 10A(m)(3) and Rule 10A-3(b)(1) of the Exchange Act, and NI 52-110 Audit Committees.
ITEM 14. PRINCIPAL ACCOUNTING FEES AND SERVICES
The table below shows the fees we paid to Deloitte in 2017 and 2016 for audit and non-audit services.
| For the year ended December 31 | 2017 | 2016 | ||||||
| Audit fees |
$ | 3,834,100 | $ | 2,398,500 | ||||
| for audit of our annual financial statements, reviews of quarterly reports and services relating to statutory and regulatory filings or engagements (including attestation services and audit of financial statements of certain subsidiaries and certain pension and benefits plans, and advice on accounting and/or disclosure matters) | ||||||||
| Audit-related fees |
$ | 21,000 | $ | 289,800 | ||||
| for assurance and services related to the audit but not included in the audit fees above, including securities filings, compliance review of third-party agreements, refinancing of subsidiary companies and accounting training | ||||||||
| Tax fees |
$ | 153,100 | $ | 147,000 | ||||
| for services relating to tax compliance, tax planning and tax advice and access fees for taxation database resources | ||||||||
| All other fees |
$ | 34,600 | $ | 26,100 | ||||
| for services provided relating to CP’s corporate sustainability report | ||||||||
| Total |
$ | 4,042,800 | $ | 2,861,400 | ||||
Pre-approval of audit services and fees
The audit committee has a written policy for pre-approving audit and non-audit services by the independent auditor and their fees, in accordance with the laws and requirements of stock exchanges and securities regulatory authorities.
The policy sets out the following governance procedures:
| • | the audit committee pre-approves the terms of the annual engagement of the external auditor |
| • | the Board pre-approves the fees for the annual engagement and budgeted amounts for the audit and non-audit services at least annually |
| • | the controller submits reports at least quarterly to the audit committee listing the services that were performed or planned to be performed by the external auditor |
| • | any additional non-audit services to be provided by the external auditor that were not included in the list of pre-approved services or exceed the budgeted amount by more than 10% must each be pre-approved by the audit committee or the committee chair. The committee chair must report any additional pre-approvals at the next committee meeting |
| • | the audit committee reviews the policy as necessary to make sure it continues to reflect our needs |
| • | our chief internal auditor monitors compliance with the policy. |
The audit committee or committee chair must be satisfied that any services it pre-approves will not compromise the independence of the external auditor. The committee pre-approved all services performed by the external auditor in 2017, in accordance with the policy.
54
Table of Contents
| ITEM 15. | EXHIBITS, FINANCIAL STATEMENT SCHEDULE |
Part IV (Item 15) of the 2017 Form 10-K is hereby amended solely to add the following exhibits required to be filed in connection with this Amendment No. 1.
| (b) | Exhibits |
Exhibits are listed in the exhibit index below.
| Exhibit |
Description | |
| 31.1* | CEO Rule 13a-14(a) Certifications relating to this Amendment No. 1 on Form 10-K/A | |
| 31.2* | CFO Rule 13a-14(a) Certifications relating to this Amendment No. 1 on Form 10-K/A | |
| * | Filed with this Amendment No. 1 on Form 10-K/A |
55
Table of Contents
Pursuant to the requirements of Section 13 or 15(d) of the Securities Exchange Act of 1934, the Company has duly caused this report to be signed on its behalf by the undersigned, thereunto duly authorized.
| CANADIAN PACIFIC RAILWAY LIMITED | ||
| (Registrant) | ||
| By: | /s/ KEITH CREEL | |
| Keith Creel | ||
| Chief Executive Officer | ||
Dated: April 5, 2018
Pursuant to the requirements of the Securities Exchange Act of 1934, this report has been signed below by the following persons on behalf of the Company and in the capacities indicated on April 5, 2018.
| Signature | Title | |
| * Keith Creel |
Chief Executive Officer and Director (Principal Executive Officer) | |
| /s/ NADEEM VELANI Nadeem Velani |
Executive Vice-President and Chief Financial Officer (Principal Financial and Accounting Officer) | |
| * Andrew F. Reardon |
Chairman of the Board of Directors | |
| * John R. Baird |
Director | |
| * Isabelle Courville |
Director | |
| * Gillian H. Denham |
Director | |
| * Rebecca MacDonald |
Director | |
| * Matthew H. Paull |
Director | |
| * Jane L. Peverett |
Director | |
| * Gordon T. Trafton II |
Director | |
| *By: | /s/ NADEEM VELANI | |
| Nadeem Velani | ||
| Attorney-in-Fact | ||
56