Attached files
| file | filename |
|---|---|
| EX-32.1 - EXHIBIT 32.1 - DZS INC. | exhibit321section1350certi.htm |
| EX-31.2 - EXHIBIT 31.2 - DZS INC. | exhibit312certificationofc.htm |
| EX-31.1 - EXHIBIT 31.1 - DZS INC. | exhibit311certificationofc.htm |
| EX-23.2 - EXHIBIT 23.2 - DZS INC. | exhibit232-q4fy17xdzsicons.htm |
| EX-23.1 - EXHIBIT 23.1 - DZS INC. | exhibit231-pwcusconsentfy1.htm |
| EX-21.2 - EXHIBIT 21.2 - DZS INC. | exhibit212listofsubsidiari.htm |
| EX-10.22.12 - EXHIBIT 10.22.12 - DZS INC. | exhibit102212-letteragreem.htm |
| EX-10.22.8 - EXHIBIT 10.22.8 - DZS INC. | exhibit10228eighthamendmen.htm |
| EX-10.9 - EXHIBIT 10.9 - DZS INC. | exhibit109golombemployment.htm |
| EX-10.8 - EXHIBIT 10.8 - DZS INC. | exhibit108employmentagreem.htm |
| EX-10.4 - EXHIBIT 10.4 - DZS INC. | exhibit104nonemployeedirec.htm |
UNITED STATES
SECURITIES AND EXCHANGE COMMISSION
Washington, D.C. 20549
FORM 10-K
(Mark One)
x | ANNUAL REPORT PURSUANT TO SECTION 13 OR 15(d) OF THE SECURITIES EXCHANGE ACT OF 1934 |
For the fiscal year ended December 31, 2017
OR
¨ | TRANSITION REPORT PURSUANT TO SECTION 13 OR 15(d) OF THE SECURITIES EXCHANGE ACT OF 1934 |
For the transition period from to
Commission File Number: 000-32743
DASAN ZHONE SOLUTIONS, INC.
(Exact name of registrant as specified in its charter)
Delaware | 22-3509099 |
(State or other jurisdiction of incorporation or organization) | (I.R.S. Employer Identification No.) |
7195 Oakport Street
Oakland, California 94621
(Address of principal executive office)
Registrant’s telephone number, including area code: (510) 777-7000
Securities registered pursuant to Section 12(b) of the Act:
Common Stock, $0.001 Par Value | The Nasdaq Stock Market LLC |
(Title of class) | (Name of each exchange on which registered) |
Securities registered pursuant to Section 12(g) of the Act: None
Indicate by check mark if the registrant is a well-known seasoned issuer, as defined in Rule 405 of the Securities Act. Yes ¨ No x
Indicate by check mark if the registrant is not required to file reports pursuant to Section 13 or Section 15(d) of the Exchange Act. Yes ¨ No x
Indicate by check mark whether the registrant (1) has filed all reports required to be filed by Section 13 or 15(d) of the Exchange Act during the preceding 12 months (or for such shorter period that the registrant was required to file such reports), and (2) has been subject to such filing requirements for the past 90 days. Yes x No ¨
Indicate by check mark whether the registrant has submitted electronically and posted on its corporate Web site, if any, every Interactive Data File required to be submitted and posted pursuant to Rule 405 of Regulation S-T (§ 232.405 of this chapter) during the preceding 12 months (or for such shorter period that the registrant was required to submit and post such files). Yes x No ¨
Indicate by check mark if disclosure of delinquent filers pursuant to Item 405 of Regulation S-K is not contained herein, and will not be contained, to the best of registrant’s knowledge, in definitive proxy or information statements incorporated by reference in Part III of this Form 10-K or any amendment to this Form 10-K. x
Indicate by check mark whether the registrant is a large accelerated filer, an accelerated filer, a non-accelerated filer, a smaller reporting company, or an emerging growth company. See definitions of “large accelerated filer,” “accelerated filer,” “smaller reporting company,” and “emerging growth company” in Rule 12b-2 of the Exchange Act (Check one):
Large accelerated filer | ¨ | Accelerated filer | ¨ |
Non-accelerated filer | ¨ (Do not check if a smaller reporting company) | Smaller reporting company | x |
Emerging growth company | ¨ | ||
If an emerging growth company, indicate by check mark if the registrant has elected not to use the extended transition period for complying with any new or revised financial accounting standards provided pursuant to Section 13(a) of the Exchange Act. ¨
Indicate by check mark whether the registrant is a shell company (as defined in Rule 12b-2 of the Exchange Act). Yes ¨ No x
As of April 2, 2018, there were 16,430,963 shares outstanding of the registrant’s common stock, $0.001 par value. As of June 30, 2017 (the last business day of the registrant’s most recently completed second fiscal quarter ), the aggregate market value of common stock held by non-affiliates of the registrant was approximately $34,723,085.
DOCUMENTS INCORPORATED BY REFERENCE
Portions of the registrant's definitive Proxy Statement for the 2018 Annual Meeting of Stockholders are incorporate by reference into Part III where indicated.
TABLE OF CONTENTS
Page | ||
PART I | ||
Item 1. | ||
Item 1A. | ||
Item 1B. | ||
Item 2. | ||
Item 3. | ||
Item 4. | ||
PART II | ||
Item 5. | ||
Item 6. | ||
Item 7. | ||
Item 7A. | ||
Item 8. | ||
Item 9. | ||
Item 9A. | ||
Item 9B. | ||
PART III | ||
Item 10. | ||
Item 11. | ||
Item 12. | ||
Item 13. | ||
Item 14. | ||
PART IV | ||
Item 15. | ||
Item 16. | ||
Forward-looking Statements
This report, including “Management’s Discussion and Analysis of Financial Condition and Results of Operations,” contains forward-looking statements regarding future events and our future results that are subject to the safe harbors created under the Securities Act of 1933 and the Securities Exchange Act of 1934, or the Exchange Act. These statements are based on current expectations, estimates, forecasts, and projections about the industries in which we operate and the beliefs and assumptions of our management. We use words such as “anticipate,” “believe,” “continue,” “could,” “estimate,” “expect,” “goal,” “intend,” “may,” “plan,” “project,” “seek,” “should,” “target,” “will,” “would,” variations of such words, and similar expressions to identify forward-looking statements. In addition, statements that refer to projections of earnings, revenue, costs or other financial items; anticipated growth and trends in our business or key markets; cost synergies, growth opportunities and other financial and operating benefits of the Merger (as defined below); future growth and revenues from our products; our ability to refinance or repay our existing indebtedness prior to the applicable maturity date; future economic conditions and performance; anticipated performance of products or services; plans, objectives and strategies for future operations; and other characterizations of future events or circumstances, are forward-looking statements. Readers are cautioned that these forward-looking statements are only predictions and are subject to risks, uncertainties and assumptions that are difficult to predict, including those identified under the heading “Risk Factors” in Item 1A, elsewhere in this report and our other filings with the Securities and Exchange Commission (the SEC). Therefore, actual results may differ materially and adversely from those expressed in any forward-looking statements. Factors that might cause such a difference include, but are not limited to, our ability to realize the anticipated cost savings, synergies and other benefits of the Merger and any integration risks relating to the Merger, the ability to generate sufficient revenue to achieve or sustain profitability, the ability to raise additional capital to fund existing and future operations or to refinance or repay our existing indebtedness, defects or other performance problems in our products, any economic slowdown in the telecommunications industry that restricts the ability of our customers to purchase our products, commercial acceptance of our products, intense competition in the communications equipment market from large equipment companies as well as private companies with products that address the same networks needs as our products, higher than anticipated expenses that we may incur, any failure to comply with the periodic filing and other requirements of The Nasdaq Stock Market, or Nasdaq, for continued listing, material weaknesses or other deficiencies in our internal control over financial reporting, the initiation of any civil litigation, regulatory proceedings, government enforcement actions or other adverse effects relating to the Audit Committee investigation or errors in the consolidated financial statements of Legacy Zhone (as defined below) and other factors identified elsewhere in this report. We undertake no obligation to revise or update any forward-looking statements for any reason.
PART I
ITEM 1. BUSINESS
Corporate Information
DASAN Zhone Solutions, Inc. (DZS, formerly known as Zhone Technologies, Inc.) was incorporated under the laws of the state of Delaware in June 1999. On September 9, 2016, we acquired Dasan Network Solutions, Inc. a California corporation (DNS) through the merger of a wholly owned subsidiary of Zhone Technologies, Inc. with and into DNS, with DNS surviving as our wholly owned subsidiary (the Merger). At the effective time of the Merger, all issued and outstanding shares of capital stock of DNS held by its sole shareholder, DASAN Networks, Inc. (DNI), were canceled and converted into the right to receive shares of our common stock in an amount equal to 58% of the issued and outstanding shares of our common stock immediately following the Merger. In connection with the Merger, Zhone Technologies, Inc. changed its name to DASAN Zhone Solutions, Inc. The mailing address of our worldwide headquarters is 7195 Oakport Street, Oakland, California 94621, and our telephone number at that location is (510) 777-7000.
As used in this report, unless the context suggests otherwise, the terms "we," "us" or "our" refer to (i) DNS and its consolidated subsidiaries for periods through September 8, 2016 and (ii) DZS and its consolidated subsidiaries for periods on or after September 9, 2016, the effective date of the Merger. For periods through September 8, 2016, Zhone Technologies, Inc. is referred to as "Legacy Zhone."
Company Overview
We are a global provider of network access solutions and communications equipment for service provider and enterprise networks. We research, develop, test, sell, manufacture and support communications equipment in five major areas: broadband access, Ethernet switching, mobile backhaul, passive optical LAN (POLAN) and software defined networks (SDN).
1
We research, develop and test products and technologies for our customers to purchase and deploy in their networks. We have development and test capabilities in five countries around the world. We are a global company with over 1,000 customers in more than 50 countries worldwide. We use a combination of both in-house and outsourced manufacturing of our products.
Broadband Access
Our broadband access products are at the core of our product strategy and offer a variety of options for carriers and service providers to connect residential and business customers. Our solutions allow carriers and service providers to either use high-speed fiber or leverage their existing deployed copper networks to offer broadband services to customer premises. Once our broadband access products are deployed, the service provider can offer voice, high-definition and ultra-high-definition video, high-speed internet access and business class services to their customers. We develop our broadband access products for all aspects of carrier and service provider access networks: customer premise equipment (such as digital subscriber line (DSL) modems), Ethernet access demarcation devices, Gigabit passive optical network (GPON) terminals, 10 Gigabit (10G) passive optical network (XGPON1/XGSPON/NGPON2) terminals and, Gigabit (GE) and 10G point-to-point Active Ethernet optical network terminals (ONTs). We also develop central office products, such as broadband loop carriers for DSL and voice-grade telephone service (POTS), high-speed digital subscriber line access multiplexers (DSLAMs) with G.fast and very-high-bit-rate DSL (VDSL) capabilities, optical line terminals (OLTs) for passive optical distribution networks like GPONs, 10G passive optical networks and 10G point-to-point Active Ethernet.
Ethernet Switching
Our Ethernet switching products provide a high-performance and manageable solution that bridges the gap from carrier access technologies to the core network. Over the past ten years carriers have migrated access infrastructure to Ethernet from time-division multiplexing and asynchronous transfer mode systems. Our products can also be deployed in data centers, blurring the line between central office and data center. Our products support pure Ethernet switching as well as layer 3 IP and multiprotocol label switching (MPLS) and are currently being developed for deployment as part of SDNs.
Mobile Backhaul
Our mobile backhaul products provide a robust, manageable and scalable solution for mobile operators that enable them to upgrade their mobile backhaul systems and migrate from 3G networks to LTE and beyond. We provide our mobile backhaul products to mobile operators or carriers who provide the transport for mobile operators. Our mobile backhaul products may be collocated at the radio access node (RAN) base station (BS) and can aggregate multiple RAN BS in to a single backhaul for delivery of mobile traffic to the RAN network controller. We provide standard Ethernet/IP or MPLS interfaces and interoperate with other vendors in these networks. With mobile backhaul networks providing carriers with significant revenue growth in recent years, mobile backhaul has become one of the most important parts of their networks.
Passive Optical LAN
Our FiberLAN portfolio of POLAN products are designed for enterprise, campus, hospitality and entertainment arena usage. Our FiberLAN portfolio includes our high-performance, high-bandwidth GPON OLTs connected to the industry’s most diverse ONT product line, which include units with integrated Power over Ethernet (PoE) to power a wide range of PoE-enabled access devices. Our environmentally friendly FiberLAN POLAN solutions are one of the most cost-effective LAN technologies that can be deployed, allowing network managers to deploy a future-proof, low-maintenance, manageable solution that requires less space, air conditioning, copper and electricity than other alternatives.
Software Defined Networks
Our SDN and network function virtualization (NFV) strategy is to develop tools and building blocks that will allow service providers to migrate their networks’ full complement of legacy control plane and data plane devices to a centralized intelligent controller that can reconfigure the services of hundreds of network elements in real time for more controlled and efficient provision of bandwidth and latency across the network. The migration to SDN and NFV will provide better service for end customers and a more efficient and cost-effective use of hardware resources for service providers. We will leverage our broadband access, mobile backhaul and Ethernet switching expertise to extract and virtualize many of the traditional legacy control and data plane functions to allow them to be run from the Cloud. The latest evolution of our hardware-based solution was designed to support SDN and NFV.
2
Industry Background
We believe growth in our business in the coming years will be driven by continued growth in worldwide demand for network access solutions and communications equipment that enable or support access to high-speed broadband services. The communications industry continues to experience rapid expansion with the internet and proliferation of bandwidth-intensive applications and services leading to increasing demands for high-bandwidth communications networks. The broad adoption of new technologies such as smartphones, digital video cameras and high definition and ultra high definition televisions allow music, pictures, user-generated content (as found on the many video-sharing sites) and high definition video to be a growing part of consumers’ regular exchange of information. In recent years, the growth of social communications and social networking has continued to place demands on existing access infrastructure and new consumer demands are challenging even the newest and most advanced infrastructures. All of these new technologies share a common dependency on high-bandwidth communication networks and sophisticated traffic management tools. However, network service providers have struggled to meet the increased demand for high-speed broadband access due to the cost of network infrastructure upgrades. As bandwidth demands continue to increase, carriers need to continue to upgrade their network infrastructure to support such demand. The infrastructure upgrade cycle typically has the effect of moving bandwidth bottlenecks from one part of the network to another (such as a carrier’s access network, core network or datacenters), depending on technology selection and cost.
It is widely believed that a fiber-optic connection that runs from customers’ premises all the way to the carrier’s datacenters is the best network architecture for a fixed network. This network architecture is called Fiber to the Premises (FTTP). However, FTTP is also typically the most expensive network solution, due to the associated build-out and equipment cost. Although many carriers have, to different degrees, adopted FTTP as their primary network architecture, many limit their use of FTTP to new greenfield builds and rely on hybrid fiber-copper topologies in their existing network in order to reduce cost. For example, popular and less costly alternatives to FTTP include Fiber to the Curb (FTTC) or Fiber to the Node (FTTN) network architecture. In these architectures, the carrier lays a fiber-optic cable to a street cabinet and then uses DSLAMs or Multiple Service Access Node (MSAN) to provide higher speed services to their customers over copper wire. Another trend in network access is the shift away from the legacy telephone switches (used in carrier networks from the 1980’s to the early 2000’s): many carriers that continue to provide services over copper wire are decommissioning their legacy telephone switches and moving services over to Voice over Internet Protocol (VoIP) platforms on an MSAN. Our broadband access products and solutions are designed to address these market trends by allowing carriers and service providers to either use fiber-optic networks or leverage their existing deployed copper networks to offer broadband services to customer premises.
With respect to mobile wireless networks, the popularity of mobile smartphones and increasing demand for mobile data has forced mobile network operators to upgrade their mobile access technologies from 3rd generation wireless (3G) to 4th generation wireless (4G or LTE) and to plan for 5th generation wireless technologies (5G). These technology upgrades are typically accompanied by network infrastructure upgrades, including upgrades to the carriers’ access networks (referred to as mobile backhaul), core networks and datacenters. Our mobile backhaul products provide a robust, manageable and scalable solution for mobile network operators that enable them to upgrade their mobile backhaul systems and migrate from 3G networks to LTE and beyond.
Another growing industry trend is the desire of carriers and service providers to simplify network operation and reduce costs. Increasingly, we see network operators seeking to reduce the number of active components in their networks and to centralize network data and control in datacenters, both of which require network redesigns and upgrades. Our FiberLAN portfolio of POLAN products, as well as our Ethernet switching products and SDN and NFV tools and building blocks, are designed to address these market trends, with POLAN emerging as a popular customer choice for network upgrades.
The DZS Strategy
Our business strategy is to be a leading global provider of network access solutions and communications equipment. The principal elements of our strategy include:
• | Leverage Growth Opportunities from the Merger. We believe the expanded geographic reach of the combined company and the enhanced functionality and range of our product offerings following the Merger represent attractive opportunities for growth in our business. Prior to the Merger, DNS provided communications equipment primarily in the Asia-Pacific region with a particular focus on Korea, Japan and Vietnam, and Legacy Zhone provided communications equipment primarily in the Americas and EMEA region. DNS and Legacy Zhone had complementary product portfolios prior to the Merger, with both DNS and Legacy Zhone offering broadband access solutions and related products. We intend to continue to leverage the combination of DNS and Legacy Zhone products to enhance the functionality and range of our product offerings and create increased sales opportunities worldwide. |
• | Drive Cost Efficiencies through Integration of DNS and Legacy Zhone Operations. We intend to continue to drive cost efficiencies in our business through continuing efforts to integrate the DNS and Legacy Zhone global operations, |
3
with a view to creating a single efficient global engineering and support organization to support all customers of the combined company worldwide. We also expect to drive further cost efficiencies through product cost reductions and manufacturing economies of scale resulting from the Merger.
• | Maintain Focus on Technology Leadership. We believe that our future success is built upon our investment in the development of advanced communications technologies. We intend to continue to focus on research and development to maintain our leadership position in network access solutions and communications equipment. |
Customers
For our core business, we sell our products and services to carriers and service providers that offer voice, data and video services to businesses, governments, utilities and residential consumers. Our global customer base includes regional, national and international carriers and service providers. To date, our products have been deployed by over 1,000 carriers and service providers worldwide.
For our FiberLAN business, we sell our POLAN solutions directly and through system integrators and distributors to hospitality, education, stadiums, manufacturing and business enterprises as well as to the government and military. Our global FiberLAN customer base includes hotels, universities, sports arenas, military bases, government institutions, manufacturing facilities and Fortune 500 businesses.
For the year ended December 31, 2017 no customer represented 10% or more of net revenue. For the year ended December 31, 2016, three customers, SK Broadband, Inc., DNI (a related party) and LG Uplus Corp., represented 16%, 14% (a related party) and 10% of net revenue, respectively. For the year ended December 31, 2015, four customers, KT Corporation, LG Uplus Corp., DNI (a related party) and SK Broadband, Inc. represented 26%, 21%, 17% (a related party) and 10% of net revenue, respectively. No other customers accounted for 10% or more of net revenue during these periods.
Research and Development
The industry in which we compete is subject to rapid technological developments, evolving industry standards, changes in customer requirements, and continuing developments in communications service offerings. Our continuing ability to adapt to these changes, and to develop new and enhanced products, is a significant factor in maintaining or improving our competitive position and our prospects for growth. Therefore, we continue to make significant investments in product development.
We have research and product development facilities at our headquarters in Oakland, California, as well as core research and product development centers in Seminole, Florida, Alpharetta Georgia, South Korea, Vietnam and India. In all of these centers we develop and test both our hardware and software solutions. We continue to invest heavily in automated and scale testing capabilities for our products to better emulate our customers’ networks.
Our product development activities focus on products to support both existing and emerging technologies in the segments of the communications industry that we consider represent viable revenue opportunities. We are actively engaged in continuing to refine our solution architecture, introducing new products using the various solutions we support, and in creating additional interfaces and protocols for both domestic and international markets.
We continue our commitment to invest in leading edge technology research and development. Our research and product development expenses were $35.4 million, $25.4 million, and $21.3 million in 2017, 2016 and 2015, respectively. We plan to continue to support the development of new products and features, while seeking to carefully manage associated costs through expense controls.
Intellectual Property
We seek to establish and maintain our proprietary rights in our technology and products through the use of patents, copyrights, trademarks and trade secret laws. We also seek to maintain our trade secrets and confidential information by nondisclosure policies and through the use of appropriate confidentiality agreements. We have obtained a number of patents and trademarks in the United States and in other countries. There can be no assurance, however, that these rights can be successfully enforced against competitive products in every jurisdiction. Although we believe the protection afforded by our patents, copyrights, trademarks and trade secrets has value, the rapidly changing technology in the networking industry and uncertainties in the legal process make our future success dependent primarily on the innovative skills, technological expertise, and management abilities of our employees rather than on the protection afforded by patent, copyright, trademark, and trade secret laws.
Many of our products are designed to include intellectual property licensed from third parties. While it may be necessary in the future to seek or renew licenses relating to various aspects of our products, we believe, based upon past experience and standard industry practice, that such licenses generally could be obtained on commercially reasonable terms. Nonetheless, there
4
can be no assurance that the necessary licenses would be available on acceptable terms, if at all. Our inability to obtain certain licenses or other rights or to obtain such licenses or rights on favorable terms, or the need to engage in litigation regarding these matters, could have a material adverse effect on our business, operating results and financial condition.
The communications industry is characterized by rapidly changing technology, a large number of patents, and frequent claims and related litigation regarding patent and other intellectual property rights. We cannot assure you that our patents and other proprietary rights will not be challenged, invalidated or circumvented, that others will not assert intellectual property rights to technologies that are relevant to us, or that our rights will give us a competitive advantage. In addition, the laws of some foreign countries may not protect our proprietary rights to the same extent as the laws of the United States.
Sales and Marketing
We have a sales presence in various domestic and foreign locations, and we sell our products and services both directly and indirectly through channel partners with support from our sales force. Channel partners include distributors, resellers, system integrators and service providers. These partners sell directly to end customers and often provide additional value add services such as system installation, technical support, and professional support services in addition to the equipment sale. Our sales efforts are generally organized according to geographical regions:
• | U.S. Sales. Our U.S. Sales organization establishes and maintains direct and indirect relationships with domestic customers, which include carriers and service providers, cable operators utilities and enterprises. In addition, this organization is responsible for managing our distribution channel. |
• | International Sales. Our International Sales organization targets foreign carriers, service providers, enterprise customers and is staffed with individuals with specific experience dealing with carriers, service providers and channel partners, in their designated international territories. |
Our marketing team works closely with our sales, research and product development organizations, and our customers by providing communications that keep the market current on our products and features. Marketing also identifies and sizes new target markets for our products, creates awareness of our company and products, generates contacts and leads within these targeted markets and performs outbound education and public relations.
Backlog
Our backlog consists of purchase orders for products and services that we expect to ship or perform within the next year. Our backlog may fluctuate based on the timing of when purchase orders are received. At December 31, 2017, our backlog was $24.4 million, compared to $28.8 million at December 31, 2016. We consider backlog to be an indicator, but not the sole predictor, of future sales because our customers may cancel or defer orders without penalty.
Competition
We compete in communications equipment markets, providing products and services for the delivery of voice, data and video services. These markets are characterized by rapid change, converging technologies and a migration to solutions that offer superior advantages. These market factors represent both an opportunity and a competitive threat to us. We compete with numerous vendors in our core business, including Nokia, Calix, Adtran, Huawei, and ZTE, among others. In our FiberLAN business, our competitors include Tellabs and Cisco, among others. In our Ethernet switching business, our competitors include Brocade, Juniper, and Cisco, among others. In addition, a number of companies have introduced products that address the same network needs that our products and solutions address, both domestically and abroad. The overall number of our competitors may increase, and the identity and composition of competitors may change. As we continue to expand our sales globally, we may see new competition in different geographic regions. Barriers to entry are relatively low, and new ventures to create products that do or could compete with our products are regularly formed. Many of our competitors have greater financial, technical, sales and marketing resources than we do.
The principal competitive factors in the markets in which we presently compete and may compete in the future include:
• | product performance; |
• | interoperability with existing products; |
• | scalability and upgradeability; |
• | conformance to standards; |
• | breadth of services; |
5
• | reliability; |
• | ease of installation and use; |
• | geographic footprints for products; |
• | ability to provide customer financing; |
• | pricing; |
• | technical support and customer service; and |
• | brand recognition. |
While we believe that we compete successfully with respect to each of these factors, we expect to face intense competition in our markets. In addition, the inherent nature of communications networking requires interoperability. As such, we must cooperate and at the same time compete with many companies.
Manufacturing
We manufacture our products using a strategic combination of procurement from qualified suppliers, in-house manufacturing at our facility in Florida, and the use of original equipment manufacturers (OEMs) located in the Far East. We manufacture many of our more complex products at our manufacturing facility in Florida.
Our parts and components are procured from a variety of qualified suppliers in the U.S., the Far East, Mexico and other countries around the world per our approved supplier list and detailed engineering specifications. Some completed products are procured to our specifications and shipped directly to our customers. We also acquire completed products from certain suppliers and configure and ship from our facility. Some of these purchases are significant. We purchase both standard off-the-shelf parts and components, which are generally available from more than one supplier, and single-source parts and components. We have generally been able to obtain adequate supplies to meet customer demand in a timely manner from our current vendors, or, when necessary, from alternate vendors. We believe that alternate vendors can be identified if current vendors are unable to fulfill our needs, or design changes can be made to employ alternate parts.
We design, specify, and monitor all of the tests that are required to meet our quality standards. Our manufacturing and test engineers work closely with our design engineers to ensure manufacturability and testability of our products, and to ensure that manufacturing and testing processes evolve as our technologies evolve. Our manufacturing engineers specify, build, or procure our test stations, establish quality standards and protocols, and develop comprehensive test procedures and processes to assure the reliability and quality of our products. Products that are procured complete or partially complete are inspected, tested, or audited for quality control.
Our Quality Management System is compliant with ISO-9001:2015 and we are certified to ISO-9001:2015 by our external registrar, National Standards Authority of Ireland (NSAI). ISO-9001:2015 requires that our processes are documented, followed and continuously improved. Internal audits are conducted on a regular schedule by our quality assurance personnel, and external audits are conducted by our external registrar each year. Our quality system is based upon our model for quality assurance in production and service to ensure our products meet rigorous quality standards.
We believe that we have sufficient production capacity to meet current and future demand for our product offerings through a combination of existing and added capacity, additional employees, or the outsourcing of products or components.
Compliance with Regulatory and Industry Standards
Our products must comply with a significant number of voice and data regulations and standards which vary by jurisdiction. Standards for new services continue to evolve, and we may need to modify our products or develop new versions to meet these standards. Standards setting and compliance verification in the U.S. are determined by the Federal Communications Commission, or FCC, Underwriters Laboratories, Quality Management Institute, Telcordia Technologies, Inc., and other communications companies. In international markets, our products must comply with standards issued by the European Telecommunications Standards Institute (ETSI) and other standards bodies, as implemented and enforced by the regulatory authorities in the applicable jurisdiction.
6
Environmental Matters
Our operations and manufacturing processes are subject to federal, state, local and foreign environmental protection laws and regulations. These laws and regulations relate to the use, handling, storage, discharge and disposal of certain hazardous materials and wastes, the pre-treatment and discharge of process waste waters and the control of process air pollutants. We believe that our operations and manufacturing processes currently comply in all material respects with applicable environmental protection laws and regulations. If we fail to comply with any present and future regulations, we could be subject to future liabilities, the suspension of production or a prohibition on the sale of our products. In addition, such regulations could require us to incur other significant expenses to comply with environmental regulations, including expenses associated with the redesign of any non-compliant product. From time to time new regulations are enacted, and it is difficult to anticipate how such regulations will be implemented and enforced. For example, in 2003 the European Union enacted the Restriction on the Use of Certain Hazardous Substances in Electrical and Electronic Equipment Directive (RoHS) and the Waste Electrical and Electronic Equipment Directive (WEEE), for implementation in European Union member states. We are aware of similar legislation that is currently in force or is being considered in the United States, as well as other countries, such as Japan and China. Additionally, we are aware of and are taking suitable action to comply with new European Union Restriction of Hazardous Substances standards (RoHS2) in advance of the 2019 compliance deadline. Our failure to comply with any of such regulatory requirements or contractual obligations could result in our being liable for costs, fines, penalties and third-party claims, and could jeopardize our ability to conduct business in countries in the jurisdictions where these regulations apply.
Audit Committee Investigation
On March 21, 2017, the Audit Committee of our Board of Directors concluded, in consultation with management and after informing our former independent registered public accounting firm, that Legacy Zhone's unaudited condensed consolidated financial statements contained in its Amendment No. 2 to Quarterly Report on Form 10-Q/A for the quarter ended June 30, 2016 should no longer be relied upon due to material errors associated with the sale and subsequent return of certain products sold in December 2014. In connection with such finding, the Audit Committee commenced an independent investigation to determine whether any financial statements of Legacy Zhone prior to the quarter ended June 30, 2016 contained material errors. As a result of this investigation, which concluded in late July 2017, the Audit Committee concluded, in consultation with management and after informing our former independent registered public accounting firm, that Legacy Zhone's unaudited condensed consolidated financial statements contained in its Quarterly Reports on Form 10-Q for the quarters ended March 31, 2015, June 30, 2015, September 30, 2015 and March 31, 2016 and Legacy Zhone's audited consolidated financial statements and assessments of internal control over financial reporting, including disclosure controls and procedures, for the years ended December 31, 2015 and 2014 contained in its Annual Reports on Form 10-K for the years ended December 31, 2015 and 2014 should no longer be relied upon. The determination that there were errors in Legacy Zhone's financial statements in periods prior to the Merger does not impact the financial statements of DZS following the Merger given the treatment of DNS as accounting acquirer.
Matters relating to or arising from the Audit Committee investigation and the associated material weaknesses identified in our internal control over financial reporting, including adverse publicity, have caused us to incur significant legal, accounting and other professional fees and other costs, have exposed us to greater risks associated with other civil litigation, regulatory proceedings and government enforcement actions, have diverted resources and attention that would otherwise be directed toward our operations and implementation of our business strategy and may have impacted our ability to attract and retain customers, employees and vendors.
Employees
As of December 31, 2017, we employed 629 individuals worldwide. We consider the relationships with our employees to be positive. Competition for technical personnel in our industry is intense. We believe that our future success depends in part on our continued ability to hire, assimilate and retain qualified personnel. To date, we believe that we have been successful in recruiting qualified employees, but there is no assurance that we will continue to be successful in the future.
Executive Officers
Set forth below is information concerning our executive officers and their ages as of December 31, 2017. As part of the management transition in connection with the first anniversary of the Merger, on September 11, 2017, James Norrod and Kirk Misaka stepped down from their roles as Co-Chief Executive Officer and Chief Financial Officer, respectively, and Il Yung Kim was appointed President, Chief Executive Officer and Acting Chief Financial Officer.
7
Mr. Norrod’s employment with us terminated on September 11, 2017 and he also stepped down from his role as a member of the Board of Directors on that date. Mr. Misaka remained in our employ as Corporate Treasurer and Secretary for a transitional period to assist with the transition of his responsibilities. Michael Golomb was appointed Chief Financial Officer, Corporate Treasurer and Secretary on December 1, 2017.
Name | Age | Position |
Il Yung Kim | 61 | Chief Executive Officer |
Michael Golomb | 42 | Chief Financial Officer, Corporate Treasurer and Secretary |
Il Yung Kim joined DZS as Co-Chief Executive Officer and a director on September 9, 2016 in connection with the Merger. Mr. Kim assumed the position of President and Chief Executive Officer on September 11, 2017 in connection with the resignation of James Norrod as part of the management transition described above, and in addition served as Acting Chief Financial Officer from September 11, 2017 to December 1, 2017. Prior to the Merger, Mr. Kim served as a consultant to DNI in connection with the Merger and, from September 2014 to August 2016, served as Chief Executive Officer of TukTak in Korea, an online startup company, which enables people with creative talents to collaborate and produce goods and services online. From December 2014 to August 2016, he also served as a strategic adviser for InMobi, a global mobile advertising platform provider. Previously, Mr. Kim held various positions with Korea Telecom, including as President and executive board member from 2013 to 2014, and as Chief Strategy Officer from 2010 to 2013. Mr. Kim commenced his career with British Telecom in 1982, where he held various senior positions including Vice President of Technology and Innovation and Programme Director and Head of Technology and Investment. Mr. Kim holds a B.S. (with Honors) in Electronic Engineering and an M.S. Degree in Microwave and Modern Optics from University College, University of London.
Michael Golomb was appointed Chief Financial Officer, Corporate Treasurer and Secretary of DZS on December 1, 2017. Prior to joining DZS, Mr. Golomb co-founded and was the managing partner of ICO Governance Foundation, a non-profit decentralized global organization with a protocol-based global community mission that performs a self-regulatory function for ICOs in decentralized capital markets. From June 2015 to May 2017, he served as the Chief Financial Officer of Breathometer, a pioneer in breath analysis technology. From December 2013 to April 2015, Mr. Golomb was Chief Financial Officer and Board Member of BitFury Group Ltd., a market leading full-service Blockchain technology company, and one of the largest private infrastructure providers in the Blockchain ecosystem. From 2011 to 2013 Mr. Golomb was an independent Senior Financial Consultant. From 2008 to 2011 Mr. Golomb was Co-Founder, Board Member, and Co-President (Finance/Operations/Business Development) at Mayak Real Estate, a joint venture between Morgan Stanley, MCP, and Mr. Golomb. From 2005 to 2007 Mr. Golomb was Chief Financial Officer at Sistema Hals Real Estate Joint-Stock Company, a publicly traded company on the London Stock Exchange. From 2002 to 2005, Mr. Golomb was Sr. Finance Manager / Head of Compliance at Trimble Navigation Ltd., a global leader in GPS technology and a publicly-traded company on NASDAQ. From 2000 to 2002 Mr. Golomb was Corporate Controller at Entegrity Solutions Corporation, a security software company. Prior to his public and private company experience Mr. Golomb was a Senior Consultant at PricewaterhouseCoopers. Mr. Golomb holds a Master of Science in Management from Stanford University Graduate School of Business, a Masters of Business Administration from Santa Clara University, and a Bachelor of Arts with a double major in Economics and Diplomacy & World Affairs from Occidental College. He is also a CPA (inactive) in California.
Web site and Available Information
Our website address is www.dasanzhone.com. The information on our website does not constitute part of this report. Through a link on the "Financials" section of our website, we make available the following filings as soon as reasonably practicable after they are electronically filed with or furnished to the SEC: our Annual Report on Form 10-K, Quarterly Reports on Form 10-Q, Current Reports on Form 8-K and any amendments to those reports filed or furnished pursuant to Section 13(a) or 15(d) of the Exchange Act. All such filings are available free of charge.
8
ITEM 1A. RISK FACTORS
Set forth below and elsewhere in this report and in other documents we file with the SEC are risks and uncertainties that could cause actual results to differ materially from the results contemplated by the forward-looking statements contained in this report.
Our lack of liquid funds and other sources of financing may limit our ability to maintain our existing operations, grow our business and compete effectively.
As of December 31, 2017, we had approximately $17.5 million in cash and cash equivalents and $29.6 million in aggregate principal amount of outstanding indebtedness, consisting of $19.8 million in aggregate principal amount of outstanding borrowings under our short-term debt obligations, $3.0 million in long-term debt obligations and $6.8 million in long-term related party borrowings. Our cash and cash equivalents as of December 31, 2017 included $12.1 million in cash balances held by our Korean subsidiary. Our current lack of liquidity could harm us by:
• | increasing our vulnerability to adverse economic conditions in our industry or the economy in general; |
• | requiring substantial amounts of cash to be used for debt servicing, rather than other purposes, including operations; |
• | limiting our ability to plan for, or react to, changes in our business and industry; and |
• | influencing investor and customer perceptions about our financial stability and limiting our ability to obtain financing or acquire customers. |
In order to meet our liquidity needs and finance our capital expenditures and working capital needs for our business, we may be required to sell assets, issue debt or equity securities, purchase credit insurance, or borrow on potentially unfavorable terms or reduce costs which could impact new product innovation. In addition, we may be required to reduce our operations in low margin regions, including reductions in headcount. We may be unable to sell assets, access additional indebtedness or undertake other actions to meet these needs. As a result, we may become unable to pay our ordinary expenses, including our debt service, on a timely basis. If additional capital is raised through the issuance of debt securities or other debt financing, the terms of such debt may include covenants, restrictions and financial ratios that may restrict our ability to operate our business. Likewise, any equity financing could result in additional dilution of our stockholders. Moreover, we may be required to include audited annual and unaudited interim historical financial statements of Legacy Zhone in any registration statement for the sale of shares of our common stock or other securities, which may make it more costly and time consuming for us to raise additional capital through a public offering of securities. If we are unable to sell assets, issue securities or access additional indebtedness to meet these needs on favorable terms, or at all, we may become unable to pay our ordinary expenses, including our debt service, on a timely basis and may be required to reduce the scope of our planned product development and sales and marketing efforts beyond the reductions we have previously taken. In addition, we may not be able to fund our business expansion, take advantage of future opportunities, or respond to competitive pressures or unanticipated capital requirements, any of which could have a material adverse effect on our business, financial condition and results of operations.
If we are unable to obtain additional capital to fund our existing and future operations, we may be required to reduce the scope of our planned product development, and marketing and sales efforts, which would harm our business, financial condition and results of operations.
The development and marketing of new products, and the expansion of our direct sales operations and associated support personnel requires a significant commitment of resources. We may incur significant losses or expend significant amounts of capital if:
• | the market for our products develops more slowly than anticipated; |
• | we fail to establish market share or generate revenue at anticipated levels; |
• | our capital expenditure forecasts change or prove inaccurate; or |
• | we fail to respond to unforeseen challenges or take advantage of unanticipated opportunities. |
As a result, we may need to raise substantial additional capital. Additional capital, if required, may not be available on acceptable terms, or at all. If additional capital is raised through the issuance of debt securities or other debt financing, the terms of such debt may include covenants, restrictions and financial ratios that may restrict our ability to operate our business. In addition, volatility in our stock price may make it more difficult or costly for us to raise capital through the issuance of common stock, preferred stock or other equity securities. If we elect to raise equity capital, this may be dilutive to existing
9
stockholders and could reduce the trading price of our common stock. Moreover, we may be required to include audited annual and unaudited interim historical financial statements of Legacy Zhone in any registration statement for the sale of shares of our common stock or other securities, which may make it more costly and time consuming for us to raise additional capital through a public offering of securities. If we are unable to obtain additional capital or are required to obtain additional capital on terms that are not favorable to us, we may be required to reduce the scope of our planned product development and sales and marketing efforts beyond the reductions that we have previously taken, which could have a material adverse effect on our business, financial condition and results of operations.
The integration of Legacy Zhone and DNS may not be completed successfully, cost-effectively or on a timely basis, and we may not realize the full benefits of the Merger.
Our ability to realize the anticipated benefits of the Merger will depend, to a large extent, on our ability to successfully integrate the Legacy Zhone and DNS businesses. Integrating and coordinating certain aspects of the operations and personnel of the two businesses and managing the expansion in the scope of our operations and financial systems involves complex operational, technological and personnel-related challenges. Our management will be required to devote a significant amount of time and attention to the process of integrating the Legacy Zhone operations with those of DNS. The potential difficulties, and resulting costs and delays, relating to the integration of the Legacy Zhone and DNS businesses include, among others:
• | the diversion of management’s attention from day-to-day operations; |
• | the management of a significantly larger company than before the Merger; |
• | the assimilation of DNS employees and the integration of the two business cultures; |
• | challenges in attracting and retaining key personnel; |
• | the need to integrate information, accounting, finance, sales, billing, payroll and regulatory compliance systems; |
• | challenges in keeping existing customers and obtaining new customers; and |
• | challenges in combining product offerings and sales and marketing activities. |
There is no assurance that we will successfully or cost-effectively integrate the Legacy Zhone and DNS operations. The costs of achieving systems integration may substantially exceed our current estimates. As a non-public company prior to the Merger, DNS did not have to comply with the requirements of the Sarbanes-Oxley Act of 2002, or the Sarbanes-Oxley Act, for internal control over financial reporting and other procedures. Accordingly, neither DNS nor its independent auditors undertook a formal assessment or audit of DNS’ internal control over financial reporting prior to the Merger. However, in connection with the preparation and external audit of DNS’ consolidated financial statements as of and for the three years ended December 31, 2015 and the preparation and review of DNS’ unaudited condensed consolidated financial statements as of and for the three months ended March 31, 2016, DNS and its independent auditors noted two material weaknesses in DNS’ internal control over financial reporting. The material weaknesses that were identified were (a) lack of resources that are knowledgeable about U.S. GAAP and SEC reporting matters to allow the company to prepare the required filings on an accurate and timely basis as a U.S. domestic registrant, and (b) lack of knowledge and experience in preparing financial statements under U.S. GAAP and that comply with SEC reporting matters on a timely and accurate basis as a U.S. domestic registrant. Bringing the legacy systems for the DNS business into compliance with requirements under the Sarbanes-Oxley Act may cause us to incur substantial additional expense. If we are unable to implement and maintain an effective system of internal controls, the existence of one or more internal control deficiencies could result in errors in our financial statements, and substantial costs and resources may be required to rectify internal control deficiencies. If we cannot produce reliable financial reports, investors could lose confidence in our reported financial information, the market price of our stock could decline significantly, we may be unable to obtain additional financing to operate and expand our business, and our business and financial condition could be materially harmed. In addition, the integration process may cause an interruption of, or loss of momentum in, the activities of our business. If our management is not able to effectively manage the integration process, or if any significant business activities are interrupted as a result of the integration process, our business could suffer and its results of operations and financial condition may be harmed.
Even if the businesses of Legacy Zhone and DNS are successfully integrated, we may not realize the full benefits of the Merger, including anticipated cost synergies, growth opportunities and other financial and operating benefits, within the expected timeframe or at all. In addition, we expect to incur significant integration and restructuring expenses to realize synergies. However, many of the expenses that will be incurred are, by their nature, difficult to estimate accurately. These expenses could, particularly in the near term, exceed the savings that we expect to achieve from elimination of duplicative expenses and the realization of economies of scale and cost savings. Although we expect that the realization of efficiencies related to the integration of the businesses may offset incremental transaction, Merger-related and restructuring costs over time,
10
we cannot give any assurance that this net benefit will be achieved in the near term, or at all. Any of these matters could adversely affect our businesses or harm our financial condition, results of operations and prospects.
We have identified material weaknesses in our internal control over financial reporting, and we cannot provide assurances that these weaknesses will be effectively remediated or that additional material weaknesses will not occur in the future. If our internal control over financial reporting or our disclosure controls and procedures are not effective, we may not be able to accurately report our financial results, prevent fraud or file our periodic reports in a timely manner, which may cause investors to lose confidence in our reported financial information and which may lead to a decline in our stock price.
On February 20, 2017, the Audit Committee of our Board of Directors concluded, in consultation with management and after informing our independent registered public accounting firm, that, due to incorrect application of generally accepted accounting principles that resulted in material misstatements and a restatement of our unaudited condensed consolidated financial statements, our previously issued interim unaudited condensed consolidated financial statements for the three and nine months ended September 30, 2016 should no longer be relied upon. On March 21, 2017, the Audit Committee of our Board of Directors concluded, in consultation with management and after informing our former independent registered public accounting firm, that Legacy Zhone's unaudited condensed consolidated financial statements for the quarter ended June 30, 2016 should also no longer be relied upon due to material errors associated with the sale and subsequent return of certain products sold in December 2014. In connection with such finding, the Audit Committee commenced an independent investigation to determine whether any financial statements of Legacy Zhone prior to the quarter ended June 30, 2016 contained material errors. As a result of this investigation, which concluded in late July 2017, the Audit Committee concluded, in consultation with management and after informing our former independent registered public accounting firm, that Legacy Zhone's unaudited condensed consolidated financial statements for the quarters ended March 31, 2015, June 30, 2015, September 30, 2015 and March 31, 2016 and Legacy Zhone's audited consolidated financial statements and assessments of internal control over financial reporting, including disclosure controls and procedures, for the years ended December 31, 2015 and 2014 should no longer be relied upon. See “Business - Audit Committee Investigation” above for additional information.
Furthermore, as discussed in “Part II, Item 9A. Controls and Procedures,” our management has identified material weaknesses in our internal control over financial reporting, which were unremediated as of December 31, 2017. A material weakness is a deficiency, or a combination of deficiencies, in internal control over financial reporting such that there is a reasonable possibility that a material misstatement of the registrant’s annual or interim financial statements will not be prevented or detected on a timely basis.
We did not maintain an effective control environment as there was an insufficient complement of personnel with appropriate accounting knowledge, experience and competence, resulting in incorrect application of generally accepted accounting principles. This material weakness contributed to the following material weaknesses. We did not maintain effective controls over our financial close process. Also, we did not design and maintain effective controls over the review of supporting information to determine the completeness and accuracy of the accounting for complex transactions, specifically related to the business combination that occurred on September 9, 2016, which resulted in an incorrect application of generally accepted accounting principles that resulted in material misstatements and a restatement of our unaudited condensed consolidated financial statements for the three and nine months ended September 30, 2016.
As of the date of this report, we are re-assessing the design of our controls and modifying processes related to the accounting for significant and unusual transactions as well as enhancing monitoring and oversight controls in the application of applicable accounting guidance related to such transactions. In connection therewith, we anticipate that we will hire additional accounting personnel with relevant skills, training and experience, and conduct further training of accounting and finance personnel. We believe that these initiatives will remediate the material weaknesses in internal control over financial reporting described above. However, there can be no assurance that we will be able to fully remediate our existing material weaknesses or that our internal control over financial reporting will not suffer in the future from other material weaknesses, thus making us unable to prevent or detect on a timely basis material misstatements in our periodic reports with the SEC. If we fail to remediate these material weaknesses or otherwise maintain effective internal control over financial reporting in the future, the existence of one or more internal control deficiencies could result in errors in our financial statements, and substantial costs and resources may be required to rectify internal control deficiencies. If we cannot produce reliable financial reports, we may have difficulty in filing timely periodic reports with the SEC, investors could lose confidence in our reported financial information, the market price of our stock could decline significantly, we may be unable to obtain additional financing to operate and expand our business, and our business and financial condition could be materially harmed. In addition, any failure to remediate the existing material weaknesses or a failure to maintain effective internal control over financial reporting could negatively impact our results of operations, cash flows and financial condition, subject us to potential litigation and regulatory inquiry and cause us to incur additional costs in future periods relating to the implementation of remedial measures.
11
Matters relating to or arising from the Audit Committee investigation and the associated material weaknesses identified in our internal control over financial reporting, including adverse publicity, have caused us to incur significant legal, accounting and other professional fees and other costs, have exposed us to greater risks associated with other civil litigation, regulatory proceedings and government enforcement actions, have diverted resources and attention that would otherwise be directed toward our operations and implementation of our business strategy and may impact our ability to attract and retain customers, employees and vendors, any of which could have a material adverse effect on our business, financial condition and results of operations.
Our future operating results are difficult to predict and our stock price may continue to be volatile.
As a result of a variety of factors discussed in this report, our revenues for a particular quarter are difficult to predict. Our revenue and operating results may vary significantly from quarter to quarter due to a number of factors, many of which are outside of our control. The primary factors that may affect our results of operations include the following:
•commercial acceptance of our products and services;
•fluctuations in demand for network access products;
•the timing and size of orders from customers;
•the ability of our customers to finance their purchase of our products as well as their own operations;
•new product introductions, enhancements or announcements by our competitors;
•our ability to develop, introduce and ship new products and product enhancements that meet customer requirements in a timely manner;
•changes in our pricing policies or the pricing policies of our competitors;
•the ability of our company and our contract manufacturers to attain and maintain production volumes and quality levels for our products;
•our ability to obtain sufficient supplies of sole or limited source components;
•increases in the prices of the components we purchase, or quality problems associated with these components;
•unanticipated changes in regulatory requirements which may require us to redesign portions of our products;
•changes in accounting rules;
•integrating and operating any acquired businesses;
•our ability to achieve targeted cost reductions;
•how well we execute on our strategy and operating plans; and
•general economic conditions as well as those specific to the communications, internet and related industries.
Any of the foregoing factors, or any other factors discussed elsewhere herein, could have a material adverse effect on our business, results of operations, and financial condition that could adversely affect our stock price. We anticipate that our stock price and trading volume may continue to be volatile in the future, whether due to the factors described above, volatility in public stock markets generally (particularly in the technology sector) or otherwise.
Between October 2011 and July 2013, in December 2015 and between December 2016 and February 2017, the bid price for our common stock traded below the $1.00 minimum per share bid price required for continued inclusion on the Nasdaq Capital Market under Marketplace Rule 5550(a)(2). We have received letters from Nasdaq requiring us to regain compliance within a specified period. A failure to regain compliance could result in our stock being delisted, subject to a right of appeal. On February 28, 2017, we effected a one-for-five reverse stock split of our outstanding shares of common stock. As a result of this, in March 2017, we received written notification from Nasdaq advising us that we had regained compliance with the minimum bid price rule as the closing bid price of our common stock had been $1.00 per share or greater for ten consecutive business days. There can be no assurance that our stock price will remain above the minimum bid price or that we will be able to regain compliance if our stock price falls below the minimum bid price again in the future. In addition, if our average market
12
capitalization falls below the carrying value of our assets for an extended period of time as it has done during recent years, this may indicate that the fair value of our net assets is below their carrying value, and may result in recording impairment charges.
We have experienced significant losses and we may incur losses in the future. If we fail to generate sufficient revenue to sustain our profitability, our stock price could decline.
Although we had net income of $1.2 million for the year ended December 31, 2017 and positive cash flow from operating activities in each of the last three years, we incurred a net loss of $15.3 million for the year ended December 31, 2016 and significant losses in prior years. We have an accumulated deficit of $18.9 million at December 31, 2017. We have significant fixed expenses and expect that we will continue to incur substantial manufacturing, research and product development, sales and marketing, customer support, administrative and other expenses in connection with the ongoing development of our business. In addition, we may be required to spend more on research and product development than originally budgeted to respond to industry trends. We may also incur significant new costs related to acquisitions and the integration of new technologies and other acquisitions that may occur in the future. We may not be able to adequately manage costs and expenses or achieve or maintain adequate operating margins. As a result, our ability to sustain profitability in future periods will depend on our ability to generate and sustain higher revenue while maintaining reasonable cost and expense levels. If we fail to generate sufficient revenue to sustain profitability in future periods, we may incur operating losses, which could be substantial, and our stock price could decline.
Our level of indebtedness could adversely affect our business, operating results and financial condition.
We have a significant amount of indebtedness. As of December 31, 2017, the aggregate principal amount of our outstanding indebtedness was $29.6 million, which comprised $19.8 million in aggregate principal amount of outstanding borrowings under our short-term debt obligations, $3.0 million in long-term debt obligations and $6.8 million in long-term related party borrowings. We may incur additional indebtedness in the future, including additional borrowings under our credit facility (the WFB Facility) with Wells Fargo Bank ("WFB"). The level of indebtedness could have important consequences and could materially and adversely affect us in a number of ways, including:
• | limiting our ability to obtain additional financing in the future for working capital, capital expenditures, acquisitions or general corporate purposes; |
• | limiting our flexibility to plan for, or react to, changes in our business or market conditions; |
• | requiring us to use a significant portion of any future cash flow from operations to repay or service the debt, thereby reducing the amount of cash available for other purposes; |
• | making us more highly leveraged than some of our competitors, which may place us at a competitive disadvantage; and |
• | making us more vulnerable to the impact of adverse economic and industry conditions and increases in interest rates. |
The WFB Facility and the instruments governing our other indebtedness include covenants (including, in the case of the WFB Facility, financial ratios) that may restrict our ability to operate our business. These covenants restrict, among other matters, our ability to incur additional indebtedness, grant liens, sell or dispose of assets, make loans and investments, pay dividends, redeem or repurchase capital stock, enter into affiliate transactions and consolidate or merger with, or sell substantially all of our assets to, another person. If we default under the WFB Facility or other instrument governing our other indebtedness because of a covenant breach or otherwise, all amounts outstanding thereunder could become immediately due and payable. In addition, WFB may be entitled to, among other things, sell our assets to satisfy the obligations under the WFB Facility. In the past we have violated the covenants in our credit facilities and received waivers for these violations. As of December 31, 2017, the Company was in technical violation of covenants under the WFB Facility to pledge the stock of certain foreign subsidiaries and transfer certain funds to WFB bank accounts. On March 19, 2018, the Company executed an agreement with WFB which cured the breach.
We cannot assure you that we will be able to comply with our financial or other covenants in the future or that any covenant violations will be waived in the future. Any acceleration of amounts due could have a material adverse effect on our liquidity and financial condition.
We cannot assure you that we will be able to generate cash flow in amounts sufficient to enable us to service our debt or to meet our working capital and capital expenditure requirements. If we are unable to generate sufficient cash flow from operations or to borrow sufficient funds to service our debt, due to borrowing base restrictions or otherwise, we may be required to sell assets, reduce capital expenditures, purchase credit insurance or obtain additional financing. We cannot assure you that we will be able to engage in any of these actions on reasonable terms, if at all.
13
Our business and future operating results are subject to global economic and market conditions.
Market turbulence and weak economic conditions, as well as concerns about energy costs, geopolitical issues, the availability and cost of credit, business and consumer confidence, and unemployment could impact our business in a number of ways, including:
Potential deferment of purchases and orders by customers: Uncertainty about global economic conditions may cause consumers, businesses and governments to defer purchases in response to flat revenue budgets, tighter credit, decreased cash availability and weak consumer confidence. Accordingly, future demand for our products could differ materially from our current expectations.
Customers’ inability to obtain financing to make purchases and/or maintain their business: Some of our customers require substantial financing in order to finance their business operations, including capital expenditures on new equipment and equipment upgrades, and make purchases from us. The potential inability of these customers to access the capital needed to finance purchases of our products and meet their payment obligations to us could adversely impact our financial condition and results of operations. While we monitor these situations carefully and attempt to take appropriate measures to protect ourselves, including factoring credit arrangements to financial institutions, it is possible that we may have to defer revenue until cash is collected or write-down or write-off uncollectible accounts. Such write-downs or write-offs, if large, could have a material adverse effect on our results of operations and financial condition. If our customers become insolvent due to market and economic conditions or otherwise, it could have a material adverse impact on our business, financial condition and results of operations.
Negative impact from increased financial pressures on third-party dealers, distributors and retailers: We make sales in certain regions through third-party dealers, distributors and retailers. These third parties may be impacted, among other things, by a significant decrease in available credit. If credit pressures or other financial difficulties result in insolvency for these third parties and we are unable to successfully transition end customers to purchase our products from other third parties, or from us directly, it could adversely impact our financial condition and results of operations.
Negative impact from increased financial pressures on key suppliers: Our ability to meet customers’ demands depends, in part, on our ability to obtain timely and adequate delivery of quality materials, parts and components from our suppliers. Certain of our components are available only from a single source or limited sources. If certain key suppliers were to become capacity constrained or insolvent, it could result in a reduction or interruption in supplies or a significant increase in the price of supplies and adversely impact our financial condition and results of operations. In addition, credit constraints of key suppliers could result in accelerated payment of accounts payable by us, impacting our cash flow.
We may experience material adverse impacts on our business, operating results and financial condition as a result of weak or recessionary economic or market conditions in the United States, Korea or the rest of the world.
If demand for our products and solutions does not develop as we anticipate, then our results of operations and financial condition will be adversely affected.
Our future revenue depends significantly on our ability to successfully develop, enhance and market our products and solutions to our target markets. Most network service providers have made substantial investments in their current infrastructure, and they may elect to remain with their current architectures or to adopt new architectures in limited stages or over extended periods of time. A decision by a customer to purchase our products will involve a significant capital investment. We must convince our service provider customers that they will achieve substantial benefits by deploying our products for future upgrades or expansions. We may experience difficulties with product reliability, partnering, and sales and marketing efforts that could adversely affect our business and divert management attention and resources from our core business. We do not know whether a viable market for our products and solutions will develop or be sustainable in our businesses. If these markets do not develop or develop more slowly than we expect, our business, financial condition and results of operations will be seriously harmed.
We depend upon the development of new products and enhancements to existing products, and if we fail to predict and respond to emerging technological trends and customers’ changing needs, our operating results and market share may suffer.
The markets for our products are characterized by rapidly changing technology, evolving industry standards, changes in end-user requirements, frequent new product introductions and changes in communications offerings from network service provider customers. Our future success depends on our ability to anticipate or adapt to such changes and to offer, on a timely and cost-effective basis, products that meet changing customer demands and industry standards. We may not have sufficient resources to successfully and accurately anticipate customers’ changing needs and technological trends, manage long development cycles or
14
develop, introduce and market new products and enhancements. The process of developing new technology is complex and uncertain, and if we fail to develop new products or enhancements to existing products on a timely and cost-effective basis, or if our new products or enhancements fail to achieve market acceptance, our business, financial condition and results of operations would be materially adversely affected.
Because our products are complex and are deployed in complex environments, our products may have defects that we discover only after full deployment by our customers, which could seriously harm our business.
We produce highly complex products that incorporate leading-edge technology, including both hardware and software. Software typically contains defects or programming flaws that can unexpectedly interfere with expected operations. In addition, our products are complex and are designed to be deployed in large quantities across complex networks. Because of the nature of these products, they can only be fully tested when completely deployed in large networks with high amounts of traffic, and there is no assurance that our pre-shipment testing programs will be adequate to detect all defects. As a result, our customers may discover errors or defects in our hardware or software, or our products may not operate as expected, after they have been fully deployed by our customers. If we are unable to cure a product defect, we could experience damage to our reputation, reduced customer satisfaction, loss of existing customers and failure to attract new customers, failure to achieve market acceptance, reduced sales opportunities, loss of revenue and market share, increased service and warranty costs, diversion of development resources, legal actions by our customers, and increased insurance costs. Defects, integration issues or other performance problems in our products could also result in financial or other damages to our customers. Our customers could seek damages for related losses from us, which could seriously harm our business, financial condition and results of operations. A product liability claim brought against us, even if unsuccessful, would likely be time consuming and costly. The occurrence of any of these problems would seriously harm our business, financial condition and results of operations.
Due to the international nature of our business, political or economic changes or other factors in a specific country or region could harm our future revenue, costs and expenses and financial condition.
We currently have significant operations in Korea, as well sales and technical support teams in various locations around the world. Many of our international sales may be denominated in foreign currencies. Because we do not currently engage in material foreign currency hedging transactions related to international sales, a decrease in the value of foreign currencies relative to the U.S. dollar could result in losses from transactions denominated in foreign currencies. We expect to continue expanding our international operations in the future. The successful management and expansion of our international operations requires significant human effort and the commitment of substantial financial resources. Further, our international operations may be subject to certain risks, disruptions and challenges that could materially harm our business and our operating results, including:
• | unexpected changes in laws, policies and regulatory requirements, including but not limited to regulations related to import-export control; |
• | trade protection measures, tariffs, embargoes and other regulatory requirements which may affect our ability to import or export our products into or from various countries; |
• | political unrest or instability, acts of terrorism or war in countries where we or our suppliers or customers have operations, including heightened security concerns relating to our operations in Korea stemming from North Korea’s nuclear weapons and ballistic missile programs and increased uncertainty regarding North Korea’s actions and possible responses from the international community; |
• | political considerations that affect service provider and government spending patterns; |
• | differing technology standards or customer requirements; |
• | developing and customizing our products for foreign countries; |
• | fluctuations in currency exchange rates, foreign exchange controls and restrictions on cash repatriation; |
• | longer accounts receivable collection cycles and financial instability of customers; |
• | requirements for additional liquidity to fund our international operations; |
• | difficulties and excessive costs for staffing and managing foreign operations; |
• | ineffective legal protection of our intellectual property rights in certain countries; |
• | potentially adverse tax consequences; and |
15
• | changes in a country’s or region’s political and economic conditions. |
In addition, some of our customer purchase agreements are governed by foreign laws, which may differ significantly from U.S. laws. We may be limited in our ability to enforce our rights under these agreements and to collect damages, if awarded. Any of these factors could harm our existing international operations and business or impair our ability to continue expanding into international markets.
We are subject to Korean foreign currency exchange rate risk.
We conduct significant business in Korea and as of December 31, 2017 our Korean subsidiary held more than half of our cash and cash equivalents, both of which subject us to Korean foreign currency exchange rate risk. Currently, we do not hold or issue foreign currency forward contracts, option contracts or other derivative financial instruments to mitigate the currency exchange rate risk. Our results of operations and our cash flows could be impacted by changes in foreign currency exchange rates.
A shortage of adequate component supply or manufacturing capacity could increase our costs or cause a delay in our ability to fulfill orders, and our failure to estimate customer demand properly may result in excess or obsolete component inventories that could adversely affect our gross margins.
Occasionally, we may experience a supply shortage, or a delay in receiving, certain component parts as a result of strong demand for the component parts and/or capacity constraints or other problems experienced by suppliers. If shortages or delays persist, the price of these components may increase, or the components may not be available at all, and we may also encounter shortages if we do not accurately anticipate our needs. Conversely, we may not be able to secure enough components at reasonable prices or of acceptable quality to build new products in a timely manner in the quantities or configurations needed. Accordingly, our revenue and gross margins could suffer until other sources can be developed. Our operating results would also be adversely affected if, anticipating greater demand than actually develops, we commit to the purchase of more components than we need. Furthermore, as a result of binding price or purchase commitments with suppliers, we may be obligated to purchase components at prices that are higher than those available in the current market. In the event that we become committed to purchase components at prices in excess of the current market price, our gross margins could decrease. In the past we experienced component shortages that adversely affected our financial results and in the future may continue to experience component shortages.
We rely on contract manufacturers for a portion of our manufacturing requirements.
We rely on contract manufacturers to perform a portion of the manufacturing operations for our products. These contract manufacturers build product for other companies, including our competitors. In addition, we do not have contracts in place with some of these providers and may not be able to effectively manage those relationships. We cannot be certain that our contract manufacturers will be able to fill our orders in a timely manner. We face a number of risks associated with this dependence on contract manufacturers including reduced control over delivery schedules, the potential lack of adequate capacity during periods of excess demand, poor manufacturing yields and high costs, quality assurance, increases in prices, and the potential misappropriation of our intellectual property. We have experienced in the past, and may experience in the future, problems with our contract manufacturers, such as inferior quality, insufficient quantities and late delivery of products.
We depend on a limited source of suppliers for several key components. If we are unable to obtain these components on a timely basis, we will be unable to meet our customers’ product delivery requirements, which would harm our business.
We currently purchase several key components from a limited number of suppliers. If any of our limited source of suppliers become insolvent, cease business or experience capacity constraints, work stoppages or any other reduction or disruption in output, they may be unable to meet our delivery schedules. Our suppliers may enter into exclusive arrangements with our competitors, be acquired by our competitors, stop selling their products or components to us at commercially reasonable prices, refuse to sell their products or components to us at any price or be unable to obtain or have difficulty obtaining components for their products from their suppliers. If we do not receive critical components from our limited source of suppliers in a timely manner, we will be unable to meet our customers’ product delivery requirements. Any failure to meet a customer’s delivery requirements could materially adversely affect our business, operating results and financial condition and could materially damage customer relationships.
16
Industry consolidation may lead to increased competition and may harm our operating results.
There has been a trend toward industry consolidation in the communications equipment market for several years. We expect this trend to continue as companies attempt to strengthen or hold their market positions in an evolving industry and as companies are acquired or are unable to continue operations. We believe that industry consolidation may result in stronger competitors that are better able to compete as sole-source vendors for customers. This could have a material adverse effect on our business, financial condition and results of operations. Furthermore, rapid consolidation could result in a decrease in the number of customers we serve. Loss of a major customer could have a material adverse effect on our business, financial condition and results of operations.
The market we serve is highly competitive and we may not be able to compete successfully.
Competition in communications equipment markets is intense. These markets are characterized by rapid change, converging technologies and a migration to networking solutions that offer superior advantages. We are aware of many companies in related markets that address particular aspects of the features and functions that our products provide. Currently, our primary competitors in our core business include Nokia, Calix, Adtran, Huawei, and ZTE, among others. In our FiberLAN business, our competitors include Tellabs and Cisco. In our Ethernet switching business, our competitors include Brocade, Juniper and Cisco. We also may face competition from other large communications equipment companies or other companies that may enter our markets in the future. In addition, a number of companies have introduced products that address the same network needs that our products and solutions address, both domestically and abroad. Many of our competitors have longer operating histories, greater name recognition, larger customer bases and greater financial, technical, sales and marketing resources than we do and may be able to undertake more extensive marketing efforts, adopt more aggressive pricing policies and provide more customer financing than we can. In particular, we are encountering price-focused competitors from Asia, especially China, which places pressure on us to reduce our prices. If we are forced to reduce prices in order to secure customers, we may be unable to sustain gross margins at desired levels or achieve profitability. Competitive pressures could result in increased pricing pressure, reduced profit margins, increased sales and marketing expenses and failure to increase, or the loss of, market share, any of which could reduce our revenue and adversely affect our financial results. Moreover, our competitors may foresee the course of market developments more accurately than we do and could develop new technologies that render our products less valuable or obsolete.
In our markets, principal competitive factors include:
• | product performance; |
• | interoperability with existing products; |
• | scalability and upgradeability; |
• | conformance to standards; |
• | breadth of services; |
• | reliability; |
• | ease of installation and use; |
• | geographic footprints for products; |
• | ability to provide customer financing; |
• | pricing; |
• | technical support and customer service; and |
• | brand recognition. |
If we are unable to compete successfully against our current and future competitors, we may have difficulty obtaining or retaining customers, and we could experience price reductions, order cancellations, increased expenses and reduced gross margins, any of which could have a material adverse effect on our business, financial condition and results of operations.
17
Our success largely depends on our ability to retain and recruit key personnel, and any failure to do so would harm our ability to meet key objectives.
Our future success depends upon the continued services of our Chief Executive Officer and other key employees, and our ability to identify, attract and retain highly skilled technical, managerial, sales and marketing personnel who have critical industry experience and relationships that we rely on to build our business. The loss of the services of any of our key employees, including our Chief Executive Officer, could delay the development and production of our products and negatively impact our ability to maintain customer relationships, which would harm our business, financial condition and results of operations. Moreover, our inability to attract and retain sufficient qualified accounting personnel with expertise in U.S. GAAP following the Merger may adversely affect our ability to maintain an effective system of internal controls or our ability to produce reliable financial reports, which may materially and adversely affect our business.
Any strategic acquisitions or investments we make could disrupt our operations and harm our operating results.
On an ongoing basis, we may evaluate acquisitions of, or investments in, complementary companies, products or technologies to supplement our internal growth, may acquire additional businesses, products or technologies in the future.
If we do complete future acquisitions, we could:
• | issue stock that would dilute our current stockholders’ percentage ownership; |
• | consume a substantial portion of our cash resources; |
• | incur substantial debt; |
• | assume liabilities; |
• | increase our ongoing operating expenses and level of fixed costs; |
• | record goodwill and non-amortizable intangible assets that will be subject to impairment testing and potential periodic impairment charges; |
• | incur amortization expenses related to certain intangible assets; |
• | incur large and immediate write-offs; and |
• | become subject to litigation. |
Any acquisitions or investments that we make in the future will involve numerous risks, including:
• | difficulties in integrating the operations, technologies, products and personnel of the acquired companies; |
• | unanticipated costs; |
• | diversion of management’s time and attention away from normal daily operations of the business and the challenges of managing larger and more widespread operations resulting from acquisitions; |
• | difficulties in entering markets in which we have no or limited prior experience; |
• | insufficient revenues to offset increased expenses associated with acquisitions and where competitors in such markets have stronger market positions; and |
• | potential loss of key employees, customers, distributors, vendors and other business partners of the companies we acquire following and continuing after announcement of acquisition plans. |
Mergers and acquisitions of high-technology companies are inherently risky and subject to many factors outside of our control, and we cannot be certain that our previous or future acquisitions will be successful and will not materially adversely affect our business, operating results or financial condition. We do not know whether we will be able to successfully integrate the businesses, products, technologies or personnel that we might acquire in the future or that any strategic investments we make will meet our financial or other investment objectives. Any failure to do so could seriously harm our business, financial condition and results of operations.
18
Sales to communications service providers are especially volatile, and weakness in sales orders from this industry may harm our operating results and financial condition.
Sales activity in the service provider industry depends upon the stage of completion of expanding network infrastructures, the availability of funding, and the extent to which service providers are affected by regulatory, economic and business conditions in the country of operations. Although some service providers may be increasing capital expenditures over the depressed levels that have prevailed over the last few years, weakness in orders from this industry could have a material adverse effect on our business, operating results and financial condition. Slowdowns in the general economy, overcapacity, changes in the service provider market, regulatory developments and constraints on capital availability have had a material adverse effect on many of our service provider customers, with many of these customers going out of business or substantially reducing their expansion plans. These conditions have materially harmed our business and operating results, and we expect that some or all of these conditions may continue for the foreseeable future. Finally, service provider customers typically have longer implementation cycles; require a broader range of service including design services; demand that vendors take on a larger share of risks; often require acceptance provisions, which can lead to a delay in revenue recognition; and expect financing from vendors. All these factors can add further risk to business conducted with service providers.
Compliance or the failure to comply with current and future environmental regulations could cause us significant expense.
We are subject to a variety of federal, state, local and foreign environmental regulations. If we fail to comply with any present and future regulations, we could be subject to future liabilities, the suspension of production or a prohibition on the sale of our products. In addition, such regulations could require us to incur other significant expenses to comply with environmental regulations, including expenses associated with the redesign of any non-compliant product. From time to time new regulations are enacted, and it is difficult to anticipate how such regulations will be implemented and enforced. For example, in 2003 the European Union enacted the Restriction on the Use of Certain Hazardous Substances in Electrical and Electronic Equipment Directive (RoHS) and the Waste Electrical and Electronic Equipment Directive (WEEE), for implementation in European Union member states. We are aware of similar legislation that is currently in force or is being considered in the United States, as well as other countries, such as Japan and China. Our failure to comply with any of such regulatory requirements or contractual obligations could result in our being liable for costs, fines, penalties and third-party claims, and could jeopardize our ability to conduct business in countries in the jurisdictions where these regulations apply.
Adverse resolution of litigation may harm our operating results or financial condition.
We are a party to various lawsuits and claims in the normal course of our business. Litigation can be expensive, lengthy, and disruptive to normal business operations. Moreover, the results of complex legal proceedings are difficult to predict. An unfavorable resolution of a particular lawsuit could have a material adverse effect on our business, operating results and financial condition.
Our intellectual property rights may prove difficult to protect and enforce.
We generally rely on a combination of copyrights, patents, trademarks and trade secret laws and restrictions on disclosure to protect our intellectual property rights. We also enter into confidentiality or license agreements with our employees, consultants and corporate partners, and control access to and distribution of our proprietary information. Despite our efforts to protect our proprietary rights, unauthorized parties may attempt to copy or otherwise obtain and use our products or technology. Monitoring unauthorized use of our technology is difficult, and we do not know whether the steps we have taken will prevent unauthorized use of our technology, particularly in foreign countries where the laws may not protect our proprietary rights as extensively as in the United States. We cannot assure you that our pending, or any future, patent applications will be granted, that any existing or future patents will not be challenged, invalidated, or circumvented, or that any existing or future patents will be enforceable. While we are not dependent on any individual patents, if we are unable to protect our proprietary rights, we may find ourselves at a competitive disadvantage to others who need not incur the substantial expense, time and effort required to create the innovative products.
Claims that our current or future products or components contained in our products infringe the intellectual property rights of others may be costly and time consuming to defend and could adversely affect our ability to sell our products.
The telecommunications equipment industry is characterized by the existence of a large number of patents and frequent claims and related litigation regarding patent, copyright, trademark and other intellectual property rights, which may relate to technologies and related standards that are relevant to us. From time to time, we receive correspondence from companies claiming that our products are using technology covered by or related to the intellectual property rights of these companies and inviting us to discuss or demanding licensing or royalty arrangements for the use of the technology or seeking payment for damages, injunctive relief and other available legal remedies through litigation. These companies also include third-party non-
19
practicing entities (also known as patent trolls) that focus on extracting royalties and settlements by enforcing patent rights. These companies typically have little or no product revenues and therefore our patents may provide little or no deterrence against such companies filing patent infringement lawsuits against us. In addition, third parties have initiated and may continue to initiate litigation against our manufacturers, suppliers, distributors or even our customers alleging infringement or misappropriation of their proprietary rights with respect to existing or future products, or components of our products. For example, various proceedings have been commenced against Broadcom Corporation and other parties alleging patent infringement in various jurisdictions, and in some cases the courts have issued rulings adverse to Broadcom enjoining Broadcom from offering, distributing, using or importing products that include the challenged intellectual property. Although we are not party to these proceedings, adverse rulings or injunctive relief awarded against Broadcom or other key suppliers of components for our products may result in delays or stoppages in the shipment of affected components, or require us to recall, modify or redesign our products containing such components. Regardless of the merit of claims against us or our manufacturers, suppliers, distributors or customers, intellectual property litigation can be time consuming and costly, and result in the diversion of the attention of technical and management personnel. Any such litigation could force us to stop manufacturing, selling, distributing, exporting, incorporating or using products or components that include the challenged intellectual property, or to recall, modify or redesign such products. In addition, if a party accuses us of infringing upon its proprietary rights, we may have to enter into royalty or licensing agreements, which may not be available on terms acceptable to us, if at all. If we are unsuccessful in any such litigation, we could be subject to significant liability for damages and loss of our proprietary rights. Any of these events or results could have a material adverse effect on our business, financial condition and results of operations.
We rely on the availability of third party licenses.
Many of our products are designed to include software or other intellectual property licensed from third parties. It may be necessary in the future to seek or renew licenses relating to various elements of the technology used to develop these products. We cannot assure you that our existing and future third-party licenses will be available to us on commercially reasonable terms, if at all. Our inability to maintain or obtain any third-party license required to sell or develop our products and product enhancements could require us to obtain substitute technology of lower quality or performance standards, or at greater cost.
The long and variable sales cycles for our products may cause revenue and operating results to vary significantly from quarter to quarter.
The target customers for our products have substantial and complex networks that they traditionally expand in large increments on a periodic basis. Accordingly, our marketing efforts are focused primarily on prospective customers that may purchase our products as part of a large-scale network deployment. Our target customers typically require a lengthy evaluation, testing and product qualification process. Throughout this process, we are often required to spend considerable time and incur significant expense educating and providing information to prospective customers about the uses and features of our products. Even after a company makes the final decision to purchase our products, it may deploy our products over extended periods of time. The timing of deployment of our products varies widely, and depends on a number of factors, including our customers’ skill sets, geographic density of potential subscribers, the degree of configuration and integration required to deploy our products, and our customers’ ability to finance their purchase of our products as well as their operations. As a result of any of these factors, our revenue and operating results may vary significantly from quarter to quarter.
Decreased effectiveness of share-based compensation could adversely affect our ability to attract and retain employees.
We have historically used stock options as a key component of our employee compensation program in order to align the interests of our employees with the interests of our stockholders, encourage employee retention and provide competitive compensation and benefit packages. If the trading price of our common stock declines, this would reduce the value of our share-based compensation to our present employees and could affect our ability to retain existing or attract prospective employees. Difficulties relating to obtaining stockholder approval of equity compensation plans could also make it harder or more expensive for us to grant share-based payments to employees in the future.
Our industry is subject to government regulations, which could harm our business.
Our operations are subject to various laws and regulations, including those regulations promulgated by the FCC. The FCC has jurisdiction over the entire communications industry in the United States and, as a result, our existing and future products and our customers’ products are subject to FCC rules and regulations. Changes to current FCC rules and regulations and future FCC rules and regulations could negatively affect our business. The uncertainty associated with future FCC decisions may cause network service providers to delay decisions regarding their capital expenditures for equipment for broadband services. In addition, international regulatory bodies establish standards that may govern our products in foreign markets. The SEC has adopted disclosure rules regarding the use of “conflict minerals” mined from the Democratic Republic of Congo and adjoining countries (DRC) and procedures regarding a manufacturer’s efforts to prevent the sourcing of such conflict minerals. These
20
rules may have the effect of reducing the pool of suppliers who can supply DRC “conflict free” components and parts, and we may not be able to obtain DRC conflict free products or supplies in sufficient quantities for our operations. Also, we may face reputational challenges with our customers, stockholders and other stakeholders if we are unable to sufficiently verify the origins for the conflict minerals used in our products. In addition, governments and regulators in many jurisdictions have implemented or are evaluating regulations relating to cyber security, privacy and data protection, which can affect the markets and requirements for networking and communications equipment. We are unable to predict the scope, pace or financial impact of government regulations and other policy changes that could be adopted in the future, any of which could negatively impact our operations and costs of doing business. Because of our smaller size, legislation or governmental regulations can significantly increase our costs and affect our competitive position. Changes to or future domestic and international regulatory requirements could result in postponements or cancellations of customer orders for our products and services, which would harm our business, financial condition and results of operations. Further, we cannot be certain that we will be successful in obtaining or maintaining regulatory approvals that may, in the future, be required to operate our business.
If we experience a significant disruption in, or breach in security of, our information technology systems, our business could be adversely affected.
We rely on several centralized information technology systems to provide products and services, maintain financial records, process orders, manage inventory, process shipments to customers and operate other critical functions. If we experience a prolonged system disruption in the information technology systems that involve our interactions with customers or suppliers, it could result in the loss of sales and customers and significant incremental costs, which could adversely affect our business. In addition, our information technology systems may be susceptible to damage, disruptions or shutdowns due to power outages, hardware failures, computer viruses, attacks by computer hackers, telecommunication failures, user errors, catastrophes or other unforeseen events. Furthermore, security breaches of our information technology systems could result in the misappropriation or unauthorized disclosure of confidential information belonging to the company or our employees, partners, customers or suppliers, which could result in significant financial or reputational damage to the company.
Man-made problems such as cybersecurity attacks, computer viruses or terrorism may disrupt our operations and harm our business, reputation and operating results
Despite our implementation of network security measures, our network may be vulnerable to cybersecurity attacks, computer viruses, break-ins and similar disruptions. Cybersecurity attacks, in particular, are evolving and include, but are not limited to, malicious software, attempts to gain unauthorized access to data, and other electronic security breaches that could lead to disruptions in systems, unauthorized release of confidential or otherwise protected information and corruption of data. Any such event could have a material adverse effect on our business, operating results and financial condition.
Our daily business operations require us to retain sensitive data such as intellectual property, proprietary business information and data related to customers, suppliers and business partners within our networking infrastructure. The ongoing maintenance and security of this information is pertinent to the success of our business operations and our strategic goals.
Our networking infrastructure and related assets may be subject to unauthorized access by hackers, employee errors, or other unforeseen activities. Such issues could result in the disruption of business processes, network degradation and system downtime, along with the potential that a third party will exploit our critical assets such as intellectual property, proprietary business information and data related to our customers, suppliers and business partners. To the extent that such disruptions occur, they may cause delays in the manufacture or shipment of our products and the cancellation of customer orders and, as a result, our business operating results and financial condition could be materially and adversely affected resulting in a possible loss of business or brand reputation.
In addition, the effects of war or acts of terrorism could have a material adverse effect on our business, operating results and financial condition. The continued threat of terrorism and heightened security and military action in response to this threat, or any future acts of terrorism, may cause further disruption to the economy and create further uncertainties in the economy. Energy shortages, such as gas or electricity shortages, could have similar negative impacts. To the extent that such disruptions or uncertainties result in delays or cancellations of customer orders or the manufacture or shipment of our products, our business, operating results and financial condition could be materially and adversely affected.
Our business and operations are especially subject to the risks of earthquakes, hurricanes and other natural catastrophic events.
Our corporate headquarters, including a significant portion of our research and development operations, are located in Northern California, a region known for seismic activity. Additionally, some of our facilities, including our manufacturing facility in Florida, are located near geographic areas that have experienced hurricanes in the past. For example, Hurricane Irma caused substantial damage and devastation in South Florida in September 2017, including in Seminole, the location of our
21
manufacturing facility. A significant natural disaster, such as an earthquake, hurricane, fire, flood or other catastrophic event, could severely affect our ability to conduct normal business operations, and as a result, our future operating results could be materially and adversely affected.
Recent U.S. tax legislation may materially adversely affect our financial condition, results of operations and cash flows.
Recently enacted U.S. tax legislation has significantly changed the U.S. federal income taxation of U.S. corporations, including by reducing the U.S. corporate income tax rate, limiting interest deductions, permitting immediate expensing of certain capital expenditures, adopting elements of a territorial tax system, imposing a one-time transition tax (or repatriation tax) on all undistributed earnings and profits of certain U.S.-owned foreign corporations, revising the rules governing net operating losses and the rules governing foreign tax credits, and introducing new anti-base erosion provisions. Many of these changes are effective immediately, without any transition periods or grandfathering for existing transactions. The legislation is unclear in many respects and could be subject to potential amendments and technical corrections, as well as interpretations and implementing regulations by the Treasury and Internal Revenue Service (IRS), any of which could lessen or increase certain adverse impacts of the legislation. In addition, it is unclear how these U.S. federal income tax changes will affect state and local taxation, which often uses federal taxable income as a starting point for computing state and local tax liabilities. While our analysis and interpretation of this legislation is preliminary and ongoing, based on our current evaluation, we expect that we may be subject to tax on certain global intangible low-taxed income and be subject to limitations on deductibility of performance-based compensation for officers. Furthermore, we believe that the limitation on interest deductions may negatively impact our cash flows going forward. Further, there may be other material adverse effects resulting from the legislation that we have not yet identified. While some of the changes made by the tax legislation may adversely affect us in one or more reporting periods and prospectively, other changes may be beneficial on a going forward basis. We continue to work with our tax advisors and auditors to determine the full impact that the recent tax legislation as a whole will have on us. We urge our investors to consult with their legal and tax advisors with respect to such legislation and the potential tax consequences of investing in our securities.
As long as DNI controls us, other holders of our common stock will have limited ability to influence matters requiring stockholder approval and DNI’s interest may conflict with our interests and the interests of other stockholders.
As of December 31, 2017, DNI owned approximately 58% of the outstanding shares of our common stock. Accordingly, until such time as DNI and its affiliates hold shares representing less than a majority of the votes entitled to be cast by the holders of our outstanding common stock at a stockholder meeting, DNI generally will have the ability to control the outcome of any matter submitted for the vote of our stockholders, except in certain circumstances set forth in our certificate of incorporation or bylaws. In addition, pursuant to our bylaws, we are subject to certain requirements and limitations regarding the composition of our board of directors until September 2018. Thereafter, for so long as DNI and its affiliates hold shares of our common stock representing at least a majority of the votes entitled to be cast by the holders of our common stock at a stockholder meeting, DNI will be able to freely nominate and elect all the members of our board of directors, subject only to a requirement that a certain number of directors qualify as "independent directors" under Nasdaq listing rules and applicable laws. We have elected to be treated as a “controlled company” under Nasdaq Marketplace Rules because more than 50% of the voting power for the election of directors is held by DNI. As a “controlled company,” we may rely on exemptions from certain corporate governance requirements under Nasdaq Marketplace Rules, including the requirement that we have a majority of independent directors on the Board of Directors and requirements with respect to compensation and nominating and corporate governance committees. The directors elected by DNI will have the authority to make decisions affecting our capital structure, including the issuance of additional capital stock or options, the incurrence of additional indebtedness, the implementation of stock repurchase programs, and the declaration of dividends. The interests of DNI may not coincide with the interests of our other stockholders or with holders of our indebtedness. DNI’s ability, subject to the limitations in our certificate of incorporation and bylaws, to control all matters submitted to our stockholders for approval limits the ability of other stockholders to influence corporate matters and, as a result, we may take actions that our stockholders or holders of our indebtedness do not view as beneficial. In addition, the existence of a controlling stockholder may have the effect of making it more difficult for a third party to acquire, or discouraging a third party from seeking to acquire, us. A third party would be required to negotiate any such transaction with DNI, and the interests of DNI with respect to such transaction may be different from the interests of our other stockholders or with holders of our indebtedness. In addition, provisions of our certificate of incorporation, bylaws and Delaware law could make it more difficult for a third party to acquire us, even if doing so would be beneficial to certain stockholders.
Future sales of our common stock could lower our stock price and dilute existing shareholders.
We issued a total of approximately 9.5 million shares (post reverse stock split) of our common stock to DNI in connection with the Merger, and may issue additional shares of common stock to finance future acquisitions through the use of equity. DNI has the right to require us to register with the SEC resales of the shares issued in connection with the Merger from time to time. In the event that DNI exercises its registration rights with respect to such shares, such shares would become eligible for resale
22
upon registration. Additionally, shares of our common stock are available for future sale pursuant to awards granted under our equity incentive plans. Our stock price may suffer a significant decline as a result of any sudden increase in the number of shares sold in the public market or market perception that the increased number of shares available for sale will exceed the demand for our common stock.
There is a limited public market of our common stock.
There is a limited public market for our common stock. The average daily trading volume in our common stock during the 12 months ended December 31, 2017 was approximately 13,415 shares (post reverse stock split) per day. We cannot provide assurances that a more active trading market will develop or be sustained. As a result of low trading volume in our common stock, the purchase or sale of a relatively small number of shares of our common stock could result in significant price fluctuations and it may be difficult for holders to sell their shares without depressing the market price for our common stock.
ITEM 1B. UNRESOLVED STAFF COMMENTS
None.
ITEM 2. PROPERTIES
We lease our worldwide headquarters, which are located in Oakland, California. We also lease facilities for manufacturing, research and development purposes at locations including Seminole, Florida, Alpharetta, Georgia, Korea, India, China and Vietnam. We maintain smaller offices to provide sales and customer support at various domestic and international locations. We manufacture many of our more complex products at our manufacturing facility in Florida. We believe that our existing facilities are suitable and adequate for our present purposes.
ITEM 3. LEGAL PROCEEDINGS
On November 30, 2017, we settled a patent infringement claim asserted by TQ Delta LLC by entering into a patent license agreement with TQ Delta LLC. Under the terms of the agreement, we expensed $0.4 million in royalty payments in 2017 and will expense $1.0 million in royalty payment in 2018.
We are subject to various legal proceedings, claims and litigation arising in the ordinary course of business. While the outcome of these matters is currently not determinable, we do not expect that the ultimate costs to resolve these matters will have a material adverse effect on our consolidated financial position or results of operations. However, litigation is subject to inherent uncertainties, and unfavorable rulings could occur. If an unfavorable ruling were to occur, there exists the possibility of a material adverse impact on the results of operations of the period in which the ruling occurs, or future periods.
ITEM 4. MINE SAFETY DISCLOSURES
Not applicable.
23
PART II
ITEM 5. MARKET FOR REGISTRANT’S COMMON EQUITY, RELATED STOCKHOLDER MATTERS AND ISSUER PURCHASES OF EQUITY SECURITIES
Price Range of Common Stock
Our common stock is listed on the Nasdaq Capital Market under the symbol “DZSI” (formerly "ZHNE" prior to the Merger). The following table sets forth, for the periods indicated, the high and low per share sales prices of our common stock as reported on Nasdaq. All per share prices reflect the one-for-five reverse stock split effected on February 28, 2017.
2017: | |||||||
High | Low | ||||||
Fourth Quarter ended December 31, 2017 | $ | 9.49 | $ | 6.25 | |||
Third Quarter ended September 30, 2017 | 7.49 | 5.71 | |||||
Second Quarter ended June 30, 2017 | 6.25 | 5.46 | |||||
First Quarter ended March 31, 2017 | 6.28 | 4.32 | |||||
2016: | |||||||
High | Low | ||||||
Fourth Quarter ended December 31, 2016 | $ | 5.95 | $ | 4.65 | |||
Third Quarter ended September 30, 2016 | 7.10 | 5.25 | |||||
Second Quarter ended June 30, 2016 | 8.25 | 5.60 | |||||
First Quarter ended March 31, 2016 | 8.10 | 5.00 | |||||
As of March 26, 2018 there were 591 registered stockholders of record. A substantially greater number of holders of DZS common stock are “street name” or beneficial holders, whose shares are held of record by banks, brokers and other financial institutions.
Dividend Policy
We have never paid or declared any cash dividends on our common stock or other securities and do not anticipate paying cash dividends in the foreseeable future. Any future determination to pay cash dividends will be at the discretion of the Board of Directors, subject to any applicable restrictions under our debt and credit agreements, and will be dependent upon our financial condition, results of operations, capital requirements, general business condition and such other factors as the Board of Directors may deem relevant.
Performance Graph
The following performance graph shall not be deemed to be incorporated by reference by means of any general statement incorporating by reference this Annual Report on Form 10-K into any filing under the Securities Act of 1933, as amended, or the Securities Exchange Act of 1934, as amended, except to the extent that we specifically incorporate this information by reference, and shall not otherwise be deemed filed under those acts.
The graph compares the cumulative total return of our common stock from December 31, 2012 through December 31, 2017 with the performance of the S&P 500 Index and the NASDAQ Telecommunications Index over those periods.
The graph assumes that (i) $100 was invested in our common stock at the closing price of our common stock on December 31, 2012, (ii) $100 was invested in each of the S&P 500 Index and the NASDAQ Telecommunications Index at the closing price of the respective indices on that date and (iii) all dividends received were reinvested. To date, no cash dividends have been declared or paid on our common stock. The Company's common stock began trading on an adjusted basis on March 1, 2017 following an one-for-five reverse stock split.
24
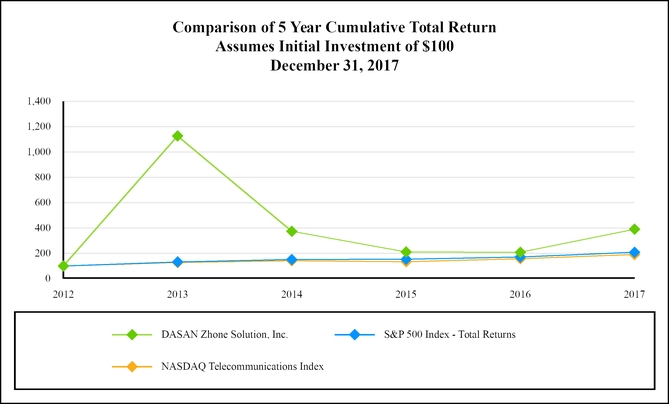
12/31/12 | 12/31/13 | 12/31/14 | 12/31/15 | 12/31/16 | 12/31/17 | ||||||||||||||||||
DASAN Zhone Solutions, Inc. | $ | 100 | $ | 1,127 | $ | 373 | $ | 211 | $ | 208 | $ | 391 | |||||||||||
S&P 500 Index - Total Returns | 100 | 132 | 151 | 153 | 171 | 208 | |||||||||||||||||
NASDAQ Telecommunications Index | 100 | 127 | 142 | 134 | 158 | 190 | |||||||||||||||||
25
ITEM 6. SELECTED FINANCIAL DATA
The following selected financial data has been derived from our consolidated financial statements and should be read in conjunction with the consolidated financial statements and notes thereto, and with “Management’s Discussion and Analysis of Financial Condition and Results of Operations.”
The Merger has been accounted for as a reverse acquisition under which DNS was considered the accounting acquirer of DZS. As such, the selected financial data below comprises the operating results of DNS and its consolidated subsidiaries for periods through September 8, 2016 and DZS and its consolidated subsidiaries for periods on or after September 9, 2016, the effective date of the Merger.
Year Ended December 31, | |||||||||||||||||||
2017 | 2016 | 2015 | 2014 | 2013 | |||||||||||||||
(in thousands, except per share data) | |||||||||||||||||||
Statement of Comprehensive Income (Loss) Data: | |||||||||||||||||||
Net revenue | $ | 215,732 | $ | 121,670 | $ | 114,421 | $ | 108,634 | $ | 108,046 | |||||||||
Net revenue - related parties | 31,382 | 28,634 | 24,775 | 30,760 | 10,164 | ||||||||||||||
Total net revenue | 247,114 | 150,304 | 139,196 | 139,394 | 118,210 | ||||||||||||||
Gross profit | 81,369 | 40,947 | 35,886 | 40,842 | 40,953 | ||||||||||||||
Total operating expenses | 80,647 | 53,996 | 38,863 | 37,639 | 32,814 | ||||||||||||||
Operating income (loss) | 722 | (13,049 | ) | (2,977 | ) | 3,203 | 8,139 | ||||||||||||
Interest income | 129 | 183 | 136 | 418 | 550 | ||||||||||||||
Interest expense | (1,019 | ) | (830 | ) | (532 | ) | (526 | ) | (629 | ) | |||||||||
Other (expense) income, net | (731 | ) | (145 | ) | 266 | 122 | 656 | ||||||||||||
(Loss) income before income taxes | (899 | ) | (13,841 | ) | (3,107 | ) | 3,217 | 8,716 | |||||||||||
Income tax (benefit) provision | (2,072 | ) | 1,487 | 232 | 1,380 | 2,208 | |||||||||||||
Net income (loss) | 1,173 | (15,328 | ) | (3,339 | ) | 1,837 | 6,508 | ||||||||||||
Net income (loss) attributable to non-controlling interest | 102 | (2 | ) | — | — | — | |||||||||||||
Net income (loss) attributable to DASAN Zhone Solutions, Inc. | $ | 1,071 | $ | (15,326 | ) | $ | (3,339 | ) | $ | 1,837 | $ | 6,508 | |||||||
Basic earnings (loss) per share attributable to DASAN Zhone Solutions, Inc.(1) | $ | 0.07 | $ | (1.32 | ) | $ | (0.36 | ) | $ | 0.20 | $ | 0.71 | |||||||
Diluted earnings (loss) per share attributable to DASAN Zhone Solutions, Inc. (1) | 0.07 | (1.32 | ) | (0.36 | ) | 0.20 | 0.71 | ||||||||||||
Weighted average shares outstanding used to compute basic net income (loss) per share (1) | 16,383 | 11,637 | 9,314 | 9,199 | 9,146 | ||||||||||||||
Weighted average shares outstanding used to compute diluted net income (loss) per share (1) | 16,396 | 11,637 | 9,314 | 9,199 | 9,146 | ||||||||||||||
(1) Basic net income (loss) per share was not different from the diluted net income (loss) per share (1) for the years ended December 31, 2013 through 2015 because we had not issued potential common stock and (2) for the year ended December 31, 2016 because the effects of stock options and restricted stock units would have been anti-dilutive.
26
As of December 31, | |||||||||||||||||||
2017 | 2016 | 2015 | 2014 | 2013 | |||||||||||||||
(in thousands) | |||||||||||||||||||
Balance Sheet Data: | |||||||||||||||||||
Cash, cash equivalents and short-term investments | $ | 17,475 | $ | 18,886 | $ | 9,095 | $ | 7,150 | $ | 24,719 | |||||||||
Working capital | 62,286 | 56,819 | 33,159 | 40,033 | 37,987 | ||||||||||||||
Total assets | 159,127 | 145,447 | 83,226 | 103,279 | 88,384 | ||||||||||||||
Stockholders’ equity and non-controlling interest | 73,767 | 66,868 | 41,465 | 48,633 | 47,124 | ||||||||||||||
ITEM 7. MANAGEMENT’S DISCUSSION AND ANALYSIS OF FINANCIAL CONDITION AND RESULTS OF OPERATIONS
Overview
We are a global provider of network access solutions and communications equipment for service provider and enterprise networks. We research, develop, test, sell, manufacture and support communications equipment in five major areas: broadband access, Ethernet switching, mobile backhaul, POLAN and SDN:
• | Our broadband access products offer a variety of solutions for carriers and service providers to connect residential and business customers, either using high-speed fiber or leveraging their existing deployed copper networks to offer broadband services to customer premises. Once our broadband access products are deployed, the service provider can offer voice, high-definition and ultra-high-definition video, high-speed internet access and business class services to their customers. |
• | Our Ethernet switching products provide a high-performance and manageable solution that bridges the gap from carrier access technologies to the core network. Our products support pure Ethernet switching as well as layer 3 IP and MPLS and are currently being developed for deployment as part of SDNs. |
• | Our mobile backhaul products provide a robust, manageable and scalable solution for mobile operators that enable them to upgrade their mobile backhaul systems and migrate from 3G networks to LTE and beyond. Our mobile backhaul products may be collocated at the RAN BS and can aggregate multiple RAN BS into a single backhaul for delivery of mobile traffic to the RAN network controller. We provide standard Ethernet/IP or MPLS interfaces and interoperate with other vendors in these networks. |
• | Our FiberLAN portfolio of POLAN products are designed for enterprise, campus, hospitality, and entertainment arena usage. Our FiberLAN portfolio includes our high-performance, high-bandwidth GPON OLTs connected to the industry’s most diverse ONT product line, which include units with integrated PoE to power a wide range of PoE-enabled access devises. |
• | Our SDN and NFV strategy is to develop tools and building blocks that will allow service providers to migrate their networks’ full complement of legacy control plane and data plane devices to a centralized intelligent controller that can reconfigure the services of the hundreds of network elements in real time for more controlled and efficient provision of bandwidth and latency across the network. The migration move to SDN and NFV will provide better service for end customers and a more efficient and cost-effective use of hardware resources for service providers. |
Going forward, our key financial objectives include the following:
• | Increasing revenue while continuing to carefully control costs; |
• | Continued investments in strategic research and product development activities that will provide the maximum potential return on investment; and |
• | Minimizing consumption of our cash and cash equivalents. |
27
Merger
On September 9, 2016, we acquired DNS through the merger of a wholly owned subsidiary of Zhone Technologies, Inc. with and into DNS, with DNS surviving as our wholly owned subsidiary. In connection with the Merger, Zhone Technologies, Inc. changed its name to DASAN Zhone Solutions, Inc.
At the effective time of the Merger, all issued and outstanding shares of capital stock of DNS held by its sole shareholder, DNI, were canceled and converted into the right to receive shares of our common stock in an amount equal to 58% of the issued and outstanding shares of our common stock immediately following the Merger. Accordingly, at the effective time of the Merger, we issued 9,493,016 shares (post reverse stock split) of our common stock to DNI as consideration in the Merger, of which 949,302 shares (post reverse stock split) are being held in escrow as security for claims for indemnifiable losses in accordance with the merger agreement relating to the Merger. As a result, immediately following the effective time of the Merger, DNI held 58% of the outstanding shares of our common stock and the holders of our common stock immediately prior to the Merger retained, in the aggregate, 42% of the outstanding shares of our common stock. See Note 2 to the consolidated financial statements set forth in Part II, Item 8 of this report for additional information regarding the Merger.
Common Control Transaction
On December 31, 2017, DNS (a wholly owned subsidiary of ours) acquired 100% and 99.99% of the common stock of D-Mobile Limited (“D-Mobile”) and DASAN India Private Limited (DASAN India), respectively, from DNI. D-Mobile and DASAN India are resellers of our products in Taiwan and India, respectively. The consideration payable by us to DNI for the common stock is the net book value of D-Mobile and DASAN India at December 31, 2017, subject to final adjustments. The net book value of D-Mobile and DASAN India was an aggregate of $0.8 million. We accounted for these transactions as common control transactions, with the net assets transferred recorded at historical cost. The transactions did not result in a change in reporting entity and hence were accounted for prospectively.
Items Affecting Comparability of our Financial Results
As discussed in Note 2 to the consolidated financial statements set forth in Part II, Item 8 of this report, the Merger has been accounted for as a reverse acquisition under which DNS was considered the accounting acquirer of Legacy Zhone. As such, our financial results presented in this Annual Report on Form 10-K reflect the operating results of DNS and its consolidated subsidiaries for the year-ended December 31, 2015 and for the period from January 1, 2016 through September 8, 2016 and the operating results of both DNS and Legacy Zhone and their respective consolidated subsidiaries for all periods from and after September 9, 2016. Our balance sheet as of December 31, 2016 included the fair value of the assets and liabilities of Legacy Zhone as of the effective date of the Merger. Those assets include the fair value of acquired intangible assets and goodwill. The year ended December 31, 2017 was the first fiscal year in which our financial results reflected a full year of operating results for both DNS and Legacy Zhone and their respective consolidated subsidiaries. Due to the foregoing, our financial results for the year ended December 31, 2017 are not comparable to our financial results for prior years.
Critical Accounting Policies and Estimates
Management’s discussion and analysis of financial condition and results of operations is based upon our consolidated financial statements, which have been prepared in accordance with generally accepted accounting principles in the United States of America. The preparation of these consolidated financial statements requires management to make estimates and judgments that affect the reported amounts of assets, liabilities, revenue and expenses, and related disclosure of contingent assets and liabilities. The policies discussed below are considered by management to be critical because changes in such estimates can materially affect the amount of our reported net income or loss. For all of these policies, management cautions that actual results may differ materially from these estimates under different assumptions or conditions.
28
Revenue Recognition
We recognize revenue when the earnings process is complete. We recognize product revenue upon shipment of product under contractual terms which transfer title to customers upon shipment, under normal credit terms, net of estimated sales returns and allowances at the time of shipment. Revenue is deferred if there are significant post-delivery obligations or if the fees are not fixed or determinable. When significant post-delivery obligations exist, revenue is deferred until such obligations are fulfilled. Our arrangements generally do not have any significant post-delivery obligations. If our arrangements include customer acceptance provisions, revenue is recognized upon obtaining the signed acceptance certificate from the customer, unless we can objectively demonstrate that the delivered products or services meet all the acceptance criteria specified in the arrangement prior to obtaining the signed acceptance. In those instances where revenue is recognized prior to obtaining the signed acceptance certificate, we use successful completion of customer testing as the basis to objectively demonstrate that the delivered products or services meet all the acceptance criteria specified in the arrangement. We also consider historical acceptance experience with the customer, as well as the payment terms specified in the arrangement, when revenue is recognized prior to obtaining the signed acceptance certificate. When collectability is not reasonably assured, revenue is recognized when cash is collected.
We make certain sales to product distributors. These customers are given certain privileges to return a portion of inventory. Return privileges generally allow distributors to return inventory based on a percent of purchases made within a specific period of time. We recognize revenue on sales to distributors that have contractual return rights when the products have been sold by the distributors, unless there is sufficient customer specific sales and sales returns history to support revenue recognition upon shipment. In those instances when revenue is recognized upon shipment to distributors, we use historical rates of return from the distributors to provide for estimated product returns. We accrue for warranty costs, sales returns and other allowances at the time of shipment based on historical experience and expected future costs.
We derive revenue primarily from stand-alone sales of our products. In certain cases, our products are sold along with services, which include education, training, installation, and/or extended warranty services. As such, some of our sales have multiple deliverables. Our products and services qualify as separate units of accounting and are deemed to be non-contingent deliverables as our arrangements typically do not have any significant performance, cancellation, termination and refund type provisions. Products are typically considered delivered upon shipment. Revenue from services is recognized ratably over the period during which the services are to be performed.
For multiple deliverable revenue arrangements, we allocate revenue to products and services using the relative selling price method to recognize revenue when the revenue recognition criteria for each deliverable are met. The selling price of a deliverable is based on a hierarchy and if we are unable to establish vendor-specific objective evidence of selling price (VSOE) we look to third-party evidence of selling price (TPE) and if no such data is available, we use a best estimated selling price (BESP). In most instances, particularly as it relates to products, we are not able to establish VSOE for all deliverables in an arrangement with multiple elements. This may be due to infrequently selling each element separately, not pricing products within a narrow range, or only having a limited sales history. When VSOE cannot be established, we attempt to establish the selling price of each element based on TPE. Generally, our marketing strategy differs from that of our peers and our offerings contain a significant level of customization and differentiation such that the comparable pricing of products with similar functionality cannot be obtained. Furthermore, we are unable to reliably determine what similar competitor products’ selling prices are on a stand-alone basis. Therefore, we are typically not able to determine TPE for our products.
When we are unable to establish selling price using VSOE or TPE, we use BESP. The objective of BESP is to determine the price at which we would transact a sale if the product or service were sold on a stand-alone basis. The BESP of each deliverable is determined using average discounts from list price from historical sales transactions or cost plus margin approaches based on factors, including our gross margin objectives, pricing practices and customer and market specific considerations.
We have established TPE for our training, education and installation services. These service arrangements are typically short term in nature and are largely completed shortly after delivery of the product. TPE is determined based on competitor prices for similar deliverables when sold separately. Training and education services are based on a daily rate per person and vary according to the type of class offered. Installation services are based on daily rate per person and vary according to the complexity of the products being installed. Training, education and installation service arrangements are typically not material, are short term in nature and are largely completed shortly after delivery of the product.
Extended warranty services are priced based on the type of product and are sold in one to five year durations. Extended warranty services include the right to warranty coverage beyond the standard warranty period. In substantially all of the arrangements with multiple deliverables pertaining to arrangements with these services, we have used and intend to continue using VSOE to determine the selling price for the services. We determine VSOE based on our normal pricing practices for these specific services when sold separately.
29
Allowances for Sales Returns and Doubtful Accounts
We record an allowance for sales returns for estimated future product returns related to current period product revenue. The allowance for sales returns is recorded as a reduction of revenue and an allowance against our accounts receivable. We base our allowance for sales returns on periodic assessments of historical trends in product return rates and current approved returned products. If the actual future returns were to deviate from the historical data on which the reserve had been established, our future revenue could be adversely affected. We record an allowance for doubtful accounts for estimated losses resulting from the inability of customers to make payments for amounts owed to us. The allowance for doubtful accounts is recorded as a charge to general and administrative expenses. We base our allowance on periodic assessments of our customers’ liquidity and financial condition through analysis of information obtained from credit rating agencies, financial statement reviews and historical collection trends. Additional allowances may be required in the future if the liquidity or financial condition of our customers deteriorates, resulting doubts about their ability to make payments.
Inventories
Inventories are stated at the lower of cost or market, with cost being determined using the first-in, first-out (FIFO) method. In assessing the net realizable value of inventories, we are required to make judgments as to future demand requirements and compare these with the current or committed inventory levels. Once inventory has been written down to its estimated net realizable value, its carrying value cannot be increased due to subsequent changes in demand forecasts. To the extent that a severe decline in forecasted demand occurs, or we experience a higher incidence of inventory obsolescence due to rapidly changing technology and customer requirements, we may incur significant charges for excess inventory.
Goodwill and Other Acquisition-Related Intangible Assets
Goodwill and other acquisition-related intangible assets not subject to amortization are tested annually for impairment using a two-step approach, and are tested for impairment more frequently if events and circumstances indicate that the asset might be impaired. An impairment loss is recognized to the extent that the carrying amount exceeds the asset’s fair value. In the application of the impairment testing, we are required to make estimates of future operating trends and resulting cash flows and judgments on discount rates and other variables. Actual future results and other assumed variables could differ from these estimates. Our future operating performance will be impacted by the future amortization of intangible assets, potential charges related to purchased in-process research and development for future acquisitions, and potential impairment charges related to goodwill. Accordingly, the allocation of the purchase price of the acquired companies to intangible assets and goodwill has a significant impact on our future operating results. The allocation process requires management to make significant estimates and assumptions, including estimates of future cash flows expected to be generated by the acquired assets and the appropriate discount rate for these cash flows. Should different conditions prevail, we would have to perform an impairment review that might result in material write-downs of intangible assets and/or goodwill. Other factors we consider important which could trigger an impairment review, include, but are not limited to, significant changes in the manner of use of our acquired assets, significant changes in the strategy for our overall business or significant negative economic trends. If this evaluation indicates that the value of an intangible asset may be impaired, an assessment of the recoverability of the net carrying value of the asset over its remaining useful life is made. If this assessment indicates that the cost of an intangible asset is not recoverable, based on the estimated undiscounted future cash flows or other comparable market valuations of the entity or technology acquired over the remaining amortization period, the net carrying value of the related intangible asset will be reduced to fair value and the remaining amortization period may be adjusted. Due to uncertain market conditions and potential changes in our strategy and product portfolio, it is possible that forecasts used to support our intangible assets may change in the future, which could result in additional non-cash charges that would adversely affect our results of operations and financial condition.
Business Combination
We allocate the fair value of purchase consideration to the tangible assets acquired, liabilities assumed and intangible assets acquired based on their estimated fair values. The excess of the fair value of purchase consideration over the fair values of these identifiable assets and liabilities is recorded as goodwill. When determining the fair values of assets acquired and liabilities assumed, management makes significant estimates and assumptions, especially with respect to intangible assets and certain tangible assets such as inventory acquired as part of the Merger.
Critical estimates in valuing certain tangible and intangible assets include but are not limited to future expected cash flows from the underlying assets and discount rates. Management’s estimates of fair value are based upon assumptions believed to be reasonable, but which are inherently uncertain and unpredictable and, as a result, actual results may differ from estimates.
30
Income Tax
We estimate our income tax provision or benefit in each of the jurisdictions in which we operate, including estimating exposures related to examinations by taxing authorities. We also make judgments regarding the realization of deferred tax assets, and establish valuation allowances where we believe it is more likely than not that future taxable income in certain jurisdictions will be insufficient to realize these deferred tax assets. Our estimates regarding future taxable income and income tax provision or benefit may vary due to changes in market conditions, changes in tax laws, or other factors. If our assumptions, and consequently our estimates, change in the future, the valuation allowances we have established may be increased or decreased, impacting future income tax expense.
31
RESULTS OF OPERATIONS
Results include the operating results of Legacy Zhone from and after September 9, 2016. Therefore, our financial results for the year ended December 31, 2017 are not comparable to our financial results for prior years.
We list in the table below the historical consolidated statement of comprehensive income (loss) as a percentage of total net revenue for the periods indicated.
Year ended December 31, | |||||||||
2017 | 2016 | 2015 | |||||||
Net revenue: | |||||||||
Net revenue | 87 | % | 81 | % | 82 | % | |||
Net revenue - related parties | 13 | % | 19 | % | 18 | % | |||
Total net revenue | 100 | % | 100 | % | 100 | % | |||
Cost of revenue: | |||||||||
Products and services | 56 | % | 56 | % | 58 | % | |||
Products and services - related parties | 11 | % | 16 | % | 16 | % | |||
Amortization of intangible assets | 0 | % | 0 | % | 0 | % | |||
Total cost of revenue | 67 | % | 73 | % | 74 | % | |||
Gross profit | 33 | % | 27 | % | 26 | % | |||
Operating expenses: | |||||||||
Research and product development | 14 | % | 17 | % | 15 | % | |||
Selling, marketing, general and administrative | 18 | % | 18 | % | 13 | % | |||
Amortization of intangible assets | 1 | % | 1 | % | 0 | % | |||
Gain from sale of assets | 0 | % | 0 | % | 0 | % | |||
Total operating expenses | 33 | % | 36 | % | 28 | % | |||
Operating income (loss) | 0 | % | (9 | )% | (2 | )% | |||
Interest income | 0 | % | 0 | % | 0 | % | |||
Interest income (expense) | 0 | % | (1 | )% | 0 | % | |||
Other income (expense), net | 0 | % | 0 | % | 0 | % | |||
Income (loss) before income taxes | 0 | % | (9 | )% | (2 | )% | |||
Income tax (benefit) provision | (1 | )% | 1 | % | 0 | % | |||
Net income (loss) | 0 | % | (10 | )% | (2 | )% | |||
Net income (loss) attributable to non-controlling interest | 0 | % | 0 | % | 0 | % | |||
Net income (loss) attributable to DASAN Zhone Solutions, Inc. | 0 | % | (10 | )% | (2 | )% | |||
2017 COMPARED WITH 2016
Net Revenue
The year ended December 31, 2017 was the first year in which our financial results reflected a full year of operating results for both DNS and Legacy Zhone and their respective consolidated subsidiaries. Net revenue improved compared to prior years reflecting the combined Company's broad base of geographic regions and product categories. Across international markets, Asia-Pacific (including Korea) contributed approximately 55% of net revenue in 2017. We are seeing strong customer tractions in EMEA and Latin America, which collectively accounted for approximately 23% of 2017 net revenue. Our North America region accounted for approximately 22% of 2017 net revenue.
From a product net revenue perspective, we are seeing a broad based strength across our five solution offerings (broadband access, Ethernet switching, mobile backhaul, POLAN and SDN).
Information about our net revenue for products and services for 2017 and 2016 is summarized below (in millions):
32
2017 | 2016 | Increase (Decrease) | % change | |||||||||||
Products | $ | 235.1 | $ | 142.2 | $ | 92.9 | 65 | % | ||||||
Services | 12.0 | 8.1 | 3.9 | 48 | % | |||||||||
$ | 247.1 | $ | 150.3 | $ | 96.8 | 64 | % | |||||||
Information about our net revenue for North America and international markets for 2017 and 2016 is summarized below (in millions):
2017 | 2016 | Increase (Decrease) | % change | |||||||||||
Revenue by geography: | ||||||||||||||
United States | $ | 48.9 | $ | 16.9 | $ | 32.0 | 189 | % | ||||||
Canada | 5.6 | 2.0 | 3.6 | 180 | % | |||||||||
Total North America | 54.5 | 18.9 | 35.6 | 188 | % | |||||||||
Latin America | 26.2 | 9.6 | 16.6 | 173 | % | |||||||||
Europe, Middle East, Africa | 30.8 | 13.6 | 17.2 | 126 | % | |||||||||
Korea | 81.5 | 77.9 | 3.6 | 5 | % | |||||||||
Other Asia Pacific | 54.1 | 30.3 | 23.8 | 79 | % | |||||||||
Total International | 192.6 | 131.4 | 61.2 | 47 | % | |||||||||
Total | $ | 247.1 | $ | 150.3 | $ | 96.8 | 64 | % | ||||||
Net revenue increased 64% or $96.8 million to $247.1 million for 2017 compared to $150.3 million for 2016. The increase in net revenue was primarily due to 2017 being the first fiscal year in which our financial results reflected a full year of the combined operating results of DNS and Legacy Zhone.
International net revenue increased 47% or $61.2 million to $192.6 million for 2017 compared to $131.4 million for 2016, and represented 78% of total net revenue compared with 87% in 2016. Net revenue from North America increased 188% or $35.6 million to $54.5 million in 2017 compared to $18.9 million in 2016. The increase in net revenue was primarily due to 2017 being the first fiscal year in which our financial results reflected a full year of operating results for both DNS and Legacy Zhone.
Additionally, we are seeing significant platform benefits from the combination of DNS and Legacy Zhone. We continue to successfully cross-sell a broader set of products into our complimentary DNS and Legacy Zhone customer base. DNS primarily sold its products to leading tier-1 carriers in the Asia-Pacific region and Legacy Zhone sold its products to alternative carriers in the Americas, Europe, the Middle East and Africa, as well as several tier-1 carriers in the Middle East. Also, in the past year we have increasingly seen customers signing longer multi-year deals across wide ranging deployments, including GPON deployments and expansions, EPON deployments, and VDSL deployments across the United States, EMEA, Latin America, and Asia Pacific.
We anticipate that our results of operations in any given period may depend to a large extent on sales to a small number of large accounts. As a result, our revenue for any quarter may be subject to significant volatility based upon changes in orders from one or a small number of key customers.
Cost of Revenue and Gross Profit
Total cost of revenue increased $56.4 million or 52% to $165.7 million for 2017, compared to $109.4 million for 2016. Total cost of revenue was 67% of net revenue for 2017, compared to 73% of net revenue for 2016, which resulted in an increase in gross profit percentage to 33% in 2017 from 27% in 2016. As previously discussed, 2017 was the first fiscal year in which our financial results reflected a full year of operating results for both DNS and Legacy Zhone. Gross margin increased in 2017 compared to 2016 primarily due to economies of scale from the Merger, including benefiting from flexible sourcing and production efficiencies as well as improved product mix.
We expect that in the future our cost of revenue as a percentage of net revenue will vary depending on the mix and average selling prices of products sold, with longer term gross margin expansion expected to come from product cost reductions and manufacturing economies of scale resulting from the Merger. In addition, continued competitive and economic pressures could
33
cause us to reduce our prices, adjust the carrying values of our inventory, or record inventory expenses relating to discontinued products and excess or obsolete inventory.
Research and Product Development Expenses
Research and product development expenses increased 40% or $10.0 million to $35.4 million for 2017 compared to $25.4 million for 2016. The increase in research and development expense was primarily due to 2017 being the first fiscal year in which our financial results reflected a full year of operating results for both DNS and Legacy Zhone.
We intend to continue to invest in research and product development to attain our strategic product development objectives while seeking to manage the associated costs through expense controls.
Selling, Marketing, General and Administrative Expenses
Selling, marketing, general and administrative expenses increased 61% or $16.6 million to $43.9 million for 2017 compared to $27.3 million for 2016. Selling, marketing, general and administrative expenses include personnel costs for sales, marketing, administration, finance, information technology, human resources and general management as well as legal and accounting expenses, rent, utilities, trade show expenses and related travel costs. The increase in selling, marketing, general and administrative expenses was primarily due to 2017 being the first fiscal year in which our financial results reflected a full year of operating results for both DNS and Legacy Zhone. As a percentage of sales, selling, marketing, general and administrative expenses were flat at 18% in 2017 and 2016.
Gain from Sale of Assets
We recorded a gain from sale of certain intellectual property of $0.3 million in December of 2016. There was no similar activities in 2017.
Interest Expense, net
Interest expense, net for 2017 and 2016 was $0.9 million and $0.6 million, respectively. This increase was primarily related to an increase in our outstanding debt balance to $29.6 million at December 31, 2017 from $24.4 million at December 31, 2016. Interest rates on our borrowings were relatively flat during 2017 and 2016.
Other Expense, net
Other expense, net for 2017 was $0.7 million compared to $0.1 million in 2016. This includes $0.5 million of currency exchange loss in 2017 compared to currency exchange loss of $0.4 million in 2016.
Income Tax Provision (Benefit)
We recorded an income tax benefit of $2.1 million for the year ended 2017 compared to an income tax provision of $1.5 million for the year ended December 31, 2016. The decrease during the fiscal year 2017 was mainly due to the release of valuation allowance against our net deferred tax assets in Korea. Management determined that it is more likely than not that the net deferred tax assets will be realized in this tax jurisdiction.
On December 22, 2017, President Trump signed the Tax Cuts and Jobs Act (the “Act”) into law. The new legislation decreases the U.S. corporate federal income tax rate from 35% to 21% effective January 1, 2018. The reduction in tax rate resulted in a $5.3 million reduction in net deferred tax assets. There was no impact on recorded deferred tax balances as the remeasurement of net deferred tax assets was offset by a change in valuation allowance. The Act imposes a one-time deemed repatriation tax on undistributed foreign earnings. We did not have a deemed repatriation due to our foreign earnings deficits. The Act also includes a number of other provisions including the elimination of loss carrybacks, limitations on the use of future losses, repeal of the Alternative Minimum Tax regime, and the introduction of a base erosion and anti-abuse tax. These provisions are not expected to have immediate effect on us.
34
2016 COMPARED WITH 2015
Net Revenue
Information about our net revenue for products and services for 2016 and 2015 is summarized below (in millions):
2016 | 2015 | Increase (Decrease) | % change | |||||||||||
Products | $ | 142.2 | $ | 133.0 | $ | 9.2 | 7 | % | ||||||
Services | 8.1 | 6.2 | 1.9 | 31 | % | |||||||||
$ | 150.3 | $ | 139.2 | $ | 11.1 | 8 | % | |||||||
Information about our net revenue for North America and international markets for 2016 and 2015 is summarized below (in millions):
2016 | 2015 | Increase (Decrease) | % change | |||||||||||
Revenue by geography: | ||||||||||||||
United States | $ | 16.9 | $ | 4.4 | $ | 12.5 | 284 | % | ||||||
Canada | 2.0 | — | 2.0 | N/A | ||||||||||
Total North America | 18.9 | 4.4 | 14.5 | 330 | % | |||||||||
Latin America | 9.6 | 2.5 | 7.1 | 284 | % | |||||||||
Europe, Middle East, Africa | 13.6 | 9.4 | 4.2 | 45 | % | |||||||||
Korea | 77.9 | 114.7 | (36.8 | ) | (32 | )% | ||||||||
Other Asia Pacific | 30.3 | 8.2 | 22.1 | 270 | % | |||||||||
Total International | 131.4 | 134.8 | (3.4 | ) | (3 | )% | ||||||||
Total | $ | 150.3 | $ | 139.2 | $ | 11.1 | 8 | % | ||||||
Net revenue increased 8% or $11.1 million to $150.3 million for 2016 compared to $139.2 million for 2015. The increase in net revenue was primarily due to the consummation of the Merger in September 2016, which resulted in the inclusion of net revenue from the Legacy Zhone business in 2016 for the period from and after the consummation of the Merger. This increase was partially offset by a decrease in product revenue resulting from the decrease in sales to certain customers in Korea.
International net revenue decreased 3% or $3.4 million to $131.4 million for 2016 compared to $134.8 million for 2015, and represented 87% of total net revenue compared with 97% in 2015. The decrease in international net revenue was primarily due to a decrease in sales to certain customers in Korea, which resulted in a decrease in net revenue from Korea of 32% or $36.8 million compared to the prior year period. This decrease was partially offset by the consummation of the Merger in September 2016, which resulted in the inclusion of international net revenue from the Legacy Zhone business in 2016 for the period from and after the consummation of the Merger, primarily relating to sales in Latin America, Europe and the Middle East. Net revenue from North America increased 330% or $14.5 million to $18.9 million in 2016 compared to $4.4 million in 2015. This increase was primarily due to the consummation of the Merger in September 2016, which resulted in the inclusion of net revenue related to the Legacy Zhone business in North America in 2016 for the period from and after the consummation of the Merger.
Cost of Revenue and Gross Profit
Total cost of revenue increased 6% or $6.0 million to $109.4 million for 2016, compared to $103.3 million for 2015. The increase in cost of revenue was primarily due to the consummation of the Merger in September 2016, which resulted in the inclusion of cost of revenue related to the Legacy Zhone business in 2016 for the period from and after the consummation of the Merger. This increase was partially offset by lower cost of revenue resulting from decreased sales in Korea in 2016 compared to the prior year period. Total cost of revenue was 73% of net revenue for 2016, compared to 74% of net revenue for 2015, which resulted in an increase in gross profit percentage from 26% in 2015 to 27% in 2016. Gross margin slightly increased in 2016 compared to 2015, primarily due to the inclusion of Legacy Zhone's higher margin business following the consummation of the Merger in September 2016.
35
Research and Product Development Expenses
Research and product development expenses increased 19% or $4.1 million to $25.4 million for 2016 compared to $21.3 million for 2015. The increase was primarily due to the consummation of the Merger in September 2016, which resulted in the inclusion of $5.1 million in research and product development expense relating to the Legacy Zhone business in 2016 for the period from and after the consummation of the Merger. This increase was partially offset by a decrease during the period prior to the Merger in research and product development expenses of $0.8 million resulting from lower personnel related expenses due to a lower headcount.
Selling, Marketing, General and Administrative Expenses
Selling, marketing, general and administrative expenses increased 56% or $9.8 million to $27.3 million for 2016 compared to $17.5 million for 2015. The increase was primarily due to the consummation of the Merger in September 2016, which resulted in the inclusion of $10.7 million in selling, marketing, general and administrative expense relating to the Legacy Zhone business in 2016 for the period from and after the consummation of the Merger. This increase was partially offset by a decrease during the period prior to the Merger of sales expenses of $2.6 million due primarily to higher bad debt expenses in 2015 and reduced commission expenses in 2016.
Gain from Sale of Assets
We recorded a gain from sale of certain intellectual property of $0.3 million in December of 2016.
Interest Expense, net
Interest expense, net for 2016 and 2015 was $0.6 million and $0.4 million, respectively. This increase was primarily related to an increase in our outstanding debt balance from $21.8 million at December 31, 2015 to $24.4 million at December 31, 2016. Interest rates remained flat during 2016 and 2015.
Other Income (Expense), net
Other expense, net for 2016 was $0.1 million compared to other income, net for 2015 of $0.3 million. This includes $0.4 million of currency exchange loss in 2016 compared to currency exchange gain of $0.3 million in 2015. The expense recorded in 2016 was primarily related to an increase in guarantee expenses of $0.4 million offset by a gain of $0.3 million related to common area maintenance reimbursement.
Income Tax Provision
We recorded an income tax provision of $1.5 million and $0.2 million related to foreign and state taxes for the years ended December 31, 2016 and 2015, respectively. The increase in tax expense for the year ended December 31, 2016 was primarily due to an additional valuation allowance recorded on deferred tax assets in Korea. Due to our recurring operating losses and the significant uncertainty regarding the realization of our net deferred tax assets, we have recorded a full valuation allowance against our deferred tax assets.
OTHER PERFORMANCE MEASURES
In managing our business and assessing our financial performance, we supplement the information provided by our GAAP results with adjusted earnings before stock-based compensation, interest, taxes, and depreciation, or Adjusted EBITDA, a non-GAAP financial measure. We define Adjusted EBITDA as net income (loss) plus (i) interest expense, net, (ii) provision (benefit) for taxes, (iii) depreciation and amortization, (iv) stock-based compensation, and (v) material non-recurring transactions or events, such as Merger transaction costs or a gain (loss) on sale of assets or impairment of fixed assets. We believe that the presentation of Adjusted EBITDA enhances the usefulness of our financial information by presenting a measure that management uses internally to monitor and evaluate our operating performance and to evaluate the effectiveness of our business strategies. We believe Adjusted EBITDA also assists investors and analysts in comparing our performance across reporting periods on a consistent basis because it excludes the impact of items that we do not believe reflect our core operating performance.
Adjusted EBITDA has limitations as an analytical tool. Some of these limitations are:
• | Adjusted EBITDA does not reflect our cash expenditures, or future requirements for capital expenditures or contractual requirements; |
36
• | Adjusted EBITDA does not reflect changes in, or cash requirements for, our working capital needs; |
• | Adjusted EBITDA does not reflect the interest expense, or the cash requirements necessary to service interest or principal payments, on our debts; |
• | Although depreciation and amortization are non-cash expenses, the assets being depreciated and amortized will often have to be replaced in the future, and Adjusted EBITDA does not reflect any cash requirements for such replacements; |
• | Non-cash compensation is and will remain a key element of our overall long-term incentive compensation package, although we exclude it as an expense when evaluating our ongoing operating performance for a particular period; and |
• | Other companies in our industry may calculate Adjusted EBITDA and similar measures differently than we do, limiting its usefulness as a comparative measure. |
Because of these limitations, Adjusted EBITDA should not be considered in isolation or as a substitute for net income (loss) or any other performance measures calculated in accordance with GAAP or as a measure of liquidity. Management understands these limitations and compensates for these limitations by relying primarily on our GAAP results and using Adjusted EBITDA only supplementally.
Set forth below is a reconciliation of net income (loss) to Adjusted EBITDA, which we consider to be the most directly comparable GAAP financial measure to Adjusted EBITDA (in thousands):
Year Ended December 31, | ||||||||||||
2017 | 2016 | 2015 | ||||||||||
Net income (loss) | $ | 1,173 | $ | (15,328 | ) | $ | (3,339 | ) | ||||
Add: | ||||||||||||
Interest expense, net | 890 | 647 | 396 | |||||||||
Income tax (benefit) provision | (2,072 | ) | 1,487 | 232 | ||||||||
Depreciation and amortization | 3,817 | 3,173 | 1,404 | |||||||||
Stock-based compensation | 902 | 336 | — | |||||||||
Merger transaction costs | — | 1,273 | — | |||||||||
Adjusted EBITDA | $ | 4,710 | $ | (8,412 | ) | $ | (1,307 | ) | ||||
LIQUIDITY AND CAPITAL RESOURCES
Our operations are financed through a combination of our existing cash, cash equivalents, available credit facilities, and sales of equity and debt instruments, based on our operating requirements and market conditions.
We had net income of $1.2 million for the year ended December 31, 2017. However, we incurred a net loss of $15.3 million for the year ended December 31, 2016 and significant losses in prior years. As of December 31, 2017, we had an accumulated deficit of $18.9 million and working capital of $62.3 million. As of December 31, 2017, we had $17.5 million in cash and cash equivalents, which included $12.1 million in cash balances held by our Korean subsidiary, and $29.6 million in aggregate principal amount of short-term debt obligations, other long-term debt and long-term related party borrowings. In addition, as of December 31, 2017 we had $8.6 million committed as security for letters of credit under our revolving credit facilities leaving $12.0 million in aggregate borrowing availability under these facilities. Our current lack of liquidity could harm us by:
• | increasing our vulnerability to adverse economic conditions in our industry or the economy in general; |
• | requiring substantial amounts of cash to be used for debt servicing, rather than other purposes, including operations; |
• | limiting our ability to plan for, or react to, changes in our business and industry; and |
• | influencing investor and customer perceptions about our financial stability and limiting our ability to obtain financing or acquire customers. |
These factors indicate that cash flows might not be sufficient for us to meet our obligations as they come due in the ordinary course of business for a period of 12 months from the date of this Annual Report on Form 10-K.
37
However, we plan to focus on cost management, operating efficiency and restrictions on discretionary spending. In addition, if necessary, we may sell assets, issue debt or equity securities or purchase credit insurance. We may also reduce the scope of our planned product development, reduce sales and marketing efforts and reduce our operations in low margin regions, including reductions in headcount. Since December 31, 2017, we have modified the terms of certain existing debt and obtained a new loan, as described more fully in Note (19), Subsequent Events. Based on our current plans and current business conditions, we believe that these measures along with our existing cash, cash equivalents and available credit facilities will be sufficient to satisfy our anticipated cash requirements for at least the next 12 months from the date of this Annual Report on Form 10-K.
Our ability to meet our obligations as they become due in the ordinary course of business for the next 12 months will depend on our ability to achieve forecasted results and our ability to access funds approved under existing facilities. Management’s belief that they will achieve these results assumes that, among other things, we will continue to be successful in implementing our business strategy and that there will be no material adverse development in our business, liquidity or capital requirements. If one or more of these factors do not occur as expected, it could cause us to fail to meets our obligations as they come due.
Operating Activities
Net Cash provided by operating activities was $1.9 million in 2017, compared to $3.5 million in 2016. Net cash flow provided by operating activities declined in 2017 primarily because the $16.5 million improvement in income (from a loss of $15.3 million in 2016 to income of $1.2 million in 2017) was offset by a $17.3 million decline from changes in operating assets and liabilities (which provided cash of $13.6 million in 2016 and used cash of $3.7 million in 2017), as well as a $4.3 million reduction in non-cash deferred taxes (from an addition to net income of $1.4 million in 2016 to a reduction from net income in of $2.9 million in 2017). The decline in cash from changes in operating assets and liabilities was primarily due to normal fluctuations in accounts receivable and payables as well as higher bonus accruals at year-end 2016. The non-cash deferred tax benefit in 2017 was due to the release of valuation allowance against the Company's net deferred tax assets in Korea.
Investing Activities
Cash flow used in or provided by investing activities consists primarily of changes in restricted cash, the purchase or disposal of property and equipment and the sale or purchase of short-term investments. Net cash from investing activities declined by $7.5 million to net cash used in investing activities of $4.7 million in 2017 compared to net cash provided by investing activities of $2.8 million in 2016 primarily because in 2016 we acquired cash through the Merger of $7.0 million .
Financing Activities
Cash flow from financing activities consist primarily of proceeds and repayments of borrowings. For fiscal year 2017, net cash provided by financing activities totaled $1.5 million and consisted primarily of proceeds from short-term borrowings of $25.8 million partially offset by repayments of borrowings of $24.4 million.
For fiscal year 2016, net cash provided by financing activities consisted of proceeds from short-term borrowings of $25.1 million and proceeds from long-term borrowings of $5.0 million, offset by repayments of short-term borrowings of $27.3 million.
Cash Management
Our primary source of liquidity comes from our cash and cash equivalents, which totaled $17.5 million at December 31, 2017, as well as our credit facilities, under which we had aggregate borrowing availability of $12.0 million as of December 31, 2017. Our cash and cash equivalents as of December 31, 2017 included $12.1 million in cash balances held by our Korean subsidiary.
Wells Fargo Bank Facility
As of December 31, 2017, we had a $25.0 million revolving line of credit and letter of credit facility with WFB. Under the WFB Facility, we have the option of borrowing funds at agreed upon interest rates. The amount that we are able to borrow under the WFB Facility varies based on eligible accounts receivable and inventory, as defined in the WFB Facility, as long as the aggregate amount outstanding does not exceed $25.0 million less the amount committed as security for letters of credit. To maintain availability of funds under the WFB Facility, we pay a commitment fee on the unused portion. The commitment fee is 0.25% per annum and is recorded as interest expense.
As of December 31, 2017, we had no outstanding borrowings under our WFB Facility. Based on our eligible accounts receivable and inventory and $2.3 million committed as security for letters of credit, we had $9.2 million of borrowing availability under the WFB Facility as of December 31, 2017. The amounts borrowed under the WFB Facility bear interest, payable monthly, at a floating rate equal to the three-month LIBOR plus a margin based on our average excess availability (as
38
calculated under the WFB Facility). The interest rate on the WFB Facility was 4.19% at December 31, 2017. The maturity date under the WFB Facility is March 31, 2019.
Our obligations under the WFB Facility are secured by substantially all of our personal property assets and those of our subsidiaries that guarantee the WFB Facility, including our intellectual property. The WFB Facility contains certain financial covenants, and customary affirmative covenants and negative covenants. If we default under the WFB Facility due to a covenant breach or otherwise, WFB may be entitled to, among other things, require the immediate repayment of all outstanding amounts and sell our assets to satisfy the obligations under the WFB Facility. In the past we have violated the covenants in our former revolving line of credit and letter of credit facility and received waivers for these violations. On July 3, 2017, we executed an agreement with WFB to extend the due date for delivery for our audited financial statements for the year ended December 31, 2016 to September 27, 2017. As of December 31, 2017, we were in technical violation of covenants under the WFB facility to pledge the stock of certain foreign subsidiaries and transfer certain funds to WFB bank accounts. On March 19, 2018, we executed an agreement with WFB which cured the breach. Effective March 27, 2018, the Company and WFB modified the definition of Liquidity Trigger Event (as defined in the WFB Facility) from $10.0 million to $5.0 million on March 31, 2018 or $10.0 million for subsequent quarters. Effective March 30, 2018, the Company and WFB amended the WFB Facility to extend the maturity date from March 31, 2019 to July 15, 2019. We make no assurances that we will be in compliance with WFB Facility covenants in the future.
Bank and Trade Facilities - Foreign Operations
Certain of our foreign subsidiaries have entered into various financing arrangements with foreign banks and other lending institutions consisting primarily of revolving lines of credit, trade facilities, term loans and export development loans. These facilities are renewed on an annual basis and are generally secured by a security interest in certain assets of the applicable foreign subsidiaries and supported by guarantees given by DNI or third parties. Certain of these financing arrangements are guaranteed by DNI. Payments under such facilities are made in accordance with the given lender’s amortization schedules. As of December 31, 2017 and December 31, 2016, we had an aggregate outstanding balance of $19.8 million and $17.6 million, respectively, under such financing arrangements, and the interest rate per annum applicable to outstanding borrowings under these financing arrangements as of December 31, 2017 and December 31, 2016 ranged from 1.58% to 8.90% and 1.92% to 4.08%, respectively.
Related-Party Debt
In connection with the Merger, on September 9, 2016, we entered into a loan agreement with DNI for a $5.0 million unsecured subordinated term loan facility. Under the loan agreement, we were permitted to request drawdowns of one or more term loans in an aggregate principal amount not to exceed $5.0 million. As of December 31, 2017, $5.0 million in term loans was outstanding under the facility. Such term loans mature in September 2021 and are pre-payable at any time by us without premium or penalty. The interest rate as of December 31, 2017 under this facility was 4.6% per annum.
In addition, we borrowed $1.8 million from DNI for capital investment in February 2016, which amount was outstanding as of December 31, 2017. This loan was due to mature in March 2018 with an option of renewal by mutual agreement, and bore interest at a rate of 4.6% per annum, payable annually. Effective February 27, 2018, we amended the terms of this loan to extend the repayment date from March 2018 to July 2019 and maintain an interest rate of 4.6%.
On March 27, 2018, DNS (a Korean-based, wholly-owned subsidiary of the Company) borrowed KRW6.5 billion ($6.0 million in USD) from DNI. The loan bears interest at a rate of 4.6% and is due on June 27, 2019.
Future Requirements and Funding Sources
Our fixed commitments for cash expenditures consist primarily of payments under operating leases, inventory purchase commitments, and payments of principal and interest for debt obligations.
From time to time, we may provide or commit to extend credit or credit support to our customers. This financing may include extending the terms for product payments to customers. Any extension of financing to our customers will limit the capital that we have available for other uses.
Our accounts receivable, while not considered a primary source of liquidity, represent a concentration of credit risk because a significant portion of the accounts receivable balance at any point in time typically consists of a relatively small number of customer account balances. As of December 31, 2017, two customers, accounted for 20% (a related-party) and 11% respectively of net accounts receivable, and receivables from customers in countries other than the United States represented 84% of net accounts receivable. Additionally, Dasan Networks Japan has factoring arrangements in relation to certain accounts receivable with certain financial institutions as December 31, 2017. We do not currently have any material commitments for
39
capital expenditures, or any other material commitments aside from operating leases for our facilities, inventory purchase commitments and debt.
Contractual Commitments and Off-Balance Sheet Arrangements
At December 31, 2017, our future contractual commitments by fiscal year were as follows (in thousands):
Total | Payments due by period | ||||||||||||||||||||||||||
2018 | 2019 | 2020 | 2021 | 2022 | Thereafter | ||||||||||||||||||||||
Operating leases | $ | 23,243 | $ | 3,794 | $ | 2,928 | $ | 2,844 | $ | 2,590 | $ | 2,664 | $ | 8,423 | |||||||||||||
Purchase commitments | 8,037 | 8,037 | — | — | — | — | — | ||||||||||||||||||||
Short-term debt | 19,790 | 19,790 | — | — | — | — | — | ||||||||||||||||||||
Long-term debt - others | 2,987 | — | 2,987 | — | — | — | — | ||||||||||||||||||||
Long-term debt - related party | 6,800 | — | 1,800 | — | 5,000 | — | — | ||||||||||||||||||||
Other payable - related party | 1,956 | 1,956 | — | — | — | — | — | ||||||||||||||||||||
Royalty obligations | 1,000 | 1,000 | — | — | — | — | — | ||||||||||||||||||||
Total future contractual commitments | $ | 63,814 | $ | 34,577 | $ | 7,715 | $ | 2,844 | $ | 7,590 | $ | 2,664 | $ | 8,423 | |||||||||||||
Operating Leases
The operating lease amounts shown above represent primarily off-balance sheet arrangements. For operating lease commitments, a liability is generally not recorded on our balance sheet unless the facility represents an excess facility for which an estimate of the facility exit costs has been recorded on our balance sheet, net of estimated sublease income. For operating leases that include contractual commitments for operating expenses and maintenance, estimates of such amounts are included based on current rates. Payments made under operating leases will be treated as rent expense for the facilities currently being utilized.
Purchase Commitments
The purchase commitments shown above represent non-cancellable inventory purchase commitments as of December 31, 2017.
Short-term Debt
The short-term debt obligations have been recorded as liabilities on our balance sheet, and comprise of $19.8 million in outstanding borrowings under the credit facilities of our foreign subsidiaries. The short-term debt obligation amount shown above represents scheduled principal repayments, but not the associated interest payments which may vary based on changes in market interest rates. At December 31, 2017, the interest rate per annum applicable to outstanding borrowings under the trade facilities of our foreign subsidiaries ranged from 1.58% to 8.90%. See above under “Cash Management” for further information about these facilities.
Long-term Debt - Others
The long-term debt obligation of $3.0 million above represents scheduled principal repayment of general loan to Shinhan Bank. On March 28, 2018, DNS and Shinhan Bank extended the term of their $3.0 million loan from March 30, 2018 to March 30, 2019. As such, the Company reclassed this debt to long-term as of December 31, 2017.
Long-term Debt - Related Party
As of December 31, 2017, we had borrowed an aggregate of $6.8 million from DNI. The amounts listed in the table above reflect the amendment in January 2018 to the DNS capital investment loan, which among other matters, extended the repayment date of the loan to July 2019. See above under “Cash Management” for further information about our related party debt.
ITEM 7A. QUANTITATIVE AND QUALITATIVE DISCLOSURES ABOUT MARKET RISK
40
Cash and Cash Equivalents
We consider all cash and highly liquid investments purchased with an original maturity of less than three months to be cash equivalents.
Concentration of Credit Risk
Financial instruments which potentially subject us to concentrations of credit risk consist primarily of cash and cash equivalents, and accounts receivable. Cash and cash equivalents consist principally of financial deposits and money market accounts. Cash and cash equivalents are principally held with various domestic financial institutions with high credit standing. We perform ongoing credit evaluations of our customers and generally do not require collateral. Allowances are maintained for potential doubtful accounts.
We anticipate that our results of operations in any given period may depend to a large extent on sales to a small number of large accounts. As a result, our revenue for any quarter may be subject to significant volatility based upon changes in orders from one or a small number of key customers.
For the year ended December 31, 2017 no customer represented 10% or more of net revenue. For the year ended December 31, 2016, three customers represented 16%, 14% (a related party) and 10% of net revenue, respectively. For the year-ended December 31, 2015, four customers represented 26%, 21%, 17% (a related party) and 10% of net revenue respectively. As of December 31, 2017, two customers accounted for 20%% (a related-party) and 11% of net accounts receivable, respectively. As of December 31, 2016, two customers accounted for 13% (related party) and 10% of net accounts receivable, respectively. As of December 31, 2017 and 2016, receivables from customers in countries other than the United States represented 84% and 87%, respectively, of net accounts receivable.
Interest Rate Risk
Our exposure to market risk for changes in interest rates relates primarily to our outstanding short-term debt. As of December 31, 2017, our outstanding short-term debt balance was $19.8 million. Amounts borrowed under the short-term debt bear interest ranging from 1.58% to 8.90% as of December 31, 2017. Assuming the outstanding balance on our variable rate debt remains constant over a year, a 1% increase in the interest rate would decrease pre-tax income and cash flow by approximately $0.2 million.
Foreign Currency Risk
We transact business in various foreign countries, and a significant portion of our assets is located in Korea. We have sales operations throughout Asia, Europe, the Middle East and Latin America. We are exposed to foreign currency exchange rate risk associated with foreign currency denominated assets and liabilities, primarily intercompany receivables and payables. Accordingly, our operating results are exposed to changes in exchange rates between the U.S. dollar and those currencies. During fiscal years 2016 and 2015, we did not hedge any of our foreign currency exposure.
We have performed a sensitivity analysis as of December 31, 2017 using a modeling technique that measures the impact on the balance sheet arising from a hypothetical 10% adverse movement in the levels of foreign currency exchange rates relative to the U.S. dollar, with all other variables held constant. The sensitivity analysis indicated that a hypothetical 10% adverse movement in foreign currency exchange rates would result in a foreign exchange loss of $2.1 million at December 31, 2017. This sensitivity analysis assumes a parallel adverse shift in foreign currency exchange rates, which do not always move in the same direction. Actual results may differ materially.
41
ITEM 8. FINANCIAL STATEMENTS AND SUPPLEMENTARY DATA
DASAN ZHONE SOLUTIONS, INC. AND SUBSIDIARIES
INDEX TO CONSOLIDATED FINANCIAL STATEMENTS
Page | |
No financial statement schedules are required because all the relevant data is included elsewhere in this Annual Report on Form 10-K.
42
Report of Independent Registered Public Accounting Firm
To the Board of Directors and Stockholders of DASAN Zhone Solutions, Inc.
Opinion on the Financial Statements
We have audited the accompanying consolidated balance sheets of DASAN Zhone Solutions, Inc. and its subsidiaries (the “Company”) as of December 31, 2017 and December 31, 2016, and the related consolidated statements of comprehensive income (loss), of stockholders’ equity and non-controlling interest and of cash flows for each of the two years in the period ended December 31, 2017, including the related notes (collectively referred to as the “consolidated financial statements”). In our opinion, the consolidated financial statements present fairly, in all material respects, the financial position of the Company as of December 31, 2017 and December 31, 2016, and the results of its operations and its cash flows for each of the two years in the period ended December 31, 2017 in conformity with accounting principles generally accepted in the United States of America.
Basis for Opinion
These consolidated financial statements are the responsibility of the Company’s management. Our responsibility is to express an opinion on the Company’s consolidated financial statements based on our audits. We are a public accounting firm registered with the Public Company Accounting Oversight Board (United States) (“PCAOB”) and are required to be independent with respect to the Company in accordance with the U.S. federal securities laws and the applicable rules and regulations of the Securities and Exchange Commission and the PCAOB.
We conducted our audits of these consolidated financial statements in accordance with the standards of the PCAOB. Those standards require that we plan and perform the audit to obtain reasonable assurance about whether the consolidated financial statements are free of material misstatement, whether due to error or fraud.
Our audits included performing procedures to assess the risks of material misstatement of the consolidated financial statements, whether due to error or fraud, and performing procedures that respond to those risks. Such procedures included examining, on a test basis, evidence regarding the amounts and disclosures in the consolidated financial statements. Our audits also included evaluating the accounting principles used and significant estimates made by management, as well as evaluating the overall presentation of the consolidated financial statements. We believe that our audits provide a reasonable basis for our opinion.
/s/ PricewaterhouseCoopers LLP
San Jose, California
April 3, 2018
We have served as the Company's auditor since 2016.
43
REPORT OF INDEPENDENT REGISTERED PUBLIC ACCOUNTING FIRM
To the Board of Directors and Stockholders of
DASAN Zhone Solutions, Inc. (the successor to DASAN Network Solutions, Inc.)
In our opinion, the consolidated balance sheet as of December 31, 2015 and the related consolidated statements of comprehensive income(loss), of stockholder’s equity and non-controlling interest and of cash flows for the year ended December 31, 2015, present fairly, in all material respects, the financial position of DASAN Zhone Solutions, Inc. (the successor to DASAN Network Solutions, Inc.) and its subsidiaries as of December 31, 2015 and the results of their operations and their cash flows for year ended December 31, 2015 in conformity with accounting principles generally accepted in the United States of America. These financial statements are the responsibility of the Company’s management. Our responsibility is to express an opinion on these financial statements based on our audits. We conducted our audits of these statements in accordance with the auditing standards of the Public Company Accounting Oversight Board (United States). Those standards require that we plan and perform the audit to obtain reasonable assurance about whether the financial statements are free of material misstatement. An audit includes examining, on a test basis, evidence supporting the amounts and disclosures in the financial statements, assessing the accounting principles used and significant estimates made by management, and evaluating the overall financial statement presentation. We believe that our audits provide a reasonable basis for our opinion.
As discussed in Note 1(d) and Note 13 to the consolidated financial statements, the Company has restated its 2015 financial statements to correct errors relating to the timing of revenue recognition, balance sheet misclassifications and the recording of certain related party sales transactions.
As discussed in Note 1(h) to the consolidated financial statements, the Company has adjusted the financial statements for the reverse stock split.
/s/ Samil PricewaterhouseCoopers
Samil PricewaterhouseCoopers
Seoul, Korea
July 28, 2016, except for Note 1 (d), Note 1(h) and Note 13 as to which the date is April 3, 2018
44
DASAN ZHONE SOLUTIONS, INC. AND SUBSIDIARIES
Consolidated Balance Sheets
(In thousands, except par value)
December 31, 2017 | December 31, 2016 | ||||||
Assets | |||||||
Current assets: | |||||||
Cash and cash equivalents | $ | 17,475 | $ | 17,893 | |||
Restricted cash | 12,425 | 6,650 | |||||
Short-term investments | — | 993 | |||||
Accounts receivable, net of allowances for sales returns and doubtful accounts of $1,691 in 2017 and $1,143 in 2016 | |||||||
Trade receivables | 48,257 | 38,324 | |||||
Related parties | 13,498 | 13,311 | |||||
Other receivables | |||||||
Others | 12,494 | 12,068 | |||||
Related parties | 164 | 171 | |||||
Inventories | 25,344 | 31,032 | |||||
Prepaid expenses and other current assets | 3,652 | 4,131 | |||||
Total current assets | 133,309 | 124,573 | |||||
Property and equipment, net | 5,873 | 6,288 | |||||
Goodwill | 3,977 | 3,977 | |||||
Intangible assets, net | 6,785 | 8,767 | |||||
Non-current deferred tax assets | 2,954 | — | |||||
Long-term restricted cash | 1,512 | — | |||||
Other assets | 4,717 | 1,842 | |||||
Total assets | $ | 159,127 | $ | 145,447 | |||
Commitments and Contingencies | |||||||
Liabilities, Stockholders’ Equity and Non-controlling Interest | |||||||
Current liabilities: | |||||||
Accounts payable | |||||||
Others | 31,441 | 29,428 | |||||
Related parties | 1,351 | 1,683 | |||||
Short-term debt | 19,790 | 17,599 | |||||
Other payables | |||||||
Others | 2,032 | 2,040 | |||||
Related parties | 1,956 | 7,107 | |||||
Deferred revenue | 3,279 | 1,901 | |||||
Accrued and other liabilities | 11,174 | 7,996 | |||||
Total current liabilities | 71,023 | 67,754 | |||||
Long-term debt | |||||||
Others | 2,987 | — | |||||
Related parties | 6,800 | 6,800 | |||||
Deferred revenue | 1,883 | 1,674 | |||||
Other long-term liabilities | 2,667 | 2,351 | |||||
Total liabilities | 85,360 | 78,579 | |||||
Commitments and contingencies (Note 14) | |||||||
Stockholders’ equity and non-controlling interest | |||||||
Common stock, authorized 36,000 shares, 16,410 and 16,375 shares outstanding as of December 31, 2017 and December 31, 2016 at a $0.001 par value (1) | 16 | 16 | |||||
Additional paid-in capital | 90,198 | 89,174 | |||||
Other comprehensive income (loss) | 1,871 | (2,815 | ) | ||||
Accumulated deficit | (18,852 | ) | (19,923 | ) | |||
Total stockholders' equity | 73,233 | 66,452 | |||||
Non-controlling interest | 534 | 416 | |||||
Total stockholders' equity and non-controlling interest | 73,767 | 66,868 | |||||
Total liabilities, stockholders’ equity and non-controlling interest | $ | 159,127 | $ | 145,447 | |||
(1) Authorized and outstanding share amounts reflect the one-for-five reverse stock split effected on February 28, 2017.
See accompanying notes to consolidated financial statements.
45
DASAN ZHONE SOLUTIONS, INC. AND SUBSIDIARIES
Consolidated Statements of Comprehensive Income (Loss)
(In thousands, except per share data)
Years Ended December 31, | |||||||||||
2017 | 2016 | 2015 | |||||||||
Net revenue: | |||||||||||
Net revenue | $ | 215,732 | $ | 121,670 | $ | 114,421 | |||||
Net revenue - related parties | 31,382 | 28,634 | 24,775 | ||||||||
Total net revenue | 247,114 | 150,304 | 139,196 | ||||||||
Cost of revenue: | |||||||||||
Products and services | 138,792 | 84,415 | 81,420 | ||||||||
Products and services - related parties | 26,341 | 24,738 | 21,890 | ||||||||
Amortization of intangible assets | 612 | 204 | — | ||||||||
Total cost of revenue | 165,745 | 109,357 | 103,310 | ||||||||
Gross profit | 81,369 | 40,947 | 35,886 | ||||||||
Operating expenses: | |||||||||||
Research and product development | 35,437 | 25,396 | 21,331 | ||||||||
Selling, marketing, general and administrative | 43,888 | 27,348 | 17,528 | ||||||||
Amortization of intangible assets | 1,322 | 1,556 | 4 | ||||||||
Gain from sale of assets | — | (304 | ) | — | |||||||
Total operating expenses | 80,647 | 53,996 | 38,863 | ||||||||
Operating income (loss) | 722 | (13,049 | ) | (2,977 | ) | ||||||
Interest income | 129 | 183 | 136 | ||||||||
Interest expense | (1,019 | ) | (830 | ) | (532 | ) | |||||
Other income (expense), net | (731 | ) | (145 | ) | 266 | ||||||
Income (loss) before income taxes | (899 | ) | (13,841 | ) | (3,107 | ) | |||||
Income tax (benefit) provision | (2,072 | ) | 1,487 | 232 | |||||||
Net income (loss) | 1,173 | (15,328 | ) | (3,339 | ) | ||||||
Net income (loss) attributable to non-controlling interest | 102 | (2 | ) | — | |||||||
Net income (loss) attributable to DASAN Zhone Solutions, Inc. | $ | 1,071 | $ | (15,326 | ) | $ | (3,339 | ) | |||
Foreign currency translation adjustments | 4,702 | (1,047 | ) | (2,790 | ) | ||||||
Comprehensive income (loss) | 5,875 | (16,375 | ) | (6,129 | ) | ||||||
Comprehensive income attributable to non-controlling interest | 118 | 1 | — | ||||||||
Comprehensive income (loss) attributable to DASAN Zhone Solutions, Inc. | $ | 5,757 | $ | (16,376 | ) | $ | (6,129 | ) | |||
Basic earnings (loss) per share attributable to DASAN Zhone Solutions, Inc. (1) | $ | 0.07 | $ | (1.32 | ) | $ | (0.36 | ) | |||
Diluted earnings (loss) per share attributable to DASAN Zhone Solutions, Inc. (1) | $ | 0.07 | $ | (1.32 | ) | $ | (0.36 | ) | |||
Weighted average shares outstanding used to compute basic net income (loss) per share (1) | 16,383 | 11,637 | 9,314 | ||||||||
Weighted average shares outstanding used to compute diluted net income (loss) per share (1) | 16,396 | 11,637 | 9,314 | ||||||||
(1) All per share and weighted average share amounts have been adjusted to retroactively reflect the one-for-five reverse stock split effected on February 28, 2017.
See accompanying notes to consolidated financial statements.
46
DASAN ZHONE SOLUTIONS, INC. AND SUBSIDIARIES
Consolidated Statements of Stockholders' Equity and Non-controlling Interest
Years ended December 31, 2017, 2016 and 2015
(In thousands)
Common stock | ||||||||||||||||||||||||||||||
Shares | Amount | Additional paid-in capital | Other comprehensive income (loss) | Accumulated deficit | Total stockholders' equity | Non-controlling interest | Total stockholders' equity and non-controlling interest | |||||||||||||||||||||||
Balances as of December 31, 2014 | 9,221 | $ | 9 | $ | 48,857 | $ | 1,025 | $ | (1,258 | ) | $ | 48,633 | $ | — | $ | 48,633 | ||||||||||||||
Issuance of common stock | 272 | — | 1,800 | — | — | 1,800 | — | 1,800 | ||||||||||||||||||||||
Net increase in parent company investment | — | — | (2,977 | ) | — | — | (2,977 | ) | — | (2,977 | ) | |||||||||||||||||||
Net loss | — | — | — | — | (3,339 | ) | (3,339 | ) | — | (3,339 | ) | |||||||||||||||||||
Other comprehensive loss | — | — | — | (2,790 | ) | — | (2,790 | ) | — | (2,790 | ) | |||||||||||||||||||
Acquisition of controlling interest | — | — | — | — | — | — | 138 | 138 | ||||||||||||||||||||||
Balances as of December 31, 2015 | 9,493 | 9 | 47,680 | (1,765 | ) | (4,597 | ) | 41,327 | 138 | 41,465 | ||||||||||||||||||||
Stock-based compensation | 8 | — | 336 | — | — | 336 | — | 336 | ||||||||||||||||||||||
Shares of Legacy Zhone stock as of September 8, 2016 acquired through business combination | 6,874 | 7 | 41,435 | — | — | 41,442 | — | 41,442 | ||||||||||||||||||||||
Net loss | — | — | — | — | (15,326 | ) | (15,326 | ) | (2 | ) | (15,328 | ) | ||||||||||||||||||
Other comprehensive income (loss) | — | — | — | (1,050 | ) | — | (1,050 | ) | 3 | (1,047 | ) | |||||||||||||||||||
Acquisition of additional interest | — | — | (277 | ) | — | — | (277 | ) | 277 | — | ||||||||||||||||||||
Balances as of December 31, 2016 | 16,375 | 16 | 89,174 | (2,815 | ) | (19,923 | ) | 66,452 | 416 | 66,868 | ||||||||||||||||||||
Exercise of stock options | 35 | — | 122 | — | — | 122 | — | 122 | ||||||||||||||||||||||
Stock-based compensation | — | — | 902 | — | — | 902 | — | 902 | ||||||||||||||||||||||
Net income | — | — | — | — | 1,071 | 1,071 | 102 | 1,173 | ||||||||||||||||||||||
Other comprehensive income | — | — | — | 4,686 | — | 4,686 | 16 | 4,702 | ||||||||||||||||||||||
Balance as of December 31, 2017 | 16,410 | $ | 16 | $ | 90,198 | $ | 1,871 | $ | (18,852 | ) | $ | 73,233 | $ | 534 | $ | 73,767 | ||||||||||||||
Share amounts reflect the one-for-five reverse stock split effected on February 28, 2017. See Note 1(h) for information on reverse stock split.
See accompanying notes to consolidated financial statements.
47
DASAN ZHONE SOLUTIONS, INC. AND SUBSIDIARIES
Consolidated Statements of Cash Flows
(In thousands)
Years Ended December 31, | |||||||||||
2017 | 2016 | 2015 | |||||||||
Cash flows from operating activities: | |||||||||||
Net income (loss) | $ | 1,173 | $ | (15,328 | ) | $ | (3,339 | ) | |||
Adjustments to reconcile net income (loss) to net cash provided by (used in) operating activities: | |||||||||||
Depreciation and amortization | 3,817 | 3,173 | 1,404 | ||||||||
Gain from sale of assets | — | (304 | ) | — | |||||||
Stock-based compensation | 902 | 336 | — | ||||||||
Losses on inventory write-down | 1,848 | 547 | 165 | ||||||||
Unrealized loss (gain) on foreign currency transactions | 786 | 62 | (1,301 | ) | |||||||
Deferred taxes | (2,915 | ) | 1,408 | (86 | ) | ||||||
Changes in operating assets and liabilities: | |||||||||||
Accounts receivable | (3,132 | ) | (2,092 | ) | 11,442 | ||||||
Inventories | 6,233 | (1,627 | ) | 5,861 | |||||||
Prepaid expenses and other current assets | (3,526 | ) | 3,074 | 196 | |||||||
Accounts payable | (3,576 | ) | 4,488 | (6,676 | ) | ||||||
Accrued expenses | 292 | 9,759 | (3,415 | ) | |||||||
Net cash provided by operating activities | 1,902 | 3,496 | 4,251 | ||||||||
Cash flows from investing activities: | |||||||||||
Cash acquired through the Merger | — | 7,013 | — | ||||||||
Cash acquired through common control transactions | 1,254 | — | — | ||||||||
(Increase) decrease in restricted cash | (5,862 | ) | (2,128 | ) | 1,479 | ||||||
Decrease in short-term and long-term loans to others | — | 516 | 88 | ||||||||
Increase in short-term and long-term loans to others | — | (214 | ) | (446 | ) | ||||||
Proceeds from disposal of property and equipment and other assets | 6 | 10 | 2,230 | ||||||||
Proceeds from sale of short-term investments | 1,463 | — | — | ||||||||
Purchase of short-term investments | (429 | ) | (1,034 | ) | (1,856 | ) | |||||
Purchases of property and equipment | (1,072 | ) | (1,311 | ) | (794 | ) | |||||
Purchases of intangible assets | (90 | ) | (61 | ) | — | ||||||
Payment for purchase of shares of HandySoft, net of cash acquired | — | — | (548 | ) | |||||||
Net cash provided by (used in) investing activities | (4,730 | ) | 2,791 | 153 | |||||||
Cash flows from financing activities: | |||||||||||
Repayments of borrowings | (24,447 | ) | (27,336 | ) | (17,796 | ) | |||||
Proceeds from short-term borrowings | 25,834 | 25,069 | 17,950 | ||||||||
Proceeds from long-term borrowings - related party | — | 5,000 | — | ||||||||
Government grants received | — | — | 217 | ||||||||
Proceeds from issuance of common stock | 121 | — | 1,800 | ||||||||
Decrease in other capital | — | — | (2,977 | ) | |||||||
Net cash provided by (used in) financing activities | 1,508 | 2,733 | (806 | ) | |||||||
Effect of exchange rate changes on cash | 902 | (222 | ) | (510 | ) | ||||||
Net increase (decrease) in cash and cash equivalents | (418 | ) | 8,798 | 3,088 | |||||||
Cash and cash equivalents at beginning of period | 17,893 | 9,095 | 6,007 | ||||||||
Cash and cash equivalents at end of period | $ | 17,475 | $ | 17,893 | $ | 9,095 | |||||
Supplemental disclosure of cash flow information: | |||||||||||
Shares of the Company's common stock held in escrow | 949 | 949 | — | ||||||||
Cash paid during the period for: | |||||||||||
Interest | $ | 838 | $ | 663 | $ | 570 | |||||
Income taxes | 327 | 353 | 1,496 | ||||||||
See accompanying notes to consolidated financial statements.
48
DASAN ZHONE SOLUTIONS, INC. AND SUBSIDIARIES
Notes to Consolidated Financial Statements
(1) Organization and Summary of Significant Accounting Policies
(a) Description of Business
DASAN Zhone Solutions, Inc. (formerly known as Zhone Technologies, Inc. and referred to, collectively with its subsidiaries, as "DZS" or the "Company") is a global provider of network access solutions and communications equipment for service provider and enterprise networks. The Company provides a wide array of reliable, cost-effective networking technologies, including broadband access, Ethernet switching, mobile backhaul, Passive Optical LAN and software-defined networks, to a diverse customer base that includes more than 1,000 customers in more than 50 countries worldwide.
DZS was incorporated under the laws of the state of Delaware in June 1999. On September 9, 2016, the Company acquired Dasan Network Solutions, Inc., a California corporation ("DNS") through the merger of a wholly owned subsidiary of the Company with and into DNS, with DNS surviving as a wholly owned subsidiary of the Company (the "Merger"). At the effective time of the Merger, all issued and outstanding shares of capital stock of DNS held by DASAN Networks, Inc. ("DNI") were canceled and converted into the right to receive shares of the Company's common stock in an amount equal to 58% of the issued and outstanding shares of the Company's common stock immediately following the Merger. In connection with the Merger, the Company changed its name from Zhone Technologies, Inc. to DASAN Zhone Solutions, Inc. For periods through September 8, 2016, Zhone Technologies, Inc. is referred to as "Legacy Zhone." The Company is headquartered in Oakland, California.
(b) Risks and Uncertainties
The accompanying consolidated financial statements have been prepared in conformity with generally accepted accounting principles in the United States ("U.S. GAAP"), assuming the Company will continue as a going concern.
The Company had net income of $1.2 million for the year ended December 31, 2017. However, the Company incurred a net loss of $15.3 million for the year ended December 31, 2016 and significant losses in prior years. As of December 31, 2017, the Company had an accumulated deficit of $18.9 million and working capital of $62.3 million. As of December 31, 2017, the Company had $17.5 million in cash and cash equivalents, which included $12.1 million in cash balances held by its Korean subsidiary and $29.6 million in aggregate principal amount of short-term debt obligations, other long-term debt and long-term related party borrowings. In addition, as of December 31, 2017 the Company had $8.6 million committed as security for letters of credit under its revolving credit facilities, leaving $12.0 million in aggregate borrowing availability under these facilities. The Company’s current lack of liquidity could harm it by:
• | increasing its vulnerability to adverse economic conditions in its industry or the economy in general; |
• | requiring substantial amounts of cash to be used for debt servicing, rather than other purposes, including operations; |
• | limiting its ability to plan for, or react to, changes in our business and industry; and |
• | influencing investor and customer perceptions about its financial stability and limiting its ability to obtain financing or acquire customers. |
These factors indicate that cash flows might not be sufficient for the Company to meet its obligations as they come due in the ordinary course of business for a period of 12 months from the date of this Annual Report on Form 10-K.
However, the Company plans to focus on cost management, operating efficiency and restrictions on discretionary spending. In addition, if necessary, the Company may sell assets, issue debt or equity securities or purchase credit insurance. The Company may also reduce the scope of its planned product development, reduce sales and marketing efforts and reduce its operations in low margin regions, including reductions in headcount. Since December 31, 2017, the Company has modified the terms of certain existing debt and obtained a new loan, as described more fully in Note (19), Subsequent Events. Based on the Company's current plans and current business conditions, the Company believes that these measures along with its existing cash, cash equivalents and available credit facilities will be sufficient to satisfy its anticipated cash requirements for at least the next 12 months from the date of this Annual Report on Form 10-K.
The Company’s ability to meet its obligations as they become due in the ordinary course of business for the next 12 months will depend on its ability to achieve forecasted results and its ability to access funds approved under existing facilities. Management’s belief that it will achieve these results assumes that, among other things, the Company will continue to be
49
successful in implementing its business strategy and that there will be no material adverse development in its business, liquidity or capital requirements. If one or more of these factors do not occur as expected, it could cause the Company to fail to meets its obligations as they come due.
(c) DNI Ownership
DNI owned approximately 58% of the outstanding shares of the Company's common stock as of December 31, 2017. For so long as DNI and its affiliates hold shares of the Company's common stock representing at least a majority of the votes, DNI will be able to freely nominate and elect all the members of the Company's board of directors, subject to the provisions of the Company's bylaws and applicable requirements under Nasdaq listing rules and applicable laws. The directors elected by DNI will have the authority to make decisions affecting the Company's capital structure, including the issuance of additional capital stock or options, the incurrence of additional indebtedness, the implementation of stock repurchase programs, and the declaration of dividends. The interests of DNI may not coincide with the interests of the Company's other stockholders or with holders of the Company's indebtedness. DNI’s ability to control all matters submitted to the Company's stockholders for approval limits the ability of other stockholders to influence corporate matters and, as a result, the Company may take actions that the Company's other stockholders or holders of the Company's indebtedness do not view as beneficial. See Note 2, Note 13 and Note 14 to the consolidated financial statements for additional information.
(d) Reclassifications
Certain prior period balance sheet items have been reclassified to correct for related party payables of $1.3 million which were reclassified from accounts payable - others to accounts payable - related parties and $0.2 million which was reclassified from accrued and other liabilities to other payables - related parties.
(e) Basis of Presentation
The consolidated financial statements are prepared in accordance with accounting principles generally accepted in the United States and include the accounts of the Company, its wholly-owned subsidiaries and a subsidiary in which it has a controlling interest. All inter-company transactions and balances have been eliminated in consolidation.
As discussed more fully in Note 2, on September 9, 2016, the acquisition of DNS was consummated through the Merger of a wholly owned subsidiary of the Company with and into DNS, with DNS surviving as a wholly owned subsidiary of the Company.
At the effective time of the Merger, all issued and outstanding shares of capital stock of DNS held by DNI were canceled and converted into the right to receive shares of the Company's common stock in an amount equal to 58% of the issued and outstanding shares of the Company's common stock immediately following the Merger. As a result, immediately following the effective time of the Merger, DNI held 58% of the outstanding shares of the Company's common stock and the holders of the Company's common stock immediately prior to the Merger retained, in the aggregate, 42% of the outstanding shares of the Company's common stock.
The Merger has been accounted for as a reverse acquisition under which DNS was considered the accounting acquirer of the Company. As such, the consolidated financial results of the Company presented in the consolidated financial statements reflect the operating results of DNS and its consolidated subsidiaries for the year ended December 31, 2015 and for the period from January 1, 2016 through September 8, 2016 and the operating results of both DNS and Legacy Zhone and their respective consolidated subsidiaries for all periods from and after September 9, 2016. The balance sheet of the Company as of December 31, 2016 includes the fair value of the assets and liabilities of Legacy Zhone as of the effective date of the Merger. Those assets include the fair value of acquired intangible assets and goodwill. The year ended December 31, 2017 was the first fiscal year in which the Company's financial results reflected a full year of operating results for both DNS and Legacy Zhone and their respective consolidated subsidiaries. Due to the foregoing, our financial results for the year ended December 31, 2017 are not comparable to our financial results for prior years.
On December 31, 2017, DNS (a wholly owned subsidiary of the Company) acquired 100% and 99.99% of the common stock of D-Mobile Limited (“D-Mobile”) and DASAN India Private Limited (DASAN India), respectively, from DNI. D-Mobile and DASAN India are resellers of the Company's products in Taiwan and India, respectively. The consideration payable by the Company to DNI for the common stock is the net book value of D-Mobile and DASAN India at December 31, 2017, subject to final adjustments. The net book value of D-Mobile and DASAN India was an aggregate of $0.8 million. These transactions were accounted for by the Company as common control transactions, with the net assets transferred recorded at historical cost. The transactions did not result in a change in reporting entity and hence were accounted for prospectively.
50
Except as otherwise specifically noted herein, all references to the "Company" refer to (i) DNS and its consolidated subsidiaries for periods through September 8, 2016 and (ii) the Company and its consolidated subsidiaries for periods on or after September 9, 2016.
(f) Consolidated Subsidiaries
Details of the Company's consolidated subsidiaries as of December 31, 2017 and December 31, 2016 are as follows:
Percentage of ownership (%) | ||||||||
Location | December 31, 2017 | December 31, 2016 | ||||||
Dasan Network Solutions, Inc. (U.S. subsidiary) | US | 100 | % | 100 | % | |||
Dasan Network Solutions, Inc. (Korean subsidiary) | Korea | 100 | % | 100 | % | |||
DASAN Network Solutions Japan Co., Ltd. (formerly: HandySoft Japan Co., Ltd.) | Japan | 69.06 | % | 69.06 | % | |||
DASAN Vietnam Co., Ltd | Vietnam | 100 | % | 100 | % | |||
D-Mobile | Taiwan | 100 | % | N/A | ||||
DASAN India | India | 99.99 | % | N/A | ||||
(g) Use of Estimates
The preparation of the consolidated financial statements in conformity with generally accepted accounting principles in the United States of America requires management to make estimates and assumptions that affect the reported amounts of assets and liabilities and disclosure of contingent assets and liabilities at the date of the consolidated financial statements and the reported amounts of revenue and expenses during the reporting period. Actual results could differ materially from those estimates.
(h) Reverse Stock Split
On February 28, 2017, the Company filed a Certificate of Amendment with the Delaware Secretary of State to amend the Company's Restated Certificate of Incorporation, which amendment effected a one-for-five reverse stock split of the Company's common stock and reduced the authorized shares of the Company's common stock from 180 million to 36 million. As a result of the reverse stock split, the number of shares of the Company’s common stock then issued and outstanding was reduced from approximately 81.9 million to approximately 16.4 million. References to shares of the Company's common stock, stock options (and associated exercise price) and restricted stock units in this Annual Report on Form 10-K are provided on a post-reverse stock split basis.
(i) Revenue Recognition
The Company recognizes revenue when the earnings process is complete. The Company recognizes product revenue upon shipment of product under contractual terms, which transfer title to customers upon shipment, under normal credit terms, net of estimated sales returns and allowances at the time of shipment. Revenue is deferred if there are significant post-delivery obligations or if the fees are not fixed or determinable. When significant post-delivery obligations exist, revenue is deferred until such obligations are fulfilled. The Company’s arrangements generally do not have any significant post-delivery obligations. If the Company’s arrangements include customer acceptance provisions, revenue is recognized upon obtaining the signed acceptance certificate from the customer, unless the Company can objectively demonstrate that the delivered products or services meet all the acceptance criteria specified in the arrangement prior to obtaining the signed acceptance. In those instances where revenue is recognized prior to obtaining the signed acceptance certificate, the Company uses successful completion of customer testing as the basis to objectively demonstrate that the delivered products or services meet all the acceptance criteria specified in the arrangement. The Company also considers historical acceptance experience with the customer, as well as the payment terms specified in the arrangement, when revenue is recognized prior to obtaining the signed acceptance certificate. When collectability is not reasonably assured, revenue is recognized when cash is collected.
The Company makes certain sales to product distributors. These customers are given certain privileges to return a portion of inventory. Return privileges generally allow distributors to return inventory based on a percent of purchases made within a specific period of time. The Company recognizes revenue on sales to distributors that have contractual return rights when the products have been sold by the distributors, unless there is sufficient customer specific sales and sales returns history to support revenue recognition upon shipment. In those instances when revenue is recognized upon shipment to distributors, the Company uses historical rates of return from the distributors to provide for estimated product returns.
51
The Company derives revenue primarily from stand-alone sales of its products. In certain cases, the Company’s products are sold along with services, which include education, training, installation, and/or extended warranty services. As such, some of the Company’s sales have multiple deliverables. The Company’s products and services qualify as separate units of accounting and are deemed to be non-contingent deliverables as the Company’s arrangements typically do not have any significant performance, cancellation, termination and refund type provisions. Products are typically considered delivered upon shipment. Revenue from services is recognized ratably over the period during which the services are to be performed.
For multiple deliverable revenue arrangements, the Company allocates revenue to products and services using the relative selling price method to recognize revenue when the revenue recognition criteria for each deliverable are met. The selling price of a deliverable is based on a hierarchy and if the Company is unable to establish vendor-specific objective evidence of selling price (“VSOE”) it uses third-party evidence of selling price (“TPE”), and if no such data is available, it uses a best estimated selling price (“BESP”). In most instances, particularly as it relates to products, the Company is not able to establish VSOE for all deliverables in an arrangement with multiple elements. This may be due to infrequently selling each element separately, not pricing products within a narrow range, or only having a limited sales history. When VSOE cannot be established, the Company attempts to establish the selling price of each element based on TPE. Generally, the Company’s marketing strategy differs from that of the Company’s peers and the Company’s offerings contain a significant level of customization and differentiation such that the comparable pricing of products with similar functionality cannot be obtained. Furthermore, the Company is unable to reliably determine what similar competitor products’ selling prices are on a stand-alone basis. Therefore, the Company is typically not able to determine TPE for the Company’s products.
When the Company is unable to establish selling price using VSOE or TPE, the Company uses BESP. The objective of BESP is to determine the price at which the Company would transact a sale if the product or service were sold on a stand-alone basis. The BESP of each deliverable is determined using average discounts from list price from historical sales transactions or cost plus margin approaches based on factors, including but not limited to, the Company’s gross margin objectives, pricing practices and customer and market specific considerations.
Training, education and installation service arrangements are typically not material, are short term in nature and are largely completed shortly after delivery of the product.
Extended warranty services are priced based on the type of product and are sold in one to five year durations. Extended warranty services include the right to warranty coverage beyond the standard warranty period. In substantially all of the arrangements with multiple deliverables pertaining to arrangements with these services, the Company has used and intends to continue using VSOE to determine the selling price for the services. The Company determines VSOE based on its normal pricing practices for these specific services when sold separately.
(j) Allowances for Sales Returns and Doubtful Accounts
The Company records an allowance for sales returns for estimated future product returns related to current period product revenue. The allowance for sales returns is recorded as a reduction of revenue and an allowance against accounts receivable. The Company bases its allowance for sales returns on periodic assessments of historical trends in product return rates and current approved returned products. If the actual future returns were to deviate from the historical data on which the reserve had been established, the Company’s future revenue could be adversely affected.
The Company records an allowance for doubtful accounts for estimated losses resulting from the inability of customers to make payments for amounts owed to the Company. The allowance for doubtful accounts is recorded as an expense to general and administrative expenses. The Company bases its allowance on periodic assessments of its customers’ liquidity and financial condition through analysis of information obtained from credit rating agencies, financial statement review and historical collection trends. Additional allowances may be required in the future if the liquidity or financial condition of the Company's customers deteriorates, resulting in doubts about their ability to make payments.
Activity under the Company’s allowance for sales returns and doubtful accounts was comprised as follows (in thousands):
52
Years ended December 31, | |||||||||||
2017 | 2016 | 2015 | |||||||||
Balance at beginning of year | $ | 1,143 | $ | 868 | $ | 136 | |||||
Charged to revenue | 1,387 | 466 | 767 | ||||||||
Utilization/write offs | (974 | ) | (149 | ) | — | ||||||
Exchange differences | 135 | (42 | ) | (35 | ) | ||||||
Balance at end of year | $ | 1,691 | $ | 1,143 | $ | 868 | |||||
The allowance for doubtful accounts was $0.9 million and $0.8 million and as of December 31, 2017 and 2016, respectively.
(k) Inventories
Inventories are stated at the lower of cost or market, with cost being determined using the first-in, first-out method. In assessing the net realizable value of inventories, the Company is required to make judgments as to future demand requirements and compare these with the current or committed inventory levels. Once inventory has been written down to its estimated net realizable value, its carrying value cannot be increased due to subsequent changes in demand. To the extent that a severe decline in forecasted demand occurs, or the Company experiences a higher incidence of inventory obsolescence due to rapidly changing technology and customer requirements, the Company may incur significant expenses for excess and obsolete inventory. The Company also evaluates the terms of its agreements with its suppliers and establish accruals for estimated losses on adverse purchase commitments as necessary, applying the same lower of cost or market approach that is used to value inventory.
(l) Foreign Currency Translation
For operations outside the United States, the Company translates assets and liabilities of foreign subsidiaries, whose functional currency is the local currency, at end of period exchange rates. Revenues and expenses are translated at periodic average rates. The adjustment resulting from translating the financial statements of such foreign subsidiaries, is included in accumulated other comprehensive income (loss,) which is reflected as a separate component of stockholders’ equity. Gains and losses on foreign currency transactions are included in other income (expense) in the accompanying consolidated statement of comprehensive income (loss).
(m) Comprehensive Income (Loss)
There have been no items reclassified out of accumulated other comprehensive income (loss) and into net income (loss). The Company’s other comprehensive income (loss) for the years ended December 31, 2017, 2016, and 2015 is comprised of foreign currency translation gains or losses.
(n) Concentration of Risk
Financial instruments, which potentially subject the Company to concentrations of credit risk, consist primarily of cash and cash equivalents and accounts receivable. Cash and cash equivalents consist principally of financial deposits and money market accounts. Cash and cash equivalents are principally held with various domestic financial institutions with high credit standing.
The Company’s customers include competitive and incumbent local exchange carriers, competitive access providers, internet service providers, wireless carriers and resellers serving these markets. The Company performs ongoing credit evaluations of its customers and generally does not require collateral. Allowances are maintained for potential doubtful accounts.
For the year ended December 31, 2017 no customer represented 10% or more of net revenue. For the year ended December 31, 2016, three customers represented 16%, 14% (a related-party) and 10% of net revenue, respectively. For the year ended December 31, 2015, four customers represented 26%, 21%, 17% (a related-party) and 10% of net revenue, respectively.
As of December 31, 2017, two customers represented 20% (a related party) and 11% of net accounts receivable, respectively. As of December 31, 2016, two customers accounted for 13% (a related-party) and 10% of net accounts receivable, respectively. As of December 31, 2017 and December 31, 2016, receivables from customers in countries other than the United States represented 84% and 87% of net accounts receivable. respectively.
53
(o) Property and Equipment
Property and equipment are stated at cost, less accumulated depreciation, and are depreciated using the straight-line method over the estimated useful life of each asset. The useful life of each asset category is as follows:
Asset Category | Useful Life |
Furniture and fixtures | 3 to 4 years |
Machinery and equipment | 3 to 10 years |
Computers and software | 3 years |
Leasehold improvements | Shorter of remaining lease term or estimated useful lives |
Upon retirement or sale, the cost and related accumulated depreciation of the asset are removed from the balance sheet and the resulting gain or loss is reflected in operating expenses.
(p) Long-Lived Assets
The Company reviews long-lived assets for impairment whenever events or changes in circumstances indicate that the carrying value of an asset or asset group may not be recoverable based on expected undiscounted cash flows attributable to that asset or asset group. Recoverability of assets to be held and used is measured by comparing the carrying amount of an asset to the future net undiscounted cash flows expected to be generated by the asset. If the carrying amount of an asset exceeds its estimated future net undiscounted cash flows, an impairment expense is recognized in the amount by which the carrying amount of the asset exceeds the fair value of the asset. Any assets to be disposed of would be separately presented in the balance sheet and reported at the lower of the carrying amount or fair value less costs to sell, and would no longer be depreciated. The assets and liabilities of a disposed group classified as held for sale would be presented separately in the appropriate asset and liability sections of the balance sheet.
The Company estimates the fair value of its long-lived assets based on a combination of market information primarily obtained from third-party quotes and online markets. In the application of impairment testing, the Company is required to make estimates of future operating trends and resulting cash flows and judgments on discount rates and other variables. Actual future results and other assumed variables could differ from these estimates. During the years ended December 31, 2017, 2016, and 2015, the Company recorded no impairment expenses related to the impairment of long-lived assets.
(q) Goodwill and Other Acquisition-Related Intangible Assets
Goodwill and other acquisition-related intangible assets not subject to amortization are tested annually for impairment using a two-step approach, and are tested for impairment more frequently if events and circumstances indicate that the asset might be impaired. An impairment loss is recognized to the extent that the carrying amount exceeds the asset’s fair value. In the application of impairment testing, the Company is required to make estimates of future operating trends and resulting cash flows and judgments on discount rates and other variables. Actual future results and other assumed variables could differ from these estimates. The Company's future operating performance will be impacted by the future amortization of intangible assets, potential expenses related to purchased in-process research and development for future acquisitions, and potential impairment expenses related to goodwill. Accordingly, the allocation of the purchase price of the acquired companies to intangible assets and goodwill has a significant impact on the Company's future operating results. The allocation process requires management to make significant estimates and assumptions, including estimates of future cash flows expected to be generated by the acquired assets and the appropriate discount rate for these cash flows. Should different conditions prevail, the Company would have to perform an impairment review that might result in material write-downs of intangible assets and/or goodwill. Other factors the Company considers important which could trigger an impairment review, include, but are not limited to, significant changes in the manner of use of its acquired assets, significant changes in the strategy for the Company's overall business or significant negative economic trends. If this evaluation indicates that the value of an intangible asset may be impaired, an assessment of the recoverability of the net carrying value of the asset over its remaining useful life is made. If this assessment indicates that the cost of an intangible asset is not recoverable, based on the estimated undiscounted future cash flows or other comparable market valuations of the entity or technology acquired over the remaining amortization period, the net carrying value of the related intangible asset will be reduced to fair value and the remaining amortization period may be adjusted. Due to uncertain market conditions and potential changes in the Company's strategy and product portfolio, it is possible that forecasts used to support its intangible assets may change in the future, which could result in additional non-cash expenses that would adversely affect its results of operations and financial condition.
54
(r) Business Combination
The Company allocates the fair value of purchase consideration to the tangible assets acquired, liabilities assumed and intangible assets acquired based on their estimated fair values. The excess of the fair value of purchase consideration over the fair values of these identifiable assets and liabilities is recorded as goodwill. When determining the fair values of assets acquired and liabilities assumed, management makes significant estimates and assumptions, especially with respect to intangible assets and certain tangible assets such as inventory.
Critical estimates in valuing certain tangible and intangible assets include but are not limited to future expected cash flows from the underlying assets and discount rates. Management’s estimates of fair value are based upon assumptions believed to be reasonable, but which are inherently uncertain and unpredictable and, as a result, actual results may differ from estimates.
(s) Stock-Based Compensation
The Company uses the Black Scholes model to estimate the fair value of options, which is affected by the Company's stock price as well as assumptions regarding a number of complex and subjective variables. These variables include the Company's expected stock price volatility over the term of the awards, actual and projected employee option exercise behaviors, risk-free interest rates and expected dividends. The expected stock price volatility is based on the weighted average of the historical volatility of the Company's common stock over the most recent period commensurate with the estimated expected life of the Company's stock options. The Company based its expected life assumption on its historical experience and on the terms and conditions of the stock awards granted. Risk-free interest rates reflect the yield on zero-coupon U.S. Treasury securities.
The value of the portion of the award that is ultimately expected to vest is recognized as expense over the requisite service periods in the Company’s consolidated statement of comprehensive income (loss). The Company attributes the values of the stock-based compensation to expense using the straight-line method.
(t) Income Taxes
The Company uses the asset and liability method to account for income taxes. Under this method, deferred tax assets and liabilities are determined based on differences between the financial reporting and the income tax bases of assets and liabilities. Deferred tax assets and liabilities are measured using enacted tax rates and laws that will be in effect when the differences are expected to reverse. Valuation allowances are established, when necessary, to reduce deferred tax assets to the amount expected to be realized. In 2017, the valuation allowance against the Company's net deferred tax assets in Korea were released after management determined that it is more likely than not that the net deferred tax assets will be realized in this tax jurisdiction. The Company maintains a valuation allowance on its U.S. net deferred tax assets, with the exception of its alternative minimum tax credit carryforward, which is anticipated to be refundable.
In 2017 the Company adopted ASU 2015-17 and applied it prospectively as allowed by the standard. In accordance with the standard, we present deferred tax assets and deferred tax liabilities as noncurrent in our balance sheet. Our adoption of ASU 2015-17 did not have a material impact on our consolidated balance sheets and had no impact on our cash provided by or used in operations for any period presented.
(u) Net Income (Loss) per Share Attributable to DASAN Zhone Solutions, Inc.
Basic net income (loss) per share attributable to DASAN Zhone Solutions, Inc. is computed by dividing the net income (loss) attributable to DASAN Zhone Solutions, Inc. for the period by the weighted average number of shares of common stock outstanding during the period. The calculation of diluted net income (loss) per share attributable to DASAN Zhone Solutions, Inc. gives effect to common stock equivalents; however, potential common equivalent shares are excluded if their effect is antidilutive. Potential common equivalent shares are composed of incremental shares of common equivalent shares issuable upon the exercise of stock options.
(v) Shipping and Handling Costs
The Company records costs related to shipping and handling in cost of revenue for all periods presented.
(w) Research and Development Cost
Costs related to research and development, which primarily consists of labor and benefits, supplies, facilities, consulting, and outside service fees, are expensed as incurred.
55
(x) Cash and Cash Equivalents
Cash and cash equivalents consist of cash and short-term investments (if any) with maturities of less than three months.
(y) Warranty
The Company offers a standard warranty for its hardware products of one year, with the option to purchase an extended warranty of up to five years, depending on the product type. The Company recognizes estimated costs related to warranty activities upon product shipment or upon identification of a specific product failure. The Company recognizes estimated warranty costs when it is probable that a liability has been incurred and the amount of loss is reasonably estimable. The estimates are based upon historical and projected product failure and claim rates, historical costs incurred in correcting product failures and information available related to any specifically identified product failures. Significant judgment is required in estimating costs associated with warranty activities and the Company's estimates are limited to information available to the Company at the time of such estimates. In some cases, such as when a specific product failure is first identified or a new product is introduced, the Company may initially have limited information and limited historical failure and claim rates upon which to base its estimates, and such estimates may require revision in future periods. The recorded amount is adjusted from time to time for specifically identified warranty exposure.
(z) Recent Accounting Pronouncements
On May 28, 2014, the Financial Accounting Standards Board ("FASB") issued Accounting Standards Update ("ASU") No. 2014-09, Revenue from Contracts with Customers, which requires an entity to recognize the amount of revenue to which it expects to be entitled for the transfer of promised goods or services to customers. The ASU will replace most existing revenue recognition guidance in U.S. GAAP when it becomes effective. The standard permits the use of either the retrospective or cumulative effect transition method. In August 2015, the FASB issued ASU 2015-14, which defers the effective date of the guidance in ASU No. 2014-09, Revenue from Contracts with Customer, for all entities by one year. With the deferral, the new standard is effective for the Company on January 1, 2018. Early adoption is permitted, but not before the original effective date of January 1, 2017. In May 2016, the FASB issued ASU 2016-12, Revenue from Contracts with Customers, Narrow-Scope Improvements and Practical Expedients, which provides clarification on how to assess collectability, present sales tax, treat noncash consideration, and account for completed and modified contracts at the time of transition to ASU 2014-09. The effective date of this updated guidance for the Company is the same as the effective date of ASU 2014-09, which is January 1, 2018. The Company has elected to use the modified retrospective method which will result in a cumulative effect transition which will be recorded in 2018. The Company is currently assessing the potential impact of adopting this new guidance on its consolidated financial statements.
In July 2015, the FASB issued ASU No. 2015-11, Simplifying the Measurement of Inventory, which requires an entity to measure inventory at the lower of cost and net realizable value. The guidance does not apply to inventory that is measured using last-in, first-out ("LIFO") or the retail inventory method. The guidance applies to all other inventory, which includes inventory that is measured using first-in, first-out ("FIFO") or average cost. The guidance was effective for the Company on January 1, 2017, and was adopted accordingly. The adoption of this standard had no impact on the Company's consolidated financial statements.
In February 2016, the FASB issued ASU 2016-02, Leases. ASU 2016-02 requires that lease arrangements longer than 12 months result in an entity recognizing an asset and liability. The updated guidance is effective for the Company on January 1, 2019, and early adoption is permitted. The Company does not plan to early adopt this guidance. The Company expects its assets and liabilities to increase as a result of the adoption of this standard. The Company is currently assessing the potential impact of adopting this new guidance on its consolidated financial statements. The Company is not able to quantify or cannot reasonably estimate quantitative information related to the impact of the new standard on its consolidated financial statements at this time.
In March 2016, the FASB issued ASU 2016-09, Improvements to Employee Share-Based Payment Accounting, which requires entities to simplify several aspects of the accounting for share-based payment transactions, including income tax consequences, classification of awards as either equity or liabilities, and classification on statements of cash flows. The guidance was effective for the Company on January 1, 2017, and was adopted accordingly. The adoption of this standard had no material impact on the Company's consolidated financial statements.
In August 2016, FASB issued ASU 2016-15, Statement of Cash Flows, Classification of Certain Cash Receipts and Cash Payments, which addresses eight specific cash flow issues with the objective of reducing the existing diversity in practice. The updated guidance is effective for the Company on January 1, 2018. The Company continues to assess all the potential impacts of the new standard and is not able to quantify or cannot reasonably estimate quantitative information related to the impact of the new standard on its consolidated financial statements at this time.
56
In November 2016, FASB issued ASU 2016-18, Statement of Cash Flows, Restricted Cash, which require that a statement of cash flows to explain the change during the period in the total of cash, cash equivalents and amounts generally described as restricted cash and restricted cash equivalents. The updated guidance is effective for the Company beginning on January 1, 2018. Adoption of this ASU is applied using a retrospective approach. As a result, the Company will no longer present transfers between cash and cash equivalents and restricted cash in the consolidated cash flow statements.
In January 2017, FASB issued ASU 2017-04, Simplifying the Test for Goodwill Impairment, which simplifies the accounting for goodwill impairment. The updated guidance is effective for the Company on January 1, 2020, and will be adopted accordingly. Early adoption is permitted. The Company is currently assessing the potential impact of adopting this new guidance on its consolidated financial statements. The Company is not able to quantify or cannot reasonably estimate quantitative information related to the impact of the new standard on its consolidated financial statements at this time.
In May 2017, the FASB issued ASU No. 2017-09, Compensation—Stock Compensation (Topic 718): Scope of modification accounting. The purpose of the amendment is to clarify which changes to the terms or conditions of a share-based payment award require an entity to apply modification accounting. The updated guidance is effective for the Company beginning on January 1, 2018. The Company is currently assessing the potential impact of adopting this new guidance on its consolidated financial statements.
(2) Merger
On September 9, 2016, the Company acquired DNS through the Merger of a wholly owned subsidiary of the Company with and into DNS, with DNS surviving as a wholly owned subsidiary of the Company. The Merger combines leading technology platforms with a broadened customer base.
At the effective time of the Merger, all issued and outstanding shares of capital stock of DNS held by DNI were canceled and converted into the right to receive shares of the Company's common stock in an amount equal to 58% of the issued and outstanding shares of the Company's common stock immediately following the Merger. Accordingly, at the effective time of the Merger, the Company issued 9,493,016 shares (post reverse stock split) of the Company’s common stock to DNI as consideration in the Merger, of which 949,302 shares (post reverse stock split) are being held in escrow as security for claims for indemnifiable losses in accordance with the merger agreement relating to the Merger. As a result, immediately following the effective time of the Merger, DNI held 58% of the outstanding shares of the Company's common stock and the holders of the Company's common stock immediately prior to the Merger retained, in the aggregate, 42% of the outstanding shares of the Company's common stock.
As described in Note 1(e), the Company accounted for the Merger as a reverse acquisition under the acquisition method of accounting in accordance with ASC 805, "Business Combination." Consequently, for the purpose of the purchase price allocation DNS' assets and liabilities have been retained at their carrying values and Legacy Zhone's assets acquired, and liabilities assumed, by DNS (as the accounting acquirer in the Merger) have been recorded at their fair value measured as of September 9, 2016.
The total purchase consideration in the Merger is based on the number of shares of Legacy Zhone common stock and Legacy Zhone stock options vested and outstanding immediately prior to the closing of the Merger, and was determined based on the closing price of $5.95 per share (post reverse stock split) of the Company's common stock on September 9, 2016. The total purchase consideration is calculated as follows (in thousands):
Shares | Estimated Fair Value | ||||||
Shares of Legacy Zhone stock as of September 8, 2016 (1) | 6,874 | $ | 40,902 | ||||
Legacy Zhone stock options (1) | 198 | 540 | |||||
Total purchase consideration | $ | 41,442 | |||||
(1) Amount presented has been adjusted to reflect the one-for-five reverse stock split effected on February 28, 2017.
The following table summarizes the allocation of the fair value of the consideration transferred as of the acquisition date (in thousands):
57
Fair Value as of December 31, 2016 | ||||
Cash and cash equivalents | $ | 7,013 | ||
Accounts receivable | 18,510 | |||
Inventory | 16,456 | |||
Prepaid expenses and other current assets | 2,191 | |||
Property and equipment | 4,339 | |||
Other assets | 125 | |||
Identifiable intangible assets | 10,479 | |||
Goodwill | 3,284 | |||
Accounts payable | (11,021 | ) | ||
Accrued and other liabilities | (7,089 | ) | ||
Other long-term liabilities | (2,845 | ) | ||
Total Indicated Fair Value of Assets | $ | 41,442 | ||
The goodwill was primarily attributed to people, geographical diversification and complementary products. The goodwill arising from the Merger is not tax deductible.
The Company considered the deferred tax liabilities caused by the Merger to be a source of income to support recoverability of acquired deferred tax assets, before considering the recoverability of the acquirer's existing deferred tax assets. Accordingly, the valuation allowance on the acquiree's deferred tax assets was reduced by the deferred tax liabilities caused by the Merger and accounted for as part of the purchase price allocation.
The Company recorded $1.3 million in Merger related costs during the year ended December 31, 2016. These expenses are included in selling, marketing, general and administrative expense.
The following table presents the fair values of the acquired intangible assets at the effective date of the Merger (in thousands, except years):
Useful life (in Years) | Fair Value | |||||
Developed technology | 5 | $ | 3,060 | |||
Customer relationships | 10 | 5,240 | ||||
Backlog | 1 | 2,179 | ||||
Total Acquired Intangible Assets | $ | 10,479 | ||||
The following unaudited pro forma condensed combined financial information for the year ended December 31, 2016 and 2015 gives effect to the Merger as if it had occurred at the beginning of 2015. The unaudited pro forma condensed combined financial information has been included for comparative purposes only and is not necessarily indicative of what the combined Company's financial position or results of operations might have been had the Merger been completed as of the date indicated. In addition, the unaudited pro forma condensed combined financial information does not purport to project the future financial position or results of operations of the combined company. The unaudited pro forma condensed combined financial information reflects adjustments related to the Merger, such as to record certain incremental expenses resulting from purchase accounting adjustments (such as amortization expenses in connection with the fair value adjustments to intangible assets and Merger related costs).
Years Ended December 31, | ||||||||
(in thousands) | 2016 | 2015 | ||||||
Pro forma total net revenue | $ | 202,321 | $ | 240,342 | ||||
Pro forma net loss | (29,514 | ) | (11,369 | ) | ||||
For the period from September 9, 2016 (the effective date of the Merger) through December 31, 2016, the Company's income statement included $29.0 million of net revenues and $7.6 million of net loss from the Legacy Zhone business.
58
(3) Fair Value Measurement
The Company utilizes a fair value hierarchy that is intended to increase consistency and comparability in fair value measurements and related disclosures. The fair value hierarchy is based on inputs to valuation techniques that are used to measure fair value that are either observable or unobservable. Observable inputs reflect assumptions market participants would use in pricing an asset or liability based on market data obtained from independent sources while unobservable inputs reflect a reporting entity’s pricing based upon their own market assumptions. The fair value hierarchy consists of the following three levels:
Level 1 – | Inputs are quoted prices in active markets for identical assets or liabilities. |
Level 2 – | Inputs are quoted prices for similar assets or liabilities in an active market, quoted prices for identical or similar assets or liabilities in markets that are not active, inputs other than quoted prices that are observable and market-corroborated inputs which are derived principally from or corroborated by observable market data. |
Level 3 – | Inputs are derived from valuation techniques in which one or more significant inputs or value drivers are unobservable. |
The following financial instruments are not measured at fair value on the Company’s consolidated balance sheet as of December 31, 2017 and 2016, but require disclosure of their fair values: cash and cash equivalents, short-term investments, accounts receivable, accounts payable and debt. The carrying values of financial instruments such as cash and cash equivalents, short-term investments, accounts receivable and accounts payable approximate their fair values based on their short-term nature. The carrying value of the Company's debt approximates their fair values based on the current rates available to the Company for debt of similar terms and maturities.
(4) | Cash and Cash Equivalents and Restricted Cash |
As of December 31, 2017 and December 31, 2016, the Company's cash and cash equivalents comprised financial deposits. Restricted cash consisted primarily of cash restricted for performance bonds, warranty bonds and collateral for borrowings. Current and long-term restricted cash increased to a total of $13.9 million at December 31, 2017 from $6.7 million at December 31, 2016 because of an increase in warranty bonds in 2017.
(5) Balance Sheet Detail
Balance sheet detail as of December 31, 2017 and 2016 is as follows (in thousands):
2017 | 2016 | ||||||
Inventories: | |||||||
Raw materials | $ | 12,671 | $ | 13,547 | |||
Work in process | 2,150 | 3,705 | |||||
Finished goods | 10,523 | 13,780 | |||||
$ | 25,344 | $ | 31,032 | ||||
Inventories provided as collateral for borrowings from Export-Import Bank of Korea amounted to $11.4 million and $14.4 million as of December 31, 2017 and December 31, 2016, respectively.
59
2017 | 2016 | ||||||
Property and equipment, net: | |||||||
Furniture and fixtures | $ | 22,988 | $ | 20,040 | |||
Machinery and equipment | 5,455 | 4,530 | |||||
Leasehold improvements | 3,647 | 3,573 | |||||
Computers and software | 621 | 411 | |||||
Other | 1,007 | 922 | |||||
33,718 | 29,476 | ||||||
Less accumulated depreciation and amortization | (27,584 | ) | (22,922 | ) | |||
Less government grants | (261 | ) | (266 | ) | |||
$ | 5,873 | $ | 6,288 | ||||
Depreciation expense associated with property and equipment was $1.9 million, $1.3 million and $1.4 million for the years ended December 31, 2017, 2016 and 2015, respectively.
The Company receives grants from various government entities mainly to support capital expenditures. Such grants are deferred and are generally refundable to the extent the Company does not utilize the funds for qualifying expenditures. Once earned, the Company records the grants as a contra amount to the assets and amortizes such amount over the useful lives of the related assets as a reduction to depreciation expense.
2017 | 2016 | ||||||
Accrued and other liabilities (in thousands): | |||||||
Accrued warranty | $ | 931 | $ | 878 | |||
Accrued compensation | 1,905 | 2,834 | |||||
Other accrued expenses | 8,338 | 4,284 | |||||
$ | 11,174 | $ | 7,996 | ||||
The Company accrues for warranty costs based on historical trends for the expected material and labor costs to provide warranty services. The Company's standard warranty period is one year from the date of shipment with the ability for customers to purchase an extended warranty of up to five years from the date of shipment. The following table summarizes the activity related to the product warranty liability (in thousands):
Balance at December 31, 2015 | $ | 441 | |
Balance assumed with the Merger | 652 | ||
Charged to cost of revenue | 717 | ||
Claims and settlements | (925 | ) | |
Foreign exchange impact | (7 | ) | |
Balance at December 31, 2016 | 878 | ||
Charged to cost of revenue | 723 | ||
Claims and settlements | (695 | ) | |
Foreign exchange impact | 25 | ||
Balance at December 31, 2017 | $ | 931 | |
60
(6) Goodwill and Intangible Assets
Goodwill as of December 31, 2017 and December 31, 2016 was as follows (in thousands):
December 31, 2017 | December 31, 2016 | ||||||
Beginning balance | $ | 3,977 | $ | 693 | |||
Goodwill from Merger | — | 2,820 | |||||
Correction of errors | — | 464 | |||||
Less: accumulated impairment | — | — | |||||
Ending balance | $ | 3,977 | $ | 3,977 | |||
The Company did not recognize impairment loss on goodwill during the years ended December 31, 2017, 2016 or 2015 because no impairment triggers were identified during those years.
Intangible assets as of December 31, 2017 and December 31, 2016 were as follows (in thousands):
December 31, 2017 | |||||||||||||||||
Gross Carrying Amount | Accumulated Amortization | Government Grant | Net | ||||||||||||||
Developed Technology | $ | 3,060 | $ | (816 | ) | $ | — | $ | 2,244 | ||||||||
Customer Relationships | 5,240 | (699 | ) | — | 4,541 | ||||||||||||
Backlog | 2,179 | (2,179 | ) | — | — | ||||||||||||
Total intangible assets, net | $ | 10,479 | $ | (3,694 | ) | $ | — | $ | 6,785 | ||||||||
December 31, 2016 | |||||||||||||||||
Gross Carrying Amount | Accumulated Amortization | Government Grant | Net | ||||||||||||||
Developed Technology | $ | 3,060 | $ | (203 | ) | $ | — | $ | 2,857 | ||||||||
Customer Relationships | 5,240 | (321 | ) | — | 4,919 | ||||||||||||
Backlog | 2,179 | (1,236 | ) | — | 943 | ||||||||||||
Other | 105 | (34 | ) | (23 | ) | 48 | |||||||||||
Total intangible assets, net | $ | 10,584 | $ | (1,794 | ) | $ | (23 | ) | $ | 8,767 | |||||||
Amortization expense associated with intangible assets for the years ended December 31, 2017 and 2016 amounted to $1.9 million, and $1.8 million, respectively. Amortization of intangible assets in 2015 was $10,000. As of December 31, 2017, expected future amortization expense for the years indicated was as follows (in thousands):
Period | Expected Amortization Expense | |||
2018 | $ | 1,136 | ||
2019 | 1,136 | |||
2020 | 1,136 | |||
2021 | 932 | |||
2022 | 524 | |||
Thereafter | 1,921 | |||
Total | $ | 6,785 | ||
61
(7) Debt
Wells Fargo Bank Facility
As of December 31, 2017, the Company had a $25.0 million revolving line of credit and letter of credit facility (the "WFB Facility") with Wells Fargo Bank ("WFB"). Under the WFB Facility, the Company has the option of borrowing funds at agreed upon interest rates. The amount that the Company is able to borrow under the WFB Facility varies based on eligible accounts receivable and inventory, as defined in the WFB Facility, as long as the aggregate amount outstanding does not exceed $25.0 million less the amount committed as security for letters of credit. To maintain availability of funds under the WFB Facility, the Company pays a commitment fee on the unused portion. The commitment fee is 0.25% per annum and is recorded as interest expense.
As of December 31, 2017, the Company had no outstanding borrowings under its WFB Facility. Based on the Company's eligible accounts receivable and inventory and $2.3 million committed as security for letters of credit, the Company had $9.2 million of borrowing availability under the WFB Facility as of December 31, 2017. The amounts borrowed under the WFB Facility bear interest, payable monthly, at a floating rate equal to the three-month LIBOR plus a margin based on the Company's average excess availability (as calculated under the WFB Facility). The interest rate on the WFB Facility was 4.19% at December 31, 2017. The maturity date under the WFB Facility was March 31, 2019. Effective March 30, 2018, the Company and WFB amended the WFB Facility to extend the maturity date from March 31, 2019 to July 15, 2019.
The Company’s obligations under the WFB Facility are secured by substantially all of its personal property assets and those of its subsidiaries that guarantee the WFB Facility, including their intellectual property. The WFB Facility contains certain financial covenants, and customary affirmative covenants and negative covenants. If the Company defaults under the WFB Facility due to a covenant breach or otherwise, WFB may be entitled to, among other things, require the immediate repayment of all outstanding amounts and sell the Company’s assets to satisfy the obligations under the WFB Facility. As of December 31, 2017, the Company was in technical violation of covenants under the WFB Facility to pledge the stock of certain foreign subsidiaries and transfer certain funds to WFB bank accounts. On March 19, 2018, the Company executed an amendment with WFB which cured the breach.
Effective March 27, 2018, the Company and WFB modified the definition of Liquidity Trigger Event (as defined in the WFB Facility) from $10.0 million to $5.0 million on March 31, 2018 or $10.0 million for subsequent quarters. Effective March 30, 2018, the Company and WFB amended the WFB Facility to extend the maturity date from March 31, 2019 to July 15, 2019.
Bank and Trade Facilities - Foreign Operations
Certain of the Company's foreign subsidiaries have entered into various financing arrangements with foreign banks and other lending institutions consisting primarily of revolving lines of credit, trade facilities, term loans and export development loans. These facilities are renewed as they mature and are generally secured by a security interest in certain assets of the applicable foreign subsidiaries and supported by guarantees given by DNI or third parties. Payments under such facilities are made in accordance with the given lender’s amortization schedules.
62
As of December 31, 2017 and December 31, 2016, the Company had an aggregate outstanding balance of $22.8 million and $17.6 million, respectively, under such financing arrangements, and the interest rates per annum applicable to outstanding borrowings under these financing arrangements were as listed in the tables below (in thousands).
As of December 31, 2017 | |||||||||
Interest rate (%) | Amount | ||||||||
Industrial Bank of Korea | Credit facility | 2.89 ~ 3.26 | $ | 2,328 | |||||
Industrial Bank of Korea | Trade Finance | 4.47 ~ 5.97 | 2,401 | ||||||
Shinhan Bank | General loan | 5.91 | 2,987 | ||||||
Shinhan Bank | Trade finance | 3.90 ~ 4.14 | 3,050 | ||||||
NongHyup Bank (Korea) | Credit facility | 2.83 ~ 3.42 | 860 | ||||||
The Export-Import Bank of Korea | Export development loan | 3.20 ~ 3.28 | 7,570 | ||||||
Mitsubishi Bank (Japan) | SoftBank AR Factoring | 1.58 | 1,872 | ||||||
Shinhan Bank (India) | General loan | 8.70-8.90 | 1,709 | ||||||
$ | 22,777 | ||||||||
As of December 31, 2016 | |||||||||
Interest rate (%) | Amount | ||||||||
Industrial Bank of Korea | Credit facility | 2.16 - 2.76 | $ | 1,106 | |||||
Shinhan Bank | General loan | 4.08 | 3,310 | ||||||
Shinhan Bank | Trade finance | 3.28 - 3.44 | 1,752 | ||||||
NongHyup Bank (Korea) | Credit facility | 1.92 - 2.66 | 482 | ||||||
KEB Hana Bank | Comprehensive credit loan | 2.79 | 3,501 | ||||||
The Export-Import Bank of Korea | Export development loan | 3.10 | 7,448 | ||||||
$ | 17,599 | ||||||||
On March 27, 2018, DNS (a Korean-based, wholly-owned subsidiary of the Company) borrowed KRW6.5 billion ($6.0 million in USD) from DNI. The loan bears interest at a rate of 4.6% and is due on June 27, 2019.
On March 28, 2018, DNS (a wholly-owned subsidiary of the Company) and Shinhan Bank extended the term of their $3.0 million loan from March 30, 2018 to March 30, 2019. As such, the Company reclassed this debt to long-term as of December 31, 2017.
As of December 31, 2017, the Company had $3.2 million in outstanding borrowings and $6.3 million committed as security for letters of credit under the Company's $12.3 million credit facility with certain foreign banks.
(8) Executive Compensation
Il Yung Kim
In October 2017, we entered into an amended and restated employment agreement with Mr. Kim. This agreement has a term of three years expiring on October 10, 2020. Following the execution of this agreement, Mr. Kim was paid a one-time bonus of $100,000.
During the term, Mr. Kim will perform the responsibilities as President, Chief Executive Officer, reporting to the Board of Directors of the company, with such duties and responsibilities as are commensurate with such positions. Under the employment agreement, Mr. Kim’s annual salary is $400,000, and will be reviewed on at least an annual basis by the Compensation Committee. In addition, Mr. Kim is eligible to participate in a performance-based annual bonus program, to be earned and paid quarterly in equal installments. Mr. Kim’s target bonus is equal to 100% of his annual salary. The Company shall pay for or reimburse Mr. Kim for housing expenses up to maximum of $6,500 per month. In addition, in the event that Mr. Kim's employment is terminated, the Company will pay or reimburse Mr. Kim for up to an additional $30,000 in relocation expenses at such termination of his employment, unless he voluntarily resigns without "good reason" (as defined below). The relocation expenses to be provided to Mr. Kim will be grossed-up for taxes. Mr. Kim is also eligible to participate in all health
63
benefits, insurance programs, pension and retirement plans and other employee benefit and compensation arrangements generally available to our other officers.
Under Mr. Kim’s employment agreement, Mr. Kim will receive certain compensation in the event that his employment is terminated by us for any reason other than by reason of Mr. Kim’s death, disability, his termination for “cause” (as defined in the employment agreement), if Mr. Kim resigns for “good reason” (as defined in the employment agreement) or as a result of expiration of the term of his employment agreement (which we refer to as a Qualifying Termination). In the event of a Qualifying termination, Mr. Kim will be entitled to receive a lump sum payment equal to his annual salary as in effect immediately prior to the date of termination (or, if greater, $400,000) plus the sum of the bonuses earned in the four most recently completed quarters. In addition, in the event of Mr. Kim’s Qualifying Termination, the vesting and exercisability of his stock options will accelerate on the date of termination.
James Norrod
Mr. Norrod’s employment agreement had an initial term expiring on September 9, 2017.
Pursuant to the management transition in September 2017, Mr. Norrod stepped down from his position as Co-Chief Executive Officer and a director of the company effective September 11, 2017. Mr. Norrod entered into a release agreement in connection with his resignation from his management roles and employment with the company. Pursuant to his separation and release agreement, Mr. Norrod was paid $300,000 in 2017 plus up to six months of continued health benefits under COBRA. In addition the expiration date of Mr. Norrod's vested stock options was extended through September 11, 2018.
Michael Golomb
In December 2017, we entered into an employment agreement with Mr. Golomb. This agreement has a term of three years expiring on December 1, 2020.
During the term, Mr. Golomb will perform the responsibilities as Chief Financial Officer, Treasurer and Corporate Secretary reporting to the Chief Executive Officer of the company, with such duties and responsibilities as are commensurate with such positions. Under the employment agreement, Mr. Golomb’s annual salary is $300,000, and will be reviewed on at least an annual basis by the Compensation Committee. In addition Mr. Golomb received 130,000 stock options which vest over three years with one third vesting on the first anniversary and the remaining two thirds vesting monthly thereafter. After six months of employment, pending a recommendation by the CEO and approval by the Board of Directors, Mr. Golomb may be entitled to receive options to purchase up to 1% of the Company's then outstanding shares.
Under Mr. Golomb’s employment agreement, Mr. Golomb will receive certain compensation in the event that his employment is terminated by us for any reason other than by reason of Mr. Golomb’s death, disability, or his termination for “cause” (as defined in the employment agreement), or in the event of expiration of the term of his employment agreement (each of
which we refer to as a Qualifying Termination). In the event of a Qualifying Termination, including a Qualifying Termination following a change in control, Mr. Golomb will be entitled to receive a lump sum payment equal to his six months' base salary as in effect immediately prior to the date of termination (or, if greater, $150,000) and the vesting and exercisability of his stock options will accelerate on the date of termination.
Kirk Misaka
Pursuant to his separation and release agreement, the Company agreed to pay Mr. Misaka $232,500. Payment was made in March 2018. In addition the exercise date of Mr. Misaka vested stock options was extended through September 11, 2018.
(9) Stockholders’ Equity
(a) Overview
The Company’s equity capitalization consisted of 36.0 million authorized shares of common stock, of which 16.4 million were outstanding at December 31, 2017.
64
(b) Stock-Based Compensation
Prior to September 9, 2016, the date of the Merger, DNS did not have any stock-based compensation plans. The plan information described below represents stock-based compensation plans that were carried over from Legacy Zhone and were in effect as of December 31, 2016 and an additional stock-based compensation plan adopted by the Company in January 2017. As of December 31, 2017, the Company had one significant stock-based compensation plan related to equity compensation (including equity compensation in the form of stock options, restricted stock and restricted stock units) and one plan related to employee stock purchases.
The following table summarizes stock-based compensation expense for the year ended December 31, 2017 and 2016 (in thousands):
Year ended December 31, | ||||||
2017 | 2016 | |||||
Compensation expense relating to employee stock options, restricted stock units and restricted stock | $ | 902 | $ | 336 | ||
Stock Incentive Plans
The Company’s stock-based compensation plans are designed to attract, motivate, retain and reward employees, directors and consultants and align stockholder and employee interests.
The Company's former Amended and Restated 2001 Stock Incentive Plan (the 2001 Plan") expired in March 2017. The Board of Directors of the Company approved the DASAN Zhone Solutions, Inc. 2017 Incentive Award Plan (the "2017 Plan") on January 4, 2017, subject to stockholder approval at the Company’s 2017 annual meeting of stockholders. The Company's stockholders approved the 2017 Plan at the 2017 annual meeting of stockholders. The 2017 Plan authorizes the issuance of stock options, restricted stock, restricted stock units, dividend equivalents, stock payment awards, stock appreciation rights, performance bonus awards and other incentive awards. The 2017 Plan authorizes the grant of awards to employees, non-employee directors and consultants of the Company and its subsidiaries.
The maximum number of shares of the Company’s common stock for which grants may be made under the 2017 Plan is the sum of (i) 600,000 shares, plus (ii) any shares subject to awards granted under the 2001 Plan to the extent such shares become available for issuance under the 2017 Plan pursuant to its terms, plus (iii) any shares subject to an annual increase on each January 1 during the 10 year term of the 2017 Plan equal to the lesser of 4% of the total shares of the Company’s common stock outstanding (on an as-converted basis) and such smaller amount as may be determined by the Board of Directors in its sole discretion. The annual increase on January 1, 2018 was 656,410 shares. In addition, the following annual limitations apply: (i) the maximum aggregate number of shares of the Company’s common stock that may be subject to awards granted to any one participant during a calendar year is 4,000,000 shares and (ii) the maximum aggregate amount of cash that may be paid to any one participant during any calendar year with respect to awards initially payable in cash is $10 million. The number of shares of the Company’s common stock that may be issued or transferred pursuant to awards granted under the 2017 Plan shall not exceed an aggregate of 7,000,000.
The Company’s former 2001 Plan provided for the grant of incentive stock options, non-statutory stock options, restricted stock unit awards, restricted stock awards and other stock-based awards to officers, employees, directors and consultants of the Company, and expired in March 2017. Under the 2001 Plan, options were permitted to be granted at an exercise price less than, equal to or greater than the fair market value on the date of grant, except that any options granted to a 10% stockholder must have an exercise price equal to at least 110% of the fair market value of the Company’s common stock on the date of grant. The Board of Directors determined the term of each option, the option exercise price and the vesting terms. Stock options were generally granted at an exercise price equal to the fair market value on the date of grant, expiring seven to ten years from the date of grant and vesting over a period of four years.
The Company has estimated the fair value of stock-based payment awards on the date of grant using the Black Scholes pricing model, which is affected by the Company’s stock price as well as assumptions regarding a number of complex and subjective variables. These variables include the Company’s expected stock price volatility over the term of the awards, actual and projected employee option exercise behaviors, risk-free interest rate and expected dividends. The estimated expected term of options granted was determined based on historical option exercises. Estimated volatility was based on historical volatility and the risk free interest rate was based on U.S. Treasury yield in effect at the time of grant for the expected life of the options. The Company does not anticipate paying any cash dividends in the foreseeable future and therefore used an expected dividend yield of zero in the option valuation model. Forfeitures are recognized as they occur.
65
The weighted average assumptions used to value option grants for the year ended December 31, 2017 and 2016 are as follows:
Year ended December 31, | |||||
2017 | 2016 | ||||
Expected term (years) | 4.87 | 4.78 | |||
Expected volatility | 81.32 | % | 79.70 | % | |
Risk free interest rate | 1.92 | % | 1.14 | % | |
The weighted average grant date fair value of options granted during the years ended December 31, 2017 and December 31, 2016 were $3.90 and $4.08, respectively.
The following table sets forth the summary of option activity under the stock option program for the year ended December 31, 2017 (in thousands, except per share data):
Options Outstanding | Weighted Average Exercise Price (1) | Weighted Average Remaining Contractual Term | Aggregate Intrinsic Value | |||||||||
Outstanding as of December 31, 2016 | 787 | $ | 6.84 | |||||||||
Granted | 733 | 6.01 | ||||||||||
Canceled/Forfeited | (282 | ) | 6.57 | |||||||||
Exercised | (25 | ) | 4.91 | |||||||||
Outstanding as of December 31, 2017 | 1,213 | 6.50 | 7.83 | $ | 3,586 | |||||||
Vested and expected to vest at December 31, 2017 | 1,213 | 6.50 | 7.83 | 3,586 | ||||||||
Vested and exercisable at December 31, 2017 | 310 | 7.65 | 4.14 | 713 | ||||||||
The aggregate intrinsic value represents the total pretax intrinsic value, based on the Company’s closing stock price as of December 31, 2017 of $9.26, per share which would have been received by the option holders had the option holders exercised their options as of that date.
As of December 31, 2017, there was $3.2 million of unrecognized compensation costs which are expected to be recognized over a weighted average period of 2.8 years.
The following table sets forth the summary of option activity under the stock option program for the year ended December 31, 2016 (in thousands, except per share data):
Options Outstanding | Weighted Average Exercise Price (1) | Weighted Average Remaining Contractual Term | Aggregate Intrinsic Value | |||||||||
Outstanding as of December 31, 2015 | — | $ | — | |||||||||
Options assumed as part of the Merger | 265 | 8.68 | ||||||||||
Granted | 530 | 5.95 | ||||||||||
Canceled/Forfeited | (8 | ) | 11.75 | |||||||||
Exercised | — | — | ||||||||||
Outstanding as of December 31, 2016 | 787 | 6.84 | 8.56 | $ | 60 | |||||||
Vested and expected to vest at December 31, 2017 | 684 | 7.01 | 8.39 | 52 | ||||||||
Vested and exercisable at December 31, 2016 | 233 | 8.34 | 5.85 | 14 | ||||||||
66
(10) Net Income (Loss) Per Share
The following table sets forth the computation of basic and diluted net income (loss) per share (in thousands, except per share data):
Years ended December 31, | |||||||||||
2017 | 2016 | 2015 | |||||||||
Numerator: | |||||||||||
Net income (loss) attributable to DASAN Zhone Solutions, Inc. | $ | 1,071 | $ | (15,326 | ) | $ | (3,339 | ) | |||
Denominator: | |||||||||||
Weighted average number of shares outstanding: | |||||||||||
Basic (1) | 16,383 | 11,637 | 9,314 | ||||||||
Effect of dilutive securities: | |||||||||||
Stock options, restricted stock units and share awards | 13 | — | — | ||||||||
Diluted (1) | 16,396 | 11,637 | 9,314 | ||||||||
Net income (loss) per share attributable to DASAN Zhone Solutions Inc.: | |||||||||||
Basic (1) | $ | 0.07 | $ | (1.32 | ) | $ | (0.36 | ) | |||
Diluted (1) | $ | 0.07 | $ | (1.32 | ) | $ | (0.36 | ) | |||
(1) Amount presented has been adjusted to reflect the one-for-five reverse stock split effected on February 28, 2017.
The following tables set forth potential common stock that is not included in the diluted net income (loss) per share calculation above because their effect would be anti-dilutive for the periods indicated (in thousands, except exercise price per share data):
2017 | Weighted average option exercise price | 2016 | Weighted average option exercise price | ||||||||||
Outstanding stock options, restricted stock units and unvested restricted shares | 1,037 | $ | 8.93 | 796 | $ | 6.84 | |||||||
As of December 31, 2017, 2016 and 2015, no shares of issued common stock were subject to repurchase.
67
(11) Income Taxes
The following is a summary of the components of income tax expense applicable to loss before income taxes (in thousands):
Years ended December 31, | |||||||||||
2017 | 2016 | 2015 | |||||||||
Current: | |||||||||||
Federal | $ | (86 | ) | $ | — | $ | — | ||||
State | 17 | (9 | ) | — | |||||||
Foreign | 912 | 88 | 318 | ||||||||
Total current tax expense | $ | 843 | $ | 79 | $ | 318 | |||||
Deferred: | |||||||||||
Federal | $ | (12 | ) | $ | — | $ | — | ||||
State | — | — | — | ||||||||
Foreign | (2,903 | ) | 1,408 | (86 | ) | ||||||
Total deferred tax expense | $ | (2,915 | ) | $ | 1,408 | $ | (86 | ) | |||
Total tax expense | $ | (2,072 | ) | $ | 1,487 | $ | 232 | ||||
A reconciliation of the expected tax expense (benefit) to the actual tax expense is as follows (in thousands):
Years ended December 31, | |||||||||||
2017 | 2016 | 2015 | |||||||||
Expected tax expense (benefit) at statutory rate (34%) | $ | (306 | ) | $ | (4,644 | ) | $ | (929 | ) | ||
State taxes, net of Federal effect | 4 | (348 | ) | — | |||||||
Foreign rate differential | (927 | ) | 391 | 328 | |||||||
Tax impact on US corporate income tax change | 5,287 | — | — | ||||||||
Valuation allowance | (4,555 | ) | 7,004 | 218 | |||||||
Permanent differences | 234 | 687 | 40 | ||||||||
Tax credit carry-forwards | (1,235 | ) | (896 | ) | (674 | ) | |||||
Tax on accumulated earnings from prior year | — | 29 | 1,348 | ||||||||
Tax paid to overseas jurisdictions | — | 71 | — | ||||||||
Tax expense adjustments after tax return for prior period | (574 | ) | (837 | ) | — | ||||||
Foreign currency translation | — | 124 | — | ||||||||
Other | — | (94 | ) | (99 | ) | ||||||
Total tax expense | $ | (2,072 | ) | $ | 1,487 | $ | 232 | ||||
Deferred income taxes reflect the net tax effects of temporary differences between the carrying amounts of assets and liabilities for financial reporting and income tax purposes. Significant components of the Company’s deferred tax assets and liabilities as of December 31, 2017 and 2016 are as follows (in thousands):
2017 | 2016 | ||||||
Deferred tax assets: | |||||||
Net operating loss, capital loss, and tax credit carryforwards | $ | 11,945 | $ | 14,243 | |||
Reduction of gross deferred tax assets due to built-in loss limitation | (678 | ) | (4,402 | ) | |||
Fixed assets and intangible assets | 2,158 | 3,775 | |||||
Inventory and other reserves | 3,516 | 4,573 | |||||
Other | 2,279 | 2,661 | |||||
Gross deferred tax assets | 19,220 | 20,850 | |||||
Less valuation allowance | (16,266 | ) | (20,850 | ) | |||
Total net deferred tax assets | $ | 2,954 | $ | — | |||
68
For the years ended December 31, 2017 and 2016, the net changes in the valuation allowance were a decrease of $4.6 million and increase of $19.4 million, respectively. The decrease during 2017 was mainly due to the release of valuation allowance against the Company's net deferred tax assets in Korea. Management determined that it is more likely than not that the net deferred tax assets will be realized in this tax jurisdiction. The Company maintains a valuation allowance on its U.S. net deferred tax assets, with the exception of its alternative minimum tax credit carryforward, which is anticipated to be refundable.
As of December 31, 2017, the Company had net operating loss carryforwards for federal and state income tax purposes of approximately $28.8 million and $47.2 million, respectively. The federal losses begin to expire in 2025. The state losses begin to expire in 2018.
As of December 31, 2017, the Company had research credit carryforwards of approximately $0.4 million, $0.5 million, and $1.6 million for federal, state, and foreign income tax purposes, respectively. If not utilized, the federal carryforward will expire in various amounts beginning in 2036. The state credit can be carried forward indefinitely. If not utilized, the foreign credit carryforward will expire in 2021.
On December 22, 2017, President Trump signed the Tax Cuts and Jobs Act (the “Act”) into law. The new legislation decreases the U.S. corporate federal income tax rate from 35% to 21% effective January 1, 2018. The reduction in tax rate resulted in a $5.3 million reduction in net deferred tax assets. There was no impact on recorded deferred tax balances as the remeasurement of net deferred tax assets was offset by a change in valuation allowance. The Act imposes a one-time deemed repatriation tax on undistributed foreign earnings. The Company did not have a deemed repatriation due to its foreign earnings deficits. The Act also includes a number of other provisions including the elimination of loss carrybacks, limitations on the use of future losses, repeal of the Alternative Minimum Tax regime, and the introduction of a base erosion and anti-abuse tax. These provisions are not expected to have immediate effect on the Company.
The Securities and Exchange Commission issued Staff Accounting Bulletin No. 118 (“SAB 118”) on December 23, 2017 which provides a one–year measurement period from a registrant’s reporting period that includes the Act’s enactment date to allow the registrant sufficient time to obtain, prepare and analyze information to complete the accounting required under ASC 740. While the Company was able to make reasonable estimates under SAB 118 for the impact of the reduction in corporate rate and the deemed repatriation transition tax, the Company has not completed its analysis for other changes from the Act, including accounting for global-intangible-low-tax income. The final impacts of the Act may differ from the above estimates, possibly materially, due to, among other things, changes in interpretations of the Act, any legislative action to address questions that arise because of the Act, any changes in accounting standards for income taxes or related interpretations in response to the Act, or any updates or changes to estimates the company has utilized under SAB 118. The Company will continue to analyze the impact of the Act as additional information and guidance is provided and complete our analysis within the measurement period in accordance with SAB 118.
Pursuant to Sections 382 and 383 of the Code, annual use of the Company's net operating losses and tax credit carryforwards may be limited in the event a cumulative change in ownership of more than 50% occurs within a three-year-period. The Company had an ownership change in September 2016, which resulted in an annual limitation on the amount of net operating losses and tax credit carryforwards which arose prior to that date that the Company can utilize.
The Company does not intend to distribute the foreign earnings from its foreign subsidiaries and has not recorded any deferred taxes related to such amounts. The Company considers the remaining excess of the amount for financial reporting over the tax basis of our investments in our foreign subsidiaries to be indefinitely reinvested and the determination of any deferred tax liability on this amount is not practicable.
In accordance with ASC 740 the Company is require to inventory, evaluate, and measure all uncertain tax positions taken or to be taken on tax returns, and to record liabilities for the amount of such positions that may not be sustained, or may only be partially sustained, upon examination by the relevant taxing authorities. At December 31, 2017, the Company had gross unrecognized tax benefits of $0.4 million, none of which if recognized, would reduce the effective tax rate in a future period, due to the Company's full valuation allowance on U.S. net deferred tax assets.
69
A reconciliation of the beginning and ending unrecognized tax benefit amounts for 2017 and 2016 are as follows (in thousands):
Balance at December 31, 2015 | $ | — | |
Increases related to current year tax positions | 77 | ||
Balance at December 31, 2016 | 77 | ||
Increases related to prior year tax positions | 17 | ||
Increases related to current year tax positions | 286 | ||
Balance at December 31, 2017 | $ | 380 | |
It is the Company's policy to account for interest and penalties related to uncertain tax positions as interest expense and general administrative expense, respectively in its statement of operations. The Company did not record any interest and penalty (benefit) expense during the year ended December 31, 2017 and 2016.
The Company or one of its subsidiaries files income tax returns in the U.S. federal jurisdiction, and various state and foreign jurisdictions. The open tax years for the major jurisdictions are as follows:
• Federal | 2014 - 2017 |
• California and Canada | 2013 - 2017 |
• Brazil | 2012 - 2017 |
• Germany | 2013 - 2017 |
• Japan | 2012 - 2017 |
• Korea | 2015 - 2017 |
• United Kingdom | 2014 - 2017 |
• Vietnam | 2016 - 2017 |
However, due to the fact the Company had net operating losses and credits carried forward in most jurisdictions, certain items attributable to technically closed years are still subject to adjustment by the relevant taxing authority through an adjustment to tax attributes carried forward to open years.
The Company is not currently under examination for income taxes in any material jurisdiction.
(12) Non-Controlling Interests
Non-controlling interests were as follows (in thousands):
Years Ended December 31, | ||||||||
2017 | 2016 | |||||||
Beginning non-controlling interests | $ | 416 | $ | 138 | ||||
Acquisition of additional interest in a subsidiary | — | 277 | ||||||
Net income (loss) attributable to non-controlling interests | 102 | (2 | ) | |||||
Foreign currency translation adjustments (Other Comprehensive Income) | 16 | 3 | ||||||
Ending non-controlling interests | $ | 534 | $ | 416 | ||||
(13) Related Party Transactions
Related Party Acquisitions
On December 31, 2017, DNS (a wholly owned subsidiary of the Company) acquired 100% and 99.99% of the common stock of D-Mobile Limited (“D-Mobile”) and DASAN India Private Limited (DASAN India), respectively, from DNI. D-Mobile and DASAN India are resellers of the Company's products in Taiwan and India, respectively. The consideration payable by the Company to DNI for the common stock is the net book value of D-Mobile and DASAN India at December 31, 2017, subject to final adjustments. The net book value of D-Mobile and DASAN India was an aggregate of $0.8 million. These transactions
70
were accounted for by the Company as common control transactions, with the net assets transferred recorded at historical cost. The transactions did not result in a change in reporting entity and hence were accounted for prospectively.
Related Party Debt
In connection with the Merger, on September 9, 2016, the Company entered into a loan agreement with DNI for a $5.0 million unsecured subordinated term loan facility. Under the loan agreement, the Company was permitted to request drawdowns of one or more term loans in an aggregate principal amount not to exceed $5.0 million. As of December 31, 2017, $5.0 million in term loans was outstanding under the facility. Such term loans mature in September 2021 and are pre-payable at any time by the Company without premium or penalty. The interest rate as of December 31, 2017 under this facility was 4.6% per annum.
In addition, the Company borrowed $1.8 million from DNI for capital investment in February 2016, which amount was outstanding as of December 31, 2017. This loan was due to mature in March 2018 with an option of renewal by mutual agreement, and bore interest at a rate of 4.6% per annum, payable annually. Effective February 27, 2018, the Company and DNI amended the terms of this loan to extend the repayment date from March 2018 to July 2019 and maintain an interest rate of 4.6% (see Note 19, Subsequent Events).
On March 27, 2018, DNS (a Korean-based, wholly-owned subsidiary of the Company) borrowed KRW6.5 billion ($6.0 million in USD) from DNI. The loan bears interest at a rate of 4.6% and is due on June 27, 2019 (see Note 19, Subsequent Events).
On June 23, 2017, the Company borrowed $3.5 million from Solueta, an affiliate of DNI. This loan was repaid in November 2017 and bore interest at a rate of 4.6% per annum, payable monthly.
Interest expense on these related party borrowings was $0.3 million in 2017 and $0.1 million in 2016.
Other Related Party Transactions
Sales and Purchases to and from Related Parties
Sales and purchases, cost of revenue, research and product development, selling, marketing, general and administrative and other income and expenses to and from related parties for the years ended December 31, 2017, 2016 and 2015 were as follows (in thousands):
For the year ended December 31, 2017 | ||||||||||||||||||||||||||
Counterparty | DNI direct ownership interest | Sales | Cost of revenue | Manufacturing (Cost of revenue) | Research and product development | Selling, marketing, general and administrative | Other expenses | |||||||||||||||||||
DNI (Parent Company) | N/A | $ | 16,559 | $ | 14,020 | $ | — | $ | — | $ | 4,502 | $ | 223 | |||||||||||||
Tomato Soft Ltd. | 100% | — | — | 140 | 246 | — | — | |||||||||||||||||||
Tomato Soft (Xi'an) Ltd. | 100% | — | — | — | 448 | 37 | — | |||||||||||||||||||
CHASAN Networks Co., Ltd. | 100% | — | — | 810 | 98 | — | — | |||||||||||||||||||
D-Mobile | N/A | 4,316 | 2,769 | — | — | 427 | — | |||||||||||||||||||
DASAN FRANCE | 100% | 2,168 | 2,006 | — | — | 383 | — | |||||||||||||||||||
HANDYSOFT, Inc. | 17.63% | 88 | 24 | — | — | 6 | 4 | |||||||||||||||||||
J-Mobile Corporation | 90.47% | 8 | — | — | — | 132 | — | |||||||||||||||||||
DASAN INDIA Private Limited | N/A | 8,245 | 6,461 | — | — | 30 | — | |||||||||||||||||||
Fine Solution | 100% | — | — | — | — | 4 | — | |||||||||||||||||||
Solueta | 27.21% | — | — | — | — | — | 3 | |||||||||||||||||||
$ | 31,384 | $ | 25,280 | $ | 950 | $ | 792 | $ | 5,521 | $ | 230 | |||||||||||||||
71
For the year ended December 31, 2016 | ||||||||||||||||||||||||||||||
Counterparty | DNI ownership interest | Sales | Cost of revenue | Manufacturing (Cost of revenue) | Research and product development | Selling, marketing, general and administrative | Other income | Other expenses | ||||||||||||||||||||||
DNI (Parent Company) | N/A | $ | 21,214 | $ | 18,173 | $ | — | $ | — | $ | 5,079 | $ | — | $ | 389 | |||||||||||||||
ABLE | 61.99% | 50 | — | — | — | — | — | — | ||||||||||||||||||||||
CHASAN Networks Co., Ltd. | 100% | — | — | 720 | 149 | — | — | — | ||||||||||||||||||||||
DASAN France | 100% | 19 | 18 | — | — | — | — | |||||||||||||||||||||||
DASAN INDIA Private Limited | 99.99% | 2,710 | 2,080 | — | — | — | — | — | ||||||||||||||||||||||
DMC | 100% | 1 | 1 | — | — | — | — | — | ||||||||||||||||||||||
D-Mobile | 100% | 4,431 | 3,610 | — | — | 421 | — | — | ||||||||||||||||||||||
DTS | 81.56% | — | — | — | — | — | 1 | — | ||||||||||||||||||||||
HANDYSOFT, Inc. | 17.64% | 155 | 136 | — | — | — | — | |||||||||||||||||||||||
J-Mobile Corporation | 68.56% | 54 | — | — | — | 634 | 25 | — | ||||||||||||||||||||||
PANDA Media, Inc. | 90% | — | — | — | — | 2 | — | 1 | ||||||||||||||||||||||
Tomato Soft (Xi'an) Ltd. | 100% | — | — | — | 750 | — | — | — | ||||||||||||||||||||||
$ | 28,634 | $ | 24,018 | $ | 720 | $ | 899 | $ | 6,136 | $ | 26 | $ | 390 | |||||||||||||||||
For the year ended December 31, 2015 | ||||||||||||||||||||||||||||||
Counterparty | DNI Ownership Interest | Sales | Cost of revenue | Manufacturing (Cost of revenue) | Research and product development | Selling, marketing, general and administrative | Other income | Other expenses | ||||||||||||||||||||||
DNI (Parent Company) | N/A | $ | 23,365 | $ | 19,822 | $ | — | $ | — | $ | 7,230 | $ | 24 | $ | 363 | |||||||||||||||
CHASAN Networks Co., Ltd. | 100% | — | — | 731 | 358 | — | — | — | ||||||||||||||||||||||
DASAN RND Co., LTD | 100% | — | — | — | — | 605 | — | — | ||||||||||||||||||||||
D-Mobile | 100% | — | — | — | — | 91 | — | — | ||||||||||||||||||||||
HANDYSOFT, Inc. | 17.64% | 1,410 | 1,337 | — | — | — | — | 184 | ||||||||||||||||||||||
J-Mobile Corporation | 68.56% | — | — | — | — | 1,511 | 15 | — | ||||||||||||||||||||||
Tomato Soft (Xi'an) Ltd. | 100% | — | — | — | 631 | — | — | — | ||||||||||||||||||||||
$ | 24,775 | $ | 21,159 | $ | 731 | $ | 989 | $ | 9,437 | $ | 39 | $ | 547 | |||||||||||||||||
The Company has entered into sales agreements with DNI and certain of its subsidiaries. Sales and cost of revenue to DNI, DASAN France, DASAN INDIA Private Limited, and D-Mobile represent finished goods produced by the Company that are sold to these related parties who sell the Company's products in Korea, France, India and Taiwan, respectively. As discussed above, on December 31, 2017 DNS acquired DASAN India Private Limited and D-Mobile from DNI.
The Company has entered into an agreement with CHASAN Networks Co., Ltd. to provide manufacturing and research and development services for the Company. Under the agreement with CHASAN Networks., Ltd., the Company is charged a cost plus 7% fee for the manufacturing and development of certain deliverables.
The Company has entered into an agreement with Tomato Soft (Xi'an) Ltd. to provide research and development services for the Company. Under the agreement with Tomato Soft (Xi'an) Ltd., the Company is charged an expected annual fee of $0.8 million for the development of certain deliverables.
Prior to the Merger, as DNS was then a wholly owned subsidiary of DNI, DNI had sales agreements with certain customers on DNS' behalf. Since the Merger, due to these prior sales agreements, the Company has entered into an agreement with DNI in which DNI acts as a sales channel to these customers. Sales to DNI necessary for DNI to fulfill agreements with its customers are recorded net of royalty fees in related party revenue.
The Company shares office space with DNI and certain of DNI's subsidiaries. Prior to the Merger, DNS, then a wholly owned subsidiary of DNI, shared human resources, treasury and other administrative support with DNI. As such, the Company entered into certain service sharing agreements with DNI and certain of its subsidiaries for the shared office space and shared administrative services. Expenses related to rent and administrative services are allocated to the Company based on square footage occupied and headcount, respectively.
72
Other income from J-Mobile Corporation represents interest income earned on a loan receivable from J-Mobile Corporation. The loan receivable was issued for the amount of $0.5 million and earned an interest rate of 6.9% per annum. The loan receivable was scheduled to mature on July 1, 2020, but was fully paid off on September 3, 2016.
Other expenses to related parties represent expenses to DNI for its payment guarantees relating to the Company's borrowings. The Company pays DNI a guarantee fee which is calculated as 0.9% of the guaranteed amount.
Balances of Receivables and Payables with Related Parties
Balances of receivables and payables arising from sales and purchases of goods and services with related parties as of December 31, 2017 and 2016 were as follows (in thousands):
As of December 31, 2017 | ||||||||||||||||||||||||||||||
Counterparty | DNI Ownership Interest | Account receivables | Other receivables | Deposits for lease* | Long-term debt | Accounts payable | Other payables | Accrued and other current liabilities** | ||||||||||||||||||||||
DNI (parent company) | N/A | $ | 12,576 | $ | 93 | $ | 786 | $ | 6,800 | $ | 1,264 | $ | 1,859 | $ | 59 | |||||||||||||||
Tomato Soft Ltd. | 100% | — | — | — | — | — | 18 | — | ||||||||||||||||||||||
Tomato Soft (Xi'an) Ltd. | 100% | — | — | — | — | — | 54 | — | ||||||||||||||||||||||
D-Mobile | 100% | — | — | — | — | — | — | — | ||||||||||||||||||||||
ABLE | 94.57% | — | — | — | — | — | — | — | ||||||||||||||||||||||
DASAN France | 100% | 870 | 71 | — | — | — | — | — | ||||||||||||||||||||||
HANDYSOFT, Inc. | 17.63% | 52 | — | — | — | — | — | — | ||||||||||||||||||||||
CHASAN Networks Co., Ltd. | 100% | — | — | — | — | 87 | — | — | ||||||||||||||||||||||
Solueta | 100% | — | — | — | — | — | 25 | — | ||||||||||||||||||||||
$ | 13,498 | $ | 164 | $ | 786 | $ | 6,800 | $ | 1,351 | $ | 1,956 | $ | 59 | |||||||||||||||||
As of December 31, 2016 | ||||||||||||||||||||||||||
Counterparty | DNI Ownership Interest | Account receivables | Other receivables | Deposits for lease* | Long-term debt | Accounts payable | Other payables | |||||||||||||||||||
DNI (Parent Company) | N/A | $ | 6,679 | $ | 171 | $ | 690 | $ | 6,800 | $ | 1,613 | $ | 7,028 | |||||||||||||
ABLE | 61.99% | 53 | — | 9 | — | — | — | |||||||||||||||||||
DASAN France | 100% | 23 | — | — | — | — | — | |||||||||||||||||||
DASAN INDIA Private Limited | 99.99% | 2,606 | — | — | — | — | — | |||||||||||||||||||
D-Mobile | 100% | 3,943 | — | — | — | — | ||||||||||||||||||||
HANDYSOFT, Inc. | 17.64% | 2 | — | — | — | — | — | |||||||||||||||||||
J-Mobile Corporation | 68.56% | 5 | — | — | — | — | — | |||||||||||||||||||
Tomato Soft Ltd. | 100% | — | — | — | — | — | 16 | |||||||||||||||||||
Tomato Soft (Xi'an) Ltd. | 100% | — | — | — | — | 70 | 63 | |||||||||||||||||||
$ | 13,311 | $ | 171 | $ | 699 | $ | 6,800 | $ | 1,683 | $ | 7,107 | |||||||||||||||
* Included in other assets related to deposits for lease in the consolidated balance sheets as of December 31, 2017 and 2016.
**Included in accrued and other liabilities in the consolidated balance sheet as of December 31, 2017.
73
(14) Commitments and Contingencies
Operating Leases
The Company has entered into operating leases for certain office space and equipment, some of which contain renewal options and escalation clauses. Estimated future lease payments under all non-cancellable operating leases with terms in excess of one year, including taxes and service fees, are as follows (in thousands):
Minimum Future Lease Payments | |||
Year ending December 31: | |||
2018 | $ | 3,794 | |
2019 | 2,928 | ||
2020 | 2,844 | ||
2021 | 2,590 | ||
2022 | 2,664 | ||
Thereafter | 8,423 | ||
Total minimum lease payments | $ | 23,243 | |
Performance Bonds
In the normal course of operations, from time to time, the Company arranges for the issuance of various types of surety bonds, such as bid and performance bonds, which are agreements under which the surety company guarantees that the Company will perform in accordance with contractual or legal obligations. As of December 31, 2017, the Company had $2.5 million of surety bonds guaranteed by third parties.
Purchase Commitments
The Company has agreements with various contract manufacturers which include non-cancellable inventory purchase commitments. The Company’s inventory purchase commitments typically allow for cancellation of orders 30 days in advance of the required inventory availability date as set by the Company at time of order. The amount of non-cancellable purchase commitments outstanding, net of reserve, was $8.0 million as of December 31, 2017.
Payment Guarantees Provided by Third Parties and DNI
The following table sets forth payment guarantees of the Company's indebtedness and other obligations as of December 31, 2017 that have been provided by third parties and DNI. DNI owns approximately 58% of the outstanding shares of our common stock.
74
Guarantor | Amount Guaranteed (in thousands) | Description of Obligations Guaranteed | ||||
DNI | $ | 3,584 | Borrowings from Shinhan Bank | |||
DNI | 1,792 | Purchasing card from Shinhan Bank | ||||
DNI | 10,640 | Letter of credit from Industrial Bank of Korea | ||||
DNI | 6,000 | Letter of credit from NongHyup Bank | ||||
DNI | 560 | Purchasing card from NongHyup Bank | ||||
DNI | 6,368 | Borrowings from Export-Import Bank of Korea | ||||
Industrial Bank of Korea | 6,221 | Letter of credit | ||||
Industrial Bank of Korea | 284 | Letter of credit (local) | ||||
NongHyup Bank | 2,983 | Letter of credit | ||||
Shinhan Bank | 330 | Purchasing card | ||||
Industrial Bank of Korea | 1,806 | Performance bonds | ||||
KEB Hana Bank | 34 | Performance bonds | ||||
State Bank of India | 39 | Performance bonds | ||||
Seoul Guarantee Insurance Co. | 594 | Performance payment guarantee* | ||||
$ | 41,235 | |||||
*The Company is responsible for the warranty liabilities generally for the period of two years regarding major product sales and have contracted surety insurance over part of the warranty liabilities.
Royalties
The Company has certain royalty commitments associated with the shipment and licensing of certain products. Royalty expense is generally based on a dollar amount per unit shipped or a percentage of the underlying revenue and is recorded in cost of revenue.
(15) Litigation
On November 30, 2017, the Company settled a patent infringement claim asserted by TQ Delta LLC by entering into a patent license agreement with TQ Delta LLC. Under the terms of the agreement, the Company expensed $0.4 million in royalty payments in 2017 and will expense $1.0 million in royalty payment in 2018.
The Company is subject to various legal proceedings, claims and litigation arising in the ordinary course of business. While the outcome of these matters is currently not determinable, the Company records an accrual for legal contingencies that it has determined to be probable to the extent that the amount of the loss can be reasonably estimated. The Company does not expect that the ultimate costs to resolve these matters will have a material adverse effect on its consolidated financial position or results of operations. However, litigation is subject to inherent uncertainties, and unfavorable rulings could occur. If an unfavorable ruling were to occur, there exists the possibility of a material adverse impact on the results of operations of the period in which the ruling occurs, or future periods.
(16) Employee Benefit Plans
The Company maintains a 401(k) plan for its employees whereby eligible employees may contribute up to a specified percentage of their earnings, on a pretax basis, subject to the maximum amount permitted by the Internal Revenue Code. Under the 401(k) plan, the Company may make discretionary contributions. The 401(k) plan is a Legacy Zhone plan. The Company made no discretionary contributions to the plan in 2017 or 2016.
The Company also maintains a defined contribution plan for its employees in Korea. Under the defined contribution plan, the Company contributes 8.33% of an employee's gross salary into the plan every quarter.
(17) Enterprise-Wide Information
The Company is a global provider of network access solutions and communications equipment for service providers and enterprise networks. There are no segment managers who are held accountable for operations, operating results and plans for
75
levels or components below the Company unit level. Accordingly, the Company is considered to be in a single reporting segment and operating unit structure. The Company’s chief operating decision maker is the Company’s Chief Executive Officer, who reviews financial information presented on a consolidated basis accompanied by disaggregated information about revenues by geographic region for purposes of making operating decisions and assessing financial performance. The Company attributes revenue from customers to individual countries based on location shipped. The following summarizes required disclosures about geographical concentrations and revenue by products and services (in thousands):
Years ended December 31, | |||||||||||
2017 | 2016 | 2015 | |||||||||
Revenue by geography: | |||||||||||
United States | $ | 48,840 | $ | 16,872 | $ | 4,426 | |||||
Canada | 5,631 | 1,967 | 7 | ||||||||
Total North America | 54,471 | 18,839 | 4,433 | ||||||||
Latin America | 26,206 | 9,604 | 2,510 | ||||||||
Europe, Middle East, Africa | 30,768 | 13,611 | 9,383 | ||||||||
Korea | 81,533 | 77,979 | 114,676 | ||||||||
Other Asia Pacific | 54,136 | 30,271 | 8,194 | ||||||||
Total International | 192,643 | 131,465 | 134,763 | ||||||||
Total | $ | 247,114 | $ | 150,304 | $ | 139,196 | |||||
Years ended December 31, | |||||||||||
2017 | 2016 | 2015 | |||||||||
Revenue by products and services: | |||||||||||
Products | $ | 235,117 | $ | 142,238 | $ | 133,036 | |||||
Services | 11,997 | 8,066 | 6,160 | ||||||||
Total | $ | 247,114 | $ | 150,304 | $ | 139,196 | |||||
The Company's property and equipment, net of accumulated depreciation, were located in the following geographical areas as of December 31, 2017 and 2016 (in thousands):
As of December 31, | |||||||
2017 | 2016 | ||||||
United States | $ | 3,393 | $ | 4,094 | |||
Korea | 1,633 | 1,455 | |||||
Japan and Vietnam | 810 | 739 | |||||
Taiwan and India | 37 | — | |||||
$ | 5,873 | $ | 6,288 | ||||
76
(18) Quarterly Information (unaudited)
Year ended December 31, 2017 | |||||||||||||||
Q1 (1) | Q2 (1) | Q3 (1) | Q4 | ||||||||||||
(in thousands, except per share data) | |||||||||||||||
Net revenue | $ | 52,112 | $ | 59,941 | $ | 66,438 | $ | 68,623 | |||||||
Gross profit | 17,792 | 19,189 | 22,073 | 22,315 | |||||||||||
Operating income (loss) | (2,529 | ) | (803 | ) | 1,661 | 2,393 | |||||||||
Net income (loss) | (3,498 | ) | (874 | ) | 1,387 | 4,157 | |||||||||
Net income (loss) attributable to non-controlling interest | 249 | (65 | ) | (12 | ) | (70 | ) | ||||||||
Net income (loss) attributable to DASAN Zhone Solutions, Inc. | (3,747 | ) | (809 | ) | 1,399 | 4,227 | |||||||||
Net income (loss) per share attributable to DASAN Zhone Solutions, Inc.: | |||||||||||||||
Basic | $ | (0.23 | ) | $ | (0.05 | ) | $ | 0.09 | $ | 0.26 | |||||
Diluted | $ | (0.23 | ) | $ | (0.05 | ) | $ | 0.09 | $ | 0.26 | |||||
Weighted-average shares outstanding: | |||||||||||||||
Basic | 16,378 | 16,380 | 16,382 | 16,391 | |||||||||||
Diluted | 16,378 | 16,380 | 16,382 | 16,445 | |||||||||||
Year ended December 31, 2016 | |||||||||||||||
Q1 | Q2 | Q3(1) | Q4(1) | ||||||||||||
(in thousands, except per share data) | |||||||||||||||
Net revenue | $ | 25,340 | $ | 34,252 | $ | 31,240 | $ | 59,472 | |||||||
Gross profit | 4,611 | 9,002 | 9,300 | 18,034 | |||||||||||
Operating loss | (4,341 | ) | (165 | ) | (5,114 | ) | (3,429 | ) | |||||||
Net loss | (3,761 | ) | (533 | ) | (4,789 | ) | (6,245 | ) | |||||||
Net income (loss) attributable to non-controlling interest | 6 | 33 | (56 | ) | 15 | ||||||||||
Net loss attributable to DASAN Zhone Solutions, Inc. | (3,767 | ) | (566 | ) | (4,733 | ) | (6,260 | ) | |||||||
Net loss per share attributable to DASAN Zhone Solutions, Inc.: | |||||||||||||||
Basic | $ | (0.40 | ) | $ | (0.06 | ) | $ | (0.42 | ) | $ | (0.38 | ) | |||
Diluted | $ | (0.40 | ) | $ | (0.06 | ) | $ | (0.42 | ) | $ | (0.38 | ) | |||
Weighted-average shares outstanding: | |||||||||||||||
Basic | 9,493 | 9,493 | 11,139 | 16,375 | |||||||||||
Diluted | 9,493 | 9,493 | 11,139 | 16,375 | |||||||||||
(1)Results include the operating results of Legacy Zhone from and after September 9, 2016.
(19) Subsequent Events
In February 2016, the Company borrowed $1.8 million from DNI for capital investment, which amount was outstanding as of December 31, 2017. This loan was due to mature in March 2018 with an option of renewal by mutual agreement, and bore interest at a rate of 4.6% per annum, payable annually. Effective February 27, 2018, the Company amended the terms of this loan to extend the repayment date from March 2018 to July 2019 and maintain an interest rate of 4.6%.
On March 27, 2018, DNS (a Korean-based, wholly-owned subsidiary of the Company) borrowed KRW6.5 billion ($6.0 million in USD) from DNI. The loan bears interest at a rate of 4.6% and is due on June 27, 2019.
Effective March 27, 2018, the Company and WFB modified the definition of Liquidity Trigger Event (as defined in the WFB Facility) from $10.0 million to $5.0 million on March 31, 2018 or $10.0 million for subsequent quarters. Effective March 30, 2018, the Company and WFB amended the WFB Facility to extend the maturity date from March 31, 2019 to July 15, 2019.
77
On March 28, 2018, DNS and Shinhan Bank extended the term of their $3.0 million loan from March 30, 2018 to March 30, 2019. As such, the Company reclassed this debt to long-term as of December 31, 2017.
ITEM 9. CHANGES IN AND DISAGREEMENTS WITH ACCOUNTANTS ON ACCOUNTING AND FINANCIAL DISCLOSURE
The information required by this Item 9 and Item 304(a) of Regulations S-K was previously reported in our Current Reports on Form 8-K filed on October 17, 2016 and December 2, 2016.
ITEM 9A. CONTROLS AND PROCEDURES
Evaluation of Disclosure Controls and Procedures
We maintain disclosure controls and procedures designed to provide reasonable assurance that information required to be disclosed in our reports filed or submitted pursuant to the Securities Exchange Act of 1934 (the Exchange Act) is recorded, processed, summarized and reported within the time periods specified in the SEC’s rules and forms and that such information is accumulated and communicated to our management, including our Chief Executive Officer and Chief Financial Officer, as appropriate to allow for timely decisions regarding required disclosures. In designing and evaluating the disclosure controls and procedures, management recognizes that any controls and procedures, no matter how well designed and operated, can provide only reasonable assurance of achieving the desired control objectives, and management applies its judgment in evaluating the cost-benefit relationship of possible controls and procedures.
As required by Rule 13a-15(b) of the exchange act, we conducted an evaluation of the effectiveness of the design and operation of our disclosure controls and procedures as of December 31, 2017, the end of the period covered by this report. The evaluation was done under the supervision and with the participation of management, including our Chief Executive Officer and our Chief Financial Officer. Based upon this evaluation, our Chief Executive Officer and Chief Financial Officer concluded that, because of the material weaknesses in our internal control over financial reporting described below under “Management’s Annual Report on Internal Control over Financial Reporting,” our disclosure controls and procedures were not effective as of December 31, 2017.
Management’s Annual Report on Internal Control over Financial Reporting
Our management is responsible for establishing and maintaining adequate internal control over financial reporting to provide reasonable assurance regarding the reliability of our financial reporting and the preparation of financial statements for external purposes in accordance with generally accepted accounting principles. Management assessed the effectiveness of our internal control over financial reporting as of December 31, 2017, the end of our fiscal year. In making this assessment, management used the criteria established in Internal Control - Integrated Framework (2013) issued by the Committee Sponsoring Organizations of the Treadway Commission (COSO). Based on our assessment of internal control over financial reporting, management has concluded that, as of December 31, 2017, our internal control over financial reporting, because of the unremediated material weaknesses in our internal control over financial reporting described below, was not effective.
A material weakness is a deficiency, or a combination of deficiencies, in internal control over financial reporting such that there is a reasonable possibility that a material misstatement of the registrant’s annual or interim financial statements will not be prevented or detected on a timely basis. Based on the results of the independent investigation and due to the incorrect application of generally accepted accounting principles that resulted in material misstatements and a restatement of our unaudited condensed consolidated financial statements for the three and nine months ended September 30, 2016, management identified material weaknesses in our internal control over financial reporting as of December 31, 2016 which continue to exist at December 31, 2017. Specifically, we did not maintain an effective control environment as there was an insufficient complement of personnel with appropriate accounting knowledge, experience and competence, resulting in incorrect application of generally accepted accounting principles. This material weakness contributed to the following material weaknesses. We did not maintain effective controls over our financial close process. Also, we did not design and maintain effective controls over the review of supporting information to determine the completeness and accuracy of the accounting for complex transactions, specifically related to the business combination that occurred on September 9, 2016, which resulted in an incorrect application of generally accepted accounting principles that resulted in material misstatements and a restatement of our unaudited condensed consolidated financial statements for the three and nine months period ended September 30, 2016. Additionally, these material weaknesses could result in a misstatement in the financial statements that would result in a material misstatement in the annual or interim consolidated financial statements that would not be prevented or detected.
78
Remediation Plan for Material Weaknesses in Internal Control over Financial Reporting
As of the date of this report, we are re-assessing the design of our controls and modifying processes related to the accounting for significant and unusual transactions as well as enhancing monitoring and oversight controls in the application of applicable accounting guidance related to such transactions. In connection therewith, we have hired and we anticipate that we will hire additional accounting personnel with relevant skills, training and experience, and conduct further training of accounting and finance personnel.
Changes in Internal Control over Financial Reporting
There were no changes in our internal control over financial reporting that occurred during our last fiscal quarter that have materially affected, or are reasonably likely to materially affect, our internal control over financial reporting. Merger-related integration activities may lead us to modify certain internal controls in future periods.
Inherent Limitations on Effectiveness of Controls
Our management, including our Chief Executive Officer and Chief Financial Officer, does not expect that our disclosure controls and procedures or our internal control over financial reporting will prevent or detect all error and all fraud. A control system, no matter how well designed and operated, can provide only reasonable, not absolute, assurance that the control system’s objectives will be met. The design of a control system must reflect the fact that there are resource constraints, and the benefits of controls must be considered relative to their costs. Further, because of the inherent limitations in all control systems, no evaluation of controls can provide absolute assurance that misstatements due to error or fraud will not occur or that all control issues and instances of fraud, if any, within the Company have been detected. These inherent limitations include the realities that judgments in decision-making can be faulty and that breakdowns can occur because of simple error or mistake. Controls can also be circumvented by the individual acts of some persons, by collusion of two or more people, or by management override of the controls. The design of any system of controls is based in part on certain assumptions about the likelihood of future events, and there can be no assurance that any design will succeed in achieving its stated goals under all potential future conditions. Projections of any evaluation of controls effectiveness to future periods are subject to risks. Over time, controls may become inadequate because of changes in conditions or deterioration in the degree of compliance with policies or procedures.
ITEM 9B. OTHER INFORMATION
None.
79
PART III
ITEM 10. DIRECTORS, EXECUTIVE OFFICERS AND CORPORATE GOVERNANCE
EXECUTIVE OFFICERS
The information required in this item relating to our corporate governance, directors and nominees, and the compliance with Section 16(a) of the Securities Exchange Act of 1934 is included under the captions "Corporate Governance Principles and Board Matters," " Ownership of Securities" and "Proposal 1: Election of Directors" in our definitive Proxy Statement for the 2018 Annual Meeting of Stockholders and is incorporated herein by reference.
Information relating to our executive officers is included under the caption "Executive Officers" in Part I of this Annual Report on Form 10-K, pursuant to General Instruction G(3) of Form 10-K.
We have adopted a Code of Conduct and Ethics applicable to all of our employees, directors and officers (including our principal executive officer, principal financial officer, principal accounting officer and controller). The Code of Conduct and Ethics is designed to deter wrongdoing and to promote honest and ethical conduct and compliance with applicable laws and regulations. The full text of our Code of Conduct and Ethics is published on our website at http://dasanzhone.com/about/investor-relations/corporategovernance/http://dasanzhone.com/about/investorrelations/corporategovernance. We intend to disclose future amendments to certain provisions of our Code of Conduct and Ethics, or waivers of such provisions granted to executive officers and directors, on our website within four business days following the date of such amendment or waiver.
ITEM 11. EXECUTIVE COMPENSATION
The information required by this item is included under the captions "Executive Compensation," "Compensation Committee Report" and "Director Compensation" in our definitive Proxy Statement for the 2018 Annual Meeting of Stockholders and is incorporate herein by reference.
ITEM 12. SECURITY OWNERSHIP OF CERTAIN BENEFICIAL OWNERS AND MANAGEMENT AND RELATED STOCKHOLDER MATTERS
The information required by this item relating to security ownership of certain beneficial owners and management, and securities authorized for issuance under equity compensation plans is included under the captions "Ownership of Securities" and "Executive Compensation" in our definitive Proxy Statement for the 2018 Annual Meeting of Stockholders and is incorporated herein by reference.
ITEM 13. CERTAIN RELATIONSHIPS AND RELATED TRANSACTIONS, AND DIRECTOR INDEPENDENCE
The information required by this item is included under the captions "Certain Relationships and Related Transactions" in our definitive Proxy Statement for the 2018 Annual Meeting of Stockholders and is incorporated herein by reference.
ITEM 14. PRINCIPAL ACCOUNTING FEES AND SERVICES
The information required by this item is included under the caption “Proposal 2: Ratification of Appointment of Independent Registered Public Accounting Firm” in our definitive Proxy Statement for the 2018 Annual Meeting of Stockholders and is incorporated herein by reference.
80
PART IV
ITEM 15. EXHIBITS, FINANCIAL STATEMENT SCHEDULES
1. | Financial Statements |
The Index to Consolidated Financial Statements on page 42 is incorporated herein by reference as the list of financial statements required as part of this report.
2. | Exhibits |
ITEM 16. FORM 10-K SUMMARY
None.
81
EXHIBIT INDEX
Exhibit Number | Exhibit Description | Incorporated by Reference | Filed or Furnished Herewith | ||||||||
Form | File Number | Exhibit | Filing Date | ||||||||
3.1 | 10-K | 000-32743 | 3.1 | September 9, 2017 | |||||||
3.2 | 8-K | 000-32743 | 3.2 | September 12, 2016 | |||||||
10.1# | 8-K | 000-32743 | 10.1 | January 10, 2017 | |||||||
10.1.1# | 8-K | 000-32743 | 10.2 | January 10, 2017 | |||||||
10.1.2# | 10-K | 000-32743 | 10-1 | September 9, 2017 | |||||||
10.2 # | 8-K | 000-32743 | 10.6 | September 13, 2016 | |||||||
10.2.1# | 8-K | 000-32743 | 10.7 | September 13, 2016 | |||||||
10.2.2# | 8-K | 000-32743 | 10.2 | May 17, 2007 | |||||||
10.2.3# | 10-Q | 000-32743 | 10.3 | November 14, 2016 | |||||||
10.3# | 8-K | 000-32743 | 10.1 | May 17, 2006 | |||||||
10.4# | X | ||||||||||
10.5# | 10-Q | 000-32743 | 10.20 | May 14, 2004 | |||||||
10.6# | 10-Q | 000-32743 | 10.1 | August 9, 2012 | |||||||
10.7# | 10-Q | 000-32743 | 10.1 | November 8, 2013 | |||||||
10.8# | X | ||||||||||
10.9# | X | ||||||||||
82
Exhibit Number | Exhibit Description | Incorporated by Reference | Filed or Furnished Herewith | ||||||||
Form | File Number | Exhibit | Filing Date | ||||||||
10.10# | 8-K | 000-32743 | 10.2 | September 13, 2016 | |||||||
10.11# | 10-Q | 000-32743 | 10.2 | November 15, 2017 | |||||||
10.12# | 8-K | 000-32743 | 10.3 | September 13, 2016 | |||||||
10.13 | 10-Q | 000-32743 | 10.3 | November 15, 2017 | |||||||
10.14# | 8-K | 000-32743 | 10.4 | September 13, 2016 | |||||||
10.15# | 8-K | 000-32743 | 10.5 | September 13, 2016 | |||||||
10.16# | 8-K | 000-32743 | 10.1 | November 14, 2016 | |||||||
10.17# | 8-K | 000-32743 | 10.1 | April 5, 2016 | |||||||
10.18 | 8-K | 000-32743 | 10.1 | September 12, 2016 | |||||||
10.19 | 8-K | 000-32743 | 10.2 | September 12, 2016 | |||||||
10.20 | 8-K | 000-32743 | 10.3 | September 12, 2016 | |||||||
10.21 | 8-K | 000-32743 | 10.4 | September 12, 2016 | |||||||
83
Exhibit Number | Exhibit Description | Incorporated by Reference | Filed or Furnished Herewith | ||||||||
Form | File Number | Exhibit | Filing Date | ||||||||
10.22 | 10-K | 000-32743 | 10.16 | March 15, 2012 | |||||||
10.22.1 | 10-K | 000-32743 | 10.12.1 | March 15, 2013 | |||||||
10.22.2 | 8-K | 000-32743 | 10.1 | October 1, 2013 | |||||||
10.22.3 | 10-K | 000-32743 | 10.13.3 | March 5, 2014 | |||||||
10.22.4 | 10-K | 000-32743 | 10.14.4 | March 6, 2015 | |||||||
10.22.5 | 10-K | 000-32743 | 10.14.5 | March 23, 2016 | |||||||
84
Exhibit Number | Exhibit Description | Incorporated by Reference | Filed or Furnished Herewith | ||||||||
Form | File Number | Exhibit | Filing Date | ||||||||
10.22.6 | 8-K | 000-32743 | 10.5 | September 12, 2016 | |||||||
10.22.7 | 10-Q | 000-32743 | 10.15 | November 14, 2016 | |||||||
10.22.8 | X | ||||||||||
10.22.9 | 8-K | 000-32743 | 10.1 | May 9, 2017 | |||||||
10.22.10 | 8-K | 000-32743 | 10.2 | April 2, 2018 | |||||||
85
Exhibit Number | Exhibit Description | Incorporated by Reference | Filed or Furnished Herewith | ||||||||
Form | File Number | Exhibit | Filing Date | ||||||||
10.22.11 | 8-K | 000-32743 | 10.1 | July 6, 2017 | |||||||
10.22.12 | X | ||||||||||
10.23 | 10-K | 000-32743 | 10.17 | March 15, 2012 | |||||||
10.24 | 8-K | 000-32743 | 10.1 | February 23, 2016 | |||||||
10.24.1 | 10-Q | 000-32743 | 10.1 | August 9, 2016 | |||||||
10.25 | 8-K | 000-32743 | 10.1 | April 2, 2018 | |||||||
21.2 | X | ||||||||||
23.1 | X | ||||||||||
23.2 | X | ||||||||||
31.1 | X | ||||||||||
31.2 | X | ||||||||||
32.1 | X | ||||||||||
101.INS | XBRL Instance Document | X | |||||||||
86
Exhibit Number | Exhibit Description | Incorporated by Reference | Filed or Furnished Herewith | ||||||||
Form | File Number | Exhibit | Filing Date | ||||||||
101.SCH | XBRL Taxonomy Extension Schema | X | |||||||||
101.CAL | XBRL Taxonomy Extension Calculation Linkbase | X | |||||||||
101.DEF | XBRL Taxonomy Extension Definition Linkbase | X | |||||||||
101.LAB | XBRL Taxonomy Extension Labels Linkbase | X | |||||||||
101.PRE | XBRL Taxonomy Extension Presentation Linkbase | X | |||||||||
# | Management contract or compensatory plan or arrangement in which one or more executive officers or directors participates. |
SIGNATURES
Pursuant to the requirements of Section 13 or 15(d) of the Securities Exchange Act of 1934, the registrant has duly caused this report to be signed on its behalf by the undersigned, thereunto duly authorized.
DASAN ZHONE SOLUTIONS, INC. | ||||
Date: April 4, 2018 | By: | /s/ IL YUNG KIM | ||
Il Yung Kim | ||||
President, Chief Executive Officer and Director | ||||
Pursuant to the requirements of the Securities Exchange Act of 1934, this report has been signed below by the following persons on behalf of the registrant and in the capacities and on the dates indicated.
Signature | Title | Date | ||
/s/ IL YUNG KIM | President, Chief Executive Officer (Principal Executive Officer) | April 4, 2018 | ||
Il Yung Kim | ||||
/s/ MICHAEL GOLOMB | Chief Financial Officer, Corporate (Principal Financial and Accounting), Corporate Treasurer, and Secretary | April 4, 2018 | ||
Michael Golomb | ||||
/s/ MIN WOO NAM | Chairman of the Board of Directors | April 4, 2018 | ||
Min Woo Nam | ||||
/s/ MICHAEL CONNORS | Director | April 4, 2018 | ||
Michael Connors | ||||
/s/ SEONG GYUN KIM | Director | April 4, 2018 | ||
Seong Gyun Kim | ||||
/s/ SUNG-BIN PARK | Director | April 4, 2018 | ||
Sung-Bin Park | ||||
87