Attached files
| file | filename |
|---|---|
| 8-K - FORM 8-K - DELTA AIR LINES, INC. | delta_8k.htm |
Exhibit 99.1
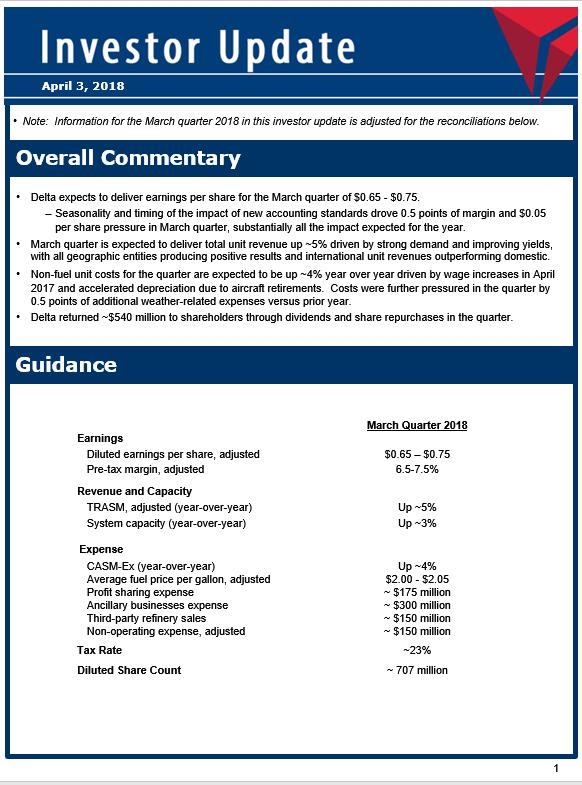
1 Overall Commentary • Delta expects to deliver earnings per share for the March quarter of $0.65 - $0.75. ‒ Seasonality and timing of the impact of new accounting standards drove 0.5 points of margin and $0.05 per share pressure in March quarter, substantially all the impact expected for the year. • March quarter is expected to deliver total unit revenue up ~5% driven by strong demand and improving yields, with all geographic entities producing positive results and international unit revenues outperforming domestic. • Non - fuel unit costs for the quarter are expected to be up ~4% year over year driven by wage increases in April 2017 and accelerated depreciation due to aircraft retirements. Costs were further pressured in the quarter by 0.5 points of weather - related expenses and 1 point related to the pension impact of new accounting standards. • Delta returned ~$540 million to shareholders through dividends and share repurchases in the quarter. April 3, 2018 • Note: Information for the March quarter 2018 in this investor update is adjusted for the reconciliations below. Guidance March Quarter 2018 Earnings Diluted e arnings per share, adjusted $0.65 – $0.75 Pre - tax margin, adjusted 6.5 - 7.5% Revenue and Capacity TRASM, adjusted (year - over - year) Up ~5% System capacity (year - over - year) Up ~3% Expense CASM - Ex (year - over - year) Up ~4% Average fuel price per gallon, adjusted $2.00 - $2.05 Profit sharing expense ~ $175 million Ancillary businesses expense ~ $300 million Third - party refinery sales ~ $150 million Non - operating expense, adjusted ~ $150 million Tax Rate ~23% Diluted Share Count ~ 707 million
2 Forward Looking Statements Profit Sharing Delta’s broad based employee profit sharing program pays 10% of the company’s adjusted annual profit up to $2.5 billion and 20% above that amount. Adjusted annual profit is calculated as the company’s annual pre - tax income before profit sharing expense, special items and certain other items. Profit sharing expense is accrued at a blended rate based on the company’s estimated profitability for the full year. Ancillary Businesses and Third - Party Refinery Sales Delta excludes certain items from unit cost, unit revenue, and margin guidance to provide a more meaningful comparison of our airline operations to the rest of the airline industry. The costs associated with ancillary businesses such as the aircraft maintenance and staffing services we provide to third parties are excluded from CASM - Ex guidance because these businesses are not related to the generation of a seat mile. In addition, third - party refinery sales are excluded from adjusted unit revenue, adjusted margin, and CASM - Ex calculations because they are not indicative of the trends in our airline business. Third - party refinery sales are at or near cost and as such, the margin on these sales is de minimis. Statements in this investor update that are not historical facts, including statements regarding our estimates, expectations, beliefs, intentions, projections or strategies for the future, may be "forward - looking statements" as defined in the Private Securities Litigation Reform Act of 1995. All forward - looking statements involve a number of risks and uncertainties that could cause actual results to differ materially from the estimates, expectations, beliefs, intentions, projections and strategies reflected in or suggested by the forward - looking statements. These risks and uncertainties include, but are not limited to, the cost of aircraft fuel; the impact of fuel hedging activity including rebalancing our hedge portfolio, recording mark - to - market adjustments or posting collateral in connection with our fuel hedge contracts; the availability of aircraft fuel; the perform anc e of our significant investments in airlines in other parts of the world; the possible effects of accidents involving our aircraft ; breaches or security lapses in our information technology systems; disruptions in our information technology infrastructure; our dependence on technology in our operations; the restrictions that financial covenants in our financing agreements could have on our financial and business operations; labor issues; the effects of weather, natural disasters and seasonality on our business; the effects of an extended disruption in services provided by third party regional carriers; failure or inability o f insurance to cover a significant liability at Monroe’s Trainer refinery; the impact of environmental regulation on the Traine r refinery, including costs related to renewable fuel standard regulations; our ability to retain senior management and key employees; damage to our reputation and brand if we are exposed to significant adverse publicity through social media; the effects of terrorist attacks or geopolitical conflict; competitive conditions in the airline industry; interruptions or disru pti ons in service at major airports at which we operate; the effects of extensive government regulation on our business; the sensitivit y o f the airline industry to prolonged periods of stagnant or weak economic conditions; uncertainty in economic conditions and regulatory environment in the United Kingdom related to the likely exit of the United Kingdom from the European Union; and the effects of the rapid spread of contagious illnesses. Additional information concerning risks and uncertainties that could cause differences between actual results and forward - looking statements is contained in our Securities and Exchange Commission filings, including our Annual Report on Form 10 - K for the fiscal year ended Dec. 31, 2017. Caution should be taken not to place undue reliance on our forward - looking statements, which represent our views only as of April 3, 2018, and which we have no current intention to update. Non - GAAP Financial Measures Delta sometimes uses information ("non - GAAP financial measures") that is derived from the Consolidated Financial Statements, but that is not presented in accordance with accounting principles generally accepted in the U.S. (“GAAP”). Under the U.S. Securities and Exchange Commission rules, non - GAAP financial measures may be considered in addition to results prepared in accordance with GAAP, but should not be considered a substitute for or superior to GAAP results. The tables below show reconciliations of non - GAAP financial measures used in this update to the most directly comparable GAAP financial measures. Non - GAAP Reconciliations
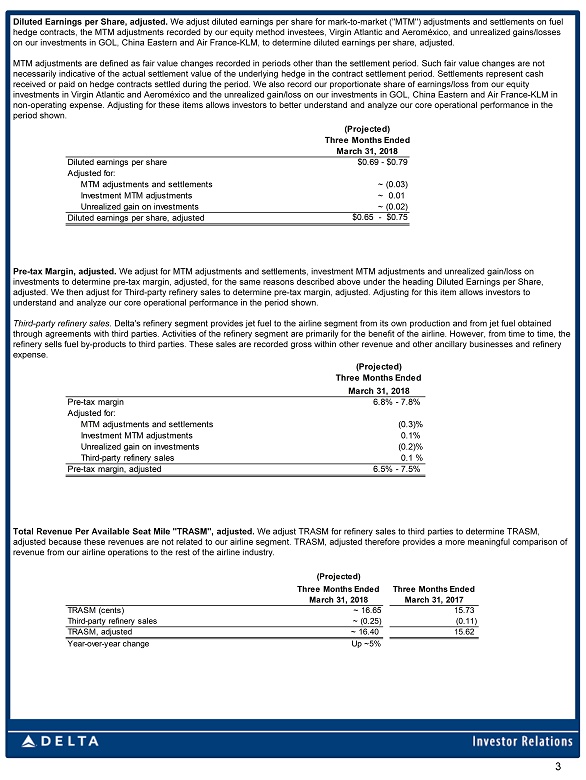
3 Diluted Earnings per Share, adjusted. We adjust diluted earnings per share for mark - to - market ("MTM") adjustments and settlements on fuel hedge contracts, the MTM adjustments recorded by our equity method investees, Virgin Atlantic and Aeroméxico, and unrealized gai ns/losses on our investments in GOL, China Eastern and Air France - KLM, to determine diluted earnings per share, adjusted. MTM adjustments are defined as fair value changes recorded in periods other than the settlement period. Such fair value chang es are not necessarily indicative of the actual settlement value of the underlying hedge in the contract settlement period. Settlements rep resent cash received or paid on hedge contracts settled during the period. We also record our proportionate share of earnings/loss from o ur equity investments in Virgin Atlantic and Aeroméxico and the unrealized gain/loss on our investments in GOL, China Eastern and Air F ran ce - KLM in non - operating expense. Adjusting for these items allows investors to better understand and analyze our core operational performa nce in the period shown. Pre - tax Margin, adjusted. We adjust for MTM adjustments and settlements, investment MTM adjustments and unrealized gain/loss on investments to determine pre - tax margin, adjusted, for the same reasons described above under the heading Diluted Earnings per S hare, adjusted. We then adjust for Third - party refinery sales to determine pre - tax margin, adjusted. Adjusting for this item allows in vestors to understand and analyze our core operational performance in the period shown. Third - party refinery sales . Delta's refinery segment provides jet fuel to the airline segment from its own production and from jet fuel obtained through agreements with third parties. Activities of the refinery segment are primarily for the benefit of the airline. Howev er, from time to time, the refinery sells fuel by - products to third parties. These sales are recorded gross within other revenue and other ancillary busine sses and refinery expense. Total Revenue Per Available Seat Mile "TRASM", adjusted. We adjust TRASM for refinery sales to third parties to determine TRASM, adjusted because these revenues are not related to our airline segment. TRASM, adjusted therefore provides a more meaningful com parison of revenue from our airline operations to the rest of the airline industry. (Projected) Three Months Ended March 31, 2018 Diluted earnings per share $0.69 - $0.79 Adjusted for: MTM adjustments and settlements ~ (0.03) Investment MTM adjustments ~ 0.01 Unrealized gain on investments ~ (0.02) Diluted earnings per share, adjusted $0.65 - $0.75 (Projected) Three Months Ended Three Months Ended March 31, 2018 March 31, 2017 TRASM (cents) ~ 16.65 15.73 Third-party refinery sales ~ (0.25) (0.11) TRASM, adjusted ~ 16.40 15.62 Year-over-year change Up ~5% (Projected) Three Months Ended March 31, 2018 6.8% - 7.8% (0.3)% Investment MTM adjustments 0.1% Unrealized gain on investments (0.2)% Third-party refinery sales 0.1% 6.5% - 7.5%Pre-tax margin, adjusted Pre-tax margin Adjusted for: MTM adjustments and settlements
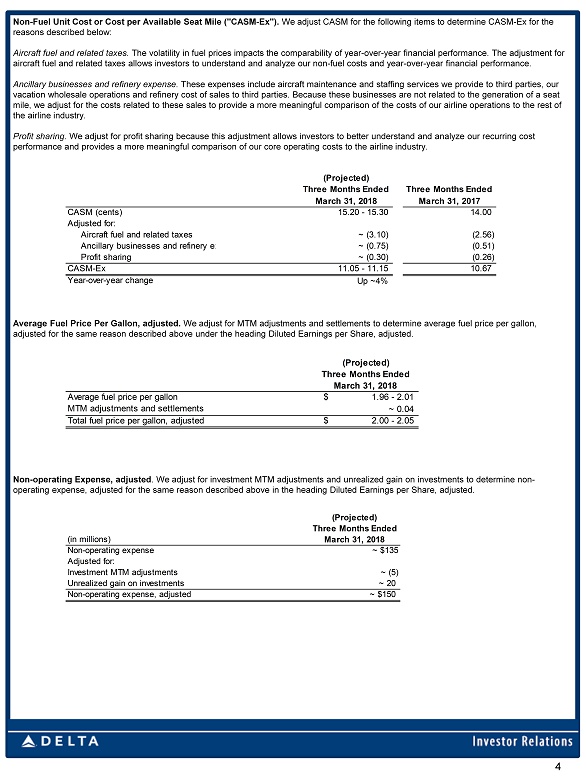
4 Non - Fuel Unit Cost or Cost per Available Seat Mile ("CASM - Ex"). We adjust CASM for the following items to determine CASM - Ex for the reasons described below: Aircraft fuel and related taxes . The volatility in fuel prices impacts the comparability of year - over - year financial performance. The adjustment for aircraft fuel and related taxes allows investors to understand and analyze our non - fuel costs and year - over - year financial perfo rmance. Ancillary businesses and refinery expense . These expenses include aircraft maintenance and staffing services we provide to third parties, our vacation wholesale operations and refinery cost of sales to third parties. Because these businesses are not related to the ge ner ation of a seat mile, we adjust for the costs related to these sales to provide a more meaningful comparison of the costs of our airline oper ati ons to the rest of the airline industry. Profit sharing . We adjust for profit sharing because this adjustment allows investors to better understand and analyze our recurring cost performance and provides a more meaningful comparison of our core operating costs to the airline industry. Average Fuel Price Per Gallon, adjusted. We adjust for MTM adjustments and settlements to determine average fuel price per gallon, adjusted for the same reason described above under the heading Diluted Earnings per Share, adjusted. Non - operating Expense, adjusted . We adjust for investment MTM adjustments and unrealized gain on investments to determine non - operating expense, adjusted for the same reason described above in the heading Diluted Earnings per Share, adjusted. (Projected) Three Months Ended (in millions) March 31, 2018 Non-operating expense ~ $135 Adjusted for: Investment MTM adjustments ~ (5) Unrealized gain on investments ~ 20 Non-operating expense, adjusted ~ $150 (Projected) Three Months Ended Three Months Ended March 31, 2018 March 31, 2017 15.20 - 15.30 14.00 ~ (3.10) (2.56) ~ (0.75) (0.51) Profit sharing ~ (0.30) (0.26) 11.05 - 11.15 10.67 Year-over-year change Up ~4% Ancillary businesses and refinery expense CASM-Ex CASM (cents) Adjusted for: Aircraft fuel and related taxes $ 1.96 - 2.01 ~ 0.04 $ 2.00 - 2.05 (Projected) Three Months Ended March 31, 2018 Average fuel price per gallon MTM adjustments and settlements Total fuel price per gallon, adjusted