Attached files
| file | filename |
|---|---|
| 8-K - FORM 8-K - American Finance Trust, Inc | tv490234_8k.htm |
Exhibit 99.1

AMERICAN FINANCE TRUST 4 th Quarter 2017 Investor Presentation
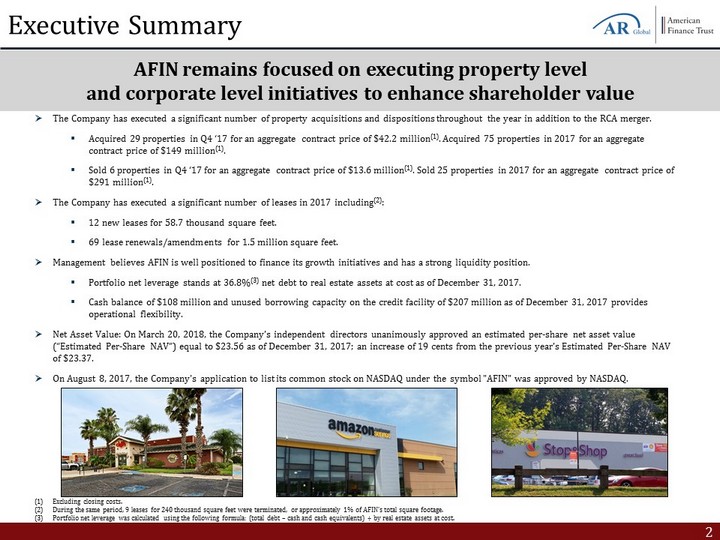
2 » The Company has executed a significant number of property acquisitions and dispositions throughout the year in addition to th e R CA merger. ▪ Acquired 29 properties in Q4 ‘17 for an aggregate contract price of $42.2 million (1) . Acquired 75 properties in 2017 for an aggregate contract price of $149 million (1) . ▪ Sold 6 properties in Q4 ‘17 for an aggregate contract price of $13.6 million (1) . Sold 25 properties in 2017 for an aggregate contract price of $291 million (1) . » The Company has executed a significant number of leases in 2017 including (2) : ▪ 12 new leases for 58.7 thousand square feet. ▪ 69 lease renewals/amendments for 1.5 million square feet. » Management believes AFIN is well positioned to finance its growth initiatives and has a strong liquidity position. ▪ Portfolio net leverage stands at 36.8 % (3) net debt to real estate assets at cost as of December 31, 2017. ▪ Cash balance of $108 million and unused borrowing capacity on the credit facility of $207 million as of December 31, 2017 pro vid es operational flexibility. » Net Asset Value: On March 20, 2018, the Company’s independent directors unanimously approved an estimated per - share net asset va lue (“Estimated Per - Share NAV”) equal to $23.56 as of December 31, 2017; an increase of 19 cents from the previous year’s Estimated Per - Share NAV of $23.37. » On August 8, 2017, the Company's application to list its common stock on NASDAQ under the symbol "AFIN" was approved by NASDA Q. The management team is continuing to execute on its strategy to increase the Company’s earnings and improve the portfolio’s overall quality, while maintaining an efficient capital structure AFIN remains focused on executing property level and corporate level initiatives to enhance shareholder value Executive Summary (1) Excluding closing costs . (2) During the same period, 9 leases for 240 thousand square feet were terminated, or approximately 1% of AFIN’s total square foo tag e. (3) Portfolio net leverage was calculated using the following formula: (total debt – cash and cash equivalents) ÷ by real estate assets at cost.
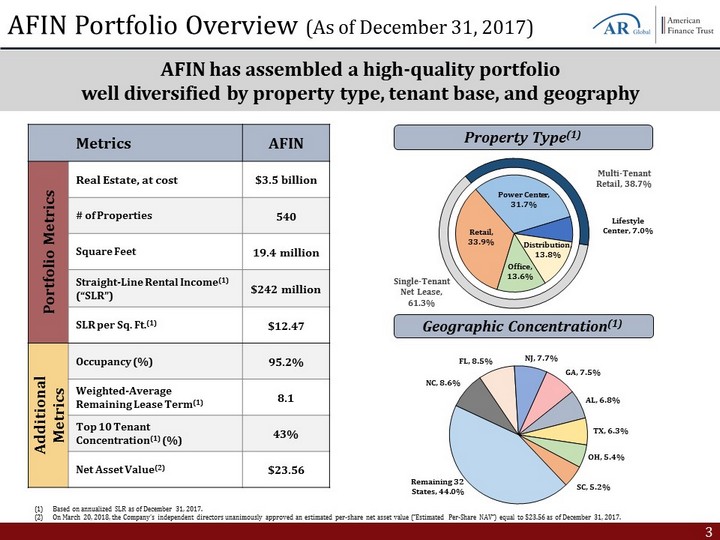
3 Retail, 33.9% Power Center , 31.7% Lifestyle Center , 7.0% Distribution , 13.8% Office , 13.6% Single - Tenant Net Lease, 61.3% Multi - Tenant Retail, 38.7% AFIN Portfolio Overview (As of December 31, 2017) AFIN has assembled a high - quality portfolio well diversified by property type, tenant base, and geography (1) Based on annualized SLR as of December 31, 2017. (2) On March 20, 2018, the Company’s independent directors unanimously approved an estimated per - share net asset value (“Estimated P er - Share NAV”) equal to $23.56 as of December 31, 2017. Metrics AFIN Portfolio Metrics Real Estate, at cost $3.5 billion # of Properties 540 Square Feet 19.4 million Straight - Line Rental Income (1) (“SLR”) $242 million SLR per Sq. Ft. (1) $12.47 Additional Metrics Occupancy (%) 95.2% Weighted - Average Remaining Lease Term (1) 8.1 Top 10 Tenant Concentration (1) (%) 43% Net Asset Value (2) $23.56 Geographic Concentration (1) NC , 8.6% FL , 8.5% NJ , 7.7% GA , 7.5% AL , 6.8% TX , 6.3% OH , 5.4% SC , 5.2% Remaining 32 States , 44.0% Property Type (1)
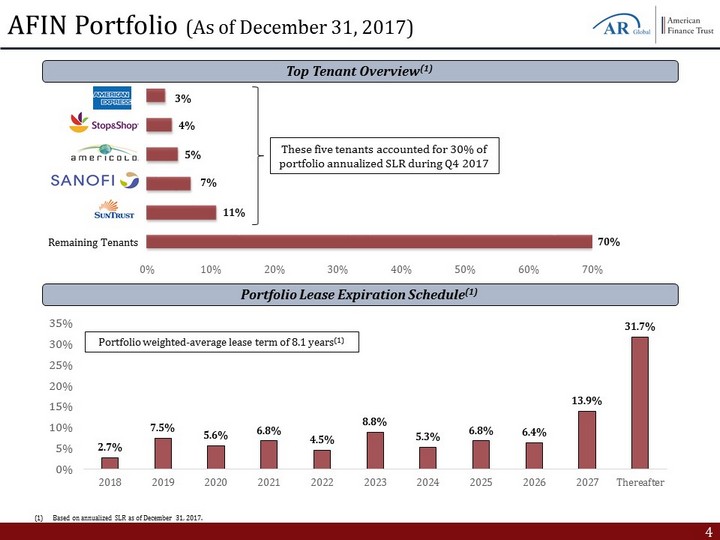
4 AFIN Portfolio (As of December 31, 2017) Portfolio Lease Expiration Schedule (1) 70% 11% 7% 5% 4% 3% 0% 10% 20% 30% 40% 50% 60% 70% Top Tenant Overview (1) These five tenants accounted for 30% of portfolio annualized SLR during Q4 2017 Remaining Tenants 2.7% 7.5% 5.6% 6.8% 4.5% 8.8% 5.3% 6.8% 6.4% 13.9% 31.7% 0% 5% 10% 15% 20% 25% 30% 35% 2018 2019 2020 2021 2022 2023 2024 2025 2026 2027 Thereafter Portfolio weighted - average lease term of 8.1 years (1) (1) Based on annualized SLR as of December 31, 2017.
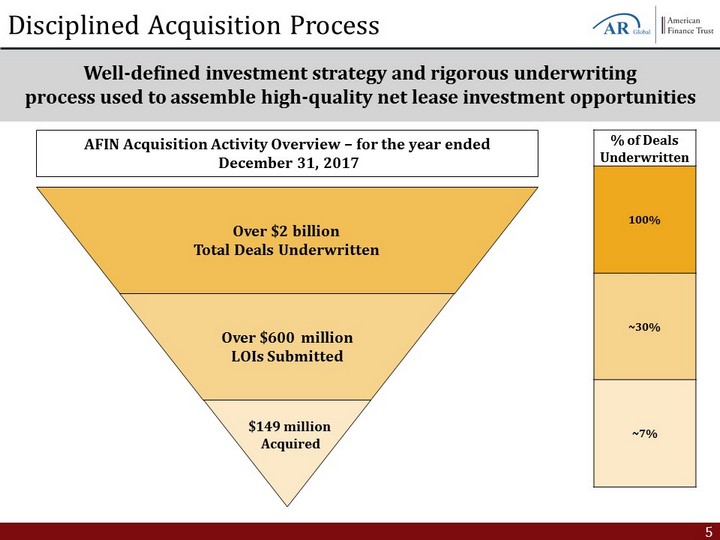
5 Disciplined Acquisition Process Well - defined investment strategy and rigorous underwriting process used to assemble high - quality net lease investment opportunities Over $2 billion Total Deals Underwritten Over $600 million LOIs Submitted $149 million Acquired AFIN Acquisition Activity Overview – for the year ended December 31, 2017 % of Deals Underwritten 100% ~30% ~7%
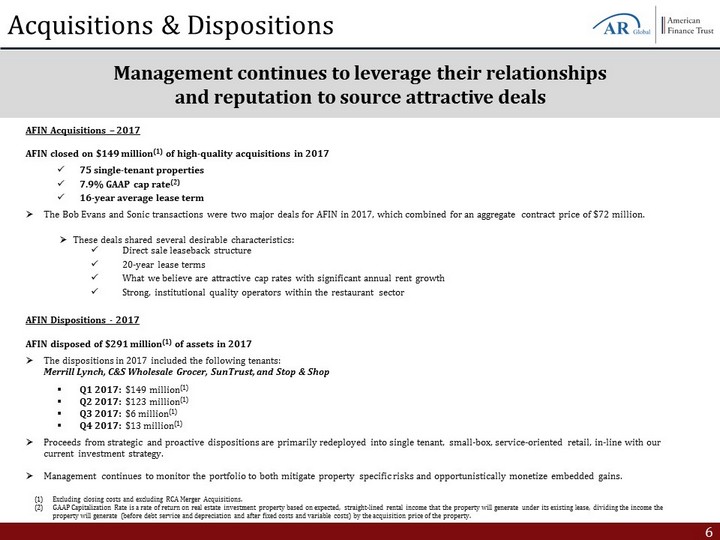
6 AFIN Acquisitions – 2017 AFIN closed on $149 million (1) of high - quality acquisitions in 2017 x 75 single - tenant properties x 7.9% GAAP cap rate (2) x 16 - year average lease term » The Bob Evans and Sonic transactions were two major deals for AFIN in 2017, which combined for an aggregate contract price of $7 2 million. Acquisitions & Dispositions AFIN Dispositions - 2017 AFIN disposed of $291 million (1) of assets in 2017 » The dispositions in 2017 included the following tenants: Merrill Lynch, C&S Wholesale Grocer, SunTrust, and Stop & Shop ▪ Q1 2017: $149 million (1) ▪ Q2 2017: $123 million (1) ▪ Q3 2017: $6 million (1) ▪ Q4 2017: $13 million (1) » Proceeds from strategic and proactive dispositions are primarily redeployed into single tenant, small - box, service - oriented reta il, in - line with our current investment strategy. » Management continues to monitor the portfolio to both mitigate property specific risks and opportunistically monetize embedde d g ains. Management continues to leverage their relationships and reputation to source attractive deals » These deals shared several desirable characteristics: x Direct sale leaseback structure x 20 - year lease terms x What we believe are attractive cap rates with significant annual rent growth x Strong, institutional quality operators within the restaurant sector (1) Excluding closing costs and excluding RCA Merger Acquisitions. (2) GAAP Capitalization Rate is a rate of return on real estate investment property based on expected, straight - lined rental income that the property will generate under its existing lease, dividing the income the property will generate (before debt service and depreciation and after fixed costs and variable costs) by the acquisition pri ce of the property.
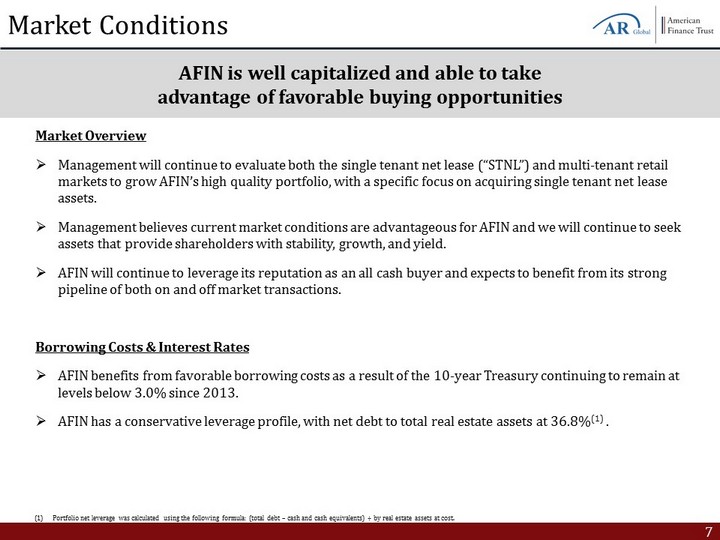
7 Market Conditions Market Overview » Management will continue to evaluate both the single tenant net lease (“STNL”) and multi - tenant retail markets to grow AFIN’s high quality portfolio, with a specific focus on acquiring single tenant net lease assets. » Management believes current market conditions are advantageous for AFIN and we will continue to seek assets that provide shareholders with stability, growth, and yield. » AFIN will continue to leverage its reputation as an all cash buyer and expects to benefit from its strong pipeline of both on and off market transactions. Borrowing Costs & Interest Rates » AFIN benefits from favorable borrowing costs as a result of the 10 - year Treasury continuing to remain at levels below 3.0% since 2013. » AFIN has a conservative leverage profile, with net debt to total real estate assets at 36.8% (1) . AFIN is well capitalized and able to take advantage of favorable buying opportunities (1) Portfolio net leverage was calculated using the following formula: (total debt – cash and cash equivalents) ÷ by real estate assets at cost.
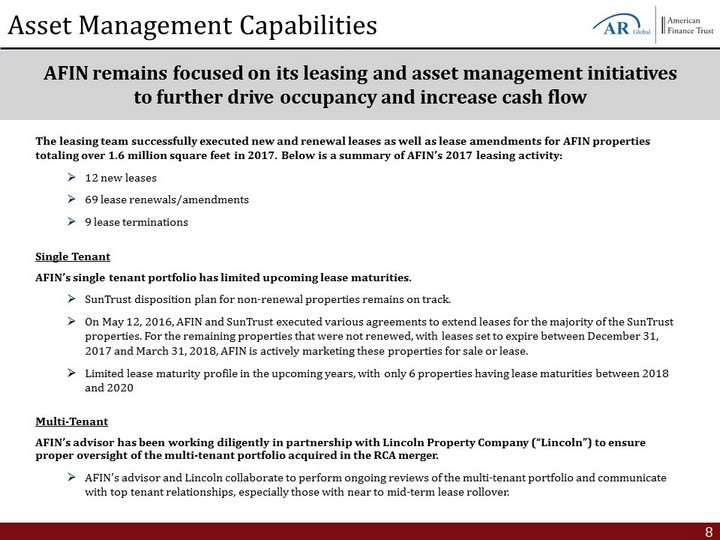
8 Asset Management Capabilities AFIN remains focused on its leasing and asset management initiatives to further drive occupancy and increase cash flow The leasing team successfully executed new and renewal leases as well as lease amendments for AFIN properties totaling over 1.6 million square feet in 2017 . Below is a summary of AFIN’s 2017 leasing activity: » 12 new leases » 69 lease renewals/amendments » 9 lease terminations Single Tenant AFIN’s single tenant portfolio has limited upcoming lease maturities. » SunTrust disposition plan for non - renewal properties remains on track. » On May 12, 2016, AFIN and SunTrust executed various agreements to extend leases for the majority of the SunTrust properties. For the remaining properties that were not renewed, with leases set to expire between December 31, 2017 and March 31, 2018, AFIN is actively marketing these properties for sale or lease. » Limited lease maturity profile in the upcoming years, with only 6 properties having lease maturities between 2018 and 2020 Multi - Tenant AFIN’s advisor has been working diligently in partnership with Lincoln Property Company (“Lincoln”) to ensure proper oversight of the multi - tenant portfolio acquired in the RCA merger. » AFIN’s advisor and Lincoln collaborate to perform ongoing reviews of the multi - tenant portfolio and communicate with top tenant relationships, especially those with near to mid - term lease rollover.
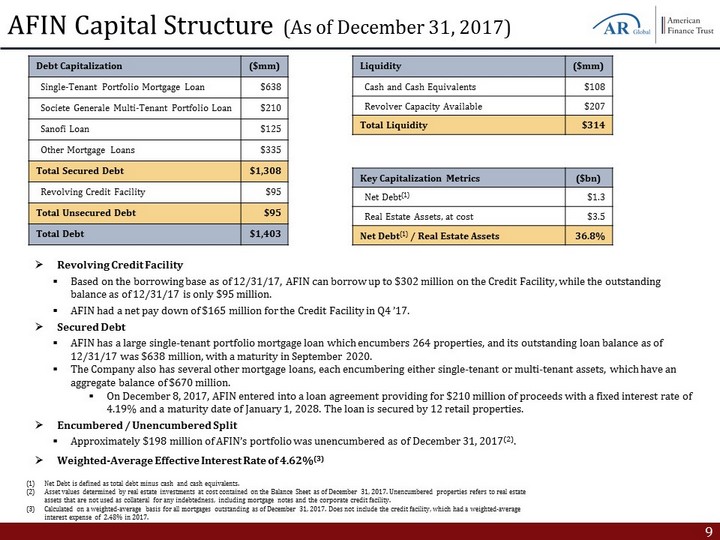
9 » Revolving Credit Facility ▪ Based on the borrowing base as of 12/31/17, AFIN can borrow up to $302 million on the Credit Facility, while the outstanding balance as of 12/31/17 is only $95 million. ▪ AFIN had a net pay down of $165 million for the Credit Facility in Q4 ’17. » Secured Debt ▪ AFIN has a large single - tenant portfolio mortgage loan which encumbers 264 properties, and its outstanding loan balance as of 12/31/17 was $638 million, with a maturity in September 2020. ▪ The Company also has several other mortgage loans, each encumbering either single - tenant or multi - tenant assets, which have an aggregate balance of $670 million. ▪ On December 8, 2017, AFIN entered into a loan agreement providing for $210 million of proceeds with a fixed interest rate of 4.19% and a maturity date of January 1, 2028. The loan is secured by 12 retail properties. » Encumbered / Unencumbered Split ▪ Approximately $198 million of AFIN’s portfolio was unencumbered as of December 31, 2017 (2) . » Weighted - Average Effective Interest Rate of 4.62% (3) AFIN Capital Structure (As of December 31, 2017) Debt Capitalization ($mm) Single - Tenant Portfolio Mortgage Loan $638 Societe Generale Multi - Tenant Portfolio Loan $210 Sanofi Loan $125 Other Mortgage Loans $335 Total Secured Debt $1,308 Revolving Credit Facility $95 Total Unsecured Debt $95 Total Debt $1,403 Liquidity ($mm) Cash and Cash Equivalents $108 Revolver Capacity Available $207 Total Liquidity $314 Key Capitalization Metrics ($ bn ) Net Debt (1) $1.3 Real Estate Assets, at cost $3.5 Net Debt (1) / Real Estate Assets 36.8% (1) Net Debt is defined as total debt minus cash and cash equivalents. (2) Asset values determined by real estate investments at cost contained on the Balance Sheet as of December 31, 2017. Unencumber ed properties refers to real estate assets that are not used as collateral for any indebtedness, including mortgage notes and the corporate credit facility. (3) Calculated on a weighted - average basis for all mortgages outstanding as of December 31, 2017 . Does not include the credit facility, which had a weighted - average interest expense of 2.48% in 2017.
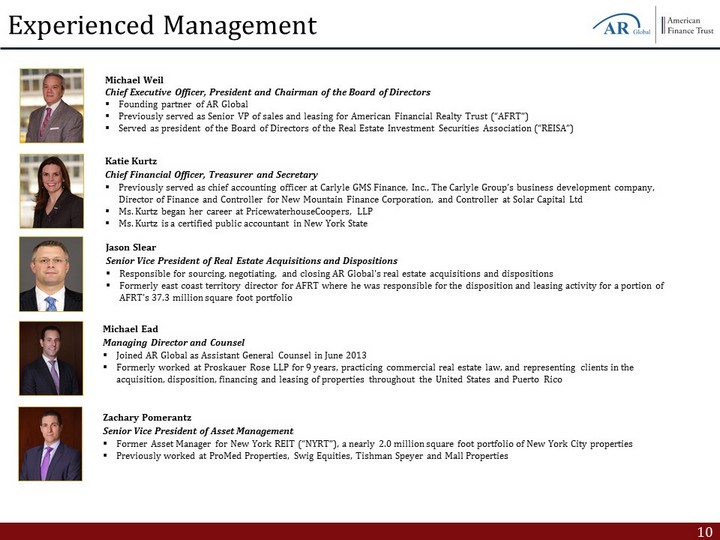
10 Experienced Management Michael Weil Chief Executive Officer, President and Chairman of the Board of Directors ▪ Founding partner of AR Global ▪ Previously served as Senior VP of sales and leasing for American Financial Realty Trust (“AFRT”) ▪ Served as president of the Board of Directors of the Real Estate Investment Securities Association (“REISA”) Jason Slear Senior Vice President of Real Estate Acquisitions and Dispositions ▪ Responsible for sourcing, negotiating, and closing AR Global's real estate acquisitions and dispositions ▪ Formerly east coast territory director for AFRT where he was responsible for the disposition and leasing activity for a porti on of AFRT's 37.3 million square foot portfolio Michael Ead Managing Director and Counsel ▪ Joined AR Global as Assistant General Counsel in June 2013 ▪ Formerly worked at Proskauer Rose LLP for 9 years, practicing commercial real estate law, and representing clients in the acquisition, disposition, financing and leasing of properties throughout the United States and Puerto Rico Zachary Pomerantz Senior Vice President of Asset Management ▪ Former Asset Manager for New York REIT (“NYRT”), a nearly 2.0 million square foot portfolio of New York City properties ▪ Previously worked at ProMed Properties, Swig Equities, Tishman Speyer and Mall Properties Katie Kurtz Chief Financial Officer, Treasurer and Secretary ▪ Previously served as chief accounting officer at Carlyle GMS Finance, Inc., The Carlyle Group’s business development company, Director of Finance and Controller for New Mountain Finance Corporation, and Controller at Solar Capital Ltd ▪ Ms. Kurtz began her career at PricewaterhouseCoopers, LLP ▪ Ms. Kurtz is a certified public accountant in New York State
11 Forward - Looking Statements & Risk Factors Certain statements made in this presentation are “forward - looking statements” (as defined in Section 21 E of the Exchange Act), which reflect the expectations of the Company regarding future events . The forward - looking statements involve a number of risks, uncertainties and other factors that could cause actual results to differ materially from those contained in the forward - looking statements . Such forward - looking statements include, but are not limited to, market and other expectations, objectives, and intentions, as well as any other statements that are not historical facts . Our potential risks and uncertainties are presented in the section titled “Item 1 A . Risk Factors” disclosed in our Annual Report on Form 10 - K for the year ended December 31 , 2017 and our Quarterly Reports on Form 10 - Q filed from time to time . We disclaim any obligation to update and revise statements contained in these materials based on new information or otherwise . The following are some of the risks and uncertainties relating to us, although not all risks and uncertainties, that could cause our actual results to differ materially from those presented in our forward - looking statements : • All of our executive officers are also officers, managers, employees or holders of a direct or indirect controlling interest in the Advisor or other entities under common control with AR Global Investments, LLC (the successor business to AR Capital, LLC, “AR Global”). As a result, o ur executive officers, the Advisor and its affiliates face conflicts of interest, including significant conflicts created by the Advisor’s compensat ion arrangements with us and other investment programs advised by affiliates of AR Global and conflicts in allocating time among these entities and us, wh ich could negatively impact our operating results. • Although we have announced our intention to list our common stock on an exchange at a time yet to be determined, there can be no assurance that our common stock will be listed or of the price at which our common stock may trade. No public market currently exists, or ma y e ver exist, for shares of our common stock and shares of our common stock are, and may continue to be, illiquid. • Lincoln Retail REIT Services, LLC (“Lincoln”) and its affiliates, which provide services to the Advisor in connection with ou r r etail portfolio, faces conflicts of interest in allocating its employees’ time between providing real estate - related services to the Advisor and other programs and activities in which they are presently involved or may be involved in the future. • The performance of our retail portfolio is linked to the market for retail space generally and factors that may impact our re tai l tenants, such as the increasing use of the Internet by retailers and consumers. • We depend on tenants for our rental revenue and, accordingly, our rental revenue is dependent upon the success and economic v iab ility of our tenants. • We have not generated, and in the future may not generate, operating cash flows sufficient to fund all of the distributions w e p ay our stockholders, and, as such, we may be forced to fund distributions from other sources, including borrowings, which may not be available on fav orable terms, or at all. • We may be unable to pay or maintain cash distributions at the current rate or increase distributions over time. • We are obligated to pay fees, which may be substantial, to the Advisor and its affiliates. • We are subject to risks associated with any dislocation or liquidity disruptions that may exist or occur in the credit market s o f the United States of America. • We may fail to continue to qualify to be treated as a real estate investment trust for U.S. federal income tax purposes (“REI T”) , which would result in higher taxes, may adversely affect our operations and would reduce the value of an investment in our common stock and our cas h a vailable for distributions. • We may be deemed by regulators to be an investment company under the Investment Company Act of 1940, as amended (the “Investm ent Company Act”), and thus subject to regulation under the Investment Company Act.

AmericanFinanceTrust.com ▪ For account information, including balances and the status of submitted paperwork, please call us at (866) 902 - 0063 ▪ Financial Advisors may view client accounts, statements and tax forms at www.dstvision.com ▪ Shareholders may access their accounts at www.ar - global.com