Attached files
| file | filename |
|---|---|
| EX-99.1 - EX-99.1 - PetIQ, Inc. | ex-99d1.htm |
| 8-K - 8-K - PetIQ, Inc. | f8-k.htm |
Exhibit 99.2
|
|
AFFORDABLE PET CARE April 2, 2018 |
|
|
2 This presentation contains forward-looking statements that involve risks and uncertainties, such as statements about our plans, objectives, expectations, assumptions or future events, including statements regarding the proposed acquisition of VIP Petcare by PetIQ, the expected closing date of the acquisition and the potential benefits and synergies of the acquisition. In some cases, you can identify forward-looking statements by terminology such as "anticipate," "estimate," "plan," "project," "continuing," "ongoing," "expect," "believe," "intend," "may," "will," "should," "could" and similar expressions. Forward-looking statements involve estimates, assumptions, known and unknown risks, uncertainties and other factors that could cause actual results to differ materially from any future results, performances, or achievements expressed or implied by the forward-looking statements. Forward-looking statements should not be read as a guarantee of future performance or results, and will not necessarily be accurate indications of the times at, or by, which such performance or results will be achieved. Forward-looking statements are based on information available at the -me those statements are made or management's good faith belief as of that -me with respect to future events, and are subject to risks and uncertainties that could cause actual performance or results to differ materially from those expressed in or suggested by the forward-looking statements. Important factors that could cause such differences include, but are not limited to, our ability to successfully grow our business through acquisitions; our ability to integrate, manage and expand VIP’s business; our dependency on a limited number of customers; our ability to implement our growth strategy effectively; our ability to achieve or sustain profitability; competition from veterinarians and others in our industry; our ability to successfully grow our business through acquisitions; our ability to integrate, manage and expand VIP’s business; reputational damage to our brands; economic trends and spending on pets; the effectiveness of our marketing and trade promotion programs; recalls or withdrawals of our products or product liability claims; our ability to manage our manufacturing and supply chain effectively; disruptions in our manufacturing and distribution chains; our ability to introduce new products and improve existing products; our failure to protect our intellectual property; costs associated with governmental regulation; our ability to keep and retain key employees; and the risks set forth under the "Risk Factors” section of our Annual Report on Form 10-K for the year ended December 31, 2017. Additional risks and uncertainties not currently known to us or that we currently deem to be immaterial also may materially adversely affect our business, financial condition or operating results. The forward-looking statements speak only as of the date on which they are made, and, except as required by law, we undertake no obligation to update any forward-looking statement to reflect events or circumstances after the date on which the statement is made or to reflect the occurrence of unanticipated events. In addition, we cannot assess the impact of each factor on our business or the extent to which any factor, or combination of factors, including the VIP Petcare transaction and its potential impact, may cause actual results to differ materially from those contained in any forward-looking statements. Consequently, you should not place undue reliance on forward-looking statements. This presentation includes certain non-GAAP financial measures, including Adjusted EBITDA. These non-GAAP financial measures should be considered only as supplemental to, and not as superior to, financial measures prepared in accordance with GAAP. Please refer to the Appendix of this presentation for a reconciliation of Adjusted EBITDA to net income, the most directly comparable financial measure prepared in accordance with U.S. GAAP. The Company does not provide guidance for net income, and similarly cannot provide a reconciliation between its forecasted adjusted EBITDA and net income metrics without unreasonable effort due to the unavailability of reliable estimates for certain items. These items are not within the Company’s control and may vary greatly between periods and could significantly impact future financial results. This presentation is confidential and may not be reproduced or otherwise distributed or disseminated, in whole or part, without the prior written consent of the Company, which consent may be withheld in its sole and absolute discretion. FORWARD-LOOKING STATEMENTS |
|
|
3 AGENDA Business Overview Pro Forma Review Veterinary Clinic Information Questions and Answers 2018 and Beyond presenters Cord Christensen, CEO John Newland, CFO |
|
|
4 CORD CHRISTENSEN CHIEF EXECUTIVE OFFICER BUSINESS OVERVIEW |
|
|
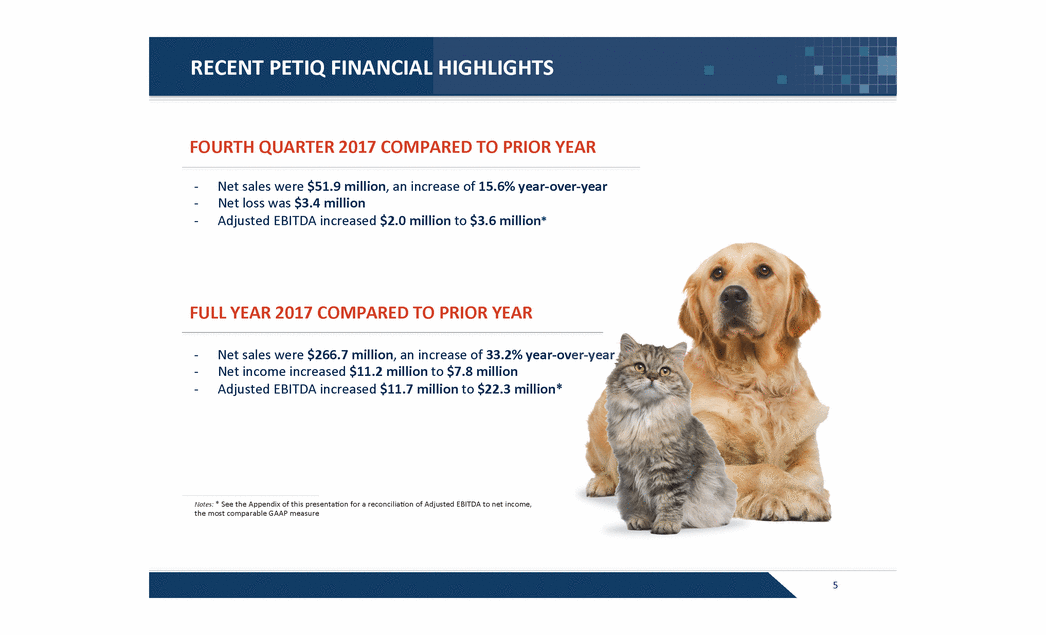
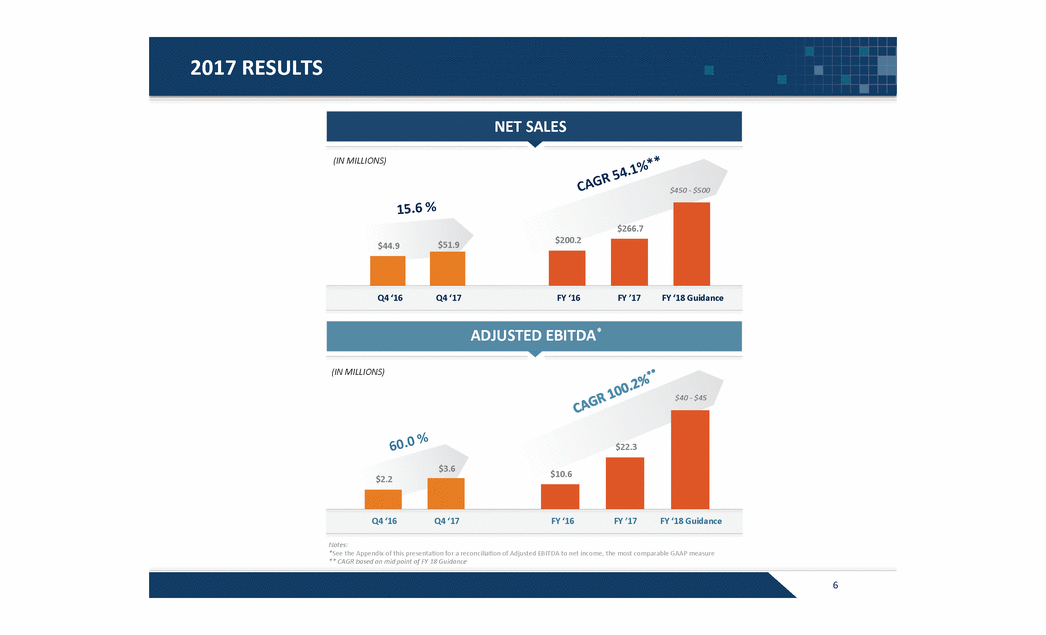
5 RECENT PETIQ FINANCIAL HIGHLIGHTS - Net sales were $51.9 million, an increase of 15.6% year-over-year - Net loss was $3.4 million - Adjusted EBITDA increased $2.0 million to $3.6 million* FOURTH QUARTER 2017 COMPARED TO PRIOR YEAR FULL YEAR 2017 COMPARED TO PRIOR YEAR - Net sales were $266.7 million, an increase of 33.2% year-over-year - Net income increased $11.2 million to $7.8 million - Adjusted EBITDA increased $11.7 million to $22.3 million* Notes: * See the Appendix of this presentation for a reconciliation of Adjusted EBITDA to net income, the most comparable GAAP measure |
|
|
$10.6 $22.3 $- $10.0 $20.0 $30.0 $40.0 $50.0 $60.0 FY16 FY17 FY18 Guidance $2.2 $3.6 $- $2.0 $4.0 Q416 Q417 15.6 % $44.9 $51.9 $- $50.0 Q416 Q417 $200.2 $266.7 $- $100.0 $200.0 $300.0 $400.0 $500.0 $600.0 $700.0 $800.0 FY16 FY17 FY18 Guidance 6 2017 RESULTS NET SALES ADJUSTED EBITDA* $450 - $500 $40 - $45 60.0 % CAGR 54.1%** CAGR 100.2%** (IN MILLIONS) (IN MILLIONS) Notes: *See the Appendix of this presentation for a reconciliation of Adjusted EBITDA to net income, the most comparable GAAP measure ** CAGR based on mid point of FY 18 Guidance Q4 ‘16 Q4 ‘17 FY ‘16 FY ’17 FY ‘18 Guidance Q4 ‘16 Q4 ‘17 FY ‘16 FY ’17 FY ‘18 Guidance |
|
|
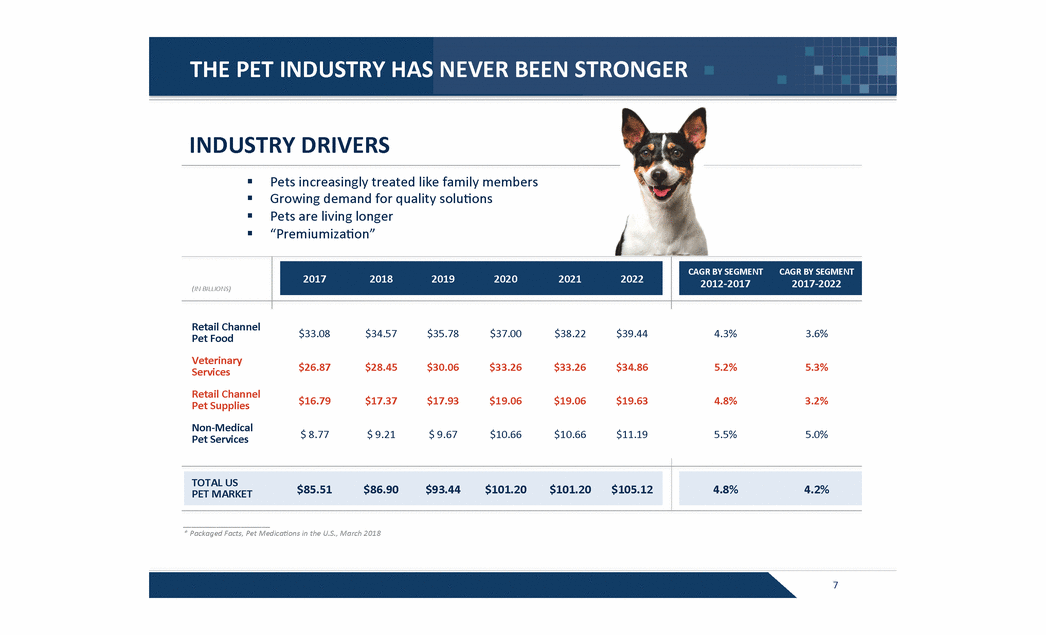
7 INDUSTRY DRIVERS Pets increasingly treated like family members Growing demand for quality solutions Pets are living longer “Premiumization” * Packaged Facts, Pet Medications in the U.S., March 2018 2017 2018 2019 2020 2021 2022 CAGR BY SEGMENT 2012-2017 CAGR BY SEGMENT 2017-2022 Retail Channel Pet Food $33.08 $34.57 $35.78 $37.00 $38.22 $39.44 4.3% 3.6% Veterinary Services $26.87 $28.45 $30.06 $33.26 $33.26 $34.86 5.2% 5.3% Retail Channel Pet Supplies $16.79 $17.37 $17.93 $19.06 $19.06 $19.63 4.8% 3.2% Non-Medical Pet Services $ 8.77 $ 9.21 $ 9.67 $10.66 $10.66 $11.19 5.5% 5.0% TOTAL US PET MARKET $85.51 $86.90 $93.44 $101.20 $101.20 $105.12 4.8% 4.2% THE PET INDUSTRY HAS NEVER BEEN STRONGER (IN BILLIONS) |
|
|
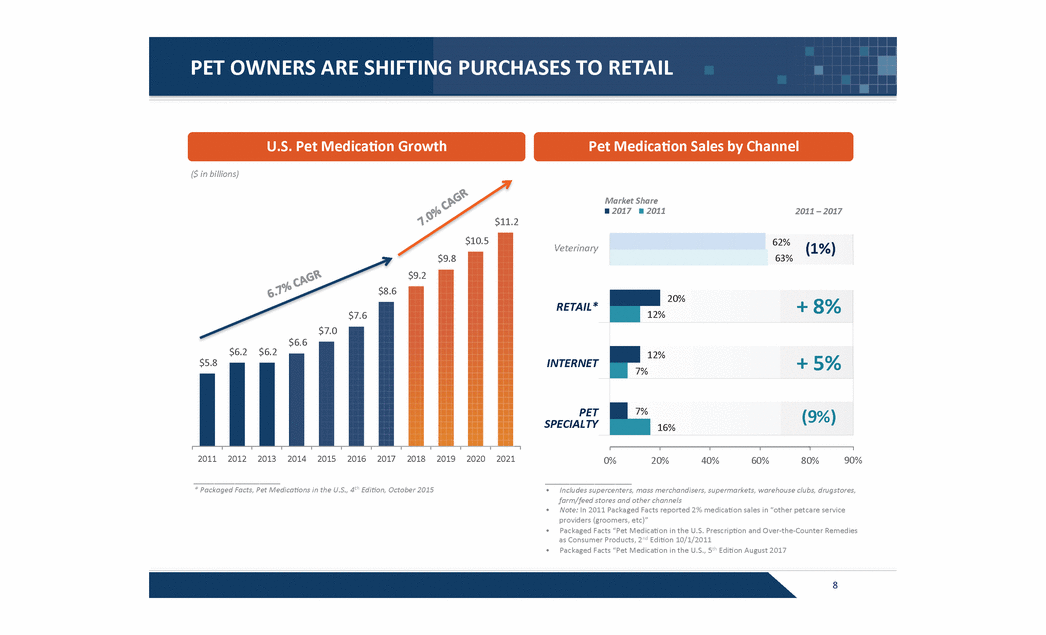
8 $5.8 $6.2 $6.2 $6.6 $7.0 $7.6 $8.6 $9.2 $9.8 $10.5 $11.2 2011 2012 2013 2014 2015 2016 2017 2018 2019 2020 2021 * Packaged Facts, Pet Medications in the U.S., 4th Edition, October 2015 16% 7% 12% 63% 7% 12% 20% 62% 0% 20% 40% 60% 80% 2011 – 2017 Includes supercenters, mass merchandisers, supermarkets, warehouse clubs, drugstores, farm/feed stores and other channels Note: In 2011 Packaged Facts reported 2% medication sales in “other petcare service providers (groomers, etc)” Packaged Facts “Pet Medication in the U.S. Prescription and Over-the-Counter Remedies as Consumer Products, 2nd Edi-on 10/1/2011 Packaged Facts “Pet Medication in the U.S., 5th Edi-on August 2017 U.S. Pet Medication Growth Pet Medication Sales by Channel (1%) + 8% + 5% (9%) ($ in billions) Market Share - 2017 - 2011 Veterinary RETAIL* INTERNET PET SPECIALTY PET OWNERS ARE SHIFTING PURCHASES TO RETAIL 90% 6.7% CAGR 7.0% CAGR |
|
|
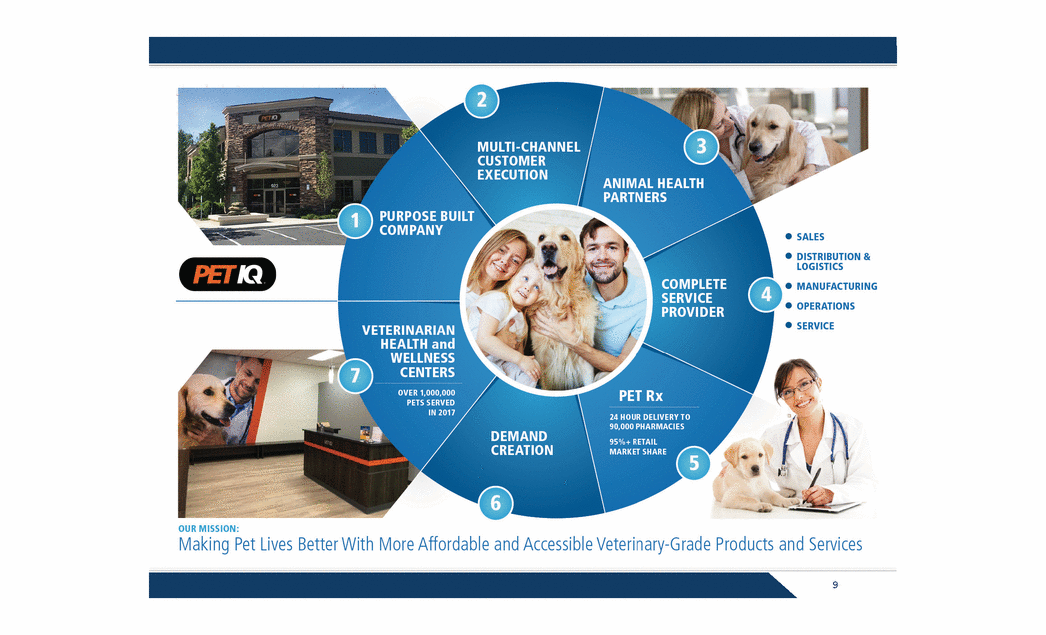
MULTI-CHANNEL CUSTOMER EXECUTION ANIMAL HEALTH PARTNERS COMPLETED SERVICE PROVIDER PET RX 24 HOUR DELIVERY TO 90,000 PHARMACIES 95%+ RETAIL MARKET SHARE DEMAND CREATION VETERINARIAN HEALTH AND WELLNESS CENTERS OVER 1,000,000 PETS SERVED IN 2017 PURPOSE BUILT COMPANY SALES DISTRIBUTION & LOGISTICS MANUFACTURING OPERATIONS SERVICE OUR MISSION MAKING PET LIVES BETTER WITH MORE AFFORDABLE AND ACCESSIBLE VETERINARY-GRADE PRODUCTS AND SERVICES.1 2 3 4 5 6 7 9 |
|
|
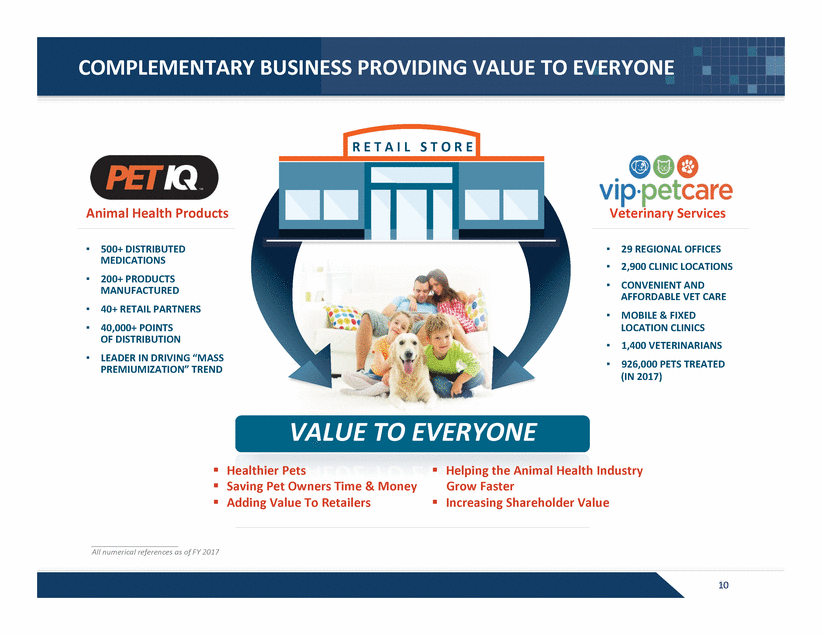
10 VALUE TO EVERYONE R E T A I L S T O R E ▪ 500+ DISTRIBUTED MEDICATIONS ▪ 200+ PRODUCTS MANUFACTURED ▪ 40+ RETAIL PARTNERS ▪ 40,000+ POINTS OF DISTRIBUTION ▪ LEADER IN DRIVING “MASS PREMIUMIZATION” TREND ▪ 29 REGIONAL OFFICES ▪ 2,900 CLINIC LOCATIONS ▪ CONVENIENT AND AFFORDABLE VET CARE ▪ MOBILE & FIXED LOCATION CLINICS ▪ 1,400 VETERINARIANS ▪ 926,000 PETS TREATED (IN 2017) ! Healthier Pets ! Saving Pet Owners Time & Money ! Adding Value To Retailers ! Helping the Animal Health Industry Grow Faster ! Increasing Shareholder Value Animal Health Products Veterinary Services COMPLEMENTARY BUSINESS PROVIDING VALUE TO EVERYONE |
|
|
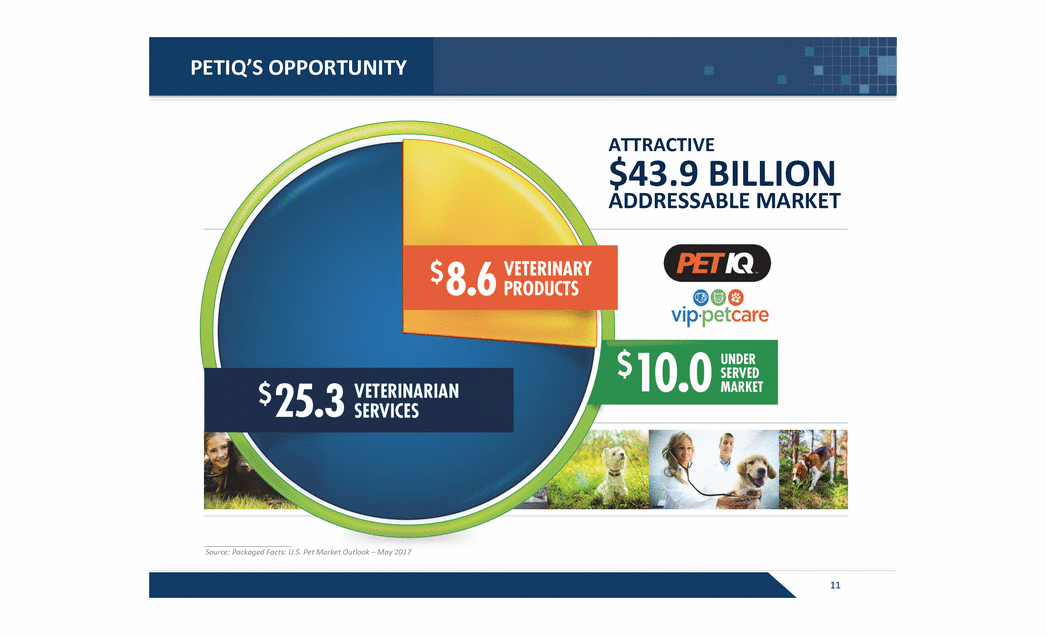
Petiq’s opportunity attractive $43.9 billion addressable market $8.6 veterinary products vip petcare $ 10.0 under served market $ 25.3 veterinarian services source: packaged facts: u.s. pet Market outlook – may 2017 11 |
|
|
12 CORD CHRISTENSEN CHIEF EXECUTIVE OFFICER VETERINARY CLINIC INFORMATION |
|
|
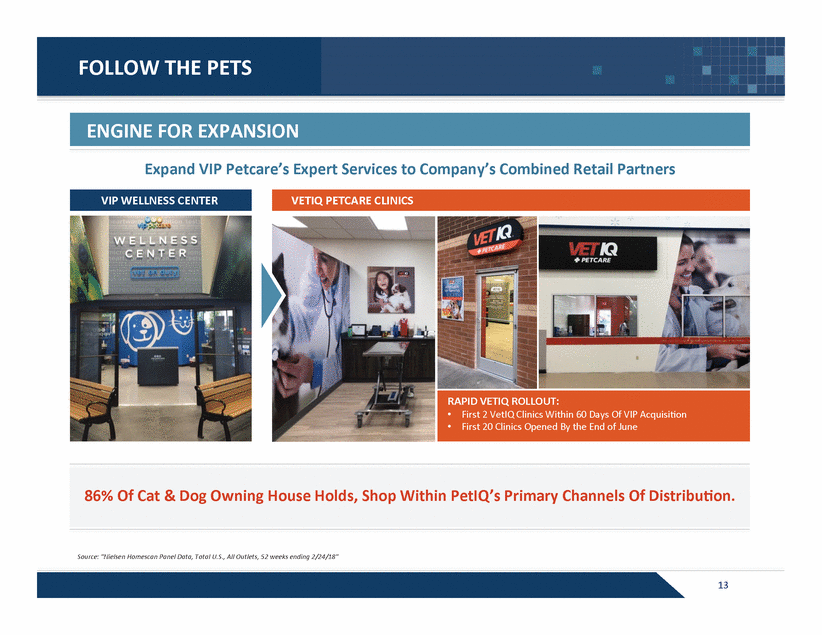
13 FOLLOW THE PETS VIP WELLNESS CENTER VETIQ PETCARE CLINICS 86% Of Cat & Dog Owning House Holds, Shop Within PetIQ’s Primary Channels Of Distribution. RAPID VETIQ ROLLOUT: ENGINE FOR EXPANSION Expand VIP Petcare’s Expert Services to Company’s Combined Retail Partners • First 2 VetIQ Clinics Within 60 Days Of VIP Acquisition • First 20 Clinics Opened By the End of June Source: "Nielsen Homescan Panel Data, Total U.S., All Outlets, 52 weeks ending 2/24/18" |
|
|
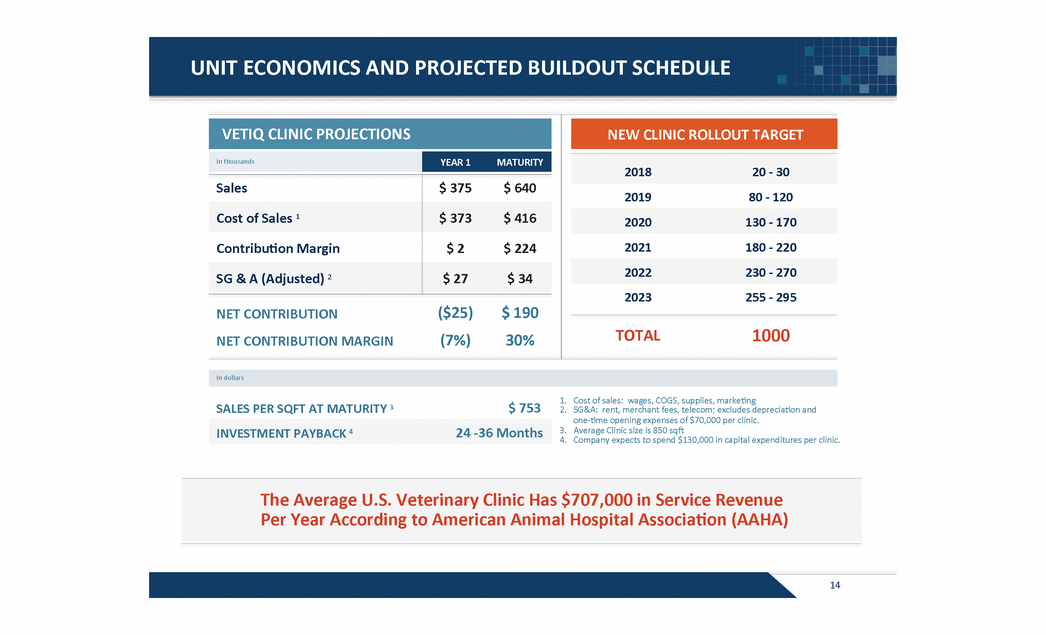
SALES PER SQFT AT MATURITY 3 $ 753 INVESTMENT PAYBACK 4 24 -36 Months 2018 20 - 30 2019 80 - 120 2020 130 - 170 2021 180 - 220 2022 230 - 270 2023 255 - 295 TOTAL 1000 YEAR 1 MATURITY Sales $ 375 $ 640 Cost of Sales 1 $ 373 $ 416 Contribution Margin $ 2 $ 224 SG & A (Adjusted) 2 $ 27 $ 34 NET CONTRIBUTION ($25) $ 190 NET CONTRIBUTION MARGIN (7%) 30% 14 VETIQ CLINIC PROJECTIONS 1. Cost of sales: wages, COGS, supplies, marketing 2. SG&A: rent, merchant fees, telecom; excludes depreciation and one--me opening expenses of $70,000 per clinic. 3. Average Clinic size is 850 sqft 4. Company expects to spend $130,000 in capital expenditures per clinic. The Average U.S. Veterinary Clinic Has $707,000 in Service Revenue Per Year According to American Animal Hospital Association (AAHA) NEW CLINIC ROLLOUT TARGET UNIT ECONOMICS AND PROJECTED BUILDOUT SCHEDULE In thousands In dollars |
|
|
15 JOHN NEWLAND CHIEF FINANCIAL OFFICER PRO FORMA REVIEW |
|
|
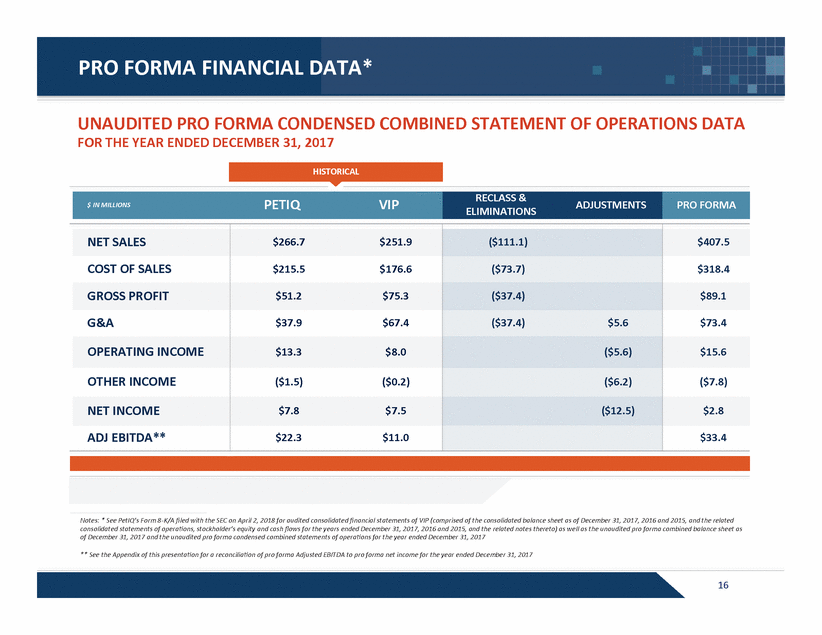
16 PRO FORMA FINANCIAL DATA* HISTORICAL $ IN MILLIONS PETIQ VIP RECLASS & ELIMINATIONS ADJUSTMENTS PRO FORMA NET SALES $266.7 $251.9 ($111.1) $407.5 COST OF SALES $215.5 $176.6 ($73.7) $318.4 GROSS PROFIT $51.2 $75.3 ($37.4) $89.1 G&A $37.9 $67.4 ($37.4) $5.6 $73.4 OPERATING INCOME $13.3 $8.0 ($5.6) $15.6 OTHER INCOME ($1.5) ($0.2) ($6.2) ($7.8) NET INCOME $7.8 $7.5 ($12.5) $2.8 ADJ EBITDA** $22.3 $11.0 $33.4 UNAUDITED PRO FORMA CONDENSED COMBINED STATEMENT OF OPERATIONS DATA FOR THE YEAR ENDED DECEMBER 31, 2017 Notes: * See PetIQ’s Form 8-K/A filed with the SEC on April 2, 2018 for audited consolidated financial statements of VIP (comprised of the consolidated balance sheet as of December 31, 2017, 2016 and 2015, and the related consolidated statements of operations, stockholder’s equity and cash flows for the years ended December 31, 2017, 2016 and 2015, and the related notes thereto) as well as the unaudited pro forma combined balance sheet as of December 31, 2017 and the unaudited pro forma condensed combined statements of operations for the year ended December 31, 2017 ** See the Appendix of this presentation for a reconciliation of pro forma Adjusted EBITDA to pro forma net income for the year ended December 31, 2017 |
|
|
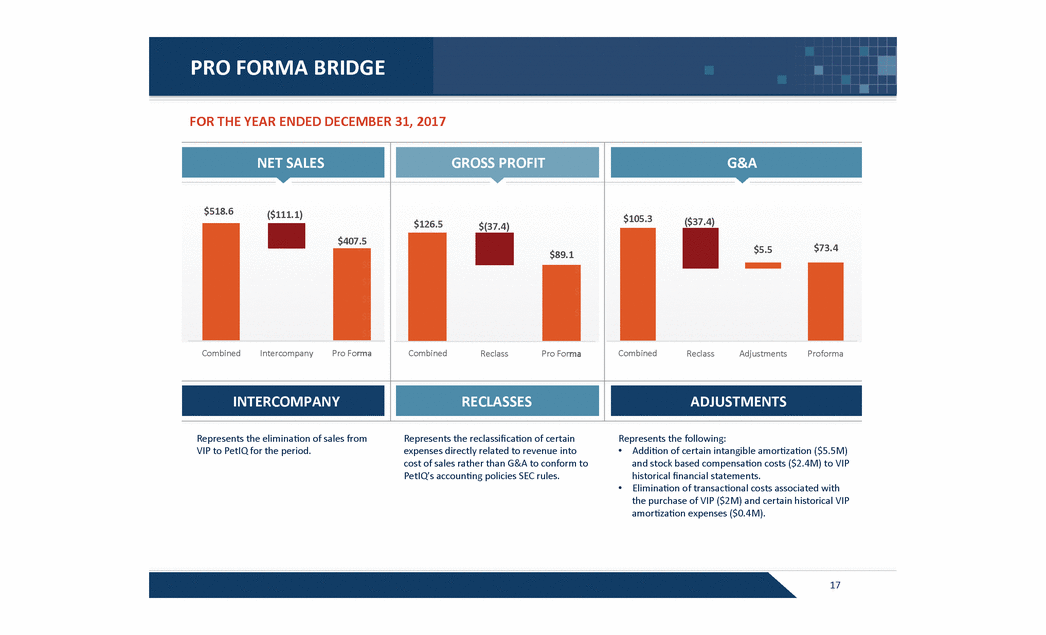
17 PRO FORMA BRIDGE FOR THE YEAR ENDED DECEMBER 31, 2017 NET SALES GROSS PROFIT G&A $518.6 ($111.1) $407.5 Combined Intercompany Pro Forma $126.5 $(37.4) $89.1 Combined Reclass Pro Forma $105.3 ($37.4) $5.5 $73.4 Combined Reclass Adjustments Proforma INTERCOMPANY RECLASSES ADJUSTMENTS Represents the elimination of sales from VIP to PetIQ for the period. Represents the reclassification of certain expenses directly related to revenue into cost of sales rather than G&A to conform to PetIQ’s accounting policies SEC rules. Represents the following: • Addition of certain intangible amortization ($5.5M) and stock based compensation costs ($2.4M) to VIP historical financial statements. • Elimination of transactional costs associated with the purchase of VIP ($2M) and certain historical VIP amortization expenses ($0.4M). |
|
|
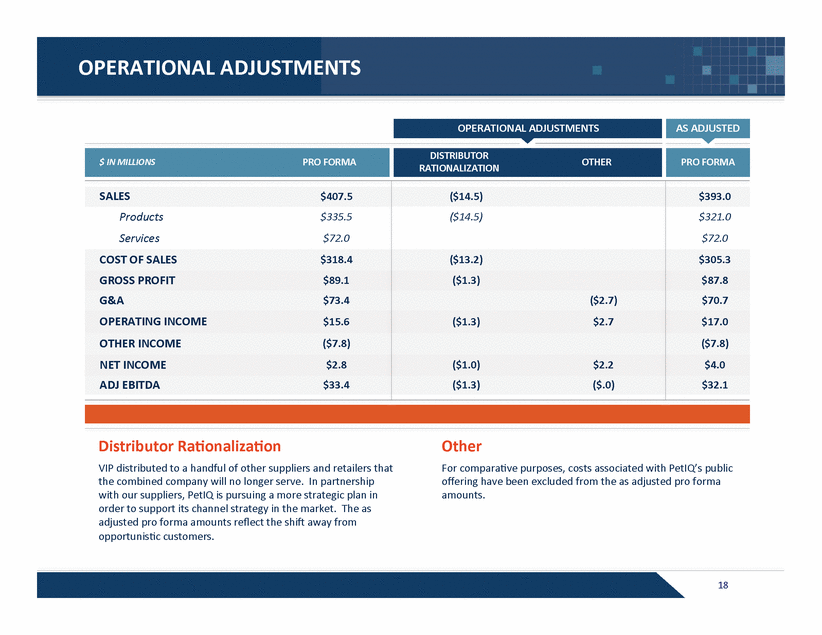
18 OPERATIONAL ADJUSTMENTS OPERATIONAL ADJUSTMENTS AS ADJUSTED $ IN MILLIONS PRO FORMA DISTRIBUTOR RATIONALIZATION OTHER PRO FORMA SALES $407.5 ($14.5) $393.0 Products $335.5 ($14.5) $321.0 Services $72.0 $72.0 COST OF SALES $318.4 ($13.2) $305.3 GROSS PROFIT $89.1 ($1.3) $87.8 G&A $73.4 ($2.7) $70.7 OPERATING INCOME $15.6 ($1.3) $2.7 $17.0 OTHER INCOME ($7.8) ($7.8) NET INCOME $2.8 ($1.0) $2.2 $4.0 ADJ EBITDA $33.4 ($1.3) ($.0) $32.1 Distributor Rationalization VIP distributed to a handful of other suppliers and retailers that the combined company will no longer serve. In partnership with our suppliers, PetIQ is pursuing a more strategic plan in order to support its channel strategy in the market. The as adjusted pro forma amounts reflect the shift away from opportunistic customers. Other For comparative purposes, costs associated with PetIQ’s public offering have been excluded from the as adjusted pro forma amounts. |
|
|
19 JOHN NEWLAND CHIEF FINANCIAL OFFICER 2018 AND BEYOND |
|
|
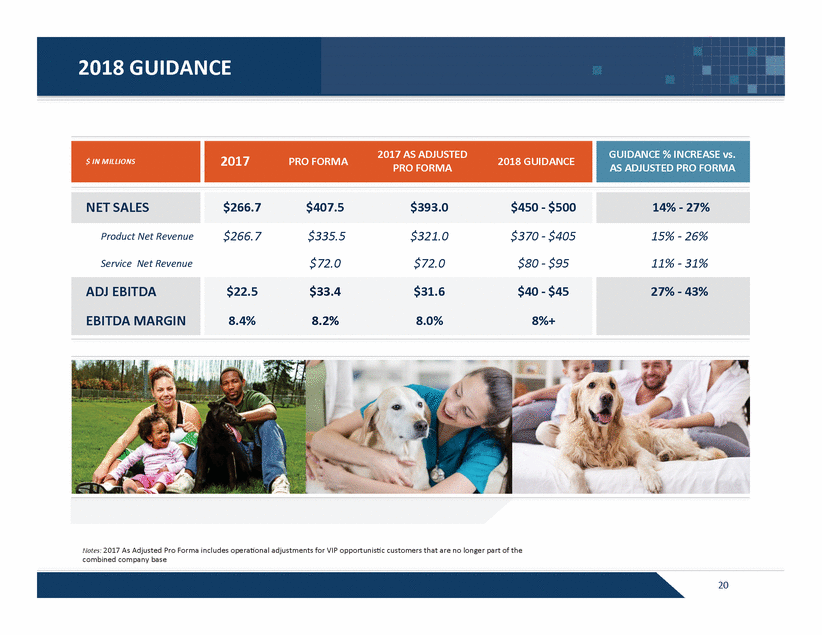
20 2018 GUIDANCE $ IN MILLIONS 2017 PRO FORMA 2017 AS ADJUSTED PRO FORMA 2018 GUIDANCE GUIDANCE % INCREASE vs. AS ADJUSTED PRO FORMA NET SALES $266.7 $407.5 $393.0 $450 - $500 14% - 27% Product Net Revenue $266.7 $335.5 $321.0 $370 - $405 15% - 26% Service Net Revenue $72.0 $72.0 $80 - $95 11% - 31% ADJ EBITDA $22.5 $33.4 $31.6 $40 - $45 27% - 43% EBITDA MARGIN 8.4% 8.2% 8.0% 8%+ Notes: 2017 As Adjusted Pro Forma includes operational adjustments for VIP opportunistic customers that are no longer part of the combined company base |
|
|
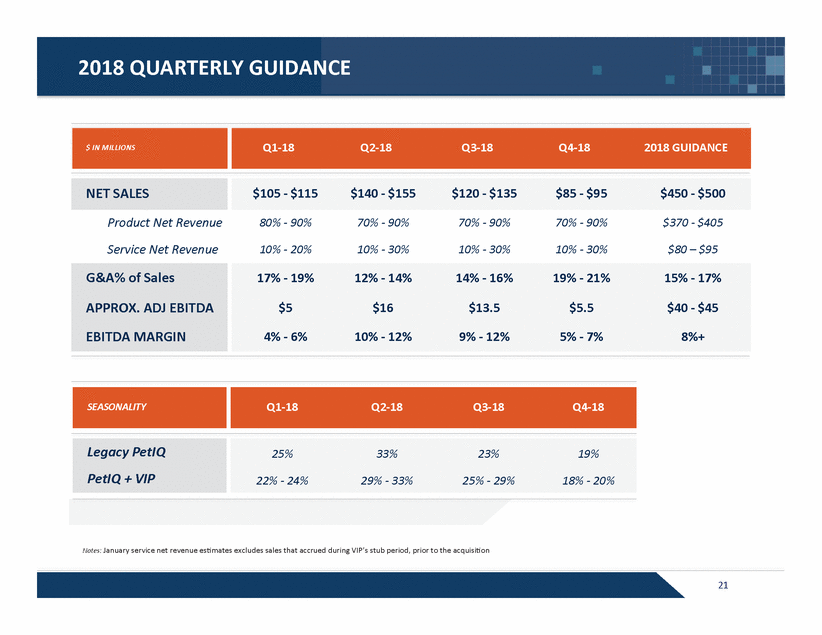
$ IN MILLIONS Q1-18 Q2-18 Q3-18 Q4-18 2018 GUIDANCE NET SALES $105 - $115 $140 - $155 $120 - $135 $85 - $95 $450 - $500 Product Net Revenue 80% - 90% 70% - 90% 70% - 90% 70% - 90% $370 - $405 Service Net Revenue 10% - 20% 10% - 30% 10% - 30% 10% - 30% $80 – $95 G&A% of Sales 17% - 19% 12% - 14% 14% - 16% 19% - 21% 15% - 17% APPROX. ADJ EBITDA $5 $16 $13.5 $5.5 $40 - $45 EBITDA MARGIN 4% - 6% 10% - 12% 9% - 12% 5% - 7% 8%+ 21 SEASONALITY Q1-18 Q2-18 Q3-18 Q4-18 Legacy PetIQ 25% 33% 23% 19% PetIQ + VIP 22% - 24% 29% - 33% 25% - 29% 18% - 20% 2018 QUARTERLY GUIDANCE Notes: January service net revenue estimates excludes sales that accrued during VIP’s stub period, prior to the acquisition |
|
|
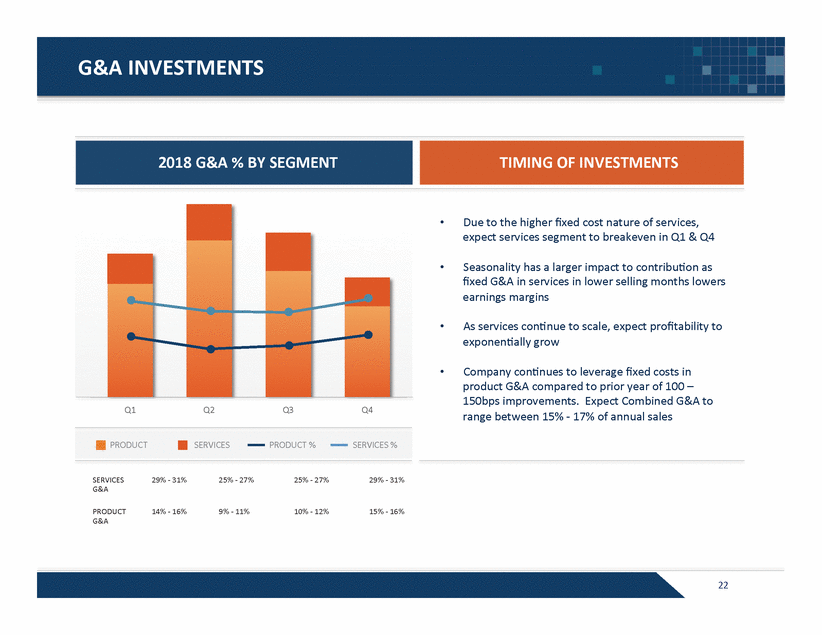
-10.0% 0.0% 10.0% 20.0% 30.0% 40.0% 50.0% 60.0% 70.0% 0.0 20.0 40.0 60.0 80.0 100.0 120.0 140.0 Q1 Q2 Q3 Q4 PRODUCT SERVICES PRODUCT % RETAIL % 22 2018 G&A % BY SEGMENT TIMING OF INVESTMENTS 29% - 31% 25% - 27% 25% - 27% 29% - 31% 14% - 16% 9% - 11% 10% - 12% 15% - 16% SERVICES G&A • Due to the higher fixed cost nature of services, expect services segment to breakeven in Q1 & Q4 • Seasonality has a larger impact to contribution as fixed G&A in services in lower selling months lowers earnings margins • As services continue to scale, expect profitability to exponentially grow Company continues to leverage fixed costs in product G&A compared to prior year of 100 – 150bps improvements. Expect Combined G&A to range between 15% - 17% of annual sales PRODUCT G&A G&A INVESTMENTS PRODUCT SERVICES PRODUCT % SERVICES % |
|
|
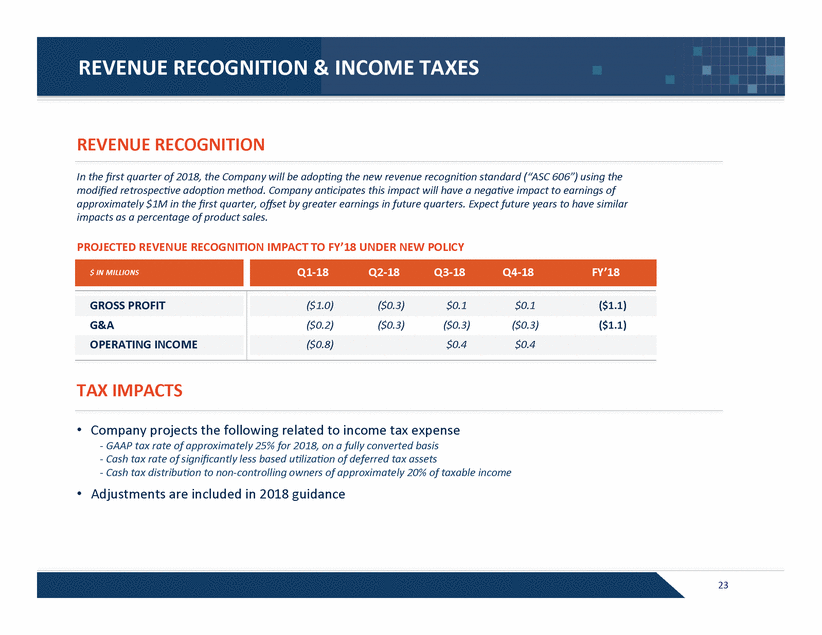
23 REVENUE RECOGNITION In the first quarter of 2018, the Company will be adopting the new revenue recognition standard (“ASC 606”) using the modified retrospective adoption method. Company anticipates this impact will have a negative impact to earnings of approximately $1M in the first quarter, offset by greater earnings in future quarters. Expect future years to have similar impacts as a percentage of product sales. PROJECTED REVENUE RECOGNITION IMPACT TO FY’18 UNDER NEW POLICY TAX IMPACTS Company projects the following related to income tax expense GAAP tax rate of approximately 25% for 2018, on a fully converted basis Cash tax rate of significantly less based utilization of deferred tax assets Cash tax distribution to non-controlling owners of approximately 20% of taxable income Adjustments are included in 2018 guidance $ IN MILLIONS Q1-18 Q2-18 Q3-18 Q4-18 FY’18 GROSS PROFIT ($1.0) ($0.3) $0.1 $0.1 ($1.1) G&A ($0.2) ($0.3) ($0.3) ($0.3) ($1.1) OPERATING INCOME ($0.8) $0.4 $0.4 REVENUE RECOGNITION & INCOME TAXES |
|
|
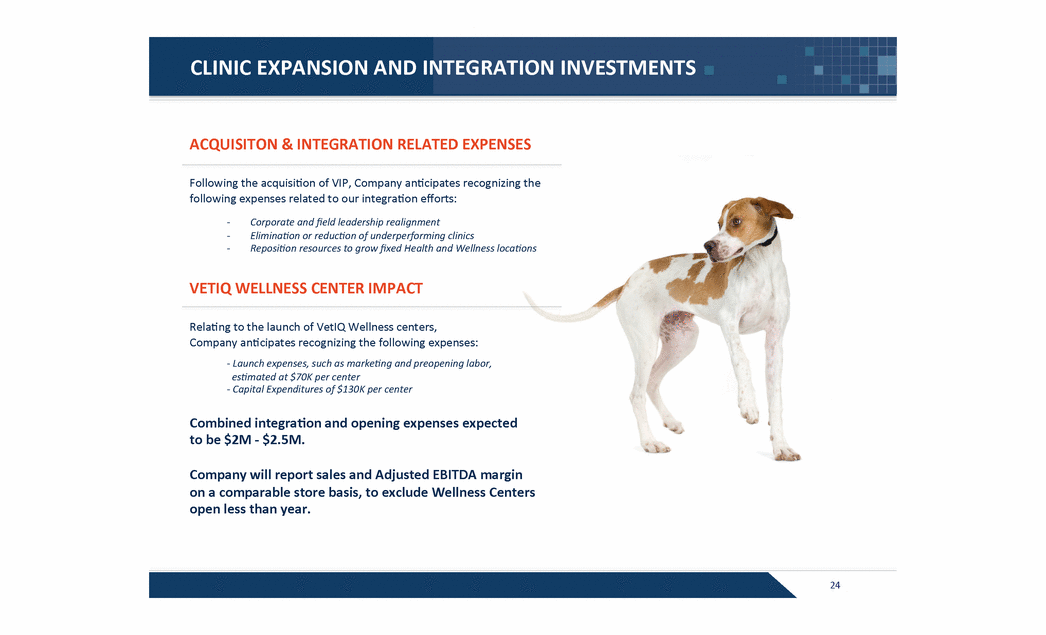
CLINIC EXPANSION AND INTEGRATION INVESTMENTS ACQUISITON & INTEGRATION RELATED EXPENSES Following the acquisition of VIP, Company anticipates recognizing the following expenses related to our integration efforts: - Corporate and field leadership realignment - Elimination or reduction of underperforming clinics - Reposition resources to grow fixed Health and Wellness locations VETIQ WELLNESS CENTER IMPACT Relating to the launch of VetIQ Wellness centers, Company anticipates recognizing the following expenses: - Launch expenses, such as marketing and preopening labor, estimated at $70K per center - Capital Expenditures of $130K per center Combined integration and opening expenses expected to be $2M - $2.5M. Company will report sales and Adjusted EBITDA margin on a comparable store basis, to exclude Wellness Centers open less than year. |
|
|
AREAS IMPACTING 1st QUARTER RESULTS QUARTERLY SALES CADENCE & PRODUCT MIX Seasonal Cadence Anticipate first quarter sales to be 21%-24% of total annual volume, down from 25% in prior year. Product Mix Approximately 150 bps in margin declines largely driven by increase mix towards distributed product. - Revenue Recognition Company anticipates this impact will have a negative impact to earnings of approximately $1M in the first quarter, offset by greater earnings in future quarters. G&A INVESTMENTS Anticipate G&A to increase year over year in Q1 related to the fixed cost nature of services and seasonality. RESTRUCTURING, NEW CLINIC & SERVICE COSTS Integration Costs and Clinic Closures VetIQ Opening Expenses |
|
|
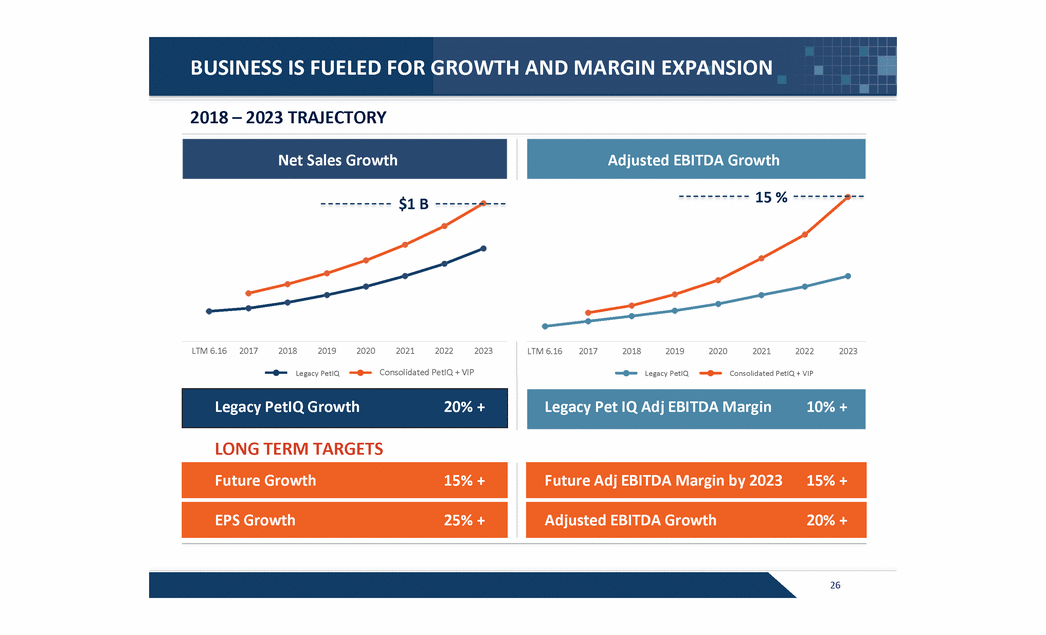
26 BUSINESS IS FUELED FOR GROWTH AND MARGIN EXPANSION 2018 – 2023 TRAJECTORY Net Sales Growth Adjusted EBITDA Growth LTM 6.16 2017 2018 2019 2020 2021 2022 2023 Legacy PetIQ Follow the Pets LTM 6.16 2017 2018 2019 2020 2021 2022 2023 Legacy PetIQ Follow the Pets $1 B 15 % Consolidated PetIQ + VIP Legacy PetIQ Legacy PetIQ Consolidated PetIQ + VIP EPS Growth 25% + Adjusted EBITDA Growth 20% + Future Growth 15% + Legacy PetIQ Growth 20% + Future Adj EBITDA Margin by 2023 15% + Legacy Pet IQ Adj EBITDA Margin 10% + LONG TERM TARGETS |
|
|
27 CORD CHRISTENSEN CHIEF EXECUTIVE OFFICER QUESTIONS AND ANSWERS JOHN NEWLAND CHIEF FINANCIAL OFFICER |
|
|
28 APPENDIX 28 APPENDIX |
|
|
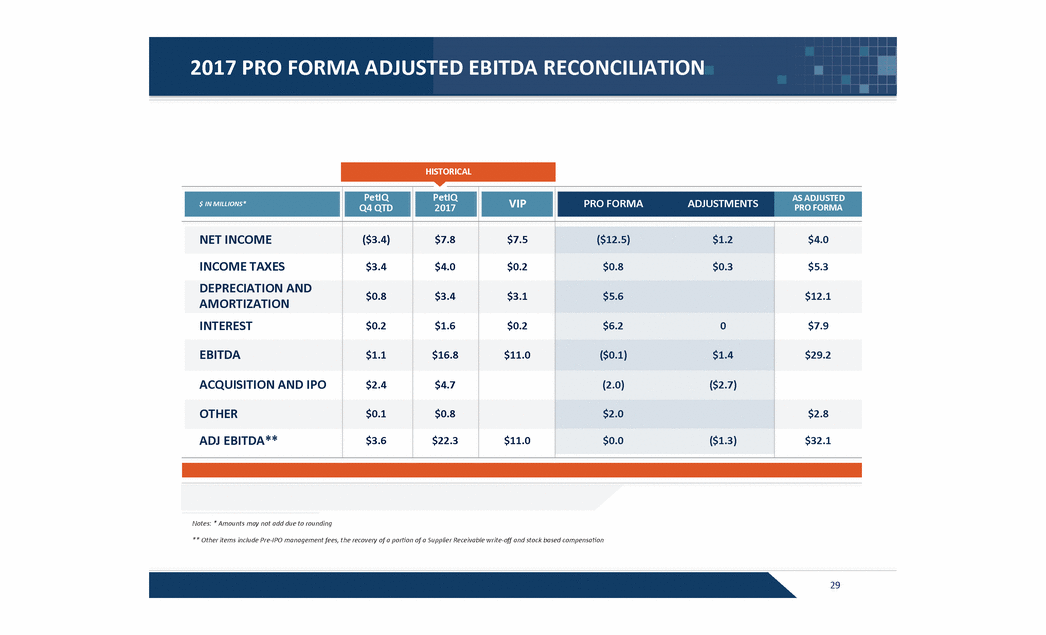
29 HISTORICAL $ IN MILLIONS* PetIQ Q4 QTD PetIQ 2017 VIP PRO FORMA ADJUSTMENTS AS ADJUSTED PRO FORMA NET INCOME ($3.4) $7.8 $7.5 ($12.5) $1.2 $4.0 INCOME TAXES $3.4 $4.0 $0.2 $0.8 $0.3 $5.3 DEPRECIATION AND AMORTIZATION $0.8 $3.4 $3.1 $5.6 $12.1 INTEREST $0.2 $1.6 $0.2 $6.2 0 $7.9 EBITDA $1.1 $16.8 $11.0 ($0.1) $1.4 $29.2 ACQUISITION AND IPO $2.4 $4.7 (2.0) ($2.7) OTHER $0.1 $0.8 $2.0 $2.8 ADJ EBITDA** $3.6 $22.3 $11.0 $0.0 ($1.3) $32.1 Notes: * Amounts may not add due to rounding ** Other items include Pre-IPO management fees, the recovery of a portion of a Supplier Receivable write-off and stock based compensation 2017 PRO FORMA ADJUSTED EBITDA RECONCILIATION |
|
|
30 |

