Attached files
| file | filename |
|---|---|
| EX-32.1 - EXHIBIT 32.1 - Net Element, Inc. | tv489318_ex32-1.htm |
| EX-31.2 - EXHIBIT 31.2 - Net Element, Inc. | tv489318_ex31-2.htm |
| EX-31.1 - EXHIBIT 31.1 - Net Element, Inc. | tv489318_ex31-1.htm |
| EX-23.1 - EXHIBIT 23.1 - Net Element, Inc. | tv489318_ex23-1.htm |
| EX-21.1 - EXHIBIT 21.1 - Net Element, Inc. | tv489318_ex21-1.htm |
UNITED STATES
SECURITIES AND EXCHANGE COMMISSION
Washington, D.C. 20549
FORM 10-K
(Mark One)
x ANNUAL REPORT PURSUANT TO SECTION 13 OR 15(d) OF THE SECURITIES EXCHANGE ACT OF 1934
For the fiscal year ended December 31, 2017
OR
¨ TRANSITION REPORT PURSUANT TO SECTION 13 OR 15(d) OF THE SECURITIES EXCHANGE ACT OF 1934
For the transition period from __________ to __________
Commission file number: 001-34887

Net Element, Inc.
(Exact name of registrant as specified in its charter)
| Delaware | 90-1025599 | |
| (State or other jurisdiction of incorporation or organization) |
(I.R.S. Employer Identification No.) |
| 3363 NE 163rd Street, Suite 705 North Miami Beach, FL |
33160 | |
| (Address of principal executive offices) | (Zip Code) |
Registrant’s telephone number, including area code: (305) 507-8808
Securities registered under Section 12(b) of the Exchange Act:
| Title of each class | Name of each exchange on which registered | |
| Common Stock, par value $0.0001 per share | NASDAQ Capital Market |
Securities registered under Section 12(g) of the Exchange Act:
| Warrants, each exercisable for one share of Common Stock |
| (Title of class) |
Indicate by check mark if the registrant is a well-known seasoned issuer, as defined in Rule 405 of the Securities Act. ¨ YES x NO
Indicate by check mark if the registrant is not required to file reports pursuant to Section 13 or Section 15(d) of the Act. ¨ YES x NO
Indicate by check mark whether the registrant (1) has filed all reports required to be filed by Section 13 or 15(d) of the Securities Exchange Act of 1934 during the preceding 12 months (or for such shorter period that the registrant was required to file such reports), and (2) has been subject to such filing requirements for the past 90 days. x YES ¨ NO
Indicate by check mark whether the registrant has submitted electronically and posted on its corporate Web site, if any, every Interactive Data File required to be submitted and posted pursuant to Rule 405 of Regulation S-T (§ 232.405 of this chapter) during the preceding 12 months (or for such shorter period that the registrant was required to submit and post such files). x YES ¨ NO
Indicate by check mark if disclosure of delinquent filers pursuant to Item 405 of Regulation S-K (§ 229.405 of this chapter) is not contained herein, and will not be contained, to the best of registrant’s knowledge, in definitive proxy or information statements incorporated by reference in Part III of this Form 10-K or any amendment to this Form 10-K. ¨
Indicate by check mark whether the registrant is a large accelerated filer, an accelerated filer, a non-accelerated filer, a smaller reporting company, or an emerging growth company. See the definitions of "large accelerated filer," "accelerated filer," "smaller reporting company," and “emerging growth company” in Rule 12b-2 of the Exchange Act.
| Large accelerated filer ¨ | Accelerated filer ¨ |
| Non-accelerated filer ¨ (Do not check if a smaller reporting company) | Smaller reporting company x |
| Emerging growth company ¨ |
If an emerging growth company, indicate by check mark if the registrant has elected not to use the extended transition period for complying with any new or revised financial accounting standards provided pursuant to Section 13(a) of the Exchange Act. ¨
Indicate by check mark whether the registrant is a shell company (as defined in Rule 12b-2 of the Act). ¨ YES x NO
The aggregate market value of the registrant’s common equity, other than shares held by persons who may be deemed affiliates of the registrant, as of June 30, 2017 was approximately $8,996,491.
The registrant had 3,862,352 shares of common stock outstanding as of March 29, 2018.
DOCUMENTS INCORPORATED BY REFERENCE
None.
Forward-Looking Statements
This Annual Report on Form 10-K (this “Report”), including the section entitled “Management’s Discussion and Analysis of Financial Conditions and Results of Operation” and “Risk Factors”, contains forward-looking statements within the meaning of Section 27A of the Securities Act of 1933, as amended, and Section 21E of the Securities Exchange Act of 1934, as amended. You should not rely upon forward-looking statements as predictions of future events. The events and circumstances reflected in the forward-looking statements may not be achieved or occur. All statements other than statements of historical fact, including, statements regarding our future results of operations and financial position, our business strategy and plans, our objectives for future operations, and any statements of a general economic or industry specific nature, are forward-looking statements. You can identify forward-looking statements by the fact that they do not relate strictly to historical or current facts. Forward-looking statements generally are identified by the words “expects,” “anticipates,” “believes,” “intends,” “estimates,” “aims,” “plans,” “may,” “will,” “continue,” “seeks,” “should,” “believe,” “potential” or the negative of such terms and similar expressions. We have based these forward-looking statements largely on our current expectations and projections about future events and trends that we believe, based on information currently available to our management, may affect our financial condition, results of operations, business strategy, short-term and long-term business operations and objectives, and financial needs. These forward-looking statements are subject to a number of risks, uncertainties and assumptions, including those described in the "Risk Factors" section in Part I, Item 1A of this Report. Moreover, we operate in a very competitive and rapidly changing environment.
If these or other risks and uncertainties (including those described in Part I, Item 1A of this Report and the Company’s subsequent filings with the U.S. Securities and Exchange Commission (the “SEC” or the “Commission”)) materialize, or if the assumptions underlying any of these statements prove incorrect, the Company’s actual results may be materially different from those expressed or implied by such statements. We undertake no obligation to publicly revise any forward-looking statement to reflect circumstances or events after the date of this Report to reflect the occurrence of unanticipated events. You should, however, review the factors and risks described in the reports we file from time-to-time with the SEC after the date of this Report. These factors include, among other factors:
| ■ | the impact of any new or changes made to laws, regulations, card network rules or other industry standards affecting our business; | |
| ■ | the impact of any significant chargeback liability and liability for merchant or customer fraud, which we may not be able to accurately anticipate and/or collect; | |
| ■ | our ability to secure or successfully migrate merchant portfolios to new bank sponsors if current sponsorships are terminated; | |
| ■ | our and our bank sponsors’ ability to adhere to the standards of Visa and MasterCard payment card brand; | |
| ■ | our reliance on third-party processors and service providers; | |
| ■ | our dependence on independent sales groups (“ISGs”) that do not serve us exclusively to introduce us to new merchant accounts; | |
| ■ | our ability to pass along increases in interchange costs and other costs to our merchants; | |
| ■ | our ability to protect against unauthorized disclosure of merchant and cardholder data, whether through breach of our computer systems or otherwise; | |
| ■ | the effect of the loss of key personnel on our relationships with ISGs, card brands, bank sponsors and our other service providers; | |
| ■ | the effects of increased competition, which could adversely impact our financial performance; | |
| ■ | the impact of any increase in attrition due to an increase in closed merchant accounts and/or a decrease in merchant charge volume that we cannot anticipate or offset with new accounts; | |
| ■ | the effect of adverse business conditions on our merchants; | |
| ■ | our ability to adopt technology to meet changing industry and customer needs or trends; | |
| ■ | the impact of any decline in the use of credit cards as a payment mechanism for consumers or adverse developments with respect to the credit card industry in general; | |
| ■ | the impact of any adverse conditions in industries in which we obtain a substantial amount of our bankcard processing volume; | |
| ■ | the impact of seasonality on our operating results; | |
| ■ | the impact of any failure in our systems due to factors beyond our control; | |
| ■ | the impact of any material breaches in the security of third-party processing systems we use; | |
| ■ | the impact of any new and potential governmental regulations designed to protect or limit access to consumer information; | |
| ■ | the impact on our profitability if we are required to pay federal, state or local taxes on transaction processing; | |
| ■ | the impact on our growth and profitability if the markets for the services that we offer fail to expand or if such markets contract; | |
| ■ | significant losses we have incurred and may continue to experience in the future; | |
| ■ | foreign laws and regulations, which are subject to change and uncertain interpretation; | |
| ■ | geopolitical instability and other conditions that may adversely affect trends in consumer, business and government spending; | |
| ■ | the Company’s ability (or inability) to obtain additional financing in sufficient amounts or on acceptable terms when needed; | |
| ■ | the impact on our operating results as a result of impairment of our goodwill and intangible assets; | |
| ■ | our material weaknesses in internal control over financial reporting and our ability to maintain effective controls over financial reporting in the future; and | |
| ■ | the other factors identified in the section of this Report entitled “Risk Factors.” |
World Wide Web addresses contained in this Report are for explanatory purposes only and they (and the content contained therein) do not form a part of, and are not incorporated by reference into, this Report.
TABLE OF CONTENTS
| 3 |
Net Element, Inc., (“Net Element”) a Delaware corporation, is a holding company that conducts its operations through its subsidiaries. Net Element and its subsidiaries are referred to collectively as the “Company,” “Net Element,” “we,” “us,” or “our,” unless the context requires otherwise.
Company Overview
Net Element is a global technology and value-added solutions group that supports electronic payments acceptance in a multi-channel environment including point-of-sale (POS), ecommerce and mobile devices. The Company operates two business segments as a provider of North American Transaction Solutions and International Transaction Solutions. Additionally, we have corporate overhead broken out in our segment reporting.
We offer a broad range of payment acceptance and processing services that enable merchants of all sizes to accept and process over 100 different payment options in more than 120 currencies, including credit, debit, prepaid and alternative payments. We also provide merchants with value-added services and technologies including integrated payment technologies, POS solutions, security solutions, fraud management, information solutions and analytical tools.
We believe that our technology-centered value-added service offerings and the payments ecosystem differentiate us from the competition. It enables us to efficiently provide a comprehensive suite of services to clients across the value chain of commerce-enabling services and technologies as well as to innovate, develop and deploy new services, while providing us with significant economies of scale. Our broad and varied distribution includes sales channels, such as our direct and indirect sales forces, referral partners and value-added resellers, which provide us with a growing and diverse client base of merchants. We believe this combination of attributes provides us with the competitive advantages that generate strong growth by enabling us to efficiently manage, update and maintain our technology, to utilize technology integration and value-added services to expand our new sales and distribution, and to realize significant operating leverage. We create our value-added solutions from a suite of proprietary technology products, software, cloud-based applications, processing services, security offerings, and customer support programs that we configure to meet our clients’ individual needs.
We provide additional services through our portfolio of brands including:
| · | Unified Payments – payment acceptance solutions, including POS solutions and value-added services throughout the United States; |
| · | Unified m-POS – easy-to-use mobile application that provides the functionalities that small to medium sized businesses (“SMB”) need to accept and manage transactions in a neat and easy to use interface, which is EMV-compliant, accepts traditional and contactless transactions such as Apple Pay®. Unified m-POS application is available for download in Apple’s App Store and Google Play; | |
| · | Aptito – proprietary cloud-based POS platform for the hospitality industry and SMB merchants; |
| · | Restoactive – seamless visual POS integration that modernizes experience in the restaurant POS environment and behind the scenes. Integration ready for over 500,000 restaurants in the United States; | |
| · | Zero Pay – zero-fee payment acceptance program for SMB merchants in the United States. Zero Pay program saves merchants costs involved in accepting credit and debit cards using mobile POS by passing the cost to the consumer; | |
| · | PayOnline – proprietary integrated, global e-commerce and mobile payments processing platform and fraud management system; |
| · | Pay-Travel – integrated payment processing solutions to the travel industry, which includes integrations with various Global Distribution Systems (“GDS”) such as Amadeus®, Galileo®, Sabre®, additional geo filters and passenger name record (PNR) through Pay-Travel service offered by PayOnline; |
| · | Sales Central – designed to enhance responsiveness of our indirect non-bank sales forces (“Sales Partners”) and improve sales efficiency. The cloud-based solution provides to both Sales Partners and merchants an integrated toolkit to more effectively manage a variety of sales, operations, reporting and accounting functions; | |
| · | Netevia – future-ready multi-channel payments platform developed by in-house Net Element Software team (software-as-a-service “SaaS” and White Label models) and available across all brands. Connecting and simplifying payments across sales channels through a single integration point, Netevia delivers end-to-end payment processing through easy-to-use APIs.; and |
| · | Digital Provider – integrated direct-carrier, mobile operator solution for smaller content providers and merchants throughout selected international markets. |
We have operations and offices located within the United States (“U.S.”) (domestic) and outside of the U.S. (international) where sales, customer service and/or administrative personnel are based. Through U.S. based subsidiaries, we generate revenues from transactional services, valued-added payment services and technologies for SMBs. Through wholly owned subsidiaries, we operate internationally with a focus on transactional services, mobile payment transactions, online payment transactions, value-added payment services and technologies in selected international markets.
Our business is characterized by transaction related fees, multi-year contracts, and a diverse client base, which allows us to grow alongside our clients. Our multi-year contracts allow us to achieve a high level of recurring revenues with the same clients. While the contracts typically do not specify fixed revenues to be realized thereunder, they do provide a framework for revenues to be generated based on volume of services provided during such contracts’ term.
Recent Developments
During 2017, we completed a number of transactions and other accomplishments in pursuit of our strategy of enhancing financial results, creating a strong operational foundation and competitive advantage. We believe the following transactions and actions have focused and strengthened our company and improved our capital structure and cash flow.
| 4 |
Our primary actions during 2017 were as follows:
| · | Received a $7.55 million institutional investment to support continued organic growth and blockchain focused developments |
| · | Ensured continued compliance with NASDAQ listing requirements |
| · | Ranked as one of the fastest growing companies in North America on Deloitte's 2017 Technology Fast 500™ |
| · | Supported Florida SMB merchants affected by Hurricane Irma with free mobile point of sale credit card readers |
Recent Partnerships:
| · | Joined the Enterprise Ethereum Alliance ("EEA"), the world's largest open-source blockchain initiative with over 250 member companies. Membership to the alliance is complementary to the Company's recently announced decentralized blockchain technology solution, Netevia, that will enable a vast number of value-added services ("VAS") and support the adoption of Ethereum in the enterprise |
| · | Partnered with Elo to provide a modern best-in-class point of sale solution. Combined Aptito POS software with Elo’s all-in-one touchscreen device delivering stylish and reliable POS solution |
| · | Partnered with Payvision in Europe, extended access to global currencies. Expanded payment acceptance to 120+ currencies globally |
| · | Partnered with Planet Payment for multi-currency pricing solution in the United States. Introduced multi-currency payment acceptance to online merchants in the United States |
Recent Product Launches:
| · | Launched multi-channel payments platform, Netevia, connecting and simplifying payments across sales channels through a single integration point, Netevia delivers end-to-end payment processing through easy-to-use APIs. This model complements Net Element's ability to perform in a multi-channel environment, including point-of-sale (POS), e-commerce, mobile devices and will enable the company to perform in blockchain technology solutions when fully-developed |
| · | Launched web-based, integrated same-day ACH and eCheck payment processing solution in the United States |
| · | Launched Zero-Fee processing program for SMB merchants in the United States |
| · | Launched loyalty program for international online merchants utilizing a PayOnline platform |
| · | Launched PayOnline's support for electronic commerce in the United States |
| · | Launched Apple Pay support in Russia |
| · | Launched payment acceptance module for Telegram, Viber, Facebook and VK instant messenger apps |
| · | Expanded payments module to include the Prominent InSales platform. InSales platform which provides access to over 4,000 merchants |
| · | Launched comprehensive point-of-sale program during Unified Payments' "2017 Launch Series" at Northeast Acquirers Association event |
| · | Launched ISO incubator to help certified resellers of Unified Payments grow their business, compete and achieve success in today's evolving marketplace |
| · | Launched fully-integrated payment acceptance for V-Tell, an international mobile network operator |
| · | Launched fully-integrated payment acceptance for Azimuth Airlines |
| · | Added support for iDEAL payment system, the most popular payment system in Netherlands |
Outlook
Our strategy is to ensure that our business remains successful in a rapidly changing market, creating sustainable value for all our stakeholders, including our clients, distribution partners and shareholders. We aim to achieve superior results for our clients by having a deep understanding of their payment acceptance needs, extensive market reach, strong product development and technology enablement.
Planned for 2018:
We will continue to focus on understanding our clients and addressing their payment acceptance needs in core market segments.
| ● | Continue growth in all key segments |
| ● | Drive client retention |
| ● | Expand our client base in selected markets |
| ● | Deliver value-added products to our clients to increase efficiencies and payment acceptance |
| ● | Launch new tools to reach our clients, such as digital channels, and deepening partner relations |
The global payments industry continued to deliver healthy growth during 2017, with underlying transaction volumes demonstrating even greater strength. We believe that new and disruptive technologies will provide us the opportunity to differentiate ourselves from our competition, continue developing and delivering innovative payment solutions in 2018 and beyond.
| ● | Continue to develop Netevia, our next-generation payments platform, enabling intelligent routing of payments for the application development community |
| ● | Continue to scale and enhance new product launches that will add value to our clients |
| ● | Extend our capabilities in next-generation POS hardware and software, and deepening our partner proposition |
| 5 |
| ● | Commence trials of advanced technologies around business intelligence and mobile based payments acceptance |
| ● | Target further developments in blockchain technologies, payments enablement for Internet of Things and biometrics payment acceptance |
| ● | Continue investment in future emerging payment technologies |
Realize the full potential of our business model.
| ● | Deliver stronger organic growth |
| ● | Develop additional payment network relationships to integrate with our technologies |
| ● | Seek acquisition or investment opportunities to deepen our technological and distribution capabilities |
We believe that blockchain technologies will play key roles in future commerce to facilitate transactions and serve as a secure payment platform. We also believe that these technologies will encourage innovation through development of value-added services and cater to both merchants and their customers.
We are developing a decentralized crypto-based ecosystem to act as a framework for a number of value-added services that can connect merchants and consumers directly utilizing blockchain technology while increasing the economic efficiency of all transactions being made within the ecosystem. Specifically, we launched a platform called Netevia that delivers end-to-end payment processing through easy-to-use APIs and complements the Company’s ability to perform in a multi-channel environment, including point-of-sale (POS), e-commerce and mobile devices and will enable the Company to perform in decentralized blockchain technology solutions. We are working to implement additional features on the platform, which will include default value-added modules, such as a payment platform technology solution, peer-to-peer interface solution and blockchain rewards system solution. We expect that the users of our blockchain based payments solution, when such solution is fully implemented, will be able to make payments by using payment options of their preference: fiat money, mainstream and alternative cryptocurrencies. The main function of the blockchain based payments solution is to provide the “one-click” payment technology solution with minimum transaction costs and maximum comfort for the users. We expect that such function will be complementary to our current platform which supports multiple payment methods internationally. We also expect that the peer-to-peer module will allow participants to transact directly using blockchain technology and support conversion and transmittal of multiple payment methods including traditional payment methods, mainstream and alternative cryptocurrencies, and the rewards system that will reward users for active use of the ecosystem and contributions into its development.
In providing such blockchain technology solutions, we will not be holding any deposits, nor trade in, digital assets. We are committed to comply with the government regulations applicable to our blockchain technology solutions.
Our Mission and Vision
Our mission is to power global commerce and allow our clients to conduct business globally. We believe that by understanding the consumer behavior and the needs of our merchants is the most effective and, ultimately, the most profitable means to accomplish our mission and create long-term value for all stakeholders.
We drive client growth through our in-depth knowledge of global transactional services and related value-added service offerings which separate us from the competition.
Our vision is to set the standard for multi-channel payments acceptance and value-added service offerings with focus on creation of unified global transaction acceptance ecosystem. We believe in emerging technologies and as such we are developing a decentralized blockchain ecosystem to support a vast number of value-added decentralized applications (“dApps”), which will provide value to our clients.
In order to achieve this vision, we seek to further develop single on-boarding, global transaction acceptance ecosystem. Manifesting this vision requires scaling our direct and indirect connectivity to multiple payment and mobile networks internationally. By implementing this vision, we believe that we will be able to provide centralized, global multi-channel transactional platform to our clients internationally.
Our Strategy
Our strategy is to power global commerce through a world-wide, multi-channel solutions offering. To continue to grow our business, our strategy is to focus on providing merchants with the ability to process a variety of electronic transactions across multiple channels. We seek to leverage the adoption of and transition to card, electronic and digital-based payments by expanding our market share through our distribution channels and services innovations. We also seek growth through strategic acquisitions to improve our offerings, scale and geography. We intend to continue to invest in and leverage our technology infrastructure and our people to increase our penetration in existing markets.
Key elements of our business strategy include:
| · | Continued investment in our core technology and new technology offerings including blockchain; | |
| · | Allocation of resources and expertise to grow in commerce and payments segments; | |
| · | Grow and control distribution by adding new merchants and partners; | |
| · | Leverage technology and operational advantages throughout our global footprint; |
| 6 |
| · | Expansion of our cardholder and subscriber customer base; | |
| · | Continue to develop seamless multinational solutions for our clients; | |
| · | Increase monetization while creating value for our clients; | |
| · | Focus on continued improvement and operation excellence; and | |
| · | Pursue potential domestic and international acquisitions of, investments in, and alliances with companies that have high growth potential, significant market presence or key technological capabilities. |
With our existing infrastructure and supplier relationships, we believe that we can accommodate expected portfolio growth. We believe that our available capacity and infrastructure will allow us to take advantage of operational efficiencies as we grow our processing volume and expand to other geographical territories.
Market Overview
The financial technology and transaction processing industry is an integral part of today’s worldwide financial structure. The industry is continually evolving, driven in large part by technological advances. The benefits of card-based payments allow merchants to access a broader universe of consumers, enjoy faster settlement times and reduce transaction errors. By using credit or debit cards, consumers are able to make purchases more conveniently, whether in person, over the Internet, or by mail, fax or telephone, while gaining the benefit of loyalty programs, such as frequent flyer miles or cash back, which are increasingly being offered by credit or debit card issuers.
In addition, consumers are also beginning to use card-based and other electronic payment methods for purchases at an earlier age in life, and increasingly for small dollar amount purchases. Given these advantages of card-based payment systems to merchants and consumers, favorable demographic trends, and the resulting proliferation of credit and debit card usage, we believe businesses will increasingly seek to accept card-based payment systems in order to remain competitive.
We believe that cash transactions are becoming progressively obsolete. The proliferation of bankcards has made the acceptance of bankcard payments a virtual necessity for many businesses, regardless of size, in order to remain competitive. In addition, the advent and growth of e-commerce and crypto-currencies have marked a significant new trend in the way business is being conducted. E-commerce is dependent upon credit and debit cards, as well as other cashless payment processing methods.
The payment processing industry continues to evolve rapidly, based on the application of new technology and changing customer needs. We intend to continue to evolve with the market to provide the necessary technological advances to meet the ever-changing needs of our market place. Traditional players in the industry must quickly adapt to the changing environment or be left behind in the competitive landscape.
Business Segments
| North American Transaction Solutions |
International Transaction Solutions | |||
| Clients: | Businesses of all types and sizes. Current focus on SMB merchants | Online businesses, merchants requiring cross-border payment acceptance, content providers and mobile applications of all types and sizes | ||
| Goals: | To help business grow commerce at the retail, online and m-POS. Enable multi-channel commerce | To help businesses transact online with ease and security and help digital merchants monetize their content in a mobile environment | ||
|
Key Solutions: |
· Merchant Acquiring · Value-added services · Aptito POS technology · m-POS technology · Smart payment POS terminal · Business performance analytics · Marketing / loyalty |
· Integrated online and mobile billing solutions · Complete cross-border toolkit for online business · Integrated GDS transaction processing · Mobile content monetization and management · Security / risk management · Marketing / loyalty | ||
| 2017 Segment Revenue: | $51M, up 21% from 2016 | $9M, down 27% from 2016 |
We operate two reportable business operating segments: (i) North American Transaction Solutions and (ii) International Transaction Solutions. Our segments are designed to establish lines of businesses that support our client base and further globalize our solutions. Management determines the reportable segments based on the internal reporting used by our Chief Operating Decision Maker to evaluate performance and to assess where to allocate resources. The principal revenue stream for all segments came from service and transaction related fees during 2017.
Prior to May 20, 2015, we had a single reportable business segment: payment processing for electronic commerce. On May 20, 2015, we obtained financial and operational control of PayOnline, a provider of online payment processing of online transactions in emerging markets. Additionally, we rebranded our mobile payments business to Digital Provider and began reporting gross revenues for mobile payments where we provide access to branded content. Given the size of assets and revenues from PayOnline and Digital Provider, we began reporting segment information for three operating segments during the third quarter of 2015. During the fourth quarter of 2017, we re-organized our segment data along geographic lines with two operating segments; North American and International. We also continue to break-out corporate overhead so that we can better see the stand-alone potential of each region.
| 7 |
Comparative segment revenues and related financial information pertaining to our segments for the years ended December 31, 2017 and 2016 are presented in the tables in Note 16, Segment Information, to our consolidated financial statements (the “Consolidated Financial Statements”), which are included elsewhere in this Report.
| · | North American Transaction Solutions – This segment provides technology and services that businesses require to accept cashless transaction for retail card-present (or “swipe”), e-commerce or card-not-present mail order / telephone order (“MOTO”) transactions (referred to as “Merchant Acquiring”) as well as next-generation offerings such as mobile payment services, merchant performance analytical tools, merchant back office reporting, and our cloud-based Aptito POS platform, which includes hospitality, mobile POS (“m-POS”) and SMB retail point-of-sale applications (referred to as “Value-added Services”). |
| · | International Transaction Solutions – This segment provides online and mobile commerce solutions for merchants including social networks, game developers, online magazines, mobile applications and digital media operators. We provide mobile users with a simple, secure and fast way to pay for purchases via mobile device, interactive device or web without a credit card or a bank account. Our fully-integrated, processor agnostic electronic commerce platform that simplifies complex enterprise online transaction processing challenges from payment acceptance and processing through risk prevention and payment security via point-to-point encryption and tokenization solutions. Our proprietary software-as-a-service (“SaaS”) suite of solutions for electronic and mobile commerce gateway and payment processing platform is compliant at Level 1 of Payment Card Industry (“PCI”) Data Security Standards (“DSS”) streamlines the order-to-cash process, improves electronic payment acceptance and reduces the scope of burden of PCI DSS compliance. |
North American Transaction Solutions Segment
The following table presents North American Transaction Solutions segment information as a percentage of total revenue:
| 2017 | 2016 | |||||||
| Segment revenue | 85 | % | 78 | % | ||||
North American Transaction Solutions Operations. Our largest segment, North American Transaction Solutions, where through our subsidiary TOT Payments, LLC, doing business as Unified Payments, we provide businesses of all sizes and types with a wide range of solutions at the point of sale, including Merchant Acquiring, e-commerce, mobile commerce, POS and other business solutions. Our largest service in this segment is Merchant Acquiring, which facilitates the acceptance of cashless transactions at the POS, whether a retail transaction at a physical business location, a mobile commerce transaction through a mobile or tablet device, which includes m-POS acceptance, Android Pay™, Apple Pay™ and Samsung Pay or an electronic commerce transaction over the web. Geographical presence for this segment is North America.
Our North American Transaction Solutions segment revenues are primarily derived from processing payment acceptance transactions in a multi-channel environment for SMB merchants and includes fees for providing processing, loyalty and software services, and sales and support of POS devices. Revenues are generated from a variety of sources, including:
| · | Discount fees charged to a merchant for processing of a transaction. The discount fee is typically either a percentage of the purchase amount or an interchange fee plus a fixed dollar amount or percentage; | |
| · | Processing fees charged to merchants for processing of a transaction; | |
| · | Processing fees charged to our Sales Partners who have outsourced their transaction processing to us; | |
| · | Sales and support of POS devices; | |
| · | Fees from providing reporting and other services; | |
| · | Software license fees for Aptito POS platform, which includes hospitality and SMB retail point-of-sale application; | |
| · | PCI compliance fees charged to a merchant for providing PCI compliance on annual basis; and | |
| · | Business software license fees for merchant analytics and back office reporting. |
For example, in a transaction using a Visa or MasterCard card, the allocation of funds resulting from a $100 transaction follows.
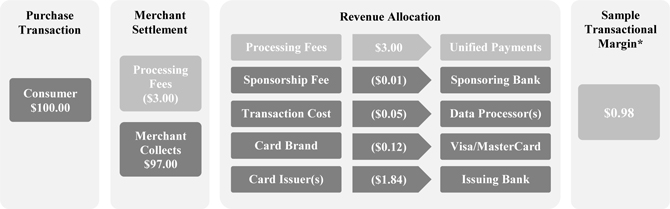
* Does not include agent commission payments.
| 8 |
We typically provide our services as part of a broader payment acceptance solution to our business clients across multiple channels, including:
| · | Retail Merchants – physical businesses or storefront locations, such as retailers, supermarkets, restaurants, hotels and other brink and mortar facilities, which we refer to as Retail. We supply our Retail merchants with POS terminals from leading manufacturers, which are Europay®, MasterCard®, and Visa® (commonly referred to as “EMV” or “Chip”) compliant and Near Field Communication (“NFC”) capable, accepting all card brands and products, as well as alternative payment forms, such as Android Pay™, Apple Pay™ and Samsung Pay. | |
| · | Mobile Merchants – physical businesses with remote or wireless storefront locations, such as small retail and service providers that use mobile devices with POS capabilities to accept electronic payments, which we refer to as Mobile; and | |
| · | Online – online businesses or website locations, such as retailers, digital content providers, and mobile application developers with Internet-based storefronts that can be accessed through a personal computer or a mobile device, where we refer to as e-commerce. |
North American Transaction Solutions Marketing. We employ a variety of go-to-market strategies in our North American Transaction Solutions segment. We mostly partner with indirect non-bank Sales Partners, such as independent sales agents, independent sales groups and referral partners that user our brand to market services (“ISG”), independent sales groups that we sponsor to Card Brands as registered Independent Sales Organizations (“ISO”) – these groups market services under their own brands, independent software vendors (“ISV”), value added resellers (“VAR”), and payment services providers (“PSP”) to sell our payment solutions to SMB merchants. We believe that this sales approach provides us with access to an experienced sales force to market our services with limited investment in sales infrastructure and management time. We believe our focus on the unique needs of SMB allows us to develop compelling offerings for our sales channels to bring to prospective merchants and provides us with a competitive advantage in our target market.
Sales & Marketing Support – Among the services and capabilities we provide are rapid application response time, merchant application acceptance by a proprietary and secure on-line sales portal, superior customer service, merchant reporting and robust analytics. In addition, by controlling the underwriting process we believe we offer the ISGs more rapid and consistent review of merchant applications than may be available from other service providers. Additionally, in certain circumstances, we offer our sales organizations tailored compensation programs and unique technology applications to assist them in the sales process. We keep an open dialogue with our Sales Partners to address their concerns as quickly as possible and work with them in investigating chargebacks or potentially suspicious activity with the aim of ensuring our merchants do not unduly suffer downtime or the unnecessary withholding of funds.
Sales & Marketing Compensation – As compensation for their referral of merchant accounts, we pay our Sales Partners an agreed-upon recurring commission, or percentage of the income we derive from the transactions we process from the merchants they refer to us. The amount of the recurring commissions we pay to our Sales Partners varies on a case-by-case basis and depends on several factors, including but not limited to the number and type of merchants each group refers to us. We provide additional incentives to our Sales Partners, including, from time to time, advances and merchant acquisition bonuses that are secured by income earned from the referred merchant and repayable from future compensation that may be earned by the groups in respect to the merchants they have referred to us. For the year ended December 31, 2017 and 2016, we had provided merchant acquisition incentives to Sales Partners in an aggregate amount of $1.8 million and $1.3 million, respectively. Our organic growth plan calls for future incentives to be funded to our Sales Partners for referred merchants.
North American Transaction Solutions. Our solutions are designed to help SMB merchants accept cashless payments in an multi-channel payment environment, which spans across POS, e-commerce and mobile devices.
Mobile POS Platform – An integrated POS platform developed on Apple’s® iOS and Android® mobile operating systems for the hospitality, retail, service and on the go industries. Our goal with Aptito is to create an easy to use POS and business management solution, which incorporates everything a small business needs to help streamline every-day management, operations and payment acceptance.
| § | Aptito Hospitality POS – proprietary, fully integrated cloud-based POS and restaurant management system developed on Apple’s® iOS mobile operating system is designed to be used as a stand-alone all digital POS or be extended to include: m-POS, self-ordering kiosk, digital menus, pay at the table EMV and NFC ready card readers, cash drawers, receipt and kitchen printers. The need for uptime in a hospitality environment is paramount and as such our Aptito Hospitality POS local server allows our merchants to remain online, even if the Internet connection to the cloud is lost. Our local server solution is automatically synchronized with the cloud, providing 99.99% uptime. |
| · | Aptito Retail POS – cloud-based POS solution is available on Apple® iOS and Android® mobile operating platforms and allows retailers to focus on their business and improve the in-store experience. Retailers are able to customize Aptito Retail POS based on their environment. Peripherals for Aptito Retail POS include a fully integrated cash drawer, thermal receipt printer, barcode scanner, barcode printer and EMV-compliant point of sale acceptance terminal. This allows retailers the ability to customize their POS solution based on their unique needs. The need for uptime in a retail environment is paramount and as such our Aptito Retail POS local server allows our merchants to remain online, even if the Internet connection to the cloud is lost. Our local server solution is automatically synchronized with the cloud, providing 99.99% uptime. |
| · | Restoactive – utilizing Aptito POS Platform architecture, we have developed and launched Restoactive, which seamlessly plugs into a current restaurant environment through integrations with some of the biggest POS and restaurant management platforms such as: MICROS®, POSitouch®, Aloha® and Symphony®. By integrating into the leading POS and restaurant management platforms, Restoactive is now accessible by over 500,000 restaurants in the United States. We believe Restoactive to be the first of its kind integrated platform, which introduces all-in-one digital menu, kiosk and m-POS application into an existing POS environment without the need to displace existing restaurant management platforms. |
| 9 |
| · | Unified m-POS – Unified m-POS solution is available on Apple® iOS and Android® mobile operating platforms and makes it easier and safer to take business on the go. Whether at the local farmer’s market or at a customer’s site, Unified m-POS accept payments with ease and security. Mobile application is EMV-compliant, accepts traditional and contactless transactions such as Apple Pay®. Unified m-POS application is available for download in Apple’s App Store and Google Play |
In addition to enhancing our ability to drive core merchant acquiring sales, Mobile POS Platform allows us to earn incremental revenue from business clients. Currently, revenue model is based on a SaaS fee, which we bill on a per station basis and additional services fee, which we bill for additional applications we offer.
We also believe that our Mobile POS Platform can help enhance client retention because we believe it will become core to our clients’ businesses and position us as a value-added partner. For example, business owners may use our business management tools to manage their employees’ work schedules, payroll, patron reservations, operate customer loyalty programs, manage inventory, and/or provide analytics on their business.
Other POS Platforms – We act as an authorized dealer for various POS manufacturers and POS software providers and deploy these systems where our proprietary products are not the best fit. Systems we offer are fully integrated with our payment acceptance capabilities.
Merchant Management Platform – We have developed Sales Central, a proprietary cloud-based merchant management platform. Sales Central is designed to enhance responsiveness of our Sales Partners and improve sales efficiency. The cloud-based solution provides to both Sales Partners and merchants an integrated toolkit to more effectively manage a variety of sales, operations, reporting and accounting functions. The system is designed to improve conversion rates, technology advisory functions and to reduce deployment time for merchants. It also allows troubleshooting of merchant issues in real-time. Sales Central is currently one of the few cloud-based systems nationwide that allows Sales Partners to onboard and monitor merchants on multiple processing platforms through a single interface.
| · | Sales Central for Sales Partners – allows Sales Partners to onboard merchants on multiple processing platforms available in the U.S. Its merchant underwriting and boarding process is seamless and paperless. Merchant Library allows Sales Partners to safely store and retrieve any agreement, form or contract related to merchants. Sales Partners that utilize the system are equipped with merchant pricing, residual calculations and risk management modules, which allow easier management of most of their day-to-day operations. Sales Partners compensation and merchant profitability can be managed using multi-level, single-click, drill-down navigation to pricing, detail, summary and statement information. |
| · | Sales Central On the Go – fully integrated, digital onboarding interface designed for Sales Partners and merchants, streamlines and automates merchant account sign-up process, delivers real-time decisions and paperless boarding approval from online and mobile devices. Mobile boarding capability facilitates API-driven, instant boarding to multiple payment processing platforms and provides new merchants with a modular approach for providing their personal and business information. The platform manages underwriting, risk assessment, merchant ID assignments and is compliant with banking standards such as Know Your Customer regulations. |
| · | Sales Central for Merchants – integrated reporting, accounting and analytics back office solution for SMB merchants. A variety of reporting tools along with easy to understand charts enables merchants to analyze sales and improve performance. The ticket system allows merchants direct communication with Company’s service and technical support designed to improve the customer service experience. |
| · | Unified Insights – the integrated Unified Insights module is a business dashboard focused on “Big Data” that gives merchants a 360-degree view of their business in a more usable formats. With Unified Insights, merchants can compare current revenue, online reputation, and social media activity to their past performance and to similar business in their area. |
North American Transaction Solutions Competition. Many large and small companies compete with us in providing payment processing services and related services to a wide range of merchants. Many of our current and prospective competitors have substantially greater financial, technical and marketing resources, larger customer bases, longer operating histories, more developed infrastructures, greater name recognition and/or more established relationships in the industry than we have. Because of this our competitors may be able to adopt more aggressive pricing policies than we can, develop and expand their service offerings more rapidly, adapt to new or emerging technologies and changes in customer requirements more quickly, take advantage of acquisitions and other opportunities more readily, achieve greater economies of scale, and devote greater resources to the marketing and sale of their services. There are also many smaller transaction processors that provide various services to small and medium sized merchants.
We believe that our specific focus on smaller merchants, in addition to our understanding of the needs and risks associated with providing payment processing services to small merchants and indirect non-bank sales forces, gives us a competitive advantage over larger competitors, which have a broader market perspective and priorities. We also believe that we have a competitive advantage over competitors of a similar or smaller size that may lack our extensive experience, value-added product offering and resources.
| 10 |
North American Transaction Solutions Industry Mix and Geography. In the United States, we have developed significant expertise in industries that we believe present relatively low risks as the customers are generally present and the products or services are generally delivered at the time the transaction is processed. These include:
| · | Restaurants | |
| · | Schools and educational services | |
| · | Brick and mortar retailers | |
| · | Convenience and liquor stores | |
| · | Professional service providers | |
| · | Hotel and lodging establishments |
Merchants we served during 2017 processed an average of $12,257 each month in credit card transactions and had an average transaction value of $41.55 per transaction. Larger payment processors have traditionally underserved these merchants. As a result, these merchants have historically paid higher transaction fees than larger merchants and have not been provided with tailored solutions and on-going services that larger merchants typically receive from larger payment processing providers.
Our total North American Transaction Solutions processing volume for the year ended December 31, 2017 was $2.3 billion, a 18% increase over processing during the year ended December 31, 2016. Transactions processed for the year ended December 31, 2017 were 89.0 million compared to 87.5 million for the year ended December 31, 2016.
Our card-present processing volume for the year ended December 31, 2017 represented 73% of the total North American Transaction Solution volume, and card-not-present processing volume represented 27%.
As of December 31, 2017, approximately 39.6% of our SMB merchants were restaurants and 22% were health and beauty services, and 16% were general merchandise. The high concentration in restaurants reflects the efforts of our sales team actively targeting our Aptito POS product line. The following table reflects the percentage concentration of our merchant base by category:
| 2017 | 2016 | |||||||
| Restaurants | 39.6 | % | 36.6 | % | ||||
| Health / Beauty | 22.0 | % | 19.9 | % | ||||
| General Merchandise | 16.0 | % | 15.2 | % | ||||
| Professional Services | 8.1 | % | 8.4 | % | ||||
| Automotive | 6.8 | % | 7.1 | % | ||||
| Food Stores | 2.4 | % | 5.8 | % | ||||
| Educational Services | 2.7 | % | 4.4 | % | ||||
| Hotels / Motels | 1.1 | % | 1.6 | % | ||||
| Other | 1.3 | % | 1.0 | % | ||||
In December 2017, SMB merchants located in the following states represented the following percentage of our SMB card processing volume: New York represented 24.31%, Florida represented 11.9% California represented 10.97%, New Jersey represented 5.69% and North Carolina represented 5.28%. No other state represented more than 5% of our total SMB card processing volume. Our geographic concentration tends to reflect states where we maintain stronger sales force. We believe that the loss of any single SMB merchant would not have a material adverse effect on our financial condition or results of operations.
North American Transaction Solutions Risk Management. In the United States, we focus our sales efforts on low-risk bankcard merchants and have developed systems and procedures designed to minimize our exposure to potential merchant losses.
Effective risk management helps us minimize merchant losses for the mutual benefit of our merchants, Independent Sales Groups and ourselves. Our Underwriting and Risk Management Policy and procedures help to protect us from fraud perpetrated by our merchants. We believe our knowledge and experience in dealing with attempted fraud has resulted in our development and implementation of effective risk management and fraud prevention systems and procedures. In 2017, we experienced losses of .0002 (or 0.02%) of our SMB card processing volume.
We employ the following systems and procedures to minimize our exposure to merchant and transaction fraud:
| · | Merchant Application Underwriting – there are varying degrees of risk associated with different merchant types based on their industry, the nature of the merchant’s business, processing volumes and average transaction size. As such, varying levels of scrutiny are needed to evaluate a merchant application and to underwrite a prospective merchant account. These range from basic due diligence for merchants with low risk profiles to more comprehensive review for higher risk merchants. The results of this assessment serves as the basis for decisions regarding acceptance of the merchant account, criteria for establishing reserve requirements, processing limits, average transaction amounts and pricing. Once aggregated, these factors also assist the Company in monitoring transactions for those accounts when pre-determined criteria have been exceeded. |
| 11 |
| · | Merchant Monitoring – we employ several levels of merchant account monitoring to help us identify suspicious transactions and trends. Daily merchant activity is sorted into a number of customized reports by our systems. Our risk management team reviews any unusual activity highlighted by these reports, such as larger than normal transactions or credits, and monitors other parameters that are helpful in identifying suspicious activity. We have daily windows to decide if any transactions should be held for further review and this provides us time to interview a merchant or issuing bank to determine the validity of suspicious transactions. We also place merchants who require special monitoring on alert status and have engaged a third-party web crawling solution that scans all merchant websites for content and integrity. |
| · | Investigation and Loss Prevention – if a merchant exceeds any parameters established by our underwriting and/or risk management staff or violates regulations established by the applicable bankcard network or the terms of our merchant agreement, one of our investigators will identify the incident and take appropriate action to reduce our exposure to loss and the exposure of our merchant. This action may include requesting additional transaction information, withholding or diverting funds, verifying delivery of merchandise or even deactivating the merchant account. Additionally, Relationship Managers may be instructed to retrieve equipment owned by us. In addition, to protect ourselves from unexpected losses, we maintain a reserve account with our sponsoring bank, which can be used to offset any losses incurred at a given time. As of December 31, 2017, our reserve balance was $447,602. The reserve is replenished as required by funding 0.03% of bankcard processing volume. In the case of our self-designated bin, this is triggered when it falls below $25,000. This reserve is accounted for on our balance sheet under the caption “other assets”. |
| · | Reserves – some of our merchants are required to post reserves (cash deposits) that are used to offset chargebacks incurred. Our sponsoring banks hold such reserves related to our merchant accounts as long as we are exposed to loss resulting from a merchant’s processing activity. In the event that a small company finds it difficult to post a cash reserve upon opening an account with us, we may build the reserve by retaining a percentage of each transaction the merchant performs until the reserve is established. This solution permits the merchant to fund our reserve requirements gradually as its business develops. As of December 31, 2017, our total reserve deposits were approximately $5,715,466. We have no legal title to the cash accounts maintained at the sponsor bank in order to cover potential chargeback and related losses under the applicable merchant agreements. We also have no legal obligation to these merchants with respect to these reserve accounts. Accordingly, we do not include these accounts and the corresponding obligation to the merchants in our consolidated financial statements. |
North American Transaction Solutions Sponsoring Banks and Data Processors. Because we are not a “member bank” as defined by Visa, MasterCard, American Express and Discover (“Card Brands”), in order to authorize and settle payment transactions for merchants, we must be sponsored by a financial institution that holds member bank status with the Card Brands (“Sponsorship Bank” in the case of Visa and MasterCard) and various third-party vendors (“Data Processors”) to assist us with these functions. Card Brand rules restrict us from performing funds settlement or accessing merchant settlement funds and require that these funds be in the possession of a Sponsorship Bank until the merchant is funded.
Sponsoring Bank. We have agreements with several banks that sponsor us for membership in the Visa, MasterCard, American Express and Discover card brands and settle card transactions for our merchants. These agreements allow us to use the banks’ identification numbers, referred to as Bank Identification Number (“BIN”) for Visa transactions and Interbank Card Association (“ICA”) number for MasterCard transactions. The principal Sponsoring Bank through which we processed the majority of our transaction in the United States during 2017 was Merrick Bank, N.A. On March 1, 2018, we moved all of our processing from Merrick Bank, N.A. to Citizens Bank, N.A as part of our relationship with Priority Payments Inc. In addition, we process transactions through BIN sponsorship agreements with Esquire Bank, N.A. and Wells Fargo Bank, N.A. From time to time, we may enter into agreements with additional banks.
Data Processor. We have agreements with several Data Processors to provide us with, on a non-exclusive basis, transaction processing and transmittal, transaction authorization and data capture, and access to various reporting tools. Our primary processing vendor in the United States is Priority Payment Systems, LLC (“Priority”), which provides us with the processing conduit to the Total System Services, Inc. (“TSYS”) and First Data Corporation (“FDC”) authorization and settlement network. We have entered into several service agreements with Priority. Each of the Priority service agreements may be terminated by Priority if, among other things, (i) certain insolvency events occur with respect to us or (ii) we fail to maintain our good standing with Card Brands. We may terminate each of the agreements if, among other things, (i) certain insolvency events occur with respect to Priority, (ii) Priority materially breaches any of the terms, covenants or conditions of the agreements and fails to cure such breach within 30 days following receipt of written notice thereof, or (iii) under certain circumstances, Priority is unable to perform services described in the agreement. In addition, we maintain direct processing agreements with TSYS and FDC.
As an example of processing an electronic payment, the below diagram illustrates the participants involved in a payment transaction. There are four main participants, the Merchant, the Service Provider (Unified Payments), the Sponsoring Bank and the Data Processor. Merchants are primarily business owners that accept credit card payment in exchange for their merchandise and services.

| 12 |
International Transaction Solutions.
The following table presents International Transaction Solutions Segment information as a percentage of total revenue:
| 2017 | 2016 | |||||||
| Segment revenue | 15 | % | 22 | % | ||||
During 2017, we have consolidated our Online Payment Solutions and Mobile Payment Solutions segments into a single International Transaction Solutions segment. Our online payment solutions company, PayOnline, now provides all operational support for our mobile payments business. Our mobile payments business is transitioning to a joint venture business model and we are in discussions with several potential partners regarding joint business development.
Through our subsidiary, PayOnline, we provide a wide range of value-added online solutions utilizing our fully-integrated, platform agnostic electronic commerce offering that simplifies complex enterprise online transaction processing challenges from payment acceptance and processing through risk prevention and payment security via point-to-point encryption and tokenization solutions. Our proprietary SaaS suite of solutions for electronic and mobile commerce gateway and payment processing platform is compliant at Level 1 of PCI DSS, streamlines the order-to-cash process, improves electronic payment acceptance and reduces the scope of burden of PCI DSS compliance. PayOnline holds a leadership position in the Russian Federation as one of the largest independent Internet Payment Services Provider (“IPSP”).
Our International Transaction Solutions segment revenues are primarily derived from processing credit and debit card transactions for online merchants and includes fees for providing processing, loyalty and software services. Revenues are generated from a variety of sources, including:
| · | Discount fees charged to a merchant for processing of a transaction. The discount fee is typically a percentage of the purchase amount; |
| · | Processing fees charged to merchants for processing of a transaction; |
| · | Processing fees charged to our sales partners who have outsourced their transaction processing to us; |
| · | Fees from providing reporting and other services; |
| · | Software license fees for PayOnline White-label platform; |
| · | Business software license fees for merchant analytics, back office reporting; and monetarization |
| · | Big Data monetization through upsell on payment confirmation page to the end consumer. |
Through our subsidiary Digital Provider, we enable mobile payment acceptance utilizing agreements with marketing companies owned by the top 3 MNOs including Mobile TeleSystem (MTS), MegaFon and VimpelCom.
There are several possible configurations of transactions that result in us receiving multiple fees for a transaction, depending on the role we play.
In a transaction using a Visa or MasterCard card, the allocation of funds resulting from a $100 transaction is as follows:
*Excludes commissions
Approximately 20% of leading e-commerce merchants in Russia use the PayOnline platform to accept payment transactions in Russia, Europe and Asia.
Online Transaction Solutions Marketing. The vast majority of PayOnline sales are direct sales, through our marketing efforts and fully automated leads management system. The marketing department of PayOnline consists of 5 specialists, responsible for product pricing, company branding and positioning, monitoring of competitors and technological developments, public relations and web marketing activities. Our marketing mix includes, but not limited to:
| · | Search Engine Optimization – PayOnline is in the top 10 results with most frequently used keywords in Google.ru and Yandex search engines. | |
| · | Social Media – PayOnline social media channels include Facebook, Vkontakte, Twitter, YouTube. | |
| · | Corporate Blog – Our corporate blog featured on popular developer communities like HabraHabr and GeekTimes is consistently in the Top 10. |
| · | Industry Research – Every year PayOnline specialists prepare and publish over 120+ research papers on popular e-commerce and IT development forums. | |
| · | RUNET – PayOnline is a payment processing provider for RUNET-ID (Russia’s largest Internet professionals’ social platform), Russian Internet Forum and Russian Interactive Week. | |
| · | Conferences – Every year our experts participate in 30+ trade shows and professional conferences. | |
| · | Education – Our senior managers are frequently invited by top Russian Federation universities and business schools as lecturers. |
| 13 |
During 2016, we attracted 320 new clients, of which 92% were in Russian Federation / CIS and 8% in Europe and Asia. Merchants we served during 2016 processed an average of $54,325 each month in credit card transactions and had an average transaction value of $21.30 per transaction. During 2016, our sales department consists of 25 specialists who are responsible for managing the leads, execution of the client agreements, client boarding, customization of the solutions, implementation of the payment acceptance solutions and post-sale client relationship.
Online Solutions. Our solutions combine payment processing, online shopping cart tools, web site design, web hosting and web related services which enable businesses to establish a presence and commercial capability on the Internet in a quick and simple fashion.
PayOnline Platform – We have developed the PayOnline Platform, a proprietary technology platform serving large and fast growing internet-led multinationals with complex payment needs, supported by our vertical expertise. Our reliable and secure proprietary technology platform enables merchants to accept a vast array of payment types, across multiple channels, anywhere in the world. Utilizing PayOnline Platform, we have built universal flexible payment solution adapted for websites and mobile applications. The solution includes:
| · | Personal Client Area: web-interface for clients to control and manage payments. |
| · | Adaptive payment form with the possibility of customization. |
| · | Simple payment process: binding card to account, moment payments, recurrent payments, temporary blocking of payment, reserving of payments, invoicing by e-mail. |
| · | Customization of protocol 3-D Secure for client's business needs. |
| · | Ability to customize the default settings of anti-fraud system. |
| · | Integrations with various Global Distribution Systems (“GDS”) such as Amadeus®, Galileo®, Sabre®, additional geo filters and passenger name record (PNR). |
| · | Integrations with Apple iOS, Android and Microsoft mobile platforms for mobile application. |
Payments from Start to Finish. PayOnline Platform reduces the payment integration time for merchants, banks and SaaS providers to just a few minutes with its PayOnline Application Program Interface (“API”) service. Easy, easier, easiest: PayOnline integration service simplifies complex payment integration when using APIs and makes the laborious task of adapting payment processes obsolete.
Complete Toolkit for Online Business. More than 20 integration modules for the world's most popular CMS (Content Management System) are available for clients with sites created on basis of CMS. A complete, modular system of web-based services gives our merchants the flexibility to add more options as and when required - without costly or lengthy IT projects.
Online Solutions Competition. PayOnline primarily competes with other companies operating in the online payment processing market in emerging markets. In our key geographical market – Russian Federation, we compete primarily with the acquiring banks and payment processors (including payment aggregators). PayOnline cannot compete with acquiring banks or payment processors on pricing. Our major advantages relate to our robust, payment processor agnostic solution that simplifies complex enterprise online payment processing challenges from payment acceptance and processing through to risk prevention and payment security via tokenization solutions. Our competitive advantages include:
| · | Suite of individually tailored e-commerce solutions | |
| · | Payment conversion management | |
| · | Seamless client payment acceptance implementation | |
| · | Quick development and implementation of custom payment acceptance solutions | |
| · | Multiple integrated payment acceptance methods | |
| · | Wide geography of payment acceptance with a single integration | |
| · | More than 120 currencies accepted worldwide | |
| · | Proprietary Anti-Fraud System |
Online Solutions Industry Mix and Geography. We have developed significant expertise in industries that we believe present opportunities for growth. These include:
| · | Internet stores | |
| · | Professional service providers | |
| · | Travel services | |
| · | Telecommunications | |
| · | Social media networks | |
| · | Financial services | |
| · | Utilities and government services | |
| · | Digital content providers |
| 14 |
Merchants we served during 2017 processed an average of $71,515 each month in credit card transactions and had an average transaction value of $27 per transaction.
The following table reflects the percentage concentration of our merchant base by class:
| 2017 | 2016 | |||||||
| Internet Stores | 36.8 | % | 40.5 | % | ||||
| Professional Service | 23.0 | % | 19.5 | % | ||||
| Travel Services | 17.2 | % | 13.6 | % | ||||
| Telecommunications | 12.0 | % | 12.5 | % | ||||
| Social Media Networks | 3.3 | % | 3.8 | % | ||||
| Financial Services | 1.1 | % | 3.8 | % | ||||
| Utilities and Government Services | 0.4 | % | 4.8 | % | ||||
| Digital content providers | 3.4 | % | 4.4 | % | ||||
| Other | 2.8 | % | 1.6 | % | ||||
Online Solutions Risk Management. In the emerging markets, we focus our sales efforts on electronic commerce merchants and have developed systems and procedures designed to minimize our exposure to potential merchant losses and provide our merchants with cross-border payment acceptance.
Effective risk management helps us minimize merchant losses for the mutual benefit of our merchants and ourselves. Our Anti-Fraud System allows us to identify and prevent up to 99.9% of potential fraud related to bankcard processing in the electronic commerce environment. Our Underwriting and Risk Management Policy and procedures help to protect us from fraud perpetrated by our merchants. 150 different fraud filters allow our clients to maintain high level or payment conversion, averaging at 99.2%, while maintaining chargeback related losses as low as .0002 (or 0.023%). Our risk management is conducted in both manual and automatic modes.
Manual Risk Management involves specialists of our Underwriting and Risk Management Department, who are responsible for the following:
| · | Analysis of risks and underwriting of our partners, i.e. acquiring banks, financial companies and payment processors | |
| · | Analysis of potential risks and underwriting of our potential clients, i.e. merchants accepting payments over internet | |
| · | Manual validation of disputed payments | |
| · | Advising of our potential and current clients on how to correctly setup up fraud monitoring methods and tools | |
| · | Future development of our fraud monitoring and prevention systems, based on the client needs and recent trends in e-commerce and m-commerce marketplace and regulations |
PayOnline Anti-Fraud System is our proprietary Fully Automated Risk Management system. The system is based on the latest know-how of the informational and financial security aspects of the payment processing industry, as well as rules and recommendations of Visa and MasterCard on fraud prevention in electronic commerce.
Major components of PayOnline Anti-Fraud System include but are not limited to:
| · | Advance monitoring of the bank card transaction in automated mode, using 150 filters, individually tuned for each client, where each transaction is evaluated by key parameters, such as country where bank card is issued, country from where the payment is requested, amount of payment, amount of all payments by this card in the past 24 hours/month, IP address, etc. | |
| · | Additional validation of the bankcard by using 3-D Secure protocol or validation by charging random amount on the card. | |
| · | Monitoring of the transactions by specialists of the Underwriting and Risk Management Department. |
Online Solutions Licensing and Certifications. In order to perform services at the highest level of safety and quality of service, PayOnline holds various industry certifications and licenses.
| · | PCI DSS Level 1 – PayOnline is certified to Payment Card Industry Data Security Standard (“PCI DSS”) Level 1 standard version 3.2 PCI DSS. Certificate received by PayOnline March 2, 2018, allows the company to process online payment transactions. During 2017, PayOnline was certified to PCI DSS Level 1 version 3.1, as of February 22, 2017. | |
| · | SDP / CISP – PayOnline has passed international certification by Visa and MasterCard and is involved in MasterCard Site Data Protection (“SDP”) program and the Visa Cardholder Information Security Program (“CISP”). | |
| · | MasterCard – Since 2009, PayOnline is accredited as the official international Service Provider of MasterCard Worldwide, participates in the MasterCard SDP program and, in addition, has the status of MasterCard DataStorage Entity. | |
| · | Visa –Since 2009, PayOnline is accredited as the official Service Provider of Visa International payment system, participates in the Visa CISP program and holds the status of Visa Third Party Processor (“TPP”). |
| 15 |
| · | Cryptographic Transport Layer Security (“TLS”) Protocol – Data exchange between the enterprise e-commerce and PayOnline is made via secure channels, using the HTTPS protocol. TLS cryptographic protocol uses asymmetric cryptography for authentication, symmetric encryption for confidentiality and authenticity of the message codes to preserve the integrity of messages. |
| · | Qualys – PayOnline regularly passes ASV-scan procedure (automated external security audit) provided by Qualys in accordance with the requirements of international payment systems to companies with certified PCI DSS. Approximately 50 companies from the Forbes Global 100 list use Qualys to secure their business. |
Online Solutions Sponsoring Banks and Data Processors. Because we are not a “member bank” or a licensed financial services institution as defined by Visa, MasterCard, American Express and Discover (“Card Brands”), in order to authorize and settle payment transactions for merchants, we must be partner with a financial institution that holds member bank status with the Card Brands (“Partner Bank”) and various third-party vendors (“Data Processors”) to assist us with these functions. Card Brand rules restrict us from performing funds settlement or accessing merchant settlement funds and require that these funds be in the possession of a Partner Bank until the merchant is funded.
Partner Bank. Since 2008, PayOnline has been working to increase the number of partnership agreements and platform integrations with different banks, financial institutions and payment processors. Our worldwide expansion requires a broader range of regions and currencies covered by such partnership agreements, enabling us to provide international payment processing.
Our key partnerships and integrations in Russian Federation include:
| · | Bank of Moscow | · | QIWI Bank |
| · | VTB Bank | · | WebMoney |
| · | Round Bank | · | Absolutbank |
| · | Raiffesenbank | · | Yandex.Money |
| · | SDM Bank |
Our key partnerships and integrations in Europe, Asia and the United States include:
| · | Latvijas Pasta Banka | · | Kyrgyzkommertsbank |
| · | Rietumu Bank | · | Paysafe |
| · | Wirecard Bank | · | Authorize.net |
| · | Kazkommertsbank | · | Skrill |
| · | Kazkommertsbank Tajikistan | · | PayPal |
As an example of processing an electronic payment, the below diagram illustrates the participants involved in a payment transaction. There are four main participants, the Merchant, the Service Provider (PayOnline), the Partner Bank and the Data Processor (PayOnline). Merchants are primarily business owners that accept credit card payment in exchange for their merchandise and services.

Research and Development
We recognize the importance of having access to the leading technology in order to develop advanced products for our customers, independent sales agents, consumers and for our own internal use. To this end, development of our products is conducted in-house. We are maintaining three development centers and four development teams of IT architects, quality assurance professionals and software developers. We support mobile platforms including Apple® iOS, Android®, and Windows®. We also support server side software development for Java, ASP.NET, and PHP platforms. We also provide user experience (UX) and user interface (UI) engineering and system administration dedicated to financial services and value-added technology businesses.
Our IT development center is headquartered in North Miami Beach, Florida (U.S.), where we employ a Chief Technology Officer (“CTO”) and POS products Testing & Development Engineer.
Our Moscow (Russia) IT development center employs two technical directors, managing Digital Provider and PayOnline platform development teams.
Our representative office in Yekaterinburg (Russia) employs two team leaders managing Sales Central and our value-added services development teams.
| 16 |
Intellectual Property
We have several trademarks and service marks, which are important to our business. The following trademarks and service marks are the subject of trademark registrations and are used in our financial services business:
| · | Net Element | · | Restoactive |
| · | Unified Payments | · | TOT |
| · | PayOnline | · | Digital Provider |
| · | Payonline.ru | · | Netevia |
We regard our software as proprietary and attempt to protect it, where applicable, with copyrights, trade secret measures and non-disclosure agreements. Despite these protections, it may be possible for competition or users to copy aspects of our intellectual property or to obtain information that we regard as trade secrets. Existing copyright laws afford only limited practical protection for computer software. The laws of foreign countries generally do not protect our proprietary rights in our products to the same extent as the laws of the United States. In addition, we may experience more difficulty in enforcing our proprietary rights in certain foreign jurisdictions.
Employees
Our total number of staff as of December 31, 2017 was 97 full-time employees. The staff in the United States was 30 employees and in Russia we had 67 employees.
Corporate History
Our Company was formed in 2010 and incorporated as a Cayman Islands exempted company with limited liability under the name Cazador Acquisition Corporation Ltd. (“Cazador”). Cazador was a blank check company incorporated for the purpose of effecting a merger; share capital exchange; asset acquisition; share purchase; reorganization or similar business combination with one or more operating businesses or assets. In 2012, Cazador completed a merger (the “Merger”) with Net Element, Inc., a Delaware corporation, which was a company with businesses in the online media and mobile commerce payment processing markets. Immediately prior to the effectiveness of the Merger, the Company (then known as Cazador) changed its jurisdiction of incorporation by discontinuing as an exempted company in the Cayman Islands and continuing and domesticating as a corporation incorporated under the laws of the State of Delaware. Effective upon consummation of the Merger, (i) Net Element, Inc. was merged with and into the Company, resulting in Net Element ceasing to exist and the Company continuing as the surviving company in the Merger, and (ii) the Company changed its name to Net Element International, Inc. In 2013, the Company divested its non-core entertainment assets. In December 2013, the Company changed its name to Net Element, Inc. We entered the mobile payments business through the launch of Tot Money (renamed Digital Provider in 2015) in Russia in 2012. We entered the financial technology and value-added transactional service business through the acquisitions of Unified Payments in April 2013 and Aptito in June 2013. We entered the online payment business with our acquisition of PayOnline in May 2015. Our principal office is located at 3363 NE 163 rd Street, Suite 705, North Miami Beach, Florida 33160, and our main telephone number is (305) 507-8808.
Regulation
Various aspects of our business are subject to U.S. and non-U.S. federal, state and local regulation. The operations of our subsidiary, Digital Provider, are subject to regulation in non-U.S. markets it operates in and may become subject to the laws and regulations of additional foreign jurisdictions as and when its business expands into additional markets. Many domestic and foreign laws and regulations that affect companies conducting business on the Internet and companies transmitting user information and payments via text message or other electronic means are still evolving and the interpretation of such laws and regulations are often uncertain. Failure to comply with applicable laws and regulations may result in the suspension or revocation of licenses or registrations, the limitation, suspension or termination of services and/or the imposition of civil and criminal penalties and/or fines. The services of Digital Provider to mobile phone carriers also are subject to certain of the rules and policies of such carriers and ongoing contractual covenants with such carriers, the violation of which may result in penalties and/or fines and possible termination of Digital Provider's services. Certain of our services are also subject to rules set by various payment networks, such as Visa and MasterCard, as more fully described below under "Association and Network Rules".
Association and Network Rules. While not legal or governmental regulation, we are subject to the network rules of Visa, MasterCard and other payment networks. In order to provide processing services, a number of our subsidiaries are registered with Visa and/or MasterCard as service providers for member institutions. Various subsidiaries of ours are also processor level members of numerous networks or are otherwise subject to various network rules in connection with processing services and other services we provide. As such, we are subject to applicable card association, networks and national scheme rules that could subject us to fines or penalties. The payment networks routinely update and modify their requirements. On occasion, we receive notices of non-compliance and fines, which might be related to excessive chargebacks by a merchant or data security failures. Our failure to comply with the networks' requirements or to pay the fines they impose could cause the termination of our registration and require us to stop providing payment services.
Dodd-Frank Act. In July 2010, the Dodd-Frank Wall Street Reform and Consumer Protection Act of 2010 was signed into law in the United States. The Dodd-Frank Act has resulted in significant structural and other changes to the regulation of the financial services industry. Among other things, the Dodd-Frank Act established the Consumer Financial Protection Bureau, or CFPB, to regulate consumer financial services, including many offered by our clients.
| 17 |
The Dodd-Frank Act provided two self-executing statutory provisions limiting the ability of payment card networks to impose certain restrictions that became effective in July 2010. The first provision allows merchants to set minimum dollar amounts (not to exceed $10) for the acceptance of a credit card (and allows federal governmental entities and institutions of higher education to set maximum amounts for the acceptance of credit cards). The second provision allows merchants to provide discounts or incentives to entice consumers to pay with cash, checks, debit cards or credit cards, as the merchant prefers.
Separately, the so-called Durbin Amendment to the Dodd-Frank Act provided that interchange fees that a card issuer or payment network receives or charges for debit transactions will now be regulated by the Federal Reserve and must be "reasonable and proportional" to the cost incurred by the card issuer in authorizing, clearing and settling the transaction. Payment network fees, such as switch fees may not be used directly or indirectly to compensate card issuers in circumvention of the interchange transaction fee restrictions. In July 2011, the Federal Reserve published the final rules governing debit interchange fees. Effective in October 2011, debit interchange rates for card issuing financial institutions with more than $10 billion of assets are capped at $0.21 per transaction with an additional component of five basis points of the transaction's value to reflect a portion of the issuer's fraud losses plus, for qualifying issuing financial institutions, an additional $0.01 per transaction in debit interchange for fraud prevention costs. The debit interchange fee would be $0.24 per transaction on a $38 debit card transaction, the average transaction size for debit card transactions. In July 2013, the U.S. District Court for the District of Columbia determined that the Federal Reserve's regulations implementing the Durbin Amendment were invalid. The U.S. Court of Appeals for the District of Columbia, or D.C. Circuit, reversed this decision on March 21, 2014, generally upholding the Federal Reserve's interpretation of the Durbin Amendment and the Federal Reserve's rules implementing it. On August 18, 2014, the plaintiffs in this litigation filed a petition for a writ of certiorari asking the U.S. Supreme Court to review the D.C. Circuit's decision with respect to the interchange fee cap. We continue to monitor developments in the litigation surrounding these rules. Regardless of the outcome of the litigation, the cap on interchange fees is not expected to have a material direct impact on our results of operations.
In addition, the new rules contain prohibitions on network exclusivity
and merchant routing restrictions. Beginning in October 2011, (i) a card payment network may not prohibit a card issuer from contracting
with any other card payment network for the processing of electronic debit transactions involving the issuer's debit cards and
(ii) card issuing financial institutions and card payment networks may not inhibit the ability of merchants to direct the routing
of debit card transactions over any card payment networks that can process the transactions. Since April 2012, most debit card
issuers have been required to enable at least two unaffiliated card payment networks on each debit card. We do not expect the prohibition
on network exclusivity to impact our ability to pass on network fees and other costs to our clients. These regulatory changes create
both opportunities and challenges for us. Increased regulation may add to the complexity of operating a payment processing business,
creating an opportunity for larger competitors to differentiate themselves both in product capabilities and service delivery.
Federal Trade Commission Act and Other Laws Impacting our Customers' Business. All persons engaged in commerce, including, but
not limited to, us and our merchant and financial institution customers are subject to Section 5 of the Federal Trade Commission
Act prohibiting unfair or deceptive acts or practices, or UDAP. In addition, there are other laws, rules and or regulations, including
the Telemarketing Sales Act, that may directly impact the activities of our merchant customers and in some cases may subject us,
as the merchant's payment processor, to investigations, fees, fines and disgorgement of funds in the event we are deemed to have
aided and abetted or otherwise provided the means and instrumentalities to facilitate the illegal activities of the merchant through
our payment processing services. Various federal and state regulatory enforcement agencies including the Federal Trade Commission,
or FTC, and the states' attorney general have authority to take action against nonbanks that engage in UDAP or violate other laws,
rules and regulations and to the extent we are processing payments for a merchant that may be in violation of laws, rules and regulations,
we may be subject to enforcement actions and as a result may incur losses and liabilities that may impact our business.
Anti-Money Laundering and Counter Terrorist Regulation. We are also subject to U.S. federal anti-money laundering laws and regulations, including the Bank Secrecy Act, as amended by the USA PATRIOT Act of 2001 (collectively, the BSA). The BSA requires, among other things, that money services businesses to develop and implement risk-based anti-money laundering programs, report large cash transactions and suspicious activity and maintain transaction records
We are additionally subject to economic and trade sanctions programs administered by the Treasury Department’s Office of Foreign Assets Control, or OFAC. These programs prohibit or restrict transactions to or from or dealings with specified countries, their governments and, in certain circumstances, their nationals, narcotics traffickers, and terrorists or terrorist organizations. We are also subject to other countries’ laws, where applicable, regarding anti-money laundering, counter terrorist financing and proceeds of crime.
Privacy. Our financial institution clients are required to comply with privacy regulations imposed under the Gramm-Leach-Bliley Act. These regulations place restrictions on the use of non-public personal information. All financial institutions must disclose detailed privacy policies to their customers and offer them the opportunity to direct the financial institution not to share information with third parties. The regulations, however, permit financial institutions to share information with non-affiliated parties who perform services for the financial institutions. We believe that our company’s present activities fall under exceptions to the consumer notice and opt-out requirements in this law for third-party service providers to financial institutions. However, the laws governing privacy generally remain unsettled. We will update our policies and procedures, where relevant, should it be determined that our activities do not fall within exceptions to Gramm-Leach-Bliley Act requirements. Our businesses operating outside of the U.S. may be subject to other legal requirements concerning the use and protection of certain customer information.
| 18 |
Anti-Corruption. We are subject to applicable anti-corruption laws, such as the U.S. Foreign Corrupt Practices Act, in the jurisdictions in which we operate. Anti-corruption laws generally prohibit offering, promising, giving, or authorizing others to give anything of value, either directly or indirectly, to a government official or private party in order to influence official action or otherwise gain an unfair business advantage
Anti-Boycott. We are required to comply with U.S. anti-boycott regulations. U.S. law prohibits cooperation with any “illegal boycott request,” which includes a request from a third party to take certain actions against countries friendly to the U.S. These prohibited actions include, but are not limited to, refusal to do business with or in countries friendly to the U.S., or with other persons or entities that do business in or with countries friendly to the U.S.; furnishing information about business relationships with or in countries friendly to the U.S.; and executing business documents such as contracts, letters of credit, warranties that contain illegal boycott requests.
Other Laws and Regulations
Since we collect certain information from members and users on our platform, we will be subject to current and future government regulations regarding the collection, use and safeguarding of consumer information over the Internet and mobile communication devices. These regulations and laws may involve taxation, tariffs, user privacy, rights of publicity, data protection, content, intellectual property, distribution, electronic contracts and other communications, consumer protection and electronic payment services. In many cases, it may be unclear how existing laws governing issues such as property ownership, sales and other taxes, libel and personal privacy apply to the Internet or mobile communication services as the vast majority of these laws were adopted prior to the advent of these technologies and do not contemplate or address the unique issues raised by the Internet and e-commerce.
There are a number of legislative proposals that are anticipated or pending before the U.S. Congress, various state legislative bodies, and foreign governments concerning data protection which could affect us. Many states, for example, have already passed laws requiring notification to subscribers when there is a security breach of personal data. It is possible that these laws may be interpreted and applied in a manner that is inconsistent with our data practices. If so, in addition to the possibility of fines, this could result in an order requiring that we change our data practices, which could have an adverse effect on our business. In addition, some states are interpreting their own statutes differently than federal law. This may create additional compliance burdens.
We are subject to foreign laws and regulations that affect the electronic payments industry in each of the foreign countries in which we operate. Some of these countries, such as the Russian Federation and the United Kingdom, have undergone significant political, economic and social change in recent years. In these countries, there is a greater risk of new, unforeseen changes that could result from, among other things, instability or changes in a country’s or region’s economic conditions; changes in laws or regulations or in the interpretation of existing laws or regulations, whether caused by a change in government or otherwise; increased difficulty of conducting business in a country or region due to actual or potential political or military conflict; or action by the European Union or the United States, Canada or other governments that may restrict our ability to transact business in a foreign country or with certain foreign individuals or entities, such as sanctions by or against the Russian Federation.
Legislation could be passed that limits our ability to use or store information about our users. The Federal Trade Commission (the "FTC") and various states have established regulatory guidelines issued under the Federal Trade Commission Act and various state acts, respectively, that govern the collection, use and storage of consumer information, establishing principles relating to notice, consent, access and data integrity and security. Our practices are designed to comply with these guidelines. For example, we disclose that we collect a range of information about our users, such as their names, email addresses, search histories and activity on our platform. We also use and store such information primarily to personalize the experience on our platforms, provide customer support and display relevant advertising. While we do not sell or share personally identifiable information with third parties for direct marketing purposes, we do have relationships with third parties that may allow them access to user information for other purposes.
The foregoing list of laws and regulations to which we are subject is not exhaustive, and the regulatory framework governing our operations changes continuously. Enactment of new laws and regulations may affect our operations, and could potentially result in increased regulatory compliance costs, litigation expense, adverse publicity, and/or loss of revenue. We believe our policies and practices comply with the FTC privacy guidelines and other applicable laws and regulations. However, if our belief proves incorrect, or if these guidelines, laws or regulations or their interpretations change or new legislation or regulations are enacted, we may be compelled to provide additional disclosures to our users, obtain additional consents from our users before collecting or using their information or implement new safeguards to help our users manage our (or others') use of their information, among other changes.
Rules and Policies of and Contractual Covenants with Mobile Phone Carriers. While not governmental regulation, Digital Provider is subject to certain of the rules and policies of mobile phone carriers to which Digital Provider provides payment processing services and ongoing contractual covenants with such mobile phone carriers. The mobile phone carriers may from time to time update or otherwise modify or supplement their rules and policies. Digital Provider periodically is subject to the imposition of fines or penalties as a result of failure to comply with such rules, policies and/or contractual covenants. Digital Provider’s failure to comply with the mobile phone carriers’ respective requirements or to pay the fines or penalties they impose could result in the termination of Digital Provider’s services.
| 19 |
Telematics Laws and Regulations in the Russian Federation. The relationships between Digital Provider and telecommunications carriers in Russia are governed by the general rules of civil law for the provision of services (Chapter 39 of the Civil Code of the Russian Federation). In addition, because the “information and entertainment services” (content services) provided by Digital Provider are inextricably linked with the networks of telecommunications carriers, these services are subject to the requirements of the Rules of Mobile Communications Services Provision, approved by the Decree of the Russian Federation Government dated May 25, 2005 No. 328. These Rules govern the relationship between a customer using mobile communication services and a telecommunications carrier in respect of mobile radio communications services, mobile radiotelephone services and/or mobile satellite radio services in the public network. Although Digital Provider is not a telecommunications carrier, many requirements of such Rules are present in Digital Provider’s contracts with telecommunications carriers, and such contracts impose responsibility and liability on Digital Provider for violations.
Digital Provider has a license for the provision of telematics services in Russia. Digital Provider is considered an operator of telematics services in Russia because it has a direct connection to equipment of telecommunications carriers and it affects electronic communications (i.e., receiving, processing and/or transmitting electronic messages). Operators of telematics services in Russia are regulated by the Federal Law “On Communication” dated July 2, 2003 No. 126-FZ. This Federal Law provides the legal basis for activity in the field of communications in the Russian Federation and territories under the Russian Federation jurisdiction, defines the powers of public authorities in the field of communications, as well as the rights and responsibilities of persons involved in such activities or using communication services. Digital Provider also is subject to the Rules of Telematics Services Provision approved by the Decree of the Russian Federation Government dated September 10, 2007 No. 575. These Rules govern the relationship between a customer or a user, on the one hand, and a telecommunications carrier providing telematics communication services, on the other hand, in the provision of telematics communication services.
The activity of Digital Provider to some extent is regulated by the Federal Law “On Operational and Investigative Activities” dated August 12, 1995 No. 144-FZ. This Federal Law determines the content of the operational and investigative activities in the Russian Federation, and provides for a system of guarantees in the process of operational and investigative operations. Operational and investigative activities include activities carried out openly and secretly by operational branches of certain government bodies in order to protect life, health, rights and freedoms of the person and the citizen, property, security of the society and the state from criminal attacks.
In carrying out activities on the Internet in Russia, Digital Provider is subject to the Federal Law “On Advertising” dated March 13, 2006 No. 38-FZ. The objectives of this Federal Law are the development of markets for goods and services based on the principles of fair competition, ensuring the common economic space in the Russian Federation, the realization of the rights of consumers to receive fair and accurate advertising, creating favorable conditions for the production and distribution of public service announcements, preventions of violations of the Russian Federation on advertising, as well as the suppression of improper advertising. Digital Provider’s activities on the Internet in Russia also are subject to the Federal Law “On Protection of Children from Information Harmful to Health” dated December 29, 2010 No. 436-FZ. This Federal Law provides regulations protecting children from information harmful to their health and/or development.
Concerning relations with Federal communication service providers, Digital Provider can be involved in regulation of personal data of subscribers. In case of transferring by Federal communication service providers’ information which includes personal data Digital Provider has to take measures to protect such data as the operator of personal data must take. The list of such measures is described in Federal Law “On Personal Data” dated 27.07.2006 No 152. This Federal Law and Federal Law “On Communication” establish rules of usage of personal data of subscribers. Taking into account that this regulation is to be applied only in case of transferring information with personal data from Federal communication service providers it is important to clarify that common execution of contracts with these providers do not stipulate transferring of personal data.
Seasonality
Historically, we have experienced seasonal fluctuations in our revenues as a result of consumer spending patterns. Revenues have been weaker during the first quarter of the calendar year and stronger during the second, third and fourth quarters. We expect our business to continue experiencing seasonal fluctuations consistent with this historical pattern.
Available Information
We are subject to the informational requirements of the Securities Exchange Act of 1934 and file or furnish reports, proxy statements, and other information with the SEC. You can read our SEC filings over the Internet at the SEC’s website at www.sec.gov. Our filings with the SEC, including our Annual Report on Form 10-K, Quarterly Reports on Form 10-Q, Current Reports on Form 8-K, and any amendments to those reports, also are available free of charge on the investors section of our website at http://investor.netelement.com/en/ir when such reports are available on the SEC’s website. Further corporate governance information, including our certificate of incorporation, bylaws, governance guidelines, board committee charters, and code of business conduct and ethics, is also available on the investors section of our website.
You may also read and copy any document we file with the SEC at its public reference facilities at 100 F Street, N.E., Room 1580, Washington, DC 20549. You may also obtain copies of the documents at prescribed rates by writing to the Public Reference Section at the SEC at 100 F Street, NE, Room 1580, Washington, DC 20549. Please call the SEC at 1-800-SEC-0330 for further information on the operation of the public reference facilities. The contents of the websites referred to above are not incorporated into this filing or in any other report or document we file with the SEC, and any references to these websites are intended to be inactive textual references only.
| 20 |
Investing in our securities involves a high degree of risk. You should carefully consider the risks and uncertainties described below, together with all of the other information in this Report, including “Management’s Discussion and Analysis of Financial Condition and Results of Operations” and our consolidated financial statements and related notes, as well as the preceding “Business” section of this Report, before engaging in any transaction in our securities. Any of the following risks could materially and adversely affect our business, financial condition, results of operations and/or prospects, and cause the value of our securities to decline, which could cause you to lose all or part of your investment.
Risks Related to Our Business and Operations
We have incurred significant losses and we may continue to experience losses in the future.
Since our inception, we have incurred significant operating losses. We sustained a net loss of approximately $10 million for the year ended December 31, 2017 and an accumulated deficit of approximately $167.4 million at December 31, 2017. We had a positive working capital of approximately $4.3 million at December 31, 2017. Our current assets at December 31, 2017 included $11.3 million in cash, $5.5 million of accounts receivable and $1.6 million in prepaid expenses. Our current liabilities included $10.5 million in accounts payable and accrued expenses, $1.7 million in deferred revenue and $2.5 million in current notes payable. As of the filing date of this Report with the SEC, management expects that our cash balance will be sufficient to fund our $4.8 million projected operating cash flow shortfall over the next twelve months. We may continue to incur losses in the future and may never generate revenues sufficient to become profitable or to sustain profitability.
Continuing losses may impair our ability to raise any additional funds required to continue and expand our operations. Additional funds may be raised through debt financing and/or the issuance of equity securities, there being no assurance that any type of financing on terms satisfactory to us will be available or otherwise occur.
Debt financing must be repaid regardless of whether we generate revenues or cash flows from operations and may be secured by substantially all of our assets. Any equity financing or debt financing that requires the issuance of equity securities or warrants to the lender would cause the percentage ownership by our current stockholders to be diluted, which dilution may be substantial. Also, any additional equity securities issued may have rights, preferences or privileges senior to those of existing stockholders. If such financings are not available when required or are not available on acceptable terms, we may be unable to implement our business plans or take advantage of business opportunities, any of which could have a material adverse effect on our business, financial condition, results of operations and/or prospects and may ultimately require us to suspend or cease operations, which could cause investors to lose the entire amount of their investment.
Global economic, political, and other conditions may adversely affect trends in consumer, business, and government spending, which may adversely impact the demand for our services and our revenue and profitability.
Financial services, payments, and technology industries in which we operate depend heavily upon the overall level of consumer, business, and government spending. A sustained deterioration in the general economic conditions (including distress in financial markets, turmoil in specific economies around the world, and additional government intervention), particularly in the United States or Europe, or increases in interest rates in key countries in which we operate may adversely affect our financial performance by reducing the number or average purchase amount of transactions involving payment cards. A reduction in the amount of consumer spending could result in a decrease of our revenue and profits. The current threats to global economic growth include geopolitical instability in Russia, Ukraine, the Middle East and other oil producing countries. Instability in these regions could affect economic conditions in Europe and the United States.
Adverse economic trends may accelerate the timing, or increase the impact of, risks to our financial performance. Such trends may include, but are not limited to, the following:
| · | Declining economies, foreign currency fluctuations, and the pace of economic recovery can change consumer spending behaviors on which a significant portion of our revenues are dependent. | |
| · | Low levels of consumer and business confidence typically associated with recessionary environments, and those markets experiencing relatively high unemployment, may cause decreased spending by cardholders. | |
| · | Budgetary concerns in the United States and other countries around the world could affect the United States and other specific sovereign credit ratings, impact consumer confidence and spending, and increase the risks of operating in those countries. | |
| · | Emerging market economies tend to be more volatile than the more established markets we serve in the United States and Europe, and adverse economic trends may be more pronounced in such emerging markets. | |
| · | Financial institutions may restrict credit lines to cardholders or limit the issuance of new cards to mitigate cardholder defaults. | |
| · | Uncertainty and volatility in the performance of our clients' businesses may make estimates of our revenues, rebates, incentives, and realization of prepaid assets less predictable. | |
| · | Our clients may decrease spending for value-added services. | |
| · | Government intervention, including the effect of laws, regulations, and /or government investments in our clients, may have potential negative effects on our business and our relationships with our clients or otherwise alter their strategic direction away from our products. |
| 21 |
A weakening in the economy could also force some retailers to close, resulting in exposure to potential credit losses and declines in transactions, and reduced earnings on transactions due to a potential shift to large discount merchants. Additionally, credit card issuers may reduce credit limits and become more selective in their card issuance practices. Changes in economic conditions could adversely impact our future revenues and profits and result in a downgrade of our corporate capacity to borrow, which may lead to termination or modification of certain contracts and make it more difficult for us to obtain new business. Any of these developments could have a material adverse impact on our overall business and results of operations.
Our ability to anticipate and respond to changing industry trends and the needs and preferences of our clients and consumers may affect our competitiveness or demand for our products, which may adversely affect our operating results.
Financial services, payments, and technology industries are subject to rapid technological advancements, new products and services, including mobile payment applications, evolving competitive landscape, developing industry standards, and changing client and consumer needs and preferences. We expect that new services and technologies applicable to the financial services, payments, and technology industries will continue to emerge. These changes in technology may limit the competitiveness of and demand for our services. Also, our clients and their customers continue to adopt new technology for business and personal uses. We must anticipate and respond to these changes in order to remain competitive within our relative markets. For example, our ability to provide innovative POS technologies to our merchant clients could have an impact on our North American Transaction Solutions segment.
Failure to develop value-added services that meet the needs and preferences of our clients could have an adverse effect on our ability to compete effectively in our industry. Furthermore, clients' and their customers' potential negative reaction to our products and services can spread quickly through social media and damage our reputation before we have the opportunity to respond. If we are unable to anticipate or respond to technological changes or evolving industry standards on a timely basis, our ability to remain competitive could be materially adversely affected.
Substantial and increasingly intense competition worldwide in the financial services, payments, and technology industries may materially and adversely affect our overall business and operations.
Financial services, payments, and technology industries are highly competitive and our payment solutions compete against all forms of financial services and payment systems, including cash and checks, and electronic, mobile, and e-commerce payment platforms. If we are unable to differentiate ourselves from our competitors, drive value for our clients and/or effectively align our resources with our goals and objectives, we may not be able to compete effectively. Our competitors may introduce their own value-added or other services or solutions more effectively than we do, which could adversely impact our growth. We also compete against new entrants that have developed alternative payment systems, e-commerce payment systems, and payment systems for mobile devices. Failure to compete effectively against any of these competitive threats could have a material adverse effect on us. In addition, the highly competitive nature of our industry could lead to increased pricing pressure which could have a material impact on our overall business and results of operations.
Potential changes in the competitive landscape, including disintermediation from other participants in the payments value chain, could harm our business.
We expect that the competitive landscape will continue to change, including:
| · | Rapid and significant changes in technology, resulting in new and innovative payment methods and programs that could place us at a competitive disadvantage and that could reduce the use of our products. | |
| · | Competitors, clients, governments, and other industry participants may develop products that compete with or replace our value-added products and services. | |
| · | Participants in the financial services, payments, and technology industries may merge, create joint ventures, or form other business combinations that may strengthen their existing business services or create new payment services that compete with our services. | |
| · | New services and technologies that we develop may be impacted by industry-wide solutions and standards related to migration to EMV chip technology, tokenization, or other safety and security technologies. |
Failure to compete effectively against any of these competitive threats could have a material adverse effect on us.
The market for our electronic commerce services is evolving and may not continue to develop or grow rapidly enough for us to develop and increase our profitability.
If the number of electronic commerce transactions does not continue to grow or if consumers or businesses do not continue to adopt our services, it could have a material adverse effect on the profitability of our business, financial condition, and results of operations. We believe future growth in the electronic commerce market will be driven by the cost, ease-of-use, and quality of products and services offered to consumers and businesses. In order to consistently increase and maintain our profitability, consumers and businesses must continue to adopt our services, including our merchant suite, Aptito and PayOnline solutions.
If we cannot compete effectively, we will lose business.
We believe our mobile payment processing business is positioned to be competitive in our target markets. We cannot guarantee that we will be able to maintain or increase revenues from our existing operations, or that our proposed future operations will be implemented successfully. Our principal competitive considerations include:
| 22 |
| · | financial resources to allocate to proper marketing and sales efforts; | |
| · | the ability to develop and maintain our operations, applications and technologies; | |
| · | the ability to effectively implement our business plans and strategies; | |
| · | establishing our brand name; | |
| · | financial resources to support working capital needs and required capital investments; and | |
| · | effects of sanctions on our business. |
We rely on third-party processors and service providers; if they fail or no longer agree to provide their services, our merchant relationships could be adversely affected and we could lose business.
We rely on agreements with several large payment processing organizations to enable us to provide card authorization, data capture, settlement and merchant accounting services and access to various reporting tools for the merchants we serve. We also outsource other services including reorganizing and accumulating daily transaction data on a merchant-by-merchant and card issuer-by-card issuer basis and forwarding the accumulated data to the relevant Payment Card Brands. Many of these organizations and service providers are our competitors, and we do not have long-term contracts with most of them. Typically, our contracts with these third parties are for one-year and are subject to cancellation upon limited notice by either party. The termination by our service providers of their arrangements with us or their failure to perform their services efficiently and effectively may adversely affect our relationships with the merchants whose accounts we serve and may cause those merchants to terminate their processing agreements with us.
We rely on bank sponsors, which have substantial discretion with respect to certain elements of our business practices, in order to process bankcard transactions. If these sponsorships are terminated and we are not able to secure or successfully migrate merchant portfolios to new bank sponsors, we will not be able to conduct our business.
Because we are not a bank, we are unable to belong to and attain direct membership to Visa and MasterCard. Visa and MasterCard operating regulations require us to be sponsored by a bank in order to process bankcard transactions. We are currently registered with Visa and MasterCard through the sponsorship from banks that are members of the card brands. The principal sponsoring bank through which we process the significant majority of our transactions is BMO Harris Bank. If our sponsorships are terminated and we are not able to secure or successfully migrate merchant portfolios to new bank sponsors, we will not be able to conduct our business.
If we or our bank sponsors fail to adhere to the standards of Visa and MasterCard, our registrations with these organizations could be terminated, and we could be required to stop providing payment processing services for Visa and MasterCard.
Substantially all of the transactions we process involve Visa or MasterCard. If we or our bank sponsors fail to comply with the applicable requirements of the Visa or MasterCard payment card brands, Visa or MasterCard could suspend or terminate our registration. The termination of our registration or any changes in the Visa or MasterCard rules that would impair our registration could prevent us from providing transactional processing services.
If PayOnline fails to maintain its key partnerships with banks, financial institutions or payment processors, our financial results could be adversely affected.
PayOnline’s business relies on partnering with different banks, financial institutions and payment processors to expand globally in order to enable it to provide international payment processing. To the extent PayOnline fails to maintain key partnerships with such banks, financial institutions or payment processors, our financial results could be adversely affected. Such failure to maintain partnerships may be due to mergers and/or consolidations of banks, financial institutions and payment processors, which may result in potential changes in their business processes that could negatively affect PayOnline operations, in particular in emerging markets, such as Kazakhstan.
We periodically experience increases in interchange and other related costs, and if we cannot pass these increases along to our merchants, our profit margins will decline.
We pay interchange fees and assessments to issuing banks through the card brands for each transaction we process using their credit and debit cards. From time to time, the card brands increase the interchange fees that they charge processors and the sponsoring banks. At their sole discretion, our sponsoring banks have the right to pass any increases in interchange fees on to us. In addition, our sponsoring banks may seek to increase their Visa and MasterCard sponsorship fees to us, all of which are based upon the dollar amount of the payment transactions we process. If we are not able to pass these fee increases along to merchants through corresponding increases in merchant discount, our profit margins will decline.
To acquire and retain merchant accounts, we depend on independent non-bank sales groups that do not serve us exclusively.
We rely on the efforts of ISGs to market our services to merchants seeking to establish a credit card processing relationship. ISGs are companies that seek to introduce to us, as well as our competitors, newly established and existing small merchants, including retailers, restaurants and other service providers. Generally, our agreements with ISGs are not exclusive and they have the right to refer merchants to other providers of transaction payment processing services. Our failure to maintain our relationships with our existing ISGs and to recruit and establish new relationships with other ISGs could adversely affect our revenues and internal growth and increase our merchant attrition.
| 23 |
Unauthorized disclosure of data, whether through cybersecurity breaches, computer viruses or otherwise, could expose us to liability, protracted and costly litigation and could damage our reputation.
We process, store and/or transmit sensitive data, such as names, addresses, credit or debit card numbers and bank account numbers, and we may have liability if we fail to protect this data in accordance with applicable laws and our clients’ specifications. The loss of data could result in significant fines and sanctions by our clients or governmental bodies, which could have a material adverse effect on our business, financial condition and results of operations. These concerns about security are increased when we transmit information over the Internet. Computer viruses can be distributed and spread rapidly over the Internet and could infiltrate our systems, which might disrupt our services and make them unavailable. In addition, a significant cybersecurity breach could result in payment networks prohibiting us from processing transactions on their networks or the loss of clients. We have been in the past and could be in the future, subject to breaches of security by hackers. It is possible that our encryption of data and other protective measures may not prevent unauthorized access. Although we have not to date incurred material losses or liabilities as a result of those breaches, a future breach of our system may subject us to material losses or liability, including payment of fines and claims for unauthorized purchases with misappropriated credit or debit card or bank account information or other similar fraud claims. A misuse of such data or a cybersecurity breach could harm our reputation and deter clients from using electronic payments generally and our services specifically, increase our operating expenses in order to correct the breaches or failures, expose us to uninsured liability, increase our risk of regulatory scrutiny, subject us to lawsuits and/or result in the imposition of material penalties and fines under applicable laws or by our clients.
Our operating results are subject to seasonality, and, if our revenues are below our seasonal norms during our historically stronger quarters, our financial results could be adversely affected.
We have experienced in the past, and expect to continue to experience, seasonal fluctuations in our revenues as a result of consumer spending patterns. Historically, revenues have been weaker during the first quarter of the calendar year and stronger during the second, third and fourth quarters. If, for any reason, our revenues are below seasonal norms during the second, third or fourth quarter, our business, financial condition and results of operations could be materially adversely affected.
New and potential governmental regulations designed to protect or limit access to consumer information could adversely affect our ability to provide, or impair the value of, the services we currently provide to our merchants.
Due to the increasing public concern over consumer privacy rights, governmental bodies in the United States and abroad have adopted, and are considering adopting, additional laws and regulations restricting the purchase, sale and sharing of personal information about customers. For example, the Gramm-Leach-Bliley Act requires non-affiliated third-party service providers to financial institutions to take certain steps to ensure the privacy and security of consumer financial information. We believe our present activities fall under exceptions to the consumer notice and opt-out requirements contained in this law for third-party service providers to financial institutions. However, the laws governing privacy generally remain unsettled. Even in areas where there has been some legislative action, such as the Gramm-Leach-Bliley Act and other consumer statutes, it is difficult to determine whether and how existing and proposed privacy laws or changes to existing privacy laws will apply to our business. Limitations on our ability to access and use customer information could adversely affect our ability to provide the services we currently offer to our merchants or impair the value of these services. Several states have proposed legislation that would limit the use of personal information gathered using the Internet. Some proposals would require proprietary online service providers and website owners to establish privacy policies. Congress has also considered privacy legislation that could further regulate the use of consumer information obtained over the Internet or in other ways. Our compliance with these privacy laws and related regulations could materially affect our operations.
Changes to existing laws or the passage of new laws could:
| · | create uncertainty in the marketplace that could reduce demand for our services; | |
| · | restrict or limit our ability to sell certain products and services to certain customers; | |
| · | limit our ability to collect and to use merchant and cardholder data; or | |
| · | increase the cost of doing business as a result of litigation costs or increased operating costs; |
Any changes to existing laws or the passage of new laws that have effects such as those described above could have a material adverse effect on our business, financial condition and results of operations.
If we are required to pay federal, state or local taxes on transaction processing, it could negatively impact our profit margins.
Transaction processing companies may become subject to federal, state or local taxation of certain portions of their fees charged to merchants for their services. Application of these taxes is an emerging issue in our industry and taxing jurisdictions have not yet adopted uniform positions on this topic. If we are required to pay such taxes and are unable to pass this tax expense through to our merchant clients, or are unable to produce increased cash flow to offset such taxes, these taxes would negatively impact our profit margins.
| 24 |
The volume and amounts of the accounts receivable suitable for assignment to the lenders under our current factoring lines of credit as of the time we choose to draw under such facilities may vary, thus potentially reducing the amounts of such draws. Any such reductions may adversely affect our ability to satisfy our working capital and other liquidity needs.
Our credit facilities are currently structured as factoring lines of credit. Pursuant to these credit facilities, we assign certain (but not all) of our trade receivables from mobile operators to our lenders. The amounts of our draws under such facilities from time to time will depend on the amounts of the accounts receivable suitable to the lenders under such credit facilities for such assignment as of the time we choose to draw under such facility. If we require access to immediate liquidity to meet our working capital requirements, our draws under our credit facilities to satisfy those needs could be potentially reduced (depending on the amounts of the accounts receivable suitable to the lenders as of the time of any such draw), which could adversely affect our ability to satisfy our working capital and other liquidity needs.
We are subject to foreign laws and regulations, which are subject to change and uncertain interpretation.
We are subject to foreign laws and regulations that affect the electronic payments industry in each of the foreign countries in which we operate. Some of these countries, such as the Russian Federation, have undergone significant political, economic and social change in recent years. In these countries, there is a greater risk of new, unforeseen changes that could result from, among other things, instability or changes in a country’s or region’s economic conditions; changes in laws or regulations or in the interpretation of existing laws or regulations, whether caused by a change in government or otherwise; increased difficulty of conducting business in a country or region due to actual or potential political or military conflict; or action by the European Union, the United States or other governments that may restrict our ability to transact business in a foreign country or with certain foreign individuals or entities, such as sanctions by or against the Russian Federation.
Proposed foreign legislation and regulations could also affect our business. For example, the Russian Federal Tax Service is interested in all betting sites that render services to Russian citizens and wants to have these sites operate their business within the Russian Federation. Some believe that Russian regulators will lobby for a ban on payments for betting sites operating outside of Russia. If such a bill is adopted, then betting sites not registered in Russia could be limited in their ability to process payments, which could harm our customers and adversely affect our payment processing business.
Our management has identified continued material weaknesses in our controls and procedures as of December 31, 2017, which, if not properly remedied, could result in material misstatements in our financial statements.
As of the end of the period covered by this Report, our management conducted an evaluation, under the supervision and with the participation of our Chief Executive Officer and Chief Financial Officer, of the effectiveness of our disclosure controls and procedures (as defined in Rule 13a-15(e) and Rule 15d-15(e) under the Exchange Act). Based on that evaluation, our Chief Executive Officer and Chief Financial Officer concluded that our disclosure controls and procedures were not effective because there are a limited number of personnel employed and we cannot have an adequate segregation of duties, and due to the material weaknesses in our internal control over financial reporting as discussed in “Management’s Report on Internal Control Over Financial Reporting” in Part II, Item 9A of this Report. Accordingly, management cannot provide reasonable assurance of achieving the desired control objective. Management works to mitigate these risks by being personally involved in all substantive transactions and attempts to obtain verification of transactions and accounting policies and treatments involving our operations, including those overseas. We are in the process of reviewing and, where necessary, modifying controls and procedures throughout the Company and we plan to address deficiencies identified over the next 18-24 months.
Acquisition activities could result in operating difficulties, dilution to our stockholders and other harmful consequences, and we may not achieve the anticipated benefits of the acquisitions.
We have built our current business primarily through acquisitions of intellectual property and other assets in connection with acquiring businesses, such as Unified Payments, Aptito and PayOnline, and we intend to selectively pursue strategic acquisitions in the future. Future acquisitions could divert management’s time and focus from operating our business. In addition, integrating an acquired company, business or technology is risky and may result in unforeseen operating difficulties and expenditures. Foreign acquisitions also involve unique risks related to integration of operations across different cultures and languages, currency risks and the particular economic, political and regulatory risks associated with specific countries. We may not accurately assess the value or prospects of acquisition candidates, and the anticipated benefits from our future or even past acquisitions may not materialize. In addition, future acquisitions or dispositions could result in potentially dilutive issuances of our equity securities, including our common stock, the incurrence of significant amounts of debt, contingent liabilities or amortization expenses, or write-offs of goodwill, any of which could negatively affect our financial condition.
We are dependent upon certain key relationships. If any of our key relationships were to deteriorate, our business prospects, financial condition and results of operations could be materially adversely affected.
Our success, particularly the success of our payment processing business, is dependent, in part, upon industry relationships of our Chief Executive Officer, Oleg Firer. If we were to lose the services of Mr. Firer, or if the industry relationships of Mr. Firer on which we rely were to deteriorate, our business prospects, financial condition and results of operations could be materially adversely affected. To our knowledge, Mr. Firer currently has no plans to retire or leave us in the near future, and we are not aware of any material adverse developments in his industry relationships. We do not have “key person” insurance on the life of Mr. Firer or any other member of our management team.
| 25 |
If we fail to adequately protect or enforce our intellectual property rights, competitors may create and market products and services similar to ours. In addition, we may be subject to intellectual property litigation and infringement claims by third parties.
Our ability to compete effectively is dependent in part upon the proprietary nature of our technologies and software platforms. We generally rely on a combination of trade secret, copyright, trademark and patent law to protect our proprietary rights in our intellectual properties. Although we attempt to protect our proprietary technologies through trade secrets, trademarks, patents and license and other agreements, these may be insufficient. In addition, if we license our software in non-U.S. countries, because of differences in foreign laws concerning proprietary rights, our intellectual properties may not receive the same degree of protection in non-U.S. countries as they would in the United States. We may not always be able to successfully protect or enforce our proprietary information and assets against competitors, which may materially adversely affect our business prospects, financial condition and results of operations. In addition, there can be no assurance that our competitors will not independently utilize existing technologies to develop products that are substantially equivalent or superior to ours, which also could materially adversely affect our business prospects, financial condition and results of operations.
Although we do not believe that our intellectual properties infringe the rights of others, and while to date we have not been subject to such claims, we may be exposed to, or threatened with, future litigation by other parties alleging that our technologies infringe their intellectual property rights. Any intellectual property claims, regardless of their merit, could be time consuming, expensive to litigate or settle and could divert management resources and attention. An adverse determination in any intellectual property claim could require us to pay damages and/or stop using our technologies and other material found to be in violation of another party’s rights and could prevent us from licensing our technologies to others. In order to avoid these restrictions, we may have to seek a license. Such a license may not be available on reasonable terms, could require us to pay significant license fees and may significantly increase our operating expenses. A license also may not be available to us at all. As a result, we may be required to use and/or develop non-infringing alternatives, which could require significant effort and expense. If we cannot obtain a license or develop alternatives for any infringing aspects of our business, we may be forced to limit our technologies and may be unable to compete effectively. Any of these adverse consequences could have a material adverse effect on our business prospects, financial condition and results of operations.
Further, from time to time we may be engaged in disputes regarding the licensing of our intellectual property rights, including matters related to the terms of our licensing arrangements. These types of disputes can be asserted by our licensees or prospective licensees or by other third parties as part of negotiations with us or in private actions seeking monetary damages or injunctive relief or in regulatory actions. Requests for monetary and injunctive remedies asserted in claims like these could be material and could have a significant impact on our business prospects. Any disputes with our licensees, potential licensees or other third parties could materially adversely affect our business prospects, financial condition and results of operations.
Fluctuations in foreign currency exchange rates could negatively affect our financial results.
We earn revenues and interest income, pay expenses, own assets and incur liabilities in countries using currencies other than the U.S. dollar. In the year ended December 31, 2017, we used one functional currency - the Russian ruble - in addition to the U.S. dollar, and derived more than 14% of our total net revenues from operations outside the United States in Russia and CIS. As of December 31, 2017, the foreign exchange rate for the Russian ruble has improved by approximately 5% as compared to the Daily rate at December 31, 2016. Because our consolidated financial statements are presented in U.S. dollars, we must translate net revenues, interest income and expenses, as well as assets and liabilities, into U.S. dollars at exchange rates in effect during or at the end of each reporting period. Therefore, increases or decreases in the value of the U.S. dollar against other major currencies will affect the amounts of our net revenues, interest income, operating expenses and the value of balance sheet items, including intercompany assets and obligations. Because we have operations in Russia, our exchange rate risk is highly sensitive to the prevailing value of the U.S. dollar relative to the Russian ruble, which exchange rates have fluctuated significantly in recent months as a result, in part, of the continuing instability in Ukraine and Syria as well as continued sanctions against Russia. Fluctuations in foreign currency exchange rates, particularly the U.S. dollar against the Russian ruble, may materially adversely affect our financial results.
Our business is subject to complex and evolving U.S. and foreign laws and regulations regarding privacy, data protection and other matters. Many of these laws and regulations are subject to change and uncertain interpretations, and could result in claims, changes to our business practices, increased cost of operations or declines in user growth or engagement, or otherwise harm our business.
We are subject to a number of foreign and domestic laws and regulations that affect companies conducting business on the Internet and companies transmitting user information and payments via text message or other electronic means, many of which are still evolving and the interpretation of which are often uncertain. Failure to comply with applicable laws and regulations may result in the suspension or revocation of licenses or registrations, the limitation, suspension or termination of services and/or the imposition of civil and criminal penalties and/or fines. The services of Digital Provider to mobile phone carriers also are subject to certain of the rules and policies of such carriers and ongoing contractual covenants with such carriers, the violation of which may result in penalties and/or fines and possible termination of Digital Provider’s services. For additional information, see “Business Description - Regulation” in Part I, Item 1 of this Report.
Poor perception of our brand, business or industry could harm our reputation and adversely affect our business prospects, financial condition and results of operations.
The success of our business depends in part on our reputation within our industries and with our clients and consumers. We may be the subject of unflattering reports in blogs, video blogs and the media about our business and our business model. Any damage to our reputation could harm our ability to obtain and retain contracts with mobile phone carriers, content providers, advertisers and other customers, which could materially adversely affect our results of operations, financial condition and business.
| 26 |
Our business is subject to the risks of hurricanes, floods, fires and other natural catastrophic events and to interruption by man-made problems such as computer viruses or terrorism.
Our systems and operations are vulnerable to damage or interruption from hurricanes, floods, fires, power losses, telecommunications outages, terrorist attacks, acts of war, human errors, break-ins and similar events. Our U.S. corporate offices are located in Miami, Florida, which is an area that is at high risk of hurricane and flood damage. In addition, acts of terrorism, which may be targeted at metropolitan areas that have higher population density than rural areas, could cause disruptions in our business or the economy as a whole. The servers that we use through various third party service providers are not located in Miami, Florida but may also be vulnerable to computer viruses, break-ins and similar disruptions from unauthorized tampering with our computer systems, which could lead to interruptions, delays, loss of critical data or the unauthorized disclosure of confidential information. Such service providers may not have sufficient protection or recovery plans in certain circumstances, and our insurance may not be sufficient to compensate us for losses that may occur. As we rely heavily on our servers, computer and communications systems and the Internet to conduct our business, such disruptions could negatively impact our ability to run our business and either directly or indirectly disrupt our customers’ respective businesses, which could have an adverse effect on our business prospects, operating results and financial condition.
We incur increased costs as a result of being a public company.
As a public company, we currently incur significant legal, accounting and other expenses not incurred by private companies. It may be time consuming, difficult and costly for us to develop, implement and maintain the additional internal controls, processes and reporting procedures required by federal statutes, SEC rules, other government regulations affecting public companies and/or stock exchange compliance requirements. We may need to hire additional financial reporting, internal auditing and other finance staff in order to develop, implement and maintain appropriate internal controls, processes and reporting procedures, which will increase our expenses and adversely affect our operating results and financial condition.
We are the subject of various legal proceedings which could have a material adverse effect on our business, financial condition or operating results.
We are involved in various litigation matters. We may, from time to time, also be involved in or be the subject of governmental or regulatory agency inquiries or investigations. If we are unsuccessful in our defense in the litigation matters, or any other legal proceeding, we may be forced to pay damages or fines and/or change our business practices, any of which could have a material adverse effect on our business, financial condition and results of operations. For more information about our legal proceedings, see “Legal Proceedings” in Part I, Item 3 of this Report.
Our merchants may be unable to satisfy obligations for which we may also be liable.
We are subject to the risk of our merchants being unable to satisfy obligations for which we may also be liable. For example, we and our merchant acquiring alliances may be subject to contingent liability for transactions originally acquired by us that are disputed by the cardholder and charged back to the merchants. If we or the alliance is unable to collect this amount from the merchant because of the merchant’s insolvency or other reasons, we or the alliance will bear the loss for the amount of the refund paid to the cardholder. We have an active program to manage our credit risk and often mitigate our risk by obtaining collateral. It is possible, however, that a default on such obligations by one or more of our merchants could have a material adverse effect on our business.
Fraud by merchants or others could have a material adverse effect on our business, financial condition, and results of operations.
We may be subject to potential liability for fraudulent electronic payment transactions or credits initiated by merchants or others. Examples of merchant fraud include when a merchant or other party knowingly uses a stolen or counterfeit credit, debit or prepaid card, card number, or other credentials to record a false sales transaction, processes an invalid card, or intentionally fails to deliver the merchandise or services sold in an otherwise valid transaction. Criminals are using increasingly sophisticated methods to engage in illegal activities such as counterfeiting and fraud. It is possible that incidents of fraud could increase in the future. Failure to effectively manage risk and prevent fraud would increase our chargeback liability or other liability. Increases in chargebacks or other liability could have a material adverse effect on our business, financial condition, and results of operations.
Risks Relating to Blockchain Technology
We may not be successful in developing our blockchain technology solutions, and even if such platform is developed, there are a number of risks that may prevent its widespread adoption.
We have been developing, but have not yet launched, a decentralized crypto-based ecosystem that will act as a framework for a number of value-added services that can connect merchants and consumers directly utilizing blockchain technology while increasing the economic efficiency of all transactions being made within the ecosystem. However, blockchain technology is new and its uses are constantly evolving. Accordingly, we may not be successful in developing our blockchain technology solutions in a timely manner or at all.
| 27 |
In addition, even if we are able to develop our blockchain platform, such technology is subject to a number of risks that may prevent its widespread adoption, including:
| • | Risks of unfavorable regulatory action in one or more jurisdictions. Blockchain technologies and cryptocurrencies have been the subject of scrutiny by various regulatory bodies around the world. We could be impacted by one or more regulatory inquiries or actions, including but not limited to restrictions on the use of blockchain technology, which could impede or limit the development of our anticipated blockchain technology solutions. |
| • | Risks relating to competition and alternative platforms. Blockchain industry is highly competitive and competition should intensify in the future. There are many platforms that enable the use of blockchain technologies in the payments ecosystem. Additional competitors are likely to enter the industry in the future. There is also competition from the traditional payment networks, all of which could potentially negatively impact us. |
| • | Risks associated with unauthorized access. Third parties that gains access to a user’s login credentials or private keys may be able to transfer the user’s value. To minimize this risk, the users should guard against unauthorized access to their electronic devices. |
| • | Risks that our anticipated blockchain technology solutions, as developed, will not meet the expectations of its target audience. Our anticipated blockchain technology solutions are presently under development and may undergo significant changes before beta and/or final release. Any expectations regarding the form and functionality of our anticipated blockchain technology solutions may not be met upon release, for any number of reasons including change in the design and implementation plans and execution. |
| • | Risks of theft and hacking. Hackers or other groups or organizations may attempt to interfere with the blockchain technology or the availability of our anticipated blockchain technology solutions in any number of ways, including without limitation denial of service attacks, Sybil attacks, spoofing, smurfing, malware attacks, or consensus based attacks. We expect to spend significant resources to consistently penetrate test and monitor its technology to prevent any such threats. |
| • | Risk of security weaknesses in the core infrastructure and software. Some parts of the core software may be based on open-source software. There is a risk that the development team or other third parties may intentionally or unintentionally introduce weaknesses or bugs into the core infrastructure elements of our anticipated blockchain technology solutions, which may materially interfere with its use. |
| • | Risk of weaknesses or exploitable breakthroughs in the field of cryptography. Advances in cryptography, or technical advances such as the development of quantum computers, could present risks to cryptocurrencies and network, which could result in theft or loss. |
| • | Unanticipated risks. Blockchain technology, cryptocurrency and cryptographic tokens are new and untested technologies. In addition to the risks set forth here, there are risks that we cannot anticipate. Risks may further materialize as unanticipated combinations or variations from the risks set forth here. |
We may not be able to develop new products or enhance the capabilities related to blockchain technology that is being developed by us to keep pace with our industry’s rapidly changing technology and customer requirements.
The industry for blockchain technology is characterized by rapid technological changes, new product introductions, enhancements, and evolving industry standards. Our business prospects depend on our ability to develop new products and applications for our technology in new markets that develop as a result of technological and scientific advances, while improving performance and cost-effectiveness. New technologies, techniques or products could emerge that might offer better combinations of price and performance than the blockchain technology solutions that are being developed by us. It is important that we anticipate changes in technology and market demand. If we do not successfully innovate and introduce new technology into our anticipated technology solutions or effectively manage the transitions of our technology to new product offerings, our business, financial condition and results of operations could be harmed.
Risks Related to Our Common Stock
Our officers, directors and their affiliates own a large portion of our common stock. Future sales or distributions of our common stock in the public market by us or our officers, directors and their affiliates could adversely affect the trading price of our common stock.
At March 30, 2018, our officers, directors and their affiliates beneficially owned approximately 20.3% of our common stock. Sales or distributions of a substantial number of shares of our common stock by our officers, directors and their affiliates in the public market, or the perception that these sales or distributions might occur, may cause the market price of our common stock to decline.
| 28 |
In addition, we may sell equity securities in the future to obtain funds for general corporate, working capital, acquisitions or other purposes. We may sell these securities at a discount to the then market price. Any future sales of equity securities will dilute the holdings of existing stockholders, possibly reducing the value of their investment.
In addition, we may sell equity securities in the future to obtain funds for general corporate, working capital, acquisitions or other purposes. We may sell these securities at a discount to the then market price. Any future sales of equity securities will dilute the holdings of existing stockholders, possibly reducing the value of their investment.
The market price and trading volume of our common stock may be volatile, which could result in rapid and substantial losses for our stockholders.
You should consider an investment in our common stock to be risky, and you should invest in our common stock only if you can withstand a significant loss and wide fluctuations in the market value of your investment. Many factors could cause the market price of our common stock to rise and fall, including the following:
| · | our announcements or our competitors’ announcements regarding new products or services, enhancements, significant contracts, acquisitions or strategic investments; |
| · | changes in earnings estimates or recommendations by securities analysts, if any, who cover our common stock; |
| · | results of operations that are below our announced guidance or below securities analysts’ or consensus estimates or expectations; |
| · | fluctuations in our quarterly financial results or the quarterly financial results of companies perceived to be similar to us; |
| · | changes in our capital structure, such as future issuances of securities, sales of large blocks of common stock by our stockholders or our incurrence of additional debt; |
| · | investors’ general perception of us and our industry; |
| · | changes in general economic and market conditions; |
| · | changes in industry conditions; and |
| · | changes in regulatory and other dynamics. |
In addition, if the market for stocks in our industry, or the stock market in general, experiences a loss of investor confidence, the trading price of our common stock could decline for reasons unrelated to our business, financial condition or results of operations. If any of the foregoing occurs, it could cause our stock price to fall and may expose us to lawsuits that, even if successfully defended, could be costly to defend and a distraction to management.
Item 1B. Unresolved Staff Comments.
Not applicable.
North American Transaction Solutions
On May 10, 2013, we entered into a lease agreement, which is dated as of May 1, 2013, for approximately 4,101 square feet of office space located at 3363 N.E. 163rd Street, Suites 705 through 707, North Miami Beach, Florida 33160. The term of the lease agreement was from May 1, 2013 through December 31, 2016, with monthly rent increasing from $16,800 per month at inception to $19,448 per month (or $233,377 per year) for the period from January 1, 2016 through December 31, 2016.
On August 1, 2017, this lease was extended for a period of five years commencing August 1, 2017 and expiring July 31, 2022 with equal monthly base rent installments of $14,354 ($172,248 per year) plus sales tax. When the additional office space located in suite 805 become available, for approximately 1,375 square feet, the total monthly rent will increase to $20,535 (or $246,420 per year) until the end of the lease term.
NetLabs Systems, LLC, through its Russian representative office, currently leases 1,654 square feet of office space in Yekaterinburg, Russia, where we develop Value Added Services, Mobile Applications, Smart Terminals Applications, Sales Central ERP system development and Marketing activities, at annual rent of approximately $24,300. The current lease term expires on June 1, 2018.
| 29 |
International Transaction Solutions
PayOnline Systems leases approximately 4,675 square feet of a new office space in Moscow, Russia at an annual rent of $84,457. The current lease term for the office space expires on September 30, 2018.
PayOnline previously leased approximately 156 square feet of office space in Almaty, Kazakhstan at an annual rent of $1,527. The lease term expired on January 31, 2018 and was not renewed.
We believe that our current facilities are suitable and adequate for our present purposes, and we anticipate that we will be able to extend our existing leases on terms satisfactory to us or acquire new facilities on acceptable terms.
For a discussion of legal proceedings, see “Litigation” in Note 11 to the Consolidated Financial Statements, which is incorporated by reference herein.
Item 4. Mine Safety Disclosures.
Not applicable.
Item 5. Market for Registrant’s Common Equity, Related Stockholder Matters and Issuer Purchases of Equity Securities.
Market Information
Our common stock began trading on The NASDAQ Capital Market under the symbol “NETE” on October 3, 2012. From October 22, 2010 through October 2, 2012, our ordinary shares (then known as Cazador Acquisition Corporation Ltd.) traded on The NASDAQ Capital Market under the symbol “CAZA.” For the periods indicated, the following table sets forth the high and low intraday sales prices per share of our common stock on The NASDAQ Capital Market.
| Fiscal 2017 | Fiscal 2016 | |||||||||||||||
| Quarter Ended | High | Low | High | Low | ||||||||||||
| March 31, | $ | 15.40 | $ | 7.40 | $ | 45.00 | $ | 15.00 | ||||||||
| June 30, | 9.10 | 6.20 | 46.00 | 17.10 | ||||||||||||
| September 30, | 11.00 | 2.60 | 25.50 | 10.30 | ||||||||||||
| December 31, | 33.51 | 3.47 | 13.80 | 7.00 | ||||||||||||
Holders
As of December 31, 2017, our common stock was held by approximately 561 stockholders of record. The number of record holders was determined from the records of our transfer agent and does not include beneficial owners of common stock whose shares are held in the names of various securities brokers, dealers and registered clearing agencies. Our transfer agent is Continental Stock Transfer & Trust Company.
Dividends
We have not declared any dividends during the two most recent fiscal years. We have no present intention of paying any cash dividends on our common stock in the foreseeable future, as any earnings will be used to help generate growth. The decision on the payment of dividends in the future rests within the discretion of the Board of Directors and will depend upon, among other things, our earnings, capital requirements and financial condition, as well as other relevant factors. There are no restrictions in our certificate of incorporation or bylaws that restrict us from declaring dividends.
Securities Authorized for Issuance Under Equity Compensation Plans
The information included under Item 12 of Part III of this Report is hereby incorporated by reference into this Item 5 of Part II of this Report.
Recent Sales of Unregistered Securities
The Company did not sell any securities during the fiscal year ended December 31, 2017 that were not registered under the Securities Act of 1933, as amended, and that have not previously been included in a Quarterly Report on Form 10-Q or in a Current Report on Form 8-K.
| 30 |
Issuer Purchases of Equity Securities
For the years ended December 31, 2017 and 2016, we did not repurchase any shares of our common stock.
Item 6. Selected Financial Data.
Not Applicable.
Item 7. Management’s Discussion and Analysis of Financial Condition and Results of Operations.
The following discussion should be read in conjunction with the Consolidated Financial Statements and Notes to Consolidated Financial Statements contained in this Report and the discussion under “Forward-Looking Statements” on page 2 at the beginning of this Report and the Risk Factors set forth in Part I, Item 1A of this Report.
Overview
Net Element is a global financial technology and value-added solutions group that supports companies in accepting electronic payments in a multi-channel environment that spans across point-of-sale (“POS”), e-commerce and mobile devices. We operate in two reportable business operating segments: (i) North American Transaction Solutions and (ii) International Transaction Solutions. For additional information about our business segments, see “Business Segments” under Part I, Item 1 of this Report.
We enable merchants of all sizes to accept and process over 100 different payment options in more than 120 currencies, including credit, debit and prepaid payments. We also provide merchants with value-added services and technologies including integrated payment technologies, POS solutions, security solutions, fraud management, information solutions and analytical tools.
Total transactions processed during 2017 were 154 million compared to 187 million for 2016. The decrease in transactions processed was primarily attributable to our International Transaction Solutions segment, which saw a 35 % decrease from 100 million in 2016 to 65 million transactions in 2017, due to the consolidation of our mobile solutions business with our online solutions business. Transactions processed for our North American Transaction Solutions segment increased by 2% from 87.2 million in 2016 to 89 million in 2017 due to bigger ticket items being purchased as our sales volume increased 18%.
Total transaction dollars processed during 2017 was $2.80 billion compared to $2.45 billion for 2016. The increase in transaction dollars processed came primarily from our North American Transactions Solutions segment, which saw an 18% increase from $1.9 billion in 2016 to $2.3 billion processed in 2017. Our International Transaction Solutions segment was flat during 2017 due to reorganization and consolidation of the mobile solutions business. Growth in the North American Transactions Solutions segment was primarily organic.
Critical Accounting Policies and Estimates
Our significant accounting policies are described more fully in Note 1 of the accompanying Notes to our Consolidated Financial Statements. The preparation of financial statements in conformity with accounting principles generally accepted in the United States requires our management to make estimates and assumptions that affect the reported amounts of assets and liabilities and disclosure of contingent assets and liabilities at the date of the financial statements, as well as the reported amounts of revenues and expenses during the reporting period. Actual results could differ materially from those estimates.
In applying estimates, management uses its judgment to determine the appropriate assumptions to be used in the determination of certain estimates. Those estimates are based on our historical experience, terms of existing contracts, the observance of trends in our industries, information provided by outside sources, trade journals and other sources, as appropriate.
Revenue . We recognize revenue when the following four basic criteria have been met: (1) persuasive evidence of a sales arrangement exists; (2) performance of services has occurred, (3) the sales price is fixed or determinable, and (4) collectability is reasonably assured. We consider persuasive evidence of a merchant processing sales arrangement to be the receipt of a billable transaction from aggregators or a signed contract.
Revenue for access to branded content is recognized monthly as the mobile subscribers purchase access to content. Service fee revenue from the Aptito SaaS fees is monthly recognized when billed unless collectability is considered an issue.
Collectability is assessed based on a number of factors, including transaction history with the customer and the credit worthiness of the customer. If it is determined that the collection is not reasonably assured, revenue is not recognized until collection becomes reasonably assured, which is generally upon receipt of cash. We record cash received in advance of revenue recognition as deferred revenue.
Reserve for Loan Losses . We monitor all accounts receivable, notes receivable and transactions with mobile operators and aggregators on a quarterly basis to ensure collectability and the adequacy of loss provisions. Considerations include payment history, business volume history, financial statements of borrower, projections of borrower and other standard credit review documentation. Management uses its best judgment to adequately reserve for future losses after all available information is reviewed. During 2017 Digital Provider had recovered approximately $0.1 million of advances previously reserved. During 2016 Digital Provider had $0.5 million of bad debt expenses. During 2017 and 2016, we recognized $1,408,908 and $1,173,815 for net ACH rejects that occurred in the normal course of business.
| 31 |
Deferred Taxes. Estimates of deferred income taxes and items giving rise to deferred tax assets and liabilities reflect management’s assessment of actual future taxes to be paid on items reflected in the financial statements, giving consideration to both timing and the probability of their realization. Actual income taxes could vary from these estimates for a variety of reasons, including changes in tax law, operating results that vary from budget or the review of our tax returns by the IRS.
Results of Operations for the Year Ended December 31, 2017 Compared to the Year Ended December 31, 2016
We reported a net loss attributable to common stockholders of $9,913,485 or ($5.04) per share for the year ended December 31, 2017 as compared to a net loss of $13,487,537 or ($10.33) per share for the year ended December 31, 2016. This resulted in a decrease in net loss attributable to stockholders of $3,574,052 primarily due to an increase in revenues, decreases in depreciation, amortization and interest expenses, partially offset by an increase in general and administrative expenses. Net loss attributable to stockholders for the year ended December 31, 2016 was also negatively affected by an expense for loss from stock value guarantee related to the PayOnline acquisition.
The following table sets forth our sources of revenues, cost of revenues and gross margins for the years ended December 31, 2017 and 2016.
Gross Margin Analysis
| Twelve | Twelve | |||||||||||||||||||
| Months Ended | Months Ended | Increase / | ||||||||||||||||||
| Source of Revenues | December 31, 2017 | Mix | December 31, 2016 | Mix | (Decrease) | |||||||||||||||
| North American Transaction Solutions | $ | 51,138,327 | 85.1 | % | $ | 42,130,902 | 77.6 | % | $ | 9,007,425 | ||||||||||
| International Transaction Solutions | 8,926,497 | 14.9 | % | 12,155,957 | 22.4 | % | (3,229,460 | ) | ||||||||||||
| Total | $ | 60,064,824 | 100.0 | % | $ | 54,286,859 | 100.0 | % | $ | 5,777,965 | ||||||||||
| Twelve | Twelve | |||||||||||||||||||
| Months Ended | % of | Months Ended | % of | Increase / | ||||||||||||||||
| Cost of Revenues | December 31, 2017 | revenues | December 31, 2016 | revenues | (Decrease) | |||||||||||||||
| North American Transaction Solutions | $ | 44,265,264 | 86.6 | % | $ | 36,342,465 | 86.3 | % | $ | 7,922,799 | ||||||||||
| International Transaction Solutions | 6,971,948 | 78.1 | % | 9,365,776 | 77.0 | % | (2,393,828 | ) | ||||||||||||
| Total | $ | 51,237,212 | 85.3 | % | $ | 45,708,241 | 84.2 | % | $ | 5,528,971 | ||||||||||
| Twelve | Twelve | |||||||||||||||||||
| Months Ended | % of | Months Ended | % of | Increase / | ||||||||||||||||
| Gross Margin | December 31, 2017 | revenues | December 31, 2016 | revenues | (Decrease) | |||||||||||||||
| North American Transaction Solutions | $ | 6,873,063 | 13.4 | % | $ | 5,788,437 | 13.7 | % | $ | 1,084,626 | ||||||||||
| International Transaction Solutions | 1,954,549 | 21.9 | % | 2,790,181 | 23.0 | % | (835,632 | ) | ||||||||||||
| Total | $ | 8,827,612 | 14.7 | % | $ | 8,578,618 | 15.8 | % | $ | 248,994 | ||||||||||
Net revenues consist primarily of service fees from transaction processing. Net revenues were $60,064,824 for the year ended December 31, 2017 as compared to $54,286,859 for the year ended December 31, 2016. The increase in net revenues is primarily due to continued organic growth of North American merchants with emphasis on value-added offerings partially offset by a $3,229,460 decrease in net revenues from our International Transaction Solutions segment as we experience increased competition, decreased margins and reorganizing assignments from our International Transaction Solutions segment.
Cost of revenues represents direct costs of generating revenues, including commissions, mobile operator fees, purchases of short numbers, interchange expense and processing fees. Cost of revenues for the year ended December 31, 2017 were $ 51,237,212 as compared to $45,708,241 for the year ended December 31, 2016. The year over year increase in cost of revenues of $5,528,971 was driven by a $7,922,799 increase due to increased North American Transaction Solutions sales for the year ended December 31, 2017. This was partially offset by a $2,393,828 decrease in the International Transaction Solutions segment cost of revenues due to the decrease in International Transaction Solutions revenues from Digital Provider.
Gross Margin for the year ended December 31, 2017 was $8,827,613, or 14.7% of net revenue, as compared to $8,578,618, or 15.8% of net revenue, for the year ended December 31, 2016. The primary reason gross margin percentages decreased was due to increased (lower margin) business mix from North American Transaction Solutions and a decrease in Digital Provider business that had higher margins.
Total operating expenses were $17,425,030 for the year ended December 31, 2017, as compared to total operating expenses of $17,416,066 for the year ended December 31, 2016. Total operating expenses for the year ended December 31, 2017 consisted of general and administrative expenses of $10,629,773, non-cash compensation of $2,940,424, a bad debt provision of $1,320,848 and depreciation and amortization of $2,533,985. For the year ended December 31, 2016, operating expenses consisted of general and administrative expenses of $8,797,883, non-cash compensation of $3,463,435, a bad debt provision of $1,688,237, and depreciation and amortization of $3,466,511.
| 32 |
General and administrative expenses for the years ended December 31, 2017 and 2016 consisted of operating expenses not otherwise delineated in our Consolidated Statements of Operations and Comprehensive Loss and include salaries and benefits, professional fees, rent, business development, travel expense, filing fees, transaction gains or losses, office expenses, communication expenses, insurance expenses, and other expenses required to run our business, as follows:
| Twelve months ended December 31, 2017 | ||||||||||||||||
| Category | North American Transaction Solutions | International Transaction Solutions | Corporate Expenses & Eliminations | Total | ||||||||||||
| Salaries, benefits, taxes and contractor payments | $ | 1,970,860 | $ | 1,696,245 | $ | 2,082,294 | $ | 5,749,399 | ||||||||
| Professional fees | 505,383 | 819,184 | 1,312,271 | 2,636,838 | ||||||||||||
| Rent | - | 245,539 | 245,186 | 490,725 | ||||||||||||
| Business development | 53,011 | 32,072 | 3,569 | 88,652 | ||||||||||||
| Travel expense | 331,299 | 32,397 | 130,198 | 493,894 | ||||||||||||
| Filing fees | - | - | 72,035 | 72,035 | ||||||||||||
| Transaction (gains) losses | 742 | (41,200 | ) | 1,642 | (38,816 | ) | ||||||||||
| Office expenses | 303,586 | 98,961 | 120,103 | 522,650 | ||||||||||||
| Communications expenses | 47,878 | 130,046 | 79,288 | 257,212 | ||||||||||||
| Insurance expense | - | 5,401 | 135,386 | 140,787 | ||||||||||||
| Other expenses | 38,788 | 14,716 | 162,893 | 216,397 | ||||||||||||
| Total | $ | 3,251,547 | $ | 3,033,361 | $ | 4,344,865 | $ | 10,629,773 | ||||||||
| Twelve months ended December 31, 2016 | ||||||||||||||||
| Category | North American Transaction Solutions | International Transaction Solutions | Corporate Expenses & Eliminations | Total | ||||||||||||
| Salaries, benefits, taxes and contractor payments | $ | 1,650,043 | $ | 1,593,390 | $ | 1,506,752 | $ | 4,750,185 | ||||||||
| Professional fees | 422,681 | 901,861 | 1,390,297 | 2,714,839 | ||||||||||||
| Rent | - | 282,099 | 284,234 | 566,333 | ||||||||||||
| Business development | 36,923 | 129,525 | 11,841 | 178,289 | ||||||||||||
| Travel expense | 191,848 | 43,436 | 111,510 | 346,794 | ||||||||||||
| Filing fees | - | - | 82,560 | 82,560 | ||||||||||||
| Transaction (gains) losses | 49 | (327,122 | ) | (413,470 | ) | (740,543 | ) | |||||||||
| Office expenses | 103,616 | 110,897 | 107,237 | 321,750 | ||||||||||||
| Communications expenses | 77,897 | 93,152 | 73,104 | 244,153 | ||||||||||||
| Insurance expense | - | 9,855 | 163,506 | 173,361 | ||||||||||||
| Other expenses | 270 | (68,976 | ) | 228,868 | 160,162 | |||||||||||
| Total | $ | 2,483,327 | $ | 2,768,117 | $ | 3,546,439 | $ | 8,797,883 | ||||||||
| Variance | ||||||||||||||||
| Category | North American Transaction Solutions | International Transaction Solutions | Corporate Expenses & Eliminations | Total | ||||||||||||
| Salaries, benefits, taxes and contractor payments | $ | 320,817 | $ | 102,855 | $ | 575,542 | $ | 999,214 | ||||||||
| Professional fees | 82,702 | (82,677 | ) | (78,026 | ) | (78,001 | ) | |||||||||
| Rent | - | (36,560 | ) | (39,048 | ) | (75,608 | ) | |||||||||
| Business development | 16,088 | (97,453 | ) | (8,272 | ) | (89,637 | ) | |||||||||
| Travel expense | 139,451 | (11,039 | ) | 18,688 | 147,100 | |||||||||||
| Filing fees | - | - | (10,525 | ) | (10,525 | ) | ||||||||||
| Transaction (gains) losses | 693 | 285,922 | 415,112 | 701,727 | ||||||||||||
| Office expenses | 199,970 | (11,936 | ) | 12,866 | 200,900 | |||||||||||
| Communications expenses | (30,019 | ) | 36,894 | 6,184 | 13,059 | |||||||||||
| Insurance expense | - | (4,454 | ) | (28,120 | ) | (32,574 | ) | |||||||||
| Other expenses | 38,518 | 83,692 | (65,975 | ) | 56,235 | |||||||||||
| Total | $ | 768,220 | $ | 265,244 | $ | 798,426 | $ | 1,831,890 | ||||||||
| 33 |
Salaries, benefits, taxes and contractor payments were $5,749,399 for the year ended December 31, 2017 as compared to $4,750,185 for the year ended December 31, 2016, representing an increase of $999,214. The increase in salaries of $999,214 was due primarily to the increase of corporate salaries of $575,542, resulting primarily from a $300,000 increase in discretionary bonus granted to our CEO by the Board of Directors and to a lesser extent increases in executive salaries. The $320,817 increase in the North American Transaction Solutions segment was primarily due to increases in headcount and sales incentives for key employees as the business grew. The $102,855 increase in the International Transaction Solutions segment was primarily due to fluctuations in the Ruble exchange rate.
Professional fees were $2,636,838 for the year ended December 31, 2017 as compared to $2,714,839 for the year ended December 31, 2016, representing a decrease of $78,001 as follows:
| Twelve months ended December 31, 2017 | ||||||||||||||||
| Professional Fees | North American Transaction Solutions | International Transaction Solutions | Corporate Expenses & Eliminations | Total | ||||||||||||
| General Legal | $ | 33,480 | $ | 38,386 | $ | 80,724 | $ | 152,590 | ||||||||
| SEC Compliance Legal Fees | - | - | 275,112 | 275,112 | ||||||||||||
| Accounting and Auditing | - | 15,433 | 412,943 | 428,376 | ||||||||||||
| Tax Compliance and Planning | - | - | 55,400 | 55,400 | ||||||||||||
| Consulting | 471,903 | 765,365 | 488,092 | 1,725,360 | ||||||||||||
| Total | $ | 505,383 | $ | 819,184 | $ | 1,312,271 | $ | 2,636,838 | ||||||||
| Twelve months ended December 31, 2016 | ||||||||||||||||
| Professional Fees | North American Transaction Solutions | International Transaction Solutions | Corporate Expenses & Eliminations | Total | ||||||||||||
| General Legal | $ | 43,257 | $ | 5,539 | $ | 193,952 | $ | 242,748 | ||||||||
| SEC Compliance Legal Fees | - | - | 175,000 | 175,000 | ||||||||||||
| Accounting and Auditing | - | 578 | 420,686 | 421,264 | ||||||||||||
| Tax Compliance and Planning | - | - | 44,200 | 44,200 | ||||||||||||
| Consulting | 379,424 | 895,744 | 556,459 | 1,831,627 | ||||||||||||
| Total | $ | 422,681 | $ | 901,861 | $ | 1,390,297 | $ | 2,714,839 | ||||||||
| Variance | ||||||||||||||||
| Professional Fees | North American Transaction Solutions | International Transaction Solutions | Corporate Expenses & Eliminations | Increase / (Decrease) | ||||||||||||
| General Legal | $ | (9,777 | ) | $ | 32,847 | $ | (113,228 | ) | $ | (90,158 | ) | |||||
| SEC Compliance Legal Fees | - | - | 100,112 | 100,112 | ||||||||||||
| Accounting and Auditing | - | 14,855 | (7,743 | ) | 7,112 | |||||||||||
| Tax Compliance and Planning | - | - | 11,200 | 11,200 | ||||||||||||
| Consulting | 92,479 | (130,379 | ) | (68,367 | ) | (106,267 | ) | |||||||||
| Total | $ | 82,702 | $ | (82,677 | ) | $ | (78,026 | ) | $ | (78,001 | ) | |||||
Professional fees decreased by $78,001 primarily due to a decrease in general legal fees because of decreases in litigation and consulting fees partially offset by an increase in SEC compliance due to increased public market transactions.
Transaction gains and losses represent changes in exchange rates between our functional currency and the foreign currency in which the transaction is denominated. During the years ended December 31, 2017 and 2016, respectively, we incurred $38,816 and $740,543 of foreign currency transaction losses.
Other general and administrative expenses were $216,397 for the year ended December 31, 2017 as compared to $160,162 for the year ended December 31, 2016, representing an increase of $56,235. The increase was caused primarily by a $43,272 increase in taxes due to a 2016 tax refund in the International Transaction Solutions segment that was not present in 2017.
| 34 |
Non-cash compensation expense was $2,940,424 for the year ended December 31, 2017 as compared to $3,463,435 for the year ended December 31, 2016. A summary of 2017 and 2016 non-cash compensation activity follows:
2017 Non-Cash Compensation Activity
| $ Amount | # of Shares Issued | # of Options Issued | ||||||||||
| Board of Directors & Employee stock and Options | $ | 2,827,200 | 242,324 | 45,106 | ||||||||
| Stock issued for consulting | 7,258 | 896 | - | |||||||||
| Stock issued for acquisitions | 105,966 | 13,082 | - | |||||||||
| Total for 2017 | $ | 2,940,424 | $ | 256,302 | 45,106 | |||||||
2016 Non-Cash Compensation Activity
| $ Amount | # of Shares Issued | # of Options Issued | ||||||||||
| Board of Directors & Employee stock and Options | $ | 3,184,608 | 1,166,610 | 182,408 | ||||||||
| Options provided for financing | 78,827 | - | 466,428 | |||||||||
| Stock issued in legal settlement | 200,000 | 95,694 | - | |||||||||
| Total for 2016 | $ | 3,463,435 | 1,262,304 | 648,836 | ||||||||
We recorded a provision for bad debt in the amount of $1,320,848 for the year ended December 31, 2017, compared to provision for bad debts of $1,688,237 for the year ended December 31, 2016. For the year ended December 31, 2017 we recorded a loss which was primarily comprised of $1,408,908 ACH rejects and an $89,545 reduction in provision from our International Transaction Solutions operations. Of the $1,408,908 of net ACH rejects, $603,257 were passed through to independent sales organizations via a reduction in commissions. For the year ended December 31, 2016 we recorded a loss provision which was primarily comprised of $1,173,815 in ACH rejects, attributable to the normal course of our North American Transaction Solutions segment, in addition, there was a $511,772 bad debt recovery from our mobile payments business in Russia. During the year ended December 31, 2016, of the $1,173,815 of net ACH rejects, $394,134 were passed through to independent sales organizations via a reduction in commissions.
During the years ended December 31, 2017 and 2016, we did not recognize any goodwill impairment.
Depreciation and amortization expense consists primarily of the amortization of merchant portfolios plus depreciation expense on fixed assets, client acquisition costs, capitalized software expenses, trademarks, domain names and employee non-compete agreements. Depreciation and amortization expense was $2,533,985 for the year ended December 31, 2017 as compared to $3,466,511 for the year ended December 31, 2016. The decrease was due to the full amortization of certain software and merchant portfolio assets during 2017.
Interest expense was $1,189,622 for the year ended December 31, 2017 as compared to $1,463,833 for the year ended December 31, 2016, representing a decrease of $ 274,211 due to lower RBL notes payable balance as follows:
| Funding Source | Twelve months ended December 31, 2017 | Twelve months ended December 31, 2016 | Increase / (Decrease) | |||||||||
| MBF Notes | 76,591 | 61,325 | 15,266 | |||||||||
| RBL Notes | 772,777 | 1,282,439 | (509,662 | ) | ||||||||
| Priority Payments Note | 168,233 | - | 168,233 | |||||||||
| Other | 172,021 | 120,069 | 51,952 | |||||||||
| Total | $ | 1,189,622 | $ | 1,463,833 | $ | (274,211 | ) | |||||
Other interest expense for the year ended December 31, 2017 consisted of $80,291 resulting from the promissory note entered into on March 1, 2017 with Star Capital Management, LLC. (See Note 12 to our Consolidated Financial Statements) and $85,578 related to the PayOnline acquisition. During the year ended December 31, 2016, other interest expense primarily consisted of $120,069 related to the PayOnline acquisition.
Other expenses for the year ended December 31, 2017 consists primarily of a $117,013 of foreign taxes and other expenses attributed to our International Transaction Solutions segment, as well as, approximately $48,000 in miscellaneous other expenses in the North American Transaction Solutions segment.
The net income attributable to non-controlling interests amounted to $109,564 and $128,539 for 2017 and 2016, respectively. The income was attributed to our North American Transaction Solutions segment represents 10% non-controlling interest in Aptito. The non-controlling interest reflects the results of operations of subsidiaries that are allocable to minority equity owners.
| 35 |
Liquidity and Capital Resources
Our total assets at December 31, 2017 were $32.3 million compared to $23.3 million at December 31, 2016. The year over year change in total assets is primarily attributable to the $10.7 million increase in our cash balance as a result of equity sales at the end of 2017.
At December 31, 2017, we had total current assets of $19.0 million including $11.3 million of cash, $5.5 million of accounts receivable, and $2.3 million of prepaid expenses and other assets. At December 31, 2016, we had total current assets of $9.2 million including $0.6 million of cash, $7.1 million of accounts receivable, and $1.5 million of prepaid expenses and other assets.
As of the filing date of this Report with the SEC, management expects that our cash flows from operations will be sufficient to fund our current operations for at least the next twelve months. We may require additional capital in order to fund business expansion or future acquisitions.
Since our inception, we have incurred significant operating losses. We incurred net losses totaling $10.0 million and $13.6 million for the years ended December 31, 2017 and 2016, respectively. We have working capital of approximately $4.3 million and an accumulated deficit of $167.3 million at December 31, 2017. We have a cash balance at December 31, 2017 of $11.3 million. We estimate we will need $4.8 million to cover our anticipated cash flow shortfall over the next 12 months and we have adequate cash balances to support our cash flow requirements for this period. We may raise additional funds through debt financing and/or the issuance of equity securities, there being no assurance that any type of financing on terms satisfactory to us will be available or otherwise occur. We have approximately $2.5 million of notes payable to be repaid during 2018. Debt financing or re-financing is another possibility in the future and debt must be repaid regardless of whether we generate revenues or cash flows from operations and may be secured by substantially all of our assets. Any equity financing or debt financing that requires the issuance of equity securities or warrants to the lender would cause the percentage ownership by our current stockholders to be diluted, which dilution may be substantial. Also, any additional equity securities issued may have rights, preferences or privileges senior to those of existing stockholders.
Operating activities used $5.0 million of cash for the twelve months ended December 31, 2017 as compared to using $3.3 million of cash for the twelve months ended December 31, 2016. Negative operating cash flow for the twelve months ended December 31, 2017 was primarily due to paying off accounts payables and accrued liabilities as the company had an increase in its cash balance as a result of equity sales at the end of 2017.
Investing activities used $1.8 million of cash for the year ended December 31, 2017 as compared to using $1.5 million of cash for the year ended December 31, 2016. The increase in cash used by investing activities for the year ended December 31, 2017 was primarily attributable to the $0.5 million increase in acquisition costs as we gain additional market share for our North American Transactions Solutions segment.
For the year ended December 31, 2017, financing activities provided cash of $17.6 million, primarily from $14.9 million from equity financing and $3.7 million in proceeds from indebtedness.
For the year ended December 31, 2016, financing activities provided cash of $4.4 million, primarily from $3.2 million from proceeds from indebtedness, $0.3 million in cash paid for stock and warrants and $1 million from related party advances from our CEO and board member.
Effective June 30, 2014, TOT Group, Inc. and its subsidiaries as co-borrowers, TOT Payments, LLC, TOT BPS, LLC, TOT FBS, LLC, Process Pink, LLC, TOT HPS, LLC and TOT New Edge, LLC (collectively, the “co-borrowers”), entered into a Loan and Security Agreement (“Credit Facility”) with RBL Capital Group, LLC (“RBL”), as lender (the “RBL Loan Agreement”). The original terms provided us with an 18-month, $10 million credit facility with interest at the higher of 13.90% per annum or the prime rate plus 10.65%. Interest on drawn amounts outstanding after November 30, 2015 carry interest at an additional three percent per annum until repaid in full, with other amounts, obligations or payments due carrying an annual default rate not to exceed the lesser of (i) the prime rate plus 13% per annum and (ii) 18.635% per annum. On May 2, 2016, we renewed our Credit Facility with RBL, increasing the facility from $10 million to $15 million and extending the term through February 2019. At December 31, 2017 and 2016, we had $10,455,912 and $10,455,087 available under the Credit Facility, respectively.
The co-borrowers obligations to RBL pursuant to the RBL Loan Agreement are secured by a first priority security interest in all of the co-borrowers tangible and intangible assets, including but not limited to their merchants, merchant contracts and proceeds thereof, and all right title and interest in co-borrowers’ processing contracts, contract rights, and portfolio cash flows with all processors of the co-borrowers.
As further described below, the following borrowings from the Credit Facility were converted into RBL term notes:
During July 2014, we entered into a $3,315,000 RBL term note. Net proceeds from the term note were used to repay a $3.0 million note previously due to MBF Merchant Capital, LLC (“MBF”) in addition to approximately $239,000 for working capital. The term note required interest-only payments at 13.90% interest through January 2015 commencing in August 2014 followed by monthly interest and principal payments of $90,421 through January 2019. The term note required payment of a 2% front-end fee due at issuance and a 4% back-end fee due at final payment. During 2016, Crede CG III, Ltd. (“Crede”) purchased $1,849,481 of the principal balance of this note held by RBL in various tranches. We repurchased and extinguished the purchased notes in exchange for 135,237 shares of our common stock. (See “Note 13 —Crede CG III, Ltd.”). During December 2016, the remaining balance of the term note was refinanced into another RBL term note.
During February 2015, we entered into a $400,000 RBL term note. The term note provided for interest-only payments at 13.9% through July 2015, with monthly interest and principal payments of $10,911 from August 2015 through July 2019. We paid $8,000 in costs related to this term note. The term note was purchased by Crede in various tranches during June 2016, which we repurchased and extinguished in exchange for 21,928 shares of our common stock.
| 36 |
During March 2015, we entered into a $250,000 RBL term note. The term note provided for interest-only payments at 13.9% through July 2015, with monthly interest and principal payments of $6,819 from August 2015 through July 2019. We paid $5,000 in costs related to this term note. This term note was purchased by Crede in May 2016, which we repurchased and extinguished in exchange for 9,174 shares of our common stock.
During May 2016, we entered into a $250,000 RBL term note. The term note provided for interest-only payments at 14.15% interest through October 2016, with monthly interest and principal payments of $6,850 from November 2016 through October 2020. The term note required payment of a 2% front-end fee at issuance and a 4% back-end fee due at the final payment. The outstanding balance of the term note was refinanced into another RBL term note during December 2016.
During May 2016, we entered into a $400,000 RBL term note. The term note provided for interest-only payments at 14.15% interest through November 2015, with monthly interest and principal payments of $10,961 from December 2016 through November 2020. The term note required payment of a 2% front-end fee at issuance and a 4% back-end fee due at the final payment. The outstanding balance of the term note was refinanced into another RBL term note during December 2016.
During June 2016, we entered into a $190,000 RBL term note. The term note provided for interest-only payments at 14.15% through December 20, 2016, with monthly interest and principal payments of $5,206 from January 2017 through December 2020. The term note requirement payment of a 2% front-end fee at issuance and a 4% back-end fee due at the final payment. The outstanding balance of the term note was refinanced into another RBL term note during December 2016.
During July 2016, we entered into a $350,000 RBL term note. The term note provided for interest-only payments at 14.15% through January 2017, with monthly interest and principal payments of $9,591 from February 2017 through January 2021. The term note requirement payment of a 2% front-end fee at issuance and a 4% back-end fee due at the final payment. The outstanding balance of the term note was refinanced into another RBL term note during December 2016.
During August 2016, we entered into a $400,000 RBL term note. The term note provided for interest-only payments at 14.15% through February 2017, with monthly interest and principal payments of $10,961 from March 2017 through February 2021. The term note required payment of a 2% front-end fee at issuance and a 4% back-end fee due at the final payment. The outstanding balance of the term note was refinanced into another RBL term note during December 2016.
During September 2016, we entered into a $350,000 RBL term note. The term note provided for interest-only payments at 14.15% through March 2017, with monthly interest and principal payments of $9,591 from April 2017 through March 2021. The term note required payment of a 2% front-end fee at issuance and a 4% back-end fee due at the final payment. The outstanding balance of the term note was refinanced into another RBL term note during December 2016.
During November 2016, we entered into a $350,000 RBL term note. The term note provided for interest-only payments at 14.15% through May 2017, with monthly interest and principal payments of $9,591 from June 2017 through May 2021. The term note required payment of a 2% front-end fee at issuance and a 4% back-end fee due at the final payment. The outstanding balance of the term note was refinanced into another RBL term note during December 2016.
During December 2016, we entered into a $325,000 RBL term note. The term note provided for interest-only payments at 14.15% through June 2017, with monthly interest and principal payments of $8,906 from July 2017 through June 2021. The term note required payment of a 2% front-end fee at issuance and a 4% back-end fee due at the final payment. The outstanding balance of the term note was refinanced into another RBL term note during December 2016.
During December 2016, we entered into a $4,044,055 RBL term note (the “Refinance note”). This note effectively refinanced all then-outstanding RBL notes described above. The term note provides for interest-only payments at 14.15% ($47,686) through May 2017, with monthly interest and principal payments of $110,814 from June 2017 through May 2021. The term note required payment of a $20,000 front-end refinancing fee at issuance and a $104,600 back-end fee due at the final payment. The outstanding balance of the term note was refinanced into another RBL term note during June 2017.
During March 2017, we entered into a $100,000 RBL term note. The term note provided for interest-only payments at 14.4% May 2017, with monthly interest and principal payments of $2,753 from June 2017 through May 2021. The term note required payment of a 2% front-end fee at issuance and a 4% back-end fee due at final payment. The outstanding balance of the term note was refinanced into another RBL term note during June 2017.
During April 2017, we entered into a $400,000 RBL term note. The term note provided for interest-only payments at 14.4% through May 2017, with monthly interest and principal payments of $11,011 from June 2017 through May 2021. The term note required payment of a 2% front-end fee at issuance and a 4% back-end fee due at final payment. The outstanding balance of the term note was refinanced into another RBL term note during June 2017.
During April 2017, Crede purchased a $75,000 tranche of our RBL term note, which we repurchased and extinguished in exchange for 10,235 shares of our common stock. As a result, the terms of the $4,044,055 Refinance note was revised to reduce the monthly interest and principal payments to $108,759.
During May 2017, we entered into a $75,000 RBL term note. The term note provided for one interest-only payment at 14.4%, with monthly interest and principal payments of $2,065 from June 2017 through May 2021. The term note required payment of a 2% front-end fee at issuance and a 4% back-end fee due at final payment. The outstanding balance of the term note was refinanced into another RBL term note during June 2017.
During May 2017, Crede purchased a $150,000 tranche of our RBL term note, which we repurchased and extinguished in exchange for 23,058 shares of our common stock.
| 37 |
During May 2017, we entered into a $150,000 RBL term note. The term note provided for one interest-only payment at 14.4%, with monthly interest and principal payments of $4,129 from July 2017 through June 2021. The term note required payment of a 2% front-end fee at issuance and a 4% back-end fee due at final payment. The outstanding balance of the term note was refinanced into another RBL term note during June 2017.
During June 2017, the $4,044,055 Refinance note was modified to include the $150,000, $75,000, $400,000 and 100,000 term notes described above. The modified note provided for interest only payments at 14.19% from June 2017 through September 2017, with monthly payments of interest and principal of $124,607 from October 2017 through September 2021.
During July 2017, the Refinance note was further modified to reflect the $150,000 tranche extinguishment in May 2017, described above. The terms of the Refinance note was revised to reduce the monthly interest and principal payments to $121,810. During October 2017 we received a six-month extension to the interest-only payment term for a fee of $12,000. At December 31, 2017 the principal balance of the Refinance note was $4,438,087.
During August 2017, we entered into a $106,000 RBL term note. The term note provided for interest-only payments at 14.9% through September 2017, with monthly interest and principal payments of $2,945 from October 2017 through September 2021. The term note required payment of a 2% front-end fee at issuance and a 4% back-end fee due at final payment. During October 2017 we received a six-month extension of the interest-only payment term. At December 31, 2017, the principal balance of the term note is $106,000.
Also see Note 17 for activity subsequent to December 31, 2017.
MBF Merchant Capital, LLC
We issued the following notes payable to MBF, an entity owned by William Healy, a former member of our Board of Directors.
During March 2016, we entered into a $75,000 promissory note with MBF. The promissory note provided for interest-only payments at 14% through May 2016, with monthly interest and principal payments of $7,990 from June 2016 through March 2017. The promissory note required payment of a 6% back-end fee which was paid at maturity in March 2017. The balance of the promissory note was $23,420 at December 31, 2016.
During April 2016, we entered into a $300,000 promissory note with MBF. The promissory note provides for interest-only payments at 15.5% through May 2016, with monthly interest and principal payments of $14,617 from June 2016 through May 2018. The promissory note requires payment of a 6% back-end fee due at the final payment. At December 31, 2017 and 2016, the balance of the note was $74,177 and $221,826, respectively.
During July 2016, our subsidiary, TOT Group, Inc., entered into a $353,500 promissory note with MBF. The promissory note provides for interest-only payments at 15.5% through June 28, 2016, with monthly interest and principal payments of $17,224 from July 2016 through June 28, 2018. The promissory note required payment of a 1% front-end fee at issuance and a 6.6% back-end fee due at final payment. At December 31, 2017 and 2016, the outstanding balance of the promissory note was $98,829 and $275,056, respectively.
On August 29, 2017, our subsidiary, TOT Group, Inc., entered into a $275,000 promissory note with MBF. The principal amount of the loan carries an interest rate 13.95% per annum, with ten monthly interest and principal payments of $29,289. The promissory note required payment of a 2% front-end fee at issuance and a 4% back-end fee due at final payment. At December 31, 2017, the outstanding balance of the promissory note was $168,798.
Priority Payment Systems LLC
Effective as of May 18, 2017, we entered into a loan agreement and security agreement with Priority Payment Systems LLC and issued a promissory note dated May 18, 2017. Pursuant to the loan agreement and the note, we borrowed $2,000,000. Prior to maturity of the loan, the principal amount of the loan will carry a floating interest rate of prime rate plus 6% per annum at 10.25% at December 31, 2017. We may prepay the loan in whole or in part at any time. The loan is repayable in monthly installments consisting of principal plus interest. The loan matures and becomes due and payable in full on May 20, 2019 to the extent not previously prepaid.
Pursuant to the security agreement, the loan is secured by collateral consisting of accounts, cash or cash equivalents, residuals related to the merchants originated by us and processed by Priority Payments Systems LLC. The loan agreement, the note and the security agreement contain customary representations, warranties, events of default, remedies and affirmative and negative covenants, as well as the right of first refusal and the right related to the merchants.
Effective as of May 17, 2017, we entered into a corporate guaranty in favor of Priority Payments Systems LLC, pursuant to which we unconditionally guarantee the full and prompt payment of each present and future liability, debt and obligation under the loan agreement, the note, the security agreement and other related documents.
On June 27, 2017, we entered into an amendment to the loan agreement with Priority Payment Systems LLC pursuant to which:
| (i) | The original term loan was modified into a multi - draw loan with an increase of the borrowing limit to $2,500,000 and; | |
| (ii) | The loan maturity was extended to May 20, 2021. |
| 38 |
During the year ended December 31, 2017, we borrowed a total of $2,889,000 and repaid $650,489 in principal from our $2,500,000 Priority Payments multi – draw loan. At December 31, 2017, the balance of this loan is $2,238,511.
Off-balance sheet arrangements
At December 31, 2017, we did not have any off-balance sheet arrangements as defined in Item 303(a) (4) of Regulation S-K.
Recently Issued Accounting Pronouncements
The information contained in Note 1 to our Consolidated Financial Statements concerning a description of recent accounting pronouncements, including our expected dates of adoption and the estimated effects on our results of operations and financial condition, is incorporated by reference herein.
Item 7A. Quantitative and Qualitative Disclosures About Market Risk.
Not Applicable.
Item 8. Financial Statements and Supplementary Data.
The Consolidated Financial Statements and notes thereto and the reports of the independent registered public accounting firm set forth on pages F-2 through F-31 are filed as part of this Report and incorporated herein by reference.
Item 9. Changes in and Disagreements with Accountants on Accounting and Financial Disclosure.
None.
Item 9A. Controls and Procedures.
Our disclosure controls and procedures are designed to provide reasonable assurance that information required to be disclosed in our reports filed or submitted under the Exchange Act is recorded, processed, summarized and reported within the time periods specified in the Commission’s rules and forms, and that such information is accumulated and communicated to our management, including our chief executive officer and chief financial officer, as appropriate, to allow for timely decisions regarding required disclosure. In designing and evaluating the disclosure controls and procedures, management recognizes that any controls and procedures, no matter how well designed and operated, can provide only reasonable assurance of achieving the desired control objectives, and management is required to apply its judgment in evaluating the cost-benefit relationship of possible controls and procedures.
As of the end of the period covered by this Report, our management conducted an evaluation, under the supervision and with the participation of our chief executive officer and chief financial officer, of the effectiveness of our disclosure controls and procedures (as defined in Rule 13a-15(e) and Rule 15d-15(e) under the Exchange Act). Based on that evaluation, our chief executive officer and chief financial officer concluded that our disclosure controls and procedures were not effective due to the material weaknesses in our internal control over financial reporting as discussed below under “Management’s Report on Internal Control Over Financial Reporting.” Accordingly, management cannot provide reasonable assurance of achieving the desired control objective. As of the date of this Report, the Company has retained an outside advisory and consulting firm with expertise in remediating disclosure control and procedures and are in the process of reviewing and, where necessary, modifying controls and procedures throughout the Company. .
Management’s Report on Internal Control over Financial Reporting
Management of the Company is responsible for establishing and maintaining adequate internal control over financial reporting (as defined in Rule 13a-15(f) and Rule 15d-15(f) under the Exchange Act). Internal control over financial reporting is a process designed to provide reasonable assurance regarding the reliability of financial reporting and the preparation of financial statements for external purposes in accordance with generally accepted accounting principles. Internal control over financial reporting includes those policies and procedures that: (i) pertain to the maintenance of records that in reasonable detail accurately and fairly reflect the transactions and dispositions of the assets of the Company; (ii) provide reasonable assurance that transactions are recorded as necessary to permit preparation of financial statements in accordance with generally accepted accounting principles, and that receipts and expenditures of the Company are being made only in accordance with authorizations of management and directors of the Company; and (iii) provide reasonable assurance regarding prevention or timely detection of unauthorized acquisition, use or disposition of the Company’s assets that could have a material effect on the financial statements.
We recognize that because of its inherent limitations, internal control over financial reporting may not prevent or detect misstatements. Also, projections of any evaluation of effectiveness to future periods are subject to the risk that controls may become inadequate because of changes in conditions, or that the degree of compliance with the policies and procedures may deteriorate.
Management of the Company conducted an assessment of the effectiveness of the Company’s internal control over financial reporting as of December 31, 2017, based on the framework in Internal Control – Integrated Framework (2013) issued by the Committee of Sponsoring Organizations of the Treadway Commission (the “COSO Framework”). Based on management’s assessment in accordance with the criteria in the COSO Framework, our management concluded that our internal control over financial reporting was not effective as of December 31, 2017.
| 39 |
Management has identified the following material weaknesses (a material weakness is a deficiency, or a combination of deficiencies, in internal control over financial reporting such that there is a reasonable possibility that a material misstatement of the Company’s annual or interim financial statements will not be prevented or detected and corrected on a timely basis) in the Company’s internal control over financial reporting:
Control Environment:
| ■ | Inadequate Policies and Procedures: Based on management’s review of key accounting policies and procedures as of December 31, 2017, we have determined that although such policies and procedures exist, they are generally not formalized. Additionally, management has assessed certain policies and procedures as inadequate regarding their design adequacy, including a lack of formalized evidence of their effective operation. We intend to remediate these deficiencies over the next 18 months. |
| ■ | Informal Financial Risk Assessment: Whereas, the Company continues to manage its financial risks, its processes for doing so are not formalized. Further, management has determined that there are insufficient technical or financial resources to adequately assess the risks in its higher and emerging risk assessment functions. As referenced earlier, as of the date of this Report, the Company has retained an outside advisory and consulting firm with risk management expertise to augment the Company’s personnel and expects to remediate this deficiency by the end of 2018. |
| ■ | Changing Board of Directors and Key Employees: Due to continued changes in board membership and executive management, we have not been able to fully train new board members and employees in effective internal control practices. We intend to provide training during 2018 to our board members and employees. |
Control Activities
| ■ | Testing of Internal Controls: Management has identified a number of deficiencies in our internal controls within certain key business processes, including the Company’s quarterly financial statement closing and reporting process and its external financial reporting procedures. These deficiencies primarily relate to lack of formal evidence of the operation of key controls and thus, an inability to test the effectiveness of such controls on an ongoing basis. We intend to remediate these deficiencies over the next 18 months. |
Information and Communication
| ■ | Our quarterly financial closing and reporting process, particularly in Russia, requires more formalized controls and procedures. We expect to remediate this weakness over the next 18-24 months. |
Monitoring
| ■ | Internal Control Monitoring: As a result insufficiently formalized documentation as to the adequacy of design and effective operation of both preventative and detective controls, management’s ability to monitor the effective operation of these internal controls is limited. Accordingly, management’s ability to timely detect, prevent and remediate deficiencies and potential fraud risks has been assessed as inadequate. We expect to remediate this weakness over the next 24 months. |
Changes in Internal Control over Financial Reporting
Except as specifically described above in this Item 9A, there was no change in our internal control over financial reporting during our fourth fiscal quarter of 2017 that has materially affected, or is reasonably likely to materially affect, our internal control over financial reporting.
None.
Item 10. Directors, Executive Officers and Corporate Governance.
The directors and executive officers of the Company and their respective ages, and positions with the Company and certain business experience as of the date of this Report are set forth below. There are no family relationships among any of the directors or executive officers.
| 40 |
There are no material legal proceedings to which any director or executive officer of the Company, or any associate of any director or executive officer of the Company, is a party adverse to the Company or any of its subsidiaries or has a material interest adverse to the Company or any of its subsidiaries.
| Name | Age | Position | ||
| Oleg Firer | 40 | Chief Executive Officer & Director | ||
| Steven Wolberg | 58 | Chief Legal Officer & Secretary | ||
| Jonathan New | 57 | Chief Financial Officer | ||
| Kenges Rakishev | 38 | Chairman | ||
| James Caan | 78 | Director | ||
| Drew Freeman | 60 | Director | ||
| Howard Ash | 59 | Director | ||
| Jon Najarian | 60 | Director | ||
| Jonathan Fichman | 47 | Director |
Each of our directors will hold office until our next annual meeting of shareholders at which directors are elected or until his successor is duly elected and qualified. Executive officers serve at the discretion of our Board of Directors.
Oleg Firer, Chief Executive Officer and Director . Mr. Firer has served as Chief Executive Officer and a director of the Company since April 16, 2013. Previously, Mr. Firer served as Executive Chairman of Unified Payments, LLC from January 2011 until its acquisition by the Company’s subsidiary, TOT Group, Inc., on April 16, 2013. From July 2004 until December 2012, Mr. Firer served as President, Chief Executive Officer and Secretary (and from May 2006 until December 2012 as Treasurer and from May 2008 until December 2012 as Chief Financial Officer) of Acies Corporation, a provider of payment processing solutions to small and medium size merchants across the United States. Mr. Firer also served as a director of Acies Corporation from May 2005 until December 2012. Mr. Firer served as the President of GM Merchant Solution, Inc. (from August 2002) and Managing Partner of GMS Worldwide, LLC (from August 2003) until their assets were acquired by Acies Corporation in June 2004. From November 2002 to December 2003, Mr. Firer served as the Chief Operating Officer of Digital Wireless Universe, Inc. From December 2001 to November 2002, Mr. Firer served as the Managing Partner of CELLCELLCELL, LLC. From March 1998 to December 2001, Mr. Firer served as Vice President of SpeedUS Corp. Mr. Firer studied Computer Science at New York Technical College from 1993 to 1995. Mr. Firer currently serves as a member of Star Capital Management, LLC and Star Equities, LLC, Florida-based investment group. In addition, Mr. Firer serves as a Chairman of the Supervisory Board of the Eastern Caribbean Blockchain Association, a board member of Progressive Care, Inc. and Star Development Ltd as well as a member of the Advisory Board of the E2Exchange, the Institute of Entrepreneurs and several non-for-profit organizations. Advisory Board member of CoinBoost, Inc. and several other private technology companies. Mr. Firer supports the initiatives of the Firer Family Charitable Foundation, the charitable family fund focused on helping families and children in need. In addition, Mr. Firer serves on various committees of Electronic Transaction Association (ETA). Mr. Firer holds a diplomatic rank of the Extraordinary and Plenipotentiary Ambassador. The Company believes that Mr. Firer’s leadership roles in various payment processing companies make him qualified to serve as a director of the Company.
Steven Wolberg, Chief Legal Officer and Secretary . Mr. Wolberg has been Chief Legal Officer and Secretary of the Company since April 16, 2013. Previously, Mr. Wolberg served in various capacities with Acies Corporation from approximately January 2009 until December 2012, including as a consultant from approximately January 2009 until October 2009, as a director from October 30, 2009 until December 2012 and as Chief Strategy Officer from March 1, 2010 until December 2012. Mr. Wolberg currently operates a solo law practice in Newton, Massachusetts, Attorney Steven Wolberg, which he has operated since January 1997. Mr. Wolberg served as Chief Counsel and Vice President of Corporate Development for Mascot Networks in Cambridge, Massachusetts from January 2000 to September 2001. Since September 1996, Mr. Wolberg has served as president of Oakland Properties, Inc., a real estate development company. From February 1993 to December 1994, Mr. Wolberg served as an attorney in the real estate and corporate divisions of Brown and Rudnick in Boston, Massachusetts. From March 1988 to November 1991, Mr. Wolberg was a partner with the law firm of Jordaan and Wolberg in Johannesburg, South Africa. From January 1986 to February 1988, Mr. Wolberg was employed as an attorney with Goodman and North in Johannesburg, South Africa. Mr. Wolberg also currently owns and serves as the Managing Member of Prime Portfolios, LLC, which holds a private investment portfolio of merchants, receiving payment processing services. Mr. Wolberg received his Bachelor of Arts from the University of Witwatersrand in Johannesburg, South Africa, his Bachelors of Laws from the University of Witwatersrand, in Johannesburg, South Africa, and his Juris Doctorate from the New England School of Law in Boston, Massachusetts. Mr. Wolberg is a member of the Massachusetts Bar Association.
Jonathan New, Chief Financial Officer . Mr. New has been Chief Financial Officer of the Company since October 2, 2012. Mr. New was Chief Financial Officer of the Company’s predecessor, Net Element, from March 10, 2008 until October 2, 2012. From 2001 to 2003, Mr. New was Chief Operating Officer of Ener1, Inc. From 2004 until it was sold in 2006, Mr. New owned and operated Wholesale Salon Furniture Corp.com, which imported and distributed salon equipment. Thereafter, until joining Net Element, Mr. New provided services to public companies on a variety of corporate accounting, reporting and audit related issues. Prior to joining Ener1, Inc. in 2001, Mr. New held finance manager and chief financial officer positions with companies including Häagen-Dazs, Virtacon (a web development company), RAI Credit Corporation (private label credit card company) and Prudential of Florida. Mr. New obtained his BS in Accounting from Florida State University and began his career with Accenture. He is a member of the Florida Institute of Certified Public Accountants and the American Institute of Certified Public Accountants.
| 41 |
Kenges Rakishev, Director . Mr. Rakishev has been a director of the Company and Chairman of the Company’s Board of Directors since October 2, 2012. Mr. Rakishev served as a director of the Company’s predecessor, Net Element, from April 23, 2012 until October 2, 2012. Mr. Rakishev is one of the Forbes Top 15 wealthiest, most influential and progressive business leaders of the Republic of Kazakhstan with significant investments in banking, finance, insurance, information technology, oil & gas, mining, manufacturing and retail business sectors worldwide. Mr. Rakishev is a large shareholder and member of the board of the largest bank in Kazakhstan, Kazkommertsbank (KASE: KKGB), with over US$250 billion in total assets, large shareholder and Chairman of SAT & Company (KASE: SATC), a diversified industrial holding , among his numerous other investments. Throughout his career, Kenges has served in several notable positions in the public sector including Vice-President of the Union of Chambers of Commerce of the Republic of Kazakhstan, Vice-President of The Boxing Association of Republic of Kazakhstan and Vice-President of the Asian Boxing Confederation. Mr. Rakishev holds a B.A. (Law) from the Kazakh State Law Academy and a B.A. (International Economics) from the Kazakh Economic University. Mr. Rakishev also has an AMP Diploma from Oxford University. We believe that Mr. Rakishev’s international business leadership and relationships, combined with his extensive knowledge and unique perspectives of global business opportunities, qualifies him to serve as a Director of the Company.
James Caan, Director . Mr. Caan has been a director of the Company since October 2, 2012. Mr. Caan served as a director of the Company’s predecessor, Net Element, from January 1, 2011 until October 2, 2012. Mr. Caan is an actor and director, having worked in the film and television industries for over 40 years, and he is one of the entertainment industry’s most renowned talents, having starred in over 80 films. We believe that Mr. Caan’s tenure working as an actor and director in the film and television industry, qualifies him to serve as a director of the Company.
Drew J. Freeman, Director . Mr. Freeman has been a director of the Company since May 21, 2014. Mr. Freeman is an accomplished industry veteran with more than 30 years of electronic payments industry experience. Since June 2007, Mr. Freeman has served as the President of Freeman Consulting, Inc., a payments consulting firm that works with private equity and ISOs. Concurrent and prior to that, Mr. Freeman served as President of Merchant Data Systems from 2009 to 2013, Group Executive at Chase Paymentech from 2006 to 2007, and Executive Vice President at JP Morgan Chase-First Data JV (Chase Merchant Services) from 2000 to 2006. Mr. Freeman earned a business degree from the University of Miami in 1980. We believe that Mr. Freeman’s extensive knowledge in the payments industry qualifies him to serve as a director of the Company.
Howard Ash, Director . Mr. Ash has been a director of the Company since June 13, 2016. Mr. Ash is an accomplished executive who served as CEO, COO and CFO to a variety of high profile, international companies. Mr. Ash currently serves as Chairman of Claridge Management since 2000. Mr. Ash served as Chief Operating Officer of BioCard Corporation from 1997 to 2007. Mr. Ash served as Chief Operating Officer of CITA Americas, Inc. from 1996 to 1997. Mr. Ash served as Chief Executive Officer of IEDC Marketing, Inc. from 1992 to 1996. Mr. Ash held a CFO/Financial Planning/Investment position at Abrams, Ash & Associates from 1990 to 1992. Mr. Ash currently serves on the Star Telemed Board, functioning initially as the Liaison to the Cuban Government through the Government of Grenada. Mr. Ash currently serves on the Advisory Board of the E2Exchange, the Institute of Entrepreneurs, in the United Kingdom as the only non-UK citizen. Mr. Ash continues to serve since 2009 in a senior development and strategic capacity for One Laptop Per Child, a global NGO created to provide educational opportunities for the world's poorest children by providing each child with a rugged, low-cost, low-power, internet connected laptop with content and software. Prior Chairmanships include the 2009 through 2012 term for the Sturge Weber Foundation, a non-profit organization dedicated to curing this rare but fatal syndrome that affects children. Previously, Mr. Ash was an Advisory Board Member to Edge Global Investment Limited which forged a strategic partnership with the Africa Forum, consisting of 37 former Heads of State and Government to pave the way for a new approach on nutrition and food supplements as part of a comprehensive strategy to fight the HIV and AIDS pandemic. Mr. Ash started an interest-free micro-loan society in 1987 that has provided more than $15 million in micro-loans throughout the United States and Israel. In 1999, Mr. Ash founded the Circle of Life Resource Center, Inc., a food bank in Miami, Florida that feeds several hundred families per week. Mr. Ash earned a Bachelor of Commerce degree, with Honors in Accounting and Law from the University of Witwatersrand (South Africa) in 1980. We believe that Mr. Ash’s extensive experience as a business and finance executive and member of multiple oversight bodies, provides him with the necessary skills to be qualified to serve as a director of the Company.
Jon Najarian, Director. Mr. Najarian has been a director of the Company since March 8, 2018. Mr. Najarian is an accomplished financial industry veteran with more than 37 years of financial and capital markets industry experience. Mr. Najarian is also well-versed in cryptocurrency and blockchain technologies. Mr. Najarian is a professional investor, money manager and media analyst. He is a co-founder of Investitue, LLC, the industry leading options education firm, which recently launched “Crypto Basics,” a new educational course that covers the basics of cryptocurrency, blockchain technology, altcoins and Initial Coin Offerings (ICOs). He is also a host of the International ICO Channel, a part of CoinBoost, whose goal is to bridge the divide between blockchain and mainstream media by offering distribution to traditional financial media outlets. In 2016, Mr. Najarian and his brother Pete co-founded Najarian Advisors, a company advising institutional investors on options strategies. The brothers invest in and work with start-ups via Rebellion Partners, a venture consulting firm they launched in 2015. Mr. Najarian is a cast member of CNBC’s “Halftime Report” and the “Fast Money” show. He is also the feature of the “DRJ Report” on CBOE-TV popular webcast. Mr. Najarian was a linebacker for the Chicago Bears before he focused his attention to trading on the Chicago Board Options Exchange (“CBOE”). He became a member of the CBOE, NYSE, CME and CBOT and worked as a floor trader for 25 years. In 1990, he founded Mercury Trading, a market-making firm at the CBOE, which he sold in 2004 to Citadel, one of the world’s largest hedge funds. In 2005, Mr. Najarian co-founded optionMONSTER and tradeMONSTER and negotiated a partnership with General Atlantic Partners in 2014 resulting ultimately in a sale to E*Trade for $750 million in September of 2016. Mr. Najarian developed and patented trading applications and algorithms used to identify unusual activity in stock, options, futures and cryptocurrency markets. optionMONSTER, an options news and education site, was described by Securities Industry News as “content king of the options business.” Mr. Najarian is a graduate of Gustavus Adolphus College with a BA degree. We believe that Mr. Najarian’s experience in the financial and capital markets industry provides him with the necessary skills to be qualified to serve as a director of the Company.
| 42 |
Jonathan Fichman, Director. Mr. Fichman has been a director of the Company since March 23, 2018. Mr. Fichman is an accomplished financial industry veteran with more than 20 years of domestic and international finance experience. His experience includes FinTech, payments, blockchain, wealth management and banking. Mr. Fichman holds a Six Sigma Black Belt accreditation and serves on multiple for profit and nonprofit boards. Since 2013, Mr. Fichman has served as a managing director of C-Anax Ventures & Advisory, where he assists early-stage companies with corporate strategy, streamlining operations, and financial analysis. Mr. Fichman is also an adjunct professor at the Florida International University where he teaches in the Business School with a focus on international management and entrepreneurship. From 2005 to 2015, Mr. Fichman served as a senior vice president of International Business Strategy & Initiatives at Bank of America Merrill Lynch. From 2003 to 2004, he served as a director of Operations, Procurement and Insurance at the Township of Cherry Hill, New Jersey. From 1999 to 2003, Mr. Fichman was a vice president of Strategic Initiatives at Actrade Financial Technologies, where he helped create B2B banking products that were at the forefront of commercial payments. From 1997 to 1999, he was a senior analyst consultant with Carson Group. Mr. Fichman received his MBA in Finance and Management from the University of Miami School of Business and Bachelor of Arts in Criminal Justice from the George Washington University. We believe that Mr. Fichman’s experience in the financial and capital markets industry provides him with the necessary skills to be qualified to serve as a director of the Company.
Section 16(a) Beneficial Ownership Reporting Compliance
Section 16(a) of the Exchange Act requires our directors and officers and persons who beneficially own more than ten percent of a registered class of our equity securities to file with theCommission initial reports of ownership and reports of change in ownership of common stock and other equity securities of the Company. Directors, officers and greater than ten percentstockholders are required by Commission regulations to furnish us with copies of all Section 16(a) forms they file. To our knowledge, the following persons have failed to file on a timely basis theidentified reports required by Section 16(a) of the Exchange Act during the most recent fiscal year:
| Name and Relationship | Number of late reports | Transactions not timely
reported | Known failures to file a required form | |||||||||
| James Caan, Director | 2 | 2 | 0 | |||||||||
| Drew Freeman, Director | 2 | 2 | 0 | |||||||||
| William Healy, former Director | 1 | 1 | 0 | |||||||||
| Howard Ash, Director | 2 | 2 | 0 | |||||||||
| Kenges Rakishev, Director | 2 | 2 | 0 | |||||||||
Code of Ethics
We have adopted a Code of Ethics and Business Conduct that applies to all of our directors, officers and employees, including our principal executive officer and our principal financial and accounting officer. A copy of our Code of Ethics and Business Conduct has been posted to the "Investors—Corporate Governance" section of our Internet website at http://www.netelement.com. We will provide a copy of our Code of Ethics and Business Conduct to any person without charge, upon written request to our Secretary at 3363 NE 163rd Street, Suite 705, North Miami Beach, Florida 33160, fax number (305) 508-5497, e-mail address investors@netelement.com.
Audit Committee
Our Board of Directors has a separately-designated standing audit committee established in accordance with Section 3(a)(58)(A) of the Exchange Act, which is currently comprised of Howard Ash (audit committee chairman), Drew Freeman, James Caan, Jonathan Fichman and Jon Najarian. Our Board of Directors has determined that Howard Ash is financially sophisticated as described in NASDAQ Listing Rule 5605(c)(2) and qualifies as an "audit committee financial expert" as defined in Item 407(d)(5) of Regulation S-K. We believe that the audit committee's current member composition satisfies the rules of NASDAQ that govern audit committee composition, including the requirement that audit committee members all be "independent directors" as that term is defined by NASDAQ Listing Rule 5605(a)(2).
Compensation.
Summary Compensation Table
The following table sets forth information for the fiscal years ended December 31, 2017 and 2016 with respect to all compensation paid to or earned by each of our “named executive officers” (as defined by Item 402(m)(2) of the Regulation S-K).
| Stock | Option | All Other | ||||||||||||||||||||||||||
| Name and Principal Position | Year | Salary ($) | Bonus ($) | Awards ($) | Awards ($) | Compensation ($) | Total ($) | |||||||||||||||||||||
| Oleg Firer, Chief | 2017 | $ | 300,000 | $ | 600,000 | $ | 1,144,899 | $ | - | $ | 25,849 | $ | 2,070,748 | |||||||||||||||
| Executive Officer of Net Element | 2016 | $ | 300,000 | $ | 300,000 | $ | 3,614,273 | $ | - | $ | 29,734 | $ | 4,244,007 | |||||||||||||||
| Steven Wolberg, Chief Legal Officer and | 2017 | $ | 230,000 | $ | - | $ | 194,997 | $ | 85,050 | $ | 33,287 | $ | 543,334 | |||||||||||||||
| Secretary of Net Element | 2016 | $ | 200,000 | $ | - | $ | 245,500 | $ | 290,743 | $ | 11,734 | $ | 747,977 | |||||||||||||||
| Jonathan New, Chief Financial Officer | 2017 | $ | 160,250 | $ | - | $ | 103,776 | $ | 85,050 | $ | 11,153 | $ | 360,229 | |||||||||||||||
| of Net Element | 2016 | $ | 165,032 | $ | - | $ | - | $ | 94,891 | $ | 11,153 | $ | 271,076 | |||||||||||||||
| 43 |
With respect to each stock option grant, the amounts disclosed generally reflect the grant date fair value computed in accordance with FASB ASC Topic 718. Grant date fair value for each stock option was determined based on the date approved by the Compensation Committee of the Board of Directors and by the closing stock price on such date.
Outstanding Equity Awards at Fiscal Year End
The following table sets forth information with respect to outstanding equity awards at the end of the Company’s fiscal year 2017 for the “named executive officers”:
| OPTION AWARDS | SHARE AWARDS | |||||||||||||||||||||||||||||||||
| Name | Number of securities underlying unexercised options(#) exercisable | Number of securities underlying unexercised options (#) unexercisable | Equity incentive plan awards: Number of securities underlying unexercised unearned options (#) | Option exercise price ($) | Option Expiration Date | Number of shares or units of stock that have not vested(#) | Market value of shares of units of stock that have not vested($) | Equity incentive plan awards: Number of unearned shares, units or other rights that have not vested (#) | Equity incentive plan awards: Market or payout value of unearned shares, units or other rights that have not vested ($) | |||||||||||||||||||||||||
| Steven Wolberg | 2,000 | - | - | $ | 24.00 | October 3, 2025 | - | $ | - | - | $ | - | ||||||||||||||||||||||
| Steven Wolberg | 13,714 | - | - | $ | 21.20 | June 13, 2026 | - | $ | - | - | $ | - | ||||||||||||||||||||||
| Steven Wolberg | 10,500 | 1,500 | - | $ | 8.10 | February 28, 2027 | - | $ | - | - | $ | - | ||||||||||||||||||||||
| Steven Wolberg | - | - | - | $ | - | - | $ | - | 7,559 | $ | 84,132 | |||||||||||||||||||||||
| Jonathan New | 2,000 | - | - | $ | 24.00 | November 30, 2025 | - | $ | - | - | $ | - | ||||||||||||||||||||||
| Jonathan New | 4,476 | - | - | $ | 21.20 | June 13, 2026 | - | $ | - | - | $ | - | ||||||||||||||||||||||
| Jonathan New | 10,500 | 1,500 | - | $ | 8.10 | February 28, 2027 | - | $ | - | - | $ | - | ||||||||||||||||||||||
| Jonathan New | - | - | - | $ | - | - | $ | - | 1,572 | $ | 17,496 | |||||||||||||||||||||||
The unvested stock and options for both Mr. New and Mr. Wolberg vested on February 28, 2018.
Director Compensation
The following table further summarizes the compensation paid to the Company's non-employee directors for service as a director during 2017:
| Fees earned or | ||||||||||||
| Director Name | paid in cash ($) | Stock awards ($) | Total ($) | |||||||||
| Kenes Rakishev | $ | - | $ | 14,998 | $ | 14,998 | ||||||
| Howard Ash | $ | 41,250 | $ | 39,011 | $ | 80,261 | ||||||
| Drew Freeman | $ | 15,000 | $ | 53,992 | $ | 68,992 | ||||||
| James Caan | $ | - | $ | 14,998 | $ | 14,998 | ||||||
| William Healy | $ | 17,500 | $ | 7,500 | $ | 25,000 | ||||||
Item 12. Security Ownership of Certain Beneficial Owners and Management and Related Stockholder Matters.
The table below contains information regarding the beneficial ownership of our Common Stock as of March 30, 2018 by (i) each person who is known to us to beneficially own more than 5% of our Common Stock, (ii) each of our directors, (iii) each of our named executive officers and (iv) all of our directors and executive officers as a group. Except as otherwise noted below, each person or entity named in the following table has the sole voting and investment power with respect to all shares of our Common Stock that he, she or it beneficially owns. Unless otherwise indicated, the address of each beneficial owner listed below is c/o Net Element, Inc., 3363 NE 163rd Street, Suite 705, North Miami Beach FL 33160.
| 44 |
| Name and address of beneficial owner | Amount and nature of beneficial ownership (number of shares of Common Stock beneficially owned) | Percent of class (1) | ||||||
| Kenges Rakishev c/o SAT & Company 241 Mukanova Street Almaty Kazakhstan 050008 | 314,957 | (2) | 7.91 | % | ||||
| Oleg Firer c/o Net Element, Inc. 3363 NE 163rd Street, Suite 705, North Miami Beach, Florida 33160 | 368,319 | (3) | 9.47 | % | ||||
| Steven Wolberg c/o Net Element, Inc. 3363 NE 163rd Street, Suite 705, North Miami Beach, Florida 33160 | 70,334 | (4) | 1.81 | % | ||||
| James Caan 2791 Hutton Drive Beverly Hills, CA 90210 | 3,536 | 0.09 | % | |||||
| Jonathan New c/o Net Element, Inc. 3363 NE 163rd Street, Suite 705, North Miami Beach, Florida 33160 | 29,817 | (5) | 0.77 | % | ||||
| Howard Ash 4233 Sheridan Avenue Miami Beach, Florida 33140 | 3,804 | 0.10 | % | |||||
| Drew Freeman 2542 Nassau Lane Fort Lauderdale. FL 33312 | 5,397 | 0.14 | % | |||||
| Jon Najarian c/o Net Element, Inc. 3363 NE 163rd Street, Suite 705, North Miami Beach, Florida 33160 | - | - | % | |||||
| Jonathan Fichman c/o Net Element, Inc. 3363 NE 163rd Street, Suite 705, North Miami Beach, Florida 33160 | - | - | % | |||||
| All directors and executive officers as a group (8 persons) | 796,164 | 20.28 | % | |||||
| (1) | Applicable percentage ownership is based on 3,862,352 shares of Common Stock outstanding as of March 30, 2018 together with securities exercisable or convertible into shares of Common Stock within 60 days of March 30, 2018 for each stockholder. Beneficial ownership is determined in accordance with the rules of the Commission and generally includes voting or investment power with respect to securities. The shares issuable pursuant to the exercise or conversion of such securities are deemed outstanding for the purpose of computing the percentage of ownership of the security holder, but are not treated as outstanding for the purpose of computing the percentage of ownership of any other person. |
| (2) | All information regarding shares that may be beneficially owned by Kenges Rakishev is based on information disclosed in a Schedule 13D/A filed by Mr. Rakishev with the Commission and on the information available to us. Per such Schedule 13D/A, Mr. Rakishev may be deemed to have beneficial ownership of 314,957 shares of Common Stock, consisting of (1) 196,885 shares of Common Stock held by Mr. Rakishev and (2) 118,072 shares of Common Stock in the aggregate issuable upon exercise of the certain options. Mr. Rakishev has sole power to vote or direct the vote and to dispose or direct the disposition of shares of Common Stock beneficially owned by Mr. Rakishev as indicated herein. |
| (3) | All information regarding shares that may be beneficially owned by Oleg Firer is based on information disclosed in a Schedule 13D/A filed jointly by Mr. Firer and Star Equities, LLC and on the information available to us. Per such Schedule 13D/A, Mr. Firer is deemed to have beneficial ownership of 368,319 shares of Common Stock consisting of (1) 243,863 restricted shares of Common Stock held directly by Mr. Firer, and (2) as the sole member of Star Equities, Mr. Firer can be deemed to beneficially own the above-described restricted shares of Common Stock beneficially owned by Star Equities (which equals to 124,456 shares as of the date hereof, as described above). Mr. Firer has sole voting power and sole dispositive power with respect to 243,863 restricted shares of Common Stock and shared voting power and shared dispositive power with respect to the above-described shares beneficially owned by Star Equities. 124,456 restricted shares of Common Stock beneficially owned by Star Equities include 28,572 restricted shares of Common Stock issuable pursuant to amended option to pursuant to the Letter Agreement dated as of September 11, 2015, as modified by that certain Additional Letter Agreement dated as of October 7, 2015, as amended, with the Company. |
| (4) | The shares held directly by Steven Wolberg include 31,287 shares of Common Stock issuable upon exercise of certain options to purchase shares of Common Stock, including (i) 27,715 shares issuable upon exercise of the options granted as part of the Company’s incentive compensation awards and (ii) 3,572 restricted shares of Common Stock issuable pursuant to amended option pursuant to the Letter Agreement dated as of September 11, 2015, as modified by that certain Additional Letter Agreement dated as of October 7, 2015, as amended, with the Company. |
| (5) | Includes (i) 58 shares of Common Stock held by Mr. New’s spouse, (ii) 108 shares of Common Stock held by Mr. New’s son and (iii) 18,477 shares of Common Stock issuable upon exercise of the options granted as part of the Company’s incentive compensation awards. |
| 45 |
Equity Compensation Plan Table
The following table summarizes our equity compensation plan information as of December 31, 2017. Information is included for equity compensation plans approved by our stockholders and equity compensation plans not approved by our stockholders
| Plan Category | (a) Number of securities to be issued upon exercise of outstanding options, warrants and rights | (b) Weighted-average exercise price per share of outstanding options, warrants and rights | (c) Number of securities remaining available for future issuance under equity compensation plans (excluding securities reflected in column (a)) | |||||||||
| Equity compensation plans approved by stockholders | 74,004 | $ | 15.50 | 240,996 | ||||||||
| Equity compensation plans not approved by stockholders | - | $ | - | - | ||||||||
| Total | 74,004 | $ | 15.50 | 240,996 | ||||||||
Item 13. Certain Relationships and Related Transactions, and Director Independence.
Certain Relationships and Related Transactions
On January 21, 2016, the Company entered into a Second Additional Letter Agreement, as amended on April 14, 2016 (the “Second Additional Agreement”) with Kenges Rakishev, Chairman of our Board of Directors. The Second Additional Agreement provided for the second and final round of $910,000 equity financing to the Company in consideration for the issuance by the Company on June 13, 2016 to Kenges Rakishev of (i) 46,643 restricted shares of the Company’s common stock based on $19.50 per share price and (ii) options to purchase 46,643 restricted shares of the Company’s common stock with a strike price of $21.50 and a 5 year life.
We issued the following notes payable to MBF Merchant Capital, LLC (“MBF”), which is owned by William Healy, a former member of our Board of Directors.
| · | Effective March 28, 2016, we entered into a $75,000 promissory loan note with MBF. The loan provides for interest only payments at 14% through May 28, 2016. From June 28, 2016 through March 28, 2017, we are obligated to make interest and principal payments of $7,990. The loan also provided a 6% backend fee due at the final payment of the loan. This loan was paid off in March of 2017. As of December 31, 2016, $23,420 was outstanding. |
| · | Effective April 19, 2016, we entered into a $300,000 promissory loan note with MBF. The loan provides for interest only payments at 15.5% through May 28, 2016. From June 28, 2016 through May 28, 2018, we are obligated to make interest and principal payments of $14,617. The loan also provided a 6% back end fee due at the final payment of the loan. As of December 31, 2017 and 2016, $70,338 and $221,826 remains outstanding respectively. |
| · | Effective July 1, 2016, our subsidiary, TOT Group, Inc., entered into a $353,500 promissory loan note with MBF. The loan provides for interest only payments at 15.5% through June 28, 2016. From July 28, 2016 through June 28, 2018, we are obligated to make interest and principal payments of $17,224. The loan also provided a 1% front end fee and a 6.6% back end fee due at the final payment of the loan. As of December 31, 2017 and 2016, $98,829 and $275,056 remains outstanding respectively |
On March 1, 2017, we entered into a promissory note with Star Equities, LLC, an entity which our CEO is the managing member, in the principal amount of $348,083 (the “Star Equities Note”). The Star Equities Note provides for 18 monthly interest payments of $3,481 through September 30, 2018 followed by one interest and principle payment on October 1, 2018. The principal balance of the Star Equities Note outstanding bears interest at the rate of 12% per annum. On October 20, 2017, the Company entered into and consummated a letter agreement with Star Equities, LLC (the “Exchange Agreement”). Pursuant to the Exchange Agreement, the entire outstanding amount (including the principal amount of $348,083 and accrued and unpaid interest) of $374,253 under the Star Equities Note was exchanged into 67,312 restricted shares of Common Stock of the Company based on such shares’ consolidated closing bid price on The NASDAQ Stock Market on the date of the Exchange Agreement.
Director Independence
Our Board of Directors currently includes five non-employee independent members: Drew Freeman, Howard Ash, James Caan, Jon Najarian and Jonathan Fichman. Each of Messrs. Freeman, Ash, Caan, Najarian and Fichman is an "independent director" as defined under NASDAQ Listing Rule 5605(a)(2). A majority of our Board members are independent directors, as five out of the seven members of the Board qualify as independent under the NASDAQ listing standards and the rules of the Commission. No director is considered independent unless our Board of Directors affirmatively determines that the director has no relationship with us (directly, or as a partner, shareholder or officer of an organization that has a relationship with us) that would interfere with the exercise of independent judgment in carrying out the responsibilities of a director. Also, all members of our Board of Director’s audit committee, compensation committee and nominating and governance committee are independent directors.
| 46 |
Item 14. Principal Accountant Fees and Services.
Audit Fees . The aggregate fees, including expenses, billed by our principal accountant for the audit of our annual financial statements and review of financial statements included in our quarterly reports on Form 10-Q and other services that are normally provided in connection with statutory and regulatory filings or engagements during the fiscal years ended December 31, 2017 and 2016 were $390,000 and $375,000, respectively.
Audit-Related Fees . The aggregate fees, including expenses, billed by our principal accountant for assurance and related services that are reasonably related to the performance of the audit or review of our financial statements not reported under “Audit Fees” above during the fiscal years ended December 31, 2017 and 2016 were $ 0.
Tax Fees . The aggregate fees, including expenses, billed by our principal accountant for services rendered for tax compliance, tax advice and tax planning during the fiscal years ended December 31, 20117 and 2016 were $0.
All Other Fees . The aggregate fees, including expenses, billed for all other products and services provided by our principal accountant during the fiscal years ended December 31, 2017 and 2016 were $0.
Audit Committee Pre-Approval Policy
Our audit committee is responsible for approving in advance the engagement of our principal accountant for all audit services and non-audit services, based on independence, qualifications and, if applicable, performance, and approving the fees and other terms of any such engagement. The audit committee may in the future establish pre-approval policies and procedures pursuant to which our principal accountant may provide certain audit and non-audit services to us without first obtaining the audit committee’s approval, provided that such policies and procedures (i) are detailed as to particular services, (ii) do not involve delegation to management of the audit committee’s responsibilities described in this paragraph and (iii) provide that, at its next scheduled meeting, the audit committee is informed as to each such service for which the principal accountant is engaged pursuant to such policies and procedures. In addition, the audit committee may in the future delegate to one or more members of the audit committee the authority to grant pre-approvals for such services, provided that the decisions of such member(s) to grant any such pre-approval must be presented to the audit committee at its next scheduled meeting.
All audit and audit-related services performed by our principal accountant during the fiscal years ended December 31, 2017 and 2016 were pre-approved by our audit committee.
Item 15. Exhibits and Financial Statement Schedules.
Documents filed as part of this Report.
| 1. | The following consolidated financial statements of Net Element, Inc. and subsidiaries and notes thereto and the reports of the independent registered public accounting firms thereon are set forth on pages F-2 through F-31 and are filed as part of this Report: |
Reports of Independent Registered Public Accounting Firms
Audited Consolidated Balance Sheets at December 31, 2017 and 2016
Audited Consolidated Statements of Operations and Comprehensive Loss for the years ended December 31, 2017 and 2016 Audited Consolidated Statements of Changes in Stockholders’ Equity for the years ended December 31, 2017 and 2016 Audited Consolidated Statements of Cash Flows for the years ended December 31, 2017 and 2016
Notes to Consolidated Financial Statements
| 2. | Exhibits. |
A list of the exhibits filed as a part of this Report is set forth on the Exhibit Index that follows page F-31 of this Report and is incorporated herein by reference.
| 47 |
None.
Pursuant to the requirements of Section 13 or 15(d) of the Securities Exchange Act of 1934, the registrant has duly caused this report to be signed on its behalf by the undersigned, thereunto duly authorized.
| Net Element, Inc. | |||
| April 2, 2018 | By: | /s/ Oleg Firer | |
| Oleg Firer | |||
| Chief Executive Officer | |||
Pursuant to the requirements of the Securities Exchange Act of 1934, this report has been signed below by the following persons on behalf of the registrant and in the capacities and on the dates indicated.
| April 2, 2018 | By: | /s/ Oleg Firer |
| Oleg Firer Chief Executive Officer and Director (Principal Executive Officer) | ||
| April 2, 2018 | By: | /s/ Jonathan New |
| Jonathan New | ||
| Chief Financial Officer (Principal Financial Officer and Principal Accounting Officer) | ||
| April 2, 2018 | By: | /s/ Kenges Rakishev |
| Kenges Rakishev | ||
| Director | ||
| April 2, 2018 | By: | /s/ Drew Freeman |
| Drew Freeman | ||
| Director | ||
| April 2, 2018 | By: | /s/ Howard Ash |
| Howard Ash | ||
| Director | ||
| April 2, 2018 | By: | /s/ James Caan |
| James Caan | ||
| Director | ||
| April 2, 2018 | By: | /s/ Jon Najarian |
| Jon Najarian | ||
| Director | ||
| April 2, 2018 | By: | /s/ Jonathan Fichman |
| Jonathan Fichman | ||
| Director |
| 48 |
NET ELEMENT, INC.
INDEX TO CONSOLIDATED FINANCIAL STATEMENTS
| F-1 |
Report of Independent Registered Public Accounting Firm
To the Board of Directors and
Stockholders of Net Element, Inc.
Miami, Florida
Opinion on the Financial Statements
We have audited the accompanying consolidated balance sheets of Net Element, Inc. (the “Company”) at December 31, 2017 and 2016, and the related consolidated statements of operations, changes in stockholders’ equity, and cash flows for each of the years in the two-year period ended December 31, 2017, and the related notes (collectively referred to as the financial statements). In our opinion, the financial statements present fairly, in all material respects, the financial position of the Company at December 31, 2017 and 2016, and the results of its operations and its cash flows for each of the years in the two-year period ended December 31, 2017, in conformity with accounting principles generally accepted in the United States of America.
Basis for Opinion
These financial statements are the responsibility of the Company’s management. Our responsibility is to express an opinion on the Company’s financial statements based on our audits. We are a public accounting firm registered with the Public Company Accounting Oversight Board (United States) (PCAOB) and are required to be independent with respect to the Company in accordance with the U.S. federal securities laws and the applicable rules and regulations of the Securities and Exchange Commission and the PCAOB.
We conducted our audits in accordance with the standards of the PCAOB. Those standards require that we plan and perform the audit to obtain reasonable assurance about whether the financial statements are free of material misstatement, whether due to error or fraud. The Company is not required to have, nor were we engaged to perform, an audit of its internal control over financial reporting. As part of our audits, we are required to obtain an understanding of internal control over financial reporting, but not for the purpose of expressing an opinion on the effectiveness of the Company’s internal control over financial reporting. Accordingly, we express no such opinion.
Our audits included performing procedures to assess the risks of material misstatement of the financial statements, whether due to error or fraud, and performing procedures that respond to those risks. Such procedures included examining, on a test basis, evidence regarding the amounts and disclosures in the financial statements. Our audits also included evaluating the accounting principles used and significant estimates made by management, as well as evaluating the overall presentation of the financial statements. We believe that our audits provide a reasonable basis for our opinion.
/s/ Daszkal Bolton LLP
We have served as the Company’s auditor since 2015.
Fort Lauderdale, Florida
April 2, 2018
| F-2 |
CONSOLIDATED BALANCE SHEETS
| December 31, 2017 | December 31, 2016 | |||||||
| ASSETS | ||||||||
| Current assets: | ||||||||
| Cash | $ | 11,285,669 | $ | 621,635 | ||||
| Accounts receivable, net | 5,472,856 | 7,126,429 | ||||||
| Prepaid expenses and other assets | 2,282,614 | 1,467,897 | ||||||
| Total current assets, net | 19,041,139 | 9,215,961 | ||||||
| Fixed assets, net | 58,268 | 117,295 | ||||||
| Intangible assets, net | 3,127,760 | 3,589,850 | ||||||
| Goodwill | 9,643,752 | 9,643,752 | ||||||
| Other long term assets | 460,511 | 603,209 | ||||||
| Total assets | $ | 32,331,430 | $ | 23,170,067 | ||||
| LIABILITIES AND STOCKHOLDERS' EQUITY | ||||||||
| Current liabilities: | ||||||||
| Accounts payable | $ | 6,785,459 | $ | 7,510,113 | ||||
| Accrued expenses | 3,674,430 | 5,518,823 | ||||||
| Deferred revenue | 1,712,591 | 1,355,972 | ||||||
| Notes payable (current portion) | 2,493,973 | 808,976 | ||||||
| Due to related parties | - | 299,004 | ||||||
| Total current liabilities | 14,666,453 | 15,492,888 | ||||||
| Notes payable (net of current portion) | 4,521,449 | 3,615,782 | ||||||
| Total liabilities | 19,187,902 | 19,108,670 | ||||||
| STOCKHOLDERS' EQUITY | ||||||||
| Series A Convertible Preferred stock ($.0001 par value, 1,000,000 shares authorized, no shares issued and outstanding at December 31, 2017 and December 31, 2016) | - | - | ||||||
| Common stock ($.0001 par value, 100,000,000 shares authorized and 3,853,100 and 1,535,350 shares issued and outstanding at December 31, 2017 and December 31, 2016 | 385 | 154 | ||||||
| Additional paid in capital | 183,119,222 | 163,920,066 | ||||||
| Accumulated other comprehensive loss | (2,530,238 | ) | (2,486,616 | ) | ||||
| Accumulated deficit | (167,356,070 | ) | (157,442,585 | ) | ||||
| Stock subscriptions receivable | (50,585 | ) | - | |||||
| Noncontrolling interest | (39,186 | ) | 70,378 | |||||
| Total stockholders' equity | 13,143,528 | 4,061,397 | ||||||
| Total liabilities and stockholders' equity | $ | 32,331,430 | $ | 23,170,067 | ||||
See accompanying notes to the consolidated financial statements
| F-3 |
CONSOLIDATED STATEMENTS OF OPERATIONS AND COMPREHENSIVE LOSS
| Twelve Months Ended December 31 | ||||||||
| 2017 | 2016 | |||||||
| Net revenues | ||||||||
| Service fees | $ | 58,723,928 | $ | 48,784,855 | ||||
| Branded content | 1,340,896 | 5,502,004 | ||||||
| Total Revenues | 60,064,824 | 54,286,859 | ||||||
| Costs and expenses: | ||||||||
| Cost of service fees | 49,934,371 | 40,521,236 | ||||||
| Cost of branded content | 1,302,841 | 5,187,005 | ||||||
| General and administrative | 10,629,773 | 8,797,883 | ||||||
| Non-cash compensation | 2,940,424 | 3,463,435 | ||||||
| Bad debt expense | 1,320,848 | 1,688,237 | ||||||
| Depreciation and amortization | 2,533,985 | 3,466,511 | ||||||
| Total costs and operating expenses | 68,662,242 | 63,124,307 | ||||||
| Loss from operations | (8,597,418 | ) | (8,837,448 | ) | ||||
| Interest expense, net | (1,189,622 | ) | (1,463,833 | ) | ||||
| Loss from stock value guarantee | - | (3,722,142 | ) | |||||
| Other income (expense) | (236,009 | ) | 407,347 | |||||
| Net loss before income taxes | (10,023,049 | ) | (13,616,076 | ) | ||||
| Income taxes | - | - | ||||||
| Net loss | (10,023,049 | ) | (13,616,076 | ) | ||||
| Net loss attributable to the noncontrolling interest | 109,564 | 128,539 | ||||||
| Net loss attributable to Net Element, Inc. stockholders | (9,913,485 | ) | (13,487,537 | ) | ||||
| Foreign currency translation | (43,623 | ) | (920,794 | ) | ||||
| Comprehensive loss attributable to common stockholders | $ | (9,957,108 | ) | $ | (14,408,331 | ) | ||
| Loss per share - basic and diluted | $ | (5.04 | ) | $ | (10.33 | ) | ||
| Weighted average number of common shares outstanding - basic and diluted | 1,967,676 | 1,305,801 | ||||||
See accompanying notes to the consolidated financial statements
| F-4 |
CONSOLIDATED STATEMENTS OF CHANGES IN STOCKHOLDERS’ EQUITY
| Preferred Stock | Common Stock | Paid in | Stock | Comprehensive | Non-controlling | Accumulated | Equity (Deficiency) | |||||||||||||||||||||||||||||||||
| Shares | Amount | Shares | Amount | Capital | Subscription | Income | interest | Deficit | in Assets | |||||||||||||||||||||||||||||||
| Balance December 31, 2015 | - | - | 1,126,376 | $ | 113 | $ | 154,362,707 | $ | (1,565,822 | ) | $ | 198,917 | $ | (143,955,048 | ) | $ | 9,040,867 | |||||||||||||||||||||||
| Share based compensation | - | - | 121,442 | 12 | 4,427,105 | - | - | - | - | 4,427,117 | ||||||||||||||||||||||||||||||
| Shares issued and issuable for acquisitions | - | - | 6,543 | 1 | 134,094 | - | - | 134,095 | ||||||||||||||||||||||||||||||||
| Shares issued for insider financing | - | - | 46,643 | 5 | 988,823 | - | - | - | - | 988,828 | ||||||||||||||||||||||||||||||
| Shares issued in connection with debt restructuring | - | - | 166,340 | 16 | 3,288,820 | - | - | - | - | 3,288,836 | ||||||||||||||||||||||||||||||
| Shares issued under ESOUSA agreement | - | - | 68,006 | 7 | 718,517 | - | - | - | - | 718,524 | ||||||||||||||||||||||||||||||
| Net loss | - | - | - | - | - | - | - | (128,539 | ) | (13,487,537 | ) | (13,616,076 | ) | |||||||||||||||||||||||||||
| Comprehensive loss - foreign currency translation | - | - | - | - | - | - | (920,794 | ) | - | - | (920,794 | ) | ||||||||||||||||||||||||||||
| Balance December 31, 2016 | - | - | 1,535,350 | $ | 154 | $ | 163,920,066 | $ | - | $ | (2,486,616 | ) | $ | 70,378 | $ | (157,442,585 | ) | $ | 4,061,397 | |||||||||||||||||||||
| Shares issued in connection with reverse stock split | - | - | 3,117 | 0 | 1 | - | - | - | - | 1 | ||||||||||||||||||||||||||||||
| Share based compensation | - | - | 242,324 | 24 | 2,850,155 | - | - | - | - | 2,850,179 | ||||||||||||||||||||||||||||||
| Shares issued for acquisitions | - | - | 13,082 | 1 | 105,965 | - | - | - | - | 105,966 | ||||||||||||||||||||||||||||||
| Shares issued to settle merchant liabilities | - | - | 30,759 | 3 | 252,220 | - | - | - | - | 252,223 | ||||||||||||||||||||||||||||||
| Shares issued for consulting services | - | - | 19,896 | 2 | 228,416 | (50,585 | ) | - | - | - | 177,833 | |||||||||||||||||||||||||||||
| Shares issued in connection with debt restructuring | - | - | 127,406 | 13 | 758,181 | - | - | - | - | 758,194 | ||||||||||||||||||||||||||||||
| Shares issued under ESOUSA/Cobblestone agreements | - | - | 1,881,165 | 188 | 15,004,217 | - | - | - | - | 15,004,405 | ||||||||||||||||||||||||||||||
| Net loss | - | - | - | - | - | - | - | (109,564 | ) | (9,913,485 | ) | (10,023,049 | ) | |||||||||||||||||||||||||||
| Comprehensive loss - foreign currency translation | - | - | - | - | - | - | (43,622 | ) | - | - | (43,622 | ) | ||||||||||||||||||||||||||||
| Balance December 31, 2017 | - | - | 3,853,100 | $ | 385 | $ | 183,119,222 | $ | (50,585 | ) | $ | (2,530,238 | ) | $ | (39,186 | ) | $ | (167,356,070 | ) | $ | 13,143,528 | |||||||||||||||||||
See accompanying notes to the consolidated financial statements
| F-5 |
CONSOLIDATED STATEMENTS OF CASH FLOWS
| Twelve Months Ended December 31, | ||||||||
| 2017 | 2016 | |||||||
| Cash flows from operating activities | ||||||||
| Net loss attributable to Net Element, Inc. stockholders | $ | (9,913,485 | ) | $ | (13,487,537 | ) | ||
| Adjustments to reconcile net loss to net cash (used in) provided by operating activities | - | |||||||
| Non controlling interest | (109,564 | ) | (128,539 | ) | ||||
| Share based compensation | 2,940,424 | 3,463,435 | ||||||
| Provision for bad debts | - | 500,000 | ||||||
| Amortization of prepaid costs | 967,313 | |||||||
| Depreciation and amortization | 2,533,985 | 3,466,510 | ||||||
| Non cash interest | 114,802 | 852,408 | ||||||
| Changes in assets and liabilities | ||||||||
| Accounts receivable | 3,002,425 | (2,751,144 | ) | |||||
| Deferred revenue | 356,619 | 612,062 | ||||||
| Prepaid expenses and other assets | (1,022,985 | ) | (570,582 | ) | ||||
| Accounts payable and accrued expenses | (2,943,154 | ) | 3,797,753 | |||||
| Net cash used in operating activities | (5,040,933 | ) | (3,278,321 | ) | ||||
| Cash flows from investing activities | ||||||||
| Client acquisition costs | (1,885,098 | ) | (1,319,820 | ) | ||||
| Receipt of excess deposits | 149,826 | |||||||
| Purchase of fixed and other assets | (103,341 | ) | (187,089 | ) | ||||
| Net cash used in investing activities | (1,838,613 | ) | (1,506,909 | ) | ||||
| Cash flows from financing activities | ||||||||
| Proceeds from common stock | 14,884,435 | - | ||||||
| Proceeds from indebtedness | 3,678,824 | 3,170,540 | ||||||
| Cash received for issuance of warrants | 300,000 | |||||||
| Repayment of indebtedness | (998,780 | ) | (71,700 | ) | ||||
| Related party advances | - | 1,027,874 | ||||||
| Net cash provided by financing activities | 17,564,479 | 4,426,714 | ||||||
| Effect of exchange rate changes on cash | (20,899 | ) | (45,596 | ) | ||||
| Net increase (decrease) in cash | 10,664,034 | (404,112 | ) | |||||
| Cash at beginning of period | 621,635 | 1,025,747 | ||||||
| Cash at end of period | $ | 11,285,669 | $ | 621,635 | ||||
| Supplemental disclosure of cash flow information | ||||||||
| Cash paid during the period for: | ||||||||
| Interest | $ | 1,074,820 | $ | 611,625 | ||||
| Taxes | $ | 86,942 | $ | 94,718 | ||||
| Share issuance for settlement of unpaid compensation | $ | - | $ | 1,042,509 | ||||
| Shares issued for redemption of indebtedness | $ | 379,874 | $ | 2,499,481 | ||||
| Shares issued in settlement of advances from from board member | $ | - | $ | 909,285 | ||||
| Shares issued in settlement of related party debt | $ | 378,253 | $ | - | ||||
See accompanying notes to the consolidated financial statements
| F-6 |
NOTES TO CONSOLIDATED FINANCIAL STATEMENTS
DECEMBER 31, 2016 AND 2017
NOTE 1. SUMMARY OF SIGNIFICANT ACCOUNTING POLICIES
Organization and Basis of Presentation
Organization
Net Element, Inc. (“We”, “us”, “our” or the “Company”) is a financial technology-driven group specializing in mobile payments and other transactional services in emerging countries and in the United States. We are differentiated by our proprietary technology which enables us to provide a broad suite of payment products, end-to-end transaction processing services and superior client support. During the year ended December 31, 2016, we operated in three reportable business operating segments: (i) North American Transaction Solutions, (ii) Mobile Solutions, and (iii) Online Solutions. During the year ended December 31, 2017, we consolidated our online and mobile payments business into one segment, International Transaction Solutions.
We are able to deliver our services across multiple points of access, or “multi-channel,” including brick and mortar locations, software integration, e-commerce, mobile operator billing, mobile and tablet-based solutions. In the United States, via our U.S. based subsidiaries, we generate revenues from transactional services and other payment technologies for small and medium-sized businesses. Through TOT Group Russia and Net Element Russia, we provide transactional services, mobile payment transactions, online payment transactions and other payment technologies in emerging countries in the Russian Federation, Commonwealth of Independent States (“CIS”), Europe and Asia.
Business
Our transactional services business enables merchants to accept credit cards as well as other forms of payment, including debit cards, checks, gift cards, loyalty programs and alternative payment methods in traditional card-present or swipe transactions, as well as card-not-present transactions, such as those conducted over the phone or through the Internet or a mobile device. We market and sell our services through both independent sales groups (“ISGs”), which are non-employee, external sales organizations and other third-party resellers of our products and services, and directly to merchants through electronic media, telemarketing and other programs, including utilizing partnerships with other companies that market products and services to local and international merchants. We have agreements with several banks that sponsor us for membership in the Visa ® , MasterCard ® , American Express ® and Discover ® card associations and settle card transactions for our merchants. These sponsoring banks include Citizens Bank, Esquire Bank, N.A. and Wells Fargo Bank, N.A. From time to time, we may enter into agreements with additional banks. We perform core functions for merchants such as application processing, underwriting, account set-up, risk management, fraud detection, merchant assistance and support, equipment deployment and chargeback services.
Our Mobile Solutions business, Digital Provider, provides relationships and contracts with mobile operators that give us the ability to offer our clients in-app, premium SMS (short message services, which is a text messaging service), Wireless Application Protocol (WAP)-click, one click and other carrier billing services. We also market our own branded content as a separate line of business for our mobile commerce business from offices in Russia and Kazakhstan. In August 2017, we substantially reorganized this business, and consolidated its operations into PayOnline and TOT Group Russia. We currently are not generating revenues from new mobile content and we continue to explore partnership opportunities that can monetize our relationships and contracts with mobile operators.
PayOnline provides flexible high-tech payment solutions to companies doing business on the Internet or in the mobile environment. PayOnline specializes in integration and customization of payment solutions for websites and mobile apps. In particular, PayOnline arranges payment on the website of any commercial organization, which increases the convenience of using the website and helps maximize the number of successful transactions. In addition, PayOnline is focused on providing online and mobile payment acceptance services to the travel industry through direct integration with leading Global Distribution Systems (“GDS”), which include Amadeus® and Sabre®. Key geographic regions that PayOnline serves include Eastern Europe, Central Asia, Western Europe, North America and Asia major sub regions. PayOnline offices are located in Russia, Kazakhstan and in the Republic of Cyprus.
Also part of our transactional services business, Aptito is a proprietary, cloud-based payments platform for the hospitality industry, which creates an online consumer experience in offline commerce environments via tablet, mobile and all other cloud-connected devices. Aptito’s easy to use point-of-sale (“POS”) system makes things easier by providing a comprehensive solution to the hospitality industry to help streamline management and operations. Orders placed tableside by customers directly speed up the ordering process and improve overall efficiency. Aptito's mobile POS system provides portability to the staff while performing all the same functions as a traditional POS system, and more.
| F-7 |
Basis of Presentation
Use of Estimates
The preparation of consolidated financial statements in conformity with accounting principles generally accepted in the United States of America requires management to make estimates and assumptions that affect the reported amounts of assets and liabilities and disclosures of contingent assets and liabilities as of the balance sheet date and the reported amounts of expenses for the period presented. Actual results could differ from those estimates.
Significant estimates include (i) the valuation of acquired merchant portfolios (ii) the recoverability of long-lived assets, (iii) the remaining useful lives of long-lived assets, and (iv) the sufficiency of merchant, legal, and other reserves. On an ongoing basis, the Company evaluates the sufficiency and accuracy of its estimates. Actual results could differ from those estimates.
Reclassifications
Certain reclassifications have been made to the comparative period amounts to conform to our current period presentation. These reclassifications had no impact on previously presented financial condition or results of operations.
Cash and Cash Equivalents
We maintain our U.S. dollar-denominated cash in several non-interest bearing bank deposit accounts. All U.S. non-interest bearing transaction accounts are insured up to a maximum of $250,000 at FDIC insured institutions. The bank balances exceeded FDIC limits at December 31, 2017 by $10,647,524 due to the cash received from capital raises. We plan to transfer funds among different financial institutions to reduce this risk. The bank balances did not exceed FDIC limits at December 31, 2016.
We maintain $186,353 and $498,308 in uninsured bank accounts in Russia and the Cayman Islands at December 31, 2017 and 2016 respectively.
Accounts Receivable and Allowance for Doubtful Accounts
Accounts receivable are stated net of an allowance for doubtful accounts. We estimate an allowance based on experience with our service providers and judgment as to the likelihood of their ultimate payment. We also consider collection experience and make estimates regarding collectability based on payout trends of the customers. In Russia, the service providers are subsidiaries of large telecommunication companies and we do not reserve for these receivables given their financial backing and our historical experience with such companies. The allowance for doubtful accounts was $256,967 at December 31, 2017 and $603,031 at December 31, 2016.
Other Current Assets
We maintain an inventory of POS terminals which we use to service both merchants and independent sales agents. If the terminals are sold for a fee, we expense the cost of these terminals, plus any setup fees at the time of the sale. Often, we will provide the terminals as an incentive for merchants and independent sales agents to enter into a merchant contracts with us. The term of these contracts have an average length of three years and the cost of the terminal plus any setup fees will be amortized over the contract period. If the merchants terminate their contract with us early, they are obligated to either return the terminal or pay for the terminal. The Company has $506,906 and $311,206 in terminals, iPads ® and related equipment as of December 31, 2017 and 2016, respectively, of which $500,701 and $308,582 has been placed with merchants during 2017 and 2016, respectively. Amortization of these terminals amounted to $188,897 and $126,643 for the years ended December 31, 2017 and 2016, respectively.
Fixed Assets
We depreciate our furniture and equipment over a term of three to ten years. Computers and software are depreciated over terms between two and five years. Leasehold improvements are depreciated over the shorter of the economic life or term of each lease. All of our assets are depreciated on a straight-line basis for financial statement purposes.
Expenditures for repairs and maintenance are charged to operating expense as incurred. Expenditures that increase the value or productive capacity of assets are capitalized. At the time of retirements, sales, or other dispositions of property and equipment, the original cost and related accumulated depreciation are removed from the respective accounts, and the gains or losses are presented as other expenses.
Goodwill and Other Intangible Assets
Intangible assets acquired, either individually or with a group of other assets (but not those acquired in a business combination), are initially recognized and measured based on fair value. Goodwill acquired in business combinations is initially computed as the amount paid by the acquiring company in excess of the fair value of the net assets acquired.
The cost of internally developing, maintaining and restoring intangible assets (including goodwill) that are not specifically identifiable, that have indeterminate lives, or that are inherent in a continuing business and related to an entity are recognized as an expense when incurred.
| F-8 |
An intangible asset (including goodwill) that is not subject to amortization shall be tested for impairment annually or more frequently if events or changes in circumstances indicate that the asset might be impaired. If the carrying amount of an intangible asset exceeds its fair value, an impairment loss shall be recognized in an amount equal to that excess. Goodwill is not amortized. It is the Company's policy to test for impairment no less than annually, by considering qualitative factors to determine whether it is more likely than not that a that the Company's goodwill carrying value is greater than its fair value. Such factors may include the following: a significant decline in expected revenues, significant decline in the Company's stock price, a significant downturn in the general economic business conditions, the loss of key personnel or when conditions occur that may indicate impairment. The Company's intangible assets, which consist of goodwill of $9,643,752 recorded in connection with the various acquisitions, were tested for impairment during the fourth quarter, 2017, and we determined that no adjustment for impairment was necessary.
Impairment of Long-Lived Assets
We review our long-lived assets for impairment whenever events or changes indicate that the carrying amount of an asset or group of assets may not be recoverable. During the twelve months ended December 31, 2017 and 2016, we did not recognize any charges for impairment of goodwill or intangible assets.
Capitalized Customer Acquisition Costs, Net
Capitalized customer acquisition costs consist of up-front cash payments made to Independent Sales Groups (“ISGs”) for the establishment of new merchant relationships. Capitalized customer acquisition costs represent incremental, direct customer acquisition costs that are recoverable through gross margins associated with merchant contracts. The up-front cash payment to the ISG is based on the estimated gross margin for the first year of the merchant contract. The deferred customer acquisition cost asset is recorded at the time amounts are receivable but not yet earned and the capitalized acquisition costs are primarily amortized on a straight-line basis over a period of three years.
During the years ended December 31, 2017 and 2016, we recorded $1,801,685 and $1,319,820, respectively, in additional capitalized customer acquisition costs, and $1,063,687 and $670,543, respectively, in related additional amortization. The balance of customer acquisition costs was $2,435,335 and $1,697,337 at December 31, 2017 and 2016, respectively, and is reflected in intangible assets in the accompanying consolidated balance sheets.
Accrued Residual Commissions
We report commissions as a cost of revenues in the accompanying consolidated statement of operations and comprehensive loss. We pay agent commissions to ISGs and independent sales agents based on the processing volume of the merchants enrolled. The commission obligations are based on varying percentages of the volume processed by us on behalf of the merchants. Percentages vary based on the program type and transaction volume of each merchant. We report residual commissions as a cost of revenues in the accompanying consolidated statement of operations and comprehensive loss.
At December 31, 2017 and 2016 the residual commissions payable to ISGs and independent sales agents were $1,821,790 and $1,347,352, respectively.
We pay agent commission on annual fees between January and April of each year. We amortize the annual fees paid in equal monthly amounts from date of payment to end of year. We pay our agent commissions for annual fees in advance of recognizing the associated revenue. We deferred $1,224,044 and $863,604 of agent commissions paid for annual fees at December 31, 2017 and 2016. Prepaid agent commissions for annual fees are included in prepaid expenses and other assets, and commissions payable are included in accounts payable in the accompanying consolidated balance sheets.
Fair Value Measurements
Our financial instruments consist primarily of cash, accounts receivables, accounts payables. The carrying values of these financial instruments are considered to be representative of their fair values due to the short-term nature of these instruments. The carrying amount of the long-term debt of, $7.0 million and $4.4 million at December 31, 2017 and 2016, respectively, approximates fair value because current borrowing rate does not materially differ from market rates for similar bank borrowings. The long-term debt is classified as a Level 2 item within the fair value hierarchy.
We measure certain nonfinancial assets and liabilities at fair value on a nonrecurring basis. Fair value is defined as the exchange price that would be received for an asset or paid to transfer a liability (an exit price) in the principal or most advantageous market for the asset or liability in an orderly transaction between market participants at the measurement date. We use a three-level fair value hierarchy to prioritize the inputs used to measure fair value and maximizes the use of observable inputs and minimizes the use of unobservable inputs. The three levels of inputs used to measure fair value are as follows:
Level 1 — Quoted market prices in active markets for identical assets or liabilities as of the reporting date
Level 2 — Observable market based inputs or unobservable inputs that are corroborated by market data
Level 3 — Unobservable inputs that are not corroborated by market data
| F-9 |
These non-financial assets and liabilities include intangible assets and liabilities acquired in a business combination as well as impairment calculations, when necessary. The fair value of the assets acquired and liabilities assumed in connection with the PayOnline acquisition, were measured at fair value by us at the acquisition date. The fair values of our merchant portfolios are primarily based on Level 3 inputs and are generally estimated based upon independent appraisals that include discounted cash flow analyses based on our most recent cash flow projections, and, for years beyond the projection period, estimates based on assumed growth rates. Assumptions are also made regarding appropriate discount rates, perpetual growth rates, and capital expenditures, among others. In certain circumstances, the discounted cash flow analyses are corroborated by a market-based approach that utilizes comparable company public trading values, and, where available, values observed in private market transactions. The inputs used by management for the fair value measurements include significant unobservable inputs, and therefore, the fair value measurements employed are classified as Level 3. The goodwill impairment was primarily based on observable inputs using company specific information and is classified as Level 3.
Foreign Currency Transactions
We are subject to exchange rate risk in our foreign operations in Russia, the functional currency of which is Russian ruble, where we generate service fee revenues and interest income and incurs product development, engineering, website development, and general and administrative costs and expenses. The Russian engineering operations pay a majority of their operating expenses in their local currencies, exposing us to exchange rate risk.
The Company does not engage in any currency hedging activities.
Revenue Recognition
We recognize revenue when the following four basic criteria have been met: (1) persuasive evidence of a sales arrangement exists; (2) performance of services has occurred, (3) the sales price is fixed or determinable, and (4) collectability is reasonably assured. The Company considers persuasive evidence of a sales arrangement to be the receipt of a billable transaction from aggregators, signed contract or the processing of a credit card transaction. Collectability is assessed based on a number of factors, including transaction history with the customer and the credit worthiness of the customer. If it is determined that the collection is not reasonably assured, revenue is not recognized until collection becomes reasonably assured, which is generally upon receipt of cash. We record cash received in advance of revenue recognition as deferred revenue.
Our revenues for the years ended December 31, 2017 and 2016 are principally derived from the following sources:
Transactional Processing Fees: Transactional processing fees are generated primarily from TOT Payments doing business as Unified Payments, which is our North American Transaction Solutions segment, PayOnline, which is our Russian online transaction processing company, and Aptito our point of sale solution for restaurants.
Our transactional processing companies derive revenues primarily from the electronic processing of services including: credit, debit, electronic benefits transfer and alternative payment methods card processing authorized and captured through proprietary and third party networks, electronic gift certificate processing, and equipment support. These revenues are recorded as bankcard and other processing transactions when processed. In addition to generating service fees, Aptito earns monthly fees for use of its platform.
Typically, fees charged to merchants for these processing services are based on a variable percentage of the dollar amount of each transaction and in some instances, additional fees are charged for each transaction. Merchant customers also may be charged miscellaneous fees, including statement fees, annual fees, monthly minimum fees, fees for handling chargebacks, gateway fees, and fees for other miscellaneous services.
Generally, we (i) are the primary obligor in our arrangements with our merchant customers, (ii) have latitude in establishing the price of our services, (iii) have the ability to change the product and perform parts of the services, (iv) have discretion in supplier selection, (v) have latitude in determining the product and service specifications to meet the needs of our merchant customers, and (vi) assume credit risk. In such cases, we report revenues as gross of fees deducted by our sponsoring member banks, as well as fees deducted from card-issuing member banks and card brands (Visa® and MasterCard®) on behalf of our sponsoring member banks for interchange and assessments. These fees charged by the card brands to process the credit card transactions are recorded separately as cost of revenue and interchange fees in the accompanying consolidated statement of operations and comprehensive loss.
We have arrangements that included bundled multiple element transactions with merchants encompassing annual PCI (payment card industry) fees, annual membership fees, and monthly processing fees.
US GAAP requires and allocation of fees to a bundled transaction based on an allocation of the relative selling prices using vendor specific objective evidence (VSOE) or third party evidence (TPE).
Our payment processing business derives revenues primarily from the electronic processing of services including credit, debit and electronic benefits transfer card processing authorized and captured through third party networks, check conversion and guarantee, electronic gift certificate processing, and equipment leasing and sales. These revenues are recorded as bankcard and other processing transactions when processed.
| F-10 |
Typically, fees charged to merchants for these processing services are based on a variable percentage of the dollar amount of each transaction and in some instances, additional fees are charged for each transaction. Merchant customers may also be charged miscellaneous fees, including statement fees, annual fees, monthly minimum fees, fees for handling chargebacks, gateway fees, and fees for other miscellaneous services.
The fair value for annual fees is based on the annual contract renewal price and is deemed to represent stand-alone selling price based upon VSOE. The fair value for processing is based on prices charged by our competitors for similar deliverables when sold separately and is deemed to represent stand-alone selling price based upon TPE.
Deferred revenue represents primarily amounts received in advance for annual fee billings and are recognized on a pro rata basis over the service period.
Service Fees: Service fees are generated primarily from mobile payment processing services provided to third party content aggregators by Digital Provider. Digital Provider’s revenues for the access of branded content are recorded at the amounts charged to the mobile subscriber. A corresponding charge to cost of sales for mobile operator and content fees is recorded for branded content. Revenues for access to branded content are recorded on the income statement as branded content revenues. Mobile payment processing revenues for third party content providers continue to be accounted for as service fees and presented net of aggregator and mobile operator payments on the consolidated financial statements as these revenues are considered to be agency fees.
Cost of revenues for Digital Provider is comprised primarily of mobile operator fees, content provider fees and fees for short numbers paid to mobile operators. Additionally, penalties and penalty recoveries are recorded as cost of sales. Service revenues for mobile payment processing services are presented net as these revenues are considered to be agency fees.
Subscription revenues for our branded content are recognized when a content subscriber initiates the purchase of our access to content using WAP-click, Internet- click, or a SMS-to-short number registered to us.
Digital Provider’s subscription revenues are recorded at the amounts charged to the third-party customer. Cost of revenues for Digital Provider branded content includes fees due to mobile operators and marketing partners, as well as short number fees.
Cost of revenues for TOT Payments, Aptito and PayOnline is comprised primarily of processing fees paid to third parties attributable to providing transaction processing and service fees for POS system usage by our merchant customers. Interchange fees and cost of services are recognized as incurred, which generally occurs in the same period in which the corresponding revenue is recognized. Interchange fees are set by the card networks and are paid to the card-issuing bank. Interchange fees are calculated as a percentage of the dollar volume processed plus a per transaction fee. We also pay Visa® and MasterCard® network dues.
Generally, the Company (i) is the primary obligor in its arrangements with its merchant customers, (ii) has latitude in establishing the price of its services, (iii) has the ability to change the product and perform parts of the services, (iv) has discretion in supplier selection, (v) has latitude in determining the product and service specifications to meet the needs of its merchant customers, and (vi) assumes credit risk. In such cases, the Company reports revenues as gross of fees deducted by its sponsoring member banks, as well as fees deducted from card-issuing member banks and card brands (Visa/MasterCard) on behalf of its sponsoring member banks for interchange and assessments. These fees charged by the card brands to process the credit card transactions are recorded separately as cost of sales and interchange fees in the accompanying consolidated statement of operations.
Net Loss per Share
Basic net loss per common share is computed by dividing net loss applicable to common stockholders by the weighted-average number of common shares outstanding during the period. Diluted net loss per common share is determined using the weighted-average number of common shares outstanding during the period, adjusted for the dilutive effect of common stock equivalents, consisting of shares issuable upon exercise of common stock options or warrants. In periods when losses are reported, the weighted-average number of common shares outstanding excludes common stock equivalents because their inclusion would have an anti-dilutive effect. At December 31, 2017 and 2016, we had warrants outstanding to purchase 728,583 and 89,389 shares of common stock, and we had 234,219 and 193,610 stock options issued and outstanding.
Income Taxes
We account for income taxes under the asset and liability method, which requires the recognition of deferred tax assets and liabilities for the expected future tax consequences of events that have been included in the financial statements. Under this method, deferred tax assets and liabilities are determined on the basis of the differences between the financial statements and tax basis of assets and liabilities using enacted tax rates in effect for the year in which the differences are expected to reverse. The effect of a change in tax rates on deferred tax assets and liabilities is recognized in income in the period that includes the enactment date.
We recognize net deferred tax assets to the extent that we believe these assets are more likely than not to be realized. In making such a determination, we consider all available positive and negative evidence, including future reversals of existing taxable temporary differences, projected future taxable income, tax-planning strategies, and results of recent operations. If we determine that we would be able to realize our deferred tax assets in the future in excess of their net recorded amount, we would make an adjustment to the deferred tax asset valuation allowance, which would reduce the provision for income taxes.
| F-11 |
We account for uncertainty in income taxes using a two-step approach to recognizing and measuring uncertain tax positions. The first step is to evaluate the tax position for recognition by determining if the weight of available evidence indicates that it is more likely than not that the position will be sustained on audit, including resolution of related appeals or litigation processes, if any. The second step is to measure the tax benefit as the largest amount that is more than 50% likely of being realized upon settlement. We classify the liability for unrecognized tax benefits as current to the extent we anticipate payment (or receipt) of cash within one year. Interest and penalties related to uncertain tax positions are recognized and recorded as necessary in the provision for income taxes. Our evaluation of uncertain tax positions was performed for the tax years ended December 31, 2012 and forward, the tax years which remain subject to examination at December 31, 2017.
Recently Issued and Adopted Accounting Guidance
In May 2014, the Financial Accounting Standards Board (“FASB”) issued Accounting Standard Update (“ASU”) 2014-09, “Revenue from Contracts with Customers,” which supersedes the revenue recognition requirements in Topic 605, “Revenue Recognition” and requires entities to recognize revenue in a way that depicts the transfer of promised goods or services to customers in an amount that reflects the consideration to which the entity expects to be entitled in exchange for those goods or services. In August 2015, the FASB issued ASU 2015-14, which defers by one year the effective date of ASU 2014-09. Accordingly, this guidance is effective for interim and annual periods beginning after December 15, 2017. We adopted this guidance on January 1, 2018 and do not expect this guidance to have a material effect on our financial position, results of operations and cash flows.
In February 2016, the FASB issued ASU 2016-02, “Leases” which, for operating leases, requires a lessee to recognize a right-of-use asset and a lease liability, initially measured at the present value of the lease payments, in its balance sheet. The standard also requires a lessee to recognize a single lease cost, calculated so that the cost of the lease is allocated over the lease term, on a generally straight-line basis. The ASU is effective for public companies for fiscal years beginning after December 15, 2018, including interim periods within those fiscal years. Early adoption is permitted. We expect that the adoption of ASU 2016-02 will result in the recognition of management’s recognition of right of use assets and related obligations on our consolidated Balance sheets.
In March 2016, the FASB issued Accounting Standards Update 2016-08 Revenue from Contracts with Customers (Topic 606) to clarify implementation guidance on principal versus agent considerations (for reporting revenue on a gross or net basis). The ASU is an amendment to Topic 606, clarifies the implementation guidance, and requires an entity to account for revenue as an agent when another entity controls the specified good or service before that good or service is transferred to the customer. This ASU is effective for annual periods beginning after December 15, 2017. The Company adopted this guidance on January 1, 2018 and did not see a change in reporting revenues resulting from the adoption of this guidance on the Company’s financial position, results of operations and cash flows.
NOTE 2. BASIS OF PRESENTATION AND PRINCIPLES OF CONSOLIDATION
On May 25, 2016, and subsequently again on October 5, 2017, we completed a one-for-ten reverse stock split of our common stock. Our consolidated financial statements give retrospective effect for these changes in capital structure for all periods presented.
Following the consolidation principles promulgated by U.S. GAAP, the consolidated financial statements of the Company include the assets, liabilities, results of operations, and cash flows of the following subsidiaries:
(1) TOT Group, Inc., a 100% owned subsidiary formed in Delaware; (2) Netlab Systems, LLC, a wholly owned subsidiary formed in Florida; (3) NetLab Systems IP, LLC, a wholly owned subsidiary formed in Florida; (4) OOO Net Element Russia (“Net Element Russia”), a wholly owned subsidiary formed in Russia; and (5) Net Element Services, LLC, a wholly owned subsidiary formed in Florida.
The subsidiaries listed above are the parent companies of several other subsidiaries, which hold the Company’s underlying investments or operating entities.
TOT Group is the parent company of TOT Payments, LLC (“TOT Payments”) doing business as Unified Payments a wholly owned subsidiary formed in Florida, Aptito, LLC, a 80% owned subsidiary formed in Florida (acquired June 18, 2013), TOT Group Europe LTD, a wholly owned subsidiary formed in the United Kingdom, Unified Portfolios, LLC, a wholly owned subsidiary formed in Florida and OOO TOT Group Russia, a wholly owned subsidiary formed in Russia.
| • | TOT Payments, LLC is the parent company of: | |
| - | Process Pink, LLC, a wholly owned subsidiary formed in Florida; | |
| - | TOT HPS, LLC, a wholly owned subsidiary formed in Florida; | |
| - | TOT FBS, LLC, a wholly owned subsidiary formed in Florida; |
| - | TOT New Edge, LLC, a wholly owned subsidiary formed in Florida; | |
| - | TOT BPS, LLC, a wholly owned subsidiary formed in Florida |
| • | OOO TOT Group Russia is the parent company of its wholly owned subsidiary OOO Digital Provider (f/k/a OOO TOT Money)(a company formed in Russia), Payonline Systems, LLC (a wholly-owned company formed in Russia), Innovative Payment Technologies, LLC (a wholly-owned company formed in Russia) and TOT Group Kazakhstan, a wholly owned subsidiary formed in Kazakhstan. |
| F-12 |
| • | Netlab Systems, LLC is the parent company of Tech Solutions LTD (Cayman Islands). | |
| • | Net Element Russia is the parent company of 99% owned OOO TOT Group. | |
| • | TOT Group Europe LTD is 100% owner of Polimore Capital Limited (Cyprus) and Brosword Holding Limited (Cyprus) |
All material intercompany accounts and transactions have been eliminated in consolidation.
NOTE 3. LIQUIDITY AND GOING CONCERN CONSIDERATIONS
The Company’s consolidated financial statements have been prepared on a going concern basis. Although, the Company had a net loss of $10.0 million for the year ended December 31, 2017, and an accumulated deficit of $167.4 million at December 31, 2017, the company had a cash balance of $11.3 million and projects future cash needs of $4.8 million for the next 12 months to fund operations, indebtedness and capital expenditures.
The Company is continuing with its plan to further grow and expand its payment processing operations and develop blockchain solutions for merchant services. Management believes that its current cash position and operating strategy will provide the opportunity for the Company to continue as a going concern; however, there is no assurance this will occur.
The independent auditors’ report on the Company’s consolidated financial statements for the year ended December 31, 2016 contained explanatory paragraphs expressing substantial doubt as to the Company’s ability to continue as a going concern.
NOTE 4. ACCOUNTS RECEIVABLE
Accounts receivable (net) consist of amounts due from merchant service providers and to a lesser extent Russian mobile operator intermediaries. Total net accounts receivable amounted to $5,472,856 and $7,126,429 at December 31, 2017 and 2016, respectively. Net accounts receivable consisted primarily of $57,754 and $2,577,296, attributed to Russian operations and $5,415,102 and $4,549,133 of credit card processing receivables at December 31, 2017 and 2016 respectively.
Total allowance for doubtful accounts was $256,967 and $603,031 at December 31, 2017 and 2016, respectively.
NOTE 5. FIXED ASSETS
Fixed assets are stated at acquired cost less accumulated depreciation and amortization as follows:
| Useful life | ||||||||||
| (in years) | December 31, 2017 | December 31, 2016 | ||||||||
| Furniture and equipment | 3 - 10 | $ | 171,082 | $ | 185,301 | |||||
| Computers | 2 - 5 | 156,958 | 168,942 | |||||||
| Total | 328,040 | 354,243 | ||||||||
| Less: Accumulated depreciation | (269,772 | ) | (236,948 | ) | ||||||
| Total fixed assets, net | $ | 58,268 | $ | 117,295 | ||||||
Depreciation expense for the years ended December 31, 2017 and 2016 was $32,824 and $83,245, respectively.
NOTE 6. INTANGIBLE ASSETS
The Company had 3,127,760 and $3,589,850 in intangible assets at December 31, 2017 and 2016, respectively. Shown below are the details.
| IP Software | Portfolios and Client Lists | Client Acquisition Costs | PCI Certification | Trademarks | Domain Names | Covenant Not to Compete | Total | |||||||||||||||||||||||||
| Balance at December 31, 2015 | $ | 1,548,601 | $ | 1,489,175 | $ | 1,048,060 | $ | 355,458 | $ | 561,772 | $ | 339,147 | $ | 81,667 | $ | 5,423,880 | ||||||||||||||||
| Additions | 102,689 | - | 1,319,820 | - | - | 83 | - | 1,422,592 | ||||||||||||||||||||||||
| Amortization | (1,271,226 | ) | $ | (704,184 | ) | (670,543 | ) | (149,668 | ) | (234,064 | ) | (145,270 | ) | (81,667 | ) | (3,256,622 | ) | |||||||||||||||
| Balance at December 31, 2016 | $ | 380,064 | $ | 784,991 | $ | 1,697,337 | $ | 205,790 | $ | 327,708 | $ | 193,960 | $ | - | $ | 3,589,850 | ||||||||||||||||
| Additions | 48,489 | 1,801,685 | 1,850,174 | |||||||||||||||||||||||||||||
| Amortization | (209,251 | ) | (510,937 | ) | (1,063,687 | ) | (149,667 | ) | $ | (235,515 | ) | (143,207 | ) | (2,312,264 | ) | |||||||||||||||||
| Balance at December , 2017 | $ | 219,302 | $ | 274,054 | $ | 2,435,335 | $ | 56,123 | $ | 92,193 | $ | 50,753 | $ | - | $ | 3,127,760 | ||||||||||||||||
| F-13 |
Amortization expense for the year ended December 31, 2017 was $2,501,161 of which $2,312,264 is described in the table above and $188,897 was for the amortization of terminal inventory placed with merchants. The inventory and its associated amortization are included in prepaid and other expenses and are not included in the table above.
Amortization expense for the year ended December 31, 2016 was $3,383,265 of which $3,256,622 is described in the table above and $126,643 was for the amortization of terminal inventory placed with merchants. The inventory and its associated amortization are included in prepaid and other expenses and are not included in the table above.
The following table presents the estimated aggregate future amortization expense of other intangible assets:
| Year | Amortization Expense | |||
| 2018 | 1,042,587 | |||
| 2019 | 1,042,587 | |||
| 2020 | 1,042,586 | |||
| Total | $ | 3,127,760 | ||
Software
We capitalized software development costs that add value to or extend the useful of the related software it develops for internal use and licensing. Costs for routine software updates are expensed as incurred. Capitalized costs are amortized over 36 months on a straight-line basis. Impairment is reviewed quarterly to ensure only viable active costs are capitalized.
During the twelve months ended December 31, 2017 and 2016 we capitalized $48,489 and $102,689 of development costs as follows:
| · | point of sale software ($48,489 and $1,469) |
| · | payment processing software ($0 and $89,101) |
| · | mobile payments billing software ($0 and $12,119) |
For the twelve months ended December 31, 2017, amortization was $209,251. For twelve months ended December 31, 2016, amortization was $1,271,226.
Merchant Portfolios and client lists
Merchant Portfolios consisted portfolios purchased on business acquisitions that earn future streams of income for the foreseeable future. The remaining useful lives of these portfolios range from 15 months to 36 months at the time of acquisition. At December 31, 2017 and 2016 the net value of these portfolios was $274,054 and $784,991 respectively.
The useful lives of merchant portfolios represent management’s best estimate over which the Company will recognize the economic benefits of these intangible assets.
Trademarks and Domain Names
At December 31, 2017 and December 31, 2016, the net book value of these trademarks was $92,193 and $327,708, respectively, and the net book value of the domain names was $50,753 and $193,960, respectively.
For the twelve- months ended December 31, 2017 and 2016, amortization for trademarks was $235,515 and $234,064, respectively.
For the twelve months ended December 31, 2017 and 2016, amortization for domain names was $143,207 and $145,270, respectively.
PCI Certification
At December 31, 2017 and 2016, the net book value of the PCI certification was $56,123 and $205,790, respectively.
For the twelve-months ended December 31, 2017 and 2016, amortization for the PCI certification was $149,667 and $149,668, respectively..
| F-14 |
NOTE 7. ACCRUED EXPENSES
At December 31, 2017 and December 31, 2016, accrued expenses amounted to $3,674,430 and $5,518,823 respectively. Accrued expenses represent expenses that are owed at the end of the period and have not been billed by the provider or are estimates of services provided. The following table details the items comprising the balances outstanding as of December 31, 2017 and December 31, 2016.
| December 31, 2017 | December 31, 2016 | |||||||
| Accrued professional fees | $ | 241,281 | $ | 220,140 | ||||
| PayOnline accrual | 1,438,900 | 3,784,451 | ||||||
| Accrued interest | 145,264 | 183,778 | ||||||
| Accrued bonus | 1,249,852 | 774,485 | ||||||
| Accrued franchise taxes | - | 180,000 | ||||||
| Accrued foreign taxes | 137,141 | 131,810 | ||||||
| Short term loan advances | - | 174,376 | ||||||
| Other accrued expenses | 461,992 | 69,783 | ||||||
| $ | 3,674,430 | $ | 5,518,823 | |||||
The accrual for PayOnline at December 31, 2017 and 2016 consists primarily of $1.1 million and $1.4 million obligation for refundable merchant reserves, respectively, assumed pursuant to an amendment to the PayOnline acquisition agreement. See Note 11 for additional information. In addition, December 31, 2016 also included a $2.0 million stock price guarantee obligation pursuant to a settlement agreement entered into in connection with the PayOnline accrued expenses at acquisition.
Accrued interest at December 31, 2017 and 2016 is comprised primarily of loan costs associated with RBL notes in the amount of $145,264 and 134,180, respectively as a result of the issuance of additional RBL notes.
We owed $137,140 and $131,810 in foreign taxes, which primarily consist of VAT and payroll taxes related to our International Transaction Solutions segment at December 31, 2017 and 2018.
Other accrued expenses of $461,992 were the result of various travel, professional and other expenses paid for by our CEO on his personal credit cards.
NOTE 8. SHORT TERM LOANS
Term Loan
Short term loans primarily consist of the current portion of long term debt in amount of $2,493,973 and $808,976 for the years end December 31, 2017 and 2016.
NOTE 9. DEBT
Debt consisted of the following:
| December 31, 2017 | December 31, 2016 | |||||||
| RBL Capital Group, LLC | $ | 4,544,087 | $ | 4,044,056 | ||||
| Priority Payments Systems LLC | 2,238,511 | - | ||||||
| MBF Merchant Capital, LLC | 341,804 | 520,303 | ||||||
| Subtotal | 7,124,402 | 4,564,359 | ||||||
| Less Deferred loan costs | (106,980 | ) | (139,601 | ) | ||||
| Subtotal | 7,017,422 | 4,424,758 | ||||||
| Less Current portion | (2,493,973 | ) | (808,976 | ) | ||||
| Long term debt | $ | 4,523,449 | $ | 3,615,782 | ||||
RBL Capital Group, LLC
Effective June 30, 2014, TOT Group, Inc. and its subsidiaries as co-borrowers, TOT Payments, LLC, TOT BPS, LLC, TOT FBS, LLC, Process Pink, LLC, TOT HPS, LLC and TOT New Edge, LLC (collectively, the “co-borrowers”), entered into a Loan and Security Agreement (“Credit Facility”) with RBL Capital Group, LLC (“RBL”), as lender (the “RBL Loan Agreement”). The original terms provided us with an 18-month, $10 million credit facility with interest at the higher of 13.90% per annum or the prime rate plus 10.65%. Interest on drawn amounts outstanding after November 30, 2015 carry interest at an additional three percent per annum until repaid in full, with other amounts, obligations or payments due carrying an annual default rate not to exceed the lesser of (i) the prime rate plus 13% per annum and (ii) 18.635% per annum. On May 2, 2016, we renewed our Credit Facility with RBL, increasing the facility from $10 million to $15 million and extending the term through February 2019. At December 31, 2017 and 2016, we had $10,455,912 and $10,455,087 available under the Credit Facility, respectively.
| F-15 |
The co-borrowers’ obligations to RBL pursuant to the RBL Loan Agreement are secured by a first priority security interest in all of the co-borrowers’ tangible and intangible assets, including but not limited to their merchants, merchant contracts and proceeds thereof, and all right title and interest in co-borrowers’ processing contracts, contract rights, and portfolio cash flows with all processors of the co-borrowers.
As further described below, the following borrowings from the Credit Facility were converted into RBL term notes:
During July 2014, we entered into a $3,315,000 RBL term note. Net proceeds from the term note were used to repay a $3.0 million note previously due to MBF Merchant Capital, LLC (“MBF”) in addition to approximately $239,000 for working capital. The term note required interest-only payments at 13.90% interest through January 2015 commencing in August 2014 followed by monthly interest and principal payments of $90,421 through January 2019. The term note required payment of a 2% front-end fee due at issuance and a 4% back-end fee due at final payment. During 2016, Crede CG III, Ltd. (“Crede”) purchased $1,849,481 of the principal balance of this note held by RBL in various tranches. We repurchased and extinguished the purchased notes in exchange for 135,237 shares of our common stock. (See “Note 13 —Crede CG III, Ltd.”). During December 2016, the remaining balance of the term note was refinanced into another RBL term note.
During February 2015, we entered into a $400,000 RBL term note. The term note provided for interest-only payments at 13.9% through July 2015, with monthly interest and principal payments of $10,911 from August 2015 through July 2019. We paid $8,000 in costs related to this term note. The term note was purchased by Crede in various tranches during June 2016, which we repurchased and extinguished in exchange for 21,928 shares of our common stock.
During March 2015, we entered into a $250,000 RBL term note. The term note provided for interest-only payments at 13.9% through July 2015, with monthly interest and principal payments of $6,819 from August 2015 through July 2019. We paid $5,000 in costs related to this term note. This term note was purchased by Crede in May 2016, which we repurchased and extinguished in exchange for 9,174 shares of our common stock.
During May 2016, we entered into a $250,000 RBL term note. The term note provided for interest-only payments at 14.15% interest through October 2016, with monthly interest and principal payments of $6,850 from November 2016 through October 2020. The term note required payment of a 2% front-end fee at issuance and a 4% back-end fee due at the final payment. The outstanding balance of the term note was refinanced into another RBL term note during December 2016.
During May 2016, we entered into a $400,000 RBL term note. The term note provided for interest-only payments at 14.15% interest through November 2015, with monthly interest and principal payments of $10,961 from December 2016 through November 2020. The term note required payment of a 2% front-end fee at issuance and a 4% back-end fee due at the final payment. The outstanding balance of the term note was refinanced into another RBL term note during December 2016.
During June 2016, we entered into a $190,000 RBL term note. The term note provided for interest-only payments at 14.15% through December 20, 2016, with monthly interest and principal payments of $5,206 from January 2017 through December 2020. The term note requirement payment of a 2% front-end fee at issuance and a 4% back-end fee due at the final payment. The outstanding balance of the term note was refinanced into another RBL term note during December 2016.
During July 2016, we entered into a $350,000 RBL term note. The term note provided for interest-only payments at 14.15% through January 2017, with monthly interest and principal payments of $9,591 from February 2017 through January 2021. The term note requirement payment of a 2% front-end fee at issuance and a 4% back-end fee due at the final payment. The outstanding balance of the term note was refinanced into another RBL term note during December 2016.
During August 2016, we entered into a $400,000 RBL term note. The term note provided for interest-only payments at 14.15% through February 2017, with monthly interest and principal payments of $10,961 from March 2017 through February 2021. The term note required payment of a 2% front-end fee at issuance and a 4% back-end fee due at the final payment. The outstanding balance of the term note was refinanced into another RBL term note during December 2016.
During September 2016, we entered into a $350,000 RBL term note. The term note provided for interest-only payments at 14.15% through March 2017, with monthly interest and principal payments of $9,591 from April 2017 through March 2021. The term note required payment of a 2% front-end fee at issuance and a 4% back-end fee due at the final payment. The outstanding balance of the term note was refinanced into another RBL term note during December 2016.
During November 2016, we entered into a $350,000 RBL term note. The term note provided for interest-only payments at 14.15% through May 2017, with monthly interest and principal payments of $9,591 from June 2017 through May 2021. The term note required payment of a 2% front-end fee at issuance and a 4% back-end fee due at the final payment. The outstanding balance of the term note was refinanced into another RBL term note during December 2016.
During December 2016, we entered into a $325,000 RBL term note. The term note provided for interest-only payments at 14.15% through June 2017, with monthly interest and principal payments of $8,906 from July 2017 through June 2021. The term note required payment of a 2% front-end fee at issuance and a 4% back-end fee due at the final payment. The outstanding balance of the term note was refinanced into another RBL term note during December 2016.
During December 2016, we entered into a $4,044,055 RBL term note (the “Refinance note”). This note effectively refinanced all then-outstanding RBL notes described above. The term note provides for interest-only payments at 14.15% ($47,686) through May 2017, with monthly interest and principal payments of $110,814 from June 2017 through May 2021. The term note required payment of a $20,000 front-end refinancing fee at issuance and a $104,600 back-end fee due at the final payment. The outstanding balance of the term note was refinanced into another RBL term note during June 2017.
| F-16 |
During March 2017, we entered into a $100,000 RBL term note. The term note provided for interest-only payments at 14.4% May 2017, with monthly interest and principal payments of $2,753 from June 2017 through May 2021. The term note required payment of a 2% front-end fee at issuance and a 4% back-end fee due at final payment. The outstanding balance of the term note was refinanced into another RBL term note during June 2017.
During April 2017, we entered into a $400,000 RBL term note. The term note provided for interest-only payments at 14.4% through May 2017, with monthly interest and principal payments of $11,011 from June 2017 through May 2021. The term note required payment of a 2% front-end fee at issuance and a 4% back-end fee due at final payment. The outstanding balance of the term note was refinanced into another RBL term note during June 2017.
During April 2017, Crede purchased a $75,000 tranche of our RBL term note, which we repurchased and extinguished in exchange for 10,235 shares of our common stock. As a result, the terms of the $4,044,055 Refinance note was revised to reduce the monthly interest and principal payments to $108,759.
During May 2017, we entered into a $75,000 RBL term note. The term note provided for one interest-only payment at 14.4%, with monthly interest and principal payments of $2,065 from June 2017 through May 2021. The term note required payment of a 2% front-end fee at issuance and a 4% back-end fee due at final payment. The outstanding balance of the term note was refinanced into another RBL term note during June 2017.
During May 2017, Crede purchased a $150,000 tranche of our RBL term note, which we repurchased and extinguished in exchange for 23,058 shares of our common stock.
During May 2017, we entered into a $150,000 RBL term note. The term note provided for one interest-only payment at 14.4%, with monthly interest and principal payments of $4,129 from July 2017 through June 2021. The term note required payment of a 2% front-end fee at issuance and a 4% back-end fee due at final payment. The outstanding balance of the term note was refinanced into another RBL term note during June 2017.
During June 2017, the $4,044,055 Refinance note was modified to include the $150,000, $75,000, $400,000 and 100,000 term notes described above. The modified note provided for interest only payments at 14.19% from June 2017 through September 2017, with monthly payments of interest and principal of $124,607 from October 2017 through September 2021.
During July 2017, the Refinance note was further modified to reflect the $150,000 tranche extinguishment in May 2017, described above. The terms of the Refinance note was revised to reduce the monthly interest and principal payments to $121,810. During October 2017 we received a six-month extension to the interest-only payment term for a fee of $12,000. At December 31, 2017 the principal balance of the Refinance note was $4,438,087.
During August 2017, we entered into a $106,000 RBL term note. The term note provided for interest-only payments at 14.9% through September 2017, with monthly interest and principal payments of $2,945 from October 2017 through September 2021. The term note required payment of a 2% front-end fee at issuance and a 4% back-end fee due at final payment. During October 2017 we received a six-month extension of the interest-only payment term. At December 31, 2017, the principal balance of the term note is $106,000.
MBF Merchant Capital, LLC
We issued the following notes payable to MBF, an entity owned by William Healy, a former member of our Board of Directors.
During March 2016, we entered into a $75,000 promissory note with MBF. The promissory note provided for interest-only payments at 14% through May 2016, with monthly interest and principal payments of $7,990 from June 2016 through March 2017. The promissory note required payment of a 6% back-end fee which was paid at maturity in March 2017. The balance of the promissory note was $23,420 at December 31, 2016.
During April 2016, we entered into a $300,000 promissory note with MBF. The promissory note provides for interest-only payments at 15.5% through May 2016, with monthly interest and principal payments of $14,617 from June 2016 through May 2018. The promissory note requires payment of a 6% back-end fee due at the final payment. At December 31, 2017 and 2016, the balance of the note was $74,177 and $221,826, respectively.
During July 2016, our subsidiary, TOT Group, Inc., entered into a $353,500 promissory note with MBF. The promissory note provides for interest-only payments at 15.5% through June 28, 2016, with monthly interest and principal payments of $17,224 from July 2016 through June 28, 2018. The promissory note required payment of a 1% front-end fee at issuance and a 6.6% back-end fee due at final payment. At December 31, 2017 and 2016, the outstanding balance of the promissory note was $98,829 and $275,056, respectively.
On August 29, 2017, our subsidiary, TOT Group, Inc., entered into a $275,000 promissory note with MBF. The principal amount of the loan carries an interest rate 13.95% per annum, with ten monthly interest and principal payments of $29,289. The promissory note required payment of a 2% front-end fee at issuance and a 4% back-end fee due at final payment. At December 31, 2017, the outstanding balance of the promissory note was $168,798. .
Priority Payment Systems LLC
Effective as of May 18, 2017, we entered into a loan agreement and security agreement with Priority Payment Systems LLC (“PPS”) and issued a promissory note dated May 18, 2017. Pursuant to the loan agreement and the note, we borrowed $2,000,000. Prior to maturity of the loan, the principal amount of the loan will carry a floating interest rate of prime rate plus 6% per annum at 10.25% at December 31, 2017. We may prepay the loan in whole or in part at any time. The loan is repayable in monthly installments consisting of principal plus interest. The loan matures and becomes due and payable in full on May 20, 2019 to the extent not previously prepaid.
| F-17 |
Pursuant to the security agreement, the loan is secured by collateral consisting of accounts, cash or cash equivalents, residuals related to the merchants originated by us and processed by PPS. The loan agreement, the note and the security agreement contain customary representations, warranties, events of default, remedies and affirmative and negative covenants, as well as the right of first refusal and the right related to the merchants.
Effective as of May 17, 2017, we entered into a corporate guaranty in favor of PPS, pursuant to which we unconditionally guaranteed the full and prompt payment of each present and future liability, debt and obligation under the loan agreement, the note, the security agreement and other related documents.
On June 27, 2017, we entered into an amendment to the loan agreement with PPS pursuant to which:
| (i) | The original term loan was modified into a multi - draw loan with an increase of the borrowing limit to $2,500,000 and; | |
| (ii) | The loan maturity was extended to May 20, 2021. |
During the year ended December 31, 2017, we borrowed a total of $2,889,000 and repaid $650,489 in principal from our $2,500,000 Priority Payments multi – draw loan. At December 31, 2017, the balance of this loan is $2,238,511.
Scheduled Debt Principal Repayment
Scheduled principal maturities on indebtedness at December 31, 2017 is as follows:
| 2018 | 2,493,973 | |||
| 2019 | 1,764,245 | |||
| 2020 | 1,162,308 | |||
| 2021 | 1,338,621 | |||
| 2022 | 365,255 | |||
| Balance December 31, 2017 | $ | 7,124,402 |
NOTE 10. CONCENTRATIONS
The Company’s total revenue was $60,064,824 and $54,286,859 for the years ended December 31, 2017 and 2016, respectively.
Of the $60,064,824 in 2017 revenues, $58,723,928 (which also includes PayOnline Systems) was derived from processing of Visa®, MasterCard®, Discover® and American Express® card transactions and $1,340,896 was derived from providing branded content during 2017.
Of the $54,286,859 in 2016 revenues, $48,784,855 (which also includes PayOnline Systems) was derived from processing of Visa®, MasterCard®, Discover® and American Express® card transactions and $5,502,004 was derived from providing branded content during 2016.
The credit card processing revenues were from merchant customer transactions, which were processed primarily by one third-party processor and our own dedicated bin (greater than 5%) during 2017 and two third-party processors (greater than 5%) during 2016.
For the twelve months ended December 31, 2017, the Company processed 77% of its total revenue with Priority Data and (5.2%) from our own dedicated bin.
For the twelve months ended December 31, 2016, the Company processed 69% of its total revenue with Priority Data and 6% of its total revenue with National Processing Company (NPC).
Mobile electronic payment revenues generated from merchant customer transactions were not responsible for more than 5% of our sales during the year ended December 31, 2017. For the year ended December 31, 2016, the Company processed 4% of its total revenue with Mobile Internet Solutions and 3% of its total revenue with HelpLine.
NOTE 11. COMMITMENTS AND CONTINGENCIES
During December 2017, we entered into a letter of intent with Bunker Capital for the development of block chain based solutions. See note 17.
PayOnline Acquisition Commitments
On October 25, 2016, we entered into an amendment to the PayOnline acquisition agreement with the Sellers, in which we agreed to assume $1,433,475 of certain refundable merchant deposit reserves and we recorded a charge accordingly. During the year the ended December 31, 2017, we paid back $252,223 of this liability.
| F-18 |
Leases
North American Transaction Solutions
On May 10, 2013, we entered into a lease agreement, which is dated as of May 1, 2013, for approximately 4,101 square feet of office space located at 3363 N.E. 163rd Street, Suites 705 through 707, North Miami Beach, Florida 33160. The term of the lease agreement was from May 1, 2013 through December 31, 2016, with monthly rent increasing from $16,800 per month at inception to $19,448 per month (or $233,377 per year) for the period from January 1, 2016 through December 31, 2016.
On August 1, 2017, this lease was extended for a period of five years commencing August 1, 2017 and expiring July 31, 2022 with equal monthly base rent installments of $14,354 ($172,248 per year) plus sales tax. When the additional office space located in suite 805 become available, for approximately 1,375 square feet, the total monthly rent will increase to $20,535 (or $246,420 per year) until the end of the lease term.
NetLabs Systems, LLC, through its Russian representative office, currently leases 1,654 square feet of office space in Yekaterinburg, Russia, where we develop Value Added Services, Mobile Applications, Smart Terminals Applications, Sales Central ERP system development and Marketing activities, at annual rent of approximately $24,300. The current lease term expires on June 1, 2018.
International Transaction Solutions
PayOnline Systems leases approximately 4,675 square feet of a new office space in Moscow, Russia at an annual rent of $84,457. The current lease term for the office space expires on September 30, 2018.
PayOnline previously leased approximately 156 square feet of office space in Almaty, Kazakhstan at an annual rent of $1,527. The lease term expired on January 31, 2018 and was not renewed.
We believe that our current facilities are suitable and adequate for our present purposes, and we anticipate that we will be able to extend our existing leases on terms satisfactory to us or acquire new facilities on acceptable terms.
Future maturities of lease agreements are as follow:
| Year | $ Amount | |||
| 2018 | $ | 184,398 | ||
| 2019 | $ | 172,248 | ||
| 2020 | $ | 172,248 | ||
| 2021 | $ | 172,248 | ||
| 2022 | $ | 100,478 | ||
Litigation
Aptito.com, Inc.
On August 6, 2014, our subsidiary (Aptito, LLC) filed a lawsuit against Aptito.com, Inc. and the shareholders of Aptito.com, Inc., in state court in the 11th Judicial Circuit in and for Miami-Dade County. This is an interpleader action in regards to 12,500 shares of stock. Aptito, LLC acquired Aptito.com, Inc. in exchange for, among other things, 12,500 shares of Net Element, Inc. stock. There has been disagreement among the Aptito.com, Inc. shareholders as to proper distribution of the 12,500 shares. To avoid any liability in regards to improper distribution, Aptito, LLC filed the interpleader action so as to allow the defendants to litigate amongst themselves as to how the shares should be distributed. Aptito.com, Inc. opposed the motion to interplead and has filed counterclaims relative to Aptito, LLC non-delivery of the 12,500 shares. On February 10, 2017, the Court held a hearing on Aptito.com, Inc.’s motion to dismiss the complaint and Aptito, LLC and Net Element’s motion to dismiss Aptito.com, Inc.’s counterclaims. The Court denied Aptito.com, Inc.’s motion to dismiss and granted Aptito, LLC and Net Element’s motion to dismiss the counterclaims without prejudice.
On March 20, 2017, Aptito.com filed amended counterclaims against Aptito, LLC as well as claims against us alleging amongst other matters, breach of contract and violations of federal and state securities laws. Management believes that these counterclaims are without merit, and we and Aptito, LLC and the Company have filed a motion to dismiss the claims and a motion for sanctions. Counsel is waiting for a hearing date for determination on these matters.
A hearing on the motion to interplead was heard in July 2017 and the Court granted Aptito, LLC’s motion to interplead. Aptito.com, Inc. shareholders will now have to settle their internal dispute regarding this matter. Aptito, LLC still has potential liability of approximately $200,000 arising from an alleged delay in issuing the shares to Aptito.com, Inc. The company is disputing these allegations through the ongoing litigation process.
| F-19 |
Gene Zell
In June 2014, we, as plaintiff, commenced an action in the Miami-Dade Circuit Court, Florida against Gene Zell for defamation of our Company and CEO and tortious interference with our business relationships. In October 2014, the court granted a temporary injunction against Zell enjoining him from posting any information about our Company and CEO on any website and enjoining him from contacting our business partners or investors. Zell violated the Court Order and the Court granted a Motion imposing sanctions against Zell. We continue to seek enforcement of the Court Order. On April 13, 2015, Zell filed a Motion to set aside the Court Order alleging he was unaware of the Court Proceedings. The Court, on August 26, 2015, dismissed Zell’s Motion to dissolve the injunction. In March 2017, the Court dismissed another Motion brought by Zell to dissolve the injunction. Accordingly, the injunction order prohibiting Zell from making further defamatory posts remains in place. The Company continues to protect its rights by ongoing enforcement of the injunction.
Other Legal Proceedings
We also are involved in certain legal proceedings and claims which arise in the ordinary course of business. In our opinion, based on consultations with outside counsel, the results of any of these ordinary course matters, individually and in the aggregate, are not expected to have a material effect on our results of operations, financial condition, or cash flows. As more information becomes available, if management should determine that an unfavorable outcome is probable on such a claim and that the amount of such probable loss that it will incur on that claim is reasonably estimable, we will record a reserve for the claim in question. If and when we record such a reserve is recorded, it could be material and could adversely impact our results of operations, financial condition, and cash flows.
NOTE 12. RELATED PARTY TRANSACTIONS
We and our subsidiary, TOT Group, Inc., have entered into certain term loan notes with MBF. For additional information about such term loan notes, see “MBF Merchant Capital, LLC” in Note 9. William Healy, a former member of our Board of Directors, is the sole member of MBF.
During the twelve months ended December 31, 2017 and 2016, agent commissions resulting from merchant processing of $98,194 and $107,235, respectively, were paid to Prime Portfolios, LLC, an entity owned by Oleg Firer, our CEO, and Steven Wolberg, our Chief Legal Officer. In addition, a key member of management owned a company that received commissions of $40,247.
On March 1, 2017, we entered into a promissory note with Star Equities, LLC, an entity which our CEO is the managing member, in the principal amount of $348,083 (the “Star Equities Note”). The Star Equities Note provides for 18 monthly interest payments of $3,481 through September 30, 2018 followed by one interest and principle payment on October 1, 2018. The principal balance of the Star Equities Note outstanding bears interest at the rate of 12% per annum. On October 20, 2017, the Company entered into and consummated a letter agreement with Star Equities, LLC (the “Exchange Agreement”). Pursuant to the Exchange Agreement, the entire outstanding amount (including the principal amount of $348,083 and accrued and unpaid interest) of $374,253 under the Star Equities Note was exchanged into 67,312 restricted shares of Common Stock of the Company based on such shares’ consolidated closing bid price on The NASDAQ Stock Market on the date of the Exchange Agreement. Also see Note 13.
NOTE 13. STOCKHOLDERS’ EQUITY
On May 25, 2016 and October 5, 2017, we effected one-for-ten reverse stock splits of our common stock. Our condensed consolidated financial statements and disclosures reflect these changes in capital structure for all periods presented.
On June 12, 2015 and June 13, 2016, our shareholders approved 100,000,000 increases in our authorized common stock to 300,000,000 and 400,000,000, respectively. On October 2, 2017, our shareholders approved a 300,000,000 decrease in our authorized common stock to 100,000,000.
Agreement with Cobblestone
On July 5, 2017, the Company entered into a common stock purchase agreement (the “Cobblestone Purchase Agreement”) with Cobblestone Capital Partners LLC (“Cobblestone Capital”) which provides that, upon the terms and subject to the conditions and limitations set forth therein, Cobblestone Capital was committed to purchase up to an aggregate of $10 million of shares of our common stock over the 30-month term of the Cobblestone Purchase Agreement. In consideration for entering into the Cobblestone Purchase Agreement, the Company was obligated to issue to Cobblestone Capital such number of shares of common stock that would have a value equivalent to $200,000 calculated using the average of volume weighted average price for the common stock during the 3 trading days period immediately preceding the date of issuance of such shares. Accordingly, on August 3, 2017, the Company issued to Cobblestone Capital 45,676 shares of common stock based on a price of $4.38 per share.
| F-20 |
In connection with the Cobblestone Purchase Agreement, we issued the following shares of our common stock to Cobblestone during 2017:
| NUMBER OF | PURCHASE | Share | ||||||||||
| DATE | SHARES | AMOUNT | Price | |||||||||
| 8/16/2017 | 19,742 | $ | 72,000 | $ | 3.65 | |||||||
| 9/13/2017 | 19,679 | $ | 54,000 | $ | 2.74 | |||||||
| 9/15/2017 | 39,723 | $ | 109,000 | $ | 2.74 | |||||||
| 9/18/2017 | 40,000 | $ | 160,000 | $ | 4.00 | |||||||
| 9/25/2017 | 60,000 | $ | 277,500 | $ | 4.63 | |||||||
| 9/28/2017 | 30,000 | $ | 210,000 | $ | 7.00 | |||||||
| 9/29/2017 | 25,000 | $ | 175,000 | $ | 7.00 | |||||||
| 10/3/2017 | 50,000 | $ | 350,000 | $ | 7.00 | |||||||
| 10/5/2017 | 50,000 | $ | 300,000 | $ | 6.00 | |||||||
| 10/16/2017 | 95,789 | $ | 455,000 | $ | 4.75 | |||||||
| 10/24/2017 | 414 | $ | 1,857 | $ | 4.49 | |||||||
| 11/27/2017 | 65,560 | $ | 250,000 | $ | 3.81 | |||||||
| 12/11/2017 | 77,453 | $ | 300,000 | $ | 3.87 | |||||||
| 12/11/2017 | 77,453 | $ | 300,000 | $ | 3.87 | |||||||
| 12/12/2017 | 129,089 | $ | 500,000 | $ | 3.87 | |||||||
| 12/20/2017 | 140,000 | $ | 700,000 | $ | 5.00 | |||||||
| 12/26/2017 | 150,000 | $ | 750,000 | $ | 5.00 | |||||||
| 12/27/2017 | 100,000 | $ | 500,000 | $ | 5.00 | |||||||
| 12/28/2017 | 146,767 | $ | 733,835 | $ | 5.00 | |||||||
| TOTAL | 1,316,670 | $ | 6,198,192 | $ | 4.71 | |||||||
Equity Incentive Plan Activity
On December 5, 2013, our shareholders approved the Net Element International, Inc. 2013 Equity Incentive Plan (the “2013 Plan”). Awards under the 2013 Plan may be granted in any one or all of the following forms: (i) incentive stock options meeting the requirements of Section 422 of the Internal Revenue Code of 1986, as amended; (ii) non-qualified stock options (unless otherwise indicated, references to “Options” include both Incentive Stock Options and Non-Qualified Stock Options); (iii) stock appreciation rights, which may be awarded either in tandem with Options or on a stand-alone basis; (iv) shares of common stock that are restricted; (v) units representing shares of common stock; (vi) units that do not represent shares of common stock but which may be paid in the form of common stock; and (vii) shares of common stock that are not subject to any conditions to vesting. The maximum aggregate number of shares of common stock available for award under the 2013 Plan at December 31, 2017 and December 31, 2016 were 240,996 and 128,026, respectively. The 2013 Plan is administered by the compensation committee.
2013 Equity Incentive Plan - Unrestricted Shares and Stock Options
During the twelve months ended December 31, 2017 and 2016, we issued common stock pursuant to the Net Element International, Inc. 2013 Equity Incentive Plan (as amended, the “2013 Plan”) to the members of our Board of Directors and recorded compensation charges of $130,499 and $7,363, respectively.
On June 13, 2016, we issued 47,500 shares of our common stock to named executives as additional compensation. We recorded a compensation charge of $1,007,000 for the fair value of shares provided.
In September, 2016, we issued 7,031 shares as incentive compensation to employees and recorded a non-cash compensation charge of $532,701.
On April 12, 2016, the compensation committee of the Board of Directors rescinded previously granted incentive stock options to purchase approximately 1.6 million shares of our common stock, as the amounts granted were inadvertently in excess of individual grant limitations set forth in the 2013 Plan documents.
On June 13, 2016, we issued 18,241 incentive stock options pursuant to the 2013 Plan to key management. The option strike price is $21.20 and the term of the option is 10 years. We recorded a non-cash compensation charge of $386,705 in connection with this issuance.
On February 28, 2017, the Compensation Committee of our Board of Directors approved and authorized grants of the following equity awards to our employees and consultants of the Company pursuant to our 2013 Equity Incentive Compensation Plan, as amended:
| (i) | 45,105 qualified options to acquire shares of our common stock (50% of such options vesting immediately and the balance 50% of such options vesting in 4 equal proportions quarterly after the grant date) and |
| (ii) | 62,668 restricted shares of our common stock (50% of such shares vesting immediately and the balance 50% of such shares vesting in 4 equal proportions quarterly after the grant date). |
| F-21 |
On December 28, 2017, the Compensation Committee of our Board of Directors approved and authorized grants for 134,161 fully vested, incentive equity awards to our employees, directors and consultants pursuant to our 2013 Equity Incentive Compensation Plan, as amended.
At December 31, 2017, we had 74,004 incentive stock options outstanding with a weighted average exercise price of $15.50 and a weighted average remaining contract term of 8.77 years. At December 31, 2016, we had 33,396 incentive stock options outstanding with a weighted average exercise price of $26.00 and a weighted average remaining contract term of 9.18 years. All of the stock options were anti-dilutive at December 31, 2017 and 2016.
Crede CG III, Ltd.
On May 2, 2016, we entered into a Master Exchange Agreement with Crede (the “Master Exchange Agreement”), an entity that purchased a portion our previously issued notes held by RBL described above. Pursuit to the Master Exchange Agreement, we have the right to request that Crede exchange up to $3,965,000 of the RBL promissory notes for shares of our common stock. On March 3, 2017, we entered into an Amendment to Master Exchange Agreement with Crede, which extended the expiration date of the Master Exchange Agreement from December 31, 2016 to August 31, 2017. Accordingly, this extends the time to which we have the right to request Crede to exchange RBL promissory notes for shares of the Company’s common stock on the terms and conditions set forth in the Master Exchange Agreement.
For the year ended December 31, 2017, we exchanged 60,944 shares of our common stock with Crede for an aggregate of $330,969 of the original $3,315,000 RBL promissory note partially purchased by Crede, based on an average per share exchange price of $6.83. The exchange included a non-cash exchange premium $52,972.
For the year ended December 31, 2016, we exchanged 166,340 shares of our common stock with Crede for an aggregate of $2,499,481 of RBL promissory notes, including the full exchange of the $400,000 promissory note (originally entered into February 10, 2015) and $250,000 promissory note (originally entered into March 27, 2015), and the partial exchange for $1,849,481 of the $3,315,000 promissory note (originally entered July 17, 2014). These notes were purchased by Crede for an average per share exchange price of $16.80. The exchanges also settled current interest and loan fees of $302,294 and a non-cash exchange premium of $487,064.
Other Stock Issuance
On January 25, 2016, we issued 4,257 shares of our common stock in connection with the earn-out provisions of our acquisition of PayOnline.
Pursuant to the earn-out installment provisions of the PayOnline purchase agreement, we issued an additional 13,082 shares of our common stock and paid $108,583 in March 2017.
On August 15, 2016, we issued 9,569 shares of our common stock and recorded a $200,000 charge in connection with the Orkin litigation settlement.
On July 19, 2017, we issued 30,759 shares for a $252,223 partial settlement of our $1.4 million reserve liability assumed with the PayOnline acquisition.
On February 28, 2017, the Compensation Committee of our board of directors awarded to Oleg Firer, our Chief Executive Officer, 47,139 restricted shares of our common stock as performance bonus subject to shareholder approval. The share award was made outside the 2013 Plan and these shares were issued in October 2017 following shareholder approval. In addition, the Committee approved a $300,000 discretionary cash performance bonus to Oleg Firer which was paid in March, 2018 (Note 17 - See Subsequent Events).
On October 20, 2017, we entered into, and consummated the transactions contemplated by, the Exchange Agreement. Pursuant to the Exchange Agreement, the entire outstanding amount (including the principal amount of $348,083 and accrued and unpaid interest) of $374,253 under the Star Equities note was exchanged into 67,312 restricted shares of Common Stock of the Company.
Agreements with ESOUSA Holdings
On July 6, 2016, we entered into a common stock purchase agreement (“Purchase Agreement”), with ESOUSA Holdings, LLC, a New York limited liability company (“ESOUSA”), which provides that ESOUSA is committed to purchase up to an aggregate of $10 million of our shares of common stock over the 30-month term of the Purchase Agreement. In consideration for entering into the Purchase Agreement, we paid shares of our common stock with a value equivalent $200,000 as a commitment fee to ESOUSA. The number of shares was calculated using the average of volume weighted average price for our common stock during the 3 trading day period immediately preceding the date of issuance of such shares. Accordingly, on August 31, 2016, we issued 13,117 shares of our common stock to ESOUSA based on the price of $15.25 per share.
In connection with the ESOUSA Purchase Agreement, we issued the following shares of our common stock to ESOUSA during 2016 and 2017:
| NUMBER OF | PURCHASE | Share | ||||||||||
| SHARES | AMOUNT | Price | ||||||||||
| 9/15/2016 | 45,455 | $ | 500,000 | $ | 11.00 | |||||||
| 10/25/2016 | 9,434 | $ | 100,000 | $ | 10.60 | |||||||
| 1/19/2017 | 24,096 | $ | 200,000 | $ | 8.30 | |||||||
| 1/25/2017 | 17,647 | $ | 150,000 | $ | 8.50 | |||||||
| 2/8/2017 | 116,144 | $ | 1,000,000 | $ | 8.61 | |||||||
| 3/23/2017 | 10,379 | $ | 87,132 | $ | 8.40 | |||||||
| Total | 223,155 | $ | 2,037,132 | |||||||||
| F-22 |
On December 29, 2017, we entered into, and consummated a unit purchase agreement with ESOUSA. Pursuant to the unit purchase agreement, the Company sold to ESOUSA (i) 350,553 shares of our common stock, par value $0.0001, at a purchase price of $11.12 per share (i.e., a price equal to the our consolidated closing bid price per share as reported by the Nasdaq); (ii) an aggregate of 404,676 five-year warrants to purchase shares of our common stock at a purchase price of $0.125 per share and exercise price of $11.12 per share; and (iii) an aggregate of 323,907 five-year pre-paid warrants to purchase shares of our common stock with exercise price of $0.01 per share. The aggregate purchase price for the securities was $7,550,585.
NOTE 14. WARRANTS AND OPTIONS
At December 31, 2017 the Company has fully vested options outstanding to purchase 234,219 shares of common stock at exercise prices ranging from $8.10 to $134.00 per share.
In February 28, 2017, the Company granted options to acquire 45,106 shares of common stock at an exercise price of $8.10 per share over a 10-year term. For 2016, the Company granted 18,241 incentive plan options at an exercise price of $21.20 per share over a 10-year term. We also granted 46,643 options outside the plan in connection with an equity raise with an exercise price of $21.46 per share over a 5-year term.
Due to the high level of volatility in the stock price of the Company’s common stock, the Company determined the grant date fair value of the options granted during the years ended December 31, 2017 and 2016 using the then quoted stock price at the grant date.
The following is a summary of the Company’s stock option activity:
| Stock Option Activity | ||||
| Outstanding at December 31, 2015 | 146,437 | |||
| Granted | 64,884 | |||
| Expired | (17,711 | ) | ||
| Outstanding at December 31, 2016 | 193,610 | |||
| Granted | 45,106 | |||
| Expired | (4,497 | ) | ||
| Outstanding at December 31, 2017 | 234,219 |
The following table summarizes stock option information at December 31, 2017:
| Exercise Price | Outstanding & Exercisable | Remaining Contractual Life (Years) | ||||||||
| $ | 134.00 | 1,021 | 6.94 | |||||||
| $ | 24.00 | 11,434 | 7.93 | |||||||
| $ | 21.20 | 18,241 | 8.45 | |||||||
| $ | 8.10 | 43,310 | 9.17 | |||||||
| $ | 22.00 | 113,572 | 2.70 | |||||||
| $ | 21.46 | 46,643 | 3.45 | |||||||
Warrants
In 2013, our predecessor entity (then known as Cazador Acquisition Corporation Ltd.) issued warrants to purchase 89,400 shares (reverse split adjusted) of common stock in connection with its private placement and initial public offering (the “Prior Warrants”). These Prior Warrants expired on October 1, 2017 and were “out-of-the-money” and had no intrinsic value at December 31, 2016.
As noted above, pursuant to the unit purchase agreement with ESOUSA, on December 29, 2017 we issued (i) an aggregate of 404,676 five-year warrants to purchase shares of Company common stock at a purchase price of $0.125 per share and exercise price of $11.12 per share; and (ii) an aggregate of 323,907 five-year pre-paid warrants to purchase shares of Company common stock with an exercise price of $0.01 per share.
At December 31, 2017 and December 31, 2016, we had warrants outstanding to purchase 728,583 and 89,389 shares of common stock. At December 31, 2017, the warrants had a weighted average exercise price of $6.20 per share purchased and a weighted average remaining contractual term of 5.0 years. At December 31, 2016, the warrants had a weighted average exercise price of $750.00 per share purchased and a weighted average remaining contractual term of 0.75 years.
The following is a summary of the Company’s warrant activity:
| F-23 |
| Warrant Activity | ||||
| Outstanding at December 31, 2015 | 89,389 | |||
| Granted | - | |||
| Expired | - | |||
| Outstanding at December 31, 2016 | 89,389 | |||
| Granted | 728,583 | |||
| Expired | (89,389 | ) | ||
| Outstanding at December 31, 2017 | 728,583 | |||
The following table summarizes warrant information at December 31, 2017:
| Exercise Price | Outstanding & Exercisable | Remaining Contractual Life (Years) | ||||||||
| $ | 11.12 | 404,676 | 5.00 | |||||||
| $ | 0.01 | 323,907 | 5.00 | |||||||
Non-Incentive Plan Options
At December 31, 2017, we had 160,214 non-incentive options outstanding with a weighted-average exercise price of $21.80 and a remaining contract term of 2.92 years. At December 31, 2016, we had 160,214 non-incentive options outstanding with a weighted-average exercise price of $21.80 and a remaining contract term of 3.92 years. These options were out of the money at December 31, 2017 and 2016 and had no intrinsic value.
NOTE 15. INCOME TAXES
The components of income (loss) before income tax provision are as follows:
| December 31, | December 31, | |||||||
| 2017 | 2016 | |||||||
| United States | $ | (7,865,421 | ) | $ | (11,615,285 | ) | ||
| Foreign | (2,157,628 | ) | (2,000,791 | ) | ||||
| $ | (10,023,049 | ) | $ | (13,616,076 | ) | |||
There was no current U.S. income tax or deferred income tax provision for years ended December 31, 2017 and December 31, 2016. There were current foreign tax provisions of $70,033 and $49,375 for the years ended December 31, 2017 and December 31, 2016 respectively.
The following is a reconciliation of the effective income tax rate with the U.S. federal statutory income tax rate at:
| December 31, | December 31, | |||||||
| 2017 | 2016 | |||||||
| U. S. Federal statutory income tax rate | 34.0 | % | 34.0 | % | ||||
| State income tax, net of federal tax benefit | 4.1 | % | 4.1 | % | ||||
| Currency translation adjustment | -2.2 | % | -0.9 | % | ||||
| Foreign income tax | -0.9 | % | -0.4 | % | ||||
| Difference in foreign tax rates | 5.2 | % | 3.4 | % | ||||
| Change in valuation allowance | -28.9 | % | -40.5 | % | ||||
| Change in tax rates | -12.2 | % | 0 | % | ||||
| Effective income tax rate | -0.9 | % | -0.4 | % | ||||
The effective tax rate on operations of -0.9% at December 31, 2017 varied from the statutory rate of 34%, primarily due to the permanent difference related to difference in foreign tax rates and the increase in our valuation allowance. The effective rate on operations of -0.4% at December 31, 2016 varied from the statutory rate of 34% primarily due to dividends paid on preferred stock, stock based compensation and the increase in our valuation allowance.
On December 22, 2017, President Trump signed into law the “Tax Cuts and Jobs Act” (TCJA) that significantly reformed the Internal Revenue Code of 1986, as amended. The TCJA reduces the corporate tax rate to 21 percent beginning with years starting January 1, 2018. Because a change in tax law is accounted for in the period of enactment, the deferred tax assets and liabilities have been adjusted to the newly enacted U.S. corporate rate, and the related impact to the tax expense has been recognized in the current year.
| F-24 |
Significant components of our deferred tax assets and liabilities are as follows:
| December 31, | December 31, | |||||||
| 2017 | 2016 | |||||||
| Deferred tax assets: | ||||||||
| Net operating loss carry forwards | $ | 14,800,451 | $ | 19,556,555 | ||||
| Stock based compensation | 741,275 | 906,087 | ||||||
| Basis difference in goodwill | 1,471,976 | 2,604,306 | ||||||
| Basis difference in fixed assets | 8,792 | 19,899 | ||||||
| Basis difference in intangible assets | 1,313,547 | 1,714,761 | ||||||
| Allowance for bad debt (US) | - | - | ||||||
| Stock price guarantee adjustment | - | 1,416,870 | ||||||
| Valuation allowance for deferred tax assets | (18,336,041 | ) | (26,218,478 | ) | ||||
| Total deferred tax assets | - | - | ||||||
| Deferred tax liabilities: | ||||||||
| Basis difference in goodwill | - | - | ||||||
| Basis difference in fixed assets | - | - | ||||||
| Basis difference in intangible assets | - | - | ||||||
| Total deferred tax liabilities | - | - | ||||||
| Net deferred taxes | $ | - | $ | - | ||||
Deferred income taxes reflect the net tax effects of temporary differences between the carrying amounts of assets and liabilities for financial reporting purposes and the amounts of assets and liabilities used for income tax purposes. At December 31, 2017, we had cumulative federal and state net operating losses (“NOLs”) carry forwards of approximately $56.8 million. At December 31, 2016, we had cumulative federal and state NOLs carry forwards of approximately $51.4 million. We also have $14.0 million and $10.4 million in foreign NOLs as of December 31, 2017 and 2016, respectively. The valuation allowance was increased by $7.9 million in fiscal year 2017. The fiscal 2017 increase was primarily related to additional operating loss incurred, and difference in tax and book basis of goodwill and other intangible assets. We have considered all the evidence, both positive and negative, that the NOLs and other deferred tax assets may not be realized and have recorded a valuation allowance for $26.7 million. The federal NOLs begin to expire in December 2025 while the foreign NOLs begin to expire in 2023.
The timing and manner in which we will be able to utilize some of its NOLs is limited by Section 382 of the Internal Revenue Code of 1986, as amended (IRC). IRC Section 382 imposes limitations on a corporation’s ability to use its NOLs when it undergoes an “ownership change.” Generally, an ownership change occurs if one or more shareholders, each of whom owns 5% or more in value of a corporation’s stock, increase their percentage ownership, in the aggregate, by more than 50% over the lowest percentage of stock owned by such shareholders at any time during the preceding three-year period. Because on June 10, 2014, we underwent an ownership change as defined by IRC Section 382, the limitation applies to us. The losses generated prior to the ownership change date (pre-change losses) are subject to the Section 382 limitation. The pre-change losses may only become available to be utilized by the Company at the rate of $2.4 million per year. Any unused losses can be carried forward, subject to their original carryforward limitation periods. In the year 2017, approximately $2.4 million in the pre-change losses was released from the Section 382 loss limitation. The Company can still fully utilize the NOLs generated after the change of the ownership, which was approximately $16.5 million. Thus, the total of approximately $20.6 million as of December 31, 2017 is available to offset future income.
The open United States tax years subject to examination with respect to the Company’s operations are 2015, 2015 and 2016.
NOTE 16. SEGMENT INFORMATION
Prior to the fourth quarter of 2017, we had three reportable business segments: (i) North American Transaction Solutions for electronic commerce, (ii) Mobile Solutions (primary Russian Federation and CIS) and (iii) Online Solutions. Management determines the reportable segments based on the internal reporting used by our Chief Operating Decision Maker to evaluate performance and to assess where to allocate resources.
Factors management used to identify the entity’s reportable segments. The increase growth in our North American Transactions Solutions segment and the consolidation of our mobile solutions business with our online solutions business has changed how management evaluates performance and allocates resources. We now have two reportable business segments (i) North American Transaction Solutions and (ii) International Transaction Solutions.
| F-25 |
The Company’s reportable segments are business units that offer different products and services in different geographies. The reportable segments are each managed separately because they offer distinct products, in distinct geographic locations, with different delivery and service processes.
North America Transaction Solutions
Our US payment processing business segment consists of the former Unified Payments business and Aptito. This segment operates primarily in North America. In March 2013, we acquired all of the business assets of Unified Payments, a provider of comprehensive turnkey, payment processing solutions to small and medium size business owners (merchants) and independent sales organizations across the United States.
In April 2013, we purchased 80% of Aptito, a cloud based Software-as-a-Service (“SaaS”) restaurant management solution, which provides integrated POS, mPOS, Kiosk, Digital Menus functionality to drive consumer engagement via Apple® iPad®-based POS, kiosk and all other cloud-connected devices.
International Transaction Solutions
Our Russian mobile and online payment processing segment consists of PayOnline and Digital Provider which operate primarily in Russia.
PayOnline, includes a protected payment processing system to accept bank card payments for goods and services.
In June 2012, we formed our subsidiary, OOO TOT Money to develop a business in mobile commerce payment processing. TOT Money launched its initial operations in Russia as a payment facilitator using SMS (short message services, which is a text messaging service) and MMS (multimedia message services) for mobile phone subscribers in Russia. During 2015, we changed or business model, rebranded our name to Digital Provider, and began to offer branded content to subscribers.
Segment Summary Information
Geographic Summary Information
2017 Revenues | 2017 Long-Lived Assets | 2016 Revenues | 2016 Long-Lived Assets | |||||||||||||
| North America | $ | 51,138,327 | $ | 9,778,888 | $ | 42,130,901 | $ | 9,468,105 | ||||||||
| Russia and CIS | 8,926,497 | 3,511,403 | 12,155,957 | 4,625,602 | ||||||||||||
The following tables present financial information of the Company’s reportable segments at December 31, 2017. The “corporate and eliminations” column includes all corporate expenses and intercompany eliminations for consolidated purposes.
| Twelve months ended December 31, 2017 | North America Transaction Solutions | International Transaction Solutions | CORP EXP & ELIMS | Total | ||||||||||||
| Net revenues | $ | 51,138,327 | $ | 8,926,497 | $ | - | 60,064,824 | |||||||||
| Cost of revenues | 44,265,264 | 6,971,948 | - | 51,237,212 | ||||||||||||
| Gross Margin | 6,873,063 | 1,954,549 | - | 8,827,612 | ||||||||||||
| Gross margin % | 13 | % | 22 | % | 0 | % | 15 | % | ||||||||
| General, administrative, and asset disposal | 3,281,547 | 3,033,360 | 4,314,866 | 10,629,773 | ||||||||||||
| Non-cash compensation | - | - | 2,940,424 | 2,940,424 | ||||||||||||
| Provision (recovery) for bad debt | 1,408,908 | (89,260 | ) | 1,200 | 1,320,848 | |||||||||||
| Depreciation and amortization | 1,480,603 | 1,053,382 | - | 2,533,985 | ||||||||||||
| Interest expense (income), net | 997,429 | -34,776 | 226,969 | 1,189,622 | ||||||||||||
| Other expenses (income) | 48,549 | 178,576 | 8,884 | 236,009 | ||||||||||||
| Net (loss) income for segment | (343,973 | ) | (2,186,733 | ) | (7,492,343 | ) | (10,023,049 | ) | ||||||||
| Segment assets | 28,235,321 | 4,096,109 | - | 32,331,430 | ||||||||||||
| F-26 |
| Twelve months ended December 31, 2016 | North
America Transaction Solutions | International
Transaction Solutions | CORP
EXP & ELIMS | Total | ||||||||||||
| Net revenues | $ | 42,130,901 | 12,155,958 | $ | - | 54,286,859 | ||||||||||
| Cost of revenues | 36,342,465 | 9,365,776 | - | 45,708,241 | ||||||||||||
| Gross Margin | 5,788,436 | 2,790,182 | - | 8,578,618 | ||||||||||||
| Gross margin % | 14 | % | 23 | % | - | 16 | % | |||||||||
| General, administrative, and asset disposal | 2,603,329 | 2,768,116 | 3,426,438 | 8,797,883 | ||||||||||||
| Non-cash compensation | - | - | 3,463,435 | 3,463,435 | ||||||||||||
| Provision (recovery) for bad debt | 1,173,815 | 513,922 | 500 | 1,688,237 | ||||||||||||
| Depreciation and amortization | 1,201,268 | 1,896,987 | 368,256 | 3,466,511 | ||||||||||||
| Interest expense (income), net | 555,212 | 23,412 | 885,209 | 1,463,833 | ||||||||||||
| Loss from stock value guarantee | - | - | 3,722,142 | 3,722,142 | ||||||||||||
| Other expenses (income) | 4,118 | (411,465 | ) | - | (407,346 | ) | ||||||||||
| Net (loss) income for segment | 250,694 | (2,000,790 | ) | (11,865,981 | ) | (13,616,076 | ) | |||||||||
| Segment assets | 14,794,400 | 7,810,814 | 564,853 | 23,170,067 | ||||||||||||
| Twelve months ended December 31, 2016 | North America Transaction Solutions | Mobile Solutions | Online Solutions | Corporate Expenses & Eliminations | Total | |||||||||||||||
| Net revenues | $ | 42,130,901 | $ | 5,933,281 | $ | 6,222,677 | $ | - | $ | 54,286,859 | ||||||||||
| Cost of revenues | 36,342,465 | 5,287,960 | 4,077,816 | - | 45,708,241 | |||||||||||||||
| Gross Margin | 5,788,436 | 645,321 | 2,144,860 | - | 8,578,618 | |||||||||||||||
| Gross margin % | 14 | % | 11 | % | 34 | % | - | 16 | % | |||||||||||
| General, administrative, and asset disposal | 2,603,329 | 20,924 | 2,003,388 | 4,170,242 | 8,797,883 | |||||||||||||||
| Non-cash compensation | - | - | - | 3,463,435 | 3,463,435 | |||||||||||||||
| Provision (recovery) for bad debt | 1,173,815 | 511,772 | 2,760 | (109 | ) | 1,688,237 | ||||||||||||||
| Depreciation and amortization | 1,201,268 | 18,970 | 1,837,709 | 408,564 | 3,466,511 | |||||||||||||||
| Interest expense (income), net | 555,212 | (42,760 | ) | (28,670 | ) | 980,051 | 1,463,833 | |||||||||||||
| Loss from stock value guarantee | - | - | - | 3,722,142 | 3,722,142 | |||||||||||||||
| Other expenses (income) | 4,118 | (446,592 | ) | 32,950 | 2,179 | (407,346 | ) | |||||||||||||
| Net (loss) income for segment | $ | 250,694 | $ | 583,008 | $ | (1,703,278 | ) | $ | (12,746,503 | ) | $ | (13,616,077 | ) | |||||||
| Segment assets | $ | 14,794,400 | $ | 2,685,673 | $ | 5,125,140 | $ | 564,853 | $ | 23,170,067 | ||||||||||
NOTE 17. SUBSEQUENT EVENTS
During December 2017 we entered into a letter of intent, with Bunker Capital for the development of block-chain technology-based solutions, and we made a prepayment of 19,000 shares of our common stock. On February 26, 2018, we terminated the relationship with Bunker Capital as the parties did not reach a definitive agreement, and, as part of such termination, we asked Bunker Capital to return such shares of the Company’s common stock. At this time, we do not know whether and how many shares will be returned.
We continue to work on the business plan and technology schematics for such block-chain technology-based solution as part of its Netevia platform utilizing its internal team of software engineers while continuing to assess the technical resources required to implement the Company’s strategic initiatives in this regard.
On March 8, 2018, we paid our CEO the previously approved discretionary bonus of $300,000.
During the first quarter of 2018, we extended the term of our $15,000,000 Credit Facility with RBL to February 2019.
| F-27 |
EXHIBIT INDEX
| 52 |
| 53 |
| 54 |
| 55 |
| 56 |
| 57 |
| 58 |
# Indicates management contract or compensatory plan or arrangement.
* Filed herewith.
| 59 |