Attached files
| file | filename |
|---|---|
| EX-31.1 - EXHIBIT 31.1 - Harvest Capital Credit Corp | exhibit31112312017.htm |
| EX-32.2 - EXHIBIT 32.2 - Harvest Capital Credit Corp | exhibit32212312017.htm |
| EX-32.1 - EXHIBIT 32.1 - Harvest Capital Credit Corp | exhibit32112312017.htm |
| EX-31.2 - EXHIBIT 31.2 - Harvest Capital Credit Corp | exhibit31212312017.htm |
| EX-12.1 - EXHIBIT 12.1 - Harvest Capital Credit Corp | exhibit121123117.htm |
| EX-10.18 - EXHIBIT 10.18 - Harvest Capital Credit Corp | exhibit1018-harvestxpledge.htm |
| EX-10.17 - EXHIBIT 10.17 - Harvest Capital Credit Corp | exhibit1017-harvestxsixtha.htm |
UNITED STATES
SECURITIES AND EXCHANGE COMMISSION
WASHINGTON, D.C. 20549
FORM 10-K
☑ | ANNUAL REPORT PURSUANT TO SECTION 13 OR 15(d) OF THE SECURITIES EXCHANGE ACT OF 1934 For the fiscal year ended December 31, 2017 |
OR
☐ | TRANSITION REPORT PURSUANT TO SECTION 13 OR 15(d) OF THE SECURITIES EXCHANGE ACT OF 1934 |
COMMISSION FILE NUMBER: 1-35906
HARVEST CAPITAL CREDIT CORPORATION
(Exact name of registrant as specified in its charter)
Delaware (State of Incorporation) | 46-1396995 (I.R.S. Employer Identification Number) |
767 Third Avenue, 29th Floor New York, NY (Address of principal executive offices) | 10017 (Zip Code) |
Registrant’s telephone number, including area code: (212) 906-3589
Securities registered pursuant to Section 12(b) of the Act:
Title of Each Class | Name of Each Exchange on Which Registered |
Common Stock, par value $0.001 per share | NASDAQ Global Market |
6.125% Notes due 2022 | NASDAQ Global Market |
Securities registered pursuant to Section 12(g) of the Act: None
Indicate by check mark if the registrant is a well-known seasoned issuer, as defined in Rule 405 of the Securities Act. Yes ☐ No ☑.
Indicate by check mark if the registrant is not required to file reports pursuant to Section 13 or Section 15(d) of the Act. Yes ☐ No ☑.
Indicate by check mark whether the Registrant (1) has filed all reports required to be filed by Section 13 or 15(d) of the Securities Exchange Act of 1934 during the preceding 12 months (or for such shorter period that the Registrant was required to file such reports), and (2) has been subject to such filing requirements for the past 90 days. Yes ☑ No ☐.
Indicate by check mark whether the registrant has submitted electronically and posted on its corporate Web site, if any, every Interactive Data File required to be submitted and posted pursuant to Rule 405 of Regulation S-T (§232.405 of this chapter) during the preceding 12 months (or for such shorter period that the registrant was required to submit and post such files). Yes ☐ No ☐
Indicate by check mark if disclosure of delinquent filers pursuant to Item 405 of Regulation S-K is not contained herein, and will not be contained, to the best of Registrant’s knowledge, in definitive proxy or information statements incorporated by reference in Part III of this Form 10-K or any amendment to this Form 10-K. ¨
Indicate by check mark whether the registrant is a large accelerated filer, an accelerated filer, a non-accelerated filer, or a smaller reporting company. See definition of “accelerated filer,” “large accelerated filer” and “smaller reporting company” in Rule 12b-2 of the Exchange Act. (Check one):
Large accelerated filer | ¨ | Accelerated filer | þ | |
Non-accelerated filer | ¨ | Smaller reporting company | ¨ | |
Emerging growth company | þ | |||
(Do not check if a smaller reporting Company) | ||||
Indicate by check mark whether the registrant is a shell company (as defined in Rule 12b-2 of the Act). Yes ☐ No ☑.
The aggregate market value of the Registrant’s common stock held by non-affiliates of the Registrant as of June 30, 2017, was approximately $66.1 million based upon the last sale price for the Registrant’s common stock on that date.
There were 6,401,175 shares of the Registrant’s common stock outstanding as of March 29, 2018.
Documents Incorporated by Reference
Portions of the Registrant’s definitive Proxy Statement relating to the Registrant’s 2018 Annual Meeting of Stockholders, to be filed with the Securities and Exchange Commission within 120 days following the end of the Company’s fiscal year, are incorporated by reference in Part III of this Annual Report on Form 10-K as indicated herein.
1
HARVEST CAPITAL CREDIT CORPORATION
FORM 10-K FOR THE FISCAL YEAR
ENDED DECEMBER 31, 2017
TABLE OF CONTENTS
Page | ||
2
PART I
Item 1. | Business |
Company
We are an externally managed, closed-end, non-diversified management investment company that has elected to be treated as a business development company, or "BDC", under the Investment Company Act of 1940, or the “1940 Act.” We have also elected to be treated for U.S. federal income tax purposes as a regulated investment company, or "RIC", under Subchapter M of the Internal Revenue Code of 1986, as amended, or the "Code", and we intend to satisfy the Code requirements to receive RIC tax treatment annually. We provide customized financing solutions to small to mid-sized companies. We generally target companies with annual revenues of less than $100 million and annual EBITDA (Earnings Before Interest, Taxes, Depreciation and Amortization) of less than $15 million.
We were formed as a Delaware corporation on November 14, 2012. We completed our initial public offering on May 7, 2013. Immediately prior to the initial public offering, we acquired Harvest Capital Credit LLC in a merger whereby the outstanding limited liability company membership interests of Harvest Capital Credit LLC were converted into shares of our common stock and we assumed and succeeded to all of Harvest Capital Credit LLC’s assets and liabilities, including its entire portfolio of investments. Harvest Capital Credit LLC, which was formed in February 2011 and commenced operations in September 2011, was founded by certain members of HCAP Advisors LLC, or “HCAP Advisors,” our investment adviser, and JMP Group, Inc. (now JMP Group LLC), or “JMP Group.” Harvest Capital Credit LLC is considered to be our predecessor for accounting purposes, and as such, its financial statements are our historical financial statements.
As used herein, the terms “we”, “us,” and the “Company” refer to Harvest Capital Credit LLC for the periods prior to the initial public offering and refer to Harvest Capital Credit Corporation for the periods after the initial public offering.
Our investment objective is to generate both current income and capital appreciation primarily by making direct investments in the form of subordinated debt, senior debt, and to a lesser extent, minority equity investments in privately-held U.S. small to mid-sized companies. The companies in which we invest are typically highly leveraged, and, in most cases, our investments in such companies are not rated by any rating agency. If such investments were rated, we believe that they would likely receive a rating below investment grade (i.e., below BBB or Baa), which is often referred to as “junk.” Indebtedness of below investment grade quality is regarded as having predominantly speculative characteristics with respect to the issuer’s capacity to pay interest and repay principal. While our primary investment focus is on making loans to, and selected equity investments in, privately-held U.S. small to mid-sized companies, we may also invest in other investments such as loans to larger, publicly-traded companies, high-yield bonds and distressed debt securities. In addition, we may also invest in debt and equity securities issued by collateralized loan obligation funds.
As a BDC, we are required to comply with numerous regulatory requirements. We are permitted to, and expect to continue to, finance our investments using debt and equity. However, our ability to use debt is limited in certain significant respects. See “Regulation as a Business Development Company.”
As a RIC, we generally will not pay corporate-level U.S. federal income taxes on any net ordinary income or capital gains that we timely distribute to our stockholders as dividends. To maintain our RIC treatment, we must meet specified source-of-income and asset diversification requirements and distribute annually to our stockholders at least 90.0% of our ordinary net income and realized net short-term capital gains in excess of realized net long-term capital losses, if any. See “-Taxation as a Regulated Investment Company.”
Our principal executive offices are located at 767 Third Avenue, 29th Floor, New York, New York 10017, and our telephone number is (212) 906-3589. We maintain a website at http://www.harvestcapitalcredit.com. The information on our website is not incorporated by reference in this annual report on Form 10-K.
We make available on or through our website certain reports and amendments to those reports that we file with or furnish to the Securities and Exchange Commission, or the "SEC," in accordance with the Securities Exchange Act of 1934, as amended, or the “Exchange Act”. These include our annual reports on Form 10-K, our quarterly reports on Form 10-Q, and our current reports on Form 8-K. We make this information available on our website free of charge as soon as reasonably practicable after we electronically file the information with, or furnish it to, the SEC.
3
Portfolio Composition
As of December 31, 2017, we had $115.6 million (at fair value) invested in 31 companies. As of December 31, 2017, our portfolio, at fair value, was comprised of approximately 51.0% senior secured term loans, 41.6% junior secured term loans and 7.4% equity and equity-like investments (including our revenue linked security). As of December 31, 2016, we had $134.1 million (at fair value) invested in 31 companies. As of December 31, 2016, our portfolio included approximately 56.8% of senior secured term loans, 39.2% of junior secured term loans and 4.0% of equity and equity-like investments (including our revenue linked security and CLO equity investments).
The weighted average effective yield of our debt and other income producing investments, as of December 31, 2017 and December 31, 2016, was approximately 15.3% and 15.4%, respectively. The weighted average effective yield on the entire portfolio, as of December 31, 2017 and December 31, 2016, was 13.7% and 14.4%, respectively. The weighted average annualized effective yield on debt and other income-producing investments is computed using the effective interest rates for our debt and other income producing investments, including cash and PIK interest as well as the accretion of deferred fees. The individual investment yields are then weighted by the respective fair values of the investments (as of the date presented) in calculating the weighted average effective yield as a percentage of our debt and other income-producing investments. Infinite Care, LLC was excluded from the calculation as of December 31, 2017 because it was on non-accrual status on that date. CRS Reprocessing, LLC and Peekay Acquisition, LLC were excluded from the calculation as of December 31, 2016 because they were on non-accrual status on that date. Shinnecock CLO 2006-1, Ltd. and other equity components of the investment portfolio were also excluded from these calculations either because they do not have stated interest rates or are non-income producing.
The dollar-weighted average annualized yield on the Company’s investments for a given period will generally be higher than what investors in our common stock would realize in a return over the same period because the dollar-weighted average annualized yield does not reflect the Company’s expenses or any sales load that may be paid by investors.
JMP Group
We were founded by certain members of HCAP Advisors, our investment adviser, and JMP Group, a full-service investment banking and asset management firm. JMP Group currently holds an equity interest in us and a majority equity interest in our investment adviser. JMP Group conducts its primary business activities through three wholly-owned subsidiaries: (i) Harvest Capital Strategies, LLC, an SEC-registered investment adviser that focuses on long-short equity hedge funds, middle-market lending and private equity, (ii) JMP Securities LLC, a full-service investment bank that provides equity research, institutional brokerage and investment banking services to growth companies and their investors, and (iii) JMP Credit Advisors LLC, or “JMP Credit Advisors,” which manages approximately $0.9 billion in credit assets through its collateralized loan obligation funds. The shares of common stock of JMP Group are traded on the New York Stock Exchange (NYSE: JMP). JMP Credit Advisors currently acts and has historically acted as our administrator. Joseph A. Jolson, our Chief Executive Officer and Chairman of our board of directors, is also the Chief Executive Officer and Chairman of the board of directors of JMP Group.
Investment Adviser
Our investment adviser’s investment team is led by Joseph A. Jolson (our Chief Executive officer and Chairman of our board of directors), Richard P. Buckanavage (our Managing Director - Head of Business Development), and James Fowler, (our Chief Investment Officer), and is supported by the investment staff at HCAP Advisors LLC, as well as investment professionals from JMP Credit Advisors and JMP Group. In addition, our investment adviser expects to draw upon JMP Group’s over 17-year history in the investment management business and to benefit from the JMP Group investment professionals’ significant capital markets, trading and research expertise developed through investments in different industries and over numerous companies in the United States.
Our investment adviser has an investment committee that is responsible for approving all key investment decisions that are made by our investment adviser on our behalf. The members of the investment committee are Messrs. Jolson; Buckanavage; Fowler; Carter D. Mack, the President of JMP Group; and Bryan B. Hamm, the President of JMP Credit Advisors. The members of our investment committee have extensive investment experience and collectively currently manage or oversee approximately $2.0 billion of assets, including alternative assets such as long-short equity hedge funds, middle-market lending, private equity, collateralized loan obligation funds, and Harvest Capital Credit Corporation. All key investment decisions made by our investment
4
adviser on our behalf require approval from three of the five members of the investment committee and must include the approval of Mr. Jolson.
Business Strategy
Our investment objective is to generate both current income and capital appreciation primarily by making direct investments in the form of subordinated debt, senior debt and, to a lesser extent, minority equity investments. We have adopted the following business strategy to achieve our investment objective:
Capitalize on our investment adviser’s extensive relationships with small to mid-sized companies, private equity sponsors and other intermediaries. Our investment adviser maintains extensive relationships with financial intermediaries, entrepreneurs, financial sponsors, management teams, small and mid-sized companies, attorneys, accountants, investment bankers, commercial bankers and other non-bank providers of capital throughout the U.S., which we expect will produce attractive investment opportunities for us. Our investment adviser has been the sole or lead originator in a majority of our completed investment transactions. Our investment adviser will also benefit from the resources and relationships of JMP Group, which maintains offices in San Francisco, CA; New York, NY; Chicago, IL; Atlanta, GA; Boston, MA; West Palm Beach, FL; and Minneapolis, MN.
Leverage the skills of our experienced investment adviser. The principals of our investment adviser have experience advising, investing in and lending to small and mid-sized companies and have been active participants in the primary leveraged credit markets. Throughout their careers, they have navigated various economic cycles as well as several market disruptions. We believe this experience and understanding allows them to select and structure better investments for us and to efficiently monitor and provide managerial assistance to our portfolio companies.
Apply disciplined underwriting policies. Lending to small to mid-sized private companies requires in-depth due diligence and credit underwriting expertise, which the principals of our investment adviser have gained throughout their extensive careers. Our investment adviser has implemented disciplined and consistent underwriting policies in every transaction. These policies include a thorough analysis of each potential portfolio company’s competitive position, financial performance, management team, operating discipline, growth potential and industry considerations.
Maintain rigorous portfolio management. The principals of our investment adviser have significant investing and board-level experience with small to mid-sized companies, and as a result, we expect that our investment adviser will be a value-added partner to, and remain in close contact with, our directly originated portfolio companies. After originating an investment in a company, our investment adviser will monitor each investment closely, typically receiving monthly, quarterly and annual financial statements, meeting face-to-face with our portfolio companies, as well as frequent informal communication with portfolio companies. In addition, our portfolio company investments generally contain financial covenants, and we obtain compliance certificates relating to those covenants quarterly from our portfolio companies. We believe that our investment adviser’s initial and ongoing portfolio review process will allow it to effectively monitor the performance and prospects of our portfolio companies.
“Enterprise value” lending. We and our investment adviser take an enterprise value approach to the loan structuring and underwriting process. “Enterprise value” is the value that a portfolio company’s most recent investors place on the portfolio company or “enterprise.” The value of the enterprise is determined by multiplying (x) the number of shares of common stock of the portfolio company outstanding on the date of calculation, on a fully diluted basis (assuming the conversion of all outstanding convertible securities and the exercise of all outstanding options and warrants), by (y) the price per share paid by the most recent purchasers of equity securities of the portfolio company plus the value of the portfolio company's liabilities. We generally secure a subordinated lien or a senior secured lien position against the enterprise value of a portfolio company and generally our exposure is less than 65% of the enterprise value and we obtain pricing enhancements in the form of warrants and other fees that we expect will build long-term asset appreciation in our portfolio. “Enterprise value” lending requires an in-depth understanding of the companies and markets served. We believe the experience that our investment adviser possesses gives us enhanced capabilities in making these qualitative “enterprise value” evaluations, which we believe can produce a high quality loan portfolio with enhanced returns for our stockholders.
Opportunity for enhanced returns. To enhance our loan portfolio returns, in addition to receiving interest, we often obtain warrants to purchase the equity of our portfolio companies, as additional consideration for making loans. The warrants we obtain generally include a “cashless exercise” provision to allow us to exercise these rights without requiring us to make any additional cash investment. Obtaining warrants in our portfolio companies allows us to participate in the equity appreciation of our portfolio companies, which we expect will enable us to generate higher returns for our investors. We may also make a direct
5
equity investment in a portfolio company in conjunction with a debt investment, which may provide us with additional equity upside in our investment. Furthermore, we seek to enhance our loan portfolio returns by obtaining ancillary structuring and other fees related to the origination, investment, disposition or liquidation of debt and investment securities.
Investment Criteria
We use the following criteria and guidelines in evaluating investment opportunities and constructing our portfolio. However, not all of these criteria and guidelines have been, or will be, met in connection with each of our investments.
Value orientation / Positive cash flow. We place a premium on analysis of business fundamentals from an investor’s perspective and have a distinct value orientation. We target companies with proven business models in which we can invest at reasonable multiples of operating cash flow. We also typically invest in companies with a history of profitability. We generally do not invest in start-up companies, “turn-around” situations or companies that we believe have unproven business plans.
Experienced management teams with meaningful equity ownership. We target portfolio companies that have management teams with significant relevant industry experience coupled with meaningful equity ownership. We believe management teams with these attributes are more likely to manage the companies in a manner that protects our debt investment and enhances the value of our equity investment.
Niche market leaders with defensible market positions. We target companies that have developed defensible and/or leading positions within their respective markets or market niches and are well positioned to capitalize on growth opportunities. We favor companies that demonstrate significant competitive advantages, which we believe helps to protect their market position and profitability.
Diversified customer and supplier base. We prefer to invest in companies that have a diversified customer and supplier base. Companies with a diversified customer and supplier base are generally better able to endure economic downturns, industry consolidation and shifting customer preferences.
Limiting portfolio concentration. We seek to avoid concentrated exposure to a particular sector, which serves to diversify our portfolio and help to mitigate the risks of an economic downturn in any particular industry sector. In addition, we seek to diversify our portfolio from a geographic and a single borrower concentration perspective to mitigate the risk of an economic downturn in any particular part of the U.S. or concentration risk with respect to a particular borrower. We have adopted a guideline that we will generally refrain from investing more than 15% of our portfolio in any single industry sector.
Ability to exert meaningful influence. We seek to target investment opportunities in which we are the lead/sole investor in our tranche and in which we can add value through rigorous portfolio management and exercising certain rights and remedies available to us when necessary.
Private equity sponsorship. When feasible, we seek to invest in companies in conjunction with private equity sponsors who have proven capabilities in building value. We believe that a private equity sponsor can serve as a committed partner and advisor that will actively work with the company and its management team to meet company goals and create value. We assess a private equity sponsor’s commitment to a portfolio company by, among other things, the capital contribution it has made or will make in the portfolio company.
Security interest. We generally seek a first or second priority security interest in all of the portfolio company’s tangible and intangible assets as collateral for our debt investment, subject in some cases to permitted exceptions. Although we do not intend to operate as an asset-based lender, the estimated liquidation value of the assets, if any, collateralizing the debt securities that we hold is evaluated as a potential source of repayment. We evaluate both tangible assets, such as accounts receivable, inventory and equipment, and intangible assets, such as intellectual property, customer lists, networks and databases.
Covenants. We seek to negotiate covenants in connection with our investments that afford our portfolio companies with flexibility in managing their businesses, but also act as a tool to minimize our loss of capital. Such restrictions may include affirmative and negative covenants, default penalties, lien protection, change of control provisions and board rights, including either observation or participation rights. Our investments generally have cross-default and material adverse change provisions, require the provision of periodic financial reports and operating metrics, and limit the portfolio company’s ability to incur additional debt, sell assets, engage in transactions with affiliates and consummate an extraordinary transaction, such as a merger, acquisition or recapitalization. In addition, we may require other performance or financial based covenants, as we deem appropriate.
6
Exit strategy. We generally seek to invest in companies that we believe possess attributes that will provide us with the ability to exit our investments within a pre-established investment horizon. We expect to exit our investments typically through one of three scenarios: (i) the sale of the company resulting in repayment of all outstanding debt, (ii) the recapitalization of the company through which our loan is replaced with debt or equity from a third party or parties or (iii) the repayment of the initial or remaining principal amount of our loan then outstanding at maturity. In some investments, there may be scheduled amortization of some portion of our loan which would result in a partial exit of our investment prior to the maturity of the loan.
Investment Process
The investment professionals of our investment adviser have responsibility for originating investment opportunities, evaluating potential investments, transaction due diligence, preparation of a preliminary deal evaluation memorandum, negotiation of definitive terms and conditions, securing approval from the investment committee, negotiation of legal documentation and monitoring/management of portfolio investments. There are six key elements of our investment process:
•Origination
•Evaluation
•Structuring/Negotiation
•Due Diligence/Underwriting
•Documentation/Closing
•Portfolio Management/Investment Monitoring.
Origination
Our investment adviser develops investment opportunities through a relationship network of financial intermediaries, entrepreneurs, financial sponsors, management teams, small- and mid-sized companies, attorneys, accountants, investment bankers, commercial bankers and other non-bank providers of capital throughout the U.S. This investment sourcing network has been developed by the principals of our investment adviser, and enabled them to originate investments in every region of the U.S. We believe that the strength of this network should enable our investment adviser to receive the first look at many investment opportunities. We believe that directly originating our own subordinated debt and senior debt investments and equity co-investments gives us greater control over due diligence, structure, terms and ultimately results in stronger investment performance. As a lead and often sole investor in the particular tranche of the capital structure, we also expect to obtain board or observation rights, which allow us to take a more active role in monitoring our investment after we close the investment.
We also expect our investment adviser’s relationship with JMP Group, which, through Harvest Capital Strategies and JMP Credit Advisors, as applicable, also manages a family of two hedge funds, two private equity funds, one real estate fund, three collateralized loan obligation funds and a total return swap, to generate investment opportunities for us.
Evaluation
An initial review of the potential investment opportunity will be performed by one or more investment professionals of our investment adviser. During the initial review process, the investment professionals may solicit input regarding industry and market dynamics from credit analysts and/or equity research analysts within our investment adviser and JMP Group. If the investment opportunity does not meet our investment criteria, feedback will be delivered timely through our origination channels. To the extent an investment appears to meet our investment criteria, the investment professionals of our investment adviser will begin preliminary due diligence.
Structuring/Negotiation
When an investment professional of our investment adviser identifies an investment opportunity that appears to meet our investment criteria, one or more of our investment adviser’s investment professionals will prepare a pre-screen memorandum. During the process, comprehensive and proprietary models are created to evaluate a range of outcomes based on sensitized variables including various economic environments, changes in the cost of production, and various product or service supply/demand and pricing scenarios. The investment professionals of our investment adviser will perform preliminary due diligence and tailor a capital structure to match the historical financial performance and growth strategy of the potential portfolio company.
The pre-screen memorandum will also include the following:
7
•Transaction description;
• | Company description, including product or service analysis, market position, industry dynamics, customer and supplier analysis, and management evaluation; |
• | Quantitative and qualitative analysis of historical financial performance and preparation of 5-year financial projections; |
•Competitive landscape;
•Business strengths and weaknesses;
•Quantitative and qualitative analysis of business owner(s) (including private equity firm);
•Potential investment structure, leverage multiples and expected yield calculations; and
•Outline of key due diligence areas.
The investment committee of our investment adviser then reviews the pre-screen memorandum and determines whether the opportunity fits our general investment criteria and should be considered for further due diligence. If the investment committee makes a positive determination, the investment professionals of our investment adviser will then negotiate and execute a non-binding term sheet with the potential portfolio company and conduct further due diligence.
The investment committee of our investment adviser currently consists of Messrs. Jolson, Buckanavage, Fowler, Mack and Hamm. All key decisions, including screening, initial approvals, final commitment, material amendments and sale approvals (if applicable), require approvals from three of the five investment committee members and must include approval from Mr. Jolson. Although we have a formal process for investment approvals, the investment professionals of our investment adviser regularly communicate with at least one member of the investment committee throughout the investment transaction process to ensure efficiency as well as clarity for our prospective portfolio companies and clients.
Due Diligence/Underwriting
Once a non-binding term sheet has been negotiated and executed with the potential portfolio company and, in limited circumstances, the prospective portfolio company has remitted a good faith deposit, we begin our formal underwriting and due diligence process by requesting additional due diligence materials from the prospective portfolio company and arranging additional on-site visits with management and relevant employees. Our investment adviser typically requests the following information as part of the due diligence process:
• | annual and interim (including monthly) financial information; |
• | completion of a quality of earnings assessment by an accounting firm; |
• | capitalization tables showing details of equity capital raised and ownership; |
• | recent presentations to investors or board members covering the portfolio company’s current status and market opportunity; |
• | detailed business plan, including an executive summary and discussion of market opportunity; |
• | detailed background on all senior members of management, including background checks by third party; |
• | detailed forecast for the current and subsequent five fiscal years; |
• | information on competitors and the prospective portfolio company’s competitive advantage; |
• | completion of Phase I (and, if necessary, Phase II) environmental assessment; |
• | marketing information on the prospective portfolio company’s products, if any; |
• | information on the prospective portfolio company’s intellectual property; and |
• | information on the prospective portfolio company from its key customers or clients. |
The due diligence process includes a formal visit to the prospective portfolio company’s location and interviews with the prospective portfolio company’s senior management team and key operational employees. Outside sources of information are reviewed, including industry publications, market articles, Internet publications, or publicly available information on competitors.
Documentation/Closing
Upon completion of the due diligence process and review and analysis of all of the information provided by the prospective portfolio company and obtained externally, the investment professionals assigned to the opportunity prepare an investment memorandum for review and approval. The investment committee of our investment adviser will reconvene to evaluate the opportunity, review the investment memorandum and discuss the findings of the due diligence process. If the opportunity receives final approval, the principals of our investment adviser, with the assistance of outside legal counsel, will be responsible for preparing
8
and negotiating transaction documents and ensuring that the documents accurately reflect the terms and conditions approved by the investment committee. Funding requires final approval by three of the five investment committee members and must include approval from Mr. Jolson.
Portfolio Management/Investment Monitoring
Our investment adviser employs several methods of evaluating and monitoring the performance of our portfolio companies, which, depending on the particular investment, may include the following processes, procedures, and reports:
• | Review of available monthly or quarterly financial statements compared against the prior year’s comparable period and the company’s financial projections; |
• | Review and discussion, if applicable, of the management discussion and analysis that will accompany its financial results; |
• | Review of the company’s quarterly results and overall general business performance and assessment of the company’s compliance with all covenants (financial or otherwise), including preparation of a portfolio monitoring report or “PMR” (on a quarterly basis), which will be distributed to the members of the investment committee of our investment adviser; |
• | Periodic, and often, face-to-face meetings with management team and owners (including private equity firm if applicable); and |
• | Attendance at company board of directors meetings through formal board seat or board observation rights. |
Once the investment adviser has had the opportunity to review all quarterly PMRs, a meeting will be held with the investment professionals to review all of the PMRs to ensure consensus on risk rating, action steps (if any), and valuation.
In connection with the preparation of PMRs, each investment receives a quarterly risk rating following the five-level numeric investment rating outlined below:
Investment Rating | Summary Description |
1 | Investment Rating 1 is used for investments that are performing above expectations, and whose risks remain favorable compared to the expected risk at the time of the original investment. |
2 | Investment Rating 2 is used for investments that are performing within expectations and whose risks remain neutral compared to the expected risk at the time of the original investment. All new loans are initially rated 2. |
3 | Investment Rating 3 is used for investments that are performing below expectations and that require closer monitoring, but where no loss of return or principal is expected. Portfolio companies with a rating of 3 may be out of compliance with financial covenants. |
4 | Investment Rating 4 is used for investments that are performing substantially below expectations and whose risks have increased substantially since the original investment. These investments are often in workout. Investments with a rating of 4 are those for which there is an increased possibility of some loss of return but no loss of principal is expected. |
5 | Investment Rating 5 is used for investments that are performing substantially below expectations and whose risks have increased substantially since the original investment. These investments are almost always in workout. Investments with a rating of 5 are those for which some loss of return and principal is expected. |
Determination of Net Asset Value and Portfolio Valuation Process
The net asset value per share of our common stock will be determined quarterly by dividing the value of our total assets minus liabilities by the total number of shares of common stock outstanding at the date as of which the determination is made. We will conduct the valuation of our assets, pursuant to which our net asset value will be determined, at all times consistent with U.S. generally accepted accounting principles, or “GAAP,” and the 1940 Act.
In calculating the fair value of our total assets, investments for which market quotations are readily available will be valued at such market quotations, which will generally be obtained from an independent pricing service or one or more broker-dealers or market makers.
We expect that there will not be a readily available market value for a substantial portion of our portfolio investments, and we will value those debt and equity securities that are not publicly traded or whose market value is not ascertainable at fair value
9
as determined in good faith by the board of directors pursuant to a valuation policy that is in accordance with GAAP and the 1940 Act and pursuant to a valuation process approved by our board of directors. Our investment adviser also employs an independent third party valuation firm to assist in determining fair value.
In accordance with authoritative accounting guidance, and with the assistance of any third-party valuation firms that we employ, we perform detailed valuations of our debt and equity investments on an individual basis, using market, income, and bond yield approaches as appropriate. In general, we utilize a bond yield method for the majority of our debt investments, as long as it is appropriate. If, in our judgment, the bond yield approach is not appropriate, we may use the market approach, or, in certain cases, an alternative methodology potentially including an asset liquidation or expected recovery model. For our equity investments, we generally utilize the market and income approaches.
Under the bond yield approach, we use bond yield models to determine the present value of the future cash flow streams of our debt investments. We review various sources of transactional data, including private mergers and acquisitions involving debt investments with similar characteristics, and assess the information to benchmark appropriate discount rates in the valuation process.
Under the market approach, we estimate the enterprise value of the portfolio companies in which we invest. There is no one methodology to estimate enterprise value, and in fact, for any one portfolio company, enterprise value is best expressed as a range of fair values, from which we derive a single estimate of enterprise value. To estimate the enterprise value of a portfolio company, we analyze various factors, including the portfolio company’s historical and projected financial results. Typically, private companies are valued based on multiples of EBITDA, cash flows, net income, revenues or, in limited cases, book value. We generally require portfolio companies to provide annual audited and quarterly and monthly unaudited financial statements, as well as annual projections for the upcoming fiscal year, though in some cases we have waived, and in the future may determine to waive, the requirement to provide audited financial statements based on facts and circumstances that make the portfolio company's audit impracticable.
Under the income approach, we generally prepare and analyze discounted cash flow models based on projections of the future free cash flows of the business. The discount rates used are determined based upon the portfolio company's weighted average cost of capital.
The types of factors that the board of directors may take into account in determining fair value include comparisons of financial ratios of the portfolio companies that issued such private equity securities to peer companies that are public, the nature and realizable value of any collateral, the portfolio company’s ability to make payments and its earnings and discounted cash flow, the markets in which the portfolio company does business, and other relevant factors. When an external event such as a purchase transaction, public offering or subsequent equity sale occurs, the company will consider the pricing indicated by the external event to corroborate the private equity valuation.
The following is a description of our valuation process. Investments are measured at fair value as determined in good faith by our management team, reviewed by the audit committee of the board of directors (independent directors), and ultimately approved by our board of directors, based on, among other factors, consistently applied valuation procedures on each measurement date.
The board of directors undertakes a multi-step valuation process at each measurement date:
• Our valuation process generally begins with each investment initially being valued by the Company's management or the investment professionals of our investment adviser, and/or, if applicable, by an independent valuation firm.
• Preliminary valuation conclusions are documented and discussed with our senior management.
• The audit committee of our board of directors reviews and discusses the preliminary valuations.
• The board of directors discusses valuations and determines the fair value of each investment in our portfolio in good faith, based upon the input of our senior management, the independent valuation firm report (if reviewed in such quarter), and the audit committee.
The nature of the materials and input that the Company’s board of directors receives in the valuation process varies depending on the nature of the investment and the other facts and circumstances. For example, in the case of investments that are Level 1 or
10
2 assets, a formal report by the Company’s management or the investment professionals of its investment adviser, called a portfolio monitoring report, or “PMR,” is not generally prepared, and no independent external valuation firm is engaged due to the availability of quotes in markets for such investments or similar assets. In the case of investments that are Level 3 assets, however, the Company’s board of directors generally receives a report on material Level 3 investments on a quarterly basis (i) from the Company’s management or the investment professionals of its investment adviser in the form of a PMR, (ii) from a third-party valuation firm, or (iii) in some cases, both. In the case of investments that are Level 3 assets and have an investment rating of 1 (performing above expectations), the Company generally engages an independent external valuation firm to review all such material investments at least annually. In quarters where an external valuation is not prepared for such investments, the Company’s management or the investment professionals of our investment adviser generally prepare a PMR. In the case of investments that are Level 3 assets and have an investment rating of 2 through 5 (with performance ranging from within expectations to substantially below expectations), the Company generally engages an independent external valuation firm to review such material investments quarterly (and may receive a PMR in addition to the review of the independent external valuation firm where the Level 3 assets have an investment rating of 3 through 5). However, in certain cases for Level 3 assets, the Company may determine that it is more appropriate for the Company to prepare a PMR instead of engaging an independent external valuation firm on a quarterly basis, because a third-party valuation is not cost effective or the nature of the investment does not warrant a quarterly third-party valuation. In addition, under certain unique circumstances, the Company may determine that a formal valuation report is not likely to be informative, and neither a third-party valuation report nor a report from the Company’s management or the investment professionals of its investment adviser is prepared. Such circumstances might include, for example, an instance in which the investment has paid off after the period end date but before the board of directors meets to discuss the valuations. Further, Level 3 debt investments that have closed within six months of the measurement date are valued at cost unless unique circumstances dictate otherwise.
Due to the inherent uncertainty in determining the fair value of investments that do not have a readily observable fair value, and the subjective judgments and estimates involved in those determinations, the fair value determinations by our board of directors, even though determined in good faith, may differ materially from the values that would have been used had a readily available market value existed for such investments, and the differences could be material.
Derivatives
We may utilize hedging techniques such as entering into interest rate swaps to mitigate potential interest rate risk on our indebtedness. Such interest rate swaps would principally be used to protect us against higher costs on our indebtedness resulting from increases in both short-term and long-term interest rates.
We also may use various hedging and other risk management strategies to seek to manage various risks, including changes in currency exchange rates and market interest rates. Such hedging strategies would be utilized to seek to protect the value of our portfolio investments, for example, against possible adverse changes in the market value of securities held in our portfolio.
Managerial Assistance
As a BDC, we offer, through our investment adviser, and must provide upon request, managerial assistance to certain of our portfolio companies. This assistance may involve, among other things, monitoring the operations of these portfolio companies, participating in board of directors and management meetings, consulting with and advising officers of portfolio companies and providing other organizational and financial guidance.
We may receive fees for these services, though we may reimburse our investment adviser for its expenses related to providing such services on our behalf.
Competition
We compete for investments with other BDCs and investment funds, as well as traditional financial services companies such as commercial banks and other financing sources. A number of our competitors are larger and have greater financial, technical, marketing and other resources than we have. For example, some competitors may have a lower cost of funds and access to funding sources that are not available to us. Furthermore, many of our competitors are not subject to the regulatory restrictions that the 1940 Act imposes on us as a BDC or that the Code imposes on us as a RIC. We believe we compete effectively with these entities primarily on the basis of the experience, industry knowledge and contacts of the principals of our investment adviser, its responsiveness and efficient investment analysis and decision-making processes, its creative financing products and highly customized investment terms. We do not intend to compete primarily on the interest rates we offer and believe that some competitors make loans with rates that are comparable or lower than our rates.
11
Employees
We do not have any employees. Our day-to-day investment operations are managed by our investment adviser, and each of our officers is an employee of our investment adviser, administrator, or other affiliate. As of March 30, 2018, our investment adviser employed a total of ten full-time employees, who expect to draw upon the resources of JMP Group, including its investment professionals as well as finance and operational professionals, in connection with our investment activities. In addition, we reimburse our administrator, JMP Credit Advisors, for the allocable portion of overhead and other expenses incurred by it in performing its obligations under the administration agreement, including the compensation of our chief financial officer and chief compliance officer, and their staff, as well as a portion of the compensation for our chief executive officer and other officers. For a more detailed discussion of the administration agreement with JMP Credit Advisors, see “Administration Agreement.” As previously disclosed, we initiated a process to transition the provision of administrative services to the Company from JMP Credit Advisors to HCAP Advisors, our investment adviser, and expect to complete that process before the end of April 2018.
Investment Advisory Agreement
HCAP Advisors serves as our investment adviser pursuant to an investment advisory and management agreement. Our investment adviser is registered as an investment adviser under the Investment Advisers Act of 1940, or the "Advisers Act". Subject to the overall supervision of our board of directors, HCAP Advisors manages our day-to-day operations, and provides investment advisory and management services to us.
Under the terms of our investment advisory and management agreement, HCAP Advisors:
• | identifies, evaluates and negotiates the structure of the investments we make (including performing due diligence on our prospective portfolio companies); |
• | determines the composition of our portfolio, the nature and timing of the changes to our portfolio and the manner of implementing such changes; and |
• | closes, monitors and administers the investments we make, including the exercise of any voting or consent rights. |
HCAP Advisors’ services under the investment advisory and management agreement are not exclusive, and it is free to furnish similar services to other entities so long as its services to us are not impaired. Under the investment advisory and management agreement, HCAP Advisors also provides on our behalf managerial assistance to those portfolio companies to which we are required to provide such assistance.
Management Fee
Pursuant to our investment advisory and management agreement, we pay HCAP Advisors a fee for investment advisory and management services consisting of a base management fee and a two-part incentive fee.
Base Management Fee. The base management fee is calculated at an annual rate of 2.0% on our gross assets up to and including $350 million, 1.75% on gross assets above $350 million and up to and including $1 billion, and 1.5% on gross assets above $1 billion, and is payable quarterly in arrears. For purposes of calculating the base management fee, the term “gross assets” includes all assets, including any assets acquired with the proceeds of leverage, but excludes cash and cash equivalents. Our investment adviser benefits when we incur debt or use leverage. The base management fee is calculated based on the average value of our gross assets at the end of the two most recently completed calendar quarters. Base management fees for any partial quarter will be appropriately prorated.
Incentive Fee. The incentive fee has two parts, as follows:
One component is calculated and payable quarterly in arrears based on our pre-incentive fee net investment income for the immediately preceding calendar quarter and is 20% of the amount, if any, by which our pre-incentive fee net investment income for the immediately preceding calendar quarter exceeds a 2.0% (which is 8.0% annualized) hurdle rate and a “catch-up” provision measured as of the end of each calendar quarter. Under this provision, in any calendar quarter, our investment adviser receives no incentive fee until our net investment income equals the hurdle rate of 2.0%, but then receives, as a “catch-up”, 100% of our pre-incentive fee net investment income with respect to that portion of such pre-incentive fee net investment income, if any, that exceeds the hurdle rate but is less than 2.5%. The effect of this provision is that, if pre-incentive fee net investment income exceeds
12
2.5% in any calendar quarter, our investment adviser will receive 20% of our pre-incentive fee net investment income as if a hurdle rate did not apply. For this purpose, pre-incentive fee net investment income means interest income, dividend income and any other income (including any other fees (other than fees for providing managerial assistance), such as commitment, origination, structuring, diligence and consulting fees or other fees that we receive from portfolio companies) accrued during the calendar quarter, minus our operating expenses for the quarter (including the base management fee, expenses payable under the administration agreement (as defined below), and any interest expense and any dividends paid on any issued and outstanding preferred stock, but excluding the incentive fee). Pre-incentive fee net investment income includes, in the case of investments with a deferred interest feature (such as original issue discount, debt instruments with payment-in-kind interest and zero coupon securities), accrued income that we have not yet received in cash. Since the hurdle rate is fixed, as interest rates rise, it is easier for our investment adviser to surpass the hurdle rate and receive an incentive fee based on net investment income. The foregoing incentive fee is subject to a total return requirement, which provides that no incentive fee in respect of the Company’s pre-incentive fee net investment income will be payable except to the extent 20% of the cumulative net increase in net assets resulting from operations over the then current and 11 preceding quarters exceeds the cumulative incentive fees accrued and/or paid for the 11 preceding quarters. In other words, any ordinary income incentive fee that is payable in a calendar quarter is limited to the lesser of (i) 20% of the amount by which our pre-incentive fee net investment income for such calendar quarter exceeds the 2% hurdle, subject to the “catch-up” provision, and (ii) (x) 20% of the cumulative net increase in net assets resulting from operations for the then current and 11 preceding calendar quarters minus (y) the cumulative incentive fees accrued and/or paid for the 11 preceding calendar quarters. For the foregoing purpose, the “cumulative net increase in net assets resulting from operations” is the amount, if positive, of the sum of pre-incentive fee net investment income, realized gains and losses and unrealized appreciation and depreciation of the Company for the then current and 11 preceding calendar quarters. Incentive fee expense for 2017 totaled $0.1 million, after giving effect to the total return requirement discussed above. Incentive fee expense for 2017 would have been $1.1 million had the total return requirement not applied.
Pre-incentive fee net investment income does not include any realized capital gains, realized capital losses or unrealized capital appreciation or depreciation. Because of the structure of the incentive fee, it is possible that we may pay an incentive fee in a quarter where we incur a loss. For example, if we receive pre-incentive fee net investment income in excess of the quarterly minimum hurdle rate, we will pay the applicable incentive fee even if we have incurred a loss in that quarter due to realized and unrealized capital losses. Our net investment income used to calculate this component of the incentive fee is also included in the amount of our gross assets used to calculate the base management fee. These calculations are appropriately prorated for any period of less than three months and adjusted for any share issuances or repurchases during the current quarter.
The following is a graphical representation of the calculation of the income-related portion of the incentive fee:
Quarterly Incentive Fee Based on Net Investment Income
Pre-incentive Fee Net Investment Income
(expressed as a percentage of the value of net assets)
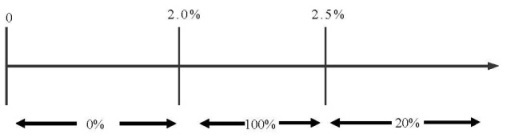
Percentage of Pre-Incentive Fee Net Investment Income Allocated to First Component of Incentive Fee
The second component of the incentive fee is determined and payable in arrears as of the end of each calendar year (or upon termination of the investment advisory and management agreement, as of the termination date), and equals 20.0% of our cumulative aggregate realized capital gains less cumulative aggregate realized capital losses, aggregate unrealized capital depreciation (unrealized depreciation on a gross investment-by-investment basis at the end of each calendar year) and prior performance-based capital gains incentive fee payments previously made to our investment adviser.
13
Examples of Incentive Fee Calculation
Example 1: Income Related Portion of Incentive Fee before Total Return Requirement Calculation:
Assumptions
•Hurdle rate(1) = 2.0%
•Management fee(2) = 0.50%
•Other expenses (legal, accounting, custodian, etc.)(3) = 0.20%
Alternative 1
Additional Assumptions
•Investment income (including interest, dividends, fees, etc.) = 1.25%
• | Pre-incentive fee net investment income (investment income – (management fee + other expenses)) = 0.55% |
Pre-incentive net investment income does not exceed hurdle rate; therefore there is no incentive fee.
Alternative 2
Additional Assumptions
•Investment income (including interest, dividends, fees, etc.) = 3.0%
Pre-incentive fee net investment income (investment income – (management fee + other expenses)) = 2.30%
Pre-incentive fee net investment income exceeds hurdle rate; therefore there is an incentive fee.
• | Incentive fee = (100% x “Catch-Up”) + (the greater of 0% AND (20% x (pre-incentive fee net investment income – 2.5%))) |
= | (100.0% x (pre-incentive fee net investment income – 2.0%)) + 0% | |
= | (100.0% x (2.30% – 2.0%)) | |
= | 100.0% x 0.30% | |
= | 0.30% | |
Alternative 3
Additional Assumptions
•Investment income (including interest, dividends, fees, etc.) = 3.50%
• | Pre-incentive fee net investment income (investment income – (management fee + other expenses)) = 2.8% |
• | Pre-incentive fee net investment income exceeds hurdle rate; therefore there is an incentive fee. |
Incentive Fee = (100% x “Catch-Up”) + (the greater of 0% AND (20% x (pre-incentive fee net investment income – 2.5%)))
= | (100% x (2.5% – 2.0%)) + (20% x (2.8% – 2.5%)) | |
= | 0.50% + (20% x 0.3%) | |
= | 0.50% + 0.06% | |
= | 0.56% | |
14
(1) | Represents 8.0% annualized hurdle rate. |
(2) | Represents 2.00% annualized management fee based on the assumption that our gross assets are not above $350 million. The annual rate at which our management fee is calculated is dependent upon the size of our gross assets, with the management fee being 2.0% on our gross assets up to and including $350 million, 1.75% on gross assets above $350 million and up to and including $1 billion, and 1.5% on gross assets above $1 billion. |
(3) | Excludes organizational and offering expenses. |
Example 2: Income Portion of Incentive Fee with Total Return Requirement Calculation:
Alternative 1:
Assumptions
• | Investment income (including interest, dividends, fees, etc.) = 3.50% |
◦ | Hurdle rate(1) = 2.0% |
◦ | Management fee(2) = 0.50% |
◦ | Other expenses (legal, accounting, custodian, etc.)(3) = 0.20% |
• | Pre-incentive fee net investment income (investment income – (management fee + other expenses) = 2.80% |
• | Cumulative incentive compensation accrued and/or paid for preceding 11 calendar quarters = $9,000,000 |
• | 20% of cumulative net increase in net assets resulting from operations over current and preceding 11 calendar quarters = $8,000,000 |
Although our pre-incentive fee net investment income exceeds the hurdle rate of 2.0% (as shown in Alternative 3 of Example 1 above), no incentive fee is payable because 20% of the cumulative net increase in net assets resulting from operations over the then current and 11 preceding calendar quarters did not exceed the cumulative income and capital gains incentive fees accrued and/or paid for the preceding 11 calendar quarters.
Alternative 2:
Assumptions
• | Investment income (including interest, dividends, fees, etc.) = 3.50% |
◦ | Hurdle rate(1) = 2.0% |
◦ | Management fee(2) = 0.50% |
◦ | Other expenses (legal, accounting, custodian, transfer agent, etc.)(3) = 0.20% |
◦ | Pre-incentive fee net investment income (investment income – (management fee + other expenses) = 2.80% |
◦ | Cumulative incentive compensation accrued and/or paid for preceding 11 calendar quarters = $9,000,000 |
◦ | 20.0% of cumulative net increase in net assets resulting from operations over current and preceding 11 calendar quarters = $10,000,000 |
Because our pre-incentive fee net investment income exceeds the hurdle rate of 2.0% and because 20.0% of the cumulative net increase in net assets resulting from operations over the then current and 11 preceding calendar quarters exceeds the cumulative income and capital gains incentive fees accrued and/or paid for the preceding 11 calendar quarters, an incentive fee would be payable, as shown in Alternative 3 of Example 1 above.
15
(1) | Represents 8.0% annualized hurdle rate. |
(2) | Represents 2.00% annualized base management fee based on the assumption that our gross assets are not above $350 million. The annual rate at which our management fee is calculated is dependent upon the size of our gross assets, with the management fee being 2.0% on our gross assets up to and including $350 million, 1.75% on gross assets above $350 million and up to and including $1 billion, and 1.5% on gross assets above $1 billion. |
(3) | Excludes organizational and offering expenses. |
(4) | The “catch-up” provision is intended to provide our investment adviser with an incentive fee of 20% on all pre-incentive fee net investment income as if a hurdle rate did not apply when our net investment income exceeds 2.5% in any fiscal quarter. |
Example 3: Capital Gains Portion of Incentive Fee:
Alternative 1:
Assumptions
• | Year 1: $20 million investment made in Company A (“Investment A”), and $30 million investment made in Company B (“Investment B”) |
• | Year 2: Investment A sold for $50 million and fair market value, or FMV, of Investment B determined to be $32 million |
• | Year 3: FMV of Investment B determined to be $25 million |
• | Year 4: Investment B sold for $31 million |
The capital gains portion of the incentive fee would be:
• | Year 1: None |
• | Year 2: Capital gains incentive fee of $6.0 million ($30 million realized capital gains on sale of Investment A multiplied by 20.0%) |
• | Year 3: None; $5.0 million (20% multiplied by ($30 million cumulative capital gains less $5 million cumulative capital depreciation)) less $6.0 million (previous capital gains fee paid in Year 2) |
• | Year 4: Capital gains incentive fee of $200,000; $6.2 million ($31 million cumulative realized capital gains multiplied by 20%) less $6.0 million (capital gains fee paid in Year 2) |
Alternative 2
Assumptions
• | Year 1: $20 million investment made in Company A (“Investment A”), $30 million investment made in Company B (“Investment B”) and $25 million investment made in Company C (“Investment C”) |
• | Year 2: Investment A sold for $50 million, FMV of Investment B determined to be $25 million and FMV of Investment C determined to be $25 million |
• | Year 3: FMV of Investment B determined to be $27 million and Investment C sold for $30 million |
• | Year 4: FMV of Investment B determined to be $24 million |
• | Year 5: Investment B sold for $20 million |
The capital gains portion of the incentive fee would be:
• | Year 1: None |
• | Year 2: Capital gains incentive fee of $5.0 million; 20% multiplied by $25 million ($30 million realized capital gains on Investment A less $5 million unrealized capital depreciation on Investment B) |
16
• | Year 3: Capital gains incentive fee of $1.4 million; $6.4 million (20% multiplied by $32 million ($35 million cumulative realized capital gains less $3 million unrealized capital depreciation on Investment B)) less $5.0 million capital gains fee received in Year 2 |
• | Year 4: None |
• | Year 5: None; $5.0 million of capital gains incentive fee (20% multiplied by $25 million (cumulative realized capital gains of $35 million less realized capital losses of $10 million)) less $6.4 million cumulative capital gains fee paid in Year 2 and Year 3 |
Payment of Our Expenses
The compensation and routine overhead expenses of the investment professionals and staff of HCAP Advisors is provided and paid for by HCAP Advisors. We bear all other costs and expenses of our operations and transactions, including those relating to:
• | our organization; |
• | calculating our net asset value (including the cost and expenses of independent valuation firms); |
• | expenses, including travel expense, incurred by HCAP Advisors or payable to third parties performing due diligence on prospective portfolio companies, monitoring our investments and, if necessary, enforcing our rights; |
• | interest payable on debt, if any, incurred to finance our investments; |
• | the costs of all offerings of our stock and other securities, if any; |
• | the base management fee and any incentive management fee; |
• | distributions on our shares; |
• | administration fees payable under our administration agreement; |
• | the allocated costs incurred by HCAP Advisors in providing managerial assistance to those portfolio companies that request it; |
• | amounts payable to third parties relating to, or associated with, making investments; |
• | transfer agent and custodial fees; |
• | registration fees; |
• | listing fees; |
• | taxes; |
• | independent director fees and expenses; |
• | costs associated with our reporting and compliance obligations under the 1940 Act and applicable federal and state securities laws; |
• | directors and officers/errors and omissions liability insurance, and any other insurance premiums; |
•indemnification payments;
• | direct costs and expenses of administration, including audit and legal costs; and |
• | all other expenses reasonably incurred by us or our administrator in connection with administering our business, such as the allocable portion of overhead under our administration agreement, including rent and the allocable portions of the cost of our chief financial officer and chief compliance officer and their respective staffs and administrative services provided to the Company by our chief executive officer and other officers. |
Limitation of Liability and Indemnification
17
The investment advisory and management agreement provides that HCAP Advisors and its officers, directors, employees and affiliates are not liable to us or any of our stockholders for any act or omission by it or its employees in the supervision or management of our investment activities or for any loss sustained by us or our stockholders, except that the foregoing exculpation does not extend to any act or omission constituting willful misfeasance, bad faith, gross negligence or reckless disregard of its obligations under the investment advisory and management agreement. The investment advisory and management agreement also provides for indemnification by us of HCAP Advisors’s members, directors, officers, employees, agents and control persons for liabilities incurred by it in connection with their services to us, subject to the same limitations and to certain conditions.
Duration and Termination
Our board of directors approved the investment advisory and management agreement at its first meeting, held on January 17, 2013. The investment advisory and management agreement was originally executed as of April 29, 2013 for an initial term of two years. Subsequent one-year renewals have been approved by our board of directors per the table below.
Effective | ||
Approval date | From | To |
January 17, 2013 | April 29, 2013 | April 29, 2015 |
March 5, 2015 | April 29, 2015 | April 29, 2016 |
March 8, 2016 | April 29, 2016 | April 29, 2017 |
March 10, 2017 | April 29, 2017 | April 29, 2018 |
Unless earlier terminated as described below, the investment advisory and management agreement provides that it will remain in effect if approved annually by our board of directors or by the affirmative vote of the holders of a majority of our outstanding voting securities, including, in either case, approval by a majority of our directors who are not parties to such agreement or who are not “interested persons” of any such party, as such term is defined in Section 2(a)(19) of the 1940 Act. The investment advisory and management agreement will automatically terminate in the event of its assignment. The investment advisory and management agreement may also be terminated by either party without penalty upon not more than 60 days’ written notice to the other party. See “Risk Factors - Our investment adviser has the right to resign on 60 days’ notice, and we may not be able to find a suitable replacement within that time, resulting in a disruption in our operations that could adversely affect our financial condition, business and results of operations.”
Board Approval of the Investment Advisory and Management Agreement
In its consideration of the investment advisory and management agreement, the board of directors focused on information it had received relating to, among other things, (a) the nature, quality and extent of the advisory and other services to be provided to us by our investment adviser; (b) comparative data with respect to advisory fees or similar expenses paid by other BDCs with similar investment objectives; (c) our projected operating expenses and expense ratio compared to BDCs with similar investment objectives; (d) any existing and potential sources of indirect income to our investment adviser from its relationships with us and the profitability of those relationships; (e) information about the services to be performed and the personnel performing such services under the investment advisory and management agreement; (f) the organizational capability and financial condition of our investment adviser; and (g) various other factors.
Based on the information reviewed and the discussions, the board of directors, including a majority of the non-interested directors, concluded that the investment management fee rates and terms are reasonable in relation to the services to be provided and approved the investment advisory and management agreement as being in the best interests of our stockholders.
Organization of the Investment Adviser
HCAP Advisors is a Delaware limited liability company. The principal executive offices of HCAP Advisors are located at 767 Third Avenue, 29th Floor, New York, New York 10017.
Administration Agreement
JMP Credit Advisors currently serves and has historically served as our administrator; however, as previously disclosed, we initiated a process to transition the provision of administrative services to the Company from JMP Credit Advisors to HCAP Advisors, our investment adviser, and expect to complete that process before the end of April 2018. Pursuant to an administration
18
agreement, JMP Credit Advisors furnishes us with office facilities, equipment and clerical, bookkeeping and record keeping services at such facilities. Under the administration agreement, the administrator also performs, or oversees the performance of, our required administrative services, which include, among other things, being responsible for the financial records which we are required to maintain and preparing reports to our stockholders. In addition, the administrator assists us in determining and publishing our net asset value, oversees the preparation and filing of our tax returns and the printing and dissemination of reports to our stockholders, and generally oversees the payment of our expenses and the performance of administrative and professional services rendered to us by others. Payments under the administration agreement are equal to an amount based upon our allocable portion of the administrator’s overhead in performing its obligations under the administration agreement, including rent and our allocable portion of the cost of our chief financial officer and chief compliance officer and their respective staffs and administrative services provided to the Company by our chief executive officer and other officers.
Our board of directors or a committee thereof discusses with our administrator the methodology employed in determining how the expenses are allocated to us. Our board of directors or a committee thereof also assesses the reasonableness of such reimbursements for expenses allocated to us based on the breadth, depth and quality of such services. In addition, our board of directors or a committee thereof consider other factors in assessing the reasonableness of the fee, including the amounts paid for such services by other BDCs and the costs that may be associated with obtaining similar services from other third-party service providers.
Under the administration agreement entered into in conjunction with our initial public offering, JMP Credit Advisors agreed to cap the amounts payable by the Company to $275,000 during the first year of the agreement. Since the $275,000 cap expired on April 29, 2014, the Company negotiated a new cap with JMP Credit Advisors of $150,000 for each of the quarters ending June 30, September 30, and December 31, 2014.
On March 5, 2015, the Company negotiated a cap with JMP Credit Advisors on amounts payable by the Company under the administration agreement during the 2015 fiscal and calendar year. This cap set the maximum amount that would be payable by the Company on both a quarterly and annual basis. The cap for each quarter was as follows: (i) for the quarter ended March 31, 2015, the cap was $150,000; (ii) for the quarter ended June 30, 2015, the cap was equal to the sum of (a) $150,000 plus (b) 0.25% of the increase in the Company’s portfolio assets from December 31, 2014, to March 31, 2015; (iii) for the quarter ended September 30, 2015, the cap was equal to the sum of (a) $150,000 plus (b) 0.25% of the increase in the Company’s portfolio assets from December 31, 2014, to June 30, 2015; and (iv) for the quarter ended December 31, 2015, the cap was equal to the sum of (a) $150,000 plus (b) 0.25% of the increase in the Company’s portfolio assets from December 31, 2014, to September 30, 2015. The overall cap for the year ended December 31, 2015 was $800,000, so notwithstanding any given quarterly cap, the amounts payable for all four quarters would not exceed $800,000.
On March 8, 2016, the Company negotiated a new cap with JMP Credit Advisors on amounts payable by the Company under the administration agreement during the 2016 fiscal and calendar year. This cap set the maximum amount that would be payable by the Company for 2016 at the lesser of 0.60% of the average of the Company's total investments (at fair value) over the year ended December 31, 2016 or $917,000. On January 4, 2017, our board of directors approved an increase in the cap to the extent necessary to reimburse JMP Credit Advisors for the cost of administrative services provided to the Company by Chief Executive Officer Richard P. Buckanavage and Vice President Ryan T. Magee in the fourth quarter of 2016, in an amount up to $75,000.
On March 10, 2017, the Company negotiated a new cap with JMP Credit Advisors on amounts payable by the Company under the administration agreement during the 2017 fiscal and calendar year. This cap set the maximum amount that would be payable by the Company for 2017 at $1.2 million. On October 27, 2017, our compensation committee and board of directors approved an increase in the cap on amounts payable by the Company under the administration agreement to cover increased costs associated with moving the administrative functions of the Company from Alpharetta, Georgia to its headquarters in New York, New York. In particular, our compensation committee and board of directors approved an increase in this cap to the extent necessary to reimburse JMP Credit Advisors for costs and expenses payable by the Company under the administration agreement for fiscal year 2017 in excess of the existing cap, up to an additional $0.2 million, for a total cap on all amounts to be paid by the Company under the administration agreement for fiscal year 2017 of $1.4 million.
The existence of a cap, and the determination of a proper cap amount, in subsequent years will be determined by the mutual agreement of the independent members of our board of directors, on our behalf, and the administrator. The administration agreement may be terminated by either party without penalty upon 60 days’ written notice to the other.
19
The administration agreement provides that, absent willful misfeasance, bad faith or negligence in the performance of its duties or by reason of the reckless disregard of its duties and obligations, JMP Credit Advisors and its officers, managers, partners, agents, employees, controlling persons, members and any other person or entity affiliated with it are entitled to indemnification from us for any damages, liabilities, costs and expenses (including reasonable attorneys’ fees and amounts reasonably paid in settlement) arising from the rendering of the administrator’s services under the administration agreement or otherwise as administrator for us.
License Agreement
We have entered into a license agreement with an affiliate of JMP Group pursuant to which it has agreed to grant us a non-exclusive, royalty-free license to use the name “Harvest.” Under this agreement, we have a right to use the “Harvest” name for so long as an affiliate of JMP Group remains our investment adviser. Other than with respect to this limited license, we have no legal right to the “Harvest” name.
Regulation as a BDC
We have elected to be regulated as a BDC under the 1940 Act. As with other companies regulated by the 1940 Act, a BDC must adhere to certain substantive regulatory requirements. The 1940 Act contains prohibitions and restrictions relating to transactions between BDCs and their affiliates (including any investment advisers or sub-advisers), principal underwriters and affiliates of those affiliates or underwriters and requires that a majority of the directors be persons other than “interested persons,” as that term is defined in the 1940 Act. In addition, the 1940 Act provides that we may not change the nature of our business so as to cease to be, or to withdraw our election as, a BDC unless approved by “a majority of our outstanding voting securities” as defined in the 1940 Act. A majority of the outstanding voting securities of a company is defined under the 1940 Act as the lesser of (i) 67% or more of such company’s shares present at a meeting if more than 50% of the outstanding shares of such company are present and represented by proxy or (ii) more than 50% of the outstanding shares of such company. Our bylaws provide for the calling of a special meeting of stockholders at which such action could be considered upon written notice of not less than ten or more than sixty days before the date of such meeting.
We do not intend to acquire securities issued by any investment company (i.e., mutual fund, registered closed-end fund or BDC) that exceed the limits imposed by the 1940 Act. Under these limits, except for registered money market funds, we generally cannot acquire more than 3% of the voting stock of any investment company, invest more than 5% of the value of our total assets in the securities of one investment company or invest more than 10% of the value of our total assets in the securities of more than one investment company. With regard to that portion of our portfolio invested in securities issued by investment companies, it should be noted that such investments might subject our stockholders to additional expenses.
We are also prohibited under the 1940 Act from knowingly participating in certain transactions with our affiliates without the prior approval of our board of directors who are not interested persons and, in some cases, prior approval by the SEC. For example, under the 1940 Act, absent receipt of exemptive relief from the SEC, we and our affiliates are generally precluded from co-investing in private placements of securities. However, on December 10, 2015, we received exemptive relief from the SEC permitting us greater flexibility to negotiate the terms of co-investments with investment funds managed by HCAP Advisors or JMP Credit Advisors and with certain accounts managed or held by JMP Group and certain of its subsidiaries, in each case in a manner consistent with our investment objectives and strategies as well as regulatory requirements and other pertinent factors (including the terms and conditions of the exemptive order issued by the SEC). Under the terms of the relief, a “required majority” (as defined in Section 57(o) of the 1940 Act) of our independent directors must make certain conclusions in connection with a co-investment transaction, including (1) the terms of the proposed transaction, including the consideration to be paid, are reasonable and fair to us and our stockholders and do not involve overreaching of us or our stockholders on the part of any person concerned and (2) that the transaction is consistent with the interests of our stockholders and is consistent with our investment objectives and strategies. We intend to co-invest, subject to the conditions included in the exemptive order we received from the SEC, with investment funds managed by HCAP Advisors or JMP Credit Advisors and with certain accounts managed or held by JMP Group and certain of its subsidiaries. We believe that such co-investments may afford us additional investment opportunities.
We expect to be periodically examined by the SEC for compliance with the 1940 Act.
We are required to provide and maintain a bond issued by a reputable fidelity insurance company to protect us against larceny and embezzlement. Furthermore, as a BDC, we are prohibited from protecting any director or officer against any liability to us or our stockholders arising from willful misfeasance, bad faith, gross negligence or reckless disregard of the duties involved in the conduct of such person’s office.
20
We and our investment adviser have adopted and implemented written policies and procedures reasonably designed to prevent violation of the federal securities laws and review these policies and procedures annually for their adequacy and the effectiveness of their implementation. We and our investment adviser have designated a chief compliance officer to be responsible for administering these policies and procedures.
Qualifying assets
Under the 1940 Act, a BDC may not acquire any asset other than assets of the type listed in section 55(a) of the 1940 Act, which are referred to as qualifying assets, unless, at the time the acquisition is made, qualifying assets represent at least 70% of the company’s total assets. The principal categories of qualifying assets relevant to our business are the following:
• | Securities purchased in transactions not involving any public offering from the issuer of such securities, which issuer (subject to certain limited exceptions) is an eligible portfolio company, or from any person who is, or has been during the preceding 13 months, an affiliated person of an eligible portfolio company, or from any other person, subject to such rules as may be prescribed by the SEC. An eligible portfolio company is defined in the 1940 Act as any issuer which: |
◦ | is organized under the laws of, and has its principal place of business in, the United States; |
◦ | is not an investment company (other than a small business investment company wholly owned by the BDC) or a company that would be an investment company but for certain exclusions under the 1940 Act; and |
◦ | satisfies any of the following: |
▪ | is a small and solvent company having total assets of not more than $4 million and capital and surplus of not less than $2 million; |
▪ | is controlled by a BDC or a group of companies including a BDC, the BDC actually exercises a controlling influence over the management or policies of the eligible portfolio company, and, as a result thereof, the BDC has an affiliated person who is a director of the eligible portfolio company; or |
▪ | has a market capitalization of less than $250 million or does not have any class of securities listed on a national securities exchange. |
• | Securities of any eligible portfolio company which we control. |
• | Securities purchased in a private transaction from a U.S. issuer that is not an investment company (other than a small business investment company wholly owned by us) or from an affiliated person of the issuer, or in transactions incident thereto, if the issuer is in bankruptcy and subject to reorganization or if the issuer, immediately prior to the purchase of its securities was unable to meet its obligations as they came due without material assistance other than conventional lending or financing arrangements. |
• | Securities of an eligible portfolio company purchased from any person in a private transaction if there is no ready market for such securities and we already own 60% of the outstanding equity of the eligible portfolio company. |
• | Securities received in exchange for or distributed on or with respect to securities described above, or pursuant to the exercise of warrants or rights relating to such securities. |
• | Cash, cash equivalents, U.S. Government securities or high-quality debt securities maturing in one year or less from the time of investment. |
The regulations defining qualifying assets may change over time. We may adjust our investment focus as needed to comply with and/or take advantage of any regulatory, legislative, administrative or judicial actions in this area.
Managerial assistance to portfolio companies
A BDC must have been organized and have its principal place of business in the United States and must be operated for the purpose of making investments in the types of securities described in “— Qualifying assets” above. BDCs generally must offer to make available to the issuer of the securities significant managerial assistance, except in circumstances where either (i) the BDC controls such issuer of securities or (ii) the BDC purchases such securities in conjunction with one or more other persons acting together and one of the other persons in the group makes available such managerial assistance. Making available managerial
21
assistance means, among other things, any arrangement whereby the BDC, through its directors, officers, employees or agents, offers to provide, and, if accepted, does so provide, significant guidance and counsel concerning the management, operations or business objectives and policies of a portfolio company.
Issuance of Additional Shares of our Common Stock
We are not generally able to issue and sell our common stock at a price below net asset value per share. We may, however, issue and sell our common stock, at a price below the current net asset value of the common stock if our board of directors determines that such sale is in our best interest and in the best interests of our stockholders, and our stockholders have approved our policy and practice of making such sales within the preceding 12 months. In any such case, the price at which our securities are to be issued and sold may not be less than a price which, in the determination of our board of directors, closely approximates the market value of such securities.
Temporary investments
Pending investment in other types of “qualifying assets,” as described above, our investments may consist of cash, cash equivalents, U.S. government securities or high-quality debt securities maturing in one year or less from the time of investment, which we refer to, collectively, as temporary investments, so that 70% of our assets are qualifying assets. Typically, we invest in highly rated commercial paper, U.S. government agency notes, U.S. Treasury bills or in repurchase agreements relating to such securities that are fully collateralized by cash or securities issued by the U.S. Government or its agencies. A repurchase agreement involves the purchase by an investor, such as us, of a specified security and the simultaneous agreement by the seller to repurchase it at an agreed-upon future date and at a price which is greater than the purchase price by an amount that reflects an agreed-upon interest rate. There is no percentage restriction on the proportion of our assets that may be invested in such repurchase agreements. However, if more than 25% of our total assets constitute repurchase agreements from a single counterparty, we would not meet the diversification tests in order to maintain our qualification as a RIC for federal income tax purposes. Thus, we do not intend to enter into repurchase agreements with a single counterparty in excess of this limit. Our investment adviser monitors the creditworthiness of the counterparties with which we enter into repurchase agreement transactions.
Senior securities; Derivative securities
We are permitted, under specified conditions and subject to certain exceptions, to issue multiple classes of indebtedness and one class of stock senior to our common stock if our asset coverage, as defined in the 1940 Act, is at least equal to 200% immediately after each such issuance. Recently passed legislation, however, would allow us to incur additional leverage if we obtain certain approvals from our independent directors and/or our stockholders to reduce our asset coverage ratio from 200% to 150%. See "Risk Factors--Recent legislation may allow us to incur additional leverage." We may also borrow amounts up to 5% of the value of our total assets for temporary or emergency purposes without regard to asset coverage.
The 1940 Act also limits the amount of warrants, options and rights to common stock that we may issue and the terms of such securities.
Code of ethics
We and our investment adviser have each adopted a code of ethics pursuant to Rule 17j-1 under the 1940 Act and Rule 204A-1 under the Advisers Act, respectively, that establishes procedures for personal investments and restricts certain personal securities transactions. Personnel subject to each code may invest in securities for their personal investment accounts, including securities that may be purchased or held by us, so long as such investments are made in accordance with the code’s requirements. You may read and copy the code of ethics at the SEC’s Public Reference Room in Washington, D.C. You may obtain information on the operation of the Public Reference Room by calling the SEC at (202) 942-8090. In addition, each code of ethics is available on the EDGAR database on the SEC’s website at http://www.sec.gov. You may also obtain copies of the code of ethics, after paying a duplicating fee, by electronic request at the following e-mail address: publicinfo@sec.gov, or by writing the SEC’s Public Reference Section, Washington, D.C. 20549-0102. Our code of ethics is also available on our corporate governance webpage of http://www.harvestcapitalcredit.com/corporate-governance.
Proxy voting policies and procedures
22
We have delegated our proxy voting responsibility, with respect to our portfolio companies, to our investment adviser. The Proxy Voting Policies and Procedures of our investment adviser are set forth below. The guidelines are reviewed periodically by our investment adviser and our independent directors and, accordingly, are subject to change.
Introduction
Our investment adviser is registered with the SEC as an investment adviser under the Investment Advisers Act of 1940. As an investment adviser registered under the Advisers Act, our investment adviser has fiduciary duties to us. As part of this duty, our investment adviser recognizes that it must vote client securities in a timely manner free of conflicts of interest and in our best interests and the best interests of our stockholders. Our investment adviser’s Proxy Voting Policies and Procedures have been formulated to ensure decision-making consistent with these fiduciary duties.
These policies and procedures for voting proxies are intended to comply with Section 206 of, and Rule 206(4)-6 under, the Advisers Act.
Proxy policies
Our investment adviser votes proxies relating to our portfolio securities in what our investment adviser perceives to be the best interest of our stockholders. Our investment adviser reviews on a case-by-case basis each proposal submitted to a stockholder vote to determine its effect on the portfolio securities held by us. Although our investment adviser will generally vote against proposals that may have a negative effect on our portfolio securities, our investment adviser may vote for such a proposal if there exist compelling long-term reasons to do so.
Our investment adviser’s proxy voting decisions are made by those senior officers who are responsible for monitoring each of our investments. To ensure that a vote is not the product of a conflict of interest, our investment adviser requires that (1) anyone involved in the decision-making process disclose to our chief compliance officer any potential conflict that he or she is aware of and any contact that he or she has had with any interested party regarding a proxy vote and (2) employees involved in the decision-making process or vote administration are prohibited from revealing how we intend to vote on a proposal in order to reduce any attempted influence from interested parties. If a vote may involve a material conflict of interest, prior to approving such vote, our investment adviser must consult with our chief compliance officer to determine whether the potential conflict is material and if so, the appropriate method to resolve such conflict. If the conflict is determined not to be material, our investment adviser’s employees shall vote the proxy in accordance with our investment adviser’s proxy voting policy.
Proxy voting records
You may obtain information about how we voted proxies by making a written request for proxy voting information to Chief Compliance Officer, Harvest Capital Credit Corporation, 767 Third Avenue, 29th Floor, New York, New York 10017.
Privacy Principles
We are committed to maintaining the privacy of stockholders and to safeguarding our non-public personal information. The following information is provided to help you understand what personal information we collect, how we protect that information and why, in certain cases, we may share information with select other parties.
Generally, we do not receive any non-public personal information relating to our stockholders, although certain non-public personal information of our stockholders may become available to us. We do not disclose any non-public personal information about our stockholders or former stockholders to anyone, except as permitted by law or as is necessary in order to service stockholder accounts (for example, to a transfer agent or third party administrator).
We restrict access to non-public personal information about our stockholders to our investment adviser’s and administrator’s employees with a legitimate business need for the information. We maintain physical, electronic and procedural safeguards designed to protect the non-public personal information of our stockholders.
Taxation as a Regulated Investment Company
23
We have elected to be treated as a RIC under Subchapter M of the Code. As a RIC, we generally will not have to pay corporate-level U.S. federal income taxes on any ordinary income or capital gains that we timely distribute to our stockholders as dividends. To maintain our qualification as a RIC, we must, among other things, meet certain source-of-income and asset diversification requirements (as described below). In addition, to be able to deduct the amount of our distributions, we must distribute to our stockholders, for each taxable year, at least 90% of our “investment company taxable income,” which is generally our net ordinary taxable income plus the excess of our realized net short-term capital gains over our realized net long-term capital losses (the “Annual Distribution Requirement”).
For any taxable year in which we:
• qualify as a RIC; and
• satisfy the Annual Distribution Requirement,
we will not be subject to U.S. federal income tax on the portion of our investment company taxable income and net capital gain, defined as net long-term capital gains in excess of net short-term capital losses, we distribute to stockholders. We will be subject to U.S. federal income tax at the regular corporate rates on any net income or net capital gain not distributed (or deemed distributed) to our stockholders.
We will be subject to a 4% nondeductible U.S. federal excise tax on certain undistributed income unless we distribute in a timely manner an amount at least equal to the sum of (1) 98% of our net ordinary income for each calendar year, (2) 98.2% of our capital gain net income for the one-year period ending October 31 in that calendar year and (3) any income recognized, but not distributed, in preceding years and on which we paid no corporate-level U.S. federal income tax (the “Excise Tax Avoidance Requirement”). We generally will endeavor in each taxable year to make sufficient distributions to our stockholders to avoid any U.S. federal excise tax on our earnings. In this regard, the Company expects to incur a $0.1 million excise tax for the year ended December 31, 2017.
In order to maintain our qualification as a RIC for U.S. federal income tax purposes, we must, among other things:
• | continue to qualify as a BDC under the 1940 Act at all times during each taxable year; |
• | derive in each taxable year at least 90% of our gross income from dividends, interest, payments with respect to loans of certain securities, gains from the sale of stock or other securities, net income from certain “qualified publicly traded partnerships,” or other income derived with respect to our business of investing in such stock or securities (the “90% Income Test”); and |
• | diversify our holdings so that at the end of each quarter of the taxable year: |
• | at least 50% of the value of our assets consists of cash, cash equivalents, U.S. Government securities, securities of other RICs, and other securities if such other securities of any one issuer do not represent more than 5% of the value of our assets or more than 10% of the outstanding voting securities of the issuer; and |
• | no more than 25% of the value of our assets is invested in the securities, other than U.S. government securities or securities of other RICs, of one issuer, of two or more issuers that are controlled, as determined under applicable Code rules, by us and that are engaged in the same or similar or related trades or businesses or of certain “qualified publicly traded partnerships” (the “Diversification Tests”). |
We may be required to recognize taxable income in circumstances in which we do not receive cash. For example, if we hold debt obligations that are treated under applicable tax rules as having original issue discount (such as debt instruments with PIK interest or, in certain cases, increasing interest rates or issued with warrants), we must include in income each year a portion of the original issue discount that accrues over the life of the obligation, regardless of whether cash representing such income is received by us in the same taxable year. We may also have to include in income other amounts that we have not yet received in cash, such as PIK interest and deferred loan origination fees that are paid after origination of the loan or are paid in non-cash compensation such as warrants or stock, or certain income with respect to foreign corporations. Because any original issue discount or other amounts accrued will be included in our investment company taxable income for the year of accrual, we may be required to make a distribution to our stockholders in order to satisfy the Annual Distribution Requirement, even though we will not have received any corresponding cash amount.
24
We are authorized to borrow funds and to sell assets in order to satisfy the distribution requirements. However, under the 1940 Act, we are not permitted in certain circumstances to make distributions to our stockholders while our debt obligations and other senior securities are outstanding unless certain “asset coverage” tests are met. Moreover, our ability to dispose of assets to meet our distribution requirements may be limited by (1) the illiquid nature of our portfolio and/or (2) other requirements relating to our status as a RIC, including the Diversification Tests. If we dispose of assets in order to meet the Annual Distribution Requirement or the Excise Tax Avoidance Requirement, we may make such dispositions at times that, from an investment standpoint, are not advantageous. If we are prohibited from making distributions or are unable to obtain cash from other sources to make the distributions, we may fail to qualify for tax treatment as a RIC, which would result in us becoming subject to corporate-level U.S. federal income tax.
In accordance with certain applicable Treasury regulations and private letter rulings issued by the Internal Revenue Service, a RIC may treat a distribution of its own stock as fulfilling its RIC distribution requirements if each stockholder may elect to receive his or her entire distribution in either cash or stock of the RIC, subject to a limitation that the aggregate amount of cash to be distributed to all stockholders must be at least 20% of the aggregate declared distribution. If too many stockholders elect to receive cash, the cash available for distribution must be allocated among each stockholder electing to receive cash (with the balance of the distribution paid in stock). In no event will any stockholder, electing to receive cash, receive less than the lesser of (a) the portion of the distribution such shareholder has elected to receive in cash, or (b) an amount equal to his or her entire distribution times the percentage limitation on cash available for distribution. If these and certain other requirements are met, for U.S federal income tax purposes, the amount of the dividend paid in stock will be equal to the amount of cash that could have been received instead of stock. We have no current intention of paying distributions in shares of our stock in accordance with these Treasury regulations or private letter rulings.
Our Status as an Emerging Growth Company
We are an “emerging growth company", or “EGC,” as defined in the Jumpstart Our Business Startups Act, or the “JOBS Act.” An EGC is defined as a company with total annual gross revenues of less than $1 billion in its most recently completed fiscal year. An EGC will retain such status until the earlier of: (1) the fifth anniversary of the date it first sold securities pursuant to an initial public offering registration statement; (2) the last day of the fiscal year in which it first exceeds $1 billion in annual gross revenues; (3) the time it becomes a large accelerated filer (an SEC registered company with a public float of at least $700 million); or (4) the date on which the EGC has, within the previous three years, issued $1 billion of nonconvertible debt.
The JOBS Act affords an EGC an opportunity to get a temporary reprieve from certain SEC regulations by exempting an EGC from these regulations for up to five years. These eased requirements include an exemption from certain financial disclosure and governance requirements and relaxed restrictions on the sale of securities. The JOBS Act provides scaled disclosure provisions for EGCs, including, among other things, removing the requirement that EGCs comply with Sarbanes-Oxley Act Section 404(b) auditor attestation of internal control over financial reporting.
Section 107(b) of the JOBS Act also permits an EGC to elect an extended transition period for complying with new or revised accounting standards that have different effective dates for public and private companies until such time as these new or revised standards are made applicable to all private companies. We have elected to take advantage of the extended transition period for complying with new or revised accounting standards, which may make it more difficult for investors and securities analysts to evaluate us since our financial statements may not be comparable to companies that comply with public company effective dates. We will lose our EGC status, December 31, 2018, marking the last day of the fiscal year following the fifth anniversary of our initial public offering.
The NASDAQ Stock Market Corporate Governance Regulations
The NASDAQ Stock Market has adopted corporate governance regulations that listed companies must comply with. We are in compliance with such corporate governance listing standards applicable to BDCs.
25
Item 1A. | Risk Factors |
Investing in our securities involves a number of significant risks. In addition to the other information contained in this annual report on Form 10-K, you should consider carefully the following information before making an investment in our securities. The risks set out below are not the only risks we face. Additional risks and uncertainties not presently known to us or not presently deemed material by us might also impair our operations and performance. If any of the following events occur, our business, financial condition and results of operations could be materially and adversely affected. In such case, our net asset value and the trading price of our common stock could decline or the value of our preferred stock, subscription rights, warrants, or debt securities may decline, and you may lose all or part of your investment.
Risks Relating to Our Business and Structure
We are dependent upon our investment adviser’s key personnel for our future success.
Our day-to-day investment operations are managed by our investment adviser, subject to oversight and supervision by our board of directors. As a result, we depend on the diligence, skill and network of business contacts of the principals of our investment adviser. These individuals have critical industry experience and relationships that we rely on to implement our business plan. If our investment adviser, which has a small number of investment professionals, loses the services of these individuals and cannot replace them, we may not be able to operate our business as we expect, and our ability to compete could be harmed, which could cause our operating results to suffer. In addition, changes in personnel at our investment adviser, including the recent resignation of one of the principals of our investment adviser, Ryan Magee, and the addition of Jim Fowler as our Chief Investment Officer, could impact our investment adviser's ability to compete effectively during and after the transition. In addition, we can offer no assurance that HCAP Advisors will remain our investment adviser.
The investment professionals of our investment adviser may in the future become affiliated with entities engaged in business activities similar to those intended to be conducted by us, and may have conflicts of interest in allocating their time. We expect that these investment professionals will continue to dedicate a significant portion of their time to our investment activities; however, they may in the future engage in other business activities which could divert their time and attention from our investment activities. For example, Joseph A. Jolson, our Chief Executive Officer and the Chairman of our board of directors, is also the Chief Executive Officer and chairman of the board of directors of JMP Group, which owns, directly or indirectly, a majority interest in HCAP Advisors (the Company's investment adviser) and JMP Credit Advisors (the Company's current and historical administrator).
Our business model depends to a significant extent upon strong referral relationships of the principals of our investment adviser, and their inability to maintain or develop these relationships, as well as the failure of these relationships to generate investment opportunities, could adversely affect our business.
We expect that the principals of our investment adviser will maintain their relationships with financial institutions, private equity and other non-bank investors, investment bankers, commercial bankers, attorneys, accountants and consultants, and we rely to a significant extent upon these relationships to provide us with potential investment opportunities. If the principals of our investment adviser fail to maintain their existing relationships or develop new relationships with other sponsors or sources of investment opportunities, we will not be able to grow our investment portfolio. In addition, individuals with whom the principals of our investment adviser have relationships are not obligated to provide us with investment opportunities, and, therefore, there is no assurance that such relationships will generate investment opportunities for us.
Our financial condition and results of operations depend on our ability to manage our business and our future growth effectively.
Our ability to achieve our investment objective depends on our ability to manage and grow our business. This depends, in turn, on our investment adviser’s ability to identify, invest in, and monitor companies that meet our investment criteria.
Accomplishing this result on a cost-effective basis will be largely a function of our investment adviser’s structuring and execution of the investment process, its ability to provide competent, attentive and efficient services to us, and our access to financing on acceptable terms. The principals of our investment adviser will have substantial responsibilities under the investment advisory and management agreement. Such demands on their time may distract them or slow our rate of investment. In order to grow, our investment adviser will need to hire, train, supervise and manage new employees. However, we can offer no assurance that any such employees will contribute effectively to the work of our investment adviser. Any failure to manage our future growth effectively could have a material adverse effect on our business, financial condition and results of operations.
26
We provide debt and equity capital primarily to small and mid-sized companies, which may present a greater risk of loss than providing debt and equity capital to larger companies.
Our portfolio consists primarily of debt and equity investments in small and mid-sized companies. Compared to larger companies, small and mid-sized companies generally have more limited access to capital and higher funding costs, may be in a weaker financial position and may need more capital to expand, compete and operate their business. They also typically have fewer administrative resources, which can lead to greater uncertainty in their ability to generate accurate and reliable financial data, including their ability to deliver audited financial statements. In addition, many small and mid-sized companies may be unable to obtain financing from the public capital markets or other traditional sources, such as commercial banks, in part because loans made to these types of companies entail higher risks than loans made to companies that have larger businesses, greater financial resources or are otherwise able to access traditional credit sources on more attractive terms.
A variety of factors may affect the ability of borrowers to make scheduled payments on loans, including failure to satisfy financial targets and covenants, a downturn in a borrower’s industry or changes in the economy in general. In addition, investing in small and mid-sized companies in general involves a number of significant risks, including that small and mid-sized companies:
• | may have limited financial resources and may be unable to meet their obligations under their debt securities that we hold, which may be accompanied by a deterioration in the value of any collateral and a reduction in the likelihood of us realizing any guarantees we may have obtained in connection with our investment; |
• | typically have shorter operating histories, narrower product lines and smaller market shares than larger businesses, which tend to render small and mid-sized companies more vulnerable to competitors’ actions and market conditions, as well as general economic downturns; |
• | are more likely to depend on the management talents and efforts of a small group of persons; therefore, the death, disability, resignation or termination of one or more of these persons could have a material adverse impact on our portfolio company and, in turn, on us; |
• | generally have less predictable operating results, may be engaged in rapidly changing businesses with products subject to a substantial risk of obsolescence, and may require substantial additional capital to support their operations, finance expansion or maintain their competitive position; |
• | may from time to time be parties to litigation, and our executive officers, directors and our investment adviser may, in the ordinary course of business, be named as defendants in litigation arising from our investments in the portfolio companies; |
• | may have difficulty accessing the capital markets to meet future capital needs, which may limit their ability to grow or to repay their outstanding indebtedness upon maturity; and |
• | may be particularly vulnerable to changes in customer preferences and market conditions, depend on a limited number of customers, and face intense competition, including from companies with greater financial, technical, managerial and marketing resources. |
Any of these factors or changes thereto could impair a small or mid-sized company’s financial condition, results of operation, cash flow or result in other adverse events, such as bankruptcy, any of which could limit a borrower’s ability to make scheduled payments on our loans. This, in turn, could result in losses in our loan portfolio and a decrease in our net interest income and net asset value.
There may be uncertainty as to the value of our portfolio investments.
Substantially all of our portfolio investments are in the form of securities that are not publicly traded. The fair value of securities and other investments that are not publicly traded may not be readily determinable. We value these securities at fair value as determined in good faith by our board of directors and in accordance with generally accepted accounting principles in the United States, or “GAAP.” Our board of directors utilizes the services of an independent valuation firm to aid it in determining the fair value of these securities. The factors that may be considered in fair value pricing our investments include the nature and realizable value of any collateral, the portfolio company’s ability to make payments and its earnings, the markets in which the portfolio company does business, comparison to publicly traded companies, discounted cash flow, enterprise value and other relevant factors. Because such valuations, and particularly valuations of private securities and private companies, are inherently uncertain, may fluctuate over short periods of time, and may be based on estimates, our determinations of fair value may differ materially from the values that would have been used if a ready market for these securities existed. Our net asset value could be adversely affected if our determinations
27
regarding the fair value of our investments were materially higher than the values that we ultimately realize upon the disposal of such securities.
We may experience fluctuations in our operating results.
We could experience fluctuations in our operating results due to a number of factors, including the interest rate payable on the debt securities we acquire, the default rate on such securities, the level of our expenses, variations in and the timing of the recognition of realized and unrealized gains or losses, the degree to which we encounter competition in our markets and general economic conditions. As a result of these factors, results for any period should not be relied upon as being indicative of performance in future periods.
There are significant potential conflicts of interest which could impact our investment returns.
The investment professionals of our investment adviser may serve as officers, directors, principals, portfolio managers or advisers of or to entities that operate in the same or a related line of business as we do or of investment funds, accounts or vehicles managed by our investment adviser or its affiliates. Accordingly, they have or may in the future have obligations to investors in those funds, accounts or vehicles, the fulfillment of which obligations might not be in the best interests of us or our stockholders. We also note that any investment fund, account or vehicle managed by our investment adviser or its affiliates in the future may have overlapping investment objectives with our own and, accordingly, may invest in asset classes similar to those targeted by us. We intend to co-invest with investment funds, accounts and vehicles managed by our investment adviser where doing so is consistent with our investment strategy as well as applicable law and SEC staff interpretations. Without an exemptive order from the SEC (as described below), we generally will only be permitted to co-invest with such investment funds, accounts and vehicles when the only term that is negotiated is price. When we invest alongside other investment funds, accounts and vehicles managed by our investment adviser, we expect our investment adviser to make such investments on our behalf in a fair and equitable manner consistent with our investment objective and strategies so that we are not disadvantaged in relation to any other future client of our investment adviser. In situations where co-investment alongside other investment funds, accounts and vehicles managed by our investment adviser is not permitted or appropriate, such as when there is an opportunity to invest in different securities of the same issuer, our investment adviser will need to decide whether we or such other entity or entities will proceed with the investment. Our investment adviser will make these determinations based on its policies and procedures, which generally require that such opportunities be offered to eligible accounts on a basis that will be fair and equitable over time. Although our investment adviser will endeavor to allocate investment opportunities in a fair and equitable manner in such event, it is possible that we may not be given the opportunity to participate in certain investments made by such other funds that are consistent with our investment objective.
In addition, on December 10, 2015, we received exemptive relief from the SEC permitting us greater flexibility to negotiate the terms of co-investments with investment funds managed by HCAP Advisors or JMP Credit Advisors and with certain accounts managed or held by JMP Group and certain of its subsidiaries, in each case in a manner consistent with our investment objectives and strategies as well as regulatory requirements and other pertinent factors (including the terms and conditions of the exemptive order issued by the SEC). Under the terms of the relief, a “required majority” (as defined in Section 57(o) of the 1940 Act) of our independent directors must make certain conclusions in connection with a co-investment transaction, including (1) the terms of the proposed transaction, including the consideration to be paid, are reasonable and fair to us and our stockholders and do not involve overreaching of us or our stockholders on the part of any person concerned and (2) the transaction is consistent with the interests of our stockholders and is consistent with our investment objectives and strategies. We intend to co-invest, subject to the conditions included in the exemptive order we received from the SEC, with investment funds managed by HCAP Advisors or JMP Credit Advisors and with certain accounts managed or held by JMP Group and certain of its subsidiaries. We believe that such co-investments may afford us additional investment opportunities.
Our incentive fee may induce our investment adviser to pursue speculative investments.
The incentive fee payable by us to our investment adviser may create an incentive for our investment adviser to pursue investments on our behalf that are risky or more speculative than would be the case in the absence of such compensation arrangement. Our investment adviser will receive the incentive fee based, in part, upon net capital gains realized on our investments. Unlike that portion of the incentive fee based on income, there is no hurdle rate applicable to the portion of the incentive fee based on net capital gains. As a result, the investment adviser may have a tendency to invest more capital in investments that are likely to result in capital gains as compared to income producing securities. Such a practice could result in our investing in more speculative securities than would otherwise be the case, which could result in higher investment losses, particularly during economic downturns.
The incentive fee payable by us to our investment adviser also may induce it to invest on our behalf in instruments that have a deferred interest feature, such as payment-in-kind, or PIK, interest. Under these investments, we would accrue the interest over the life of the investment but would not receive the cash income from the investment until the end of the investment’s term, if
28
at all. Our net investment income used to calculate the income portion of our incentive fee, however, includes accrued interest. Thus, a portion of the incentive fee would be based on income that we have not yet received in cash and may never receive in cash if the portfolio company is unable to satisfy such interest payment obligation to us. While we may make incentive fee payments on income accruals that we may not collect in the future and with respect to which we do not have a formal “claw back” right against our investment adviser per se, the amount of accrued income written off in any period will reduce the income in the period in which such write-off was taken and thereby reduce or have the effect of eliminating such period’s incentive fee payment. However, in light of the 2% quarterly hurdle rate relating to the income incentive fee payable to our investment adviser, the reduction in such period’s income incentive fee may not correlate perfectly with the benefit, if any, previously received by the investment adviser with respect to the income incentive fee at the time of the accrual of such income.
Finally, the fact that the incentive fee payable to our investment adviser is calculated based on a percentage of our return on invested capital may encourage our investment adviser to use leverage to increase the return on our investments. Under certain circumstances, the use of leverage may increase the likelihood of default, which could impair the value of our securities, particularly our common stock.
Our base management fee may induce our investment adviser to incur leverage.
The fact that our base management fee is payable based upon our gross assets, which would include any borrowings for investment purposes, may encourage our investment adviser to use leverage to make additional investments. Under certain circumstances, the use of increased leverage may increase the likelihood of default, which could impair the value of our securities, particularly our common stock. Given the subjective nature of the investment decisions made by our investment adviser on our behalf, we may not be able to monitor this potential conflict of interest.
PIK interest earned increases our assets under management and, as a result, will increase the amount of base management fees payable by us to HCAP Advisors.
Certain of our debt investments may contain provisions providing for the payment of PIK interest. Because PIK interest results in an increase in the size of the loan balance of the underlying loan, the receipt by us of PIK interest will have the effect of increasing our assets under management. As a result, because the base management fee that we pay to HCAP Advisors is based on the value of our gross assets, the receipt by us of PIK interest will result in an increase in the amount of the base management fee payable by us.
Changes in laws or regulations governing our operations may adversely affect our business.
We and our portfolio companies are subject to laws and regulations at the local, state and federal levels. These laws and regulations, as well as their interpretation, may be changed from time to time. Accordingly, any change in these laws or regulations could have a material adverse effect on our business.
We cannot predict how tax reform legislation will affect us, our investments, or our stockholders, and any such legislation could adversely affect our business.
Legislative or other actions relating to taxes could have a negative effect on us. The rules dealing with U.S. federal income taxation are constantly under review by persons involved in the legislative process and by the IRS and the U.S. Treasury Department. The U.S. House of Representatives and U.S. Senate passed tax reform legislation, which the President recently signed into law. Such legislation will make many changes to the Code, including significant changes to the taxation of business entities, the deductibility of interest expense, and the tax treatment of capital investment. We cannot predict with certainty how any changes in the tax laws might affect us, our stockholders, or our portfolio investments. New legislation and any U.S. Treasury regulations, administrative interpretations or court decisions interpreting such legislation could significantly and negatively affect our ability to maintain our tax treatment as a RIC or the U.S. federal income tax consequences to us and our stockholders of such qualification, or could have other adverse consequences. Stockholders are urged to consult with their tax advisor regarding tax legislative, regulatory, or administrative developments and proposals and their potential effect on an investment in our securities.
We are an “emerging growth company” and we cannot be certain if the reduced disclosure requirements applicable to emerging growth companies will make our shares of common stock less attractive to investors.
We are an “emerging growth company,” as defined in the Jumpstart Our Business Startups Act of 2012, or the “JOBS Act”, and we intend to take advantage of certain exemptions from various reporting requirements that are applicable to other public companies that are not “emerging growth companies” including, but not limited to, not being required to comply with the auditor attestation requirements of Section 404(b) of the Sarbanes-Oxley Act of 2002. We cannot predict if investors will find shares of our
29
common stock less attractive because we rely on these exemptions. If some investors find our shares of common stock less attractive as a result, there may be a less active trading market for our shares and our share price may be more volatile.
In addition, Section 107 of the JOBS Act also provides that an “emerging growth company” can take advantage of the extended transition period provided in Section 7(a)(2)(B) of the Securities Act for complying with new or revised accounting standards. In other words, an “emerging growth company” can delay the adoption of certain accounting standards until those standards would otherwise apply to private companies. We are choosing to take advantage of the extended transition period for complying with new or revised accounting standards, which may make it more difficult for investors and securities analysts to evaluate us since our financial statements may not be comparable to companies that comply with public company effective dates and may result in less investor confidence. We will remain an emerging growth company until the earlier of (a) the last day of the fiscal year (i) following the fifth anniversary of the completion of our initial public offering (December 31, 2018), (ii) in which we have total annual gross revenue of at least $1.1 billion, or (iii) in which we are deemed to be a large accelerated filer, which means the market value of our common stock that is held by non-affiliates exceeds $700 million as of the prior June 30th, and (b) the date on which we have issued more than $1.1 billion in non-convertible debt during the prior three-year period.
If we fail to maintain an effective system of internal control over financial reporting, we may not be able to accurately report our financial results or prevent fraud. As a result, stockholders could lose confidence in our financial and other public reporting, which would harm our business and the trading price of our common stock.
Effective internal controls over financial reporting are necessary for us to provide reliable financial reports and, together with adequate disclosure controls and procedures, are designed to prevent fraud. Any failure to implement required new or improved controls, or difficulties encountered in their implementation could cause us to fail to meet our reporting obligations. In addition, any testing by us conducted in connection with Section 404 of the Sarbanes-Oxley Act, or the subsequent testing by our independent registered public accounting firm (when undertaken, as noted below), may reveal deficiencies in our internal control over financial reporting that are deemed to be material weaknesses or that may require prospective or retroactive changes to our financial statements or identify other areas for further attention or improvement. Inferior internal controls could also cause investors to lose confidence in our reported financial information, which could have a negative effect on the trading price of our common stock.
We are required to disclose changes made in our internal control on financial reporting on a quarterly basis and our management is required to assess the effectiveness of these controls annually.As of December 31, 2018, we will lose our status as an “emerging growth company” under the JOBS Act, and our independent registered public accounting firm will be required to attest to the effectiveness of our internal control over financial reporting pursuant to Section 404 of the Sarbanes-Oxley Act as of December 31, 2018. An independent assessment of the effectiveness of our internal controls could detect problems that our management’s assessment might not. Undetected material weaknesses in our internal controls could lead to financial statement restatements and require us to incur the expense of remediation.
We seek to maintain effective internal controls over financial reporting and to evaluate and improve the effectiveness of those internal controls in particular when reporting challenges arise. For example, we were unable to timely file this annual report on Form 10-K because additional time, resources, and effort were required to complete procedures and other work relating to certain of the Company’s portfolio company investments. Those additional procedures were required because material financial information from one of these portfolio companies was not promptly supplied to our financial staff by certain senior investment professionals, including the Company’s then-Chief Executive Officer and a senior investment professional responsible for this portfolio company. The senior investment professional with responsibility for the portfolio company resigned. As a result of that matter, the Company had to further evaluate these and other portfolio company investments to ensure all financial data reported in the consolidated financial statements was complete and accurate before filing this annual report on Form 10-K. While the Company has taken remedial measures in response to this matter, as described further in Item 9A of this annual report on Form 10-K, we could fail to meet our financial reporting obligations in the future if a similar matter were to occur and it were not identified by our internal controls.
Regulations governing our operations will affect our ability to raise, and the method for raising, additional capital, which may expose us to risks.
Our business requires a substantial amount of capital. However, we may not be able to raise additional capital in the future on favorable terms or at all. We may issue debt securities, other evidences of indebtedness or preferred stock, and we may borrow money from banks or other financial institutions, which we collectively refer to as “senior securities,” up to the maximum amount permitted by the 1940 Act. Currently, we are generally permitted to issue senior securities in amounts such that our asset coverage, as defined in the 1940 Act, equals at least 200% after each issuance of senior securities; however, as discussed under "Recent legislation may allow us to incur additional leverage" below, we may be permitted to increase our leverage if we receive certain
30
approvals from our independent directors and/or our stockholders. As a result of issuing senior securities, we will also be exposed to typical risks associated with leverage, including an increased risk of loss. If we issue preferred stock, it will rank “senior” to common stock in our capital structure, and will have priority over our common stock as to the distribution of assets and payments of dividends. Preferred stockholders will also have separate voting rights and may have rights, preferences or privileges more favorable than those of holders of our common stock. The issuance of preferred stock could have the effect of delaying, deferring or preventing a transaction or a change of control that might involve a premium price for holders of our common stock or otherwise be in the best interest of the holders of our common stock.
To the extent that we are constrained in our ability to issue debt or other senior securities, we will depend on issuances of common stock to finance our operations. As a BDC, we generally are not able to issue our common stock at a price below net asset value without first obtaining required approvals of our stockholders and independent directors. This requirement may limit our ability to issue additional stock to finance our operations, since our common stock may trade, and has traded at times, at a discount to our net asset value. In addition, if we raise additional funds by issuing more common stock or senior securities convertible into, or exchangeable for, our common stock, the percentage ownership of our stockholders at that time would decrease, which may subject them to dilution. If we cannot raise additional capital, we may be significantly constrained in our ability to make new investments and grow our business.
Recent legislation may allow us to incur additional leverage.
The 1940 Act generally prohibits us from incurring indebtedness unless immediately after such borrowing we have an asset coverage for total borrowings of at least 200% (i.e., the amount of debt may not exceed 50% of the value of our assets). However, recent legislation has modified the 1940 Act by allowing a BDC to increase the maximum amount of leverage it may incur from an asset coverage ratio of 200% to an asset coverage ratio of 150%, if certain requirements are met. Under the legislation, we are allowed to increase our leverage capacity if shareholders representing at least a majority of the votes cast, when quorum is met, approve a proposal to do so. If we receive shareholder approval, we would be allowed to increase our leverage capacity on the first day after such approval. Alternatively, the legislation allows the majority of our independent directors to approve an increase in our leverage capacity, and such approval would become effective after one year. In either case, we would be required to make certain disclosures on our website and in SEC filings regarding, among other things, the receipt of approval to increase our leverage, our leverage capacity and usage, and risks related to leverage.
As a result of this legislation, we may be able to increase our leverage up to an amount that reduces our asset coverage ratio from 200% to 150%. Leverage magnifies the potential for loss on investments in our indebtedness and on invested equity capital. As we use leverage to partially finance our investments, you will experience increased risks of investing in our securities. If the value of our assets increases, then leveraging would cause the net asset value attributable to our common stock to increase more sharply than it would have had we not leveraged. Conversely, if the value of our assets decreases, leveraging would cause net asset value to decline more sharply than it otherwise would have had we not leveraged our business. Similarly, any increase in our income in excess of interest payable on the borrowed funds would cause our net investment income to increase more than it would without the leverage, while any decrease in our income would cause net investment income to decline more sharply than it would have had we not borrowed. Such a decline could negatively affect our ability to pay common stock dividends, scheduled debt payments or other payments related to our securities. Leverage is generally considered a speculative investment technique. See “Risk Factors - Risks Related to Our Business and Structure - Because we borrow money, the potential for loss on amounts invested in us is magnified and may increase the risk of investing in us.”
Because we borrow money in connection with our investment activities, the potential for gain or loss on amounts invested in us is magnified and may increase the risk of investing in us.
Borrowings, also known as leverage, magnify the potential for gain or loss on invested equity capital. As we use leverage to partially finance our investments, you will experience increased risks associated with investing in our common stock. If the value of our assets increases, then leveraging would cause the net asset value attributable to our common stock to increase more sharply than it would have had we not utilized leverage. Conversely, if the value of our assets decreases, leveraging would cause net asset value to decline more sharply than it otherwise would have had we not utilized leverage. Similarly, any increase in our income in excess of interest payable on the borrowed funds would cause our net investment income to increase more than it would without the leverage, while any decrease in our income would cause our net investment income to decline more sharply than it would have had we not borrowed. Such a decline could negatively affect our ability to make distributions to our stockholders.
At December 31, 2017, we had $45.5 million of outstanding indebtedness with an annualized cost of $2.8 million related to interest and unused line fees. In order for us to cover these annualized interest payments on indebtedness, we must achieve annual returns on our investments of at least 2.44%.
31
Advances under our $55.0 million senior secured revolving credit facility with Pacific Western Bank (successor to CapitalSource Bank), as agent and a lender, and each of the lenders from time to time party thereto, including City National Bank (the "Credit Facility"), bear interest at a rate per annum equal to the lesser of (i) LIBOR plus 3.25% and (ii) the maximum rate permitted under applicable law. In addition, the Credit Facility requires payment of a fee for unused amounts during the revolving period, which fee varies depending on the obligations outstanding as follows: (i) 0.75% per annum, if the average daily principal balance of the obligations outstanding for the prior month are less than fifty percent of the maximum loan amount; and (ii) 0.50% per annum, if such obligations outstanding are equal to or greater than fifty percent of the maximum loan amount. In each case, the fee is calculated based on the difference between (i) the maximum loan amount under the Credit Facility and (ii) the average daily principal balance of the obligations outstanding during the prior calendar month. The Credit Facility is secured by all of the Company’s assets. If we are unable to meet the financial obligations under the Credit Facility, and an event of default occurs and is not cured, the lenders under the Credit Facility could exercise their remedies against the Company’s assets and would have a superior claim to such assets over our stockholders.
The Company's $28.8 million of unsecured notes, or the "2022 Notes", have a fixed annual interest rate of 6.125% and require quarterly interest payments until the notes mature in September 2022.
Illustration. The following table illustrates the effect of leverage on returns from an investment in our common stock assuming various annual returns, net of expenses. The calculations in the table below are hypothetical and actual returns may be higher or lower than those appearing below.
Assumed Return on Our Portfolio
(net of expenses)
-10% | -5% | 0% | 5% | 10% | ||||||||||
Corresponding return to stockholder | (19 | )% | (11 | )% | (3 | )% | 4 | % | 12 | % | ||||
Assumes (i) $115.6 million in portfolio investments at December 31, 2017, (ii) $45.5 million in outstanding indebtedness at December 31, 2017, (iii) $81.8 million in net assets at December 31, 2017 and (iv) average cost of funds of 6.2%, which is the estimated weighted average borrowing cost under our Credit Facility and 2022 Notes at December 31, 2017.
All of our assets are subject to security interests under the Credit Facility, and if we default on our obligations under the Credit Facility, we may suffer materially adverse consequences, including foreclosure on our assets.
As of December 31, 2017, all of our assets were pledged as collateral under our Credit Facility. If we default on our obligations under the Credit Facility, the lenders have the right to foreclose upon and sell, or otherwise transfer, the collateral subject to their security interests. If the lenders exercise their right to sell the assets pledged under the Credit Facility, such sales may be completed at distressed sale prices, thereby diminishing or potentially eliminating the amount of cash available to us after repayment of the amounts outstanding under the Credit Facility. Such deleveraging of our company could significantly impair our ability to effectively operate our business and otherwise have a material adverse effect on our financial condition, results of operations and cash flows. Further, in such a circumstance, we could be forced to curtail or cease new investment activities and lower or eliminate the distributions that we have historically paid to our stockholders.
Changes in interest rates may affect our cost of capital and net investment income.
We leverage our investments with borrowed money and plan to continue doing so. As a result our net investment income depends, in part, upon the difference between the rate at which we borrow funds and the rate at which we invest those funds. While we have a significant percentage of floating rate assets to match our floating rate liabilities, we can offer no assurance that a significant change in market interest rates will not have a material adverse effect on our net investment income in the event we use debt to finance our investments.
Our business and operation could be negatively affected if we become subject to shareholder activism, which could cause us to incur significant expense, hinder execution of investment strategy and impact our stock price.
Shareholder activism, which could take many forms or arise in a variety of situations, has been increasing in publicly traded companies and in the BDC space recently. Shareholder activism, including potential proxy contests, could result in substantial costs and divert management’s and our board of directors’ attention and resources from our business. Additionally, such shareholder activism could give rise to perceived uncertainties as to our future, adversely affect our relationships with service providers and make it more difficult to attract and retain qualified personnel. Also, we may be required to incur significant legal fees and other
32
expenses related to activist shareholder matters. Further, our stock price could be subject to significant fluctuation or otherwise be adversely affected by the events, risks and uncertainties of any shareholder activism.
Provisions of the Delaware General Corporation Law and our certificate of incorporation and bylaws could deter takeover attempts and have an adverse impact on the price of our common stock.
The Delaware General Corporation Law and our certificate of incorporation and bylaws contain provisions that may have the effect of discouraging, delaying or making difficult a change in control of our company or the removal of our incumbent directors. The existence of these provisions, among others, may have a negative impact on the price of our common stock and may discourage third-party bids for ownership of our company. These provisions may prevent any premiums being offered to holders of our common stock.
The investment advisory and management agreement with our investment adviser and the administration agreement with our administrator were not negotiated on an arm’s length basis and may not be as favorable to us as if they had been negotiated with an unaffiliated third party.
The investment advisory and management agreement with our investment adviser and the administration agreement with our administrator were negotiated between related parties. Joseph A. Jolson, our Chief Executive Officer and the Chairman of our board of directors, is also the Chief Executive Officer and chairman of the board of directors of JMP Group, which owns, directly or indirectly, a majority interest in HCAP Advisors (the Company's investment adviser) and JMP Credit Advisors (the Company's current and historical administrator). Consequently, the terms of these agreements, including fees payable to our investment adviser, may not be as favorable to us as if they had been negotiated with an unaffiliated third party. In addition, we may choose not to enforce, or to enforce less vigorously, our rights and remedies under these agreements because of our desire to maintain our ongoing relationship with JMP Group and its respective affiliates.
Our board of directors may change our investment objective, operating policies and strategies without prior notice or stockholder approval.
Our board of directors has the authority to modify or waive certain of our operating policies and strategies without prior notice and without stockholder approval. However, absent stockholder approval, we may not change the nature of our business so as to cease to be, or withdraw our election as, a BDC. We cannot predict the effect any changes to our current operating policies and strategies would have on our business, operating results and value of our securities. Nevertheless, the changes may adversely affect our business and affect our ability to make distributions.
The involvement of our investment adviser’s investment professionals in our valuation process may create conflicts of interest.
Our portfolio investments are generally not in publicly traded securities. As a result, the values of these securities are not readily available. We value these securities at fair value as determined in good faith by our board of directors. In connection with that determination, and in addition to valuations prepared by the independent third party valuation firm that we employ, investment professionals from our investment adviser prepare portfolio company valuations based upon the most recent portfolio company financial statements available and projected financial results of each portfolio company. The participation of our investment adviser’s investment professionals in our valuation process could result in a conflict of interest as our investment adviser’s management fee is based on our gross assets.
Our investment adviser has the right to resign on 60 days’ notice, and we may not be able to find a suitable replacement within that time, resulting in a disruption in our operations that could adversely affect our financial condition, business and results of operations.
Our investment adviser has the right, under the investment advisory and management agreement, to resign at any time upon not less than 60 days’ written notice, whether we have found a replacement or not. If our investment adviser resigns, we may not be able to find a new investment adviser or hire internal management with similar expertise and ability to provide the same or equivalent services on acceptable terms within 60 days, or at all. If we are unable to do so quickly, our operations are likely to experience a disruption, our financial condition, business and results of operations as well as our ability to pay distributions are likely to be adversely affected and the market price of our shares may decline. In addition, the coordination of our internal management and investment activities is likely to suffer if we are unable to identify and reach an agreement with a single institution or group of executives having the expertise possessed by our investment adviser and its affiliates. Even if we are able to retain comparable management, whether internal or external, the integration of such management and their lack of familiarity with our investment objective may result in additional costs and time delays that may adversely affect our financial condition, business and results of operations.
33
If we do not invest a sufficient portion of our assets in qualifying assets, we could fail to qualify as a BDC or be precluded from investing according to our current business strategy.
We may not acquire any assets other than “qualifying assets” unless, at the time of and after giving effect to such acquisition, at least 70% of our total assets are qualifying assets. See “Business--Regulation as a BDC.”
We believe that most of the subordinated and senior debt investments that we intend to target should constitute qualifying assets. However, we may be precluded from investing in what we believe are attractive investments if such investments are not qualifying assets for purposes of the 1940 Act. Similarly, these rules could prevent us from making follow-on investments in existing portfolio companies (which could result in the dilution of our position).
A failure on our part to maintain our qualification as a BDC would significantly reduce our operating flexibility.
If we fail to continuously qualify as a BDC, we might be subject to regulation as a registered closed-end investment company under the 1940 Act, which would significantly decrease our operating flexibility. In addition, failure to comply with the requirements imposed on BDCs by the 1940 Act could cause the SEC to bring an enforcement action against us. For additional information on the qualification requirements of a BDC, see the disclosure under the caption “Business--Regulation as a BDC.”
We may have difficulty paying our required distributions if we recognize income before or without receiving cash representing such income.
As a RIC, we will be required to distribute annually at least 90% of our ordinary income and realized net short-term capital gains in excess of realized net long-term capital losses to maintain our eligibility for RIC tax treatment. For U.S. federal income tax purposes, we will include in taxable income certain amounts that we have not yet received in cash, such as contracted payment-in-kind, or PIK, interest, which represents contractual interest added to the loan balance and due at the end of the loan term. The increases in loan balances as a result of contracted payment-in-kind arrangements will be included in income in advance of receiving cash payment, and will be separately identified on our consolidated statements of cash flows. We also may be required to include in income certain other amounts that we will not receive in cash.
Any warrants that we receive in connection with our debt investments will generally be valued as part of the negotiation process with the particular portfolio company. As a result, a portion of the aggregate purchase price for the debt investments and warrants will be allocated to the warrants that we receive. This will generally result in our debt instruments having original issue discount, or "OID,” for tax purposes, which we must recognize as ordinary income as such original issue discount accrues regardless of whether we have received any corresponding payment of such interest. Other features of debt instruments that we hold may also cause such instruments to generate original issue discount.
Since in certain cases we may recognize income before or without receiving cash representing such income, we may have difficulty meeting the requirement to distribute at least 90% of our ordinary income and realized net short-term capital gains in excess of realized net long-term capital losses to maintain our eligibility for regulated investment company tax treatment. Accordingly, we may have to sell some of our assets, raise additional debt or equity capital or reduce new investment originations to meet these distribution requirements. If we are unable to obtain cash from other sources to satisfy such distribution requirements, we may fail to qualify for regulated investment company tax treatment and thus may become subject to corporate-level income tax.
We will be subject to corporate-level income tax and may default under our Credit Facility if we are unable to satisfy certain RIC qualification requirements under Subchapter M of the Code or do not satisfy the annual distribution requirement.
In order to satisfy the requirements for RIC tax treatment, we must meet the following annual distribution, income source and asset diversification requirements to be relieved of federal taxes on income and gains distributed to our stockholders.
• | The Annual Distribution Requirement for a regulated investment company will be satisfied if we distribute to our stockholders on an annual basis at least 90% of our net ordinary income and realized net short-term capital gains in excess of realized net long-term capital losses, if any. Because we use debt financing, we will be subject to an asset coverage ratio requirement under the 1940 Act. If we are unable to obtain cash from other sources, we could fail to qualify for regulated investment company tax treatment and thus become subject to corporate-level income tax. |
34
• | The income source requirement will be satisfied if we obtain at least 90% of our income for each year from dividends, interest, gains from the sale of stock or securities or similar sources. |
• | The asset diversification requirement will be satisfied if we meet certain asset diversification requirements at the end of each quarter of our taxable year. To satisfy this requirement, at least 50% of the value of our assets must consist of cash, cash equivalents, U.S. government securities, securities of other regulated investment companies, and other acceptable securities; and no more than 25% of the value of our assets can be invested in the securities, other than U.S. government securities or securities of other regulated investment companies, of one issuer, of two or more issuers that are controlled, as determined under applicable Code rules, by us and that are engaged in the same or similar or related trades or businesses or of certain “qualified publicly traded partnerships.” Failure to meet these requirements may result in our having to dispose of certain investments quickly in order to prevent the loss of regulated investment company status. Because most of our investments will be in private companies, and therefore will be relatively illiquid, any such dispositions could be made at disadvantageous prices and could result in substantial losses. |
If we fail to satisfy certain RIC qualification requirements under Subchapter M of the Code or to meet the Annual Distribution Requirement for any reason and are subject to corporate income tax, the resulting corporate taxes could substantially reduce our net assets, the amount of income available for distribution and the amount of our distributions. Furthermore, if we fail to maintain our qualification as a RIC, we may be in default under the terms of the Credit Facility. Such a failure would have a material adverse effect on us and our stockholders.
We will continue to need additional capital to finance our growth because we intend to distribute substantially all of our income to our stockholders to maintain our qualification as a RIC. If additional funds are unavailable or are not available on favorable terms, our ability to grow will be impaired.
In order to satisfy the requirements applicable to a RIC, we intend to distribute to our stockholders at least 90% of our ordinary income and realized net short-term capital gains in excess of realized net long-term capital losses. As a BDC, we are generally required to meet a coverage ratio of total assets to total senior securities, which include all of our borrowings and any preferred stock that we may issue in the future. Currently this coverage ratio is 200%. This requirement will limit the amount that we may borrow. Because we will continue to need capital to grow our loan and investment portfolio, this limitation may prevent us from incurring debt and require us to raise additional equity at a time when it may be disadvantageous to do so. While we expect to be able to borrow and to issue additional debt and equity securities, we cannot assure you that debt and equity financing will be available to us on favorable terms, or at all. In addition, as a BDC, we generally are not permitted to issue common stock priced below net asset value without stockholder and independent director approval. However, if we were to obtain the necessary approvals to issue securities at prices below net asset value, our stockholders’ investments would experience dilution as a result of such issuance. If additional funds are not available to us, we could be forced to curtail or cease our lending and investment activities, and our net asset value could decrease.
We are dependent on information systems and systems failures could significantly disrupt our business, which may, in turn, negatively affect our liquidity, financial condition or results of operations.
Our business is dependent on our and third parties' communications and information systems. Any failure or interruption of those systems, including as a result of the termination of an agreement with any third-party service providers, could cause delays or other problems in our activities. Our financial, accounting, data processing, backup or other operating systems and facilities may fail to operate properly or become disabled or damaged as a result of a number of factors including events that are wholly or partially beyond our control and adversely affect our business. There could be:
Our business is dependent on our and third parties' communications and information systems. Any failure or interruption of those systems, including as a result of the termination of an agreement with any third-party service providers, could cause delays or other problems in our activities. Our financial, accounting, data processing, backup or other operating systems and facilities may fail to operate properly or become disabled or damaged as a result of a number of factors including events that are wholly or partially beyond our control and adversely affect our business. There could be:
• | sudden electrical or telecommunications outages; |
• | natural disasters such as earthquakes, tornadoes and hurricanes; |
• | disease pandemics; |
• | events arising from local or larger scale political or social matters, including terrorist acts; and |
• | cyber attacks. |
These events, in turn, could have a material adverse effect on our operating results and negatively affect the market price of our common stock and our ability to pay dividends to our stockholders.
35
We may expose ourselves to risks if we engage in hedging transactions.
If we engage in hedging transactions, we may expose ourselves to risks associated with such transactions. We may utilize instruments such as forward contracts, currency options and interest rate swaps, caps, collars and floors to seek to hedge against fluctuations in the relative values of our portfolio positions from changes in currency exchange rates and market interest rates. Hedging against a decline in the values of our portfolio positions does not eliminate the possibility of fluctuations in the values of such positions or prevent losses if the values of such positions decline. However, such hedging can establish other positions designed to gain from those same developments, thereby offsetting the decline in the value of such portfolio positions. Such hedging transactions may also limit the opportunity for gain if the values of the underlying portfolio positions should increase. Moreover, it may not be possible to hedge against an exchange rate or interest rate fluctuation that is so generally anticipated that we are not able to enter into a hedging transaction at an acceptable price.
The success of our hedging transactions will depend on our ability to correctly predict movements in currencies and interest rates. Therefore, while we may enter into such transactions to seek to reduce currency exchange rate and interest rate risks, unanticipated changes in currency exchange rates or interest rates may result in poorer overall investment performance than if we had not engaged in any such hedging transactions. In addition, the degree of correlation between price movements of the instruments used in a hedging strategy and price movements in the portfolio positions being hedged may vary. Moreover, for a variety of reasons, we may not seek to establish a perfect correlation between such hedging instruments and the portfolio holdings being hedged. Any such imperfect correlation may prevent us from achieving the intended hedge and expose us to risk of loss. In addition, it may not be possible to hedge fully or perfectly against currency fluctuations affecting the value of securities denominated in non-U.S. currencies because the value of those securities is likely to fluctuate as a result of factors not related to currency fluctuations.
Risks Relating to Economic Conditions
Economic recessions or downturns could impair our portfolio companies and harm our operating results.
Many of our portfolio companies are susceptible to economic slowdowns or recessions and may be unable to repay our loans during such periods. Therefore, our non-performing assets will likely increase and the value of our portfolio will likely decrease during these economic conditions. Adverse economic conditions also may decrease the value of collateral securing some of our loans and the value of our equity investments. Further, economic slowdowns or recessions could lead to financial losses in our portfolio and a decrease in revenues, net income and assets. Unfavorable economic conditions also could increase our funding costs, limit our access to the capital markets or result in a decision by lenders not to extend credit to us. These events could prevent us from increasing investments and harm our operating results.
A portfolio company’s failure to satisfy financial or operating covenants imposed by us or other lenders could lead to defaults and, potentially, termination of its loans and foreclosure on its secured assets, which could trigger cross-defaults under other agreements and jeopardize such portfolio company’s ability to meet its obligations under debt securities that we hold. We may incur expenses to the extent necessary to seek recovery upon default or to negotiate new terms with a defaulting portfolio company. In addition, if one of our portfolio companies were to go bankrupt, even if we had structured our interest as senior debt, depending on the facts and circumstances, including the extent to which we actually provided managerial assistance to that portfolio company, a bankruptcy court might re-characterize our debt holding and subordinate all or a portion of our claim to that of other creditors.
The capital markets may experience periods of disruption and instability. Such market conditions may materially and adversely affect debt and equity capital markets in the United States, which may have a negative impact on our business and operations.
From time to time, the U.S. capital markets may experience periods of disruption and instability. For example, between 2008 and 2009, the U.S. capital markets were unstable and experienced extreme volatility and disruption. Those disruptions in the capital markets increased the spread between the yields realized on risk-free and higher risk securities and resulted in illiquidity in parts of the capital markets, significant write-offs in the financial services sector, the re-pricing of credit risk in certain credit markets, and the failure of major financial institutions. Those capital markets conditions also resulted in recessionary conditions and depressed levels of consumer and commercial spending. While market conditions have experienced relative stability in recent years, there can be no assurance that adverse market conditions will not repeat themselves in the future or otherwise worsen. If existing market conditions worsen or the market conditions similar to those experienced from 2008 through 2009 were to be repeated for any substantial length of time, the U.S. capital markets could experience a prolonged period of market illiquidity, which could have a material adverse effect on our business, financial condition, and results of operations. Unfavorable economic conditions also could increase our funding costs, limit our access to the capital markets, or result in a decision by lenders not to extend credit to us. These events could limit our investment originations, limit our ability to grow, and negatively impact our operating results.
36
In addition, significant changes or volatility in the capital markets may also have a negative effect on the valuations of our investments. While most of our investments are not publicly traded, applicable accounting standards require us to assume as part of our valuation process that our investments are sold in a principal market to market participants (even if we plan on holding an investment through its maturity). Significant changes in the capital markets may also affect the pace of our investment activity and the potential for liquidity events involving our investments. Thus, the illiquidity of our investments may make it difficult for us to sell such investments to access capital if required, and as a result, we could realize significantly less than the value at which we have recorded our investments if we were required to sell them for liquidity purposes. An inability to raise or access capital could have a material adverse effect on our business, financial condition or results of operations.
Changes to United States tariff and import/export regulations may have a negative effect on our portfolio companies and, in turn, harm us.
There has been on-going discussion and commentary regarding potential significant changes to United States trade policies, treaties and tariffs. The current administration, along with Congress, has created significant uncertainty about the future relationship between the United States and other countries with respect to the trade policies, treaties and tariffs. These developments, or the perception that any of them could occur, may have a material adverse effect on global economic conditions and the stability of global financial markets, and may significantly reduce global trade and, in particular, trade between the impacted nations and the United States. Any of these factors could depress economic activity and restrict our portfolio companies’ access to suppliers or customers and have a material adverse effect on their business, financial condition and results of operations, which in turn would negatively impact us.
Risks Relating to Our Investments
We operate in a highly competitive market for investment opportunities.
We face competition from entities that also make the types of investments that we plan to make. We compete with public and private funds (including other BDCs), commercial and investment banks, commercial financing companies and, to the extent they provide an alternative form of financing, private equity funds. Many of our potential competitors are substantially larger and have considerably greater financial, technical and marketing resources than we do. For example, some competitors may have a lower cost of funds and access to funding sources that are not available to us. In addition, some of our competitors may have higher risk tolerances or different risk assessments than we do, which could allow them to consider a wider variety of investments and establish more relationships than us. Furthermore, many of our competitors are not subject to the regulatory restrictions that the 1940 Act imposes on us. We cannot assure you that the competitive pressures we face will not have a material adverse effect on our business, financial condition and results of operations. Also, as a result of this competition, we may not be able to take advantage of attractive investment opportunities from time to time, and we can offer no assurance that we will be able to continue to identify and make investments that are consistent with our investment objective.
We do not seek to compete primarily based on the interest rates we offer, and we believe that some of our competitors may make loans with interest rates that are comparable to or lower than the rates we offer. We may lose investment opportunities if we do not match our competitors’ pricing, terms and structure. However, if we match our competitors’ pricing, terms and structure, we may experience decreased net interest income and increased risk of credit loss.
Our investments may be risky, and we could lose all or part of our principal.
Our portfolio consists primarily of directly originated investments in subordinated and senior debt of small to mid-size companies. In addition, we may make non-control, equity co-investments in these companies in conjunction with our debt investments.
Subordinated debt investments. We generally structure our subordinated debt investments with a security interest that ranks junior to a company’s secured debt in priority of payment, but senior to a company’s preferred or common stock. As such, other creditors will rank senior to us in the event of insolvency, which may result in an above average amount of risk and loss of principal.
Senior debt investments. We also invest in senior debt of small and mid-sized companies. Senior debt investments are typically secured by the assets of the portfolio company, including a pledge of the capital stock of the portfolio company’s subsidiaries, and are senior to all other junior capital in terms of payment priority. There is, however, a risk that the collateral securing these loans may decrease in value over time, may be difficult to sell in a timely manner, may be difficult to appraise and may fluctuate in value based upon the success of the portfolio company and market conditions, including as a result of the inability of the portfolio company to raise additional capital, and, in some circumstances, our lien could be subordinated to claims of other
37
creditors. In addition, deterioration in a portfolio company’s financial condition and prospects, including its inability to raise additional capital, may be accompanied by deterioration in the value of the collateral for the loan. Consequently, the fact that a loan is secured does not guarantee that we will receive principal and interest payments according to the loan’s terms, or at all, or that we will be able to collect on the loan should we be forced to enforce our remedies.
Equity investments. When we invest in subordinated debt or senior debt, we may acquire equity securities as well. In addition, we may invest directly in the equity securities of portfolio companies. Our goal is ultimately to dispose of such equity interests and realize gains upon our disposition of such interests. Accordingly, we may not be able to realize gains from our equity interests, and any gains that we do realize on the disposition of any equity interests may not be sufficient to offset any other losses we experience.
The lack of liquidity in our investments may adversely affect our business.
We generally make investments in private companies. Substantially all of these securities are subject to legal and other restrictions on resale or are otherwise less liquid than publicly traded securities. The illiquidity of our investments may make it difficult for us to sell such investments if the need arises. In addition, if we are required to liquidate all or a portion of our portfolio quickly, we may realize significantly less than the value at which we have previously recorded our investments. In addition, we may face other restrictions on our ability to liquidate an investment in a portfolio company to the extent that we or our investment adviser have material non-public information regarding such portfolio company.
Our failure to make follow-on investments in our portfolio companies could impair our investment in a portfolio company.
Following an initial investment in a portfolio company, we may make additional investments in that portfolio company as “follow-on” investments, in order to:
• | increase or maintain in whole or in part our equity ownership percentage in a portfolio company; |
• | exercise warrants, options or convertible securities that were acquired in the original or subsequent financing; or |
• | attempt to preserve or enhance the value of our investment. |
We may elect not to make follow-on investments or otherwise lack sufficient funds to make those investments. We will have the discretion to make any follow-on investments, subject to any applicable legal requirements, including the RIC diversification requirements, and the availability of capital resources. The failure to make follow-on investments may, in some circumstances, jeopardize the continued viability of a portfolio company and our initial investment, or may result in a missed opportunity for us to increase our participation in a successful operation. Even if we have sufficient capital to make a desired follow-on investment, we may elect not to make a follow-on investment because we may not want to increase our concentration or level of risk, either because we prefer other opportunities (or because we are inhibited by compliance with BDC requirements or the desire to maintain our RIC tax status).
Because we generally do not hold controlling equity interests in our portfolio companies, we may not be in a position to exercise control over our portfolio companies or to prevent decisions by the management of our portfolio companies that could decrease the value of our investments.
Although we may do so in the future, we generally do not take controlling equity positions in our portfolio companies. As a result, we will be subject to the risk that a portfolio company may make business decisions with which we disagree, and that the management and/or stockholders of a portfolio company may take risks or otherwise act in ways that are adverse to our interests. Due to the lack of liquidity of the debt and equity investments that we will typically hold in our portfolio companies, we may not be able to dispose of our investments in the event we disagree with the actions of a portfolio company and may therefore suffer a decrease in the value of our investments.
Defaults by our portfolio companies will harm our operating results.
A portfolio company’s failure to satisfy financial or operating covenants imposed by us or other lenders could lead to defaults and, potentially, termination of its loans and foreclosure on its assets. This could trigger cross-defaults under other agreements and jeopardize such portfolio company’s ability to meet its obligations under the debt or equity securities that we hold. We may incur expenses to the extent necessary to seek recovery upon default or to negotiate new terms, which may include the waiver of certain financial covenants, with a defaulting portfolio company.
38
Prepayments of our debt investments by our portfolio companies could adversely impact our results of operations and ability to make stockholder distributions and result in a decline in the market price of our shares.
We are subject to the risk that the debt investments we make in our portfolio companies may be repaid prior to maturity. We expect that our investments will generally allow for repayment at any time subject to certain penalties. When this occurs, we intend to generally reinvest these proceeds in temporary investments, pending their future investment in accordance with our investment strategy. These temporary investments will typically have substantially lower yields than the debt being prepaid, and we could experience significant delays in reinvesting these amounts. Any future investment may also be at lower yields than the debt that was repaid. As a result, our results of operations could be materially adversely affected if one or more of our portfolio companies elects to prepay amounts owed to us. Additionally, prepayments could negatively impact our ability to make, or the amount of, stockholder distributions with respect to our common stock, which could result in a decline in the market price of our shares.
An investment strategy focused primarily on privately held companies presents certain challenges, including the lack of available information about these companies, a dependence on the talents and efforts of only a few key portfolio company personnel and a greater vulnerability to economic downturns.
We invest primarily in privately held companies. Generally, little public information exists about these companies, and we will be required to rely on the ability of our investment adviser’s investment professionals to obtain adequate information to evaluate the potential returns from investing in these companies. If we are unable to uncover all material information about these companies, we may not make a fully informed investment decision, and we may lose money on our investments. Also, privately held companies frequently have less diverse product lines and smaller market presence than larger competitors. These factors could adversely affect our investment returns as compared to companies investing primarily in the securities of public companies.
Our portfolio companies may incur debt that ranks equally with, or senior to, our investments in such companies.
We invest primarily in subordinated debt, senior debt, and, to a lesser extent, equity securities issued by our portfolio companies. Some of our portfolio companies have, or may be permitted to incur, other debt that ranks equally with, or senior to, the debt securities in which we invest. By their terms, such debt instruments may provide that the holders are entitled to receive payment of interest or principal on or before the dates on which we are entitled to receive payments. Also, in the event of insolvency, liquidation, dissolution, reorganization or bankruptcy of a portfolio company, holders of debt instruments ranking senior to our investment in that portfolio company would typically be entitled to receive payment in full before we receive any distribution in respect of our investment. After repaying such senior creditors, such portfolio company may not have any remaining assets to use for repaying its obligation to us. In the case of debt ranking equally with debt securities in which we invest, we would have to share on an equal basis any distributions with other creditors holding such debt in the event of an insolvency, liquidation, dissolution, reorganization or bankruptcy of the relevant portfolio company.
There may be circumstances where our debt investments could be subordinated to claims of other creditors or we could be subject to lender liability claims.
Even though we may have structured certain of our investments as senior debt, if one of our portfolio companies were to go bankrupt, depending on the facts and circumstances and based upon principles of equitable subordination as defined by existing case law, a bankruptcy court could subordinate all or a portion of our claim to that of other creditors and transfer any lien securing such subordinated claim to the bankruptcy estate. The principles of equitable subordination defined by case law have generally indicated that a claim may be subordinated only if its holder is guilty of misconduct or where the senior loan is re-characterized as an equity investment and the senior lender has actually provided significant managerial assistance to the bankrupt debtor. We may also be subject to lender liability claims for actions taken by us with respect to a borrower’s business or instances where we exercise control over the borrower. It is possible that we could become subject to a lender's liability claim, including as a result of actions taken in rendering significant managerial assistance or actions to compel and collect payments from the borrower outside the ordinary course of business.
Second priority liens on collateral securing loans that we make to our portfolio companies may be subject to control by senior creditors with first priority liens. If there is a default, the value of the collateral may not be sufficient to repay in full both the first priority creditors and us.
39
Certain loans that we make to portfolio companies will be secured on a second priority basis by the same collateral securing senior secured debt of such companies. The first priority liens on the collateral will secure the portfolio company’s obligations under any outstanding senior debt and may secure certain other future debt that may be permitted to be incurred by the company under the agreements governing the loans. The holders of obligations secured by the first priority liens on the collateral will generally control the liquidation of and be entitled to receive proceeds from any realization of the collateral to repay their obligations in full before us. In addition, the value of the collateral in the event of liquidation will depend on market and economic conditions, the availability of buyers and other factors. There can be no assurance that the proceeds, if any, from the sale or sales of all of the collateral would be sufficient to satisfy the loan obligations secured by the second priority liens after payment in full of all obligations secured by the first priority liens on the collateral. If such proceeds are not sufficient to repay amounts outstanding under the loan obligations secured by the second priority liens, then we, to the extent not repaid from the proceeds of the sale of the collateral, will only have an unsecured claim against the company’s remaining assets, if any.
The rights we may have with respect to the collateral securing the loans we make to our portfolio companies with senior debt outstanding may also be limited pursuant to the terms of one or more intercreditor agreements that we enter into with the holders of senior debt. Under such an intercreditor agreement, at any time that obligations that have the benefit of the first priority liens are outstanding, any of the following actions that may be taken in respect of the collateral will be at the direction of the holders of the obligations secured by the first priority liens: the ability to cause the commencement of enforcement proceedings against the collateral; the ability to control the conduct of such proceedings; the approval of amendments to collateral documents; releases of liens on the collateral; and waivers of past defaults under collateral documents. We may not have the ability to control or direct such actions, even if our rights are adversely affected.
Our portfolio is concentrated in a limited number of portfolio companies and industries, which will subject us to a risk of significant loss if any of these companies defaults on its obligations under any of its debt instruments or if there is a downturn in a particular industry.
Our portfolio is concentrated in a limited number of portfolio companies and industries. Although we will be subject to the asset diversification requirements associated with our qualification as a RIC under the Code and have adopted a guideline that we will generally refrain from investing more than 15% of our portfolio in any single industry sector, our portfolio may be subject to concentration risk due to our investment in a limited number of portfolio companies. As a result, the aggregate returns we realize may be significantly adversely affected if a small number of investments perform poorly or if we need to write down the value of any one investment. Additionally, a downturn in any particular industry in which we are invested could also significantly impact the aggregate returns we realize. As of December 31, 2017, we had one loan on non-accrual status. This loan comprised approximately 7.2% of our debt portfolio at cost, which may be a higher percentage of the portfolio at cost than the BDC industry average. The continued failure by borrowers under these loans to pay interest and repay principal, and the failure by other borrowers to make such payments, could have a material adverse effect on our financial condition and results of operation and, consequently, our ability to meet our payment obligations under the 2022 Notes.
Risks Relating to Our Securities and an Offering of Our Securities
We may be unable to invest a significant portion of the net proceeds from an offering of our securities on acceptable terms within an attractive timeframe.
Delays in investing the net proceeds raised in an offering of our securities may cause our performance to be worse than that of other fully invested BDCs or other lenders or investors pursuing comparable investment strategies. We cannot assure you that we will be able to identify any investments that meet our investment objective or that any investment that we make will produce a positive return. We may be unable to invest the net proceeds of any offering on acceptable terms within the time period that we anticipate or at all, which could harm our financial condition and operating results.
We anticipate that, depending on market conditions, it may take us a substantial period of time to invest substantially all of the net proceeds of any offering in securities meeting our investment objective. During this period, we will invest the net proceeds of an offering primarily in cash, cash equivalents, U.S. government and agency securities, repurchase agreements relating to such securities, and high-quality debt instruments maturing in one year or less from the time of investment, which may produce returns that are significantly lower than the returns which we expect to achieve when our portfolio is fully invested in securities meeting our investment objective. As a result, any distributions that we pay during this period may be substantially lower than the distributions that we may be able to pay when our portfolio is fully invested in securities meeting our investment objective. In addition, until such time as the net proceeds of an offering are invested in securities meeting our investment objective, the market
40
price for our common stock may decline. Thus, the return on an investment in us may be lower than when, if ever, our portfolio is fully invested in securities meeting our investment objective.
We may allocate the net proceeds from an offering in ways with which you may not agree.
We will have significant flexibility in investing the net proceeds of an offering and may use the net proceeds from an offering in ways with which you may not agree or for purposes other than those contemplated at the time of the offering. In addition, we can provide you with no assurance that by increasing the size of our available equity capital our expense ratio or debt ratio will be lowered.
Shares of closed-end investment companies, including BDCs, may trade at a discount to their net asset value.
Shares of closed-end investment companies, including BDCs, may trade at a discount to net asset value. This characteristic of closed-end investment companies and BDCs is separate and distinct from the risk that our net asset value per share may decline. We cannot predict whether our common stock will trade at, above or below net asset value. In addition, if our common stock trades below net asset value, we will generally not be able to issue additional common stock at the market price unless our stockholders approve such a sale and our independent directors make certain determinations.
If our investments do not meet our performance expectations, our stockholders may not receive distributions or a portion of our distributions may be a return of capital.
We make and expect to continue to make distributions on a monthly basis to our stockholders. We may not be able to achieve operating results that will allow us to continue to make distributions at a specific level or to increase the amount of these distributions from time to time. Also, restrictions and provisions in our Credit Facility and any future credit facilities may limit our ability to make distributions in certain circumstances. If we do not distribute annually at least 90% of our ordinary income and realized net short-term capital gains in excess of realized net long-term losses, we will be subject to corporate-level federal income tax, which may reduce the amounts available for distribution. We cannot assure you that you will receive distributions at a particular level or at all.
When we make distributions, we will be required to determine the extent to which such distributions are paid out of current or accumulated earnings and profits. Distributions in excess of current and accumulated earnings and profits will be treated as a non-taxable return of capital to the extent of an investor’s basis in our stock and, assuming that an investor holds our stock as a capital asset, thereafter as a capital gain.
The market price of our common stock may fluctuate significantly.
The market price and liquidity of the market for our securities may be significantly affected by numerous factors, some of which are beyond our control and may not be directly related to our operating performance. These factors include:
• | significant volatility in the market price and trading volume of securities of BDCs or other companies in our sector, which is not necessarily related to the operating performance of these companies; |
• | changes in regulatory policies or tax guidelines, particularly with respect to RICs or BDCs; |
• | failure to qualify or loss of our qualification, as applicable, as a RIC or BDC; |
• | changes in earnings or variations in operating results; |
• | changes in the value of our portfolio of investments; |
• | changes in accounting guidelines governing valuation of our investments; |
• | any shortfall in revenue or net income or any increase in losses from levels expected by investors or securities analysts; |
• | departures of key personnel; |
• | loss of a major funding source; |
• | operating performance of companies comparable to us; |
• | litigation and governmental investigations; and |
41
• | economic and political conditions or events. |
Such fluctuations in the market price and demand for our common stock may limit or prevent investors from readily selling their common stock and may otherwise negatively affect the liquidity of our common stock.
Sales of substantial amounts of our common stock in the public market may have an adverse effect on the market price of our common stock.
Sales of substantial amounts of our common stock, or the availability of such common stock for sale, could adversely affect the prevailing market prices for our common stock. If this occurs and continues, it could impair our ability to raise additional capital through the sale of securities should we desire to do so.
Stockholders may experience dilution in their ownership percentage if they do not participate in our dividend reinvestment plan.
All distributions declared in cash payable to stockholders that are participants in our dividend reinvestment plan are generally automatically reinvested in shares of our common stock. As a result, stockholders that do not participate in the dividend reinvestment plan may experience dilution over time. Stockholders who receive distributions in shares of common stock may experience accretion to the net asset value of their shares if our shares are trading at a premium and dilution if our shares are trading at a discount. The level of accretion or discount would depend on various factors, including the proportion of our stockholders who participate in the plan, the level of premium or discount at which our shares are trading and the amount of the distribution payable to a stockholder.
Investing in our securities may involve an above average degree of risk.
The investments we make in accordance with our investment objective may result in a higher amount of risk, and higher volatility or loss of principal, than alternative investment options. Our investments in portfolio companies may be speculative and, therefore, an investment in our securities may not be suitable for someone with lower risk tolerance.
If we issue preferred stock and/or debt securities, the net asset value and market value of our common stock may become more volatile or otherwise adversely affected.
We cannot assure you that the issuance of preferred stock and/or debt securities would result in a higher yield or return to the holders of our common stock. The issuance of preferred stock and/or debt securities would likely cause the net asset value and market value of our common stock to become more volatile. If the distribution rate on the preferred stock, or the interest rate on the debt securities, were to approach the net rate of return on our investment portfolio, the benefit of leverage to the holders of our common stock would be reduced. If the distribution rate on the preferred stock, or the interest rate on the debt securities, were to exceed the net rate of return on our portfolio, the use of leverage would result in a lower rate of return to the holders of common stock than if we had not issued the preferred stock and/or debt securities. Any decline in the net asset value of our investment would be borne entirely by the holders of our common stock. Therefore, if the market value of our portfolio were to decline, the leverage would result in a greater decrease in net asset value to the holders of our common stock than if we were not leveraged through the issuance of preferred stock and/or debt securities. This decline in net asset value would also tend to cause a greater decline in the market price for our common stock.
The issuance of shares of preferred stock with dividend or conversion rights, liquidation preferences or other economic terms favorable to the holders of preferred stock could also adversely affect the market price for our common stock by making an investment in our common stock less attractive. In addition, except in limited circumstances, the 1940 Act imposes certain features onto any preferred stock we issue that may make an investment in our common stock less attractive or otherwise limit our operational flexibility, including:
• | preferred stock constitutes a “senior security” for purposes of the asset coverage test; |
• | dividends on any preferred stock we issue generally must be cumulative; |
• | payments of dividends on and repayments of the liquidation preference of preferred stock must take preference over any dividends or other payments to our common stockholders; |
42
• | the holders of shares of preferred stock, if any are issued, must be entitled as a class to elect two directors at all times and to elect a majority of the directors if and for so long as dividends on the preferred stock are in arrears by two years or more; and |
• | under the terms of such securities, we may not be permitted to declare a cash distribution on our common stock or purchase our common stock unless our preferred stock (together with all of our other senior securities) has at the time of the declaration of any such distribution or at the time of any such purchase an asset coverage ratio of at least 200% or, if we obtain the required approvals from our independent directors and/or stockholders, 150% (after deducting the amount of such dividend, distribution or purchase price, as the case may be). |
There is also a risk that, in the event of a sharp decline in the value of our net assets, we would be in danger of failing to maintain required asset coverage ratios which may be required by the preferred stock and/or debt securities or of a downgrade in the ratings of the preferred stock and/or debt securities or our current investment income might not be sufficient to meet the distribution requirements on the preferred stock or the interest payments on the debt securities.
In order to counteract such an event, we might need to liquidate investments in order to fund redemption of some or all of the preferred stock and/or debt securities. In addition, we would pay (and the holders of our common stock would bear) all costs and expenses relating to the issuance and ongoing maintenance of the preferred stock and/or debt securities. Holders of preferred stock and/or debt securities may have different interests than holders of common stock and may at times have disproportionate influence over our affairs.
The trading market or market value of our debt securities or any convertible debt securities, if issued to the public, may be volatile.
Our debt securities or any convertible debt securities, if issued to the public, may or may not have an established trading market. We cannot assure investors that a trading market for our debt securities or any convertible debt securities, if issued to the public, would develop or be maintained if developed. In addition to our creditworthiness, many factors may materially adversely affect the trading market for, and market value of, our publicly issued debt securities or any convertible debt securities. These factors include, but are not limited to, the following:
• | the time remaining to the maturity of these debt securities; |
• | the outstanding principal amount of debt securities with terms identical to these debt securities; |
• | the general economic environment; |
• | the supply of debt securities trading in the secondary market, if any; |
• | the redemption, repayment or convertible features, if any, of these debt securities; |
• | the level, direction and volatility of market interest rates generally; and |
• | market rates of interest higher or lower than rates borne by the debt securities. |
There also may be a limited number of buyers for our debt securities. This too may materially adversely affect the market value of the debt securities or the trading market for the debt securities. Our debt securities may include convertible features that cause them to more closely bear risks associated with an investment in our common stock.
Terms relating to redemption may materially adversely affect the return on any debt securities.
If we issue any debt securities or any convertible debt securities that are redeemable at our option we may choose to redeem the debt securities at times when prevailing interest rates are lower than the interest rate paid on the debt securities. In addition, if the debt securities are subject to mandatory redemption, we may be required to redeem the debt securities at times when prevailing interest rates are lower than the interest rate paid on the debt securities. In this circumstance, a holder of our debt securities may not be able to reinvest the redemption proceeds in a comparable security at an effective interest rate as high as the debt securities being redeemed.
The issuance of subscription rights, warrants or convertible debt that are exchangeable for our common stock, will cause your interest in us to be diluted as a result of any such rights, warrants or convertible debt offering.
43
Stockholders who do not fully exercise rights, warrants or convertible debt issued to them in any offering of subscription rights, warrants or convertible debt to purchase our common stock should expect that they will, at the completion of the offering, own a smaller proportional interest in us than would otherwise be the case if they fully exercised their rights, warrants or convertible debt. We cannot state precisely the amount of any such dilution in share ownership because we do not know what proportion of the common stock would be purchased as a result of any such offering.
In addition, if the subscription price, warrant price or convertible debt price is less than our net asset value per share of common stock at the time of such offering, then our stockholders would experience an immediate dilution of the aggregate net asset value of their shares as a result of the offering. The amount of any such decrease in net asset value is not predictable because it is not known at this time what the subscription price, warrant price, convertible debt price or net asset value per share will be on the expiration date of such offering or what proportion of our common stock will be purchased as a result of any such offering. The risk of dilution is greater if there are multiple rights offerings. However, our board of directors will make a good faith determination that any offering of subscription rights, warrants or convertible debt would result in a net benefit to existing stockholders.
Future offerings of debt securities, which would be senior to our common stock upon liquidation, or equity securities, which could dilute our existing stockholders and may be senior to our common stock for the purposes of distributions, may harm the value of our common stock.
In the future, we may attempt to increase our capital resources by making offerings of debt or equity securities, including commercial paper, medium-term notes, senior or subordinated notes and classes of preferred stock or common stock, subject to the restrictions of the 1940 Act. Upon a liquidation of our company, holders of our debt securities and shares of preferred stock and lenders with respect to other borrowings would receive a distribution of our available assets prior to the holders of our common stock. Additional equity offerings by us may dilute the holdings of our existing stockholders or reduce the value of our common stock, or both. Any preferred stock we may issue would have a preference on distributions that could limit our ability to make distributions to the holders of our common stock. Because our decision to issue securities in any future offering will depend on market conditions and other factors beyond our control, we cannot predict or estimate the amount, timing or nature of our future offerings. Thus, our stockholders bear the risk of our future offerings reducing the market price of our common stock and diluting their stock holdings in us. In addition, proceeds from a sale of common stock will likely be used to increase our total assets or to pay down our borrowings, among other uses. This would increase our asset coverage ratio and permit us to incur additional leverage under rules pertaining to BDCs by increasing our borrowings or issuing senior securities such as preferred stock or additional debt securities.
We have unsecured 2022 Notes that are effectively subordinated to any secured indebtedness we have incurred or may incur in the future.
Our 2022 Notes are not secured by any of our assets. As a result, the 2022 Notes are effectively subordinated to any secured indebtedness we, have outstanding or that they may incur in the future (or any indebtedness that is initially unsecured to which we subsequently grant security) to the extent of the value of the assets securing such indebtedness. In any liquidation, dissolution, bankruptcy, or other similar proceeding, the holders of any of our existing or future secured indebtedness may assert rights against the assets pledged to secure that indebtedness in order to receive full payment of their indebtedness before the assets may be used to pay other creditors, including the holders of the 2022 Notes. As of December 31, 2017, we had $16.7 million in outstanding indebtedness under our Credit Facility. This indebtedness is secured by all of our assets and therefore effectively senior to the 2022 Notes to the extent of the value of such assets.
The 2022 Notes are structurally subordinated to the indebtedness and other liabilities of our future subsidiaries.
The 2022 Notes are obligations exclusively of Harvest Capital Credit Corporation and not of any subsidiaries that we may have. None of our future subsidiaries, if any, will be a guarantor of the 2022 Notes, and the 2022 Notes are not required to be guaranteed by any subsidiaries we may have.
Except to the extent we are a creditor with recognized claims against our subsidiaries, all claims of creditors, including trade creditors, and holders of preferred stock, if any, of our subsidiaries, if any, will have priority over our claims (and therefore the claims of our creditors, including holders of the 2022 Notes) with respect to the assets of such subsidiaries. Even if we were recognized as a creditor of one or more of our existing or future subsidiaries, if any, our claims would still be effectively subordinated to any security interests in the assets of any such existing or future subsidiary and to any indebtedness or other liabilities of any such subsidiary senior to our claims. Consequently, the 2022 Notes will be subordinated structurally to all indebtedness and other
44
liabilities, including trade payables, of any subsidiaries that we may in the future acquire or establish as financing vehicles or otherwise. All of the existing indebtedness of our existing and future subsidiaries would be structurally senior to the 2022 Notes.
The indenture under which the 2022 Notes are issued contains limited protection for holders of the 2022 Notes.
The indenture under which the 2022 Notes are issued offers limited protection to holders of the 2022 Notes. The terms of the indenture and the 2022 Notes do not restrict our or any of our future subsidiaries’ ability to engage in, or otherwise be a party to, a variety of corporate transactions, circumstances or events that could have an adverse impact on an investment in the 2022 Notes. In particular, the terms of the indenture and the 2022 Notes do not place any restrictions on our or our subsidiaries’ ability to:
• | issue securities or otherwise incur additional indebtedness or other obligations, including (1) any indebtedness or other obligations that would be equal in right of payment to the 2022 Notes, (2) any indebtedness or other obligations that would be secured and therefore rank effectively senior in right of payment to the 2022 Notes to the extent of the values of the assets securing such debt, (3) indebtedness of ours that is guaranteed by one or more of our subsidiaries and which therefore is structurally senior to the 2022 Notes, and (4) securities, indebtedness, or obligations issued or incurred by our subsidiaries that would be senior to our equity interests in our subsidiaries and therefore rank structurally senior to the 2022 Notes with respect to the assets of our subsidiaries, in each case other than an incurrence of indebtedness or other obligation that would cause a violation of Section 18(a)(1)(A) as modified by Section 61(a)(1) of the 1940 Act or any successor provisions, whether or not we continue to be subject to such provisions of the 1940 Act, but giving effect, in each case, to any exemptive relief granted to us by the SEC. Currently, these provisions generally prohibit us from incurring additional borrowings, including through the issuance of additional debt securities, unless our asset coverage, as defined in the 1940 Act, equals at least 200% after such borrowings , but recently passed legislation may allow us to reduce our asset coverage ratio to 150% and increase our leverage if we obtain certain approvals as described under "--Recent legislation may allow us to incur additional leverage."; |
• | pay dividends on, or purchase or redeem or make any payments in respect of, capital stock or other securities ranking junior in right of payment to the 2022 Notes, except that we have agreed that, for the period of time during which the 2022 Notes are outstanding, we will not violate Section 18(a)(1)(B) as modified by (i) Section 61(a)(1) of the 1940 Act or any successor provisions and after giving effect to any exemptive relief granted to us by the SEC and (ii) the following two exceptions: (A) we will be permitted to declare a cash dividend or distribution notwithstanding the prohibition contained in Section 18(a)(1)(B) as modified by Section 61(a)(1) of the 1940 Act, but only up to such amount as is necessary for us to maintain our status as a regulated investment company under Subchapter M of the Internal Revenue Code of 1986; and (B) this restriction will not be triggered unless and until such time as our asset coverage has not been in compliance with the minimum asset coverage required by Section 18(a)(1)(B) as modified by Section 61(a)(1) of the 1940 Act (after giving effect to any exemptive relief granted to us by the SEC) for more than six consecutive months. If Section 18(a)(1)(B) as modified by Section 61(a)(1) of the 1940 Act were applicable to us, these provisions would generally prohibit us from declaring any cash dividend or distribution upon any class of our capital stock, or purchasing any such capital stock if our asset coverage, as defined in the 1940 Act, were below 200% at the time of the declaration of the dividend or distribution or the purchase and after deducting the amount of such dividend, distribution or purchase, but recently passed legislation may allow us to reduce our asset coverage ratio to 150% and increase our leverage if we obtain certain approvals as described under "--Recent legislation may allow us to incur additional leverage."; |
• | sell assets (other than certain limited restrictions on our ability to consolidate, merge, or sell all or substantially all of our assets); |
• | enter into transactions with affiliates; |
• | create liens (including liens on the shares of our future subsidiaries) or enter into sale and leaseback transactions; |
• | make investments; or |
• | create restrictions on the payment of dividends or other amounts to us from any of our future subsidiaries. |
Additionally, the indenture governing the 2022 Notes does not require us to make an offer to purchase the 2022 Notes in connection with a change of control or any other event.
45
Furthermore, the terms of the indenture and the 2022 Notes do not protect holders of the 2022 Notes in the event that we experience changes (including significant adverse changes) in our financial condition, results of operations or credit ratings, as they do not require that we or any of our future subsidiaries adhere to any financial tests or ratios or specified levels of net worth, revenues, income, cash flow or liquidity.
Our ability to recapitalize, incur additional debt and take a number of other actions that are not limited by the terms of the 2022 Notes may have important consequences for holders of the 2022 Notes, including making it more difficult for us to satisfy our obligations with respect to the 2022 Notes or negatively affecting the trading value of the 2022 Notes.
Other debt we issue or incur in the future could contain more protections for its holders than the indenture and the 2022 Notes, including additional covenants and events of default. The issuance or incurrence of any such debt with incremental protections could affect the market for and trading levels and prices of the 2022 Notes.
An active trading market for the 2022 Notes may not exist, which could limit the market price of the 2022 Notes or a holder's ability to sell them.
The 2022 Notes are a new issue of debt securities listed on the NASDAQ Global Market under the symbol “HCAPZ.” Although the 2022 Notes are listed on NASDAQ, we cannot provide any assurances that an active trading market will exist in the future for the 2022 Notes or that holders will be able to sell their 2022 Notes. Even if an active trading market does exist, the 2022 Notes may trade at a discount from their initial offering price depending on prevailing interest rates, the market for similar securities, our credit ratings, general economic conditions, our financial condition, performance and prospects, and other factors. To the extent an active trading market does not exist, the liquidity and trading price for the 2022 Notes may be harmed.
We may choose to redeem the 2022 Notes when prevailing interest rates are relatively low.
We may choose to redeem the 2022 Notes from time to time, especially when prevailing interest rates are lower than the rate borne by the 2022 Notes. If prevailing rates are lower at the time of redemption, and we were to redeem the 2022 Notes, a holder of the 2022 Notes would not be able to reinvest the redemption proceeds in a comparable security at an effective interest rate as high as the interest rate on the 2022 Notes being redeemed. Our redemption right also may adversely impact a holder's ability to sell the 2022 Notes as the optional redemption date or period approaches.
If we default on our obligations to pay our other indebtedness, we may not be able to make payments on the 2022 Notes.
Any default under the agreements governing our indebtedness, including a default under the Credit Facility or other indebtedness to which we may be a party, that is not waived by the required lenders, and the remedies sought by such lenders, could make us unable to pay principal, premium, if any, and interest on the 2022 Notes and substantially decrease the market value of the 2022 Notes. If we are unable to generate sufficient cash flow and are otherwise unable to obtain funds necessary to meet required payments of principal, premium, if any, and interest on our indebtedness, or if we otherwise fail to comply with the various covenants, including financial and operating covenants, in the instruments governing our indebtedness (including the Credit Facility), we could be in default under the terms of the agreements governing such indebtedness. In the event of such default, the holders of such indebtedness could elect to declare all the funds borrowed thereunder to be due and payable, together with accrued and unpaid interest, the lenders under the Credit Facility or other debt we may incur in the future could elect to terminate their commitments, cease making further loans and institute foreclosure proceedings against our assets, and we could be forced into bankruptcy or liquidation. Our ability to generate sufficient cash flow in the future is, to some extent, subject to general economic, financial, competitive, legislative and regulatory factors as well as other factors that are beyond our control. We cannot assure you that our business will generate cash flow from operations, or that future borrowings will be available to us under the Credit Facility or otherwise, in an amount sufficient to enable us to meet our payment obligations under the 2022 Notes and our other debt and to fund other liquidity needs.
If our operating performance declines and we are not able to generate sufficient cash flow to service our debt obligations, we may in the future need to refinance or restructure our debt, including any 2022 Notes sold, sell assets, reduce or delay capital investments, seek to raise additional capital or seek to obtain waivers from the required lenders under the Credit Facility or other debt that we may incur in the future to avoid being in default. If we are unable to implement one or more of these alternatives, we may not be able to meet our payment obligations under the 2022 Notes and our other debt. If we breach our covenants under the Credit Facility or other debt and seek a waiver, we may not be able to obtain a waiver from the required lenders. If this occurs, we would be in default under the Credit Facility or other debt, the lenders could exercise their rights as described above, and we could be forced into bankruptcy or liquidation. If we are unable to repay debt, lenders having secured obligations could proceed
46
against the collateral securing the debt. Because the Credit Facility has, and any future credit facilities will likely have, customary cross-default provisions, if the indebtedness under the 2022 Notes, the Credit Facility or under any future credit facility is accelerated, we may be unable to repay or finance the amounts due.
Item 1B. | Unresolved Staff Comments |
Not applicable.
Item 2. | Properties |
We do not own any real estate or other physical properties materially important to our operation. Our principal executive offices are located at 767 Third Avenue, 29th Floor, New York, NY 10017.
Item 3. | Legal Proceedings |
We are a party to certain legal proceedings incidental to the normal course of our business, including where third parties may try to seek to impose liability on us in connection with the activities of our portfolio companies. While the outcome of these legal proceedings cannot at this time be predicted with certainty, we do not expect that these proceedings will have a material effect on our financial condition or results of operations.
Item 4. | Mine Safety Disclosures |
Not applicable.
47
PART II
Item 5. | Market for Registrant’s Common Equity, Related Stockholder Matters and Issuer Purchases of Equity Securities |
Price Range of Common Stock
Our common stock is traded on the NASDAQ Global Market under the symbol “HCAP.” In connection with our initial public offering, our shares of common stock began trading on May 3, 2013, and before that date, there was no established trading market for our common stock. The following table sets forth the range of high and low closing prices of our common stock as reported on the NASDAQ Global Market for each fiscal quarter during 2017 and 2016.
Fiscal Year Ended | NAV | High | Low | Premium or Discount of High Sales Price to NAV | Premium or Discount of Low Sales Price to NAV | ||||||
December 31, 2017 | |||||||||||
Fourth Quarter | $12.66 | $13.80 | $10.67 | 9.0 | % | (15.7 | )% | ||||
Third Quarter | $12.86 | $13.99 | $12.91 | 8.8 | % | 0.4 | % | ||||
Second Quarter | $13.25 | $13.97 | $12.81 | 5.4 | % | (3.3 | )% | ||||
First Quarter | $13.89 | $14.52 | $12.67 | 4.5 | % | (8.8 | )% | ||||
December 31, 2016 | |||||||||||
Fourth Quarter | $13.86 | $13.75 | $12.05 | (0.8 | )% | (13.1 | )% | ||||
Third Quarter | $13.75 | $13.09 | $12.13 | (4.8 | )% | (11.8 | )% | ||||
Second Quarter | $13.71 | $13.45 | $12.22 | (1.9 | )% | (10.9 | )% | ||||
First Quarter | $13.90 | $12.17 | $10.02 | (12.4 | )% | (27.9 | )% | ||||
The last reported sale price for our common stock on the NASDAQ Global Market on March 29, 2018 was $10.26 per share. As of March 29, 2018, we had 18 shareholders of record.
Shares of BDCs may trade at a market price that is less than the value of the net assets attributable to those shares. The possibility that our shares of common stock will trade at a discount from net asset value per share or at premiums that are unsustainable over the long term are separate and distinct from the risk that our net asset value per share will decrease. It is not possible to predict whether the common stock will trade at, above, or below net asset value per share.
Distributions
Our distributions, if any, are determined by our board of directors. We have elected to be treated for federal income tax purposes as a RIC under Subchapter M of the Code. If we maintain our qualification as a RIC, we will not be taxed on our investment company taxable income or realized net capital gains, to the extent that such taxable income or gains are distributed, or deemed to be distributed, to stockholders on a timely basis.
To receive RIC tax treatment, we must, among other things, distribute annually at least 90% of our net ordinary income and realized net short-term capital gains in excess of realized net long-term capital losses, if any. Depending on the level of taxable income earned in a tax year, we may choose to carry forward taxable income in excess of current year distributions into the next tax year and pay a 4% excise tax on such income. Any such carryover taxable income must be distributed through a dividend declared prior to filing the final tax return related to the year which generated such taxable income. We may, in the future, make deemed distributions to our stockholders of our net capital gains. We can offer no assurance that we will achieve results that will permit the payment of any cash distributions and, if we issue senior securities, we may be prohibited from making distributions
48
if doing so causes us to fail to maintain the asset coverage ratios stipulated by the 1940 Act or if distributions are limited by the terms of any of our borrowings.
We have adopted an “opt out” dividend reinvestment plan, or “DRIP,” for our common stockholders. As a result, if we make cash distributions, then stockholders’ cash distributions will be automatically reinvested in additional shares of our common stock, unless they specifically “opt out” of the dividend reinvestment plan so as to receive cash distributions.
We make and expect to continue to make distributions on a monthly basis to our stockholders. We may not be able to achieve operating results that will allow us to continue to make distributions at a specific level or to increase the amount of these distributions from time to time. In addition, due to the asset coverage test applicable to us as a BDC, we may be limited in our ability to make distributions. Also, restrictions and provisions in our Credit Facility and any future credit facilities may limit our ability to make distributions in certain circumstances. If we do not distribute annually at least 90% of our ordinary income and realized net short-term capital gains in excess of realized net long-term losses, we will fail to maintain our qualification for RIC tax treatment and will be subject to corporate-level federal income tax, which may reduce the amounts available for distribution. We cannot assure you that you will receive distributions at a particular level or at all.
The following table reflects the cash distributions, including returns of capital, if any, per share that our board of directors has declared on our common stock since our initial public offering in May 2013:
Date Declared | Record Date | Payment Date | Amount Per Share | |||
Fiscal 2018 | ||||||
February 8, 2018 | April 19, 2018 | April 26, 2018 | $0.0950 | |||
February 8, 2018 | March 20, 2018 | March 27, 2018 | $0.0950 | |||
February 8, 2018 | February 21, 2018 | February 28, 2018 | $0.0950 | |||
November 7, 2017 | January 19, 2018 | January 26, 2018 | $0.1125 | |||
Total (2018) | $0.3975 | |||||
Fiscal 2017 | ||||||
November 7, 2017 | December 22, 2017 | December 29, 2017 | $0.1125 | |||
November 7, 2017 | November 24, 2017 | November 30, 2017 | $0.1125 | |||
August 9, 2017 | October 19, 2017 | October 26, 2017 | $0.2125 | |||
August 9, 2017 | September 21, 2017 | September 28, 2017 | $0.1125 | |||
August 9, 2017 | August 17, 2017 | August 24, 2017 | $0.1125 | |||
May 9, 2017 | July 20, 2017 | July 27, 2017 | $0.1125 | |||
May 9, 2017 | June 15, 2017 | June 22, 2017 | $0.1125 | |||
May 9, 2017 | May 19, 2017 | May 26, 2017 | $0.1125 | |||
February 1, 2017 | April 20, 2017 | April 27, 2017 | $0.1125 | |||
February 1, 2017 | March 16, 2017 | March 23, 2017 | $0.1125 | |||
February 1, 2017 | February 16, 2017 | February 23, 2017 | $0.1125 | |||
November 3, 2016 | January 12, 2017 | January 19, 2017 | $0.1125 | |||
Total (2017) | $1.4500 | |||||
Fiscal 2016 | ||||||
November 3, 2016 | December 15, 2016 | December 22, 2016 | $0.1125 | |||
November 3, 2016 | November 21, 2016 | November 28, 2016 | $0.1125 | |||
August 4, 2016 | October 13, 2016 | October 20, 2016 | $0.1125 | |||
August 4, 2016 | September 15, 2016 | September 22, 2016 | $0.1125 | |||
August 4, 2016 | August 19, 2016 | August 25, 2016 | $0.1125 | |||
May 4, 2016 | July 14, 2016 | July 21, 2016 | $0.1125 | |||
49
May 4, 2016 | June 16, 2016 | June 23, 2016 | $0.1125 | |||
May 4, 2016 | May 20, 2016 | May 27, 2016 | $0.1125 | |||
February 3, 2016 | April 21, 2016 | April 28, 2016 | $0.1125 | |||
February 3, 2016 | March 17, 2016 | March 24, 2016 | $0.1125 | |||
February 3, 2016 | February 18, 2016 | February 25, 2016 | $0.1125 | |||
November 3, 2015 | January 14, 2016 | January 21, 2016 | $0.1125 | |||
Total (2016) | $1.3500 | |||||
Fiscal 2015 | ||||||
November 3, 2015 | December 17, 2015 | December 24, 2015 | $0.1125 | |||
November 3, 2015 | November 20, 2015 | November 27, 2015 | $0.1125 | |||
August 5, 2015 | October 15, 2015 | October 22, 2015 | $0.1125 | |||
August 5, 2015 | September 17, 2015 | September 24, 2015 | $0.1125 | |||
August 5, 2015 | August 20, 2015 | August 27, 2015 | $0.1125 | |||
May 1, 2015 | July 23, 2015 | July 30, 2015 | $0.1125 | |||
May 1, 2015 | June 18, 2015 | June 25, 2015 | $0.1125 | |||
May 1, 2015 | May 21, 2015 | May 28, 2015 | $0.1125 | |||
February 13, 2015 | April 23, 2015 | April 30, 2015 | $0.1125 | |||
February 13, 2015 | March 20, 2015 | March 27, 2015 | $0.1125 | |||
February 13, 2015 | February 23, 2015 | February 27, 2015 | $0.1125 | |||
November 6, 2014 | January 22, 2015 | January, 29, 2015 | $0.1125 | |||
Total (2015) | $1.3500 | |||||
Fiscal 2014 | ||||||
November 6, 2014 | December 17, 2014 | December 24, 2014 | $0.1125 | |||
November 6, 2014 | November 24, 2014 | November 28, 2014 | $0.1125 | |||
August 5, 2014 | October 16, 2014 | October 23, 2014 | $0.1125 | |||
August 5, 2014 | September 18, 2014 | September 25, 2014 | $0.1125 | |||
August 5, 2014 | August 25, 2014 | August 29, 2014 | $0.1125 | |||
March 26, 2014 | July 17, 2014 | July 24, 2014 | $0.1125 | |||
March 26, 2014 | June 19, 2014 | June 26, 2014 | $0.1125 | |||
March 26, 2014 | May 22, 2014 | May 29, 2014 | $0.1125 | |||
February 5, 2014 | April 17, 2014 | April 24, 2014 | $0.1125 | |||
February 5, 2014 | March 20, 2014 | March 27, 2014 | $0.1125 | |||
February 5, 2014 | February 20, 2014 | February 27, 2014 | $0.1125 | |||
November 5, 2013 | January 16, 2014 | January 23, 2014 | $0.1125 | |||
Total (2014) | $1.3500 | |||||
Fiscal 2013 | ||||||
November 5, 2013 | December 19, 2013 | December 26, 2013 | $0.1125 | |||
November 5, 2013 | November 21, 2013 | November 29, 2013 | $0.1125 | |||
August 2, 2013 | October 17, 2013 | October 24, 2013 | $0.1125 | |||
August 2, 2013 | September 19, 2013 | September 26, 2013 | $0.1125 | |||
August 2, 2013 | August 23, 2013 | August 30, 2013 | $0.1125 | |||
June 6, 2013 | July 11, 2013 | July 18, 2013 | $0.1125 | |||
June 6, 2013 | June 20, 2013 | June 27, 2013 | $0.0900 | |||
Total (2013) | $0.7650 | |||||
50
Tax characteristics of all distributions paid by us (or the applicable withholding agent) are reported to stockholders on Form 1099 after the end of the calendar year. For the calendar year ended December 31, 2013, $0.07 per share of the distributions paid represented a return of capital. For the years ended December 31, 2014, 2015, 2016 and 2017, none of the distributions paid by the Company constituted a return of capital. Our future monthly distributions, if any, will be determined by our board of directors.
Sales of Unregistered Securities
In 2017, we issued a total of 33,932 shares of our common stock under our dividend reinvestment plan (“DRIP”). The aggregate value of the shares of our common stock issued under the DRIP during the year ended December 31, 2017 was approximately $0.4 million.
In 2016, we issued a total of 43,603 shares of our common stock under our DRIP. The aggregate value of the shares of our common stock issued under the DRIP during the year ended December 31, 2016 was approximately $0.5 million.
In 2015, we issued a total of 46,996 shares of our common stock under our DRIP. The aggregate value of the shares of our common stock issued under the DRIP during the year ended December 31, 2015 was approximately $0.6 million.
These issuances were not subject to the registration requirements of the Securities Act of 1933.
Purchases of Equity Securities
On March 8, 2016, our board of directors authorized a $3.0 million open market stock repurchase program. Pursuant to our program, we were authorized to repurchase up to $3.0 million in the aggregate of our outstanding stock in the open market. The repurchase program expired on December 31, 2016. On June 13, 2017, our board of directors authorized another $3.0 million open market stock repurchase program. Pursuant to our program, we are authorized to repurchase up to $3.0 million in the aggregate of our outstanding stock in the open market. The timing, manner, price and amount of any share repurchases will be determined by our management at its discretion, and no assurances can be given that any common stock, or any particular amount, will be purchased. Unless amended by our board of directors, the repurchase program will expire on the earlier of June 30, 2018 or the repurchase of $3.0 million of our outstanding shares of common stock.
During the year ended December 31, 2017, the Company made the following repurchases pursuant to the repurchase plan:
51
Period | Total Number of Shares Purchased | Average Purchase Price | Total Number of Shares Purchased as Part of Publicly Announced Plan | Maximum Remaining Dollar Value that May Yet Be Purchased Under Plan | ||||||||||
January | — | — | — | |||||||||||
February | — | — | — | |||||||||||
March | — | — | — | |||||||||||
April | — | — | — | |||||||||||
May | — | — | — | |||||||||||
June | — | — | — | |||||||||||
July | — | — | — | |||||||||||
August | — | — | — | |||||||||||
September | — | — | — | |||||||||||
October | — | — | — | |||||||||||
November | — | — | — | |||||||||||
December | 36,614 | 10.98 | 36,614 | $ | 2,598,098 | |||||||||
Total repurchases during 2017 | 36,614 | $10.98 | 36,614 | $ | 2,598,098 | * | ||||||||
* Unless and until re-approved, the repurchase program expires on June 30, 2018.
Stock Performance Graph
This graph compares the return on our common stock with that of the Russell 2000 Financial Services Index and NASDAQ Financial 100 Index, for the period from May 3, 2013 ( the date our common stock began to trade in connection with our initial public offering) through December 31, 2017. The graph assumes that, on May 3, 2013, a person invested $100 in each of our common stock, the Russell 2000 Financial Services Index and the NASDAQ Financial 100 Index. The graph measures total stockholder return, which takes into account both changes in stock price and distributions. It assumes that distributions paid are invested in like securities.
52
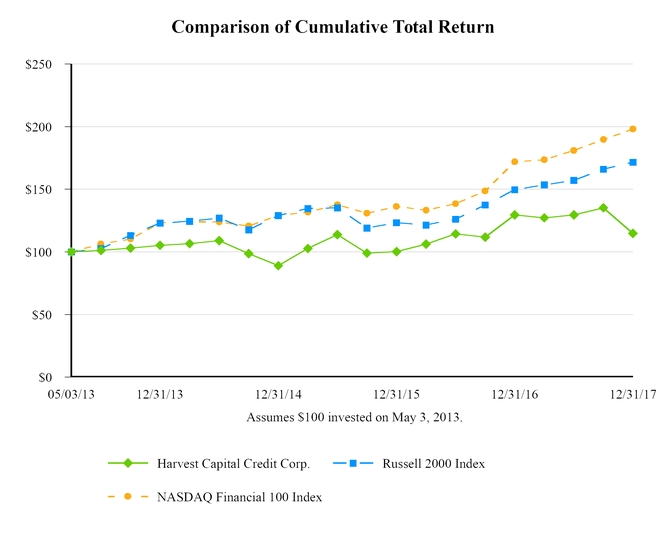
The graph and other information furnished under this Part II Item 5 of this Form 10-K shall not be deemed to be “soliciting material” or to be “filed” with the SEC or subject to Regulation 14A or 14C, or to the liabilities of Section 18 of the 1934 Act. The stock price performance included in the above graph is not necessarily indicative of future stock price performance.
53
Item 6. | Selected Financial Data |
The following selected financial and other data as of and for the years ended December 31, 2013, December 31, 2014, December 31, 2015, December 31, 2016 and December 31, 2017, is derived from our financial statements, which have been audited. The financial information and other data below should be read in conjunction with our financial statements and related notes thereto and “Management’s Discussion and Analysis of Financial Condition and Results of Operations” included elsewhere in this report. The other data is unaudited.
As of and for the Year Ended December 31, | |||||||||||||||||||
2017 | 2016 | 2015 | 2014 | 2013 | |||||||||||||||
Statement of Operations Data: | |||||||||||||||||||
Interest income | $ | 18,468,062 | $ | 20,738,511 | $ | 20,074,063 | $ | 14,004,609 | $ | 8,699,968 | |||||||||
Other income | 236,198 | 154,963 | 252,833 | 707,438 | 60,000 | ||||||||||||||
Net investment income, after taxes | 8,236,854 | 10,052,422 | 9,651,015 | 8,265,253 | 5,831,370 | ||||||||||||||
Net change in unrealized appreciation (depreciation) on investments | 1,458,173 | (3,528,349 | ) | (2,182,647 | ) | 464,416 | (1,709,209 | ) | |||||||||||
Net realized (losses) gains on investments | (8,062,441 | ) | (517,586 | ) | (1,057,355 | ) | 665,813 | — | |||||||||||
Net increase in net assets resulting from operations | 1,632,586 | 6,006,487 | 6,411,013 | 9,395,482 | 4,122,161 | ||||||||||||||
Other Data: | |||||||||||||||||||
Dollar-weighted average annualized yield on debt and other income-producing investments (1) | 15.3 | % | 15.4 | % | 13.9 | % | 15.1 | % | 16.7 | % | |||||||||
Dollar-weighted average annualized yield on total investments (1) | 13.7 | % | 14.4 | % | 13.6 | % | 14.0 | % | 16.4 | % | |||||||||
Number of portfolio companies at period end | 31 | 31 | 33 | 29 | 21 | ||||||||||||||
Per Share (2): | |||||||||||||||||||
Net increase in net assets resulting from operations per share (3) | $0.25 | $0.96 | $1.03 | $1.52 | $0.93 | ||||||||||||||
Net investment income per share (3) | $1.28 | $1.60 | $1.54 | $1.34 | $1.32 | ||||||||||||||
Distributions declared per common share | $1.45 | $1.35 | $1.35 | $1.35 | $2.58 | ||||||||||||||
Net asset value per share | $12.66 | $13.86 | $14.26 | $14.60 | $14.45 | ||||||||||||||
Statement of Assets and Liabilities Data: | |||||||||||||||||||
Gross investments | $ | 115,600,678 | $ | 134,101,534 | $ | 142,760,426 | $ | 115,834,428 | $ | 70,552,476 | |||||||||
Cash and restricted cash | 11,464,437 | 7,556,978 | 3,069,409 | 2,171,771 | 18,984,162 | ||||||||||||||
Total assets | 128,152,840 | 142,989,647 | 149,137,859 | 119,870,004 | 91,345,251 | ||||||||||||||
Borrowings | 44,467,405 | 53,731,355 | 57,198,293 | 26,075,140 | — | ||||||||||||||
Total liabilities | 46,371,411 | 55,867,351 | 59,723,603 | 28,997,689 | 2,490,765 | ||||||||||||||
Net assets | 81,781,429 | 87,122,296 | 89,414,256 | 90,872,315 | 88,854,486 | ||||||||||||||
(1) | The dollar-weighted average annualized effective yield on debt and other income-producing investments is computed using the effective interest rates for our debt investments and other income producing investments, including cash and PIK interest as well as the accretion of deferred fees. The individual investment yields are then weighted by the respective fair values of the investments (as of the date presented) in calculating the weighted average effective yield as a percentage of our debt and other income-producing investments. The dollar-weighted average annualized yield on total investments takes the same yields but weights them to determine the weighted average effective yield as a percentage of the Company's total investments. The dollar-weighted average annualized yield on the Company’s investments for a given period will generally be higher than what investors in our common stock would realize in a return over the same period because the dollar-weighted average annualized yield does not reflect the Company’s expenses or any sales load that may be paid by investors. |
(2) | All per share amounts are basic and diluted. |
(3) | The shares outstanding and per share amounts for all periods prior to May 2013 have been adjusted for the conversion rate of 0.9913 shares for each unit. |
54
Item 7. | Management’s Discussion and Analysis of Financial Condition and Results of Operations |
Forward-Looking Statements
Some of the statements in this annual report on Form 10-K constitute forward-looking statements, which relate to future events or our future performance or financial condition. The forward-looking statements contained in this annual report on Form 10-K involve risks and uncertainties, including statements as to:
• | our future operating results, including the performance of our existing investments; |
• | the introduction, withdrawal, success and timing of business initiatives and strategies; |
• | changes in political, economic or industry conditions, the interest rate environment or financial and capital markets, which could result in changes in the value of our assets; |
• | the relative and absolute investment performance and operations of our investment adviser; |
• | the impact of increased competition; |
• | the impact of investments we intend to make and future acquisitions and divestitures; |
• | our ability to turn potential investment opportunities into transactions and thereafter into completed and successful investments; |
• | the unfavorable resolution of any future legal proceedings; |
• | our business prospects and the prospects of our portfolio companies; |
• | our regulatory structure and tax status; |
• | the adequacy of our cash resources and working capital; |
• | the timing of cash flows, if any, from the operations of our portfolio companies; |
• | the impact of interest rate volatility on our results, particularly because we use leverage as part of our investment strategy; |
• | the ability of our portfolio companies to achieve their objective; |
• | the impact of legislative and regulatory actions and reforms and regulatory, supervisory or enforcement actions of government agencies relating to us or our investment adviser; |
• | our contractual arrangements and relationships with third parties; |
• | our ability to access capital and any future financings by us; |
• | the ability of our investment adviser to attract and retain highly talented professionals; and |
• | the impact of changes to tax legislation and, generally, our tax position. |
Such forward-looking statements may include statements preceded by, followed by or that otherwise include the words “may,” “might,” “will,” “intend,” “should,” “could,” “can,” “would,” “expect,” “believe,” “estimate,” “anticipate,” “predict,” “potential,” “plan” or similar words.
We have based the forward-looking statements included in this annual report on Form 10-K on information available to us on the date of this annual report on Form 10-K, and we assume no obligation to update any such forward-looking statements. Actual results could differ materially from those anticipated in our forward-looking statements, and future results could differ materially from historical performance. We undertake no obligation to revise or update any forward-looking statements, whether as a result of new information, future events or otherwise, unless required by law or SEC rule or regulation. You are advised to consult any additional disclosures that we may make directly to you or through reports that we in the future may file with the SEC, including annual reports on Form 10-K, quarterly reports on Form 10-Q and current reports on Form 8-K.
The following analysis of our financial condition and results of operations should be read in conjunction with our consolidated financial statements and the related notes thereto contained elsewhere in this annual report on Form 10-K.
55
Overview
We were formed as a Delaware corporation on November 14, 2012. We completed our initial public offering on May 7, 2013, raising $51.0 million in gross proceeds. On May 17, 2013, we raised another $6.5 million in gross proceeds from the closing of the initial public offering underwriters’ overallotment option. Immediately prior to the initial public offering, we acquired Harvest Capital Credit LLC in a merger whereby the outstanding limited liability company membership interests were converted into shares of our common stock and we assumed and succeeded to all of Harvest Capital Credit LLC’s assets and liabilities, including its entire portfolio of investments. We issued 2,246,699 shares of our common stock for all of Harvest Capital Credit LLC’s 2,266,974 outstanding membership interests in connection with the merger. Harvest Capital Credit LLC is considered to be our predecessor for accounting purposes and, as such, its financial statements are our historical financial statements.
Our investment objective is to generate both current income and capital appreciation primarily by making direct investments in the form of subordinated debt, senior debt and, to a lesser extent, minority equity investments. We plan to accomplish our investment objective by targeting investments in small and mid-sized U.S. private companies with annual revenues of less than $100 million and EBITDA (earnings before interest, taxes, depreciation and amortization) of less than $15 million. We believe that transactions involving companies of this size offer higher yielding investment opportunities, lower leverage levels and other terms more favorable than transactions involving larger companies.
We are an externally managed, closed-end, non-diversified management investment company that has elected to be regulated as a BDC under the 1940 Act. As a BDC, we are required to comply with certain regulatory requirements. For instance, as a BDC, we must not acquire any assets other than “qualifying assets” specified in the 1940 Act unless, at the time the acquisition is made, at least 70% of our total assets are qualifying assets (with certain limited exceptions). Qualifying assets include investments in “eligible portfolio companies.” Under the relevant SEC rules, the term “eligible portfolio company” includes all private operating companies, companies whose securities are not listed on a national securities exchange, and certain public companies that have listed their securities on a national securities exchange and have a market capitalization of less than $250 million, in each case organized in the United States.
We have also elected to be treated for U.S. federal income tax purposes as a RIC under Subchapter M of the Code, and we intend to receive RIC tax treatment annually. To maintain our qualification as a RIC, we must, among other things, meet certain source-of-income and asset diversification requirements. As a RIC, we generally will not have to pay corporate-level U.S. federal income taxes on any income we distribute to our stockholders, provided we distribute at least 90% of our ordinary income and short term capital gains.
Portfolio
Portfolio Composition
As of December 31, 2017, we had $115.6 million (at fair value) invested in 31 companies. As of December 31, 2017, our portfolio, at fair value, was comprised of approximately 51.0% senior secured term loans, 41.6% junior secured term loans and 7.4% equity and equity-like investments (including our revenue linked security).
As of December 31, 2016, we had $134.1 million (at fair value) invested in 31 companies. As of December 31, 2016, our portfolio, at fair value, was comprised of approximately 56.8% senior secured term loans, 39.2% junior secured term loans and 4.0% equity and equity-like investments (including our revenue linked security and CLO equity investment).
We originate and invest primarily in privately-held middle-market companies (typically those with less than $15.0 million of EBITDA) through first lien and second lien debt, oftentimes with a corresponding equity investment component and less frequently with a corresponding royalty security. The composition of our investments as of December 31, 2017 and December 31, 2016 was as follows:
56
December 31, 2017 | December 31, 2016 | ||||||||||||||
Cost | Fair Value | Cost | Fair Value | ||||||||||||
Senior Secured | $ | 61,508,211 | $ | 59,010,761 | $ | 77,341,917 | $ | 76,221,062 | |||||||
Junior Secured | 48,217,674 | 48,098,749 | 55,460,089 | 52,541,766 | |||||||||||
Equity and Equity Related | 9,021,290 | 7,958,168 | 5,159,856 | 4,207,964 | |||||||||||
Revenue Linked Security | 393,515 | 533,000 | 999,127 | 992,012 | |||||||||||
CLO Equity | — | — | 138,730 | 138,730 | |||||||||||
Total Investments | $ | 119,140,690 | $ | 115,600,678 | $ | 139,099,719 | $ | 134,101,534 | |||||||
At December 31, 2017, our average portfolio company debt investment at amortized cost and fair value was approximately $4.6 million and $4.5 million, respectively, and our largest portfolio company debt investment by amortized cost and fair value was approximately $12.0 million and $12.0 million, respectively. At December 31, 2016, our average portfolio company debt investment at amortized cost and fair value was approximately $4.7 million and $4.6 million, respectively, and our largest portfolio company debt investment by amortized cost and fair value was approximately $12.7 million and $12.9 million, respectively.
At December 31, 2017, 54.6% of our income producing investments bore interest based on floating rates (some of which were subject to interest rate floors), such as LIBOR, and 45.4% bore interest at fixed rates. At December 31, 2016, 64.9% of our debt investments bore interest based on floating rates (some of which were subject to interest rate floors), such as LIBOR, and 35.1% bore interest at fixed rates.
The weighted average effective yield of our debt and other income producing investments, as of December 31, 2017 and December 31, 2016, was approximately 15.3% and 15.4%, respectively. The weighted average effective yield on the entire portfolio, as of December 31, 2017 and December 31, 2016, was 13.7% and 14.4%, respectively. The weighted average annualized effective yield on debt and other income-producing investments is computed using the effective interest rates for our debt and other income producing investments, including cash and PIK interest as well as the accretion of deferred fees. The individual investment yields are then weighted by the respective fair values of the investments (as of the date presented) in calculating the weighted average effective yield as a percentage of our debt and other income-producing investments. Infinite Care, LLC was excluded from the calculation as of December 31, 2017 because it was on non-accrual status on that date. CRS Reprocessing, LLC and Peekay Acquisition, LLC were excluded from the calculation as of December 31, 2016 because they were on non-accrual status on that date. Shinnecock CLO 2006-1, Ltd. and other equity components of the investment portfolio were also excluded from these calculations either because they do not have stated interest rates or are non-income producing. The dollar-weighted average annualized yield on the Company’s investments for a given period will generally be higher than what investors in our common stock would realize in a return over the same period because the dollar-weighted average annualized yield does not reflect the Company’s expenses or any sales load that may be paid by investors.
For investments that have a PIK interest component, PIK interest is accrued each period but generally not collected until the debt investment is sold or paid off. A roll forward of PIK interest accruals and collections for the years ended December 31, 2017 and December 31, 2016 is summarized in the table below.
2017 | |||||||||||||||||||
Q1 | Q2 | Q3 | Q4 | FY | |||||||||||||||
PIK, beginning of period | $ | 2,582,253 | $ | 3,063,183 | $ | 3,503,747 | $ | 3,494,981 | $ | 2,582,253 | |||||||||
Accrual | 490,832 | 440,564 | 497,647 | 364,044 | 1,793,087 | ||||||||||||||
Payments | (9,902 | ) | — | (228,774 | ) | (6,389 | ) | (245,065 | ) | ||||||||||
Write-off | — | — | (277,639 | ) | — | (277,639 | ) | ||||||||||||
PIK, end of period | $ | 3,063,183 | $ | 3,503,747 | $ | 3,494,981 | $ | 3,852,636 | $ | 3,852,636 | |||||||||
57
2016 | |||||||||||||||||||
Q1 | Q2 | Q3 | Q4 | FY | |||||||||||||||
PIK, beginning of period | $ | 1,756,333 | $ | 1,473,384 | $ | 1,870,747 | $ | 2,301,794 | $ | 1,756,333 | |||||||||
Accrual | 153,826 | 397,363 | 431,047 | 516,497 | 1,498,733 | ||||||||||||||
Payments | (436,775 | ) | — | — | (96,895 | ) | (533,670 | ) | |||||||||||
PIK, end of period | $ | 1,473,384 | $ | 1,870,747 | $ | 2,301,794 | $ | 2,721,396 | $ | 2,721,396 | |||||||||
Investment Activity
During the year ended December 31, 2017, we closed $52.9 million of debt investment commitments in eleven new and four existing portfolio companies. We also made $4.1 million of equity investments in six new portfolio companies and one existing one. During the year ended December 31, 2016, we closed $29.7 million of debt investment commitments in five new and two existing portfolio companies.
During the year ended December 31, 2017, we exited $58.6 million of debt investment commitments from sixteen portfolio companies and one equity investments totaling $0.2 million. During the year ended December 31, 2016, we exited $21.9 million of debt investment commitments from six portfolio companies and two equity investments totaling $0.4 million.
Our level of investment activity can vary substantially from period to period depending on many factors, including the level of merger and acquisition activity in our target market, the general economic environment and the competitive environment for the types of investments we make.
Asset Quality
In addition to various risk management and monitoring tools, we use an investment rating system to characterize and monitor the credit profile and expected level of returns on each investment in our portfolio. This investment rating system uses a five-level numeric scale. The following is a description of the conditions associated with each investment rating:
• | Investment Rating 1 is used for investments that are performing above expectations, and whose risks remain favorable compared to the expected risk at the time of the original investment. |
• | Investment Rating 2 is used for investments that are performing within expectations and whose risks remain neutral compared to the expected risk at the time of the original investment. All new loans are initially rated 2. |
• | Investment Rating 3 is used for investments that are performing below expectations and that require closer monitoring, but where no loss of return or principal is expected. Portfolio companies with a rating of 3 may be out of compliance with financial covenants. |
• | Investment Rating 4 is used for investments that are performing substantially below expectations and whose risks have increased substantially since the original investment. These investments are often in workout. Investments with a rating of 4 are those for which some loss of return but no loss of principal is expected. |
• | Investment Rating 5 is used for investments that are performing substantially below expectations and whose risks have increased substantially since the original investment. These investments are almost always in workout. Investments with a rating of 5 are those for which some loss of return and principal is expected. |
The following table shows the investment rankings of our debt investments at fair value (in millions):
58
As of December 31, 2017 | As of December 31, 2016 | |||||||||||||||||||
Investment Rating | Fair Value (in millions) | % of Total Portfolio | Number of Portfolio Companies | Fair Value (in millions) | % of Total Portfolio | Number of Portfolio Companies | ||||||||||||||
1 | $ | 25.6 | 23.9 | % | 8 | $ | 33.4 | 26.0 | % | 9 | ||||||||||
2 | 48.9 | 45.6 | % | 10 | 70.8 | 55.0 | % | 13 | ||||||||||||
3 | 20.3 | 19.0 | % | 3 | 14.5 | 11.2 | % | 3 | ||||||||||||
4 | 6.7 | 6.3 | % | 2 | 10.1 | 7.8 | % | 2 | ||||||||||||
5 | 5.6 | 5.2 | % | 1 | — | * | — | % | * | 1 | ||||||||||
$ | 107.1 | 100.0 | % | 24 | $ | 128.8 | 100.0 | % | 28 | |||||||||||
* Rounds to less $1.0 million or .01%, as applicable.
Loans and Debt Securities on Non-Accrual Status
We do not accrue interest income on loans and debt securities if we doubt our ability to collect such interest. Generally, we will place the loan on non-accrual for such investments in which interest has not been paid for greater than 90 days. However, collections actually received on non-accrual loans may be recognized as interest income on a cash basis or applied to principal depending on management's judgment regarding collectability. As of December 31, 2017, we had one loan on non-accrual status (our senior secured debt investment in Infinite Care, LLC), which comprised 7.2% of our debt investments at cost. As of December 31, 2016, we had two loans on non-accrual status, which comprised approximately 6.3% of our debt investments at cost. One of the non-accrual loans (our junior secured debt investment in Peekay Acquisition, LLC) represented 1.5% of our debt investments at cost. The other non-accrual loan (our subordinated debt investment in CRS Reprocessing LLC) represented 4.7% of our debt investments at cost. In the case of CRS, we recognized the cash collected during the six months ended December 31, 2016 , as interest income. The failure by a borrower or borrowers to pay interest and repay principal could have a material adverse effect on our financial condition and results of operation.
Results of Operations
An important measure of our financial performance is the net increase or decrease in net assets resulting from operations, which includes net investment income, net change in realized gain or loss and net unrealized appreciation or depreciation. Net investment income is the difference between our income from interest, distributions, fees and other investment income and our operating expenses including interest on borrowed funds. Net realized gain or loss on investments is generally the difference between the proceeds received from dispositions of portfolio equity investments and their amortized cost. Net change in unrealized appreciation or depreciation on investments is the net unrealized change in the fair value of our investment portfolio.
Comparison of the Years Ended December 31, 2017 and December 31, 2016
Revenues
We generate revenue primarily in the form of interest income on debt investments and, to a lesser extent, capital gains on equity investments we make in portfolio companies. Our debt investments typically have terms of five to seven years and bear interest at a fixed or floating rate. Interest on our debt investments is payable at least quarterly. Payments of principal on our debt investments may be amortized over the stated term of the investment, deferred for several years or due entirely at maturity. In some cases, our debt investments may PIK. Any outstanding principal amount of our debt investments and any accrued but unpaid interest will generally become due at the maturity date. The level of interest income we receive is directly related to the balance of interest-bearing investments multiplied by the weighted average yield of our investments. We expect that the dollar amount of interest and any dividend income that we earn to increase as the size of our investment portfolio increases. In addition, we may generate revenue in the form of prepayment, commitment, loan origination, structuring or due diligence fees and consulting fees, which may be non-recurring in nature.
Investment income for the year ended December 31, 2017 totaled $18.7 million, compared to investment income of $20.9 million for the year ended December 31, 2016. Investment income for the year ended December 31, 2017 was comprised of $14.2 million in cash interest, $1.8 million in PIK interest, $2.5 million in fees earned on the investment portfolio and $0.2 million in other interest income. Investment income for the year ended December 31, 2016 was comprised of $17.4 million in cash interest, $1.5 million in PIK interest, $1.8 million in fees earned on the investment portfolio and $0.2 million in other interest income. The
59
$2.2 million decrease in investment income in the year ended December 31, 2017 is primarily attributable to a smaller investment portfolio, on average during the period, as compared to the year ended December 31, 2016.
Expenses
Our primary operating expenses include the payment of fees to HCAP Advisors LLC under the investment advisory and management agreement, our allocable portion of overhead expenses under the administration agreement with JMP Credit Advisors and other operating costs described below. We bear all other out-of-pocket costs and expenses of our operations and transactions, which include:
• | Interest expense and unused line fees; |
• | the cost of calculating our net asset value, including the cost of any third-party valuation services; |
• | the cost of effecting sales and repurchases of shares of our common stock and other securities; |
• | fees payable to third parties relating to making investments, including out-of-pocket fees and expenses associated with performing due diligence and reviews of prospective investments; |
• | transfer agent and custodial fees; |
• | out-of-pocket fees and expenses associated with marketing efforts; |
• | federal and state registration fees and any stock exchange listing fees; |
• | U.S. federal, state and local taxes; |
• | independent directors’ fees and expenses; |
• | brokerage commissions; |
• | fidelity bond, directors’ and officers’ liability insurance and other insurance premiums; |
•direct costs, such as printing, mailing, long distance telephone and staff;
• | fees and expenses associated with independent audits and outside legal costs, and |
• | costs associated with our reporting and compliance obligations under the 1940 Act and other applicable U.S. federal and state securities laws. |
Operating expenses totaled $10.5 million for the year ended December 31, 2017,compared to $10.8 million for the year ended December 31, 2016. Operating expenses in both periods consisted of interest expense, base and incentive management fees, administrator expenses, interest and related fees, professional fees, valuation fees, insurance expenses, directors’ fees, taxes, and other general and administrative expenses. Operating expenses were slightly higher in 2016 due to higher interest expense, base management fees and administrative expenses for the year ended December 31, 2017 compared to the year ended December 31, 2016, offset by lower incentive fee expense (discussed in greater detail below).
Base management fees for the year ended December 31, 2017 were $2.6 million, compared to $2.9 million for the year ended December 31, 2016. The decrease in base management fees is attributable to a smaller average outstanding investment portfolio in 2017 as compared to 2016.
Incentive management fees for the year ended December 31, 2017 were $0.1 million, compared to $1.4 million for the year ended December 31, 2016. The decrease in incentive management fees is a result of the total return provision in the investment advisory and management agreement. The incentive fees paid or owed to HCAP Advisors are subject to a three year total return requirement, such that no incentive fee, in respect of pre-incentive fee net investment income, will be payable except to the extent 20.0% of the cumulative net increase in net assets resulting from operations over the calendar quarter for which such fees are being calculated and the 11 preceding quarters exceeds the cumulative incentive fees paid or accrued over the 11 preceding quarters. Due to this total return requirement, incentive fees of $1.0 million were not paid or accrued for the year ended December 31, 2017.
Administrative services expense was $1.4 million for the year ended December 31, 2017, compared to $0.9 million for the year ended December 31, 2016. The Company negotiated a new cap with JMP Credit Advisors on amounts payable under the administration agreement for 2017. The cap, which was increased by our board of directors in November 2017, included limits
60
such that amounts payable would not exceed $1.4 million for the year. The actual administrative services expense that would have been payable to JMP Credit Advisors for the year ended December 31, 2017 exceeded this proportionate share of the cap by approximately $0.2 million.
Other operating expenses included general and administrative expenses such as legal, accounting and a portion of the expense incurred in valuing our portfolio companies.
Net Investment Income
For the year ended December 31, 2017, net investment income was $8.2 million, compared to $10.1 million for the year ended December 31, 2016. For the year ended December 31, 2017, net investment income per share was $1.28, compared to $1.60 for the year ended December 31, 2016.
Net Realized Gains and Losses
Realized gains and losses on investments are calculated using the specific identification method. We measure realized gains or losses on equity investments as the difference between the net proceeds from the sale and the amortized cost basis of the investment, without regard to unrealized appreciation or depreciation previously recognized. We measure realized gains or losses on debt investments as the difference between the net proceeds from the repayment or sale and the contractual amount owed to us on the investment, without regard to unrealized appreciation or depreciation previously recognized or unamortized deferred fees. The acceleration of unamortized deferred fees is recognized as interest income and the collection of prepayment and other fees is recognized as other income.
We recognized $8.1 million and $0.5 million in realized losses on our investments for the years ended December 31, 2017 and December 31, 2016, respectively. A summary of realized gains and losses for the years ended December 31, 2017 and December 31, 2016 is as follows:
Twelve Months Ended December 31, | ||||||
2017 | 2016 | |||||
Applied Systems, Inc. (Senior Secured Term Loan) | $ | — | $ | 7,878 | ||
Atrium Innovations, Inc. (Senior Secured Term Loan) | — | (3,656 | ) | |||
Bridgewater Engine Ownership III, LLC (Residual Value) | — | 18,301 | ||||
CRS Reprocessing, LLC (Junior Secured Term Loan) | (6,293,866 | ) | — | |||
Infinite Aegis Group, LLC (Common Equity Warrants) | — | (77,522 | ) | |||
Infracon Energy Services Corp. (Unsecured Note) | — | 10,775 | ||||
Lanco Acquisition, LLC (Warrants to Purchase Common Equity) | 60,000 | — | ||||
Mercury Network, LLC (Common Equity Units) | 301,001 | — | ||||
Optimal Blue, LLC (Class A Common Equity Units) | — | 683,578 | ||||
Peekay Acquisition, LLC (Senior Secured Term Loan) | (1,995,421 | ) | — | |||
Peekay Acquisition, LLC (Common Stock) | (105,000 | ) | — | |||
Rostra Tool Company (Common Equity Warrants) | 4,096 | 55,226 | ||||
Shinnecock CLO 2006-1, Ltd. (CLO Subordinated Notes) | (33,251 | ) | (69,903 | ) | ||
Solex Fine Foods, LLC Common Equity Units | — | (700,465 | ) | |||
Solex Fine Foods, LLC (Senior Secured Term Loan) | — | (441,798 | ) | |||
Net realized losses | $ | (8,062,441 | ) | $ | (517,586 | ) |
Net Change in Unrealized Appreciation of Investments
Net change in unrealized appreciation or depreciation primarily reflects the change in portfolio investment values during the reporting period, including the reversal of previously recorded appreciation or depreciation when gains or losses are realized.
Net change in unrealized appreciation (depreciation) on investments totaled $1.5 million for the year ended December 31, 2017 and $(3.5) million for the year ended December 31, 2016.
61
Net Increase in Net Assets Resulting from Operations
The net increase in net assets resulting from operations was $1.6 million for the year ended December 31, 2017 compared to $6.0 million for the year ended December 31, 2016. The $4.4 million decrease for the year ended December 31, 2017 was a result of lower net investment income and higher net realized and unrealized losses on investments in 2017 as compared to 2016.
Comparison of the Years Ended December 31, 2016 and December 31, 2015
Revenues
We generate revenue primarily in the form of interest income on debt investments and, to a lesser extent, capital gains on equity investments we make in portfolio companies. Our debt investments typically have terms of five to seven years and bear interest at a fixed or floating rate. Interest on our debt investments is payable at least quarterly. Payments of principal on our debt investments may be amortized over the stated term of the investment, deferred for several years or due entirely at maturity. In some cases, our debt investments may PIK. Any outstanding principal amount of our debt investments and any accrued but unpaid interest will generally become due at the maturity date. The level of interest income we receive is directly related to the balance of interest-bearing investments multiplied by the weighted average yield of our investments. We expect that the dollar amount of interest and any dividend income that we earn to increase as the size of our investment portfolio increases. In addition, we may generate revenue in the form of prepayment, commitment, loan origination, structuring or due diligence fees and consulting fees, which may be non-recurring in nature.
Investment income for the year ended December 31, 2016 totaled $20.9 million, compared to investment income of $20.3 million for the year ended December 31, 2015. Investment income for the year ended December 31, 2016 was comprised of $17.4 million in cash interest, $1.5 million in PIK interest, $1.8 million in fees earned on the investment portfolio and $0.2 million in other interest income. Investment income for the year ended December 31, 2015 was comprised of $16.5 million in cash interest, $1.1 million in PIK interest, $2.5 million in fees earned on the investment portfolio and $0.3 million in other interest income. The $0.6 million increase in investment income in the year ended December 31, 2016 is primarily attributable to a larger investment portfolio, on average during the period, as compared to the year ended December 31, 2015.
Expenses
Our primary operating expenses include the payment of fees to HCAP Advisors LLC under the investment advisory and management agreement, our allocable portion of overhead expenses under the administration agreement with JMP Credit Advisors and other operating costs described below. We bear all other out-of-pocket costs and expenses of our operations and transactions, which include:
• | Interest expense and unused line fees; |
• | the cost of calculating our net asset value, including the cost of any third-party valuation services; |
• | the cost of effecting sales and repurchases of shares of our common stock and other securities; |
• | fees payable to third parties relating to making investments, including out-of-pocket fees and expenses associated with performing due diligence and reviews of prospective investments; |
• | transfer agent and custodial fees; |
• | out-of-pocket fees and expenses associated with marketing efforts; |
• | federal and state registration fees and any stock exchange listing fees; |
• | U.S. federal, state and local taxes; |
• | independent directors’ fees and expenses; |
• | brokerage commissions; |
• | fidelity bond, directors’ and officers’ liability insurance and other insurance premiums; |
•direct costs, such as printing, mailing, long distance telephone and staff;
• | fees and expenses associated with independent audits and outside legal costs, and |
62
• | costs associated with our reporting and compliance obligations under the 1940 Act and other applicable U.S. federal and state securities laws. |
Operating expenses totaled $10.8 million for the year ended December 31, 2016,compared to $10.7 million for the year ended December 31, 2015. Operating expenses in both periods consisted of interest expense, base and incentive management fees, administrator expenses, interest and related fees, professional fees, valuation fees, insurance expenses, directors’ fees, and other general and administrative expenses. Operating expenses were slightly higher in 2016 due to higher interest expense, base management fees and administrative expenses for the year ended December 31, 2016 compared to the year ended December 31, 2015, offset by lower incentive fee expense (discussed in greater detail below).
Base management fees for the year ended December 31, 2016 were $2.9 million, compared to $2.7 million for the year ended December 31, 2015. The increase in base management fees is attributable to increased average gross investments in 2016 as compared to 2015.
Incentive management fees for the year ended December 31, 2016 were $1.4 million, compared to $2.2 million for the year ended December 31, 2015. The decrease in incentive management fees is a result of the total return provision in the investment advisory and management agreement. The incentive fees paid or owed to HCAP Advisors are subject to a three year total return requirement, such that no incentive fee, in respect of pre-incentive fee net investment income, will be payable except to the extent 20.0% of the cumulative net increase in net assets resulting from operations over the calendar quarter for which such fees are being calculated and the 11 preceding quarters exceeds the cumulative incentive fees paid or accrued over the 11 preceding quarters. Due to this total return requirement, incentive fees of $0.9 million were not paid or accrued for the year ended December 31, 2016.
Administrative services expense was $0.9 million for the year ended December 31, 2016, compared to $0.7 million for the year ended December 31, 2015. The Company negotiated a new cap with JMP Credit Advisors on amounts payable under the administration agreement for 2016. The cap, which was increased by our board of directors in January 2017, included limits based upon growth in the portfolio and an annual cap such that amounts payable would not exceed $0.9 million for the year. The actual administrative services expense that would have been payable to JMP Credit Advisors for the year ended December 31, 2016 exceeded this proportionate share of the cap by approximately $0.2 million.
Other operating expenses included general and administrative expenses such as legal, accounting and a portion of the expense incurred in valuing our portfolio companies.
Net Investment Income
For the year ended December 31, 2016, net investment income was $10.1 million, compared to $9.7 million for the year ended December 31, 2015. For the year ended December 31, 2016, net investment income per share was $1.60, compared to $1.54 for the year ended December 31, 2015.
Net Realized Gains and Losses
Realized gains and losses on investments are calculated using the specific identification method. We measure realized gains or losses on equity investments as the difference between the net proceeds from the sale and the amortized cost basis of the investment, without regard to unrealized appreciation or depreciation previously recognized. We measure realized gains or losses on debt investments as the difference between the net proceeds from the repayment or sale and the contractual amount owed to us on the investment, without regard to unrealized appreciation or depreciation previously recognized or unamortized deferred fees. The acceleration of unamortized deferred fees is recognized as interest income and the collection of prepayment and other fees is recognized as other income.
We recognized $0.5 million and $1.1 million in realized losses on our investments for the years ended December 31, 2016 and December 31, 2015, respectively. A summary of realized gains and losses for the years ended December 31, 2016 and December 31, 2015 is as follows:
63
Twelve Months Ended December 31, | ||||||
2016 | 2015 | |||||
Applied Systems, Inc. (Senior Secured Term Loan) | $ | 7,878 | $ | — | ||
Atrium Innovations, Inc. (Senior Secured Term Loan) | (3,656 | ) | — | |||
Bridgewater Engine Ownership III, LLC (Residual Value) | 18,301 | — | ||||
CRS Reprocessing, LLC (Junior Secured Term Loan) | — | (674,880 | ) | |||
Dell International LLC (Senior Secured Term Loan) | — | 2,493 | ||||
FCA US LLC (Senior Secured Term Loan) | — | (1,036 | ) | |||
Infinite Aegis Group, LLC (Common Equity Warrants) | (77,522 | ) | — | |||
Infracon Energy Services Corp. (Unsecured Note) | 10,775 | |||||
LNB Construction, Inc. (Options to Purchase Common Equity) | — | (104,525 | ) | |||
Optimal Blue, LLC (Class A Common Equity Units) | 683,578 | — | ||||
Rostra Tool Company (Common Equity Warrants) | 55,226 | 71,810 | ||||
Shinnecock CLO 2006-1, Ltd. (CLO Subordinated Notes) | (69,903 | ) | (351,217 | ) | ||
Solex Fine Foods, LLC Common Equity Units | (700,465 | ) | — | |||
Solex Fine Foods, LLC (Senior Secured Term Loan) | (441,798 | ) | — | |||
Net realized gains (losses) | $ | (517,586 | ) | $ | (1,057,355 | ) |
Net Change in Unrealized Appreciation of Investments
Net change in unrealized appreciation or depreciation primarily reflects the change in portfolio investment values during the reporting period, including the reversal of previously recorded appreciation or depreciation when gains or losses are realized.
Net change in unrealized appreciation (depreciation) on investments totaled $(3.5) million for the year ended December 31, 2016 and $(2.2) million for the year ended December 31, 2015.
Net Increase in Net Assets Resulting from Operations
The net increase in net assets resulting from operations was $6.0 million for the year ended December 31, 2016 compared to $6.4 million for the year ended December 31, 2015. The $0.4 million decrease for the year ended December 31, 2016 was a result of higher realized and unrealized losses in 2016 as compared to 2015, partially offset by higher net investment income in 2016 as compared to 2015.
Financial Condition, Liquidity and Capital Resources
Cash Flows from Operating and Financing Activities
Our operating activities provided cash of $21.2 million for the year ended December 31, 2017 and $15.6 million for the year December 31, 2016, primarily in connection with the payoffs and fundings of investments. Our financing activities used cash of $17.3 million for the year ended December 31, 2017 and $11.1 million for the year ended December 31, 2016. Our financing activity uses for the year ended December 31, 2017 were primarily in connection with net repayments on our Credit facility, distributions paid to shareholders and in connection with the net borrowings and repayments of our unsecured notes. Our financing activity proceeds for the year ended December 31, 2016 were primarily in connection with net repayments on our Credit Facility and distributions paid to shareholders.
Our operating activities provided cash of $15.6 million for the year ended December 31, 2016 and used cash of $21.3 million for the year December 31, 2015, primarily in connection with the payoffs and fundings of investments. Our financing activities used cash of $11.1 million for the year ended December 31, 2016 and and provided cash of $22.2 million for the year ended December 31, 2015. Our financing activity uses for the year ended December 31, 2016 were primarily in connection with net repayments on our Credit facility and distributions paid to shareholders. Our financing activity proceeds for the year ended December 31, 2015 were primarily in connection with net borrowings on our Notes offering and Credit Facility partially offset by distributions paid to shareholders.
64
Our liquidity and capital resources are derived from our Credit Facility, proceeds received from the public offering of our 2022 Notes in September 2017, cash flows from operations, including investment sales and repayments, and cash income earned. Our primary use of funds from operations includes investments in portfolio companies and other operating expenses we incur, as well as the payment of distributions to the holders of our common stock. We used, and expect to continue to use, these capital resources as well as proceeds from public and private offerings of securities to finance our investment activities.
Although we expect to fund the growth of our investment portfolio through the net proceeds from future equity offerings and issuances of senior securities or future borrowings to the extent permitted by the 1940 Act, our plans to raise capital may not be successful. In this regard, if our common stock trades at a price below our then-current net asset value per share, we may be limited in our ability to raise equity capital given that we cannot sell our common stock at a price below net asset value per share unless our stockholders approve such a sale and our board of directors makes certain determinations in connection therewith. For portions of 2017 and 2016, our common stock traded at a discount to our then-current net asset value. If our common stock continues to trade at a discount to net asset value, we may be limited in our ability to raise equity capital unless we obtain the approval described above, which we have not obtained.
In addition, we intend to distribute between 90% and 100% of our taxable income to our stockholders in order to satisfy the requirements applicable to RICs under Subchapter M of the Code. Consequently, we may not have the funds or the ability to fund new investments, to make additional investments in our portfolio companies, to fund our unfunded commitments to portfolio companies or to repay borrowings. In addition, the illiquidity of our portfolio investments may make it difficult for us to sell these investments when desired and, if we are required to sell these investments, we may realize significantly less than their recorded value.
Also, as a BDC, we are generally required to meet a coverage ratio of total assets, less liabilities and indebtedness not represented by senior securities, to total senior securities, which include all of our borrowings and any outstanding preferred stock, of at least 200%. This requirement limits the amount that we may borrow. As of December 31, 2017, we were in compliance with this requirement. The amount of leverage that we employ as a BDC will depend on our assessment of market conditions and other factors at the time of any proposed borrowing, such as the maturity, covenant package and rate structure of the proposed borrowings, our ability to raise funds through the issuance of shares of our common stock and the risks of such borrowings within the context of our investment outlook. Ultimately, we only intend to use leverage if the expected returns from borrowing to make investments will exceed the cost of such borrowing.
As of December 31, 2017 and December 31, 2016, we had cash and restricted cash of $11.5 million and $7.6 million, respectively.
Credit Facility
On October 29, 2013, the Company entered into a Loan and Security Agreement with CapitalSource Bank (now Pacific Western Bank), as agent and a lender, and each of the lenders from time to time party thereto, including City National Bank, to provide the Company with a $55.0 million senior secured revolving credit facility (the “Credit Facility”). The Credit Facility is secured by all of the Company’s assets, including the Company's equity interest in HCAP Equity Holdings, LLC, and has an accordion feature that allows the size of the facility to increase up to $85.0 million. The maturity date under the Credit Facility is the earlier of (x) April 30, 2020, or (y) the date that is six (6) months prior to the maturity of any of the Company's outstanding unsecured longer-term indebtedness, which, based on the Company's outstanding unsecured notes that mature on September 15, 2022, the maturity date under the facility would be April 30, 2020. HCAP Equity Holdings, LLC became a co-borrower under the Credit Facility in August 2016.
Advances under the Credit Facility, following amendments in September 2015, bear interest at a rate per annum equal to the lesser of (i) the applicable LIBOR rate plus 3.25% (with a 0.50% LIBOR floor) and (ii) the maximum rate permitted under applicable law.
In addition, the Credit Facility requires payment of a fee for unused amounts during the revolving period, which fee varies depending on the obligations outstanding as follows: (i) 0.75% per annum, if the average daily principal balance of the obligations outstanding for the prior month are less than fifty percent of the maximum loan amount; and (ii) 0.50% per annum, if such obligations outstanding are equal to or greater than fifty percent of the maximum loan amount. In each case, the fee is calculated based on the difference between (i) the maximum loan amount under the Credit Facility and (ii) the average daily principal balance of the obligations outstanding during the prior calendar month.
65
The Credit Facility also contains customary terms and conditions, including, without limitation, affirmative and negative covenants, including, without limitation, information reporting requirements, a minimum tangible net worth, a minimum debt service coverage ratio, a minimum liquidity of 4% of the maximum loan amount, a maximum leverage ratio of 1.00 to 1.00, and maintenance of RIC and BDC status. In addition, the Credit Facility contains a covenant that limits the amount of our unsecured longer-term indebtedness (as defined in the Credit Facility), which includes our 2022 Notes, to 50% of the maximum borrowing amount under the Credit Facility. The Credit Facility also contains customary events of default, including, without limitation, nonpayment, misrepresentation of representations and warranties in a material respect, breach of covenant, cross-default to other indebtedness, bankruptcy, change of control, and the occurrence of a material adverse effect. In addition, the Credit Facility provides that, upon the occurrence and during the continuation of such an event of default, the Company’s administration agreement could be terminated and a backup administrator could be substituted by the agent.
As of December 31, 2017 and December 31, 2016, the outstanding balance on the $55.0 million Credit Facility was $16.7 million and $26.9 million, respectively.
Notes Offerings
On January 27, 2015, the Company closed the public offering of $25.0 million in aggregate principal amount of its 7.00% Notes due 2020 (the "2020 Notes"). On February 4, 2015, the Company closed on an additional $2.5 million in aggregate principal amount of 2020 Notes to cover the over-allotment option exercised by the underwriters. In total, the Company issued 1,100,000 2020 Notes at a price of $25.00 per Note. The total net proceeds to the Company from the 2020 Notes, after deducting underwriting discounts of $0.8 million and offering expenses of $0.2 million, were $26.5 million. The 2020 Notes were redeemable in whole or in part at anytime at the Company's option after January 16, 2017 at a price equal to 100% of the outstanding principal amount of the 2020 Notes plus accrued and unpaid interest. The 2020 Notes were redeemed on September 23, 2017. The 2020 Notes were listed on the NASDAQ Global Market under the trading symbol “HCAPL.”
On August 24, 2017, the Company closed the public offering of $25.0 million in aggregate principal amount of its 6.125% Notes due 2022 (the "2022 Notes"). On September 1, 2017, the Company closed on an additional $3.75 million in aggregate principal amount of 2022 Notes to cover the over-allotment option exercised by the underwriters. In total, the Company issued 1,150,000 of the 2022 Notes at a price of $25.00 per Note. The total net proceeds to the Company from the 2022 Notes, after deducting underwriting discounts of $0.9 million and offering expenses of $0.2 million, were $27.7 million. As of December 31, 2017, the outstanding principal balance of the 2022 Notes was $28.8 million and the debt issuance costs balance was $1.0 million. The Company used the proceeds of the 2022 Notes to redeem the 2020 Notes in full on September 23, 2017.
The 2022 Notes mature on September 15, 2022 and bear interest at a rate of 6.125%. They are redeemable in whole or in part at anytime at the Company's option after September 15, 2019 at a price equal to 100% of the outstanding principal amount of the 2022 Notes plus accrued and unpaid interest. The 2022 Notes are unsecured obligations of the Company and rank pari passu with any future unsecured indebtedness; senior to any of the Company’s future indebtedness that expressly provides it is subordinated to the 2022 Notes; effectively subordinated to all of the existing and future secured indebtedness of the Company, to the extent of the value of the assets securing such indebtedness, including borrowings under the Credit Facility; and structurally subordinated to all existing and future indebtedness and other obligations of any subsidiaries, financing vehicles, or similar facilities the Company may form in the future, with respect to claims on the assets of any such subsidiaries, financing vehicles, or similar facilities. Interest on the 2022 Notes is payable quarterly on March 15, June 15, September 15, and December 15 of each year. The 2022 Notes are listed on the NASDAQ Global Market under the trading symbol “HCAPZ.” The Company may from time to time repurchase 2022 Notes in accordance with the 1940 Act and the rules promulgated thereunder.
The indenture governing the 2022 Notes (the "2022 Notes Indenture”) contains certain covenants, including covenants (i) requiring the Company’s compliance with the asset coverage requirements set forth in Section 18(a)(1)(A) as modified by Section 61(a)(1) of the 1940 Act, whether or not the Company continues to be subject to such provisions of the 1940 Act; (ii) requiring the Company’s compliance, under certain circumstances, with a modified version of the requirements set forth in Section 18(a)(1)(B) as modified by Section 61(a)(1) of the 1940 Act, whether or not the Company continues to be subject to such provisions of the 1940 Act, prohibiting the declaration of any cash dividend or distribution upon any class of the Company’s capital stock (except to the extent necessary for the Company to maintain its treatment as a RIC under Subchapter M of the Code), or purchasing any such capital stock, if the Company’s asset coverage, as defined in the 1940 Act, were below 200% at the time of the declaration of the dividend or distribution or the purchase and after deducting the amount of such dividend, distribution, or purchase; and (iii) requiring the Company to provide financial information to the holders of the 2022 Notes and the Trustee if the Company ceases to be subject to the reporting requirements of the Securities Exchange Act of 1934. These covenants are subject to limitations and exceptions that are described in the 2022 Notes Indenture.
66
At the Market Stock Offering
On January 27, 2017, we entered into an equity distribution agreement with JMP Securities LLC relating to up to 1,000,000 shares of our common stock that we may offer and sell from time to time at prices related to the prevailing market prices or at negotiated prices. On September 29, 2017, the Company entered into a new equity distribution agreement with JMP Securities to sell up to 1,000,000 shares of our common stock from time to time at prevailing market prices or at negotiated prices. During the year ended December 31, 2017, we sold 172,774 shares at an average gross price of $14.03 per share.
Off-Balance Sheet Arrangements
We may be a party to financial instruments with off-balance sheet risk in the normal course of business to meet the financial needs of our portfolio companies. As of December 31, 2017, our only off-balance sheet arrangements consisted of $3.0 million million of unfunded revolving line of credit commitments to five of our portfolio companies. As of December 31, 2016, our only off-balance sheet arrangements consisted $2.1 million of unfunded revolving line of credit commitments to five of our portfolio companies.
Regulated Investment Company Status and Distributions
We have elected to be treated as a RIC under Subchapter M of the Code. If we receive RIC tax treatment, we will not be taxed on our investment company taxable income or realized net capital gains, to the extent that such taxable income or gains are distributed, or deemed to be distributed, to stockholders on a timely basis.
Taxable income generally differs from net income for financial reporting purposes due to temporary and permanent differences in the recognition of income and expenses, and generally excludes net unrealized appreciation or depreciation until realized. Distributions declared and paid by us in a year may differ from taxable income for that year as such dividends may include the distribution of current year taxable income or the distribution of prior year taxable income carried forward into and distributed in the current year. Distributions also may include returns of capital.
To receive RIC tax treatment, the Company is required to meet certain income and asset diversification tests in addition to distributing at least 90% of ordinary income and realized net short-term capital gains in excess of realized net long-term capital losses, if any, out of the assets legally available for distribution. As a RIC, the Company will be subject to a 4% nondeductible U.S. federal excise tax on certain undistributed income unless the Company distributes in a timely manner an amount at least equal to the sum of (1) 98% of its ordinary income for each calendar year, (2) 98.2% of its capital gain net income for the 1-year period ending October 31 in that calendar year and (3) any ordinary income and net capital gains for preceding years that were not distributed during such years and on which the Company paid no U.S. federal income tax.
We intend to distribute to our stockholders between 90% and 100% of our annual taxable income (which includes our taxable interest and fee income). However, the covenants contained in the Credit Facility may prohibit us from making distributions to our stockholders, and, as a result, could hinder our ability to satisfy the distribution requirement. In addition, we may retain for investment some or all of our net taxable capital gains (i.e., realized net long-term capital gains in excess of realized net short-term capital losses) and treat such amounts as deemed distributions to our stockholders. If we do this, our stockholders will be treated as if they received actual distributions of the capital gains we retained and then reinvested the net after-tax proceeds in our common stock. Our stockholders also may be eligible to claim tax credits (or, in certain circumstances, tax refunds) equal to their allocable share of the tax we paid on the capital gains deemed distributed to them. To the extent our taxable earnings for a fiscal taxable year fall below the total amount of our distributions for that fiscal year, a portion of those distributions may be deemed a return of capital to our stockholders.
We may not be able to achieve operating results that will allow us to make distributions at a specific level or to increase the amount of these distributions from time to time. In addition, we may be limited in our ability to make distributions due to the asset coverage test for borrowings applicable to us as a BDC under the 1940 Act and due to provisions in the Credit Facility. We cannot assure stockholders that they will receive any dividends or distributions at a particular level.
In accordance with certain applicable Treasury regulations and private letter rulings issued by the Internal Revenue Service, a RIC may treat a distribution of its own stock as fulfilling its RIC distribution requirements if each stockholder may elect to receive his or her entire distribution in either cash or stock of the RIC, subject to a limitation that the aggregate amount of cash to be distributed to all stockholders must be at least 20% of the aggregate declared distribution. If too many stockholders
67
elect to receive cash, the cash available for distribution must be allocated among each stockholder electing to receive cash (with the balance of the distribution paid in stock). In no event will any stockholder, electing to receive cash, receive less than the lesser of (a) the portion of the distribution such shareholder has elected to receive in cash, or (b) an amount equal to his or her entire distribution times the percentage limitation on cash available for distribution. If these and certain other requirements are met, for U.S federal income tax purposes, the amount of the dividend paid in stock will be equal to the amount of cash that could have been received instead of stock. We have no current intention of paying distributions in shares of our stock in accordance with these Treasury regulations or private letter rulings.
Recent Developments
During the first quarter of 2018, the Company repurchased 64,897 shares of its common stock at an average price of $10.75 per share.
During the first quarter of 2018, the Company increased its debt investment in Infinite Care, LLC by $0.4 million through two over-advances on its revolver commitment. The Company also took control of the borrower's equity after accelerating the debt and auctioning the borrower’s equity in a public sale. The Company bid a portion of its outstanding debt to gain control of the portfolio company. Upon completion of this process, the Company converted $2.0 million of its debt investment in the borrower to preferred equity.
On January 24, 2018, the Company made a $7.0 million senior secured debt investment and a $0.2 million preferred equity investment in Coastal Screen and Rail, LLC. The debt investment consists of a $6.5 million term loan and a $0.5 million revolver. The term loan carries an interest rate of 10.50% cash plus 1.50% PIK. The revolver carries an interest rate of LIBOR + 8.00% on funded balances.
On February 8, 2018, the Company declared monthly distributions of $0.095 per share payable on each of February 28, 2018, March 27, 2018 and April 26, 2018.
On March 7, 2018, the Company received a full repayment at par plus a 2% prepayment fee on its $2.0 million junior secured debt investment in Turning Point Brands, Inc. The Company generated a 15.0% internal rate of return ("IRR") on its investment. IRR is the rate of return that makes the net present value of all cash flows into or from the investment equal to zero, and is calculated based on the amount of each cash flow received or invested by the Company and the day it was invested or received.
On March 12, 2018, the Company received $3.9 million for its $4.6 million debt and $0.3 million equity investments in WorkWell, LLC. The Company also entered into a royalty agreement with the sponsor allowing it to recover up to another $0.1 million on its investment subject to certain future events. The Company generated a combined IRR of 5.2% on its debt and equity investments in WorkWell, LLC.
On March 28, 2018, our board of directors appointed Joseph A. Jolson (Chairman of our board of directors) as the Chief Executive Officer of the Company, effective as of such date. Mr. Jolson succeeds Richard P. Buckanavage, who stepped down from his positions as Chief Executive Officer and President on March 28, 2018, to assume the role of Managing Director - Head of Business Development, effective as of such date. In addition, Mr. Buckanavage continues to serve as a principal and member of the investment committee of our investment adviser, along with Mr. Jolson. On March 28, 2018, our board of directors also appointed James Fowler as the Chief Investment Officer of the Company. Mr. Fowler is also a member of the investment committee at our investment adviser. The addition of Mr. Fowler strengthens the investment team at our investment adviser following the resignation of Ryan T. Magee, a Vice President of the Company and a principal of our investment adviser, on March 8, 2018.
In addition, on March 28, 2018, as part of the previously announced process initiated by the Company to transition the provision of administrative services to the Company from JMP Credit Advisors to HCAP Advisors, our investment adviser, the board accepted the resignations of Craig R. Kitchin, the Company’s Chief Financial Officer and Secretary, and Renee Lefebvre, the Company’s Chief Compliance Officer, each effective as of April 2, 2018. Mr. Kitchin and Ms. Lefebvre are employed by JMP Credit Advisors. To succeed Mr. Kitchin and Ms. Lefebvre, our board of directors appointed William Alvarez as Chief Financial Officer, Chief Compliance Officer, and Secretary, effective as of April 2, 2018. The resignations of Mr. Kitchin and Ms. Lefebvre are not related to the events disclosed in the Company's Rule 12b-25 filing on March 15, 2018.
68
Item 7A. Quantitative and Qualitative Disclosures About Market Risk
We are subject to financial market risks, including changes in interest rates. For the year ended December 31, 2017, fourteen of our loans, or 54.6% of the fair value of our portfolio, bore interest at floating rates. For the year ended December 31, 2016, nineteen of our loans, or 64.9% of the fair value of our portfolio, bore interest at floating rates. Assuming that the Statement of Assets and Liabilities as of December 31, 2017 were to remain constant and no actions were taken to alter the existing interest rate sensitivity, a hypothetical one percent increase in LIBOR would increase our net investment income by a maximum of $0.4 million. Similarly, a hypothetical one percent decrease in LIBOR would decrease our net income by $0.3 million. Although we believe that this measure is indicative of our sensitivity to interest rate changes, it does not adjust for potential changes in credit quality, size and composition of the assets on the balance sheet and other business developments that could affect net increase in net assets resulting from operations, or net income. Accordingly, no assurances can be given that actual results would not differ materially from the potential outcome simulated by this estimate. We may hedge against interest rate fluctuations by using standard hedging instruments such as futures, options and forward contacts subject to the requirements of the 1940 Act. While hedging activities may insulate us against adverse changes in interest rates, they may also limit our ability to participate in the benefits of lower interest rates with respect to our portfolio of investments. We have not engaged in any hedging activities to date.
69
Item 8. Consolidated Financial Statements and Supplementary Data
Index to Consolidated Financial Statements
70
Report of Independent Registered Public Accounting Firm
To the Board of Directors and Shareholders of Harvest Capital Credit Corporation
Opinion on the Financial Statements
We have audited the accompanying statements of assets and liabilities, including the schedules of investments, of Harvest Capital Credit Corporation as of December 31, 2017 and December 31, 2016, and the related statements of operations, of changes in net assets and of cash flows for each of the three years in the period ended December 31, 2017, including the related notes and financial statement schedules listed in the index appearing under Item 15(a)(2) (collectively referred to as the “financial statements”). In our opinion, the financial statements referred to above present fairly, in all material respects, the financial position of the Company as of December 31, 2017 and December 31, 2016, and the results of its operations, changes in its net assets, and its cash flows for each of the three years in the period ended December 31, 2017 in conformity with accounting principles generally accepted in the United States of America.
Basis for Opinion
These financial statements are the responsibility of the Company’s management. Our responsibility is to express an opinion on the Company’s financial statements based on our audits. We are a public accounting firm registered with the Public Company Accounting Oversight Board (United States) (“PCAOB”) and are required to be independent with respect to the Company in accordance with the U.S. federal securities laws and the applicable rules and regulations of the Securities and Exchange Commission and the PCAOB.
We conducted our audits of these financial statements in accordance with the standards of the PCAOB. Those standards require that we plan and perform the audit to obtain reasonable assurance about whether the financial statements are free of material misstatement, whether due to error or fraud. The Company is not required to have, nor were we engaged to perform, an audit of its internal control over financial reporting. As part of our audits we are required to obtain an understanding of internal control over financial reporting but not for the purpose of expressing an opinion on the effectiveness of the Company’s internal control over financial reporting. Accordingly, we express no such opinion.
Our audits included performing procedures to assess the risks of material misstatement of the financial statements, whether due to error or fraud, and performing procedures that respond to those risks. Such procedures included examining, on a test basis, evidence regarding the amounts and disclosures in the financial statements. Our audits also included evaluating the accounting principles used and significant estimates made by management, as well as evaluating the overall presentation of the financial statements. Our procedures included confirmation of securities owned as of December 31, 2017 and December 31, 2016 by correspondence with the custodian, borrowers, and agent banks; when replies were not received, we performed other auditing procedures. Our audits also included performing such other procedures as we considered necessary in the circumstances. We believe that our audits provide a reasonable basis for our opinion.
/s/PricewaterhouseCoopers LLP
San Francisco, California
April 2, 2018
We have served as the Company’s auditor since 2011.
71
Harvest Capital Credit Corporation
Consolidated Statements of Assets and Liabilities
December 31, | |||||||
2017 | 2016 | ||||||
ASSETS: | |||||||
Non-affiliated/non-control investments, at fair value (cost of $80,790,705 at 12/31/17 and $120,162,148 at 12/31/16) | $ | 82,902,537 | $ | 119,032,736 | |||
Affiliated investments, at fair value (cost of $26,365,364 at 12/31/17 and $15,994,294 at 12/31/16) | 25,983,871 | 12,137,552 | |||||
Control investments, at fair value (cost of $11,984,621 at 12/31/17 and $2,943,277 at 12/31/16) | 6,714,270 | 2,931,246 | |||||
Total investments, at fair value (cost of $119,140,690 at 12/31/17 and $139,099,719 at 12/31/16) | 115,600,678 | 134,101,534 | |||||
Cash | 4,233,597 | 4,472,749 | |||||
Restricted cash | 7,230,840 | 3,084,229 | |||||
Interest receivable | 287,408 | 578,140 | |||||
Accounts receivable – other | 37,688 | 27,135 | |||||
Deferred offering costs | 146,446 | 98,549 | |||||
Deferred financing costs | 508,284 | 542,342 | |||||
Other assets | 107,899 | 84,969 | |||||
Total assets | $ | 128,152,840 | $ | 142,989,647 | |||
LIABILITIES: | |||||||
Revolving line of credit | $ | 16,721,853 | $ | 26,946,613 | |||
Unsecured notes (net of deferred offering costs of $1,004,448 at 12/31/17 and $715,258 at 12/31/16). | 27,745,552 | 26,784,742 | |||||
Accrued interest payable | 139,148 | 421,534 | |||||
Accounts payable - base management fees | 582,912 | 693,190 | |||||
Accounts payable - incentive management fees | — | 202,235 | |||||
Accounts payable - administrative services | 397,463 | 276,214 | |||||
Accounts payable - accrued expenses | 782,726 | 499,907 | |||||
Other liabilities | 1,757 | 42,916 | |||||
Total liabilities | 46,371,411 | 55,867,351 | |||||
Commitments and contingencies (Note 8) | |||||||
NET ASSETS: | |||||||
Common stock, $0.001 par value, 100,000,000 shares authorized, 6,519,978 issued and 6,457,588 outstanding at 12/31/17 and 6,313,272 issued and 6,287,496 outstanding at 12/31/16 | 6,520 | 6,313 | |||||
Capital in excess of common stock | 93,043,208 | 90,433,114 | |||||
Treasury shares at cost, 62,390 and 25,776 at 12/31/17 and 12/31/16, respectively | (724,039 | ) | (322,137 | ) | |||
Accumulated realized losses on investments | (8,923,961 | ) | (1,537,506 | ) | |||
Net unrealized depreciation on investments | (3,540,012 | ) | (4,998,185 | ) | |||
Undistributed net investment income | 1,919,713 | 3,540,697 | |||||
Total net assets | 81,781,429 | 87,122,296 | |||||
Total liabilities and net assets | $ | 128,152,840 | $ | 142,989,647 | |||
Common stock outstanding | 6,457,588 | 6,287,496 | |||||
Net asset value per common share | $ | 12.66 | $ | 13.86 | |||
See accompanying notes to audited consolidated financial statements.
72
Harvest Capital Credit Corporation
Consolidated Statements of Operations
Year Ended December 31, | |||||||||||
2017 | 2016 | 2015 | |||||||||
Investment Income: | |||||||||||
Interest: | |||||||||||
Cash - non-affiliated/non-control investments | $ | 10,811,964 | $ | 16,055,958 | $ | 16,032,738 | |||||
Cash - affiliated investments | 2,583,523 | 1,253,098 | 477,407 | ||||||||
Cash - control investments | 813,486 | 133,966 | — | ||||||||
PIK - non-affiliated/non-control investments | 959,768 | 1,462,755 | 1,091,792 | ||||||||
PIK - affiliated investments | 568,482 | — | — | ||||||||
PIK - control investments | 264,837 | 35,978 | — | ||||||||
Amortization of fees, discounts and premiums, net: | |||||||||||
Non-affiliated/non-control investments | 2,247,071 | 1,819,960 | 2,240,199 | ||||||||
Affiliated investments | 147,859 | (24,003 | ) | 231,927 | |||||||
Control investments | 71,072 | 799 | — | ||||||||
Total interest income | 18,468,062 | 20,738,511 | 20,074,063 | ||||||||
Other income | 236,198 | 154,963 | 252,833 | ||||||||
Total investment income | 18,704,260 | 20,893,474 | 20,326,896 | ||||||||
Expenses: | |||||||||||
Interest expense - revolving line of credit | 717,465 | 1,183,431 | 921,284 | ||||||||
Interest expense - unsecured notes | 2,022,195 | 1,925,004 | 1,785,976 | ||||||||
Interest expense - unused line of credit | 276,197 | 146,728 | 243,800 | ||||||||
Interest expense - deferred financing costs | 233,993 | 278,733 | 264,228 | ||||||||
Interest expense - deferred offering costs | 198,966 | 196,872 | 167,255 | ||||||||
Loss on extinguishment of debt | 581,734 | — | — | ||||||||
Total interest expense | 4,030,550 | 3,730,768 | 3,382,543 | ||||||||
Professional fees | 1,109,774 | 827,793 | 747,032 | ||||||||
General and administrative | 1,148,817 | 1,021,516 | 869,391 | ||||||||
Base management fees | 2,597,120 | 2,899,416 | 2,710,993 | ||||||||
Incentive management fees | 58,005 | 1,394,382 | 2,234,551 | ||||||||
Administrative services expense | 1,394,925 | 905,586 | 729,978 | ||||||||
Total expenses | 10,339,191 | 10,779,461 | 10,674,488 | ||||||||
Net Investment Income, before taxes | 8,365,069 | 10,114,013 | 9,652,408 | ||||||||
Income tax expense | 63,565 | — | — | ||||||||
Excise tax expense | 64,650 | 61,591 | 1,393 | ||||||||
Net Investment Income, after taxes | 8,236,854 | 10,052,422 | 9,651,015 | ||||||||
Net realized (losses) gains: | |||||||||||
Non-affiliated / Non-control investments | (5,962,020 | ) | 624,677 | (1,057,355 | ) | ||||||
Affiliated investments | (2,100,421 | ) | (1,142,263 | ) | — | ||||||
Net realized losses on investments | (8,062,441 | ) | (517,586 | ) | (1,057,355 | ) | |||||
Net change in unrealized appreciation (depreciation) | |||||||||||
Non-affiliated / Non-control investments | 3,377,985 | (464,342 | ) | (1,088,851 | ) | ||||||
Affiliated investments | 1,601,553 | (3,051,977 | ) | (1,093,796 | ) | ||||||
Control investments | (3,521,365 | ) | (12,030 | ) | — | ||||||
Net change in unrealized appreciation (depreciation) on investments | 1,458,173 | (3,528,349 | ) | (2,182,647 | ) | ||||||
Total net unrealized and realized (losses) gains on investments | (6,604,268 | ) | (4,045,935 | ) | (3,240,002 | ) | |||||
Net increase in net assets resulting from operations | $ | 1,632,586 | $ | 6,006,487 | $ | 6,411,013 | |||||
Net investment income per share | $1.28 | $1.60 | $1.54 | ||||||||
Net increase in net assets resulting from operations per share | $0.25 | $0.96 | $1.03 | ||||||||
Weighted average shares outstanding (basic and diluted) | 6,412,215 | 6,282,360 | 6,249,346 | ||||||||
Distributions paid per common share | $1.45 | $1.35 | $1.35 | ||||||||
73
See accompanying notes to audited consolidated financial statements.
74
Harvest Capital Credit Corporation
Consolidated Statements of Changes in Net Assets
Year Ended December 31, | |||||||||||
2017 | 2016 | 2015 | |||||||||
Increase in net assets from operations: | |||||||||||
Net investment income, after taxes | $ | 8,236,854 | $ | 10,052,422 | $ | 9,651,015 | |||||
Net realized losses on investments | (8,062,441 | ) | (517,586 | ) | (1,057,355 | ) | |||||
Net change in unrealized appreciation (depreciation) on investments | 1,458,173 | (3,528,349 | ) | (2,182,647 | ) | ||||||
Net increase in net assets resulting from operations | 1,632,586 | 6,006,487 | 6,411,013 | ||||||||
Distributions to shareholders: | |||||||||||
Distributions from net investment income | (9,310,066 | ) | (8,481,370 | ) | (8,066,281 | ) | |||||
Distributions from capital gains | — | — | (369,418 | ) | |||||||
Decrease in net assets resulting from shareholder distributions | (9,310,066 | ) | (8,481,370 | ) | (8,435,699 | ) | |||||
Capital share transactions: | |||||||||||
Issuance of common shares (net of offering costs of $96,891 for 2017, $0 for 2016 and $0 for 2015 | 2,318,427 | 83 | 70 | ||||||||
Reinvestment of dividends (1) | 420,088 | 504,977 | 566,557 | ||||||||
Share repurchases | (401,902 | ) | (322,137 | ) | — | ||||||
Net increase in net assets from capital share transactions | 2,336,613 | 182,923 | 566,627 | ||||||||
Total decrease in net assets | (5,340,867 | ) | (2,291,960 | ) | (1,458,059 | ) | |||||
Net assets at beginning of period | 87,122,296 | 89,414,256 | 90,872,315 | ||||||||
Net assets at end of period | $ | 81,781,429 | $ | 87,122,296 | $ | 89,414,256 | |||||
Capital share activity (common shares): | |||||||||||
Shares issued from at the market offering | 172,774 | — | — | ||||||||
Shares issued from reinvestment of dividends | 33,932 | 43,603 | 46,996 | ||||||||
Shares repurchased | (36,614 | ) | (25,776 | ) | — | ||||||
Net increase in capital share activity (common shares) | 170,092 | 17,827 | 46,996 | ||||||||
(1) | Net of par value of shares issued of $34, $44, and $47 and funds received for fractional shares of $77, $83 and $70 for December 31, 2017, 2016 and 2015, respectively. |
(2) | Undistributed net investment income at December 31, 2017, December 31, 2016 and December 31, 2015 was $1.9 million, $3.5 million and $2.0 million, respectively. See Dividends and Distributions Policy in Note 2. |
See accompanying notes to audited consolidated financial statements.
75
Harvest Capital Credit Corporation
Consolidated Statements of Cash Flows
Year Ended December 31, | |||||||||||
2017 | 2016 | 2015 | |||||||||
Cash flows from operating activities: | |||||||||||
Net increase in net assets resulting from operations | $ | 1,632,586 | $ | 6,006,487 | $ | 6,411,013 | |||||
Adjustments to reconcile net increase in net assets resulting from operations to net cash used by operating activities: | |||||||||||
Paid in kind income | (1,793,087 | ) | (1,498,733 | ) | (1,091,792 | ) | |||||
Paid in kind income collected | 245,065 | 533,670 | 859,585 | ||||||||
Net realized losses (gains) on investments | 8,062,441 | 517,586 | 1,057,355 | ||||||||
Net change in unrealized (appreciation) depreciation of investments | (1,458,173 | ) | 3,528,349 | 2,182,647 | |||||||
Amortization of fees, discounts and premiums, net | (2,466,002 | ) | (1,796,756 | ) | (2,472,126 | ) | |||||
Amortization of deferred financing costs | 233,993 | 278,733 | 264,228 | ||||||||
Amortization of deferred offering costs | 198,966 | 196,872 | 167,255 | ||||||||
Loss on extinguishment of debt | 581,734 | — | — | ||||||||
Acceleration of offering costs from expired shelf registration statement | 77,386 | — | — | ||||||||
Purchase of investments (net of loan origination and other fees) | (52,184,690 | ) | (31,012,429 | ) | (54,464,040 | ) | |||||
Proceeds from principal payments | 68,088,632 | 38,387,205 | 25,816,815 | ||||||||
Changes in operating assets and liabilities | |||||||||||
Decrease (increase) in interest receivable | 290,732 | 534,745 | (562,036 | ) | |||||||
(Increase) decrease in accounts receivable - other and other assets | (33,483 | ) | 311,152 | (55,948 | ) | ||||||
(Decrease) increase in accrued interest payable | (282,386 | ) | 9,435 | 334,736 | |||||||
Increase (decrease) in accounts payable and other liabilities | 50,396 | (398,749 | ) | 266,733 | |||||||
Net cash provided by (used in) operating activities | 21,244,110 | 15,597,567 | (21,285,575 | ) | |||||||
Cash flows used in financing activities: | |||||||||||
Borrowings on revolving credit facility | 56,550,000 | 23,931,375 | 53,900,000 | ||||||||
Repayment of borrowings on revolving credit facility | (66,774,760 | ) | (26,683,055 | ) | (50,276,847 | ) | |||||
Financing costs | (199,932 | ) | (72,436 | ) | — | ||||||
Proceeds from the issuance of unsecured notes | 28,750,000 | — | 27,500,000 | ||||||||
Repayment of unsecured notes | (27,500,000 | ) | — | — | |||||||
Proceeds from the issuance of common stock and common units | 2,339,110 | 83 | 70 | ||||||||
Repurchased shares (held in Treasury Stock) | (401,902 | ) | (322,137 | ) | — | ||||||
Offering costs | (1,209,186 | ) | 12,565 | (1,070,868 | ) | ||||||
Distributions to equity holders (net of stock issued under dividend reinvestment plan of $420,088, $504,977, and $566,557, respectively) | (8,889,981 | ) | (7,976,393 | ) | (7,869,142 | ) | |||||
Net cash (used in) provided by financing activities | (17,336,651 | ) | (11,109,998 | ) | 22,183,213 | ||||||
Net increase in cash during the period | 3,907,459 | 4,487,569 | 897,638 | ||||||||
Cash at beginning of period | 7,556,978 | 3,069,409 | 2,171,771 | ||||||||
Cash at end of period (1) | $ | 11,464,437 | $ | 7,556,978 | $ | 3,069,409 | |||||
Non-cash operating activities: | |||||||||||
Amendment fees (2) | — | (75,000 | ) | 186,854 | |||||||
Non-cash financing activities: | |||||||||||
Value of shares issued in connection with dividend reinvestment plan | $ | 420,088 | $ | 504,977 | $ | 566,557 | |||||
Supplemental disclosures of cash flow information: | |||||||||||
Cash paid during the period for interest | $ | 3,298,239 | $ | 3,245,725 | $ | 2,616,324 | |||||
Cash paid during the period for taxes | $ | 103,797 | $ | 48,297 | $ | 7,861 | |||||
(1) Consists of cash and restricted cash of $4,233,597 and $7,230,840 respectively, at December 31, 2017, and $4,472,749 and $3,084,229 respectively, at December 31, 2016, and $595,047 and $2,474,362 respectively at December 31, 2015. | |
(2) Includes $75,000 of non-cash amendment fees that were accrued in 2015, but written off related to the impairment of Peekay Acquisition, LLC. | |
See accompanying notes to audited consolidated financial statements.
76
Harvest Capital Credit Corporation
Consolidated Schedule of Investments
(as of December 31, 2017)
Portfolio Company | Date ** | Industry | Investment (1) (2) (14) | Principal | Cost | Fair Value | ||||
Non-Control / Non-Affiliate Investments | ||||||||||
AMS Flight Leasing, LLC (loss guaranty provided by IAG Engine Center, LLC) (0.5%) * | 04/2017 | Aerospace & Defense | Senior Secured Term Loan, due 01/2019 (14.00%) | (5) (7) | 428,456 | 242,518 | 428,456 | |||
428,456 | 242,518 | 428,456 | ||||||||
Bradford Soap International, Inc. (5.5%) * | 08/2015 | Consumer Goods - Non-Durable | Junior Secured Term Loan, due 10/2019 (10.63%; 1M LIBOR + 9.25%) | 4,500,000 | 4,457,846 | 4,500,000 | ||||
4,500,000 | 4,457,846 | 4,500,000 | ||||||||
Bridgewater Engine Ownership III, LLC (0.2%) * | 10/2014 | Aerospace & Defense | Senior Secured Term Loan, due 07/2019 (14.00%; the greater of 14.00% and LIBOR +8.50%) | 195,421 | 178,639 | 195,421 | ||||
195,421 | 178,639 | 195,421 | ||||||||
Brite Media LLC (0.1%) * | 04/2014 | Media: Advertising, Printing & Publishing | Class A Interest (139 Units) | 125,000 | 70,669 | |||||
125,000 | 70,669 | |||||||||
CP Holding Co. Inc (Choice Pet) (3.5%) * | 05/2013 | Retailer | Junior Secured Term Loan, due 06/2020 (12.00%) | 2,899,852 | 2,894,941 | 2,879,000 | ||||
2,899,852 | 2,894,941 | 2,879,000 | ||||||||
DirectMed Parts & Service, LLC (6.8%) * | 05/2017 | Healthcare & Pharmaceuticals | Senior Secured Term Loan, due 02/2022 (11%; 3M LIBOR +9.50% with 1.00% LIBOR floor) | 5,530,000 | 5,442,369 | 5,530,000 | ||||
Revolver Line of Credit, due 02/2022 (3M LIBOR + 6.50% with 1.00% LIBOR floor) | (4) | — | — | — | ||||||
5,530,000 | 5,442,369 | 5,530,000 | ||||||||
Douglas Machines Corp. (5.1%) * | 05/2014 | Capital Equipment | Junior Secured Term Loan, due 12/2018 (12.50%) | 4,027,633 | 3,993,541 | 4,027,633 | ||||
04/2012 | Common Equity Warrants (204 Shares) | 12,500 | 177,391 | |||||||
4,027,633 | 4,006,041 | 4,205,024 | ||||||||
Flavors Holdings, Inc. (4.7%) * | 10/2014 | Beverage, Food & Tobacco | Junior Secured Term Loan, due 10/2021 (11.69%; 3M LIBOR +10.00% with 1.00% LIBOR floor) | 4,000,000 | 3,900,507 | 3,821,500 | ||||
4,000,000 | 3,900,507 | 3,821,500 | ||||||||
Flight Lease XIII, LLC (0.4%) * | 03/2017 | Aerospace & Defense | Common Equity Interest (600 Units) | (10) | 300,000 | 310,854 | ||||
300,000 | 310,854 | |||||||||
Fox Rent A Car, Inc. (1.1%) * | 10/2014 | Automotive | Common Equity Warrants (102 shares) | — | 861,425 | |||||
— | 861,425 | |||||||||
GK Holdings, Inc. (3.6%)* | 01/2015 | High Tech Industries | Junior Secured Term Loan, due 01/2022 (11.94%; 3M LIBOR +10.25% with 1.00% LIBOR floor) | (8) | 3,000,000 | 2,943,370 | 2,906,000 | |||
3,000,000 | 2,943,370 | 2,906,000 | ||||||||
77
Portfolio Company | Date ** | Industry | Investment (1) (2) (14) | Principal | Cost | Fair Value | ||||
IAG Engine Center, LLC (1.3%) * | 08/2016 | Aerospace & Defense | Senior Secured Term Loan, due 08/2018 (14.00%) | (7) | 563,395 | 471,875 | 563,000 | |||
Revenue Linked Security | (6) (10) | 393,515 | 533,000 | |||||||
563,395 | 865,390 | 1,096,000 | ||||||||
King Engineering Associates, Inc. (9.3%) * | 04/2017 | Environmental Industries | Senior Secured Term Loan, due 04/2021 (11.37%; 1M LIBOR +10.00%) | 6,576,000 | 6,482,233 | 6,576,000 | ||||
Revolving Line of Credit, due 04/2019 (11.37%; 1M LIBOR +10.00%) | (4) | — | — | — | ||||||
10/2017 | Class A Interest (86,433 Units) | (10) | 521,146 | 1,051,555 | ||||||
6,576,000 | 7,003,379 | 7,627,555 | ||||||||
ProAir Holdings Corporation (7.7%) * | 09/2017 | Capital Equipment | Junior Secured Term Loan, due 12/2022 (12.75%) | 6,500,000 | 6,405,784 | 6,282,507 | ||||
6,500,000 | 6,405,784 | 6,282,507 | ||||||||
Regional Engine Leasing, LLC (4.4%) * | 03/2015 | Aerospace & Defense | Senior Secured Term Loan, due 03/2020 (11.00%; the greater of 11.00% or 1M LIBOR +4.50%) | 3,471,326 | 3,403,439 | 3,471,326 | ||||
Residual Value | (3) | 102,421 | 105,322 | |||||||
3,471,326 | 3,505,860 | 3,576,648 | ||||||||
Safety Services Acquisition Corp. (8.9%) * | 03/2017 | Services: Business | Senior Secured Term Loan, due 03/2019 (14.5%; 3M LIBOR + 11.00% with a 1.00% floor/2.00% default interest) | (8) | 7,218,750 | 7,169,237 | 7,179,000 | |||
04/2012 | Series A Preferred Interest (100,000 Shares) | 100,000 | 69,000 | |||||||
7,218,750 | 7,269,237 | 7,248,000 | ||||||||
Shannon Specialty Floors, LLC (4.9%) * | 04/2017 | Chemicals, Plastics & Rubber | Junior Secured Term Loan, due 04/2021 (11.36%; 3M LIBOR + 10.00% with 1.00% LIBOR floor) | (8) | 4,000,000 | 3,948,995 | 3,968,000 | |||
4,000,000 | 3,948,995 | 3,968,000 | ||||||||
Sitel Worldwide Corporation (2.1%) * | 08/2015 | Services: Business | Junior Secured Term Loan, due 09/2022 (10.88%; 3M LIBOR +9.50% with 1.00% LIBOR floor) | (11) | 1,750,000 | 1,723,508 | 1,704,609 | |||
1,750,000 | 1,723,508 | 1,704,609 | ||||||||
Surge Busy Bee Holdings, LLC (9.1%) * | 11/2017 | Services: Business | Senior Secured Term Loan, due 11/2022 (11.38%; 1M LIBOR + 10.00%) | 4,937,500 | 4,723,800 | 4,723,800 | ||||
Senior Secured Term Loan, due 11/2022 (14.00%; 12.00% Cash/2.00% PIK) | 2,500,000 | 2,401,389 | 2,401,389 | |||||||
Revolving Line of Credit, due 11/2021 (9.38%, 1M LIBOR+8.00%) | (4) | 150,000 | 150,000 | 150,000 | ||||||
Class B Equity Warrants (210 Units) | 152,950 | 184,372 | ||||||||
7,587,500 | 7,428,139 | 7,459,561 | ||||||||
Turning Point Brands, Inc. (2.5%) * | 02/2017 | Beverage, Food & Tobacco | Junior Secured Term Loan, due 08/2022 (11.00%) | (11) | 2,000,000 | 1,982,298 | 2,015,000 | |||
2,000,000 | 1,982,298 | 2,015,000 | ||||||||
World Business Lenders, LLC (0.3%) * | 12/2013 | Banking, Finance, Insurance & Real Estate | Class B Equity Interest (49,209 Units) | 200,000 | 221,808 | |||||
200,000 | 221,808 | |||||||||
Wetmore Tool and Engineering (4.9%) * | 03/2017 | Capital Equipment | Junior Secured Term Loan, due 09/2021 (12.5%; 12.00% Cash/0.5% PIK) | (8) | 4,022,206 | 3,970,037 | 3,981,000 | |||
4,022,206 | 3,970,037 | 3,981,000 | ||||||||
Yucatan Foods, L.P. ( 14.7%) * | 03/2016 | Beverage, Food & Tobacco | Junior Secured Term Loan A, due 03/2021 (14.50%; 10.00% Cash/4.50% PIK) | (8) | 9,062,282 | 8,933,921 | 8,995,500 | |||
78
Portfolio Company | Date ** | Industry | Investment (1) (2) (14) | Principal | Cost | Fair Value | ||||
Junior Secured Term Loan B, due 03/2021 (10.00% PIK; convertible into 5.80% of fully diluted common equity) | (9) | 3,101,658 | 3,062,926 | 3,018,000 | ||||||
12,163,940 | 11,996,847 | 12,013,500 | ||||||||
Subtotal Non-Control / Non-Affiliate Investments | 80,434,479 | 80,790,705 | 82,902,537 | |||||||
Affiliate Investments | ||||||||||
Flight Lease XII, LLC (0.8%) * | 03/2017 | Aerospace & Defense | Common Equity Interest (1,000 Units) | (10) | 500,000 | 616,502 | ||||
500,000 | 616,502 | |||||||||
24/7 Software, Inc. (formerly Instant Sales Solutions, Inc.) ( 5.1%) * | 07/2017 | High Tech Industries | Senior Secured Term Loan, due 07/2022 (13.25%) | 2,887,500 | 2,859,272 | 2,859,272 | ||||
Revolving Line of Credit, due 07/2021 (10.5%, 3M LIBOR+9.00% with a 1.00% LIBOR floor) | (4) | — | — | — | ||||||
Common Equity Interest (950 Units) | (10) | 950,000 | 1,300,000 | |||||||
2,887,500 | 3,809,272 | 4,159,272 | ||||||||
Northeast Metal Works LLC (15.4%) * | 09/2014 | Metals & Mining | Senior Secured Term Loan, due 12/2019 (16.50%; 10.50% Cash/6.00% PIK) | (13) | 9,788,725 | 9,752,528 | 9,652,000 | |||
Revolving Line of Credit, due 12/2019 (13.50%) | 1,500,000 | 1,500,000 | 1,482,000 | |||||||
05/2017 | Preferred Equity Interest (2,500 Class A Units) | (10) | 1,600,000 | 1,481,000 | ||||||
11,288,725 | 12,852,528 | 12,615,000 | ||||||||
V-Tek, Inc. (5.8%) * | 03/2017 | Capital Equipment | Senior Secured Term Loan, due 03/2022 (12.5%; 3M LIBOR + 11.00%) | 3,500,000 | 3,406,474 | 3,500,000 | ||||
Senior Secured Revolver, due 03/2021 (8.00%; 3M LIBOR + 06.50%) | (4) | 886,097 | 886,097 | 886,097 | ||||||
Common Equity Interest (90 Units) | (10) | 150,000 | 351,000 | |||||||
4,386,097 | 4,442,571 | 4,737,097 | ||||||||
WorkWell, LLC ( 4.7%) * | 10/2015 | Healthcare & Pharmaceuticals | Senior Secured Term Loan, due 10/2020 (13.00%; 3M LIBOR + 11.50% with 0.50% LIBOR floor) | 4,569,699 | 4,510,993 | 3,856,000 | ||||
Preferred Equity Interest (250,000 Units) | 250,000 | — | ||||||||
Common Equity Interest (250,000 Units) | — | — | ||||||||
4,569,699 | 4,760,993 | 3,856,000 | ||||||||
Subtotal Affiliate Investments | 23,132,021 | 26,365,364 | 25,983,871 | |||||||
Control Investments | ||||||||||
Flight Lease VII (1.0%) * | 03/2016 | Aerospace & Defense | Common Equity Interest (1,800 Units) | 857,273 | 829,849 | |||||
857,273 | 829,849 | |||||||||
Flight Lease XI, LLC (0.4%) * | 12/2016 | Aerospace & Defense | Common Equity Interest (400 Units) | (10) | 200,000 | 327,421 | ||||
200,000 | 327,421 | |||||||||
Infinite Care, LLC (6.8%) * | 02/2016 | Healthcare & Pharmaceuticals | Senior Secured Term Loan, due 02/2019 (13.38%; 1M LIBOR+6.00% with a 0.42% LIBOR floor/6.00% PIK) | 6,360,914 | 5,862,348 | 3,492,000 | ||||
Revolving Line of Credit, due 02/2019 (13.38%, 1M LIBOR+12.00% with a 0.42% LIBOR floor) | 2,065,000 | 2,065,000 | 2,065,000 | |||||||
Class A Interest (3,000,000 Units) | (12) | 3,000,000 | — | |||||||
8,425,914 | 10,927,348 | 5,557,000 | ||||||||
Subtotal Control Investments | 8,425,914 | 11,984,621 | 6,714,270 | |||||||
Total Investments at 12/31/17 (141.4%) * | 111,992,414 | 119,140,690 | 115,600,678 | |||||||
79
See accompanying notes to audited consolidated financial statements.
* Value as a percentage of net assets.
** Date refers to the origination date of the investment.
(1) | Debt investments and the CLO subordinated notes are income producing investments unless an investment is on non accrual. Common equity, residual values and warrants are non-income producing. |
(2) | For each loan, the Company has provided the interest rate in effect on the date presented, as well as the contractual components of that interest rate. In the case of the Company's variable or floating rate loans, the interest rate in effect takes into account the applicable LIBOR rate in effect on the date presented or, if higher, the applicable LIBOR floor. |
(3) | "Residual value" represents the value of the Company’s share in the collateral securing the loan. |
(4) | Credit facility has an unfunded commitment in addition to the amounts shown in the Consolidated Schedule of Investments. See Note 8 in the Notes to Consolidated Financial Statements for further discussion on portion of commitment unfunded at December 31, 2017. |
(5) | The Company restructured the investment in IAG Engine Center, LLC on June 20, 2017. Specifically, AMS Flight Leasing, LLC was formed to facilitate the purchase of an aircraft engine from IAG Engine Center, LLC for $1.4 million. Per the terms of the agreement, the proceeds of the aircraft engine sale were used by IAG Engine Center, LLC to pay down the Company’s existing debt investment in IAG Engine Center, LLC. Concurrently, the Company also entered in a separate debt investment with AMS Flight Leasing, LLC for $1.1 million, which is separately presented on the Consolidated Schedule of Investments in Unaffiliated Issuers. |
(6) | The revenue linked security entitles the Company to participate in the proceeds of inventory sales pursuant to a consignment agreement between IAG Engine Center, LLC and an affiliated entity of IAG Engine Center, LLC, AMS Flight Funding, LLC. The IAG Engine Center, LLC consignment sales since origination of this security have been slower to materialize than originally planned resulting in lower than expected revenue linked security payments to date. As a result, this investment was placed on non-accrual status during the three months ended March 31, 2017. The revenue linked security payments materialized meaningfully in Q4 2017 and the investment was taken off of non-accrual status. |
(7) | IAG Engine Center, LLC has provided up to $1.4 million of credit enhancement to AMS Flight Leasing, LLC. |
(8) | The coupon on the loan is subject to a pricing grid based on certain leverage ratios of the portfolio company. |
(9) | The loan is convertible any time, at the Company's discretion, into 5.8% of the fully diluted common equity of the borrower. |
(10) | The investment is held by HCAP Equity Holdings, LLC, the Company's taxable blocker subsidiary. |
(11) | This portfolio company investment is a level 2 asset. Portfolio company investments without this footnote are level 3 assets whose values were determined using significant unobservable inputs. |
(12) | Infinite Care LLC ("ICC") is in default under the terms of its credit agreement and was on non-accrual status as of December 31, 2017. ICC was current on its interest payments to the Company through December 31, 2017; however, it failed to repay the Company’s protective loan advances at various dates in the fourth quarter of 2017. ICC was previously in breach of its minimum EBITDA, minimum fixed charge and total leverage covenants, but these breaches were waived by the Company through December 31, 2017 in connection with its entry into an agreement, dated as of January 13, 2017, with ICC relating thereto. In October 2017, the Company exercised its rights under a stock pledge of ICC. The Company formed a wholly owned subsidiary, HCAP ICC, LLC, to exercise its proxy right under the pledge agreement and take control of ICC’s board of directors. In January 2018, HCAP took control of ICC's equity after accelerating the debt and auctioning ICC’s equity in a public sale. The Company bid a portion of its outstanding debt to gain control of ICC in connection with the public sale process. Upon the completion of the sale process in January 2018, the Company converted $2.0 million of its debt investment in ICC into shares of ICC’s preferred stock. ICC had $13.1 million in cash receipts in 2017, and also had $60 thousand dollars in cash, among other current and long-term assets and current liabilities, and long-term liabilities consisting only of the $8.4 million debt principal it owed the Company (which included $361 thousand dollars of payment-in-kind interest due to the Company at the maturity of its debt investments in ICC) and no other debt as of December 31, 2017. The Company has performed additional diligence procedures on certain balance sheet and income statement accounts of ICC to ensure that the inputs used in connection with its determination of the fair value of its debt investments in ICC at December 31, 2017 were accurate and reliable. The Company determined the fair value of its investments in ICC using a methodology consistent with its valuation policy and with the same methodology it uses in connection with the valuation of its other portfolio company investments. Specifically, the Company utilized comparable investments in the marketplace and determined that a revenue multiple - with cash receipts determined to be the most appropriate proxy therefor based on ICC’s business and circumstances - was the most appropriate metric upon which to base the valuation for this portfolio company. The Company engaged a third party expert to assist it in connection with its determination of fair value of its investments in ICC as of December 31, 2017. The Company is currently in conversations with the investment committee of its investment adviser and its board of directors about the appropriate next steps for ICC. In that regard, the Company is considering (1) selling ICC as-is, (2) investing in underperforming areas of ICC’s business prior to selling ICC or (3) investing further in the business with the intent of continuing to hold its investments in ICC. |
(13) | The interest rate on the revolver is 11% prior to following the interim advance term; 13.5% from the first amendment effective date to February 28, 2018; 14.25% from March 1, 2018 through May 31, 2018 and 15% from June 1, 2018 until expiration of the interim advance. The interest rate on the term loan is 11% prior to and following the interim advance term; 10.5% cash pay plus 6% PIK from the first amendment date trough February 28, 2018; 10.5% cash pay plus 6.25% PIK from March 1, 2018 to May 31, 2018; 10.5% cash play plus 6.5% PIK from June 1, 2018 until expiration of the interim advance. |
(14) | The Company's non-qualifying assets, on a fair value basis, comprise approximately 2% of the Company's total assets. |
80
As of December 31, 2017, investments consisted of the following:
Type | Amortized Cost | Fair Value | % of Fair Value | % of Net Assets | |||||||
Senior Secured Debt | 61,508,211 | 59,010,761 | 51.0 | % | 72.2 | % | |||||
Junior Secured Debt | 48,217,674 | 48,098,749 | 41.6 | % | 58.8 | % | |||||
Equity | 9,021,290 | 7,958,168 | 6.9 | % | 9.7 | % | |||||
Revenue Linked Security | 393,515 | 533,000 | 0.5 | % | 0.7 | % | |||||
Total | 119,140,690 | 115,600,678 | 100.0 | % | 141.4 | % | |||||
The rate type of debt investments at fair value as of December 31, 2017 was as follows:
Rate Type | Amortized Cost | Fair Value | % of Fair Value | % of Net Assets | |||||||
Fixed Rate | 48,471,030 | 48,584,757 | 45.4 | % | 59.4 | % | |||||
Floating rate | 61,254,855 | 58,524,753 | 54.6 | % | 71.6 | % | |||||
Total | 109,725,885 | 107,109,510 | 100.0 | % | 131.0 | % | |||||
The industry composition of investments at fair value as of December 31, 2017 was as follows:
Industry | Amortized Cost | Fair Value | % of Fair Value | % of Net Assets | |||||||
Aerospace & Defense | 6,649,680 | 7,381,151 | 6.4 | % | 9.0 | % | |||||
Automobile | — | 861,425 | 0.8 | % | 1.1 | % | |||||
Banking, Finance, Insurance & Real Estate | 200,000 | 221,808 | 0.2 | % | 0.3 | % | |||||
Beverage, Food & Tobacco | 17,879,652 | 17,850,000 | 15.4 | % | 21.8 | % | |||||
Capital Equipment | 18,824,433 | 19,205,628 | 16.6 | % | 23.5 | % | |||||
Chemicals, Plastics and Rubber | 3,948,995 | 3,968,000 | 3.4 | % | 4.9 | % | |||||
Consumer Goods - Non-Durable | 4,457,846 | 4,500,000 | 3.9 | % | 5.5 | % | |||||
Environmental Industries | 7,003,379 | 7,627,555 | 6.6 | % | 9.3 | % | |||||
Healthcare & Pharmaceuticals | 21,130,710 | 14,943,000 | 12.9 | % | 18.3 | % | |||||
High Tech Industries | 6,752,642 | 7,065,272 | 6.1 | % | 8.6 | % | |||||
Media: Broadcasting & Subscription | 125,000 | 70,669 | 0.1 | % | 0.1 | % | |||||
Metals & Mining | 12,852,528 | 12,615,000 | 10.9 | % | 15.4 | % | |||||
Retailer | 2,894,941 | 2,879,000 | 2.5 | % | 3.5 | % | |||||
Services: Business | 16,420,884 | 16,412,170 | 14.2 | % | 20.1 | % | |||||
Total | 119,140,690 | 115,600,678 | 100.0 | % | 141.4 | % | |||||
81
Harvest Capital Credit Corporation
Consolidated Schedule of Investments
(as of December 31, 2016)
Portfolio Company | Investment (1) (2) | Origination Date | Outstanding Principal | Cost (3) | Fair Value | ||||||||
Non-Control / Non-Affiliate Investments | |||||||||||||
Aerospace & Defense | |||||||||||||
Bridgewater Engine Ownership III, LLC | 0.7% | * | Senior Secured Term Loan, due 07/05/2019 | 10/03/14 | 592,484 | 559,461 | 592,484 | ||||||
(14.00%; the greater of 14.00% or LIBOR +8.50%) | |||||||||||||
Regional Engine Leasing, LLC | 4.7% | * | Senior Secured Term Loan, due 03/31/2020 | 03/31/15 | 3,938,747 | 3,838,923 | 3,938,747 | ||||||
(11.00%; the greater of 11.00% or LIBOR +4.50%) | |||||||||||||
Residual Value | (4 | ) | 03/31/15 | — | 102,421 | 158,628 | |||||||
IAG Engine Center, LLC | 2.5% | * | Senior Secured Term Loan, due 08/29/2018 | (17 | ) | 08/29/16 | 1,855,000 | 1,177,857 | 1,177,857 | ||||
(14.00% Cash) | |||||||||||||
Revenue Linked Security | (9) (16) | — | 999,127 | 992,012 | |||||||||
Automotive | |||||||||||||
Fox Rent A Car, Inc. | 13.0% | * | Senior Secured Term Loan, due 09/30/2017 | (13 | ) | 10/31/14 | 10,000,000 | 10,117,435 | 10,722,000 | ||||
(12.62%; LIBOR +12.00%) | |||||||||||||
Warrants to purchase 50.5 shares of common stock | — | — | 586,000 | ||||||||||
Banking, Finance, Insurance and Real Estate | |||||||||||||
Shinnecock CLO 2006-1, Ltd. | 0.2% | * | 4,200,000 Subordinated Notes, due 07/15/2018 | (12 | ) | 03/06/14 | — | 138,730 | 138,730 | ||||
WBL SPE I, LLC | 1.9% | * | Senior Secured Term Loan, due 02/28/2017 | 09/30/13 | 1,696,694 | 1,696,233 | 1,696,694 | ||||||
(13.00% Cash) | |||||||||||||
WBL SPE II, LLC | 9.4% | * | Senior Secured Term Loan, due 09/30/2017 | 09/30/14 | 8,209,027 | 8,129,659 | 8,209,027 | ||||||
(14.50% Cash) | |||||||||||||
World Business Lenders, LLC | 0.3% | * | 49,209 Class B Common Equity Units | (10 | ) | 12/23/13 | — | 200,000 | 237,895 | ||||
(0.31% on a fully diluted basis) | |||||||||||||
Beverage, Food & Tobacco | |||||||||||||
Flavors Holdings, Inc. | 4.3% | * | Junior Secured Term Loan, due 10/4/2021 | 10/07/14 | 4,000,000 | 3,881,124 | 3,771,500 | ||||||
82
(11.00%; LIBOR +10.00% with 1.00% LIBOR floor) | |||||||||||||
North Atlantic Trading Company, Inc. | 4.3% | * | Junior Secured Term Loan, due 07/13/2020 | 01/13/14 | 3,750,000 | 3,733,284 | 3,740,625 | ||||||
(11.50%; LIBOR +10.25% with 1.25% LIBOR floor) | |||||||||||||
Yucatan Foods, L.P. | 13.1% | * | Junior Secured Term Loan A, due 03/29/2021 | 03/29/16 | 8,618,621 | 8,475,023 | 8,592,500 | ||||||
(14.50%; 8.00% cash/6.50% PIK) | (11 | ) | |||||||||||
Junior Secured Term Loan B, due 03/29/2021 | 03/29/16 | 2,806,068 | 2,761,801 | 2,820,000 | |||||||||
(10.00% PIK; convertible into 5.80% of fully diluted common equity) | (15 | ) | |||||||||||
Capital Equipment | |||||||||||||
Douglas Machines Corp. | 5.0% | * | Junior Secured Term Loan, due 12/31/2018 | 05/07/14 | 4,177,633 | 4,111,228 | 4,177,633 | ||||||
(12.50% Cash) | |||||||||||||
Warrants to purchase 204 Shares of Common Stock | 04/06/12 | — | 12,500 | 153,266 | |||||||||
(2.00% on a fully diluted basis) | |||||||||||||
Lanco Acquisition, LLC | 3.5% | * | Senior Secured Term Loan A, due 06/12/2018 | 06/13/14 | 226,618 | 223,738 | 226,618 | ||||||
(11.62%; LIBOR +11.00% with 0.50% LIBOR floor) | |||||||||||||
Senior Secured Term Loan B, due 03/12/2019 | 06/13/14 | 2,448,137 | 2,403,485 | 2,448,137 | |||||||||
(15.00%; 12.50% Cash/2.50% PIK) | |||||||||||||
Revolving Line of Credit, 06/12/2017 | (6 | ) | 06/13/14 | 250,000 | 250,000 | 250,000 | |||||||
(8.62%; LIBOR +8.00% with 0.50% LIBOR floor) | |||||||||||||
Warrants to purchase 1,482 Common Equity Units | 06/13/14 | — | 42,000 | 163,932 | |||||||||
(12.00% on a fully diluted basis) | |||||||||||||
Chemicals, Plastics & Rubber | |||||||||||||
CRS Reprocessing, LLC | 5.3% | * | Junior Secured Term Loan, due 09/30/2017 | (5 | ) | 05/27/15 | 7,136,824 | 6,598,278 | 4,659,199 | ||||
(5.00% Cash) | |||||||||||||
Consumer Goods - Non-Durable | |||||||||||||
Bradford Soap International, Inc. | 5.2% | * | Junior Secured Term Loan, due 10/31/2019 | 08/05/15 | 4,500,000 | 4,436,639 | 4,489,143 | ||||||
(9.87%; LIBOR + 9.25%) | |||||||||||||
High Tech Industries | |||||||||||||
GK Holdings, Inc. (Global Knowledge) | 3.3% | * | Junior Secured Term Loan, due 1/20/2022 | 01/30/15 | 3,000,000 | 2,952,193 | 2,922,000 | ||||||
(10.50%; LIBOR +9.50% with 1.00% LIBOR floor) | |||||||||||||
Mercury Network, LLC | 2.4% | * | Senior Secured Term Loan, due 08/24/2021 | 05/12/15 | 1,887,138 | 1,858,766 | 1,887,138 | ||||||
83
(10.50%; LIBOR +9.50% with 1.00% LIBOR floor) | (11 | ) | |||||||||||
86,957 Class A Common Equity Units | 05/12/15 | — | 86,957 | 164,616 | |||||||||
(0.50% on a fully diluted basis) | |||||||||||||
Media: Broadcasting & Subscription | |||||||||||||
Chemical Information Services, LLC | 4.3% | * | Senior Secured Term Loan, due 08/28/2019 | 08/28/15 | 3,775,425 | 3,743,423 | 3,775,425 | ||||||
(12.85%; LIBOR +12.00%) | (11 | ) | |||||||||||
Revolving Line of Credit, due 08/28/2018 | (6 | ) | 08/28/15 | — | — | — | |||||||
(12.85%; LIBOR +12.00%) | (11 | ) | |||||||||||
Multicultural Radio Broadcasting, Inc. | 5.6% | * | Senior Secured Term Loan (Last Out), due 06/27/2019 | 09/10/14 | 4,950,050 | 4,950,050 | 4,852,000 | ||||||
(11.50%; LIBOR +10.50% with 1.00% LIBOR floor) | |||||||||||||
Media: Advertising, Printing & Publishing | |||||||||||||
Brite Media LLC | 6.6% | * | Senior Secured Term Loan, due 04/24/2019 | 04/24/14 | 5,019,225 | 4,979,129 | 5,005,500 | ||||||
(13.18%; LIBOR +11.75% with 0.75% LIBOR floor plus 0.50% PIK) | (11 | ) | |||||||||||
Revolving Line of Credit, due 04/24/2018 | 04/24/14 | 666,667 | 666,667 | 666,667 | |||||||||
(12.68%; LIBOR +11.75% with 0.75% LIBOR floor) | (11 | ) | |||||||||||
139 Class A Common Equity Units | 04/24/14 | — | 125,000 | 78,657 | |||||||||
(1.45% on a fully diluted basis) | |||||||||||||
Metals & Mining | |||||||||||||
Northeast Metal Works LLC | 14.8% | * | Senior Secured Term Loan, due 12/29/2017 | 09/29/14 | 11,348,552 | 11,541,520 | 11,678,261 | ||||||
(17.62%; LIBOR +14.00% with 0.20% LIBOR floor plus 3.00% PIK) | (11) (14) | ||||||||||||
Revolving Line of Credit, due 12/29/17 | (6 | ) | 09/29/14 | 1,189,239 | 1,189,239 | 1,189,239 | |||||||
(17.62%; LIBOR +14.00% with 0.20% LIBOR floor plus 3.00% PIK) | (11) (14) | ||||||||||||
Retailer | |||||||||||||
CP Holding Co., Inc. (Choice Pet) | 6.2% | * | Senior Secured Term Loan, due 02/28/2018 | 05/30/13 | 5,611,638 | 5,569,739 | 5,397,440 | ||||||
(16.25%; 12.00% Cash/4.25% PIK) | (11 | ) | |||||||||||
Services: Business | |||||||||||||
Novitex Acquisition, LLC | 8.0% | * | Junior Secured Term Loan, due 07/7/2021 | 07/07/14 | 7,000,000 | 6,916,408 | 7,000,000 | ||||||
(12.25%; LIBOR + 11.00% with 1.25% LIBOR floor) | |||||||||||||
Safety Services Acquisition Corp. | 7.0% | * | Junior Secured Term Loan, due 07/5/2017 | 04/05/12 | 6,011,262 | 5,984,252 | 6,011,000 | ||||||
84
(15.0%; 12.50% Cash/2.50% PIK) | |||||||||||||
100,000 shares of Series A Preferred Stock | 04/05/12 | — | 100,000 | 104,000 | |||||||||
(0.59% on a fully diluted basis) | |||||||||||||
Sitel Worldwide Corporation | 1.9% | * | Junior Secured Term Loan, due 09/19/2022 | 08/21/15 | 1,750,000 | 1,719,469 | 1,694,000 | ||||||
(10.50%; LIBOR +9.50% with 1.00% LIBOR floor) | |||||||||||||
SourceHOV LLC | 3.1% | * | Junior Secured Term Loan, due 4/30/2020 | 10/29/14 | 4,000,000 | 3,890,390 | 2,664,166 | ||||||
(11.50%; LIBOR + 10.50% with 1.00% LIBOR floor) | |||||||||||||
Subtotal Non-controlled, Non-affiliated Investments | 120,415,049 | 120,162,148 | 119,032,736 | ||||||||||
Affiliated Investments | |||||||||||||
Healthcare & Pharmaceuticals | |||||||||||||
Infinite Care, LLC | 8.5% | * | Senior Secured Term Loan, due 02/28/2019 | 02/29/16 | 6,000,000 | 5,920,025 | 5,916,570 | ||||||
(12.62%; LIBOR+12.00% with 0.42% LIBOR floor) | |||||||||||||
Revolving Line of Credit, due 02/28/2019 | (6 | ) | 02/29/16 | 200,000 | 200,000 | 200,000 | |||||||
(12.62%; LIBOR+12.00% with 0.42% LIBOR floor) | |||||||||||||
3,000,000 Class A Common Equity Units | 02/29/16 | — | 3,000,000 | 1,266,500 | |||||||||
(27.00% on a fully diluted basis) | |||||||||||||
WorkWell, LLC | 5.4% | * | Senior Secured Term Loan, due 10/21/2020 | 10/22/15 | 4,601,563 | 4,523,847 | 4,546,000 | ||||||
(12.43%; LIBOR + 11.50% with 0.50% LIBOR floor) | (11 | ) | |||||||||||
Revolving Line of Credit, due 10/21/2020 | (6 | ) | 10/22/15 | — | — | — | |||||||
(12.43%; LIBOR + 11.50% with 0.50% LIBOR floor) | (11 | ) | |||||||||||
250,000 Preferred Equity Units | 10/22/15 | — | 250,000 | 170,000 | |||||||||
(6.16% on a fully diluted basis) | |||||||||||||
250,000 Common Equity Units | 10/22/15 | — | — | 523 | |||||||||
(0.12% on a fully diluted basis) | |||||||||||||
Retailer | |||||||||||||
Peekay Acquisition, LLC | 0.0% | * | Senior Secured Term Loan (Last Out), due 02/15/16 | 12/31/12 | 2,304,615 | 1,995,422 | 37,959 | ||||||
(17.00% PIK) | (7 | ) | |||||||||||
35,775 shares of Common Stock (Peekay Boutiques, Inc.) | (8 | ) | 12/31/12 | — | 105,000 | — | |||||||
85
(5.95% on a fully diluted basis) | |||||||||||||
Subtotal Affiliated Investments | 13,106,178 | 15,994,294 | 12,137,552 | ||||||||||
Control Investments | |||||||||||||
Aerospace & Defense | |||||||||||||
Flight Lease VII, LLC | 1.1 | % | * | 1,800 Common Equity Units | 03/18/16 | — | 935,978 | 923,947 | |||||
(46.15% on a fully diluted basis) | |||||||||||||
Flight Engine Leasing III, LLC | 2.3 | % | Senior Secured Term Loan, due 12/13/2018 | 12/13/16 | 1,825,000 | 1,807,299 | 1,807,299 | ||||||
(13.00%; the greater of 13.00% or LIBOR plus 7.50%) | |||||||||||||
400 Common Equity Units | (16) (18) | 12/13/16 | — | 200,000 | 200,000 | ||||||||
(33.33% of fully diluted common equity) | |||||||||||||
Subtotal Control Investments | 1,825,000 | 2,943,277 | 2,931,246 | ||||||||||
Total Investments as of 12/31/2016 | 153.8% | * | 135,346,227 | 139,099,719 | 134,101,534 | ||||||||
86
(1) | Debt investments, the revenue linked security and the CLO subordinated notes are income producing investments unless an investment is on non accrual. Equity investments (other than Flight Lease VII, LLC), residual values and warrants are non-income producing. All investments other than Shinnecock CLO 2006-1, Ltd., WBL SPE I, LLC, WBL SPE II, LLC and World Business Lenders, LLC are qualifying assets for purposes of Section 55(a) of the Investment Company Act of 1940, as amended. The Company's non-qualifying assets, on a fair value basis, comprise 7.16% of the Company's total assets. |
(2) | For each loan, the Company has provided the interest rate in effect on the date presented, as well as the contractual components of that interest rate. In the case of the Company's variable or floating rate loans, the interest rate in effect takes into account the applicable LIBOR rate in effect on the date presented or, if higher, the applicable LIBOR floor. |
(3) | Gross unrealized appreciation, gross unrealized depreciation, and net unrealized depreciation for federal income tax purposes totaled $3.3 million, $7.5 million, and $4.2 million, respectively. The tax cost of investments is $138.4 million. |
(4) | "Residual value" represents the value of the Company’s share in the collateral securing the loan. |
(5) | On May 27, 2015, the Company's investment in CRS Reprocessing, LLC ("CRS") was restructured in a manner that was intended to strengthen the credit profile of the borrower. The restructured investment carried a fixed interest rate of 5.00% and has a principal amount of $7.0 million, which includes all previously unpaid interest amounts. The maturity date of the restructured investment remained unchanged at September 30, 2016. CRS was taken off non-accrual and began accruing interest during the three months ended June 30, 2015. On April 29, 2016, the loan agreement was amended to extend the maturity date from September 30, 2016 to March 30, 2017. In conjunction with the extension, the interest rate increased from 5.0% cash to 10.0% (5.0% cash / 5.0% PIK). The loan was placed on non-accrual status during the three months ended September 30, 2016. On October 31, 2016 the maturity date was extended from March 30, 2017 to September 30, 2017 and the interest rate was reduced from 10.00% (5.00% cash/5.00%PIK) to 5.00% cash. No income was accrued during the six months ended December 31, 2016. However, cash interest of $181,247, which represents the total amount of interest due to the Company as of December 31, 2016, was collected and recognized as income during this period. |
(6) | Credit facility has an unfunded commitment in addition to the amounts shown in the Schedule of Investments. See Note 8 for further discussion on portion of commitment unfunded at December 31, 2016. |
(7) | The debt investment in Peekay Acquisition, LLC ("Peekay") was not paid off by its February 15, 2016 maturity date. Effective February 1, 2016 the debt investment was placed on non-accrual status. The loan is in default and lenders are working with the company on restructuring its debt. |
(8) | The Company's common equity investment in Peekay Boutiques, Inc. has been classified as an affiliated investment because the Company owns more than 5% of the outstanding voting securities of Peekay Boutiques, Inc. The Company's last out senior secured term loan in Peekay Acquisition, LLC has also been classified as an affiliated investment because Peekay Acquisition, LLC is a wholly owned subsidiary of Peekay Boutiques, Inc. |
(9) | The revenue linked security entitles the Company to participate in the proceeds of inventory sales pursuant to a consignment agreement between IAG Engine Center, LLC ("IAG") and an affiliated entity of IAG, AMS Flight Funding, LLC. |
(10) | The Company owns 49,209 Class B Preferred membership units representing 0.31% of the fully diluted common equity in World Business Lenders, LLC. However, due to the liquidation preference of the Class B units we would receive 0.52% of the proceeds in a liquidation of the company at the December 31, 2016 fair value. |
(11) | The coupon on the loan is subject to a pricing grid based on certain leverage ratios of the portfolio company. |
(12) | The subordinated notes of the CLO are the most junior tranche of securities in the securitization and have the attributes of equity. Our investment in Shinnecock CLO 2006-1 Ltd. is referred to as CLO Equity in other parts of this document. The CLO has begun its redemption process and as of October 15, 2016 had paid down all of its secured liabilities. The fair value of the investment as of December 31, 2016 is based on our expected liquidation proceeds and not on an effective yield basis. |
(13) | The loan was placed on non-accrual status during the second quarter of 2016, after the Company received notice from the senior secured lender to Fox Rent a Car, Inc. ("Fox") that, due to Fox's violation of certain covenants under its senior secured credit facility, it was blocking the junior secured term loan lenders from receiving interest payments until the covenant breaches were cured, waived by the senior secured lenders or the blockage period expires. During the third quarter of 2016, Fox refinanced its senior credit facility and our loan was brought current. On October 26, 2016, our credit agreement was amended and restated to convert the loan from a junior secured term loan to a senior secured term loan secured by all assets of the Company other than the vehicle fleet. The Company earned a $0.8 million amendment fee which is due at the earlier of maturity or loan repayment. The maturity date was changed from October 31, 2019 to September 29, 2017 and amortization of $0.2 million a month on the total loan amount will commence on March 31, 2017. The interest rate reverted back to the original level of LIBOR plus 12.00%. Also as part of the new agreement, the Company is entitled to receive additional fees and equity warrants in the borrower if our loan is not paid off at certain future milestone dates. The investment was taken off of non-accrual status during the third quarter of 2016 following the receipt of all past due interest. The Company earned warrants to buy 50.5 shares of common stock in Fox on 12/31/16 since the loan was not paid off as of that date. |
(14) | This loan was in violation of financial covenants pursuant to its loan agreement. As a result, the Company implemented a 3% PIK default rate on August 9, 2016. The default rate was in effect as of December 31, 2016. |
(15) | The loan is convertible any time, at the Company's discretion, into 5.8% of the fully diluted common equity of the borrower. |
(16) | The investment is held by HCAP Equity Holdings, LLC, the Company's taxable blocker subsidiary. |
(17) | The borrower failed to make a required principal payment on January 31, 2017 causing an event of default to occur under the credit agreement. The default had not been cured as of the filing date of this document. |
(18) | The Company's equity investment is in Flight Engine Leasing XI, LLC. This entity owns 100% of the membership interests in our borrower, Flight Engine Leasing III, LLC. |
87
Harvest Capital Credit Corporation
Notes to Audited Consolidated Financial Statements
Note 1. Organization
Harvest Capital Credit Corporation (“HCAP”) was incorporated as a Delaware corporation on November 14, 2012, for the purpose of, among other things, acquiring Harvest Capital Credit LLC (“HCC LLC”). HCAP acquired HCC LLC on May 2, 2013, in connection with HCAP's initial public offering. HCAP is an externally managed, closed-end, non-diversified management investment company that has filed an election to be treated as a business development company (“BDC”) under the Investment Company Act of 1940, as amended (the “1940 Act”). In addition, for tax purposes, HCAP has elected to be treated as a regulated investment company (“RIC”) under Subchapter M of the Internal Revenue Code of 1986, as amended (the “Code”). As an investment company, we follow accounting and reporting guidance as set forth in Financial Accounting Standards Board ("FASB") Accounting Standards Codification ("ASC") 946, Financial Services- Investment Companies.
On May 2, 2013, HCAP acquired HCC LLC. HCC LLC was organized as a limited liability company in the state of Delaware on February 7, 2011, and commenced operations on September 6, 2011, as an externally-managed specialty finance company with the objective of generating both current income and capital appreciation primarily by making direct investments in the form of subordinated debt and, to a lesser extent, senior debt and minority equity investments in privately-held U.S. small to mid-sized companies. Pursuant to the acquisition agreement, immediately prior to HCAP's election to be treated as a BDC under the 1940 Act, the following formation transaction was consummated:
* | HCAP acquired HCC LLC through a merger (the “Merger”) whereby HCC LLC merged with and into HCAP, and the holders of membership interests in HCC LLC received shares of HCAP common stock in exchange for their interests in HCC LLC. As a result of the Merger, the outstanding limited liability company interests in HCC LLC were converted into a number of shares of HCAP common stock equal to (i) $33.7 million (i.e., the net asset value of HCC LLC as of December 31, 2012), plus the proceeds of sales of membership interests by HCC LLC since December 31, 2012, plus the reclassification of mezzanine equity to members capital, and minus distributions of pre-December 31, 2012 earnings made by HCC LLC after December 31, 2012, divided by (ii) $15.00 per share of the common stock of HCAP. In connection with the Merger, the number of membership interests of HCC LLC underlying each outstanding warrant of HCC LLC, and the exercise price thereof, were converted into HCAP’s common stock equivalent (based on the merger conversion formula). In addition, the exercise prices of the warrants were subject to upward (but not downward) adjustment as the public offering price of HCAP’s shares of common stock in the initial public offering described below was higher than the then-current exercise price of the warrants. | |
* | HCAP assumed and succeeded to all of the assets and liabilities of HCC LLC, including its obligations under the revolving credit facility with JMP Group LLC. | |
* | On May 7, 2013, HCAP closed its initial public offering of 3,400,000 shares of its common stock at a price of $15.00 per share, raising $51.0 million in gross proceeds, or $50.4 million after deducting underwriting discounts and commissions. | |
* | On May 17, 2013, HCAP closed on the initial public offering underwriters’ overallotment option of 433,333 shares of its common stock at $15.00 per share, raising additional gross proceeds of $6.5 million, or $6.1 million after deducting underwriting discounts and commissions. | |
When HCAP acquired HCC LLC, HCAP issued shares of its common stock in exchange for all HCC LLC's outstanding membership interests at a rate of 0.9913 shares for each membership interest. As a result of this transaction, we have retroactively applied the aforementioned exchange/conversion rate to all unit measurements relating to HCC LLC's membership interests for all periods presented and have replaced all references to membership interests of HCC LLC to shares of common stock of HCAP in the financial statements and notes thereto contained herein. On the date of the Merger, the net asset value of HCAP was $15.00 per share and none of the warrants assumed in the Merger had an exercise price below $15.00 per share.
On July 1, 2016, the Company formed HCAP Equity Holdings, LLC, a Delaware limited liability company, as a wholly owned subsidiary of the Company to hold certain equity investments made by the Company in limited liability companies or other forms of pass-through entities. By investing through HCAP Equity Holdings, LLC , the Company is able to benefit from the tax treatment of this entity and create a tax structure that is advantageous with respect to the Company's status as a RIC. This taxable subsidiary is consolidated for U.S. GAAP financial reporting purposes, and the portfolio investments
88
held by the taxable subsidiary are included in the Company's consolidated financial statements and recorded at fair value in conjunction with the Company's valuation policy.
As used herein, the terms “we”, “us” and the “Company” refer to HCC LLC for the periods prior to the initial public offering and refer to HCAP for the periods after the initial public offering.
Note 2. Summary of Significant Accounting Policies
Basis of Financial Statement Presentation
The accompanying consolidated financial statements have been prepared in accordance with accounting principles generally accepted in the United States of America (“GAAP”) and in accordance with the rules and regulations of the SEC and Regulation S-X. In the opinion of management, all adjustments of a normal recurring nature considered necessary for the fair statement of the Company's consolidated financial statements have been made. Certain prior period amounts have been reclassified to reflect current period classification.
In preparing the consolidated financial statements in accordance with GAAP, management is required to make estimates and assumptions that affect the reported amounts of assets and liabilities, and disclosures of contingent assets and liabilities, as of the date of the Consolidated Statement of Assets and Liabilities and the Consolidated Statements of Operations for the period. Actual results could differ from those estimates.
Principles of Consolidation
The consolidated financial statements of the Company include the accounts of Harvest Capital Credit Corporation and its wholly-owned subsidiary, HCAP Equity Holdings, LLC. The effects of all intercompany transactions between the Company and its subsidiary have been eliminated in consolidation. Under the investment company rules and regulations pursuant to Article 6 of Regulation S-X and ASC 946, Financial Services - Investment Companies, the Company is precluded from consolidating portfolio company investments, including those in which it has a controlling interest, unless the portfolio company is another investment company.
Recent Accounting Pronouncements
In January 2016, the FASB issued ASU 2016-01, Recognition and Measurement of Financial Assets and Financial Liabilities. ASU 2016-01 amends certain aspects of recognition, measurement, presentation and disclosure of financial instruments, including the requirement to measure certain equity investments at fair value with changes in fair value recognized in net income. ASU 2016-01 is effective for interim and annual reporting periods in fiscal years beginning after December 15, 2017. We have concluded that adoption of this pronouncement will not have a material impact to our consolidated financial statements.
In October 2016, the SEC adopted new rules and forms and amended other rules to enhance the reporting and disclosure of information by registered investment companies. As part of these changes, the SEC amended Regulation S-X to standardize and enhance disclosures in investment company financial statements. Implementation of the new or amended rules is required for reporting periods ending after August 1, 2017. The Company has reviewed the requirements and adopted the amendments to Regulation S-X on its consolidated financial statements and related disclosures for the periods presented.
As of January 1, 2017, the Company adopted Accounting Standards Update (“ASU”) 2015-03, Simplifying the Presentation of Debt Issuance Costs, and ASU 2015-15, Presentation and Subsequent Measurement of Debt Issuance Costs Associated with Line-of-Credit Arrangements, which require debt issuance costs to be presented on the balance sheet as a direct deduction from the associated debt liability, except for debt issuance costs associated with line-of-credit arrangements. Adoption of these standards results in the reclassification of debt issuance costs from deferred offering costs and the presentation of the Company’s unsecured notes net of the associated debt issuance costs in the liabilities section on the Consolidated Statements of Assets and Liabilities. In addition, the comparative Consolidated Statements of Assets and Liabilities as of December 31, 2016 has been adjusted to apply the change in accounting principle retrospectively. Specifically, the presentation of the Company’s deferred offering costs and unsecured notes line items were adjusted by the amount of unamortized debt issuance costs. There is no impact to the Company’s Consolidated Statements of Operations. In addition,
89
there is no change to the presentation of the Credit Facility (defined below) as debt issuance costs are presented separately as an asset on the Consolidated Statements of Assets and Liabilities.
Debt issuance costs are fees and other direct incremental costs incurred by the Company in obtaining debt financing and are amortized over the life of the related debt instrument. In accordance with ASU 2015-03 debt issuance costs are presented as a reduction to the associated liability balance on the Consolidated Statement of Assets and Liabilities, except for debt issuance costs associated with line-of-credit arrangements. Debt issuance costs, net of accumulated amortization, were $1.0 million and $0.7 million as of December 31, 2017 and December 31, 2016, respectively.
Cash
Cash as presented in the Consolidated Statement of Assets and Liabilities and the Consolidated Statement of Cash Flows include bank checking accounts.
Restricted Cash
Restricted cash of $7.2 million and $3.1 million as of December 31, 2017 and December 31, 2016 respectively, was held at U.S. Bank, National Association in conjunction with the Company's Credit Facility (see Note 3. Borrowings). The Company is restricted from accessing this cash until the monthly settlement date when, after delivering a covenant compliance certificate, the net restricted cash is released to us after paying interest, fees and expenses owed under our Credit Facility.
Investments and Related Investment Revenue and Expense
All investment related revenue and expenses are reflected on the Consolidated Statement of Operations commencing on the settlement date unless otherwise specified by the transaction documents.
The Company accrues interest income if it expects that ultimately it will be able to collect it. Generally, when an interest payment default occurs on a loan in the portfolio, in which interest has not been paid for greater than 90 days, or if management otherwise believes that the issuer of the loan will not be able to service the loan and other obligations, the Company will place the loan on non-accrual status and will cease accruing interest income on that loan until all principal and interest is current through payment or until a restructuring occurs, such that the interest income is deemed collectible. However, the Company remains contractually entitled to this interest, and any collections actually received on these non-accrual loans may be recognized as interest income on a cash basis or applied to the principal depending upon management's judgment regarding collectibility. The Company may make exceptions to this policy if the loan has sufficient collateral value and is in the process of collection and the amount of collectible interest can be reasonably estimated.
For loans with contractual PIK (payment-in-kind) interest income, which represents contractual interest accrued and added to the loan balance that generally becomes due at maturity, we will not accrue PIK interest if we believe that the PIK interest is no longer collectible, including if the portfolio company valuation indicates that such PIK interest is not collectible. Loan origination fees - net of direct loan origination costs, original issue discounts that initially represent the value of detachable equity warrants obtained in conjunction with the acquisition of debt securities and market discounts or premiums - are accreted or amortized using the effective interest method as interest income over the contractual life of the loan. Upon the prepayment of a loan or debt security, any unamortized net loan origination fee will be recorded as interest income. Loan exit fees that are contractually required to be paid at the termination or maturity of the loan will be accreted to interest income over the contractual term of the loan. We suspend the accretion of interest income for any loans or debt securities placed on non-accrual status. We may also collect other prepayment premiums on loans. These prepayment premiums are recorded as other income as earned. Dividend income, if any, will be recognized on the ex-dividend date.
Certain expenses related to legal and tax consultation, due diligence, valuation expenses and independent collateral appraisals may arise when the Company makes certain investments. To the extent that such costs are not classified as direct loan origination costs, these expenses are recognized in the Consolidated Statement of Operations as they are incurred.
Investment Date
90
The Company records investment purchases and sales based on the trade date. For instances when the trade date and funding date differ, the Company captures the open trades in the receivable for securities sold or payable for securities purchased on the Consolidated Statements of Assets and Liabilities.
Net Realized Gains or Losses and Net Change in Unrealized Appreciation or Depreciation
Realized gains and losses on investments are calculated using the specific identification method. We measure realized gains or losses on equity investments as the difference between the net proceeds from the sale and the cost basis of the investment, without regard to unrealized appreciation or depreciation previously recognized. We measure realized gains or losses on debt investments as the difference between the net proceeds from the repayment or sale and the contractual amount owed to us on the investment, without regard to unrealized appreciation or depreciation previously recognized or unamortized deferred fees. The acceleration of unamortized deferred fees is recognized as interest income and the collection of prepayment and other fees is recognized as other income. We recognized $(8.1) million in realized losses on our investments during the twelve months ended December 31, 2017 and $(0.5) million in realized losses on our investments during the twelve months ended December 31, 2016.
Net changes in unrealized appreciation or depreciation measure changes in the fair value of our investments relative to changes in their amortized cost. We recognized $1.5 million in net change in unrealized appreciation during the twelve months ended December 31, 2017 and $(3.5) million in net change in unrealized depreciation during the twelve months ended December 31, 2016
Classification of Investments
We classify our investments by level of control. As defined in the 1940 Act, control investments are those where there is the ability or power to exercise a controlling influence over the management or policies of a company. Control is generally deemed to exist when a company or individual owns beneficially more than 25% of the voting securities of an investee company. Affiliated investments and affiliated companies are defined by a lesser degree of influence and are deemed to exist through beneficial ownership of at least 5% but not more than 25%, of the outstanding voting securities of another person. The Company had 23 and 26 investments that were classified as Non-Control/Non-Affiliated as of December 31, 2017 and December 31, 2016, respectively. Five of the Company’s investments were classified as Affiliated as of December 31, 2017 and three were Affiliated as of December 31, 2016. Three of the Company's investments were classified as Control as of December 31, 2017 and two were classified as Control as of December 31, 2016.
Valuation of Investments
Valuation analyses of the Company’s investments are performed on a quarterly basis pursuant to ASC 820, Fair Value Measurement. ASC 820 defines fair value, establishes a framework for measuring fair value in accordance with applicable accounting guidance and expands disclosure of fair value measurements.
Pursuant to ASC 820, the valuation standard used to measure the value of each investment is fair value defined as, “the price that would be received to sell an asset or paid to transfer a liability in an orderly transaction between market participants at the measurement date.” Investments are recorded at their fair value at each quarter end (the measurement date).
Fair Value Investment Hierarchy
Accounting standards establish a fair value hierarchy which requires an entity to maximize the use of observable inputs and minimize the use of unobservable inputs when measuring fair value. The standard describes three levels of inputs that may be used to measure fair value:
Level 1 | Quoted prices (unadjusted) for identical assets or liabilities in active public markets that the entity has the ability to access as of the measurement date. |
Level 2 | Significant other observable inputs other than Level 1 prices such as quoted prices for similar assets or liabilities; quoted prices in markets that are not active; or other inputs that are observable or can be corroborated by observable market data. |
Level 3 | Significant unobservable inputs that reflect a reporting entity’s own assumptions about what market participants would use in pricing an asset or liability. |
Valuation Process
91
Investments are measured at fair value as determined in good faith by our management team, reviewed by the audit committee of the board of directors (independent directors), and ultimately approved by our board of directors, based on, among other factors, consistently applied valuation procedures on each measurement date.
The board of directors undertakes a multi-step valuation process at each measurement date.
• | Our valuation process generally begins with each investment initially being valued by the Company's management or the investment professionals of our investment adviser, and/or, if applicable, by an independent valuation firm. |
• | Preliminary valuation conclusions are documented and discussed with our senior management. |
• | The audit committee of our board of directors reviews and discusses the preliminary valuations. |
• | The board of directors discusses valuations and determines the fair value of each investment in our portfolio in good faith, based upon the input of our senior management, the independent valuation firm report (if reviewed in such quarter), and the audit committee. |
The nature of the materials and input that the Company’s board of directors receives in the valuation process varies depending on the nature of the investment and the other facts and circumstances. For example, in the case of investments that are Level 1 or 2 assets, a formal report by the Company’s management or the investment professionals of its investment adviser, called a portfolio monitoring report, or “PMR,” is not generally prepared, and no independent external valuation firm is engaged due to the availability of quotes in markets for such investments or similar assets.
In the case of investments that are Level 3 assets, however, the Company’s board of directors generally receives a report on material Level 3 investments on a quarterly basis (i) from the Company’s management or the investment professionals of its investment adviser in the form of a PMR, (ii) from a third-party valuation firm, or (iii) in some cases, both. In the case of investments that are Level 3 assets and have an investment rating of 1 (performing above expectations), the Company generally engages an independent external valuation firm to review all such material investments at least annually. In quarters where an external valuation is not prepared for such investments, the Company’s management or the investment professionals of our investment adviser generally prepare a PMR. In the case of investments that are Level 3 assets and have an investment rating of 2 through 5 (with performance ranging from within expectations to substantially below expectations), the Company generally engages an independent external valuation firm to review such material investments quarterly (and may receive a PMR in addition to the review of the independent external valuation firm where the Level 3 assets have an investment rating of 3 through 5). However, in certain cases for Level 3 assets, the Company may determine that it is more appropriate for the Company to prepare a PMR instead of engaging an independent external valuation firm on a quarterly basis, because a third-party valuation is not cost effective or the nature of the investment does not warrant a quarterly third-party valuation. In addition, under certain unique circumstances, the Company may determine that a formal valuation report is not likely to be informative, and neither a third-party valuation report nor a report from the Company’s management or the investment professionals of its investment adviser is prepared. Such circumstances might include, for example, an instance in which the investment has paid off after the period end date but before the board of directors meets to discuss the valuations.
Further, Level 3 debt investments that have closed within six months of the measurement date are valued at cost unless unique circumstances dictate otherwise.
Valuation Methodology
The following section describes the valuation methods and techniques used to measure the fair value of the investments.
Fair value for each investment may be derived using a combination of valuation methodologies that, in the judgment of our management, are most relevant to such investment, including, without limitation, being based on one or more of the following: (i) market prices obtained from market makers for which our management has deemed there to be enough breadth (number of quotes) and depth to be indicative of fair value, (ii) the price paid or realized in a completed transaction or binding offer received in an arms-length transaction, (iii) the market approach (enterprise value), (iv) the income approach (discounted cash flow analysis) or (v) the bond yield approach.
92
The valuation methods selected for a particular investment are based on the circumstances and on the level of sufficient data available to measure fair value. If more than one valuation method is used to measure fair value, the results are evaluated and weighted, as appropriate, considering the reasonableness of the range indicated by those results. A fair value measurement is the point within that range that is most representative of fair value in the circumstances.
The determination of fair value using the selected methodologies takes into consideration a range of factors including, but not limited to, the price at which the investment was acquired, the nature of the investment, local market conditions, trading values on public and private exchanges for comparable securities, current and projected operating performance and financing transactions subsequent to the acquisition of the investment, compliance with agreed upon terms and covenants, and assessment of credit ratings of an underlying borrower.
In most cases we use the bond yield approach for valuing our Level 3 debt investments, as long as we deem this method appropriate. This approach entails analyzing the interest rate spreads for recently completed financing transactions which are similar in nature to ours, in order to assess what the range of effective market interest rates would be for our investment if it were being made on or near the valuation date. Then all of the remaining expected cash flows of the investment are discounted using this range of interest rates to determine a range of fair values for the debt investment. If, in our judgment, the bond yield approach is not appropriate, we may use the market approach, or, in certain cases, an alternative methodology potentially including an asset liquidation or expected recovery model.
The fair value of equity securities, including warrants, in portfolio companies oftentimes considers the market approach, which applies market valuation multiples of publicly-traded firms or recently acquired private firms engaged in businesses similar to those of the portfolio companies. This approach to determining the fair value of a portfolio company’s equity security will typically involve: (1) applying to the portfolio company’s trailing twelve month EBITDA (earnings before interest, taxes, depreciation and amortization) a range of enterprise value to EBITDA multiples that are derived from an analysis of comparable companies, in order to arrive at a range of enterprise values for the portfolio company; then (2) subtracting from the range of enterprise values balances of any debt or equity securities that rank senior to our equity securities; and (3) multiplying the range of equity values by the Company’s ownership share of such equity to determine a range of fair values for the Company’s equity investment.
We also use the income approach, which discounts a portfolio company’s expected future cash flows to determine its net present enterprise value. The discount rate used is based upon the company’s weighted average cost of capital, which is determined by blending the cost of the portfolio company’s various debt instruments and its estimated cost of equity capital. The cost of equity capital is estimated based upon our market knowledge and discussions with private equity sponsors.
These valuation methodologies involve a significant degree of judgment. As it relates to investments that do not have an active public market, there is no single standard for determining the estimated fair value. Valuations of privately held investments are inherently uncertain, and they may fluctuate over short periods of time and may be based on estimates. The determination of fair value may differ materially from the values that would have been used if a ready market for these investments existed. In some cases, fair value of such investments is best expressed as a range of values derived utilizing different methodologies from which a single estimate may then be determined.
Consequently, fair value for each investment may be derived using a combination of valuation methodologies that, in the judgment of our management, are most relevant to such investment. The selected valuation methodologies for a particular investment are consistently applied on each measurement date. However, a change in a valuation methodology or its application from one measurement date to another is possible if the change results in a measurement that is equally or more representative of fair value in the circumstances.
Capital Gains Incentive Fee
Under GAAP, the Company calculates the capital gains incentive fee as if the Company had realized all investments at their fair values as of the reporting date. Accordingly, the Company accrues a provisional capital gains incentive fee taking into account any unrealized gains or losses. As the provisional incentive fee is subject to the performance of investments until there is a realization event, the amount of provisional capital gains incentive fee accrued at a reporting date may vary from the capital gains incentive fee that is ultimately paid and the differences could be material.
Deferred Offering Costs
93
Deferred offering costs are made up of offering costs related to the preparation and filing of the Company's shelf registration statement on Form N-2 and the expenses related to the Company's 2020 Notes and 2022 Notes. The deferred offering costs consist of underwriting fees, legal fees and other direct costs incurred by the Company in conjunction with preparation and filing of the Company's shelf registration statement on Form N-2 and are recognized as assets and are amortized as deferred offering expense over the term of the applicable offering. The balance of deferred offering costs as of December 31, 2017 and December 31, 2016 was $1.2 million and $0.8 million, respectively. The amortization expense relating to deferred offering costs during the years ended December 31, 2017 and December 31, 2016 was $0.2 million and $0.2 million, respectively.
Deferred Financing Costs
Deferred financing costs are made up of debt issuance costs associated with the Company's revolving line of credit. The deferred debt financing costs consist of fees and other direct costs incurred by the Company in obtaining debt financing from its lenders and are recognized as assets and are amortized as interest expense over the term of the applicable credit facility. The balance of deferred financing costs as of December 31, 2017 and December 31, 2016 was $0.5 million and $0.5 million, respectively. The amortization expense relating to deferred debt financing costs during the years ended December 31, 2017 and December 31, 2016 was $0.2 million and $0.3 million, respectively.
Dividends and Distributions
Dividends and distributions to common stockholders are recorded on the ex-dividend date. Distributions to shareholders which exceed tax distributable income (tax net investment income and realized gains, if any) are reported as distributions of paid-in capital (i.e., return of capital). The determination of the tax attributes of our distributions is made at the end of the year based upon our taxable income for the full year and the distributions paid during the full year. Net realized capital gains, if any, are distributed at least annually, although the Company may decide to retain such capital gains for investment. The Company adopted a dividend reinvestment plan that provides for reinvestment of our dividends and other distributions on behalf of our stockholders, unless a stockholder elects to receive cash. As a result, if the board of directors authorizes, and we declare, a cash dividend or other distribution, then our stockholders who have not “opted out” of our dividend reinvestment plan will have their cash distribution automatically reinvested in additional shares of our common stock, rather than receiving the cash distribution.
During the years ended December 31, 2017 and December 31, 2016, the Company declared distributions totaling $1.45 and $1.35 per share, respectively.
Income Taxes
Beginning with its first taxable year ending December 31, 2013, the Company elected to be treated, and intends to qualify annually as a RIC under Subchapter M of the Code. To qualify for tax treatment as a RIC, the Company is required to meet certain income and asset diversification tests in addition to distributing at least 90% of ordinary income and realized net short-term capital gains in excess of realized net long-term capital losses, if any, out of the assets legally available for distribution. As a RIC, the Company will be subject to a 4% nondeductible federal excise tax on certain undistributed income unless the Company distributes in a timely manner an amount at least equal to the sum of (1) 98% of its ordinary income for each calendar year, (2) 98.2% of its capital gain net income for the 1-year period ending October 31 in that calendar year and (3) any ordinary income and net capital gains for preceding years that were not distributed during such years and on which the Company paid no U.S. federal income tax. To the extent the Company receives taxable income information from portfolio companies subsequent to the filing of the Form 10-K which alters taxable income estimates and book/tax differences as reported in the filing, the Company’s tax return will be trued-up.
The company's wholly-owned taxable subsidiary, HCAP Equity Holdings LLC, holds certain portfolio investments that are listed on the Consolidated Schedule of Investments. HCAP Equity Holdings LLC is consolidated for financial reporting purposes, such that the company’s consolidated financial statements reflect the Company’s investments in the portfolio companies owned by it. The purpose of the HCAP Equity Holdings LLC is to permit the Company to hold certain portfolio companies that are organized as limited liability companies (“LLCs”) (or other forms of pass-through entities) and still satisfy the RIC tax requirement that at least 90% of the RIC’s gross revenue for income tax purposes must consist of qualifying investment income. Absent such a taxable subsidiary, a proportionate amount of any gross income of an LLC (or other pass-through entity) portfolio investment would flow through directly to the RIC. To the extent that such income did not consist of qualifying investment income, it could jeopardize the Company’s ability to qualify as a RIC and therefore cause the Company to incur significant amounts of federal income taxes. When LLCs (or other pass-through entities) are owned by a taxable
94
subsidiary, their income is taxed to the taxable subsidiary and does not flow through to the RIC, thereby helping the Company preserve its RIC status and resultant tax advantages. HCAP Equity Holdings LLC is not consolidated for income tax purposes and may generate income tax expense as a result of its ownership of the portfolio companies. This income tax expense is reflected in the Company’s Consolidated Statements of Operations.
The Company’s tax returns are subject to examination by federal, state and local taxing authorities. Because many types of transactions are susceptible to varying interpretations under federal and state income tax laws and regulations, the amounts reported in the accompanying financial statements may be subject to change at a later date by the respective taxing authorities. For tax positions meeting the more-likely-than-not threshold, the amount recognized in the financial statements is the largest benefit that has a greater than 50% likelihood of being realized upon ultimate settlement with the relevant tax authority. Penalties or interest that may be assessed related to any income taxes would be classified as other operating expenses in the financial statements. Based on an analysis of our tax position, there are no uncertain tax positions that met the recognition or measurement criteria and the Company has no amounts accrued for interest or penalties as of December 31, 2017. Neither HCC LLC nor the Company is currently undergoing any tax examinations. The Company does not anticipate any significant increase or decrease in unrecognized tax benefits for the next twelve months. The federal tax years 2014-2016 for HCC LLC and the Company remain subject to examination by the IRS.
Excise Tax
The Company estimates excise tax based on timely information available. Excise tax for the year ended December 31, 2017 was $64,650. Excise tax for the year ended December 31, 2016 was $61,591.
Note 3. Borrowings
On October 29, 2013, the Company entered into a Loan and Security Agreement with CapitalSource Bank (now Pacific Western Bank), as agent and a lender, and each of the lenders from time to time party thereto, including City National Bank, to provide the Company with a $55.0 million senior secured revolving credit facility (the “Credit Facility”). The Credit Facility is secured by all of the Company’s assets, including the Company's equity interest in HCAP Equity Holdings, LLC, and has an accordion feature that allows the size of the facility to increase up to $85.0 million. On April 28, 2017, we amended our Credit Facility to, among other things, (i) extend the expiration of the revolving period from April 30, 2017 to October 30, 2018; (ii) extend the maturity date from October 29, 2018 to the earlier of (x) April 30, 2020, or (y) the date that is six (6) months prior to the maturity of any of the Company's outstanding unsecured longer-term indebtedness, which, based on the Company's outstanding 2022 Notes that mature on September 15, 2022, the maturity date under the facility would be April 30, 2020; and (iii) subject to certain conditions, provide limited borrowing base credit for the Company's loans to (x) certain portfolio companies in which the Company or HCAP Equity Holdings, LLC owns in excess of ten percent of the portfolio company's equity interests and (y) certain special purpose entity portfolio companies formed to hold specified assets, which loans previously did not receive borrowing base credit.
Advances under the Credit Facility, following amendments in September 2015, bear interest at a rate per annum equal to the lesser of (i) the applicable LIBOR rate plus 3.25% (with a 0.50% LIBOR floor) and (ii) the maximum rate permitted under applicable law.
In addition, the Credit Facility requires payment of a fee for unused amounts during the revolving period, which fee varies depending on the obligations outstanding as follows: (i) 0.75% per annum, if the average daily principal balance of the obligations outstanding for the prior month are less than fifty percent of the maximum loan amount; and (ii) 0.50% per annum, if such obligations outstanding are equal to or greater than fifty percent of the maximum loan amount. In each case, the fee is calculated based on the difference between (i) the maximum loan amount under the Credit Facility and (ii) the average daily principal balance of the obligations outstanding during the prior calendar month.
The Credit Facility also contains customary terms and conditions, including, without limitation, affirmative and negative covenants, including, without limitation, information reporting requirements, a minimum tangible net worth, a minimum debt service coverage ratio, a minimum liquidity of 4% of the maximum loan amount, a maximum leverage ratio of 1.00 to 1.00, and maintenance of RIC and BDC status. In addition, the Credit Facility contains a covenant that limits the amount of our unsecured longer-term indebtedness (as defined in the Credit Facility), which includes our unsecured notes, to 50% of the maximum borrowing amount under the Credit Facility. The Credit Facility also contains customary events of default, including, without limitation, nonpayment, misrepresentation of representations and warranties in a material respect, breach of covenant, cross-default to other indebtedness, bankruptcy, change of control, and the occurrence of a material adverse effect. In addition, the Credit Facility provides
95
that, upon the occurrence and during the continuation of such an event of default, the Company’s administration agreement could be terminated and a backup administrator could be substituted by the agent.
Availability under the Credit Facility is determined by advance rates against eligible loans in the borrowing base up to a maximum aggregate availability of $55.0 million. Advance rates against individual investments range from 40% to 65% depending on the seniority of the investment in the borrowing base.
As of December 31, 2017, the outstanding balance on the Credit Facility was $16.7 million. As of December 31, 2016, the outstanding balance on the Credit Facility was $26.9 million. As of December 31, 2017 and December 31, 2016, the Company was in compliance with its debt covenants.
On January 27, 2015, the Company closed the public offering of $25.0 million in aggregate principal amount of its 7.00% Notes due 2020 (the "2020 Notes"). On February 4, 2015, the Company closed on an additional $2.5 million in aggregate principal amount of 2020 Notes to cover the over-allotment option exercised by the underwriters. In total, the Company issued 1,100,000 2020 Notes at a price of $25.00 per Note. The total net proceeds to the Company from the 2020 Notes, after deducting underwriting discounts of $0.8 million and offering expenses of $0.2 million, were $26.5 million. The 2020 Notes were redeemable in whole or in part at anytime at the Company's option after January 16, 2017 at a price equal to 100% of the outstanding principal amount of the 2020 Notes plus accrued and unpaid interest. The 2020 Notes were redeemed on September 23, 2017. As a result of the redemption, the Company recorded a loss on extinguishment of debt for the amount of the unamortized debt issuance costs. The loss on extinguishment of debt recorded for the twelve months ended December 31, 2017 was $0.6 million. The Company did not record a loss on extinguishment of debt in the twelve months ended December 31, 2016. The loss on extinguishment of debt is classified as a component of net investment income in the Company’s Consolidated Statement of Operations. The 2020 Notes were listed on the NASDAQ Global Market under the trading symbol “HCAPL.”
On August 24, 2017, the Company closed the public offering of $25.0 million in aggregate principal amount of its 6.125% Notes due 2022 (the "2022 Notes"). On September 1, 2017, the Company closed on an additional $3.75 million in aggregate principal amount of 2022 Notes to cover the over-allotment option exercised by the underwriters. In total, the Company issued 1,150,000 of the 2022 Notes at a price of $25.00 per Note. The total net proceeds to the Company from the 2022 Notes, after deducting offering costs of $1.2 million, were $27.7 million. As of December 31, 2017, the outstanding principal balance of the 2022 Notes was $28.8 million and the debt issuance costs balance was $1.0 million. The Company used the proceeds of the 2022 Notes to redeem the 2020 Notes in full on September 23, 2017.
The 2022 Notes mature on September 15, 2022 and bear interest at a rate of 6.125%. They are redeemable in whole or in part at anytime at the Company's option after September 15, 2019 at a price equal to 100% of the outstanding principal amount of the 2022 Notes plus accrued and unpaid interest. The 2022 Notes are unsecured obligations of the Company and rank pari passu with any future unsecured indebtedness; senior to any of the Company’s future indebtedness that expressly provides it is subordinated to the 2022 Notes; effectively subordinated to all of the existing and future secured indebtedness of the Company, to the extent of the value of the assets securing such indebtedness, including borrowings under the Credit Facility; and structurally subordinated to all existing and future indebtedness and other obligations of any subsidiaries, financing vehicles, or similar facilities the Company may form in the future, with respect to claims on the assets of any such subsidiaries, financing vehicles, or similar facilities. Interest on the 2022 Notes is payable quarterly on March 15, June 15, September 15, and December 15 of each year. The 2022 Notes are listed on the NASDAQ Global Market under the trading symbol “HCAPZ.” The Company may from time to time repurchase 2022 Notes in accordance with the 1940 Act and the rules promulgated thereunder.
The indenture governing the 2022 Notes (the "2022 Notes Indenture”) contains certain covenants, including covenants (i) requiring the Company’s compliance with the asset coverage requirements set forth in Section 18(a)(1)(A) as modified by Section 61(a)(1) of the 1940 Act, whether or not the Company continues to be subject to such provisions of the 1940 Act; (ii) requiring the Company’s compliance, under certain circumstances, with a modified version of the requirements set forth in Section 18(a)(1)(B) as modified by Section 61(a)(1) of the 1940 Act, whether or not the Company continues to be subject to such provisions of the 1940 Act, prohibiting the declaration of any cash dividend or distribution upon any class of the Company’s capital stock (except to the extent necessary for the Company to maintain its status as a RIC under Subchapter M of the Code), or purchasing any such capital stock, if the Company’s asset coverage, as defined in the 1940 Act, were below 200% at the time of the declaration of the dividend or distribution or the purchase and after deducting the amount of such dividend, distribution, or purchase; and (iii) requiring the Company to provide financial information to the holders of the 2022 Notes and the custodian if the Company ceases to be subject to the reporting requirements of the Securities Exchange Act of 1934. These covenants are subject to limitations and exceptions that are described in the 2022 Notes Indenture. As of December 31, 2017, the Company was in compliance with its debt covenants.
96
Note 4. Concentrations of Credit Risk
The Company’s investment portfolio consists primarily of loans to privately-held small to mid-size companies. Many of these companies may experience variation in operating results. Many of these companies do business in regulated industries and could be affected by changes in government regulations.
The largest debt investments may vary from year to year as new debt investments are recorded and repaid. The Company’s five largest debt investments represented approximately 41.7% and 36.4% of total debt investments outstanding as of December 31, 2017 and December 31, 2016, respectively. Investment income, consisting of interest and fees, can fluctuate significantly upon repayment of large loans. Interest income from the five largest debt investments accounted for approximately 29.5% and 34.6% of total loan interest and fee income for the years ended December 31, 2017 and December 31, 2016, respectively.
Note 5. Shareholders’ Equity
The following tables summarize the total shares issued and proceeds received for shares of the Company’s common stock net of any underwriting discounts and offering costs for the years ended December 31, 2017, December 31, 2016 and December 31, 2015.
Year Ended December 31, 2017 | |||||
Shares | Proceeds | ||||
Shares issued | 172,774 | $ | 2,318,427 | ||
Dividends reinvested | 33,932 | 420,088 | |||
Shares repurchased | (36,614) | (401,902) | |||
Total for the year ended December 31, 2017 | 170,092 | $ | 2,336,613 | ||
Year Ended December 31, 2016 | |||||
Shares | Proceeds | ||||
Dividends reinvested | 43,603 | $ | 504,977 | ||
Shares repurchased | (25,776) | (322,137) | |||
Total for the year ended December 31, 2016 | 17,827 | $ | 182,840 | ||
Year Ended December 31, 2015 | ||||||
Shares | Proceeds | |||||
Dividends reinvested | 46,996 | $ | 566,557 | |||
Shares repurchased | — | — | ||||
Total for the year ended December 31, 2015 | 46,996 | $ | 566,557 | |||
As of December 31, 2017, December 31, 2016 and December 31, 2015, the Company had no dilutive securities outstanding.
On January 27, 2017, we entered into an equity distribution agreement with JMP Securities LLC relating to up to 1,000,000 shares of our common stock that we may offer and sell from time to time at prices related to the prevailing market prices or at negotiated prices. On September 29, 2017, the Company entered into a new equity distribution agreement with JMP Securities to sell up to 1,000,000 shares of our common stock from time to time at prevailing market prices or at negotiated prices.The Company sold 172,774 shares of stock in 2017 under these agreements at an average gross price of $14.03 per share.
97
On March 8, 2016, our board of directors authorized a $3.0 million open market stock repurchase program. Pursuant to our program, we were authorized to repurchase up to $3.0 million in the aggregate of our outstanding stock in the open market. The repurchase program expired on December 31, 2016. On June 13, 2017, our board of directors authorized another $3.0 million open market stock repurchase program. Pursuant to our program, we are authorized to repurchase up to $3.0 million in the aggregate of our outstanding stock in the open market. The timing, manner, price and amount of any share repurchases will be determined by our management at its discretion, and no assurances can be given that any common stock, or any particular amount, will be purchased. Unless amended by our board of directors, the repurchase program will expire on the earlier of June 30, 2018 or the repurchase of $3.0 million of our outstanding shares of common stock.
During the year ended December 31, 2017, the Company repurchased 36,614 shares of its common stock at an average price of $10.98 per share, and a total cost of $401,902. During the year ended December 31, 2016, the Company repurchased 25,776 shares of its common stock at an average price of $12.50 per share, and a total cost of $322,137.
We have adopted an “opt out” dividend reinvestment plan, or “DRIP,” for our common stockholders. As a result, if we make cash distributions, then stockholders’ cash distributions will be automatically reinvested in additional shares of our common stock, unless they specifically “opt out” of the dividend reinvestment plan so as to receive cash distributions.
Note 6. Fair Value Measurements
As described in Note 2, the Company uses fair value measurements to record fair value adjustments to certain assets and liabilities and to determine fair value disclosures. A description of the valuation methodologies used for assets and liabilities recorded at fair value, and for estimating fair value for financial and non-financial instruments not recorded at fair value, is set forth below.
Unsecured notes: The 2022 Notes are a Level 2 financial instrument with readily observable market inputs. The Notes trade under the ticker HCAPZ and, as of December 31, 2017, the fair value of $29.3 million was based on the closing price of the Notes on that day.
Off-balance sheet financial instruments: The fair value of unfunded commitments is estimated based on the fair value of the funded portion of the corresponding debt investment.
As of December 31, 2017 and December 31, 2016, unfunded commitments totaled $3.0 million and $2.1 million, respectively, and if funded, their estimated fair values on such dates were $3.0 million and $2.1 million, respectively.
There are no assets or liabilities measured at fair value on a nonrecurring basis as of December 31, 2017 or December 31, 2016. The following table details the financial instruments that are carried at fair value and measured at fair value on a recurring basis as of December 31, 2017 and December 31, 2016, respectively:
Fair Values as of December 31, 2017 | |||||||||||||||
Level 1 | Level 2 | Level 3 | Total | ||||||||||||
Financial assets: | |||||||||||||||
Senior Secured | $ | — | $ | — | $ | 59,010,761 | $ | 59,010,761 | |||||||
Junior Secured | — | 3,719,609 | 44,379,140 | 48,098,749 | |||||||||||
Equity and Equity Related Securities | — | — | 7,958,168 | 7,958,168 | |||||||||||
Revenue Linked Security | — | — | 533,000 | 533,000 | |||||||||||
$ | — | $ | 3,719,609 | $ | 111,881,069 | $ | 115,600,678 | ||||||||
98
Fair Values as of December 31, 2016 | |||||||||||||||
Level 1 | Level 2 | Level 3 | Total | ||||||||||||
Financial assets: | |||||||||||||||
Senior Secured (1) | $ | — | $ | — | $ | 76,221,062 | $ | 76,221,062 | |||||||
Junior Secured | — | 8,098,791 | 44,442,975 | 52,541,766 | |||||||||||
CLO Equity | — | — | 138,730 | 138,730 | |||||||||||
Equity and Equity Related Securities | — | — | 4,207,964 | 4,207,964 | |||||||||||
Revenue Linked Security | — | — | 992,012 | 992,012 | |||||||||||
$ | — | $ | 8,098,791 | $ | 126,002,743 | $ | 134,101,534 | ||||||||
(1) | Senior secured category for December 31, 2016 includes both first out and last out term loans. The Company's last out senior secured loans are identified on the Schedule of Investments. |
The following table provides quantitative information related to the significant unobservable inputs used to fair value the Company's Level 3 investments as of December 31, 2017 and December 31, 2016, respectively, and indicates the valuation techniques utilized by the Company to determine the fair value:
Type of Investment | Fair Value at December 31, 2017 | Valuation Technique (1) | Significant Unobservable Input | Range | Weighted Average | |||||||
Senior Secured | $ | 59,010,761 | Bond Yield | Risk adjusted discount factor | 6.0% - 30.2% | 10.6% | ||||||
Market | EBITDA multiple | 2.2x - 6.7x | 5.5x | |||||||||
Income | Weighted average cost of capital | 10.0% - 23.1% | 15.6% | |||||||||
Junior Secured | $ | 44,379,140 | Bond Yield | Risk adjusted discount factor | 4.1% - 17.5% | 12.6% | ||||||
Market | EBITDA multiple | 0.9x - 10.9x | 7.4x | |||||||||
Income | Weighted average cost of capital | 9.0% - 17.8% | 15.1% | |||||||||
Equity and Equity Related Securities | $ | 7,958,168 | Market | EBITDA multiple | 3.6x - 6.9x | 5.5x | ||||||
Income | Weighted average cost of capital | 10.0% - 25.0% | 14.6% | |||||||||
Revenue Linked Security | $ | 533,000 | Income | Weighted average cost of capital | 36.6% | 36.6% | ||||||
99
Type of Investment | Fair Value at December 31, 2016 | Valuation Technique (1) | Significant Unobservable Input | Range | Weighted Average | |||||||
Senior Secured (2) | $ | 76,221,062 | Bond Yield | Risk adjusted discount factor | 6.1% - 30.0% | 13.5% | ||||||
Market | EBITDA multiple | 0.8x - 9.7x | 5.0x | |||||||||
Income | Weighted average cost of capital | 10.0% - 23.0% | 17.4% | |||||||||
Junior Secured | $ | 44,442,975 | Bond Yield | Risk adjusted discount factor | 4.2% - 26.0% | 13.6% | ||||||
Market | EBITDA multiple | 5.9x - 8.7x | 7.3x | |||||||||
Income | Weighted average cost of capital | 13.0% - 25.0% | 17.5% | |||||||||
Equity and Equity Related Securities | $ | 4,207,964 | Market | EBITDA multiple | 4.1x - 9.7x | 6.4x | ||||||
Income | Weighted average cost of capital | 10.0% - 23.0% | 18.3% | |||||||||
CLO Equity | $ | 138,730 | Estimated Liquidation Value | Discount applied to loans | 50% | N/A | ||||||
Revenue Linked Security | $ | 992,012 | Income | Weighted average cost of capital | 50% | 50% | ||||||
(1) | When estimating the fair value of its debt investments, the Company typically utilizes the bond yield technique. The significant unobservable inputs used in the fair value measurement under this technique are risk adjusted discount factors. However, the Company also takes into consideration the market technique and income technique in order to determine whether the fair value of the debt investment is within the estimated enterprise value of the portfolio company. The significant unobservable inputs used under these techniques are EBITDA multiples and weighted average cost of capital. Under the bond yield technique, significant increases (decreases) in the risk adjusted discount factors would result in a significantly lower (higher) fair value measurement. When estimating the fair value of its equity investments, the Company utilizes the (i) market technique and (ii) income technique. The significant unobservable inputs used in the fair value measurement of the Company’s equity investments are EBITDA multiples and weighted average cost of capital (“WACC”). Significant increases (decreases) in EBITDA multiple inputs in isolation would result in a significantly higher (lower) fair value measurement. Significant increases (decreases) in WACC inputs in isolation would result in a significantly lower (higher) fair value measurement. When estimating the value of its CLO equity investment, the Company historically utilized the bond yield technique. The significant unobservable inputs used in the fair value measurement under this technique were risk adjusted discount factors. The Company also utilized the performance and covenant compliance information as provided by the independent trustee along with other risk factors including default risk, prepayment rates, interest rate risk and credit spread risk when valuing this investment. As of December 31, 2016, the CLO had been called and was almost entirely liquidated. The fair value of the investment at December 31, 2016 was based on the estimated liquidation value of the loans remaining in the CLO as of this date. |
(2) | Senior secured category includes both first out and last out loans. The Company's last out senior secured loans are identified on the Consolidated Schedule of Investments. |
The following table shows a reconciliation of the beginning and ending balances for Level 3 assets for the years ending December 31, 2017 and December 31, 2016. Transfers between investment type and level, if any, are recognized at fair value at the end of the year in which the transfers occur:
100
Year ended December 31, 2017 | |||||||||||||||||||||||
Senior Secured | Junior Secured | CLO Equity | Equity and Equity Related Securities | Revenue- Linked Security | December 31, 2017 | ||||||||||||||||||
Fair value of portfolio, beginning of period | $ | 76,221,062 | $ | 44,442,975 | $ | 138,730 | $ | 4,207,964 | $ | 992,012 | $ | 126,002,743 | |||||||||||
New/Add-on investments | 33,058,389 | 17,952,428 | — | 4,267,737 | — | 55,278,554 | |||||||||||||||||
Principal payments received | (52,116,306 | ) | (7,735,662 | ) | (76,947 | ) | (662,304 | ) | (605,612 | ) | (61,196,831 | ) | |||||||||||
Loan origination fees received | (2,121,900 | ) | (332,872 | ) | — | (4,096 | ) | — | (2,458,868 | ) | |||||||||||||
Payment in kind interest earned | 995,318 | 797,769 | — | — | — | 1,793,087 | |||||||||||||||||
Accretion of deferred loan origination fees/discounts | 2,071,919 | 263,719 | — | — | — | 2,335,638 | |||||||||||||||||
Transfer to (from) level 3 | — | (2,015,000 | ) | — | — | — | (2,015,000 | ) | |||||||||||||||
Transfer (to) from investment type | 4,300,000 | (4,300,000 | ) | — | — | — | — | ||||||||||||||||
Transfer (to) from other receivables | — | — | (28,532 | ) | — | — | (28,532 | ) | |||||||||||||||
Net realized losses on investments | (1,995,421 | ) | (6,293,866 | ) | (33,251 | ) | 260,097 | — | (8,062,441 | ) | |||||||||||||
Change in unrealized appreciation (depreciation) on investments | (1,402,300 | ) | 1,599,649 | — | (111,230 | ) | 146,600 | 232,719 | |||||||||||||||
Fair value of portfolio, end of period | $ | 59,010,761 | $ | 44,379,140 | $ | — | $ | 7,958,168 | $ | 533,000 | $ | 111,881,069 | |||||||||||
Net unrealized depreciation relating to Level 3 assets still held at December 31, 2017 | $ | (2,812,484 | ) | $ | (115,197 | ) | $ | — | $ | (16,639 | ) | $ | 146,600 | (2,797,720 | ) | ||||||||
Year ended December 31, 2016 | |||||||||||||||||||||||
Senior Secured (1) | Junior Secured | CLO Equity | Equity and Equity Related Securities | Revenue- Linked Security | December 31, 2016 | ||||||||||||||||||
Fair value of portfolio, beginning of period | $ | 80,220,519 | $ | 43,593,371 | $ | 1,567,860 | $ | 1,824,777 | $ | — | $ | 127,206,527 | |||||||||||
New/Add-on investments | 16,594,084 | 10,800,000 | — | 4,125,000 | 895,962 | 32,415,046 | |||||||||||||||||
Principal payments received | (29,875,918 | ) | (137,500 | ) | (1,359,227 | ) | (810,578 | ) | — | (32,183,223 | ) | ||||||||||||
Loan origination fees received | (1,096,399 | ) | (251,000 | ) | — | — | — | (1,347,399 | ) | ||||||||||||||
Payment in kind interest earned | 523,371 | 836,219 | — | 35,978 | 103,165 | 1,498,733 | |||||||||||||||||
Accretion of deferred loan origination fees/discounts | 883,413 | 817,971 | — | — | — | 1,701,384 | |||||||||||||||||
Transfer (to) from level 3 | — | — | — | — | — | — | |||||||||||||||||
Transfer (to) from investment type | 10,722,000 | (10,722,000 | ) | — | — | — | — | ||||||||||||||||
Net realized losses on investments | (700,465 | ) | — | (69,903 | ) | 182,559 | — | (587,809 | ) | ||||||||||||||
Change in unrealized appreciation (depreciation) on investments | (1,049,543 | ) | (494,086 | ) | — | (1,149,772 | ) | (7,115 | ) | (2,700,516 | ) | ||||||||||||
Fair value of portfolio, end of period | $ | 76,221,062 | $ | 44,442,975 | $ | 138,730 | $ | 4,207,964 | $ | 992,012 | $ | 126,002,743 | |||||||||||
Net unrealized depreciation relating to Level 3 assets still held at December 31, 2016 | $ | (1,689,509 | ) | $ | (494,084 | ) | $ | — | $ | (1,239,932 | ) | $ | (7,115 | ) | $ | (3,430,640 | ) | ||||||
(1 | ) | Senior secured category includes both first out and last out loans. The Company's last out senior secured loans are identified on the Schedule of Investments. |
There was one transfer of an asset from Level 3 to Level 2 during the year ended December 31, 2017. There were no transfers between levels of the fair value hierarchy during the year ended December 31, 2016. In order for an investment to be considered a Level 2 investment there must be multiple dealer quotes at the time of the fair value measurement and the quotes must be determined to be actionable.
101
The information presented should not be interpreted as an estimate of the fair value of the entire Company since a fair value calculation is only required for a portion of the Company’s assets and liabilities.
Note 7. Related Party Transactions
We were founded in September 2011 by certain members of our investment adviser and JMP Group Inc. (now JMP Group LLC) ("JMP Group"), a full-service investment banking and asset management firm. JMP Group currently holds an equity interest in us and our investment adviser. JMP Group conducts its primary business activities through three wholly-owned subsidiaries: (i) Harvest Capital Strategies, LLC ("HCS"), an SEC registered investment adviser that focuses on long-short equity hedge funds, middle-market lending and private equity, (ii) JMP Securities LLC, a full-service investment bank that provides equity research, institutional brokerage and investment banking services to growth companies and their investors, and (iii) JMP Credit Advisors LLC ("JMP Credit Advisors"), which manages approximately $0.9 billion in credit assets of collateralized loan obligation and warehouse funds.
In conjunction with our initial public offering in May 2013, HCAP entered into an investment advisory and management agreement with HCAP Advisors LLC ("HCAP Advisors"), which is a majority owned subsidiary of JMP Group. Under the investment advisory and management agreement, the base management fee is calculated based on our gross assets (which includes assets acquired with the use of leverage and excludes cash and cash equivalents) at an annual rate of 2.0% on gross assets up to and including $350 million, 1.75% on gross assets above $350 million and up to and including $1 billion, and 1.5% on gross assets above $1 billion. The incentive fee consists of two parts. The first part is calculated and payable quarterly in arrears based on our pre-incentive fee net investment income for the immediately preceding calendar quarter and is 20% of the amount, if any, by which our pre-incentive fee net investment income for the immediately preceding calendar quarter exceeds a 2.0% (which is 8.0% annualized) hurdle rate and a “catch-up” provision measured as of the end of each calendar quarter. Under this provision, in any calendar quarter, our investment adviser receives no incentive fee until our net investment income equals the hurdle rate of 2.0%, but then receives, as a “catch-up”, 100% of our pre-incentive fee net investment income with respect to that portion of such pre-incentive fee net investment income, if any, that exceeds the hurdle rate but is less than 2.5%. The effect of this provision is that, if pre-incentive fee net investment income exceeds 2.5% in any calendar quarter, our investment adviser, HCAP Advisors (as defined above), will receive 20% of our pre-incentive fee net investment income as if a hurdle rate did not apply. Since the hurdle rate is fixed, as interest rates rise, it is easier for our investment adviser to surpass the hurdle rate and receive an incentive fee based on net investment income.The second part is calculated and payable in arrears as of the end of each calendar year (or upon termination of the investment advisory and management agreement, as of the termination date) and equals 20% of our realized capital gains on a cumulative basis from inception through the end of each calendar year, computed net of all realized capital losses and unrealized capital depreciation on a cumulative basis, less the aggregate amount of any previously paid capital gain incentive fees.
The incentive fee is subject to a total return requirement, which provides that no incentive fee in respect of our pre-incentive fee net investment income is payable except to the extent 20% of the cumulative net increase in net assets resulting from operations over the then current and 11 preceding calendar quarters exceeds the cumulative income and capital gains incentive fees accrued and/or paid for the 11 preceding quarters. As a result, even in the event that our pre-incentive fee net investment income exceeds the hurdle rate, no incentive fee will be payable to the extent that we have generated cumulative net decreases in assets resulting from operations over the trailing 12 quarters due to unrealized or realized net losses on our investments.
Incentive fee expense for the year ended December 31, 2017 totaled $0.1 million after giving effect to the total return requirement discussed above. Incentive fee expense for the year ended December 31, 2017 would have been $1.1 million had the total return requirement not applied. Incentive fee expense for the year ended December 31, 2016 totaled $1.4 million.
The capital gains incentive fee is determined and paid annually with respect to cumulative realized capital gains (but not unrealized capital gains) to the extent such cumulative realized capital gains exceed cumulative realized and unrealized capital losses through the end of such fiscal year (less the aggregate amount of any previously paid capital gain incentive fee). The Company also records an expense accrual relating to the capital gains incentive fee payable by the Company to its investment adviser when (i) the cumulative realized and unrealized gains on its investments exceed all cumulative realized and unrealized capital losses on its investments and (ii) the capital gains incentive fee that would be payable exceeds the aggregate amount of any previously paid capital gain incentive fee given the fact that a capital gains incentive fee would be owed to the investment adviser if the Company were to liquidate its investment portfolio at such time. Any decrease in unrealized appreciation in subsequent periods will result in the reversal of some or all of such previously recorded expense accrual. The actual incentive fee payable to the Company's investment adviser related to capital gains is determined and payable in arrears at the end of each fiscal year and
102
is only based on cumulative realized capital gains, including realized capital gains for such period, but not unrealized capital gains. The Company recorded net change in unrealized appreciation (depreciation) of $1.5 million for the year ended December 31, 2017 and a net change in unrealized appreciation (depreciation) of $(3.5) million for the year ended December 31, 2016. The Company recorded net realized gains (losses) of $(8.1) million for the year ended December 31, 2017 and net realized gains (losses) of $(0.5) million for the year ended December 31, 2016.
Total base management fees and incentive management fees were $2.7 million and $4.3 million for the years ended December 31, 2017 and December 31, 2016, respectively. Base and incentive management fees payable were $0.6 million and $0.9 million as of December 31, 2017 and December 31, 2016, respectively.
In conjunction with our initial public offering in May 2013, HCAP entered into an administration agreement with JMP Credit Advisors pursuant to which JMP Credit Advisors provides administrative services to HCAP and furnishes us with office facilities, equipment, and clerical, bookkeeping, and record keeping services. Payments under the administration agreement are equal to an amount based upon our allocable portion of the administrator's overhead in performing its obligations under the administration agreement, including rent and our allocable portion of the cost of our chief financial officer and chief compliance officer and their respective staffs and administrative services provided to the Company by our chief executive officer and other officers, except that payments required to be made by HCAP to JMP Credit Advisors under the agreement were capped such that amounts payable to JMP Credit Advisors would not exceed $275,000 during the first year of the term of the administration agreement. In connection with the expiration of the $275,000 cap on April 29, 2014, the Company negotiated a cap with JMP Credit Advisors of $150,000 for each of the quarters ending June 30, September 30, and December 31, 2014. On March 5, 2015, the Company negotiated a cap with JMP Credit Advisors on amounts payable by the Company under the administration agreement during the 2015 fiscal and calendar year. The 2015 cap set the maximum amount that was payable by the Company on both a quarterly and annual basis. The cap for each quarter was as follows: (i) for the quarter ended March 31, 2015, the cap was $150,000; (ii) for the quarter ended June 30, 2015, the cap was equal to the sum of (a) $150,000 plus (b) 0.25% of the increase in the Company’s portfolio assets from December 31, 2014, to March 31, 2015; (iii) for the quarter ended September 30, 2015, the cap was equal to the sum of (a) $150,000 plus (b) 0.25% of the increase in the Company’s portfolio assets from December 31, 2014 to June 30, 2015; and (iv) for the quarter ended December 31, 2015, the cap was equal to the sum of (a) $150,000 plus (b) 0.25% of the increase in the Company’s portfolio assets from December 31, 2014, to September 30, 2015. The overall cap for the year was $800,000, so notwithstanding any given quarterly cap, the amounts payable for all four quarters would not exceed $800,000. In connection with the expiration of the 2015 cap, the Company entered into an annual cap for 2016 such that the maximum amount that would be payable by the Company for 2016 was the lesser of 0.60% of the average of the Company's total investments over the year ended December 31, 2016 or $917,000. On January 4, 2017, our board of directors approved an increase in the cap to the extent necessary to reimburse JMP Credit Advisors for the cost of administrative services provided to the Company by Chief Executive Officer Richard P. Buckanavage and Vice President Ryan T. Magee in the fourth quarter of 2016, in an amount up to $75,000. In connection with the expiration of the 2016 cap, the Company negotiated a new cap with JMP Credit Advisors on amounts payable during the 2017 fiscal and calendar year. The 2017 cap set the maximum amount payable for the year at $1,200,000.
On October 27, 2017, our compensation committee and board of directors approved an increase in the cap on amounts payable by the Company under the administration agreement to cover increased costs associated with moving the administrative functions of the Company from Alpharetta, Georgia to its headquarters in New York, New York. For the 2017 fiscal year, the Company and JMP Credit Advisors had agreed to a cap that set the maximum amount that would be payable by the Company for services under the administration agreement in 2017 at $1.2 million. Our compensation committee and board of directors approved an increase in this cap to the extent necessary to reimburse JMP Credit Advisors for costs and expenses payable by the Company under the administration agreement for fiscal year 2017 in excess of the existing cap, up to an additional $0.2 million, for a total cap on all amounts to be paid by the Company under the administration agreement for fiscal year 2017 of $1.4 million.
Total administrative services expense was $1.4 million and $0.9 million for the years ended December 31, 2017 and December 31, 2016, respectively. Administrative services fees payable were $0.4 million and $0.3 million as of December 31, 2017 and December 31, 2016, respectively.
In connection with the Company’s offering of its 2020 Notes in January 2015, JMP Securities LLC was one of the co-managing underwriters and received approximately $20,000 of compensation for its services. In the future, JMP Securities LLC or its affiliates may provide the Company with various financial advisory and investment banking services, for which they would receive customary compensation.
103
On January 27, 2017, we entered into an equity distribution agreement with JMP Securities LLC relating to up to 1,000,000 shares of our common stock that we may offer and sell from time to time at prices related to the prevailing market prices or at negotiated prices. On September 29, 2017, the Company entered into a new equity distribution agreement with JMP Securities to sell up to 1,000,000 shares of our common stock from time to time at prevailing market prices or at negotiated prices. During the year ended December 31, 2017, we sold 172,774 shares at at average price of $14.03 per share through these agreements.
Note 8. Commitments and Contingencies
At December 31, 2017, the Company had a total of $3.0 million in unfunded commitments comprised of unfunded revolving line of credit commitments on five of the Company’s debt investments. At December 31, 2016, the Company had a total of $2.1 million in unfunded commitments comprised of unfunded revolving line of credit commitments on five of the Company’s debt investments. The following table summarizes the Company's unfunded commitments and extended fair value, if drawn, as of December 31, 2017 and December 31, 2016:
As of December 31, 2017 | As of December 31, 2016 | ||||||||||||||
Unfunded Commitment | Extended Fair Value of Unfunded Commitment | Unfunded Commitment | Extended Fair Value of Unfunded Commitment | ||||||||||||
24/7 Software, Inc. | $ | 300,000 | $ | 297,067 | $ | — | $ | — | |||||||
Chemical Information Services, LLC | — | — | 285,000 | 285,000 | |||||||||||
Direct Med Parts & Service, LLC | 1,000,000 | 1,000,000 | — | — | |||||||||||
Infinite Care, LLC | — | — | 800,000 | 789,235 | |||||||||||
King Engineering Associates, Inc. | 300,000 | 300,000 | — | — | |||||||||||
Lanco Acquisition, LLC | — | — | 450,000 | 450,000 | |||||||||||
Northeast Metal Works LLC | — | — | 310,761 | 310,761 | |||||||||||
Surge Busy Bee Holdings, LLC | 300,000 | 287,652 | — | — | |||||||||||
WorkWell, LLC | — | — | 300,000 | 296,378 | |||||||||||
V-Tek, Inc. | 1,113,903 | 1,113,903 | — | — | |||||||||||
Total | $ | 3,013,903 | $ | 2,998,622 | $ | 2,145,761 | $ | 2,131,374 | |||||||
Legal Proceedings
We are a party to certain legal proceedings incidental to the normal course of our business, including where third parties may try to seek to impose liability on us in connection with the activities of our portfolio companies. While the outcome of these legal proceedings cannot at this time be predicted with certainty, we do not expect that these proceedings will have a material effect on our financial condition or results of operations.
Note 9. Net Increase in Net Assets Resulting from Operations per Common Share
In accordance with the provision of ASC 260, “Earnings per Share,” basic earnings per share is computed by dividing earnings available to common shareholders by the weighted average number of shares outstanding during the period. Other potentially dilutive common shares, and the related impact to earnings, are considered when calculating earnings per share on a diluted basis. There were no potentially dilutive common shares issued as of December 31, 2017, December 31, 2016 or December 31, 2015.
The following information sets forth the computation of the weighted average basic and diluted net increase in net assets per share from operations for each period:
104
Year Ended December 31, 2017 | Year Ended December 31, 2016 | Year Ended December 31, 2015 | |||||||||
Net increase in net assets resulting from operations | $ | 1,632,586 | $ | 6,006,487 | $ | 6,411,013 | |||||
Weighted average shares outstanding (basic and diluted) | 6,412,215 | 6,282,360 | 6,249,346 | ||||||||
Net increase in net assets resulting from operations per share | $ | 0.25 | $ | 0.96 | $ | 1.03 | |||||
Note 10. Income Tax
Taxable income differs from net increase (decrease) in net assets resulting from operations primarily due to: (1) unrealized appreciation (depreciation) on investments and incentive fees on such investments, as investment gains and losses and the accompanying incentive fees are not included in taxable income until they are realized; (2) recognition of interest income on certain loans; (3) income or loss recognition on exited investments; and (4) excise taxes on undistributed ordinary income and capital gains, as federal taxes are not deductible.
Listed below is a reconciliation of “net increase in net assets resulting from operations” to taxable income for the year ended December 31, 2017, December 31, 2016 and December 31, 2015.
Year Ended December 31, 2017 | Year Ended December 31, 2016 | Year Ended December 31, 2015 | |||||||||
Net increase in net assets resulting from operations | $ | 1,632,586 | $ | 6,006,487 | $ | 6,411,013 | |||||
Net change in unrealized depreciation (appreciation) on investments | (1,458,173 | ) | 3,528,349 | 2,182,647 | |||||||
Incentive fees on net unrealized depreciation on investments | — | — | (92,883 | ) | |||||||
Book/tax difference due to acceleration of loan fees on modified investments | (399,791 | ) | (21,183 | ) | 70,415 | ||||||
Book/tax difference due to interest income on certain investments | 299,656 | (197,831 | ) | (298,798 | ) | ||||||
Interest income in HCAP Equity Holdings LLC | (420,493 | ) | — | — | |||||||
Operating expenses in HCAP Equity Holdings LLC | 245,271 | — | — | ||||||||
Book/tax difference due to capital losses | 766,206 | 148,716 | 1,060,320 | ||||||||
Book/tax difference due to partnership income on certain equity investments | — | (17,853 | ) | (83,052 | ) | ||||||
Excise and income taxes not deductible | 128,215 | 61,591 | 1,393 | ||||||||
Capital loss carryforward | 7,296,235 | 368,870 | — | ||||||||
Taxable/Distributable Income | $ | 8,089,712 | $ | 9,877,146 | $ | 9,251,055 | |||||
The gross unrealized appreciation, gross unrealized depreciation and net unrealized depreciation of the Company's investments for federal income tax purposes totaled $4.0 million, $6.5 million and $2.5 million, respectively. The tax cost of investments is $118.1 million. The components of accumulated undistributed and distributions in excess of income on a tax basis were as follows:
As of December 31, | |||||||||||
2017 | 2016 | 2015 | |||||||||
Ordinary income | $ | 1,108,620 | $ | 2,795,424 | $ | 1,183,219 | |||||
Realized capital gains | $ | — | $ | — | $ | 1,509 | |||||
At December 31, 2017, the Company had a net long term capital loss carryforward of $7.7 million to offset future net capital gains. This loss carryforward does not have an expiration date.
Our distributions, if any, are determined by our board of directors. We have elected to be treated for federal income tax purposes as a RIC under Subchapter M of the Code. If we maintain our qualification as a RIC, we will not be taxed on our
105
investment company taxable income or realized net capital gains, to the extent that such taxable income or gains are distributed, or deemed to be distributed, to stockholders on a timely basis.
To receive RIC tax treatment, we must, among other things, distribute annually at least 90% of our net ordinary income and realized net short-term capital gains in excess of realized net long-term capital losses, if any. Depending on the level of taxable income earned in a tax year, we may choose to carry forward taxable income in excess of current year distributions into the next tax year and pay a 4% excise tax on such income. Any such carryover taxable income must be distributed through a dividend declared prior to filing the final tax return related to the year which generated such taxable income. We may, in the future, make actual distributions to our stockholders of our net capital gains. We can offer no assurance that we will achieve results that will permit the payment of any cash distributions and, if we issue senior securities, we may be prohibited from making distributions if doing so causes us to fail to maintain the asset coverage ratios stipulated by the 1940 Act or if distributions are limited by the
terms of any of our borrowings. The Company did not incur a U.S. federal excise tax for calendar year 2013. The Company incurred a U.S. federal excise tax of $43,727 for calendar year 2014, $1,393 for calendar year 2015, $85,512 for calendar year 2016, and expects to incur $30,226 for 2017.
We have adopted an “opt out” dividend reinvestment plan, or “DRIP,” for our common stockholders. As a result, if we make cash distributions, then stockholders’ cash distributions will be automatically reinvested in additional shares of our common stock, unless they specifically “opt out” of the dividend reinvestment plan so as to receive cash distributions.
Note 11. Financial Highlights
The following is a schedule of financial highlights for the years ended December 31, 2013 through December 31, 2017:
2017 | 2016 | 2015 | 2014 | 2013 | ||||||
Per share data: | ||||||||||
Net asset value at beginning of period | $13.86 | $14.26 | $14.60 | $14.45 | $16.89 | |||||
Net investment income, after taxes (1) | 1.28 | 1.60 | 1.54 | 1.34 | 1.32 | |||||
Realized (losses) gains on investments (1) | (1.26 | ) | (0.08 | ) | (0.17 | ) | 0.10 | — | ||
Net change in unrealized appreciation (depreciation) on investments | 0.23 | (0.56 | ) | (0.34 | ) | 0.06 | (0.39 | ) | ||
Net increase in net assets from operations | 0.25 | 0.96 | 1.03 | 1.50 | 0.93 | |||||
Distributions from net investment income | (1.45 | ) | (1.35 | ) | (1.29 | ) | (1.35 | ) | (2.48 | ) |
Distributions from capital gains | — | — | (0.06 | ) | — | (0.10 | ) | |||
Total Distributions | (1.45 | ) | (1.35 | ) | (1.35 | ) | (1.35 | ) | (2.58 | ) |
Effect of shares issued, net of offering expenses | — | (0.01 | ) | (0.02 | ) | — | (0.79 | ) | ||
Net asset value at end of period | $12.66 | $13.86 | $14.26 | $14.60 | $14.45 | |||||
Net assets at end of period | 81,781,429 | 87,122,296 | 89,414,256 | 90,872,315 | 88,854,486 | |||||
Shares outstanding at end of period | 6,457,588 | 6,287,496 | 6,269,669 | 6,222,673 | 6,148,227 | |||||
Weighted average shares outstanding (basic) (2) | 6,412,215 | 6,282,360 | 6,249,346 | 6,185,061 | 4,429,639 | |||||
Per share market value at end of period | $10.96 | $13.75 | $11.73 | $11.54 | $15.02 | |||||
Ratios and Supplemental data: | ||||||||||
Net Asset Value Total Return (3) | 2.62 | % | 9.17 | % | 9.20 | % | 11.85 | % | 1.18 | % |
Market Price Total Return (4) | (10.45 | )% | 31.66 | % | 13.64 | % | (14.95 | )% | 5.78 | % |
Average Net Assets | $85,071,701 | $87,281,555 | $89,888,327 | $89,846,742 | $64,066,052 | |||||
Ratio of expenses to average Net assets (5) | 12.30 | % | 12.42 | % | 11.88 | % | 7.13 | % | 4.57 | % |
Ratio of net investment income to average Net assets | 9.68 | % | 11.52 | % | 10.74 | % | 9.20 | % | 9.10 | % |
106
(1) | Based on weighted average number of common shares outstanding for the period. |
(2) | The shares outstanding and per share amounts for the periods prior to May 2013 have been adjusted for the conversion rate of 0.99 shares for each unit. See Note 1. |
(3) | This measure of total investment return measures the changes in net asset value over the period indicated, taking into account dividends as reinvested. The return is calculated by taking the difference between the net asset value per share at the end of the period (plus assumed reinvestment of dividends and distributions at prices obtained under the Company's dividend reinvestment plan) and the net asset value per share at the beginning of the period, and dividing that difference by the net asset value per share at the beginning of the period. This return primarily differs from the total investment return in that it does not take into account changes in the market price of the Company's stock. |
(4) | This measure of total investment return measures the changes in market value over the period indicated, taking into account dividends as reinvested. The return is calculated based on an assumed purchase of stock at the market price on the first day of the period (plus assumed reinvestment of dividends and distributions at prices obtained under the Company’s dividend reinvestment plan) and an assumed sale at the market price on the last day of the period. The difference between the sale and purchases is then divided by the purchase prices. The total investment return does not reflect any sales load that may be paid by investors. |
(5) | Had our investment adviser not agreed to waive its incentive fee for the period from our initial public offering through March 31, 2014 to the extent required to support a minimum dividend yield of 9%, our ratio of expenses to average net assets would have increased by 36 basis point in 2014. |
Note 12. Selected Quarterly Data (Unaudited)
The following table sets forth certain quarterly financial information for each of the last eight quarters prior to December 31, 2017. This information was derived from the Company’s unaudited financial statements. Results for any quarter are not necessarily indicative of results for the full year or for any future quarter.
Quarter Ended | ||||||||||||||
(in thousands, except per share data) | 3/31/2017 | 6/30/2017 | 9/30/2017 | 12/31/2017 | ||||||||||
Total investment income | 4,670 | 5,083 | $ | 4,815 | $ | 4,136 | ||||||||
Net investment income | 2,238 | 2,515 | 1,560 | 1,925 | ||||||||||
Net increase (decrease) in net assets resulting from operations | 2,334 | (1,860 | ) | (333 | ) | 1,492 | ||||||||
Net increase (decrease) in net assets resulting from operations per share (basic and diluted) | $0.37 | $(0.29) | $(0.05) | $0.23 | ||||||||||
Quarter Ended | ||||||||||||||
(in thousands, except per share data) | 3/31/2016 | 6/30/2016 | 9/30/2016 | 12/31/2016 | ||||||||||
Total investment income | 5,473 | 4,729 | $ | 5,494 | $ | 5,197 | ||||||||
Net investment income | 2,571 | 2,069 | 2,979 | 2,433 | ||||||||||
Net (decrease) increase in net assets resulting from operations | (133 | ) | 993 | 2,370 | 2,777 | |||||||||
Net (decrease) increase in net assets resulting from operations per share (basic and diluted) | $(0.02) | $0.16 | $0.38 | $0.44 | ||||||||||
Note 13. Subsequent Events
During the first quarter of 2018, the Company repurchased 64,897 shares of its common stock at an average price of $10.75 per share.
During the first quarter of 2018, the Company increased its debt investment in Infinite Care, LLC by $0.4 million through two over-advances on its revolver commitment. HCAP also took control of the borrower's equity after accelerating the debt and auctioning the borrower’s equity in a public sale. The Company bid a portion of its outstanding debt to gain control of the company. Upon completion of this process the Company converted $2.0 million of its debt investment in the borrower to preferred equity.
On January 24, 2018, the Company made a $7.0 million senior secured debt investment and a $0.2 million preferred equity investment in Coastal Screen and Rail, LLC. The debt investment consists of a $6.5 million term loan and a $0.5 million revolver. The term loan carries an interest rate of 10.50% cash plus 1.50% PIK. The revolver carries an interest rate of LIBOR + 8.00% on funded balances.
107
On February 8, 2018, the Company declared monthly distributions of $0.095 per share payable on each of February 28, 2018, March 27, 2018 and April 26, 2018.
On March 7, 2018, the Company received a full repayment at par plus a 2% prepayment fee on its $2.0 million junior secured debt investment in Turning Point Brands, Inc. The Company generated an internal rate of return ("IRR") of 15.0% on its investment. IRR is the rate of return that makes the net present value of all cash flows into or from the investment equal to zero, and is calculated based on the amount of each cash flow received or invested by the Company and the day it was invested or received.
On March 12, 2018, the Company received $3.9 million for its $4.6 million debt and $0.3 million equity investments in WorkWell, LLC. The Company also entered into a royalty agreement with the sponsor allowing it to recover up to another $0.1 million on its investment subject to certain future events. The Company generated a combined IRR of 5.2% on its debt and equity investments in WorkWell, LLC.
On March 28, 2018, our board of directors appointed Joseph A. Jolson (Chairman of our board of directors) as the Chief Executive Officer of the Company, effective as of such date. Mr. Jolson succeeds Richard P. Buckanavage, who stepped down from his positions as Chief Executive Officer and President on March 28, 2018, to assume the role of Managing Director - Head of Business Development, effective as of such date. In addition, Mr. Buckanavage continues to serve as a principal and member of the investment committee of our investment adviser, along with Mr. Jolson. On March 28, 2018, our board of directors also appointed James Fowler as the Chief Investment Officer of the Company. Mr. Fowler is also a member of the investment committee at our investment adviser. The addition of Mr. Fowler strengthens the investment team at our investment adviser following the resignation of Ryan T. Magee, a Vice President of the Company and a principal of our investment adviser, on March 8, 2018.
In addition, on March 28, 2018, as part of the previously announced process initiated by the Company to transition the provision of administrative services to the Company from JMP Credit Advisors to HCAP Advisors, our investment adviser, the board accepted the resignations of Craig R. Kitchin, the Company’s Chief Financial Officer and Secretary, and Renee Lefebvre, the Company’s Chief Compliance Officer, each effective as of April 2, 2018. Mr. Kitchin and Ms. Lefebvre are employed by JMP Credit Advisors. To succeed Mr. Kitchin and Ms. Lefebvre, our board of directors appointed William Alvarez as Chief Financial Officer, Chief Compliance Officer, and Secretary, effective as of April 2, 2018. The resignations of Mr. Kitchin and Ms. Lefebvre are not related to the events disclosed in the Company's Rule 12b-25 filing on March 15, 2018.
108
Item 9. | Changes in and Disagreements with Independent Registered Public Accounting Firm on Accounting and Financial Disclosure |
None.
Item 9A. Controls and Procedures.
(a) Evaluation of Disclosure Controls and Procedures
We have established disclosure controls and procedures to provide reasonable assurance that information is accumulated and communicated to our management, including our principal executive officer and principal financial officer, as appropriate to allow timely decisions regarding required disclosure, and ensure that information required to be disclosed in the reports we file or submit under the Securities Exchange Act of 1934, as amended (Exchange Act) is recorded, processed, summarized and reported, within the time periods specified in the SEC’s rules and forms.
Our management, with the participation of our Chief Executive Officer and Chief Financial Officer, evaluated the effectiveness of our disclosure controls and procedures (as defined in Rules 13a-15(e) under the Exchange Act, as of December 31, 2017. Based on this evaluation, our Chief Executive Officer and Chief Financial Officer concluded that our disclosure controls and procedures were not effective as of December 31, 2017, due to the material weakness in internal control over financial reporting.
(b) Management's Report on Internal Control Over Financial Reporting
Management of the Company is responsible for establishing and maintaining adequate internal control over financial reporting as defined in Rules 13a-15(f) under the Exchange Act. Our internal control over financial reporting is a process designed to provide reasonable assurance regarding the reliability of financial reporting and the preparation of financial statements for external purposes in accordance with generally accepted accounting principles. Because of its inherent limitations, internal control over financial reporting may not prevent or detect misstatements. Also, projections of any evaluation of effectiveness to future periods are subject to the risk that controls may become inadequate because of changes in conditions, or that the degree of compliance with the policies or procedures may deteriorate.
Management conducted an evaluation of the effectiveness of our internal control over financial reporting as of December 31, 2017 based on the framework in Internal Control-Integrated Framework (2013) issued by the Committee of Sponsoring Organizations of the Treadway Commission (COSO). A material weakness is a deficiency, or combination of deficiencies, in internal control over financial reporting, such that there is a reasonable possibility that a material misstatement of the Company’s annual or interim financial statements will not be prevented or detected on a timely basis.
We did not maintain an effective control environment as material financial information from one of our portfolio companies was not promptly supplied to our financial staff by certain senior investment professionals, including the Company’s then-Chief Executive Officer and a senior investment professional responsible for this portfolio company. Specifically, a senior investment professional misrepresented information necessary to support the portfolio company valuation, and the Company's then-CEO failed to reinforce the need for compliance with the Company’s valuation policies and procedures, which resulted in inappropriate business conduct.
This control deficiency did not result in a misstatement to the Company’s consolidated financial statements. However, this control deficiency could result in a misstatement to our annual or interim consolidated financial statements that would result in a material misstatement that would not be prevented or detected. Accordingly, our management has determined that this control deficiency constitutes a material weakness.
Remediation Plan and Activities
* The Company accepted the resignation of the senior investment professional directly responsible for the investment in which material information was not promptly communicated to the financial staff.
* Joseph Jolson, our Chairman of the Board, has assumed the additional role of Chief Executive Officer of the Company.
109
* Richard Buckanavage has stepped down from his role as President and CEO to the role of Managing Director - Head of Business Development, where his efforts will be focused on origination of new portfolio investment opportunities. He reports to Mr. Jolson and will not have a financial reporting role within the organization.
* The Company has hired James Fowler as its Chief Investment Officer who is responsible for the daily management of Company’s portfolio company investments after they are made, and will be specifically charged with ensuring that financial and related information from the portfolio companies is routed directly from the portfolio companies to the Company’s financial staff. He reports to Mr. Jolson.
* | Members of senior management, with the participation and input of the Audit Committee and the Board of Directors, have and will increase communication with, and training of employees regarding: |
▪ Our commitment to ethical standards and the integrity of our business practices;
▪ Requirements for compliance with applicable laws, our Code of Ethics and Business Conduct and other Company policies; and
▪ Availability of and processes for reporting suspected violations of law or our Code of Ethics and Business Conduct.
The Company is committed to maintaining a strong internal control environment. Management believes the foregoing efforts will effectively remediate the material weakness. We will provide further updates to the Company’s Board on an ongoing basis with measurable milestones and responsibilities regarding the progress of our remediation efforts.
(c) Report of the Independent Registered Public Accounting Firm
This annual report on Form 10-K does not include an attestation report of our independent registered public accounting firm regarding internal control over financial reporting. We were not required to have, nor have we, engaged our independent registered public accounting firm to perform an audit of internal control over financial reporting pursuant to the rules of the Securities and Exchange Commission that permit us to provide only management's report in this annual report on Form 10-K.
(d) Changes in Internal Control Over Financial Reporting
There were no changes in the Company’s internal control over financial reporting that occurred during the quarter ended December 31, 2017 that has materially affected, or is reasonably likely to materially affect, the Company’s internal control over financial reporting.
Item 9B. | Other Information. |
On March 28, 2018, our board of directors appointed Joseph A. Jolson (Chairman of our board of directors) as the Chief Executive Officer of the Company, effective as of such date. Mr. Jolson succeeds Richard P. Buckanavage, who stepped down from his positions as Chief Executive Officer and President on March 28, 2018, to assume the role of Managing Director - Head of Business Development, effective as of such date. In addition, Mr. Buckanavage continues to serve as a principal and member of the investment committee of our investment adviser, along with Mr. Jolson. On March 28, 2018, our board of directors also appointed James Fowler as the Chief Investment Officer of the Company. Mr. Fowler is also a member of the investment committee at our investment adviser. The addition of Mr. Fowler strengthens the investment team at our investment adviser following the resignation of Ryan T. Magee, a Vice President of the Company and a principal of our investment adviser, on March 8, 2018.
In addition, on March 28, 2018, as part of the previously announced process initiated by the Company to transition the provision of administrative services to the Company from JMP Credit Advisors to HCAP Advisors, our investment adviser, the board accepted the resignations of Craig R. Kitchin, the Company’s Chief Financial Officer and Secretary, and Renee Lefebvre, the Company’s Chief Compliance Officer, each effective as of the close of business on April 2, 2018. Mr. Kitchin and Ms. Lefebvre are employed by JMP Credit Advisors. To succeed Mr. Kitchin and Ms. Lefebvre, our board of directors appointed William Alvarez as Chief Financial Officer, Chief Compliance Officer, and Secretary, effective as of the
110
close of business on April 2, 2018. The resignations of Mr. Kitchin and Ms. Lefebvre are not related to the events disclosed in the Company's 12b-25 filing on March 15, 2018.
Mr. Fowler, age 56, also serves as and has been a Managing Director of JMP Group, a full-service investment banking and asset management firm, since February, 2001. Commencing April 2016 to present, he is serving as the Portfolio Manager of JMP Capital I LLC, which is a credit fund providing debt capital to lower middle market companies. Prior to this role, from 2010 to 2016, Mr. Fowler was a Co-Portfolio Manager of Harvest Opportunities Partners II, which was a market-neutral equity hedge fund dedicated to investing in small and mid-sized financial services companies. Mr. Fowler joined JMP’s asset management platform in February 2007, and from February 2008 until December 2012, he was the non-Executive Chairman of the Board of Directors of New York Mortgage Trust (NASD: NYMT), which is a New York-based mortgage real estate investment trust (REIT) that was recapitalized in February 2008 by entities owned by JMP Group. From February 2001 to February 2007, Mr. Fowler was a senior equity research analyst at JMP Group’s broker/dealer (JMP Securities) where he covered a wide range of mortgage and specialty finance companies. During this period, from 2005-2007, he also served as Co-Director of Equity research. Mr. Fowler holds a B.S. degree in Finance from Golden Gate University.
Mr. Alvarez, age 64, also serves as Managing Director of HCAP Advisors, which he joined in August 2017. Mr. Alvarez brings over 30 years of experience in finance, accounting and asset management to the Company. Mr. Alvarez, from December 2004 to December 2009, was Chief Financial Officer and Secretary of Patriot Capital Funding, Inc., a BDC that went public in 2005 and later merged with another business in December 2009. From Mid-2010 to November 2014, Mr. Alvarez served as a consultant and then Chief Financial Officer and later Interim Chief Executive Officer of NH Northeast, LLC, an international computer learning center that operated 17 locations in the Northeast. From November 2014 to May 2016, Mr. Alvarez served as the Chief Financial Officer of Natural Markets Food Group, an international organic retail food organization with operations in the US and Canada. From June 2016 until joining HCAP Advisors in August 2017, Mr. Alvarez provided outsourced accounting and consulting services through CFO Finance, LLC. Mr. Alvarez is a licensed Certified Public Accountant in the State of Connecticut.
111
PART III
We will file a definitive Proxy Statement for our 2018 Annual Meeting of Stockholders with the SEC, pursuant to Regulation 14A, not later than 120 days after the end of our fiscal year. Accordingly, certain information required by Part III has been omitted under General Instruction G(3) to the annual report on Form 10-K. Only those sections of our definitive Proxy Statement that specifically address the items set forth herein are incorporated by reference.
Item 10. | Directors, Executive Officers and Corporate Governance |
The information required by Item 10 is hereby incorporated by reference from the Company’s definitive Proxy Statement relating to the Company’s 2018 Annual Meeting of Stockholders, to be filed with the Securities and Exchange Commission within 120 days following the end of the Company’s fiscal year.
We have adopted a code of business conduct that applies to our directors, officers and employees, if any. This code of business conduct is published on our website at www.harvestcapitalcredit.com. We intend to disclose any future amendments to, or waivers from, this code of business conduct within four business days of the waiver or amendment through a current report on Form 8-K.
Item 11. | Executive Compensation |
The information required by Item 11 is hereby incorporated by reference from the Company’s definitive Proxy Statement relating to the Company’s 2018 Annual Meeting of Stockholders, to be filed with the Securities and Exchange Commission within 120 days following the end of the Company’s fiscal year.
Item 12. | Security Ownership of Certain Beneficial Owners and Management and Related Stockholder Matters |
The information required by Item 12 is hereby incorporated by reference from the Company’s definitive Proxy Statement relating to the Company’s 2018 Annual Meeting of Stockholders, to be filed with the Securities and Exchange Commission within 120 days following the end of the Company’s fiscal year.
Item 13. | Certain Relationships and Related Transactions, and Director Independence |
The information required by Item 13 is hereby incorporated by reference from the Company’s definitive Proxy Statement relating to the Company’s 2018 Annual Meeting of Stockholders, to be filed with the Securities and Exchange Commission within 120 days following the end of the Company’s fiscal year.
Item 14. | Principal Accountant Fees and Services |
The information required by Item 14 is hereby incorporated by reference from the Company’s definitive Proxy Statement relating to the Company’s 2018 Annual Meeting of Stockholders, to be filed with the Securities and Exchange Commission within 120 days following the end of the Company’s fiscal year.
112
PART IV
Item 15. | Exhibits, Financial Statement Schedules |
1. Financial Statements
The following financial statements of Harvest Capital Credit Corporation are filed herewith:
Page | |
2. The following financial statement schedule is filed herewith:
3. Exhibits required to be filed by Item 601 of Regulation S-K.
113
b. Exhibits
The following exhibits are filed as part of this report or hereby incorporated by reference to exhibits previously filed with the SEC: | |
3.1 | |
3.2 | |
4.1 | |
4.2 | |
4.3 | |
4.4 | |
4.5 | |
4.6 | |
10.1 | |
10.2 | |
10.3 | |
10.4 | |
10.5 | |
10.6 | |
10.7 | |
114
10.8 | |
10.9 | |
10.10 | |
10.11 | |
10.12 | |
10.13 | |
10.14 | |
10.15 | |
10.16 | |
10.17 | |
10.18 | |
11.1 | |
12.1 | |
21.1 | List of Subsidiaries: HCAP Equity Holdings, LLC, a Delaware limited liability company, and HCAP ICC, LLC, a Delaware limited liability company. |
31.1 | |
115
31.2 | |
32.1 | |
32.2 | |
* Filed herewith.
116
c. Schedule of Investments in and Advances to Affiliates
Harvest Capital Credit Corporation
Consolidated Schedule of Investments in and Advances to Affiliates
Year Ended December 31, 2017
Portfolio Company | Type of Investment (4) (5) (10) | Net Realized Loss | Net Change in Unrealized Appreciation (Depreciation) | Amount of Dividends or Interest Credited to Income (1) | December 31, 2016 Value | Gross Additions (2) | Gross Reductions (3) | December 31, 2017 Value | ||||||||||||||||
Non-Majority Owned Control Investments | ||||||||||||||||||||||||
Flight Engine Leasing III LLC | Senior Secured Term Loan, due 12/2018 (13.00%; the greater of 13.00% of LIBOR + 7.50% | $ | — | $ | — | $ | 119,821 | $ | 1,807,299 | $ | 17,701 | $ | (1,825,000 | ) | $ | — | ||||||||
Flight Lease XI, LLC | Common Equity Interest (400 Units) | (7) (11) | — | 127,421 | 149,154 | 200,000 | 127,421 | — | 327,421 | |||||||||||||||
Flight Lease VII, LLC | Common Equity Interest (1,800 Units) | (11 | ) | — | (15,393 | ) | 155,859 | 923,947 | — | (94,098 | ) | 829,849 | ||||||||||||
Infinite Care, LLC | Senior Secured Term Loan, due 2/2019 (13.38%; 1M LIBOR + 6.00% with a 0.42% LIBOR floor plus 6.00% PIK | (8) (13) | — | (2,366,893 | ) | 653,687 | 5,916,570 | 318,209 | (2,742,779 | ) | 3,492,000 | |||||||||||||
Revolving Line of Credit, due 2/2019 (13.38%; 1M LIBOR + 12.00% with a 0.42% LIBOR floor | — | — | 70,875 | 200,000 | 1,865,000 | — | 2,065,000 | |||||||||||||||||
Class A Common Equity Units (3,000,000 Units) | — | (1,266,500 | ) | — | 1,266,500 | — | (1,266,500 | ) | — | |||||||||||||||
Total Non-Majority Owned Control Investments | $ | — | $ | (3,521,365 | ) | $ | 1,149,396 | $ | 10,314,316 | $ | 2,328,331 | $ | (5,928,377 | ) | $ | 6,714,270 | ||||||||
Non-Control Affiliate Investments | ||||||||||||||||||||||||
Flight Lease XII, LLC | Common Equity Interest (1,000 Units) | (7) (11) | $ | — | $ | 116,502 | $ | — | $ | — | $ | 616,502 | $ | — | $ | 616,502 | ||||||||
24/7 Software, Inc.(formerly Instant Sales Solutions, Inc.) | Senior Secured Term Loan, due 7/2022 (13.25%) | (6) (14) | — | — | 198,005 | — | 2,971,772 | (112,500 | ) | 2,859,272 | ||||||||||||||
Revolving Line of Credit, due 07/2021 (10.5%; 3M LIBOR + 9.00% with a 1.00% LIBOR floor | — | — | — | — | — | — | — | |||||||||||||||||
Common Equity Interest (950 Units) | (7 | ) | — | 350,000 | — | — | 1,300,000 | — | 1,300,000 | |||||||||||||||
Northeast Metal Works LLC | Senior Secured Term Loan, due 12/2019 (16.50%; 10.50% Cash plus 6.00% PIK | (9) (15) | — | (237,269 | ) | 1,760,994 | 11,678,261 | 530,621 | (2,556,882 | ) | 9,652,000 | |||||||||||||
Revolving Line of Credit, due 12/2019 (13.50%) | — | (18,000 | ) | 215,961 | 1,189,239 | 1,295,751 | (1,002,990 | ) | 1,482,000 | |||||||||||||||
Preferred Equity Interest (2,500 Class A Units) | (7 | ) | — | (119,000 | ) | — | — | 1,600,000 | (119,000 | ) | 1,481,000 | |||||||||||||
Peekay Acquisition, LLC | Senior Secured Term Loan, due 2/2016 (17.00% PIK) | (1,995,421 | ) | 1,957,463 | — | 37,959 | 1,957,462 | (1,995,421 | ) | — | ||||||||||||||
Common Equity Interest (Peekay Boutiques, Inc.) (35,000 Units) | (105,000 | ) | 105,000 | — | — | 105,000 | (105,000 | ) | — | |||||||||||||||
V-Tek, Inc. | Senior Secured Term Loan, due 03/2022 (12.5%; 3M LIBOR + 11.00%) | (12 | ) | — | 93,526 | 343,208 | — | 3,500,000 | — | 3,500,000 | ||||||||||||||
117
Senior Secured Revolver, due 3/2021 (8.00%; 3M LIBOR + 6.50%) | (6 | ) | — | — | 54,543 | — | 1,036,097 | (150,000 | ) | 886,097 | ||||||||||||||
Common Equity Interest (90 Units) | (7 | ) | — | 201,000 | — | — | 351,000 | — | 351,000 | |||||||||||||||
WorkWell, LLC | Senior Secured Term Loan, due 10/2020 (13.00%; 3M LIBOR + 11.50% with 0.50% LIBOR floor) | (13 | ) | — | (677,146 | ) | 727,153 | 4,546,000 | 135,584 | (825,584 | ) | 3,856,000 | ||||||||||||
Preferred Equity Interest (250,000 Units) | — | (170,000 | ) | — | 170,000 | — | (170,000 | ) | — | |||||||||||||||
Common Equity Interest (250,000 Units) | — | (523 | ) | — | 523 | — | (523 | ) | — | |||||||||||||||
Subtotal: Non-Control Affiliate Investments | $ | (2,100,421 | ) | $ | 1,601,553 | $ | 3,299,864 | $ | 17,621,982 | $ | 15,399,789 | $ | (7,037,900 | ) | $ | 25,983,871 | ||||||||
(1) | Represents the total amount of interest and fees credited to income for the portion of the year an investment was included in Affiliate categories. |
(2) | Gross additions include increase in the cost basis of investments resulting from new portfolio investment and accrued PIK interest. |
(3) | Gross reductions include decreases in the total cost basis of investments resulting from principal or PIK repayments or sales. |
(4) | Debt investments and the CLO subordinated notes are income producing investments unless an investment is on non accrual. Common equity, residual values and warrants are non-income producing. |
(5) | For each loan, the Company has provided the interest rate in effect on the date presented, as well as the contractual components of that interest rate. In the case of the Company's variable or floating rate loans, the interest rate in effect takes into account the applicable LIBOR rate in effect on the date presented or, if higher, the applicable LIBOR floor. |
(6) | Credit facility has an unfunded commitment in addition to the amounts shown in the Consolidated Schedule of Investments. See Note 8 in the Notes to Consolidated Financial Statements for further discussion on portion of commitment unfunded at December 31, 2017. |
(7) | The investment is held by HCAP Equity Holdings, LLC, the Company's taxable blocker subsidiary. |
(8) | Infinite Care LLC ("ICC") is in default under the terms of its credit agreement. In October 2017, the Company exercised its rights under a stock pledge of the borrower. The Company formed a wholly owned subsidiary, HCAP ICC, LLC, to exercise its proxy right under the pledge agreement and take control of the board of ICC. The loan was placed on non-accrual status in Q4 2017. In January 2018, HCAP took control of the borrower's equity after accelerating the debt and auctioning the borrower’s equity in a public sale. The Company bid a portion of its outstanding debt to gain control of the company. Upon completion of this process the Company converted $2.0 million of its debt investment in the borrower to preferred equity. |
(9) | The interest rate on the revolver is 11% prior to following the interim advance term; 13.5% from the first amendment effective date to February 28, 2018; 14.25% from March 1, 2018 through May 31, 2018 and 15% from June 1, 2018 until expiration of the interim advance. The interest rate on the term loan is 11% prior to and following the interim advance term; 10.5% cash pay plus 6% PIK from the first amendment date trough February 28, 2018; 10.5% cash pay plus 6.25% PIK from March 1, 2018 to May 31, 2018; 10.5% cash play plus 6.5% PIK from 6/1/18 until expiration of the interim advance. |
(10) | The Company's non-qualifying assets, on a fair value basis, comprise approximately 2% of the Company's total assets. |
(11) | Industry: Aerospace & Defense |
(12) | Industry: Capital Equipment |
(13) | Industry: Healthcare & Pharmaceuticals |
(14) | Industry: High Tech Industries |
(15) | Industry: Metals & Mining |
118
As of December 31, 2017, affiliate investments consisted of the following:
Type | Amortized Cost | Fair Value | % of Fair Value | % of Net Assets | |||||||
Senior Secured Debt | 30,842,712 | 27,792,369 | 24.0 | % | 34.0 | % | |||||
Equity | 7,507,273 | 4,905,772 | 4.2 | % | 6.0 | % | |||||
Total | 38,349,985 | 32,698,141 | 28.2 | % | 40.0 | % | |||||
The rate type of affiliate debt investments at fair value as of December 31, 2017 was as follows:
Rate Type | Amortized Cost | Fair Value | % of Fair Value | % of Net Assets | |||||||
Fixed Rate | 14,111,800 | 13,993,272 | 12.1 | % | 17.1 | % | |||||
Floating rate | 16,730,912 | 13,799,097 | 11.9 | % | 16.9 | % | |||||
Total | 30,842,712 | 27,792,369 | 24.0 | % | 34.0 | % | |||||
The industry composition of affiliate investments at fair value as of December 31, 2017 was as follows:
Industry | Amortized Cost | Fair Value | % of Fair Value | % of Net Assets | |||||||
Aerospace & Defense | 1,557,273 | 1,773,772 | 1.5 | % | 2.2 | % | |||||
Capital Equipment | 4,442,571 | 4,737,097 | 4.1 | % | 5.8 | % | |||||
Healthcare & Pharmaceuticals | 15,688,341 | 9,413,000 | 8.1 | % | 11.5 | % | |||||
High Tech Industries | 3,809,272 | 4,159,272 | 3.6 | % | 5.1 | % | |||||
Metals & Mining | 12,852,528 | 12,615,000 | 10.9 | % | 15.4 | % | |||||
Total | 38,349,985 | 32,698,141 | 28.2 | % | 40.0 | % | |||||
119
Harvest Capital Credit Corporation
Consolidated Schedule of Investments in and Advances to Affiliates
Year Ended December 31, 2016
Portfolio Company | Investment | Amount of Interest and Fees Credited to Income (1) | December 31, 2015 Value | Gross Additions (2) | Gross Reductions (3) | December 31, 2016 Value | ||||||||||||||
Non-Majority Owned Control Investments | ||||||||||||||||||||
Flight Engine Leasing III, LLC | Senior Secured Term Loan, due 12/13/2018 | $ | 13,474 | — | $ | 1,832,999 | (25,000 | ) | $ | 1,807,999 | ||||||||||
(13.00%; the greater of 13.00% or LIBOR + 7.50%) | ||||||||||||||||||||
400 Common Equity Units | $ | — | $ | — | $ | 200,000 | $ | — | $ | 200,000 | ||||||||||
(33.33% of fully diluted common equity) | ||||||||||||||||||||
Flight Lease VII, LLC | 1,800 Common Equity Units | $ | 157,269 | $ | — | $ | 935,978 | $ | (12,031 | ) | $ | 923,947 | ||||||||
46.15% on a fully diluted basis | ||||||||||||||||||||
Total Non-Majority Owned Control Investments | $ | 170,743 | $ | — | $ | 2,968,977 | $ | (37,031 | ) | $ | 2,931,946 | |||||||||
Non-Control Affiliate Investments | ||||||||||||||||||||
Infinite Care, LLC | Senior Secured Term Loan, due 02/28/2019 | $ | 655,623 | $ | — | $ | 5,920,025 | $ | (3,455 | ) | $ | 5,916,570 | ||||||||
(12.62%; LIBOR+12.00% with 0.42% LIBOR floor) | ||||||||||||||||||||
Revolving Line of Credit, due 02/28/2019 | $ | 1,683 | $ | — | $ | 200,000 | $ | — | $ | 200,000 | ||||||||||
(12.62%; LIBOR+12.00% with 0.42% LIBOR floor) | ||||||||||||||||||||
3,000,000 Class A Common Equity Units | $ | — | $ | — | $ | 3,000,000 | $ | (1,733,500 | ) | $ | 1,266,500 | |||||||||
(27.00% on a fully diluted basis) | ||||||||||||||||||||
Peekay Acquisition, LLC | Senior Secured Term Loan (Last Out), due 2/15/16 | $ | (26,776 | ) | $ | 1,442,394 | $ | 12,224 | $ | (1,416,659 | ) | $ | 37,959 | |||||||
(17.00 PIK) | ||||||||||||||||||||
35,775 Shares of Common Equity Stock (Peekay Boutiques, Inc.) | $ | — | $ | — | $ | — | $ | — | $ | — | ||||||||||
(5.95% of fully diluted common shares) | ||||||||||||||||||||
WorkWell, LLC | Senior Secured Term Loan, due 10/21/2020 | $ | 598,565 | $ | 4,625,099 | $ | 39,651 | $ | (118,750 | ) | $ | 4,546,000 | ||||||||
(12.43%; LIBOR + 11.50% with a 0.50% LIBOR floor) | ||||||||||||||||||||
Revolving Line of Credit, due 10/21/2020 | $ | — | $ | — | $ | — | $ | — | $ | — | ||||||||||
(12.43%; LIBOR + 11.50% with a 0.50% LIBOR floor) | ||||||||||||||||||||
250,000 Preferred Equity Units | $ | — | $ | 250,000 | $ | — | $ | (80,000 | ) | $ | 170,000 | |||||||||
(6.16% of fully diluted common equity) | ||||||||||||||||||||
250,000 Common Equity Units | $ | — | $ | — | $ | 523 | $ | — | $ | 523 | ||||||||||
(0.12% of fully diluted common equity) | ||||||||||||||||||||
Total Affiliate Investments | $ | 1,229,095 | $ | 6,317,493 | $ | 9,172,423 | $ | (3,352,364 | ) | $ | 12,137,552 | |||||||||
(1) | Represents the total amount of interest and fees credited to income for the portion of the year an investment was included in Affiliate categories. |
120
(2) | Gross additions include increase in the cost basis of investments resulting from new portfolio investment and accrued PIK interest. Gross Additions also include net increases in unrealized appreciation or net decreases in unrealized depreciation. |
(3) | Gross reductions include decreases in the total cost basis of investments resulting from principal or PIK repayments or sales. Gross reductions also include net increases in unrealized depreciation or net decreases in unrealized appreciation. |
This schedule should be read in conjunction with Harvest Capital Credit Corporation’s Financial Statements, including the Schedule of Investments.
121
Item 16. Form 10-K Summary
Not applicable.
SIGNATURES
Pursuant to the requirements of Section 13 or 15(d) of the Securities Exchange Act of 1934, the registrant has duly caused this report to be signed on its behalf by the undersigned, thereunto duly authorized.
HARVEST CAPITAL CREDIT CORPORATION | |
Date: April 2, 2018 | /s/ Joseph A. Jolson |
Joseph A. Jolson Chief Executive Officer | |
Pursuant to the requirements of the Securities Exchange Act of 1934, this report has been signed below by the following persons on behalf of the registrant and in the capacity and on the dates indicated.
Date: April 2, 2018 | /s/ Joseph A. Jolson |
Joseph A. Jolson Chief Executive Officer and Director (Principal Executive Officer) | |
Date: April 2, 2018 | /s/ Craig R. Kitchin |
Craig R. Kitchin Chief Financial Officer and Secretary (Principal Financial and Accounting Officer) | |
Date: April 2, 2018 | /s/ Richard P. Buckanavage |
Richard P. Buckanavage Director | |
Date: April 2, 2018 | /s/ Dorian B. Klein |
Dorian B. Klein Director | |
Date: April 2, 2018 | /s/ Jack G. Levin |
Jack G. Levin Director | |
Date: April 2, 2018 | /s/ Richard A. Sebastiao |
Richard A. Sebastiao Director | |
122