Attached files
| file | filename |
|---|---|
| EX-32.2 - EXHIBIT 32.2 - Forbes Energy Services Ltd. | fes-ex322k2017.htm |
| EX-32.1 - EXHIBIT 32.1 - Forbes Energy Services Ltd. | fes-ex321k2017.htm |
| EX-31.2 - EXHIBIT 31.2 - Forbes Energy Services Ltd. | fes-ex312k2017.htm |
| EX-31.1 - EXHIBIT 31.1 - Forbes Energy Services Ltd. | fes-ex311k2017.htm |
| EX-23.1 - EXHIBIT 23.1 - Forbes Energy Services Ltd. | fes-ex2312017.htm |
| EX-21.1 - EXHIBIT 21.1 - Forbes Energy Services Ltd. | fes-ex2112017.htm |
UNITED STATES
SECURITIES AND EXCHANGE COMMISSION
WASHINGTON, D.C. 20549
____________________________________________________________
Form 10-K
____________________________________________________________
(Mark One)
ý | ANNUAL REPORT PURSUANT TO SECTION 13 OR 15(d) OF THE SECURITIES EXCHANGE ACT OF 1934 |
For the fiscal year ended December 31, 2017
OR
¨ | TRANSITION REPORT PURSUANT TO SECTION 13 OR 15(d) OF THE SECURITIES EXCHANGE ACT OF 1934 |
Commission file number 001-35281
____________________________________________________________
Forbes Energy Services Ltd.
(Exact name of registrant as specified in its charter)
____________________________________________________________
Texas | 98-0581100 | |
(State or other jurisdiction of incorporation or organization) | (I.R.S. Employer Identification No.) | |
3000 South Business Highway 281 Alice, Texas | 78332 | |
(Address of principal executive offices) | (Zip Code) | |
Registrant’s telephone number, including area code: (361) 664-0549
Securities registered pursuant to Section 12(b) of the Act:
Title of Each Class | Name of Each Exchange on Which Registered | |
Common Stock, $0.01 par value | OTCQX Best Market | |
Securities registered pursuant to Section 12(g) of the Act:
Title of Each Class
None
____________________________________________________________
Indicate by check mark if the registrant is a well-known seasoned issuer, as defined in Rule 405 of the Securities Act. ¨ Yes ý No
Indicate by check mark if the registrant is not required to file reports pursuant to Section 13 or Section 15(d) of the Act. ¨ Yes ý No
Indicate by check mark whether the registrant (1) has filed all reports required to be filed by Section 13 or 15(d) of the Securities Exchange Act of 1934 during the preceding 12 months (or for such shorter period that the registrant was required to file such reports), and (2) has been subject to such filing requirements for the past 90 days. ý Yes ¨ No
Indicate by check mark whether the registrant has submitted electronically and posted on its corporate website, if any, every Interactive Data File required to be submitted and posted pursuant to Rule 405 of Regulation S-T during the preceding 12 months (or for such shorter period that the registrant was required to submit and post such files). ý Yes ¨ No
Indicate by check mark if disclosure of delinquent filers pursuant to Item 405 of Regulation S-K is not contained herein and will not be contained, to the best of the registrant’s knowledge, in definitive proxy or information statements incorporated by reference in Part III of this Form 10-K or any amendment to this Form 10-K. ý
Indicate by check mark whether the registrant is a large accelerated filer, an accelerated filer, a non-accelerated filer or a smaller reporting company. See the definitions of “large accelerated filer,” “accelerated filer” and “smaller reporting company” in Rule 12b-2 of the Exchange Act.
Large Accelerated Filer | ¨ | Accelerated Filer | ¨ |
Non-Accelerated Filer | ¨ | Smaller Reporting Company | ý |
Emerging Growth Company | ¨ | ||
Indicate by check mark whether the registrant is a shell company (as defined in Exchange Act Rule 12b-2). ¨ Yes ý No
The aggregate market value of the stock held by non-affiliates of the registrant as of June 30, 2017, the last business day of the most recently completed second fiscal quarter, was $36,246,635 (based on a closing price of $17.00 per share and 2,132,155 shares held by non-affiliates).
As of March 26, 2018, there were 5,336,397 common shares outstanding.
FORBES ENERGY SERVICES LTD. AND SUBSIDIARIES
TABLE OF CONTENTS
Page | ||
Item 1. | ||
Item 1A. | ||
Item 1B. | ||
Item 2. | ||
Item 3. | ||
Item 4. | ||
Item 5. | ||
Item 6. | ||
Item 7. | ||
Item 7A. | ||
Item 8. | ||
Item 9. | ||
Item 9A. | ||
Item 9B. | ||
Item 10. | ||
Item 11. | ||
Item 12. | ||
Item 13. | ||
Item 14. | ||
Item 15. | ||
Item 16. | ||
i
FORWARD-LOOKING STATEMENTS
This Annual Report on Form 10-K and any oral statements made in connection with it include certain forward-looking statements within the meaning of the federal securities laws. You can generally identify forward-looking statements by the appearance in such a statement of words like “anticipate,” “believe,” “continue,” “could,” “estimate,” “expect,” “intend,” “may,” “plan,” “potential,” “predict,” “project” or “should” or other comparable words or the negative of these words. When you consider our forward-looking statements, you should keep in mind the risk factors we describe and other cautionary statements we make in this Annual Report on Form 10-K. Our forward-looking statements are only predictions based on expectations that we believe are reasonable. Our actual results could differ materially from those anticipated in, or implied by, these forward-looking statements as a result of known risks and uncertainties set forth below and elsewhere in this Annual Report on Form 10-K. These factors include or relate to the following:
• | the effect of the industry-wide downturn in energy exploration and development activities; |
• | continuing incurrence of operating losses due to such downturn; |
• | oil and natural gas commodity prices; |
• | market response to global demands to curtail use of oil and natural gas; |
• | capital budgets and spending by the oil and natural gas industry; |
• | the ability or willingness of the Organization of Petroleum Exporting Countries, or OPEC, to set and maintain production levels for oil; |
• | oil and natural gas production levels by non-OPEC countries; |
• | supply and demand for oilfield services and industry activity levels; |
• | our ability to maintain stable pricing; |
• | possible impairment of our long-lived assets; |
• | potential for excess capacity; |
• | competition; |
• | substantial capital requirements; |
• | significant operating and financial restrictions under our loan and security agreement which provides for a term loan of $50.0 million, or the New Loan Agreement; |
• | technological obsolescence of operating equipment; |
• | dependence on certain key employees; |
• | concentration of customers; |
• | substantial costs of compliance with reporting obligations, the Sarbanes-Oxley Act and New Loan Agreement covenants; |
• | seasonality of oilfield services activity; |
• | collection of accounts receivable; |
• | environmental and other governmental regulation; |
• | the potential disruption of business activities caused by the physical effects, if any, of climate change; |
• | risks inherent in our operations; |
• | ability to fully integrate future acquisitions; |
• | variation from projected operating and financial data; |
• | variation from budgeted and projected capital expenditures; |
• | volatility of global financial markets; and |
• | the other factors discussed under “Risk Factors” beginning on page 10 of this Annual Report on Form 10-K. |
We undertake no obligation to update or revise any forward-looking statements, whether as a result of new information, future events or otherwise. To the extent these risks, uncertainties and assumptions give rise to events that vary from our expectations, the forward-looking events discussed in this Annual Report on Form 10-K may not occur. All forward-looking statements attributable to us are qualified in their entirety by this cautionary statement.
ii
PART I
Item 1.Business
Overview
Forbes Energy Services Ltd., or FES Ltd., is an independent oilfield services contractor that provides a wide range of well site services to oil and natural gas drilling and producing companies to help develop and enhance the production of oil and natural gas. These services include fluid hauling, fluid disposal, well maintenance, completion services, workovers and re-completions and plugging and abandonment. Our operations are concentrated in the major onshore oil and natural gas producing regions of Texas, plus one location in Pennsylvania. We believe that our broad range of services, which extends from initial drilling, through production, to eventual abandonment, is fundamental to establishing and maintaining the flow of oil and natural gas throughout the life cycle of our customers’ wells. Our headquarters and executive offices are located at 3000 South Business Highway 281, Alice, Texas 78332. We can be reached by phone at (361) 664-0549.
As used in this Annual Report on Form 10-K, the “Company,” “we,” and “our” mean FES Ltd. and its subsidiaries, except as otherwise indicated.
On January 22, 2017, FES Ltd. and its domestic subsidiaries, or collectively, the Debtors, filed voluntary petitions, or the Bankruptcy Petitions, for reorganization under chapter 11 of the United States Bankruptcy Code in the United States Bankruptcy Court for the Southern District of Texas-Corpus Christi Division, or the Bankruptcy Court, pursuant to the terms of a restructuring support agreement that contemplated the reorganization of the Debtors pursuant to a prepackaged plan of reorganization, as amended and supplemented, the Plan. On March 29, 2017, the Bankruptcy Court entered an order confirming the Plan. On April 13, 2017, or the Effective Date, the Plan became effective pursuant to its terms and the Debtors emerged from their chapter 11 cases.
As discussed in Note 2 to the Consolidated Financial Statements, we applied fresh start accounting upon emergence from bankruptcy on the Effective Date which resulted in the Company becoming a new entity for financial reporting purposes. The effects of the Plan and the application of fresh start accounting are reflected in our Consolidated Financial Statements from and after April 13, 2017 (Successor) and the adjustments related thereto were recorded as reorganization items in our Consolidated Statements of Operations for the period January 1, 2017 to April 12, 2017 (Predecessor). References to "Successor" pertain to the Company from and after the Effective Date. References to "Predecessor" pertain to the Company prior to the Effective Date.
We provide a wide range of services to a diverse group of companies. For the period April 13 through December 31, 2017 (Successor) and period January 1 through April 12, 2017 (Predecessor), we provided services to 462 and 303 companies, respectively. John E. Crisp, Steve Macek and our senior management team have cultivated deep and ongoing relationships with these customers during their combined experience of over 40 years in the oilfield services industry.
We conduct our operations through the following two business segments:
• | Well Servicing. Our well servicing segment comprised 66.2% and 63.6% of our consolidated revenues for the period April 13 through December 31, 2017 (Successor) and period January 1 through April 12, 2017 (Predecessor), respectively. Our well servicing segment utilizes our fleet of well servicing rigs, which at December 31, 2017 was comprised of 154 workover rigs and 14 swabbing rigs, six coiled tubing spreads, and related assets to provide (i) well maintenance, including remedial repairs and removal and replacement of downhole production equipment, (ii) well workovers, including significant downhole repairs, re-completions and re-perforations, (iii) completion and swabbing activities, (iv) plugging and abandonment services, and (v) pressure testing of oil and natural gas production tubing and scanning tubing for pitting and wall thickness. |
• | Fluid Logistics. Our fluid logistics segment comprised 33.8% and 36.4% of our consolidated revenues for the period April 13 through December 31, 2017 (Successor) and period January 1 through April 12, 2017 (Predecessor), respectively. Our fluid logistics segment utilizes our fleet of owned or leased fluid transport trucks and related assets, including specialized vacuum, high pressure pump and tank trucks, frac tanks, water wells, salt water disposal wells and facilities, and related equipment. These assets are used to provide, transport, store, and dispose of a variety of drilling and produced fluids used in, and generated by, oil and natural gas production. These services are required in most workover and completion projects and are routinely used in daily operation of producing wells. |
We believe that our two business segments are complementary and create synergies in terms of selling opportunities. Our multiple lines of service are designed to capitalize on our existing customer base to grow within existing markets, generate more business from existing customers, and increase our operating performance. By offering our customers the ability to reduce the number of vendors they use, we believe that we help improve our customers’ efficiency. This is demonstrated by the fact that 72.7% and 68.1% of our revenues for the period April 13 through December 31, 2017 (Successor) and period January 1 through April 12, 2017 (Predecessor), respectively, were from customers that utilized services of both of our business segments. Further,
1
by having multiple service offerings that span the life cycle of the well, we believe that we have a competitive advantage over smaller competitors offering more limited services.
The following table summarizes the number of locations and major components of our equipment fleet at December 31, 2017:
December 31, 2017 | ||
Locations | 22 | |
Well Servicing Segment: | ||
Workover rigs | 154 | |
Swabbing rigs | 14 | |
Other heavy trucks | 29 | |
Tubing testing units | 9 | |
Coiled tubing spreads | 6 | |
Fluid logistics segment: | ||
Vacuum trucks | 266 | |
Other heavy trucks | 110 | |
Frac and fluid mixing tanks | 2,867 | |
Salt water disposal wells (1) | 16 | |
(1) | At December 31, 2017, 14 salt water disposal wells, included in the above well count, were subject to verbal or written ground leases or other operating arrangements with third parties. The above well count does not include one well that has been permitted and drilled but has not been completed. |
Corporate Structure
FES Ltd. was initially organized as a Bermuda exempt company on April 9, 2008. On August 12, 2011, FES Ltd. discontinued its existence as a Bermuda entity and converted into a Texas corporation, or the Texas Conversion. FES Ltd. has been and is the holding company for all of our operations. Forbes Energy Services LLC, or FES LLC, a Delaware limited liability company, is a wholly-owned subsidiary of FES Ltd. that acts as an intermediate holding company for our direct and indirect wholly-owned operating companies that have conducted our business historically: C.C. Forbes, LLC, or CCF, TX Energy Services, LLC, or TES, and Forbes Energy International, LLC, or FEI. Effective July 1, 2015, we completed an internal corporate reorganization, which simplified our corporate structure. Our former subsidiary, Superior Tubing Testers, LLC, merged with and into CCF.
Under the Plan, all of FES Ltd.’s previously outstanding equity interests, which included FES Ltd.’s prior common stock, par value $0.04 per share, or the Old Common Stock, FES Ltd.’s prior preferred stock, awards under FES Ltd.’s prior incentive compensation plans, and the preferred stock purchase rights under the rights agreement dated as of May 19, 2008, as subsequently amended on July 8, 2013, between FES Ltd. and CIBC Mellon Trust Company, as rights agent, in FES Ltd. were extinguished without recovery, and FES Ltd. created a new class of common stock, par value $0.01 per share, or the New Common Stock.
On May 18, 2017, shares of the New Common Stock were authorized for trading on the Over-The-Counter Pink Market. On May 19, 2017, OTC Markets Group Inc. announced that the New Common Stock was qualified to trade on the OTCQX Best Market. On May 19, 2017, the New Common Stock began trading on the OTCQX Best Market under the symbol “FLSS.”
Our Competitive Position
We believe that the following competitive strengths position us well within the oilfield services industry:
• | Exposure to Revenue Streams Throughout the Life Cycle of the Well. Our maintenance and workover services give us exposure to demand from our customers throughout the life cycle of a well, from drilling through production and eventual abandonment. Each new well that is drilled provides us a potential multi-year stream of well servicing revenue, as our customers attempt to maximize and maintain a well’s productivity. Accordingly, demand for our production services is generally driven by the total number of producing wells in a region and is generally less volatile than demand for new well drilling services. |
• | High Level of Customer Retention. Our top customers include many of the largest integrated and independent oil and natural gas companies operating onshore in the United States. We believe that our success comes from growing in our existing markets with existing customers due to the quality of our well servicing rigs, our personnel, and our safety record. We believe members of our senior management team have maintained excellent working relationships with our top customers in the United States during their combined experience of over 40 years in the oilfield services industry. We believe the complementary nature of our two business segments also helps us to retain customers because of the |
2
efficiency we offer a customer with multiple needs at the wellsite. Notably, 72.7% and 68.1% of our total revenues for the period April 13 through December 31, 2017 (Successor) and period January 1 through April 12, 2017 (Predecessor), respectively, were from customers that utilize services in both of our business segments. Further, by having multiple service offerings that span the life cycle of the well, we believe that we have a competitive advantage over smaller competitors offering more limited services.
• | Industry-Leading Safety Record. During the twelve months ended December 31, 2017, we had approximately 36.3% fewer reported incidents than the industry average as published by the Bureau of Labor Statistics. We believe that our safety record and reputation are critical factors to purchasing and operations managers in their decision-making process. We have a strong safety culture based on our training programs and safety seminars for our employees and customers. For example, for several years, members of our senior management have played an integral part in joint safety training meetings with customer personnel. In addition, our deployment of new well servicing rigs with enhanced safety features has contributed to our strong safety record and reputation. |
• | Experienced Senior Management Team and Operations Staff. Our executive operations management team of John E. Crisp and Steve Macek have over 40 years of combined experience within the oilfield services industry. In addition, our next level of management, which includes our division, regional and location managers, has an average of over 38 years of experience in the industry. |
Our Business Strategy
Our strategy in this rapidly changing market:
• | Maintain Maximum Asset Utilization. We constantly monitor asset usage and industry trends as we strive to maximize utilization. We accomplish this through moving assets from regions with less activity to those with more activity or that are increasing in activity. We are focusing on basins that are either predominantly oil or contain natural gas with high liquids content, such as the Permian Basin in West Texas and the Eagle Ford Basin in South Texas. Although industry activity has stabilized, and is on an upward trajectory in most basins, drilling techniques have resulted in the need for less equipment for well completions or fewer hours for the equipment being used. This has directly impacted our utilization. In response, we continue to minimize costs by concentrating utilization in as few active assets as possible while eliminating or substantially reducing our operating expenses on the inactive assets. |
• | Maintain a Presence in Proven and Established Oil and Liquids Rich Basins. We focus our operations on customers that operate in well-established basins which have proven production histories and that have maintained a high level of activity throughout various oil and natural gas pricing environments. While a substantial amount of our business is in the completion area, the majority of our business is production-related. We believe production-related services help create a more stable revenue stream, as these services are tied more to producing wells and less to drilling activity. Our experience shows that historically, production-related services tend to withstand depressed economic or industry conditions better than completion services. |
• | Establish and Maintain Leadership Position in Core Operating Areas. Based on our estimates, we believe that we have a significant market share in well servicing and fluid logistics in South Texas. We strive to establish and maintain significant positions within each of our core operating areas. To achieve this goal, we maintain close customer relationships and offer high-quality services to our customers. In addition, our significant presence in our core operating areas facilitates employee retention, hiring and brand recognition. |
• | Maintain a Disciplined Growth Strategy. We strategically evaluate opportunities for growth and expansion when customer demand dictates and dedicate the capital and staffing to respond. Conversely, we continually evaluate the viability and economics of our existing locations to ensure an efficient use of our management time and working capital. In some cases, this may result in closing a location or locations, reducing middle management, and reducing headcount. We believe both of these initiatives are necessary in order for the Company to be competitive in the current market environment. |
Description of Business Segments
Well Servicing Segment
Through our fleet of 168 well servicing rigs, which was comprised of 154 workover rigs and 14 swabbing rigs, as of December 31, 2017, located in 11 operational areas across Texas and one in Pennsylvania, we provide a comprehensive offering of well services to oil and natural gas companies, including completions of newly drilled oil and natural gas wells, wellbore maintenance, workovers and recompletions, tubing testing, and plugging and abandonment services. As a result of the downturn, 91 rigs were stacked at December 31, 2017. We currently operate six coiled tubing spreads that are used to mill, log, perforate, clean out, drill plugs, cement, acidize, and fish/retrieve tools/pipe in producing oil and gas wells. The services offered are customized to the
3
customer's job specific requirements. Our well servicing rig fleet has an average age of less than ten years. As part of our operational strategy, we enhanced our design specifications to improve the operational and safety characteristics of our well servicing rigs compared with some of the older well servicing rigs operated by others in the industry. These include increased derrick height and weight ratings and increased mud pump horsepower. We believe these enhanced features translate into increased demand for our equipment and services along with better pricing for our equipment and personnel. In addition, we augment our well servicing rig fleet with auxiliary equipment, such as mud pumps, power swivels, mud plants, mud tanks, blow-out preventers, lighting plants, generators, pipe racks, and tongs, which results in incremental rental revenue and increases financial performance of a typical well servicing job.
We provide the following services in our well servicing segment:
• | Completions. Utilizing our well servicing rig fleet and coiled tubing equipment, we perform completion services, which involve wellbore cleanout, well prepping for fracturing, drilling, setting and retrieving plugs, fishing operations, tool conveyance and logging, cementing, well unloading, casing and packer testing, pump-down plug, velocity strings, perforating, acidizing and/or stimulating a wellbore, along with swabbing operations that are utilized to clean a wellbore prior to production. Completion services are generally shorter term in nature and involve our equipment operating on a site for a period of two to three days, although some fishing jobs, which involve the recovery of equipment lost or stuck in the wellbore, can take longer. |
• | Maintenance. Through our fleet of well servicing rigs and coiled tubing units, we provide for the removal and repair of sucker rods, downhole pumps, and other production equipment, repair of failed production tubing, and removal of sand, paraffin, and other downhole production-related byproducts that impair well performance. These operations typically involve our well servicing rigs or coil tubing equipment operating on a wellsite for five to seven days. |
• | Workovers and Recompletions. We provide workover and re-completion services for existing wellbores. These services are designed to significantly enhance production by re-perforating to initiate or re-establish productivity from an oil or natural gas wellbore. In addition, we provide major downhole repairs such as casing repair, production tubing replacement, and deepening and sidetracking operations used to extend a wellbore laterally or vertically. These operations are typically longer term in nature and involve our well servicing rigs operating on a wellsite for one to two weeks at a time. |
• | Tubing Testing. Our downhole tubing testing services allow operators to verify tubing integrity. Tubing testing services are performed as production tubing is run into a new wellbore or on older wellbores as production tubing is replaced during a workover operation. In addition to our downhole testing units, our electromagnetic scan trucks scan tubing while out of the wellbore. This scanning function provides key operational information related to corrosion pitting, holes and splits, and wall loss on tubing. Tubing testing services complement our other service offerings and provide a significant opportunity for cross-selling. |
• | Plugging and Abandonment. Our well servicing rigs are also used in the process of permanently closing oil and natural gas wells that are no longer capable of producing in economic quantities, become mechanically impaired or are dry holes. Plugging and abandonment work can be performed with a well servicing rig along with wireline and cementing equipment; however, this service is typically provided by companies that specialize in plugging and abandonment work. Many well operators bid this work on a “lump sum” basis to include the sale or disposal of equipment salvaged from the well as part of the compensation received. |
Fluid Logistics Segment
Our fluid logistics segment provides an integrated array of oilfield fluid sales, transportation, storage, and disposal services that are required on most workover, drilling, and completion projects and are routinely used in daily operation of producing wells by oil and natural gas producers. We have a substantial operational footprint with 12 fluid logistics locations across Texas as of December 31, 2017, and an extensive fleet of transportation trucks, high-pressure pump trucks, hot oil trucks, frac tanks, fluid mixing tanks and salt water disposal wells. This combination of services enables us to provide a one-stop source for oil and natural gas companies. Although there are large operators in our areas, we believe that the vast majority of our smaller competitors in this segment can provide some, but not all, of the equipment and services required by customers, thereby requiring our customers to use several companies to meet their requirements and increasing their administrative burden. In addition, by pursuing an integrated approach to service, we experience increased asset utilization rates, as multiple assets are usually required to service a customer.
We provide the following services in our fluid logistics segment:
• | Fluid Hauling. As of December 31, 2017, we owned 266 fluid service vacuum trucks, trailers, and other hauling trucks equipped with a fluid hauling capacity of up to 150 barrels per unit, with most of the units having a capacity of 130 barrels. As a result of the downturn, 22 trucks and trailers were stacked at December 31, 2017. Each fluid service truck unit is equipped to pump fluids from or into wells, pits, tanks, and other on-site storage facilities. The majority of our fluid service truck units are also used to transport water to fill frac tanks on well locations, including frac tanks provided |
4
by us and others, to transport produced salt water to disposal wells, including injection wells owned and/or operated by us, and to transport drilling and completion fluids to and from well locations. In conjunction with frac tank rentals, we use fluid service trucks to transport water for use by our customers in fracturing operations. Following completion of fracturing operations by our customers, our fluid service trucks are used to transport the flowback produced as a result of the fracturing operations from the wellsite to disposal wells. We also operate several hot oil trucks which are capable of providing heated water and oil for use in well and pipe maintenance.
• | Disposal Services. Most oil and natural gas wells produce varying amounts of salt water throughout their productive lives. Under Texas law, oil and natural gas waste and salt water produced from oil and natural gas wells are required to be disposed of in authorized facilities, including permitted salt water disposal wells. Disposal, or injection, wells are licensed by state authorities and are completed in permeable formations below the fresh water table. As of December 31, 2017, we operated 16 disposal wells in 14 locations across Texas, with an aggregate injection capacity of approximately 196,000 barrels per day. The wells are permitted to dispose of salt water and incidental non-hazardous oil and natural gas wastes throughout our operational bases in Texas. It is our intent to locate the salt water disposal wells in close proximity to the producing wells of our customers. Although, in the normal course of production development, it is not uncommon for drilling and production activity to migrate closer to or farther away from our disposal wells. We maintain separators at all of our disposal wells that permit us to reclaim residual crude oil that we sell. |
• | Equipment Rental. As of December 31, 2017, we owned a fleet of 2,867 fluid storage tanks that can store up to 500 barrels of fluid each. This equipment is used by oilfield operators to store various fluids at the wellsite, including fresh water, brine and acid for frac jobs, flowback, temporary production, and drilling fluids. We transport the tanks with our trucks to well locations that are usually within a 75-mile radius of our nearest location. Frac tanks are used during all phases of the life of a producing well. A typical fracturing operation conducted by a customer can be completed within four days using five to 40 or more frac tanks. We believe we maintain one of the youngest frac tank fleets in the industry with an average equipment age of approximately seven years. |
• | Fluid Sales. We sell and transport a variety of chemicals and fluids used in drilling, completion, and workover operations for oil and natural gas wells. Although this is a relatively small percentage of our overall business, the provision of these chemicals and fluids increases utilization of and enhances revenues from the associated equipment. Through these services, we provide fresh water used in fracturing fluid, completion fluids, cement, and drilling mud. In addition, we provide potassium chloride for completion fluids, brine water, and water-based drilling mud. |
Financial Information about Segments and Geographic Areas
See Item 7. “Management’s Discussion and Analysis of Financial Condition and Results of Operations” and Note 15 to our Consolidated Financial Statements included in this Annual Report on Form 10-K for further discussion regarding financial information by segment and geographic location.
Seasonality and Cyclical Trends
Our operations are impacted by seasonal factors. Historically, our business has been negatively impacted during the winter months due to inclement weather, fewer daylight hours, and holidays. We also typically experience a significant slowdown during the Thanksgiving and Christmas holiday seasons. Our well servicing rigs are mobile and we operate a significant number of oilfield vehicles. During periods of heavy snow, ice or rain, we may not be able to move our equipment between locations, thereby reducing our ability to generate rig or truck hours. In addition, the majority of our well servicing rigs work only during daylight hours. In the winter months, as daylight time becomes shorter, the amount of time that the well servicing rigs work is shortened, which has a negative impact on total hours worked.
In addition, the oil and natural gas industry has traditionally been volatile and is influenced by a combination of long-term, short-term and cyclical trends, including the domestic and international supply and demand for oil and natural gas, current and expected future prices for oil and natural gas and the perceived stability and sustainability of those prices. Such cyclical trends also include the resultant levels of cash flows generated and allocated by exploration and production companies to their drilling, completion and workover budget. The volatility of the oil and natural gas industry along with declines in oil and natural gas prices have negatively impacted the level of exploration and production activity and capital expenditures by our customers through 2016. Activity began increasing in 2017 and stabilized during the second half of 2017, albeit at lower utilization levels than in prior years.
5
Sales Organization
Our sales structure is primarily decentralized where each of our business regions cultivates and maintains relationships with customer representatives who manage operations in their respective regions. At the regional level, management maintains relationships with key personnel in the operators' branch or division offices and in each business unit function. In the field, regional managers, yard managers and supervisors are the primary point of contact for sales to operator field representatives. At the corporate level, our Chief Executive Officer and Director of Business Development work with account managers who are assigned to our larger customers, act as liaison between customer contacts, including purchasing managers and the appropriate contacts within each function of the Forbes organization. Sales representatives typically serve multiple roles and in that way are involved in most aspects of the sales cycle, from order fulfillment to billing. Our customers represent both large and small independent oil and natural gas companies that are largely managed at the field level, and depending on the structure, have corporate procurement groups also coordinating supply chain decisions. These corporate procurement groups are the primary focus of our designated sales personnel. We cross-market our well servicing rigs along with our fluid logistics services, thereby offering our customers the ability to minimize vendors, which we believe improves the efficiency of our customers. This is demonstrated by the fact that 72.7% and 68.1% of our revenues for the period April 13 through December 31, 2017 (Successor) and period January 1 through April 12, 2017 (Predecessor), respectively, were from customers that utilized services of both of our business segments.
Employees
As of December 31, 2017, we had 843 employees.
We provide comprehensive employee training and implement recognized standards for health and safety. None of our employees are represented by a union or employed pursuant to a collective bargaining agreement or similar arrangement. We have not experienced any strikes or work stoppages, and we believe we have good relations with our employees.
Continued retention of existing qualified management and field employees and availability of additional qualified management and field employees will be a critical factor in our continued success as we work to ensure that we have adequate levels of experienced personnel to service our customers.
Competition
Our competition includes small regional service providers as well as larger companies with operations throughout the continental United States and internationally. Our larger competitors are Basic Energy Services, Inc., Superior Energy Services, Inc., Nuverra Environmental Solutions, Key Energy Services, Inc., C&J Energy Services, Inc., and Stallion Oilfield Services, Ltd. Because of their size, we believe these companies market a large portion of their work to the major oil and natural gas companies. We compete primarily on the basis of the age and quality of our equipment, our safety record, the quality and expertise of our employees, and our responsiveness to customer needs.
Customers
We served 462 customers for the period April 13 through December 31, 2017 (Successor) and 303 customers for the period January 1 through April 12, 2017 (Predecessor). For the period April 13 through December 31, 2017 (Successor) and the period January 1 through April 12, 2017 (Predecessor), our largest customer comprised approximately 17.2% and 14.9% of our total revenues, respectively; our five largest customers comprised approximately 46.3% and 47.8% of our total revenues, respectively; and our ten largest customers comprised approximately 56.5% and 63.1% of our total revenues, respectively. During the period April 13 through December 31, 2017 (Successor), Chesapeake Energy, Conoco Phillips, and EOG Resources made up 17.2%, 11.5%, and 6.4% of our total revenues, respectively. During the period January 1 through April 12, 2017 (Predecessor), Chesapeake Energy, EOG Resources, and Conoco Phillips made up 14.9%, 12.4%, and 7.7% of our total revenues, respectively. The loss of our largest customer or of several of the customers in the top ten would materially adversely affect our revenues and results of operations. There can be no assurance that lost revenues could be replaced in a timely manner or at all.
We have master service agreements in place with most of our customers, under which jobs or projects are awarded on the basis of price, type of service, location of equipment, and the experience level of work crews. Our business segments charge customers by the hour, by the day, or by the project for the services, equipment, and personnel we provide.
Suppliers
We purchase well servicing chemicals, drilling fluids, and related supplies from various third-party suppliers. Although we do not have written agreements with any of our suppliers (other than leases with respect to certain equipment), we have not historically suffered from an inability to purchase or lease equipment or purchase raw materials.
6
Insurance
Our operations are subject to risks inherent in the oilfield services industry, such as equipment defects, malfunctions, failures and natural disasters. In addition, hazards such as unusual or unexpected geological formations, pressures, blow-outs, fires or other conditions may be encountered in drilling and servicing wells, as well as the transportation of fluids and our assets between locations. We have obtained insurance coverage against certain of these risks which we believe is customary in the industry. We have $100 million of liability coverage. Our general liability policy is self-insured up to $250 thousand for each occurrence. We also make estimates and accrue for amounts related to deductibles or self-insured retentions. Such insurance is subject to coverage limits and exclusions and may not be available for all of the risks and hazards to which we are exposed. In addition, no assurance can be given that such insurance will be adequate to cover our liabilities or will be generally available in the future or, if available, that premiums will be commercially justifiable. If we incur substantial liability and such damages are not covered by insurance or are in excess of policy limits, or if we incur such liability at a time when we are not able to obtain liability insurance, our business, results of operations, and financial condition could be materially and adversely affected.
Environmental Regulations
Our operations are subject to various federal, state and local laws and regulations in the United States pertaining to health, safety, and the environment. Laws and regulations protecting the environment have become more stringent over the years, and in certain circumstances may impose strict, joint and several liability, rendering us potentially liable for environmental damage without regard to negligence or fault on our part and for environmental response costs for which others have contributed. Moreover, cleanup costs, penalties, and other damages arising as a result of new, or changes to existing, environmental laws and regulations could be substantial and could have a material adverse effect on our financial condition, results of operations, and cash flows. We believe that we conduct our operations in substantial compliance with current federal, state, and local requirements related to health, safety and the environment. There were no known material environmental liabilities at December 31, 2017 and 2016.
The following is a summary of the more significant existing environmental, health, and safety laws and regulations to which our operations are subject and for which compliance may have a material adverse effect on our results of operation or financial position. See Item 1A beginning on page 10 of this Annual Report for further details on the following: Risk Factors— Due to the nature of our business, we may be subject to environmental liability.
Hazardous Substances and Waste
The Comprehensive Environmental Response, Compensation, and Liability Act, as amended, or CERCLA, and comparable state laws in the United States impose liability without regard to fault or the legality of the original conduct on certain defined persons, including current and prior owners or operators of the site where a release of hazardous substances occurred and entities that disposed or arranged for the disposal of the hazardous substances found at the site and entities that selected and transported the hazardous substances to the site. Under CERCLA, these responsible persons may be assigned strict joint and severed liability for the costs of cleaning up the hazardous substances, for damages to natural resources, and for the costs of certain health studies. In the course of our operations, we handle materials that are regulated as hazardous substances and, as a result, may incur CERCLA liability for cleanup costs. Because of the expansive definition of "responsible parties" under CERCLA, we could be held liable for releases of hazardous substances that resulted from third party operations not under our control or for releases related to practices performed by us or others that were industry standard and in compliance with existing laws and regulations. Also, claims may be filed for personal injury and property damage allegedly caused by the release of or exposure to hazardous substances or other pollutants.
We also handle solid wastes that are subject to the requirements of the Resource Conservation and Recovery Act, as amended, or RCRA, and comparable state statutes. Certain materials generated in the exploration, development, or production of crude oil and natural gas are excluded from RCRA’s hazardous waste regulation under RCRA Subtitle C, but may be subject to regulation as a solid waste under RCRA Subtitle D. Moreover, these wastes, which include wastes currently generated during our operations, could be designated as “hazardous wastes” in the future and become subject to more rigorous and costly disposal requirements. Any such changes in the laws and regulations could have a material adverse effect on our operating expenses.
Although we have used operating and disposal practices that were standard in the industry at the time, hydrocarbons or other wastes may have been released at properties owned or leased by us now or in the past, or at other locations where these hydrocarbons and wastes were taken for treatment or disposal. Under CERCLA, RCRA and analogous state laws, we could be required to clean up contaminated property (including contaminated groundwater), perform remedial activities to prevent future contamination, pay for associated natural resource damages, or pay significant monetary penalties for such releases.
7
Water Discharges
We operate facilities that are subject to requirements of the Clean Water Act, as amended, or CWA, and analogous state laws that impose restrictions and controls on the discharge of pollutants into navigable waters. Pursuant to these laws, permits must be obtained to discharge pollutants into state waters or waters of the United States, including to discharge storm water runoff from certain types of facilities. Spill prevention, control, and countermeasure requirements under the CWA require implementation of measures to help prevent the contamination of navigable waters in the event of a hydrocarbon spill. The CWA can impose substantial civil and criminal penalties for non-compliance. We believe that our disposal and equipment cleaning facilities are in substantial compliance with CWA requirements.
Air Emissions
Our facilities and operations are also subject to regulation under the Clean Air Act (CAA) and analogous state and local laws and regulations for air emissions. Changes in and scheduled implementation of these laws could lead to the imposition of new air pollution control requirements for our operations. Therefore, we may incur future capital expenditures to upgrade or modify air pollution control equipment or come into compliance where needed. The EPA promulgated new source performance standards regulating methane emissions from the oil and gas sector in June 2016. These regulations require a reduction in methane emissions from new and modified infrastructure and equipment in the oil and gas sector, including the drilling of new wells, by up to 45% from 2012 levels by the year 2025. The Trump Administration has, however, indicated disapproval of the regulations and is expected to repeal, withdraw, or significantly modify the new source performance standards in the upcoming year. We believe that our operations are in substantial compliance with CAA requirements.
Employee Health and Safety
We are subject to the requirements of the federal Occupational Safety and Health Act, as amended, or OSHA, and comparable state laws that regulate the protection of employee health and safety. OSHA’s hazard communication standard requires that information about hazardous materials used or produced in our operations be maintained and provided to employees, state and local government authorities, and citizens. In addition, OSHA requires that certain safety measures such as hazard controls and employee training be implemented to prevent employee exposure to safety and health hazards and dangerous conditions at oil and gas sites. We believe that our operations are in substantial compliance with OSHA requirements.
Climate Change Regulation
Continued political attention to issues concerning climate change, the role of human activity in it, and potential mitigation through regulation could have a material impact on our operations and financial results. International agreements and national or regional legislation and regulatory measures to limit greenhouse emissions are currently in various stages of discussion or implementation. These and other greenhouse gas emissions-related laws, policies, and regulations may result in substantial capital, compliance, operating and maintenance costs. Material price increases or incentives to conserve or use alternative energy sources could reduce demand for services that we currently provide and adversely affect our operations and financial results. The ultimate financial impact associated with compliance with these laws and regulations is uncertain and is expected to vary depending on the laws enacted in each jurisdiction, our activities in those jurisdictions and market conditions.
Other Laws and Regulations
We operate salt water disposal wells that are subject to the CWA, Safe Drinking Water Act, and state and local laws and regulations, including those established by the EPA’s Underground Injection Control Program which establishes the minimum program requirements. Our salt water disposal wells are located in Texas, which requires us to obtain a permit to operate each of these wells. We have such permits for each of our operating salt water disposal wells. The Texas regulatory agency may suspend, modify, or terminate any of these permits if such well operation is likely to result in pollution of fresh water, substantial violation of permit conditions or applicable rules, contributes to seismic activity or leaks to the environment. We maintain insurance against some risks associated with our well service activities, but there can be no assurance that this insurance will continue to be commercially available or available at premium levels that justify its purchase by us. The occurrence of a significant event that is not fully insured or indemnified could have a materially adverse effect on our financial condition and operations. In addition, hydraulic fracturing practices have come under increased scrutiny in recent years as various regulatory bodies and public interest groups investigate the potential impacts of hydraulic fracturing on fresh water sources. Risks associated with potential regulation of hydraulic fracturing are discussed in more detail under Item 1A. Risk Factors: Federal and state legislative and regulatory initiatives relating to hydraulic fracturing could result in increased cost and additional operating restrictions or delays.
Emergence from Bankruptcy
As previously discussed, on the Effective Date, the Plan became effective in accordance with its terms and the Debtors emerged from their chapter 11 cases. Under the Plan, which was approved by the Bankruptcy Court and became effective on the Effective Date, the following changes occurred:
8
•FES Ltd. converted from a Texas corporation to a Delaware corporation;
•All previously outstanding equity interests (which included FES Ltd.’s Old Common Stock, FES Ltd.’s prior preferred stock, awards under FES Ltd.’s prior incentive compensation plans, or the Prior Compensation Plans, and the preferred stock purchase rights under the rights agreement dated as of May 19, 2008, as subsequently amended on July 8, 2013, or the Rights Agreement, between FES Ltd. and CIBC Mellon Trust Company, as rights agent) in FES Ltd. were extinguished without recovery;
•FES Ltd. created a new class of common stock, the New Common Stock;
•Approximately $280 million in principal amount of FES Ltd.'s prior 9% senior notes due 2019, or the Prior Senior Notes, plus accrued interest of $28.1 million were canceled and each holder of the Prior Senior Notes received such holder’s pro rata share of (i) $20.0 million in cash and (ii) 100% of the New Common Stock, subject to dilution only as a result of the shares of New Common Stock issued or available for issuance in connection with a management incentive plan, or the Management Incentive Plan or the MIP. A total of 5,249,997 shares of New Common Stock was issued to the holders of the Prior Senior Notes;
•The Debtors entered into the New Loan Agreement, with certain financial institutions party thereto from time to time as lenders, or the Lenders, and Wilmington Trust, National Association, as agent for the Lenders;
•FES Ltd. adopted the Management Incentive Plan, which provides for the issuance of equity-based awards with respect to, in the aggregate, up to 750,000 shares of New Common Stock;
•The Debtors’ loan and security agreement governing their revolving credit facility dated as of September 9, 2011 as subsequently amended, or the Prior Loan Agreement, with Regions Bank, or Regions, as the sole lender party thereto, or the Lender, was terminated and a new letter of credit facility was entered into with Regions, or the New Regions Letters of Credit Facility, which covers letters of credit and the Company's credit card program. Regions continues to hold the cash pledged to support the New Regions Letters of Credit Facility in the amount of $9.0 million as of December 31, 2017;
•The Debtors paid off the outstanding principal balance of $15 million plus outstanding interest and fees under the Prior Loan Agreement, and the Prior Loan Agreement was terminated in accordance with the Plan;
•Holders of allowed creditor claims, aside from holders of the Prior Senior Notes, received, on account of such claims, either payment in full in cash or otherwise had their rights reinstated; and
•FES Ltd. entered into a registration rights agreement with certain of its stockholders to provide registration rights with respect to the New Common Stock.
For more information regarding our emergence from bankruptcy, see Note 2 - Chapter 11 Proceedings in our Consolidated Financial Statements, below.
Available Information
Information regarding Forbes Energy Services Ltd. and its subsidiaries can be found on our website at http://www.forbesenergyservices.com. We make available on our website, free of charge, access to our annual reports on Form 10-K, quarterly reports on Form 10-Q, current reports on Form 8-K Proxy Statements and amendments to those reports, as well as other documents that we file or furnish to the Securities and Exchange Commission, or the SEC, in accordance with Sections 13 or 15(d) of the Exchange Act as soon as reasonably practicable after these reports have been electronically filed with, or furnished to, the SEC. We also post copies of any press releases we issue on our website. We intend to use our website as a means of disclosing material non-public information and for complying with disclosure obligations under Regulation FD. Such disclosures will be included on our website under the heading “Investor Relations.” Accordingly, investors should monitor such portion of our website, in addition to following our press releases, SEC filings and public conference calls and webcasts. Information filed with the SEC may be read or copied at the SEC’s Public Reference Room at 100 F Street, N.E., Washington, D.C. 20549. Information on operation of the Public Reference Room may be obtained by calling the SEC at 1-800-SEC-0330. The SEC also maintains an internet website (http://www.sec.gov) that contains reports, proxy and information statements, and other information regarding issuers that file electronically. Our Third Amended and Restated Employee Code of Business Conduct and Ethics (which applies to all employees, including our Chief Executive Officer and Chief Financial Officer), Second Amended and Restated Code of Business Conduct and Ethics for Members of the Board of Directors and the charters for our Audit, Nominating/Corporate Governance and Compensation Committees, can all be found on the Investor Relations page of our website under “Corporate Governance.” We intend to disclose any changes to or waivers from the Third Amended and Restated Employee Code of Business Conduct and Ethics that would otherwise be required to be disclosed under Item 5.05 of Form 8-K on our website. We will also provide printed copies of these materials to any shareholder upon request to Forbes Energy Services Ltd., Attn: Chief Financial Officer, 3000 South Business Highway 281, Alice, Texas 78332. The information on our website is not, and shall not be deemed to be, a part of this report or incorporated into any other filings we make with the Commission.
9
Item 1A. | Risk Factors |
The following information describes certain significant risks and uncertainties inherent in our business. You should take these risks into account when evaluating us. This section does not describe all risks applicable to us, our industry or our business, and it is intended only as a summary of known material risks that are specific to the Company. You should carefully consider such risks and uncertainties together with the other information contained in this Form 10-K. If any of such risks or uncertainties actually occurs, our business, financial condition or operating results could be harmed substantially and could differ materially from the plans and other forward-looking statements included in Item 7. “Management’s Discussion and Analysis of Financial Condition and Results of Operations” of this Annual Report on Form 10-K and elsewhere herein.
RISKS RELATING TO OUR RECENT EMERGENCE FROM BANKRUPTCY
We recently emerged from our chapter 11 cases, which could adversely affect our business and relationships.
The fact that we filed for bankruptcy protection in 2017 and recently emerged from our chapter 11 cases could adversely affect our business and relationships with our customers, suppliers, contractors, suppliers or others. Due to these uncertainties, many risks exist, including the following:
• | key suppliers could terminate their relationship with us or require additional financial assurances or enhanced performance from us; |
• | the ability to renew existing contracts and compete for new business may be adversely affected; |
• | the ability to attract, motivate and/or retain key executives and employees may be adversely affected; |
• | employees may be more easily attracted to other employment opportunities; and |
• | competitors may take business away from us, and our ability to attract and retain customers may be negatively impacted. |
The occurrence of one or more of these events could have a material and adverse effect on our operations, financial condition and reputation. We cannot assure you that having been through the chapter 11 cases will not adversely affect our operations in the future.
Our New Loan Agreement contains certain covenants that may inhibit our ability to make certain investments, incur additional indebtedness and engage in certain other transactions, which could adversely affect our ability to meet our future goals.
Our New Loan Agreement limits our ability, among other things, to
• | incur additional indebtedness; |
• | create or suffer to exist liens; |
• | enter into leases for equipment or real property; |
• | make certain investments; |
• | merge, consolidate, sell, or otherwise dispose of all or substantially all of our assets; |
• | pay dividends or make other distributions on our capital stock; |
• | enter into transactions with affiliates; |
• | engage or enter into any new lines of business; |
• | prepay, redeem, retire or repurchase certain of our indebtedness; |
• | form a subsidiary; and |
• | amend, modify or waive certain provisions of our (and our subsidiaries’) organizational documents. |
A breach of any of these covenants could result in a default under our New Loan Agreement. If a default occurs, the lender under the New Loan Agreement may elect to declare all borrowings thereunder outstanding, together with accrued interest and other fees, to be immediately due and payable. The lenders under the New Loan Agreement would also have the right in these circumstances to terminate any commitments they have to provide further borrowings. If we are unable to repay our indebtedness when due or declared due, the lenders thereunder will also have the right to proceed against the collateral pledged to them to secure the indebtedness. If such indebtedness were to be accelerated, our assets may not be sufficient to repay in full our secured indebtedness.
10
Upon our emergence from bankruptcy, the composition of our shareholder base and Board of Directors changed significantly. As a result, the future strategy and plans of the Company may differ materially from those in the past.
Pursuant to the Plan, the composition of our Board of Directors (the “Board”) changed significantly effective upon our emergence from the chapter 11 cases on April 13, 2017. Our Board is now made up of six directors, five of whom had not previously served on the Board. The new directors have different backgrounds, experiences and perspectives from those individuals who previously served on the Board and, thus, may have different views on the issues that will determine the future of the Company. As a result, the future strategy and plans of the Company may differ materially from those of the past.
The price of shares of our New Common Stock may be volatile and such volatility may negatively affect the price of shares of our New Common Stock.
Upon emergence from the chapter 11 cases, our old common stock was canceled and we issued 5,249,997 shares of our New Common Stock. On May 18, 2017, our New Common Stock was authorized for trading on the Over-The-Counter Pink Market. On May 19, 2017, OTC Markets Group Inc. announced that our New Common Stock qualified to trade on the OTCQX Best Market under the symbol “FLSS.” The market price of our New Common Stock is likely to be highly volatile and could fluctuate widely in price in response to various factors, many of which are beyond our control, including the following:
• | announcements concerning our competitors, the oil and gas industry or the economy in general; |
• | fluctuations in the prices of oil and natural gas; |
• | general and industry-specific economic conditions; |
• | changes in financial estimates or recommendations by securities analysts or failure to meet analysts’ performance expectations; |
• | any increased indebtedness we may incur in the future; |
• | speculation or reports by the press or investment community with respect to us or our industry in general; |
• | announcements by us or our competitors of significant contracts, acquisitions, dispositions, strategic partnerships, joint ventures or capital commitments; |
• | changes or proposed changes in laws or regulations affecting the oil and natural gas industry or enforcement of these laws and regulations, or announcements relating to these matters; and |
• | general market, political and economic conditions, including any such conditions and local conditions in the markets in which we operate. |
Broad market and industry factors may decrease the market price of our New Common Stock, regardless of our actual operating performance. The stock market in general has from time to time experienced extreme price and volume fluctuations, including periods of sharp decline. In the past, following periods of volatility in the overall market and the market price of a company’s securities, securities class action litigation has often been instituted against such companies. Such litigation, if instituted against us, could result in substantial costs and be a diversion of our management’s attention and resources.
A limited public trading market may cause volatility in the price of shares of our New Common Stock.
Our New Common Stock is currently quoted on the OTCQX Best Market. The quotation of our New Common Stock on the OTCQX Best Market does not assure that a meaningful, consistent and liquid trading market currently exists, and in recent years the OTCQX Best Market has experienced extreme price and volume fluctuations that have particularly affected the market prices of many smaller companies like ours. Our New Common Stock is sporadically and thinly traded. As a consequence, sales of even small amounts of our New Common Stock, or the perception that such sales might occur, could adversely affect prevailing market prices of our New Common Stock. As a result of our New Common Stock’s volatility, our stock price could decline substantially in a short time and our stockholders could suffer losses or be unable to liquidate their holdings.
Our actual financial results after emergence from our chapter 11 cases may not be comparable to our projections filed with the Bankruptcy Court in the course of our chapter 11 cases, and will not be comparable to our historical financial results as a result of the implementation of the Plan and the transactions contemplated thereby and the impact from fresh start accounting.
We filed with the Bankruptcy Court projected financial information through the end of fiscal year ended December 31, 2019, to demonstrate to the Bankruptcy Court the feasibility of the Plan and our ability to continue operations following our emergence from the chapter 11 cases. Those projections were prepared solely for the purpose of the chapter 11 cases and have not been, and will not be, updated on an ongoing basis and should not be relied upon by investors. At the time they were prepared, the projections reflected numerous assumptions concerning our anticipated future performance with respect to then prevailing and anticipated market and economic conditions that were and remain beyond our control and that may not materialize. Projections are inherently
11
subject to substantial and numerous uncertainties and to a wide variety of significant business, economic and competitive risks and the assumptions underlying the projections and/or valuation estimates may prove to be wrong in material respects. Actual results will likely vary significantly from those contemplated by the projections. As a result, investors should not rely on these projections.
Additionally, we applied fresh start reporting in our financial statements commencing as of April 13, 2017. As a result of fresh start accounting, our consolidated financial statements from and after April 13, 2017 are not comparable to our financial statements prior to such date.
RISKS RELATING TO OUR BUSINESS
The industry in which we operate is highly volatile and dependent on domestic spending by the oil and natural gas industry, and continued and prolonged reductions in oil and natural gas prices and in the overall level of exploration and development activities may further reduce our levels of utilization, demand for our services, or pricing for our services.
The levels of utilization, demand, pricing, and terms for oilfield services in our existing or future service areas largely depend upon the level of exploration and development activity for both crude oil and natural gas in the United States. Oil and natural gas industry conditions are influenced by numerous factors over which we have no control, including oil and natural gas prices, expectations about future oil and natural gas prices, levels of supply and consumer demand, the cost of exploring for, producing and delivering oil and natural gas, the expected rates of current production, the discovery rates of new oil and natural gas reserves, available pipeline and other oil and natural gas transportation capacity, political instability in oil and natural gas producing countries, merger and divestiture activity among oil and natural gas producers, political, regulatory and economic conditions, and the ability of oil and natural gas companies to raise equity capital or debt financing. Any addition to, or elimination or curtailment of, government incentives for companies involved in the exploration for and production of oil and natural gas could have a significant effect on the oilfield services industry in the United States.
Our operations may be materially affected by severe weather conditions, such as hurricanes, drought, or extreme temperatures. Such events could result in evacuation of personnel, suspension of operations or damage to equipment and facilities. Damage from adverse weather conditions could result in a material adverse effect on our financial condition, results of operations and cash flows.
Beginning in October 2014, through 2015 and the first half of 2017, oil prices worldwide dropped significantly. While market conditions generally improved somewhat in the second half of 2017, any significant reduction in commodity prices could cause the cancellation or curtailment of additional drilling programs and the lowering of production spending on existing wells in the future. Lower oil and natural gas prices could also cause our customers to seek to terminate, renegotiate, or fail to honor our service contracts.
A continued and prolonged reduction in the overall level of exploration and development activities, whether resulting from changes in oil and natural gas prices or otherwise, could materially and adversely affect us by negatively impacting:
• | our revenues, cash flows and profitability; |
• | the fair market value of our equipment fleet; |
• | our ability to maintain or increase our borrowing capacity; |
• | our ability to obtain additional capital to finance our business and make acquisitions, and the cost of that capital; |
• | the collectability of our receivables; and |
• | our ability to retain skilled personnel whom we would need in the event of an upturn in the demand for our services. |
The ongoing decrease in utilization, demand for our services and pricing has had, and if it continues will continue to have a material adverse effect on our business, financial condition, results of operations, and cash flows.
Our business may be adversely affected by a deterioration in general economic conditions or a weakening of the broader energy industry.
A prolonged economic slowdown or recession in the United States, adverse events relating to the energy industry or regional, national and global economic conditions and factors, particularly a further or renewed slowdown in the oil and gas industry, could negatively impact our operations and therefore adversely affect our results. The risks associated with our business are more acute during periods of economic slowdown or recession because such periods may be accompanied by decreased exploration and development spending by our customers, decreased demand for oil and gas and decreased prices for oil and gas.
12
We extend credit to our customers which presents a risk of non-payment.
A substantial portion of our accounts receivable are with customers involved in the oil and natural gas industry, whose revenues are also affected by fluctuations in oil and natural gas prices, including the recent substantial decline in oil prices. Collection of some of these receivables will be more difficult, and due to economic factors affecting this industry, we may experience an increase in uncollectible accounts. Failure to collect a significant level of receivables from one or more customers could have a material adverse effect on our business, financial condition, results of operations, and cash flows.
The market for oil and natural gas may be adversely affected by global demands to curtail use of such fuels.
Fuel conservation measures, alternative fuel requirements, increasing consumer demand for alternatives to oil and natural gas and technological advances in fuel economy and energy generation devices could reduce the demand for oil and other liquid hydrocarbons. We cannot predict the effect of changing demand for oil and natural gas products, and any major changes may have a material adverse effect on our business, financial condition, results of operations and cash flows.
We may be unable to maintain or increase pricing on our core services.
We may periodically seek to increase the prices on our services to offset rising costs or to generate higher returns for our stockholders. However, we operate in a very competitive industry and, as a result, we are not always successful in raising or maintaining our existing prices. Additionally, during periods of increased market demand, a significant amount of new service capacity may enter the market, which also puts pressure on the pricing of our services and limits our ability to increase prices.
Even when we are able to increase our prices, we may not be able to do so at a rate that is sufficient to offset such rising costs. In periods of high demand for oilfield services, a tighter labor market may result in higher labor costs. During such periods, our labor costs could increase at a greater rate than our ability to raise prices for our services. Also, we may not be able to successfully increase prices without adversely affecting our activity levels. The inability to maintain or increase our pricing as costs increase could have a material adverse effect on our business, financial position, and results of operations.
Our customer base is concentrated within the oil and natural gas production industry and loss of a significant customer could cause our revenue to decline substantially.
We served 462 customers for the period April 13 through December 31, 2017 (Successor) and 303 customers for the period January 1 through April 12, 2017 (Predecessor). For the period April 13 through December 31, 2017 (Successor), the period January 1 through April 12, 2017 (Predecessor) and the year ended December 31, 2016 (Predecessor), our largest customer comprised approximately 17.2%, 14.9% and 16.2% of our total revenues, respectively; our five largest customers comprised approximately 46.3%, 47.8% and 56.8% of our total revenues, respectively; and our ten largest customers comprised approximately 56.5%, 63.1% and 70.1% of our total revenues, respectively. Our top 100 customers amounted to 91.8%, 97.1% and 96.1% for the period April 13 through December 31, 2017 (Successor), the period January 1 through April 12, 2017 (Predecessor) and the year ended December 31, 2016 (Predecessor), respectively. The loss of our top customer or of several of our top customers would adversely affect our revenues and results of operations. We may be able to replace customers lost with other customers, but there can be no assurance that lost revenues could be replaced in a timely manner with the same margins or, perhaps, at all.
Our indebtedness and operating lease commitments could restrict our operations and make us more vulnerable to adverse economic conditions.
As of December 31, 2017 (Successor), our long-term debt, including current portions, was $58.9 million and our commitment for operating leases is $4.9 million. In the event a decline in activity is encountered, our level of indebtedness and lease payment obligations may adversely affect operations and limit our growth. Our level of indebtedness and lease payments may affect our operations in several ways, including the following:
• | by increasing our vulnerability to general adverse economic and industry conditions; |
• | due to the fact that the covenants that are contained in the New Loan Agreement limit our ability to borrow funds, dispose of assets, pay dividends and make certain investments; |
• | due to the fact that any failure to comply with the covenants of the New Loan Agreement (including failure to make the required interest payments) could result and did result in an event of default under the New Loan Agreement, which would result in all outstanding indebtedness due under the New Loan Agreement becoming immediately due and payable; |
• | all of our indebtedness may become immediately due and payable; and |
• | due to the fact that our level of debt may impair our ability to obtain additional financing in the future for working capital, capital expenditures, acquisitions, or other general corporate purposes. |
These restrictions could have a material adverse effect on our business, financial position, results of operations, and cash flows, and the ability to satisfy the obligations under the New Loan Agreement. Accordingly, an event of default could result in all or a portion of our outstanding debt under our debt agreements becoming immediately due and payable. If this occurred, we
13
might not be able to obtain waivers or secure alternative financing to satisfy all of our obligations simultaneously, which would adversely affect our business and operations.
Impairment of our long-term assets may adversely impact our financial position and results of operations.
We have recorded asset impairment charges in the past. We periodically evaluate our long-lived assets, including our property and equipment, and intangible assets. In performing these assessments, we project future cash flows on an undiscounted basis for long-lived assets and compare these cash flows to the carrying amount of the related assets. These cash flow projections are based on our current operating plans, estimates and judgmental assumptions. We perform the assessment of potential impairment for our property and equipment and intangibles whenever facts and circumstances indicate that the carrying value of those assets may not be recoverable due to various external or internal factors. If we determine that our estimates of future cash flows were inaccurate or our actual results are materially different from what we have predicted, we could record additional impairment charges in future periods, which could have a material adverse effect on our financial position and results of operations. Following emergence from our chapter 11 cases, fresh start accounting required us to present our assets, liabilities and equity as if we were a new entity upon emergence from bankruptcy, with no beginning retained earnings or deficit as of the fresh start reporting date and with our assets reported at fair values upon emergence.
The industry in which we operate is highly competitive.
The oilfield services industry is highly competitive and we compete with a substantial number of companies, some of which have greater technical and financial resources than we have. Examples of our larger competitors performing both well servicing and fluid logistics are Basic Energy Services, Inc., Superior Energy Services, Inc., Key Energy Services, Inc., and C&J Energy Services, Inc. Our largest competitors that compete only with our fluid logistics segment are Nuverra Environmental Solutions and Stallion Oilfield Services, Ltd. Our ability to generate revenues and earnings depends primarily upon our ability to win bids in competitive bidding processes and to perform awarded projects within estimated times and costs. There can be no assurance that competitors will not substantially increase the resources devoted to the development and marketing of products and services that compete with ours or that new or existing competitors will not enter the various markets in which we are active. In certain aspects of our business, we also compete with a number of small and medium-sized companies that, like us, have certain competitive advantages such as low overhead costs and specialized regional strengths. Although activity has increased in 2017, it is still at reduced levels compared to prior years. These levels continue to result in pricing pressure in certain markets and lines of business and may result in lower revenues or margins to us.
The New Loan Agreement imposes significant operating and financial restrictions on us that may prevent us from pursuing certain business opportunities and restrict or limit our ability to operate our business.
The New Loan Agreement contains covenants that restrict or limit our ability to take various actions, such as:
• | incur additional indebtedness; |
• | create or suffer to exist liens; |
• | enter into leases for equipment or real property; |
• | make certain investments; |
• | merge, consolidate, sell, or otherwise dispose of all or substantially all of our assets; |
• | pay dividends or make other distributions on our capital stock; |
• | enter into transactions with affiliates; |
• | engage or enter into any new lines of business; |
• | prepay, redeem, retire or repurchase certain of our indebtedness; |
• | form a subsidiary; and |
• | amend, modify or waive certain provisions of our (and our subsidiaries’) organizational documents. |
In addition, our New Loan Agreement requires us to satisfy certain financial conditions, some of which become more restrictive over time, and may require us to reduce our debt or take some other action in order to comply with them. The failure to comply with any of these financial conditions, including the covenants, would cause a default under our New Loan Agreement. A default under any of our indebtedness, if not waived, could result in the acceleration of such indebtedness or other indebtedness, in which case the debt would become immediately due and payable. In the event of any acceleration of our indebtedness, we may not be able to pay our debt or borrow sufficient funds to refinance it, and any holders of secured indebtedness may seek to foreclose on the assets securing such indebtedness. Even if new financing is available, it may not be available on terms that are acceptable to us. These restrictions could also limit our ability to obtain future financings, make needed capital expenditures, withstand a downturn in our business or the economy in general, or otherwise conduct necessary corporate activities. We also may be prevented from taking advantage of business opportunities that arise because of the limitations imposed on us by the restrictive covenants under
14
our New Loan Agreement or existing limitations on the incurrence of additional indebtedness, including in connection with acquisitions. See Item 7. “Management’s Discussion and Analysis of Financial Condition and Results of Operations” for a discussion of our New Loan Agreement.
We are subject to the risk of technological obsolescence.
We anticipate that our ability to maintain our current business and win new business will depend upon continuous improvements in operating equipment, among other things. There can be no assurance that we will be successful in our efforts in this regard or that we will have the resources available to continue to support this need to have our equipment remain technologically up to date and competitive. Our failure to do so could have a material adverse effect on us. No assurances can be given that competitors will not achieve technological advantages over us.
We are highly dependent on certain of our officers, management and key employees.
Our success is dependent upon our key management, technical and field personnel, especially John E. Crisp, our President and Chief Executive Officer, and Steve Macek, our Executive Vice President and Chief Operating Officer. Any loss of the services of either one of these officers, or managers with strong relationships with customers or suppliers, or a sufficient number of other key employees could have a material adverse effect on our business and operations. Our ability to expand our services is dependent upon our ability to attract and retain additional qualified employees.
We expect that we will continue to incur significant costs as a result of being obligated to comply with Securities Exchange Act reporting requirements, the Sarbanes-Oxley Act, and the New Loan Agreement covenants and that our management will be required to devote substantial time to compliance matters.
As a public company, we incur significant legal, accounting, insurance and other expenses, including costs associated with public company reporting requirements. We also have incurred and will incur costs associated with the Sarbanes-Oxley Act of 2002 and related rules implemented by the SEC. We will incur ongoing periodic expenses in connection with the administration of our organizational structure. The expenses incurred by public companies generally for reporting and corporate governance purposes have been increasing. We expect these rules and regulations to increase our legal and financial compliance costs and to make some activities more time-consuming and costly, although we are currently unable to estimate these costs with any degree of certainty. In estimating these costs, we took into account expenses related to insurance, legal, accounting, and compliance activities, as well as other expenses not currently incurred. These laws and regulations could also make it more difficult or costly for us to obtain certain types of insurance, including director and officer liability insurance, and we may be forced to accept reduced policy limits and coverage or incur substantially higher costs to obtain the same or similar coverage. These laws and regulations could also make it more difficult for us to attract and retain qualified persons to serve on our Board, our Board committees or as our executive officers. Furthermore, if we are unable to satisfy our obligations as a public company, we could be subject to delisting of our New Common Stock, fines, sanctions and other regulatory action and potentially civil litigation.
We engage in transactions with related parties and such transactions present possible conflicts of interest that could have an adverse effect on us.
We have historically entered into a significant number of transactions with related parties. The details of certain of these transactions are set forth in Note 10 to our Consolidated Financial Statements included in this Annual Report on Form 10-K. Related party transactions create the possibility of conflicts of interest with regard to our management. Such a conflict could cause an individual in our management to seek to advance his or her economic interests above ours. Further, the appearance of conflicts of interest created by related party transactions could impair the confidence of our investors. Our Board has adopted a Related Persons Transaction Policy that requires the Audit Committee to approve or ratify related party transactions that involve consideration in excess of $120,000. Notwithstanding this, it is possible that a conflict of interest could have a material adverse effect on our business, financial condition, results of operations, and cash flows.
Activity in the oilfield services industry is seasonal and may affect our revenues during certain periods.
Our operations are impacted by seasonal factors. Historically, our business has been negatively impacted during the winter months due to inclement weather, fewer daylight hours, and holidays. Our well servicing rigs are mobile and we operate a significant number of oilfield vehicles. During periods of heavy snow, ice or rain, we may not be able to move our equipment between locations, thereby reducing our ability to generate rig or truck hours. In addition, the majority of our well servicing rigs work only during daylight hours. In the winter months as daylight time becomes shorter, the amount of time that the well servicing rigs work is shortened, which has a negative impact on total hours worked. Finally, we historically have experienced significant slowdown during the Thanksgiving and Christmas holiday seasons.
In addition, the oil and natural gas industry has traditionally been volatile and is influenced by a combination of long-term, short-term and cyclical trends, including the domestic and international supply and demand for oil and natural gas, current and expected future prices for oil and natural gas and the perceived stability and sustainability of those prices. Such cyclical trends also include the resultant levels of cash flows generated and allocated by exploration and production companies to their drilling, completion and workover budget. The volatility of the oil and natural gas industry and the precipitous decline in oil and natural
15
gas prices have negatively impacted the level of exploration and production activity and capital expenditures by our customers. This has adversely affected, and in the future may adversely affect, the demand for our services, which has had, and if it continues, will continue to have, a material adverse effect on our business, financial condition, results of operations, and cash flows.
We rely heavily on our suppliers and do not maintain written agreements with any suppliers.
Our ability to compete and grow will be dependent on our access to equipment, including well servicing rigs, parts, and components, among other things, at a reasonable cost and in a timely manner. We do not maintain written agreements with any of our suppliers (other than leases for certain equipment), and we are, therefore, dependent on the relationships we maintain with them. Failure of suppliers to deliver such equipment, parts and components at a reasonable cost and in a timely manner would be detrimental to our ability to maintain existing customers and obtain new customers. No assurance can be given that we will be successful in maintaining our required supply of such items.
The source and supply of materials has been consistent in the past, however, in periods of high industry activity, periodic shortages of certain materials have been experienced and costs have been affected. If current or future suppliers are unable to provide the necessary raw materials, or otherwise fail to deliver products in the quantities required, any resulting delays in the provision of services to our customers could have a material adverse effect on our business, results of operations, financial condition, and cash flows.
We do not maintain current written agreements with respect to some of our salt water disposal wells.
Our ability to continue to provide well maintenance services depends on our continued access to salt water disposal wells. Many of our currently active salt water disposal wells are not subject to written operating agreements or are located on the premises of third parties with whom we do not have a current written lease. We do not maintain current written surface leases or right of way agreements with these third parties and we are, therefore, dependent on the relationships we maintain with them. Failure to maintain relationships with these third parties could impair our ability to access and maintain the applicable salt water disposal wells and any well servicing equipment located on their property. If that occurred, we would increase the levels of fluid injection at our remaining salt water disposal wells and would need to use additional third party disposal wells at substantial additional cost. Additionally, our permits to inject fluid into the salt water disposal wells are subject to maximum pressure limitations and if multiple salt water disposal wells became unavailable, this might adversely impact our operations.
Due to the nature of our business, we may be subject to environmental liability.
Our business operations and ownership of real property are subject to numerous federal, state and local environmental and health and safety laws and regulations, including those relating to emissions to air, discharges to water, treatment, storage and disposal of regulated materials, and remediation of soil and groundwater contamination. The nature of our business, including operations at our current and former facilities by prior owners, lessors or operators, exposes us to risks of liability under these laws and regulations due to the production, generation, storage, use, transportation, and disposal of materials that can cause contamination or personal injury if released into the environment or if certain types of exposures occur. Environmental laws and regulations may have a significant effect on the costs of transportation and storage of raw materials as well as the costs of the transportation, treatment, storage, and disposal of wastes. We believe we are in material compliance with applicable environmental and worker health and safety requirements. However, we may incur substantial costs, including fines, penalties, damages, criminal or civil sanctions, remediation costs, or experience interruptions in our operations for violations or liabilities arising under these laws and regulations. Although we may have the benefit of insurance maintained by our customers, by other third parties or by us, such insurances may not cover every expense. Further, we may become liable for damages against which we cannot adequately insure, or against which we may elect not to insure, because of high costs or other reasons.
Our customers are subject to similar environmental laws and regulations, as well as limits on emissions to the air and discharges into surface and sub-surface waters. Although regulatory developments that may occur in subsequent years could have the effect of reducing industry activity, we cannot predict the nature of any new restrictions or regulations that may be imposed. We may be required to increase operating expenses or capital expenditures in order to comply with any new restrictions or regulations.
16
Climate change legislation or regulations restricting emissions of “greenhouse gases” could result in increased operating costs and reduced demand for our services.
Continued political attention to issues concerning climate change, the role of human activity in it, and potential mitigation through regulation could have a material impact on our operations and financial results. International agreements and national or regional legislation and regulatory measures to limit greenhouse emissions are currently in various stages of discussion or implementation. These and other greenhouse gas emissions-related laws, policies, and regulations may result in substantial capital, compliance, operating and maintenance costs. Material price increases or incentives to conserve or use alternative energy sources could reduce demand for services that we currently provide and adversely affect our operations and financial results. The ultimate financial impact associated with compliance with these laws and regulations is uncertain and is expected to vary depending on the laws enacted in each jurisdiction, our activities in those jurisdictions and market conditions.
Significant physical effects of climatic change, if they should occur, have the potential to damage oil and natural gas facilities, disrupt production activities and could cause us or our customers to incur significant costs in preparing for or responding to those effects.
In an interpretative guidance on climate change disclosures, the SEC indicates that climate change could have an effect on the severity of weather (including hurricanes and floods), sea levels, the arability of farmland, and water availability and quality. If any such effects were to occur, they could have an adverse effect on our assets and operations or the assets and operations of our customers. We may not be able to recover through insurance some or any of the damages, losses, or costs that may result should the potential physical effects of climate change occur. Unrecovered damages and losses incurred by our customers could result in decreased demand for our services.
Increasing trucking regulations may increase our costs and negatively affect our results of operations.
In connection with the services we provide, we operate as a motor carrier and, therefore, are subject to regulation by the U.S. Department of Transportation, or U.S. DOT, and by various state agencies. These regulatory authorities exercise broad powers governing activities such as the authorization to engage in motor carrier operations and regulatory safety. There are additional regulations specifically relating to the trucking industry, including testing and specification of equipment and product handling requirements. The trucking industry is subject to possible regulatory and legislative changes that may affect the economics of the industry by requiring changes in operating practices or by changing the demand for common or contract carrier services or the cost of providing truckload services. Some of these possible changes include increasingly stringent environmental regulations and changes in the regulations that govern the amount of time a driver may drive in any specific period, onboard black box recorder devices, or limits on vehicle weight and size.
Interstate motor carrier operations are subject to safety requirements prescribed by the U.S. DOT. To a large degree, intrastate motor carrier operations are subject to state safety regulations that mirror federal regulations. Such matters as weight and dimension of equipment are also subject to federal and state regulations.
From time to time, various legislative proposals are introduced, including proposals to increase federal, state, or local taxes, including taxes on motor fuels, which may increase our costs or adversely affect the recruitment of drivers. Management cannot predict whether, or in what form, any increase in such taxes applicable to us will be enacted. We may be required to increase operating expenses or capital expenditures in order to comply with any new restrictions or regulations.
We are subject to extensive additional governmental regulation.
In addition to environmental and trucking regulations, our operations are subject to a variety of other federal, state, and local laws, regulations and guidelines, including laws and regulations relating to health and safety, the conduct of operations, and the manufacture, management, transportation, storage and disposal of certain materials used in our operations. Also, we may become subject to such regulation in any new jurisdiction in which we may operate. We believe that we are in material compliance with such laws, regulations and guidelines.
We have invested financial and managerial resources to comply with applicable laws, regulations and guidelines and expect to continue to do so in the future. Although regulatory expenditures have not historically been material to us, such laws, regulations and guidelines are subject to change. Accordingly, it is impossible for us to predict the cost or effect of such laws, regulations, or guidelines on our future operations.
Our ability to use net operating loss carryforwards will be subject to limitations under Section 382 of the Internal Revenue Code.
In general, under Sections 382 and 383 of the Internal Revenue Code of 1986, as amended (the “Code”), a corporation that undergoes an “ownership change” is subject to limitations on its ability to utilize its pre-change net operating losses (“NOLs”) and certain tax credits, to offset future taxable income and tax. In general, an ownership change occurs if the aggregate stock ownership of certain stockholders changes by more than 50 percentage points over such stockholders’ lowest percentage of ownership during the testing period (generally three years).
17
In connection with our emergence from Chapter 11 bankruptcy proceedings, we experienced an ownership change for the purposes of Section 382 of the Code. The ownership change did not result in the expiration of any NOLs generated prior to the emergence date. Consequently, approximately $39.4 million of our NOL carryforwards of $52.0 million at January 1, 2018 are subject to annual limitations under Sec. 382. Any subsequent ownership changes under the provisions of Section 382 could further adversely affect the use of our NOLs in future periods.
Our operations are inherently risky, and insurance may not always be available at commercially justifiable rates or in amounts sufficient to fully protect us.
We have an insurance and risk management program in place to protect our assets, operations, and employees. We also have programs in place to address compliance with current safety and regulatory standards. However, our operations are subject to risks inherent in the oilfield services industry, such as equipment defects, malfunctions, failures, accidents, and natural disasters. In addition, hazards such as unusual or unexpected geological formations, pressures, blow-outs, fires, or other conditions may be encountered in drilling and servicing wells, as well as the transportation of fluids and company assets between locations. These risks and hazards could expose us to substantial liability for personal injury, loss of life, business interruption, property damage or destruction, pollution, and other environmental damages.
Although we have obtained insurance against certain of these risks, such insurance is subject to coverage limits and exclusions and may not be available for the risks and hazards to which we are exposed. In addition, no assurance can be given that such insurance will be adequate to cover our liabilities or will be generally available in the future or, if available, that premiums will be commercially justifiable or that such coverage may not require us to accept additional deductibles. If we were to incur substantial liability and such damages were not covered by insurance or were in excess of policy limits, or if we were to incur such liability at a time when we are not able to obtain liability insurance, our business, results of operations, and financial condition could be materially adversely affected.
We have anti-takeover provisions in our organizational documents that may discourage a change of control.
Our organizational documents contain provisions that could make it more difficult for a third party to acquire us without the consent of our Board. These provisions provide for the following:
• | requirements that our Board be divided into three classes, serving in staggered three year terms, which may not be altered or repealed without the affirmative vote of the holders of at least 80% of the shares entitled to vote in an election of directors; |
• | requirements that any action required or permitted to be taken by our stockholders must be effected at a duly called annual or special meeting of such stockholders and may not be effected by consent in writing by such stockholders; |
• | requirements that special meetings of stockholders may be called only by our Chief Executive Officer, our Chairman of the Board, or our Board; |
• | restrictions on the ability of a person who would be an “interested stockholder” (as defined in our Certificate of Incorporation) to effect various business combinations with us for a three year period; |
• | requirements that if notice is provided for a stockholders meeting, other than an annual meeting, the business transacted at such meeting shall be limited to the matters so stated in our notice of meeting; |
• | renouncement of the “corporate opportunity” doctrine as it applies to certain stockholders and the affiliates of such stockholders; and |
• | rights to issue authorized but unissued shares of our common stock and/or any preferred stock without stockholder approval. |
In addition, our organizational documents do not provide for cumulative voting with respect to the election of directors or any other matters, and cumulative voting is not otherwise provided under Delaware law. All of the foregoing provisions could make it more difficult for a third party to acquire, or discourage a third party from attempting to acquire control of us, even if the third party’s offer was considered beneficial by many stockholders. As a result, these provisions could limit the price that investors might be willing to pay in the future for shares of our New Common Stock and may have the effect of delaying or preventing a takeover of the Company that would otherwise be beneficial to investors.
Future legal proceedings could adversely affect us and our operations.
Given the nature of our business, we are involved in litigation from time to time in the ordinary course of business. While we are not presently a party to any material legal proceedings, legal proceedings could be filed against us in the future. No assurance can be given as to the final outcome of any legal proceedings or that the ultimate resolution of any legal proceedings will not have a material adverse effect on us.
18
We may not be able to fully integrate future acquisitions.
We may undertake future acquisitions of businesses and assets in the ordinary course of business. Achieving the benefits of acquisitions depends in part on having the acquired assets perform as expected, successfully consolidating functions, retaining key employees and customer relationships, and integrating operations and procedures in a timely and efficient manner. Such integration may require substantial management effort, time, and resources and may divert management’s focus from other strategic opportunities and operational matters, and ultimately we may fail to realize anticipated benefits of acquisitions.
Federal and state legislative and regulatory initiatives relating to hydraulic fracturing could result in increased cost and additional operating restrictions or delays.
Hydraulic fracturing is an important and common practice that is used to stimulate production of hydrocarbons, particularly natural gas, from tight formations. Hydraulic fracturing involves the injection of water, sand, and chemicals under pressure into the formation to fracture the surrounding rock and stimulate production. Various governmental entities (within and outside the United States) are in the process of studying, restricting, regulating, or preparing to regulate hydraulic fracturing, directly and indirectly. Hydraulic fracturing operations are regulated through the underground injection control programs under the Safe Drinking Water Act and other environmental statutes. The EPA has adopted air emissions standards that apply to well completion activities. In June 2016, the EPA developed new standards for wastewater discharges associated with hydraulic fracturing and, in December 2016, completed a study on the impacts of hydraulic fracturing on groundwater. In 2015, the Bureau of Land Management also enacted regulations for hydraulic fracturing activities that would be unique to federal lands. These rules were, however, struck down by a federal court in June 2016 that determined that BLM did not have authority over fracking operations pursuant to the Energy Policy Act of 2005. Since then, legislation has been proposed that would provide for federal regulation of hydraulic fracturing and require disclosure of the chemicals used in the fracturing process. The legislation remains in committee and has not passed either house. In addition, many state governments now require the disclosure of chemicals used in the fracturing process and some jurisdictions have imposed an express or de facto ban on hydraulic fracturing. A law enacted by the Texas legislature and a rule enacted by The Railroad Commission of Texas in 2011 require disclosure regarding the composition of hydraulic fracturing products to certain parties, including The Railroad Commission of Texas. Furthermore, local groundwater districts may regulate the amount of groundwater that can be withdrawn and used for hydraulic fracturing operations. This could be a material issue due to the water-intensive nature of these operations. If new laws or regulations that significantly restrict hydraulic fracturing are adopted, such laws could make it more difficult or costly for producers to perform fracturing to stimulate production from tight formations. In addition, if hydraulic fracturing is regulated at the federal level, fracturing activities could become subject to additional permitting requirements, and also to attendant permitting delays and potential increases in costs. Increased consumer activism against hydraulic fracturing or the prohibition or restriction of hydraulic fracturing on the part of our customers could potentially result in materially reduced demand for the Company’s services and could have a material adverse effect on our business, results of operations or financial condition.
Recently enacted changes to the U.S. federal tax laws could have a negative impact on our business operations, financial condition and earnings.
Recently enacted legislation, commonly referred to as the “Tax Cuts and Jobs Act,” or the TCJA, includes significant changes to the taxation of business entities. Although the TCJA includes a provision for lower corporate income tax rates, those rate reductions could be offset by other changes intended to broaden the tax base, for example, by limiting the ability to deduct interest expense and net operating losses. We continue to examine the impact the TCJA may have on our business and financial results.
Cybersecurity breaches, hostile cyber intrusions, or business system disruptions may adversely affect our business.
Our operations are highly dependent on digital technologies and services. Digital technologies and services are increasingly subject to cybersecurity threats such as unauthorized access to data and systems, loss or destruction of data (including confidential customer information), computer viruses, and phishing and cyberattacks. Moreover, sophisticated nation-state and nation-state supported actors now engage in intrusions and attacks and add to the risks to our internal data and systems.
Although we seek to implement security measures to protect against such cybersecurity risks, there can be no assurance that these measures will prevent or detect every type of attempt or attack. In addition, a cyberattack or security breach could go undetected for an extended period of time. If our measures for protecting against cybersecurity risks prove insufficient, we could be adversely affected by, among other things: unauthorized publication of our confidential business or proprietary information, unauthorized release of customer or employee data, violation of privacy or other laws, and exposure to litigation. These risks could have a material adverse effect on our business, results of operation, and financial condition.
Item 1B. | Unresolved Staff Comments |
The information to be reported under this item is not required of smaller reporting companies.
19
Item 2. | Properties |
The following sets forth the principal locations from which the Company currently conducts its operations. The Company leases or rents all of the properties set forth below, except for the Alice rig yard, the San Ygnacio truck yard, the Big Lake truck yard and the Madisonville truck yard which are owned by the Company.
Locations | Date in Service | Service Offering | ||
South Texas | ||||
Alice - truck location | 9/1/2003 | Fluid Logistics | ||
Alice - rig location | 9/1/2003 | Well Servicing | ||
Freer | 9/1/2003 | Fluid Logistics | ||
San Ygnacio | 4/1/2004 | Fluid Logistics | ||
Goliad | 8/1/2005 | Fluid Logistics | ||
Bay City | 9/1/2005 | Fluid Logistics | ||
Edna | 2/1/2006 | Well Servicing | ||
Three Rivers | 8/1/2006 | Fluid Logistics | ||
Carrizo Springs | 12/1/2006 | Fluid Logistics | ||
Victoria | 2/15/2011 | Well Servicing | ||
Giddings | 1/1/2013 | Well Servicing | ||
Pleasanton | 3/6/2013 | Well Servicing | ||
Agua Dulce | 8/1/2014 | Well Servicing | ||
West Texas | ||||
San Angelo | 7/1/2006 | Well Servicing | ||
Monahans | 8/31/2007 | Well Servicing/Fluid Logistics | ||
Odessa | 9/30/2007 | Well Servicing | ||
Big Lake | 7/16/2008 | Fluid Logistics | ||
Midland | 11/1/2012 | Fluid Logistics | ||
East Texas | ||||
Marshall | 12/1/2005 | Fluid Logistics | ||
Carthage | 3/1/2007 | Well Servicing | ||
Madisonville | 8/1/2013 | Fluid Logistics | ||
Pennsylvania | ||||
Indiana | 7/9/2009 | Well Servicing | ||
Item 3.Legal Proceedings
From time to time, we are involved in legal proceedings and regulatory proceedings arising out of our operations. We establish reserves for specific liabilities in connection with legal actions that we deem to be probable and estimable. We are not currently a party to any proceeding, the adverse outcome of which would have a material adverse effect on our financial position or results of operations.
On January 22, 2017, the Debtors filed the Bankruptcy Petitions for reorganization under chapter 11 of the United States Bankruptcy Code in the Bankruptcy Court, pursuant to the terms of a restructuring support agreement that contemplated the reorganization of the Debtors pursuant to a prepackaged plan of reorganization, as amended and supplemented, the Plan. On March 29, 2017, the Bankruptcy Court entered an order confirming the Plan. On April 13, 2017, or the Effective Date, the Plan became effective pursuant to its terms and the Debtors emerged from their chapter 11 cases. For more information regarding the bankruptcy, see Note 2 - Chapter 11 Proceedings of our Consolidated Financial Statements, below.
Item 4. | Mine Safety Disclosures |
None.
20
PART II
Item 5. | Market for Registrant’s Common Equity, Related Stockholder Matters and Issuer Purchases of Equity Securities |
Price Range of Common Shares
Since May 19, 2017, our New Common Stock has been quoted on the OTCQX Best Market under the symbol "FLSS". From August 12, 2011 to March 30, 2016, our Old Common Stock was listed and traded on the NASDAQ Global Market under the symbol "FES." From March 31, 2016 to November 20, 2016, our Old Common Stock was listed and traded on the NASDAQ Capital Market under the symbol "FES." From November 21, 2016 to April 12, 2017, our Old Common Stock was quoted on the Pink Sheets under the symbol "FESLQ."
The following table sets forth the high and low sales prices per share of our common stock:
High | Low | ||||||
Successor | |||||||
OTCQX Best Market | |||||||
Fiscal Year 2017: | |||||||
Fourth Quarter | $ | 17.50 | $ | 9.50 | |||
Third Quarter | $ | 17.00 | $ | 9.60 | |||
May 19, 2017 - June 30, 2017(1) | $ | 31.00 | $ | 20.00 | |||
Predecessor | |||||||
Pink Sheets | |||||||
Fiscal Year 2017: | |||||||
April 1, 2017 - April 12, 2017 | $ | 0.02 | $ | 0.01 | |||
First Quarter | $ | 0.06 | $ | 0.01 | |||
Fiscal Year 2016: | |||||||
November 21, 2016 - December 31, 2016 | $ | 0.08 | $ | 0.03 | |||
NASDAQ Capital Market | |||||||
Fiscal Year 2016: | |||||||
October 1, 2016 - November 20, 2016 | $ | 0.14 | $ | 0.09 | |||
Third Quarter | $ | 0.23 | $ | 0.13 | |||
Second Quarter | $ | 0.48 | $ | 0.17 | |||
NASDAQ Global Market | |||||||
Fiscal Year 2016: | |||||||
First Quarter | $ | 0.60 | $ | 0.20 | |||
(1) Following the Effective Date, no trading occurred from April 13, 2017 through May 18, 2017 | |||||||
As of March 26, 2018, we had 5,336,397 shares of New Common Stock issued and outstanding, held by nine stockholders of record. All common stock held by Cede & Co. is recorded in the Company’s stock register as being held by one stockholder.
The Company has never declared a cash dividend on its New Common Stock (or its Old Common Stock) and has no plans of doing so now or in the foreseeable future. Additionally, the New Loan Agreement prohibits the payment of dividends on our New Common Stock. Subject to that limitation in the New Loan Agreement, the declaration of dividends on the New Common Stock, if any, in the future would be subject to the discretion of our Board, which may consider factors such as our results of operations, financial condition, capital needs, liquidity, and acquisition strategy, among other factors.
Item 6. | Selected Financial Data |
Not applicable.
21
Item 7. | Management’s Discussion and Analysis of Financial Condition and Results of Operations |
The following discussion and analysis of our financial condition and results of operations should be read in conjunction with the accompanying Item 8. Consolidated Financial Statements and related notes included elsewhere in this Annual Report on Form 10-K. This discussion and analysis contains forward-looking statements within the meaning of the federal securities laws, including statements using terminology such as “anticipate,” “believe,” “continue,” “could,” “estimate,” “expect,” “intend,” “may,” “plan,” “potential,” “predict,” “project” or “should” or other comparable words or the negative of these words. Forward-looking statements involve various risks and uncertainties. Any forward-looking statements made by or on our behalf are made pursuant to the safe harbor provisions of the Private Securities Litigation Reform Act of 1995. Readers are cautioned that such forward-looking statements involve risks and uncertainties in that the actual results may differ materially from those projected in the forward-looking statements. Important factors that could cause actual results to differ include risks set forth in “Part I-Item 1A. Risk Factors” beginning on page 10 herein.
Overview
FES Ltd. is an independent oilfield services contractor that provides well site services to oil and natural gas drilling and producing companies to help develop and enhance the production of oil and natural gas. These services include fluid hauling, fluid disposal, well maintenance, completion services, workovers and recompletions, plugging and abandonment, and tubing testing. Our operations are concentrated in the major onshore oil and natural gas producing regions of Texas, with an additional location in Pennsylvania.
Market Conditions
The oil and natural gas industry has experienced a significant decline in oil exploration and production activity that began in the fourth quarter of 2014 and continued into the first half of 2017. The price of West Texas Intermediate (“WTI”) oil fell from a price of $104 per barrel as of June 30, 2014 to a low of $30 per barrel in February of 2016. Oil prices traded in a range of approximately $45 to $55 in the last half of 2016 and through most of 2017. During the last half of 2017 oil pricing trended upward in response to market conditions, and as of December 31, 2017, the price of WTI was approximately $58 per barrel. As oil prices began to rise, U.S. drilling rig count increased by 525 from May 2016 to December 2017, with the count stabilizing in the last half of 2017. During this same time period Texas drilling rig count increased by 280 rigs, similar to the U.S. count increases. The two basins in which we operate, the Eagle Ford and Permian, had rig count increases of 41 and 261, respectively, during this eighteen month period. Of note, while we are actively pursuing additional business in the Permian, currently 66.7% of our revenues are generated in the Eagle Ford where the rig count increased by 41.
Below are three charts that provide total U.S. rig counts, total Texas rig counts and WTI oil price trends for the twelve months ended December 31, 2017 and 2016.
22
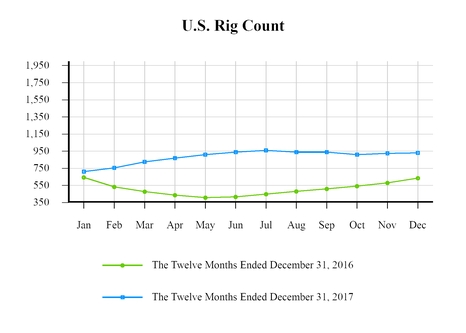
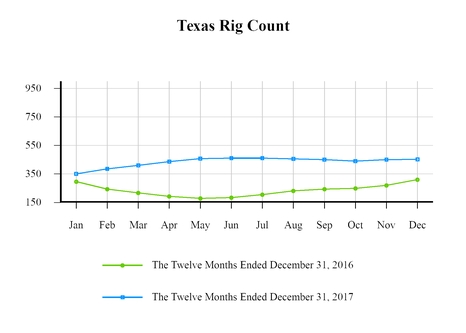
Source: Rig counts are per Baker Hughes, Inc. (www.bakerhughes.com). Rig counts are the averages of the weekly rig count activity.
23
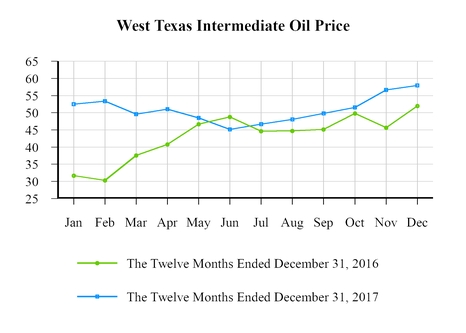
Impact of the Current Environment
The declines in oil and natural gas prices and exploration activities that began in 2014 and continued through the first half of 2017 created a challenging market for the provision of our services. In response to the market conditions in 2015 and 2016, we implemented cost reduction measures and continue to analyze cost reduction opportunities today while ensuring that appropriate functions and capacity are preserved to allow us to be opportunistic in the current environment. During the second half of 2017 market conditions improved.
Although market conditions are improving, we continue to focus on meeting our customers' expectations and adjusting our cost structure where possible. We are also maintaining our focus on maximizing use of our active operating assets, and maintaining cost controls that were established in the prior twenty four months.
Factors Affecting Results of Operations
Oil and Natural Gas Prices
Demand for well servicing and fluid logistics services is generally a function of the willingness of oil and natural gas companies to make operating and capital expenditures to explore for, develop, and produce oil and natural gas, which in turn is affected by current and anticipated levels of oil and natural gas prices. Exploration and production spending is generally categorized as either operating expenditures or capital expenditures. Activities by oil and natural gas companies designed to add oil and natural gas reserves are classified as capital expenditures, and those associated with maintaining or accelerating production, such as workover and fluid logistics services, are categorized as operating expenditures. Operating expenditures are typically more stable than capital expenditures and may be less sensitive to oil and natural gas price volatility. In contrast, capital expenditures for drilling are more directly influenced by current and expected oil and natural gas prices and generally reflect the volatility of commodity prices.
Workover Rig Rates
Our well servicing segment revenues are dependent on the prevailing market rates for workover rigs. For the year ended December 31, 2017, utilization and rates increased 23.9% and 8.6%, respectively as a result of increasing oil and natural gas prices. In comparison, for the year ended December 31, 2016 both utilization and rates dropped 22.1% and 20.0% respectively, due to the market decline. Oil and natural gas prices dropped significantly in 2015 and subsequently, our customers began requesting rate reductions, which we began implementing in 2015 and into 2016. During 2017, we regained a portion of utilization and the pricing that declined in 2015 and 2016.
Fluid Logistics Rates
Our fluid logistics segment revenues are dependent on the prevailing market rates for fluid transport trucks and the related assets, including specialized vacuum, high-pressure pump and tank trucks, hot oil trucks, frac tanks, fluid mixing tanks, and salt water disposal wells. We use our fluid transport truck rates as a key indicator of our fluid logistics environment. During 2017 our fluid transport truck rates increased approximately 33.6% as compared to 2016 and hours decreased approximately 6.1%. Rates are still below those of 2014 and 2015.
24
Operating Expenses
During 2017, although consolidated operating expenses increased in total, they decreased as a percentage of revenues (noted under 'Results of Operations' below) as competitive pressures continued. The expense decline was primarily driven by reductions in headcount, along with other cost reduction measures. We continue to focus on managing our overall cost structure as well as on efforts to maintain or increase rates to customers.
Seasonality and Cyclical Trends
Our operations are impacted by seasonal factors. Historically, our business has been negatively impacted during the winter months due to inclement weather, fewer daylight hours, and holidays. We typically experience a significant slowdown during the Thanksgiving and Christmas holiday seasons. Our well servicing rigs are mobile and we operate a significant number of oilfield vehicles. During periods of heavy snow, ice or rain, we may not be able to move our equipment between locations, thereby reducing our ability to generate rig or truck hours. In addition, the majority of our well servicing rigs work only during daylight hours. In the winter months, as daylight time becomes shorter, the amount of time that the well servicing rigs work is shortened, having a negative impact on total hours worked.
In addition, the oil and natural gas industry has traditionally been volatile and is influenced by a combination of long-term, short-term and cyclical trends, including the domestic and international supply and demand for oil and natural gas, current and expected future prices for oil and natural gas and the perceived stability and sustainability of those prices. Such cyclical trends also include the resultant levels of cash flows generated and allocated by exploration and production companies to their drilling, completion and workover budget.
Results of Operations
The following tables compare the operating results of our segments for the period April 13 through December 31, 2017 (Successor), the period January 1 through April 12, 2017 (Predecessor) and the year ended December 31, 2016 (Predecessor) (in thousands, except percentages). Segment profit excludes general and administrative expenses, depreciation and amortization and impairment.
25
Revenues | |||||||||||||||||||
Successor | Predecessor | ||||||||||||||||||
April 13 through December 31, 2017 | % of revenue | January 1 through April 12, 2017 | % of revenue | Year ended December 31, 2016 | % of revenue | ||||||||||||||
Well Servicing | $ | 63,916 | 66.2 | % | $ | 19,554 | 63.6 | % | $ | 70,921 | 61.0 | % | |||||||
Fluid Logistics | 32,565 | 33.8 | % | 11,211 | 36.4 | % | 45,284 | 39.0 | % | ||||||||||
Total | $ | 96,481 | $ | 30,765 | $ | 116,205 | |||||||||||||
Direct Operating Expenses(1) | |||||||||||||||||||
Successor | Predecessor | ||||||||||||||||||
April 13 through December 31, 2017 | % of segment revenue | January 1 through April 12, 2017 | % of segment revenue | Year ended December 31, 2016 | % of segment revenue | ||||||||||||||
Well Servicing | $ | 49,152 | 76.9 | % | $ | 15,952 | 81.6 | % | $ | 61,279 | 86.4 | % | |||||||
Fluid Logistics | 31,083 | 95.4 | % | 11,207 | 100.0 | % | 42,744 | 94.4 | % | ||||||||||
Total | $ | 80,235 | $ | 27,159 | $ | 104,023 | |||||||||||||
Segment Profit (1) | |||||||||||||||||||
Successor | Predecessor | ||||||||||||||||||
April 13 through December 31, 2017 | Gross margin % | January 1 through April 12, 2017 | Gross margin % | Year ended December 31, 2016 | Gross margin % | ||||||||||||||
Well Servicing | $ | 14,764 | 23.1 | % | $ | 3,602 | 18.4 | % | $ | 9,642 | 13.6 | % | |||||||
Fluid Logistics | 1,482 | 4.6 | % | 4 | — | % | 2,540 | (2) | 5.6 | % | |||||||||
Total | $ | 16,246 | 16.8 | % | $ | 3,606 | 11.7 | % | $ | 12,182 | 10.5 | % | |||||||
(1) Excluding general and administrative expenses, depreciation and amortization, and impairment of assets. | |||||||||||||||||||
(2) Excluding impairment of assets of $14.5 million. | |||||||||||||||||||
Revenues
Consolidated Revenues. Consolidated revenues during the period April 13 through December 31, 2017 (Successor) and the period January 1 through April 12, 2017 (Predecessor) increased as compared to the year ended December 31, 2016 (Predecessor). This was a direct result of increased spending by our customers during this period due to increased activity and rising oil and natural gas prices.
Well Servicing. Revenues from our well servicing segment during the period April 13 through December 31, 2017 (Successor) and the period January 1 through April 12, 2017 (Predecessor) increased as compared to the year ended December 31, 2016 (Predecessor) due to a 23.9% increase in rig hours offset, in part, by a 5.2% decline in rates.
Fluid Logistics. Revenues from our fluid logistics segment during the period April 13 through December 31, 2017 (Successor) and the period January 1 through April 12, 2017 (Predecessor) decreased as compared to the year ended December 31, 2016 (Predecessor) due to price concessions with existing customers and non-renewal and release of frac tank rentals primarily in the first half of the year. The decrease was offset, in part, by a slight increase in truck hours for the year.
26
Segment Profit
Well Servicing. Segment profit from our well servicing segment during the period April 13 through December 31, 2017 (Successor) and the period January 1 through April 12, 2017 (Predecessor) increased as compared to the year ended December 31, 2016 (Predecessor) due to both an increase in revenues and a decrease in expenses as a percentage of revenues. Contributing factors included an increase in rig hours as well as a decrease in equipment lease and insurance expense.
Fluid Logistics. Segment profit from our fluid logistics segment during the period April 13 through December 31, 2017 (Successor) and the period January 1 through April 12, 2017 (Predecessor) decreased as compared to the year ended December 31, 2016 (Predecessor) due to a decrease in revenue and the direct operating cost as a percentage of revenue decreasing at a slower pace.
Operating Expenses
The following tables compares our operating expenses for the period April 13 through December 31, 2017 (Successor), the period January 1 through April 12, 2017 (Predecessor) and the year ended December 31, 2016 (Predecessor) (in thousands, except percentages).
Successor | Predecessor | |||||||||||
April 13 through December 31, 2017 | January 1 through April 12, 2017 | Year ended December 31, 2016 | ||||||||||
Well servicing direct operating expenses | $ | 49,152 | $ | 15,952 | $ | 61,279 | ||||||
Fluid logistics direct operating expenses | 31,083 | 11,207 | 42,744 | |||||||||
General and administrative | 14,229 | 5,012 | 18,832 | |||||||||
Depreciation and amortization | 20,051 | 13,601 | 52,374 | |||||||||
Loss on impairment of assets | — | — | 14,537 | |||||||||
Restructuring costs | — | — | 7,548 | |||||||||
Total expenses | $ | 114,515 | $ | 45,772 | $ | 197,314 | ||||||
Well Servicing Direct Operating Expenses. Direct operating expenses for our well servicing segment for the period April 13 through December 31, 2017 (Successor) and the period January 1 through April 12, 2017 (Predecessor) increased as compared to the year ended December 31, 2016 (Predecessor), but decreased as a percentage of revenues. Well servicing expenses as a percentage of well servicing revenues were 76.9% and 81.6% for the period April 13 through December 31, 2017 (Successor) and the period January 1 through April 12, 2017 (Predecessor), respectively, compared to 86.4% for the year ended December 31, 2016 (Predecessor). The decrease was due in part to a decrease in lease expense resulting from equipment and truck operating leases reaching term, or being returned before reaching term, a decrease in insurance expense, as well as a decrease in bad debt expense.
Fluid Logistics Direct Operating Expenses. Direct operating expenses for our fluid logistics segment for the period April 13 through December 31, 2017 (Successor) and the period January 1 through April 12, 2017 (Predecessor) decreased as compared to the year ended December 31, 2016 (Predecessor) due to a decrease in lease expense resulting from leases reaching term, or being returned before reaching term, and decreases in insurance costs. Fluid logistics expenses as a percentage of fluid logistics revenues were 95.4% and 100.0% for the period April 13 through December 31, 2017 (Successor) and the period January 1 through April 12, 2017 (Predecessor), respectively, compared to 94.4% for the year ended December 31, 2016 (Predecessor).
General and Administrative Expenses. General and administrative expenses as a percentage of revenues were 14.7%, 16.3% and 16.2% for the period April 13 through December 31, 2017 (Successor), the period January 1 through April 12, 2017 (Predecessor), and the year ended December 31, 2016 (Predecessor), respectively. General and administrative expenses for the period April 13 through December 31, 2017 (Successor) and the period January 1 through April 12, 2017 (Predecessor) were impacted by professional fees associated with our Chapter 11 restructuring.
Depreciation and Amortization. Depreciation and amortization expenses for the period April 13 through December 31, 2017 (Successor) and the period January 1 through April 12, 2017 (Predecessor) decreased compared to the year ended December 31, 2016 (Predecessor) due to a decrease in the depreciable value of property and equipment in the Successor period as a result of fresh start accounting.
Loss on Impairment of Assets. Loss on impairment of assets for the period April 13 through December 31, 2017 (Successor) and the period January 1 through April 12, 2017 (Predecessor) decreased as compared to the year ended December 31, 2016 (Predecessor) due to us recording an impairment loss against our intangible assets in 2016. No similar event occurred in 2017.
Restructuring Costs. Restructuring costs for the year ended December 31, 2016 (Predecessor) were due to the pre-bankruptcy activities during the period.
27
Other Income (Expense)
Successor | Predecessor | |||||||||||
April 13 through December 31, 2017 | January 1 through April 12, 2017 | Year ended December 31, 2016 | ||||||||||
Gain (loss) on reorganization items, net | $ | (1,299 | ) | $ | 44,503 | $ | — | |||||
Interest income | 11 | 13 | 31 | |||||||||
Interest expense | (6,420 | ) | (2,254 | ) | (27,879 | ) | ||||||
Other income (expense), net | $ | (7,708 | ) | $ | 42,262 | $ | (27,848 | ) | ||||
Income tax expense | $ | 243 | $ | 27 | $ | 172 | ||||||
Reorganization Items, net. Reorganization items, net was a loss of $1.3 million for the period April 13 through December 31, 2017 (Successor) and a gain of $44.5 million for the period January 1 through April 12, 2017 (Predecessor). For the period January 1 through April 12, 2017 (Predecessor), the $44.5 million gain was generated by the settlement of liabilities subject to compromise of $140.4 million, offset by the fresh start and reorganization adjustments of $87.1 million and legal and professional fees and loan costs of $8.8 million.
Interest Expense. Interest expense for the period April 13 through December 31, 2017 (Successor) and the period January 1 through April 12, 2017 (Predecessor) decreased as compared to the year ended December 31, 2016 (Predecessor) due to a reduction in interest expense on the Prior Senior Notes because such interest was no longer incurred after the date of Bankruptcy Petitions discharged in the chapter 11 cases. Interest expense on the Successor is primarily related to the debt outstanding under the New Loan Agreement with a substantially lower outstanding balance plus associated amortization of deferred financing costs than the debt that existed before the Effective Date.
Income Taxes. We recognized income tax expense of $243 thousand for the period April 13 through December 31, 2017 (Successor), compared to $27 thousand for the period January 1 through April 12, 2017 (Predecessor) and $172 thousand for the year ended December 31, 2016 (Predecessor). Our effective tax rate was (0.9)%, 0.1% and (0.2)% for the period April 13 through December 31, 2017 (Successor), the period January 1 through April 12, 2017 (Predecessor), and the year ended December 31, 2016 (Predecessor), respectively. The increase in income tax expense is primarily due to interest and penalties on uncertain tax positions recorded in 2017. We have evaluated the impact of the reorganization on our carryover tax attributes as a result of emergence from bankruptcy. We will be able to fully absorb cancellation of debt income with NOL carryforwards and other tax attributes, and as a result, our NOL carryforwards and tax credits were significantly reduced. The amount of remaining NOL carryforwards available after the cancellation of debt income may be limited under IRC Sec. 382 due to the change in control in connection with the reorganization. At December 31, 2017 (Successor), we estimate our NOL carryforwards are approximately $52.0 million. On December 22, 2017, the Tax Reform Act was signed into law. The legislation significantly changed U.S. tax law by, among other things, lowering the U.S. corporate income tax rate from a maximum of 35% to a flat 21% rate, effective January 1, 2018. As a result of the decrease in the corporate income tax rate, we revalued our ending net deferred tax assets at December 31, 2017, but did not recognize any income tax impact in 2017 due to the offsetting change in the valuation allowance.
Liquidity and Capital Resources
Historically, we have funded our operations, including capital expenditures, through our cash flow from operations, the revolving credit facility under the Prior Loan Agreement, vendor financings, and cash flow from operations, the issuance of senior notes and the proceeds from our public and private equity offerings. More recently, upon and since our emergence from chapter 11 reorganization, we have funded our operations through our New Credit Facility and other financing activities.
As of December 31, 2017 (Successor), we had $5.5 million in unrestricted cash and cash equivalents and $63.4 million in contractual debt.
Restricted cash at December 31, 2017 (Successor) and December 31, 2016 (Predecessor) was $30.0 million and $27.6 million, respectively. The components of restricted cash at December 31, 2017 primarily included $20.9 million related to the New Loan Agreement which is subject to satisfaction of certain release restrictions and $9.1 million in a cash collateral account related to letters of credit and our corporate credit card program under the New Regions Letter of Credit Facility. The release conditions for restricted cash set forth in the New Loan Agreement include, among other things, (i) no default or event of default under the New Loan Agreement having occurred or being continuing as of the date of the requested release of proceeds of the New Loan Agreement,
28
or that would exist after giving effect to the release requested to be made on such date, and (ii) our unrestricted cash and cash equivalents being less than $7.0 million after giving pro forma effect to the requested release.
The $63.4 million in contractual debt was comprised of $51.7 million for the New Loan Agreement and $5.8 million in equipment notes and $5.9 million in insurance notes related to our general liability, workers compensation and other insurance. Of our total debt, $7.6 million was classified as current portion of long-term debt, and $55.8 million was classified as long-term. We incurred $15.5 million and $0.4 million for equipment acquisitions during the period April 13 through December 31, 2017 (Successor) and the period January 1 through April 12, 2017 (Predecessor), respectively.
New Loan Agreement and Prior Loan Agreement
Forbes Energy Services LLC, or the Borrower, is the borrower under the New Loan Agreement. The Borrower’s obligations have been guaranteed by the FES Ltd. and by Texas Energy Services, LLC, C.C. Forbes, LLC and Forbes Energy International, LLC, each direct subsidiaries of the Borrower and indirect subsidiaries of FES Ltd. The New Loan Agreement provides for a term loan of $50.0 million, which was fully available on the Effective Date, subject to release restrictions. Subject to certain exceptions and permitted encumbrances, the obligations under the New Loan Agreement are secured by a first priority security interest in substantially all the assets of the Company other than cash collateralizing the New Regions Letters of Credit Facility. The New Loan Agreement has a stated maturity date of April 13, 2021. The proceeds of such term loan are only permitted to be used for (i) the payment on account of the Prior Senior Notes in an amount equal to $20.0 million; (ii) the payment of costs, expenses and fees incurred on or prior to the Effective Date in connection with the preparation, negotiation, execution and delivery of the New Loan Agreement and documents related thereto; and (iii) subject to satisfaction of certain release conditions set forth in the New Loan Agreement, for general operating, working capital and other general corporate purposes of the Borrower not otherwise prohibited by the terms of the New Loan Agreement. The release conditions set forth in the New Loan Agreement include, among other things, (i) no default or event of default under the New Loan Agreement having occurred or being continuing as of the date of the requested release of proceeds of the New Loan Agreement, or that would exist after giving effect to the release requested to be made on such date, and (ii) the Company’s unrestricted cash and cash equivalents being less than $7 million after giving pro forma effect to the requested release. At December 31, 2017, $20.9 million included in restricted cash was subject to these release restrictions.
Borrowings under the New Loan Agreement bear interest at a rate equal to five percent (5%) per annum payable quarterly in cash, or the Cash Interest Rate, plus (ii) an initial rate for paid in kind interest of seven percent (7%) commencing April 13, 2017 to be capitalized and added to the principal amount of the term loan on the first day of each quarter, or at the election of the Borrower, paid in cash. During the period April 13 through December 31, 2017 (Successor), the Company elected to pay interest in kind. The paid in kind interest increases by two percent (2%) twelve months after the Effective Date and every twelve months thereafter until maturity. Upon and after the occurrence of an event of default, the Cash Interest Rate will increase by two percentage points per annum.
The Borrower is also responsible for certain other administrative fees and expenses. In connection with the execution of the New Loan Agreement, the Borrower paid the Lenders a funding fee of $3.0 million, and paid certain Lenders a backstop fee of $2.0 million. The $20.0 million payment referred to above and these fees were funded as draws under the New Loan Agreement.
We are able to voluntarily repay the outstanding term loan at any time without premium or penalty. We are required to use the net proceeds from certain events, including but not limited to, the disposition of assets, certain judgments, indemnity payments, tax refunds, pension plan refunds, insurance awards and certain incurrences of indebtedness to repay outstanding loans under the New Loan Agreement. We may also be required to use cash in excess of $20.0 million to repay outstanding loans under the New Loan Agreement.
The New Loan Agreement includes customary negative covenants for an asset-based term loan, including covenants limiting our ability to, among other things, (i) effect mergers and consolidations, (ii) sell assets, (iii) create or suffer to exist any lien, (iv) make certain investments, (v) incur debt and (vi) transact with affiliates. In addition, the New Loan Agreement includes customary affirmative covenants for an asset-based term loan, including covenants regarding the delivery of financial statements, reports and notices to the Agent. The New Loan Agreement also contains customary representations and warranties and event of default provisions for a secured term loan.
New Regions Letters of Credit Facility
As discussed in Note 2 of the Consolidated Financial Statements, on the Effective Date, we repaid the outstanding principal balance of $15.0 million plus outstanding interest and fees under the Prior Loan Agreement, and entered into the New Regions Letters of Credit Facility to cover letters of credit and our credit card program existing on the Effective Date and pursuant to which Regions may issue, upon request by the Company, letters of credit and continue to provide charge cards for use by the Company. Amounts available under the New Regions Letters of Credit Facility are subject to customary fees and are secured by a first-priority lien on, and security interest in, a cash collateral account with Regions containing cash equal to at least (i) 105% of the sum of (a) all amounts owing for any drawings under letters of credit, including any reimbursement obligations, (b) the aggregate undrawn amount of all outstanding letters of credit, (c) all sums owing to Regions or any affiliate pursuant to any letter of credit
29
document and (d) all obligations of the Company arising thereunder, including any indemnities and obligations for reimbursement of expenses and (ii) 120% of the aggregate line of credit for charge cards issued by Regions to the Company. The fees for each letter of credit for the period from and excluding the date of issuance of such letter of credit to and including the date of expiration or termination, are equal to (x) the average daily face amount of each outstanding letter of credit multiplied by (y) a per annum rate determined by Regions from time to time in its discretion based upon such factors as Regions shall determine, including, without limitation, the credit quality and financial performance of the Company. As of December 31, 2017, the rate was 3.00%. In the event we are unable to repay amounts due under the New Regions Letters of Credit Facility, Regions could proceed against such cash collateral account. Regions has no commitment under the New Regions Letters of Credit Facility to issue letters of credit.
Cash Flows
Our cash flows depend, to a large degree, on the level of spending by oil and gas companies' development and production activities. Although the prices of oil and natural gas have increased since the decline that began in 2014 and continued into 2016, before recovering somewhat, the significant decreases in the price of oil and natural gas had a material impact on these activities, and such activities have not fully recovered. These lower levels of activities will likely also materially affect our future cash flows.
Successor | Predecessor | |||||||||||
April 13 through December 31, 2017 | January 1 through April 12, 2017 | Year Ended December 31, 2016 | ||||||||||
Net cash used in operating activities | $ | (10,856 | ) | $ | (4,254 | ) | $ | (13,918 | ) | |||
Net cash provided by (used in) investing activities | (6,313 | ) | 537 | (6,775 | ) | |||||||
Net cash provided by (used in) financing activities | 2,774 | 3,140 | (33,481 | ) | ||||||||
Net decrease in cash and cash equivalents | (14,395 | ) | (577 | ) | (54,174 | ) | ||||||
Cash and cash equivalents: | ||||||||||||
Beginning of period | 19,860 | 20,437 | 74,611 | |||||||||
End of period | $ | 5,465 | $ | 19,860 | $ | 20,437 | ||||||
Cash flows used in operating activities for the period April 13 through December 31, 2017 (Successor) and the period January 1 through April 12, 2017 (Predecessor) increased as compared to the year ended December 31, 2016 (Predecessor). The increase resulted from the effect of net income of $27.2 million for the period January 1 through April 12, 2017 (Predecessor) offset in part by a net loss of $26.0 million for the period April 13 through December 31, 2017 (Successor) as compared to a net loss of $109.1 million for the year ended December 31, 2016 (Predecessor), offset in part by an increase in accounts receivable and an increase in accounts payable.
Cash flows used in investing activities for the period April 13 through December 31, 2017 (Successor) net of cash flows provided by investing activities for the period January 1 through April 12, 2017 (Predecessor) decreased as compared to cash flows used in investing activities for the year ended December 31, 2016 (Predecessor) primarily due to an increase in the proceeds from the sale of property and equipment.
Cash flows provided by (used in) financing activities was $2.8 million, $3.1 million and $(33.5) million for the period April 13 through December 31, 2017 (Successor), the period January 1 through April 12, 2017 (Predecessor) and the year ended December 31, 2016 (Predecessor), respectively. The period January 1 through April 12, 2017 (Predecessor) included the impact of net proceeds from the New Loan Agreement, offset in part by repayment of the Prior Loan Agreement, payment of Prior Senior Notes and payment for debt issuance costs related to the New Loan Agreement. The year ended December 31, 2016 (Predecessor) included the pledging of restricted cash.
Our current and future liquidity is greatly dependent upon our operating results. Our ability to continue to meet our liquidity needs is subject to and will be affected by cash utilized in operations, the economic or business environment in which we operate, weakness in oil and natural gas industry conditions, the financial condition of our customers and vendors, and other factors. Furthermore, as a result of the challenging market conditions we continue to face, for the short term, we anticipate continued net cash used in operating activities after capital expenditures. We believe that our current reserves of cash and access to restricted cash under the New Loan Agreement are sufficient to finance our cash requirements for current and future operations, budgeted capital expenditures, debt service and other obligations for at least the next twelve months.
Capital Expenditures
Capital expenditures for the period April 13 through December 31, 2017 (Successor) and the period January 1 through April 12, 2017 (Predecessor) were additions of $15.5 million and $0.4 million, respectively. Additions to our fluid logistics segment were primarily purchases of vacuum trucks, extinguishment of operating leases for vacuum trailers and vacuum truck
30
refurbishments. Additions to our well servicing segment were primarily down payments on capital leases for light trucks and purchases of coiled tubing equipment. Capital expenditures for 2016 were comprised of additions to our fluid logistics segment of approximately $4.4 million and additions to our well servicing segment of approximately $4.3 million. Additions to our fluid logistics segment were primarily purchases of trucks and trailers, which had previously been on operating leases and were at the end of their respective terms. Additions to the well servicing segment were primarily purchases of trucks and coil tubing equipment, which had previously been on operating leases and were at the end of their respective terms.
Off-Balance Sheet Arrangements
We are often party to certain transactions that require off-balance sheet arrangements such as performance bonds, guarantees, operating leases for equipment, and bank guarantees that are not reflected in our consolidated balance sheets. These arrangements are made in our normal course of business and they are not reasonably likely to have a current or future material adverse effect on our financial condition, results of operations, liquidity, or cash flows.
Critical Accounting Policies and Estimates
The Company’s accounting policies are more fully described in Note 4 - Summary of Significant Accounting Policies
to our Consolidated Financial Statements. As disclosed in Note 4, the preparation of consolidated financial statements in conformity with generally accepted accounting principles requires management to make estimates and assumptions about future events that affect the amounts reported in the consolidated financial statements and accompanying notes. Management reviews its estimates on an ongoing basis using currently available information. Changes in facts and circumstances may result in revised estimates, and actual results could differ from those estimates
to our Consolidated Financial Statements. As disclosed in Note 4, the preparation of consolidated financial statements in conformity with generally accepted accounting principles requires management to make estimates and assumptions about future events that affect the amounts reported in the consolidated financial statements and accompanying notes. Management reviews its estimates on an ongoing basis using currently available information. Changes in facts and circumstances may result in revised estimates, and actual results could differ from those estimates
The Company believes that the following discussion addresses the Company’s most critical accounting policies, which are those that are most important to the portrayal of the Company’s financial condition and results of operations and require management’s most difficult, subjective and complex judgments.
Fresh Start Accounting
As discussed in Note 2 - Chapter 11 Proceedings of our Consolidated Financial Statements, the Company applied fresh start accounting upon emergence from bankruptcy. Under fresh start accounting, assets and liabilities are remeasured at their respective fair values. See further discussion of the method and assumptions used to determine fair value of Successor assets in Note 2 to the Consolidated Financial Statements.
Estimated Depreciable Lives
A substantial portion of our total assets is comprised of equipment, which totaled $117.2 million, representing 58.0% of total assets at December 31, 2017 (Successor). Depreciation expense totaled $19.2 million and $13.4 million, which represented 16.8% and 29.3% of total operating expenses for the period April 13 through December 31, 2017 (Successor) and January 1 through April 12, 2017 (Predecessor), respectively. Given the significance of equipment to our financial statements, the determination of an asset’s economic useful life is considered to be a critical accounting estimate. Each asset included in equipment is recorded at cost and depreciated using the straight-line method over the asset’s estimated economic useful life. The estimated economic useful life is monitored by management to determine its continued appropriateness.
Long-Lived Assets
The Company makes judgments and estimates regarding the carrying value of its long-lived assets, including amounts to be capitalized, estimated useful lives, depreciation and amortization methods to be applied, and possible impairment. The Company evaluates its long-lived assets whenever events and changes in circumstances indicate the carrying amount of its net assets may not be recoverable due to various external or internal factors. When an indicator of possible impairment exists, the Company uses estimated future undiscounted cash flows to assess recoverability of its long-lived assets. These cash flow projections require the Company to make judgments regarding long-term forecasts of future revenue and costs related to the assets subject to review. These forecasts include assumptions related to the rates the Company bills its customers, equipment utilization, equipment additions, staffing levels, pay rates, and other expenses. These forecasts also require assumptions about demand for the Company's products and services, future market conditions, and technological developments.
We recognized an impairment loss of $14.5 million during the year ended December 31, 2016 (Predecessor). See Note 5 - Intangible Assets of our Consolidated Financial Statements for further discussion of method used to measure the fair values of the long-lived assets.
Volatility in the oil and natural gas industry, which is driven by factors over which the Company has no control, could affect the fair market value of the Company's equipment fleet and cause the Company to conclude at a future date that additional impairment is evident and may trigger a write-down of the Company's assets for accounting purposes, which could have a material adverse impact on the Company's financial position and results of operations.
31
Allowance for Doubtful Accounts
The determination of the collectability of amounts due from our customers requires us to use estimates and make judgments regarding future events and trends, including monitoring our customers’ payment history and current credit worthiness to determine that collectability is reasonably assured, as well as consideration of the overall business climate in which our customers operate. Inherently, these uncertainties require us to make frequent judgments and estimates regarding our customers’ ability to pay amounts due to us in order to determine the appropriate amount of valuation allowances required for doubtful accounts.
Income Taxes
Current and deferred net tax liabilities are recorded in accordance with enacted tax laws and rates. Valuation allowances are established to reduce deferred tax assets when it is more likely than not that some portion or all of the deferred tax assets will not be realized. In determining the need for valuation allowances, we have considered and made judgments and estimates regarding estimated future taxable income and ongoing prudent and feasible tax planning strategies. These estimates and judgments include some degree of uncertainty and changes in these estimates and assumptions could require us to adjust the valuation allowances for our deferred tax assets. The existence of reversing taxable temporary differences supports the recognition by the Company of deferred tax assets. In the event that the Company's federal deferred tax assets exceed the Company's reversing taxable temporary differences, it is not more likely than not that those deferred tax assets would be realized due to the Company's lack of earnings history. The Company maintains a full valuation allowance for its deferred tax assets.
Litigation and Self-Insurance
The Company is self-insured under its Employee Group Medical Plan for the first $150 thousand per individual. The Company is self-insured with a retention for the first $250 thousand in general liability. The Company has an additional premium payable clause under its lead $10.0 million limit excess policy that states in the event losses exceed $1.0 million, a loss additional premium of up to 15% of paid losses in excess of $1.0 million will be due. The loss additional premium is payable at the time when the loss is paid and will be payable over a period agreed by insurers. We maintain accruals in our consolidated balance sheets related to self-insurance retentions by using third-party actuarial data and claims history.
We estimate our reserves related to litigation and self-insured risk based on the facts and circumstances specific to the litigation and self-insured risk claims and our past experience with similar claims. The actual outcome of litigation and insured claims could differ significantly from estimated amounts. These accruals are based on a third-party analysis developed using historical data to project future losses. Loss estimates in the calculation of these accruals are adjusted based upon reported claims and actual claim settlements.
Recently Issued Accounting Pronouncements
In May 2014, the FASB issued ASU No. 2014-09, creating a new topic, FASB ASC Topic 606, “Revenue from Contracts with Customers, which supersedes revenue recognition requirements in FASB ASC Topic 605, "Revenue Recognition." This ASU provides guidance that an entity should recognize revenue to depict the transfer of promised goods or services to customers in an amount that reflects the consideration to which the entity expects to be entitled in exchange for those goods and services. In addition, an entity is required to disclose sufficient information to enable users of financial statements to understand the nature, amount, timing and uncertainty of revenue and cash flows arising from contracts with customers. The standard is effective for interim and annual periods beginning after December 15, 2017. The Company adopted the new standard on January 1, 2018 using the modified retrospective application method. The majority of the Company’s contracts with customers in both the
well servicing and fluid logistics segments are short-term in nature and are recognized as “over-time” performance obligations as the services are performed. For most contracts, the Company expects to utilize the “as-invoiced” practical expedient as the amount of consideration the Company has a right to invoice corresponds directly with the value of the Company’s performance to date. The Company has determined that there are no material differences in its existing revenue recognition methods that require modification under the new standard, and it did not record a material cumulative effect adjustment upon adoption of the new standard. The Company continues to evaluate the disclosure requirements as a result of the provisions of this ASU.
In November 2016, Financial Accounting Standards Board, or the FASB, issued ASU No. 2016-18, "Statement of Cash Flows (Topic 230), Restricted Cash," ("ASU 2016-18"). ASU 2016-18 provides guidance on the presentation of restricted cash and restricted cash equivalents in the statement of cash flows. Restricted cash and restricted cash equivalents should be included with cash and cash equivalents when reconciling the beginning-of-period and end-of-period amounts shown on the statement of cash flows. The Company adopted this pronouncement as of January 1, 2018 using a retrospective transition method and expects the only impact to be the presentation of the statement of cash flows for restricted cash.
In February 2016, the FASB issued ASU No. 2016-02, "Leases (Topic 842)" ("ASU 2016-02"), which increases the transparency and comparability about leases among entities. The new guidance requires lessees to recognize a lease liability and a corresponding lease asset for operating leases with lease terms greater than 12 months. It also requires additional disclosures about leasing arrangements to help users of financial statements better understand the amount, timing, and uncertainty of cash
32
flows arising from leases. ASU 2016-02 becomes effective for interim and annual periods beginning after December 15, 2018, and requires a modified retrospective approach to adoption. Early adoption is permitted. The Company plans to engage a third party to assist in evaluating the impact of this new standard on its consolidated financial statements and related disclosures.
Item 7A. | Quantitative and Qualitative Disclosures About Market Risk |
Not applicable.
33
Item 8. | Consolidated Financial Statements |
Index to Financial Statements
Forbes Energy Services Ltd. and Subsidiaries
Consolidated Financial Statements
34
Report of Independent Registered Public Accounting Firm
Board of Directors and Stockholders
Forbes Energy Services, Ltd.
Alice, Texas
Opinion on the Consolidated Financial Statements
We have audited the accompanying consolidated balance sheets of Forbes Energy Services, Ltd. (the “Company”) and subsidiaries as of December 31, 2017 (Successor) and 2016 (Predecessor), the related consolidated statements of operations, stockholders’ equity (deficit), and cash flows for the periods from April 13, 2017 to December 31, 2017 (Successor) and from January 1, 2017 through April 12, 2017 (Predecessor) and for the year ended December 31, 2016 (Predecessor), and the related notes (collectively referred to as the “consolidated financial statements”). In our opinion, the consolidated financial statements present fairly, in all material respects, the financial position of the Company and subsidiaries at December 31, 2017 (Successor) and 2016 (Predecessor), and the results of their operations and their cash flows for the periods from April 13, 2017 to December 31, 2017 (Successor) and from January 1, 2017 through April 12, 2017 (Predecessor) and for the year ended December 31, 2016 (Predecessor), in conformity with accounting principles generally accepted in the United States of America.
Change in Basis of Accounting
As discussed in Note 2 to the consolidated financial statements, upon emerging from bankruptcy proceedings on April 13, 2017, the Company became a new entity for financial reporting purposes and applied fresh-start accounting. The Company’s assets and liabilities were recorded at their estimated fair values, which differed materially from the previously recorded amounts. As a result, the consolidated financial statements for the period following the application of fresh-start accounting are not comparable to the financial statements for previous periods.
Basis for Opinion
These consolidated financial statements are the responsibility of the Company’s management. Our responsibility is to express an opinion on the Company’s consolidated financial statements based on our audits. We are a public accounting firm registered with the Public Company Accounting Oversight Board (United States) (“PCAOB”) and are required to be independent with respect to the Company in accordance with the U.S. federal securities laws and the applicable rules and regulations of the Securities and Exchange Commission and the PCAOB.
We conducted our audits in accordance with the standards of the PCAOB. Those standards require that we plan and perform the audit to obtain reasonable assurance about whether the consolidated financial statements are free of material misstatement, whether due to error or fraud. The Company is not required to have, nor were we engaged to perform, an audit of its internal control over financial reporting. As part of our audits we are required to obtain an understanding of internal control over financial reporting but not for the purpose of expressing an opinion on the effectiveness of the Company’s internal control over financial reporting. Accordingly, we express no such opinion.
Our audits included performing procedures to assess the risks of material misstatement of the consolidated financial statements, whether due to error or fraud, and performing procedures that respond to those risks. Such procedures included examining, on a test basis, evidence regarding the amounts and disclosures in the consolidated financial statements. Our audits also included evaluating the accounting principles used and significant estimates made by management, as well as evaluating the overall presentation of the consolidated financial statements. We believe that our audits provide a reasonable basis for our opinion.
/s/ BDO USA, LLP
We have served as the Company's auditor since 2009.
Austin, Texas
April 2, 2018
35
Forbes Energy Services Ltd. and Subsidiaries
Consolidated Balance Sheets
(in thousands, except par value amounts)
Successor | Predecessor | |||||||
December 31, 2017 | December 31, 2016 | |||||||
Assets | ||||||||
Current assets | ||||||||
Cash and cash equivalents | $ | 5,465 | $ | 20,437 | ||||
Cash - restricted | 30,015 | 27,563 | ||||||
Accounts receivable - trade, net | 24,341 | 16,962 | ||||||
Accounts receivable - other | 496 | 290 | ||||||
Prepaid expenses and other current assets | 11,212 | 8,778 | ||||||
Total current assets | 71,529 | 74,030 | ||||||
Property and equipment, net | 117,191 | 233,362 | ||||||
Intangible assets, net | 11,852 | 3,220 | ||||||
Other assets | 1,185 | 2,269 | ||||||
Total assets | $ | 201,757 | $ | 312,881 | ||||
Liabilities, Temporary Equity and Stockholders’ Equity (Deficit) | ||||||||
Current liabilities | ||||||||
Accounts payable - trade | $ | 7,497 | $ | 4,505 | ||||
Accounts payable - related parties | 11 | 18 | ||||||
Accrued interest payable | 998 | 26,578 | ||||||
Accrued expenses | 11,084 | 8,740 | ||||||
Current portion of long-term debt | 7,566 | 298,932 | ||||||
Total current liabilities | 27,156 | 338,773 | ||||||
Long-term debt, net of current portion and issuance costs | 51,288 | 240 | ||||||
Deferred tax liability | 379 | 1,096 | ||||||
Total liabilities | 78,823 | 340,109 | ||||||
Commitments and contingencies (Note 11) | ||||||||
Temporary equity | ||||||||
Predecessor Series B senior convertible preferred shares, 588 shares outstanding at December 31, 2016 | — | 15,298 | ||||||
Stockholders’ equity (deficit) | ||||||||
Predecessor common stock, $0.04 par value, 112,500 shares authorized, 22,215 shares issued and outstanding at December 31, 2016 | — | 889 | ||||||
Predecessor additional paid-in capital | — | 193,477 | ||||||
Successor common stock, $0.01 par value, 40,000 shares authorized, 5,336 shares issued and outstanding at December 31, 2017 | 53 | |||||||
Successor additional paid-in capital | 148,866 | |||||||
Accumulated deficit | (25,985 | ) | (236,892 | ) | ||||
Total stockholders’ equity (deficit) | 122,934 | (42,526 | ) | |||||
Total liabilities, temporary equity and stockholders’ equity | $ | 201,757 | $ | 312,881 | ||||
The accompanying notes are an integral part of these consolidated financial statements.
36
Forbes Energy Services Ltd. and Subsidiaries
Consolidated Statements of Operations
(in thousands except, per share amounts)
Successor | Predecessor | |||||||||||
April 13 through December 31, 2017 | January 1 through April 12, 2017 | Year Ended December 31, 2016 | ||||||||||
Revenues | ||||||||||||
Well servicing | $ | 63,916 | $ | 19,554 | $ | 70,921 | ||||||
Fluid logistics | 32,565 | 11,211 | 45,284 | |||||||||
Total revenues | 96,481 | 30,765 | 116,205 | |||||||||
Expenses | ||||||||||||
Well servicing | 49,152 | 15,952 | 61,279 | |||||||||
Fluid logistics | 31,083 | 11,207 | 42,744 | |||||||||
General and administrative | 14,229 | 5,012 | 18,832 | |||||||||
Depreciation and amortization | 20,051 | 13,601 | 52,374 | |||||||||
Loss on impairment of assets | — | — | 14,537 | |||||||||
Restructuring costs | — | — | 7,548 | |||||||||
Total expenses | 114,515 | 45,772 | 197,314 | |||||||||
Operating loss | (18,034 | ) | (15,007 | ) | (81,109 | ) | ||||||
Other income (expense) | ||||||||||||
Interest income | 11 | 13 | 31 | |||||||||
Interest expense | (6,420 | ) | (2,254 | ) | (27,879 | ) | ||||||
Reorganization items, net | (1,299 | ) | 44,503 | — | ||||||||
Pre-tax income (loss) | (25,742 | ) | 27,255 | (108,957 | ) | |||||||
Income tax expense | 243 | 27 | 172 | |||||||||
Net income (loss) | (25,985 | ) | 27,228 | (109,129 | ) | |||||||
Preferred stock dividends | — | (46 | ) | (776 | ) | |||||||
Net income (loss) attributable to common stockholders | $ | (25,985 | ) | $ | 27,182 | $ | (109,905 | ) | ||||
Income (loss) per share of common stock | ||||||||||||
Basic and diluted | $ | (4.91 | ) | $ | 0.99 | $ | (4.95 | ) | ||||
Weighted average number of shares of common stock outstanding | ||||||||||||
Basic and diluted | 5,288 | 27,508 | 22,214 | |||||||||
The accompanying notes are an integral part of these consolidated financial statements.
37
Forbes Energy Services Ltd. and Subsidiaries
Consolidated Statements of Changes in Stockholders’ Equity (Deficit)
(in thousands)
Temporary Equity | Permanent Equity | ||||||||||||||||||||||||
Preferred Stock | Common Stock | Additional Paid-In Capital | Accumulated Deficit | Total Stockholders’ Equity (Deficit) | |||||||||||||||||||||
Shares | Amount | Shares | Amount | ||||||||||||||||||||||
Predecessor | |||||||||||||||||||||||||
Balance at January 1, 2016 | 588 | $ | 14,644 | 22,210 | $ | 889 | $ | 194,253 | $ | (127,763 | ) | $ | 67,379 | ||||||||||||
Net loss | — | — | — | — | — | (109,129 | ) | (109,129 | ) | ||||||||||||||||
Issuance of restricted stock | — | — | 5 | — | — | — | — | ||||||||||||||||||
Preferred shares dividends and accretion | — | 654 | — | — | (776 | ) | — | (776 | ) | ||||||||||||||||
Balance at December 31, 2016 | 588 | $ | 15,298 | 22,215 | $ | 889 | $ | 193,477 | $ | (236,892 | ) | $ | (42,526 | ) | |||||||||||
Net income, January 1, 2017 - April 12, 2017 | — | — | — | — | — | 27,228 | 27,228 | ||||||||||||||||||
Preferred stock dividends and accretion | — | 46 | — | — | (46 | ) | — | (46 | ) | ||||||||||||||||
Balance at April 12, 2017 | 588 | 15,344 | 22,215 | 889 | 193,431 | (209,664 | ) | (15,344 | ) | ||||||||||||||||
Cancellation of temporary equity and predecessor permanent equity | (588 | ) | (15,344 | ) | (22,215 | ) | (889 | ) | (193,431 | ) | 209,664 | 15,344 | |||||||||||||
Balance at April 12, 2017 | — | $ | — | — | $ | — | $ | — | $ | — | $ | — | |||||||||||||
Successor | |||||||||||||||||||||||||
Issuance of Successor common stock | 5,250 | $ | 53 | $ | 147,578 | $ | — | $ | 147,631 | ||||||||||||||||
Share-based compensation | 86 | — | 1,288 | — | 1,288 | ||||||||||||||||||||
Net loss, April 13, 2017 - December 31, 2017 | — | — | — | (25,985 | ) | (25,985 | ) | ||||||||||||||||||
Balance at December 31, 2017 | 5,336 | $ | 53 | $ | 148,866 | $ | (25,985 | ) | $ | 122,934 | |||||||||||||||
The accompanying notes are an integral part of these consolidated financial statements.
38
Forbes Energy Services Ltd. and Subsidiaries
Consolidated Statements of Cash Flows
(in thousands)
Successor | Predecessor | |||||||||||
April 13 through December 31, 2017 | January 1 through April 12, 2017 | Year Ended December 31, 2016 | ||||||||||
Cash flows from operating activities: | ||||||||||||
Net income (loss) | $ | (25,985 | ) | $ | 27,228 | $ | (109,129 | ) | ||||
Adjustments to reconcile net income (loss) to net cash by used in operating activities: | ||||||||||||
Depreciation and amortization | 20,051 | 13,601 | 52,374 | |||||||||
Share-based compensation | 1,288 | — | (298 | ) | ||||||||
Reorganization items (non-cash) | — | (51,166 | ) | — | ||||||||
Deferred tax (benefit) expense | 15 | (47 | ) | 197 | ||||||||
Gain on disposal of assets | (187 | ) | (950 | ) | (449 | ) | ||||||
Impairment of assets | — | — | 14,537 | |||||||||
Bad debt expense | 46 | 1 | 2,230 | |||||||||
Amortization of debt discount | 473 | 234 | 1,260 | |||||||||
Interest paid in kind | 1,677 | — | — | |||||||||
Changes in operating assets and liabilities: | ||||||||||||
Accounts receivable | (6,716 | ) | (916 | ) | 8,220 | |||||||
Prepaid expenses and other assets | 157 | (748 | ) | (2,099 | ) | |||||||
Accounts payable - trade | (4,566 | ) | 6,608 | (4,274 | ) | |||||||
Accounts payable - related parties | (9 | ) | 2 | 10 | ||||||||
Dividends payable | — | — | (61 | ) | ||||||||
Accrued expenses | 1,902 | 324 | (1,613 | ) | ||||||||
Accrued interest payable | 998 | 1,575 | 25,177 | |||||||||
Net cash used in operating activities | (10,856 | ) | (4,254 | ) | (13,918 | ) | ||||||
Cash flows from investing activities: | ||||||||||||
Purchases of property and equipment | (8,521 | ) | (400 | ) | (8,917 | ) | ||||||
Proceeds from sale of property and equipment | 2,208 | 937 | 2,142 | |||||||||
Net cash provided by (used in) investing activities | (6,313 | ) | 537 | (6,775 | ) | |||||||
Cash flows from financing activities: | ||||||||||||
Change in restricted cash | 3,964 | (6,416 | ) | (27,512 | ) | |||||||
Payments for capital leases | (1,190 | ) | (444 | ) | (5,722 | ) | ||||||
Payments for debt issuance costs | — | (5,000 | ) | — | ||||||||
Payment of Prior Senior Notes | — | (20,000 | ) | — | ||||||||
Repayment of Prior Loan Agreement | — | (15,000 | ) | — | ||||||||
Proceeds from New Loan Agreement | — | 50,000 | — | |||||||||
Payment of tax withholding obligations related to restricted stock | — | — | (124 | ) | ||||||||
Dividends paid on Predecessor Series B senior convertible preferred shares | — | — | (123 | ) | ||||||||
Net cash provided by (used in) financing activities | 2,774 | 3,140 | (33,481 | ) | ||||||||
Net decrease in cash and cash equivalents | (14,395 | ) | (577 | ) | (54,174 | ) | ||||||
Cash and cash equivalents: | ||||||||||||
Beginning of period | 19,860 | 20,437 | 74,611 | |||||||||
End of period | $ | 5,465 | $ | 19,860 | $ | 20,437 | ||||||
The accompanying notes are an integral part of these consolidated financial statements.
39
Forbes Energy Services Ltd. and Subsidiaries
Notes to Consolidated Financial Statements
1. Organization and Nature of Operations
Nature of Business
Forbes Energy Services Ltd., or FES Ltd., is an independent oilfield services contractor that provides well site services to oil and natural gas drilling and producing companies to help develop and enhance the production of oil and natural gas. These services include fluid hauling, fluid disposal, well maintenance, completion services, workovers and recompletions, plugging and abandonment, and tubing testing. The Company's operations are concentrated in the major onshore oil and natural gas producing regions of Texas, with an additional location in Pennsylvania. The Company believes that its broad range of services, which extends from initial drilling, through production, to eventual abandonment, is fundamental to establishing and maintaining the flow of oil and natural gas throughout the life cycle of our customers’ wells. The Company's headquarters and executive offices are located at 3000 South Business Highway 281, Alice, Texas 78332. The Company can be reached at (361) 664-0549.
As used in these consolidated financial statements, the “Company”, “we” and “our” mean FES Ltd. and its subsidiaries, except as otherwise indicated.
As discussed in Note 2 - Chapter 11 Proceedings, the Company applied fresh start accounting upon emergence from bankruptcy on the Effective Date. As a result of fresh start accounting, our consolidated financial statements from and after April 13, 2017 are not comparable to our financial statements prior to such date.
2. Chapter 11 Proceedings
Emergence from Chapter 11 Proceedings
On January 22, 2017, FES Ltd. and its domestic subsidiaries, or collectively, the Debtors, filed voluntary petitions, or the Bankruptcy Petitions, for reorganization under chapter 11 of the United States Bankruptcy Code, or the Bankruptcy Code, in the United States Bankruptcy Court for the Southern District of Texas-Corpus Christi Division, or the Bankruptcy Court, in accordance with the terms of a restructuring support agreement that contemplated the reorganization of the Debtors in accordance with a prepackaged plan of reorganization, as amended and supplemented, the Plan. On March 29, 2017, the Bankruptcy Court entered an order confirming the Plan. On April 13, 2017, or the Effective Date, the Plan became effective in accordance with its terms and the Debtors emerged from their chapter 11 cases. Although the Debtors are no longer debtors-in-possession, the Debtors were debtors-in-possession from January 22, 2017 through April 12, 2017. As such, certain aspects of the bankruptcy proceedings of the Debtors and related matters are described below in order to provide context and explain part of the Company's financial condition and results of operations for the periods presented.
Effect of the Bankruptcy Proceedings
During the bankruptcy proceedings, the Debtors conducted normal business activities and were authorized to pay certain vendor payments, wage payments and tax payments in the ordinary course. In addition, subject to certain specific exceptions under the Bankruptcy Code, the Bankruptcy Petitions automatically stayed most judicial or administrative actions against the Debtors or their property to recover, collect, or secure a prepetition claim. For example, the Bankruptcy Petitions prohibited lenders or note holders from pursuing claims for defaults under the Debtors’ debt agreements during the pendency of the chapter 11 cases.
The Plan
Under the Plan, which was approved by the Bankruptcy Court and became effective on the Effective Date,:
•FES Ltd. converted from a Texas corporation to a Delaware corporation;
•All previously outstanding equity interests (which included FES Ltd.’s prior common stock, par value $0.04 per share, or the Old Common Stock, FES Ltd.’s prior preferred stock, awards under FES Ltd.’s prior incentive compensation plans, or the Prior Compensation Plans, and the preferred stock purchase rights under the rights agreement dated as of May 19, 2008 as subsequently amended on July 8, 2013, or the Rights Agreement, between FES Ltd. and CIBC Mellon Trust Company, as rights agent) in FES Ltd. were extinguished without recovery;
•FES Ltd. created a new class of common stock, par value $0.01 per share, or the New Common Stock;
•Approximately $280 million in principal amount of FES Ltd.'s prior 9% senior notes due 2019, or the Prior Senior Notes, plus accrued interest of $28.1 million were canceled and each holder of the Prior Senior Notes received such holder’s pro rata share of (i) $20.0 million in cash and (ii) 100% of the New Common Stock, subject to dilution only as a result of the shares of New Common Stock issued or available for issuance in connection with a management incentive plan, or the Management Incentive Plan or the MIP. A total of 5,249,997 shares of New Common Stock was issued to the holders of the Prior Senior Notes;
40
•The Debtors entered into the New Loan Agreement (see Note 9 - Long-Term Debt), with certain financial institutions party thereto from time to time as lenders, or the Lenders, and Wilmington Trust, National Association, as agent for the Lenders;
•FES Ltd. adopted the Management Incentive Plan, which provides for the issuance of equity-based awards with respect to, in the aggregate, up to 750,000 shares of New Common Stock;
•The Debtors’ loan and security agreement governing their revolving credit facility dated as of September 9, 2011 as subsequently amended, or the Prior Loan Agreement, with Regions Bank, or Regions, as the sole lender party thereto, or the Lender, was terminated and a new letter of credit facility was entered into with Regions, or the New Regions Letters of Credit Facility, which covers letters of credit and the Company's credit card program. Regions continues to hold the cash pledged to support the New Regions Letters of Credit Facility in the amount of $9.0 million as of December 31, 2017.
•The Debtors paid off the outstanding principal balance of $15 million plus outstanding interest and fees under the Prior Loan Agreement, and the Prior Loan Agreement was terminated in accordance with the Plan;
•Holders of allowed creditor claims, aside from holders of the Prior Senior Notes, received, on account of such claims, either payment in full in cash or otherwise had their rights reinstated; and
•FES Ltd. entered into a registration rights agreement with certain of its stockholders to provide registration rights with respect to the New Common Stock.
Fresh Start Accounting
Upon emergence from bankruptcy, the Company adopted fresh start accounting in accordance with the provisions of Accounting Standards Codification, or ASC, 852, “Reorganizations,” or ASC 852, as (i) the holders of Old Common Stock received none of the New Common Stock issued upon the Debtors' emergence from bankruptcy and (ii) the reorganization value of the Company's assets immediately prior to confirmation of the Plan was less than the post-petition liabilities and allowed claims. Fresh start accounting required the Company to present its assets, liabilities and equity as if it were a new entity upon emergence from bankruptcy, with no beginning retained earnings or deficit as of the fresh start reporting date. The cancellation of the Old Common Stock and the issuance of the New Common Stock on the Effective Date caused a change of control of FES Ltd. under ASC 852. As a result of the adoption of fresh start accounting, the Company’s consolidated financial statements from and after April 13, 2017 are not comparable to its financial statements prior to such date. References to “Successor” or “Successor Company” relate to the financial position and results of operations of the reorganized Company from and after April 13, 2017. References to “Predecessor” or “Predecessor Company” relate to the financial position and results of operations of the Company on or prior to April 12, 2017.
Under ASC 852, the Successor Company must determine a value to be assigned to the equity of the emerging company as of the date of adoption of fresh start accounting. Enterprise value represents the fair value of an entity’s interest-bearing debt and stockholders’ equity. In the valuation analysis submitted to (and confirmed by) the Bankruptcy Court, the Company estimated a range of enterprise values between $176 million and $210 million, with a midpoint of $193 million. The Company deemed it appropriate to use the low end of the range to determine the final enterprise value of $176 million for fresh-start accounting. The low end of the enterprise value range was selected based on significant market volatility around the emergence. The Company calculated an enterprise value for the Successor Company using a discounted cash flow, or DCF, analysis under the income approach.
Under our DCF analysis, the Company calculated an estimate of future cash flows for the period ranging from 2017 to 2021 and discounted estimated future cash flows to present value. The estimated cash flows for the period 2017 to 2021 were derived from earnings forecasts and assumptions regarding growth and margin projections, as applicable, and a tax rate of 35.0%. A terminal value was included based on the cash flows of the final year of the forecast period. The discount rate of 16.9% was estimated based on an after-tax weighted average cost of capital, or the WACC, reflecting the rate of return that would be expected by a market participant. The WACC also takes into consideration a company specific risk premium reflecting the risk associated with the overall uncertainty of the financial projections used to estimate future cash flows.
The estimated enterprise value and the equity value are highly dependent on the achievement of the future financial results contemplated in the projections that were set forth in the Plan. The estimates and assumptions made in the valuation are inherently subject to significant uncertainties. The primary assumptions for which there is a reasonable possibility of the occurrence of a variation that would have significantly affected the reorganization value include revenue growth, operating expenses, the amount and timing of capital expenditures and the discount rate utilized.
Fresh start accounting reflects the value of the Successor Company as determined in the confirmed Plan. Under fresh start accounting, asset values are remeasured and allocated based on their respective fair values in conformity with the acquisition method of accounting for business combinations in ASC 805. Liabilities existing as of the Effective Date, other than deferred
41
taxes, were recorded at the present value of amounts expected to be paid using appropriate risk adjusted interest rates. Deferred taxes were determined in conformity with applicable accounting standards. Predecessor accumulated depreciation, accumulated amortization and retained deficit were eliminated.
Machinery and Equipment
To estimate the fair value of machinery and equipment, the Company considered the income approach, the cost approach, and the sales comparison (market) approach for each individual asset. The primary approaches that were relied upon to value these assets were the cost approach and the market approach. Although the income approach was not applied to value the machinery and equipment assets individually, the Company did consider the earnings of the enterprise of which these assets are a part. When more than one approach is used to develop a valuation, the various approaches are reconciled to determine a final value conclusion.
The typical starting point or basis of the valuation estimate is replacement cost new, or the RCN, reproduction cost new, or the CRN, or a combination of both. Once the RCN and CRN estimates are adjusted for physical and functional conditions, they are then compared to market data and other indications of value, where available, to confirm results obtained by the cost approach.
Where direct RCN estimates were not available or deemed inappropriate, the CRN for machinery and equipment was estimated using the indirect (trending) method, in which percentage changes in applicable price indices are applied to historical costs to convert them into indications of current costs. To estimate the CRN amounts, inflation indices from established external sources were then applied to historical costs to estimate the CRN for each asset.
The market approach measures the value of an asset through an analysis of recent sales or offerings of comparable property, and considers physical, functional and economic conditions. Where direct or comparable matches could not be reasonably obtained, the Company utilized the percent of cost technique of the market approach. This technique looks at general sales, sales listings, and auction data for each major asset category. This information is then used in conjunction with each asset’s effective age to develop ratios between the sales price and RCN or CRN of similar asset types. A market-based depreciation curve was developed and applied to asset categories where sufficient sales and auction information existed.
Where market information was not available or a market approach was deemed inappropriate, the Company developed a cost approach. In doing so, an indicated value is derived by deducting physical deterioration from the RCN or CRN of each identifiable asset or group of assets. Physical deterioration is the loss in value or usefulness of a property due to the using up or expiration of its useful life caused by wear and tear, deterioration, exposure to various elements, physical stresses, and similar factors.
Functional and economic obsolescence related to these was also considered. Any functional obsolescence due to excess capital costs was eliminated through the direct method of the cost approach to estimate the RCN. Economic obsolescence was also applied to stacked and underutilized assets based on the status of the asset. Economic obsolescence was also considered in situations in which the earnings of the applicable business segment in which the assets are employed suggest economic obsolescence. When penalizing assets for economic obsolescence, an additional economic obsolescence penalty was levied, while considering scrap value to be the floor value for an asset.
Intangible Assets
The financial information used to estimate the fair values of intangible assets was consistent with the information used in estimating the Company’s enterprise value.
Trademarks were valued utilizing the relief from royalty method of the income approach. Significant inputs and assumptions included remaining useful lives, the forecasted revenue streams, an applicable royalty rate, tax rate, and applicable discount rate.
Customer relationships were valued using a multi-period excess earnings method, and were split between well servicing relationships and fluid servicing relationships. There was no value attributed to the fluid servicing customer relationships. Significant inputs and assumptions for both relationship analyses included the expected attrition rate, forecasted revenue streams, contributory asset charges, and an applicable discount rate.
Covenants not to compete were valued using a with and without method under the income approach. Significant inputs and assumptions included the expected impact on revenues under competition, the forecasted revenue streams, the probability of competition if the non-compete were not in place, and an applicable discount rate.
The following table reconciles the enterprise value to the estimated reorganization value as of the Effective Date (in millions):
Enterprise value | $ | 176 | ||
Plus: Cash and cash equivalents | 20 | |||
Plus: Fair value on non-debt liabilities, net | 20 | |||
Reorganization value of Successor assets | $ | 216 | ||
42
Consolidated Balance Sheet
The adjustments set forth in the following consolidated balance sheet as of the Effective Date reflect the effects of the transactions contemplated by the Plan and carried out by the Company, which are reflected in the column titled “Reorganization Adjustments,” as well as fair value adjustments as a result of the adoption of fresh start accounting, which are reflected in the column titled “Fresh Start Adjustments.”
The following table reflects the reorganization and application of ASC 852 on the Company's consolidated balance sheet at April 12, 2017 (in thousands, except par value):
Predecessor Company | Reorganization Adjustments | Fresh Start Adjustments | Successor Company | ||||||||||||
Assets | |||||||||||||||
Current assets | |||||||||||||||
Cash and cash equivalents | $ | 17,500 | $ | 2,360 | (a) | $ | — | $ | 19,860 | ||||||
Cash - restricted | 27,579 | 6,400 | (a) | — | 33,979 | ||||||||||
Accounts receivable - trade | 17,237 | — | — | 17,237 | |||||||||||
Accounts receivable - other | 930 | — | — | 930 | |||||||||||
Prepaid expenses and other | 6,099 | 45 | (b) | — | 6,144 | ||||||||||
Other current assets | 567 | — | — | 567 | |||||||||||
Total current assets | 69,912 | 8,805 | — | 78,717 | |||||||||||
Property and equipment, net | 220,326 | — | (97,442 | ) | (g) | 122,884 | |||||||||
Intangible assets, net | 3,068 | — | 9,587 | (h) | 12,655 | ||||||||||
Other assets | 2,178 | (12 | ) | (b) | — | 2,166 | |||||||||
Total assets | $ | 295,484 | $ | 8,793 | $ | (87,855 | ) | $ | 216,422 | ||||||
Liabilities, Temporary Equity and Stockholders’ Equity (Deficit) | |||||||||||||||
Current liabilities | |||||||||||||||
Current portions of long-term debt | $ | 18,064 | $ | (15,000 | ) | (a) | $ | — | $ | 3,064 | |||||
Accounts payable - trade | 12,238 | (1,125 | ) | (b) | — | 11,113 | |||||||||
Accounts payable - related parties | 20 | — | — | 20 | |||||||||||
Accrued expenses | 9,293 | (82 | ) | (a) | (65 | ) | (i) | 9,146 | |||||||
Total current liabilities | 39,615 | (16,207 | ) | (65 | ) | 23,343 | |||||||||
Long-term debt, net of current portion | 84 | 45,000 | (c) | — | 45,084 | ||||||||||
Deferred tax liability | 1,049 | — | (685 | ) | (j) | 364 | |||||||||
Liabilities subject to compromise | 308,072 | (308,072 | ) | (d) | — | — | |||||||||
Total liabilities | 348,820 | (279,279 | ) | (750 | ) | 68,791 | |||||||||
Temporary equity | |||||||||||||||
Predecessor Series B senior convertible preferred shares, 588 shares outstanding at December 31, 2016 | 15,344 | (15,344 | ) | (e) | — | — | |||||||||
Stockholders’ equity (deficit) | |||||||||||||||
Predecessor common stock, $0.04 par value, 112,500 shares authorized; 22,215 shares outstanding at December 31, 2016 | 889 | (889 | ) | (e) | — | — | |||||||||
Predecessor additional paid-in capital | 193,431 | (193,431 | ) | (e) | — | — | |||||||||
Successor common stock, $0.01 par value, 40,000 shares authorized; 5,250 shares issued and outstanding | — | 53 | (f) | — | 53 | ||||||||||
Successor additional paid-in capital | — | 147,578 | (f) | — | 147,578 | ||||||||||
Accumulated retained earnings (deficit) | (263,000 | ) | 350,105 | (e) | (87,105 | ) | (k) | — | |||||||
Total stockholders’ equity (deficit) | (68,680 | ) | 303,416 | (87,105 | ) | 147,631 | |||||||||
Total liabilities, temporary equity and stockholders’ equity (deficit) | $ | 295,484 | $ | 8,793 | $ | (87,855 | ) | $ | 216,422 | ||||||
43
Reorganization Adjustments
Reorganization adjustments reflect amounts recorded on the Effective Date for the effect of implementation of the Plan. The significant reorganization adjustments are summarized as follows (in thousands):
(a) Reflects the net sources of cash on the Effective Date from implementation of the Plan:
Sources: | ||||
New Loan Agreement | $ | 50,000 | ||
Uses: | ||||
Payment to Holders of the Prior Senior Notes | $ | (20,000 | ) | |
Payoff of Prior Loan Agreement | (15,000 | ) | ||
Payoff of Prior Loan Agreement accrued interest | (82 | ) | ||
Restricted cash | (6,400 | ) | ||
Debt issuance costs | (5,000 | ) | ||
Professional fees | (1,158 | ) | ||
Total Uses | (47,640 | ) | ||
Net Sources | $ | 2,360 | ||
(b) Reflects the net payment of $1.1 million in professional fees.
(c) Represents the issuance of the new debt, net of loan costs, in connection with the Plan.
(d) Reflects the settlement of Liabilities Subject to Compromise in accordance with the Plan as follows:
Liabilities subject to compromise of the Predecessor Company: | ||||
Prior Senior Notes and accrued interest | $ | 308,072 | ||
Fair value of equity issued to Prior Senior Noteholders | (147,631 | ) | ||
Cash payments to Prior Senior Noteholders | (20,000 | ) | ||
Gain on settlement of liabilities subject to compromise | $ | 140,441 | ||
(e) Reflects the cumulative impact of reorganization adjustments discussed above:
Gain on settlement of liabilities subject to compromise | $ | 140,441 | ||
Cancellation of Predecessor temporary equity and permanent equity | 209,664 | |||
Net impact to retained earnings (deficit) | $ | 350,105 | ||
(f) Reflects the issuance of 5,249,997 shares, valued at $28.12 per share, of New Common Stock in accordance with the Plan.
44
Fresh Start Accounting Adjustments
Fresh start accounting adjustments are necessary to reflect assets at their estimated fair values and to eliminate accumulated deficit.
(g) An adjustment of $97.4 million was recorded to decrease the net book value of property and equipment to estimated fair value. The components of property and equipment, net as of the Effective Date and the fair value at the Effective Date are summarized in the following table (in thousands).
Predecessor Company | Fresh start adjustments | Successor Company | |||||||||
Well servicing equipment | $ | 165,585 | $ | (88,033 | ) | $ | 77,552 | ||||
Autos and trucks | 26,660 | 7,392 | 34,052 | ||||||||
Disposal wells | 15,890 | (12,080 | ) | 3,810 | |||||||
Buildings and improvements | 9,766 | (4,424 | ) | 5,342 | |||||||
Furniture and fixtures | 901 | 359 | 1,260 | ||||||||
Land | 1,524 | (656 | ) | 868 | |||||||
$ | 220,326 | $ | (97,442 | ) | $ | 122,884 | |||||
(h) An adjustment of $9.6 million was recorded to increase the net book value of intangible assets to estimated fair value. The components of intangibles, net as of the Effective Date and the fair value at the Effective Date are summarized in the following table (in thousands).
Useful Life (years) | Predecessor Company | Fresh start adjustments | Successor Company | |||||||||
Trade names | 15 | $ | 3,068 | $ | (596 | ) | $ | 2,472 | ||||
Covenants not to compete | 4 | — | 1,505 | 1,505 | ||||||||
Customer relationships | 15 | — | 8,678 | 8,678 | ||||||||
$ | 3,068 | $ | 9,587 | $ | 12,655 | |||||||
(i) Reflects adjustment decreasing the Company's asset retirement obligation to estimated fair value.
(j) Reflects a reduction in deferred tax liabilities recorded as of the Effective Date as determined in accordance with ASC 740 - Income Taxes. The reduction in deferred tax liabilities was primarily the result of the revaluation of the Company’s property and equipment and intangible assets under fresh start accounting.
(k) Reflects the cumulative impact of fresh start adjustments discussed above (in thousands):
Intangible assets fair value adjustments | $ | 9,587 | ||
Property and equipment fair value adjustments | (97,442 | ) | ||
Asset retirement obligation adjustment | 65 | |||
Deferred tax liability adjustments | 685 | |||
Net impact to retained earnings (deficit) | $ | (87,105 | ) | |
45
Reorganization Items
Reorganization items represent amounts incurred subsequent to the filing of the Bankruptcy Petitions as a direct result of the filing of the Plan and are comprised of the following (in thousands):
Successor | Predecessor | ||||||||
April 13 through December 31, 2017 | January 1 through April 12, 2017 | ||||||||
Reorganization legal and professional fees | $ | (1,299 | ) | $ | (6,663 | ) | |||
Deferred loan costs expensed | — | (2,170 | ) | ||||||
Gain on settlement of liabilities subject to compromise | — | 140,441 | |||||||
Fresh start adjustments | — | (87,105 | ) | ||||||
Reorganization items, net | $ | (1,299 | ) | $ | 44,503 | ||||
3. Risk and Uncertainties
As an independent oilfield services contractor that provides a broad range of drilling-related and production-related services to oil and natural gas companies, primarily onshore in Texas, the Company's revenue, profitability, cash flows and future rate of growth are substantially dependent on the Company's ability to (1) maintain adequate equipment utilization, (2) maintain adequate pricing for the services the Company provides, and (3) maintain a trained work force. Failure to do so could adversely affect the Company's financial position, results of operations, and cash flows.
Because the Company's revenues are generated primarily from customers who are subject to the same factors generally impacting the oil and natural gas industry, its operations are also susceptible to market volatility resulting from economic, seasonal and cyclical, weather related, or other factors related to such industry. Changes in the level of operating and capital spending in the industry, decreases in oil and natural gas prices, or industry perception about future oil and natural gas prices could materially decrease the demand for the Company's services, adversely affecting its financial position, results of operations, and cash flows.
4. Summary of Significant Accounting Policies
Basis of Consolidation
The Company’s consolidated financial statements include the accounts of FES Ltd. and all of its subsidiaries. All significant intercompany balances and transactions have been eliminated in consolidation.
Use of Estimates
The preparation of consolidated financial statements in conformity with accounting principles generally accepted in the United States of America, or GAAP, requires management to make estimates and assumptions that affect the reported amounts of assets and liabilities and disclosure of contingent assets and liabilities at the date of the consolidated balance sheets and the reported amounts of revenues and expenses during the reporting period. Actual results could materially differ from those estimates.
Fair Values of Financial Instruments
Fair value is the price that would be received to sell an asset or the amount paid to transfer a liability in an orderly transaction between market participants (an exit price) at the measurement date.
There is a fair value hierarchy that prioritizes the inputs used to measure fair value. The hierarchy gives the highest priority to quoted prices in active markets for identical assets or liabilities (Level 1 measurement) and the lowest priority to unobservable inputs (Level 3 measurement). The Company classifies fair value balances based on the observability of those inputs. The three levels of the fair value hierarchy are as follows:
• | Level 1 - Quoted prices in active markets for identical assets or liabilities that the Company has the ability to access. Active markets are those in which transactions for the asset or liability occur in sufficient frequency and volume to provide pricing information on an ongoing basis. |
• | Level 2 - Inputs are other than quoted prices in active markets included in Level 1, which are either directly or indirectly observable. These inputs are either directly observable in the marketplace or indirectly observable through corroboration with market data for substantially the full contractual term of the asset or liability being measured. |
46
• | Level 3 - Inputs reflect management’s best estimate of what market participants would use in pricing the asset or liability at the measurement date. Consideration is given to the risk inherent in the valuation technique and the risk inherent in the inputs to the model. |
In valuing certain assets and liabilities, the inputs used to measure fair value may fall into different levels of the fair value hierarchy. For disclosure purposes, assets and liabilities are classified in their entirety in the fair value hierarchy level based on the lowest level of input that is significant to the overall fair value measurement. The Company’s assessment of the significance of a particular input to the fair value measurement requires judgment and may affect the placement within the fair value hierarchy levels.
The carrying amounts of cash and cash equivalents, accounts receivable-trade, accounts receivable-other, accounts payable-trade, accounts payable-related parties, and insurance notes approximate fair value because of the short maturity of these instruments. The fair values of third party notes and equipment notes approximate their carrying values, based on current market rates at which the Company could borrow funds with similar maturities (Level 2 in the fair value hierarchy). The fair values of the New Loan Agreement and the Prior Senior Notes as of the respective dates are set forth below (in thousands):
December 31, 2017 | December 31, 2016 | ||||||||||||||||
Carrying Amount | Fair Value | Carrying Amount | Fair Value | ||||||||||||||
New Loan Agreement (1) | $ | 47,150 | $ | 55,550 | $ | — | $ | — | |||||||||
9% Senior Notes | $ | — | $ | — | $ | 277,662 | $ | 98,570 | |||||||||
(1) The carrying value of the New Loan Agreement includes $1.7 million of paid in kind interest less $4.5 million of debt issuance cost. | |||||||||||||||||
As discussed in Note 2 - Chapter 11 Proceedings, upon emergence from bankruptcy, the Company adopted fresh start accounting which requires the Successor Company to allocate its reorganization value to its individual assets and liabilities. See further discussion of fair value estimates in Note 2.
The Company has nonfinancial assets measured at fair value on a non-recurring basis which include property, plant and equipment and intangible assets for which fair value is calculated in connection with impairment testing. These fair value calculations incorporate a market and a cost approach and the inputs include projected revenue, costs, equipment utilization and other assumptions. Given the unobservable inputs, those fair value measurements are classified as Level 3.
Revenue Recognition
Well Servicing –Well servicing consists primarily of maintenance services, workover services, completion services, plugging and abandonment services, and tubing testing. The Company prices well servicing by the hour of service performed, or on occasion, bid/turnkey pricing.
Fluid Logistics – Fluid logistics consists primarily of the sale, transportation, storage, and disposal of fluids used in drilling, production, and maintenance of oil and natural gas wells. The Company prices fluid logistics services by the job, by the hour, or by the quantities sold, disposed, or hauled.
The Company recognizes revenue when services are performed, collection of the relevant receivables is probable, persuasive evidence of an arrangement exists, and the price is fixed or determinable. Revenues are presented net of any sales taxes collected by the Company from its customers that are remitted to governmental authorities.
Cash and Cash Equivalents
The Company considers all highly liquid investments purchased with an original maturity of three months or less to be cash equivalents.
Restricted Cash
Restricted cash serves as collateral for certain outstanding letters of credit and the Company's corporate credit card program. The Company had restricted cash balances of $30.0 million and $27.6 million at December 31, 2017 (Successor) and 2016 (Predecessor), respectively.
Accounts Receivable and Allowance for Doubtful Accounts
Accounts receivable are based on earned revenues. The Company provides an allowance for doubtful accounts, which is based on a review of outstanding receivables, historical collection information, and existing economic conditions. Provisions for doubtful accounts are recorded when it becomes evident that the customer will not be likely to make the required payments at either
47
contractual due dates or in the future. The accounts are written off against the provision when it becomes evident that the account is not collectible.
The following reflects changes in the Company's allowance for doubtful accounts:
Predecessor | |||
Balance as of January 1, 2016 | $ | 1,804 | |
Provision | 2,230 | ||
Bad debt write-off | (2,677 | ) | |
Balance as of December 31, 2016 | $ | 1,357 | |
Provision | 1 | ||
Bad debt write-off | — | ||
Reorganization adjustment | 177 | ||
Balance as of April 12, 2017 | $ | 1,535 | |
Successor | |||
Balance as of April 13, 2017 | $ | 1,535 | |
Provision | 46 | ||
Bad debt write-off | — | ||
Balance as of December 31, 2017 | $ | 1,581 | |
Property and Equipment
Property and equipment are recorded at cost or fair value (as part of fresh start accounting). Improvements or betterments that extend the useful life of the assets are capitalized. Expenditures for maintenance and repairs are charged to expense when incurred. The costs of assets retired or otherwise disposed of and the related accumulated depreciation are eliminated from the accounts in the period of disposal. Gains or losses resulting from property disposals are credited or charged to operations. Depreciation is recorded using the straight-line method over the estimated useful lives of the assets.
Intangible Assets
The Company's major classes of intangible assets consisted of its customer relationships, trade names and one covenant not to compete in 2017 resulting from fresh start accounting as described in Note 2 - Chapter 11 Proceedings.
The Company expenses costs associated with extensions or renewals of intangible assets. There were no such extensions or renewals in the period April 13 through December 31, 2017 (Successor), the period January 1 through April 12, 2017 (Predecessor) or the year ended December 31, 2016 (Predecessor). Amortization expense is calculated using the straight-line method.
Impairment of Long-Lived Assets
Long-lived assets include property and equipment and intangible assets. The Company tests its long-lived assets whenever events and changes in circumstances indicate the carrying amount of its net assets may not be recoverable. When an indicator of possible impairment exists, the Company uses estimated future undiscounted cash flows to assess recoverability of its long-lived assets. Impairment is indicated when future cash flows are less than the carrying amount of the assets. An impairment loss would be recorded in the period in which it is determined the carrying amount is not recoverable. The impairment loss is the amount by which the carrying amount exceeds the fair market value.
We recognized an impairment loss of $14.5 million during the year ended December 31, 2016 (Predecessor). We believed that the continued decline in revenues and industry-wide slowdown related to oil prices was other than temporary and was an indicator of potential impairment. Therefore, we assessed all of our long-lived assets for impairment. Our assessment indicated that the carrying amounts of long-lived assets associated with our fluid logistics segment exceeded the recoverable amounts. As a result, we measured the fair values of the long-lived assets associated with our fluid logistics segment and recorded an impairment loss of $14.5 million. Fair value was determined utilizing a combination of the income, cost and market approaches. Specific assets affected were customer relationships and other intangibles.
48
Deferred Financing Costs
The Company amortizes deferred financing costs over the period of the New Loan Agreement and, previously, the period of the agreements that governed the 9% Senior Notes and the revolving credit facility on an effective interest basis, as a component of interest expense. Amortization of deferred financing costs was $0.5 million, $0.2 million, and $1.3 million for period April 13 through December 31, 2017 (Successor), the period January 1 through April 12, 2017 (Predecessor) and the year ended December 31, 2016 (Predecessor), respectively.
Share-Based Compensation
The Company measures share-based compensation cost as of the grant date based on the estimated fair value of the award less an estimated rate for pre-vesting forfeitures, and recognizes compensation expense on a straight-line basis over the vesting period. The Company classifies stock awards as either an equity award or a liability award. Equity classified awards are valued as of the grant date using market price. Liability classified awards are re-measured at fair value at the end of each reporting date until settled.
Income Taxes
The Company recognizes deferred tax assets and liabilities for the future tax consequences attributable to differences between the financial statement carrying amounts of existing assets and liabilities and their respective tax bases. Deferred tax assets and liabilities are measured using statutory tax rates expected to apply to taxable income in the years in which those temporary differences are expected to be recovered or settled. The effect on deferred tax assets and liabilities of a change in tax rate is recognized in the period that includes the statutory enactment date. Valuation allowances are established to reduce deferred tax assets when it is more likely than not that some portion or all of the deferred tax assets will not be realized. The Company records uncertain tax positions at their net recognizable amount, based on the amount that management deems is more likely than not to be sustained upon ultimate settlement with tax authorities.
The Company’s policy for recording interest and penalties associated with uncertain tax positions is to record such items as a component of tax expense. The Company has not recognized any material uncertain tax positions for the period April 13 through December 31, 2017 (Successor), the period January 1 through April 12, 2017 (Predecessor) or the year ended December 31, 2016 (Predecessor).
Earnings per Share (EPS)
Basic earnings (loss) per share, or EPS, is computed by dividing net income (loss) available to common stockholders by the weighted average common stock outstanding during the period. Diluted EPS takes into account the potential dilution that could occur if securities or other contracts to issue common stock, such as stock options and unvested restricted stock units, were exercised and converted into common stock. Diluted EPS is computed by dividing net income (loss) available to common stockholders by the weighted average common stock outstanding during the period, increased by the number of additional common shares that would have been outstanding if the potential common shares had been issued and were dilutive.
Environmental
The Company is subject to extensive federal, state, and local environmental laws and regulations. These laws, which are constantly changing, regulate the discharge of materials into the environment and may require the Company to remove or mitigate the adverse environmental effects of the disposal or release of hazardous substances at various sites. Environmental expenditures are expensed or capitalized depending on their future economic benefit. Expenditures that relate to an existing condition caused by past operations and that have no future economic benefits are expensed. Liabilities for expenditures of a non-capital nature are recorded when environmental assessment and/or remediation is probable and the costs can be reasonably estimated. There were no material environmental liabilities as of December 31, 2017 (Successor) or as of December 31, 2016 (Predecessor).
Litigation and Self-Insurance
The Company estimates its reserves related to litigation and self-insured risks based on the facts and circumstances specific to the litigation and self-insured claims and its past experience with similar claims. The Company maintains accruals in the consolidated balance sheets to cover self-insurance retentions. Please see Note 11- Commitments and Contingencies for further discussion.
Recent Accounting Pronouncements
In May 2014, the FASB issued ASU No. 2014-09, creating a new topic, FASB ASC Topic 606, “Revenue from Contracts with Customers, which supersedes revenue recognition requirements in FASB ASC Topic 605, "Revenue Recognition." This ASU provides guidance that an entity should recognize revenue to depict the transfer of promised goods or services to customers in an amount that reflects the consideration to which the entity expects to be entitled in exchange for those goods and services. In addition, an entity is required to disclose sufficient information to enable users of financial statements to understand
49
the nature, amount, timing and uncertainty of revenue and cash flows arising from contracts with customers. The standard is effective for interim and annual periods beginning after December 15, 2017. The Company adopted the new standard on January 1, 2018 using the modified retrospective application method. The majority of the Company’s contracts with customers in both the
well servicing and fluid logistics segments are short-term in nature and are recognized as “over-time” performance obligations as the services are performed. For most contracts, the Company expects to utilize the “as-invoiced” practical expedient as the amount of consideration the Company has a right to invoice corresponds directly with the value of the Company’s performance to date. The Company has determined that there are no material differences in its existing revenue recognition methods that require modification under the new standard, and it did not record a material cumulative effect adjustment upon adoption of the new standard. The Company continues to evaluate the disclosure requirements as a result of the provisions of this ASU.
In November 2016, Financial Accounting Standards Board, or the FASB, issued ASU No. 2016-18, "Statement of Cash Flows (Topic 230), Restricted Cash," ("ASU 2016-18"). ASU 2016-18 provides guidance on the presentation of restricted cash and restricted cash equivalents in the statement of cash flows. Restricted cash and restricted cash equivalents should be included with cash and cash equivalents when reconciling the beginning-of-period and end-of-period amounts shown on the statement of cash flows. The Company adopted this pronouncement as of January 1, 2018 using a retrospective transition method and expects the only impact to be the presentation of the statement of cash flows for restricted cash.
In February 2016, the FASB issued ASU No. 2016-02, "Leases (Topic 842)" ("ASU 2016-02"), which increases the transparency and comparability about leases among entities. The new guidance requires lessees to recognize a lease liability and a corresponding lease asset for operating leases with lease terms greater than 12 months. It also requires additional disclosures about leasing arrangements to help users of financial statements better understand the amount, timing, and uncertainty of cash flows arising from leases. ASU 2016-02 becomes effective for interim and annual periods beginning after December 15, 2018, and requires a modified retrospective approach to adoption. Early adoption is permitted. The Company plans to engage a third party to assist in evaluating the impact of this new standard on its consolidated financial statements and related disclosures.
5. Intangible Assets
The following sets forth the identified intangible assets by major asset class (in thousands):
Useful Life (years) | Gross Carrying Value | Accumulated Amortization | Impairment | Net Book Value | |||||||||||||
As of December 31, 2017, Successor | |||||||||||||||||
Customer relationships | 15 | $ | 8,678 | $ | (415 | ) | $ | — | $ | 8,263 | |||||||
Trade names | 15 | 2,472 | (118 | ) | — | 2,354 | |||||||||||
Covenants not to compete | 4 | 1,505 | (270 | ) | — | 1,235 | |||||||||||
$ | 12,655 | $ | (803 | ) | $ | — | $ | 11,852 | |||||||||
As of December 31, 2016, Predecessor | |||||||||||||||||
Customer relationships | 15 | $ | 31,896 | $ | (18,073 | ) | $ | (13,823 | ) | $ | — | ||||||
Trade names | 15 | 8,050 | (4,830 | ) | — | 3,220 | |||||||||||
Other | 10-15 | 2,375 | (1,686 | ) | (689 | ) | — | ||||||||||
$ | 42,321 | $ | (24,589 | ) | $ | (14,512 | ) | $ | 3,220 | ||||||||
Amortization expense for the period April 13 through December 31, 2017 (Successor), the period January 1 through April 12, 2017 (Predecessor) and the year ended December 31, 2016 (Predecessor) was $0.8 million, $0.2 million, and $1.7 million, respectively. Future amortization of these intangibles will be as follows:
50
2018 | $ | 1,120 | ||
2019 | 1,120 | |||
2020 | 1,120 | |||
2021 | 850 | |||
2022 | 743 | |||
Thereafter | 6,899 | |||
$ | 11,852 | |||
6. Share-Based Compensation
As discussed in Note 2 - Chapter 11 Proceedings, on the Effective Date, all prior equity interests (which included the Old Common Stock, FES Ltd.’s prior preferred stock, awards under the Prior Compensation Plans and the preferred stock purchase rights under the Rights Agreement) in FES Ltd. were extinguished without recovery. At December 31, 2016 (Predecessor), there were 715,679 unvested restricted stock units outstanding which were canceled prior to the Effective Date. For the year ended December 31, 2016 (Predecessor), the Company recorded a benefit of $0.3 million related to the cancellation of these liability awards.
Management Incentive Plan - Successor
On the Effective Date, pursuant to the operation of the Plan, the Management Incentive Plan became effective.
The compensation committee, or the Compensation Committee, of the board of directors of the FES Ltd., or the Board, administers the Management Incentive Plan. The Compensation Committee has broad authority under the Management Incentive Plan to, among other things: (i) select participants; (ii) determine the terms and conditions, not inconsistent with the Management Incentive Plan, of any award granted under the Management Incentive Plan; (iii) determine the number of shares to be covered by each award granted under the Management Incentive Plan; and (iv) determine the fair market value of awards granted under the Management Incentive Plan, subject to certain exceptions.
Persons eligible to receive awards under the Management Incentive Plan include officers and employees of the Company. The types of awards that may be granted under the Management Incentive Plan include stock options, stock appreciation rights, restricted stock, restricted stock units, performance units, performance shares and other forms of stock based awards.
The maximum number of shares of New Common Stock that may be issued or transferred pursuant to awards under the Management Incentive Plan is 750,000, which number may be increased with the approval of FES Ltd.’s stockholders. If any outstanding award granted under the Management Incentive Plan expires or is terminated or canceled without having been exercised or settled in full, or if shares of New Common Stock acquired pursuant to an award subject to forfeiture are forfeited, the shares of New Common Stock allocable to the terminated portion of such award or such forfeited shares will revert to the Management Incentive Plan and will be available for grant under the Management Incentive Plan as determined by the Compensation Committee in consultation with the Chairman of the Board, subject to certain restrictions.
In the event of any change in the outstanding shares of New Common Stock by reason of a stock split, stock dividend or other non-recurring dividends or distributions, recapitalization, merger, consolidation, spin-off, combination, repurchase or exchange of stock, reorganization, liquidation, dissolution or other similar corporate transaction, an equitable adjustment will be made in order to prevent dilution or enlargement of the benefits or potential benefits intended to be made available under the Management Incentive Plan. Such adjustment may include an adjustment to the maximum number and kind of shares of stock or other securities or other equity interests as to which awards may be granted under the Management Incentive Plan, the number and kind of shares of stock or other securities or other equity interests subject to outstanding awards and the exercise price thereof, if applicable.
Restricted Stock Unit activity under the Management Incentive Plan was as follows (in thousands):
Number of Shares | Weighted Average Grant Date Fair Value | ||||||
Unvested as of April 13, 2017 | — | $ | — | ||||
Granted | 450,000 | $ | 11.00 | ||||
Vested | (86,400 | ) | $ | 11.00 | |||
Forfeited | — | $ | — | ||||
Unvested as of December 31, 2017 | 363,600 | $ | 11.00 | ||||
51
Share based compensation expense recognized under the Management Incentive Plan was $1.3 million during the period April 13 through December 31, 2017 (Successor). As of December 31, 2017 (Successor) unrecognized compensation cost was $3.7 million to be recognized over approximately 3.7 years.
7. Property and Equipment
Property and equipment consisted of the following (in thousands):
Estimated Life in Years | Successor | Predecessor | ||||||||
December 31, 2017 | December 31, 2016 | |||||||||
Well servicing equipment | 9-15 years | $ | 80,899 | $ | 411,199 | |||||
Autos and trucks | 5-10 years | 42,831 | 126,580 | |||||||
Disposal wells | 5-15 years | 3,977 | 37,752 | |||||||
Building and improvements | 5-30 years | 5,474 | 14,125 | |||||||
Furniture and fixtures | 3-15 years | 1,950 | 6,779 | |||||||
Land | 868 | 1,524 | ||||||||
135,999 | 597,959 | |||||||||
Accumulated depreciation | (18,808 | ) | (364,597 | ) | ||||||
$ | 117,191 | $ | 233,362 | |||||||
Depreciation expense was $19.2 million, $13.4 million and $50.7 million for the period April 13 through December 31, 2017 (Successor), the period January 1 through April 12, 2017 (Predecessor) and the year ended December 31, 2016 (Predecessor), respectively.
The Company is obligated under various capital leases for certain vehicles and equipment that expire at various dates during the next four years. The gross amount of property and equipment and related accumulated depreciation recorded under capital leases and included above consists of the following (in thousands):
Successor | Predecessor | |||||||
December 31, 2017 | December 31, 2016 | |||||||
Well servicing equipment | $ | — | $ | 13,696 | ||||
Autos and trucks | 9,104 | 12,706 | ||||||
9,104 | 26,402 | |||||||
Accumulated depreciation | (916 | ) | (15,146 | ) | ||||
$ | 8,188 | $ | 11,256 | |||||
Depreciation of assets held under capital leases of $1.0 million, $0.3 million, and $0.9 million for the period April 13 through December 31, 2017 (Successor), the period January 1 through April 12, 2017 (Predecessor) and the year ended December 31, 2016 (Predecessor), respectively, is included in depreciation and amortization expense in the consolidated statements of operations.
8. Accrued Expenses
Accrued expenses consisted of the following (in thousands):
Successor | Predecessor | |||||||
December 31, 2017 | December 31, 2016 | |||||||
Accrued wages | $ | 1,030 | $ | 601 | ||||
Accrued insurance | 7,204 | 7,193 | ||||||
Other accrued expenses | 2,850 | 946 | ||||||
Total accrued expenses | $ | 11,084 | $ | 8,740 | ||||
52
9. Long-Term Debt
Long-term debt consisted of the following (in thousands):
Successor | Predecessor | |||||||
December 31, 2017 | December 31, 2016 | |||||||
Prior Senior Notes, net of deferred financing costs of $2.3 million as of December 31, 2016 | $ | — | $ | 277,662 | ||||
Prior Loan Agreement | — | 15,000 | ||||||
Third party equipment notes and capital leases | 5,822 | 1,386 | ||||||
Insurance notes | 5,882 | 5,124 | ||||||
New Loan Agreement of $50.0 million, plus $1.7 million of accrued interest paid in kind and net of debt discount of $4.5 million as of December 31, 2017 | 47,150 | — | ||||||
Total debt | 58,854 | 299,172 | ||||||
Less: Current portion | (7,566 | ) | (298,932 | ) | ||||
Total long-term debt | $ | 51,288 | $ | 240 | ||||
Prior Senior Notes
On June 7, 2011, FES Ltd. issued $280.0 million in principal amount of the Prior Senior Notes, which were guaranteed by Forbes Energy Services LLC, or FES LLC, C.C. Forbes, LLC, or CCF, TX Energy Services, LLC, or TES, and Forbes Energy International, LLC, or FEI. FES Ltd.’s failure to make the semi-annual interest payments on the Prior Senior Notes on June 15, 2016 and December 15, 2016 after the cure periods provided for in the indenture governing the Prior Senior Notes, or the Prior Senior Indenture, and other events of default resulting from technical breaches of covenants under the Prior Senior Indenture, or collectively, the Prior Indenture Defaults, could have resulted in all outstanding indebtedness due under the Prior Senior Indenture immediately becoming due and payable. However, as discussed in Note 2 - Chapter 11 Proceedings, any efforts to enforce such payment obligations were automatically stayed as a result of the filing of the Bankruptcy Petitions, and the creditors' rights of enforcement in respect of the Prior Senior Indenture were subject to the applicable provisions of the Bankruptcy Code and orders of the Bankruptcy Court. As discussed in Note 2 - Chapter 11 Proceedings, on the Effective Date, the Prior Senior Notes were canceled and each holder of the Prior Senior Notes received such holder’s pro rata share of (i) $20 million in cash and (ii) 100% of the New Common Stock, subject to dilution only as a result of the shares of New Common Stock issued or available for issuance in connection with the Management Incentive Plan.
Prior Loan Agreement
On September 9, 2011, the Debtors entered into the Prior Loan Agreement. Under cross default provisions in the Prior Loan Agreement, an event of default under the Prior Senior Indenture constituted an event of default under the Prior Loan Agreement. As mentioned above, the Debtors experienced the Prior Indenture Defaults under the Prior Senior Indenture and, thus, constituted an event of default under the Prior Loan Agreement, or the Prior Loan Defaults. The Prior Indenture Defaults and the Prior Loan Defaults could have resulted in all outstanding indebtedness due under the Prior Senior Indenture and the Prior Loan Agreement becoming immediately due and payable. However, as discussed in Note 2 - Chapter 11 Proceedings, any efforts to enforce such payment obligations were automatically stayed as a result of the filing of the Bankruptcy Petitions, and the creditors' rights of enforcement in respect of the Prior Senior Indenture and the Prior Loan Agreement were subject to the applicable provisions of the Bankruptcy Code and orders of the Bankruptcy Court. As discussed in Note 2 - Chapter 11 Proceedings, on the Effective Date, the outstanding principal balance of $15.0 million plus outstanding interest and fees under the Prior Loan Agreement were paid off and the Prior Loan Agreement was terminated in accordance with the Plan. Additionally, on the Effective Date, the Debtors entered into the New Regions Letters of Credit Facility to cover letters of credit and certain bank product obligations.
53
New Loan Agreement
As discussed previously, on the Effective Date, the Company entered into the New Loan Agreement. FES LLC is the borrower, or the Borrower, under the New Loan Agreement. The Borrower’s obligations have been guaranteed by FES Ltd. and by TES, CCF and FEI, each direct subsidiaries of the Borrower and indirect subsidiaries of FES Ltd. The New Loan Agreement provides for a term loan of $50.0 million, which was fully funded on the Effective Date. Subject to certain exceptions and permitted encumbrances, the obligations under the New Loan Agreement are secured by a first priority security interest in substantially all the assets of the Company other than cash collateralizing the New Regions Letters of Credit Facility. The New Loan Agreement has a stated maturity date of April 13, 2021. The proceeds of such term loan are only permitted to be used for (i) the payment on account of the Prior Senior Notes in an amount equal to $20.0 million; (ii) the payment of costs, expenses and fees incurred on or prior to the Effective Date in connection with the preparation, negotiation, execution and delivery of the New Loan Agreement and documents related thereto; and (iii) subject to satisfaction of certain release conditions set forth in the New Loan Agreement, for general operating, working capital and other general corporate purposes of the Borrower not otherwise prohibited by the terms of the New Loan Agreement. The release conditions set forth in the New Loan Agreement include, among other things, (i) no default or event of default under the New Loan Agreement having occurred or being continuing as of the date of the requested release of proceeds of the New Loan Agreement, or that would exist after giving effect to the release requested to be made on such date, and (ii) the Company’s unrestricted cash and cash equivalents being less than $7 million after giving pro forma effect to the requested release. At December 31, 2017, $20.9 million included in restricted cash was subject to these release restrictions.
Borrowings under the New Loan Agreement bear interest at a rate equal to five percent (5%) per annum payable quarterly in cash, or the Cash Interest Rate, plus (ii) an initial paid in kind interest rate of seven percent (7%) commencing April 13, 2017 to be capitalized and added to the principal amount of the term loan or, at the election of the Borrower, paid in cash. The paid in kind interest increases by two percent (2%) twelve months after the Effective Date and every twelve months thereafter until maturity. Upon and after the occurrence of an event of default, the Cash Interest Rate will increase by two percentage points per annum. During the period April 13 through December 31, 2017 (Successor), $1.7 million of interest was paid in kind.
The Borrower is also responsible for certain other administrative fees and expenses. In connection with the execution of the New Loan Agreement, the Borrower paid the Lenders a funding fee of $3.0 million and paid certain Lenders a backstop fee of $2.0 million. These amounts were recorded as debt issuance costs, as a reduction in the carrying amount of the New Loan Agreement. The $20.0 million payment referred to above and these fees were funded as draws under the New Loan Agreement.
The Company is able to voluntarily repay the outstanding term loan at any time without premium or penalty. The Company is required to use the net proceeds from certain events, including but not limited to, the disposition of assets, certain judgments, indemnity payments, tax refunds, pension plan refunds, insurance awards and certain incurrences of indebtedness to repay outstanding loans under the New Loan Agreement. The Company may also be required to use cash in excess of $20.0 million to repay outstanding loans under the New Loan Agreement.
The New Loan Agreement includes customary negative covenants for an asset-based term loan, including covenants limiting the ability of the Company to, among other things, (i) effect mergers and consolidations, (ii) sell assets, (iii) create or suffer to exist any lien, (iv) make certain investments, (v) incur debt and (vi) transact with affiliates. In addition, the New Loan Agreement includes customary affirmative covenants for an asset-based term loan, including covenants regarding the delivery of financial statements, reports and notices to the Agent. The New Loan Agreement also contains customary representations and warranties and event of default provisions for a secured term loan.
New Regions Letters of Credit Facility
As discussed previously, on the Effective Date the Company entered into the New Regions Letters of Credit Facility to cover letters of credit and the credit card program existing on the Effective Date and pursuant to which Regions may issue, upon request by the Company, letters of credit and continue to provide charge cards for use by the Company. Amounts available under the New Regions Letters of Credit Facility are subject to customary fees and are secured by a first-priority lien on, and security interest in, a cash collateral account with Regions containing cash equal to at least (i) 105% of the sum of (a) all amounts owing for any drawings under letters of credit, including any reimbursement obligations, (b) the aggregate undrawn amount of all outstanding letters of credit, (c) all sums owing to Regions or any affiliate pursuant to any letter of credit document and (d) all obligations of the Company arising thereunder, including any indemnities and obligations for reimbursement of expenses and (ii) 120% of the aggregate line of credit for charge cards issued by Regions to the Company. The fees for each letter of credit for the period from and excluding the date of issuance of such letter of credit to and including the date of expiration or termination, are equal to (x) the average daily face amount of each outstanding letter of credit multiplied by (y) a per annum rate determined by Regions from time to time in its discretion based upon such factors as Regions shall determine, including, without limitation, the credit quality and financial performance of the Company. At December 31, 2017, such rate was 3.00%. In the event the Company is unable to repay amounts due under the New Regions Letters of Credit Facility, Regions could proceed against such cash collateral account. Regions has no commitment under the New Regions Letters of Credit Facility to issue letters of credit. At December 31, 2017, the facility had $9.0 million in letters of credit outstanding.
54
Capital Leases
The Company financed the purchase of certain vehicles and equipment through commercial loans and capital leases with aggregate principal amounts outstanding as of December 31, 2017 (Successor) and December 31, 2016 (Predecessor) of approximately $5.8 million and $1.4 million, respectively. These loans are repayable in a range of 42 to 48 monthly installments with maturity dates ranging from October 2017 to September 2021. Interest accrues at rates ranging from 3.4% to 5.7% and is payable monthly. The loans are collateralized by equipment purchased with the proceeds of such loans. The Company paid total principal payments of approximately $1.2 million during the period April 13 through December 31, 2017 (Successor), $0.4 million during the period January 1, 2017 through April 12, 2017 (Predecessor), and $5.7 million during the year ended December 31, 2016 (Predecessor), respectively.
Following are required principal payments due on capital leases existing as of December 31, 2017 (in thousands):
2018 | $ | 1,684 | |
2019 | 1,507 | ||
2020 | 1,574 | ||
2021 | 1,057 | ||
2022 | — | ||
Thereafter | — | ||
$ | 5,822 | ||
Management has historically acquired all light duty trucks (pickup trucks) through capital leases and may use capital leases or cash to purchase equipment held under operating leases that have reached the end of the lease term.
Insurance Notes
During 2017 and 2016, the Company entered into insurance promissory notes for the payment of insurance premiums at an interest rate of 3.27% and 2.87% respectively, with an aggregate principal amount outstanding as of December 31, 2017 (Successor) and 2016 (Predecessor), of approximately $5.9 million and $5.1 million, respectively. The amount outstanding could be substantially offset by the cancellation of the related insurance coverage which is classified in prepaid insurance. These notes are or were payable in nine monthly installments with maturity dates of July 15, 2018 and July 15, 2017, respectively.
10. Related Party Transactions
The Company periodically enters into transactions with related parties. The following tables represent related party transactions (in thousands):
As of | |||||||||||
Successor | Predecessor | ||||||||||
December 31, 2017 | December 31, 2016 | ||||||||||
Related parties cash and cash equivalents balances: | |||||||||||
Balance at Texas Champion Bank (1) | $ | — | $ | 295 | |||||||
Related parties payable: | |||||||||||
Dorsal Services, Inc. (2) | — | $ | 8 | — | $ | — | |||||
Tasco Tool Services, Inc. (3) | — | 3 | 11 | — | |||||||
Texas Quality Gate Guard Services, LLC (4) | — | 18 | |||||||||
$ | 11 | $ | 18 | ||||||||
There were no related party capital expenditures for the period April 13 through December 31, 2017 (Successor), the period January 1 through April 12, 2017 (Predecessor), and the year ended December 31, 2016 (Predecessor).
55
Successor | Predecessor | Predecessor | ||||||||||
April 13 through December 31, 2017 | January 1 through April 12, 2017 | Year ended December 31, 2016 | ||||||||||
Related parties expense activity: | ||||||||||||
Alice Environmental Holdings, LLC Alice Environmental Services, LP (5) | $ | 591 | $ | 296 | $ | 1,012 | ||||||
Animas Holding, LLC (6) | 125 | 61 | 172 | |||||||||
CJW Group, LLC (7) | 25 | 13 | 38 | |||||||||
Dorsal Services, Inc. (2) | 35 | — | 13 | |||||||||
Tasco Tool Services, Inc. (3) | — | 11 | 36 | |||||||||
Texas Quality Gate Guard Services, LLC (4) | — | 58 | 200 | |||||||||
$ | 776 | $ | 439 | $ | 1,471 | |||||||
Other payments to related parties: | ||||||||||||
SB Factoring, LLC (8) | $ | 27 | $ | 65 | $ | 402 | ||||||
(1) | The Company had a deposit relationship with Texas Champion Bank. Travis Burris, who served on the Company’s Board of Directors until April 12, 2017 is the President, Chief Executive Officer, and director of Texas Champion Bank. John E. Crisp, an executive officer and director of Forbes Energy Services, Ltd., serves on the board of directors of Texas Champion Bank. On September 30, 2017, the Company closed the account with Texas Champion Bank. |
(2) | Dorsal Services, Inc., or Dorsal Services, is a trucking service company. Mr. Crisp was a partial owner of Dorsal Services in prior periods. The Company used Dorsal Services from time to time. |
(3) | Tasco Tool Services, Inc., or Tasco, is a down-hole tool company that is partially owned and managed by a company that was partially owned by Charles C. Forbes, Jr., now deceased. Mr. Forbes served as an executive officer and director of the Company until the Effective Date. Tasco rents and sells tools to the Company from time to time. Since the Effective Date, Tasco is no longer a related party. |
(4) | Texas Quality Gate Guard Services, LLC, or Texas Quality Gate Guard Services, is an entity partially owned by Mr. Crisp and a son of Mr. Crisp. Texas Quality Gate Guard Services has provided security services to the Company. Since the Effective Date, Texas Quality Gate Guard Services has not provided services to our Company and we do not anticipate securing their services in the future. |
(5) | Mr. Crisp is a partial owner of Alice Environmental Holdings, LLC, or AEH, and is an indirect shareholder and manager of Alice Environmental Services, LP, or AES and Alice Environmental West Texas, LLC, or AEWT. The Company leases or rents land and buildings from AES. |
(6) | Animas Holdings, LLC, or Animas, is partially owned by two sons of Mr. Crisp. Animas owns land and property that it leases to the Company. |
(7) | CJW Group, LLC is an entity that leases office space to the Company and is partially owned by Mr. Crisp. |
(8) | From time to time, vendors of the Company factor their receivables from the Company and direct that the Company make payment of such factored amounts directly to the applicable factor. One such factor to whom payments have been made by the Company is SB Factoring LLC, which is partially owned by Mr. Crisp. The nature of these transactions does not result in recording in the Company’s financial records any revenue, any expense or any receivable and does not result in any payable distinct in amount from the amount payable to such vendors as originally incurred. |
In addition to such related party transactions above, Lawrence A. First, a director of FES Ltd., serves as the Chief Investment Officer and Managing Director of Ascribe Capital LLC, or Ascribe, and Brett G. Wyard, also a director of FES Ltd., serves as a Managing Partner of Solace Capital Partners, or Solace, had the right to designate one member of the Board. Additionally, Ascribe and Solace had the right to jointly designate one member of the Board and, together with certain other holders of the Prior Senior Notes, the right to designate the one other member of the Board. Furthermore, Ascribe and/or one of more of its affiliates own approximately 24.1% of the outstanding New Common Stock as of February 28, 2018, and is owed approximately $13.2 million of the aggregate principal amount of the New Loan Agreement. Solace and/or one of its affiliates own approximately 17.8% of the outstanding New Common Stock as of February 28, 2018, and is owed approximately $11.9 million of the aggregate principal amount of the term loan covered by the New Loan Agreement. Moreover, an affiliate of Solace and affiliates of Ascribe are parties to that certain registration rights agreement dated as of the Effective Date by and among the Company and certain stockholders of the Company.
11. Commitments and Contingencies
Concentrations of Credit Risk
Financial instruments which subject the Company to credit risk consist primarily of cash balances maintained in excess of federal depository insurance limits and trade receivables. Insurance coverage is currently $250,000 per depositor at each financial
56
institution, and the Company's non-interest bearing cash balances exceeded federally insured limits. The Company restricts investment of temporary cash investments to financial institutions with high credit standings. The Company’s customer base consists primarily of multi-national and independent oil and natural gas producers. The Company does not require collateral on its trade receivables. For the period April 13 through December 31, 2017 (Successor) the Company’s largest customer, five largest customers, and ten largest customers constituted 17.2%, 46.3%, and 56.5% of total revenues, respectively. For the period January 1 through April 12, 2017 (Predecessor), the Company's largest customer, five largest customers, and ten largest customers constituted 14.9%, 47.8%, and 63.1% of total revenues, respectively. For the year ended December 31, 2016 (Predecessor) the Company’s largest customer, five largest customers, and ten largest customers constituted 16.2%, 56.8%, and 70.1% of total revenues, respectively. The loss of any one of the Company's top five customers would have a materially adverse effect on the revenues and profits of the Company. Further, the Company's trade accounts receivable are from companies within the oil and natural gas industry and as such the Company is exposed to normal industry credit risks. As of December 31, 2017 (Successor), the Company's largest customer, five largest customers, and ten largest customers constituted 21.8%, 39.5%, and 46.0% of trade accounts receivable, respectively. As of December 31, 2016 (Predecessor), the Company's largest customer, five largest customers, and ten largest customers constituted 22.9%, 58.0%, and 69.8% of trade accounts receivable, respectively. The Company continually evaluates its reserves for potential credit losses and establishes reserves for such losses.
Employee Benefit Plan
The Company has a 401(k) retirement plan for substantially all of its employees based on certain eligibility requirements. The Company may provide profit sharing contributions to the plan at the discretion of management. No such discretionary contributions have been made since inception of the plan.
Litigation
The Company is subject to various other claims and legal actions that arise in the ordinary course of business. The Company does not believe that any of the currently existing claims and actions, separately or in the aggregate, will have a material adverse effect on the Company's business, financial condition, results of operations, or cash flows. It is reasonably possible that cases could be resolved and result in liabilities that exceed the amounts currently reserved; however, we cannot reasonably estimate a range of loss based on the status of the cases. If one or more negative outcomes were to occur relative to these matters, the aggregate impact to the Company’s financial condition could be material.
Self-Insurance
The Company is self-insured under its Employee Group Medical Plan for the first $150 thousand per individual. The Company is self-insured with a retention for the first $250 thousand in general liability. The Company has an additional premium payable clause under its lead $10.0 million limit excess policy that states in the event losses exceed $1.0 million, a loss additional premium of up to 15% of paid losses in excess of $1.0 million will be due. The loss additional premium is payable at the time when the loss is paid and will be payable over a period agreed by insurers. The Company has accrued liabilities totaling $7.2 million and $7.2 million as of December 31, 2017 (Successor) and 2016 (Predecessor), respectively, for the projected additional premium and self-insured portion of these insurance claims as of the financial statement dates. This accrual includes claims made as well as an estimate for claims incurred but not reported by using third party data and claims history as of the financial statement dates.
Other
The Company is currently undergoing sales and use tax audits for multi-year periods. The Company believes the outcome of these audits will not have a material adverse effect on its results of operations or financial position. Because certain of these audits are in a preliminary stage, an estimate of the possible loss or range of loss cannot reasonably be made.
Off-Balance Sheet Arrangements
The Company is often party to certain transactions that require off-balance sheet arrangements such as performance bonds, guarantees, operating leases for equipment, and bank guarantees that are not reflected in the Company's consolidated balance sheets. These arrangements are made in the Company's normal course of business and they are not reasonably likely to have a current or future material adverse effect on its financial condition, results of operations, liquidity, or cash flows. The Company's off-balance sheet arrangements include $9.0 million in letters of credit.
57
Leases
Future minimum lease payments under non-cancellable operating leases as of December 31, 2017 (Successor) are as follows (in thousands):
Related Party | Other | Total | |||||||||
2018 | $ | 253 | $ | 777 | $ | 1,030 | |||||
2019 | — | 654 | 654 | ||||||||
2020 | — | 656 | 656 | ||||||||
2021 | — | 658 | 658 | ||||||||
2022 | — | 660 | 660 | ||||||||
Thereafter | — | 1,250 | 1,250 | ||||||||
Total | $ | 253 | $ | 4,655 | $ | 4,908 | |||||
Rent expense for the period April 13 through December 31, 2017 (Successor) and the period January 1 through April 12, 2017 (Predecessor) and the year ended December 31, 2016 (Predecessor) totaled approximately $6.2 million, $0.9 million and $7.8 million, respectively.
12. Supplemental Cash Flow Information
Successor | Predecessor | |||||||||||
April 13 through December 31, 2017 | January 1 through April 12, 2017 | Year Ended December 31, 2016 | ||||||||||
(in thousands) | ||||||||||||
Cash paid for | ||||||||||||
Interest | $ | 2,272 | $ | 453 | $ | 432 | ||||||
Income tax | — | — | — | |||||||||
Supplemental schedule of non-cash investing and financing activities | ||||||||||||
Change in accounts payable related to capital expenditures | 930 | — | (216 | ) | ||||||||
Capital leases on equipment | 6,069 | — | — | |||||||||
Preferred stock dividends and accretion costs | — | 10 | (654 | ) | ||||||||
13. Income Taxes
On December 22, 2017, the Tax Reform Act was signed into law. The legislation significantly changed U.S. tax law by, among other things, lowering the U.S. corporate income tax rate from a maximum of 35% to a flat 21% rate, effective January 1, 2018. As a result of the decrease in the corporate income tax rate, we revalued our ending net deferred tax assets at December 31, 2017, but did not recognize any income tax impact in 2017 due to the offsetting change in the valuation allowance.
On December 22, 2017 the SEC staff issued Staff Accounting Bulletin No. 118 to address the application of GAAP in situations when a registrant does not have the necessary information available, prepared or analyzed (including computations) in reasonable detail to complete the accounting for certain income tax effects of the Tax Reform Act. We have recognized the incremental tax impacts related to deferred tax assets and liabilities and our reassessment of uncertain tax positions and valuation allowances and included these amounts in our Consolidated Financial Statements for the period April 13 through December 31, 2017 (Successor). The ultimate impact may differ from these amounts, possibly materially, due to, among other things, additional technical analysis including changes in interpretations and assumptions we have made with respect to the Tax Reform Act.
58
Income tax expense included in the consolidated statements of operations consisted of the following (in thousands):
Successor | Predecessor | |||||||||||
April 13 through December 31, 2017 | January 1 through April 12, 2017 | Year Ended December 31, 2016 | ||||||||||
Current: | ||||||||||||
Federal | $ | — | $ | — | $ | — | ||||||
State | — | — | — | |||||||||
Foreign | 228 | 74 | (25 | ) | ||||||||
Total current income tax expense (benefit) | $ | 228 | $ | 74 | $ | (25 | ) | |||||
Deferred: | ||||||||||||
Federal | $ | — | $ | — | $ | (96 | ) | |||||
State | 15 | (47 | ) | 293 | ||||||||
Foreign | — | — | — | |||||||||
Total deferred income tax expense (benefit) | $ | 15 | $ | (47 | ) | $ | 197 | |||||
Total income tax expense | $ | 243 | $ | 27 | $ | 172 | ||||||
The differences between income taxes expected at the U.S. federal statutory income tax rate of 35% and the reported income tax expense are summarized as follows (in thousands):
Successor | Predecessor | |||||||||||
April 13 through December 31, 2017 | January 1 through April 12, 2017 | Year Ended December 31, 2016 | ||||||||||
Income tax expense (benefit) at statutory rate | $ | (9,010 | ) | $ | 9,539 | $ | (38,135 | ) | ||||
Nondeductible expenses | 111 | 33 | 5,293 | |||||||||
Bankruptcy transaction costs | 788 | 2,355 | — | |||||||||
Effect of tax attribute reduction | 3,959 | (18,667 | ) | — | ||||||||
Change in U.S. tax rate | 12,259 | — | — | |||||||||
Change in deferred tax valuation allowance | (8,409 | ) | 5,532 | 33,177 | ||||||||
Foreign taxes | 227 | 75 | — | |||||||||
State taxes | 16 | (48 | ) | — | ||||||||
Stock based compensation | — | 1,042 | — | |||||||||
Other | 302 | 166 | (163 | ) | ||||||||
$ | 243 | $ | 27 | $ | 172 | |||||||
59
Significant components of our deferred tax assets and liabilities are as follows (in thousands):
Successor | Predecessor | |||||||
December 31, 2017 | December 31, 2016 | |||||||
Deferred tax assets: | ||||||||
Net operating loss carryforwards | $ | 10,916 | $ | 52,274 | ||||
Foreign tax credits | 796 | 796 | ||||||
Alternative minimum tax credit | — | 1,228 | ||||||
Share-based compensation | 113 | 1,062 | ||||||
Bad debts | 345 | 484 | ||||||
Accrued expenses | 1,785 | 2,567 | ||||||
Tax over book depreciation | 6,549 | — | ||||||
Other | 95 | 28 | ||||||
Total deferred tax assets | 20,599 | 58,439 | ||||||
Less: valuation allowance | (19,368 | ) | (36,762 | ) | ||||
Total deferred tax assets, net | $ | 1,231 | $ | 21,677 | ||||
Deferred tax liabilities: | ||||||||
Book over tax depreciation | $ | (325 | ) | $ | (21,411 | ) | ||
Intangible assets | (1,285 | ) | (1,362 | ) | ||||
Total deferred tax liabilities | $ | (1,610 | ) | $ | (22,773 | ) | ||
Net deferred tax liability | $ | (379 | ) | $ | (1,096 | ) | ||
Under the Plan, a substantial portion of the Company’s pre-petition debt securities were extinguished. Absent an exception, a debtor recognizes cancellation of indebtedness income (“CODI”) upon discharge of its outstanding indebtedness for an amount of consideration that is less than its adjusted issue price. The Internal Revenue Code of 1986, as amended (the “Code”), provides that a debtor in a bankruptcy case may exclude CODI from taxable income but must reduce certain of its tax attributes by the amount of any CODI realized as a result of the consummation of a plan of reorganization. The amount of CODI realized by a taxpayer is the adjusted issue price of any indebtedness discharged less the sum of (i) the amount of cash paid, (ii) the issue price of any new indebtedness issued and (iii) the fair market value of any other consideration, including equity, issued. As a result of the market value of our equity upon our emergence from Chapter 11 bankruptcy proceedings, the estimated amount of U.S. CODI was approximately $151.2 million, which reduced the value of the Company’s U.S. net operating losses.
In general, under Sections 382 and 383 of the Code, a corporation that undergoes an “ownership change” is subject to limitations on its ability to utilize its pre-change net operating losses (“NOLs”) and certain tax credits, to offset future taxable income and tax. In general, an ownership change occurs if the aggregate stock ownership of certain stockholders changes by more than 50 percentage points over such stockholders’ lowest percentage of ownership during the testing period (generally three years). In connection with our emergence from Chapter 11 bankruptcy proceedings, we experienced an ownership change for the purposes of Section 382 of the Code. The ownership change did not result in the expiration of any NOLs generated prior to the emergence date. However, any subsequent ownership changes under the provisions of Section 382 could further adversely affect the use of our NOLs in future periods.
As of December 31, 2017 (Successor), the Company had federal net operating loss carryforwards of approximately $52.0 million, which will begin to expire in 2033 if not utilized prior to that time. Realization of deferred tax assets associated with net operating loss carryforwards is dependent upon generating sufficient taxable income in the appropriate jurisdiction prior to their expiration. The existence of reversing taxable temporary differences supports the recognition by the Company of deferred tax assets. It is not more likely than not that those deferred tax assets would be realized due to the Company's lack of earnings history. The Company has established a full valuation allowance against its NOLs. The change in valuation allowance was $(8.4) million and $5.5 million for the period April 13 through December 31, 2017 (Successor) and the period January 1 through April 12, 2017 (Predecessor), respectively.
The Company files U.S. federal, U.S. state, and foreign tax returns, and is generally no longer subject to tax examinations for fiscal years prior to 2012.
14. Earnings (loss) per Share
As discussed in Note 2 - Chapter 11 Proceedings, on the Effective Date, the Old Common Stock, the prior Series B Senior Convertible Preferred Stock, or the Prior Preferred Stock, and awards then outstanding under the Prior Compensation Plans were extinguished without recovery.
60
The following table sets forth the computation of basic and diluted loss per share:
Successor | Predecessor | |||||||||||
April 13 through December 31, 2017 | January 1 through April 12, 2017 | Year ended December 31, 2016 | ||||||||||
(in thousands, except per share amounts) | ||||||||||||
Basic and diluted: | ||||||||||||
Net income (loss) | $ | (25,985 | ) | $ | 27,228 | $ | (109,129 | ) | ||||
Preferred stock dividends and accretion | — | (46 | ) | (776 | ) | |||||||
Net income (loss) attributable to common stockholders | $ | (25,985 | ) | $ | 27,182 | $ | (109,905 | ) | ||||
Weighted-average common shares | 5,288 | 27,508 | 22,214 | |||||||||
Basic and diluted net income (loss) per share | $ | (4.91 | ) | $ | 0.99 | $ | (4.95 | ) | ||||
There were 363,300 unvested restricted stock units that were not included in the calculation of diluted EPS for the period April 13 through December 31, 2017 (Successor) because their effect would have been antidilutive. There were 602,625 stock options, 0 units of unvested restricted stock, and 5,292,531 shares of Old Common Stock equivalents underlying the Prior Preferred Stock outstanding as of December 31, 2016 (Predecessor) that were not included in the calculation of diluted EPS for the year ended December 31, 2016 (Predecessor) because their effect would have been antidilutive. There were 5,292,531 shares of Old Common Stock equivalents underlying the Prior Preferred Stock included in the weighted average common shares for the period January 1 through April 12, 2017 (Predecessor) as the Prior Preferred Stock was dilutive and a participating security. There were 602,625 stock options that were not included in the calculation of diluted EPS for the period January 1 through April 12, 2017 (Predecessor) because their effect would have been antidilutive.
15. Business Segment Information
The Company has two reportable segments organized based on its products and services—well servicing and fluid logistics. The accounting policies of the segments are the same as those described in the summary of significant accounting policies.
Well Servicing
The Company's well servicing segment utilizes a fleet of well servicing rigs, which was comprised of workover rigs and swabbing rigs, in addition to coiled tubing spreads and other related assets and equipment to provide the following services:(i) well maintenance, including remedial repairs and removal and replacement of downhole production equipment, (ii) well workovers, including significant downhole repairs, re-completions and re-perforations, (iii) completion and swabbing activities, (iv) plugging and abandonment services, and (v) pressure testing of oil and natural gas production tubing and scanning tubing for pitting and wall thickness using tubing testing units.
Fluid Logistics
The Company's fluid logistics segment utilizes a fleet of fluid transport trucks and related assets, including specialized vacuum, high-pressure pump and tank trucks, frac tanks, water wells, salt water disposal wells and facilities, and related equipment to provide services such as transportation, storage and disposal of a variety of drilling and produced fluids used in, and generated by, oil and natural gas production. These services are required in most workover and completion projects and are routinely used in the daily operation of producing wells.
The following table sets forth certain financial information from continuing operations with respect to the Company’s reportable segments (in thousands):
Well Servicing | Fluid Logistics | Consolidated | |||||||||
Successor | |||||||||||
April 13 through December 31, 2017 | |||||||||||
Revenues | $ | 63,916 | $ | 32,565 | $ | 96,481 | |||||
Direct operating costs | 49,152 | 31,083 | 80,235 | ||||||||
Segment profits | $ | 14,764 | $ | 1,482 | $ | 16,246 | |||||
Depreciation and amortization | $ | 10,251 | $ | 9,800 | $ | 20,051 | |||||
Capital expenditures (1) | $ | 12,489 | $ | 3,031 | $ | 15,520 | |||||
61
Well Servicing | Fluid Logistics | Consolidated | |||||||||
Total assets | $ | 128,623 | $ | 86,511 | $ | 215,134 | |||||
Long lived assets | $ | 71,545 | $ | 57,498 | $ | 129,043 | |||||
Predecessor | |||||||||||
January 1 through April 13, 2017 | |||||||||||
Revenues | $ | 19,554 | $ | 11,211 | $ | 30,765 | |||||
Direct operating costs | 15,952 | 11,207 | 27,159 | ||||||||
Segment profits | $ | 3,602 | $ | 4 | $ | 3,606 | |||||
Depreciation and amortization | $ | 6,927 | $ | 6,674 | $ | 13,601 | |||||
Capital expenditures (1) | $ | 286 | $ | 114 | $ | 400 | |||||
Year ended December 31, 2016 | |||||||||||
Revenues | $ | 70,921 | $ | 45,284 | $ | 116,205 | |||||
Direct operating costs | 61,279 | 42,744 | 104,023 | ||||||||
Segment operating profits | $ | 9,642 | $ | 2,540 | $ | 12,182 | |||||
Depreciation and amortization | $ | 26,246 | $ | 26,128 | $ | 52,374 | |||||
Loss on impairment of assets | $ | 25 | $ | 14,512 | $ | 14,537 | |||||
Restructuring costs | $ | 7,548 | $ | — | $ | 7,548 | |||||
Capital expenditures (1) | $ | 4,293 | $ | 4,408 | $ | 8,701 | |||||
Total assets | $ | 611,090 | $ | 434,663 | $ | 1,045,753 | |||||
Long lived assets | $ | 142,509 | $ | 90,853 | $ | 233,362 | |||||
(1) Capital expenditures listed above include all cash and non-cash additions to property and equipment, including capital leases and fixed assets recorded in accounts payable at year-end. | |||||||||||
Successor | Predecessor | |||||||||||
April 13 through December 31, 2017 | January 1 through April 12, 2017 | Year Ended December 31, 2016 | ||||||||||
Reconciliation of Operating Loss As Reported: | ||||||||||||
Segment profits | $ | 16,246 | $ | 3,606 | $ | 12,182 | ||||||
Less: | ||||||||||||
General and administrative expense | 14,229 | 5,012 | 18,832 | |||||||||
Depreciation and amortization | 20,051 | 13,601 | 52,374 | |||||||||
Loss on impairment of assets | — | — | 14,537 | |||||||||
Restructuring costs | — | — | 7,548 | |||||||||
Operating loss | (18,034 | ) | (15,007 | ) | (81,109 | ) | ||||||
Other income (expenses), net | (7,708 | ) | 42,262 | (27,848 | ) | |||||||
Pre-tax income (loss) | $ | (25,742 | ) | $ | 27,255 | $ | (108,957 | ) | ||||
62
Successor | Predecessor | |||||||
December 31, 2017 | December 31, 2016 | |||||||
Reconciliation of Total Assets As Reported: | ||||||||
Total reportable segments | $ | 215,134 | $ | 1,045,753 | ||||
Elimination of intercompany transactions | (311,147 | ) | (1,935,640 | ) | ||||
Parent | 297,770 | 1,202,768 | ||||||
Total assets | $ | 201,757 | $ | 312,881 | ||||
16. Equity Securities
Successor
On the Effective Date, FES Ltd. created the New Common Stock, which carries the following rights:
• Voting. Holders of the New Common Stock are entitled to one vote per share of New Common Stock owned as of the relevant record date on all matters submitted to a vote of stockholders. Except as otherwise required by Delaware law, holders of New Common Stock (as well as holders of any preferred stock of FES Ltd. entitled to vote with such common stockholders) vote together as a single class on all matters presented to the stockholders for their vote or approval, including the election of directors. The election of directors is determined by a plurality of the votes cast by the stockholders present in person or represented by proxy at the meeting and entitled to vote thereon. All other matters are determined by the vote of a majority of the votes cast by the stockholders present in person or represented by proxy at the meeting and entitled to vote thereon, unless the matter is one upon which, by applicable law, the rules or regulations of any stock exchange applicable to FES Ltd., the Certificate of Incorporation of FES Ltd., or the Certificate of Incorporation, or the Second Amended and Restated Bylaws of FES Ltd., or the Bylaws, a different vote is required, in which case such provision shall govern and control the decision of such matter.
• Dividends. Subject to provisions of applicable law and the Certificate of Incorporation, dividends may be declared by and at the discretion of the Board at any meeting and may be paid in cash, in property, or in shares of stock of FES Ltd.
• Liquidation, dissolution or winding up. Except as otherwise required by the Certificate of Incorporation or the Bylaws, in the event of the liquidation, dissolution or winding-up of FES Ltd., holders of New Common Stock will have all rights and privileges typically associated with such securities as set forth in the General Corporation Law of the State of Delaware in relation to rights upon liquidation.
• Restrictions on transfer. The New Common Stock is not subject to restrictions on transfer as a result of the Certificate of Incorporation or the Bylaws. Nevertheless, there may be restrictions imposed by applicable securities laws or by the terms of other agreements entered into in the future. The Bylaws permit FES Ltd. to place restrictive legends on its share certificates in order to ensure compliance with these restrictions.
• Other rights. Holders of the New Common Stock have no preemptive, redemption, conversion or sinking fund rights.
The rights, preferences, and privileges of the holders of the New Common Stock will be subject to, and may be adversely affected by, the rights of the holders of any series of preferred stock that may be issued by FES Ltd.
Predecessor
Common Stock
Holders of common stock had no pre-emptive, redemption, conversion, or sinking fund rights. Holders of common stock were entitled to one vote per share on all matters submitted to a vote of holders of common stock. Unless a different majority was required by law or by the bylaws, resolutions to be approved by holders of common stock required approval by a simple majority of votes cast at a meeting at which a quorum was present. In the event of the liquidation, dissolution, or winding up of the Company, the holders of common stock were entitled to share equally and ratably in the Company’s assets, if any, that remained after the payment of all of its debts and liabilities, subject to any liquidation preference on any issued and outstanding preferred stock.
63
Series B Preferred Stock
Under the Company's Series B Certificate of Designation, the Company was authorized to issue 825,000 shares of Series B Senior Convertible Preferred Stock, or the Series B Preferred Stock, par value $0.01 per share. This is presented as temporary equity on the balance sheet. The common stock into which the Series B Preferred Stock was convertible had certain demand and “piggyback” registration rights. There were 588,059 shares of Series B Preferred Stock outstanding as of December 31, 2016.
The value of the Series B Preferred Stock, for accounting purposes, was being accreted up to redemption value from the date of issuance to the earliest redemption date of the instrument using the effective interest rate method. If the Series B Preferred Stock had been redeemed as of December 31, 2016, the redemption amount applicable at such date would have been approximately $15.6 million.
The primary terms of the Series B Preferred Stock were as follows:
Rank - The Series B Preferred Stock ranked senior in right of payment to the common stock and any class or series of capital stock that is junior to the Series B Preferred Stock, and pari passu with any series of the Company's preferred stock that is by its terms ranked pari passu in right of payment as to dividends and liquidation with the Series B Preferred Stock.
Conversion - The Series B Preferred Stock was convertible into the Company's common stock at an initial rate of nine common shares per share of Series B Preferred Stock (as adjusted for the Share Consolidation).
Dividends Rights - The Series B Preferred Stock was entitled to receive preferential dividends equal to five percent (5%) per annum of the original issue price per share, payable quarterly in February, May, August, and November of each year. Such dividends could be paid by the Company in cash or in kind (in the form of additional shares of Series B Preferred Stock). Although the dividends paid on February 28, 2016 were paid in cash, all other dividends due in 2016 and 2017 were paid in kind.
Certain of the redemption features were outside of the Company's control, and as a result, the Series B Preferred Stock was reflected in the consolidated balance sheet as temporary equity.
Preferred stock dividends were recorded at their fair value. If paid in kind, the fair value of the preferred stock dividends was determined using valuation techniques that include a component representing the intrinsic value of the dividends (which represents the fair value of the common stock into which the preferred stock could be converted) and an option component (which is determined using a Black-Scholes Option Pricing Model). Dividends and accretion for the year ended December 31, 2016 (Predecessor) was $0.8 million.
As discussed in Note 2 - Chapter 11 Proceedings to our Consolidated Financial Statements, on the Effective Date, the Prior Preferred Stock was extinguished without recovery.
64
Item 9.Changes in or Disagreements with Accountants on Accounting and Financial Disclosure
None.
Item 9A. | Controls and Procedures |
Evaluation of Disclosure Controls and Procedures
The Company's management, with the participation of its chief executive officer and chief financial officer, evaluated the effectiveness of the Company's disclosure controls and procedures as of December 31, 2017. The term “disclosure controls and procedures,” as defined in Rules 13a-15(e) and 15d-15(e) under the Securities Exchange Act of 1934, as amended or the Exchange Act, means controls and other procedures of a company that are designed to ensure that information required to be disclosed by a company in the reports that it files or submits under the Exchange Act is recorded, processed, summarized and reported, within the time periods specified in the SECs rules and forms. Disclosure controls and procedures include, without limitation, controls and procedures designed to ensure that information required to be disclosed by a company in the reports that it files or submits under the Exchange Act is accumulated and communicated to the Company’s management, including its principal executive and principal financial officers, as appropriate to allow timely decisions regarding required disclosure. Management recognizes that any controls and procedures, no matter how well designed and operated, can provide only reasonable assurance of achieving their objectives and management necessarily applies its judgment in evaluating the cost-benefit relationship of possible controls and procedures. Based on the evaluation of the Company's disclosure controls and procedures as of December 31, 2017, the Company's chief executive officer and chief financial officer concluded that, as of such date, the Company's disclosure controls and procedures over financial reporting were effective.
Management's Report on Internal Control Over Financial Reporting
Management of the Company is responsible for establishing and maintaining adequate internal control over financial reporting, as such term is defined in Rule 13(a)-15(f) or Rule15d-15(f) under the Exchange Act. Internal control over financial reporting is a process to provide reasonable assurance regarding the reliability of the Company's financial reporting for external purposes in accordance with U.S. generally accepted accounting principles. Internal control over financial reporting includes maintaining records that, in reasonable detail, accurately and fairly reflect the Company's transactions; providing reasonable assurance that transactions are recorded as necessary for preparation of the Company's financial statements in accordance with U.S. generally accepted accounting principles; providing reasonable assurance that receipts and expenditures of company assets are made in accordance with authorizations of the Company’s management and board of directors; and providing reasonable assurance that unauthorized acquisition, use or disposition of company assets that could have a material effect on the Company's financial statements would be prevented or detected on a timely basis.
The Company's management conducted an evaluation of the effectiveness of internal control over financial reporting based on the Internal Control—Integrated Framework (2013) issued by the Committee of Sponsoring Organizations of the Treadway Commission. Based on the evaluation of the Company's internal control over financial reporting as of December 31, 2017, the Company's chief executive officer and chief financial officer concluded that, as of such date, the Company's internal control over financial reporting is effective.
Changes in Internal Control Over Financial Reporting
No change in the Company's internal control over financial reporting (as defined in Rules 13a-15(f) and 15d-15(f) under the Exchange Act) occurred during the fourth quarter of 2017 that has materially affected, or is reasonably likely to materially affect, the Company's internal control over financial reporting.
Item 9B. | Other Information |
Not applicable.
65
PART III
Item 10. | Directors, Executive Officers and Corporate Governance |
Identification of Directors
We currently have six members of the Board, who serve in separate classes, or Class I, Class II or Class III directors. Our Certificate of Incorporation provides that Class I’s term expires at the first annual meeting after such Class I directors’ election or appointment; Class II’s term expires at the second annual meeting after such Class II directors’ election or appointment; and Class III’s term expires at the third annual meeting after such Class III directors’ election or appointment.
The name, age as of March 30, 2018, principal occupation, and other information highlighting the particular experience, qualifications, attributes and skills of each of the Company are set forth below.
Class I Directors
Lawrence First, 56, currently serves as the Chief Investment Officer and Managing Director of Ascribe Capital LLC (“Ascribe”). Mr. First joined Ascribe in 2008. Prior to joining Ascribe, Mr. First was a Managing Director and Co-Portfolio Manager in Merrill Lynch’s Principal Credit Group, a proprietary investing platform for the firm’s capital, where he was responsible for evaluating and managing assets in the team’s North American portfolio, including non-investment grade bank loans, stressed/distressed fixed income investments and public and private equity. Prior to joining Merrill Lynch in 2003, Mr. First was a senior partner in the Bankruptcy and Restructuring department of the law firm of Fried, Frank, Harris, Shriver & Jacobson LLP, where he began his legal career in 1987. At Fried Frank, he represented both debtors and creditors in both in-court and out-of court restructurings as well as lenders to, investors in, and potential buyers and sellers of, financially troubled companies. Prior to his joining Fried Frank’s Bankruptcy and Restructuring department, he was a member of its Corporate Department, where he became a partner in 1994. On behalf of Ascribe Capital LLC, Mr. First currently sits on the board of directors of Geokinetics Inc. since 2013, EnviroSolutions Inc. since July 2010 and Engineering Solutions & Products, LLC since November 2013. He was a director on the board of Alion Science and Technology Corp. from August 2014 until August 2015. Mr. First received a Bachelor of Arts in History and Sociology from Haverford College, and a Juris Doctor from New York University School of Law. He also attended the London School of Economics. Mr. First’s background in the financial and legal industries provides valuable expertise to the Board.
Brett G. Wyard, 48, is a Founder and has served as Managing Partner of Solace Capital Partners since April 2014. Beginning in April 2013, Mr. Wyard spent the year planning and preparing for the founding of Solace Capital Partners. Prior to that, Mr. Wyard was with The Carlyle Group from 2005 to 2012, where he was involved with the raising and investing of $1.9 billion as a Global Partner, Managing Director and Co-head of Carlyle Strategic Partners. Prior to Carlyle, from 1999 to 2005, Mr. Wyard was Managing Director at Oaktree Capital Management as one of the senior members in the firm’s flagship Opportunities Funds. Between 1992 and 1999, Mr. Wyard had roles at Miller & Schroeder, Voyageur Asset Management, the Financial Restructuring Group at Houlihan Lokey Howard & Zukin, and the Global Special Situations Group at Merrill Lynch. Mr. Wyard received a Bachelor of Arts degree in Economics from Boston College. In addition to the Forbes Board, Mr. Wyard is currently a member of the Board of Directors of Select Interior Concepts Inc., the Board of Regents of Boston College, and the Board of Trustees of the St. John’s Health Center Foundation and the Young Presidents’ Organization. Mr. Wyard’s experience in the financial industry, particularly as it relates to corporate restructurings, provides valuable expertise to the Board.
Class II Directors
John E. Crisp, 55, is the President and Chief Executive Officer of the Company and was appointed to such offices and elected as a director and Chairman of the Board upon the Company’s formation effective April 11, 2008. Since January 1, 2008, Mr. Crisp has been President and Chief Executive Officer of Forbes Energy Services LLC and since June 2007, Mr. Crisp has served as an executive officer of each of TX Energy Services, LLC and C.C. Forbes, LLC, the entities that now serve as the principal operating subsidiaries of the Company (the “Operating Subsidiaries”). Prior to that time, Mr. Crisp helped found the predecessor entities of the Operating Subsidiaries in 2003 and was Director of Operations of one such predecessor entity, TX Energy Services, L.P., from its founding until the reorganization of the Operating Subsidiaries as Delaware limited liability companies in June 2007. Prior to assisting in the founding of the predecessor entities to the Operating Subsidiaries in 2003, Mr. Crisp was a Division Manager at Key Energy from 1998 to 2003. Key Energy acquired Dawson Production Services (“Dawson”) shortly after Dawson acquired Hellums Services, Inc. in 1998. Mr. Crisp became a partner of Hellums in 1995, after serving as their Equipment and Safety Manager from 1990, and served in the same capacity until it was sold to Dawson in 1998, at which time Mr. Crisp was serving as a district manager. Mr. Crisp started in the energy industry in 1978, working as an equipment operator. Mr. Crisp has over 33 years of oilfield services industry experience and has on three separate occasions built and later sold oilfield service businesses. Mr. Crisp currently serves as a director of Texas Champion Bank and Brush Country Bank. He also serves in various management capacities with regard to certain business ventures described under “Certain Relationships and Related Transactions” beginning on page 80.
66
Mr. Crisp is one of the founders of the Company and its Chief Executive Officer. As such, Mr. Crisp has a thorough understanding of the Company, its operations and the industry in which it operates. Under his leadership, the Company has grown from a small South Texas company to a major North American provider of production and well services. Mr. Crisp’s knowledge of the Company, combined with his long experience working in the oilfield services industry make him an indispensable member of the Board.
David B. Rosenwasser, 47, Since March 2018, Mr. Rosenwasser has been an independent consultant with a focus on the energy industry. From December 2016 through February, 2018, Mr. Rosenwasser served as Chief Executive Officer of Pinnacle Advanced Reliability Technologies, a company focused on building, implementing and maintaining comprehensive asset reliability and integrity programs in the oil and gas, chemical, mining, pharmaceutical, wastewater and electric power industries. From November 2015 through November 2016, Mr. Rosenwasser was involved in private consulting and personal investment activities. Previously, Mr. Rosenwasser worked at Gulfmark Offshore, Inc. where he served in a number of executive roles beginning in September 2001, including Executive Vice President and Chief Operating Officer from June 2012 until his promotion to Senior Executive Vice President in the same function in February 2013, a position he held through October 2015. Prior to that, he worked at Lehman Brothers as an investment Banking Analyst and then Associate in their Natural Resources Group, from July 1997 to August 2001. Mr. Rosenwasser brings to the Board valuable expertise in the areas of business and finance related to the oil and gas industry.
Class III Directors
Rome G. Arnold III, 62, since January 2017, has served as a Senior Advisor at Rose and Co., a financial-technology startup company with a focus on digital media. From August 2016 to January 2017, Mr. Arnold was an independent private investor managing his personal investments. From January 2012 through August 2016, Mr. Arnold was a Managing Director at UBS Securities in their Energy Group serving as the Head of Oil Field Services. Mr. Arnold received his Bachelor of Arts in Psychology and History of Art from Yale College. He received his Master of Business Administration from Harvard Business School. Mr. Arnold brings to the Board valuable expertise in the areas of business and finance related to the oil and gas industry.
Paul S. Butero, 61, since October 2015, has served as the Executive Chairman of Laney Directional Drilling Co. and as an Operating Partner of Altos Energy Partners LLC. From May 2015 to October 2015, Mr. Butero worked as an independent consultant focused on mergers and acquisitions. From October 2012 to May 2015, Mr. Butero served as the President and Chief Executive Officer of Nine Energy Service LLC, a SCF Partners OFS portfolio company focused on the completion phase of resource development. Prior to joining Nine Energy Service LLC, Mr. Butero enjoyed over 32 years with Baker Hughes Incorporated, most recently serving as President of US Land Operations. He also served as President of Hughes Christensen Company (drill bits), President of Baker Atlas (wireline), and President of Baker Hughes Inteq (drilling systems). He also held a Vice President role in operations, sales and marketing as well as a number of operational management positions both domestically and internationally. Mr. Butero received his Bachelor of Arts in Geography from the University of Colorado in Boulder. Mr. Butero’s experience as an executive in the oil and gas industry brings valuable expertise to the Board.
Identification of Executive Officers
The names, ages as of March 30, 2018, position and other information concerning the Company’s executive officers are set forth below.
Name | Age | Position |
John E. Crisp | 55 | Chairman of the Board, President and Chief Executive Officer |
L. Melvin Cooper | 64 | Senior Vice President, Chief Financial Officer and Assistant Secretary |
Steve Macek | 61 | Executive Vice President and Chief Operating Officer |
John E. Crisp is our President and Chief Executive Officer and was appointed to such offices and elected as a director and Chairman of the Board upon the Company’s formation effective April 11, 2008. Please refer to the section entitled “Identification of Directors - Class II Directors” above for additional information with respect to Mr. Crisp’s background and experience.
L. Melvin Cooper is our Senior Vice President, Chief Financial Officer and Assistant Secretary and was appointed to such offices upon the Company’s formation effective April 11, 2008. Mr. Cooper also serves as the Senior Vice President and Chief Financial Officer of each of the Operating Subsidiaries. Prior to joining Forbes in 2007, Mr. Cooper served as the Chief Financial Officer or President of companies involved in site preparation for oil and gas exploration companies, supplying products and services to new home builders, and supply chain management. Mr. Cooper has been a Director of Flotek Industries, Inc. (NYSE: FTK) since 2010. He is also a member of the Board of Directors for Par Pacific Holdings, Inc. (NYSE: PARR), where he has served since August 2012. In July 2016, Mr. Cooper joined the Board of Directors of SAExploration Holdings, Inc. (NASDAQ: SAEX). Mr. Cooper earned a degree in accounting from Texas A&M University - Kingsville (formerly Texas A&I) in 1975. Mr. Cooper has been a Certified Public Accountant since May 1977.
67
Steve Macek is our Executive Vice President and Chief Operating Officer and was appointed to such offices on April 14, 2017. Prior to such appointments, Mr. Macek served as the Executive Vice President of Well Servicing of C.C. Forbes LLC since 2014. From 2007 to 2014, Mr. Macek served as the Vice President of Well Servicing of C.C. Forbes, LLC. Mr. Macek received his Bachelor of Business Administration in Marketing from Texas A&M University in Kingsville.
Section 16(a) Beneficial Ownership Reporting Compliance
Section 16(a) of the Exchange Act requires our officers and directors, and persons who own more than 10% of a registered class of our equity securities, to file reports of ownership and changes in ownership with the Commission and NASDAQ. Officers, directors and greater than 10% stockholders are also required by Commission regulations to furnish us with copies of all Section 16(a) forms they file.
Based solely on a review of the Forms 3 and 4 and amendments thereto filed during the 2017 fiscal year and written certifications provided to the Company, the Company believes that all of these reporting persons timely complied with their filing requirements, except David B. Rosenwasser filed a Form 3 late with respect to his appointment as an independent director on November 9, 2017.
Availability of Committee Charters and Codes of Ethics
The Company’s Second Amended and Restated Audit Committee Charter and Amended and Restated Compensation Committee Charter, as well as the Company’s Second Amended and Restated Corporate Governance Guidelines, Third Amended and Restated Employee Code of Business Conduct and Ethics (which applies to all employees including executive officers and includes a portion of the policy applicable specifically to executive officers), and Second Amended and Restated Code of Business Conduct and Ethics for Members of the Board, can all be found, free of charge, on the Investor Relations page of the Company’s website, www.forbesenergyservices.com. We intend to disclose any changes to or waivers from the Third Amended and Restated Employee Code of Business Conduct and Ethics applicable to the executive officers and the Second Amended and Restated Code of Business Conduct and Ethics for Members of the Board that would otherwise be required to be disclosed under Item 5.05 of Form 8-K on the Company’s website. We will also provide printed copies of these materials to any stockholder or other interested person upon request to Forbes Energy Services Ltd., Attn: L. Melvin Cooper, 3000 South Business Highway 281, Alice, Texas 78332. The information on the Company’s website is not, and shall not be deemed to be, a part of this report or incorporated into any other filings we make with the Securities and Exchange Commission, or the Commission.
Stockholder Nominees for Director
There have been no material changes to the procedures by which stockholders may recommend nominees to the Board.
Audit Committee of the Board
The audit committee has been structured to comply with the requirements of Section 3(a)(58)(A) of the Exchange Act. The audit committee is comprised of Messrs. Arnold, Butero and Rosenwasser. Mr. Arnold is the chair of the audit committee. The Board has determined that the audit committee members have the appropriate level of financial understanding and industry specific knowledge to be able to perform their duties on the committee, are financially literate and qualify as audit committee financial experts as defined in Item 407(d)(5)(ii) of Regulation S-K under the Exchange Act and are all independent as that term is defined under NASDAQ rules. The Second Amended and Restated Audit Committee Charter may be found on the Investor Relations page of the Company’s website, www.forbesenergyservices.com.
Item 11. | Executive Compensation |
Overview
We are currently considered a smaller reporting company for purposes of the Commission’s executive compensation disclosure rules. In accordance with such rules, we are required to provide a Summary Compensation Table and an Outstanding Equity Awards at Fiscal Year-End Table, as well as limited narrative disclosures. Further, our reporting obligations extend only to the individuals serving as our Chief Executive Officer and our two next most highly compensated executive officers.
This summary focuses primarily on the information in the tables below and related footnotes, as well as the supplemental narratives, relating to the fiscal year ended December 31, 2017. As a smaller reporting company, we are not required to provide, and do not purport to provide, all of the disclosures required for “Compensation Discussion and Analysis” as set forth in Rule 402(b) under Regulation S-K.
Compensation Program Philosophy and Objectives
Our philosophy on the compensation of our executive officers is to provide competitive salary levels and compensation incentives that attract and retain individuals of high quality, recognize performance and align executive goals with the short-term and long-term objectives of the Company and our stockholders. Our compensation program is designed to reward performance, leadership and loyalty. The elements of our executive compensation program for our executive officers consist of base salary and
68
benefits, cash bonuses and cash incentive awards and equity incentive awards. We provide base salary and benefits in order to compensate executive officers for their day-to-day services rendered to the Company, cash bonuses and cash incentive awards in order to encourage achievement of operating results over the short-term and equity incentive awards in order to better align the interests of our executive officers with the long-term interests of our stockholders. We believe that each of these three principal elements play a role in achieving our overall compensation objective of attracting and maintaining high quality individuals, recognizing performance and aligning executive goals with the objectives of the Company.
We do not have a formal policy for allocating between cash and non-cash compensation, generally, or with respect to our named executive officers. Each year, the compensation committee evaluates each element of compensation separately and as a whole. In making this evaluation, the compensation committee generally considers information regarding such executive officer’s performance; the performance of the Company, past compensation practices and general industry information. In 2015, the Company engaged a compensation consultant to prepare a study of peer group compensation practices. These peer companies were reviewed and approved by the compensation committee for assessing the competitiveness of 2015 and 2016 compensation levels. A discussion of how this comparison was conducted and a list of the peer companies considered is provided in the section entitled “How and why we benchmark compensation against our peers,” below. In 2017, prior to the Effective Date, the Company did not change its approach to compensation. However, on the Effective Date, the Company’s executive officers entered into new employment agreements, and the Company made other changes to its approach to compensation that are described below.
Base Salary
As stated above, we provide base salary to our executive officers in order to compensate such officers for the services they provide to the Company, on a day-to-day basis. The base salaries for the executive officers were initially set in April 2017, when we entered into new employment agreements with such officers at the time we exited from our chapter 11 reorganization. Salaries for Messrs. Crisp and Cooper were the same salaries that were in effect since 2012. The salary level for Messr. Macek was effective as of the date of the reorganization when he assumed the title and responsibilities of Chief Operating Officer. The compensation committee will from time to time evaluate those salaries based on the contributions made, responsibilities assumed and skills possessed by each such executive, as well as the condition of the Company and the overall energy services industry.
The compensation committee determined that the base salary of Messrs. Crisp, Cooper and Macek of $652,224, $432,508 and $410,818, respectively, should remain unchanged for 2018. These salaries are based on the factors described above and an earlier review of compensation practices of our peer group, which is described in greater detail in the section entitled “How and why we benchmark compensation against our peers” beginning on page 71. With respect to setting the salary of Mr. Cooper, specifically, the compensation committee felt, and continues to feel, that Mr. Cooper’s talents and achievements, including the completion of the reorganization and exit financings, make him well qualified to take a position in a company whose size exceeds our peer group. Further, the compensation committee was particularly mindful of the broad scope of responsibilities assumed by Mr. Cooper, including those associated with a treasurer, corporate secretary, mergers and acquisitions director, and investor relations, which may not be performed by chief financial officers in other similarly situated companies.
Benefits and Perquisites.
The Company provides the executive officers and other employees with perquisites and other personal benefits as part of providing a competitive executive compensation program. The Company provides its executive officers with health, medical, dental and life insurance coverage, as it does for all of its employees, provided that with regard to these benefit plans, the Company compensates the executives for the cost of certain premiums for such plans that are not covered for all employees. The cost of such premiums are included in the executive officer salaries referenced above.
Messrs. Crisp and Macek have also been provided company trucks, which are used to access work sites and for other business-related purposes. Further, Messrs. Crisp and Cooper receive a monthly vehicle allowance. This vehicle allowance is also available to certain managers and full-time employees.
Annual Bonuses and Cash Incentive Compensation and Related Stock Grants
The Company uses cash compensation in excess of base salary to encourage achievement of operating results and to create a competitive compensation package for our executive officers. For fiscal year 2017, the compensation committee adopted a formal plan, which we refer to as our annual bonus plan or our STIP. The compensation committee believes that the adoption of this performance incentive compensation approach, which operates under our Plan, brings greater certainty and executive accountability to the Company’s compensation package.
For fiscal year 2017, the target awards under the annual bonus plan were based on a percentage of each named executive officer’s base salary. In the case of Mr. Crisp, his target award was 100% of base salary. In the case of Messrs. Cooper and Macek, their target award was 70% of their base salary.
In previous years, the Company used adjusted EBITDA as the primary financial metric for assessing short-term corporate performance and as a measurement to reward its executive officers. The Company continued to use adjusted EBITDA as the primary financial metric for assessing short-term corporate performance, with 75% of the potential short-term award being based
69
on adjusted EBITDA, 37.5% for the short-term award being based on achieving adjusted EBITDA of at least $2 million (the “First EBITDA Component”) and another 37.5% for the short-term award being based on achieving adjusted EBITDA of at least $10 million (the “Second EBITDA Component”), or if adjusted EBITDA were between $2 million and $10 million, then the percentage applicable to the Second EBITDA Component would be interpolated on a straight-line basis between $2 million and $10 million, provided that, the total Performance Component Award Earned for the First EBITDA Component and the Second EBITDA Component, combined, shall not exceed 75% of the Maximum Award of any named executive officer. For fiscal year 2017, 25% of the award under the annual bonus plan being based on the Company’s safety record as compared to the Industry Total Recordable Incident Rate for the North American Industry Classification System code for oil and gas operations (NAICS 213112) as published by the Bureau of Labor Statistics in October 2016. These percentages are referred to as the “Component Percentage.” Each performance component contributed to the value of the total annual bonus for each executive as discussed below.
The compensation committee established the First EBITDA Component of at least $2 million and the Second EBITDA Component of at least $10 million for fiscal year 2017, provided that, the percentage applicable to the Second EBITDA Component would be interpolated on a straight-line basis for adjusted EBITDA between $2 million and $10 million, as discussed above. The 2017 performance of the Company and the officers entitled each of Messrs. Crisp, Forbes and Macek to receive short-term incentive compensation of 37.5% of the target awards for the First EBITDA Component and 52% of the target awards for the interpolated Second EBITDA Component.
The safety component of the 2017 target cash incentive compensation was based on the Company achieving a target total recordable incident rate (“TRIR”) that is equal or less (i.e., better) than the industry average TRIR for the North American Industry Classification System code for oil and gas operations (NAICS 213112) as published by the Bureau of Labor Statistics in October 2016. Achievement of TRIR that is better than the industry average earns incentive compensation of 100% of the target cash incentive compensation multiplied by the Component Percentage. For 2017, the TRIR for the North American Industry Classification System code for oil and gas operations (NAICS 213112) as published by the Bureau of Labor Statistics in October 2016 was 1.1, while the Company reported a TRIR of 0.7, meaning the Company achieved a safety record for 2017 that was approximately 64% of the industry average TRIR for the North American Industry Classification System code for oil and gas operations.
The compensation committee determined that, because the Company’s safety record was better than the industry average for 2017, each officer was entitled to receive the 25% Component Percentage times the target award.
Although management envisions using the same compensation structure for 2018, the threshold, target and maximum levels of performance for each component performance metric have not yet been approved for 2018.
Equity Incentive Awards
The Company uses equity incentive awards in order to better align the interests of our executive officers with the long-term interests of our stockholders and to create a competitive compensation package for such officers.
On August 28, 2017, based on the approval of the compensation committee, the Company granted (i) 181,440, 86,395 and 86,400 time-based restricted stock units (the “Time-Based RSUs”) respectively to Mr. John E. Crisp (President and Chief Executive Officer), Mr. L. Melvin Cooper (Senior Vice President, Chief Financial Officer) and Mr. Steve Macek (Executive Vice President and Chief Operating Officer), and (ii) 9,220, 4,390 and 4,390 exit financing restricted stock units (the “Exit Financing RSUs”) respectively to Messrs. Crisp, Cooper and Macek.
The Time-Based RSUs and the Exit Financing RSUs (i) were granted under the 2017 Management Incentive Plan (the “MIP”), (ii) are consistent with the reorganization and (iii) are governed by the Form of Time-Based Restricted Stock Unit Award Agreement and the Form of Exit Financing Time-Based Restricted Stock Unit Award Agreement disclosed on Exhibits 10.8 and 10.0, respectively, to the Company’s quarterly report on Form 10-Q for the quarter ended March 31, 2017.
The Time-Based RSUs vested 20% on the date of grant and will vest 20% each on the first, second, third and fourth anniversaries of the date of grant. The Exit Financing RSUs will vest (i) 40% on the first day following the date that is eighteen (18) months after the date of grant with the remainder vesting, (ii) 20% each on the second and third anniversaries of the date of grant, and (iii) 20% one day prior to the fourth anniversary of the date of grant.
Each of Messrs. Crisp, Mr. Cooper and Mr. Macek were provided with an opportunity to defer the settlement of the Time-Based RSUs and the Exit Financing RSUs. Mr. Cooper elected to defer the settlement of 9,279 of his Time-Based RSU shares that vested on August 28, 2017.
Clawback Policy
In March 2012, the compensation committee adopted a policy to recover incentive-based compensation paid to any executive officer as required by the provisions of the Dodd-Frank Act, any regulations or rules promulgated thereunder, or any other “clawback” provision required by applicable law or the listing standards of the NASDAQ Global Market. On May 13, 2014, the Company entered into agreements with Messrs. Crisp and Cooper and on March 20, 2018 with Mr. Macek to implement this policy.
70
Stock Ownership Policy
In March 2015, the compensation committee adopted a stock ownership policy, which applies to the Company’s named executive officers and directors. The policy provides a number of shares that the Company’s named executive officers must accumulate and hold within five years of the date such individual became subject to the policy. The specific ownership requirement for the Company’s chief executive officer and for each of the other named executive officers is being reviewed for the purpose of amending it to conform to the new equity structure in place since the Effective Date. The stock ownership guidelines for directors are detailed in the section entitled “2017 Director Compensation.”
Tax and Accounting Treatment Issues
Under Section 162(m) of the Code, the Company may not deduct, for federal income tax purposes, compensation paid in excess of $1,000,000 to a named executive officer employed by the Company at year-end. In order to ensure competitive levels of total compensation for our executive officers, there may be circumstances in which the Company’s interests are best served by approving compensation for its executive officers that will not meet the requirements of Section 162(m) of the Code and, therefore, will not be deductible by the Company for federal income tax purposes. Accordingly, the compensation committee may approve compensation for one or more of its executive officers that is not deductible for federal income tax purposes.
How and why we benchmark compensation against our peers
We operate in a competitive industry and compete with other companies in that industry for executive officers. In order to ensure that our compensation is effective at attracting and retaining executive talent, we feel it is appropriate to compare our compensation with other companies in our industry.
In 2015, Towers Watson was engaged to provide a study of compensation programs of executive officers and directors offered by a broad peer group in order to assist the compensation committee in establishing and maintaining an appropriate compensation program to better enable the Company to attract and retain highly qualified officers and directors. Based on analysis and survey data provided by Towers Watson, in March, 2015, the compensation committee approved a group of peer companies for 2015 (and again for 2016) compensation decisions. The peer companies listed below reflect the list approved by the compensation committee, except that the companies that are no longer in existence have been omitted.
Basic Energy Services, Inc.
•C & J Energy Services, Inc.
•CARBO Ceramics Inc.
•Dawson Geophysical Company
•Dril-Quip, Inc.
•Gulf Island Fabrication Inc.
•Gulfmark Offshore, Inc.
•Helix Energy Solutions Group, Inc.
•Hombeck Offshore Services, Inc.
•ION Geophysical Corporation
•Key Energy Services Inc.
•Matrix Service Company
•Nabors Industries Ltd.
•Newpark Resources Inc.
•Nuverra Environmental Solutions, Inc.
•Parker Drilling Co.
•PHI Inc.
•Pioneer Energy Services Corp.
•RigNet, Inc.
•SEACOR Holdings Inc.
•Superior Energy Services, Inc.
•TETRA Technologies, Inc.
How and why we plan to use adjusted EBITDA to determine whether incentive cash compensation has been earned
71
The term “Adjusted EBITDA” means, with respect to the Company and its subsidiaries, income (loss) from continuing operations before interest, taxes, depreciation, amortization, gain or loss on early extinguishment of debt, non-cash stock-based compensation, merger and acquisition costs, and litigation settlements from claims originating before January 22, 2017, excluding extraordinary items, other non-recurring items, and material out-of-period adjustments. Adjusted EBITDA may include or exclude other items as the Compensation Committee of the Board, in its sole discretion, may deem reasonable or appropriate.
Adjusted EBITDA is a non-GAAP financial measure that is used as a supplemental financial measure by our management and directors and by our investors to assess the financial performance of our assets without regard to financing methods, capital structure or historical cost basis; the ability of our assets to generate cash sufficient to pay interest on our indebtedness; and our operating performance and return on invested capital as compared to those of other companies in the well services industry, without regard to financing methods and capital structure. We use adjusted EBITDA in our quarterly earnings releases, investor conference calls and other filings with the Commission.
Due to the significance of adjusted EBITDA as a measure of the performance of the Company, the compensation committee felt that it was appropriate to tie elements of executive compensation with the achievement of a target level of adjusted EBITDA. The adjusted EBITDA target is set by the compensation committee, after receiving the recommendation of management. Our use of adjusted EBITDA for 2018 will be the same as in 2017.
Adjusted EBITDA has limitations as an analytical tool and should not be considered an alternative to net income, operating income, cash flow from operating activities or any other measure of financial performance or liquidity presented in accordance with GAAP. Adjusted EBITDA excludes some, but not all, items that affect net income and operating income and these measures may vary among other companies. Limitations to using Adjusted EBITDA as an analytical tool include:
• Adjusted EBITDA does not reflect our current or future requirements for capital expenditures or capital commitments;
•Adjusted EBITDA does not reflect changes in, or cash requirements necessary to service interest or principal payments on our debt;
•Adjusted EBITDA does not reflect income taxes;
•Although depreciation and amortization are non-cash charges, the assets being depreciated and amortized will often have to be replaced in the future, and Adjusted EBITDA does not reflect any cash requirements for such replacements; and
•Other companies in our industry may calculate Adjusted EBITDA differently than we do, limiting its usefulness as a comparative measure.
The following table sets forth all compensation paid, payable, awarded, granted, given, or otherwise provided, directly or indirectly, by the Company or a subsidiary thereof, in U.S. dollars, to the individuals who were, at December 31, 2017, the Chief Executive Officer, the Chief Financial Officer and the other executive officers whose total annual compensation was more than $100,000.
72
SUMMARY COMPENSATION TABLE
Name and principal position | Year | Salary ($) (1) | Bonus ($) | Stock Awards ($) | Option Awards ($) | Non-Equity Incentive Plan Compensation ($)(2) | Nonqualified Deferred Compensation Earnings ($) | All Other Compensation ($) | Total ($) | |||||||||||
John E. Crisp, President & Chief Executive Officer | 2017 | 664,767 | — | 399,168 | (3) | — | 533,548 | — | 41,679 | (4) | 1,639,162 | |||||||||
2016 | 650,000 | — | 605,277 | (5)(6) | — | — | — | 106,229 | (7) | 1,361,506 | ||||||||||
Charles C. Forbes, Jr. Executive Vice President and Chief Operating Officer (Deceased) (8) | 2017 | 339,994 | — | — | — | — | — | 29,196 | (9) | 369,190 | ||||||||||
2016 | 650,000 | — | 605,277 | (5)(6) | — | — | — | 113,459 | (10) | 1,368,736 | ||||||||||
L. Melvin Cooper, Senior Vice President & Chief Financial Officer | 2017 | 440,825 | — | 190,069 | (3) | — | 244,201 | — | 12,955 | (11) | 888,050 | |||||||||
2016 | 425,000 | — | 277,777 | (12) | — | — | — | 19,113 | (13) | 721,890 | ||||||||||
Steve Macek, Executive Vice President and Chief Operating Officer (14) | 2017 | 390,663 | — | 190,080 | (3) | — | 229,836 | — | — | 810,579 | ||||||||||
(1) These amounts include gross-up payments for insurance premiums in 2017.
(2) The amounts noted reflect the cash incentive payments to the executive officers under the Company’s annual bonus plan for the year ended December 31, 2017.
(3) | The grant date fair values of the restricted stock awards are calculated in accordance with FASB ASC Topic 718. See Note 6 - Share-Based Compensation for additional information regarding the assumptions used to calculate the grant date fair value of the restricted stock awards. |
(4) | The 2017 amount is comprised of $28,596 for fees earned as a director during 2017, prior to the Effective Date, and $13,084 for an automobile and related auto expenses. |
(5) The amounts noted reflect the grant date fair value of (i) two awards of 661,375 restricted stock units each, for a total of 1,322,750 units, granted to each of Messrs. Crisp and Forbes on March 29, 2016, for the two long-term incentive portions of the Company’s annual executive bonus plan for services performed for the year ended December 31, 2016, and (iii) the award of 118,386 restricted stock units granted on March 29, 2016 to each of Messrs. Crisp and Forbes in their capacities as directors for 2016. The grant date fair values of the restricted stock units are calculated in accordance with FASB ASC Topic 718. On March 14, 2017, the Company and each of the named executive officers agreed to cancel, effective as of December 31, 2016, all awards under the Prior Compensation Plan that had not vested as of December 31, 2016.
(6) | In recognition that under the Plan, all prior equity interests (which included the Old Common Stock, the Company’s prior preferred stock, awards under the Prior Compensation Plan and the preferred stock purchase rights under the Rights Agreement) of the Company would be extinguished without recovery. On March 14, 2017, the Company and each of the named executive officers agreed to cancel, effective as of December 31, 2016, all awards granted to such named executive officer that had not vested as of December 31, 2016. |
(7) | The 2016 amount is comprised of $91,750 for fees earned as a director, $2,091 for premiums paid by the Company for health and life insurance and $12,388 for an automobile and related auto expenses. |
(8) | Charles C. Forbes, Jr., who previously served as Executive Vice President and Chief Operating Officer of the Company, elected to retire from his officer positions with the Company and its subsidiaries effective as of the Effective Date, and continued as an employee of the Company on a reduced time commitment basis until his death on February 9, 2018. |
(9) | The 2017 amount is comprised of $22,596 for fees earned as a director during 2017, prior to the Effective Date and $6,600 for an automobile and related auto expenses. |
(10) | The 2016 amount is comprised of $91,750 for fees earned as a director, $9,321 for premiums paid by the Company for health and life insurance and $12,388 for an automobile and related auto expenses. |
(11) | The 2017 amount reflects an allowance for automobile and related auto expenses of $12,955. |
(12) The amount noted reflects the grant date fair value of (i) two awards of 330,687 restricted stock units each, for a total of 661,374 units, granted to Mr. Cooper on March 29, 2016, for the two long-term incentive portions of the Company’s annual executive bonus plan for services performed for the year ended December 31, 2016. The grant date fair values of the restricted stock units are calculated in
73
accordance with FASB ASC Topic 718. On March 14, 2017, the Company and each of the named executive officers agreed to cancel, effective as of December 31, 2016, all awards under the Prior Compensation Plan that had not vested as of December 31, 2016.
(13) | The 2016 amount is comprised of $6,589 for premiums paid by the Company for health and life insurance and $12,524 as an allowance for an automobile and related auto expenses. |
(14) | Steve Macek became the Executive Vice President and Chief Operating Officer of the Company on the Effective Date. |
Narrative Disclosure to Summary Compensation Table
Executive Officers
On April 13, 2017 (the “Effective Date”), Charles C. Forbes, Jr., who previously served as Executive Vice President and Chief Operating Officer of the Company, elected to retire from his officer positions with the Company and its subsidiaries and to retire as a director but continued as an employee of the Company on a reduced time commitment basis until his death on February 9, 2018.
Cancellation of Prior Equity Interests
On the Effective Date, pursuant to the Company’s reorganization, all prior equity interests, including the Old Common Stock, the Company’s prior preferred stock, awards under the Company’s prior incentive compensation plans (the “Prior Compensation Plans”), and the preferred stock purchase rights under the rights agreement dated as of May 19, 2008 as subsequently amended on July 8, 2013 (the “Rights Agreement”), between the Company and CIBC Mellon Trust Company, as rights agent) of the Company were extinguished without recovery. Pursuant to the reorganization, on the Effective Date, the Company created a new class of common stock, par value $0.01 per share (the “New Common Stock”). Accordingly, the Company and each of the named executive officers agreed to cancel, effective as of December 31, 2016, all awards under the Prior Compensation Plan that had not vested as of December 31, 2016.
2017 Management Incentive Plan
On the Effective Date, the MIP became effective.
The compensation committee administers the MIP. The compensation committee has broad authority under the MIP to, among other things: (i) select participants; (ii) determine the terms and conditions, not inconsistent with the MIP, of any award granted under the MIP; (iii) determine the number of shares to be covered by each award granted under the MIP; and (iv) determine the fair market value of awards granted under the MIP, subject to certain exceptions.
Persons eligible to receive awards under the MIP include officers and employees of the Company. The types of awards that may be granted under the MIP include stock options, stock appreciation rights, restricted stock, restricted stock units, performance units, performance shares and other forms of stock based awards.
The maximum number of shares of New Common Stock that may be issued or transferred pursuant to awards under the MIP is 750,000, which number may be increased with the approval of the Company’s stockholders. If any outstanding award granted under the MIP expires or is terminated or canceled without having been exercised or settled in full, or if shares of New Common Stock acquired pursuant to an award subject to forfeiture are forfeited, the shares of New Common Stock allocable to the terminated portion of such award or such forfeited shares will revert to the MIP and will be available for grant under the MIP as determined by the Compensation Committee in consultation with the Chairman of the Board, subject to certain restrictions.
As is customary in management incentive plans of this nature, in the event of any change in the outstanding shares of New Common Stock by reason of a stock split, stock dividend or other non-recurring dividends or distributions, recapitalization, merger, consolidation, spin-off, combination, repurchase or exchange of stock, reorganization, liquidation, dissolution or other similar corporate transaction, an equitable adjustment will be made in order to prevent dilution or enlargement of the benefits or potential benefits intended to be made available under the MIP. Such adjustment may include an adjustment to the maximum number and kind of shares of stock or other securities or other equity interests as to which awards may be granted under the MIP, the number and kind of shares of stock or other securities or other equity interests subject to outstanding awards and the exercise price thereof, if applicable.
Pension and Retirement Plans
We do not have in place any pension or retirement plan with the exception of a 401(k) retirement plan for substantially all of its employees based on certain eligibility requirements. We may provide profit sharing contributions to the plan at the discretion of management. No such discretionary contributions have been made since the inception of the 401(k) retirement plan.
Employment Agreements Upon Our Emergence from the Chapter 11 Reorganization
In connection with our emergence from the chapter 11 reorganization, Forbes Energy Services LLC entered into (i) amended and restated employment agreements, replacing the prior agreements, with Messrs. Crisp and Cooper and (ii) an employment agreement with Mr. Macek. The following summary details the material terms of the employment agreements:
74
•Term. Each of the employment agreements has a current term expiring April 13, 2021, or the Initial Term. The term of each Employment Agreement will automatically extend for an additional year every April 14, commencing April 14, 2021, unless written notice of termination is given between one hundred eighty (180) and two hundred forty (240) days prior to any such renewal date by the employee or the employer.
•Base Salaries. The employment agreements of Messrs. Crisp, Cooper and Macek provide for annual base salaries of $650,000, $425,000 and $400,000 plus compensation for medical and related premiums, respectively, or such other sums as the parties may agree as determined by the Board, during the Initial Term.
•Termination.
• | If the employee terminates his employment for “good reason” (as defined in the employment agreements) or under certain circumstances following a change in control, then such employee would be entitled to his base salary, bonus and other compensation and benefits through the actual expiration date of the remaining term of the employment agreement, and any and all options, rights or awards granted in conjunction with the MIP (other than performance awards) would immediately vest and a “pro rata portion” (as defined in the employment agreements) of each performance award would remain outstanding until the end of the applicable performance period (or, if earlier, until the occurrence of a change in control) and would vest or not based on the actual performance for the performance period or, if applicable, upon the change in control. |
• | If the employer terminates employee’s employment for any reason other than for good cause, then such employee would be entitled to his base salary, bonus and other compensation and benefits through the actual expiration date of the remaining term of the employment agreement, and any and all options, rights or awards granted in conjunction with the MIP (other than performance awards) would immediately vest and a “pro rata portion” of each performance award would remain outstanding until the end of the applicable performance period (or, if earlier, until the occurrence of a change in control) and would vest or not based on the actual performance for the performance period or, if applicable, upon the change in control. |
• | If employee is terminated for good cause or if employee voluntarily terminates his employment other than for good reason, employer will pay any compensation earned but not paid to him prior to the effective date of termination. Employee may voluntarily terminate his employment by giving at least thirty (30) days’ written notice. At that time, employer would have the right to relieve him of his duties; however, his salary would continue during the notice period. |
• | If employee dies or becomes permanently disabled during the term of his employment, employer will pay to his estate the compensation that such employee would have earned through the date of death or determination of permanent disability, including salary, any prior year bonus earned but not yet paid, the pro-rated portion of any current year bonus, any and all options, rights or awards granted in conjunction with the MIP would immediately vest and his dependants would be entitled to benefits, including medical and other benefits and use of an employer automobile for a period of one year. |
•Change in Control. If a change in control of the Company shall occur after the Effective Date, then any and all options, rights or awards to employee in conjunction with the MIP would be deemed to have vested immediately prior to such change in control; provided that, with respect to the immediate vesting of any and all performance awards, such awards would immediately vest if and to the extent determined by the Board at the time of grant and set forth in the applicable award agreement between employee and employer. See “Potential Payments Upon Termination or Change in Control.”
•Restricted Activities. Employee has agreed that, during the term of his agreement and thereafter until the later of (i) the end of the Initial Term or any then applicable extension period and (ii) one year after termination of employment following a notice of non-renewal, regardless of whether the termination occurs with or without cause and regardless of who terminates such employment, he will not, among others, (i) be employed by or associated with or own more than 5% of the outstanding securities of any entity that competes with the Company’s business or (ii) solicit any of our employees to terminate their employment.
•Bonuses. The Compensation Committee has discretion to establish the methodology for determining annual bonuses. The Compensation Committee has not yet made such a determination.
•Permitted Activities. Employee may engage only in those activities set forth in his Employment Agreement and those that would comply with the terms of the covenant applicable to permitted activities.
75
OUTSTANDING EQUITY AWARDS AT FISCAL YEAR END
The following table sets forth for each named executive officer all option-based and share-based awards outstanding at December 31, 2017.
OPTION AWARDS | STOCK AWARDS | ||||||||||||||
Name | Number of Securities Underlying Unexercised Options (#) Exercisable | Number of Securities Underlying Unexercised Options (#) Unexercisable | Equity incentive plan awards: Number of securities underlying unexercised unearned options (#) | Option Exercise Price ($) | Option Expiration Date | Number of Shares or Units of Stock That Have Not Vested (#) | Market Value of Shares or Units of Stock That Have Not Vested ($) | Equity Incentive Plan Awards: Number of Unearned Shares, Units or Other Rights That Have Not Vested (#)(1) | Equity Incentive Plan Awards: Market or Payout Value of Unearned Shares, Units or Other Rights That Have Not Vested ($) | ||||||
John E. Crisp, President & Chief Executive Officer | — | — | — | — | — | — | — | 154,372 | 1,528,283 | ||||||
L. Melvin Cooper, Senior Vice President & Chief Financial Officer | — | — | — | — | — | — | — | 73,506 | 727,709 | ||||||
Steve Macek, Senior Vice President and Chief Operating Officer | — | — | — | — | — | — | — | 73,510 | 727,749 | ||||||
(1) The Time-Based RSUs vested 20% on the date of grant and will vest 20% each on the first, second, third and fourth anniversaries of the date of grant. The Exit Financing RSUs will vest (i) 40% on the first day following the date that is eighteen (18) months after the date of grant with the remainder vesting, (ii) 20% each on the second and third anniversaries of the date of grant, and (iii) 20% one day prior to the fourth anniversary of the date of grant.
Potential Payments Upon Termination or Change In Control
The following narrative discussion outlines the material terms of each contract, agreement, plan or arrangement, whether written or unwritten, that provides for payment(s) to a named executive officer at, following, or in connection with the resignation, retirement or other termination of a named executive officer, or a change in control of the Company, with respect to each named executive officer. Potential payments upon termination, including after change in control, to Messrs. Crisp, Macek and Cooper are governed by the terms of their respective employment agreements. For more information about their employment agreements, see “Employment Agreements Upon Our Emergence from the Chapter 11 Reorganization,” above.
Payments Made Upon Termination for “Good Reason”
If the employee terminates his employment for “good reason” (as defined in the employment agreements) or under certain circumstances following a change in control, then such employee would be entitled to his base salary, bonus and other compensation and benefits through the actual expiration date of the remaining term of the employment agreement, and any and all options, rights or awards granted in conjunction with the MIP (other than performance awards) would immediately vest and a “pro rata portion” (as defined in the employment agreements) of each performance award would remain outstanding until the end of the applicable performance period (or, if earlier, until the occurrence of a change in control) and would vest or not based on the actual performance for the performance period or, if applicable, upon the change in control.
Payments Made Upon Termination Without Good Cause
If the employer terminates the employee’s employment for any reason other than for good cause, then such employee would be entitled to his base salary, bonus and other compensation and benefits through the actual expiration date of the remaining term of the employment agreement, and any and all options, rights or awards granted in conjunction with the MIP (other than performance awards) would immediately vest and a “pro rata portion” of each performance award would remain outstanding until the end of the applicable performance period (or, if earlier, until the occurrence of a change in control) and would vest or not based on the actual performance for the performance period or, if applicable, upon the change in control.
Payments Made Upon a Change in Control
If a change in control of the Company occurs after the Effective Date, then any and all options, rights or awards to employee in conjunction with the MIP would be deemed to have vested immediately prior to such change in control; provided that, with respect to the immediate vesting of any and all performance awards, such awards would immediately vest if and to the extent
76
determined by the Board at the time of grant and set forth in the applicable award agreement between employee and employer.
For purposes of the employment agreements of Messrs. Crisp, Cooper and Macek, and the MIP, a “change in control” means:
(i) Any Person, other than a Significant Shareholder, becomes the “beneficial owner” (as defined in Rule 13d-3 of the Exchange Act), directly or indirectly, of securities of the Company representing more than fifty percent (50%) of the total combined voting power represented by the Company’s then outstanding voting securities; or
(ii) The sale or other disposition of all or substantially all of the assets of the Company to any Person, other than a Significant Shareholder;
provided, however, that no transaction will constitute a Change in Control unless it constitutes a change in the ownership or effective control of the Company, or in the ownership of a substantial portion of its assets, in each case within the meaning of Section 409A of the Code and the Treasury regulations promulgated thereunder.
A “Significant Shareholder” means (i) any shareholder of the Company as of the Effective Date who, together with its Affiliates, “beneficially owns” (as defined in Rule 13d-3 of the Exchange Act) as of the Effective Date five percent (5%) or more of the Company’s outstanding voting securities and (ii) with respect to any shareholder described in clause (i) that is an investment fund, any other investment fund managed by the same or an affiliated investment manager.
In the event that it shall be determined that any payment by the Company to or for the benefit of the executive officers would be subject to the excise tax imposed by Section 4999 of the Code, or any successor provision thereto, by reason of being considered “contingent on a change in ownership or control” of the Company, within the meaning of Section 280G of the Code, or any successor provision thereto, or to any similar tax imposed by state or local law, or any interest or penalties with respect to such tax (such tax or taxes, together with any such interest and penalties, being hereafter collectively referred to as the “Excise Tax”), then the executive officer shall be entitled to receive an additional payment or payments, or gross-up payment, under his employment agreement or change in control agreement. The gross-up payment shall be in an amount such that after payment by such executive officer of all taxes including any Excise Tax (and including any interest or penalties imposed with respect to such taxes and the Excise Tax, other than interest and penalties imposed by reason of such executive officer’s failure to timely file a tax return or pay taxes shown due on such executive officer’s return) imposed upon the gross-up payment, the amount of the gross-up payment retained by such executive officer is equal to the Excise Tax imposed upon the payment. Based on the Company’s calculations as of December 31, 2017, the payments by the Company to or for the benefit of the executive officers would not be subject to the excise tax imposed by Section 4999 of the Code, and the Company would not be required to pay to any of the executive officers an additional gross-up payment attributable to such excise tax.
Payments Made Upon Voluntary Termination or Termination with Good Cause
If any employee is terminated for good cause or if any employee voluntarily terminates his employment other than for good reason, employer will pay any compensation earned but not paid to him prior to the effective date of termination. Employee may voluntarily terminate his employment by giving at least thirty (30) days’ written notice. At that time, employer would have the right to relieve him of his duties; however, his salary would continue during the notice period.
Payments Made Upon Permanent Disability or Death
If employee dies or becomes permanently disabled during the term of his employment, the Company will pay to his estate the compensation that such employee would have earned through the date of death or determination of permanent disability, including salary, any prior year bonus earned but not yet paid, the pro-rated portion of any current year bonus, any and all options, rights or awards granted in conjunction with the MIP would immediately vest and his dependents would be entitled to benefits, including medical and other benefits for a period of one year.
Material Conditions and Obligations Under the Employment Agreements
Messrs. Crisp, Cooper or Macek have each agreed during the term of each of their agreements and thereafter until the later of (i) the end of the Initial Term or any then applicable extension period and (ii) one year after termination of employment following a notice of non-renewal, regardless of whether the termination occurs with or without cause and regardless of who terminates such employment, he will not, among others, (i) be employed by or associated with or own more than 5% of the outstanding securities of any entity that competes with the Company’s business or (ii) solicit any of our employees to terminate their employment. Notwithstanding the foregoing, the respective agreements of Messrs. Crisp and Forbes permit their involvement with other business ventures provided that they are not competitive with the Company’s business or have been approved by the Board. Certain of these transactions are described under “Certain Relationships and Related Transactions” beginning on page 81.
77
2017 Director Compensation
The following table details the compensation received by each Director, other than named executive officers, for the year ended December 31, 2017.
Name | Fees Earned or Paid in Cash ($) | Stock Awards ($) (1) | Option Awards ($) (1) | Non-Equity Incentive Plan Compensation ($) | Nonqualified Deferred Compensation Earnings ($) | All Other Compensation ($) | Total ($) | |||||||
Lawrence First (2) | 89,583 | — | — | — | — | — | 89,583 | |||||||
Brett G. Wyard (3) | 89,583 | — | — | — | — | — | 89,583 | |||||||
Rome G. Arnold III | 107,500 | — | — | — | — | — | 107,500 | |||||||
Paul Butero | 107,500 | — | — | — | — | — | 107,500 | |||||||
David B. Rosenwasser | 18,151 | — | — | — | — | — | 18,151 | |||||||
John E. Crisp | 38,596 | — | — | — | — | — | 38,596 | |||||||
Dale W. Bossert (4) | 33,846 | — | — | — | — | — | 33,846 | |||||||
Travis H. Burris (4) | 35,263 | — | — | — | — | — | 35,263 | |||||||
Charles C. Forbes, Jr. (4) | 22,596 | — | — | — | — | — | 22,596 | |||||||
Ted A. Izatt (4) | 27,596 | — | — | — | — | — | 27,596 | |||||||
William W. Sherrill (4) | 36,679 | — | — | — | — | — | 36,679 | |||||||
(1) No equity was awarded to the directors of our Board in 2017.
(2) The amount shown reflects the compensation received by Ascribe Investments II, LLC and Ascribe Investments III, LLC on Mr. First’s behalf.
(3) The amount shown reflects compensation received by Solace on Mr. Wyard’s behalf.
(4) On the Effective Date, Dale W. Bossert, Travis H. Burris, Charles C. Forbes, Jr., Ted A. Izatt and William W. Sherrill each resigned from the Company’s board of directors.
Narrative Discussion
In accordance with the Plan, Dale W. Bossert, Travis H. Burris, Charles C. Forbes, Jr., Ted A. Izatt and William W. Sherrill resigned from the Board on the Effective Date, and Lawrence First, Brett G. Wyard, Rome G. Arnold III and Paul S. Butero, together with Mr. Crisp, who remained on the Board, took office on the Effective Date. In addition, David B. Rosenwasser was appointed to the Board on November 21, 2017. The current Board members, except Mr. Crisp, were each paid an annual director retainer of $125,000. Each of Messrs. First and Wyard directed the Company to pay any director compensation owed to him to Ascribe’s affiliates and Solace, respectively. In March 2015, the compensation committee adopted a stock ownership policy, which applies to the Company’s named executive officers and directors. The policy provides a number of shares that the Company’s directors must accumulate and hold within five years of the date such individual became subject to the policy. The specific ownership requirement for the Company’s directors is being reviewed for the purpose of amending it to conform to the new equity structure in place since the Effective Date.
Officers Who Also Act As Directors
Messrs. Crisp and Forbes were compensated as directors in 2017 prior to the Effective Date as described in “2017 Director Compensation - Narrative Discussion” above. Since the Effective Date, Mr. Crisp has not received any separate compensation for his service as Chairman of the Board, as a director.
Item 12. | Security Ownership of Certain Beneficial Owners and Management and Related Stockholder Matters |
On the Effective Date, by operation of the Plan, all prior equity interests (which included the Old Common Stock, the Company’s prior preferred stock, awards under the Prior Compensation Plan and the preferred stock purchase rights under the Rights Agreement) of the Company were extinguished without recovery. Accordingly, all awards then outstanding under the Prior Compensation Plan were extinguished without recovery on the Effective Date.
78
Plan Category | Number of Securities to be Issued upon Exercise of Outstanding Options Warrants and Rights | Weighted Average Exercise Price of Outstanding Options, Warrants and Rights | Number of Securities Remaining Available for Future Issuance under Equity Compensation Plans (Excluding Securities Reflected in First Column) | ||||
Equity Compensation Plans Approved by Security Holders | — | — | — | ||||
Equity Compensation Plans Not Approved by Security Holders | 380,077 | — | 300,000 | (3) | |||
Total | 380,077 | — | 300,000 | ||||
(1) Shares governed by Time-Based RSUs and Exit Financing RSUs granted in 2017, pursuant to the MIP. For more information regarding the MIP, see “Item 11 – Narrative Disclosure to Summary Compensation Table – 2017 Management Incentive Plan.”
(2) The Time-Based RSUs and Exit Financing RSUs have no exercise price.
(3) This amount includes 300,000 shares of New Common Stock available for issuance under the MIP, as of December 31, 2017.
Security Ownership of Certain Beneficial Owners and Management
Principal Stockholders
The following table sets forth certain information regarding the beneficial ownership of our voting securities as of February 28, 2018:
•each person who is known to us to be the beneficial owner of more than 5% of our voting securities;
•each of our directors; and
•each of our named executive officers and all of our executive officers and directors as a group.
Unless otherwise indicated, each person named below has an address in care of our principal executive offices and has sole power to vote and dispose of the shares of voting securities beneficially owned by them, subject to community property laws where applicable.
Name | Common Stock Beneficially Owned(**)(1) | Percentage of Common Stock Beneficially Owned(%) | |||||
Executive Officers and Directors: | |||||||
John E. Crisp | 36,288 | * | |||||
Lawrence A. First. | — | * | |||||
Brett G. Wyard | — | * | |||||
Rome G. Arnold III | — | * | |||||
Paul S. Butero | — | * | |||||
L. Melvin Cooper | 17,279 | * | |||||
Steve Macek | 8,000 | * | |||||
David B. Rosenwasser | — | * | |||||
All directors and executive officers as a group (9 persons) | — | * | |||||
5% Stockholders: | |||||||
Ascribe Capital LLC | 1,286,306 (2) | 24.1 | |||||
Solace Forbes Holdings, LLC | 947,268(3) | 17.8 | |||||
FMR LLC | 884,264(4) | 16.6 | |||||
Pacific Investment Management Company LLC | 576,018(5) | 10.8 | |||||
Phoenix Investment Adviser, LLC | 389,243(6) | 7.3 | |||||
Courage Capital Management, LLC | 272,212(7) | 5.1 | |||||
* | Indicates beneficial ownership of less than 1% of the total outstanding common stock. |
79
** “Beneficial ownership” is a term broadly defined by the SEC in Rule 13d-3 under the Securities Exchange Act of 1934, as amended and includes more than typical forms of stock ownership, that is, stock held in the person’s name. The term also includes what is referred to as “indirect ownership,” meaning ownership of shares as to which a person has or shares investment or voting power. There are no shares outstanding that are subject to options, warrants, rights or conversion privileges exercisable within 60 days of February 28, 2018.
(1) | On the Effective Date, pursuant to the operation of the Plan, the Forbes Energy Services Ltd. 2017 Management Incentive Plan, or the MIP, became effective. The types of awards that may be granted under the MIP include stock options, stock appreciation rights, restricted stock, restricted stock units, performance units, performance shares and other forms of stock based awards. The maximum number of New Common Stock that may be issued or transferred pursuant to awards under the MIP is 750,000, which number may be increased with the approval of the Company’s stockholders. |
(2) | Based on information provided on Schedule 13G recently filed with the SEC, reflecting shares of New Common Stock beneficially owned by Ascribe, which has shared voting power of 1,286,306 shares of New Common Stock. Its principal business address is 299 Park Avenue, 34th Floor, New York, NY 10171. |
(3) | Based on information provided on Schedule 13G filed with the SEC on February 14, 2018, reflecting shares of New Common Stock beneficially owned by Solace Forbes Holdings, LLC, which has shared voting power of 947,268 shares of New Common Stock. Its principal business address is 11111 Santa Monica Boulevard, Suite 1275, Los Angeles, CA 90025. |
(4) | Based on information provided on Schedule 13G filed with the SEC on February 13, 2018, reflecting shares of New Common Stock managed by direct or indirect subsidiaries of FMR LLC (the “Fidelity Entities”) . Abigail P. Johnson is the chairman and chief executive officer of FMR LLC. Members of the Johnson family, including Abigail P. Johnson, are the predominant owners, directly or through trusts, of Series B voting common shares of FMR LLC representing 49% of the voting power of FMR LLC. The Johnson family group and all other Series B shareholders have entered into a shareholders’ voting agreement under which all Series B voting common shares will be voted in accordance with the majority vote of Series B voting common shares. Accordingly, through their ownership of voting common shares and the execution of the shareholders’ voting agreement, members of the Johnson family may be deemed, under the Investment Company Act of 1940, to form a controlling group with respect to FMR LLC. Neither FMR LLC nor Abigail P. Johnson has the sole power to vote or direct the voting of the shares owned directly by the Fidelity Entities advised by Fidelity Management & Research Company, a wholly owned subsidiary of FMR LLC, which power resides with the Fidelity Entities’ Boards of Trustees. Fidelity Management & Research Company carries out the voting of the shares under written guidelines established by the Fidelity Entities’ Boards of Trustees. FMR LLC’s address is 245 Summer Street, Boston, Massachusetts 02210. |
(5) | Based on information provided on Schedule 13G filed with the SEC on June 12, 2017, reflecting shares of New Common Stock beneficially owned by Pacific Investment Management Company LLC, which has sole voting power of 576,018 shares of New Common Stock. Its address is 650 Newport Center Drive, Newport Beach, CA 92660. |
(6) | Based on information provided on Schedule 13G filed with the SEC on January 24, 2018, reflecting shares of New Common Stock beneficially owned by Phoenix Investment Adviser LLC (“Phoenix”), which has sole voting power of 290,525 shares of New Common Stock and shared voting power of 98,718 shares of New Common Stock. Phoenix acts as the discretionary investment manager to JLP Credit Opportunity Master Fund Ltd. Jeffrey Peskind is the Managing Member of Phoenix. Its address is The Graybar Building, 420 Lexington Avenue, Suite 2040, New York, NY 10170. |
(7) | Based on information provided on Schedule 13G filed with the SEC on February 14, 2018, reflecting shares of New Common Stock beneficially owned by Courage Capital Management, LLC, which has shared voting power of 272,212 shares of New Common Stock. Its address is 4400 Harding Road, Suite 503, Nashville, Tennessee 37205. |
Item 13. | Certain Relationships and Related Transaction, and Director Independence |
Certain Relationships and Related Transactions
The Company and its subsidiaries enter into transactions with related parties in the normal course of conducting business. References in this section to the Company include the Company’s subsidiaries, unless the context indicates otherwise. The Company believes all of the terms with the companies are comparable to terms that were and are available to the Company in arm’s-length transactions with non-related parties. Below are the cash and cash equivalents and accounts payable balances as of December 31, 2017 and 2016 as well as the revenues and expenses for the years ended December 31, 2017 and 2016 related to the related party transactions. There were no related party receivables as of, and no capital expenditures for the years ended December 31, 2017 and 2016.
80
As of | |||||||||||
Successor | Predecessor | ||||||||||
December 31, 2017 | December 31, 2016 | ||||||||||
Related parties cash and cash equivalents balances: | |||||||||||
Balance at Texas Champion Bank (1) | $ | — | $ | 295 | |||||||
Related parties payable: | |||||||||||
Dorsal Services, Inc. (2) | — | $ | 8 | — | $ | — | |||||
Tasco Tool Services, Inc. (3) | — | 3 | 11 | — | |||||||
Texas Quality Gate Guard Services, LLC (4) | — | 18 | |||||||||
$ | 11 | $ | 18 | ||||||||
Successor | Predecessor | Predecessor | ||||||||||
April 13 through December 31, 2017 | January 1 through April 12, 2017 | Year ended December 31, 2016 | ||||||||||
Related parties expense activity: | ||||||||||||
Alice Environmental Holdings, LLC Alice Environmental Services, LP (5) | $ | 591 | $ | 296 | $ | 1,012 | ||||||
Animas Holding, LLC (6) | 125 | 61 | 172 | |||||||||
CJW Group, LLC (7) | 25 | 13 | 38 | |||||||||
Dorsal Services, Inc. (2) | 35 | — | 13 | |||||||||
Tasco Tool Services, Inc. (3) | — | 11 | 36 | |||||||||
Texas Quality Gate Guard Services, LLC (4) | — | 58 | 200 | |||||||||
$ | 776 | $ | 439 | $ | 1,471 | |||||||
Other payments to related parties: | ||||||||||||
SB Factoring, LLC (8) | $ | 27 | $ | 65 | $ | 402 | ||||||
(1) | The Company had a deposit relationship with Texas Champion Bank. Travis Burris, who served on the Company’s Board of Directors until April 12, 2017 is the President, Chief Executive Officer, and director of Texas Champion Bank. John E. Crisp, an executive officer and director of Forbes Energy Services, Ltd., serves on the board of directors of Texas Champion Bank. On September 30, 2017, the Company closed the account with Texas Champion Bank. |
(2) | Dorsal Services, Inc., or Dorsal Services, is a trucking service company. Mr. Crisp was a partial owner of Dorsal Services in prior periods. The Company used Dorsal Services from time to time. |
(3) | Tasco Tool Services, Inc., or Tasco, is a down-hole tool company that is partially owned and managed by a company that was partially owned by Charles C. Forbes, Jr., now deceased. Mr. Forbes served as an executive officer and director of the Company until the Effective Date. Tasco rents and sells tools to the Company from time to time. Since the Effective Date, Tasco is no longer a related party. |
(4) | Texas Quality Gate Guard Services, LLC, or Texas Quality Gate Guard Services, is an entity partially owned by Mr. Crisp and a son of Mr. Crisp. Texas Quality Gate Guard Services has provided security services to the Company. Since the Effective Date, Texas Quality Gate Guard Services has not provided services to our Company and we do not anticipate securing their services in the future. |
(5) | Mr. Crisp is a partial owner of Alice Environmental Holdings, LLC, or AEH, and is an indirect shareholder and manager of Alice Environmental Services, LP, or AES and Alice Environmental West Texas, LLC, or AEWT. The Company leases or rents land and buildings from AES. |
(6) | Animas Holdings, LLC, or Animas, is partially owned by two sons of Mr. Crisp. Animas owns land and property that it leases to the Company. |
(7) | CJW Group, LLC is an entity that leases office space to the Company and is partially owned by Mr. Crisp. |
(8) | From time to time, vendors of the Company factor their receivables from the Company and direct that the Company make payment of such factored amounts directly to the applicable factor. One such factor to whom payments have been made by the Company is SB Factoring LLC, which is partially owned by Mr. Crisp. The nature of these transactions does not result in recording in the Company’s financial records any revenue, any expense or any receivable and does not result in any payable distinct in amount from the amount payable to such vendors as originally incurred. |
81
In addition to such related party transactions above, Lawrence A. First, a director of FES Ltd., serves as the Chief Investment Officer and Managing Director of Ascribe Capital LLC, or Ascribe, and Brett G. Wyard, also a director of FES Ltd., serves as a Managing Partner of Solace Capital Partners, or Solace, had the right to designate one member of the Board. Additionally, Ascribe and Solace had the right to jointly designate one member of the Board and, together with certain other holders of the Prior Senior Notes, the right to designate the one other member of the Board. Furthermore, Ascribe and/or one of more of its affiliates own approximately 24.1% of the outstanding New Common Stock as of February 28, 2018, and is owed approximately $13.2 million of the aggregate principal amount of the New Loan Agreement. Solace and/or one of its affiliates own approximately 17.8% of the outstanding New Common Stock as of February 28, 2018, and is owed approximately $11.9 million of the aggregate principal amount of the term loan covered by the New Loan Agreement. Moreover, an affiliate of Solace and affiliates of Ascribe are parties to that certain registration rights agreement dated as of the Effective Date by and among the Company and certain stockholders of the Company.
Registration Rights Agreement
Pursuant to the Registration Rights Agreement, among other things, any holder that, together with such holder’s affiliates or, collectively, a Demand Holder, (i) beneficially owns at least ten percent (10%) of the outstanding shares of New Common Stock, as of the Effective Date and (ii) continues to beneficially own at least five percent (5%) of the aggregate outstanding shares of New Common Stock will have the right to request the Company to file with the Commission, a registration statement under the Securities Act of 1933, as amended, or the Securities Act, or a Demand Registration, on Form S-1, or a Long-Form Registration, or Form S-3, or a Short-Form Registration, of all or any portion of the Registrable Securities (as defined below) held by such holder. Notwithstanding the foregoing, the Company shall be required to conduct no more than two Long-Form Registrations and an unlimited number of Short-Form Registrations for Demand Holders. Any Demand Holder may request that any offering conducted under a Long-Form Registration or a Short-Form Registration be underwritten.
The term “Registrable Securities” means at any time New Common Stock held or beneficially owned by any party to the Registration Rights Agreement, including (i) any New Common Stock issued pursuant to the Plan or upon the conversion, exercise or exchange, as applicable, of any other securities and/or interests issued pursuant to the Plan and (ii) any shares of New Common Stock acquired in the open market or otherwise purchased or acquired by such person after the Effective Date; provided, however, Registrable Securities shall irrevocably cease to constitute Registrable Securities upon the earliest to occur of: (i) the date on which such securities have been disposed of pursuant to an effective registration statement under the Securities Act; (ii) the date on which such securities have been disposed of pursuant to Rule 144 promulgated under the Securities Act; (iii) the date on which such securities have been transferred to any person in a transfer not complying with the provisions of the Registration Rights Agreement governing the transfer of registration rights; and (iv) the date on which such securities cease to be outstanding.
Pursuant to the Registration Rights Agreement, the Company filed a Long-Form Registration on Form S-1 on February 2, 2018, which as of the filing date of this Form 10-K has not been declared effective by the SEC. Following the effectiveness of such shelf registration statement, any Demand Holder may request to effectuate a shelf takedown off of such shelf by means of an underwritten public offering. The Company, however, will not be obligated to effect an underwritten shelf takedown within 60 days after the pricing of a previous underwritten shelf takedown.
In the event the Company proposes to file a Demand Registration or a Company-initiated registration statement with respect to a public offering of any class of the Company’s equity securities other than a registration statement on Form S-8 or Form S-4, such registration a Piggyback Registration, the Company must notify all holders of Registrable Securities of its intention to effect such Piggyback Registration.
The Registration Rights Agreement includes customary indemnification provisions.
Review, Approval or Ratification of Transactions with Related Persons
The Board adopted a written Related Persons Transaction Policy on March 17, 2014. Prior to the adoption of the Related Persons Transaction Policy, certain significant related party transactions were reviewed and approved by the Board.
Pursuant to the Related Persons Transaction Policy, any transaction or series of transactions, arrangement or relationship between the company and a “related person” in which such related person has a direct or indirect material interest, and where the amount involved exceeds $120,000, must be submitted to our audit committee for review, approval, or ratification. A “related person” means a director, executive officer or beneficial holder of more than 5% of the Company’s outstanding common stock, or any immediate family member of the foregoing, as well as any entity at which any such person is employed, is a partner or principal (or holds a similar position), or is a beneficial owner of a 10% or greater direct or indirect equity interest.
The Related Persons Transaction Policy requires our audit committee to be provided with full information concerning the proposed transaction, including the benefits to the Company and the related person, any alternative means by which to obtain like benefits, and terms that would prevail in a similar transaction with an unaffiliated third party. In considering whether to approve or ratify any such transaction, the audit committee will consider all relevant factors, including the nature of the interest of the
82
related person in the transaction and whether the transaction may involve a conflict of interest that is not in or consistent with the best interests of the Company and our stockholders.
Specific types of transactions are excluded from the Related Persons Transaction Policy, such as, for example, transactions in which the related person’s interest derives solely from his or her service as a director of another entity that is a party to the transaction.
Under the agreement governing our existing credit facility, we are only permitted to enter into new transactions with a related party if such transaction is entered into in the ordinary course of business and on an arm-length basis on terms no less favorable than those obtainable form a third-party, subject to certain exceptions, including exceptions for compensation relationships.
Additionally, the Company has a written Third Amended and Restated Employee Code of Business Conduct and Ethics that requires that an employee obtain written approval of the President or the Chief Executive Officer prior to doing business on behalf of the Company with a member of that employee’s family. All of the transactions described above under “Certain Relationships and Related Transactions” beginning on page 81 were approved or ratified by the Board, including the disinterested members thereof.
Director Independence
Although the Company’s common stock is currently listed on the OTCQX Best Market, the Board applies NASDAQ rules when determining director independence. The Board has determined that Lawrence “Larry” First, Brett G. Wyard, Rome G. Arnold III, Paul S. Butero and David B. Rosenwasser are independent directors as defined by NASDAQ. John E. Crisp is not an independent director because he is an executive officer of the Company and has interests in certain related party transactions that are described in the section titled “Certain Relationship and Related Transactions” below. Although John E. Crisp, the Chairman of the Board, is not an independent director, Lawrence First, the Lead Independent Director, is independent. The primary responsibility of the Lead Independent Director is to provide independent leadership and conduct executive sessions of the Board when management is not present. At present, as noted above, a majority of our directors are independent as defined by NASDAQ and as required by NASDAQ rules.
Item 14. | Principal Accounting Fees and Services |
Independent Auditors and Fees
BDO USA, LLP, began serving as the Company’s independent registered public accounting firm on June 23, 2009. The audit committee approved the reappointment of BDO USA, LLP as the Company’s independent registered public accounting firm for the 2018 fiscal year, subject to ratification by the Company’s stockholders.
The following table presents fees for professional audit services rendered by BDO USA, LLP for the audit of the Company’s annual financial statements for the years ended December 31, 2017 and December 31, 2016, and fees billed for other services rendered by BDO USA, LLP during those periods.
Year Ended December 31, | |||||||
2017 | 2016 | ||||||
Audit fees(1) | $ | 922,717 | $ | 964,426 | |||
Tax fees(2) | 115,120 | 130,390 | |||||
Total | $ | 1,037,837 | $ | 1,094,816 | |||
(1) Audit fees consist of fees billed for professional services rendered for the audit of the Company’s consolidated financial statements, for the review of the interim condensed consolidated financial statements included in quarterly reports, services that are normally provided by BDO USA, LLP in connection with statutory and regulatory filings or engagements and attest services, except those not required by statute or regulation.
(2) | Tax fees consist of tax compliance and preparation and other tax services. Tax compliance and preparation consist of fees billed for professional services related to federal, state and international tax compliance, assistance with tax audits and appeals, and tax return preparation. Other tax services consist of fees billed for other miscellaneous tax consulting and planning. |
Policy on Audit Committee Pre-Approval of Audit and Permissible Non-Audit Services of Independent Auditors
The audit committee is responsible for the appointment, retention, termination, compensation and oversight of the independent auditors. The audit committee’s policy is to pre-approve all audit and permissible non-audit services provided by the independent auditors. Requests for approval are generally submitted at a meeting of the audit committee. The audit committee may delegate pre-approval authority to a committee member, provided that any decisions made by such member shall be presented to the full committee at its next scheduled meeting.
83
PART IV
Item 15. | Exhibits, Financial Statement Schedules |
(a) | The following items are filed as part of this report: |
1. | Financial Statements. The financial statements and information required by Item 8 appear on pages 34 through 64 of this report. The Index to Consolidated Financial Statements appears on page 34. |
2. | Financial Statement Schedules. All schedules are omitted because they are not applicable or the required information is shown in the financial statements or the notes thereto. |
3. | Exhibits. The Exhibits set forth below. |
Number | Description of Exhibits | ||
— | Debtors’ Prepackaged Joint Plan of Reorganization, dated December 21, 2016 (incorporated by reference to Exhibit 99.1 to the Company’s Current Report on Form 8-K filed December 23, 2016). | ||
— | Certificate of Incorporation of Forbes Energy Services Ltd. (incorporated by reference to Exhibit 3.1 to the Company’s Registration Statement on Form 8-A filed April 18, 2017). | ||
— | Second Amended and Restated Bylaws of Forbes Energy Services Ltd. (incorporated by reference to Exhibit 3.2 to the Company’s Registration Statement on Form 8-A filed April 18, 2017). | ||
— | Specimen Certificate for the Company’s common stock, $0.01 par value (incorporated by reference to Exhibit 4.1 to the Company’s Registration Statement on Form 8-A filed April 18, 2017). | ||
— | Registration Rights Agreement by and among Forbes Energy Services Ltd. and certain holders identified therein dated as of April 13, 2017 (incorporated by reference to Exhibit 10.1 to the Company's Registration Statement on Form 8-A filed April 18, 2017). | ||
— | Loan and Security Agreement, dated as of April 13, 2017, by and among Forbes Energy Services LLC, as borrower, Forbes Energy International, LLC, TX Energy Services, LLC, C.C. Forbes, LLC and Forbes Energy Services Ltd., as guarantors, Wilmington Trust, N.A., as agent, and certain lenders party thereto (incorporated by reference to Exhibit 10.1 to the Company's Current Report on Form 8-K filed April 18, 2017). | ||
— | Agreement regarding Cash Collateral and Letters of Credit dated as of April 13, 2017 by and among Forbes Energy Services LLC, Forbes Energy International, LLC, TX Energy Services, LLC, C.C. Forbes, LLC, Forbes Energy Services Ltd. and Regions Bank (incorporated by reference to Exhibit 10.2 to the Company's Current Report on Form 8-K filed April 18, 2017). | ||
— | Forbes Energy Services Ltd. 2017 Management Incentive Plan (incorporated by reference to Exhibit 10.4 to the Company’s Current Report on Form 8-K filed April 18, 2017). | ||
— | Amended and Restated Employment Agreement effective April 13, 2017, by and between John E. Crisp and Forbes Energy Services LLC (incorporated by reference to Exhibit 10.5 to the Company’s Current Report on Form 8-K filed April 18, 2017). | ||
— | Amended and Restated Employment Agreement effective April 13, 2017, by and between L. Melvin Cooper and Forbes Energy Services LLC (incorporated by reference to Exhibit 10.6 to the Company’s Current Report on Form 8-K filed April 18, 2017). | ||
— | Employment Agreement effective April 13, 2017, by and between Steve Macek and Forbes Energy Services LLC (incorporated by reference to Exhibit 10.7 to the Company’s Current Report on Form 8-K filed April 18, 2017). | ||
— | Form of Time-Based Restricted Stock Unit Award Agreement (incorporated by reference to Exhibit 10.8 to the Company’s Quarterly Report on Form 10-Q filed May 15, 2017). | ||
— | Form of Exit Financing Time-Based Restricted Stock Unit Award Agreement (incorporated by reference to Exhibit 10.9 to the Company’s Quarterly Report on Form 10-Q filed May 15, 2017. | ||
— | Form of Performance-Based Restricted Stock Unit Award Agreement (incorporated by reference to Exhibit 10.10 to the Company’s Quarterly Report on Form 10-Q filed May 15, 2017). | ||
21.1* | — | Subsidiaries of Forbes Energy Services Ltd. | |
23.1* | — | Consent of BDO USA, LLP | |
31.1* | — | Certification of Chief Executive Officer pursuant to Rule 13a-14(a)/15d-14(a). | |
31.2* | — | Certification of Chief Financial Officer pursuant to Rule 13a-14(a)/15d-14(a). | |
32.1* | — | Certification of Chief Executive Officer Pursuant to Section 18 U.S.C. Section 1350, as Adopted Pursuant to Section 906 of the Sarbanes-Oxley Act of 2002. | |
84
32.2* | — | Certification of Chief Financial Officer Pursuant to Section 18 U.S.C. Section 1350, as Adopted Pursuant to Section 906 of the Sarbanes-Oxley Act of 2002. | |
99.1 | — | Order Approving the Debtors’ Disclosure Statement For, and Confirming, the Debtors’ Prepackaged Joint Plan of Reorganization, as entered by the Bankruptcy Court on March 29, 2017 (incorporated by reference to Exhibit 99.1 to the Company’s Current Report on Form 8-K filed March 31, 2017). | |
101* | — | Interactive Data Files | |
____________________
* | Filed herewith. |
Item 16. Form 10-K Summary
None.
SIGNATURES
Pursuant to the requirements of Section 13 or 15(d) of the Securities Exchange Act of 1934, as amended, the registrant has duly caused this report to be signed on its behalf by the undersigned, thereunto duly authorized, in the City of Alice, the State of Texas, on April 2, 2018.
FORBES ENERGY SERVICES LTD. | ||
By: | /S/ JOHN E. CRISP | |
John E. Crisp | ||
President and Chief Executive Officer | ||
Pursuant to the requirements of the Securities Exchange Act of 1934, as amended, this report has been signed by the following persons on behalf of the registrant and in the capacities and on the dates indicated.
85
Signature | Title | Date | ||
/s/ JOHN E. CRISP (John E. Crisp) | Chairman of the Board, President, Chief Executive Officer and Director (Principal Executive Officer) | April 2, 2018 | ||
/s/ L. MELVIN COOPER (L. Melvin Cooper) | Senior Vice President, Chief Financial Officer and Secretary (Principal Financial and Accounting Officer) | April 2, 2018 | ||
/s/ LAWRENCE FIRST (Lawrence First) | Director | April 2, 2018 | ||
/s/ BRETT G. WYARD (Brett G. Wyard) | Director | April 2, 2018 | ||
/s/ ROME G. ARNOLD III (Rome G. Arnold III) | Director | April 2, 2018 | ||
/s/ PAUL S. BUTERO (Paul S. Butero) | Director | April 2, 2018 | ||
/s/ DAVID B. ROSENWASSER (David B. Rosenwasser) | Director | April 2, 2018 | ||
86