Attached files
| file | filename |
|---|---|
| 8-K - 8-K - VECTOR GROUP LTD | march2018factsheet.htm |
| EX-99.2 - EXHIBIT 99.2 - VECTOR GROUP LTD | vectorfactsheetmarch2018.htm |
| EX-99.1 - EXHIBIT 99.1 - VECTOR GROUP LTD | investorpresentationmarc.htm |

1
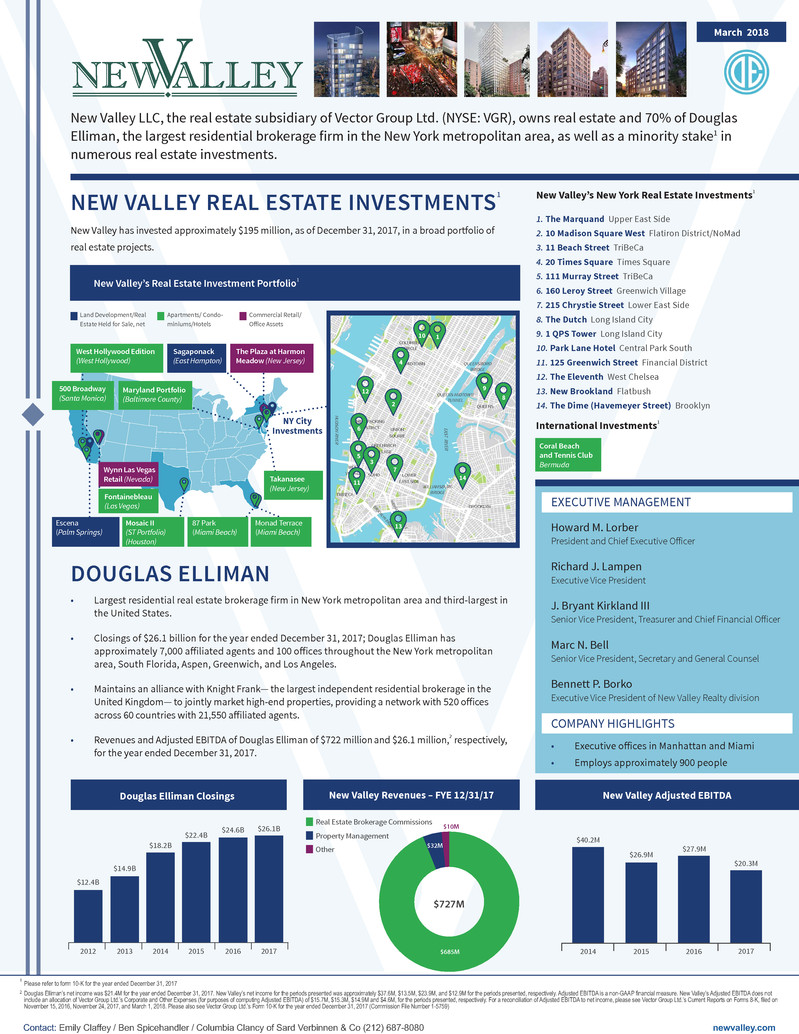
New Valley LLC, the real estate subsidiary of Vector Group Ltd. (NYSE: VGR), owns real estate and 70% of Douglas
Elliman, the largest residential brokerage firm in the New York metropolitan area, as well as a minority stake1 in
numerous real estate investments.
New Valley has invested approximately $195 million, as of December 31, 2017, in a broad portfolio of
real estate projects.
NEW VALLEY REAL ESTATE INVESTMENTS1
March 2018
DOUGLAS ELLIMAN
• Largest residential real estate brokerage firm in New York metropolitan area and third-largest in
the United States.
• Closings of $26.1 billion for the year ended December 31, 2017; Douglas Elliman has
approximately 7,000 affiliated agents and 100 offices throughout the New York metropolitan
area, South Florida, Aspen, Greenwich, and Los Angeles.
• Maintains an alliance with Knight Frank— the largest independent residential brokerage in the
United Kingdom— to jointly market high-end properties, providing a network with 520 offices
across 60 countries with 21,550 affiliated agents.
• Revenues and Adjusted EBITDA of Douglas Elliman of $722 million and $26.1 million,2 respectively,
for the year ended December 31, 2017.
COMPANY HIGHLIGHTS
• Executive offices in Manhattan and Miami
• Employs approximately 900 people
Douglas Elliman’s net income was $21.4M for the year ended December 31, 2017. New Valley’s net income for the periods presented was approximately $37.6M, $13.5M, $23.9M, and $12.9M for the periods presented, respectively. Adjusted EBITDA is a non-GAAP financial measure. New Valley’s Adjusted EBITDA does not
include an allocation of Vector Group Ltd.’s Corporate and Other Expenses (for purposes of computing Adjusted EBITDA) of $15.7M, $15.3M, $14.9M and $4.6M, for the periods presented, respectively. For a reconciliation of Adjusted EBITDA to net income, please see Vector Group Ltd.’s Current Reports on Forms 8-K, filed on
November 15, 2016, November 24, 2017, and March 1, 2018. Please also see Vector Group Ltd.’s Form 10-K for the year ended December 31, 2017 (Commission File Number 1-5759)
2
2017
$20.3M
New Valley Adjusted EBITDA
Maryland Portfolio
(Baltimore County)
New Valley’s Real Estate Investment Portfolio1
New Valley’s New York Real Estate Investments1
1. The Marquand Upper East Side
2. 10 Madison Square West Flatiron District/NoMad
3. 11 Beach Street TriBeCa
4. 20 Times Square Times Square
5. 111 Murray Street TriBeCa
6. 160 Leroy Street Greenwich Village
7. 215 Chrystie Street Lower East Side
8. The Dutch Long Island City
9. 1 QPS Tower Long Island City
10. Park Lane Hotel Central Park South
11. 125 Greenwich Street Financial District
12. The Eleventh West Chelsea
13. New Brookland Flatbush
14. The Dime (Havemeyer Street) Brooklyn
Coral Beach
and Tennis Club
Bermuda
International Investments1
Land Development/Real
Estate Held for Sale, net
Apartments/ Condo-
miniums/Hotels
Commercial Retail/
Office Assets
Monad Terrace
(Miami Beach)
newvalley.comContact: Emily Claffey / Ben Spicehandler / Columbia Clancy of Sard Verbinnen & Co (212) 687-8080
Escena
(Palm Springs)
Douglas Elliman Closings
2017
$26.1B
EXECUTIVE MANAGEMENT
Howard M. Lorber
President and Chief Executive Officer
Richard J. Lampen
Executive Vice President
J. Bryant Kirkland III
Senior Vice President, Treasurer and Chief Financial Officer
Marc N. Bell
Senior Vice President, Secretary and General Counsel
Bennett P. Borko
Executive Vice President of New Valley Realty division
NY City
Investments
New Valley Revenues – FYE 12/31/17
Other
Real Estate Brokerage Commissions
Property Management
West Hollywood Edition
(West Hollywood)
The Plaza at Harmon
Meadow (New Jersey)
Sagaponack
(East Hampton)
87 Park
(Miami Beach)
Mosaic II
(ST Portfolio)
(Houston)
Takanasee
(New Jersey)
$727M
$685M
$32M
$10M
Wynn Las Vegas
Retail (Nevada)
Fontainebleau
(Las Vegas)
500 Broadway
(Santa Monica)
2012
$12.4B
2013
$14.9B
$18.2B
2014 2015
$22.4B
2016
$24.6B
2014
$40.2M
2015
$26.9M
2016
$27.9M
2
12
7
8
9
1
MEATPACKING
DISTRICT
MIDTOWN
QUEENS-MIDTOWN
TUNNEL
QUEENS
WILLIAMSBURG
BRIDGE
QUEENSBORO
BRIDGE
BROOK
LYN BRIDG
E
MANH
ATTAN BRIDG
E
HUDSON RIVE
R
EAST RIVE
R
COLUMBUS
CIRCLE
UNION
SQUARE
BROOKLYN
LOWER
EAST SIDE
GREENWICH
VILLAGE
WEST
VILLAGE SOHO
TRIBECA
6
5
3
11
4
10
13
Please refer to form 10-K for the year ended December 31, 2017
14
