Attached files
| file | filename |
|---|---|
| EX-31.4 - EXHIBIT 31.4 - PROGRESS SOFTWARE CORP /MA | exhibit314.htm |
| EX-31.3 - EXHIBIT 31.3 - PROGRESS SOFTWARE CORP /MA | exhibit313.htm |
UNITED STATES
SECURITIES AND EXCHANGE COMMISSION
Washington, D.C. 20549
FORM 10-K/A
(Amendment No. 1)
ý | ANNUAL REPORT PURSUANT TO SECTION 13 OR 15(d) OF THE SECURITIES EXCHANGE ACT OF 1934 |
For the Fiscal Year Ended November 30, 2017
or
¨ | TRANSITION REPORT PURSUANT TO SECTION 13 OR 15(d) OF THE SECURITIES EXCHANGE ACT OF 1934 |
Commission File Number: 0-19417
PROGRESS SOFTWARE CORPORATION
(Exact name of registrant as specified in its charter)
DELAWARE (State or other jurisdiction of incorporation or organization) | 04-2746201 (I.R.S. Employer Identification No.) | |
14 Oak Park
Bedford, Massachusetts 01730
(Address of Principal Executive Offices)
Telephone Number: (781) 280-4000
Securities registered pursuant to Section 12(b) of the Act:
Title of Each Class | Name of Each Exchange on Which Registered | |
Common Stock $.01 par value | The NASDAQ Global Select Market | |
Securities registered pursuant to Section 12(g) of the Act: None
Indicate by check mark if the registrant is a well-known seasoned issuer, as defined in Rule 405 of the Securities Act. Yes ý No ¨
Indicate by check mark if the registrant is not required to file reports pursuant to Section 13 or Section 15(d) of the Exchange Act. Yes ¨ No ý
Indicate by check mark whether the registrant (1) has filed all reports required to be filed by Section 13 or 15(d) of the Securities Exchange Act of 1934 during the preceding 12 months (or for such shorter period that the registrant was required to file such reports), and (2) has been subject to such filing requirements for the past 90 days. Yes ý No ¨
Indicate by check mark whether the registrant has submitted electronically and posted on its corporate Web site, if any, every Interactive Data File required to be submitted and posted pursuant to Rule 405 of Regulation S-T during the preceding 12 months (or for such shorter period that the registrant was required to submit and post such files). Yes ý No ¨
Indicate by check mark if disclosure of delinquent filers pursuant to Item 405 of Regulation S-K is not contained herein, and will not be contained, to the best of registrant’s knowledge, in definitive proxy or information statements incorporated by reference in Part III of this Form 10-K or any amendment to this Form 10-K. ý
Indicate by check mark whether the registrant is a large accelerated filer, an accelerated filer, a non-accelerated filer, smaller reporting company, or an emerging growth company. See the definitions of “large accelerated filer,” “accelerated filer,” “smaller reporting company,” and "emerging growth company" in Rule 12b-2 of the Exchange Act.
Large accelerated filer | ý | Accelerated filer | ¨ | |||
Non-accelerated filer | ¨ | (Do not check if a smaller reporting company) | Smaller reporting company | ¨ | ||
Emerging growth company | ¨ | |||||
If an emerging growth company, indicate by check mark if the registrant has elected not to use the extended transition period for complying with any new or revised financial accounting standards provided pursuant to Section 13(a) of the Exchange Act. ¨
Indicate by check mark whether the registrant is a shell company (as defined in Rule 12b-2 of the Exchange Act).
Yes ¨ No ý
As of May 31, 2017 (the last business day of the registrant’s most recently completed second fiscal quarter), the aggregate market value of voting stock held by non-affiliates of the registrant was approximately $1,381,000,000.
As of February 28, 2018, there were 46,297,792 common shares outstanding.
Documents Incorporated by Reference
None
PROGRESS SOFTWARE CORPORATION
FORM 10-K/A
For the year ended November 30, 2017
TABLE OF CONTENTS
Explanatory Note
PART III
Item 10. Directors, Executive Officers and Corporate Governance
Item 11. Executive Compensation
Item 12. Security Ownership of Certain Beneficial Owners and Management and Related Stockholder Matters
Item 13. Certain Relationships and Related Transactions, and Director Independence
Item 14. Principal Accountant Fees and Services
PART IV
Item 15. Exhibits and Financial Statement Schedules
Signatures
EX-31.3 Certification Pursuant to Section 302 of the Sarbanes-Oxley Act of 2002 - Principal Executive Officer
EX-31.4 Certification Pursuant to Section 302 of the Sarbanes-Oxley Act of 2002 - Principal Financial Officer
EXPLANATORY NOTE
Progress Software Corporation (referred to as Progress, the company, we, us or our) is filing this Amendment No. 1 on Form 10-K/A (this “Amendment”) to its Annual Report on Form 10-K for the year ended November 30, 2017, originally filed on January 26, 2018 (the “Original Report”), for the sole purpose of including the information required by Part III of Form 10-K. Accordingly, Items 10, 11, 12, 13, and 14 of Part III of our Original Report are replaced in their entirety with the information provided herein. The information included herein as required by Part III, Items 10 through 14 of Form 10-K is more limited than what is required to be included in the definitive proxy statement to be filed in connection with our annual meeting of stockholders. Accordingly, the definitive proxy statement to be filed at a later date will include additional information related to the topics herein and additional information not required by Part III, Items 10 through 14 of Form 10-K.
This Form 10-K/A does not amend, update or change any other items or disclosure in the Original Report or reflect events that occurred after the date of the Original Report. Therefore, this Amendment should be read in conjunction with our Original Report and our other filings made with the United States Securities and Exchange Commission (“SEC”) after the filing of the Original Report.
This Form 10-K/A also includes as exhibits the certifications required by Rule 13a-14(a) of the Securities Exchange Act of 1934, as amended (the “Exchange Act”).
PART III
ITEM 10. DIRECTORS, EXECUTIVE OFFICERS, AND CORPORATE GOVERNANCE
Board of Directors |
Currently, our Board of Directors is comprised of nine members. Each director has been elected to hold office until the next annual meeting of shareholders or special meeting in lieu of such annual meeting or until his or her successor has been duly elected and qualified, or until his or her earlier death, resignation or removal. There are no family relationships among any of our executive officers or directors.
The following table sets forth our current directors, their ages, and the positions held by each person with our company. In addition, for each person we have included information regarding the business or other experience, qualifications, attributes or skills considered in determining that such person should serve as a director.
Name | Age | Position | ||
John R. Egan (1) | 60 | Non-Executive Chairman of the Board | ||
Paul T. Dacier (2) | 60 | Director | ||
Rainer Gawlick (2), (3) | 50 | Director | ||
Yogesh Gupta | 57 | President and Chief Executive Officer and Director | ||
Charles F. Kane (1), (3) | 60 | Director | ||
Samskriti Y. King | 44 | Director | ||
David A. Krall (2), (3) | 57 | Director | ||
Michael L. Mark (1), (2) | 72 | Director | ||
Angela T. Tucci | 51 | Director | ||
(1) | Member of Audit Committee |
(2) | Member of Nominating and Corporate Governance Committee |
(3) | Member of Compensation Committee |
Mr. Egan became our Non-Executive Chairman of the Board in December 2012. Mr. Egan has been a director since September 2011. Mr. Egan is managing partner of Carruth Management, LLC, a Boston-based venture capital fund he founded in October 1998 that specializes in technology and early stage investments. From October 1986 until September 1998, Mr. Egan served in several executive positions with EMC Corporation (NYSE: EMC), a publicly-held global leader in information technology, including Executive Vice President, Products and Offerings, Executive Vice President, Sales and Marketing, Executive Vice President, Operations and Executive Vice President, International Sales.
Mr. Egan serves on the board of directors of Verint Systems, Inc. (NASDAQ: VRNT), a publicly-held provider of systems to the internet security market, and NetScout Systems, Inc. (NASDAQ: NTCT), a publicly-held network performance management company, where he serves as Lead Director. Mr. Egan also served as a director of EMC and VMWare, Inc. prior to EMC’s acquisition by Dell Technologies.
Mr. Egan brings to our Board of Directors extensive understanding and expertise in the information technology industry because of his service on other boards of directors combined with his executive leadership roles at EMC. His broad experience ranges from venture capital investments in early-stage technology companies to extensive sales and marketing experience, to executive leadership and management roles. Mr. Egan brings to the Board of Directors business acumen, substantial operational experience, and expertise in corporate strategy and development. Mr. Egan also has extensive experience serving as a director of publicly-traded companies.
Mr. Dacier has been a director since June 2017. Mr. Dacier is currently the General Counsel of Indigo Agriculture, Inc., a Boston-based agricultural technology start-up company that specializes in products designed to maximize crop health and productivity, which he joined in March 2017. Previously, Mr. Dacier was Executive Vice President and General Counsel of EMC Corporation (NYSE: EMC) from 1990 until September 2016, when EMC was acquired by Dell Technologies. Mr. Dacier was responsible for the worldwide legal affairs of EMC and its subsidiaries and oversaw the company’s internal audit, real estate and facilities organizations, sustainability and government affairs departments.
Mr. Dacier also currently serves on the Board of Directors for AerCap Holdings NV (NYSE: AER), the world's largest independent aircraft leasing company, and GTY Technology Holdings, Inc. (NASDAQ: GTYHU), a technology holding company.
Mr. Dacier brings to our Board of Directors his extensive understanding and expertise in the information technology industry because of his service on other boards of directors combined with his executive role at EMC. Mr. Dacier also brings his experience and expertise in legal issues and corporate governance as a general counsel and director of publicly-traded companies.
Dr. Gawlick has been a director since June 2017. Dr. Gawlick currently serves on the Board of Directors of Proto Labs, Inc. (NYSE: PRLB), a leading online and technology-enabled quick-turn manufacturer of custom parts for prototyping and short-run production. Dr. Gawlick also serves on the Board of Directors of ChyronHego Corp., a private company specializing in broadcast graphics creation, playout and real-time data visualization, NewForma, Inc. a private company providing leading collaboration and project information management platform, Meltwater, Inc., a private software-as-a-service company that develops and markets media monitoring and business intelligence software, and CloudSense, a private company specializing in delivering industry specific commerce solutions. Dr. Gawlick has also been an advisor to Vector Capital since December 2016.
Previously, Dr. Gawlick was President of Perfecto Mobile, Ltd., a leader in mobile testing, from July 2015 until September 2016. Prior to that, Dr. Gawlick was Executive Vice President of Global Sales at IntraLinks, Inc., a computer software company providing virtual data rooms and other content management services, from April 2012 until July 2015. From August 2008 to April 2012, Dr. Gawlick served as Chief Marketing Officer of Sophos Ltd., a computer security company providing endpoint, network and data protection software. From April 2005 to August 2008, Dr. Gawlick served as Vice President of Worldwide Marketing and Strategy at SolidWorks Corp., a CAD software company. He also has held a variety of executive positions in other technology businesses and was a consultant with McKinsey & Company. Dr. Gawlick holds a Ph.D. in Computer Science from the Massachusetts Institute of Technology.
Through his experience as a director of public and private companies, as well as his leadership roles in the technology industry, Dr. Gawlick brings to our Board of Directors extensive expertise in international sales as well as product-management and marketing. Dr. Gawlick also provides expertise in developing growth strategies.
Mr. Gupta became a director and our President and Chief Executive Officer in October 2016. Prior to that time, Mr. Gupta served as an advisor to various venture capital and private equity firms from October 2015 until September 2016. Prior to that time, Mr. Gupta was President and Chief Executive Officer at Kaseya, Inc., a provider of IT management software solutions, from June 2013 until July 2015, at which time, Mr. Gupta became Chairman of the Board of Directors of Kaseya, a position he held until October 2015. From July 2012 until June 2013, Mr. Gupta served as an advisor to various venture capital and private equity firms in several mergers and acquisitions opportunities. Mr. Gupta was previously President and Chief Executive Officer of FatWire Software from July 2007 until February 2012, prior to the acquisition of FatWire Software by Oracle Corporation. Prior roles held by Mr. Gupta include Chief Technology Officer at CA, Inc., with whom Mr. Gupta held various senior positions.
Through his prior roles in the software industry as chief executive officer and in other leadership positions, Mr. Gupta has gained significant management and operating experience, extensive knowledge of the software industry and critical technical, financial, strategic and marketing expertise. Also, in his role as our President and Chief Executive Officer, Mr. Gupta can provide unique insight into our markets, products, technology, challenges and opportunities.
Mr. Kane has been a director since November 2006. Mr. Kane is currently an adjunct professor of International Finance at the MIT Sloan Graduate Business School of Management. Since November 2006, Mr. Kane has also been a Director and Strategic Advisor of One Laptop Per Child, a non-profit organization that provides computing and internet access for students in the developing world, for whom he served as President and Chief Operating Officer from 2008 until 2009. Mr. Kane served as Executive Vice President and Chief Administrative Officer of Global BPO Services Corp., a special purpose acquisition corporation, from July 2007 until March 2008, and as Chief Financial Officer of Global BPO from August 2007 until March 2008. Prior to joining Global BPO, he served as Chief Financial Officer of RSA Security Inc., a provider of e-security solutions, from May 2006 until RSA was acquired by EMC Corporation in October 2006. From July 2003 until May 2006, he served as Chief Financial Officer of Aspen Technology, Inc. (NYSE: AZPN), a publicly-traded provider of supply chain management software and professional services.
2
Mr. Kane is currently a director of Carbonite, Inc. (NASDAQ: CARB), a publicly-traded leading provider of online backup solutions for consumers and small and medium sized businesses, and Realpage Inc. (NASDAQ: RP), a publicly-traded company providing on-demand software solutions for the rental housing industry. Mr. Kane was previously a director of Netezza Corporation, Borland Software Corporation, Applix Inc. and Demandware, Inc.
As our Audit Committee financial expert and Chairman of the Audit Committee, Mr. Kane provides a high level of expertise and leadership experience in the areas of finance, accounting, audit oversight and risk analysis derived from his experience as the chief financial officer of publicly-traded technology companies. Mr. Kane also offers substantial public company board experience to our Board of Directors.
Ms. King has been a director since February 2018. Ms. King is currently Senior Vice President, General Manager and Chief Strategy Officer of Veracode, the application security business of CA, Inc, a role she has held since July 2017, when Veracode was acquired by CA. In her role as General Manager of Veracode, Ms. King is responsible for all functions of the business unit. From August 2015 until July 2017, Ms. King was the Chief Strategy Officer of Veracode. Prior to that time, from April 2012 until July 2015, Ms. King was Executive Vice President, Product Strategy and Corporate Development GM, Mobile at Veracode. Ms. King joined Veracode in November 2006 and also served as Veracode’s Senior Vice President, Product Marketing and Vice President, Service Delivery.
From a variety of key roles at Veracode, Ms. King has gained significant management and operating experience, extensive knowledge of the software industry and critical strategic expertise. Ms. King also brings to the Board of Directors extensive experience in the areas of product marketing and product management.
Mr. Krall has been a director since February 2008. Mr. Krall has served as a strategic advisor to Roku, Inc., a leading manufacturer of media players for streaming entertainment, since December 2010. From February 2010 to November 2010, he served as President and Chief Operating Officer of Roku, where he was responsible for managing all functional areas of the company. Prior to that, Mr. Krall spent two years as President and Chief Executive Officer of QSecure, Inc., a privately-held developer of secure credit cards based on micro-electro-mechanical-system technology. From 1995 to July 2007, he held a variety of positions of increasing responsibility and scope at Avid Technology, Inc. (NYSE: AVID), a publicly-traded leading provider of digital media creation tools for the media and entertainment industry. His tenure at Avid included serving seven years as the company’s President and Chief Executive Officer.
Mr. Krall also currently serves on the Board of Directors for Harmonic Inc. (NASDAQ: HLIT), a leader in video delivery and cable access virtualization, Universal Audio, Inc., a privately-held manufacturer of audio hardware and software plug-ins, WeVideo, Inc., a privately-held provider of a collaborative video editing platform, Avegant Corp., a privately-held leading developer of virtual and augmented reality technology, and Audinate Pty Ltd., a creator of industry-leading media networking technology. Mr. Krall previously served on the Board of Directors of Quantum Corp. (NYSE: QTM), a publicly-traded global expert in data protection and big data management.
Mr. Krall has significant leadership, management and operational experience through his service in a broad range of executive positions within the software and technology industries. From working in companies ranging from small startups to public companies with thousands of employees serving worldwide marketplaces, Mr. Krall brings experience in the areas of new product development, integration of complex software and hardware solutions, strategy formation, and general management.
Mr. Mark has been a director since July 1987. He was our Non-Executive Chairman of the Board from April 2011 until May 2012 and also from December 2006 until March 2009. From March 2009 until April 2011, Mr. Mark served as Lead Independent Director. Mr. Mark is a private investor and member of Walnut Venture Associates, an investment group seeking opportunities in early-stage and emerging high-tech companies in New England. Mr. Mark was a founder of several high-tech companies, including Intercomp Company, American Energy Services, Inc., and Cadmus Computer Systems Corporation. Mr. Mark is also an investor in numerous early-stage companies and serves on several private boards of directors.
Mr. Mark has served on our Board of Directors for almost thirty years, spanning the entire time that we have been a public company. As a result, Mr. Mark provides our Board of Directors with critical historical knowledge and insights on our business and the software industry generally. Mr. Mark also has extensive experience as a director of public and private companies.
Ms. Tucci has been a director since February 2018. Ms. Tucci is currently Chief Executive Officer of Apto, Inc., a provider of web-based software for commercial real estate brokers. Ms. Tucci became Chief Executive Officer of Apto in August 2017. Prior to that time, Ms. Tucci was General Manager, Agile Management Business Unit of CA, Inc. from September 2015 until July 2017. Prior to that time, Ms. Tucci was Chief Revenue Officer, Office of the CEO of Rally Software from December 2014 until August 2015, when Rally was acquired by CA. Ms. Tucci joined Rally Software in December 2013
3
as Chief Marketing Officer. From January 2011 until August 2013, Ms. Tucci was Chief Strategy Officer of Symantec Corporation.
Through her experiences as chief executive officer, chief revenue officer and chief strategy officer of enterprise software companies, Ms. Tucci has developed extensive leadership, operational and strategic capabilities at both public and private software companies. Ms. Tucci’s experiences at technology companies specializing in software-as-a-service bring important insights to our Board as we continue to execute on our business and product strategies.
Executive and Other Key Officers of the Registrant |
The following table sets forth certain information regarding our executive and other key officers.
Name | Age | Position | ||
John Ainsworth | 53 | Senior Vice President, Products - Core | ||
Stephen Faberman | 48 | Chief Legal Officer | ||
Yogesh Gupta | 57 | President and Chief Executive Officer | ||
Paul Jalbert | 60 | Chief Financial Officer | ||
Loren Jarrett | 43 | Chief Marketing Officer | ||
Tony Murphy | 47 | Chief Information Officer | ||
Gary Quinn | 57 | Senior Vice President, Core Field Organization | ||
Faris Sweis | 42 | Senior Vice President, General Manager - DevTools | ||
Dimitre Taslakov | 41 | Chief Talent Officer | ||
Dmitri Tcherevik | 48 | Chief Technology Officer | ||
Mr. Ainsworth became Senior Vice President, Products-Core in January 2017. Mr. Ainsworth is responsible for the product management, product marketing, technical support and engineering functions for Progress OpenEdge, Progress Corticon, Progress DataDirect Connect, Progress DataDirect Hybrid Data Pipeline, and Sitefinity. Prior to joining our company, Mr. Ainsworth was Senior Vice President, Engineering Services at CA, Inc., a position he assumed in April 2016. Prior to that time, Mr. Ainsworth held various senior positions within CA, which he joined through acquisition in 1994.
Mr. Faberman became Chief Legal Officer in December 2015. As Chief Legal Officer, Mr. Faberman is responsible for our legal and compliance, risk management, license compliance and corporate development functions. Prior to becoming Chief Legal Officer, Mr. Faberman was Senior Vice President, General Counsel. Mr. Faberman became General Counsel in December 2012 and a Senior Vice President in January 2014. Prior to that time, from October 2012 to December 2012, Mr. Faberman was Vice President, Acting General Counsel, and from January 2012 to October 2012, Mr. Faberman was Vice President, Deputy General Counsel. Prior roles included Senior Vice President, Corporate Counsel at Heritage Property Investment Trust, Inc. from October 2003 until October 2006 and Partner, Bingham McCutcheon LLP until October 2003.
Mr. Gupta became President and Chief Executive Officer in October 2016. Prior to that time, Mr. Gupta served as an advisor to various venture capital and private equity firms from October 2015 until September 2016. Prior to that time, Mr. Gupta was President and Chief Executive Officer at Kaseya, Inc., a provider of IT management software solutions, from June 2013 until July 2015, at which time, Mr. Gupta became Chairman of the Board of Directors of Kaseya, a position he held until October 2015. From July 2012 until June 2013, Mr. Gupta served as an advisor to various venture capital and private equity firms in several mergers and acquisitions opportunities. Mr. Gupta was previously President and Chief Executive Officer of FatWire Software from July 2007 until February 2012, prior to the acquisition of FatWire Software by Oracle Corporation. Prior roles held by Mr. Gupta include Chief Technology Officer at CA, Inc., with whom Mr. Gupta held various senior positions.
Mr. Jalbert became Chief Financial Officer in March 2017. As Chief Financial Officer, Mr. Jalbert is responsible for our finance and accounting, financial planning, treasury, tax and investor relations functions. Prior to becoming Chief Financial Officer, Mr. Jalbert was Vice President, Chief Accounting Officer, a position he assumed upon joining the Company in August 2012. Prior roles included Corporate Controller at publicly traded companies Keane and Genuity, as well as other senior financial positions at Verizon (formerly GTE).
Ms. Jarrett became Chief Marketing Officer in January 2017. As Chief Marketing Officer, Ms. Jarrett is responsible for our marketing strategy, corporate marketing, demand generation, and field marketing functions. Prior to becoming Chief Marketing Officer, Ms. Jarrett was Chief Marketing Officer at Acquia Inc., a provider of cloud platform and data-driven journey technology, from 2015 until December 2016. Previously, Ms. Jarrett was Chief Marketing Officer at Kaseya, Inc. from 2013
4
until 2015, and Vice President, Corporate Charge Card and Loyalty Products at American Express, in 2013. Prior to that time, Ms. Jarrett was Vice President, Product Management and Strategy at Oracle Corporation from 2011 until 2012, and Senior Vice President of Marketing and Product Management at FatWire Software from 2007 until its acquisition by Oracle Corporation in 2011.
Mr. Murphy became Chief Information Officer in June 2017. As our Chief Information Officer, Mr. Murphy is responsible for the development and implementation of our overall technology strategy for all internal systems and business processes. Prior to joining our company, Mr. Murphy was Vice President of Global IT at Stratus Technologies, Inc., a producer of computer servers and software, from January 2013 until May 2017. Previously, Mr. Murphy was Director of IT and Business Systems at Acme Packet, Inc. from May 2011 until its acquisition by Oracle Corporation in 2013.
Mr. Quinn became Senior Vice President, Core Field Organization in August 2017. Mr. Quinn is responsible for global field operations for Progress OpenEdge, Progress Corticon, Progress DataDirect Connect, Progress DataDirect Hybrid Data Pipeline, and Sitefinity. Prior to joining our company, Mr. Quinn was President and Chief Executive Officer of FalconStor Software, Inc. Mr. Quinn joined FalconStor Software in April 2012 as vice president of sales and marketing for North America, and he was named executive vice president and chief operating officer (COO) in April 2013, interim CEO in June 2013 and CEO in August 2014. Prior roles included Executive Vice President of Global Partners and International Sales at CA, Inc. until 2006 and Commissioner of Information Technology (CIO) at Suffolk County Department of Information Technology (DoIT) from 2008 until 2012.
Mr. Sweis became Senior Vice President and General Manager of DevTools in January 2017. As General Manager, Mr. Sweis is responsible for the sales, product management, product marketing, field marketing, technical support and engineering for our DevTools product. Prior to this role, Mr. Sweis was our Chief Transformation Officer, a position he assumed in May 2016. Mr. Sweis also became our Acting Chief Product Development Officer in August 2016. Prior to being named our Chief Transformation Officer, Mr. Sweis was Vice President, Development, a position he assumed upon acquisition of Telerik in December 2014. Prior to that time, Mr. Sweis was Chief Technology Officer at Telerik.
Mr. Taslakov became Chief Talent Officer in December 2014 upon our acquisition of Telerik. As Chief Talent Officer, Mr. Taslakov is responsible for talent and performance management, recruiting, compensation and benefits and facilities functions. Prior to the acquisition of Telerik, Mr. Taslakov was Chief Talent Officer of Telerik, a position he assumed in January 2014. Prior to that time, from November 2012 until December 2013, he was Telerik’s Chief Revenue Officer. Prior to November 2012, Mr. Taslakov was Vice President of Business Development at Telerik.
Mr. Tcherevik became Chief Technology Officer in April 2017. As Chief Technology Officer, Mr. Tcherevik is responsible for leading our technology strategy for cognitive applications across our product portfolio as well as our future technology efforts. Prior to joining our company, Mr. Tcherevik was Chief Executive Officer of MightyMeeting, Inc., which he founded in 2010. Prior roles included Chief Technology Officer at FatWire Software from 2007 until 2010 and Vice President, Office of the Chief Technology Officer at CA, Inc. until 2004.
Audit Committee |
The Audit Committee of our Board of Directors during 2017 consisted of Messrs. Egan, Ram Gupta (until February 2017), Kane and Mark, with Mr. Kane serving as Chairman. The Audit Committee met eight times during 2017. In February 2017, Ram Gupta resigned from our Board of Directors.
Our Board of Directors has determined that each member of the Audit Committee meets the independence requirements promulgated by NASDAQ and the SEC, including Rule 10A-3(b)(1) under the Securities Exchange Act of 1934, as amended, or the Exchange Act. In addition, our Board of Directors has determined that each member of the Audit Committee is financially literate and that Mr. Kane qualifies as an “audit committee financial expert” under the rules of the SEC.
The Audit Committee operates under a written charter adopted by our Board of Directors, a copy of which can be found on our website at www.progress.com under the heading “Corporate Governance” located on the “Investor Relations” page.
The Audit Committee assists our Board of Directors in fulfilling its oversight responsibilities for accounting and financial reporting compliance. The Audit Committee meets with management and with our independent registered public accounting firm to discuss our financial reporting policies and procedures, our internal control over financial reporting, the results of the independent registered public accounting firm’s examinations, our critical accounting policies and the overall quality of our financial reporting, and the Audit Committee reports on these matters to our Board of Directors. The Audit Committee meets with the independent registered public accounting firm with and without our management present.
5
For 2017, among other functions, the Audit Committee:
• | appointed the independent registered public accounting firm; |
• | reviewed with our independent registered public accounting firm the scope of the audit for the year and the results of the audit when completed; |
• | reviewed the independent registered public accounting firm’s fees for services performed; |
• | reviewed with management and the independent registered public accounting firm the annual audited financial statements and the quarterly financial statements, prior to the filing of reports containing those financial statements with the SEC; |
• | reviewed with management our major financial risks and the steps management has taken to monitor and control those risks; and |
• | reviewed with management various matters related to our internal controls. |
Section 16(a) Beneficial Ownership Reporting Compliance |
Section 16(a) of the Exchange Act requires our directors, executive officers, and holders of more than 10% of our common stock to file with the SEC initial reports of ownership and reports of changes in ownership of our common stock. These reporting persons are required by regulations of the SEC to furnish us with copies of all such filings. Based solely on a review of the copies of such forms that we have received, and on written representations from certain reporting persons, we believe that, with respect to the fiscal year ended November 30, 2017, our directors, officers, and 10% stockholders complied with all applicable Section 16(a) filing requirements.
Code of Conduct and Business Ethics |
Our Board of Directors has adopted a Code of Conduct and Business Ethics that applies to all of our officers, directors, and employees. A copy of the Code of Conduct and Business Ethics can be found on our website at www.progress.com under the heading “Corporate Governance” located on the “Investor Relations” page.
6
ITEM 11. EXECUTIVE COMPENSATION
COMPENSATION DISCUSSION AND ANALYSIS
Introduction |
This “Compensation Discussion and Analysis” section describes the elements of our compensation programs for our executive officers. This section also provides an overview of our executive compensation philosophy and analyzes how and why the Compensation Committee of our Board of Directors arrives at specific compensation decisions and policies.
We describe below our compensation philosophy, policies, and practices relating to the fiscal year ended November 30, 2017 with respect to the following “named executive officers,” (“NEOs”) whose compensation is set forth in the "Summary Compensation Table" and other compensation tables contained in this Amendment No. 1 to Annual Report on Form 10-K/A:
• | Yogesh Gupta, our President and Chief Executive Officer; |
• | Paul Jalbert, who became our Chief Financial Officer in March 2017; |
• | John Ainsworth, who became our Senior Vice President, Core Products in January 2017; |
• | Loren Jarrett, who became our Chief Marketing Officer in January 2017; |
• | Dmitri Tcherevik, who became our Chief Technology Officer in April 2017; and |
• | Kurt Abkemeier, who served as our Chief Financial Officer until March 2017. |
We present our Compensation Discussion and Analysis in the following sections:
1. Executive Summary. In this section, we discuss our 2017 corporate performance and certain governance aspects of our executive compensation program. | p. 7 |
2. Executive Compensation Program. In this section, we describe our executive compensation philosophy and process and the material elements of our executive compensation program. | p. 16 |
3. 2017 Executive Compensation Decisions. In this section, we provide an overview of our Compensation Committee’s executive compensation decisions for 2017 and certain actions taken before or after 2017, when doing so enhances the understanding of our executive compensation program. | p. 19 |
4. Other Executive Compensation Matters. In this section, we describe our other compensation policies and review the accounting and tax treatment of compensation. | p. 31 |
Executive Summary |
Business Overview
We are a global leader in application development, empowering enterprises to build mission-critical business applications to succeed in an evolving business environment. With offerings spanning web, mobile and data for on-premise and cloud environments, we power startups and industry titans worldwide, promoting success one application at a time. Our solutions are used across a variety of industries.
Fiscal 2017-A Transformative Year
Fiscal 2017 was a transformative year for our company. The catalyst for our transformation occurred in October 2016, when Yogesh Gupta became our new Chief Executive Officer. Mr. Gupta brought to Progress more than twenty-five years of software experience, with a proven track record as chief executive officer of delivering outstanding investor returns
through innovative growth strategies and strong execution. Mr. Gupta also served in several executive-level roles during his more than fifteen years at CA, Inc., a publicly-traded software company with businesses and technologies that have similar growth profiles as our company.
Immediately after the end of fiscal 2016, Mr. Gupta conducted a thorough review of our strategy. Following this strategy review, our Board of Directors and Mr. Gupta concluded that we should undertake a new strategy that leverages our application development platform capabilities, and enables our customers and partners to build next generation applications
7
that drive their businesses. We will accomplish this by providing the platform and tools enterprises need to build "Cognitive Applications," which are the future of application development. This new strategy builds on our inherent DNA and vast experience in application development established over 35 years.
At the same time, Mr. Gupta also reviewed our operations. Our budget and operating plan for 2016 reflected our optimism about the growth prospects of our business segments. However, as fiscal 2016 ended, our financial results fell short of our aggressive expectations. Following this operational review, our Board of Directors and Mr. Gupta concluded that because our core products competed in mature market segments with limited growth opportunities, we needed to moderate our view of their growth prospects. We shifted our organization and operating principles for these product lines, with the goal of serving our core customer base more profitably and with a focus on retention rather than the pursuit of new customers. We recognized that our prospects for future growth would be tied to our new strategy.
Following these extensive reviews, in January 2017, we launched a new strategic plan and operating model, with three major elements:
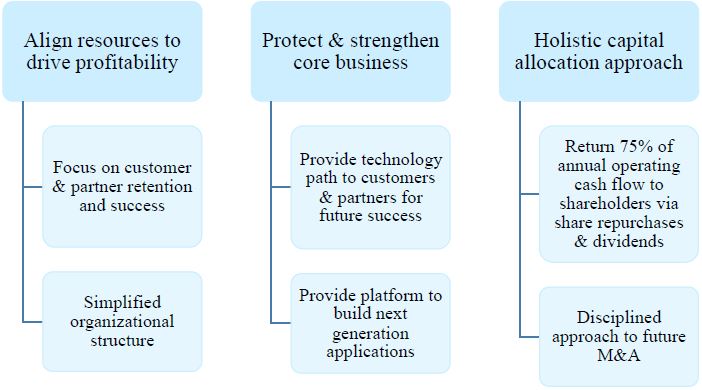
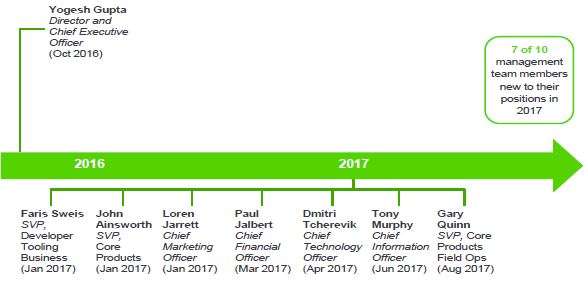
In consultation with our Board, Mr. Gupta also concluded that changes to our senior management team were required to transform our company. To execute our new strategy, Mr. Gupta recruited several new senior leaders with a track record of success in executing the type of strategies and operational changes that the transformation we began in 2017 would require. Mr. Gupta also shifted the responsibilities of existing senior leaders to better align with our new operating model. As shown in the table below seven of our ten management team members were new to their positions in fiscal 2017.
8
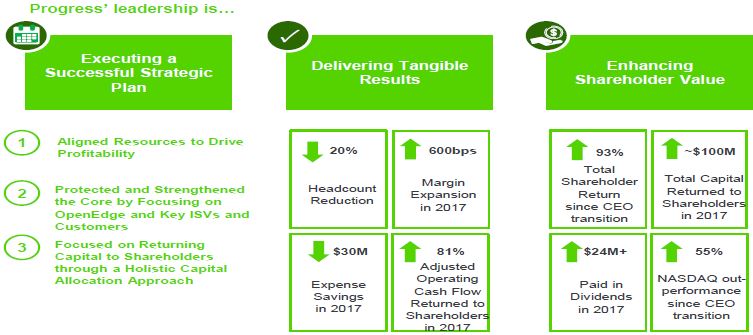
Our New Strategic Plan is Delivering Results…and Enhancing Shareholder Value
As shown in the chart below, we made significant progress in executing on our new strategic plan. Our budget and operating plan for 2017 reflected our modest growth expectations with respect to our core products and our focus on managing our business as efficiently as possible. Although we projected that our total revenues would decline year-over-year, by reducing our operating expenses through headcount and spending reductions, we anticipated that we would achieve growth in non-GAAP operating income and non-GAAP earnings per share.
Our 2017 financial results exceeded our original expectations with respect to total revenue, operating income, operating margin, earnings per share and free cash flow. The strength of our overall business enabled us to return almost $100 million of capital to shareholders in fiscal 2017 in the form of share repurchases and dividends. Ultimately, our better-than-expected performance throughout the year generated strong returns for our shareholders.
9
The table below summarizes our 2017 financial results as compared to fiscal 2016:
(In millions, except percentages and per share amounts) | Fiscal 2016 Actual | Fiscal 2017 Actual | |||
GAAP | |||||
Revenue | $405.3 | $397.6 | |||
Income (loss) from operations | ($29.7) | $70.6 | |||
Diluted earnings (loss) per share | ($1.13) | $0.77 | |||
Operating Margin | (7 | )% | 18 | % | |
Cash from operations | $102.8 | $105.7 | |||
Non-GAAP | |||||
Revenue | $407.4 | $398.6 | |||
Operating income | $123.1 | $144.5 | |||
Diluted earnings per share | $1.65 | $1.91 | |||
Operating Margin | 30 | % | 36 | % | |
Adjusted free cash flow | $100.6 | $121.5 | |||
A reconciliation between the GAAP results and non-GAAP measures is located in Appendix A at the end of this Amendment No. 1 to Annual Report on Form 10-K/A.
GAAP Results vs. Non-GAAP Measures
As disclosed in our press releases regarding annual and quarterly earnings and other communications, we provide financial information using methods in addition to those prescribed by generally accepted accounting principles in the United States ("GAAP"), such as non-GAAP revenue, non-GAAP operating income, non-GAAP earnings per share and adjusted free cash flow.
We believe these non-GAAP financial measures enhance the reader’s overall understanding of our current financial performance and our prospects for the future by providing more transparency for certain financial measures and providing a
10
level of disclosure that helps investors understand how we plan and measure our business. We believe that providing these non-GAAP measures affords investors a view of our operating results that may be more easily compared to our peer companies and enables investors to consider our operating results on both a GAAP and non-GAAP basis during and following the integration period of our acquisitions. Presenting the GAAP measures on their own may not be indicative of our core operating results. Furthermore, management believes that the presentation of non-GAAP measures when shown in conjunction with the corresponding GAAP measures provide useful information to management and investors regarding present and future business trends relating to our financial condition and results of operations.
Non-GAAP revenue, non-GAAP costs of sales and operating expenses, non-GAAP income from operations and operating margin, non-GAAP net income, and non-GAAP diluted earnings per share exclude the effect of purchase accounting on the fair value of acquired deferred revenue, amortization of acquired intangible assets, impairment of acquired intangible assets, stock-based compensation expense, restructuring charges, acquisition-related expenses, certain identified non-operating gains and losses, and the related tax effects of the preceding items. We also provide guidance on adjusted free cash flow, which is equal to cash flows from operating activities less purchases of property and equipment and capitalized software development costs, plus restructuring payments.
However, this non-GAAP information is not in accordance with, or an alternative to, GAAP information and should be considered in conjunction with our GAAP results as the items excluded from the non-GAAP information often have a material impact on our financial results. We provide a reconciliation of non-GAAP adjustments to our GAAP financial results in our earnings releases and we make this information available on our website at www.progress.com within the "Investor Relations" section.
2017 Executive Compensation Program Design
The Compensation Committee’s philosophy is to tie executive pay to company performance, thereby creating alignment with our stockholders and to drive the creation of sustainable long-term stockholder value. Our executive compensation programs for 2017 reflected the shift in our strategy following Mr. Gupta’s appointment as our CEO, including our revised growth expectations within our core products, the shift in our go-forward product strategy and the restructuring of our organization and operational philosophy we undertook in early January 2017.
A key component of the Compensation Committee’s responsibilities during fiscal 2017 was to develop compensation packages sufficient to retain Mr. Jalbert as our Chief Financial Officer, and to attract Mr. Ainsworth, Ms. Jarrett and Mr. Tcherevik to join our company. These compensation packages reflected our pay-for-performance philosophy and alignment of executive officer and stockholder interests, as well as external competitiveness and internal parity considerations.
For each of these individuals, the Compensation Committee issued new hire or promotion equity awards with a value larger than the typical award for which the NEO would be eligible under our annual equity program. In addition to a standard annual award, these new hire or promotion equity awards included a special one-time award of time-based restricted stock units ("RSUs"). See "New NEO Compensation Terms." The amounts shown in the chart below for the NEOs include these one-time RSU awards, which are not part of our NEOs’ on-going compensation.
In the case of Mr. Gupta, no RSUs were issued in fiscal 2017 as he received RSUs in October 2016 as part of his new hire award. See "Individual Considerations."
11
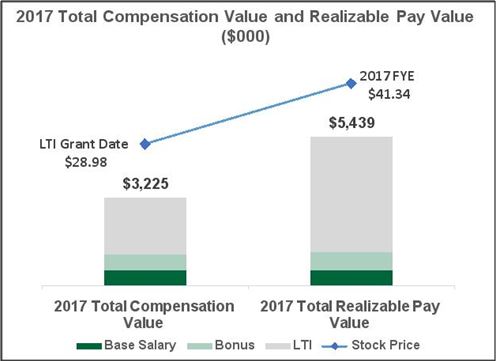
Alignment of CEO Realizable Pay Value and Performance
The Compensation Committee reviews realizable pay value analyses for the executive officers to inform design and award levels for long-term incentive ("LTI") awards. We calculate realizable pay as the sum of annual base salary, actual corporate bonus plan award paid, the "in-the-money" value of stock options, the value of RSUs and the value of performance-based restricted stock units ("PSUs") (the current value is determined by measuring performance thus far in the performance period and determining the resulting level of assumed payout as of the most-recent fiscal year end).
Given that 2017 was the first full year of Mr. Gupta’s tenure as our CEO, the table below focuses on 2017 compensation only:
• | The aggregate realizable pay value of the total base salary, corporate bonus plan payout and LTI for our CEO at the end of fiscal 2017 was estimated to be $5.4 million, or approximately 169% of his 2017 compensation values disclosed in the Summary Compensation Table below. |
• | Our corporate bonus plan payout was 115% of target, based on actual company performance versus goals set at the beginning of the fiscal year |
• | Our stock price increased from $28.98 (as of Mr. Gupta’s LTI grant date of February 23, 2017) to $41.34 (2017 fiscal year end stock price), which represented a 44% return to shareholders (includes share price performance plus dividends paid during this period). |
These findings demonstrate alignment of the CEO’s realizable pay with shareholders’ investment performance during 2017.
12
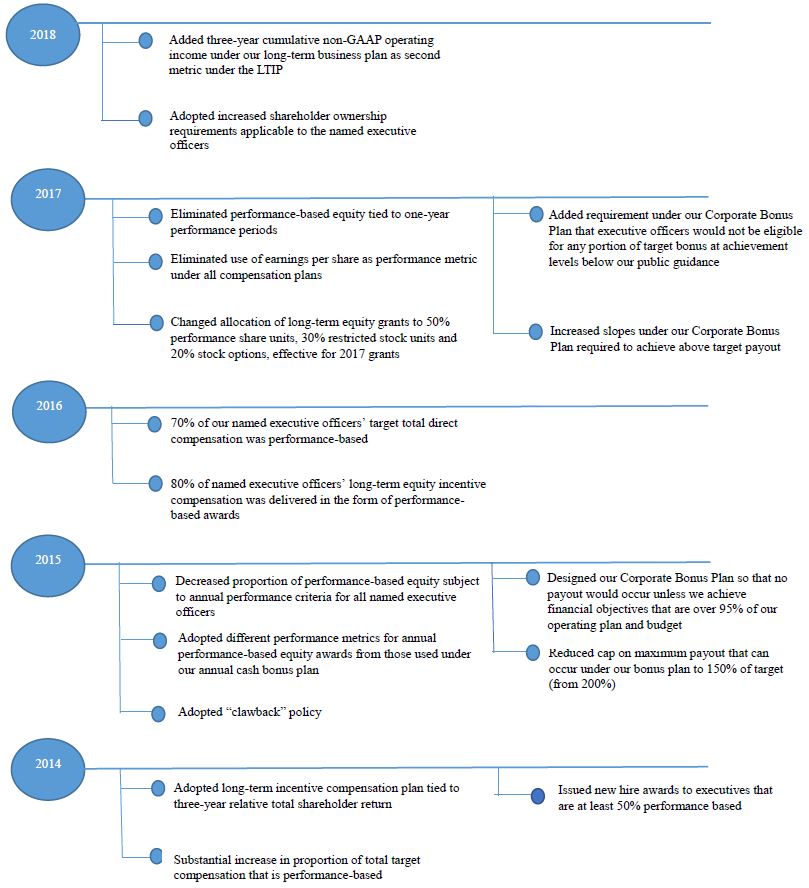
Response to 2017 Say-on-Pay Vote and the Evolution of our Executive Compensation Program
We value the input of our stockholders on our compensation programs. We hold an advisory vote on executive compensation on an annual basis. We also periodically communicate with our stockholders to better understand their opinions on governance issues, including compensation. The Compensation Committee carefully considers stockholder feedback and the outcome of each vote when reviewing our executive compensation programs each year.
At our 2017 annual stockholders meeting, approximately 98% of the votes cast approved, on an advisory basis, our executive compensation for fiscal year 2016. As shown in the table below, for each of the past three years, we received more than 95% support with respect to the advisory vote on executive compensation.
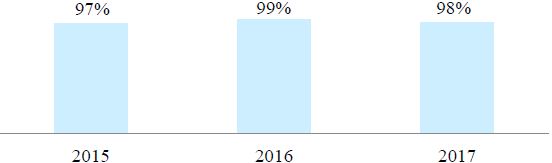
However, over the past few years we have made significant changes to our executives’ compensation in response to prior say-on-pay votes and feedback from stockholders as shown in the table below. The Committee will continue to consider the outcome of our say-on-pay votes and our stockholder views when making future compensation decisions for our executives.
13
14
Compensation Governance
What We Do: | What We Don’t Do: |
✓ 70% of annual equity award is performance-based | X No perquisites |
✓ Grant performance-based equity awards with performance measures that span three years | X No guaranteed salary increases or non-performance-based bonuses |
✓ Utilize different measures for performance equity awards and cash incentives | X No excise tax gross-ups |
✓ Maintain stock ownership guidelines to ensure our directors’ and executives’ interests are aligned with those of our stockholders | X No pledging or hedging of company stock by directors and executive officers |
✓ Maintain compensation recovery (or clawback) policy | |
✓ Cap the amounts our executives can earn under our annual incentive plans | |
15
Executive Compensation Program |
Philosophy and Objectives
Our philosophy is to reward executive officers based upon corporate performance, as well as to provide long-term incentives for the achievement of financial and strategic goals. We use a combination of cash compensation, composed of base salary and an annual cash bonus program, long-term equity incentive compensation programs, and a broad-based benefits program to create a competitive compensation package for our executive management team. We tie the payment of cash and equity incentive compensation to executive officers exclusively to the achievement of financial objectives.
The Compensation Committee uses the following principles to guide its decisions regarding the compensation of our executive officers:
Pay for Performance: | Total compensation should reflect a “pay for performance” philosophy in which more than 50% of each executive officer’s compensation is tied to the achievement of company financial objectives. Cash compensation for our executive officers is weighted toward short-term incentive bonus awards tied to company financial objectives that are difficult to attain and require achievement closely linked to our annual operating plan and budget. If the targets for total revenue and adjusted free cash flow are not met within 95% of our budget or the target for operating income is not met within 90% of our budget, no bonus is earned. |
Alignment with Stockholders’ Interests: | Total compensation levels should include performance-based equity awards to align executive officer and stockholder interests. |
Internal Parity: | To the extent practicable, base salaries and short- and long-term incentive targets for similarly-situated executive officers should be comparable to avoid divisiveness and encourage teamwork, collaboration, and a cooperative working environment. |
External Competitiveness: | Total compensation should be competitive with peer companies so that we can attract and retain high performing key executive talent. To achieve this goal within market ranges, our Compensation Committee periodically reviews the compensation practices of other companies in our peer group, as discussed in the “Peer Group” section below. |
Compensation Review Process
Role of Compensation Committee
Toward the end of each fiscal year, the Compensation Committee begins the process of reviewing executive officer compensation for the next fiscal year. The Compensation Committee is provided with reports from its independent compensation consultant comparing our executive compensation and equity granting practices relative to the market and to our peer group. The Compensation Committee reviews recommendations from management on the current fiscal year annual and long-term incentive compensation programs. The Compensation Committee then reviews and approves changes to executive officers’ total target cash compensation, which includes base salary and target incentive compensation, and long-term equity incentive compensation. The Compensation Committee reviews all recommendations considering our compensation philosophy and seeks input from its independent compensation consultant prior to making any final decisions.
Role of Chief Executive Officer
Our Chief Executive Officer makes recommendations to the Compensation Committee with respect to compensation for his direct reports (including our other named executive officers). In making these recommendations, the factors considered include market data, tenure, individual performance, responsibilities, and experience levels of the executives, as well as the compensation of the executives relative to one another.
These initial CEO recommendations are discussed with the Chairman of the Compensation Committee or presented at Compensation Committee meetings. The Total Rewards group within our Human Capital Department and individuals within our Finance and Legal Departments support the Compensation Committee in the performance of its responsibilities. During 2017, our Chief Financial Officer, Chief Legal Officer and Chief Talent Officer regularly attended the Compensation Committee meetings to provide perspectives on the competitive landscape, the needs of the business, information about our financial performance and relevant legal and regulatory developments.
16
The Compensation Committee meets in executive session (without management) with its external compensation consultant to deliberate on executive compensation matters. None of our executive officers participate in the Compensation Committee’s deliberations or decisions regarding their own compensation.
Role of Compensation Consultant
Our Compensation Committee again retained Pay Governance to advise it on matters related to executive compensation for 2017.
Other than providing limited guidance regarding our broad-based equity plan design for all employees, Pay Governance did not provide any services for management in 2017. Pay Governance consulted with our management when requested by the Compensation Committee and only as necessary to obtain relevant compensation and performance data for the executives as well as essential business information so that it could effectively support the Compensation Committee with appropriate competitive market information and relevant analyses.
During 2017, Pay Governance provided a range of services to the Compensation Committee to support the Compensation Committee’s agenda and obligations, including providing advice relating to compensation terms for new or promoted executives, regulatory updates, industry trends and peer group compensation data, so that the Compensation Committee could set compensation for executives and non-employee directors in accordance with our policies and the Compensation Committee’s charter, advice on the structure and competitiveness of our compensation programs, and advice on the consistency of our programs with our executive compensation philosophy.
Representatives of Pay Governance attended Compensation Committee meetings and provided advice to the Compensation Committee upon its request. The Compensation Committee assessed the independence of Pay Governance and determined that Pay Governance is independent of our company and has no relationships that could create a conflict of interest with us. As part of its assessment, the Compensation Committee considered the fact that Pay Governance did not provide any other services to us and consults with our management only as necessary to provide the services described above.
Peer Group
To assist the Compensation Committee in making decisions on total compensation for executives and company-wide equity grants, the Compensation Committee utilizes peer and industry group data and analyses. Each year, as necessary, the Compensation Committee reviews with its external compensation consultant the list of peer companies as points of comparison to ensure that comparisons are meaningful.
For 2017, Pay Governance provided recommendations on the composition of our peer group. Based on the facts described in the table below and management’s input, for 2017, Pay Governance recommended, and the Compensation Committee approved, the following peer group:
General Description | Criteria Considered | Peer Group List |
Software and high technology companies which operate in similar or related businesses and with which Progress competes for talent | Publicly-traded and based in U.S. Revenues-0.5x to 2.5x of Progress Market Cap-0.2x to 3.0x of Progress Other (e.g., recent financial performance, business model, proxy advisor peers) | Aspen Technology, Inc. Avid Technology, Inc. Bottomline Technologies, Inc. CommVault Systems, Inc. Demandware, Inc. Epiq Systems, Inc. Gigamon Inc.* HubSpot Inc.* Interactive Intelligence, Inc.* Jive Software, Inc. Manhattan Associates, Inc. MicroStrategy, Inc. Pegasystems, Inc. Rovi Corporation Splunk, Inc. Synchronoss Technologies, Inc. Tableau Software, Inc. The Ultimate Software Group, Inc. VASCO Data Security International, Inc.* *Added for 2017 |
17
For 2017, the Compensation Committee replaced five peer companies utilized in 2016 with four new additions as shown in the table above. Four of the replaced companies (Advent Software, Inc., Demandware, Inc., Qlik Technologies, Inc. and SolarWinds, Inc.) were acquired during 2016. The Compensation Committee replaced NetScout Systems, Inc. because their annual revenues (as a result of an acquisition) had exceeded our criteria.
Pay Governance then prepared a compensation analysis based on survey data and data gathered from publicly available information for our peer group companies.
Survey Data
The executive compensation analysis prepared by Pay Governance also included data from Radford’s 2016 Global Technology Survey for companies with revenues between $200 million and $500 million. The Compensation Committee used this data to compare the current compensation of our named executive officers to the peer group and to determine the relative market value for position, based on direct, quantitative comparisons of pay levels. The survey data was used when there was a lack of public peer data for an executive’s position and to obtain a general market understanding of current compensation practices.
Competitive Positioning
The fiscal 2017 target total direct compensation for our named executive officers was set by the Compensation Committee based predominantly on competitive pay practices, as reflected in the peer group and survey data. The Compensation Committee reviews market data at the 25th, 50th, and 75th percentile and, for 2017, sought to target total direct compensation for the named executive officers as a group at the 50th percentile of our peer group in setting our executive compensation programs. Additional adjustments were considered based on individual importance to our company, anticipated future contributions, internal pay equity, and historical pay levels, as well as the level of an executive officer’s unvested equity awards and incentives.
In determining equity awards related to the recruitment or promotion of executive officers, the Compensation Committee seeks to align the interests of these executives with our shareholders and reviews and considers: market data, forfeited awards at prior employers, importance of role, candidate experience, transitional state of the company and internal positioning. New hire and promotional equity awards are generally one-time in nature and future awards to these executive officers are aligned with our annual equity award structure.
Components of Executive Officer Compensation
Compensation for our named executive officers currently consists of three primary components that are designed to reward performance in a simple and straightforward manner-base salaries, annual cash bonuses, and long-term equity awards. The purpose and key characteristics of each of these components and how each element accomplishes the goals and objectives of our program are summarized below.
18
Compensation Element | Objective | Key Features |
Cash Compensation | To attract, motivate and reward executives whose knowledge, skills, and performance are critical to our success | |
• Base Salary | To secure and retain services of key executive talent by providing a fixed level of cash compensation for performing essential elements of position | Adjustments may be made to reflect market conditions for a position, changes in the status or duties associated with a position, individual performance or internal pay equity |
• Annual Cash Bonus | To encourage and reward annual corporate performance that enhances short and long-term stockholder value | Cash bonuses are based on percentage of base salary, with actual awards based exclusively on attainment of objective corporate financial goals |
Equity Compensation | To align executives’ interests with those of stockholders | |
• PSUs under the Long-Term Incentive Plan (“LTIP”) | To align interests of management with those of our stockholders with the goal of creating long-term growth and value | Three-year performance period Performance metric utilized is relative total stockholder return (“TSR”) in comparison to NASDAQ Software Index |
• Restricted Stock Units | To retain executive talent | Service-based vesting over three-year period |
• Stock Options | To align interests of management with those of our stockholders with the goal of creating long-term growth and value | Service-based vesting over four-year period Exercise price equal to fair market value on date of grant |
Other Compensation | To provide benefits that promote employee health and welfare, which assists in attracting and retaining our executive officers | Indirect compensation element consisting of programs such as medical, dental, and vision insurance, a 401(k) plan with up to a 3% matching contribution, an employee stock purchase plan program, and other plans and programs generally made available to employees |
Severance and Change in Control Benefits | To serve our retention and motivational objectives, helping our named executive officers maintain continued focus, dedication to their responsibilities and objectivity to maximize stockholder value, including in the event of a transaction that could result in a change in control of our company; particularly important in a time of increased consolidation in our industry and increased competition for executive talent | Provides protection in the event of an involuntary termination of employment under specified circumstances, including following a change in control of our company as described below under “Potential Payments Upon Termination or Change in Control” and “Executive Compensation-Severance and Change in Control Agreements” |
2017 Executive Compensation Decisions |
2017 Program Design
Consistent with its pay-for-performance philosophy, the Compensation Committee emphasized alignment with our long-term business goals in designing our executive compensation programs for 2017. Our executive compensation programs for 2017 reflected the shift in our strategy, the change in our go-forward product strategy and the restructuring of our organization and operational philosophy we undertook in early 2017.
19
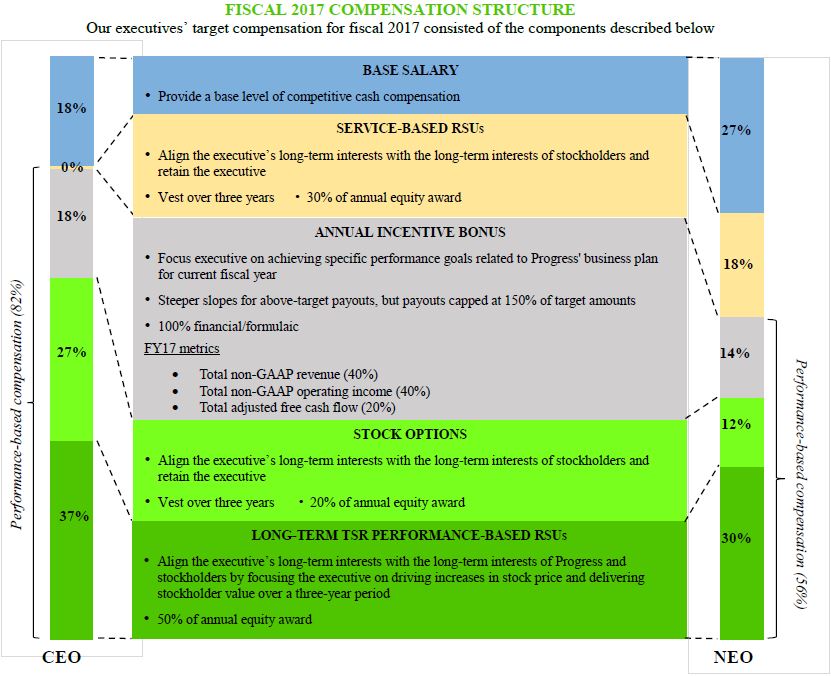
The chart below summarizes the key attributes of each pay element for fiscal 2017.
Element | Key Attributes |
Base salary | Aligns with scope and complexity of role and prevailing market conditions; salary levels are generally at market median |
Annual Cash Bonus | 100% financial/formulaic FY17 metrics Total non-GAAP revenue (40%) Total non-GAAP operating income (40%) Total adjusted free cash flow (20%) Payout of bonuses would not occur if we failed to achieve total revenue and adjusted free cash flow of at least 95% of our annual operating plan and budget and operating income of at least 90% of our annual operating plan and budget Payouts under the annual cash bonuses capped at 150% of target amounts with steeper slopes for above-target payouts |
Restricted Stock Units | Vests over three years to support retention 30% of annual equity award |
Stock options | Vests over four years to support retention and align with our stockholders’ interests 20% of annual equity award |
LTIP PSUs | Three-year performance period Performance metric utilized is relative TSR in comparison to NASDAQ Software Index 50% of annual equity award |
New NEO Compensation Terms
As described above, a key component of the Compensation Committee’s responsibilities during fiscal 2017 was to develop compensation packages sufficient to attract and retain Mr. Jalbert, Mr. Ainsworth, Ms. Jarrett and Mr. Tcherevik as well as other new members of senior management. In each case, the Compensation Committee designed these compensation packages in consultation with its external compensation consultant.
In the table below, we describe the responsibilities and unique experiences brought to our company by each of such named executive officers.
NEO | Role | Responsibilities | Experience |
Paul Jalbert | Chief Financial Officer | Finance & accounting | Thirty years of experience as finance executive at publicly and private-held companies, including UnitedHealth, Picis, Keane, Genuity and Verizon |
John Ainsworth | SVP, Core Products | Product management, engineering and technical support for all core products except Dev Tools | Twenty-five years at CA, Inc. running large teams responsible for products with similar profiles and growth characteristics as our core products |
Loren Jarrett | Chief Marketing Officer | Product and marketing strategy | Track record of creating successful product and marketing strategies at companies as diverse as CA, Inc., Oracle, American Express and Acquia |
Dmitri Tcherevik | Chief Technology Officer | Leading our vision and technology strategy across our product portfolio | Successful track record of devising and implementing technology strategy for emerging markets as founder of two successful technology start-ups as well as for CA, Inc. |
In developing compensation terms for the new NEOs, the Compensation Committee took into account the following factors, among others:
• | in the case of Mr. Jalbert, the compensation terms negotiated with Mr. Abkemeier approximately six months earlier following the lengthy search process for a new Chief Financial Officer during fiscal 2016; |
• | in the case of Mr. Ainsworth, his experience at CA, Inc. leading product teams with characteristics similar to our core products; |
20
• | in the case of Ms. Jarrett, the fact that developing a product and marketing strategy would be a key part of her role as Chief Marketing Officer; |
• | in the case of Mr. Tcherevik, the substantial experience he had with strategies and technologies similar to our cognitive applications product strategy; |
• | internal pay equity; and |
• | the significant turnover we had experienced in the executive ranks during fiscal 2017 and the need for greater stability in the management team to execute the new strategic plan. |
As described above, in determining equity awards related to the recruitment or promotion of executive officers, the Compensation Committee seeks to align the interests of these executives with our shareholders and reviews and considers: market data, forfeited awards at prior employers, importance of role, candidate experience, transitional state of the company and internal positioning. New hire and promotional equity awards are generally one-time in nature and future awards to these executive officers are aligned with our annual equity award structure.
In the case of Mr. Jalbert, Mr. Ainsworth and Ms. Jarrett, the new hire equity awards consisted of two components, an annual equity award and a special equity award. For Mr. Jalbert, Mr. Ainsworth and Ms. Jarrett, the annual equity award consisted of 50% performance stock units under our Long-Term Incentive Plan, 30% time-based restricted stock units and 20% stock options. Mr. Jalbert received an annual equity award with a value of $1,000,000 and Mr. Ainsworth and Ms. Jarrett each received an annual equity award with a value of $700,000. The vesting of these annual equity awards is identical to our annual equity program described below.
The Compensation Committee issued special one-time equity awards consisting of time-based restricted stock units to each of Mr. Jalbert ($1,000,000), Mr. Ainsworth ($300,000) and Ms. Jarrett ($300,000). Mr. Jalbert’s special equity award vests in March 2020 if he remains our Chief Financial Officer on such date. The vesting of the special awards issued to Mr. Ainsworth and Ms. Jarrett is identical to RSUs issued under our annual equity program.
In the case of Mr. Tcherevik, he received a new hire equity award of $1,000,000, consisting of 50% performance stock units under our Long-Term Incentive Plan, 30% time-based restricted stock units and 20% stock options. The vesting of Mr. Tcherevik’s new hire award is identical to the annual equity program.
In January 2018, consistent with the Compensation Committee’s philosophy, each of the NEOs received awards under our annual equity program that did not include a new hire or special equity award.
Pay Mix
In setting the mix among the different elements of executive compensation, we do not target specific allocations, but generally weight target compensation more heavily toward performance-based compensation, both cash and equity. The percentage of performance-based compensation for our executive officers and other employees increases with job responsibility, reflecting our view of internal pay equity and the ability of a given employee to contribute to our results. We also generally align our compensation mix with the practices of our peer group when possible and to the extent consistent with our compensation strategy and business plan.
As shown in the tables below, the total direct compensation mix for Mr. Gupta and our other named executive officers in fiscal 2017 was consistent with our peer group.
21
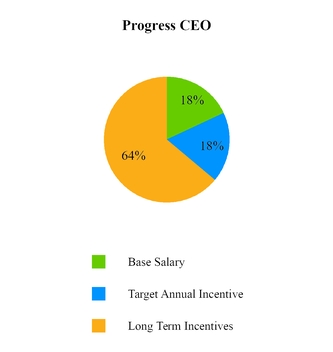
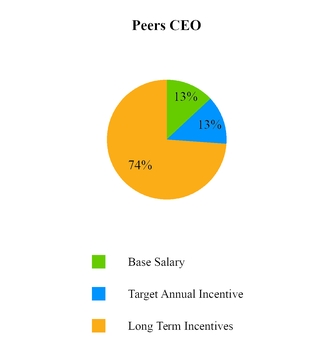
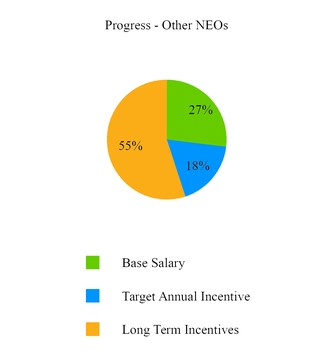
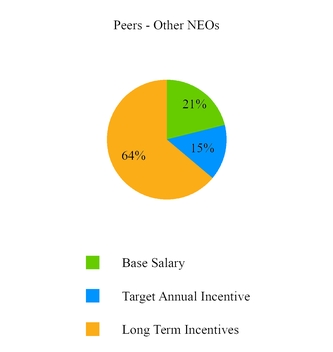
These allocations reflect our belief that a significant portion of our named executive officers’ compensation should be performance-based and therefore “at risk” based on company performance, as well as subject to service requirements. Since our cash incentive opportunities and equity incentive awards have both upside opportunities and downside risks and our actual performance can deviate from the target goals, the amount of compensation earned will differ from the target allocations.
Individual Considerations
Below is a summary of the fiscal 2017 compensation decisions and, where applicable, changes for each named executive officer from fiscal 2016.
22
Yogesh Gupta, Chief Executive Officer (1)
2016 Target Pay ($) | 2017 Target Pay ($) | |||
Target Annual Cash Compensation | 1,150,000 | 1,150,000 | (7) | |
Base Salary | 575,000 | 575,000 | ||
Target Bonus | 575,000 | (2) | 575,000 | (8) |
Target Annual Equity Compensation | 2,400,000 | 2,075,000 | ||
Target Annual RSUs | 375,000 | (3) | -- | (9) |
Target Annual Stock Options | -- | 875,000 | (4) | |
Target One-Year Performance PSUs | 875,000 | (4) | -- | |
Target LTIP PSUs | 1,150,000 | (5) | 1,200,000 | (10) |
Total Target Annual Compensation | 3,550,000 | 3,225,000 | ||
Special New Hire Award | 2,500,000 | (6) | -- | |
Total Target Compensation | 6,050,000 | 3,225,000 | ||
(1) | Mr. Gupta became our Chief Executive Officer in October 2016. We entered into an employment agreement with Mr. Gupta setting forth the terms of his compensation described above. |
(2) | Represents cash payable upon achievement of target performance under our Corporate Bonus Plan. Based on company performance, Mr. Gupta earned 15% of his bonus for fiscal 2016 prorated to reflect his employment commencement date. |
(3) | 70% of Mr. Gupta’s fiscal 2016 annual equity award was to be in the form of PSUs based on one-year performance objectives and 30% in the form of time-based RSUs. Mr. Gupta was issued RSUs with a grant date value of $375,000 in October 2016, which vest in equal installments every six months over three years beginning on April 1, 2017, subject to continued employment. The PSUs were to be issued in early 2017 and based on FY17 financial objectives. In February 2017, the Compensation Committee eliminated the practice of awarding PSUs based on one-year performance objectives and in lieu of his new hire PSUs, Mr. Gupta was awarded $875,000 of stock options in February 2017. These stock options are shown in the 2017 Target Pay column under “Target Annual Stock Options”. |
(4) | Mr. Gupta was to receive PSUs as part of his new hire award but, in February 2017, the Compensation Committee eliminated the practice of awarding PSUs based on one-year performance objectives, and in lieu of his new hire PSUs, Mr. Gupta was awarded $875,000 of stock options in February 2017. These options vest in equal installments every six months over four years beginning on October 1, 2017, subject to continued employment. |
(5) | Represents PSUs issued to our executive officers under our Long-Term Incentive Plan with a grant date value of two times base salary and subject to three-year relative total stockholder return performance measures. |
(6) | Represents a one-time award of RSUs subject to three-year vesting as follows: 25% on October 10, 2017, 25% on October 10, 2018, and 50% on October 10, 2019, subject, in each case, to continued employment. The vesting of all or part of this award may be accelerated in the event of a change in control or involuntary termination. |
(7) | We evaluated Mr. Gupta’s fiscal 2016 total target compensation against our compensation peer group, as to individual elements and as to total compensation to determine whether any changes should be made. We determined that Mr. Gupta’s target cash compensation was in line with the market data. |
(8) | Represents cash payable upon achievement of target performance under our Corporate Bonus Plan. Based on company performance, Mr. Gupta earned 115% of his bonus for fiscal 2017. |
(9) | Mr. Gupta did not receive an award of time-based RSUs in fiscal 2017 because he received time-based RSUs in October 2016 as part of his new hire award. |
(10) | Represents PSUs issued to our executive officers under our Long-Term Incentive Plan that are subject to three-year relative total stockholder return performance measures. |
23
Paul Jalbert, Chief Financial Officer (1)
2017 Target Pay ($)(2) | ||
Target Annual Cash Compensation | 600,000 | |
Base Salary | 375,000 | |
Target Bonus | 225,000 | (3) |
Target Annual Equity Compensation | 1,000,000 | (4) |
Target Annual RSUs | 300,000 | (5) |
Target Annual Stock Options | 200,000 | (6) |
Target LTIP PSUs | 500,000 | (7) |
Total Target Annual Compensation | 1,600,000 | |
Special Promotion Award | 1,000,000 | (8) |
Total Target Compensation | 2,600,000 | |
(1) | Mr. Jalbert was not an executive officer in fiscal 2016. In fiscal 2016, Mr. Jalbert was our Vice President, Chief Accounting Officer. In March 2017, Mr. Jalbert was promoted to Chief Financial Officer and became an executive officer. |
(2) | In connection with Mr. Jalbert’s promotion, we evaluated his fiscal 2017 total target compensation against our compensation peer group, as to individual elements and as to total compensation to determine whether any changes should be made. We also took into consideration the compensation terms we entered into with Kurt Abkemeier, who was our Chief Financial Officer until March 2017, and who had joined our company in September 2016. Mr. Jalbert’s base salary prior to his promotion was $270,504 and his target bonus was $108,202. |
(3) | Represents cash payable upon achievement of target performance under our Corporate Bonus Plan. Based on the performance under the Corporate Bonus Plan, Mr. Jalbert earned 115% of his fiscal 2017 target bonus. |
(4) | As part of his promotion to Chief Financial Officer, Mr. Jalbert received an annual equity award of $1,000,000 consisting of 50% PSUs under our Long-Term Incentive Plan, 30% time-based RSUs and 20% stock options. |
(5) | RSUs vest in equal installments every six months over three years beginning on October 1, 2017. |
(6) | Stock options vest in equal installments every six months over four years beginning on October 1, 2017. |
(7) | PSUs issued to our executive officers under our Long-Term Incentive Plan are subject to three-year relative total stockholder return performance measures. |
(8) | Represents a one-time award of RSUs subject to three-year cliff vesting, subject to continued employment. The vesting of all or part of this award may be accelerated in the event of a change in control or involuntary termination |
John Ainsworth, Senior Vice President, Core Products (1)
2017 Target Pay ($) | ||
Target Annual Cash Compensation | 502,500 | |
Base Salary | 335,000 | |
Target Bonus | 167,500 | (2) |
Target Annual Equity Compensation | 700,000 | (3) |
Target Annual RSUs | 210,000 | (4) |
Target Annual Stock Options | 140,000 | (5) |
Target LTIP PSUs | 350,000 | (6) |
Total Target Annual Compensation | 1,202,500 | |
Cash Signing Bonus | 150,000 | |
Special New Hire Award | 300,000 | (7) |
Total Target Compensation | 1,652,500 | |
(1) | Mr. Ainsworth became our Senior Vice President, Core Products in January 2017. We entered into an offer letter with Mr. Ainsworth setting forth the terms of his compensation described above. |
(2) | Represents cash payable upon achievement of target performance under our Corporate Bonus Plan. Based on the performance under the Corporate Bonus Plan, Mr. Ainsworth earned 115% of his fiscal 2017 target bonus prorated to reflect his employment commencement date. |
(3) | Mr. Ainsworth received an annual equity award of $700,000 consisting of 50% PSUs under our Long-Term Incentive Plan, 30% time-based RSUs and 20% stock options. |
24
(4) | RSUs vest in equal installments every six months over three years beginning on October 1, 2017. |
(5) | Stock options vest in equal installments every six months over four years beginning on October 1, 2017. |
(6) | PSUs issued to our executive officers under our Long-Term Incentive Plan are subject to three-year relative total stockholder return performance measures. |
(7) | Represents a one-time award of RSUs which vest in equal installments every six months over three years beginning on October 1, 2017. |
Loren Jarrett, Chief Marketing Officer (1)
2017 Target Pay ($) | ||
Target Annual Cash Compensation | 502,500 | |
Base Salary | 335,000 | |
Target Bonus | 167,500 | (2) |
Target Annual Equity Compensation | 700,000 | (3) |
Target Annual RSUs | 210,000 | (4) |
Target Annual Stock Options | 140,000 | (5) |
Target LTIP PSUs | 350,000 | (6) |
Total Target Annual Compensation | 1,202,500 | |
Cash Signing Bonus | 125,000 | |
Special New Hire Award | 300,000 | (7) |
Total Target Compensation | 1,627,500 | |
(1) | Ms. Jarrett became our Chief Marketing Officer in January 2017. We entered into an offer letter with Ms. Jarrett setting forth the terms of her compensation described above. |
(2) | Represents cash payable upon achievement of target performance under our Corporate Bonus Plan. Based on the performance under the Corporate Bonus Plan, Ms. Jarrett earned 115% of her fiscal 2017 target bonus prorated to reflect her employment commencement date. |
(3) | Ms. Jarrett received an annual equity award of $700,000 consisting of 50% PSUs under our Long-Term Incentive Plan, 30% time-based RSUs and 20% stock options. |
(4) | RSUs vest in equal installments every six months over three years beginning on October 1, 2017. |
(5) | Stock options vest in equal installments every six months over four years beginning on October 1, 2017. |
(6) | PSUs issued to our executive officers under our Long-Term Incentive Plan are subject to three-year relative total stockholder return performance measures. |
(7) | Represents a one-time award of RSUs which vest in equal installments every six months over three years beginning on October 1, 2017. |
Dmitri Tcherevik, Chief Technology Officer (1)
2017 Target Pay ($) | ||
Target Cash Compensation | 502,500 | |
Base Salary | 335,000 | |
Target Bonus | 167,500 | (2) |
Target Equity Compensation | 1,000,000 | (3) |
Target RSUs | 300,000 | (4) |
Target Stock Options | 200,000 | (5) |
Target LTIP PSUs | 500,000 | (6) |
Total Target Compensation | 1,502,500 | |
(1) | Mr. Tcherevik became our Chief Technology Officer in April 2017. We entered into an offer letter with Mr. Tcherevik setting forth the terms of his compensation described above. |
(2) | Represents cash payable upon achievement of target performance under our Corporate Bonus Plan. Based on the performance under the Corporate Bonus Plan, Mr. Tcherevik earned 115% of his fiscal 2017 target bonus prorated to reflect his employment commencement date. |
(3) | Mr. Tcherevik received a new hire equity award of $1,000,000 consisting of 50% PSUs under our Long-Term Incentive Plan, 30% time-based RSUs and 20% stock options. |
25
(4) | RSUs vest in equal installments every six months over three years beginning on April 1, 2018. |
(5) | Stock options vest in equal installments every six months over four years beginning on April 1, 2018. |
(6) | PSUs issued to our executive officers under our Long-Term Incentive Plan are subject to three-year relative total stockholder return performance measures. |
Kurt Abkemeier, Former Chief Financial Officer (1)
2016 Target Pay ($) | 2017 Target Pay ($) | |||
Target Annual Cash Compensation | 675,000 | 675,000 | (7) | |
Base Salary | 375,000 | 375,000 | ||
Target Bonus | 300,000 | (2) | 300,000 | (8) |
Target Annual Equity Compensation | 1,350,000 | 860,000 | ||
Target Annual RSUs | 240,000 | (3) | -- | (9) |
Target Annual Stock Options | -- | 360,000 | (4) | |
Target One-Year Performance PSUs | 360,000 | (4) | ||
Target LTIP PSUs | 750,000 | (5) | 500,000 | (10) |
Total Target Annual Compensation | 2,025,000 | 1,535,000 | ||
Cash Signing Bonus | 50,000 | -- | ||
Special New Hire Award | 1,650,000 | (6) | -- | |
Total Target CompensationTotTarget Compensation | 3,725,000 | 1,535,000 | ||
(1) | Mr. Abkemeier became our Chief Financial Officer in September 2016. We entered into an employment agreement with Mr. Abkemeier setting forth the terms of his compensation described above. In March 2017, Mr. Abkemeier’s employment with our company terminated. Upon his termination, we paid Mr. Abkemeier the severance benefits described in the section of this Amendment No. 1 to Annual Report on Form 10-K/A entitled, “Severance and Change in Control Benefits.” |
(2) | Represents cash payable upon achievement of target performance under our Corporate Bonus Plan. Based on company performance, Mr. Abkemeier earned 15% of his bonus for fiscal 2016 prorated to reflect his employment commencement date. |
(3) | 60% of Mr. Abkemeier’s fiscal 2016 annual equity award was to be in the form PSUs based on one-year performance objectives and 40% in the form of time-based RSUs. Mr. Abkemeier was issued RSUs with a grant date value of $240,000 in September 2016, which vest in equal installments every six months over three years beginning on April 1, 2017. Upon termination of Mr. Abkemeier’s employment, the vesting of two installments of these RSUs was accelerated. The PSUs were to be issued in early 2017 and based on FY17 financial objectives. In February 2017, the Compensation Committee eliminated the practice of awarding PSUs based on one-year performance objectives and, in lieu of his new hire PSUs, Mr. Abkemeier was awarded $360,000 of stock options in February 2017. These stock options are shown in the 2017 Target Pay column under “Target Annual Stock Options”. |
(4) Mr. Abkemeier was to receive PSUs as part of his new hire award but, in February 2017, the Compensation Committee eliminated the practice of awarding PSUs based on one-year performance objectives, and in lieu of his new hire PSUs, Mr. Abkemeier was awarded $360,000 of stock options in February 2017. These options vest in equal installments every six months over four years beginning on October 1, 2017, subject to continued employment. Upon termination of Mr. Abkemeier’s employment, the vesting of two installments of these options was accelerated.
(5) | Represents PSUs issued to our executive officers under our Long-Term Incentive Plan with a grant date value of two times base salary and subject to three-year relative total stockholder return performance measures. Upon Mr. Abkemeier’s termination of employment in March 2017, these PSUs were canceled. |
(6) | Represents a one-time award of RSUs subject to three-year cliff vesting, subject to continued employment. The vesting of all or part of this award may be accelerated in the event of a change in control or involuntary termination. Upon termination of Mr. Abkemeier’s employment, the vesting of one-third of this one-time award of RSUs was accelerated. |
(7) | We evaluated Mr. Abkemeier’s fiscal 2016 total target compensation against our compensation peer group, as to individual elements and as to total compensation to determine whether any changes should be made. We determined that Mr. Abkemeier’s target cash compensation was in line with the market data. |
(8) | Represents cash payable upon achievement of target performance under our Corporate Bonus Plan. Mr. Abkemeier did not receive any portion of his FY17 target bonus as a result of his termination of employment in March 2017. |
(9) | Mr. Abkemeier did not receive an award of time-based RSUs in fiscal 2017 because he received time-based RSUs in September 2016 as part of his new hire award. |
(10) | Represents PSUs issued to our executive officers under our Long-Term Incentive Plan that are subject to three-year relative total stockholder return performance measures. Upon Mr. Abkemeier’s termination of employment in March 2017, these PSUs were canceled. |
26
Cash Incentive Compensation
Annual Cash Bonus
It is our philosophy to base a significant portion of each executive officer’s total compensation opportunity on performance incentives. Our annual bonus plan is intended to motivate eligible participants toward overall business results, to tie their goals and interests to those of the company and its stockholders, and to enable the company to attract and retain highly qualified executives. Our bonus plan is administered by our Compensation Committee.
The Compensation Committee set the target annual cash incentive opportunity for 2017 (expressed as a percentage of base salary earned during the year) for each named executive officer in January 2017, in the case of Mr. Gupta and Mr. Abkemeier, and at the time of promotion or hire, in the case of the other named executive officers. In setting the target levels, the Compensation Committee considered each named executive officer’s 2017 target total cash opportunity against the peer group data provided by our independent compensation consultant, internal pay equity and the roles and responsibilities of the named executive officers. The Compensation Committee set Mr. Gupta’s and Mr. Abkemeier’s 2017 cash bonus target at the same percentage as his respective target opportunity in 2016. Mr. Jalbert’s cash bonus target was increased to 60% as part of his promotion to Chief Financial Officer in March 2017. The cash bonus targets for Ms. Jarrett, Mr. Ainsworth and Mr. Tcherevik were set at 50% consistent with the target levels of other senior executives. The Compensation Committee believes that the target annual cash bonus opportunity should make up a larger portion of an executive officer’s total target cash compensation as the executive’s level of responsibility increases.
2017 Plan Design
In January 2017, the Compensation Committee approved the 2017 Corporate Bonus Plan. Our named executive officers participated in the Corporate Bonus Plan.
For 2017, the Compensation Committee adopted three plan metrics for the Corporate Bonus Plan, all of which would be utilized to determine funding and payout under the cash bonus plans. These three plan metrics were non-GAAP corporate revenue, non-GAAP operating income and adjusted free cash flow. These three plan metrics were the same metrics utilized by the Compensation Committee in fiscal 2016.
Non-GAAP corporate revenue was weighted at 40%, non-GAAP operating income was weighted at 40%, and the adjusted free cash flow metric was weighted at 20%. Each metric was measured separately and not impacted by performance with respect to the other metrics. The performance measures selected for our cash bonus plan were designed to support our goals of expanding our non-GAAP operating income, which would result in increased stockholder value, while at the same time preserving our strong cash flow. Our revenue targets reflected our more modest view of the growth prospects of our core products. For further detail about our use of non-GAAP measures, refer to the paragraph entitled, “GAAP Results vs. non-GAAP Measures” above.
For 2017, the Compensation Committee determined that, for purposes of earning any award under the Corporate Bonus Plan, it was necessary to achieve threshold total non-GAAP revenue and adjusted free cash flow of at least 95% of the corresponding target in our 2017 operating plan and budget. With respect to the total non-GAAP total operating income metric, the Compensation Committee set the threshold at 90% of the corresponding target in our 2017 operating plan and budget. Although the Compensation Committee retained the funding percentage for threshold-level achievement at 25% for bonus plan participants below the senior executive level, for Mr. Gupta and the other named executive officers, the Compensation Committee adopted a funding percentage for threshold-level achievement at 50% with respect to the revenue and free cash flow metrics. The rationale for this difference was that the Compensation Committee determined that no funding should occur with respect to a metric for which the performance was below our publicly-announced expectations for fiscal 2017 performance.
The targets established with respect to the total revenue goal reflected the challenge we faced in growing our core revenues while implementing a new strategy. The targets established with respect to the non-GAAP operating income metric were consistent with our new operational model for our core business. The targets established with respect to the adjusted free cash flow goal reflected the importance of maintaining a strong cash balance to enable us to execute a capital allocation strategy in the best interests of stockholders.
Corporate Bonus Plan Criteria and Achievement
The table below shows the funding percentages based on our performance under the three metrics. For the named executive officers, none of the annual bonus under the Corporate Bonus Plan would be earned unless we achieved at least $388 million in total non-GAAP revenue, $130 million in total non-GAAP operating income or $95 million in adjusted free
27
cash flow, in which case a portion of the bonus would be earned based on the level of achievement and weighting of the metrics.
2017 Annual Bonus Plan Criteria and Achievement
Metric ($ millions)(1) | Weighting | Threshold (25%) | 50% Funding | Target (100%) | Maximum (150%) | Actual Achievement | Funding Percentage |
Non-GAAP Corp. Revenue | 40% | $382 | $388 | $396 | $414 | $392 | 74% |
Non-GAAP Operating Income | 40% | $130 | $136 | $141 | $159 | $154 | 137% |
Adjusted Free Cash Flow | 20% | $93 | $95 | $98 | $104 | $122 | 150% |
Total | 100% | 115% | |||||
_____________
(1) | Targets and actual achievement figures shown in the table above are based on budgeted exchange rates. For purposes of computing non-GAAP Operating Income, bonus expense is added back to the Threshold, Target, Maximum, and Actual achievement amounts. |
Amounts Earned under the 2017 Corporate Bonus Plan
As a result of our financial performance during fiscal 2017, we exceeded the target level of performance under our bonus plan, which resulted in a payout percentage of 115% with respect to the annual cash bonus. For Mr. Gupta and the other executive officers, the actual bonuses earned were based 100% on the financial metrics described above and no portion of the annual bonuses are based on subjective measures.
The following table shows the bonuses earned by our named executive officers under the Corporate Bonus Plan in 2017.
NEO | Target Annual Bonus ($) | Amount Earned ($) |
Yogesh Gupta | 575,000 | 661,250 |
Paul Jalbert | 225,000 | 258,750 |
John Ainsworth (1) | 167,500 | 168,349 |
Loren Jarrett (2) | 167,500 | 168,349 |
Dmitri Tcherevik (3) | 167,500 | 127,713 |
Kurt Abkemeier (4) | 300,000 | — |
(1) | Mr. Ainsworth became our SVP, Core Products in January 2017 and received a pro-rated payout of his 2017 actual bonus. |
(2) | Ms. Jarrett became our Chief Marketing Officer in January 2017 and received a pro-rated payout of her 2017 actual bonus. |
(3) | Mr. Tcherevik became our Chief Technology Officer in April 2017 and received a pro-rated payout of his 2017 actual bonus. |
(4) | Because Mr. Abkemeier’s employment as our Chief Financial Officer terminated in March 2017, he earned no portion of his 2017 target bonus. |
Other Cash Incentives
As part of his new hire compensation package, Mr. Ainsworth received a signing bonus of $150,000.
As part of her new hire compensation package, Ms. Jarrett received a signing bonus of $125,000.
Equity Compensation
We use equity compensation to attract, retain, motivate and reward our named executive officers. We issue annual and new hire equity awards based on guidelines for awards commensurate with position levels and that reflect grant practices within our peer group and the broader software industry generally. The Compensation Committee reviews the mix of equity awards to our named executive officers on an annual basis.
PSUs are subject to performance criteria aligned with our business plan and are earned only to the extent the performance criteria are achieved, with any PSUs earned being subject to subsequent time-based vesting (one-third vests upon determination of achievement of the performance goals established for that year and one-third in each of the next two years if the executive remains employed on the vesting date).
28
RSUs typically vest in six equal installments over three years beginning six months after issuance. In a volatile stock market, RSUs continue to provide value when other forms of equity such as stock options may not, which the Compensation Committee believes is useful in retaining talented executives in unpredictable economic times.
Stock option awards provide individuals with the right to purchase shares of our common stock at a fixed exercise price, typically for a period of seven years, subject to continued employment with our company. Stock options vest in six-month increments over a four-year period. We believe that meaningful vesting periods encourage recipients to remain with our company over the long-term and, because the value of the awards is based on our stock price, stock options encourage recipients to focus on achievement of longer-term goals, such as strategic growth, business innovation and shareholder return. In general, employees whose employment terminates (other than for death or disability) before the award fully vests forfeit the unvested portions of these awards.
Beginning in 2014, the Compensation Committee made fundamental changes to the equity program applicable to our named executive officers. In January 2014, the Compensation Committee approved a new long-term equity incentive compensation plan consisting of the grant of PSUs, which would be earned entirely based on performance over a three-year measurement period. The Compensation Committee approved awards of PSUs under the LTIP in fiscal 2015, 2016 and 2017.
Prior to fiscal 2017, the number of PSUs awarded was equal to two times each recipient’s base salary. For fiscal 2017, the Compensation Committee determined that 50% of the total annual equity award to executive officers should be in the form of PSUs under the LTIP. The number of shares earned is determined by comparing our relative TSR for the relevant period to the relative TSR of the component companies of the NASDAQ Software Index.
Under the LTIP, participants can earn between 0% and 200% (the payout cap under the LTIP) of the target number of PSUs. The cumulative three-year TSR measure compares the TSR of our common stock against the TSR of companies included in the NASDAQ Software Index during the three-year period. Regardless of our relative position with respect to the NASDAQ Software Index, the award will be reduced by 50% if our absolute TSR over the measurement period is negative.
The three-year performance period with respect to the LTIP awarded in 2014 expired on November 30, 2016. Based on the price of our common stock for the thirty-day trading period ending November 30, 2016, our TSR compared to the NASDAQ Software Index for the same period placed us below the 50th percentile, meaning that none of the 2014 PSUs awarded as the LTIP were earned. As a result, all of the 2014 PSUs awarded as the LTIP were canceled. The three-year performance period with respect to the LTIP awarded in 2015 expired on November 30, 2017. Based on the price of our common stock for the thirty-day trading period ending November 30, 2017, our TSR compared to the NASDAQ Software Index for the same period placed us below the 50th percentile, meaning that none of the 2015 PSUs awarded as the LTIP were earned. As a result, all of the 2015 PSUs awarded as the LTIP were canceled.
Target Value and Award Determination
The Compensation Committee’s decisions regarding the amount and type of equity incentive compensation, the allocation of equity and relative weighting of these awards within total executive compensation have been based on advice provided by our external compensation consultant and the Compensation Committee’s understanding and individual experiences with market practices of similarly-situated companies. Equity-based incentive awards are intended to be the longer-term components of our overall executive compensation program and are designed to encourage performance by our executive officers over several years.
To determine the size of the equity awards, the Compensation Committee first determined the total number of shares that would be available for the annual equity awards to all proposed recipients. The total number of shares was determined by consideration of the potential dilution to our stockholders and average burn rate of other companies in our industry. The Compensation Committee utilized the grant data from the peer group and other information provided by Pay Governance to assist it in determining the size of the overall equity pool for our company as well as the individual grants to the named executive officers.
To determine the size of the individual annual equity awards, the Compensation Committee, utilizing data provided by Pay Governance, compared the long-term equity incentive compensation levels of our executives with similar positions within our peer group and survey data to determine the long-term equity incentive compensation amount for each executive. The Compensation Committee reviews market data at the 25th, 50th, and 75th percentile. In finalizing the amounts of the annual equity awards, the Compensation Committee considers this market data, the CEO’s recommendations, the burn rate of the executive grants, and the degree to which those amounts would be aligned with our goals of motivating and retaining key employees.
29
2017 Annual Equity Program
Program | Fiscal 2016 Equity Program | Fiscal 2017 Equity Program | ||||
Form of Equity | Time-Based Restricted Stock Units Performance-Based Stock Units | Time-Based Restricted Stock Units Stock Options Performance-Based Stock Units | ||||
Performance Periods | Annual PSUs have 1-year period LTIP PSUs have three-year period | LTIP PSUs have three-year period | ||||
Metrics | Annual PSUs tied to earnings per share LTIP PSUs tied to relative total shareholder return | LTIP PSUs tied to relative total shareholder return | ||||
Vesting | Time-Based RSUs vest 33% per year over 3 years Annual PSUs earned based on one-year performance metric, with vesting over subsequent two years LTIP PSUs may be earned at 0% to 200% of target, with threshold vesting at 50% achievement | Time-Based RSUs vest 33% per year over 3 years Stock options vest 25% per year over 4 years LTIP PSUs may be earned at 0% to 200% of target, with threshold vesting at 35% achievement | ||||
Frequency of Grant | Annual | Annual | ||||
For fiscal 2017, the Compensation Committee altered the type and mix of equity awards to our named executive officers. In fiscal 2016, the Compensation Committee utilized an equity mix comprised of PSUs tied to a one-year financial objective, time-based RSUs and LTIP PSUs tied to three-year relative total shareholder return. The Compensation Committee placed a much higher emphasis on PSUs than our peer companies. In addition, the LTIP was designed as an outperformance plan and had a payout schedule that was more challenging than those similar plans utilized by our peers and the market generally. As a result of this mix and LTIP design, the Compensation Committee had issued equity awards to the named executive officers that approximated the 75th percentile of our historical peer group.
As fiscal 2016 ended, the Compensation Committee determined that changes to the design of the equity awards to our named executive officers were necessary because of the significant shift in our strategy and operations being implemented for fiscal 2017. For fiscal 2017, the Compensation Committee eliminated PSUs in which the performance metric was tied to a one-year financial objective. In fiscal 2016, the Compensation Committee had utilized earnings per share as the one-year performance metric but for fiscal 2017, the Compensation Committee determined that utilizing earnings per share as the metric would place too much focus on the short-term to the detriment of long-term strategy. Ultimately, the Compensation Committee concluded that setting one-year financial goals for equity awards that would be meaningful to stockholders and different than the metrics utilized under the Corporate Bonus Plan would be challenging.
Therefore, for fiscal 2017, the Compensation Committee eliminated PSUs in which the performance metric was tied to a one-year financial objective and replaced annual PSUs with stock options. Stock option grants are intended to correlate executive compensation to our long-term success as measured by our stock price. Stock options are tied to our future success because options granted have an exercise price equal to the closing market value at the date of grant and will only provide value to the extent that the price of our stock increases above the exercise price. As a result, the Compensation Committee viewed stock options as a form of performance equity, but with a longer-term focus than PSUs tied to an annual performance metric.
The Compensation Committee retained the use of time-based RSUs as part of the equity mix for fiscal 2017. In a volatile stock market, RSUs continue to provide value when other equity vehicles may not, which the Compensation Committee believes is useful in retaining talented executives in unpredictable economic times.
30
In addition, the Compensation Committee modified the terms of the LTIP to revise the relative TSR payout scale to reflect emerging trends and shareholder-friendly practices (e.g., above-median performance required to achieve target payout).
Under the revised LTIP design, participants can still earn between 0% and 200% (the payout cap under the LTIP) of the target amount of PSUs. The cumulative three-year TSR measure compares the TSR of our common stock against the TSR of companies included in the NASDAQ Software Index during the three-year period. Our relative TSR performance must be at the 55th percentile of the index group in order for the target award to be earned. For the February 2017 award under the LTIP, the three-year comparison period commenced on December 1, 2016 and will end on November 30, 2019.
Relative Performance (TSR Percentile Rank) | % of Target PSU Earned |
Less than 35th Percentile | 0% |
35th Percentile | 50% |
50th Percentile | 90% |
55th Percentile | 100% |
65th Percentile | 125% |
75th Percentile | 150% |
90th Percentile | 200% (Maximum) |
Awards interpolated for performance within stated percentiles | |
Additionally, regardless of our relative position with respect to the NASDAQ Software Index, the award will be reduced by 50% if our absolute TSR over the measurement period is negative.
The Compensation Committee then determined the mix of the fiscal 2017 equity compensation program to the named executive officers. Consistent with the Compensation Committee’s philosophy that a significant portion of the equity mix to named executive officers should be tied to our long-term performance, the Compensation Committee determined that the equity mix should be 50% LTIP PSUs, 30% RSUs and 20% stock options.
Other Executive Compensation Matters |
Timing of Equity Grants
We do not time grants either to take advantage of a depressed stock price or in anticipation of an increase in stock price and have limited the amount of discretion that can be exercised in connection with the timing of awards. We generally make awards only on pre-determined dates to ensure that awards cannot be timed to take advantage of material non-public information.
Equity awards may be made only by the Compensation Committee. The Compensation Committee makes awards only at Committee meetings and awards are generally not effective in trading blackout periods (the period encompassing ten days prior to the end of each fiscal quarter through 48 hours after the earnings for that quarter are announced).
Stock Ownership Guidelines
In January 2018, our Board of Directors adopted revised stock ownership guidelines for our senior executive officers, including our named executive officers. These guidelines provide for the Chief Executive Officer to hold an amount of our common stock, restricted shares, stock options and/or earned performance shares having a value equal to at least three times his or her base salary. For other senior executive officers, the stock ownership requirement is at least one times his or her base salary. Executive officers have five years to attain the applicable ownership threshold.
31
Compensation Recovery Policy
We have adopted a clawback policy providing that in the event of a material restatement of financial statements triggered by executive-level misconduct, we may require that the bonuses and other incentive compensation paid to that executive be forfeited. The amount of incentive compensation subject to recovery would be the amount in excess of what the executive officer would have earned in accordance with the restatement, as determined by the Compensation Committee.
Hedging and Pledging Policy
Our policies explicitly prohibit our directors and executive officers from “hedging” their ownership by engaging in short sales or trading in any derivatives involving our securities. Our policies also prohibit our directors and executive officers from “pledging” their ownership by holding our stock in a margin account or pledging our stock as collateral for a loan.
Tax and Accounting Considerations and Compensation Recovery Policies
Deductibility of Executive Compensation. Through fiscal 2017, Section 162(m) of the Internal Revenue Code placed a limit of $1 million on the amount of compensation that public companies may deduct in any one year with respect to certain of their named executive officers. Through fiscal 2017, certain performance-based compensation approved by stockholders was not subject to this deduction limit. The Compensation Committee’s strategy in this regard has been to be cost and tax effective by preserving corporate tax deductions, while maintaining the flexibility to approve arrangements that it deemed to be in our best interests and the best interests of our stockholders where we paid compensation to our executive officers that was not deductible. We believe that the cost associated with these arrangements was justified by the incentive and retention value provided by the award.
Section 409A of the Internal Revenue Code. Section 409A of the Internal Revenue Code imposes additional significant taxes in the event that an executive officer, director or service provider receives “deferred compensation” that does not satisfy the requirements of Section 409A. Our severance and change in control agreements described below, including the Employee Retention and Motivation Agreements we entered into with our named executive officers, contain provisions that are intended to either avoid the application of Section 409A or, to the extent doing so is not possible, comply with the applicable Section 409A requirements. The Compensation Committee has the sole discretion to change the severance guidelines applicable to executive officers to the extent necessary to avoid the application of Section 409A or comply with applicable Section 409A requirements.
Accounting for Stock-Based Compensation. Stock-based compensation expense reflects the fair value of stock-based awards measured at the grant date and recognized over the relevant service period. We estimate the fair value of each stock-based award on the measurement date using either the current market price of the stock, the Black-Scholes option valuation model, or the Monte Carlo Simulation valuation model.
Compensation Committee Report |
This report is submitted by the Compensation Committee of our Board of Directors. The Compensation Committee has reviewed the "Compensation Discussion and Analysis" included in this Amendment No. 1 to Annual Report on Form 10-K/A and discussed it with management. Based on such review and discussions, the Compensation Committee has recommended to our Board of Directors that the "Compensation Discussion and Analysis" be included in this Amendment No. 1 to Annual Report on Form 10-K/A and in our proxy statement for the 2018 Annual Meeting of Stockholders.
No portion of this Compensation Committee Report shall be deemed to be incorporated by reference into any filing under the Securities Act of 1933 or the Securities Exchange Act of 1934, through any general statement incorporating by reference in its entirety the annual report or the proxy statement in which this report appears, except to the extent that the company specifically incorporates this report or a portion of it by reference. In addition, this report shall not be deemed filed under either the Securities Act or the Exchange Act.
Respectfully submitted by the Compensation Committee,
David A. Krall, Chairman
Rainer Gawlick
Charles F. Kane
32
Compensation Committee Interlocks and Insider Participation |
The members of our Compensation Committee during 2017 were Messrs. Egan (until June 2017), Gawlick (from and after June 2017), Kane, and Krall. Messrs. Egan, Gawlick, Kane, and Krall are not, nor have they ever been, an officer or employee of our company or of any of its subsidiaries, or had any relationship with us requiring disclosure in this Amendment No. 1 to Annual Report on Form 10-K/A. There are no compensation committee interlocks amongst any of our directors.
Analysis of Risk Associated with Our Compensation Plans |
In setting compensation, the Compensation Committee considers the risks to our stockholders and to the achievement of our goals that may be inherent in the compensation plans and programs for all employees, including our executives. When evaluating our executive compensation program, the Compensation Committee considers whether the program is based on the appropriate philosophy, benchmarked against the appropriate peer group and balanced between long and short-term performance targets, company and individual performance. Although a significant portion of our executives’ compensation is performance-based and “at-risk,” we believe our compensation plans and programs are appropriately structured so as not to encourage our employees to take excessive or unreasonable risks.
We considered the following elements of our compensation plans and policies when evaluating whether such plans and policies are structured to encourage our employees to take unreasonable risks:
• | A detailed planning process with executive or Compensation Committee oversight exists for all compensation programs. |
• | The proportion of an employee’s performance-based pay increases as the responsibility and potential impact of the employee’s position increases, which structure is in line with market practices. |
• | Compensation consists of both fixed and variable components. The fixed portion (i.e., base salary) and variable portion (i.e., performance-based bonus and equity awards) provide a mix of compensation intended to produce corporate performance without encouraging excessive risks. |
• | We set performance goals that we believe are aggressive and consistent with building long-term shareholder value. |
• | We use consistent corporate performance metrics from year-to-year rather than changing the metric to take advantage of changing market conditions. |
• | Our short-term incentive plans are capped as to the maximum potential payout, which we believe mitigates excessive risk taking by limiting bonus payments even if we dramatically exceed the performance targets. |
• | The time-based vesting for RSUs and stock options ensures that our executives’ interests align with those of our stockholders for the long-term performance of our company. |
• | Assuming achievement of at least a minimum level of performance, payouts under our performance-based plans result in some compensation at levels below full target achievement, rather than an “all-or-nothing” approach. |
• | In accordance with our written stock option grant policy, all equity grants must occur at a meeting of the Compensation Committee and management has no authority to issue equity. |
• | The Compensation Committee retains and does not delegate any of its power to determine matters of executive compensation. |
• | We maintain a system of controls and procedures designed to ensure that amounts are earned and paid in accordance with our plans and programs. |
• | We do not allow our executives and directors to hedge their exposure to ownership of, or interest in, our stock. We also do not allow them to engage in speculative transactions with respect to our stock. |
33
Summary of Executive Compensation |
The following table sets forth certain information with respect to compensation for the fiscal years ended November 30, 2017 and 2016, earned by:
(a) | Mr. Gupta; |
(b) | The two individuals who served as our Chief Financial Officer during fiscal 2017: Mr. Jalbert, who served as Chief Financial Officer from March 24, 2017 until the end of fiscal 2017, and Mr. Abkemeier, who served as Chief Financial Officer from the beginning of fiscal 2017 through March 24, 2017. |
(c) | Mr. Ainsworth, Ms. Jarrett and Mr. Tcherevik, who were our three other most highly compensated executive officers. |
SUMMARY COMPENSATION TABLE - FISCAL YEARS 2017 and 2016
Name and Principal Position | Year | Salary ($) | Bonus ($) | Stock Awards ($)(1) | Option Awards ($)(2) | Non-Equity Incentive Plan Compensation ($)(3) | All Other Compensation ($)(4) | Total ($) |
Yogesh Gupta, Chief Executive Officer (5) | 2017 2016 | 575,000 66,346 | -- -- | 1,242,240 3,553,558 | 875,885 -- | 661,250 12,254 | 27,668 783 | 3,382,043 3,632,942 |
Paul Jalbert, Chief Financial Officer (6) | 2017 | 339,636 | -- | 1,762,944 | 200,159 | 258,750 | 16,062 | 2,577,551 |
John Ainsworth, SVP, Core Products (7) | 2017 | 283,462 | 150,000 | 856,084 | 139,979 | 168,349 | 30,673 | 1,628,547 |
Loren Jarrett, Chief Marketing Officer (8) | 2017 | 283,462 | 125,000 | 856,084 | 139,979 | 168,349 | 30,988 | 1,603,862 |
Dmitri Tcherevik, Chief Technology Officer (9) | 2017 | 212,596 | -- | 783,704 | 200,078 | 127,713 | 24,107 | 1,348,198 |
Kurt Abkemeier, Former Chief Financial Officer (10) | 2017 2016 | 129,808 54,808 | -- 50,000 | 518,833 2,268,766 | 359,948 -- | -- 7,869 | 451,115 38,608 | 1,459,704 2,420,050 |
(1) | These amounts do not reflect the actual economic value realized by the named executive officer. In accordance with FASB ASC Topic 718, we estimate the fair value of each stock-based award on the measurement date using either the current market price of the stock or the Monte Carlo Simulation valuation model, assuming the probable outcome of related performance conditions at target levels. See the description of our 2017 Annual Equity Program described in “Compensation Discussion and Analysis” in this Amendment No. 1 to Annual Report on Form 10-K/A. |
(2) | Represents the grant date fair value of options on the date of grant. The grant date fair value of our options is equal to the number of shares subject to the option multiplied by the fair value of our options on the date of grant determined using the Black-Scholes option valuation model. The methodology and assumptions used to calculate the Black-Scholes value of our options are described in Note 11 of the consolidated financial statements contained in our Annual Report on Form 10-K for the fiscal year ended November 30, 2017. |
(3) | The amounts listed reflect the amounts earned under our Corporate Bonus Plan as described in “Compensation Discussion and Analysis” in this Amendment No. 1 to Annual Report on Form 10-K/A. For all individuals, bonus payments were accrued and earned in the year indicated and paid in the succeeding fiscal year. |
(4) | Amounts listed in this column for 2017 include: |
34
Name | Company Contributions (401(k)) ($) | Insurance Premiums ($) | Termination Related ($) | |
Mr. Gupta | 12,480 | 15,188 | -- | |
Mr. Jalbert | 12,480 | 3,582 | -- | |
Mr. Ainsworth | 12,480 | 18,193 | -- | |
Ms. Jarrett | 12.480 | 18,508 | -- | |
Mr. Tcherevik | 9,529 | 14,578 | -- | |
Mr. Abkemeier | 2,721 | 6,252 | 442,142 | |
(5) | Mr. Gupta became Chief Executive Officer on October 10, 2016. The amounts shown for Mr. Gupta in 2016 are base salary and non-equity incentive plan compensation for the period of October 10, 2016 until November 30, 2016. |
(6) | Mr. Jalbert became our Chief Financial Officer on March 24, 2017. Mr. Jalbert was not a named executive officer in fiscal 2016 or fiscal 2015. |
(7) | Mr. Ainsworth became SVP, Core Products on January 16, 2017. The amounts shown for Mr. Ainsworth in 2017 are base salary and non-equity incentive plan compensation for the period of January 16, 2017 until November 30, 2017. Also, the amount listed in the “Bonus” column is a one-time signing bonus paid to Mr. Ainsworth upon joining our company. |
(8) | Ms. Jarrett became Chief Marketing Officer on January 16, 2017. The amounts shown for Ms. Jarrett in 2017 are base salary and non-equity incentive plan compensation for the period of January 16, 2017 until November 30, 2017. Also, the amount listed in the “Bonus” column is a one-time signing bonus paid to Ms. Jarrett upon joining our company. |
(9) | Mr. Tcherevik became Chief Technology Officer on April 1, 2017. The amounts shown for Mr. Tcherevik in 2017 are base salary and non-equity incentive plan compensation for the period of April 1, 2017 until November 30, 2017. |
(10) | Mr. Abkemeier became Chief Financial Officer on September 28, 2016. The amounts shown for Mr. Abkemeier in 2016 are base salary and non-equity incentive plan compensation for the period of September 28, 2016 until November 30, 2016. Also, the amount listed in the “Bonus” column is a one-time signing bonus paid to Mr. Abkemeier upon joining our company. Mr. Abkemeier’s employment terminated on March 24, 2017. The amount shown for Mr. Abkemeier in 2017 is base salary for the period from December 1, 2016 until March 24, 2017. |
35
Grants of Plan-Based Awards |
GRANTS OF PLAN-BASED AWARDS TABLE - 2017
Name | Grant Date | Estimated Possible Payouts Under Non-Equity Incentive Plan Awards | Estimated Possible Payouts Under Equity Incentive Plan Awards | All Other Stock Awards: Number of Shares of Stock or Units (#)(3) | All Other Stock Awards: Number of Securities Underlying Options (#)(4) | Grant Date Fair Value of Stock and Option Awards ($)(5) | ||||||||||||||
Threshold ($)(1) | Target ($)(1) | Maximum ($)(1) | Threshold (#)(2) | Target (#)(2) | Maximum (#)(2) | |||||||||||||||
Yogesh Gupta | — | 143,750 | 575,000 | 862,500 | — | — | — | — | — | — | ||||||||||
2/23/2017 | — | — | — | 20,704 | 41,408 | 82,816 | — | — | 1,200,004 | |||||||||||
2/23/2017 | — | — | — | — | — | — | — | 149,573 | 875,885 | |||||||||||
Paul Jalbert | — | 56,250 | 225,000 | 337,500 | — | — | — | — | — | — | ||||||||||
3/31/2017 | — | — | — | 8,606 | 17,212 | 34,424 | — | — | 500,086 | |||||||||||
3/31/2017 | — | — | — | — | — | — | 44,752 | — | 1,300,046 | |||||||||||
3/31/2017 | — | — | — | — | — | — | — | 35,274 | 200,159 | |||||||||||
John Ainsworth | — | 83,750 | 167,500 | 251,250 | — | — | — | — | — | — | ||||||||||
2/17/2017 | — | — | — | 5,983 | 11,966 | 23,932 | — | — | 350,006 | |||||||||||
2/17/2017 | — | — | — | — | — | — | 17,436 | — | 510,003 | |||||||||||
2/17/2017 | — | — | — | — | — | — | — | 23,490 | 139,979 | |||||||||||
Loren Jarrett | — | 83,750 | 167,500 | 251,250 | — | — | — | — | — | — | ||||||||||
2/17/2017 | — | — | — | 5,983 | 11,966 | 23,932 | — | — | 350,006 | |||||||||||
2/17/2017 | — | — | — | — | — | — | 17,436 | — | 510,003 | |||||||||||
2/17/2017 | — | — | — | — | — | — | — | 23,490 | 139,979 | |||||||||||
Dmitri Tcherevik | — | 83,750 | 167,500 | 251,250 | — | — | — | — | — | — | ||||||||||
6/30/2017 | — | — | — | 8,093 | 16,187 | 32,374 | — | — | 500,016 | |||||||||||
6/30/2017 | — | — | — | — | — | — | 9,712 | — | 300,004 | |||||||||||
6/30/2017 | — | — | — | — | — | — | — | 33,841 | 200,078 | |||||||||||
Kurt Abkemeier | — | 75,000 | 300,000 | 450,000 | — | — | — | — | — | — | ||||||||||
2/17/2017 | — | — | — | 5,817 | 17,095 | 23,326 | — | — | 500,029 | |||||||||||
2/17/2017 | — | — | — | — | — | — | — | 60,403 | 359,948 | |||||||||||
_____________
(1) | These columns indicate the range of payouts (25%, 100% and 150%) targeted for fiscal 2017 performance under our Corporate Bonus Plan as described in "Compensation Discussion and Analysis" in this Amendment No. 1 to Annual Report on Form 10-K/A. The actual payout with respect to fiscal 2017 for each named executive officer is shown in the Summary Compensation Table in the column titled "Non-Equity Incentive Plan Compensation". Mr. Ainsworth, Ms. Jarrett and Mr. Tcherevik were eligible for a pro-rated bonus payout based on their dates of hire. Mr. Abkemeier’s employment terminated prior to the end of fiscal 2017 and, therefore, he was not eligible for a bonus payout. |
(2) | The second row of these columns with respect to each named executive officer represents performance share units awarded under our Long-Term Incentive Plan. These columns show the performance share units that could be earned at threshold, target and maximum levels of performance. If we do not achieve the threshold performance metric, no performance share units will be earned. Because the LTIP is based on a three-year performance period, none of the performance share units will be earnable until the performance period closes following our 2019 fiscal year. See "Compensation Discussion and Analysis" section of this Amendment No. 1 to Annual Report on Form 10-K/A for additional discussion of the LTIP. |
(3) | Except as described in the next sentence, represents RSUs that vest, so long as the executive continues to be employed with us, in six equal installments over three years beginning approximately six months after date of issuance. In the case of Mr. Jalbert, 34,424 of the RSUs shown vest on the third anniversary of the date of grant, subject to his continued employment on that date. |
(4) | Represents stock options that vest, so long as the executive continues to be employed with us, in eight equal installments over four years beginning approximately six months after date of issuance. |
(5) | Represents the grant date fair value of the award, which, in the case of RSUs, is equal to the number of RSUs granted multiplied by the closing price of our stock on the grant date. In the case of LTIP PSUs, the grant date fair value is equal to the number of PSUs granted at target performance multiplied by the closing price of our stock on the date awarded. In the case of stock options, the grant date fair value is equal to the number of shares subject to the option multiplied by the fair value of our options on the date of grant determined using the Black-Scholes option valuation model. The methodology and assumptions used to calculate the Black-Scholes value of our options are described in Note 11 of the consolidated financial statements contained in our Annual Report on Form 10-K for the fiscal year ended November 30, 2017. |
36
The closing price of our stock on (i) February 17, 2017 was $29.25, (ii) February 23, 2017 was $28.98, (iii) March 31, 2017 was $29.05, and (iv) June 30, 2017 was $30.89.
Narrative Summary to Summary Compensation Table and Grants of Plan-Based Awards in 2016 Table |
The material terms of our named executive officers’ annual compensation, including base salaries, cash incentive plan, time-based RSUs, stock options and Long-Term Incentive Plan PSUs and the explanations of the amounts of salary, cash incentives, and equity values in proportion to total compensation are described under "Compensation Discussion and Analysis" in this Amendment No. 1 to Annual Report on Form 10-K/A.
As discussed in greater detail in "Compensation Discussion and Analysis" in this Amendment No. 1 to Annual Report on Form 10-K/A, the 2017 non-equity incentive awards were granted pursuant to the Fiscal 2017 Corporate Bonus Plan, with amounts to be earned based on the achievement of certain financial targets. In fiscal 2017, our financial performance during fiscal 2017 exceeded our expectations with respect to two of the three metrics under the bonus plan, which resulted in a cumulative level of performance under the plan of 115%. Mr. Ainsworth, Ms. Jarrett and Mr. Tcherevik earned a pro-rated bonus payout based on their dates of hire. Mr. Abkemeier’s employment terminated prior to the end of fiscal 2017 and, therefore, he was not eligible for a bonus payout.
As discussed in greater detail in "Compensation Discussion and Analysis" in this Amendment No. 1 to Annual Report on Form 10-K/A, the PSUs awarded under the Long-Term Incentive Plan will be earned based on the results achieved during the three year performance period as determined following our 2019 fiscal year, contingent upon each named executive officer’s continued service.
Except as stated in Note 3, the RSUs granted to our named executive officers in 2017 vest in equal installments every six months over three years, subject to continued employment. There is no purchase price associated with performance share or RSU awards. The stock options granted to our named executive officers in 2017 vest in equal installments every six months over four years, subject to continued employment. The stock options have an exercise price equal to the closing price of our common stock on the date of grant.
37
Outstanding Equity Awards |
The following table sets forth certain information with respect to the outstanding equity awards at November 30, 2017 for each of the named executive officers.
OUTSTANDING EQUITY AWARDS AT FISCAL YEAR-END 2017
Option Awards | Stock Awards | ||||||||||||||||||
Number of Securities Underlying Unexercisable Options | Option Exercise Price ($) | Option Expiration Date | Number of Shares or Units of Stock That Have Not Vested (#)(1) | Market Value of Shares or Units of Stock That Have Not Vested ($)(2) | |||||||||||||||
Name | Exercisable | Unexercisable | |||||||||||||||||
Yogesh Gupta | |||||||||||||||||||
18,697 | 130,876 | 28.98 | 2/22/2024 | ||||||||||||||||
163,529 | 6,760,289 | ||||||||||||||||||
Paul Jalbert | |||||||||||||||||||
4,410 | 30,864 | 29.05 | 3/30/2024 | ||||||||||||||||
61,988 | 2,562,584 | ||||||||||||||||||
John Ainsworth | |||||||||||||||||||
2,937 | 20,553 | 29.25 | 2/16/2024 | ||||||||||||||||
26,497 | 1,095,386 | ||||||||||||||||||
Loren Jarrett | |||||||||||||||||||
2,937 | 20,553 | 29.25 | 2/16/2024 | ||||||||||||||||
26,497 | 1,095,386 | ||||||||||||||||||
Dmitri Tcherevik | |||||||||||||||||||
— | 33,841 | 30.89 | 6/30/2024 | ||||||||||||||||
25,899 | 1,070,665 | ||||||||||||||||||
Kurt Abkemeier (3) | |||||||||||||||||||
— | — | — | — | ||||||||||||||||
— | — | ||||||||||||||||||
_____________
(1) | The unvested shares shown in this column are RSU awards that are subject to time-based vesting and PSU awards that are subject to performance-based and time-based vesting. |
(2) | The market value of unvested RSUs and PSUs was calculated as of November 30, 2017 based on closing price of our common stock on NASDAQ of $41.34 on that date. |
(3) | Mr. Abkemeier’s employment terminated on March 24, 2017 and all unvested RSU and PSU awards terminated as of that date. |
38
Option Exercises and Stock Vested |
The following table sets forth certain information regarding the number of stock options exercised and RSUs that vested in the fiscal year ended November 30, 2017 under our equity incentive plans and the corresponding amounts realized by the named executive officers. The value realized on exercise for stock option awards is calculated as the difference between the closing price of our common stock on the NASDAQ Global Select Market on the exercise date and the exercise price of the applicable stock option award. The value realized on vesting for RSUs is calculated as the product of the number of shares subject to the RSUs that vested and the closing price of our common stock on the NASDAQ Global Select Market on the vesting date.
Option Exercises and Stock Vested - Fiscal 2017
Option Awards | Stock Awards | |||||||||
Name | Number of Shares Acquired on Exercise (#) | Value Realized on Exercise ($) | Number of Shares Acquired on Vesting (#) | Value Realized on Vesting ($) | ||||||
Yogesh Gupta | — | — | 25,155 | 1,015,084 | ||||||
Paul Jalbert | — | — | 3,973 | 139,283 | ||||||
John Ainsworth | — | — | 2,905 | 110,637 | ||||||
Loren Jarrett | — | — | 2,905 | 110,637 | ||||||
Dmitri Tcherevik | — | — | — | — | ||||||
Kurt Abkemeier | 7,551 | 3,048 | 23,161 | 651,635 | ||||||
Severance and Change in Control Agreements |
We have agreements with, or guidelines applicable to, our executive officers that provide the benefits described below in connection with certain terminations of employment or a change in control of our company. We do not provide excise tax gross-ups to our executive officers under these or any other agreements.
Mr. Gupta’s Executive Employment Agreement
In connection with his appointment as our President and Chief Executive Officer, we and Mr. Gupta entered into an employment agreement, effective as of October 10, 2016, setting forth Mr. Gupta’s compensation and certain other terms. Mr. Gupta’s employment agreement provides that if his employment is terminated because of an “involuntary termination,” he will be entitled to:
• | the payment of cash severance equal to 18 months of total target cash compensation as of the date of termination, which will be paid over 18 months; |
• | the continuation, for a period of 18 months, of benefits that are substantially equivalent to the benefits (medical, dental, and vision) that were in effect immediately prior to termination; and |
• | 18 months of acceleration of unvested stock options and RSUs (but not unvested performance equity). |
Receipt of the severance and benefits is subject to the execution of a standard separation and release agreement. Separation payments upon any involuntary termination within twenty-four months following a change in control would be governed by the Employee Retention and Motivation Agreement described below and not by Mr. Gupta’s employment agreement.
An “involuntary termination” is defined in the employment agreement as a termination of employment by us other than for cause, disability or death or a termination by Mr. Gupta as a result of certain events occurring without his consent such as an assignment to him of duties, a significant reduction of his duties, either of which is materially inconsistent with his position prior to the assignment or reduction, or the removal of Mr. Gupta from that position, a material reduction in Mr. Gupta's base salary or target bonus, a relocation of Mr. Gupta to a facility or location more than fifty miles from his then present location, or a material breach of the employment agreement by us.
39
Mr. Gupta’s employment agreement also includes non-competition and related covenants. The non-competition covenant will be in effect for the duration of the period in which severance and other benefits are paid. The non-competition covenant relates to certain businesses with similar product areas and activities as our company.
Mr. Gupta’s Employee Retention and Motivation Agreement
We and Mr. Gupta have also entered into an Employee Retention and Motivation Agreement (“Gupta ERMA”), which provides certain compensation and benefits if his employment is involuntarily terminated within 24 months of a change in control of our company. If an involuntary termination of Mr. Gupta’s employment occurs under other circumstances, the severance terms of his employment agreement, as described above, would control and not the Gupta ERMA.
Change in Control Benefits. Under the Gupta ERMA, upon a change in control of our company, Mr. Gupta would be entitled to:
• | the payment of his annual target cash bonus on a pro-rata basis with respect to the elapsed part of the relevant fiscal year; |
• | accelerated vesting of all unvested stock options and RSUs, unless the acquirer assumes all such options and restricted equity. If such outstanding stock options and shares of restricted equity held by Mr. Gupta are continued by us or assumed by our successor entity, then vesting will continue in its usual course; and |
• | accelerated determination of PSUs earned under outstanding LTIPs, unless the acquirer assumes such LTIPs. Upon the change in control, our Compensation Committee will determine the number of PSUs that are eligible to be earned based on the actual attainment of relative total shareholder return as of the change in control. Those PSUs determined to be earned will not become fully vested until the conclusion of the original three-year performance period, subject to the continued employment of Mr. Gupta through such date. |
Involuntary Termination Following Change in Control. In the event of an involuntary termination within twenty-four (24) months following a change in control, Mr. Gupta would be entitled to:
• | the payment of cash severance equal to 24 months of total target cash compensation as of the date of termination, which will be paid over 24 months; |
• | the continuation, for a period of 24 months, of benefits that are substantially equivalent to the benefits (medical, dental, and vision) that were in effect immediately prior to termination; |
• | accelerated vesting of all unvested stock options and RSUs; and |
• | accelerated payout of PSUs determined to be earned under LTIPs outstanding as of the change in control. |
In the event that any amounts provided for under the Gupta ERMA or otherwise payable to Mr. Gupta would constitute “parachute payments” within the meaning of Section 280G of the Internal Revenue Code and be subject to the related excise tax, Mr. Gupta would be entitled to receive either full payment of the benefits under the agreement or such lesser amount which would result in no portion of the benefits being subject to the excise tax, whichever results in the greatest amount of after-tax benefits to Mr. Gupta.
Mr. Jalbert's Executive Employment Agreement
In connection with his appointment as our Chief Financial Officer, we and Mr. Jalbert entered into an employment agreement, effective as of March 24, 2017, setting forth Mr. Jalbert’s compensation and certain other terms. Mr. Jalbert’s employment agreement provides that in the event that his employment is terminated as a result of an "involuntary termination," he will be entitled to:
• | the payment of cash severance equal to 12 months of total target cash compensation as of the date of termination, which will be paid over 12 months; |
• | the continuation, for a period of 12 months, of benefits that are substantially equivalent to the benefits (medical, dental, and vision) that were in effect immediately prior to termination; |
40
• | 12 months of acceleration of unvested stock options and RSUs (but not unvested performance equity); and |
• | one-fourth acceleration of Mr. Jalbert’s special RSU award, if the termination occurs prior to March 24, 2018 and one-half acceleration of Mr. Jalbert’s special RSU award, if the termination occurs after March 24, 2018 but prior to March 24, 2019. |
Receipt of the severance and benefits is subject to the execution of a standard separation and release agreement. Separation payments upon any involuntary termination within twelve months following a change in control would be governed by the Employee Retention and Motivation Agreement described below and not by Mr. Jalbert’s employment agreement.
An "involuntary termination" is defined in the employment agreement as a termination of employment by us other than for cause, disability or death or a termination by Mr. Jalbert as a result of certain events occurring without his consent such as an assignment to him of duties, a significant reduction of his duties, either of which is materially inconsistent with his position prior to the assignment or reduction, or the removal of Mr Jalbert from that position, a material reduction in Mr. Jalbert’s base salary or target bonus, a relocation of Mr. Jalbert to a facility or location more than fifty miles from his then present location, or a material breach of the employment agreement by us.
Mr. Jalbert’s employment agreement also includes non-competition and related covenants. The non-competition covenant will be in effect for the duration of the period in which severance and other benefits are paid. The non-competition covenant relates to certain businesses with similar product areas and activities as our company.
Mr. Abkemeier's Executive Employment Agreement
In connection with his appointment as our Chief Financial Officer, we and Mr. Abkemeier entered into an employment agreement, effective as of September 28, 2016, setting forth Mr. Abkemeier’s compensation and certain other terms. The terms of Mr. Abkemeier’s employment agreement are substantially identical to the terms of Mr. Jalbert’s employment agreement except that, upon an involuntary termination of employment, one-third of Mr. Abkemeier’s special RSU award would occur, if the termination occurred prior to September 28, 2017, and two-thirds of Mr. Abkemeier’s special RSU award would occur, if the termination occurs after September 28, 2017 but prior to September 28, 2018.
On March 24, 2017, we terminated Mr. Abkemeier’s employment. In connection with his termination, we entered into a separation and release agreement with Mr. Abkemeier and provided him with the severance and other benefits in accordance with his employment agreement as described above.
Executive Severance Guidelines
We have adopted severance guidelines applicable to our executive officers, including the named executive officers other than Messrs. Gupta and Jalbert. Any severance payable to Messrs. Gupta and Jalbert is governed by the employment agreements described above. Our executive severance guidelines provide that upon an involuntary termination and the execution of a standard release of claims, an executive officer is entitled to:
• | the payment of cash severance equal to 12 months of total target cash compensation as of the date of termination, which will be paid over 12 months; |
• | the continuation, for a period of 12 months, of benefits that are substantially equivalent to the benefits (medical, dental, and vision) that were in effect immediately prior to termination; and |
• | 12 months of acceleration of unvested stock options and RSUs (but not unvested performance equity). |
Severance payments and benefits upon any involuntary termination within 12 months following a change in control are governed by the Employee Retention and Motivation Agreement described below.
The payment of severance and other benefits is conditioned upon the executive agreeing to non-competition, non-disparagement and related covenants. The non-competition covenant would be in effect for one year following the termination of employment. In connection with the termination of employment of an executive officer, all PSUs awarded to that executive officer relating to annual performance or under our Long-Term Incentive Plan are canceled.
41
Other Employee Retention and Motivation Agreements
We have entered into an ERMA with each of our other named executive officers. Each agreement is substantially identical to the Gupta ERMA except that upon the involuntary termination of the executive officer within 12 months following a change of control, the executive officer will be entitled to receive a lump sum payment equal to 15 months of his total target compensation and his benefits will continue for 15 months. Mr. Jalbert’s ERMA contains the same terms with respect to accelerated vesting upon a change in control as the Gupta ERMA. For all ERMAs entered into after October 2014 (other than Mr. Gupta’s), accelerated vesting upon a change in control is limited to twelve months of accelerated vesting. Under no circumstances would any of our executive officers be entitled to a gross-up payment under the ERMAs for any excise taxes to which he or she may be subject if any of the above payments and benefits are considered to be "parachute payments."
Estimate of Severance and Change in Control Benefits
The following table indicates the estimated payments and benefits that each of Messrs. Gupta, Jalbert, Ainsworth and Tcherevik and Ms. Jarrett would have received under (a) their respective employment agreements, in the case of Messrs. Gupta and Jalbert, (b) our severance guidelines applicable to executive officers, in the case of Messrs. Ainsworth and Tcherevik and Ms. Jarrett, and (c) their respective ERMAs, assuming that the change of control of our company and/or termination of his employment occurred at November 30, 2017.
Mr. Abkemeier’s employment terminated on March 24, 2017 and we provided him the severance benefits described above. As a result, we have omitted Mr. Abkemeier from the table below.
These amounts are estimates only and do not necessarily reflect the actual amounts that would be paid to the named executive officer, which would only be known at the time that he becomes entitled to such payment.
42
CIRCUMSTANCES OF TERMINATION OR EVENT | ||||||||||||||||||||
Involuntary Termination (1)($) | Change in Control Only (2)($) | Involuntary Termination Within 12 Months Following Change of Control ($) | ||||||||||||||||||
Yogesh Gupta | ||||||||||||||||||||
Cash Severance | 1,725,000 | — | 2,300,000 | |||||||||||||||||
Pro Rata Bonus | 575,000 | 575,000 | 575,000 | |||||||||||||||||
Stock Options | 693,285 | — | 1,617,627 | |||||||||||||||||
Restricted Stock Units | 1,526,686 | — | 4,201,963 | |||||||||||||||||
Benefits (3) | 24,557 | — | 32,743 | |||||||||||||||||
Total | 4,544,528 | 575,000 | 8,727,333 | |||||||||||||||||
Paul Jalbert | ||||||||||||||||||||
Cash Severance | 600,000 | — | 750,000 | |||||||||||||||||
Pro Rata Bonus | 225,000 | 225,000 | 225,000 | |||||||||||||||||
Stock Options | 108,386 | — | 379,319 | |||||||||||||||||
Restricted Stock Units | 251,430 | — | 2,176,468 | |||||||||||||||||
Benefits (3) | 1,184 | — | 1,480 | |||||||||||||||||
Total | 1,185,999 | 225,000 | 3,532,267 | |||||||||||||||||
John Ainsworth | ||||||||||||||||||||
Cash Severance | 502,500 | — | 628,125 | |||||||||||||||||
Pro Rata Bonus | 167,500 | 167,500 | 167,500 | |||||||||||||||||
Stock Options | 71,005 | — | 248,486 | |||||||||||||||||
Restricted Stock Units | 268,751 | — | 771,983 | |||||||||||||||||
Benefits (3) | 27,171 | — | 33,963 | |||||||||||||||||
Total | 1,036,927 | 167,500 | 1,850,057 | |||||||||||||||||
Loren Jarrett | ||||||||||||||||||||
Cash Severance | 502,500 | — | 628,125 | |||||||||||||||||
Pro Rata Bonus | 167,500 | 167,500 | 167,500 | |||||||||||||||||
Stock Options | 71,005 | — | 248,486 | |||||||||||||||||
Restricted Stock Units | 268,751 | — | 771,983 | |||||||||||||||||
Benefits (3) | 27,707 | — | 34,634 | |||||||||||||||||
Total | 1,037,463 | 167,500 | 1,850,728 | |||||||||||||||||
Dmitri Tcherevik | ||||||||||||||||||||
Cash Severance | 502,500 | — | 628,125 | |||||||||||||||||
Pro Rata Bonus | 167,500 | 167,500 | 167,500 | |||||||||||||||||
Stock Options | 88,407 | — | 353,638 | |||||||||||||||||
Restricted Stock Units | 162,301 | — | 572,766 | |||||||||||||||||
Benefits (3) | 27,998 | — | 34,997 | |||||||||||||||||
Total | 948,706 | 167,500 | 1,757,026 | |||||||||||||||||
_____________
(1) | The amounts shown in the first column, with respect to stock options and RSUs, represent the value of certain unvested options and RSUs becoming fully vested and are calculated using the exercise price for each unvested stock option and the closing price of our common stock on November 30, 2017, which was $41.34. In the event of an Involuntary Termination, all unvested performance share units awarded to an individual under our Long Term Incentive Plan are canceled. |
(2) | In the event of a change in control, there is no accelerated vesting of options or RSUs provided that the acquirer assumes all existing, outstanding stock options and RSUs of the individual. These tables have been prepared under that assumption. However, if the acquirer does not assume all existing, outstanding stock options and RSUs of the individual, all unvested stock options and RSUs become fully vested and the value indicated in the third column would apply upon a change in control. The amounts shown in the third column are calculated using the exercise price for each unvested stock option and the closing price of our common stock on November 30, 2017, which was $41.34. For purposes of computing amounts attributable to accelerated vesting, the second and third columns exclude all unvested performance share units awarded under our Long Term Incentive Plan as those amounts are undeterminable. |
(3) | Represents the estimated value (based on the cost as of November 30, 2017) of continuing benefits (medical, dental, and vision) for: |
• | 18 months in the case of an involuntary termination of Mr. Gupta’s employment, 24 months in the case of an involuntary termination in connection with a change in control; |
• | 12 months in the case of an involuntary termination of employment of Messrs. Jalbert, Ainsworth and Tcherevik and Ms. Jarrett, other than in connection with a change in control; and |
• | 15 months, in the case of an involuntary termination in connection with a change in control, with respect to Messrs. Jalbert, Ainsworth and Tcherevik and Ms. Jarrett. |
43
Director Compensation |
We pay our directors a mix of cash and equity compensation. Employee directors receive no compensation for their service as directors.
In accordance with the 2017 Director Compensation Plan adopted by the Board, for 2017, our non-employee directors were paid an annual retainer of $250,000. This annual retainer was paid $50,000 in cash and $200,000 in equity, in the form of deferred stock units (DSUs). The non-executive Chairman of the Board was paid an additional cash retainer of $50,000.
Prior to adopting the 2017 Director Compensation Plan, the Compensation Committee received market data from its external compensation consultant and considered whether any changes in director compensation were required. Based on the market data, the Compensation Committee recommended to the Board no changes to director compensation except the adoption of DSUs as the exclusive form of equity to be awarded to non-employee directors under the plan.
The number of DSUs was determined by dividing the equity retainer by the grant date closing price of our common stock as reported by NASDAQ. Upon issuance, the DSUs vest in a single installment on the date of the 2018 Annual Meeting, subject to continued service on our Board of Directors. DSUs do not convert to shares of common stock until a director terminates service on the Board of Directors or upon a change in control, whichever occurs first.
With respect to service on the committees of our Board of Directors, the following fees were paid:
• | Audit Committee - $25,000 for the Chairman and $20,000 for the other members; |
• | Compensation Committee - $20,000 for the Chairman and $15,000 for the other members; and |
• | Nominating and Corporate Governance Committee - $12,500 for the Chairman and $10,000 for the other members. |
The fees paid for service on the committees of our Board of Directors were paid in cash in March 2017.
In March 2017, our Board of Directors adopted revised stock retention guidelines for non-employee directors. These guidelines provide for all non-employee directors to hold an amount of our common stock, restricted shares, stock options and/or deferred stock units having a value equal to at least five times the annual cash retainer. Directors have five years to attain this ownership threshold.
Each newly elected director receives an initial director appointment grant of $300,000 of deferred stock units at the first April or October grant date following his or her election to our Board of Directors. Deferred stock units vest over a 60-month period, beginning on the first day of the month following the month the director joins our Board of Directors, with full acceleration of vesting upon a change in control.
44
Director Compensation Table – Fiscal 2017 | ||||
The following table sets forth a summary of the compensation earned by or paid to our non-employee directors in 2017. For 2017, compensation was paid to our current directors except Ms. King and Ms. Tucci, who joined our Board in February 2018. In addition, compensation was paid to Philip M. Pead, who did not stand for re-election to our Board at the 2017 Annual Meeting.
Name | Fees Earned or Paid in Cash ($) | Stock Awards (1) (2) ($) | Option Awards (3) ($) | Total ($) | |
Paul Dacier (4) | 56,250 | 400,026 | — | 456,276 | |
John R. Egan (5) | 132,500 | 200,009 | — | 332,509 | |
Rainer Gawlick (6) | 57,500 | 400,026 | — | 457,526 | |
Charles F. Kane | 90,000 | 200,009 | — | 290,009 | |
David A. Krall | 85,000 | 200,009 | — | 285,009 | |
Michael L. Mark | 80,000 | 200,009 | — | 280,009 | |
Philip M. Pead (7) | 50,000 | 125,040 | — | 175,040 | |
_____________
(1) | Represents DSUs issued to the named directors in the following amounts: |
Name | Total RSUs Granted in 2017 |
Mr. Dacier | 12,950 |
Mr. Egan | 6,885 |
Mr. Gawlick | 12,950 |
Mr. Kane | 6,885 |
Mr. Krall | 6,885 |
Mr. Mark | 6,885 |
Mr. Pead | 3,443 |
In the case of Mr. Pead, he was also issued 810 full value shares having a value of $25,021 on March 31, 2017 relating to the pro-rated portion of the fiscal 2016 equity retainer for the period from October 12, 2016 until November 30, 2017 following his retirement as our Chief Executive Officer.
(2) | Represents the fair value of DSUs on June 30, 2017. In the case of Messrs. Egan, Kane, Krall, Mark and Pead, DSUs were originally granted on March 31, 2017. However, in June 2017, the Compensation Committee amended these DSU grants to provide that such DSUs vest on the date of the 2018 Annual Meeting rather than December 1, 2017, so the fair value measurement date changed accordingly. The grant date fair value is equal to the number of DSUs granted multiplied by $30.89, the closing price on the date of grant. |
(3) | Each non-employee director had the following unexercised stock options outstanding as of the record date: |
Name | Unexercised Stock Options Outstanding at Record Date | |
Mr. Dacier | — | |
Mr. Egan | 72,632 | |
Mr. Gawlick | — | |
Mr. Kane | — | |
Mr. Krall | — | |
Mr. Mark | 100,583 | |
(4) | Mr. Dacier was elected to the Board of Directors at the 2017 Annual Meeting and received 50% of the annual retainer for service on our Board in fiscal 2017. Mr. Dacier also received an award of DSUs in connection with his initial appointment to our Board. Mr. Dacier served as Chairman of the Nominating and Corporate Governance Committees for one-half of fiscal 2017. |
(5) | Mr. Egan served as a member of the Compensation and Nominating and Corporate Governance Committee for one-half of fiscal 2017. |
(6) | Mr. Gawlick was elected to the Board of Directors at the 2017 Annual Meeting and received 50% of the annual retainer for service on our Board in fiscal 2017. Mr. Gawlick also received an award of DSUs in connection with his initial appointment to our Board. Mr. Gawlick served as a member of the Compensation and the Nominating and Corporate Governance Committees for one-half of fiscal 2017. |
(7) | Mr. Pead was our Chief Executive Officer until October 12, 2016. Following his retirement as Chief Executive Officer, Mr. Pead remained on our Board, although he did not stand for re-election at the 2017 Annual Meeting. Mr. Pead was paid a pro-rata portion of the annual retainer for the period from December 1, 2016 until June 12, 2017. |
45
ITEM 12. SECURITY OWNERSHIP OF CERTAIN BENEFICIAL OWNERS AND MANAGEMENT AND RELATED STOCKHOLDER MATTERS
The following table sets forth certain information regarding beneficial ownership as of February 28, 2018:
• | by each person who is known by us to beneficially own more than 5% of the outstanding shares of our common stock; |
• | by each director of our company; |
• | by each of the named executive officers and |
• | by all directors and executive officers of our company as a group. |
Amount and Nature of Beneficial Ownership | ||||
Name and Address of Beneficial Owner (1) | Number | Percent | ||
BlackRock, Inc. (2) 55 East 52nd Street New York, NY 10055 | 6,187,103 | 13.4% | ||
The Vanguard Group, Inc. (3) 1000 Vanguard Blvd. Malvern, PA 19355 | 4,446,130 | 9.6% | ||
Praesidium Investment Management Company, LLC (4) 747 Third Avenue, 35th floor New York, NY 10017 | 4,260,853 | 9.2% | ||
Kurt Abkemeier | — | * | ||
John Ainsworth (5) | 10,741 | * | ||
Paul Dacier (6) | 1,612 | * | ||
John R. Egan (7) | 121,038 | * | ||
Rainer Gawlick (8) | 1,612 | * | ||
Yogesh Gupta (9) | 56,573 | * | ||
Paul Jalbert (10) | 20,263 | * | ||
Loren Jarrett (11) | 10,741 | * | ||
Charles F. Kane (12) | 83,502 | * | ||
Samskriti King | — | * | ||
David A. Krall (13) | 77,769 | * | ||
Michael L. Mark (14) | 300,498 | * | ||
Dmitri Tcherevik (15) | 5,848 | * | ||
Angela Tucci | — | * | ||
All executive officers and directors as a group (19 persons) (16) | 884,551 | 1.9% | ||
_____________
* Less than 1%
(1) | All persons named in the table have sole voting and investment power with respect to all shares of our common stock shown as beneficially owned by them, subject to community property laws where applicable and subject to the other information contained in the footnotes to this table. Unless otherwise noted the address of such person is c/o Progress Software Corporation, 14 Oak Park, Bedford, Massachusetts 01730. |
(2) | Derived from Schedule 13G/A filed on January 19, 2018. The Schedule 13G/A reported that BlackRock, Inc. had sole voting power over 6,055,057, shares and sole dispositive power with respect to all shares reported. |
(3) | Derived from Schedule 13G/A filed on February 12, 2018. The Schedule 13G/A reported that The Vanguard Group held sole voting power over 85,816 shares, sole dispositive power over 4,357,532 shares and shared dispositive power over 88,598 shares. |
(4) | Derived from Schedule 13D/A filed on September 15, 2017. The Schedule 13D/A reported that Praesidium, in its capacity as investment manager to certain managed accounts and investment fund vehicles on behalf of investment advisory clients, has sole power to vote 3,995,179 shares and sole dispositive power with respect to all shares reported. Kevin Oram and Peter Uddo, as managing members of Praesidium, may be deemed to control Praesidium. On March 7, 2018, Praesidium filed a Schedule 13D/A to report that it had disposed of all but 1,000 shares. |
(5) | Includes 2,937 shares issuable upon the exercise of outstanding options that are exercisable within 60 days of February 28, 2018 and 2,905 shares issuable upon vesting of RSUs that will vest within 60 days of February 28, 2018. |
(6) | Includes 1,612 fully vested deferred stock units. |
46
(7) | Includes 72,632 shares issuable upon the exercise of outstanding options that are exercisable within 60 days of February 28, 2018 and 7,236 fully vested deferred stock units. |
(8) | Includes 1,612 fully vested deferred stock units. |
(9) | Includes 18,697 shares issuable upon the exercise of outstanding options that are exercisable as of February 28, 2018 and 2,787 shares issuable upon vesting of RSUs that will vest within 60 days of February 28, 2018. |
(10) | Includes 4,410 shares issuable upon the exercise of outstanding options that are exercisable as of February 28, 2018 and 2,632 shares issuable upon vesting of RSUs that will vest within 60 days of February 28, 2018. |
(11) | Includes 2,937 shares issuable upon the exercise of outstanding options that are exercisable within 60 days of February 28, 2018 and 2,905 shares issuable upon vesting of RSUs that will vest within 60 days of February 28, 2018. |
(12) | Includes 19,483 fully vested deferred stock units. |
(13) | Includes 5,547 fully vested deferred stock units. |
(14) | Includes 100,583 shares issuable upon the exercise of outstanding options that are exercisable within 60 days of February 28, 2018 and 7,110 fully vested deferred stock units. |
(15) | Includes 4,230 shares issuable upon the exercise of outstanding options that are exercisable as of February 28, 2018, and 1,618 shares issuance upon vesting of RSUs that will vest within 60 days of February 28, 2018. |
(16) | Includes 261,103 shares issuable upon the exercise of outstanding options that are exercisable within 60 days of February 28, 2018, 27,471 shares issuable upon vesting of RSUs that will vest within 60 days of February 28, 2018, 648 shares issuable upon vesting of deferred stock units that will vest within 60 days of February 28, 2018 and 41,952 fully vested deferred stock units. |
Information related to securities authorized for issuance under equity compensation plans as of November 30, 2017 is as follows (in thousands, except per share data):
Plan Category | Number of Securities to be Issued Upon Exercise of Outstanding Options, Warrants and Rights | Weighted-average Exercise Price of Outstanding Options, Warrants and Rights | Number of Securities Remaining Available for Future Issuance | |||
Equity compensation plans approved by stockholders (1) | 2,114 | (2) | 28.31 | 3,945 | (3) | |
Equity compensation plans not approved by stockholders (4) | 24 | 27.50 | 1,489 | |||
Total | 2,138 | 28.29 | 5,434 | |||
_____________
(1) Consists of the 1992 Incentive and Nonqualified Stock Option Plan, 1994 Stock Incentive Plan, 1997 Stock Incentive Plan, 2008 Stock Option and Incentive Plan and 1991 Employee Stock Purchase Plan (ESPP).
(2) Includes 1,136 restricted stock units under our 2008 Plan. Does not include purchase rights accruing under the ESPP because the purchase price (and therefore the number of shares to be purchased) will not be determined until the end of the purchase period.
(3) Includes 815 shares available for future issuance under the ESPP.
(4) Consists of the 2002 Nonqualified Stock Plan and the 2004 Inducement Plan described below.
We have adopted two equity compensation plans, the 2002 Nonqualified Stock Plan and the 2004 Inducement Stock Plan, for which the approval of shareholders was not required. We intend that the 2004 Inducement Stock Plan be reserved for persons to whom we may issue securities as an inducement to become employed by us pursuant to the rules and regulations of NASDAQ. Executive officers and members of the Board of Directors are not eligible for awards under the 2002 Nonqualified Stock Plan. An executive officer would be eligible to receive an award under the 2004 Inducement Stock Plan only as an inducement to join us. Awards under the 2002 Nonqualified Stock Plan and the 2004 Inducement Stock Plan may include nonqualified stock options, grants of conditioned stock, unrestricted grants of stock, grants of stock contingent upon the attainment of performance goals and stock appreciation rights. A total of 11,250,000 shares are issuable under the two plans, of which, 1,489,314 shares are available for future issuance.
47
ITEM 13. CERTAIN RELATIONSHIPS AND RELATED TRANSACTIONS, AND DIRECTOR INDEPENDENCE
Review, Approval or Ratification of Transactions with Related Persons |
Pursuant to the Audit Committee’s Charter, which can be found at www.progress.com under the Corporate Governance page located on the Investor Relations page, the Audit Committee is responsible for the review and approval of related person transactions. A related person is a director, executive officer, nominee for director or certain stockholders of our company since the beginning of the last fiscal year and their respective immediate family members. A related person transaction is a transaction involving: (1) our company and any related person when the amount involved exceeds $120,000, and (2) the related person has a material direct or indirect interest.
We identify transactions for review and approval through our Code of Ethics and Business Conduct which can be found at www.progress.com under the Corporate Governance page located on the Investor Relations page. The Code of Ethics and Business Conduct requires our employees to disclose any potential or actual conflicts of interest to his or her manager, our human capital department or our Chief Compliance Officer. This disclosure also applies to potential conflicts involving immediate family members of employees. We require our directors to complete a questionnaire intended to identify any transactions or potential transactions that must be reported per SEC rules and regulations. This questionnaire also requires our directors to promptly notify us of any changes during the year.
Transactions with Related Persons |
During fiscal 2017, we acquired 100% of the outstanding securities of MightyMeeting, Inc. ("MightyMeeting"), a mobile collaboration and social publishing platform, for $1.5 million. Dmitri Tcherevik, our Chief Technology Officer, was the founder and 50% owner of MightyMeeting. We recorded an intangible asset of $2.4 million, which includes a deferred tax liability of $0.9 million that will be amortized over five years beginning in the fourth quarter of fiscal 2017. Our Audit Committee approved the acquisition in accordance with the Audit Committee’s Charter.
Except as described above, neither the company nor its subsidiaries engaged in any transactions or series of similar transactions in which the amount involved exceeded $120,000 and in which any of our directors or executive officers, any holder of more than 5% of any class of our voting securities or any member of the immediate family of any of the foregoing persons had a direct or indirect material interest, nor are any such transactions currently proposed.
Independence of Members of our Board of Directors |
We have determined that all current directors except Yogesh Gupta (our current President and Chief Executive Officer) are independent within the meaning of the director independence standards of NASDAQ and the applicable rules of the SEC. In making this determination, we solicited information from each of the directors regarding whether that director, or any member of his immediate family, had a direct or indirect material interest in any transactions involving our company, was involved in a debt relationship with our company or received personal benefits outside the scope of the director’s normal compensation. We considered the responses of the directors, and independently considered the commercial agreements, acquisitions and other material transactions entered by us during 2017, and determined that none of our non-employee directors had a material interest in those transactions.
48
ITEM 14. PRINCIPAL ACCOUNTING FEES AND SERVICES
Selection of Independent Registered Public Accounting Firm |
The Audit Committee has selected the firm of Deloitte & Touche LLP, independent registered public accounting firm, to serve as our independent registered public accounting firm for the fiscal year ending November 30, 2018.
Independent Registered Public Accounting Firm Fees |
Aggregate fees billed to us for services performed for the fiscal years ended November 30, 2017 and November 30, 2016 by our independent registered public accounting firm, Deloitte & Touche LLP, were as follows:
2017 | 2016 | |||||
Audit Fees (1) | $ | 2,256,107 | $ | 2,304,444 | ||
Tax Fees (2) | 9,625 | 2,406 | ||||
Audit-Related Fees (3) | 140,000 | — | ||||
All Other Fees | — | — | ||||
__________
(1) | Represents fees billed for each of the last two fiscal years for professional services rendered for the audit of our annual financial statements included in Form 10-K and reviews of financial statements included in our interim filings on Form 10-Q, as well as statutory audit fees related to our wholly-owned foreign subsidiaries. In accordance with the policy on Audit Committee pre-approval, 100% of audit services provided by the independent registered public accounting firm are pre-approved. |
(2) | Includes fees primarily for tax services. In accordance with the policy on Audit Committee pre-approval, 100% of tax services provided by the independent registered public accounting firm are pre-approved. |
(3) | Represents for 2017 fees billed for audit services in connection with the acquisitions of DataRPM Corporation and Kinvey, Inc., both of which were completed during fiscal 2017. |
Policy on Audit Committee Pre-Approval of Audit and Permissible Non-Audit Services of Independent Registered Public Accounting Firm |
The Audit Committee is responsible for appointing, setting compensation, and overseeing the work of our independent registered public accounting firm. The Audit Committee has established a policy regarding pre-approval of all audit and permissible non-audit services provided by the independent registered public accounting firm.
Requests for specific services by the independent registered public accounting firm which comply with the auditor services policy are reviewed by our Finance, Tax, and Internal Audit departments. Requests approved by the group are aggregated and submitted to the Audit Committee in one of the following ways:
• | Request for approval of services at a meeting of the Audit Committee; or |
• | Request for approval of services by the Chairman of the Audit Committee and then the approval by the full committee at the next meeting of the Audit Committee. |
The request may be made with respect to either specific services or a type of service for predictable or recurring services.
49
PART IV
ITEM 15. EXHIBITS, FINANCIAL STATEMENT SCHEDULES
(a) Exhibits
Documents listed below, except for documents followed by parenthetical numbers, are being filed as exhibits. Documents followed by parenthetical numbers are not being filed herewith and, pursuant to Rule 12b-32 of the General Rules and Regulations promulgated by the SEC under the Exchange Act, reference is made to such documents as previously filed as exhibits with the SEC. Our file number under the Act is 0-19417.
50
2.1 | |
2.2 | |
3.1 | |
3.2 | |
3.2.1 | |
3.3 | |
4.1 | |
10.1* | |
10.2* | |
10.3* | |
10.4* | |
10.5* | |
10.6* | |
10.7* | |
10.8* | |
10.9* | |
10.10* | |
10.11* | |
10.12* | |
10.13* | |
10.14* | |
10.15* | |
10.16* | |
10.17* | |
10.18* | |
10.19* | |
21.1 | |
23.1 | |
31.1 | |
31.2 | |
31.3 | |
31.4 | |
32.1 | |
101** | The following materials from Progress Software Corporation’s Annual Report on Form 10-K for the year ended November 30, 2017, formatted in XBRL (eXtensible Business Reporting Language): (i) Consolidated Balance Sheets as of November 30, 2017 and 2016, (ii) Consolidated Statements of Income for the years ended November 30, 2017, 2016 and 2015, (iii) Consolidated Statements of Comprehensive Income for the years ended November 30, 2017, 2016 and 2015, (iv) Consolidated Statements of Shareholders’ Equity for the years ended November 30, 2017, 2016 and 2015, and (v) Consolidated Statements of Cash Flows for the years ended November 30, 2017, 2016 and 2015. (31) |
(1) | Incorporated by reference to Exhibit 2.1 to our Current Report on Form 8-K filed on October 27, 2014. |
(2) | Incorporated by reference to Exhibit 2.1 to our Current Report on Form 8-K filed on May 14, 2015. |
(3) | Incorporated by reference to Exhibit 3.1 to our Current Report on Form 8-K filed on May 14, 2015. |
(4) | Incorporated by reference to Exhibit 3.2 to our Current Report on Form 8-K filed on May 14, 2015. |
(5) | Incorporated by reference to Exhibit 3.4 to our Current Report on Form 8-K filed on May 14, 2015. |
(6) | Incorporated by reference to Exhibit 4.1 to our Annual Report on Form 10-K for the year ended November 30, 2011. |
(7) | Incorporated by reference to Exhibit 10.1 to our Annual Report on Form 10-K for the year ended November 30, 2009. |
(8) | Incorporated by reference to Exhibit 10.2 to our Annual Report on Form 10-K for the year ended November 30, 2009. |
(9) | Incorporated by reference to Exhibit 10.3 to our Annual Report on Form 10-K for the year ended November 30, 2012. |
51
(10) | Incorporated by reference to Exhibit 10.4 to our Annual Report on Form 10-K for the year ended November 30, 2013. |
(11) | Incorporated by reference to Exhibit 10.5 to our Annual Report on Form 10-K for the year ended November 30, 2015. |
(12) | Incorporated by reference to Exhibit 10.6 to our Annual Report on Form 10-K for the year ended November 30, 2015. |
(13) | Incorporated by reference to Annex A to our definitive Proxy Statement filed April 15, 2016. |
(14) | Incorporated by reference to Annex A to our definitive Proxy Statement filed May 7, 2013. |
(15) | Incorporated by reference to Exhibit 10.9 to our Annual Report on Form 10-K for the year ended November 30, 2013. |
(16) | Incorporated by reference to Exhibit 10.10 to our Annual Report on Form 10-K for the year ended November 30, 2012. |
(17) | Incorporated by reference to Exhibit 10.1 to our Quarterly Report on Form 10-Q for the quarter ended February 28, 2017. |
(18) | Incorporated by reference to Exhibit 10.12 to our Annual Report on Form 10-K for the year ended November 30, 2013. |
(19) | Incorporated by reference to Exhibit 10.13 to our Annual Report on Form 10-K for the year ended November 30, 2013. |
(20) | Incorporated by reference to Exhibit 10.14 to our Annual Report on Form 10-K for the year ended November 30, 2013. |
(21) | Incorporated by reference to Exhibit 10.15 to our Annual Report on Form 10-K for the year ended November 30, 2014. |
(22) | Incorporated by reference to Exhibit 10.1 to our Current Report on Form 8-K filed November 27, 2017. |
(23) | Incorporated by reference to Exhibit 10.1 to our Current Report on Form 8-K filed on October 14, 2016. |
(24) | Incorporate by reference to Exhibit 10.2 to our Current Report on Form 8-K filed on October 14, 2016. |
(25) | Incorporated by reference to Exhibit 10.1 to our Current Report on Form 8-K filed on March 31, 2017. |
(26) | Incorporated by reference to Exhibit 21.1 to our Annual Report on Form 10-K for the year ended November 30, 2017 |
(27) | Incorporated by reference to Exhibit 23.1 to our Annual Report on Form 10-K for the year ended November 30, 2017 |
(28) | Incorporated by reference to Exhibit 31.1 to our Annual Report on Form 10-K for the year ended November 30, 2017 |
(29) | Incorporated by reference to Exhibit 31.2 to our Annual Report on Form 10-K for the year ended November 30, 2017 |
(30) | Incorporated by reference to Exhibit 32.1 to our Annual Report on Form 10-K for the year ended November 30, 2017 |
(31) | Incorporated by reference to Exhibit 101 to our Annual Report on Form 10-K for the year ended November 30, 2017 |
* | Management contract or compensatory plan or arrangement in which an executive officer or director of Progress Software Corporation participates. |
** | Pursuant to Rule 406T of Regulation S-T, the Interactive Data Files on Exhibit 101 hereto are deemed not filed or part of a registration statement or prospectus of Sections 11 or 12 of the Securities Act of 1933, as amended, are deemed not filed for purposes of Section 18 of the Securities and Exchange Act of 1934, as amended, and otherwise are not subject to liability under those sections. |
52
SIGNATURES
Pursuant to the requirements of Section 13 or 15(d) of the Securities Exchange Act of 1934, the registrant has duly caused this report to be signed on its behalf by the undersigned, thereunto duly authorized, on the 30th day of March, 2018.
PROGRESS SOFTWARE CORPORATION
By: /s/ Yogesh Gupta
Yogesh Gupta
President and Chief Executive Officer
53
APPENDIX A
RECONCILIATIONS OF GAAP TO NON-GAAP SELECTED FINANCIAL MEASURES
(Unaudited)
Fiscal Year Ended | % Change | |||||||||||||||
(In thousands, except per share data) | November 30, 2017 | November 30, 2016 | Non-GAAP | |||||||||||||
Adjusted revenue: | ||||||||||||||||
GAAP revenue | $ | 397,572 | $ | 405,341 | ||||||||||||
Acquisition-related revenue (1) | 1,015 | 2,014 | ||||||||||||||
Non-GAAP revenue | $ | 398,587 | 100 | % | $ | 407,355 | 100 | % | (2 | )% | ||||||
Adjusted gross margin: | ||||||||||||||||
GAAP gross margin | $ | 328,413 | 83 | % | $ | 339,629 | 84 | % | ||||||||
Amortization of acquired intangibles | 20,108 | 5 | 15,496 | 4 | ||||||||||||
Stock-based compensation (2) | 1,016 | — | 899 | — | ||||||||||||
Acquisition-related revenue (1) | 1,015 | — | 2,014 | — | ||||||||||||
Non-GAAP gross margin | $ | 350,552 | 88 | % | $ | 358,038 | 88 | % | (2 | )% | ||||||
Adjusted operating expenses: | ||||||||||||||||
GAAP operating expenses | $ | 257,799 | 65 | % | $ | 369,338 | 91 | % | ||||||||
Amortization/impairment of acquired intangibles | (13,039 | ) | (3 | ) | (17,786 | ) | (4 | ) | ||||||||
Impairment of goodwill | — | — | (92,000 | ) | (23 | ) | ||||||||||
Fees related to shareholder activist | (2,020 | ) | (1 | ) | — | — | ||||||||||
Restructuring expenses and other | (22,046 | ) | (6 | ) | (1,692 | ) | (1 | ) | ||||||||
Acquisition-related expenses | (1,458 | ) | — | (1,240 | ) | — | ||||||||||
Stock-based compensation (2) | (13,137 | ) | (3 | ) | (21,642 | ) | (5 | ) | ||||||||
Non-GAAP operating expenses | $ | 206,099 | 52 | % | $ | 234,978 | 58 | % | (12 | )% | ||||||
Adjusted income (loss) from operations: | ||||||||||||||||
GAAP operating (loss) | $ | 70,614 | 18 | % | $ | (29,709 | ) | (7 | )% | |||||||
Amortization/impairment of acquired intangibles | 33,147 | 8 | 33,282 | 8 | ||||||||||||
Impairment of goodwill | — | — | 92,000 | 23 | ||||||||||||
Fees related to shareholder activist | 2,020 | — | — | — | ||||||||||||
Restructuring expenses and other | 22,046 | 5 | 1,692 | — | ||||||||||||
Stock-based compensation (2) | 14,153 | 4 | 22,541 | 5 | ||||||||||||
Acquisition-related | 2,473 | 1 | 3,254 | 1 | ||||||||||||
Non-GAAP income from operations | $ | 144,453 | 36 | % | $ | 123,060 | 30 | % | 17 | % | ||||||
Adjusted diluted earnings per share: | ||||||||||||||||
GAAP diluted earnings (loss) per share | $ | 0.77 | $ | (1.13 | ) | |||||||||||
Amortization/impairment of acquired intangibles | 0.68 | 0.67 | ||||||||||||||
Impairment of goodwill | — | 1.85 | ||||||||||||||
Fees related to shareholder activist | 0.04 | — | ||||||||||||||
Restructuring expenses and other | 0.46 | 0.03 | ||||||||||||||
Stock-based compensation (2) | 0.29 | 0.45 | ||||||||||||||
Acquisition-related | 0.05 | 0.07 | ||||||||||||||
Provision for income taxes | (0.38 | ) | (0.29 | ) | ||||||||||||
Non-GAAP diluted earnings per share | $ | 1.91 | $ | 1.65 | 16 | % | ||||||||||
Non-GAAP weighted avg shares o/s - diluted | 48,516 | 50,039 | (3 | )% | ||||||||||||
(1) Acquisition-related revenue constitutes revenue reflected as pre-acquisition deferred revenue that would otherwise have been recognized but for the purchase accounting treatment of acquisitions. Since GAAP accounting requires the elimination of this revenue, GAAP results alone do not fully capture all of our economic activities. Note that acquisition-related revenue adjustments relate to Progress' OpenEdge and Application Development and Deployment business segments for Kinvey and Telerik, respectively. | ||||||||||||||||
(2) Stock-based compensation is included in the GAAP statements of income, as follows: | ||||||||||||||||
Cost of revenue | $ | 1,016 | $ | 899 | ||||||||||||
Operating expenses | 13,137 | 21,642 | ||||||||||||||
Total | $ | 14,153 | $ | 22,541 | ||||||||||||
54
RECONCILIATIONS OF GAAP TO NON-GAAP SELECTED FINANCIAL MEASURES
(Unaudited)
Adjusted Free Cash Flow | ||||||||||
(In thousands) | FY 2017 | FY 2016 | % Change | |||||||
Cash flows from operations | $ | 105,686 | $ | 102,845 | 3 | % | ||||
Purchases of property and equipment | (3,377 | ) | (5,786 | ) | (42 | ) | ||||
Free cash flow | 102,309 | 97,059 | 5 | |||||||
Add back: restructuring payments | 19,234 | 3,539 | 443 | |||||||
Adjusted free cash flow | $ | 121,543 | $ | 100,598 | 21 | % | ||||
55