Attached files
| file | filename |
|---|---|
| EX-32 - EXHIBIT 32 - GUARANTY FEDERAL BANCSHARES INC | ex_108918.htm |
| EX-31.I2 - EXHIBIT 31.(I)2 - GUARANTY FEDERAL BANCSHARES INC | ex_108917.htm |
| EX-31.I1 - EXHIBIT 31.(I)1 - GUARANTY FEDERAL BANCSHARES INC | ex_108916.htm |
| EX-23 - EXHIBIT 23 - GUARANTY FEDERAL BANCSHARES INC | ex_108915.htm |
UNITED STATES
SECURITIES AND EXCHANGE COMMISSION
Washington, D.C. 20549
FORM 10-K
ANNUAL REPORT PURSUANT TO SECTION 13 OR 15(d) OF THE SECURITIES EXCHANGE ACT OF 1934
For the fiscal year ended December 31, 2017
Commission File Number: 0-23325

Guaranty Federal Bancshares, Inc.
(Exact name of registrant as specified in its charter)
|
Delaware |
43-1792717 |
|
(State or Other Jurisdiction of Incorporation |
(I.R.S. Employer Identification No.) |
|
or Organization) |
|
2144 E Republic Rd, Suite F200, Springfield, Missouri |
65804 |
|
(Address of Principal Executive Offices) |
(Zip Code) |
Registrant's telephone number, including area code: (417) 520-4333
Securities registered pursuant to Section 12(b) of the Act:
| Title of Class | Exchange on which Registered | |
| Common Stock, par value $.10 per share | NASDAQ Global Market |
Securities registered pursuant to Section 12(g) of the Act: None
Indicate by check mark if the registrant is a well-known seasoned issuer, as defined in Rule 405 of the Securities Act. Yes No X
Indicate by check mark if the registrant is not required to file reports pursuant to Section 13 or Section 15(d) of the Exchange Act. Yes No X
Indicate by check mark whether the registrant: (1) has filed all reports required to be filed by Section 13 or 15(d) of the Securities Exchange Act of 1934 during the preceding 12 months (or for such shorter period that the registrant was required to file such reports), and (2) has been subject to such filing requirements for the past 90 days. Yes X No
Indicate by check mark whether the registrant has submitted electronically and posted on its corporate Web site, if any, every Interactive Data File required to be submitted and posted pursuant to Rule 405 of Regulation S-T (§232.405 of this chapter) during the preceding 12 months (or for such shorter period that the registrant was required to submit and post such files). Yes X No
Indicate by check mark if disclosure of delinquent filers pursuant to Item 405 of Regulation S-K is not contained herein, and will not be contained, to the best of registrant's knowledge, in definitive proxy or information statements incorporated by reference in Part III of this Form 10-K or any amendment to this Form 10-K. [X]
Indicate by check mark whether the registrant is a large accelerated filer, an accelerated filer, a non-accelerated filer, a smaller reporting company, or an emerging growth company. See the definitions of “large accelerated filer”, “accelerated filer”, “smaller reporting company” and “emerging growth company” in Rule 12b-2 of the Exchange Act.
|
Large accelerated file |
Accelerated filer |
Non-accelerated filer |
|
Smaller reporting company X |
Emerging growth company |
If an emerging growth company, indicate by check mark if the registrant has elected not to use the extended transition period for complying with any new or revised financial accounting standards provided pursuant to Section 13(a) of the Exchange Act. ____
Indicate by check mark whether the registrant is a shell company (as defined in Rule 12b-2 of the Exchange Act). Yes ____ No X
The aggregate market value of the voting and non-voting common stock held by non-affiliates of the registrant, based on the average bid and asked prices of the registrant's Common Stock as quoted on the Global Market of The NASDAQ Stock Market on June 30, 2017 (the last business day of the registrant’s most recently completed second quarter) was $63.9 million. As of March 23, 2018 there were 4,439,757 shares of the registrant's Common Stock outstanding.
DOCUMENTS INCORPORATED BY REFERENCE
Portions of the Proxy Statement for the Annual Meeting of Stockholders (the “Proxy Statement”) to be held on May 23, 2018 (Part III).
|
GUARANTY FEDERAL BANCSHARES, INC. |
||||
|
Form 10-K |
||||
|
TABLE OF CONTENTS |
||||
|
Item |
Page |
|||
|
PART I |
||||
|
1 |
Business |
4 |
||
|
1A |
Risk Factors |
30 |
||
|
1B |
Unresolved Staff Comments |
42 |
||
|
2 |
Properties |
42 |
||
|
3 |
Legal Proceedings |
43 |
||
|
4 |
Mine Safety Disclosures |
43 |
||
|
PART II |
||||
| 5 |
Market for Registrant's Common Equity, Related Stockholder Matters and Issuer Purchases of Equity Securities |
44 |
||
|
6 |
Selected Financial Data |
46 |
||
| 7 |
Management's Discussion and Analysis of Financial Condition and Results of Operations |
47 |
||
|
7A |
Quantitative and Qualitative Disclosures About Market Risk |
59 |
||
|
8 |
Financial Statements and Supplementary Data |
61 |
||
| 9 |
Changes in and Disagreements with Accountants on Accounting and Financial Disclosure |
107 |
||
|
9A |
Controls and Procedures |
107 |
||
|
9B |
Other Information |
108 |
||
|
PART III |
||||
|
10 |
Directors, Executive Officers and Corporate Governance |
109 |
||
|
11 |
Executive Compensation |
109 |
||
| 12 |
Security Ownership of Certain Beneficial Owners and Management and Related Stockholder Matters |
109 |
||
| 13 |
Certain Relationships and Related Transactions, and Director Independence |
110 |
||
|
14 |
Principal Accounting Fees and Services |
110 |
||
|
PART IV |
||||
|
15 |
Exhibits and Financial Statement Schedules |
110 |
||
|
16 |
Form 10-K Summary |
114 |
||
|
Signatures |
||||
PART I
Item 1. Business
Guaranty Federal Bancshares, Inc.
Guaranty Federal Bancshares, Inc. (hereinafter referred to as “we,” “us,” “our,” or the “Company”) is a Delaware-chartered corporation that was formed in September 1997. The Company became a unitary savings and loan holding company for Guaranty Federal Savings Bank, a federal savings bank (the "Bank") on December 30, 1997, in connection with a plan of conversion and reorganization involving the Bank and its then existing mutual holding company. The mutual holding company structure had been created in April 1995 at which time more than a majority of the shares of the Bank were issued to the mutual holding company and the remaining shares were sold in a public offering. In connection with the conversion and reorganization on December 30, 1997, the shares of the Bank held by the mutual holding company were extinguished along with the mutual holding company, and the shares of the Bank held by the public were exchanged for shares of the Company. All of the shares of the Bank which remained outstanding after the conversion are owned by the Company.
On June 27, 2003, the Bank converted from a federal savings bank to a state-chartered trust company with banking powers in Missouri, and the Company became a bank holding company. On this date, the name of the Bank was changed from Guaranty Federal Savings Bank to Guaranty Bank. The primary activity of the Company is to oversee its investment in the Bank. The Company engages in few other activities. For this reason, unless otherwise specified, references to the Company include operations of the Bank. Further, information in a chart or table based on Bank only data is identical to or immaterially different from information that would be provided on a consolidated basis. In addition to the Bank, the Company owns Guaranty Statutory Trust I and Guaranty Statutory Trust II, both Delaware statutory trusts.
At December 31, 2017, the Company’s consolidated assets were $794.5 million, net loans were $631.5 million, deposits were $607.4 million and total stockholders’ equity was $74.9 million. See Item 6 “Selected Financial Data” for further details regarding the Company’s financial position and results of operations for the previous five fiscal years.
Guaranty Bank
The Bank's principal business has been, and continues to be, attracting retail deposits from the general public and investing those deposits, together with funds generated from operations, in commercial real estate loans, multi-family residential mortgage loans, construction loans, permanent one- to four-family residential mortgage loans, business, consumer and other loans. The Bank also invests in mortgage-backed securities, U.S. Government and federal agency securities and other marketable securities. The Bank's revenues are derived principally from interest on its loans and other investments and fees charged for services provided, and gains generated from sales of loans and investment securities, and the Bank’s results of operations are primarily dependent on net interest margin, which is the difference between interest income on interest-earning assets and interest expense on interest-bearing liabilities. The Bank's primary sources of funds are: deposits; borrowings; amortization and prepayments of loan principal; and amortizations, prepayments and maturities of investment securities.
The Bank is regulated by the Missouri Division of Finance (“MDF”) and its deposits are insured by the Deposit Insurance Fund of the Federal Deposit Insurance Corporation (the "FDIC"). See discussion under section captioned “Supervision and Regulation” in this Item 1. The Bank is a member of the FHLB of Des Moines, which is one of 11 regional Federal Home Loan Banks (“FHLB”).
Internet Website
The Company’s internet website address is www.gbankmo.com. The information contained on that website is not included as part of, or incorporated by reference into, this Annual Report on Form 10-K. The Company makes available through its website its Annual Report on Form 10-K, Quarterly Reports on Form 10-Q and Current Reports on Form 8-K and any amendments to these reports as soon as reasonably practicable after they are electronically filed or furnished to the Securities and Exchange Commission. These materials are also available free of charge (other than a user's regular internet access charges) on the Securities and Exchange Commission's website at www.sec.gov.
Market Area
The Bank's primary market areas are Greene, Christian and Jasper Counties, which are in the southwestern corner of Missouri and includes the cities of Springfield, Nixa, Ozark and Joplin, Missouri (our “Market Area”). The major components of the Market Area’s economy are service industries, education, retail, light manufacturing and health care. There is a significant regional health care presence with three large regional hospitals. There also are four accredited colleges and two major universities. Part of the area’s growth can be attributed to its proximity to Branson, Missouri, which has developed a strong tourism industry related to country music and entertainment. Branson is located 30 miles south of Springfield, and attracts between five and six million tourists each year, many of whom pass through Springfield. The Bank also has one Loan Production Office in Webster County, Missouri.
Lending Activities
Like many commercial banks in our market, our loan portfolio is comprised of different types of industries. However, real estate lending is a significant portion of our business and accounted for more than 81% of our loan portfolio by value as of December 31, 2017. Set forth below is selected data relating to the composition of the Bank’s loan portfolio at the dates indicated:
|
As of December 31, |
||||||||||||||||||||||||||||||||||||||||
|
2017 |
2016 |
2015 |
2014 |
2013 |
||||||||||||||||||||||||||||||||||||
|
$ |
% |
$ |
% |
$ |
% |
$ |
% |
$ |
% |
|||||||||||||||||||||||||||||||
|
(Dollars in Thousands) |
||||||||||||||||||||||||||||||||||||||||
|
Mortgage loans (includes loans held for sale): |
||||||||||||||||||||||||||||||||||||||||
|
One to four family |
$ | 108,223 | 17 | % | $ | 108,594 | 20 | % | $ | 100,160 | 20 | % | $ | 99,116 | 20 | % | $ | 94,422 | 20 | % | ||||||||||||||||||||
|
Multi-family |
85,225 | 13 | % | 48,483 | 9 | % | 41,604 | 8 | % | 33,786 | 7 | % | 46,188 | 10 | % | |||||||||||||||||||||||||
|
Construction |
64,744 | 10 | % | 40,912 | 7 | % | 45,463 | 9 | % | 36,785 | 7 | % | 43,266 | 9 | % | |||||||||||||||||||||||||
|
Commercial real estate |
261,866 | 41 | % | 249,581 | 46 | % | 208,824 | 42 | % | 215,605 | 44 | % | 179,079 | 38 | % | |||||||||||||||||||||||||
|
Total mortgage loans |
520,058 | 81 | % | 447,570 | 82 | % | 396,051 | 79 | % | 385,292 | 78 | % | 362,955 | 77 | % | |||||||||||||||||||||||||
|
Commercial business loans |
94,523 | 15 | % | 75,405 | 14 | % | 81,007 | 16 | % | 92,114 | 19 | % | 92,722 | 20 | % | |||||||||||||||||||||||||
|
Consumer loans |
24,716 | 4 | % | 23,606 | 4 | % | 21,992 | 4 | % | 17,246 | 3 | % | 17,303 | 4 | % | |||||||||||||||||||||||||
|
Total consumer and other loans |
119,239 | 19 | % | 99,011 | 18 | % | 102,999 | 21 | % | 109,360 | 22 | % | 110,025 | 23 | % | |||||||||||||||||||||||||
|
Total loans |
639,297 | 100 | % | 546,581 | 100 | % | 499,050 | 100 | % | 494,652 | 100 | % | 472,980 | 100 | % | |||||||||||||||||||||||||
|
Less: |
||||||||||||||||||||||||||||||||||||||||
|
Deferred loan fees/costs, net |
663 | 382 | 333 | 262 | 175 | |||||||||||||||||||||||||||||||||||
|
Allowance for loan losses |
7,107 | 5,742 | 5,812 | 6,589 | 7,802 | |||||||||||||||||||||||||||||||||||
|
Total Loans, net |
$ | 631,527 | $ | 540,457 | $ | 492,905 | $ | 487,801 | $ | 465,003 | ||||||||||||||||||||||||||||||
The following table sets forth the maturity of the Bank's loan portfolio as of December 31, 2017. The table shows loans that have adjustable rates as due in the period during which they contractually mature. The table does not include prepayments or scheduled principal amortization.
|
Loan Maturities |
Due in One Year or Less |
Due After One Through Five Years |
Due After Five Years |
Total |
||||||||||||
|
(Dollars in thousands) |
||||||||||||||||
|
One to four family |
$ | 16,943 | $ | 43,879 | $ | 47,401 | $ | 108,223 | ||||||||
|
Multi-family |
8,110 | 45,243 | 31,872 | 85,225 | ||||||||||||
|
Construction |
32,108 | 22,968 | 9,668 | 64,744 | ||||||||||||
|
Commercial real estate |
26,674 | 161,579 | 73,613 | 261,866 | ||||||||||||
|
Commercial loans |
38,963 | 40,305 | 15,255 | 94,523 | ||||||||||||
|
Consumer loans |
9,345 | 6,057 | 9,314 | 24,716 | ||||||||||||
|
Total loans (1) |
$ | 132,143 | $ | 320,031 | $ | 187,123 | $ | 639,297 | ||||||||
|
Less: |
||||||||||||||||
|
Deferred loan fees/costs |
663 | |||||||||||||||
|
Allowance for loan losses |
7,107 | |||||||||||||||
|
Loans receivable net |
$ | 631,527 | ||||||||||||||
|
(1) Includes mortgage loans held for sale of $1,922 |
The following table sets forth the dollar amount, before deductions for unearned discounts, deferred loan fees/costs and allowance for loan losses, as of December 31, 2017 of all loans due after December 2018, which have pre-determined interest rates and which have adjustable interest rates.
|
Fixed Rates |
Adjustable Rates |
Total |
% Adjustable |
|||||||||||||
|
(Dollars in Thousands) |
||||||||||||||||
|
One to four family |
$ | 54,764 | $ | 36,516 | $ | 91,280 | 40 | % | ||||||||
|
Multi-family |
58,125 | 18,990 | 77,115 | 25 | % | |||||||||||
|
Construction |
14,099 | 18,537 | 32,636 | 57 | % | |||||||||||
|
Commercial real estate |
144,776 | 90,416 | 235,192 | 38 | % | |||||||||||
|
Commercial loans |
31,880 | 23,680 | 55,560 | 43 | % | |||||||||||
|
Consumer loans |
4,251 | 11,120 | 15,371 | 72 | % | |||||||||||
|
Total loans (1) |
$ | 307,895 | $ | 199,259 | $ | 507,154 | 39 | % | ||||||||
|
(1) Before deductions for unearned discounts, deferred loan fees/costs and allowances for loan losses. |
Commercial Real Estate Loans. As of December 31, 2017, the Bank had commercial real estate loans totaling $261.9 million or 41% of the Bank's total loan portfolio. Commercial real estate loans are generally originated in amounts up to 80% of the appraised value of the mortgaged property. The majority of the Bank’s commercial real estate loans have been originated with adjustable rates of interest, the majority of which are quoted at a spread to the Wall Street Prime rate for the initial fixed rate period with subsequent adjustments at a spread to the Wall Street Prime rate. The Bank's commercial real estate loans are generally permanent loans secured by improved property such as office buildings, retail stores, small shopping centers, medical offices, motels, churches and other non-residential buildings.
To originate commercial real estate loans, the Bank generally requires a mortgage and security interest in the subject real estate, personal guarantees of the principals, a security interest in the related personal property, and a standby assignment of rents and leases. The Bank has established its loan-to-one borrower limitation, which was $24.2 million as of December 31, 2017, as its maximum commercial real estate loan amount.
Loans secured by commercial real estate are generally larger and involve a greater degree of risk than residential mortgage loans. Because payments on loans secured by commercial real estate are often dependent on successful operation or management of the properties, repayment of such loans may be subject, to a greater extent, to adverse conditions in the real estate market or the economy. The Bank seeks to minimize these risks by careful underwriting, requiring personal guarantees, lending only to established customers and borrowers otherwise known by the Bank, and generally restricting such loans to its primary Market Area.
As of December 31, 2017, the Bank’s commercial real estate loan portfolio included approximately $7.8 million, or 1.2% in loans to develop land into residential lots. The Bank utilizes its knowledge of the local market conditions and appraisals to evaluate the development cost and estimate projected lot prices and absorption rates to assess loans on residential subdivisions. The Bank typically loans up to 75% of the appraised value over terms up to two years. Development loans generally involve a greater degree of risk than residential mortgage loans because (1) the funds are advanced upon the security of the land which has a materially lower value prior to completion of the infrastructure required of a subdivision, (2) the cash flow available for debt repayment is a function of the sale of the individual lots, and (3) the amount of interest required to service the debt is a function of the time required to complete the development and sell the lots.
Commercial Business Loans. As of December 31, 2017, the Bank had commercial business loans totaling $94.5 million or 15% of the Bank's total loan portfolio. Commercial business loans are generally secured by business assets, such as accounts receivable, equipment and inventory. Unlike residential mortgage loans, which generally are made on the basis of the borrower's ability to make repayment from his or her employment and other income and which are secured by real property whose value tends to be more easily ascertainable, commercial business loans are of higher risk and typically are made on the basis of the borrower's ability to make repayment from the cash flow of the borrower's business. As a result, the availability of funds for the repayment of commercial business loans may be substantially dependent on the success of the business itself. Further, the collateral securing the loans may depreciate over time, may be difficult to appraise and may fluctuate in value based on the success of the business. The Bank expects to continue to expand its commercial business lending as opportunities present themselves.
One- to Four-Family Mortgage Loans. The Bank offers fixed- and adjustable-rate (“ARM”) first mortgage loans secured by one- to four-family residences in the Bank's primary lending area. Typically, such residences are single family homes that serve as the primary residence of the owner. However, there are a number of loans originated by the Bank which are secured by non-owner occupied properties. Loan originations are generally obtained from existing or past customers, members of the local community, attorney referrals, established builders and realtors within our Market Area. Originated mortgage loans in the Bank's portfolio include due-on-sale clauses which provide the Bank with the contractual right to deem the loan immediately due and payable in the event that the borrower transfers ownership of the property without the Bank's consent.
As of December 31, 2017, $108.2 million or 17% of the Bank’s total loan portfolio consisted of one- to four-family residential loans. The Bank currently offers ARM and balloon loans that have fixed interest rate periods of one to seven years. Generally, ARM loans provide for limits on the maximum interest rate adjustment ("caps") that can be made at the end of each applicable period and throughout the duration of the loan. ARM loans are originated for a term of up to 30 years on owner-occupied properties and generally up to 25 years on non-owner occupied properties. Typically, interest rate adjustments are calculated based on U.S. treasury securities adjusted to a constant maturity of one year (CMT), plus a 2.50% to 2.75% margin. Interest rates charged on fixed-rate loans are competitively priced based on market conditions and the cost of funds existing at the time the loan is committed. The Bank's fixed-rate mortgage loans are made for terms of 15 to 30 years which are currently being sold on the secondary market.
Generally, ARM loans pose credit risks different from the risks inherent in fixed-rate loans, primarily because as interest rates rise, the underlying payments of the borrower rise, thereby increasing the potential for default. At the same time, the marketability of the underlying property may be adversely affected by higher interest rates. The Bank does not originate ARM loans that provide for negative amortization.
The Bank generally originates both owner occupied and non-owner occupied one- to four-family residential mortgage loans in amounts up to 80% of the appraised value or the selling price of the mortgaged property, whichever is lower. The Bank on occasion may make loans up to 95% of appraised value or the selling price of the mortgage property, whichever is lower. However, the Bank typically requires private mortgage insurance for the excess amount over 80% for mortgage loans with loan to value percentages greater than 80%.
Multi-Family Mortgage Loans. The Bank originates multi-family mortgage loans in its primary lending area. As of December 31, 2017, $85.2 million or 13% of the Bank's total loan portfolio consisted of multi-family residential real estate loans. With regard to multi-family mortgage loans, the Bank generally requires personal guarantees of the principals as well as a security interest in the real estate. Multi-family mortgage loans are generally originated in amounts of up to 80% of the appraised value of the property. A portion of the Bank’s multi-family mortgage loans have been originated with adjustable rates of interest which are quoted at a spread to the FHLB advance rate for the initial fixed rate period with subsequent adjustments based on the Wall Street prime rate. The loan-to-one-borrower limitation, $24.2 million as of December 31, 2017, is the maximum the Bank will lend on a multi-family residential real estate loan.
Loans secured by multi-family residential real estate generally involve a greater degree of credit risk than one- to four-family residential mortgage loans and carry larger loan balances. This increased credit risk is a result of several factors, including the concentration of principal in a limited number of loans and borrowers, the effects of general economic conditions on income producing properties, and the increased difficulty of evaluating and monitoring these types of loans. Furthermore, the repayment of loans secured by multi-family residential real estate is typically dependent upon the successful operation of the related real estate property. If the cash flow from the project is reduced, the borrower's ability to repay the loan may be impaired.
Construction Loans. As of December 31, 2017, construction loans totaled $64.7 million or 10% of the Bank's total loan portfolio. Construction loans originated by the Bank are generally secured by permanent mortgage loans for the construction of owner-occupied residential real estate or to finance speculative construction secured by residential real estate or owner-operated commercial real estate. This portion of the Bank’s loan portfolio consists of speculative loans, i.e., loans to builders who are speculating that they will be able to locate a purchaser for the underlying property prior to or shortly after the time construction has been completed.
Construction loans are made to contractors who have sufficient financial strength and a proven track record, for the purpose of resale, as well as on a "pre-sold" basis. Construction loans made for the purpose of resale generally provide for interest only payments at floating rates and have terms of six months to fifteen months. Construction loans for speculative purposes, models, and commercial properties typically have loan to value ratios of up to 80%. Loan proceeds are disbursed in increments as construction progresses and as inspections warrant.
Construction lending by its nature entails significant additional risks as compared with one-to four-family mortgage lending, attributable primarily to the fact that funds are advanced upon the security of the project under construction prior to its completion. As a result, construction lending often involves the disbursement of substantial funds with repayment dependent on the success of the ultimate project and the ability of the borrower or guarantor to repay the loan. Because of these factors, the analysis of the prospective construction loan projects requires an expertise that is different in significant respects from that which is required for residential mortgage lending. The Bank attempts to address these risks through its underwriting and construction monitoring procedures.
Consumer and Other Loans. The Bank also offers consumer loans, primarily consisting of loans secured by certificates of deposit, automobiles, boats and home equity loans. As of December 31, 2017, the Bank has such loans totaling $24.7 million or 4% of the Bank’s total loan portfolio. The Bank expects to continue to expand its consumer lending as opportunities present themselves.
Director and Insider loans. Management believes that loans to Directors and Officers are prudent and within the normal course of business. These loans reflect normal credit terms and represent no more collection risk than any other loan in the portfolio.
Delinquencies, Non-Performing and Problem Assets.
Delinquent Loans. As of December 31, 2017, the Bank has eleven loans 90 days or more past due with a principal balance of $3,083,305 and 19 loans between 30 and 89 days past due with an aggregate principal balance of $2,685,988. The Bank generally does not accrue interest on loans past due more than 90 days.
The following table sets forth the Bank's loans that were accounted for on a non-accrual basis or 90 days or more delinquent at the dates indicated.
| Delinquency Summary |
As of |
|||||||||||||||||||
|
December 31, |
||||||||||||||||||||
|
2017 |
2016 |
2015 |
2014 |
2013 |
||||||||||||||||
|
(Dollars in Thousands) |
||||||||||||||||||||
|
Loans accounted for on a non-accrual basis or contractually past due 90 days or more |
||||||||||||||||||||
|
Mortgage Loans: |
||||||||||||||||||||
|
One to four family |
$ | 4,423 | $ | 2,060 | $ | 2,272 | $ | 911 | $ | 816 | ||||||||||
|
Multi-family |
- | - | - | - | - | |||||||||||||||
|
Construction |
4,452 | 5,447 | 8,080 | 2,893 | 4,530 | |||||||||||||||
|
Commercial real estate |
162 | 162 | 1,241 | 460 | 3,663 | |||||||||||||||
| 9,037 | 7,669 | 11,593 | 4,264 | 9,009 | ||||||||||||||||
|
Non-mortgage loans: |
||||||||||||||||||||
|
Commercial loans |
803 | 925 | 2,149 | 1,027 | 6,776 | |||||||||||||||
|
Consumer and other loans |
122 | 38 | 13 | - | 63 | |||||||||||||||
| 925 | 963 | 2,162 | 1,027 | 6,839 | ||||||||||||||||
|
Total non-accrual loans |
9,962 | 8,632 | 13,755 | 5,291 | 15,848 | |||||||||||||||
|
Accruing loans which are contractually past maturity or past due 90 days or more: |
||||||||||||||||||||
|
Mortgage Loans: |
||||||||||||||||||||
|
One to four family |
- | - | - | - | - | |||||||||||||||
|
Multi-family |
- | - | - | - | - | |||||||||||||||
|
Construction |
- | - | - | - | - | |||||||||||||||
|
Commercial real estate |
- | - | - | - | - | |||||||||||||||
| - | - | - | - | - | ||||||||||||||||
|
Non-mortgage loans: |
||||||||||||||||||||
|
Commercial loans |
- | - | - | - | - | |||||||||||||||
|
Consumer and other loans |
- | - | - | - | - | |||||||||||||||
| - | - | - | - | - | ||||||||||||||||
|
Total past maturity or past due accruing loans |
- | - | - | - | - | |||||||||||||||
|
Total accounted for on a non-accrual basis or contractually past maturity or 90 days or more past due |
$ | 9,962 | $ | 8,632 | $ | 13,755 | $ | 5,291 | $ | 15,848 | ||||||||||
|
Total accounted for on a non-accrual basis or contractually past maturity or 90 days or more past due as a percentage of net loans |
1.58 | % | 1.60 | % | 2.79 | % | 1.08 | % | 3.41 | % | ||||||||||
|
Total accounted for on a non-accrual basis or contractually past maturity or 90 days or more past due as a percentage of total assets |
1.24 | % | 1.25 | % | 2.11 | % | 0.84 | % | 2.56 | % | ||||||||||
Non-Performing Assets. Loans are reviewed on a regular basis and are placed on non-accrual status when, in the opinion of management, the collection of all interest at contractual rates becomes doubtful. As part of such review, mortgage loans are placed on non-accrual status generally when either principal or interest is more than 90 days past due, or when other circumstances indicate the collection of principal or interest is in doubt. Interest accrued and unpaid at the time a loan is placed on non-accrual status is charged against interest income.
Real estate acquired by the Bank as a result of foreclosure or by deed in lieu of foreclosure is deemed a foreclosed asset held for sale until such time as it is sold. When a foreclosed asset held for sale is acquired it is recorded at its estimated fair value, less estimated selling expenses. Valuations of such foreclosed assets are periodically performed by management, and any subsequent decline in estimated fair value is charged to operations.
The following table shows the principal amount of non-performing assets (i.e. loans that are not performing under regulatory guidelines) and all foreclosed assets, including assets acquired in settlement of loans and the resulting impact on interest income for the periods then ended.
|
Non-Performing Assets |
As of |
|||||||||||||||||||
|
December 31, |
||||||||||||||||||||
|
2017 |
2016 |
2015 |
2014 |
2013 |
||||||||||||||||
|
|
(Dollars in Thousands) |
|||||||||||||||||||
| Non-accrual loans: | ||||||||||||||||||||
|
Mortgage loans: |
||||||||||||||||||||
|
One to four family |
$ | 4,423 | $ | 2,060 | $ | 2,272 | $ | 911 | $ | 816 | ||||||||||
|
Multi-family |
- | - | - | - | - | |||||||||||||||
|
Construction |
4,452 | 5,447 | 8,080 | 2,893 | 4,530 | |||||||||||||||
|
Commercial real estate |
162 | 162 | 1,241 | 460 | 3,663 | |||||||||||||||
| 9,037 | 7,669 | 11,593 | 4,264 | 9,009 | ||||||||||||||||
|
Non-mortgage loans: |
||||||||||||||||||||
|
Commercial loans |
803 | 925 | 2,149 | 1,027 | 6,776 | |||||||||||||||
|
Consumer and other loans |
122 | 38 | 13 | - | 63 | |||||||||||||||
| 925 | 963 | 2,162 | 1,027 | 6,839 | ||||||||||||||||
|
Total non-accrual loans |
9,962 | 8,632 | 13,755 | 5,291 | 15,848 | |||||||||||||||
|
Real estate and other assets acquired in settlement of loans |
283 | 2,682 | 2,392 | 3,165 | 3,822 | |||||||||||||||
|
Total non-performing assets |
$ | 10,245 | $ | 11,314 | $ | 16,147 | $ | 8,456 | $ | 19,670 | ||||||||||
|
Total non-accrual loans as a percentage of net loans |
1.58 | % | 1.60 | % | 2.79 | % | 1.08 | % | 3.41 | % | ||||||||||
|
Total non-performing assets as a percentage of total assets |
1.28 | % | 1.64 | % | 2.47 | % | 1.35 | % | 3.17 | % | ||||||||||
|
Impact on interest income for the period: |
||||||||||||||||||||
|
Interest income that would have been recorded on non-accruing loans |
$ | 95 | $ | 90 | $ | 573 | $ | 337 | $ | 572 | ||||||||||
Problem Assets. Federal regulations require that the Bank review and classify its assets on a regular basis to determine those assets considered to be of lesser quality. In addition, in connection with examinations of insured institutions, bank examiners have authority to identify problem assets and, if appropriate, require them to be classified. There are three classifications for problem assets: substandard, doubtful, and loss. "Substandard assets" must have one or more defined weaknesses and are characterized by the distinct possibility that the insured institution will sustain some loss if the deficiencies are not corrected. "Doubtful assets" have the weaknesses of substandard assets with the additional characteristic that the weaknesses make collection or liquidation in full on the basis of currently existing facts, conditions, and values highly questionable, and improbable. An asset classified "loss" is considered uncollectible and of such little value that continuance as an asset of the institution is not warranted. The regulations have also created a “special mention” category, described as assets which do not currently expose an insured institution to a sufficient degree of risk to warrant classification but do possess credit deficiencies or potential weaknesses deserving management's close attention. Federal regulations require the Bank to establish general allowances for loan losses from assets classified as substandard or doubtful. If an asset or portion thereof is classified as loss, the insured institution must either establish specific allowances for loan losses in the amount of 100% of the portion of the asset classified loss or charge off such amount. A portion of general loss allowances established to cover possible losses related to assets classified substandard or doubtful may be included in determining an institution's regulatory capital.
For management purposes, the Bank also designates certain loans for additional attention. Such loans are called “Special Mention” and have identified weaknesses, that if the situation deteriorates, the loans would merit a substandard classification.
The following table shows the aggregate amounts of the Bank's classified assets as of December 31, 2017.
|
Special Mention |
Substandard |
Doubtful |
Total |
|||||||||||||||||||||||||||||
|
Number |
Amount |
Number |
Amount |
Number |
Amount |
Number |
Amount |
|||||||||||||||||||||||||
|
(Dollars in Thousands) |
||||||||||||||||||||||||||||||||
|
Loans: |
||||||||||||||||||||||||||||||||
|
One to four family |
6 | $ | 3,799 | 41 | $ | 5,779 | - | $ | - | 47 | $ | 9,578 | ||||||||||||||||||||
|
Multi-family |
- | - | 1 | 775 | - | - | 1 | 775 | ||||||||||||||||||||||||
|
Construction |
- | - | 5 | 4,453 | - | - | 5 | 4,453 | ||||||||||||||||||||||||
|
Commercial real estate |
2 | 5,578 | 9 | 1,630 | - | - | 11 | 7,208 | ||||||||||||||||||||||||
|
Commercial |
1 | 200 | 12 | 708 | 2 | 513 | 15 | 1,421 | ||||||||||||||||||||||||
|
Consumer and Other |
- | - | 3 | 276 | - | - | 3 | 276 | ||||||||||||||||||||||||
|
Total loans |
9 | 9,577 | 71 | 13,621 | 2 | 513 | 82 | 23,711 | ||||||||||||||||||||||||
|
Foreclosed assets held-for-sale: |
||||||||||||||||||||||||||||||||
|
One to four family |
- | - | - | - | - | - | - | - | ||||||||||||||||||||||||
|
Land and other assets |
- | - | 2 | 283 | - | - | 2 | 283 | ||||||||||||||||||||||||
|
Total foreclosed assets |
- | - | 2 | 283 | - | - | 2 | 283 | ||||||||||||||||||||||||
|
Total |
9 | $ | 9,577 | 73 | $ | 13,904 | 2 | $ | 513 | 84 | $ | 23,994 | ||||||||||||||||||||
Allowance for Loan Losses and Provision for Loan Losses
The allowance for loan losses is established through a provision for loan losses based on management's evaluation of the risk inherent in its loan portfolio and the general economy. Such evaluation, which includes a review of all loans on which full collectability may not be reasonably assured, considers among other matters, the estimated fair value of the underlying collateral, economic conditions, historical loan loss experience, and other factors that warrant recognition in providing for an adequate loan loss allowance. In addition, various regulatory agencies, as an integral part of their examination process, periodically review the Bank's allowance for loan losses and valuation of foreclosed assets held for sale. Such agencies may require the Bank to recognize additions to the allowance based on their judgments about information available to them at the time of their examination.
As of December 31, 2017, the Bank's total allowance for loan losses was $7.1 million or 1.12% of gross loans outstanding (excluding mortgage loans held for sale), an increase of $1,364,969 from December 31, 2016. The Bank experienced loan charge offs in excess of recoveries as management charged off specific loans that had been previously identified and classified as impaired. This allowance reflects not only management's determination to maintain an allowance for loan losses consistent with regulatory expectations for non-performing or problem assets, but also reflects the regional economy and the Bank's policy of evaluating the risks inherent in its loan portfolio.
Management records a provision for loan losses to bring the total allowance for loan losses to a level considered adequate based on the Bank’s internal analysis and methodology. During 2017, the Bank recorded a provision for loan loss expense, as shown in the table below. Management anticipates the need to continue adding to the allowance through charges to provision for loan losses as growth in the loan portfolio or other circumstances warrant.
The following tables set forth certain information concerning the Bank's allowance for loan losses for the periods indicated.
|
Allowance for Loan Losses |
Year ended |
|||||||||||||||||||
|
December 31, |
||||||||||||||||||||
|
2017 |
2016 |
2015 |
2014 |
2013 |
||||||||||||||||
|
(Dollars in Thousands) |
||||||||||||||||||||
|
Beginning balance |
$ | 5,742 | $ | 5,812 | $ | 6,589 | $ | 7,802 | $ | 8,740 | ||||||||||
|
Gross loan charge offs |
||||||||||||||||||||
|
Mortgage Loans: |
||||||||||||||||||||
|
One to four family |
(11 | ) | (47 | ) | (99 | ) | (127 | ) | (139 | ) | ||||||||||
|
Multi-family |
- | - | - | - | - | |||||||||||||||
|
Construction |
- | (1,222 | ) | (1,233 | ) | (411 | ) | (879 | ) | |||||||||||
|
Commercial real estate |
(72 | ) | (69 | ) | - | (9 | ) | (277 | ) | |||||||||||
| (83 | ) | (1,338 | ) | (1,332 | ) | (547 | ) | (1,295 | ) | |||||||||||
|
Non-mortgage loans: |
||||||||||||||||||||
|
Commercial loans |
(240 | ) | (171 | ) | - | (2,018 | ) | (1,268 | ) | |||||||||||
|
Consumer and other loans |
(213 | ) | (190 | ) | (119 | ) | (150 | ) | (164 | ) | ||||||||||
| (453 | ) | (361 | ) | (119 | ) | (2,168 | ) | (1,432 | ) | |||||||||||
|
Total charge offs |
(536 | ) | (1,699 | ) | (1,451 | ) | (2,715 | ) | (2,727 | ) | ||||||||||
|
Recoveries |
||||||||||||||||||||
|
Mortgage Loans: |
||||||||||||||||||||
|
One to four family |
19 | 34 | 20 | 9 | 23 | |||||||||||||||
|
Multi-family |
- | - | - | - | - | |||||||||||||||
|
Construction |
74 | 91 | 10 | 5 | 50 | |||||||||||||||
|
Commercial real estate |
- | 32 | - | 99 | - | |||||||||||||||
| 93 | 157 | 30 | 113 | 73 | ||||||||||||||||
|
Non-mortgage loans: |
||||||||||||||||||||
|
Commercial loans |
12 | 8 | 4 | 65 | 110 | |||||||||||||||
|
Consumer and other loans |
46 | 89 | 40 | 49 | 56 | |||||||||||||||
| 58 | 97 | 44 | 114 | 166 | ||||||||||||||||
|
Total recoveries |
151 | 254 | 74 | 227 | 239 | |||||||||||||||
|
Net loan charge-offs |
(385 | ) | (1,445 | ) | (1,377 | ) | (2,488 | ) | (2,488 | ) | ||||||||||
|
Provision charged to expense |
1,750 | 1,375 | 600 | 1,275 | 1,550 | |||||||||||||||
|
Ending balance |
$ | 7,107 | $ | 5,742 | $ | 5,812 | $ | 6,589 | $ | 7,802 | ||||||||||
|
Net charge-offs as a percentage of average loans, net |
0.06 | % | 0.28 | % | 0.27 | % | 0.53 | % | 0.53 | % | ||||||||||
|
Allowance for loan losses as a percentage of average loans, net |
1.17 | % | 1.12 | % | 1.16 | % | 1.41 | % | 1.67 | % | ||||||||||
|
Allowance for loan losses as a percentage of total non-performing loans |
71 | % | 67 | % | 42 | % | 125 | % | 49 | % | ||||||||||
Allocation of Allowance for Loan Losses
The following table shows the amount of the allowance allocated to the mortgage and non-mortgage loan categories and the respective percent of that loan category to total loans.
|
As of |
||||||||||||||||||||||||||||||||||||||||
|
December 31, |
||||||||||||||||||||||||||||||||||||||||
|
2017 |
2016 |
2015 |
2014 |
2013 |
||||||||||||||||||||||||||||||||||||
|
Amount |
% |
Amount |
% |
Amount |
% |
Amount |
% |
Amount |
% |
|||||||||||||||||||||||||||||||
|
(Dollars in thousands) |
||||||||||||||||||||||||||||||||||||||||
|
Mortgage Loans |
$ | 4,577 | 64 | % | $ | 4,126 | 72 | % | $ | 3,770 | 65 | % | $ | 4,349 | 66 | % | $ | 5,652 | 72 | % | ||||||||||||||||||||
|
Non-Mortgage Loans |
2,530 | 36 | % | 1,616 | 28 | % | 2,042 | 35 | % | 2,240 | 34 | % | 2,150 | 28 | % | |||||||||||||||||||||||||
|
Total |
$ | 7,107 | 100 | % | $ | 5,742 | 100 | % | $ | 5,812 | 100 | % | $ | 6,589 | 100 | % | $ | 7,802 | 100 | % | ||||||||||||||||||||
Investment Activities
The investment policy of the Company, which is established by the Company’s Board of Directors and reviewed by the Asset/Liability Committee of the Company’s Board of Directors, is designed primarily to provide and maintain liquidity, to generate a favorable return on investments, to help mitigate interest rate and credit risk, and to complement the Bank's lending activities. The policy currently provides for held-to-maturity and available-for-sale investment security portfolios. The Company does not currently engage in trading investment securities and does not anticipate doing so in the future. As of December 31, 2017, the Company has investment securities with an amortized cost of $82.3 million and an estimated fair value of $81.5 million. See Note 1 of the “Notes to Consolidated Financial Statements” for description of the accounting policy for investments. Based on the carrying value of these securities, $81.5 million, or 99.9%, of the Company’s investment securities portfolio are available-for-sale.
From time to time, the Company will sell a security to change its interest rate risk profile or restructure the portfolio and its cash flows. In 2017, the Company sold $20.9 million in securities and recognized $46,329 of gains.
The Company has the authority to invest in various types of liquid assets, including United States Treasury obligations, securities of various federal agencies, corporate securities, trust preferred securities, certain certificates of deposit of insured banks and savings institutions, certain bankers' acceptances, repurchase agreements, and sale of federal funds.
Composition of Investment Securities Portfolio
The following tables set forth the amortized cost and approximate fair market values of the available-for-sale securities and held-to-maturity securities.
|
Amortized Cost |
Gross Unrealized Gains |
Gross Unrealized (Losses) |
Approximate Fair Value |
|||||||||||||
|
As of December 31, 2017 |
||||||||||||||||
|
AVAILABLE-FOR-SALE SECURITIES: |
||||||||||||||||
|
Debt Securities: |
||||||||||||||||
|
Corporates |
$ | 3,000,000 | $ | 65,000 | $ | - | $ | 3,065,000 | ||||||||
|
Municipals |
$ | 33,908,207 | $ | 253,872 | $ | (263,621 | ) | $ | 33,898,458 | |||||||
|
Government sponsored mortgage-backed securities and SBA loan pools |
45,414,845 | 9,283 | (908,913 | ) | 44,515,215 | |||||||||||
|
HELD-TO-MATURITY SECURITIES: |
||||||||||||||||
|
Government sponsored mortgage-backed securities |
16,457 | 327 | (55 | ) | 16,729 | |||||||||||
| $ | 82,339,509 | $ | 328,482 | $ | (1,172,589 | ) | $ | 81,495,402 | ||||||||
|
Amortized Cost |
Gross Unrealized Gains |
Gross Unrealized (Losses) |
Approximate Fair Value |
|||||||||||||
|
As of December 31, 2016 |
||||||||||||||||
|
AVAILABLE-FOR-SALE SECURITIES: |
||||||||||||||||
|
Debt Securities: |
||||||||||||||||
|
Corporates |
$ | 7,003,986 | $ | 54,050 | $ | (4,514 | ) | $ | 7,053,522 | |||||||
|
Municipals |
39,357,506 | 65,673 | (1,085,654 | ) | 38,337,525 | |||||||||||
|
Government sponsored mortgage-backed securities and SBA loan pools |
48,115,793 | 19,432 | (1,127,037 | ) | 47,008,188 | |||||||||||
|
HELD-TO-MATURITY SECURITIES: |
||||||||||||||||
|
Government sponsored mortgage-backed securities |
27,528 | 625 | - | 28,153 | ||||||||||||
| $ | 94,504,813 | $ | 139,780 | $ | (2,217,205 | ) | $ | 92,427,388 | ||||||||
|
Amortized Cost |
Gross Unrealized Gains |
Gross Unrealized (Losses) |
Approximate Fair Value |
|||||||||||||
|
As of December 31, 2015 |
||||||||||||||||
|
AVAILABLE-FOR-SALE SECURITIES: |
||||||||||||||||
|
Equity Securities |
$ | 102,212 | $ | 10,081 | $ | (12,776 | ) | $ | 99,517 | |||||||
|
Debt Securities: |
||||||||||||||||
|
U. S. government agencies |
8,533,885 | - | (137,101 | ) | 8,396,784 | |||||||||||
|
Corporates |
3,965,719 | - | (152,019 | ) | 3,813,700 | |||||||||||
|
Municipals |
31,132,635 | 302,335 | (85,808 | ) | 31,349,162 | |||||||||||
|
Government sponsored mortgage-backed securities and SBA loan pools |
54,643,681 | 13,764 | (1,024,121 | ) | 53,633,324 | |||||||||||
|
HELD-TO-MATURITY SECURITIES: |
||||||||||||||||
|
Government sponsored mortgage-backed securities |
43,099 | 836 | - | 43,935 | ||||||||||||
| $ | 98,421,231 | $ | 327,016 | $ | (1,411,825 | ) | $ | 97,336,422 | ||||||||
The following tables set forth certain information regarding the weighted average yields and maturities of the Bank's investment securities portfolio as of December 31, 2017.
|
Investment Portfolio Maturities and Average Weighted Yields |
Amortized Cost |
Weighted Average Yield |
Approximate Fair Value |
|||||||||
|
Due in one to five years |
563,318 | 1.43 | % | 571,615 | ||||||||
|
Due in five to ten years |
9,238,773 | 2.50 | % | 9,278,788 | ||||||||
|
Due after ten years |
27,106,116 | 3.66 | % | 27,113,055 | ||||||||
|
Government sponsored mortgage-backed securities and SBA loan pools not due on a single maturity date |
45,431,302 | 2.74 | % | 44,531,944 | ||||||||
| $ | 82,339,509 | 2.98 | % | $ | 81,495,402 | |||||||
|
After One Through Five Years |
After Five Through Ten Years |
After Ten Years |
Securities Not Due on a Single Maturity Date |
Total |
||||||||||||||||
|
As of December 31, 2017 |
||||||||||||||||||||
|
Debt Securities: |
||||||||||||||||||||
|
Corporates |
$ | - | $ | 3,065,000 | $ | - | $ | - | $ | 3,065,000 | ||||||||||
|
Municipals |
571,615 | 6,213,788 | 27,113,055 | - | 33,898,458 | |||||||||||||||
|
Government sponsored mortgage-backed securities and SBA loan pools |
- | - | - | 44,531,944 | 44,531,944 | |||||||||||||||
| $ | 571,615 | $ | 9,278,788 | $ | 27,113,055 | $ | 44,531,944 | $ | 81,495,402 | |||||||||||
Sources of Funds
General. The Company's primary sources of funds are retail and commercial deposits, FHLB borrowings, amortization and prepayments of loans and amortization, prepayments and maturities of investment securities.
Deposits. The Bank offers a variety of deposit accounts having a range of interest rates and terms. The Bank has concentrated on a diverse deposit mix, such that transaction accounts make a greater percent of funding than in the past. The Bank offers various checking accounts, money markets, savings, fixed-term certificates of deposit and individual retirement accounts.
The flow of deposits is influenced significantly by general economic conditions, changes in prevailing interest rates, local competition and competition from non-bank financial service providers. The Company closely monitors its deposit position and mix to manage interest rate risk and net interest margin. The Bank's deposits are typically obtained from the areas in which its offices are located. The Bank relies primarily on experienced customer service, long-term relationships with customers and convenient banking center locations to attract and retain a high level of core deposits.
Deposit Account Types
The following table sets forth the distribution of the Bank's deposit accounts at the dates indicated (dollars in thousands).
|
2017 |
2016 |
2015 |
||||||||||||||||||||||||||||||||||
|
Average |
Percent |
Average |
Percent |
Average |
Percent |
|||||||||||||||||||||||||||||||
|
Interest |
of Total |
Interest |
of Total |
Interest |
of Total |
|||||||||||||||||||||||||||||||
|
Rate |
Amount |
Deposits |
Rate |
Amount |
Deposits |
Rate |
Amount |
Deposits |
||||||||||||||||||||||||||||
|
NOW |
0.35 | % | $ | 139,458 | 23 | % | 0.30 | % | $ | 129,138 | 26 | % | 0.31 | % | $ | 137,473 | 27 | % | ||||||||||||||||||
|
Savings |
0.19 | % | 30,848 | 5 | % | 0.20 | % | 28,095 | 6 | % | 0.20 | % | 25,865 | 5 | % | |||||||||||||||||||||
|
Money Market |
0.73 | % | 187,064 | 31 | % | 0.45 | % | 155,530 | 31 | % | 0.42 | % | 170,603 | 33 | % | |||||||||||||||||||||
|
Non-interest bearing demand |
0.00 | % | 94,728 | 16 | % | 0.00 | % | 80,911 | 15 | % | 0.00 | % | 67,897 | 13 | % | |||||||||||||||||||||
|
Total |
452,098 | 74 | % | 393,674 | 78 | % | 401,838 | 78 | % | |||||||||||||||||||||||||||
|
Certificates of Deposit: (fixed-rate, fixed-term) |
||||||||||||||||||||||||||||||||||||
|
1-11 months |
0.71 | % | 92,349 | 15 | % | 0.75 | % | 65,802 | 13 | % | 0.54 | % | 45,517 | 9 | % | |||||||||||||||||||||
|
12-23 months |
0.99 | % | 39,930 | 7 | % | 0.89 | % | 22,328 | 4 | % | 0.82 | % | 43,523 | 8 | % | |||||||||||||||||||||
|
24-35 months |
1.42 | % | 12,472 | 2 | % | 1.24 | % | 12,882 | 3 | % | 1.02 | % | 12,654 | 3 | % | |||||||||||||||||||||
|
36-47 months |
1.49 | % | 6,420 | 1 | % | 1.40 | % | 5,106 | 1 | % | 1.35 | % | 6,895 | 1 | % | |||||||||||||||||||||
|
48-59 months |
1.46 | % | 3,753 | 1 | % | 1.47 | % | 3,655 | 1 | % | 1.44 | % | 4,671 | 1 | % | |||||||||||||||||||||
|
60-71 months |
1.34 | % | 339 | 0 | % | 1.37 | % | 1,874 | 0 | % | 1.47 | % | 2,274 | 0 | % | |||||||||||||||||||||
|
72-95 months |
1.34 | % | 3 | 0 | % | 1.34 | % | 42 | 0 | % | 1.34 | % | 14 | 0 | % | |||||||||||||||||||||
|
Total |
155,266 | 26 | % | 111,689 | 22 | % | 115,548 | 22 | % | |||||||||||||||||||||||||||
|
Total Deposits |
$ | 607,364 | 100 | % | $ | 505,363 | 100 | % | $ | 517,386 | 100 | % | ||||||||||||||||||||||||
Maturities of Certificates of Deposit of $100,000 or More
In 2017, management continued to place emphasis on reducing the dependence on jumbo deposits ($100,000 or more). The following table indicates the approximate amount of the Bank's certificate of deposit accounts of $100,000 or more by time remaining until maturity as of December 31, 2017.
|
(Dollars in thousands) |
||||
|
As of December 31, 2017 |
||||
|
Three months or less |
$ | 19,728 | ||
|
Over three through six months |
24,429 | |||
|
Over six through twelve months |
35,542 | |||
|
Over twelve months |
23,299 | |||
|
Total |
$ | 102,998 | ||
Borrowings
The Company’s borrowings at December 31, 2017 consist of FHLB advances and issuances of junior subordinated debentures. Other borrowings available to the Company include borrowings from the Federal Reserve Bank and Securities Sold Under Agreements to Repurchase.
Deposits are the primary source of funds for the Bank's lending activities and other general business purposes. However, during periods when the supply of lendable funds cannot meet the demand for such loans, the FHLB System, of which the Bank is a member, makes available, subject to compliance with eligibility standards, a portion of the funds necessary through loans (advances) to its members. Use of FHLB advances is a common practice, allowing the Bank to provide funding to its customers at a time when significant liquidity is not present, or at a rate advantageous relative to current market deposit rates. FHLB advances, due to their structure, allow the Bank to better manage its interest rate and liquidity risk. The following table presents certain data for FHLB advances as of the dates indicated.
|
As of December 31, |
||||||||||||
|
2017 |
2016 |
2015 |
||||||||||
|
(Dollars in Thousands) |
||||||||||||
|
Remaining maturity: |
||||||||||||
|
Less than one year |
$ | 92,200 | $ | 43,600 | $ | - | ||||||
|
One to two years |
2,100 | 50,000 | - | |||||||||
|
Two to three years |
- | 2,100 | - | |||||||||
|
Three to four years |
- | - | 50,000 | |||||||||
|
Four to five years |
- | - | 2,100 | |||||||||
|
Over five years |
- | - | - | |||||||||
|
Total |
$ | 94,300 | $ | 95,700 | $ | 52,100 | ||||||
|
Weighted average rate at end of period |
1.97 | % | 1.72 | % | 2.25 | % | ||||||
|
For the period: |
||||||||||||
|
Average outstanding balance |
$ | 93,942 | $ | 71,200 | $ | 52,592 | ||||||
|
Weighted average interest rate |
1.78 | % | 1.79 | % | 2.24 | % | ||||||
|
Maximum outstanding as of any month end |
$ | 116,700 | $ | 95,700 | $ | 56,500 | ||||||
Junior Subordinated Debentures:
On December 15, 2005, the Company completed an offering of $15 million of “Trust Preferred Securities” (defined hereinafter). The Company formed two wholly-owned subsidiaries, Guaranty Statutory Trust I (“Trust I”) and Guaranty Statutory Trust II (“Trust II”) each a Delaware statutory trust (each a “Trust”, and collectively, the “Trusts”), for the purpose of issuing the $15 million of Trust Preferred Securities. The proceeds of the sale of Trust Preferred Securities, together with the proceeds of the Trusts’ sale of their common securities to the Company, were used by each Trust to purchase certain debentures from the Company. The Company issued 30-year junior subordinated deferrable interest debentures to the Trusts in the principal amount of $5,155,000 (“Trust I Debentures”) and $10,310,000 (“Trust II Debentures”, and together with the Trust I Debentures, the “Debentures”) pursuant to the terms of Indentures dated December 15, 2005 by and between the Company and Wilmington Trust Company, as trustee. The Trust I Debentures bear interest at a fixed rate of 6.92%, payable quarterly. The Trust II Debentures bear interest at a fixed rate of 6.47% for 5 years, payable quarterly, after issuance and thereafter at a floating rate equal to the three month LIBOR plus 1.45%. The interest payments by the Company to the Trusts will be used to pay the dividends payable by the Trusts to the holders of the Trust Preferred Securities.
The Debentures mature on February 23, 2036. Subject to prior approval by the Federal Reserve Board, the Debentures and the Trust Preferred Securities are each callable by the Company or the Trusts, respectively and as applicable, at its option after five years from issuance, and sooner in the case of a special redemption at a special redemption price ranging up to 103.2% of the principal amount thereof, and upon the occurrence of certain events, such as a change in the regulatory capital treatment of the Trust Preferred Securities, either Trust being deemed an investment company or the occurrence of certain adverse tax events. In addition, the Company and the Trusts may defer interest and dividend payments, respectively, for up to five consecutive years without resulting in a default. An event of default may occur if the Company declares bankruptcy, fails to make the required payments within 30 days or breaches certain covenants within the Debentures. The Debentures are subordinated to the prior payment of any other indebtedness of the Company.
Pursuant to two guarantee agreements by and between the Company and Wilmington Trust Company, the Company issued a limited, irrevocable guarantee of the obligations of each Trust under the Trust Preferred Securities whereby the Company has guaranteed any and all payment obligations of the Trusts related to the Trust Preferred Securities including distributions on, and the liquidation or redemption price of, the Trust Preferred Securities to the extent each Trust does not have funds available.
The following table sets forth certain information as to the Company's subordinated debentures issued to the Trusts at the dates indicated.
|
As of December 31, |
||||||||||||
|
2017 |
2016 |
2015 |
||||||||||
|
(Dollars in Thousands) |
||||||||||||
|
Subordinated debentures |
$ | 15,465 | $ | 15,465 | $ | 15,465 | ||||||
|
Weighted average interest rate of subordinated debentures |
4.08 | % | 3.75 | % | 3.48 | % | ||||||
Federal Reserve Bank Borrowings
During 2008, the Bank established a borrowing line with Federal Reserve Bank. The Bank had the ability to borrow $36.4 million as of December 31, 2017. The Federal Reserve Bank requires the Bank to maintain collateral in relation to borrowings outstanding. The Bank had no borrowings on this line as of December 31, 2017 and 2016.
Securities Sold Under Agreements to Repurchase
In January 2008, the Company borrowed $30.0 million under three structured repurchase agreements. Interest was based on a fixed weighted average rate of 2.65% until maturity in January 2018. Beginning in February 2010, the counterparty, Barclay’s Capital, Inc., had the option to terminate the agreements on a quarterly basis until maturity.
Prior to the stated maturity date, the Company paid off one of these agreements in the amount $15.0 million in May 2013 and another agreement in the amount of $5.0 million in November 2011.
In June 2015, the Company executed a structured transaction in order to pay off the remaining $10.0 million, prior to its stated maturity date, incurring a prepayment penalty of $463,992.
Subsidiary Activity and Segment Information
The Company has three wholly-owned subsidiaries: (i) the Bank, the Company’s principal subsidiary and a state-chartered bank with trust powers in Missouri; (ii) Trust I; and (iii) Trust II. As discussed in more detail above, Trust I and Trust II were formed in December 2005 for the exclusive purpose of issuing trust preferred securities to acquire junior subordinated debentures issued by the Company. Those debentures are the sole assets of the Trusts. The interest payments by the Company on the debentures are the sole revenues of the Trusts and are used by the Trusts to pay the dividends to the holders of the trust preferred securities. The Company has guaranteed any and all payment obligations of the Trusts related to the trust preferred securities. Under generally accepted accounting principles, the Trusts are not consolidated with the Company.
The Bank has one service corporation subsidiary, Guaranty Financial Services of Springfield, Inc., a Missouri corporation. This service corporation, which has been inactive since February 1, 2003, had agreements with third party providers for the sale of securities and casualty insurance products.
The Company’s banking operation conducted through its principal subsidiary, the Bank, is the Company’s only reportable segment. Other information about the Company’s business segment is contained in the section captioned “Segment Information” in Note 1 to the Notes of the Consolidated Financial Statements in this report.
Return on Equity and Assets
The following table sets forth certain dividend, equity and asset ratios of the Company for the periods indicated.
|
Year ended |
Year ended |
Year ended |
||||||||||
|
December 31, |
December 31, |
December 31, |
||||||||||
|
2017 |
2016 |
2015 |
||||||||||
|
Common Dividend Payout Ratio |
36 | % | 27 | % | 18 | % | ||||||
|
Return on Average Assets |
0.69 | % | 0.83 | % | 0.88 | % | ||||||
|
Return on Average Equity |
6.97 | % | 8.00 | % | 8.81 | % | ||||||
|
Stockholders' Equity to Assets |
9.43 | % | 10.17 | % | 10.17 | % | ||||||
|
EPS Diluted |
$ | 1.16 | $ | 1.27 | $ | 1.30 | ||||||
|
Dividends on Common Shares |
$ | 0.42 | $ | 0.34 | $ | 0.23 | ||||||
Employees
As of December 31, 2017, the Bank had 155 full-time employees and 18 part-time employees. As of December 31, 2017, the Company had no employees. None of the Bank's employees are represented by a collective bargaining group.
Competition
The Bank experiences substantial competition both in attracting and retaining deposit accounts and in the origination of loans. The Bank's primary competition consist of commercial banks, credit unions, and savings institutions.
Direct competition for deposit accounts comes from other commercial banks, credit unions, regional bank and thrift holding companies, and savings institutions located in the remainder of our Market Area. Significant competition for the Bank's other deposit products and services come from money market mutual funds, brokerage firms, insurance companies, and retail stores. Recently, online firms have offered attractive financial service products to consumers, irrespective of location. The primary factors in competing for loans are interest rates and loan origination fees and the range of services offered by various financial institutions. Our larger competitors have a greater ability to finance wide-ranging advertising campaigns through their greater capital resources. Our marketing efforts depend heavily upon referrals from officers, directors and shareholders, selective advertising in local media and direct mail solicitations. The Bank believes it is able to compete effectively in its primary Market Area by offering competitive interest rates and loan fees, and a variety of deposit products, and by emphasizing personal customer service.
Supervision and Regulation
General
The Company and the Bank are subject to an extensive regulatory framework under federal and state law. Consequently, the Company’s growth and earnings performance may be affected by the requirements of federal and state statutes and by regulations and policies of various bank regulatory authorities, including the:
|
● |
Board of Governors of the Federal Reserve System (“FRB”); |
|
● |
Missouri Division of Finance; |
|
● |
Federal Deposit Insurance Corporation; and |
|
● |
Consumer Financial Protection Bureau (“CFPB”). |
Additionally, the Company’s business may be impacted by assorted laws and rules, including:
|
● |
anti-money laundering laws enforced by the U.S. Department of Treasury (Treasury); |
|
● |
taxation laws administered by the Internal Revenue Service (IRS) and state taxing authorities; |
|
● |
accounting rules developed by the Financial Accounting Standards Board (FASB); and |
|
● |
securities laws administered by the Securities and Exchange Commission (SEC) and state securities authorities. |
Regulatory agencies often have significant discretion regarding their supervisory and enforcement activities. This comprehensive supervisory and regulatory framework significantly impacts the Company’s operations and results. Additionally, new legislation is introduced from time to time that could impact the Company and the Bank in substantial ways and the nature, extent, or impact of new statutes or regulations on the Company’s or the Bank’s operations or financial conditions cannot be predicted with any certainty.
Set forth below is a brief summary of certain material laws and regulations applicable to the Company and the Bank. These laws and regulations are primarily intended for the protection of the Bank’s customers and depositors and not for the benefit of the stockholders or creditors of the Company. The following description does not purport to be complete and is qualified in its entirety by reference to the full text of the statutes and regulations described below.
Dodd-Frank Act
The Dodd-Frank Wall Street Reform and Consumer Protection Act of 2010 (“Dodd-Frank Act” or “Dodd-Frank”) significantly changed the regulatory framework for financial institutions and their holding companies. Among other provisions, the Dodd-Frank Act:
|
● |
created the CFPB, which is responsible for implementing, supervising, and enforcing compliance with consumer financial protection laws; |
|
● |
increased the deposit insurance coverage limit and changed the assessment base for calculating a bank’s deposit insurance assessments; |
|
● |
repealed the prohibition on payment of interest on demand deposits; |
|
● |
provided for new disclosures related to executive compensation and corporate governance and prohibited compensation arrangements that encourage inappropriate risks or that could provide excessive compensation; |
|
● |
imposed new capital requirements on banking institutions (see “New Capital Rules” below); |
|
● |
enhanced the authority of the Federal Reserve Board to examine the Company and its non-bank subsidiaries; and |
|
● |
imposed new requirements and restrictions on consumer mortgage banking. |
The Dodd-Frank Act contains numerous provisions scheduled to be implemented through rulemakings by various federal regulatory agencies over a period of several years. Many, but not all, of the regulations have been issued and full implementation of the Dodd-Frank Act is still not complete. This law will continue to significantly influence the regulatory environment in which the Bank and the Company operate. As a result, the Company cannot predict the Dodd-Frank Act’s ultimate impact on the Company or the Bank at this time. Certain rules proposed or adopted under the Dodd-Frank Act are discussed throughout this section.
Minimum Capital Requirements
In July 2013, the U.S. federal banking agencies approved a final rule to comprehensively revise the regulatory capital framework for the U.S. banking sector, implementing many aspects of the framework agreed to by the International Basel Committee on Bank Supervision and incorporating changes required by the Dodd-Frank Act (the “Basel III Rule”). The capital requirements apply to all banks and savings associations, bank holding companies with more than $1 billion in assets and savings and loan holding companies (other than certain savings and loan holding companies engaged in insurance underwriting and grandfathered diversified holding companies). The Basel III Rule establishes new higher capital ratio requirements, tightens the definition of “capital,” imposes new operating restrictions on banking organizations with insufficient capital buffers, and increases the risk-weighting of certain assets. Cumulatively, these changes result in substantially more demanding capital standards for U.S. banking organizations.
The Basel III Rule distinguishes between banking organizations subject to the “advanced approaches” method of computing risk-based regulatory capital, which are those with $250 billion or more in total consolidated assets or $10 billion or more in foreign exposures, and other banking organizations that successfully opt-in (“Advanced Banks”) and other banking organizations, such as the Company and the Bank, which operate under the “standardized approach” (“Standardized Banks”). The new rules became effective for the Company and the Bank on January 1, 2015, with certain requirements to be phased-in between January 2016 and January 2019.
The Basel III Rule, among other features:
|
● |
Introduces a new capital measure, Common Equity Tier 1 (“CET1” or “Tier 1 Common”), which is defined as common stock instruments, related surplus (net of Treasury stock), and retained earnings, subject to certain regulatory adjustments; and |
|
● |
Requires banking institutions to maintain: |
|
o |
a new minimum ratio of CET1 to risk-weighted assets of at least 4.5% (plus a capital conservation buffer); |
|
o |
a minimum amount of Tier 1 capital (the sum of CET1 and Additional Tier 1 capital) to risk-weighted assets of at least 6%, which is an increase from 4% (plus a capital conservation buffer); |
|
o |
a total capital (the sum of Tier 1 and Tier 2 capital) ratio of at least 8% of risk-weighted assets (plus a capital conservation buffer); and |
|
o |
a minimum leverage ratio of Tier 1 capital of 4%. |
In addition, the Basel III Rule requires that banking organizations maintain a “capital conservation buffer” comprised of CET1 in order to avoid restrictions on the ability to make capital distributions (including dividends and stock purchases) and pay discretionary bonuses to executive officers. The capital conservation buffer is equal to 2.5% of risk-weighted assets, in addition to the minimum CET1, Tier 1, and total capital ratios. The capital conservation buffer will be phased-in beginning at 0.625% of risk-weighted assets on January 1, 2016, and increasing each subsequent year by an additional 0.625%, to reach the final level of 2.5% of risk-weighted assets on January 1, 2019. Accordingly, factoring in the capital conservation buffer, the minimum ratios noted above increase to 7% for CET1, 8.5% for Tier 1 capital, and 10.5% for total capital.
Furthermore, the Basel III Rule includes more restrictive definitions for the components of capital. For example, cumulative perpetual preferred stock and trust preferred securities have been phased-out of Tier 1 capital. However, for smaller entities with less than $15 billion in assets as of December 31, 2009, such as the Bank, the final rule permanently grandfathers as Tier 1 capital trust preferred securities and similar instruments issued by such entities prior to May 19, 2010, until such entity exceeds $15 billion in assets. The final Basel III Rule provides entities such as the Company and the Bank with a one time “opt-out” right to continue excluding accumulated other comprehensive income (“AOCI”) from CET1 capital. This opt-out was required to be made in the first quarter of 2015 and the Company and Bank made this election. Accordingly, the Bank and the Company need not include AOCI in CET1 capital going forward. The rule also requires that goodwill and certain other intangible assets, other than mortgage servicing assets, net of associated deferred tax liabilities, be deducted from CET1 capital. Additionally, certain deferred tax assets and mortgage servicing assets must be deducted from CET1 capital if such assets exceed a certain percentage of an institution’s CET1 capital. Generally, greater deductions from CET1 reduce an institution’s capital base.
Moreover, the Basel III Rule changes the risk-weightings for certain assets that are used to calculate capital ratios. All else being equal, a higher risk weight results in a higher risk-weighted asset amount which, in turn, gives rise to a lower risk-based capital ratio. The final rule assigns a higher risk-weighting of 150% (up from 100%) for exposures that are more than 90 days past due and assigns a higher risk-weighting of 150% (up from 100%) for high-volatility commercial real estate loans, which are credit facilities that, prior to conversion to permanent financing, finance or have financed the acquisition, development, or construction of real property, subject to certain exclusions. Although initially contemplated, there was no change to the risk-weighting treatment of residential mortgage loans in the final Basel III Rule.
Although the Basel III Rule is more stringent than previous capital rules, the Basel III Rule has had minimal impact on the Company and the Bank, to date. The Company and the Bank have a strong capital base and currently maintain adequate capital to meet the new standards.
Nonetheless, federal banking guidelines provide that financial institutions experiencing significant growth could be expected to maintain capital levels above the minimum requirements without significant reliance on intangible assets. Additionally, higher capital levels could be required under certain circumstances, such as situations involving interest rate risk, risk from concentrations of credit, or nontraditional activities. Accordingly, the Company and the Bank could be required to maintain higher capital levels in the future.
Regulation of the Bank
General. The Bank, as a Missouri-chartered non-member depository trust company, is primarily regulated by the MDF and FDIC. The Bank is subject to extensive federal and state regulatory oversight in all areas of banking operations, including, but not limited to, lending activities, investments, loans, deposits, interest rates payable on deposits, establishment of branches, corporate restructuring, and capital adequacy. The Bank is also subject to certain reserve requirements promulgated by the FRB.
The MDF, in conjunction with the FDIC, regularly examines the Bank and reports to the Bank's Board of Directors on any deficiencies that are found in the Bank's operations. The Bank must also file reports with the MDF and the FDIC concerning its activities and financial condition, in addition to obtaining regulatory approvals prior to entering into certain transactions such as mergers with or acquisitions of other banks or savings institutions. These regulatory authorities have extensive discretion in connection with their supervisory and enforcement activities and examination policies. Regulation by these agencies is designed to protect the Bank’s depositors and not the Company’s shareholders.
Insurance of Deposit Accounts and Assessments. The deposit accounts held by the Bank are insured by the DIF. The Dodd-Frank Act permanently increased the maximum amount of deposit insurance for banks, savings institutions, and credit unions to $250,000 per insured depositor, retroactive to January 1, 2009. The Dodd-Frank Act also increased the minimum ratio of net worth to insured deposits of the DIF from 1.15% to 1.35%.
A bank's insurance assessment is determined quarterly by multiplying its assessment rate by its assessment base. Per FDIC rules, a bank’s assessment base is the institution’s average consolidated total assets minus its average tangible equity. The FDIC has adopted a risk-based system for assessment rates. For banks with less than $10 billion in assets, such as the Bank, the risk classification is based on the Bank’s capital levels and level of supervisory risk. Assessment rates are subject to adjustment and (1) decrease for issuance of long-term unsecured debt (including senior unsecured debt and subordinated debt); (2) increase for holdings of long-term unsecured or subordinated debt issued by other insured banks; and (3) for banks that are not well-rated or not well-capitalized, increase for significant holdings of brokered deposits.
The FDIC may terminate a bank’s deposit insurance if it finds that the institution has engaged in unsafe and unsound practices, is in an unsafe or unsound condition to continue operations, or has violated any applicable law, regulation, rule, order or condition imposed by the FDIC.
Regulatory Capital Requirements and Prompt Corrective Action. The FDIC is required to take prompt corrective action if an insured depository institution, such as the Bank, does not meet its minimum capital requirements. The FDIC has established five capital tiers: “well-capitalized”, “adequately capitalized”, “undercapitalized”, “significantly undercapitalized” and “critically undercapitalized”. A depository institution’s capital tier depends upon its capital levels in relation to various relevant capital measures, which, among others, include a Tier 1 and total risk-based capital measure and a leverage ratio capital measure. The Prompt Corrective Action rules were amended effective January 1, 2015 to incorporate changes under the Basel III Rule, including the CET1 requirements, and to raise capital requirements for certain categories. An insured financial institution is considered:
|
● |
“Well-capitalized” if it has a Tier 1 leverage ratio of 5% or greater, a CET1 to risk-based capital ratio of 6.5% or greater, a Tier 1 to risk-based capital ratio of 8% or greater, a total risk-based capital ratio of 10% or greater and is not subject to any written agreement, order, capital directive, or prompt corrective action directive; |
|
● |
“Adequately capitalized” if it has it has a Tier 1 leverage ratio of 4% or greater, a CET1 to risk-based capital ratio of 4.5% or greater, a Tier 1 to risk-based capital ratio of 6% or greater, and a total risk-based capital ratio of 8% or greater; |
|
● |
“Undercapitalized” if it has a Tier 1 leverage ratio of less than 4%, a CET1 to risk-based capital ratio of less than 4.5%, a Tier 1 to risk-based capital ratio of less than 6% and a total risk-based capital ratio of less than 8%; |
|
● |
“Significantly undercapitalized” if it has a Tier 1 leverage ratio of less than 3%, a CET1 to risk-based capital ratio of less than 3%, a Tier 1 to risk-based capital ratio of less than 4%, and a total risk-based capital ratio of less than 6%; and |
|
● |
“Critically undercapitalized” if it has a tangible equity capital to total assets ratio equal to or less than 2%. |
The FDIC may, under certain circumstances, reclassify a well-capitalized insured depository institution as adequately capitalized. It is also permitted to require an adequately capitalized or undercapitalized institution to comply with supervisory provisions as if the institution were in the next lower category (but not treat a significantly undercapitalized institution as critically undercapitalized) based on supervisory information other than the capital levels of the institution. An institution may be reclassified if the FDIC determines (after notice and opportunity for hearing) that the institution is in an unsafe or unsound condition or deems the institution to be engaging in an unsafe or unsound practice.
Federal banking agencies are required to take prompt corrective action to resolve capital deficiencies at insured depository institutions. Failure to meet the capital guidelines could subject a bank to a variety of enforcement actions, including the issuance of a capital directive, prohibition on paying dividends or management fees, prohibition on accepting brokered deposits, and restrictions on paying bonuses or increasing compensation for executive officers. For critically undercapitalized institutions, a receiver may be appointed.
The Bank met its minimum capital adequacy guidelines, and the Bank was categorized as “well-capitalized”, as of December 31, 2017. Applicable capital and ratio information is contained under the section titled “Regulatory Matters” in Note 1 to the “Notes of the Consolidated Financial Statements” in this report.
Safety and Soundness Standards. The federal bank regulators have adopted guidelines to promote the safety and soundness of federally insured depository institutions. The guidelines set forth standards for internal controls, information systems and internal audit systems, loan documentation, credit underwriting, interest-rate-risk exposure, asset growth, asset quality, earnings, stock valuation and compensation, fees and benefits and other operational and managerial standards. The guidelines provide standards in each area and an institution must establish its own procedures to achieve such goals.
If an institution fails to meet a standard, a regulator may require the institution to submit an acceptable plan to achieve compliance with the standard. If an institution fails to submit an acceptable plan or fails to implement an accepted plan, an agency must, by order, require the institution to correct the deficiency. The agency may, and in some cases must, take other supervisory actions until the deficiency has been corrected.
Federal Home Loan Bank System. The Bank is a member of the FHLB of Des Moines, which is one of 11 regional FHLBs. The FHLB system’s primary purpose is to provide stable funding to member institutions that such institutions in turn use to make loans to families, farms and businesses. The FHLBs are overseen by the Federal Housing Finance Agency (“FHFA”). As a member, the Bank is required to purchase and maintain a minimum investment in the stock of the FHLB. As of December 31, 2017, the Bank was in compliance with this requirement.
Dividend Limitations. The amount of dividends that the Bank may pay is subject to various regulatory limitations. Under federal law, an FDIC-insured institution may not pay dividends if it is undercapitalized or if payment would cause it to be undercapitalized. If the FDIC believes that a bank is engaged in, or about to engage in, an unsafe or unsound practice, the FDIC may require, after notice and hearing, that the bank cease and desist from that practice. In addition, under Missouri law, the Bank may pay dividends to the Company only from a portion of its undivided profits and may not pay dividends if its capital is impaired. Additionally, under Missouri statute, dividends paid by the Bank are restricted by a statutory formula, which provides for the maintenance of a surplus fund and prohibits the payment of dividends which would impair the surplus fund.
Anti-Money Laundering and Anti-Terrorism Regulation. The Bank Secrecy Act (“BSA”) establishes the framework for anti-money laundering (“AML”) obligations imposed on U.S. financial institutions. The purpose of the BSA is to prevent banks and other financial services providers from being used as intermediaries for, or to hide the transfer or deposit of money derived from, drug trafficking, money laundering, and other crimes. The Uniting and Strengthening America by Providing Appropriate Tools Required to Intercept and Obstruct Terrorism Act of 2001 (“USA Patriot Act”) amended the BSA and imposes a number of obligations on banks, including the requirement to implement policies, procedures and controls reasonably designed to detect and report instances of money laundering and terrorism financing. The USA Patriot Act also requires financial institutions to develop written customer identification programs. In addition, the U.S. Department of Treasury’s Office of Foreign Asset Controls (“OFAC”) administers and enforces economic and trade sanctions based on U.S. foreign policy and national security against entities such as targeted foreign countries and terrorists.
Consumer Protection Laws. In connection with its banking activities, the Bank is subject to a number of federal and state laws designed to protect consumers in their transactions with banks. These laws include, but are not limited to, the Equal Credit Opportunity Act (“ECOA”), Fair Credit Reporting Act (“FCRA”), Fair and Accurate Credit Transaction Act of 2003 (“FACTA”), Gramm-Leach-Bliley Act (“GLBA”), Electronic Funds Transfer Act (“EFTA”), Home Mortgage Disclosure Act (“HMDA”), Real Estate Settlement Procedures Act (“RESPA”), and Truth in Lending Act (“TILA”), and their various state counterparts. In addition, the Dodd-Frank Act prohibits unfair, deceptive, or abusive acts or practices (“UDAAP”). Moreover, several federal laws, including GLBA, FCRA, and FACTA, regulate consumer financial privacy and restrict the sharing of consumer financial information.
Transactions with Affiliates and Insiders. Federal law imposes certain limitations on the ability of a bank to engage in “covered transactions” with affiliates. The Company is an affiliate of the Bank for purposes of these restrictions. The definition of “covered transactions,” which was expanded under the Dodd-Frank Act, includes extensions of credit to affiliates, investments in stock or other securities of affiliates, and acceptance of the stock or other securities of an affiliate as collateral for loans. Additionally, federal law prohibits institutions from engaging in certain transactions with affiliates unless the transactions are on terms substantially the same as, or at least as favorable to the Bank as, those prevailing at the time for comparable transactions with non-affiliated companies. Federal law also restricts the Bank’s ability to extend credit to its executive officers, directors, principal shareholders, and their related interests, including that such credit extensions must be made on substantially the same terms, including interest rate and collateral, as those prevailing at the time for comparable transactions with unrelated third parties, and not involve more than the normal risk of repayment or present other unfavorable features.
Transaction Account Reserve Requirements. The FRB requires insured depository institutions to maintain reserves against specified deposit liabilities. Reservable liabilities consist of net transaction accounts, non-personal time deposits, and Eurocurrency liabilities. For 2017, the first $15.5 million of otherwise reservable balances are exempt from the reserve requirements; the reserve requirement is 3% for net transaction accounts between $15.5 million and $115.1 million; and the reserve requirement is 10% for net transaction accounts in excess of $115.1 million. These reserve requirements are subject to annual adjustment.
Commercial Real Estate Lending. The Bank may be subject to greater scrutiny from federal banking regulators based on its concentration of commercial real estate (“CRE”) loans. Federal regulators have issued guidance to address concerns about CRE concentrations and to provide expectations for managing a concentrated portfolio. The guidance includes development and construction loans for which repayment is dependent upon the sale of the property, as well as properties for which repayment is dependent upon rental income.
Per the guidance, institutions that may have significant CRE concentration risk are those that have experienced rapid growth in CRE lending, have notable exposures to a specific type of CRE, or are approaching or exceed the following supervisory criteria: (i) total loans for construction, land development, and other land represent 100% or more of the institution’s total capital; or (ii) total CRE loans represent 300% or more of the institution’s total capital, and the outstanding balance of the institution’s CRE loan portfolio has increased by 50% or more during the prior 36 months. If a bank’s portfolio goes outside of these general guidelines, the bank must engage in heightened risk management practices.
Residential Real Estate Lending. The CFPB has issued new rules implementing several Dodd-Frank requirements regarding residential mortgage lending. Lenders must assess a borrower’s ability to repay the mortgage-related obligation and must consider certain underwriting factors. Lenders also receive certain protections from liability if they make “qualified mortgages.” Additionally, new rules prohibit certain loan features, such as negative amortization, interest-only payment, balloon payments, and restrict points and fees paid by a borrower and prepayment penalties.”
Volcker Rule. The Volcker Rule, issued by the federal banking and securities regulators pursuant to the Dodd-Frank Act, generally prohibits insured depository institutions and their affiliated companies from: (i) short-term proprietary trading in securities and other financial instruments; and (ii) sponsoring or acquiring or retaining an ownership interest in private equity and hedge funds, subject to certain exceptions.
Community Reinvestment Act. Under the Community Reinvestment Act of 1977 (“CRA”), the Bank has a continuing and affirmative obligation, consistent with safe and sound operation, to help meet the credit needs of its communities, including low- and moderate-income neighborhoods. As part of its examinations, the FDIC evaluates the Bank’s record in meeting these obligations. CRA ratings are also taken into account by regulators in evaluating applications for mergers, acquisitions, or to open a new branch or facility. Based on its most recent CRA compliance examinations, the Bank has received a “Satisfactory” CRA rating.
Regulation of the Company
General. The Company is a registered bank holding company subject to regulation and supervision by the FRB under the Bank Holding Company Act of 1956 (“BHCA”). The Company is required to file periodic reports of its operations with the FRB. Additionally, the Company is legally obligated to act as a source of strength to the Bank and to commit resources to support the Bank.
Restrictions on Dividends and Stock Repurchases. The Company’s source of funds (including cash flow to pay dividends to stockholders) is dividends paid to it by the Bank. The right of the Company to receive dividends or other distributions from the Bank is subject to the prior claims of creditors of the Bank, including depositors, and applicable regulatory restrictions, including prior approval in certain situations.
The amount of dividends that the Company may pay is subject to various regulatory limitations, including the requirement to maintain adequate capital. Financial institutions are generally prohibited from paying dividends if, following payment of dividends, the institution would be considered undercapitalized. Additionally, under the Basel III Rule, institutions seeking to pay dividends must maintain the required capital conservation buffer. Also, the FRB strongly encourages financial institutions to consult with the agency prior to paying dividends. The FRB has indicated that a board of directors should “eliminate, defer, or severely limit” dividends if:
|
● |
the bank holding company’s net income available to shareholders for the past four quarters, net of dividends paid during that period, is not sufficient to fully fund the dividends; |
|
● |
the bank holding company’s rate of earnings retention is inconsistent with capital needs and overall macroeconomic outlook; or |
|
● |
the bank holding company will not meet, or is in danger of not meeting, its minimum regulatory capital adequacy ratios. |
Banking regulators also have the authority to prohibit banks and bank holding companies from paying a dividend if such payment would be an unsafe or unsound practice.
Generally, a bank holding company must notify the FRB prior to the purchase or redemption of its outstanding equity securities if the gross consideration for the purchase or redemption, when aggregated with the net consideration paid for all such purchases during the preceding twelve months is equal to 10% or more of the bank holding company’s consolidated net worth. Prior approval may not be required if the bank holding company, among other things, will meet or exceed “well capitalized” thresholds both before and after the repurchase, is considered “well managed,” and is not subject to any unresolved supervisory issues. Additionally, bank holding companies are expected to consult with the FRB before redeeming or repurchasing stock if:
|
● |
the bank holding company is at “significant risk” of developing a financial weakness; |
|
● |
the bank holding company is considering expansion (either acquisition or new activities); and |
|
● |
if such redemption or repurchase will cause a net reduction in capital from the beginning of the quarter in which the redemption or repurchase occurs. |
The FRB may disapprove of the purchase or redemption if it determines, among other things, that the proposal would constitute an unsafe or unsound business practice.
Support of Banking Subsidiaries. Under FRB policy, the Company is expected to act as a source of financial strength to the Bank and, where required, to commit resources to support the Bank. Financial support from the Company may be required even when the Company might not otherwise be inclined to provide it. Moreover, if the Bank should become undercapitalized, the Company would be required to guarantee the Bank's compliance with its capital restoration plan in order for such plan to be accepted by the FDIC.
Acquisitions, Activities, and Changes in Control. Under the BHCA, the Company must obtain the prior approval of the FRB before the Company may: (i) acquire substantially all the assets of a bank; (ii) acquire direct or indirect ownership or control of more than 5% of the voting shares of any bank; or (iii) or merge or consolidate with any other bank holding company. The BHCA also restricts the Company’s ability to acquire direct or indirect ownership or control of 5% or more of any class of voting shares of any nonbanking corporation. The FRB is required to consider the financial and managerial resources and future prospects of the bank holding companies and banks concerned and the convenience and needs of the community to be served. Consideration of financial resources generally focuses on capital adequacy. Consideration of convenience and needs includes the involved institutions’ performance under the CRA. The FRB may not approve a transaction if it would result in or tend to create a monopoly, substantially lessen competition, or otherwise function as a restraint of trade, unless the anti-competitive effects are clearly outweighed by the public interest in meeting the needs and convenience of the community to be served.
Additionally, FRB approval is required prior to any person or company acquiring “control” of a bank holding company. “Control” is conclusively presumed to exist if a person or company acquires 25% or more of the outstanding voting shares of a bank holding company. There is a rebuttable presumption of control if a person or company acquires more than 10% but less than 25% of any class of voting securities.
Moreover, bank holding companies are generally prohibited from engaging in any business other than that of banking, managing, and controlling banks or furnishing services to banks and their subsidiaries, although bank holding companies are permitted to engage in activities that are determined to be “closely related to banking” and “a proper incident thereto.”
Transactions with Affiliates. As discussed above, federal regulations restrict the extent to which the Company and its officers and directors may engage in certain “covered transactions” with the Bank, including borrowing or otherwise obtaining credit from or selling assets or securities to the Bank. Additionally, any transactions that are “covered transactions” with the Bank must be on nonpreferential terms.
Federal Securities Regulation and Corporate Governance. The Company’s stock is registered with the SEC and, therefore, the Company is subject to SEC restrictions and requirements, including rules regarding information sharing, proxy solicitation, and insider trading.
The Sarbanes-Oxley Act of 2002 (“SOX”) addresses, among other issues, corporate governance, auditing and accounting, executive compensation, and enhanced and timely disclosure of corporate information. Per SOX, the Company’s Chief Executive Officer (CEO) and Chief Financial Officer (CFO) are required to certify that the quarterly and annual reports do not contain any untrue statement of a material fact. The SEC’s rules regarding CEO and CFO certifications require these officers to certify, among others, that: (i) they are responsible for establishing, maintaining and regularly evaluating the effectiveness of internal controls over financial reporting; (ii) they have made certain disclosures to auditors and the audit committee of the board of directors; and (iii) they have included information in quarterly and annual reports about their evaluation and whether there have been changes in internal controls over financial reporting or in other factors that could materially affect internal control over financial reporting.
The Dodd-Frank Act provides other investor protections, corporate governance, and executive compensation requirements that affect U.S. publicly traded companies. For example, the Dodd-Frank Act requires companies to give shareholders a non-binding vote approving executive compensation and “golden parachute” payments. Pursuant to the Dodd Frank Act, in July 2015, the SEC proposed a rule that companies whose securities are listed on national securities exchanges and associations (including the Company whose securities are listed on the NASDAQ Global Market) would be required to develop and enforce recovery policies that, in the event of an accounting restatement, would “claw back” from current and former executive officers incentive-based compensation they should not have received based on the restatement. Recovery would be required without regard to fault and without regard to whether any misconduct occurred in connection with or an executive officer’s responsibility for the erroneous misstatement. The proposed rules would also require disclosure of listed companies’ recovery policies, and their actions under those policies. The proposed rules are not yet final.
Tax Reform. In the fourth quarter of 2017 the Company re-measured its deferred tax assets and liabilities as a result of the enactment of the new tax law "H.R.1," originally known as the "Tax Cuts and Jobs Act" (the "Tax Reform Legislation"). The enactment occurred on December 22, 2017. The Tax Reform Legislation became effective January 1, 2018 and modifies the tax law in many ways. The centerpiece of the Tax Reform Legislation is the reduction of the federal corporate income tax rate from 35% to 21%. All deferred tax items as of December 22, 2017 needed to be re-valued using the new federal corporate income tax rate of 21%. As a result, income tax expense recorded in 2017 included a $1.0 million reduction to deferred tax assets. The impact of the Tax Reform Legislation on the Company’s 2017 financial results are not necessarily indicative of the results to be achieved in any future periods.
The SEC staff issued Staff Accounting Bulletin No. 118 ("SAB 118") to address the application of U.S. GAAP in situations when a registrant does not have the necessary information available, prepared, or analyzed (including computations) in reasonable detail to complete the accounting for certain income tax effects of the Tax Reform Legislation. The Company has recognized the provisional tax impact related to the revaluation of deferred tax assets and liabilities and included these amounts in its consolidated financial statements for the year ended December 31, 2017. The ultimate impact may differ from these provisional amounts, possibly materially, due to, among other things, additional analysis, changes in interpretations and assumptions the Company has made, additional regulatory guidance that may be issued, and actions the Company may take as a result of the Tax Reform Legislation. The accounting is expected to be complete when the Company's 2017 U.S. corporate income tax return is filed in 2018.
Pending Acquisition of Hometown Bancshares, Inc. As previously reported, on November 30, 2017, Guaranty Federal Bancshares, Inc. entered into an Agreement and Plan of Merger with Hometown Bancshares, Inc., a Missouri corporation (“Hometown”) (the “Agreement”). Pursuant to the terms of the Agreement, Hometown will merge into the Company with the Company being the surviving corporation (the “Merger”). Under the terms of the Agreement, each share of Hometown common stock will be exchanged for $20.00 in cash and the transaction is valued at approximately $4.6 million. The Agreement provides that at a time yet to be determined but after the Merger, Hometown Bank, National Association, a national bank headquartered in Carthage, Missouri (“Hometown Bank”) which is Hometown’s only bank subsidiary, will merge with and into and under the charter of the Bank which is the Company’s only bank subsidiary, with the Bank as the survivor of that merger (the “Bank Merger”).
In its December 31, 2017, unaudited Consolidated Report of Condition, Hometown Bank, N.A., the subsidiary bank of Hometown, reported total assets of $179.6 million, total liabilities of $163.2 million and total equity of $16.4 million. The Bank reported $210,000 in net income for the twelve months ended December 31, 2017. The Company anticipates there will be goodwill and a core deposit intangible recorded with this acquisition. Upon the completion of the Merger, the Company will have acquired Hometown Bank's seven branches in the Joplin, Missouri area.
The acquisition has been approved by the board of directors of each of Guaranty and Hometown and necessary regulatory approvals have been obtained, as well as the approval and adoption of the Agreement by Hometown’s shareholders. Guaranty Federal Bancshares, Inc. and Hometown have made customary representations and warranties about their business and covenants pending the closing of the acquisition, including covenants by Hometown to cause Hometown Bank, National Association, its wholly-owned bank subsidiary, to conduct its business in the ordinary course. The Company expects the Merger to be effective in the second quarter of 2018.
Executive Officers of the Registrant
Set forth below is information concerning the executive officers of the Company. Each executive officer is annually elected to a one-year term by the Board of Directors of the Company.
Shaun A. Burke joined the Bank in March 2004 as President and Chief Executive Officer and was appointed President and Chief Executive Officer of the Company on February 28, 2005. He has over 31years of banking experience. Mr. Burke received a Bachelor of Science Degree in Finance from Missouri State University and is a graduate of the Graduate School of Banking of Colorado. Mr. Burke currently serves on the board of the Missouri Bankers Association as Vice Chairman and previously served as Chairman of the Legislative Affairs Committee and Chairman of the Audit Committee. From 2014 to 2017, he served on the Community Bankers Council of the American Bankers Association. In March 2016 he was appointed to the Federal Reserve Bank of St. Louis’ Community Depository Institutions Advisory Council. From 2012 to 2014, he was a Board Member of the Springfield Area Chamber of Commerce serving as Vice Chairman of Economic Development in 2014. From 2009 through 2014, he was a Board Member of the Springfield Business Development Corporation, the economic development subsidiary of the Springfield Area Chamber of Commerce serving as President in 2012. He is also a past Member of the United Way Allocations and Agency Relations Executive Committee, Salvation Army Board, and Big Brothers Big Sisters Board.
Carter Peters is Executive Vice President and Chief Financial Officer of the Bank and the Company. Mr. Peters has over 25 years of experience in the financial services and public accounting industries. Prior to joining the Company in August 2005, Mr. Peters served as the Chief Financial Officer of Southern Missouri Bank for approximately two years and was employed by BKD, LLP, a certified public accounting and advisory firm, for eleven years. He is a Certified Public Accountant with a Bachelor of Science Degree in Accounting from Missouri State University. He is a member of the American Institute of Certified Public Accountants and the Missouri Society of Certified Public Accountants. Mr. Peters has been recognized by the Springfield Business Journal as a “40 Under 40” honoree. He has served several not-for-profit organizations, including past Chairman of the Southwest Missouri Regional Board of the Make-A-Wish Foundation of Missouri.
H. Charles Puls is Executive Vice President and Chief Lending Officer of the Bank. He joined the Bank and the Company in June 2016. Mr. Puls has over 26 years of experience in the banking industry. Prior to joining the Company Mr. Puls served as Senior Vice President, Market President in Southeast Missouri for Regions Bank. Before that, he was Senior Vice President, Relationship Manager for Regions Bank, Union Planters Bank, and Capital Bank & Trust in the St. Louis market. He is a board member and active volunteer for the American Red Cross and is a graduate of the University of Missouri – St. Louis.
Sheri Biser is Executive Vice President and Chief Credit Officer of the Bank. She joined the Bank in February 2009. Ms. Biser has over 30 years of banking experience. Prior to joining the Bank, Ms. Biser served as Chief Credit Officer of Metropolitan National Bank for nearly eight years and worked in credit administration for fourteen years at another financial institution. She received a Bachelor of Science Degree in Accounting from Fort Hays State University.
Robin E. Robeson is Executive Vice President and Chief Operating Officer of the Bank. She joined the Bank in July 2012. Ms. Robeson has over 25 years of experience in the financial services industry and 3 years of executive management experience in the technology industry. She has a Bachelor of Art Degree in Communication from the University of Missouri-Columbia and a Master of Business Administration Degree from Drury University. In addition, Ms. Robeson was awarded the Certified Trust & Financial Advisor (CTFA) professional designation from the Institute of Certified Bankers. She currently serves on the Springfield Area Chamber of Commerce Board of Directors and is a member of the Executive Advisory Council for the Missouri State University College of Business. She previously served as board Vice Chairman for City Utilities of Springfield, as Past President of the Big Brothers/Big Sisters of the Ozarks and Rotary Club of Springfield boards and as a member of the Ozarks Transportation Organization board. She is a graduate of Leadership Springfield Class XIII, and has been recognized by the Springfield Business Journal as one of the “20 Most Influential Women in Business” and been named a “40 Under 40” honoree.
As of December 31, 2017, the age of these individuals was 54 for Mr. Burke, 48 for Mr. Peters, 58 for Mr. Puls, 54 for Ms. Biser and 51 for Ms. Robeson.
Item 1A. Risk Factors
Our business and operations are subject to, and may be adversely affected by, certain risks and uncertainties. An investment in our common stock is subject to risks inherent in our business. Before making an investment decision, you should carefully consider the risks and uncertainties described below together with all of the other information included and incorporated by reference in this report. In addition to the risks and uncertainties described below, other risks and uncertainties not currently known to us or that we currently deem to be immaterial also may materially and adversely affect our business, financial condition and results of operations. The value or market price of our common stock could decline due to any of these identified or other risks, and you could lose all or part of your investment.
Failure to consummate our announced Merger with Hometown, or a delay in consummating the Merger, could negatively impact the market price of the Company’s common stock and could have a material adverse effect on the Company’s business, financial condition and results of operations.
On November 30, 2017, the Company entered into that certain Agreement and Plan of Merger with Hometown providing for the merger of Hometown with and into the Company with the Company as the surviving corporation. The Agreement provides that at a time yet to be determined but after the Merger, Hometown Bank, Hometown’s only bank subsidiary, will merge with and into and under the charter of the Bank which is the Company’s only bank subsidiary, with the Bank as the survivor of that merger. The Merger is expected to be completed in the second quarter of 2018 pending shareholder and regulatory approvals and the satisfaction of other customary closing conditions. We have incurred substantial expenses in connection with the negotiation and preparations for completion of the transactions contemplated by the Merger. If the Merger is not completed, we will have incurred these expenses without realizing the expected benefits of the Merger. If the Merger is not consummated for any reason, our ongoing business, financial condition and results of operations may be materially adversely affected and the market price of our common stock may decline significantly, particularly to the extent that the current market price reflects a market assumption that the Merger will be consummated. If the consummation of the Merger is delayed, including by the receipt of a competing acquisition proposal or by reason of litigation, our business, financial condition and results of operations may also be materially adversely affected. In addition, our business may have been impacted adversely by the failure to pursue other beneficial opportunities due to the focus of management on the Merger without realizing any of the anticipated benefits of completing the Merger.
We may fail to realize the anticipated benefits of the Merger.
The success of the Merger will depend on, among other things, our ability to combine the business of Hometown Bank with our business. If we are not able to successfully achieve this objective, the anticipated benefits of the Merger may not be realized fully, or at all, or may take longer to realize than expected. Hometown and Hometown Bank have each operated and, until the consummation of the Merger, will continue to operate independently. It is possible that the integration process or other factors could result in the loss or departure of key employees, the disruption of our ongoing business or inconsistencies in standards, controls, procedures and policies. It is also possible that clients, customers, depositors and counterparties of Hometown Bank could choose to discontinue their relationships with the combined company post-merger, which would adversely affect the future performance of the combined company. These transition matters could have an adverse effect on us, Hometown and Hometown Bank during the pre-merger period and for an undetermined time after the consummation of the Merger.
Guaranty Federal Bancshares, Inc., the Bank, Hometown and Hometown Bank will be subject to business uncertainties and contractual restrictions while the Merger is pending that could adversely affect their respective businesses.
The parties’ efforts to complete the Merger could cause substantial disruptions in the Company, the Bank, Hometown and Hometown Bank’s respective businesses, which could have an adverse effect on their respective financial results. Among other things, uncertainty as to whether the Merger will be completed may affect the ability of each of the parties to recruit prospective employees or to retain and motivate existing employees. Employee retention may be particularly challenging while the Merger is pending because employees may experience uncertainty about their future roles with the combined company and combined banks. Uncertainty as to the future could adversely affect the Company, the Bank, Hometown and Hometown Bank’s, respective businesses, reputation and relationships with potential depositors, borrowers and vendors. For example, vendors, customers and others who deal with the Company, the Bank, and Hometown Bank could defer decisions concerning working with that bank, or seek to change existing business relationships with such banks.
Further, a substantial amount of the attention of management and employees of each company and bank is being directed toward the completion of the Merger and thus is being diverted from such company’s day-to-day operations because matters related to the Merger (including integration planning) require substantial commitments of time and resources.
In addition, the Merger Agreement restricts Hometown and Hometown Bank from taking certain actions without the Company’s consent while the Merger is pending. These restrictions may, among other matters, prevent Hometown and Hometown Bank from pursuing otherwise attractive business opportunities, selling assets, entering into other transactions or making other changes to its respective business prior to consummation of the Merger or termination of the Merger Agreement. These restrictions could have a material adverse effect on Hometown Bank’s business, financial condition and results of operations pre-Merger reducing Hometown Bank’s value at the time of the Merger.
The Merger Agreement may be terminated in accordance with its terms and the Merger may not be completed.
The Merger Agreement is subject to a number of conditions which must be fulfilled in order to complete it. Those conditions include: approval of the Merger Agreement by the shareholders of Hometown, receipt of requisite regulatory approvals subject to certain limitations set forth in the Merger Agreement, absence of orders prohibiting completion of the mergers, the continued accuracy of the representations and warranties by the parties, and the performance by the parties of their covenants and obligations. These conditions to the closing of the Mergers may not be fulfilled and, accordingly, the Mergers may not be completed. Under the Merger Agreement, if the Merger is not completed at or before June 30, 2018, either party to the Merger Agreement may choose not to proceed with the Merger, and the parties can mutually decide to terminate the Merger Agreement at any time, before or after shareholder approval. In addition, under the Merger Agreement Guaranty Federal or Hometown, as applicable, may elect to terminate the Merger Agreement in certain other circumstances. If the Merger Agreement is terminated by one party due to breaches of its representations, warranties, covenants or agreements in any material respect by the other party that would result in the failure of a closing condition that has not or cannot be cured, the breaching party may be required to pay the terminating party $200,000.
If the Company terminates the Merger Agreement for fiduciary duty reasons in connection with an acquisition proposal from another potential acquirer, Hometown may be required to pay the Company $220,000.
Failure to complete the Mergers could negatively impact our businesses, financial condition, results of operations and/or stock prices.
If the Merger Agreement is terminated and the Merger is not completed, our ongoing business may be adversely affected. The market price of our common stock may decline to the extent that the current market price reflects a market assumption that the Merger will be completed. In addition, we may experience negative reactions to the termination of the Merger from customers, depositors, investors, vendors and others with whom they deal, and we would not realize any of the anticipated benefits of having completed the Merger. The expenses we have incurred in connection with the Merger, such as legal and accounting fees, must be paid even if the Merger is not completed and may not be recovered from the other party.
We expect to incur significant expenses related to the Merger.
We have and expect to incur significant expenses in connection with consummation of the Merger and combining the business, operations, networks, systems, technologies, policies and procedures of Hometown and Hometown Bank. Although we have assumed that a certain level of transaction and combination expenses would be incurred, there are a number of factors beyond our control that could affect the total amount or the timing of our expenses. Many of the expenses that will be incurred, by their nature, are difficult to estimate accurately at the present time. Due to these factors, the transaction and combination expenses associated with the Merger could, particularly in the near term, exceed the savings that we expect to achieve from the elimination of duplicative expenses and the realization of economies of scale and cost savings related to the combination of the businesses following the consummation of the Merger. As a result of these expenses, we have taken and expect to take charges against our earnings before and after the completion of the Merger. The charges taken in connection with the Merger is expected to be significant, although the aggregate amount and timing of such charges are uncertain at present.
Our business is concentrated in and largely dependent upon the continued growth and welfare of the general geographical markets in which we operate.
Our operations are heavily concentrated in the Greene, Christian and Jasper Counties, which are in the southwestern corner of Missouri, including the cities of Springfield, Nixa, Ozark and Joplin, Missouri (our “Market Area”). Our success depends to a significant extent upon the business activity, population, income levels, deposits and real estate activity in these markets. Although our customers' business and financial interests may extend well beyond these market areas, adverse economic conditions that affect these market areas could reduce our growth rate, affect the ability of our customers to repay their loans to us, affect the value of collateral underlying loans and generally affect our financial condition and results of operations. Because of our geographic concentration, we are less able than other regional or national financial institutions to diversify our credit risks across multiple markets.
Our loan/lease portfolio possesses increased risk due to our relatively high concentration of real estate loans, which involve risks specific to real estate values.
Real estate lending comprises a significant portion of our lending business. Real estate loans were $520.1 million, or approximately 81% of our total loan/lease portfolio, as of December 31, 2017. The market value of real estate securing our real estate loans can fluctuate significantly in a short period of time as a result of market conditions in our Market Area which is where most of the real estate on which our real estate loans are made is located. Adverse developments affecting real estate values in our Market Area could increase the credit risk associated with our loan portfolio. Additionally, real estate lending typically involves higher loan principal amounts and the repayment of the loans generally is dependent, in large part, on sufficient income from the properties securing the loans to cover operating expenses and debt service. Economic events or governmental regulations outside of our control or that of our borrowers could negatively impact the future cash flow and market values of the affected properties impairing the ability of our borrowers to repay their loans which could materially and adversely affect the Bank’s financial condition and results of operations depending on the severity of the economic downturn or the nature of the regulatory changes.
Deterioration in asset quality could have an adverse impact on our business.
A significant source of risk for us arises from the possibility that losses will be sustained because borrowers, guarantors and related parties may fail to perform in accordance with the terms of their loans. With respect to secured loans, the collateral securing the repayment of these loans includes a wide variety of diverse real and personal property that may be affected by changes in prevailing economic, environmental and other conditions, including declines in the value of real estate, changes in interest rates, changes in monetary and fiscal policies of the federal government, environmental contamination (as discussed in more detail below) and other external events. In addition, decreases in real estate values due to the nature of the Bank’s loan portfolio (discussed above) could affect the ability of customers to repay their loans. The Bank’s loan policies and procedures may not prevent unexpected losses that could have a material adverse effect on our business, financial condition, results of operation or liquidity.
We are subject to environmental liability risk associated with real estate collateral securing our loans.
A significant portion of our loan portfolio is secured by real property. Under certain circumstances, we may take title to the real property collateral through foreclosure or other means. As the titleholder of the property, we may be responsible for environmental risks, such as hazardous materials, which attach to the property. For these reasons, prior to extending credit, we conduct an environmental review to identify any known environmental risks associated with the real property that will secure our loans. In addition, we routinely inspect properties prior to foreclosing. If environmental risks are found, environmental laws and regulations may prescribe our approach to remediation. As a result, while we have ownership of a property, we may incur substantial expense and bear potential liability for any damages caused. The environmental risks may also materially reduce the property’s value or limit our ability to use or sell the property. We also cannot guarantee that our environmental review will detect all environmental issues relating to a property, which could subject us to additional liability.
Our loan portfolio possesses increased risk due to the percentage of commercial real estate loans and commercial business loans.
Our loan portfolio includes a significant amount of commercial real estate loans and commercial business loans. The credit risk related to these types of loans is considered to be greater than the risk related to owner-occupied residential real estate loans or consumer loans because commercial loans often have larger balances, and repayment usually depends on the borrowers’ successful business operations. The underlying commercial real estate values, customer cash flow and payment expectations on such loans can be more easily influenced by adverse conditions in the related industries, the real estate market or in the economy in general. Any significant deterioration in the credit quality of the commercial loan portfolio or underlying collateral values would have a material adverse effect on our financial condition and results of operation.
Our future success is dependent on our ability to compete effectively in the highly competitive banking industry.
We face competition in attracting and retaining deposits, making loans, and providing other financial services throughout our market area. Our competitors include other community banks, regional and super-regional banking institutions, national banking institutions, and a wide range of other financial institutions such as credit unions, government-sponsored enterprises, mutual fund companies, insurance companies, brokerage companies, and other non-bank businesses. Many of these competitors have substantially greater resources than we do and some are not subject to the same regulatory restrictions as we are. Many of our competitors compete across geographic boundaries and are able to provide customers with a feasible alternative to traditional banking services.
As we try to meet our competitors’ terms and pricing, increased competition in our markets may result in:
|
● |
interest rate changes to various types of accounts; |
|
● |
a decrease in the amounts of our loans and deposits; |
|
● |
reduced spreads between loan rates and deposit rates; or |
|
● |
loan terms that are more favorable to the borrower and less favorable to the Bank. |
Any of these results could have a material adverse effect on our ability to grow and remain profitable. If increased competition causes us to significantly discount the interest rates we offer on loans or increase the amount we pay on deposits, our net interest income could be adversely impacted.
Our operations are concentrated in one subsidiary bank; an event or a series of events having a material adverse impact on the financial condition and results of operations of the Bank would have a material adverse impact on our financial condition and results of operation and, accordingly, on your investment in us.
As a holding company with only one subsidiary bank, our investment risk is concentrated in just one primary operating asset in a relatively small geographic location. A substantial portion of our cash flow comes from dividends paid directly to us by the Bank. If and to the extent our Bank is not successful or an event were to occur that prevents it or hinders it from operating effectively, our financial condition and results of operation could be materially and adversely impacted. Larger bank holding companies with more subsidiary banks or bank facilities and which are more geographically dispersed are not as susceptible to the concentrated risks we are if one of their subsidiary banks or facilities was not able to operate effectively.
Cybersecurity threats and data breaches could adversely impact our financial condition as well as cause legal or reputational harm.
Our operations are heavily dependent on the secure processing, transmission, and storage of confidential and other information in our computer systems and networks. Cybersecurity risks for banking organizations have significantly increased in recent years due to the proliferation of new technologies, the increased use of the internet to conduct financial transactions, and the increased sophistication of attackers, such as hackers. In addition, customers may use personal mobile or computing devices to access our products or services that are outside of our network environment and are subject to their own cybersecurity risks
A cyberattack, security breach, or a technology failure could adversely affect our ability to conduct our business, result in the disclosure or misuse of confidential information, cause us to spend significant resources to investigate and remediate exposures, and adversely impact our operations and liquidity. We may also be subject to litigation and financial losses and we could suffer reputational harm and a loss of confidence in our systems and products.
Although we have established policies and procedures to prevent or limit the impact of data incidents, the security of our computer systems, software, and networks may be vulnerable to breaches, unauthorized access, misuse, or other cyberattacks. Security compromises could include computer viruses, malicious or destructive code, phishing attacks, denial of service or information or other security breaches that could result in the unauthorized collection, monitoring, release, use, loss or destruction of confidential, proprietary and other information of ours, our customers or third parties, damages to systems.
We rely on our employees and third parties in our day-to-day and ongoing operations, who may, as a result of human error, misconduct, malfeasance or failure, or breach of systems or infrastructure, expose us to risk. We have taken measures to implement safeguards to support our operations, but our ability to conduct business may be adversely affected by any significant disruptions to us or to third parties with whom we interact or upon whom we rely.
As cyber threats continue to evolve, we may be required to expend significant additional resources to continue to modify or enhance our protective measures or to investigate and remediate any information security vulnerabilities or incidents. Cyber threats are rapidly evolving and we may not be able to anticipate or prevent all such attacks. There can be no reassurance that we will not be subject to a data breach and our security measures may not detect all cyberattacks. A cyberattack or other information or security breach could result in a material loss or have material consequences on our business.”
We depend upon third-party vendors for a significant portion of our operations.
We rely on third-party service providers for a substantial portion of our operations, including communication, record retention, and financial control systems technology. While we endeavor to select reliable and competent vendors, we cannot control our vendors or their actions. The potential for operational risk exposure exists because of our interactions with, and reliance on, third parties in our daily and ongoing operations. Any problems caused by or suffered by a third-party vendor, including a vendor’s failure to provide contracted services, poor performance by a vendor, disruption of a vendor’s business operations, or otherwise, could materially and adversely affect our ability to serve our customers or to conduct our business efficiently and effectively. Replacing a vendor could entail significant delay and expense.
Our third-party vendors are also subject to the cybersecurity risks discussed above. A cyberattack, information or security breach, or a technology failure of a third-party vendor could have a material adverse effect on our business. Although we review the security practices of third-parties before contracting with them, we cannot control their systems or security. If our data or the data of our customers is improperly accessed, used, transmitted, or otherwise obtained because of, or due in part to, actions or inactions caused by our third-party vendors, we could face significant operational harm, legal and financial exposure, and reputational damage.”
We continually encounter technological change, and we cannot predict how changes in technology will affect our business.
The financial services industry is continually undergoing rapid technological change with frequent introductions of new technology-driven products and services. The effective use of technology increases efficiency and enables financial institutions to better serve customers and reduce costs. Our future success will depend, in part, upon our ability to address the needs of our customers by using technology to provide products and services that will satisfy customer demands for convenience, as well as to create additional efficiencies in our operations. Many of our competitors have substantially greater resources to invest in technological improvements than we do. We may not be able to effectively implement new technology-driven products and services or be successful in marketing these products and services to our customers. Failure to successfully keep pace with technological change affecting the financial services industry could have a material adverse effect on our business and, in turn, our financial condition and results of operations.
Rapidly changing interest rate environments could reduce our net interest margin and otherwise negatively impact our results of operations.
Interest and fees on loans and securities, net of interest paid on deposits and borrowings, are a large part of our net income. Interest rates are the key drivers of our net interest margin and are subject to many factors beyond the control of management. As interest rates change, our net interest income is affected. Rapid increases in interest rates in the future could result in our interest expense increasing faster than interest income because of mismatches in the maturities of our assets and liabilities. Furthermore, substantially higher rates generally reduce loan demand and may result in slower loan growth for us. Decreases or increases in interest rates could have a negative effect on the spreads between our interest rates earned on assets and our rates of interest paid on liabilities, and therefore decrease our net interest income, which would have a material adverse effect on our financial condition and results of operation.
Interest rate changes may affect borrowers’ repayment schedules, negatively impacting our financial condition.
Interest rate increases often result in larger payment requirements for our borrowers, which increase the potential for default. At the same time, the marketability of underlying collateral may be adversely affected by any reduced demand resulting from higher interest rates. In a declining interest rate environment, there may be an increase in prepayments on certain of our loans as borrowers refinance at lower rates. Fluctuation in interest rates may therefore change borrowers’ timing of repayment of, or ability to repay loans, which could have a material adverse impact on our financial condition.
Changes in interest rates could negatively impact our nonperforming assets, decreasing net interest income.
Changes in interest rates also can affect the value of loans. An increase in interest rates that adversely affects the ability of borrowers to pay the principal or interest on loans may lead to an increase in our nonperforming assets and a reduction of income recognized, which could have a material adverse effect on our results of operations and cash flows. Further, when we place a loan on nonaccrual status, we reverse any accrued but unpaid interest receivable, which decreases interest income. Subsequently, we continue to have a cost to fund the loan, which is reflected as interest expense, without any interest income to offset the associated funding expense. Thus, an increase in the amount of nonperforming assets resulting from changes in interest rates would have an adverse impact on net interest income, which could have a material adverse effect on our financial condition and results of operation.
The financial condition of the Bank’s customers and borrowers could adversely affect the Bank’s liquidity.
Two of the Bank’s primary sources of funds are customer deposits and loan repayments. Customer deposit levels may also be affected by a number of factors, including the competitive interest rate environment in both the national market and our Market Area, local and national economic conditions, natural disasters and other various events. Though scheduled loan repayments are a relatively stable source of liquidity, they are subject to the borrowers’ ability to repay their loans. The ability of the borrowers to repay their loans can be adversely affected by a number of factors, including changes in the economic conditions, adverse trends or events affecting the business environment, natural disasters and various other factors. The inability of borrowers to repay their loans or a decline in customer deposits would, depending on the extent of the loan defaults or decline in customer deposits, materially and adversely affect our liquidity and financial condition.
Liquidity needs could adversely affect our results of operations and financial condition.
Adequate liquidity is critical in our ability to meet the needs of our customers. An inability to access funding through customer deposits, available borrowings, sales of loans or investments could have an adverse effect on our liquidity. Furthermore, regional and community banks, including the Bank, generally have less access to the capital markets, than do the national and super-regional banks because of their smaller size and limited analyst coverage. Any significant decline in available funding could adversely impact our ability in the future to originate loans, invest in securities, meet our expenses, pay dividends to our stockholders, or fulfill obligations such as repaying our borrowings or meeting deposit withdrawal demands, any of which could have a material adverse impact on our liquidity, business, results of operations and financial condition.
A decrease in cash flows from our investment portfolio may adversely affect our liquidity.
Another primary source of liquidity for the Bank is cash flows from investment securities. Cash flows from the investment portfolio may be affected by changes in interest rates, resulting in excessive levels of cash flow during periods of declining interest rates and lower levels of cash flow during periods of rising interest rates. These changes may be beyond our control and could significantly influence our available cash.
If we are required to rely on secondary sources of liquidity, those sources may not be immediately available.
We may be required from time to time to rely on secondary sources of liquidity to meet withdrawal demands or otherwise fund operations. Such sources include the FHLB advances, brokered deposits and federal funds lines of credit from correspondent banks. Our ability to borrow could be impaired by factors that are not specific to us, such as severe disruption of the financial markets or negative publicity about the financial services industry as a whole. We may also be required to pledge investments as collateral to borrow money from third parties. In certain cases, we may be required to sell investment instruments for sizable losses to meet liquidity needs, thereby reducing interest income and resultantly net income. While we believe that we are currently sufficiently liquid, there can be no assurance we will not in the future be required to turn to these secondary sources of liquidity which may not be available or only at costs that could materially and adversely affect our financial condition and results of operation.
Inability to hire or retain certain key professionals, management and staff could adversely affect our revenues, net income and growth plans.
Our performance is largely dependent on the talents and efforts of highly skilled individuals and their ability to attract and retain customer relationships in a community bank environment. We rely on key personnel to manage and operate our business, including major revenue generating functions such as our loan and deposit portfolios. None of our employees, including those who comprise our key management team, are subject to employment contracts with us. Such employees are at-will and thus are not restricted from terminating their employment. The lack of employment contracts with key employees could have a material adverse impact on our ability to retain such employees. The loss of key management or our key loan officers with their contacts in the business communities within our Market Area may adversely affect our ability to maintain and manage these portfolios effectively, which could negatively affect our revenues.
If we do struggle with employee retention, our success may also be impacted if we are unable to recruit replacement management and key employees in a reasonable amount of time. There is intense competition in the financial services industry for qualified employees. In addition, loss of key personnel could result in increased recruiting, hiring, and training expenses, resulting in lower net income.
We are subject to certain operational risks, including, but not limited to, customer or employee fraud.
Employee errors and employee and customer misconduct could subject us to financial losses, regulatory sanctions, lawsuits and seriously harm our reputation. Misconduct by our employees could include hiding unauthorized activities from us, improper or unauthorized activities on behalf of our customers, or improper use of confidential information. We maintain a system of internal controls and insurance coverage to mitigate against operational risks. However, if our internal controls fail to prevent or detect an occurrence, or if any resulting loss is not insured or exceeds applicable insurance limits, such failures could have a material adverse effect on our business, financial condition and results of operations.
We are subject to extensive regulation that may significantly affect our operations or earnings.
We are subject to significant federal and state regulation and supervision, as discussed in more detail below, which is primarily for the benefit and protection of the Bank’s customers and not for the benefit of investors. As a result, various statutory provisions restrict the amount of dividends our Bank subsidiary can pay to us without regulatory approval. Our regulatory compliance is costly. We are subject to examination, supervision, and comprehensive regulation by various agencies, including the FRB, the MDF and FDIC. These regulators have broad discretion in their supervisory and enforcement activities. We are also subject to capitalization guidelines established by our regulators, as discussed below, which require that we and the Bank maintain adequate capital to support our growth and the Bank’s growth. To the extent our activities and/or the Bank’s activities are restricted or limited by regulation or regulators’ supervisory authority, our future profitability may be adversely affected.
An uncertain regulatory environment could impact our business, financial performance, and results of operations.
Many aspects of the Dodd-Frank Act are subject to continued rulemaking and will take effect over several years, making it difficult to anticipate the overall financial impact on us. The U.S. Congress continues to propose new legislation that could increase or change regulation of the financial services industry and impact the operations of the Bank or Company.
On February 3, 2017, President Trump signed Executive Order 13772 announcing new “Core Principles” for regulating the U.S. financial system. Among other things, the President directed the Secretary of the Treasury, in consultation with federal regulatory agencies, to review existing laws and regulations and report on the extent to which they were consistent with the Core Principles. The Trump administration has also indicated in public statements that the Dodd-Frank Act will be under scrutiny and that some of its provisions and the rules promulgated thereunder may be revised, repealed or amended. It is not clear when, or if, changes to existing statutory or regulatory requirements may be implemented.
The implementation, amendment, or repeal of federal financial services laws or regulations may impact our profitability, limit our business opportunities, impose additional costs, or otherwise adversely affect our business. Any changes may also require us to invest management attention and resources to achieve compliance. In addition, any proposed legislative or regulatory changes that could benefit our business may not occur in the timeframe proposed, may appear different in final form than proposed, or may not occur at all.”
Changes in federal or state regulation may increase our costs.
The laws, regulations, policies, and interpretations that govern our industry are constantly evolving and may change significantly over time. The Dodd-Frank Act reshaped regulation of banking institutions and the numerous requirements stemming from the Dodd-Frank Act have resulted in increased compliance costs for institutions both large and small, including us and the Bank. As these regulations continue to be implemented, interpreted, and enforced, our compliance must evolve as well. The CFPB has shown that it is a proactive agency and we anticipate that the CFPB will continue to expand its supervisory and enforcement authority into new areas and to issue new rules and guidance.
We cannot predict the nature or effect of current or proposed legislative or regulatory changes on us or the Bank with any certainty. Changes in laws or regulations could impact our business practices and profitability. We also cannot predict the cost of new compliance that may be required to keep pace with industry regulatory changes.
Decreases in capital and changes to the formulas for calculating adequate capital may negatively impact us or result in increased regulatory supervision.
Federal rules require banking institutions to maintain an adequate level of regulatory capital (net assets available to absorb losses). Due to the risks associated with the industry, banking institutions are generally required to hold more capital than other businesses. Revised minimum capital adequacy requirements under the Basel III Rule became effective for us and the Bank on January 1, 2015, with additional requirements, such as the capital conservation buffer (discussed below), to be phased in over the next few years. The new requirements change the definition of capital, increase minimum required risk-based capital ratios, and increase the risk-weights for certain assets. Cumulatively, the Basel III Rule is more stringent than prior requirements and requires financial institutions to hold more and better capital against their assets, decreasing the size of their balance sheets. Although the impact on us has been minimal to date, we cannot guarantee that will continue.
Financial institutions must maintain a 2.5% capital conservation buffer comprised of CET1 Capital above the minimum risk-based capital requirements. The buffer must be maintained in order to avoid limitations on capital distributions and discretionary bonus payments to executive officers. If we or the Bank dip below the capital conservation buffer, we or the Bank could be subject to increasingly strict limitations on capital distributions and bonus payments.
Federal law provides regulators with broad powers to take "prompt corrective action" to resolve capital deficiencies at insured depository institutions that do not meet minimum capital requirements. There are five capital tiers: "well capitalized," "adequately capitalized," "undercapitalized," "significantly undercapitalized" and "critically undercapitalized." As an institution’s capital levels deteriorates and it falls below the “well capitalized” threshold, such institution faces increasing penalties. Regulator’s corrective powers include, but are not limited to:
|
● |
requiring a waiver to accept brokered deposits; |
|
● |
requiring submission of a capital plan; |
|
● |
limiting growth or restricting activities; |
|
● |
requiring the issuance of additional capital stock; |
|
● |
restricting transactions with affiliates; |
|
● |
prohibiting executive bonuses or raises; |
|
● |
prohibiting the payment of subordinated debt; and |
|
● |
appointing a receiver. |
Accordingly, we and the Bank could be subject to regulatory penalties and restrictions if capital falls below certain minimum thresholds.
Management’s analysis of the necessary funding for the allowance for loan loss account may be incorrect or may suddenly change resulting in lower earnings.
The funding of the allowance for loan loss account is the most significant estimate made by management in its financial reporting to stockholders and regulators. The determination of the appropriate level of the allowance for loan losses involves a high degree of subjectivity and requires us to make significant estimates of current credit risks and future trends, all of which are subject to material changes.
Although management believes that the allowance for loan/lease losses as of December 31, 2017 was adequate to absorb losses on any existing loans/leases that may become uncollectible, we cannot predict loan losses with certainty, and we cannot assure you that our allowance for loan losses will prove sufficient to cover actual loan losses in the future, particularly if economic conditions are more difficult than management currently expects. If negative changes to the performance of our loan portfolio were to occur, management may find it necessary to or be required to fund the allowance for loan loss account through additional charges to our provision for loan loss expense. These changes may occur suddenly and be dramatic in nature. Additional provisions to the allowance for loan losses and loan losses in excess of said allowance may adversely affect our business, financial condition and results of operations.
Monetary policies and regulations of the Federal Reserve could adversely affect our business, financial condition and results of operations.
In addition to being affected by general economic conditions, including economic conditions specifically in our Market Area, our earnings and growth are affected by the policies of the Federal Reserve. An important function of the Federal Reserve is to regulate the money supply and credit conditions. Among the instruments used by the Federal Reserve to implement these objectives are open market operations in U.S. government securities, adjustments of the discount rate and changes in reserve requirements against bank deposits. These instruments are used in varying combinations to influence overall economic growth and the distribution of credit, bank loans, investments and deposits. Their use also affects interest rates charged on loans or paid on deposits.
The effects of the monetary policies and regulations of the Federal Reserve upon our business, financial condition and results of operations in the future cannot be predicted, but have had a significant effect on the operating results of commercial banks, including our Bank, in the past.
Anti-takeover provisions could negatively impact our stockholders.
Provisions in our governing documents, the General Corporation Law of the State of Delaware (the “DGCL”) and federal regulations could delay or prevent a third party from acquiring us, despite the possible benefit to our stockholders. These provisions include, but are not limited to:
|
● |
a prohibition on voting shares of common stock beneficially owned in excess of 10% of total shares outstanding without prior Board approval; |
|
● |
supermajority voting requirements for certain business combinations with any person who beneficially owns 10% or more of our outstanding common stock; |
|
● |
the election of directors to staggered terms of three years; |
|
● |
advance notice requirements for director nominations and for proposing matters that stockholders may act on at stockholder meetings; |
|
● |
a requirement that only directors may fill a vacancy in our Board of Directors; and |
|
● |
supermajority voting requirements to remove any of our directors. |
In addition, because we are a bank holding company, purchasers of 10% or more of our common stock may be required to obtain approvals under the Change in Bank Control Act of 1978, as amended, or the Bank Holding Company Act of 1956, as amended (the “BHCA”), and in certain cases such approvals may be required at a lesser percentage of ownership.
These provisions may discourage potential takeover attempts, discourage bids for our common stock at a premium over market price or adversely affect the market price of, and the voting and other rights of the holders of, our common stock. These provisions could also discourage proxy contests and make it more difficult for holders of our common stock to elect directors other than the candidates nominated by our Board of Directors.
There are restrictions on our ability to pay dividends on and repurchase our common stock.
Holders of our common stock are entitled to receive dividends only when, as and if declared by our Board of Directors. Our ability to pay dividends is limited by Delaware law, as well as regulatory restrictions and the need to maintain sufficient consolidated capital. The ability of the Bank to pay dividends to us is limited by its obligation to maintain sufficient capital and liquidity and by other general restrictions on dividends that are applicable to the Bank. If current or any future regulatory requirements are not met, the Bank will not be able to pay dividends to us, and we may be unable to pay dividends on our common stock.
The DGCL provides that dividends by a Delaware corporation may be paid only from: (1) “surplus” determined in the manner described in the DGCL, or (2) in case there is no “surplus,” net profits for the fiscal year in which the dividend is declared and/or the preceding fiscal year. Dividends paid from the second source may not be paid unless the capital represented by the issued and outstanding stock of all classes having a preference upon the distribution of assets at current market value is intact.
Moreover, as a bank holding company, our ability to declare and pay dividends is subject to the guidelines of the Federal Reserve regarding capital adequacy and dividends. The Federal Reserve guidelines generally require us to review the effects of the cash payment of dividends on common stock and other Tier 1 capital instruments (i.e., perpetual preferred stock and trust preferred debt) in light of our earnings, capital adequacy and financial condition. As a general matter, the Federal Reserve indicates that the Board of Directors of a bank holding company should eliminate, defer or significantly reduce the dividends if:
|
● |
the company’s net income available to stockholders for the past four quarters, net of dividends previously paid during that period, is not sufficient to fully fund the dividends; |
|
● |
the prospective rate of earnings retention is inconsistent with the company’s capital needs and overall current and prospective financial condition; or |
|
● |
the company will not meet, or is in danger of not meeting, its minimum regulatory capital adequacy ratios. |
In the future, if we default on certain of our outstanding debts, we will be prohibited from making dividend payments on our common stock until such payments have been brought current.
Failure to pay interest on our debt may adversely impact our ability to pay common stock dividends.
As of December 31, 2017, we had $15.5 million of junior subordinated debentures held by two Trusts. Interest payments on the Company’s existing debentures, which totaled $631,000 for 2017, must be paid before the Company can pay dividends on its capital stock, including its common stock. The Company has the right to defer interest payments on the debentures for up to 20 consecutive quarters. However, if it elects to defer interest payments, all deferred interest must be paid before the Company can pay dividends on its capital stock.
Although the Company expects to be able to pay all required interest on the junior subordinated debentures, there is no guarantee that it will be able to do so.
There is a limited trading market for our common stock, and you may not be able to resell your shares at or above the price you paid for them.
Although our common stock is listed for trading on the NASDAQ Global Market, it has a low average daily trading volume relative to many other stocks whose shares are also quoted on the NASDAQ Global Market. A public trading market having the desired characteristics of depth, liquidity and orderliness depends on the presence in the market of willing buyers and sellers of our common stock at any given time. This presence depends on the individual decisions of investors and general economic and market conditions over which we have no control. We cannot assure you that the volume of trading in our common stock will increase in the future.
Additionally, general market forces may have a negative effect on our stock price, independent of factors affecting our stock specifically. Factors beyond our control, including price and trading fluctuation, can significantly influence the fair value of securities in our portfolio and can cause potential adverse changes to the fair value of these securities. These conditions may result in (i) volatility in the level of, and fluctuations in, the market prices of stocks generally and, in turn, our common stock and (ii) sales of substantial amounts of our common stock in the market, in each case that could be unrelated or disproportionate to changes in our operating performance. These broad market fluctuations may adversely affect the market value of our common stock.
The soundness of other financial institutions could negatively affect our business.
Our ability to engage in routine funding and other transactions could be negatively affected by the actions and commercial soundness of other financial institutions. Financial services institutions, including the Bank, are interrelated as a result of trading, clearing, counterparty or other relationships. Defaults by, or even rumors or questions about, one or more financial services institutions, or the financial services industry generally, have led to market-wide liquidity problems and losses of depositor, creditor and counterparty confidence and could lead to losses or defaults by us or by other institutions. We could experience increases in deposits and assets as a result of the difficulties or failures of other banks, which would increase the capital we need to support our growth. There can be no assurance that we could raise the necessary capital to support our growth or on terms satisfactory to us.
We face legal risks, both from regulatory investigations and proceedings and from private actions brought against us.
We could in the future become subject to lawsuits or regulatory proceedings challenging the legality of our lending or business practices. Future actions against us may result in judgments, settlements, fines, penalties or other results adverse to us, which could materially adversely affect our business, financial condition or results of operations, or cause serious reputational harm to us. As a participant in the financial services industry, we are exposed to a high level of potential litigation related to our businesses and operations. Although we maintain insurance, the scope of this coverage may not provide us with full, or even partial, coverage in any particular case.
Our businesses and operations are also subject to increasing regulatory oversight and scrutiny, which may lead to additional regulatory investigations or enforcement actions. These and other initiatives from federal and state officials may subject us to further judgments, settlements, fines or penalties, or cause us to be required to restructure our operations and activities, all of which could lead to reputational issues, or higher operational costs, thereby reducing our revenue.
Our reputation could be damaged by negative publicity.
Reputational risk, or the risk to us from negative publicity, is inherent in our business. Negative publicity can result from actual or alleged conduct in a number of areas, including legal and regulatory compliance, lending practices, corporate governance, litigation, inadequate protection of customer data, ethical behavior of our employees, and from actions taken by regulators, ratings agencies and others as a result of that conduct. Damage to our reputation could impact our ability to attract new or maintain existing loan and deposit customers, employees and business relationships.
Changes in the federal or state tax laws may negatively impact our financial performance.
We are subject to tax law changes that could increase the effective tax rate payable to the state or federal government. These changes may be retroactive to previous periods and as a result, could negatively affect our current and future financial performance. On December 22, 2017, President Trump signed into law The Tax Cuts and Jobs Act (“Tax Act”), which among other actions reduces the federal corporate tax rate to 21% from 35% effective January 1, 2018, which will have a favorable impact on the Company’s net income going forward. As a result, income tax expense recorded in 2017 included a $1.0 million reduction to deferred tax assets. The Company’s customers are likely to experience varying effects from both the individual and business tax provisions of the Tax Act, which could adversely impact demand for the Company’s products and services. The Company continues to examine the impact this tax reform legislation may have on its financial condition and results of operations.”
The preparation of our consolidated financial statements requires us to make estimates and judgments, which are subject to an inherent degree of uncertainty and which may differ from actual results.
Our consolidated financial statements are prepared in accordance with generally accepted accounting principles and general reporting practices within the U.S. financial services industry, which require us to make estimates and judgments that affect the reported amounts of assets, liabilities, revenues and expenses and related disclosure of contingent assets and liabilities. Some accounting policies, such as those pertaining to our allowance for loan losses, require the application of significant judgment by management in selecting the appropriate assumptions for calculating financial estimates. By their nature, these estimates and judgments are subject to an inherent degree of uncertainty and actual results may differ from these estimates and judgments under different assumptions or conditions. If actual results vary significantly, there may be a material adverse effect on our financial condition or results of operations in subsequent periods.
Item 1B. Unresolved Staff Comments
Not applicable.
Item 2. Properties
The following table sets forth certain information concerning the Bank’s facilities as of December 31, 2017. All buildings owned are free of encumbrances or mortgages. The Bank’s facilities are well maintained and considered adequate for the foreseeable future.
|
Lease |
||||||
|
Expiration |
||||||
|
Year |
Owned or |
(Including any |
||||
|
Location |
Opened |
|
Leased |
|
renewal options) |
|
|
Main Office |
||||||
|
2144 E Republic Rd, Ste F200 |
Springfield, Missouri 65804 |
2017 |
Leased |
2047 |
||
|
Operations Center |
||||||
|
1414 W Elfindale |
Springfield, Missouri 65807 |
2009 |
Owned |
N/A |
||
|
Banking Center Offices |
||||||
|
1341 W Battlefield Road |
Springfield, Missouri 65807 |
1995 |
Leased |
2048 |
||
|
1510 E Sunshine |
Springfield, Missouri 65804 |
1979 |
Owned |
N/A |
||
|
2109 N Glenstone |
Springfield, Missouri 65803 |
1987 |
Owned |
N/A |
||
|
4343 S National |
Springfield, Missouri 65810 |
2000 |
Owned |
N/A |
||
|
1905 W Kearney |
Springfield, Missouri 65803 |
2004 |
Leased* |
2044 |
||
|
2155 W Republic Road |
Springfield, Missouri 65807 |
2006 |
Leased* |
2046 |
||
|
709 W Mt. Vernon |
Nixa, Missouri 65714 |
2005 |
Leased* |
2044 |
||
|
291 East Hwy CC |
Nixa, Missouri 65714 |
2008 |
Leased* |
2038 |
||
|
1701 W State Hwy J |
Ozark, Missouri 65721 |
2008 |
Owned |
N/A |
||
|
2639 E 32nd St, Suite R |
Joplin, Missouri 64804 |
2016 |
Leased |
2018 |
||
|
Loan Production Offices |
||||||
|
1100 Spur Dr. |
Marshfield, Missouri 65706 |
2007 |
Leased |
2018 |
||
|
* Building owned with land leased. |
||||||
Item 3. Legal Proceedings
|
(a) |
Material Legal Proceedings |
The Company and the Bank, from time to time, may be parties to ordinary routine litigation, which arises in the normal course of business, such as claims to enforce liens, and condemnation proceedings, on properties in which the Bank holds security interests, claims involving the making and servicing of real property loans, and other issues incident to the business of the Company and the Bank. While the ultimate outcome of such legal proceedings cannot be predicted with certainty, after reviewing pending and threatened litigation with legal counsel, management believes at this time that the outcome of any such litigation will not have a material adverse effect on the Company’s business, financial condition or results of operations.
|
(b) |
Proceedings Terminated During the Last Quarter of the Fiscal Year Covered by This Report |
Not applicable.
Item 4. Mine Safety Disclosures
Not applicable.
PART II
Item 5. Market for Registrant's Common Equity, Related Stockholder Matters and Issuer Purchases of Equity Securities
Market Information
The common stock of Guaranty Federal Bancshares, Inc. (the “Company”) is listed for trading on the NASDAQ Global Market under the symbol “GFED”.
Shareholders
As of March 12, 2018, there were approximately 1,395 holders of shares of the Company’s common stock. At that date the Company had 6,880,386 shares of common stock issued and 4,432,176 shares of common stock outstanding.
Dividends and Common Stock Prices
The table below sets forth the cash dividends per share on the Company’s common stock for the years ended December 31, 2017 and 2016.
|
Year ended |
Year ended |
|||||||||||
|
December 31, 2017 |
December 31, 2016 |
|||||||||||
|
Declared |
Paid |
Dividend Per Share |
Declared |
Paid |
Dividend Per Share |
|||||||
|
Quarter ended: |
||||||||||||
|
March 31 |
3/24/2017 |
4/14/2017 |
$ | 0.10 |
3/24/2016 |
4/14/2016 |
$ | 0.08 | ||||
|
June 30 |
6/23/2017 |
7/13/2017 |
$ | 0.10 |
6/23/2016 |
7/5/2016 |
$ | 0.08 | ||||
|
September 30 |
9/22/2017 |
10/13/2017 |
$ | 0.10 |
9/29/2016 |
10/20/2016 |
$ | 0.08 | ||||
|
December 31 |
12/22/2017 |
1/13/2018 |
$ | 0.12 |
12/22/2016 |
1/13/2017 |
$ | 0.10 | ||||
Any future dividends will be at the discretion of the Company’s Board of Directors and will depend on, among other things, the Company’s results of operations, cash requirements and surplus, financial condition, regulatory limitations and other factors that the Company’s Board of Directors may consider relevant.
The table below reflects the range of common stock high and low sale prices per the NASDAQ Global Market by quarter for the years ended December 31, 2017 and 2016.
|
Year ended |
Year ended |
|||||||||||||||
|
December 31, 2017 |
December 31, 2016 |
|||||||||||||||
|
High |
Low |
High |
Low |
|||||||||||||
|
Quarter ended: |
||||||||||||||||
|
March 31 |
$ | 21.80 | $ | 19.06 | $ | 15.57 | $ | 14.80 | ||||||||
|
June 30 |
20.97 | 18.50 | 16.18 | 14.98 | ||||||||||||
|
September 30 |
22.65 | 20.23 | 16.90 | 16.00 | ||||||||||||
|
December 31 |
22.47 | 21.16 | 21.20 | 16.30 | ||||||||||||
Financial Performance
Set forth below is a stock performance graph comparing the cumulative total shareholder return on the Common Stock with (a) the cumulative total stockholder return on stocks included in The Nasdaq – Total U.S. Index (b) the cumulative total stockholder return on stocks included in The NASDAQ Bank Index and (c) the cumulative total stockholder return on stocks included in the SNL U.S. Bank NASDAQ. All three investment comparisons assume the investment of $100 as of the close of business on December 31, 2012 and the hypothetical value of that investment as of the Company’s fiscal years ended December 31, 2013, 2014, 2015, 2016, and 2017, assuming that all dividends were reinvested. The graph reflects the historical performance of the Common Stock, and, as a result, may not be indicative of possible future performance of the Common Stock. The data used to compile this graph was obtained from NASDAQ.
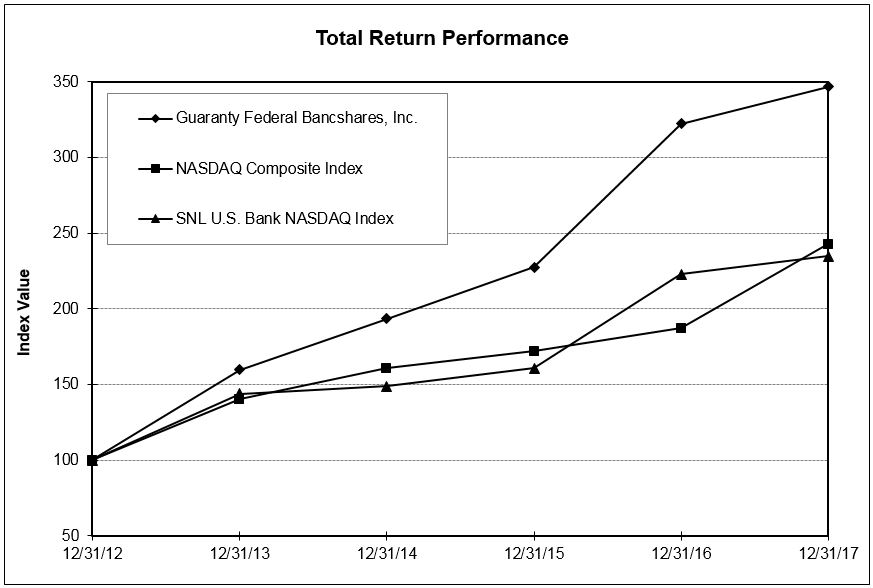
|
Period Ending |
||||||
|
Index |
12/31/12 |
12/31/13 |
12/31/14 |
12/31/15 |
12/31/16 |
12/31/17 |
|
Guaranty Federal Bancshares, Inc. |
100.00 |
159.64 |
193.42 |
227.47 |
322.27 |
346.66 |
|
NASDAQ Composite Index |
100.00 |
140.12 |
160.78 |
171.97 |
187.22 |
242.71 |
|
SNL U.S. Bank NASDAQ Index |
100.00 |
143.73 |
148.86 |
160.70 |
222.81 |
234.58 |
As a result of a change in the total return data made available to us through our vendor provider, our performance graphs going forward will be using an index provided by NASDAQ OMX Global Indexes which is comparable to the NASDAQ Bank Stock Index. Please note, information for the NASDAQ Bank Stock Index is provided only from December 31, 2012 through December 31, 2017, the last day this data was available by our third-party provider.
Securities Authorized for Issuance under Equity Compensation Plans
With respect to the equity compensation plan information required by this item, see “Item 12. Security Ownership of Certain Owners and Management and Related Stockholder Matters” in this report.
Issuer Purchases of Equity Securities
The Company has a repurchase plan which was announced on August 20, 2007. This plan authorizes the purchase by the Company of up to 350,000 shares of the Company’s common stock. There is no expiration date for this plan. There are no other repurchase plans in effect at this time. The Company had no repurchase activity of the Company’s common stock during the fourth quarter ended December 31, 2017.
Item 6. Selected Financial Data
The following tables include certain information concerning the financial position and results of operations of Guaranty Federal Bancshares, Inc. (including consolidated data from operations of Guaranty Bank) as of the dates indicated. Dollar amounts are expressed in thousands except per share.
|
Summary Balance Sheets |
As of December 31, |
|||||||||||||||||||
|
2017 |
2016 |
2015 |
2014 |
2013 |
||||||||||||||||
|
ASSETS |
||||||||||||||||||||
|
Cash and cash equivalents |
$ | 37,407 | $ | 9,088 | $ | 18,774 | $ | 12,494 | $ | 12,303 | ||||||||||
|
Investments and interest-bearing deposits |
81,495 | 92,427 | 97,336 | 86,529 | 97,772 | |||||||||||||||
|
Loans receivable, net |
631,527 | 540,457 | 492,905 | 487,801 | 465,003 | |||||||||||||||
|
Accrued interest receivable |
2,450 | 1,947 | 1,987 | 2,030 | 1,853 | |||||||||||||||
|
Prepaids and other assets |
10,950 | 11,234 | 10,121 | 11,421 | 14,204 | |||||||||||||||
|
Foreclosed assets |
283 | 2,682 | 2,392 | 3,165 | 3,822 | |||||||||||||||
|
Premises and equipment, net |
10,607 | 10,871 | 10,540 | 10,603 | 10,887 | |||||||||||||||
|
Bank owned life insurance |
19,741 | 19,273 | 18,780 | 14,417 | 14,044 | |||||||||||||||
| $ | 794,460 | $ | 687,979 | $ | 652,835 | $ | 628,460 | $ | 619,888 | |||||||||||
|
LIABILITIES |
||||||||||||||||||||
|
Deposits |
$ | 607,364 | $ | 505,363 | $ | 517,386 | $ | 479,818 | $ | 487,319 | ||||||||||
|
Federal Home Loan Bank and Federal Reserve Bank advances |
94,300 | 95,700 | 52,100 | 60,350 | 55,350 | |||||||||||||||
|
Securities sold under agreements to repurchase |
- | - | - | 10,000 | 10,000 | |||||||||||||||
|
Subordinated debentures |
15,465 | 15,465 | 15,465 | 15,465 | 15,465 | |||||||||||||||
|
Other liabilities |
2,439 | 1,477 | 1,462 | 1,350 | 1,399 | |||||||||||||||
| 719,568 | 618,005 | 586,413 | 566,983 | 569,533 | ||||||||||||||||
|
STOCKHOLDERS' EQUITY |
74,892 | 69,974 | 66,422 | 61,477 | 50,355 | |||||||||||||||
| $ | 794,460 | $ | 687,979 | $ | 652,835 | $ | 628,460 | $ | 619,888 | |||||||||||
|
Supplemental Data |
As of December 31, |
|||||||||||||||||||
|
2017 |
2016 |
2015 |
2014 |
2013 |
||||||||||||||||
|
Number of full-service offices |
11 | 9 | 9 | 9 | 9 | |||||||||||||||
|
Cash dividends per common share |
$ | 0.42 | $ | 0.34 | $ | 0.23 | $ | 0.15 | $ | - | ||||||||||
|
Summary Statements of Income |
Years ended December 31, |
|||||||||||||||||||
|
2017 |
2016 |
2015 |
2014 |
2013 |
||||||||||||||||
|
Interest income |
$ | 29,441 | $ | 25,389 | $ | 25,190 | $ | 25,014 | $ | 25,855 | ||||||||||
|
Interest expense |
6,087 | 4,177 | 4,280 | 4,329 | 5,097 | |||||||||||||||
|
Net interest income |
23,354 | 21,212 | 20,910 | 20,685 | 20,758 | |||||||||||||||
|
Provision for loan losses |
1,750 | 1,375 | 600 | 1,275 | 1,550 | |||||||||||||||
|
Net interest income after provision for loan losses |
21,604 | 19,837 | 20,310 | 19,410 | 19,208 | |||||||||||||||
|
Noninterest income |
5,727 | 4,870 | 4,478 | 3,350 | 5,319 | |||||||||||||||
|
Noninterest expense |
19,603 | 17,100 | 16,610 | 14,865 | 16,771 | |||||||||||||||
|
Income before income taxes |
7,728 | 7,607 | 8,178 | 7,895 | 7,756 | |||||||||||||||
|
Provision for income taxes |
2,570 | 2,013 | 2,461 | 2,113 | 2,516 | |||||||||||||||
|
Net income |
$ | 5,158 | $ | 5,594 | $ | 5,717 | $ | 5,782 | $ | 5,240 | ||||||||||
|
Preferred stock dividends and discount accretion |
- | - | - | 357 | 795 | |||||||||||||||
|
Net income available to common shareholders |
$ | 5,158 | $ | 5,594 | $ | 5,717 | $ | 5,425 | $ | 4,445 | ||||||||||
|
Basic income per common share |
$ | 1.18 | $ | 1.28 | $ | 1.32 | $ | 1.35 | $ | 1.63 | ||||||||||
|
Diluted income per common share |
$ | 1.16 | $ | 1.27 | $ | 1.30 | $ | 1.33 | $ | 1.58 | ||||||||||
Item 7. Management's Discussion and Analysis of Financial Condition and Results of Operations
GENERAL
Guaranty Federal Bancshares, Inc. (the “Company”) is a Delaware corporation organized on December 30, 1997 that operates as a one-bank holding company. Guaranty Bank (the “Bank”) is a wholly-owned subsidiary of the Company.
The primary activity of the Company is to oversee its investment in the Bank. The Company engages in few other activities, and the Company has no significant assets other than its investment in the Bank. For this reason, unless otherwise specified, references to the Company include the operations of the Bank. The Company’s principal business consists of attracting deposits from the general public and using such deposits to originate multi-family, construction and commercial real estate loans, mortgage loans secured by one- to four-family residences, and consumer and business loans. The Company also uses these funds to purchase government sponsored mortgage-backed securities, US government and agency obligations, and other permissible securities. When cash outflows exceed inflows, the Company uses borrowings and brokered deposits as additional financing sources.
The Company derives revenues principally from interest earned on loans and investments and, to a lesser extent, from fees charged for services. General economic conditions and policies of the financial institution regulatory agencies, including the MDF and the FDIC, significantly influence the Company’s operations. Interest rates on competing investments and general market interest rates influence the Company’s cost of funds. Lending activities are affected by the interest rates at which such financing may be offered. The Company intends to focus on commercial, one- to four-family residential and consumer lending throughout southwestern Missouri.
The Company has two active wholly-owned subsidiaries other than the Bank, its principal subsidiary: (i) Guaranty Statutory Trust I, a Delaware statutory trust; and (ii) Guaranty Statutory Trust II, a Delaware statutory trust and a third inactive subsidiary. These Trusts were formed in December 2005 for the exclusive purpose of issuing trust preferred securities to acquire junior subordinated debentures issued by the Company. The Company’s banking operation conducted through the Bank is the Company’s only reportable segment. See also the discussion contained in the section captioned “Segment Information” in Note 1 of the Notes to Consolidated Financial Statements in this report. The third subsidiary is a service corporation which has been inactive since February 1, 2003.
FORWARD-LOOKING STATEMENTS
The Company may from time to time make written or oral "forward-looking statements", including statements contained in the company's filings with the Securities and Exchange Commission (including this Annual Report on Form 10-K and the exhibits thereto), in its reports to stockholders and in other communications by the Company, which are made in good faith by the Company pursuant to the "safe harbor" provisions of the Private Securities Litigation Reform Act of 1995. When used in this Annual Report on Form 10-K, words such as “anticipates,” “estimates,” “believes,” “expects,” and similar expressions are intended to identify such forward-looking statements but are not the exclusive means of identifying such statements.
These forward-looking statements involve risks and uncertainties, such as statements of the Company's plans, objectives, expectations, estimates and intentions that are subject to change based on various important factors (some of which are beyond the Company's control). The following factors, among others, could cause the Company's financial performance to differ materially from the plans, objectives, expectations, estimates and intentions expressed in such forward-looking statements: the strength of the United States economy in general and the strength of the real estate values and the local economies in which the Company conducts operations; risks associated with the completion of the proposed acquisition of Hometown and its wholly-owned subsidiary Hometown Bank and the integration of Hometown Bank with the Bank, including the possibility that we may not realize the anticipated benefits of the acquisition; the impact of recent and potential future changes in the laws, rules, regulations, interpretations and policies relating to financial institutions, accounting, tax, monetary and fiscal matters and their application by our regulators; the effects of, and changes in, trade, monetary and fiscal policies and laws, changes in interest rates; the timely development of and acceptance of new products and services of the company and the perceived overall value of these products and services by users, including the features, pricing and quality compared to competitors' products and services; the impact of changes in financial services' laws and regulations (including laws concerning taxes, banking, securities and insurance); asset quality deterioration; environmental liability associated with real estate collateral; technological changes and cybersecurity risks; acquisitions; employee retention; the success of the Company at managing the risks resulting from these factors; and other factors set forth in reports and other documents filed by the Company with the Securities and Exchange Commission from time to time. For further information about these and other risks, uncertainties and factors, please review the disclosure included in Item 1A. “Risk Factors” of this Form 10-K.
The Company cautions that the listed factors are not exclusive. The Company does not undertake to update any forward-looking statement, whether written or oral, that may be made from time to time by or on behalf of the Company.
FINANCIAL CONDITION
From December 31, 2016 to December 31, 2017, the Company’s total assets increased $106,479,701 (15%) to $794,459,520, liabilities increased $101,562,588 (16%) to $719,568,027, and stockholders' equity increased $4,917,113 (7%) to $74,891,493. The ratio of stockholders’ equity to total assets was 9.4% and 10.2% at December 31, 2017 and 2016, respectively.
From December 31, 2016 to December 31, 2017, available-for-sale securities decreased $10,920,562 (12%), primarily due to purchases of $15,975,995 offset by sales, maturities and principal payments received of $27,627,667. The Company had net unrealized losses of $844,379 at December 31, 2017 compared to $2,078,050 at December 31, 2016.
From December 31, 2016 to December 31, 2017, net loans receivable increased by $91,331,369 (17%) to $629,605,009. New production included a mix of multi-family, agriculture, hospitality and Small Business Administration (“SBA”) lending. During the year, permanent multi-family loans increased $36,741,551 (76%), construction loans increased $23,831,275 (58%), commercial loans increased $19,118,108 (25%), commercial real estate loans increased $12,285,412 (5%) and consumer and other loans increased $1,110,141 (5%). The Company continues to focus its lending efforts in the commercial, owner occupied real estate and small business lending categories.
As of December 31, 2017, management identified loans totaling $10,827,000 as impaired with a related allowance for loan losses of $1,249,000. Impaired loans increased by $2,128,000 during 2017, compared to the balance of $8,699,000 at December 31, 2016.
From December 31, 2016 to December 31, 2017, the allowance for loan losses increased $1,364,969 to $7,107,418. In addition to the provision for loan losses of $1,750,000 recorded by the Company during the year ended December 31, 2017, loan charge-offs of specific loans (previously classified as nonperforming) exceeded recoveries by $385,031 for the year ended December 31, 2017. The increase in the allowance is primarily due to the increased loan balances during 2017 and reserves on a few specific problem credits. The allowance for loan losses, as a percentage of gross loans outstanding (excluding mortgage loans held for sale), as of December 31, 2017 and December 31, 2016 was 1.12% and 1.06%, respectively. The allowance for loan losses, as a percentage of nonperforming loans outstanding, as of December 31, 2017 and December 31, 2016 was 71.3% and 66.5%, respectively. Management believes the allowance for loan losses is at a level to be sufficient in providing for potential loan losses in the Bank’s existing loan portfolio.
From December 31, 2016 to December 31, 2017, deposits increased $102,001,600 (20%) to $607,364,350. During this period, checking and savings transaction balances increased by $58,424,702 and certificates of deposit increased $43,576,898. The increase in checking and savings accounts was due to the Company’s continued efforts to increase core transaction deposits, including commercial, retail and public funds. Other increases include $25,546,000 of brokered certificate of deposits during 2017. The Company utilizes brokered certificate of deposits as a tool to manage cost of funds and to efficiently match changes in liquidity needs based on loan growth.
Federal Home Loan Bank advances decreased $1,400,000 (1%) from $95,700,000 as of December 31, 2016 to $94,300,000 as of December 31, 2017 due to principal reductions.
From December 31, 2016 to December 31, 2017, stockholders’ equity (including unrealized depreciation on available-for-sale securities, net of tax) increased $4,917,113 (7%) to $74,891,493. Net income for the year ended December 31, 2017 exceeded dividends paid or declared by $3,300,208. The equity portion of the Company’s unrealized losses on available-for-sale securities and effects of interest rate swaps improved by $1,103,048 during 2017. On a per common share basis, stockholders’ equity increased from $16.09 as of December 31, 2016 to $17.10 as of December 31, 2017.
AVERAGE BALANCES, INTEREST AND AVERAGE YIELDS
The following table shows the balances as of December 31, 2017 of various categories of interest-earning assets and interest-bearing liabilities and the corresponding yields and costs, and, for the periods indicated: (1) the average balances of various categories of interest-earning assets and interest-bearing liabilities, (2) the total interest earned or paid thereon, and (3) the resulting weighted average yields and costs. In addition, the table shows the Company’s rate spreads and net yields. Average balances are based on daily balances. Tax-free income is not material; accordingly, interest income and related average yields have not been calculated on a tax equivalent basis. Average loan balances include non-accrual loans. Dollar amounts are expressed in thousands.
|
As of |
Year Ended |
Year Ended |
Year Ended |
|||||||||||||||||||||||||||||||||||||||||
|
December 31, 2017 |
December 31, 2017 |
December 31, 2016 |
December 31, 2015 |
|||||||||||||||||||||||||||||||||||||||||
|
Balance |
Yield / Cost |
Average Balance |
Interest |
Yield / Cost |
Average Balance |
Interest |
Yield / Cost |
Average Balance |
Interest |
Yield / Cost |
||||||||||||||||||||||||||||||||||
|
ASSETS |
||||||||||||||||||||||||||||||||||||||||||||
|
Interest-earning: |
||||||||||||||||||||||||||||||||||||||||||||
|
Loans |
$ | 638,634 | 4.82 | % | $ | 608,439 | $ | 27,454 | 4.51 | % | $ | 513,995 | $ | 23,315 | 4.54 | % | $ | 501,194 | $ | 23,565 | 4.70 | % | ||||||||||||||||||||||
|
Investment securities |
81,495 | 2.08 | % | 87,389 | 1,792 | 2.05 | % | 101,081 | 1,895 | 1.87 | % | 90,248 | 1,484 | 1.64 | % | |||||||||||||||||||||||||||||
|
Other assets |
37,971 | 0.43 | % | 15,328 | 195 | 1.27 | % | 17,905 | 179 | 1.00 | % | 23,552 | 141 | 0.60 | % | |||||||||||||||||||||||||||||
|
Total interest-earning |
758,100 | 4.31 | % | 711,156 | 29,441 | 4.14 | % | 632,981 | 25,389 | 4.01 | % | 614,994 | 25,190 | 4.10 | % | |||||||||||||||||||||||||||||
|
Noninterest-earning |
36,360 | 39,800 | 40,632 | 36,103 | ||||||||||||||||||||||||||||||||||||||||
| $ | 794,460 | $ | 750,956 | $ | 673,613 | $ | 651,097 | |||||||||||||||||||||||||||||||||||||
| LIABILITIES AND STOCKHOLDERS' EQUITY | ||||||||||||||||||||||||||||||||||||||||||||
|
Interest-bearing: |
||||||||||||||||||||||||||||||||||||||||||||
|
Savings accounts |
$ | 30,848 | 0.20 | % | $ | 29,685 | $ | 58 | 0.20 | % | $ | 27,489 | $ | 55 | 0.20 | % | $ | 24,841 | $ | 49 | 0.20 | % | ||||||||||||||||||||||
|
Transaction accounts |
326,523 | 0.67 | % | 340,899 | 2,395 | 0.70 | % | 320,352 | 1,235 | 0.39 | % | 305,849 | 1,277 | 0.42 | % | |||||||||||||||||||||||||||||
|
Certificates of deposit |
155,266 | 1.12 | % | 126,625 | 1,299 | 1.03 | % | 111,220 | 994 | 0.89 | % | 119,793 | 1,098 | 0.92 | % | |||||||||||||||||||||||||||||
|
FHLB advances |
94,300 | 1.97 | % | 96,774 | 1,704 | 1.76 | % | 73,833 | 1,314 | 1.78 | % | 53,970 | 1,196 | 2.22 | % | |||||||||||||||||||||||||||||
|
Subordinated debentures |
15,465 | 3.53 | % | 15,465 | 631 | 4.08 | % | 15,465 | 579 | 3.74 | % | 15,465 | 539 | 3.49 | % | |||||||||||||||||||||||||||||
|
Repurchase agreements |
- | 0.00 | % | - | - | 0.00 | % | - | - | 0.00 | % | 4,575 | 121 | 2.64 | % | |||||||||||||||||||||||||||||
|
Total interest-bearing |
622,402 | 1.02 | % | 609,448 | 6,087 | 1.00 | % | 548,359 | 4,177 | 0.76 | % | 524,493 | 4,280 | 0.82 | % | |||||||||||||||||||||||||||||
|
Noninterest-bearing |
103,284 | 67,720 | 55,344 | 61,686 | ||||||||||||||||||||||||||||||||||||||||
|
Total liabilities |
725,686 | 677,168 | 603,703 | 586,179 | ||||||||||||||||||||||||||||||||||||||||
|
Stockholders' equity |
68,774 | 73,788 | 69,910 | 64,918 | ||||||||||||||||||||||||||||||||||||||||
| $ | 794,460 | $ | 750,956 | $ | 673,613 | $ | 651,097 | |||||||||||||||||||||||||||||||||||||
|
Net earning balance |
$ | 135,698 | $ | 101,708 | $ | 84,622 | $ | 90,501 | ||||||||||||||||||||||||||||||||||||
|
Earning yield less costing rate |
3.29 | % | 3.14 | % | 3.25 | % | 3.28 | % | ||||||||||||||||||||||||||||||||||||
|
Net interest income, and net yield spread on interest-earning assets |
$ | 23,354 | 3.29 | % | $ | 21,212 | 3.35 | % | $ | 20,910 | 3.40 | % | ||||||||||||||||||||||||||||||||
|
Ratio of interest-earning assets to interest-bearing liabilities |
122 | % | 117 | % | 115 | % | 117 | % | ||||||||||||||||||||||||||||||||||||
The following table sets forth information regarding changes in interest income and interest expense for the periods indicated resulting from changes in average balances and average rates shown in the previous table. For each category of interest-earning assets and interest-bearing liabilities information is provided with respect to changes attributable to: (i) changes in balance (change in balance multiplied by the old rate), (ii) changes in interest rates (change in rate multiplied by the old balance); and (iii) the combined effect of changes in balance and interest rates (change in balance multiplied by change in rate). Dollar amounts are expressed in thousands.
|
Year ended |
Year ended |
|||||||||||||||||||||||||||||||
|
December 31, 2017 versus December 31, 2016 |
December 31, 2016 versus December 31, 2015 |
|||||||||||||||||||||||||||||||
|
Average Balance |
Interest Rate |
Rate & Balance |
Total |
Average Balance |
Interest Rate |
Rate & Balance |
Total |
|||||||||||||||||||||||||
|
Interest income: |
||||||||||||||||||||||||||||||||
|
Loans |
$ | 4,284 | $ | (122 | ) | $ | (23 | ) | $ | 4,139 | $ | 602 | $ | (830 | ) | $ | (21 | ) | $ | (249 | ) | |||||||||||
|
Investment securities |
(256 | ) | 177 | (24 | ) | (103 | ) | 178 | 208 | 25 | 411 | |||||||||||||||||||||
|
Other assets |
(26 | ) | 49 | (7 | ) | 16 | (34 | ) | 94 | (23 | ) | 37 | ||||||||||||||||||||
|
Net change in interest income |
4,002 | 104 | (54 | ) | 4,052 | 746 | (528 | ) | (19 | ) | 199 | |||||||||||||||||||||
|
Interest expense: |
||||||||||||||||||||||||||||||||
|
Savings accounts |
4 | (1 | ) | - | 3 | 5 | 1 | - | 6 | |||||||||||||||||||||||
|
Transaction accounts |
79 | 1,016 | 65 | 1,160 | 61 | (98 | ) | (4 | ) | (41 | ) | |||||||||||||||||||||
|
Certificates of deposit |
138 | 147 | 20 | 305 | (79 | ) | (27 | ) | 2 | (104 | ) | |||||||||||||||||||||
|
FHLB advances |
408 | (14 | ) | (4 | ) | 390 | 440 | (236 | ) | (87 | ) | 117 | ||||||||||||||||||||
|
Subordinated debentures |
- | 52 | - | 52 | - | 40 | - | 40 | ||||||||||||||||||||||||
|
Repurchase agreements |
- | - | - | - | (121 | ) | (121 | ) | 121 | (121 | ) | |||||||||||||||||||||
|
Net change in interest expense |
629 | 1,200 | 81 | 1,910 | 306 | (441 | ) | 32 | (103 | ) | ||||||||||||||||||||||
|
Change in net interest income |
$ | 3,373 | $ | (1,096 | ) | $ | (135 | ) | $ | 2,142 | $ | 440 | $ | (87 | ) | $ | (51 | ) | $ | 302 | ||||||||||||
RESULTS OF OPERATIONS - COMPARISON OF YEAR ENDED DECEMBER 31, 2017 AND DECEMBER 31, 2016
Interest Rates
|
Average for the Year Shown |
||||||||||||
|
Prime |
Ten-Year Treasury |
One-Year Treasury |
||||||||||
|
December 31, 2017 |
4.10 | % | 2.33 | % | 1.20 | % | ||||||
|
December 31, 2016 |
3.51 | % | 1.84 | % | 0.61 | % | ||||||
|
Change in rates |
0.59 | % | 0.49 | % | 0.59 | % | ||||||
The Bank charges borrowers and pays depositors interest rates that are largely a function of the general level of interest rates. The above table sets forth the weekly average interest rates for the 52 weeks ending December 31, 2017 and December 31, 2016 as reported by the Federal Reserve. The Bank typically indexes its adjustable rate commercial loans to prime and its adjustable rate mortgage loans to the one-year Treasury Rate. The ten-year Treasury Rate is a proxy for 30-year fixed rate home mortgage loans.
Rates trended upward during 2017 as the Federal Reserve Open Market Committee (“FOMC”) increased the discount rate by 25 basis points in March, June and December 2017. As of December 31, 2017, the prime rate was 4.5% which is a 75 basis point increase from December 31, 2016.
Interest Income. Total interest income increased $4,051,407 (16%). The average balance of interest-earning assets increased $78,175,000 (12%), while the yield on average interest earning assets increased 13 basis points to 4.14%.
Interest income on loans increased $4,139,313 (18%). The average loan receivable balance increased $94,444,000 (18%) while the average yield decreased 3 basis points to 4.51%. The Company experienced strong loan activity during 2017. However, pricing on loans is challenging due to significant competition on new and renewing credits. The pricing pressure has impacted the ability to maintain loan yield compared to 2016.
Interest income on investment securities decreased $103,474 (5%). The average balance of investment securities decreased $13,692,000 (14%) while the average yield improved 18 basis points to 2.05%.
Interest Expense. Total interest expense increased $1,909,542 (46%) as the average balance of interest-bearing liabilities increased $61,089,000 (11%), while the average cost of interest-bearing liabilities increased 24 basis points to 1.00%.
Interest expense on deposits increased $1,467,583 (64%) during 2017 as the average balance of interest bearing deposits increased $38,148,000 (8%), while the average interest rate paid to depositors increased 25 basis points to 0.75%. The increase in asset growth opportunities among institutions in our market have created significant competitive pressures on deposit rates. To fund its asset growth going forward, the Company will continue to utilize a cost-effective mix of retail and commercial core deposits along with non-core, wholesale funding.
Net Interest Income. The Company’s net interest income increased $2,141,865 (10%) primarily due to the increase in overall average balances of interest-earning assets and interest-bearing liabilities. Refer to the tables in the “Average Balances, Interest and Average Yields” section (pages 47 and 48) for additional information on components of net interest income.
Provision for Loan Losses. Provisions for loan losses are charged or credited to earnings to bring the total allowance for loan losses to a level considered adequate by the Company to provide for potential loan losses in the existing loan portfolio. When making its assessment, the Company considers prior loss experience, volume and type of lending, local banking trends and impaired and past due loans in the Company’s loan portfolio. In addition, the Company considers general economic conditions and other factors related to collectability of the Company’s loan portfolio.
Based on its internal analysis and methodology, management recorded a provision for loan losses of $1,750,000 and $1,375,000 for the years ended December 31, 2017 and 2016, respectively. The Company’s increase in the provision was primarily due to the increased loan balances and maintaining general portfolio reserves at a level deemed appropriate in accordance with its methodology. The Bank will continue to monitor its allowance for loan losses and make future additions based on economic and regulatory conditions. Management may need to increase the allowance for loan losses through charges to the provision for loan losses if anticipated growth in the Bank’s loan portfolio increases or other circumstances warrant. See further discussions of the allowance for loan losses under “Financial Condition” above.
Although the Bank maintains its allowance for loan losses at a level which it considers to be sufficient to provide for potential loan losses in its existing loan portfolio, there can be no assurance that future loan losses will not exceed internal estimates. In addition, the amount of the allowance for loan losses is subject to review by regulatory agencies which can order the establishment of additional loan loss provisions.
Non-Interest Income. Non-interest income increased $857,113 (18%). This was primarily due to the Company’s emphasis on Small Business Administration (SBA) lending and its continued efforts in fixed-rate mortgage lending. The Company’s gains on sale of SBA loans increased $449,177, gains on fixed-rate mortgage loans sales increased $312,730 and net gain on foreclosed assets increased $180,734 when compared to 2016. These gains were partially offset by a decrease in gain on sale of investment securities of $146,208 when compared to 2016.
Non-Interest Expense. Non-interest expense increased $2,502,340 (15%). Salaries and employee benefits increased $1,353,964 (13%) which was primarily due to the recent expansion in the Joplin, Missouri market and increases in other key areas of commercial banking, operations and technology. Included in the salaries and benefits increase, the Company had $780,363 of increases in health/retirement benefits and performance incentives due to strong Company results.
The Company incurred $587,428 (100%) of impairment charges on solar tax credit investments in 2017. The Company purchased an interest in a utility scale solar energy project. The project is expected to generate an estimated $557,000 of 2017 investment tax credits plus additional tax credits in future years assuming certain compliance criteria are met. The cost of the investment will be accounted for under the equity and hypothetical liquidation at book value methods. Under these methods, an impairment charge is recorded on the investment equal to the discounted future cash flows compared to the carrying value of the investment.
The Company’s occupancy expense increased $377,199 (21%) primarily due to the Company’s continued enhancements in facilities (including signage) and significant investments in new technologies. The ongoing expansion in the Joplin, Missouri market has also played a factor in the increase in expense.
Income Taxes. The provision for income taxes increased $557,985 (28%) over 2016 is primarily a result of the Company’s $1.0 million charge for the deferred tax asset write-down which was partially offset by the utilization of tax credits which is discussed above. As a result of the Tax Cuts and Jobs Act signed into law on December 22, 2017, the Company was required to revalue its deferred tax assets and deferred tax liabilities to account for the future impact of lower corporate tax rates. As of December 31, 2017, the Company revalued its net deferred tax asset and it resulted in a one-time charge to income tax expense of approximately $1.0 million.
Cash Dividends Paid. The Company paid dividends of $0.10 per share on April 14, 2017 to stockholders of record as of April 4, 2017, and $0.10 per share on July 13, 2017, to stockholders of record as of July 3, 2017, and $.10 per share on October 13, 2017, to stockholders of record as of October 3, 2017 and also declared a cash dividend of $0.12 per share on December 22, 2017, which was paid on January 13, 2018, to stockholders of record on January 3, 2018. During 2017, 2016 and 2015, the Company paid $1,767,486, $1,415,180 and $873,499 in dividends on common stock.
RESULTS OF OPERATIONS - COMPARISON OF YEAR ENDED DECEMBER 31, 2016 AND DECEMBER 31, 2015
Interest Rates
|
Average for the Year Shown |
||||||||||||
|
Prime |
Ten-Year Treasury |
One-Year Treasury |
||||||||||
|
December 31, 2016 |
3.51 | % | 1.84 | % | 0.61 | % | ||||||
|
December 31, 2015 |
3.26 | % | 2.14 | % | 0.32 | % | ||||||
|
Change in rates |
0.25 | % | -0.30 | % | 0.29 | % | ||||||
The Bank charges borrowers and pays depositors interest rates that are largely a function of the general level of interest rates. The above table sets forth the weekly average interest rates for the 52 weeks ending December 31, 2016 and December 31, 2015 as reported by the Federal Reserve. The Bank typically indexes its adjustable rate commercial loans to prime and its adjustable rate mortgage loans to the one-year Treasury Rate. The ten-year Treasury Rate is a proxy for 30-year fixed rate home mortgage loans.
Rates trended upward by the end of 2016 as the Federal Reserve Open Market Committee (“FOMC”) increased the discount rate by 25 basis points in December 2016. As of December 31, 2016, the prime rate was 3.75% which is a 25 basis point increase from December 31, 2015.
Interest Income. Total interest income increased $199,692 (1%). The average balance of interest-earning assets increased $17,987,000 (3%), while the yield on average interest earning assets decreased 9 basis points to 4.01%.
Interest income on investment securities increased $411,623 (28%). The average balance of investment securities increased $10,833,000 (12%) while the average yield improved 23 basis points to 1.87%.
Offsetting the increase in interest income on investments was the decline in interest income on loans which decreased $249,990 (1%). The average loan receivable balance increased $12,801,000 (3%) while the average yield decreased 16 basis points to 4.54%. The Company experienced strong loan activity during 2016. However, pricing on loans was and is challenging due to significant competition on new and renewing credits. The pricing pressure impacted the ability to maintain loan yield compared to 2015.
Interest Expense. Total interest expense decreased $102,870 (2%) as the average balance of interest-bearing liabilities increased $23,866,000 (5%), while the average cost of interest-bearing liabilities decreased 6 basis points to 0.76%.
Interest expense on deposits decreased $139,889 (6%) during 2016 as the average balance of interest bearing deposits increased $8,578,000 (2%), however, the average interest rate paid to depositors decreased 4 basis points to 0.50%. The expansion of lower-cost, core deposit relationships and reductions in higher priced retail products and utilization of cost effective wholesale funding continue to improve the Company’s overall cost of funds. Also improving cost of funds over the prior year was the prepayment of the Company’s $10 million repurchase agreement during the second quarter of 2015, which had a rate of 2.61%.
Net Interest Income. The Company’s net interest income increased $302,562 (1%) primarily due to the increase in overall average balances of interest-earning assets and interest-bearing liabilities. Refer to the tables in the “Average Balances, Interest and Average Yields” section (pages 47 and 48) for additional information on components of net interest income.
Provision for Loan Losses. Provisions for loan losses are charged or credited to earnings to bring the total allowance for loan losses to a level considered adequate by the Company to provide for potential loan losses in the existing loan portfolio. When making its assessment, the Company considers prior loss experience, volume and type of lending, local banking trends and impaired and past due loans in the Company’s loan portfolio. In addition, the Company considers general economic conditions and other factors related to collectability of the Company’s loan portfolio.
Based on its internal analysis and methodology, management recorded a provision for loan losses of $1,375,000 and $600,000 for the years ended December 31, 2016 and 2015, respectively. The Company’s increase in the provision was primarily due to the increased loan balances and maintaining general portfolio reserves at a level deemed appropriate in accordance with its methodology. The Bank will continue to monitor its allowance for loan losses and make future additions based on economic and regulatory conditions. Management may need to increase the allowance for loan losses through charges to the provision for loan losses if anticipated growth in the Bank’s loan portfolio increases or other circumstances warrant. See further discussions of the allowance for loan losses under “Financial Condition” above.
Although the Bank maintains its allowance for loan losses at a level which it considers to be sufficient to provide for potential loan losses in its existing loan portfolio, there can be no assurance that future loan losses will not exceed internal estimates. In addition, the amount of the allowance for loan losses is subject to review by regulatory agencies which can order the establishment of additional loan loss provisions.
Non-Interest Income. Non-interest income increased $392,135 (9%). This was primarily due to increased gains on sale of mortgage loans held for sale of $312,120 (22%). A stronger real estate market and the Company’s increased activity in Federal Housing Administration lending increased mortgage volume compared to 2015. Originations of mortgage loans held for sale were $63,974,589 during 2016 compared to $56,515,986 in 2015.
Non-Interest Expense. Non-interest expense increased $491,018 (3%). Salaries and employee benefits increased $881,227 (7%) which was partially offset by the prepayment penalty of $463,992 (100%) paid during 2015 as part of a structured transaction to prepay a $10,000,000 repurchase agreement. The increase in salaries and employee benefits was due to the addition of commercial and mortgage staff for what was then the new loan production office in Joplin and the addition of other key positions in technology, commercial and retail production. The Company was continuing to position itself for future growth and expansion. Also impacting compensation were mortgage commissions which increased due to the mortgage volume noted above under “Non-Interest Income” above.
Income Taxes. The provision for income taxes decreased $448,565 (18%) over 2015 as a direct result of the Company’s decrease in taxable income primarily through the increased utilization of tax-exempt revenue sources.
Cash Dividends Paid. The Company paid dividends of $0.08 per share on April 14, 2016 to stockholders of record as of April 4, 2016, and $0.08 per share on July 15, 2016, to stockholders of record as of July 5, 2016, and $.08 per share on October 20, 2016, to stockholders of record as of October 10, 2016 and also declared a cash dividend of $0.10 per share on December 22, 2016, which was paid on January 13, 2017, to stockholders of record on January 3, 2017. During 2015, the Company paid $1,008,332 in dividends on common stock. During 2014, the Company also paid $648,280 in dividends on common stock and $413,000 dividends on its preferred stock.
LIQUIDITY
Liquidity refers to the ability to manage future cash flows to meet the needs of depositors and borrowers and fund operations. Maintaining appropriate levels of liquidity allows the Company to have sufficient funds available for customer demand for loans, withdrawal of deposit balances and maturities of deposits and other liabilities. The Company’s primary sources of liquidity include cash and cash equivalents, available-for-sale securities, customer deposits and FHLB borrowings. The Company also has established a borrowing line with the Federal Reserve Bank which is considered a secondary source of funds.
The Company’s most liquid assets are cash and cash equivalents, which are cash on hand, amounts due from financial institutions, and certificates of deposit with other financial institutions that have an original maturity of three months or less. The levels of such assets are dependent on the Bank’s operating, financing, and investment activities at any given time. The Company’s cash and cash equivalents totaled $37,406,930 as of December 31, 2017 and $9,088,441 as of December 31, 2016, representing an increase of $28,318,489. The variations in levels of cash and cash equivalents are influenced by deposit flows and anticipated future deposit flows, which are subject to, and influenced by, many factors. The Bank has $105,487,706 in certificates of deposit that are scheduled to mature in one year or less. Management anticipates that the majority of these certificates will renew in the normal course of operations. Based on existing collateral as well as the FHLB’s limitation of advances to 35% of assets, the Bank has the ability to borrow an additional $107,306,000 from the FHLB, as of December 31, 2017. Based on existing collateral, the Bank has the ability to borrow $36,375,000 from the Federal Reserve Bank as of December 31, 2017. The Bank plans to maintain its FHLB and Federal Reserve Bank borrowings to a level that will provide a borrowing capacity sufficient to provide for contingencies. Management has many policies and controls in place to attempt to manage the appropriate level of liquidity.
CAPITAL REQUIREMENTS
The Company meets the eligibility criteria of a small bank holding company in accordance with the Federal Reserve's Small Bank Holding Company Policy Statement issued in February 2015, and is no longer obligated to report consolidated regulatory capital. The Bank continues to be subject to various capital requirements administered by banking agencies. Failure to meet minimum capital requirements can trigger certain mandatory and discretionary actions by regulators that could have a direct material effect on the Company's financial statements. The Bank's capital amounts and classifications are also subject to qualitative judgments by regulators about components, risk weightings and other factors.
In July 2013, the Federal Reserve issued a final rule that revised its risk-based and leverage capital requirements for banking organizations to align them with the Basel III regulatory capital framework and meet certain requirements of the Dodd-Frank Act (“Basel III Rule”). The Basel III Rule implemented a revised definition of regulatory capital, a new common equity tier 1 (“CET1”) minimum capital requirement, and a higher minimum tier1 capital requirement. The final rules also made changes to the prompt corrective action framework for depository institutions by incorporating the new minimum capital ratios into the framework, introducing the CET1 capital measure, and aligning the definition of tangible equity for purposes of the critically undercapitalized prompt corrective action category with the definition of tier 1 capital. Under the Basel III Rule, the following three components comprise a banking organization’s “regulatory capital”: (i) “CET1 capital,” which is predominantly comprised of retained earnings and common stock instruments that meet certain criteria and related surplus (net of any treasury stock), AOCI (for organizations that do not make opt-out elections), and CET1 minority interest, which are subject to certain restrictions; (ii) “Additional Tier 1 Capital,” which consists of non-cumulative perpetual preferred stock and similar instruments meeting specified eligibility criteria and related surplus, Tier 1 minority interests not included in CET1 capital, and “TARP” preferred stock and other instruments issued under the Emergency Economic Stabilization Act of 2008; and (iii) “Tier 2 Capital,” which includes instruments such as subordinated debt that has a minimum original maturity of at least five years and is subordinated to the claims of depositors and general creditors, total capital minority interest not included in Tier 1 capital and limited amounts of a banking organization’s allowance for loan and lease losses (ALLL), less applicable regulatory adjustments and deductions.
Effective January 1, 2015, the final rule requires the Bank to comply with the following minimum capital ratios: (i) a new common equity Tier 1 capital ratio of 4.5% of risk-weighted assets; (ii) a Tier 1 capital ratio of 6.0% of risk-weighted assets (increased from the prior requirement of 4.0%); (iii) a total capital ratio of 8.0% of risk-weighted assets (unchanged from the prior requirement); and (iv) a leverage ratio of 4.0% of total assets (unchanged from the prior requirement). When fully phased in on January 1, 2019, the Basel III Rule will require the Bank to maintain (i) a minimum ratio of common equity Tier 1 to risk-weighted assets of at least 4.5%, plus a 2.5% "capital conservation buffer" effectively resulting in a minimum ratio of common equity Tier 1 to risk-weighted assets of at least 7.0% upon full implementation); (ii) a minimum ratio of Tier 1 capital to risk-weighted assets of at least 6.0%, plus the 2.5% capital conservation buffer effectively resulting in a minimum Tier 1 capital ratio of 8.5% upon full implementation); (iii) a minimum ratio of total capital to risk-weighted assets of at least 8.0%, plus the 2.5% capital conservation buffer effectively resulting in a minimum total capital ratio of 10.5% upon full implementation); and (iv) a minimum leverage ratio of 4.0%, calculated as the ratio of Tier 1 capital to average assets.
Beginning January 1, 2016, the capital conservation buffer requirement was phased in at 0.625% of risk-weighted assets, increasing by the same amount each year until fully implemented at 2.5% on January 1, 2019. The capital conservation buffer is designed to absorb losses during periods of economic stress. Banking institutions with a ratio of common equity Tier 1 to risk-weighted assets above the minimum but below the conservation buffer will face constraints on dividends, equity repurchases, and compensation based on the amount of the shortfall.
The Bank is classified as “well capitalized” under current regulatory guidelines. See also additional information provided under the caption “Regulatory Matters” in Note 1 of the Notes to Consolidated Financial Statements.
OFF-BALANCE SHEET ARRANGEMENTS
Various commitments and contingent liabilities arise in the normal course of business, which are not required to be recorded on the balance sheet. The most significant of these are loan commitments, lines of credit and standby letters of credit. Commitments to extend credit are agreements to lend to a customer as long as there is no violation of any condition established in the contract. As of December 31, 2017 and 2016, the Bank had outstanding commitments to originate loans of approximately $7,261,000 and $6,152,000, respectively. Lines of credit are agreements to lend to a customer as long as there is no violation of any condition established in the contract. As of December 31, 2017 and 2016, unused lines of credit to borrowers aggregated approximately $117,068,000 and $89,103,000, respectively, for commercial lines and $15,929,000 and $15,960,000, respectively, for open-end consumer lines. Since a portion of the loan commitment and line of credit may expire without being drawn upon, the total unused commitments and lines do not necessarily represent future cash requirements.
Standby letters of credit are irrevocable conditional commitments issued by the Bank to guarantee the performance of a customer to a third party. The credit risk involved in issuing standby letters of credit is essentially the same as that involved in extending loans to customers. The Bank had total outstanding standby letters of credit amounting to $12,733,000 and $11,596,000 as of December 31, 2017 and 2016, respectively. The commitments extend over varying periods of time.
In connection with the Company’s issuance of the Trust Preferred Securities and pursuant to two guarantee agreements by and between the Company and Wilmington Trust Company, the Company issued a limited, irrevocable guarantee of the obligations of each Trust under the Trust Preferred Securities whereby the Company has guaranteed any and all payment obligations of the Trusts related to the Trust Preferred Securities including distributions on, and the liquidation or redemption price of, the Trust Preferred Securities to the extent each Trust does not have funds available.
AGGREGATE CONTRACTUAL OBLIGATIONS
The following table summarizes the Company’s fixed and determinable contractual obligations by payment date as of December 31, 2017. Dollar amounts are expressed in thousands.
|
Payments Due By Period |
||||||||||||||||||||
|
One Year |
One to |
Three to |
More than |
|||||||||||||||||
|
Contractual Obligations |
Total |
or less |
Three Years |
Five Years |
Five Years |
|||||||||||||||
|
Deposits without stated maturity |
$ | 452,098 | $ | 452,098 | $ | - | $ | - | $ | - | ||||||||||
|
Time and brokered certificates of deposit |
155,266 | 105,488 | 39,591 | 9,890 | 297 | |||||||||||||||
|
Other borrowings |
- | - | - | - | - | |||||||||||||||
|
FHLB and Federal Reserve advances |
94,300 | 92,200 | 2,100 | - | - | |||||||||||||||
|
Subordinated debentures |
15,465 | - | - | - | 15,465 | |||||||||||||||
|
Operating leases |
2,416 | 291 | 537 | 460 | 1,129 | |||||||||||||||
|
Purchase obligations |
2,073 | 2,073 | - | - | - | |||||||||||||||
|
Other long term obligations |
565 | 565 | - | - | - | |||||||||||||||
|
Total |
$ | 722,183 | $ | 652,715 | $ | 42,228 | $ | 10,350 | $ | 16,891 | ||||||||||
IMPACT OF INFLATION AND CHANGING PRICES
The Company prepared the consolidated financial statements and related data presented herein in accordance with accounting principles generally accepted in the United States of America which require the measurement of financial position and operating results in terms of historical dollars, without considering changes in the relative purchasing power of money over time due to inflation.
Unlike most companies, the assets and liabilities of a financial institution are primarily monetary in nature. As a result, interest rates have a more significant impact on a financial institution’s performance than the effects of general levels of inflation. Interest rates do not necessarily move in the same direction or in the same magnitude as the price of goods and services, since such prices are affected by inflation. In the current interest rate environment, liquidity and the maturity structure of the Bank’s assets and liabilities are critical to the maintenance of acceptable performance levels.
CRITICAL ACCOUNTING POLICIES
Management’s Discussion and Analysis of Financial Condition and Results of Operations is based upon the Company’s consolidated financial statements and the notes thereto, which have been prepared in accordance with accounting principles generally accepted in the United States of America. The preparation of these financial statements requires management to make estimates and judgments that affect the reported amounts of assets and liabilities and the disclosure of contingent assets and liabilities at the date of the financial statements and the reported amounts of revenues and expenses during the reported periods. On an on-going basis, management evaluates its estimates and judgments.
Management bases its estimates and judgments on historical experience and on various other factors that are believed to be reasonable under the circumstances, the results of which form the basis for making judgments about the carrying values of assets and liabilities that are not readily apparent from other sources. There can be no assurance that actual results will not differ from those estimates. If actual results are different than management’s judgments and estimates, the Company’s financial results could change, and such change could be material to the Company.
Material estimates that are particularly susceptible to significant change in the near term relate to the determination of the allowance for loan losses, the valuation of real estate acquired in connection with foreclosures or in satisfaction of loans and fair values. In connection with the determination of the allowance for loan losses and the valuation of foreclosed assets held for sale, management obtains independent appraisals for significant properties.
The Company has identified the accounting policies for the allowance for loan losses and related significant estimates and judgments as critical to its business operations and the understanding of its results of operations. For a detailed discussion on the application of these significant estimates and judgments and our accounting policies, also see Note 1 of the “Notes to Consolidated Financial Statements” in this report.
Item 7A. Quantitative and Qualitative Disclosures About Market Risk
ASSET / LIABILITY MANAGEMENT
The responsibility of managing and executing the Bank’s Asset Liability Policy falls to the Bank’s Asset/ Liability Committee (ALCO). ALCO seeks to manage interest rate risk through changing interest rate environments. Management attempts to position the Bank’s instrument repricing characteristics in line with probable rate movements in order to minimize the impact of changing interest rates on the Bank’s net interest income. Since the relative spread between financial assets and liabilities is constantly changing, the Bank’s current net interest income may not be an indication of future net interest income.
The Bank has continued to emphasize the origination of commercial business and real estate, home equity, consumer and adjustable-rate, one- to four-family residential loans while originating fixed-rate, one- to four-family residential loans primarily for immediate resale in the secondary market. Management continually monitors the loan portfolio for the purpose of product diversification and over concentration.
The Bank constantly monitors its deposits in an effort to prohibit them from adversely impacting the Bank’s interest rate sensitivity. Rates of interest paid on deposits at the Bank are priced competitively in order to meet the Bank’s asset/liability management objectives and spread requirements. As of December 31, 2017 and 2016, the Bank’s savings accounts, checking accounts, and money market deposit accounts totaled $452,098,463 or 74% of its total deposits and $393,673,761 or 78% of total deposits, respectively. The weighted average rate paid on these accounts increased 13 basis points from 0.29% on December 31, 2016 to 0.42% on December 31, 2017 primarily due significant competitive pressures on deposit rates.
INTEREST RATE SENSITIVITY ANALYSIS
The following tables set forth as of December 31, 2017 and 2016, management’s estimates of the projected changes in Economic Value of Equity (“EVE”) in the event of instantaneous and permanent increases and decreases in market interest rates. Dollar amounts are expressed in thousands.
| 12/31/2017 | |||||||||||||||||||||
|
BP Change |
Estimated Net Portfolio Value |
NPV as % of PV of Assets |
|||||||||||||||||||
|
in Rates |
$ Amount |
$ Change |
% Change |
NPV Ratio |
Change |
||||||||||||||||
|
+200 |
$ | 116,010 | $ | 4,350 | 4 | % | 14.84 | % | 0.86 | % | |||||||||||
|
+100 |
115,268 | 3,608 | 3 | % | 14.57 | % | 0.59 | % | |||||||||||||
|
NC |
111,660 | - | 0 | % | 13.98 | % | 0.00 | % | |||||||||||||
| -100 | 105,747 | (5,913 | ) | -5 | % | 13.15 | % | -0.83 | % | ||||||||||||
| -200 | 87,071 | (24,589 | ) | -22 | % | 10.78 | % | -3.20 | % | ||||||||||||
| 12/31/2016 | |||||||||||||||||||||
|
BP Change |
Estimated Net Portfolio Value |
NPV as % of PV of Assets |
|||||||||||||||||||
|
in Rates |
$ Amount |
$ Change |
% Change |
NPV Ratio |
Change |
||||||||||||||||
|
+200 |
$ | 92,319 | $ | (8,391 | ) | -8 | % | 13.95 | % | -0.69 | % | ||||||||||
|
+100 |
96,547 | (4,163 | ) | -4 | % | 14.31 | % | -0.32 | % | ||||||||||||
|
NC |
100,710 | - | 0 | % | 14.63 | % | 0.00 | % | |||||||||||||
| -100 | 95,335 | (5,375 | ) | -5 | % | 13.70 | % | -0.93 | % | ||||||||||||
| -200 | 86,491 | (14,219 | ) | -14 | % | 12.25 | % | -2.38 | % | ||||||||||||
Computations of prospective effects of hypothetical interest rate changes are based on an internally generated model using actual maturity and repricing schedules for the Bank’s loans and deposits, and are based on numerous assumptions, including relative levels of market interest rates, loan repayments and deposit run-offs, and should not be relied upon as indicative of actual results. Further, the computations do not contemplate any actions the Bank may undertake in response to changes in interest rates. All EVE and earnings projections are based on a point in time static balance sheet.
Management cannot predict future interest rates or their effect on the Bank’s EVE in the future. Certain shortcomings are inherent in the method of analysis presented in the computation of EVE. For example, although certain assets and liabilities may have similar maturities or periods to repricing, they may react in differing degrees to changes in market interest rates. Additionally, certain assets, such as floating-rate loans, which represent the Bank’s primary loan product, have an initial fixed rate period typically from one to five years and over the remaining life of the asset changes in the interest rate are restricted. In addition, the proportion of adjustable-rate loans in the Bank’s loan portfolio could decrease in future periods due to refinancing activity if market interest rates remain constant or decrease in the future. Further, in the event of a change in interest rates, prepayment and early withdrawal levels could deviate significantly from those assumed in the table. Finally, the ability of many borrowers to service their adjustable-rate debt may decrease in the event of an interest rate increase.
The Bank’s Board of Directors is responsible for reviewing the Bank’s asset and liability policies. The Bank’s management is responsible for administering the policies and determinations of the Board of Directors with respect to the Bank’s asset and liability goals and strategies. Management expects that the Bank’s asset and liability policies and strategies will continue as described above so long as competitive and regulatory conditions in the financial institution industry and market interest rates continue as they have in recent years.
Item 8. Financial Statements and Supplementary Data
|
Guaranty Federal Bancshares, Inc. |
||
|
Consolidated Balance Sheets |
||
|
December 31, 2017 and 2016 |
|
December 31, |
December 31, |
|||||||
|
2017 |
2016 |
|||||||
|
ASSETS |
||||||||
|
Cash and due from banks |
$ | 4,094,694 | $ | 3,769,478 | ||||
|
Interest-bearing deposits in other financial institutions |
33,312,236 | 5,318,963 | ||||||
|
Cash and cash equivalents |
37,406,930 | 9,088,441 | ||||||
|
Available-for-sale securities |
81,478,673 | 92,399,235 | ||||||
|
Held-to-maturity securities |
16,457 | 27,528 | ||||||
|
Stock in Federal Home Loan Bank, at cost |
4,597,500 | 4,611,000 | ||||||
|
Mortgage loans held for sale |
1,921,819 | 2,183,633 | ||||||
|
Loans receivable, net of allowance for loan losses at |
||||||||
|
December 31, 2017 and 2016 - $7,107,418 and $5,742,449, respectively |
629,605,009 | 538,273,640 | ||||||
|
Accrued interest receivable |
2,449,847 | 1,947,063 | ||||||
|
Prepaid expenses and other assets |
3,846,686 | 2,961,336 | ||||||
|
Foreclosed assets held for sale |
282,785 | 2,682,353 | ||||||
|
Premises and equipment, net |
10,607,094 | 10,871,039 | ||||||
|
Bank owned life insurance |
19,740,623 | 19,272,893 | ||||||
|
Deferred and receivable income taxes |
2,506,097 | 3,661,658 | ||||||
| $ | 794,459,520 | $ | 687,979,819 | |||||
|
LIABILITIES AND STOCKHOLDERS' EQUITY |
||||||||
|
LIABILITIES |
||||||||
|
Deposits |
$ | 607,364,350 | $ | 505,362,750 | ||||
|
Federal Home Loan Bank advances |
94,300,000 | 95,700,000 | ||||||
|
Subordinated debentures |
15,465,000 | 15,465,000 | ||||||
|
Advances from borrowers for taxes and insurance |
180,269 | 192,460 | ||||||
|
Accrued expenses and other liabilities |
1,962,865 | 1,077,396 | ||||||
|
Accrued interest payable |
295,543 | 207,833 | ||||||
| 719,568,027 | 618,005,439 | |||||||
|
COMMITMENTS AND CONTINGENCIES |
- | - | ||||||
|
STOCKHOLDERS' EQUITY |
||||||||
|
Capital Stock: |
||||||||
|
Common stock, $0.10 par value; authorized 10,000,000 shares; issued |
||||||||
|
December 31, 2017 and 2016 - 6,878,503 and 6,875,503 shares, respectively |
687,850 | 687,550 | ||||||
|
Additional paid-in capital |
50,856,069 | 50,552,077 | ||||||
|
Retained earnings, substantially restricted |
60,679,308 | 57,347,282 | ||||||
|
Accumulated other comprehensive loss |
(206,193 | ) | (1,309,241 | ) | ||||
| 112,017,034 | 107,277,668 | |||||||
|
Treasury stock, at cost; December 31, 2017 and 2016 - 2,453,728 and 2,465,476 shares, respectively |
(37,125,541 | ) | (37,303,288 | ) | ||||
| 74,891,493 | 69,974,380 | |||||||
| $ | 794,459,520 | $ | 687,979,819 | |||||
|
See Notes to Consolidated Financial Statements |
|
Guaranty Federal Bancshares, Inc. |
|||||
|
Consolidated Statements of Income |
|||||
|
Years Ended December 31, 2017, 2016 and 2015 |
|
2017 |
2016 |
2015 |
||||||||||
|
Interest Income |
||||||||||||
|
Loans |
$ | 27,454,089 | $ | 23,314,776 | $ | 23,564,766 | ||||||
|
Investment securities |
1,791,921 | 1,895,395 | 1,483,772 | |||||||||
|
Other |
194,723 | 179,155 | 141,096 | |||||||||
| 29,440,733 | 25,389,326 | 25,189,634 | ||||||||||
|
Interest Expense |
||||||||||||
|
Deposits |
3,751,565 | 2,283,982 | 2,423,871 | |||||||||
|
Federal Home Loan Bank advances |
1,703,787 | 1,313,620 | 1,196,393 | |||||||||
|
Subordinated debentures |
631,202 | 579,410 | 538,785 | |||||||||
|
Securities sold under agreements to repurchase |
- | - | 120,833 | |||||||||
| 6,086,554 | 4,177,012 | 4,279,882 | ||||||||||
|
Net Interest Income |
23,354,179 | 21,212,314 | 20,909,752 | |||||||||
|
Provision for Loan Losses |
1,750,000 | 1,375,000 | 600,000 | |||||||||
|
Net Interest Income After Provision for Loan Losses |
21,604,179 | 19,837,314 | 20,309,752 | |||||||||
|
Noninterest Income |
||||||||||||
|
Service charges |
1,189,575 | 1,134,664 | 1,214,880 | |||||||||
|
Gain on sale of investment securities |
46,329 | 192,537 | 187,090 | |||||||||
|
Gain on sale of mortgage loans held for sale |
2,021,208 | 1,708,478 | 1,396,358 | |||||||||
|
Gain on sale of Small Business Administration loans |
746,639 | 297,462 | 344,818 | |||||||||
|
Net gain (loss) on foreclosed assets |
182,004 | 1,270 | (164,663 | ) | ||||||||
|
Other income |
1,541,565 | 1,535,796 | 1,499,589 | |||||||||
| 5,727,320 | 4,870,207 | 4,478,072 | ||||||||||
|
Noninterest Expense |
||||||||||||
|
Salaries and employee benefits |
12,040,528 | 10,686,564 | 9,805,337 | |||||||||
|
Occupancy |
2,204,408 | 1,827,209 | 1,904,886 | |||||||||
|
FDIC deposit insurance premiums |
245,115 | 350,475 | 447,044 | |||||||||
|
Prepayment penalty on repurchase agreements |
- | - | 463,992 | |||||||||
|
Data processing |
987,193 | 889,575 | 790,928 | |||||||||
|
Advertising |
525,000 | 525,000 | 525,000 | |||||||||
|
Impairment on investment tax credits |
587,428 | - | - | |||||||||
|
Merger costs |
151,270 | - | - | |||||||||
|
Other expense |
2,862,144 | 2,821,923 | 2,672,541 | |||||||||
| 19,603,086 | 17,100,746 | 16,609,728 | ||||||||||
|
Income Before Income Taxes |
7,728,413 | 7,606,775 | 8,178,096 | |||||||||
|
Provision for Income Taxes |
2,570,749 | 2,012,764 | 2,461,329 | |||||||||
|
Net Income Available to Common Shareholders |
$ | 5,157,664 | $ | 5,594,011 | $ | 5,716,767 | ||||||
|
Basic Income Per Common Share |
$ | 1.18 | $ | 1.28 | $ | 1.32 | ||||||
|
Diluted Income Per Common Share |
$ | 1.16 | $ | 1.27 | $ | 1.30 | ||||||
|
See Notes to Consolidated Financial Statements |
|
Guaranty Federal Bancshares, Inc. |
|||
|
Consolidated Statements of Comprehensive Income |
|||
|
Years Ended December 31, 2017, 2016 and 2015 |
|
2017 |
2016 |
2015 |
||||||||||
|
NET INCOME |
$ | 5,157,664 | $ | 5,594,011 | $ | 5,716,767 | ||||||
|
OTHER ITEMS OF COMPREHENSIVE INCOME (LOSS): |
||||||||||||
|
Change in unrealized gain (loss) on investment securities available-for-sale, before income taxes |
1,182,895 | (799,869 | ) | (186,775 | ) | |||||||
|
Change in unrealized gain (loss) on interest rate swaps, before income taxes |
632,990 | - | - | |||||||||
|
Less: Reclassification adjustment for realized gains on investment securities included in net income, before income taxes |
(46,329 | ) | (192,537 | ) | (187,090 | ) | ||||||
|
Total other items of comprehensive income (loss) |
1,769,556 | (992,406 | ) | (373,865 | ) | |||||||
|
Income tax expense (benefit) related to other items of comprehensive income |
666,508 | (367,121 | ) | (138,330 | ) | |||||||
|
Other comprehensive income (loss) |
1,103,048 | (625,285 | ) | (235,535 | ) | |||||||
|
TOTAL COMPREHENSIVE INCOME |
$ | 6,260,712 | $ | 4,968,726 | $ | 5,481,232 | ||||||
|
See Notes to Consolidated Financial Statements |
|
Guaranty Federal Bancshares, Inc. |
|||
|
Consolidated Statements of Cash Flows |
|||
|
Years Ended December 31, 2017, 2016 and 2015 |
|
2017 |
2016 |
2015 |
||||||||||
|
CASH FLOWS FROM OPERATING ACTIVITIES |
||||||||||||
|
Net income |
$ | 5,157,664 | $ | 5,594,011 | $ | 5,716,767 | ||||||
|
Items not requiring (providing) cash: |
||||||||||||
|
Deferred income taxes |
1,080,452 | 123,091 | 320,738 | |||||||||
|
Depreciation |
1,155,642 | 845,221 | 918,441 | |||||||||
|
Provision for loan losses |
1,750,000 | 1,375,000 | 600,000 | |||||||||
|
Gain on sale of Small Business Administration loans |
(746,639 | ) | (297,462 | ) | (344,818 | ) | ||||||
|
Gain on sale of mortgage loans held for sale and investment securities |
(2,067,537 | ) | (1,901,015 | ) | (1,758,087 | ) | ||||||
|
Loss on sale of equipment and other assets |
95,863 | - | - | |||||||||
|
Loss (gain) on sale of foreclosed assets |
(249,349 | ) | (112,576 | ) | 104,670 | |||||||
|
Amortization of deferred income, premiums and discounts, net |
840,340 | 665,361 | 704,985 | |||||||||
|
Stock award plans |
466,469 | 373,782 | 285,589 | |||||||||
|
Origination of loans held for sale |
(70,835,359 | ) | (63,974,589 | ) | (56,515,986 | ) | ||||||
|
Proceeds from sale of loans held for sale |
73,118,381 | 65,402,367 | 57,398,682 | |||||||||
|
Increase in cash surrender value of bank owned life insurance |
(467,730 | ) | (492,978 | ) | (362,695 | ) | ||||||
|
Changes in: |
||||||||||||
|
Accrued interest receivable |
(502,784 | ) | 39,629 | 43,366 | ||||||||
|
Prepaid expenses and other assets |
1,097,510 | 563,696 | 1,005,159 | |||||||||
|
Accrued expenses and other liabilities |
883,209 | (75,505 | ) | (69,305 | ) | |||||||
|
Income taxes receivable/payable |
(494,295 | ) | 341,305 | (208,412 | ) | |||||||
|
Net cash provided by operating activities |
10,281,837 | 8,469,338 | 7,839,094 | |||||||||
|
CASH FLOWS FROM INVESTING ACTIVITIES |
||||||||||||
|
Net change in loans |
(119,195,775 | ) | (51,498,165 | ) | (4,870,934 | ) | ||||||
|
Proceeds from sale of loans receivable |
26,781,419 | - | - | |||||||||
|
Principal payments on held-to-maturity securities |
11,071 | 15,571 | 17,894 | |||||||||
|
Principal payments on available-for-sale securities |
6,649,871 | 8,884,281 | 10,445,669 | |||||||||
|
Purchase of available-for-sale securities |
(15,975,995 | ) | (82,423,495 | ) | (55,150,017 | ) | ||||||
|
Proceeds from sales of available-for-sale securities |
20,869,621 | 76,480,961 | 33,059,741 | |||||||||
|
Proceeds from maturities of available-for-sale securities |
- | 535,000 | - | |||||||||
|
Purchase of premises and equipment |
(3,684,707 | ) | (1,175,832 | ) | (856,106 | ) | ||||||
|
Purchase of tax credit investments |
(1,415,156 | ) | - | - | ||||||||
|
Proceeds from sale of premises and equipment |
2,697,147 | - | - | |||||||||
|
Purchase of bank owned life insurance |
- | - | (4,000,000 | ) | ||||||||
|
(Purchase) redemption of Federal Home Loan Bank stock |
13,500 | (1,773,500 | ) | 319,400 | ||||||||
|
Proceeds from sale of foreclosed assets held for sale |
2,448,163 | 2,922,119 | 797,876 | |||||||||
|
Net cash used in investing activities |
(80,800,841 | ) | (48,033,060 | ) | (20,236,477 | ) | ||||||
See Notes to Consolidated Financial Statements
|
Guaranty Federal Bancshares, Inc. |
|||
|
Consolidated Statements of Cash Flows |
|||
|
Years Ended December 31, 2017, 2016 and 2015 |
|
2017 |
2016 |
2015 |
||||||||||
|
CASH FLOWS FROM FINANCING ACTIVITIES |
||||||||||||
|
Net increase (decrease) in demand deposits, |
||||||||||||
|
NOW accounts and savings accounts |
$ | 58,424,702 | $ | (8,163,633 | ) | $ | 43,000,898 | |||||
|
Net increase (decrease) in certificates of deposit |
43,576,898 | (3,859,312 | ) | (5,433,485 | ) | |||||||
|
Repayment of securities sold under agreements to repurchase |
- | - | (10,000,000 | ) | ||||||||
|
Proceeds from FHLB and Federal Reserve advances |
761,600,000 | 223,099,999 | - | |||||||||
|
Repayments of FHLB and Federal Reserve advances |
(763,000,000 | ) | (179,499,999 | ) | (8,250,000 | ) | ||||||
|
Advances from (repayments to) borrowers for taxes and insurance |
(12,191 | ) | 1,607 | 46,869 | ||||||||
|
Proceeds from Stock options exercised |
15,570 | 85,800 | 187,129 | |||||||||
|
Common and preferred cash dividends paid |
(1,767,486 | ) | (1,415,180 | ) | (873,499 | ) | ||||||
|
Treasury stock purchased |
- | (371,538 | ) | - | ||||||||
|
Net cash provided by financing activities |
98,837,493 | 29,877,744 | 18,677,912 | |||||||||
|
INCREASE (DECREASE) IN CASH AND CASH EQUIVALENTS |
28,318,489 | (9,685,978 | ) | 6,280,529 | ||||||||
|
CASH AND CASH EQUIVALENTS, BEGINNING OF YEAR |
9,088,441 | 18,774,419 | 12,493,890 | |||||||||
|
CASH AND CASH EQUIVALENTS, END OF YEAR |
$ | 37,406,930 | $ | 9,088,441 | $ | 18,774,419 | ||||||
|
Supplemental Cash Flows Information |
||||||||||||
|
Real estate acquired in settlement of loans |
$ | 1,209,279 | $ | 3,228,589 | $ | 190,026 | ||||||
|
Interest paid |
$ | 5,998,844 | $ | 4,165,281 | $ | 4,325,925 | ||||||
|
Income taxes paid, net of (refunds) |
$ | 1,138,000 | $ | 724,000 | $ | 1,445,000 | ||||||
|
Sale and financing of foreclosed assets held for sale |
$ | 1,588,921 | $ | 149,920 | $ | 61,200 | ||||||
|
See Notes to Consolidated Financial Statements |
|
Guaranty Federal Bancshares, Inc. |
|||
|
Consolidated Statements of Stockholders' Equity |
|||
|
Years Ended December 31, 2017, 2016 and 2015 |
|
Common Stock |
Additional Paid-In Capital |
Treasury Stock |
||||||||||
|
Balance, January 1, 2015 |
682,320 | 50,366,546 | (37,673,289 | ) | ||||||||
|
Net income |
- | - | - | |||||||||
|
Change in unrealized gain (loss) on available-for-sale securities, net of income taxes of $138,330 |
- | - | - | |||||||||
|
Dividends on common stock ($0.23 per share) |
- | - | - | |||||||||
|
Stock award plans |
- | (108,631 | ) | 394,220 | ||||||||
|
Stock options exercised |
3,580 | 183,549 | - | |||||||||
|
Balance, December 31, 2015 |
685,900 | 50,441,464 | (37,279,069 | ) | ||||||||
|
Net income |
- | - | - | |||||||||
|
Change in unrealized gain (loss) on available-for-sale securities, net of income taxes of $367,121 |
- | - | - | |||||||||
|
Dividends on common stock ($0.34 per share) |
- | - | - | |||||||||
|
Treasury stock purchased |
- | - | (371,538 | ) | ||||||||
|
Stock award plans |
- | 26,463 | 347,319 | |||||||||
|
Stock options exercised |
1,650 | 84,150 | - | |||||||||
|
Balance, December 31, 2016 |
687,550 | 50,552,077 | (37,303,288 | ) | ||||||||
|
Net income |
- | - | - | |||||||||
|
Change in unrealized gain on available-for-sale securities and effect of interest rate swaps, net of income taxes of $666,508 |
- | - | - | |||||||||
|
Reclassification of amounts within AOCI to retained earnings due to tax reform |
- | - | - | |||||||||
|
Dividends on common stock ($0.42 per share) |
- | - | - | |||||||||
|
Stock award plans |
- | 288,722 | 177,747 | |||||||||
|
Stock options exercised |
300 | 15,270 | - | |||||||||
|
Balance, December 31, 2017 |
$ | 687,850 | $ | 50,856,069 | $ | (37,125,541 | ) | |||||
|
See Notes to Consolidated Financial Statements |
|
Guaranty Federal Bancshares, Inc. |
||
|
Consolidated Statements of Stockholders' Equity |
||
|
Years Ended December 31, 2017, 2016 and 2015 |
|
Retained Earnings |
Accumulated Other Comprehensive Income (Loss) |
Total |
||||||||
| 48,549,691 | (448,421 | ) | 61,476,847 | |||||||
| 5,716,767 | - | 5,716,767 | ||||||||
| - | (235,535 | ) | (235,535 | ) | ||||||
| (1,008,332 | ) | - | (1,008,332 | ) | ||||||
| - | - | 285,589 | ||||||||
| - | - | 187,129 | ||||||||
| 53,258,126 | (683,956 | ) | 66,422,465 | |||||||
| 5,594,011 | - | 5,594,011 | ||||||||
| - | (625,285 | ) | (625,285 | ) | ||||||
| (1,504,855 | ) | - | (1,504,855 | ) | ||||||
| - | - | (371,538 | ) | |||||||
| - | - | 373,782 | ||||||||
| - | - | 85,800 | ||||||||
| 57,347,282 | (1,309,241 | ) | 69,974,380 | |||||||
| 5,157,664 | - | 5,157,664 | ||||||||
| - | 1,103,048 | 1,103,048 | ||||||||
| 31,818 | - | 31,818 | ||||||||
| (1,857,456 | ) | - | (1,857,456 | ) | ||||||
| - | - | 466,469 | ||||||||
| - | - | 15,570 | ||||||||
| $ | 60,679,308 | $ | (206,193 | ) | $ | 74,891,493 | ||||
|
See Notes to Consolidated Financial Statements |
GUARANTY FEDERAL BANCSHARES, INC.
NOTES TO CONSOLIDATED FINANCIAL STATEMENTS
NOTE 1: NATURE OF OPERATIONS AND SUMMARY OF SIGNIFICANT ACCOUNTING POLICIES
Nature of Operations
The Company operates as a one-bank holding company. The Bank is primarily engaged in providing a full range of banking and mortgage services to individual and corporate customers in southwest Missouri. The Bank is subject to competition from other financial institutions. The Company and the Bank are also subject to the regulation of certain federal and state agencies and receive periodic examinations by those regulatory authorities.
Principles of Consolidation
The consolidated financial statements include the accounts of the Company and its wholly owned subsidiary, the Bank. All significant intercompany profits, transactions and balances have been eliminated in consolidation.
Use of Estimates
The preparation of financial statements in conformity with accounting principles generally accepted in the United States of America requires management to make estimates and assumptions that affect the reported amounts of assets and liabilities and disclosure of contingent assets and liabilities at the date of the financial statements and the reported amounts of revenues and expenses during the reporting period. Actual results could differ from those estimates.
Material estimates that are particularly susceptible to significant change in the near term relate to the determination of the allowance for loan losses, the valuation of real estate acquired in connection with foreclosures or in satisfaction of loans and fair values. In connection with the determination of the allowance for loan losses and the valuation of foreclosed assets held for sale, management obtains independent appraisals for significant properties.
Securities
Certain debt securities that management has the positive intent and ability to hold to maturity are classified as “held to maturity” and recorded at amortized cost. Securities not classified as held to maturity are classified as “available-for-sale” and are carried at fair value, with unrealized gains and losses excluded from earnings and reported in other comprehensive income. Purchase premiums are recognized in interest income using the interest method over the terms of the securities. Gains and losses on the sale of securities are recorded on the trade date and are determined using the specific identification method.
For debt securities with fair value below carrying value, when the Company does not intend to sell a debt security, and it is more likely than not, the Company will not have to sell the security before a recovery of its cost basis, it recognizes the credit component of an other-than-temporary impairment of a debt security in earnings and the remaining portion in other comprehensive income. For held-to-maturity debt securities, the amount of an other-than-temporary impairment recorded in other comprehensive income for the noncredit portion of a previous other-than-temporary impairment is amortized prospectively over the remaining life of the security on the basis of the timing of future estimated cash flows of the security.
The Company’s consolidated statements of income reflect the full impairment (that is, the difference between the security’s amortized cost basis and fair value) on debt securities that the Company intends to sell or would more likely than not be required to sell before the expected recovery of the amortized cost basis. For available-for-sale and held-to-maturity debt securities that management has no intent to sell and believes that it more likely than not will not be required to sell prior to recovery, only the credit loss component of the impairment is recognized in earnings, while the noncredit loss is recognized in accumulated other comprehensive income. The credit loss component recognized in earnings is identified as the amount of principal cash flows not expected to be received over the remaining term of the security as projected based on cash flow projections.
Mortgage Loans Held for Sale
Mortgage loans held for sale are carried at the lower of cost or fair value, determined using an aggregate basis. Write-downs to fair value are recognized as a charge to earnings at the time a decline in value occurs. Forward commitments to sell mortgage loans are sometimes acquired to reduce market risk on mortgage loans in the process of origination and mortgage loans held for sale. Gains and losses resulting from sales of mortgage loans are recognized when the respective loans are sold to investors. Gains and losses are determined by the difference between the selling price and the carrying amounts of the loans sold, and are recorded in noninterest income. Direct loan origination costs and fees are deferred at origination of the loan and are recognized in noninterest income upon sale of the loan.
Loans
For loans amortized at cost, interest income is accrued based on the unpaid principal balance. Loan origination fees net of certain direct origination costs, are deferred and amortized as a level yield adjustment over the respective term of the loan.
The accrual of interest on loans is discontinued at the time the loan is 90 days past due unless the credit is well-secured and in process of collection. Past due status is based on contractual terms of the loan. In all cases, loans are placed on nonaccrual or charged off at an earlier date if collection of principal or interest is considered doubtful.
All interest accrued but not collected for loans that are placed on nonaccrual or charged off is reversed against interest income. The interest on these loans is accounted for on the cash-basis or cost-recovery method, until qualifying for return to accrual. Loans are returned to accrual status when all the principal and interest amounts contractually due are brought current and future payments are reasonably assured.
Allowance for Loan Losses
The allowance for loan losses is established as losses are estimated to have occurred through a provision for loan losses charged to income. Loan losses are charged against the allowance when management believes the uncollectibility of a loan balance is confirmed. Subsequent recoveries, if any, are credited to the allowance.
The allowance for loan losses is evaluated on a regular basis by management and is based upon management’s periodic review of the collectibility of the loans in light of historical experience, the nature and volume of the loan portfolio, adverse situations that may affect the borrower’s ability to repay, estimated value of any underlying collateral and prevailing economic conditions. This evaluation is inherently subjective as it requires estimates that are susceptible to significant revision as more information becomes available.
The allowance consists of allocated and general components. The allocated component relates to loans that are classified as impaired. For those loans that are classified as impaired, an allowance is established when the discounted cash flows (or collateral value or observable market price) of the impaired loan is lower than the carrying value of that loan. The general component covers nonclassified loans and is based on historical charge-off experience and expected loss given default derived from the Bank’s internal risk rating process. Other adjustments may be made to the allowance for pools of loans after an assessment of internal or external influences on credit quality that are not fully reflected in the historical loss or risk rating data.
A loan is considered impaired when, based on current information and events, it is probable that the Bank will be unable to collect the scheduled payments of principal or interest when due according to the contractual terms of the loan agreement. Factors considered by management in determining impairment include payment status, collateral value and the probability of collecting scheduled principal and interest payments when due. Loans that experience insignificant payment delays and payment shortfalls generally are not classified as impaired. Management determines the significance of payment delays and payment shortfalls on a case-by-case basis, taking into consideration all of the circumstances surrounding the loan and the borrower, including the length of the delay, the reasons for the delay, the borrower’s prior payment record and the amount of the shortfall in relation to the principal and interest owed. Impairment is measured on a loan-by-loan basis by either the present value of expected future cash flows discounted at the loan’s effective interest rate, the loan’s obtainable market price or the fair value of the collateral if the loan is collateral dependent.
Groups of loans with similar risk characteristics are collectively evaluated for impairment based on the group’s historical loss experience adjusted for changes in trends, conditions and other relevant factors that affect repayment of the loans.
Foreclosed Assets Held for Sale
Assets acquired through, or in lieu of, loan foreclosure are held for sale and are initially recorded at fair value less costs to sell at the date of foreclosure, establishing a new cost basis. Subsequent to foreclosure, valuations are periodically performed by management and the assets are carried at the lower of carrying amount or fair value less estimated costs to sell. Revenue and expenses from operations and changes in the valuation allowance are included in net expenses from foreclosed assets.
Premises and Equipment
Depreciable assets are stated at cost less accumulated depreciation. Depreciation is charged to expense using the straight-line method over the estimated useful lives of the assets. The estimated useful lives for each major depreciable classification of premises and equipment are as follows:
| Buildings and improvements (years) | 35 | - | 40 | ||
| Furniture and fixtures and vehicles (years) | 3 | - | 10 |
Bank Owned Life Insurance
Bank owned life insurance policies are carried at their cash surrender value. The Company recognizes tax-free income from the periodic increases in cash surrender value of these policies and from death benefits.
Income Taxes
The Company accounts for income taxes in accordance with income tax accounting guidance (ASC 740, Income Taxes). The income tax accounting guidance results in two components of income tax expense: current and deferred. Current income tax expense reflects taxes to be paid or refunded for the current period by applying the provisions of the enacted tax law to the taxable income or excess of deductions over revenues. The Company determines deferred income taxes using the liability (or balance sheet) method. Under this method, the net deferred tax asset or liability is based on the tax effects of the differences between the book and tax bases of assets and liabilities, and enacted changes in tax rates and laws are recognized in the period in which they occur.
Deferred income tax expense results from changes in deferred tax assets and liabilities between periods. Deferred tax assets are recognized if it is more likely than not, based on the technical merits, that the tax position will be realized or sustained upon examination. The term more likely than not means a likelihood of more than 50 percent; the terms examined and upon examination also include resolution of the related appeals or litigation processes, if any. A tax position that meets the more-likely-than-not recognition threshold is initially and subsequently measured as the largest amount of tax benefit that has a greater than 50 percent likelihood of being realized upon settlement with a taxing authority that has full knowledge of all relevant information. The determination of whether or not a tax position has met the more-likely-than-not recognition threshold considers the facts, circumstances and information available at the reporting date and is subject to management’s judgment. Deferred tax assets are reduced by a valuation allowance if, based on the weight of evidence available, it is more likely than not that some portion or all of a deferred tax asset will not be realized.
The Company recognizes interest and penalties on income taxes as a component of income tax expense.
The Company files consolidated income tax returns with its subsidiary. With a few exceptions, the Company is no longer subject to U.S. federal or state income tax examinations by tax authorities for years before 2014.
Cash Equivalents
The Company considers all liquid investments with original maturities of three months or less to be cash equivalents. At December 31, 2017 and 2016 cash equivalents consisted of interest-bearing deposits and money market accounts.
Restriction on Cash and Due From Banks
The Company is required to maintain reserve funds in cash and/or on deposit with the Federal Reserve Bank. The Company’s required reserve on December 31, 2017 was $1,424,000.
Comprehensive Income
Comprehensive income consists of net income and other comprehensive income (loss), net of applicable income taxes. Other comprehensive income (loss) includes unrealized gain (loss) on available-for-sale securities, unrealized gain (loss) on available-for-sale securities for which a portion of an other-than-temporary impairment has been recognized in income, unrealized gain (loss) on held-to-maturity securities for which a portion of an other-than-temporary impairment has been recognized in income and unrealized gain (loss) on interest rate swap agreements designated as cash flow hedges.
Interest Rate Swap Agreements Designated as Cash Flow Hedges
Cash flow hedge relationships mitigate exposure to the variability of future cash flows or other forecasted transactions. The Company uses interest rate swaps to manage overall cash flow changes related to interest rate risk exposure on benchmark interest rate loans. The effective portion of the gain or loss related to the derivative instrument is recognized as a component of other comprehensive income and subsequently reclassified into interest income when the forecasted transaction affects income. The ineffective portion of the gain or loss is recognized immediately as noninterest income. The Company assesses the effectiveness of the hedging derivative by comparing the change in fair value of the respective derivative instrument and the change in fair value of an effective hypothetical derivative instrument.
Regulatory Matters
The Bank is subject to various regulatory capital requirements administered by the federal banking agencies. Failure to meet minimum capital requirements can initiate certain mandatory and possibly additional discretionary actions by regulators that, if undertaken, could have a direct and material effect on the Company's consolidated financial statements. Under capital adequacy guidelines and the regulatory framework for prompt corrective action, the Bank must meet specific capital guidelines that involve quantitative measures of assets, liabilities and certain off-balance-sheet items as calculated under regulatory accounting practices. The capital amounts and classification are also subject to qualitative judgments by the regulators about components, risk weightings and other factors. Furthermore, the Company’s regulators could require adjustments to regulatory capital not reflected in these financial statements.
Quantitative measures established by regulation to ensure capital adequacy require the Bank to maintain minimum amounts and ratios (set forth in the table below). Management believes, as of December 31, 2017 and 2016, that the Bank met all capital adequacy requirements to which it is subject.
As of December 31, 2017, the most recent notification from the Missouri Division of Finance and the Federal Deposit Insurance Corporation categorized the Bank as well capitalized under the regulatory framework for prompt corrective action. To be categorized as well capitalized the Bank must maintain minimum total risk-based, Tier I risk-based, Tier I leverage and Common Equity Tier 1 risk-based ratios as set forth in the following table. There are no conditions or events since that notification that management believes have changed the Bank’s category.
The Bank's actual capital amounts and ratios are also presented in the table. No amount was deducted from capital for interest-rate risk. Dollar amounts are expressed in thousands.
|
To Be Well Capitalized |
||||||||||||||||||||||||
|
For Capital |
Under Prompt Corrective |
|||||||||||||||||||||||
|
Actual |
Adequacy Purposes |
Action Provisions |
||||||||||||||||||||||
|
Amount |
Ratio |
Amount |
Ratio |
Amount |
Ratio |
|||||||||||||||||||
|
As of December 31, 2017 |
||||||||||||||||||||||||
|
Tier 1 (core) capital, and ratio to adjusted total assets Bank |
$ | 89,526 | 11.5 | % | $ | 31,227 | 4.0 | % | $ | 39,034 | 5.0 | % | ||||||||||||
|
Tier 1 (core) capital, and ratio to risk-weighted assets Bank |
$ | 89,526 | 12.5 | % | $ | 42,939 | 6.0 | % | $ | 57,252 | 8.0 | % | ||||||||||||
|
Total risk-based capital, and ratio to risk-weighted assets Bank |
$ | 96,633 | 13.5 | % | $ | 57,252 | 8.0 | % | $ | 71,565 | 10.0 | % | ||||||||||||
|
Common equity tier 1 capital ratio to risk-weighted assets Bank |
$ | 89,526 | 12.5 | % | $ | 32,204 | 4.5 | % | $ | 46,517 | 6.5 | % | ||||||||||||
|
To Be Well Capitalized |
||||||||||||||||||||||||
|
For Capital |
Under Prompt Corrective |
|||||||||||||||||||||||
|
Actual |
Adequacy Purposes |
Action Provisions |
||||||||||||||||||||||
|
Amount |
Ratio |
Amount |
Ratio |
Amount |
Ratio |
|||||||||||||||||||
|
As of December 31, 2016 |
||||||||||||||||||||||||
|
Tier 1 (core) capital, and ratio to adjusted total assets Bank |
$ | 85,255 | 12.5 | % | $ | 27,283 | 4.0 | % | $ | 34,103 | 5.0 | % | ||||||||||||
|
Tier 1 (core) capital, and ratio to risk-weighted assets Bank |
$ | 85,255 | 14.0 | % | $ | 36,434 | 6.0 | % | $ | 48,578 | 8.0 | % | ||||||||||||
|
Total risk-based capital, and ratio to risk-weighted assets Bank |
$ | 90,997 | 15.0 | % | $ | 48,578 | 8.0 | % | $ | 60,723 | 10.0 | % | ||||||||||||
|
Common equity tier 1 capital ratio to risk-weighted assets Bank |
$ | 85,255 | 14.0 | % | $ | 27,325 | 4.5 | % | $ | 39,470 | 6.5 | % | ||||||||||||
The above minimum capital requirements exclude the capital conversion buffer required to avoid limitations on capital distributions, including dividend payments and certain discretionary bonus payments to executive officers. The capital conservation buffer is being phased in from 0.0% for 2015 to 2.50% by 2019. The capital conversion buffer was 1.25% at December 31, 2017. The net unrealized gain or loss on available-for-sale securities is not included in computing regulatory capital.
The amount of dividends that the Bank may pay is subject to various regulatory limitations. As of December 31, 2017 and 2016 the Bank exceeded the minimum capital requirements. The Bank may not pay dividends which would reduce capital below the minimum requirements shown above.
Segment Information
The principal business of the Company is overseeing the business of the Bank. The Company has no significant assets other than its investment in the Bank. The banking operation is the Company’s only reportable segment. The banking segment is principally engaged in the business of originating mortgage loans secured by one-to-four family residences, multi-family, construction, commercial and consumer loans. These loans are funded primarily through the attraction of deposits from the general public, borrowings from the Federal Home Loan Bank and brokered deposits. Selected information is not presented separately for the Company’s reportable segment, as there is no material difference between that information and the corresponding information in the consolidated financial statements.
General Litigation
The Company and the Bank, from time to time, may be parties to ordinary routine litigation, which arises in the normal course of business, such as claims to enforce liens, and condemnation proceedings, on properties in which the Bank holds security interests, claims involving the making and servicing of real property loans, and other issues incident to the business of the Company and the Bank. After reviewing pending and threatened litigation with legal counsel, management believes that as of December 31, 2017, the outcome of any such litigation will not have a material adverse effect on the Company’s financial position or results of operations.
Earnings Per Common Share
The computation for earnings per common share for the years ended December 31, 2017, 2016 and 2015 is as follows:
|
Year Ended |
Year Ended |
Year Ended |
||||||||||
|
December 31, 2017 |
December 31, 2016 |
December 31, 2015 |
||||||||||
|
Net income available to common shareholders |
$ | 5,157,664 | $ | 5,594,011 | $ | 5,716,767 | ||||||
|
Weighted average common shares outstanding |
4,372,262 | 4,363,949 | 4,333,418 | |||||||||
|
Effect of dilutive securities |
68,685 | 56,299 | 55,931 | |||||||||
|
Weighted average diluted shares outstanding |
4,440,947 | 4,420,248 | 4,389,349 | |||||||||
|
Basic income per common share |
$ | 1.18 | $ | 1.28 | $ | 1.32 | ||||||
|
Diluted income per common share |
$ | 1.16 | $ | 1.27 | $ | 1.30 | ||||||
Stock options to purchase 30,000, 68,500 and 88,500 shares of common stock were outstanding during the years ended December 31, 2017, 2016 and 2015, respectively, but were not included in the computation of diluted income per common share because their exercise price was greater than the average market price of the common shares.
NOTE 2: SECURITIES
The amortized cost and approximate fair values, together with gross unrealized gains and losses, of securities classified as available-for-sale are as follows:
|
Amortized Cost |
Gross Unrealized Gains |
Gross Unrealized (Losses) |
Approximate Fair Value |
|||||||||||||
|
As of December 31, 2017 |
||||||||||||||||
|
Debt Securities: |
||||||||||||||||
|
Municipals |
$ | 33,908,207 | $ | 253,872 | $ | (263,621 | ) | $ | 33,898,458 | |||||||
|
Corporates |
3,000,000 | 65,000 | - | 3,065,000 | ||||||||||||
|
Government sponsored mortgage-backed securities and SBA loan pools |
45,414,845 | 9,283 | (908,913 | ) | 44,515,215 | |||||||||||
| $ | 82,323,052 | $ | 328,155 | $ | (1,172,534 | ) | $ | 81,478,673 | ||||||||
|
Amortized Cost |
Gross Unrealized Gains |
Gross Unrealized (Losses) |
Approximate Fair Value |
|||||||||||||
|
As of December 31, 2016 |
||||||||||||||||
|
Debt Securities: |
||||||||||||||||
|
Municipals |
$ | 39,357,506 | $ | 65,673 | $ | (1,085,654 | ) | $ | 38,337,525 | |||||||
|
Corporates |
7,003,986 | 54,050 | (4,514 | ) | 7,053,522 | |||||||||||
|
Government sponsored mortgage-backed securities and SBA loan pools |
48,115,793 | 19,432 | (1,127,037 | ) | 47,008,188 | |||||||||||
| $ | 94,477,285 | $ | 139,155 | $ | (2,217,205 | ) | $ | 92,399,235 | ||||||||
Maturities of available-for-sale debt securities as of December 31, 2017:
|
Amortized Cost |
Approximate Fair Value |
|||||||
|
1-5 years |
$ | 563,318 | $ | 571,615 | ||||
|
5-10 years |
9,238,773 | 9,278,788 | ||||||
|
After ten years |
27,106,116 | 27,113,055 | ||||||
|
Government sponsored mortgage-backed securities and SBA loan pools not due on a single maturity date |
45,414,845 | 44,515,215 | ||||||
| $ | 82,323,052 | $ | 81,478,673 | |||||
The amortized cost and approximate fair values, together with gross unrealized gains and losses, of securities classified as held to maturity are as follows:
|
Amortized Cost |
Gross Unrealized Gains |
Gross Unrealized (Losses) |
Approximate Fair Value |
|||||||||||||
|
As of December 31, 2017 |
||||||||||||||||
|
Debt Securities: |
||||||||||||||||
|
Government sponsored mortgage-backed securities |
$ | 16,457 | $ | 327 | $ | (55 | ) | $ | 16,729 | |||||||
|
Amortized Cost |
Gross Unrealized Gains |
Gross Unrealized (Losses) |
Approximate Fair Value |
|||||||||||||
|
As of December 31, 2016 |
||||||||||||||||
|
Debt Securities: |
||||||||||||||||
|
Government sponsored mortgage-backed securities |
$ | 27,528 | $ | 625 | $ | - | $ | 28,153 | ||||||||
Maturities of held-to-maturity securities as of December 31, 2017:
|
Amortized Cost |
Approximate Fair Value |
|||||||
|
Government sponsored mortgage-backed securities not due on a single maturity date |
$ | 16,457 | $ | 16,729 | ||||
The carrying value of securities pledged as collateral, to secure public deposits and for other purposes, amounted to $35,355,969 and $47,617,900 as of December 31, 2017 and 2016, respectively.
Gross gains of $165,237, $261,875 and $205,909 and gross losses of $118,908, $69,338 and $18,819 resulting from sale of available-for-sale securities were realized for the years ended December 31, 2017, 2016 and 2015, respectively. The tax effect of these net gains was $17,142, $71,239 and $69,223 in 2017, 2016 and 2015, respectively.
The Company evaluates all securities quarterly to determine if any unrealized losses are deemed to be other than temporary. Certain investment securities are valued less than their historical cost. These declines are primarily the result of the rate for these investments yielding less than current market rates, or declines in stock prices of equity securities. Based on evaluation of available evidence, management believes the declines in fair value for these securities are temporary. It is management’s intent to hold the debt securities to maturity or until recovery of the unrealized loss. Should the impairment of any of these debt securities become other than temporary, the cost basis of the investment will be reduced and the resulting loss recognized in net income in the period the other-than-temporary impairment is identified, to the extent the loss is related to credit issues, and to other comprehensive income to the extent the decline on debt securities is related to other factors and the Company does not intend to sell the security prior to recovery of the unrealized loss.
No securities were written down for other-than-temporary impairment during the years ended December 31, 2017, 2016 and 2015.
Certain other investments in debt and equity securities are reported in the consolidated financial statements at an amount less than their historical cost. Total fair value of these investments at December 31, 2017 and 2016, was $62,107,660 and $79,361,229, respectively, which is approximately 76% and 86% of the Company’s investment portfolio. These declines primarily resulted from changes in market interest rates and failure of certain investments to meet projected earnings targets.
The following table shows gross unrealized losses and fair value, aggregated by investment category and length of time that individual securities have been in a continuous unrealized loss position at December 31, 2017 and 2016.
|
December 31, 2017 |
||||||||||||||||||||||||
|
Less than 12 Months |
12 Months or More |
Total |
||||||||||||||||||||||
|
Description of Securities |
Fair Value |
Unrealized Losses |
Fair Value |
Unrealized Losses |
Fair Value |
Unrealized Losses |
||||||||||||||||||
|
Municipals |
$ | 11,024,593 | $ | (103,747 | ) | $ | 8,802,796 | $ | (159,874 | ) | $ | 19,827,389 | $ | (263,621 | ) | |||||||||
|
Government sponsored mortgage-backed securities and SBA loan pools |
20,088,694 | (253,907 | ) | 22,191,577 | (655,006 | ) | 42,280,271 | (908,913 | ) | |||||||||||||||
| $ | 31,113,287 | $ | (357,654 | ) | $ | 30,994,373 | $ | (814,880 | ) | $ | 62,107,660 | $ | (1,172,534 | ) | ||||||||||
|
December 31, 2016 |
||||||||||||||||||||||||
|
Less than 12 Months |
12 Months or More |
Total |
||||||||||||||||||||||
|
Description of Securities |
Fair Value |
Unrealized Losses |
Fair Value |
Unrealized Losses |
Fair Value |
Unrealized Losses |
||||||||||||||||||
|
Municipals |
$ | 33,084,816 | $ | (1,082,021 | ) | $ | 179,402 | $ | (3,633 | ) | $ | 33,264,218 | $ | (1,085,654 | ) | |||||||||
|
Corporates |
1,996,172 | (3,828 | ) | 881,100 | (686 | ) | 2,877,272 | (4,514 | ) | |||||||||||||||
|
Government sponsored mortgage-backed securities and SBA loan pools |
39,570,463 | (1,022,511 | ) | 3,649,276 | (104,526 | ) | 43,219,739 | (1,127,037 | ) | |||||||||||||||
| $ | 74,651,451 | $ | (2,108,360 | ) | $ | 4,709,778 | $ | (108,845 | ) | $ | 79,361,229 | $ | (2,217,205 | ) | ||||||||||
NOTE 3: LOANS AND ALLOWANCE FOR LOAN LOSSES
Categories of loans at December 31, 2017 and 2016 include:
|
December 31, |
||||||||
|
2017 |
2016 |
|||||||
|
Real estate - residential mortgage: |
||||||||
|
One to four family units |
$ | 106,300,790 | $ | 106,410,559 | ||||
|
Multi-family |
85,225,074 | 48,483,523 | ||||||
|
Real estate - construction |
64,743,582 | 40,912,307 | ||||||
|
Real estate - commercial |
261,866,285 | 249,580,873 | ||||||
|
Commercial loans |
94,522,840 | 75,404,732 | ||||||
|
Consumer and other loans |
24,716,447 | 23,606,306 | ||||||
|
Total loans |
637,375,018 | 544,398,300 | ||||||
|
Less: |
||||||||
|
Allowance for loan losses |
(7,107,418 | ) | (5,742,449 | ) | ||||
|
Deferred loan fees/costs, net |
(662,591 | ) | (382,211 | ) | ||||
|
Net loans |
$ | 629,605,009 | $ | 538,273,640 | ||||
Classes of loans by aging at December 31, 2017 and 2016 were as follows:
As of December 31, 2017
|
30-59 Days |
60-89 Days |
Greater Than |
Total Past |
Current |
Total Loans |
Total Loans > |
||||||||||||||||||||||
|
(In Thousands) |
||||||||||||||||||||||||||||
|
Real estate - residential mortgage: |
||||||||||||||||||||||||||||
|
One to four family units |
$ | 510 | $ | 731 | $ | 2,495 | $ | 3,736 | $ | 102,565 | $ | 106,301 | $ | - | ||||||||||||||
|
Multi-family |
775 | - | - | 775 | 84,450 | 85,225 | - | |||||||||||||||||||||
|
Real estate - construction |
- | - | - | - | 64,744 | 64,744 | - | |||||||||||||||||||||
|
Real estate - commercial |
243 | 135 | - | 378 | 261,488 | 261,866 | - | |||||||||||||||||||||
|
Commercial loans |
276 | - | 588 | 864 | 93,659 | 94,523 | - | |||||||||||||||||||||
|
Consumer and other loans |
8 | 8 | - | 16 | 24,700 | 24,716 | - | |||||||||||||||||||||
|
Total |
$ | 1,812 | $ | 874 | $ | 3,083 | $ | 5,769 | $ | 631,606 | $ | 637,375 | $ | - | ||||||||||||||
As of December 31, 2016
|
30-59 Days |
60-89 Days |
Greater Than |
Total Past |
Current |
Total Loans |
Total Loans > |
||||||||||||||||||||||
|
(In Thousands) |
||||||||||||||||||||||||||||
|
Real estate - residential mortgage: |
||||||||||||||||||||||||||||
|
One to four family units |
$ | 367 | $ | 495 | $ | 103 | $ | 965 | $ | 105,446 | $ | 106,411 | $ | - | ||||||||||||||
|
Multi-family |
- | - | - | - | 48,483 | 48,483 | - | |||||||||||||||||||||
|
Real estate - construction |
- | - | - | - | 40,912 | 40,912 | - | |||||||||||||||||||||
|
Real estate - commercial |
- | - | - | - | 249,581 | 249,581 | - | |||||||||||||||||||||
|
Commercial loans |
- | - | 593 | 593 | 74,812 | 75,405 | - | |||||||||||||||||||||
|
Consumer and other loans |
- | - | 38 | 38 | 23,568 | 23,606 | - | |||||||||||||||||||||
|
Total |
$ | 367 | $ | 495 | $ | 734 | $ | 1,596 | $ | 542,802 | $ | 544,398 | $ | - | ||||||||||||||
Nonaccruing loans are summarized as follows:
|
December 31, |
||||||||
|
2017 |
2016 |
|||||||
|
Real estate - residential mortgage: |
||||||||
|
One to four family units |
$ | 4,423,074 | $ | 2,060,180 | ||||
|
Multi-family |
- | - | ||||||
|
Real estate - construction |
4,452,409 | 5,446,896 | ||||||
|
Real estate - commercial |
161,491 | 161,491 | ||||||
|
Commercial loans |
802,628 | 925,281 | ||||||
|
Consumer and other loans |
121,915 | 37,791 | ||||||
|
Total |
$ | 9,961,517 | $ | 8,631,639 | ||||
The following tables present the activity in the allowance for loan losses and the recorded investment in loans based on portfolio segment and impairment method as of and for the years ended December 31, 2017, 2016 and 2015:
|
As of December 31, 2017 |
||||||||||||||||||||||||||||||||
|
Construction |
Commercial |
One to four family |
Multi-family |
Commercial |
Consumer |
Unallocated |
Total |
|||||||||||||||||||||||||
|
|
(In Thousands) |
|||||||||||||||||||||||||||||||
| Allowance for loan losses: | ||||||||||||||||||||||||||||||||
|
Balance, beginning of year |
$ | 1,377 | $ | 1,687 | $ | 856 | $ | 206 | $ | 1,168 | $ | 337 | $ | 111 | $ | 5,742 | ||||||||||||||||
|
Provision charged to expense |
793 | 174 | 82 | 258 | 91 | 284 | 68 | $ | 1,750 | |||||||||||||||||||||||
|
Losses charged off |
- | (72 | ) | (11 | ) | - | (240 | ) | (213 | ) | - | $ | (536 | ) | ||||||||||||||||||
|
Recoveries |
74 | - | 19 | - | 12 | 46 | - | $ | 151 | |||||||||||||||||||||||
|
Balance, end of year |
$ | 2,244 | $ | 1,789 | $ | 946 | $ | 464 | $ | 1,031 | $ | 454 | $ | 179 | $ | 7,107 | ||||||||||||||||
|
Ending balance: individually evaluated for impairment |
$ | 738 | $ | - | $ | 127 | $ | - | $ | 246 | $ | 138 | $ | - | $ | 1,249 | ||||||||||||||||
|
Ending balance: collectively evaluated for impairment |
$ | 1,506 | $ | 1,789 | $ | 819 | $ | 464 | $ | 785 | $ | 316 | $ | 179 | $ | 5,858 | ||||||||||||||||
|
Loans: |
||||||||||||||||||||||||||||||||
|
Ending balance: individually evaluated for impairment |
$ | 4,452 | $ | 161 | $ | 4,424 | $ | 775 | $ | 739 | $ | 276 | $ | - | $ | 10,827 | ||||||||||||||||
|
Ending balance: collectively evaluated for impairment |
$ | 60,292 | $ | 261,705 | $ | 101,877 | $ | 84,450 | $ | 93,784 | $ | 24,440 | $ | - | $ | 626,548 | ||||||||||||||||
|
As of December 31, 2016 |
||||||||||||||||||||||||||||||||
|
Construction |
Commercial |
One to four family |
Multi-family |
Commercial |
Consumer |
Unallocated |
Total |
|||||||||||||||||||||||||
|
|
(In Thousands) |
|||||||||||||||||||||||||||||||
| Allowance for loan losses: | ||||||||||||||||||||||||||||||||
|
Balance, beginning of year |
$ | 1,246 | $ | 1,526 | $ | 821 | $ | 177 | $ | 1,382 | $ | 223 | $ | 437 | $ | 5,812 | ||||||||||||||||
|
Provision charged to expense |
1,262 | 198 | 48 | 29 | (51 | ) | 215 | (326 | ) | $ | 1,375 | |||||||||||||||||||||
|
Losses charged off |
(1,222 | ) | (69 | ) | (47 | ) | - | (171 | ) | (190 | ) | - | $ | (1,699 | ) | |||||||||||||||||
|
Recoveries |
91 | 32 | 34 | - | 8 | 89 | - | $ | 254 | |||||||||||||||||||||||
|
Balance, end of year |
$ | 1,377 | $ | 1,687 | $ | 856 | $ | 206 | $ | 1,168 | $ | 337 | $ | 111 | $ | 5,742 | ||||||||||||||||
|
Ending balance: individually evaluated for impairment |
$ | 302 | $ | - | $ | 14 | $ | - | $ | 241 | $ | 45 | $ | - | $ | 602 | ||||||||||||||||
|
Ending balance: collectively evaluated for impairment |
$ | 1,075 | $ | 1,687 | $ | 842 | $ | 206 | $ | 927 | $ | 292 | $ | 111 | $ | 5,140 | ||||||||||||||||
|
Loans: |
||||||||||||||||||||||||||||||||
|
Ending balance: individually evaluated for impairment |
$ | 5,447 | $ | 161 | $ | 2,060 | $ | - | $ | 925 | $ | 106 | $ | - | $ | 8,699 | ||||||||||||||||
|
Ending balance: collectively evaluated for impairment |
$ | 35,465 | $ | 249,420 | $ | 104,351 | $ | 48,483 | $ | 74,480 | $ | 23,500 | $ | - | $ | 535,699 | ||||||||||||||||
|
As of December 31, 2015 |
||||||||||||||||||||||||||||||||
|
Construction |
Commercial |
One to four family |
Multi-family |
Commercial |
Consumer |
Unallocated |
Total |
|||||||||||||||||||||||||
|
|
(In Thousands) |
|||||||||||||||||||||||||||||||
| Allowance for loan losses: | ||||||||||||||||||||||||||||||||
|
Balance, beginning of year |
$ | 1,330 | $ | 1,992 | $ | 900 | $ | 127 | $ | 1,954 | $ | 185 | $ | 101 | $ | 6,589 | ||||||||||||||||
|
Provision charged to expense |
1,139 | (466 | ) | - | 50 | (576 | ) | 117 | 336 | $ | 600 | |||||||||||||||||||||
|
Losses charged off |
(1,233 | ) | - | (99 | ) | - | - | (119 | ) | - | $ | (1,451 | ) | |||||||||||||||||||
|
Recoveries |
10 | - | 20 | - | 4 | 40 | - | $ | 74 | |||||||||||||||||||||||
|
Balance, end of year |
$ | 1,246 | $ | 1,526 | $ | 821 | $ | 177 | $ | 1,382 | $ | 223 | $ | 437 | $ | 5,812 | ||||||||||||||||
|
Ending balance: individually evaluated for impairment |
$ | 540 | $ | - | $ | - | $ | - | $ | 312 | $ | 13 | $ | - | $ | 865 | ||||||||||||||||
|
Ending balance: collectively evaluated for impairment |
$ | 706 | $ | 1,526 | $ | 821 | $ | 177 | $ | 1,070 | $ | 210 | $ | 437 | $ | 4,947 | ||||||||||||||||
|
Loans: |
||||||||||||||||||||||||||||||||
|
Ending balance: individually evaluated for impairment |
$ | 8,080 | $ | 1,241 | $ | 2,272 | $ | - | $ | 2,149 | $ | 988 | $ | - | $ | 14,730 | ||||||||||||||||
|
Ending balance: collectively evaluated for impairment |
$ | 37,383 | $ | 207,583 | $ | 95,985 | $ | 41,604 | $ | 78,858 | $ | 21,004 | $ | - | $ | 482,417 | ||||||||||||||||
A loan is considered impaired, in accordance with the impairment accounting guidance (ASC-310-10-35-16), when based on current information and events, it is probable the Bank will be unable to collect all amounts due from the borrower in accordance with the contractual terms of the loan. Impaired loans include nonperforming commercial loans but also include loans modified in troubled debt restructurings where concessions have been granted to borrowers experiencing financial difficulties. These concessions could include a reduction in the interest rate on the loan, payment extensions, forgiveness of principal, forbearance or other actions intended to maximize collection.
The following summarizes impaired loans as of and for the years ended December 31, 2017 and 2016:
|
As of December 31, 2017 |
||||||||||||||||||||
|
Recorded |
Unpaid |
Specific |
Average |
Interest |
||||||||||||||||
|
(In Thousands) |
||||||||||||||||||||
|
Loans without a specific valuation allowance |
||||||||||||||||||||
|
Real estate - residential mortgage: |
||||||||||||||||||||
|
One to four family units |
$ | 3,180 | $ | 3,180 | $ | - | $ | 2,170 | $ | - | ||||||||||
|
Multi-family |
775 | 775 | - | 130 | 5 | |||||||||||||||
|
Real estate - construction |
2,840 | 2,840 | - | 2,940 | - | |||||||||||||||
|
Real estate - commercial |
161 | 161 | - | 311 | - | |||||||||||||||
|
Commercial loans |
465 | 465 | - | 536 | - | |||||||||||||||
|
Consumer and other loans |
3 | 3 | - | 7 | 1 | |||||||||||||||
|
Loans with a specific valuation allowance |
||||||||||||||||||||
|
Real estate - residential mortgage: |
||||||||||||||||||||
|
One to four family units |
$ | 1,244 | $ | 1,244 | $ | 127 | $ | 247 | $ | - | ||||||||||
|
Multi-family |
- | - | - | - | - | |||||||||||||||
|
Real estate - construction |
1,612 | 2,845 | 738 | 2,326 | - | |||||||||||||||
|
Real estate - commercial |
- | - | - | - | - | |||||||||||||||
|
Commercial loans |
274 | 274 | 246 | 456 | - | |||||||||||||||
|
Consumer and other loans |
273 | 273 | 138 | 208 | - | |||||||||||||||
|
Total |
||||||||||||||||||||
|
Real estate - residential mortgage: |
||||||||||||||||||||
|
One to four family units |
$ | 4,424 | $ | 4,424 | $ | 127 | $ | 2,417 | $ | - | ||||||||||
|
Multi-family |
775 | 775 | - | 130 | 5 | |||||||||||||||
|
Real estate - construction |
4,452 | 5,685 | 738 | 5,266 | - | |||||||||||||||
|
Real estate - commercial |
161 | 161 | - | 311 | - | |||||||||||||||
|
Commercial loans |
739 | 739 | 246 | 992 | - | |||||||||||||||
|
Consumer and other loans |
276 | 276 | 138 | 215 | 1 | |||||||||||||||
|
Total |
$ | 10,827 | $ | 12,060 | $ | 1,249 | $ | 9,331 | $ | 6 | ||||||||||
|
As of December 31, 2016 |
||||||||||||||||||||
|
Recorded |
Unpaid |
Specific |
Average |
Interest |
||||||||||||||||
|
(In Thousands) |
||||||||||||||||||||
|
Loans without a specific valuation allowance |
||||||||||||||||||||
|
Real estate - residential mortgage: |
||||||||||||||||||||
|
One to four family units |
$ | 2,006 | $ | 2,006 | $ | - | $ | 2,165 | $ | - | ||||||||||
|
Multi-family |
- | - | - | - | - | |||||||||||||||
|
Real estate - construction |
3,017 | 3,017 | - | 5,427 | - | |||||||||||||||
|
Real estate - commercial |
161 | 161 | - | 540 | - | |||||||||||||||
|
Commercial loans |
622 | 622 | - | 868 | - | |||||||||||||||
|
Consumer and other loans |
3 | 3 | - | 90 | 2 | |||||||||||||||
|
Loans with a specific valuation allowance |
||||||||||||||||||||
|
Real estate - residential mortgage: |
||||||||||||||||||||
|
One to four family units |
$ | 54 | $ | 54 | $ | 14 | $ | 27 | $ | - | ||||||||||
|
Multi-family |
- | - | - | - | - | |||||||||||||||
|
Real estate - construction |
2,430 | 3,663 | 302 | 2,195 | - | |||||||||||||||
|
Real estate - commercial |
- | - | - | 139 | - | |||||||||||||||
|
Commercial loans |
303 | 755 | 241 | 447 | - | |||||||||||||||
|
Consumer and other loans |
103 | 103 | 45 | 112 | - | |||||||||||||||
|
Total |
||||||||||||||||||||
|
Real estate - residential mortgage: |
||||||||||||||||||||
|
One to four family units |
$ | 2,060 | $ | 2,060 | $ | 14 | $ | 2,192 | $ | - | ||||||||||
|
Multi-family |
- | - | - | - | - | |||||||||||||||
|
Real estate - construction |
5,447 | 6,680 | 302 | 7,622 | - | |||||||||||||||
|
Real estate - commercial |
161 | 161 | - | 679 | - | |||||||||||||||
|
Commercial loans |
925 | 1,377 | 241 | 1,315 | - | |||||||||||||||
|
Consumer and other loans |
106 | 106 | 45 | 202 | 2 | |||||||||||||||
|
Total |
$ | 8,699 | $ | 10,384 | $ | 602 | $ | 12,010 | $ | 2 | ||||||||||
Interest of approximately $4,000 was recognized on average impaired loans of $8,110,000 for the year ended December 31, 2015.
At December 31, 2017, the Bank’s impaired loans shown in the table above included loans that were classified as troubled debt restructurings (TDR). The restructuring of a loan is considered a TDR if both (i) the borrower is experiencing financial difficulties and (ii) the creditor has granted a concession.
In assessing whether or not a borrower is experiencing financial difficulties, the Bank considers information currently available regarding the financial condition of the borrower. This information includes, but is not limited to, whether (i) the debtor is currently in payment default on any of its debt; (ii) a payment default is probable in the foreseeable future without the modification; (iii) the debtor has declared or is in the process of declaring bankruptcy and (iv) the debtor’s projected cash flow is sufficient to satisfy the contractual payments due under the original terms of the loan without a modification.
The Bank considers all aspects of the modification to loan terms to determine whether or not a concession has been granted to the borrower. Key factors considered by the Bank include the debtor’s ability to access funds at a market rate for debt with similar risk characteristics, the significance of the modification relative to unpaid principal balance or collateral value of the debt, and the significance of a delay in the timing of payments relative to the original contractual terms of the loan. The most common concessions granted by the Bank generally include one or more modifications to the terms of the debt, such as (i) a reduction in the interest rate for the remaining life of the debt, (ii) an extension of the maturity date at an interest rate lower than the current market rate for new debt with similar risk, (iii) a reduction of the face amount or maturity amount of the debt as stated in the original loan, (iv) a temporary period of interest-only payments, (v) a reduction in accrued interest, and (vi) an extension of amortization.
The following summarizes information regarding new troubled debt restructurings by class:
|
2017 |
||||||||||||
|
Number of Loans |
Pre-Modification |
Post-Modification |
||||||||||
|
Real estate - residential mortgage: |
||||||||||||
|
One to four family units |
- | $ | - | $ | - | |||||||
|
Multi-family |
- | - | - | |||||||||
|
Real estate - construction |
- | - | - | |||||||||
|
Real estate - commercial |
- | - | - | |||||||||
|
Commercial loans |
- | - | - | |||||||||
|
Consumer and other loans |
1 | 119,459 | 119,459 | |||||||||
|
Total |
1 | $ | 119,459 | $ | 119,459 | |||||||
|
2016 |
||||||||||||
|
Number of Loans |
Pre-Modification |
Post-Modification |
||||||||||
|
Real estate - residential mortgage: |
||||||||||||
|
One to four family units |
- | $ | - | $ | - | |||||||
|
Multi-family |
- | - | - | |||||||||
|
Real estate - construction |
- | - | - | |||||||||
|
Real estate - commercial |
1 | 5,575,358 | 5,575,358 | |||||||||
|
Commercial loans |
1 | 165,831 | 165,831 | |||||||||
|
Consumer and other loans |
- | - | - | |||||||||
|
Total |
2 | $ | 5,741,189 | $ | 5,741,189 | |||||||
The troubled debt restructurings described above increased the allowance for loan losses by $118,482 and $41,458 and resulted in charge offs of $0 and $0 during the years ended December 31, 2017 and 2016, respectively.
The following presents the troubled debt restructurings by type of modification:
|
2017 |
||||||||||||||||
|
Interest Rate |
Term |
Combination |
Total Modification |
|||||||||||||
|
Real estate - residential mortgage: |
||||||||||||||||
|
One to four family units |
$ | - | $ | - | $ | - | $ | - | ||||||||
|
Multi-family |
- | - | - | - | ||||||||||||
|
Real estate - construction |
- | - | - | - | ||||||||||||
|
Real estate - commercial |
- | - | - | - | ||||||||||||
|
Commercial loans |
- | - | - | - | ||||||||||||
|
Consumer and other loans |
- | 119,459 | - | 119,459 | ||||||||||||
|
Total |
$ | - | $ | 119,459 | $ | - | $ | 119,459 | ||||||||
|
2016 |
||||||||||||||||
|
Interest Rate |
Term |
Combination |
Total Modification |
|||||||||||||
|
Real estate - residential mortgage: |
||||||||||||||||
|
One to four family units |
$ | - | $ | - | $ | - | $ | - | ||||||||
|
Multi-family |
- | - | - | - | ||||||||||||
|
Real estate - construction |
- | - | - | - | ||||||||||||
|
Real estate - commercial |
- | - | 5,575,358 | 5,575,358 | ||||||||||||
|
Commercial loans |
- | 165,831 | - | 165,831 | ||||||||||||
|
Consumer and other loans |
- | - | - | - | ||||||||||||
|
Total |
$ | - | $ | 165,831 | $ | 5,575,358 | $ | 5,741,189 | ||||||||
As part of the on-going monitoring of the credit quality of the Bank’s loan portfolio, management tracks loans by an internal rating system. All loans are assigned an internal credit quality rating based on an analysis of the borrower’s financial condition. The criteria used to assign quality ratings to extensions of credit that exhibit potential problems or well-defined weaknesses are primarily based upon the degree of risk and the likelihood of orderly repayment, and their effect on the Bank’s safety and soundness. The following are the internally assigned ratings:
Pass-This rating represents loans that have strong asset quality and liquidity along with a multi-year track record of profitability.
Special mention-This rating represents loans that are currently protected but are potentially weak. The credit risk may be relatively minor, yet constitute an increased risk in light of the circumstances surrounding a specific loan.
Substandard-This rating represents loans that show signs of continuing negative financial trends and unprofitability and therefore, is inadequately protected by the current sound worth and paying capacity of the obligor or of the collateral pledged, if any.
Doubtful-This rating represents loans that have all the weaknesses of substandard classified loans with the additional characteristic that the weaknesses make collection or liquidation in full, on the basis of currently existing facts, conditions and values, highly questionable and improbable.
Risk characteristics applicable to each segment of the loan portfolio are described as follows.
Real estate-Residential 1-4 family: The residential 1-4 family real estate loans are generally secured by owner-occupied 1-4 family residences. Repayment of these loans is primarily dependent on the personal income and credit rating of the borrowers. Credit risk in these loans can be impacted by economic conditions within the Bank’s market areas that might impact either property values or a borrower’s personal income.
Risk is mitigated by the fact that the loans are of smaller individual amounts and spread over a large number of borrowers.
Real estate-Construction: Construction and land development real estate loans are usually based upon estimates of costs and estimated value of the completed project and include independent appraisal reviews and a financial analysis of the developers and property owners. Sources of repayment of these loans may include permanent loans, sales of developed property or an interim loan commitment from the Bank until permanent financing is obtained. These loans are considered to be higher risk than other real estate loans due to their ultimate repayment being sensitive to interest rate changes, general economic conditions and the availability of long-term financing. Credit risk in these loans may be impacted by the creditworthiness of a borrower, property values and the local economies in the Bank’s market areas.
Real estate-Commercial: Commercial real estate loans typically involve larger principal amounts, and repayment of these loans is generally dependent on the successful operations of the property securing the loan or the business conducted on the property securing the loan. These loans are viewed primarily as cash flow loans and secondarily as loans secured by real estate. Credit risk in these loans may be impacted by the creditworthiness of a borrower, property values and the local economies in the Bank’s market areas.
Commercial: The commercial portfolio includes loans to commercial customers for use in financing working capital needs, equipment purchases and expansions. The loans in this category are repaid primarily from the cash flow of a borrower’s principal business operation. Credit risk in these loans is driven by creditworthiness of a borrower and the economic conditions that impact the cash flow stability from business operations.
Consumer: The consumer loan portfolio consists of various term and line of credit loans such as automobile loans and loans for other personal purposes. Repayment for these types of loans will come from a borrower’s income sources that are typically independent of the loan purpose. Credit risk is driven by consumer economic factors (such as unemployment and general economic conditions in the Bank’s market area) and the creditworthiness of a borrower.
The following table provides information about the credit quality of the loan portfolio using the Bank’s internal rating system as of December 31, 2017 and 2016:
|
As of December 31, 2017 |
||||||||||||||||||||||||||||
|
Construction |
Commercial |
One to four family |
Multi-family |
Commercial |
Consumer |
Total |
||||||||||||||||||||||
|
(In Thousands) |
||||||||||||||||||||||||||||
|
Rating: |
||||||||||||||||||||||||||||
|
Pass |
$ | 60,291 | $ | 254,658 | $ | 96,723 | $ | 84,450 | $ | 93,102 | $ | 24,440 | $ | 613,664 | ||||||||||||||
|
Special Mention |
- | 5,578 | 3,799 | - | 200 | - | 9,577 | |||||||||||||||||||||
|
Substandard |
4,453 | 1,630 | 5,779 | 775 | 708 | 276 | 13,621 | |||||||||||||||||||||
|
Doubtful |
- | - | - | - | 513 | - | 513 | |||||||||||||||||||||
|
Total |
$ | 64,744 | $ | 261,866 | $ | 106,301 | $ | 85,225 | $ | 94,523 | $ | 24,716 | $ | 637,375 | ||||||||||||||
|
As of December 31, 2016 |
||||||||||||||||||||||||||||
|
Construction |
Commercial |
One to four family |
Multi-family |
Commercial |
Consumer |
Total |
||||||||||||||||||||||
|
(In Thousands) |
||||||||||||||||||||||||||||
|
Rating: |
||||||||||||||||||||||||||||
|
Pass |
$ | 35,465 | $ | 242,200 | $ | 100,367 | $ | 48,483 | $ | 69,093 | $ | 23,380 | $ | 518,988 | ||||||||||||||
|
Special Mention |
- | 5,922 | 2,591 | - | 4,503 | - | 13,016 | |||||||||||||||||||||
|
Substandard |
5,447 | 1,459 | 3,453 | - | 1,225 | 226 | 11,810 | |||||||||||||||||||||
|
Doubtful |
- | - | - | - | 584 | - | 584 | |||||||||||||||||||||
|
Total |
$ | 40,912 | $ | 249,581 | $ | 106,411 | $ | 48,483 | $ | 75,405 | $ | 23,606 | $ | 544,398 | ||||||||||||||
The weighted average interest rate on loans as of December 31, 2017 and 2016 was 4.82% and 4.81%, respectively.
The Bank serviced mortgage loans for others amounting to $45,839 and $54,722 as of December 31, 2017 and 2016, respectively. The Bank serviced commercial loans for others amounting to $31,425,300 and $5,978,363 as of December 31, 2017 and 2016, respectively.
NOTE 4: PREMISES AND EQUIPMENT
Major classifications of premises and equipment, stated at cost, are as follows:
|
December 31, |
December 31, |
|||||||
|
2017 |
2016 |
|||||||
|
Land |
$ | 1,377,304 | $ | 2,251,789 | ||||
|
Buildings and Improvements |
9,649,660 | 11,850,553 | ||||||
|
Automobile |
25,115 | 25,115 | ||||||
|
Furniture, Fixtures and Equipment |
9,554,925 | 11,357,768 | ||||||
|
Leasehold Improvements |
277,376 | 271,799 | ||||||
| 20,884,380 | 25,757,024 | |||||||
|
Less accumulated depreciation |
(10,277,286 | ) | (14,885,985 | ) | ||||
|
Net premises and equipment |
$ | 10,607,094 | $ | 10,871,039 | ||||
During the fourth quarter of 2017, the Company sold the building and land of the previous headquarters which had a book value of $2,601,284. The Company recognized a loss on sale of $95,863.
NOTE 5: BANK OWNED LIFE INSURANCE
The Company has purchased Bank owned life insurance on certain key members of management. Such policies are recorded at their cash surrender value, or the amount that can be realized. The increase in cash surrender value in excess of the single premium paid is reported as other noninterest income. The balance at December 31, 2017 and 2016 was $19,740,623 and $19,272,893, respectively.
NOTE 6: INVESTMENTS IN AFFORDABLE HOUSING PARTNERSHIPS
The Company has purchased investments in limited partnerships that were formed to operate low-income housing apartment complexes and single-family housing units throughout Missouri. Effective January 2015, the investments are accounted for under the proportional amortization method if certain conditions are met. The Company does not have the ability to exert significant influence over the partnerships. For a minimum 15 year compliance period, each partnership must adhere to affordable housing regulatory requirements in order to maintain the utilization of the tax credits. At December 31, 2017 and 2016, the net carrying values of the Company’s investments in these entities was $1,652,358 and $1,871,582, respectively, and are included in other assets on the Company’s Consolidated Balance Sheets.
The Company received total income tax credits of $1,871,058, $1,221,394 and $1,221,394 during 2017, 2016 and 2015, respectively. Amortization of the investment costs was $1,531,527, $817,122 and $885,478 during each of the fiscal years 2017, 2016 and 2015.
NOTE 7: DEPOSITS
Deposits are comprised of the following at December 31, 2017 and 2016:
|
December 31, 2017 |
December 31, 2016 |
|||||||||||||||||||||||||
|
Weighted Average Rate |
Balance |
Percentage of Deposits |
Weighted Average Rate |
Balance |
Percentage of Deposits |
|||||||||||||||||||||
|
Demand |
0.00 | % | $ | 94,727,683 | 15.6 | % | 0.01 | % | $ | 80,910,910 | 16.0 | % | ||||||||||||||
|
NOW |
0.35 | % | 139,458,528 | 23.0 | % | 0.30 | % | 129,137,807 | 25.6 | % | ||||||||||||||||
|
Money market |
0.73 | % | 187,064,098 | 30.8 | % | 0.45 | % | 155,529,796 | 30.8 | % | ||||||||||||||||
|
Savings |
0.20 | % | 30,848,154 | 5.5 | % | 0.20 | % | 28,095,248 | 5.5 | % | ||||||||||||||||
| 0.42 | % | 452,098,463 | 74.4 | % | 0.29 | % | 393,673,761 | 77.9 | % | |||||||||||||||||
|
Certificates: |
||||||||||||||||||||||||||
| 0.00% | - | 0.99% | 0.69 | % | 46,771,850 | 7.7 | % | 0.54 | % | 57,349,324 | 11.3 | % | ||||||||||||||
| 1.00% | - | 1.99% | 1.39 | % | 104,284,007 | 17.3 | % | 1.28 | % | 54,319,296 | 10.8 | % | ||||||||||||||
| 2.00% | - | 3.99% | 2.00 | % | 4,210,030 | 0.7 | % | 2.14 | % | 20,369 | 0.0 | % | ||||||||||||||
| 1.20 | % | 155,265,887 | 25.6 | % | 0.90 | % | 111,688,989 | 22.1 | % | |||||||||||||||||
|
Total Deposits |
0.62 | % | $ | 607,364,350 | 100.0 | % | 0.43 | % | $ | 505,362,750 | 100.0 | % | ||||||||||||||
The aggregate amount of certificates of deposit with a minimum balance of $100,000 was approximately $102,998,000 and $63,697,000, as of December 31, 2017 and 2016, respectively. The aggregate amount of certificates of deposit with a minimum balance of $250,000 was approximately $44,308,000 and $11,798,000, as of December 31, 2017 and 2016, respectively.
A summary of certificates of deposit by maturity as of December 31, 2017, is as follows:
|
2018 |
$ | 105,487,705 | ||
|
2019 |
27,783,463 | |||
|
2020 |
11,807,481 | |||
|
2021 |
6,381,977 | |||
|
2022 |
3,508,356 | |||
|
Thereafter |
296,905 | |||
| $ | 155,265,887 |
A summary of interest expense on deposits is as follows:
|
Years ended |
||||||||||||
|
December 31, |
||||||||||||
|
2017 |
2016 |
2015 |
||||||||||
|
NOW and Money Market accounts |
$ | 2,394,549 | $ | 1,235,359 | $ | 1,276,808 | ||||||
|
Savings accounts |
58,384 | 55,094 | 49,467 | |||||||||
|
Certificate accounts |
1,309,629 | 1,002,872 | 1,102,928 | |||||||||
|
Early withdrawal penalties |
(10,997 | ) | (9,343 | ) | (5,332 | ) | ||||||
| $ | 3,751,565 | $ | 2,283,982 | $ | 2,423,871 | |||||||
The Bank utilizes brokered deposits as an additional funding source. The aggregate amount of brokered deposits was approximately $82,205,000 and $41,456,000 as of December 31, 2017 and 2016, respectively.
NOTE 8: BORROWINGS
Federal Home Loan Bank Advances
Federal Home Loan Bank advances consist of the following:
|
December 31, 2017 |
December 31, 2016 |
|||||||||||||||
|
Maturity Date |
Amount |
Weighted Average Rate |
Amount |
Weighted Average Rate |
||||||||||||
|
2018 |
92,200,000 | 1.90 | % | 43,600,000 | 0.79 | % | ||||||||||
|
2019 |
2,100,000 | 4.87 | % | 50,000,000 | 2.14 | % | ||||||||||
|
2020 |
- | 0.00 | % | 2,100,000 | 4.87 | % | ||||||||||
| $ | 94,300,000 | 1.97 | % | $ | 95,700,000 | 1.72 | % | |||||||||
The FHLB requires the Bank to maintain collateral in relation to outstanding balances of advances. For collateral purposes, the FHLB values mortgage loans free of other pledges, liens and encumbrances at 80% of their fair value, and investment securities free of other pledges, liens and encumbrances at 95% of their fair value. Based on existing collateral as well as the FHLB’s limitation of advances to 35% of assets, the Bank has the ability to borrow an additional $107.3 million from the FHLB, as of December 31, 2017.
Federal Reserve Bank Borrowings
During 2008, the Bank established a borrowing line with the Federal Reserve Bank. The Bank has the ability to borrow $36.4 million as of December 31, 2017. The Federal Reserve Bank requires the Bank to maintain collateral in relation to borrowings outstanding. The Bank had no borrowings outstanding on this line as of December 31, 2017 and 2016.
Securities Sold Under Agreements to Repurchase
In January 2008, the Company borrowed $30.0 million under three structured repurchase agreements. Interest was based on a fixed weighted average rate of 2.65% until maturity in January 2018. Beginning in February 2010, the counterparty, Barclay’s Capital, Inc., had the option to terminate the agreements on a quarterly basis until maturity.
Prior to the stated maturity date, the Company paid off one of these agreements in the amount $15.0 million in May 2013 and another agreement in the amount of $5.0 million in November 2011.
In June 2015, the Company executed a structured transaction in order to pay off the remaining $10.0 million, prior to its stated maturity date, incurring a prepayment penalty of $463,992.
NOTE 9: SUBORDINATED DEBENTURES
During 2005, the Company formed two wholly owned grantor trust subsidiaries, Guaranty Statutory Trust I and Guaranty Statutory Trust II, to issue preferred securities representing undivided beneficial interests in the assets of the trusts and to invest the gross proceeds of the preferred securities in notes of the Company. Trust I issued $5,000,000 of preferred securities and Trust II issued $10,000,000 of preferred securities. The sole assets of Trust I were originally $5,155,000 aggregate principal amount of the Company’s fixed rate subordinated debenture notes due 2036, which were redeemable beginning in 2011. The sole assets of Trust II were originally $10,310,000 aggregate principal amount of the Company’s fixed/variable rate subordinated debenture notes due 2036, which were redeemable beginning in 2011. Trust II subordinated debenture notes bear interest at a fixed rate for five years and thereafter at a floating rate based on LIBOR. The preferred securities qualify as either Tier I or Tier II capital for regulatory purposes, subject to certain limitations.
NOTE 10: INCOME TAXES
As of December 31, 2017 and 2016, retained earnings included approximately $5,075,000 for which no deferred income tax liability has been recognized. This amount represents an allocation of income to bad debt deductions for tax purposes only. Reduction of amounts so allocated for purposes other than tax bad debt losses or adjustments arising from carryback of net operating losses would create income for tax purposes only, which would be subject to the then current corporate income tax rate. The unrecorded deferred income tax liability on the above amount was approximately $1,294,000 as of both December 31, 2017.
The provision for income taxes consists of:
|
December 31, |
||||||||||||
|
2017 |
2016 |
2015 |
||||||||||
|
Taxes currently payable |
$ | 1,490,297 | $ | 1,889,673 | $ | 2,140,591 | ||||||
|
Deferred income taxes |
68,340 | 123,091 | 320,738 | |||||||||
| Deferred income taxes related to 2017 Tax Act | 1,012,112 | - | - | |||||||||
| $ | 2,570,749 | $ | 2,012,764 | $ | 2,461,329 | |||||||
The tax effects of temporary differences related to deferred taxes shown on the December 31, 2017 and 2016 balance sheets are:
|
December 31, |
December 31, |
|||||||
|
2017 |
2016 |
|||||||
|
Deferred tax assets: |
||||||||
|
Allowances for loan losses |
$ | 1,492,558 | $ | 1,952,433 | ||||
|
Writedowns on foreclosed assets held for sale |
86,610 | 681,281 | ||||||
|
Deferred loan fees/costs |
168,961 | 141,418 | ||||||
|
Unrealized depreciation on available-for-sale securities |
215,317 | 768,879 | ||||||
|
Tax Credits |
445,151 | 441,908 | ||||||
|
Other |
71,395 | 66,486 | ||||||
| 2,479,992 | 4,052,405 | |||||||
|
Deferred tax liabilities: |
||||||||
|
FHLB stock dividends |
(32,035 | ) | (46,481 | ) | ||||
|
Unrealized appreciation on interest rate swaps |
(144,765 | ) | - | |||||
|
Accumulated depreciation |
(544,560 | ) | (470,883 | ) | ||||
|
Other |
(31,458 | ) | (60,906 | ) | ||||
| (752,818 | ) | (578,270 | ) | |||||
|
Net deferred tax asset |
$ | 1,727,174 | $ | 3,474,135 | ||||
A reconciliation of income tax expense at the statutory rate to income tax expense at the Company’s effective rate is shown below:
|
Years ended |
||||||||||||
|
December 31, |
||||||||||||
|
2017 |
2016 |
2015 |
||||||||||
|
Computed at statutory rate |
34.0 | % | 34.0 | % | 34.0 | % | ||||||
|
Increase (reduction) in taxes resulting from: |
||||||||||||
|
State financial institution tax and credits |
(10.2% | ) | (4.2% | ) | (4.8% | ) | ||||||
|
Cash surrender value of life insurance |
(2.1% | ) | (2.2% | ) | (1.5% | ) | ||||||
|
Tax exempt interest |
(3.0% | ) | (3.3% | ) | (1.7% | ) | ||||||
|
Impact of 2017 Tax Act |
13.1 | % | - | - | ||||||||
|
Other |
1.5 | % | 2.2 | % | 4.1 | % | ||||||
|
Actual effective rate |
33.3 | % | 26.5 | % | 30.1 | % | ||||||
The Tax Cuts and Jobs Act ("Tax Act") was signed into law on December 22, 2017, making several changes to U. S. corporate income tax laws, including reducing the corporate Federal income tax rate from 35% to 21% effective January 1, 2018. U. S. GAAP requires that the impact of the provisions of the Tax Act be accounted for in the period of enactment and the Company recognized the income tax effects of the Tax Act in its 2017 financial statements. The Tax Act is complex and requires significant detailed analysis. During the preparation of the Company's 2017 income tax returns in 2018, additional adjustments related to enactment of the Tax Act may be identified. We do not currently expect significant adjustments will be necessary, but any further adjustments identified will be recognized in accordance with guidance contained in Staff Accounting Bulletin No. 118 from the U. S. Securities and Exchange Commission.
NOTE 11: DISCLOSURES ABOUT FAIR VALUE OF ASSETS AND LIABILITIES
ASC Topic 820, Fair Value Measurements, defines fair value as the price that would be received to sell an asset or paid to transfer a liability in an orderly transaction between market participants at the measurement date. Topic 820 also specifies a fair value hierarchy which requires an entity to maximize the use of observable inputs and minimize the use of unobservable inputs when measuring fair value. The standard describes three levels of inputs that may be used to measure fair value:
Level 1: Quoted prices in active markets for identical assets or liabilities
Level 2: Observable inputs other than Level 1 prices, such as quoted prices for similar assets or liabilities; quoted prices in markets that are not active; or other inputs that are observable or can be corroborated by observable market data for substantially the full term of the assets or liabilities
Level 3: Unobservable inputs supported by little or no market activity and are significant to the fair value of the assets or liabilities
The following is a description of the inputs and valuation methodologies used for assets measured at fair value on a recurring basis and recognized in the accompanying consolidated balance sheets, as well as the general classification of such assets pursuant to the valuation hierarchy.
Available-for-sale securities: Where quoted market prices are available in an active market, securities are classified within Level 1 of the valuation hierarchy. Level 1 securities include equity securities. If quoted market prices are not available, then fair values are estimated by using pricing models, quoted prices of securities with similar characteristics or discounted cash flows. Level 2 securities include U.S. government agencies, municipals, U.S. corporate and government sponsored mortgage-backed securities. The Company has no Level 3 securities.
The following table presents the fair value measurements of assets recognized in the accompanying consolidated balance sheets measured at fair value on a recurring basis and the level within the fair value hierarchy in which the fair value measurements fall at December 31, 2017 and 2016 (dollar amounts in thousands):
|
As of December 31, 2017 |
||||||||||||||||
|
Financial assets: |
||||||||||||||||
|
Level 1 inputs |
Level 2 inputs |
Level 3 inputs |
Total fair value |
|||||||||||||
|
Debt securities: |
||||||||||||||||
|
Municipals |
$ | - | $ | 33,898 | $ | - | $ | 33,898 | ||||||||
|
Corporates |
- | 3,065 | - | 3,065 | ||||||||||||
|
Government sponsored mortgage-backed securities and SBA loan pools |
- | 44,515 | - | 44,515 | ||||||||||||
|
Available-for-sale securities |
$ | - | $ | 81,478 | $ | - | $ | 81,478 | ||||||||
| Interest Rate Swaps | $ | - | $ | 568 | $ | - | $ | 568 | ||||||||
|
As of December 31, 2016 |
||||||||||||||||
|
Financial assets: |
||||||||||||||||
|
Level 1 inputs |
Level 2 inputs |
Level 3 inputs |
Total fair value |
|||||||||||||
|
Debt securities: |
||||||||||||||||
|
Municipals |
$ | - | $ | 38,338 | $ | - | $ | 38,338 | ||||||||
|
Corporates |
- | 7,053 | - | 7,053 | ||||||||||||
|
Government sponsored mortgage-backed securities and SBA loan pools |
- | 47,008 | - | 47,008 | ||||||||||||
|
Available-for-sale securities |
$ | - | $ | 92,399 | $ | - | $ | 92,399 | ||||||||
The following is a description of the valuation methodologies used for assets measured at fair value on a nonrecurring basis and recognized in the accompanying consolidated balance sheets, as well as the general classification of such assets pursuant to the valuation hierarchy.
Foreclosed Assets Held for Sale: Fair value is estimated using recent appraisals, comparable sales and other estimates of value obtained principally from independent sources, adjusted for selling costs. Foreclosed assets held for sale are classified within Level 3 of the valuation hierarchy.
Impaired loans (Collateral Dependent): Loans for which it is probable that the Company will not collect all principal and interest due according to contractual terms are measured for impairment. Allowable methods for determining the amount of impairment include estimating fair value using the fair value of the collateral for collateral dependent loans.
If the impaired loan is identified as collateral dependent, then the fair value method of measuring the amount of impairment is utilized. This method requires obtaining a current independent appraisal of the collateral and applying a discount factor to the value. Impaired loans that are collateral dependent are classified within Level 3 of the fair value hierarchy when impairment is determined using the fair value method.
The following table presents the fair value measurement of assets measured at fair value on a nonrecurring basis and the level within the fair value hierarchy in which the fair value measurements fall at December 31, 2017 and 2016 (dollar amounts in thousands):
|
Impaired loans: |
||||||||||||||||
|
Level 1 inputs |
Level 2 inputs |
Level 3 inputs |
Total fair value |
|||||||||||||
|
December 31, 2017 |
$ | - | $ | - | $ | 2,224 | $ | 2,224 | ||||||||
|
December 31, 2016 |
$ | - | $ | - | $ | 1,006 | $ | 1,006 | ||||||||
|
Foreclosed assets held for sale: |
||||||||||||||||
|
Level 1 inputs |
Level 2 inputs |
Level 3 inputs |
Total fair value |
|||||||||||||
|
December 31, 2017 |
$ | - | $ | - | $ | - | $ | - | ||||||||
|
December 31, 2016 |
$ | - | $ | - | $ | 149 | $ | 149 | ||||||||
There were no transfers between valuation levels for any asset during the years ended December 31, 2017 or 2016. If transfers are deemed necessary, the Company considers those transfers to occur at the end of the period when the assets are valued.
The following table presents quantitative information about unobservable inputs used in nonrecurring Level 3 fair value measurements (dollar amounts in thousands):
|
Fair Value |
Valuation Technique |
Unobservable Input |
Range |
|||||||||
|
Impaired loans (collateral dependent) |
$ | 2,224 |
Market Comparable |
Discount to reflect realizable value |
0% | - | 100% (12%) | |||||
|
Foreclosed assets held for sale |
$ | - |
Market Comparable |
Discount to reflect realizable value |
0% | |||||||
|
Fair Value |
Valuation Technique |
Unobservable Input |
Range |
|||||||||
|
Impaired loans (collateral dependent) |
$ | 1,006 |
Market Comparable |
Discount to reflect realizable value |
0% | - | 100% (7%) | |||||
|
Foreclosed assets held for sale |
$ | 149 |
Market Comparable |
Discount to reflect realizable value |
10% | |||||||
The following methods were used to estimate the fair value of all other financial instruments recognized in the accompanying consolidated balance sheets at amounts other than fair value.
Cash and cash equivalents, interest-bearing deposits and Federal Home Loan Bank stock
The carrying amounts reported in the consolidated balance sheets approximate those assets' fair value.
Held-to-maturity securities
Fair value is based on quoted market prices, if available. If a quoted market price is not available, fair value is estimated using quoted market prices for similar securities.
Loans
The fair value of loans is estimated by discounting the future cash flows using the market rates at which similar loans would be made to borrowers with similar credit ratings and for the same remaining maturities. Loans with similar characteristics were aggregated for purposes of the calculations. The carrying amount of accrued interest and mortgage loans held for sale approximates these fair values.
Deposits
Deposits include demand deposits, savings accounts, NOW accounts and certain money market deposits. The carrying amount approximates fair value. The fair value of fixed-maturity certificates of deposit is estimated by discounting the future cash flows using rates currently offered for deposits of similar remaining maturities.
Federal Home Loan Bank and Federal Reserve advances
The fair value of advances are estimated by using rates on debt with similar terms and remaining maturities.
Subordinated debentures
For these variable rate instruments, the carrying amount is a reasonable estimate of fair value. There is currently a limited market for similar debt instruments and the Company has the option to call the subordinated debentures at an amount close to its par value.
Interest payable
The carrying amount approximates fair value.
Commitments to originate loans, letters of credit and lines of credit
The fair value of commitments to originate loans is estimated using the fees currently charged to enter into similar agreements, taking into account the remaining terms of the agreements and the present credit worthiness of the counterparties. For fixed-rate loan commitments, fair value also considers the difference between current levels of interest rates and the committed rates. The fair value of letters of credit and lines of credit is based on fees currently charged for similar agreements or on the estimated cost to terminate them or otherwise settle the obligations with the counterparties at the reporting date.
The following table presents estimated fair values of the Company’s financial instruments at December 31, 2017 and 2016.
|
December 31, 2017 |
December 31, 2016 |
|||||||||||||||||||||
|
Carrying |
Fair |
Hierarchy |
Carrying |
Fair |
Hierarchy |
|||||||||||||||||
|
Financial assets: |
||||||||||||||||||||||
|
Cash and cash equivalents |
$ | 37,406,930 | $ | 37,406,930 | 1 | $ | 9,088,441 | $ | 9,088,441 | 1 | ||||||||||||
|
Held-to-maturity securities |
16,457 | 16,729 | 2 | 27,528 | 28,153 | 2 | ||||||||||||||||
|
Federal Home Loan Bank stock |
4,597,500 | 4,597,500 | 2 | 4,611,000 | 4,611,000 | 2 | ||||||||||||||||
|
Mortgage loans held for sale |
1,921,819 | 1,921,819 | 2 | 2,183,633 | 2,183,633 | 2 | ||||||||||||||||
|
Loans, net |
629,605,009 | 627,498,508 | 3 | 538,273,640 | 537,645,692 | 3 | ||||||||||||||||
|
Interest receivable |
2,449,847 | 2,449,847 | 2 | 1,947,063 | 1,947,063 | 2 | ||||||||||||||||
|
Financial liabilities: |
||||||||||||||||||||||
|
Deposits |
607,364,350 | 606,548,280 | 2 | 505,362,750 | 504,829,161 | 2 | ||||||||||||||||
|
FHLB and Federal Reserve advances |
94,300,000 | 94,417,733 | 2 | 95,700,000 | 95,764,840 | 2 | ||||||||||||||||
|
Subordinated debentures |
15,465,000 | 15,465,000 | 3 | 15,465,000 | 15,465,000 | 3 | ||||||||||||||||
|
Interest payable |
295,543 | 295,543 | 2 | 207,833 | 207,833 | 2 | ||||||||||||||||
|
Unrecognized financial instruments (net of contractual value): |
||||||||||||||||||||||
|
Commitments to extend credit |
- | - | - | - | - | - | ||||||||||||||||
|
Unused lines of credit |
- | - | - | - | - | - | ||||||||||||||||
NOTE 12: SIGNIFICANT ESTIMATES AND CONCENTRATIONS
Accounting principles generally accepted in the United States of America require disclosure of certain significant estimates and current vulnerabilities due to certain concentrations. Estimates related to the allowance for loan losses are reflected in the footnote regarding loans. Current vulnerabilities due to certain concentrations of credit risk are discussed in the footnote regarding loans.
NOTE 13: EMPLOYEE BENEFIT PLANS
Equity Plans
On May 27, 2015, the Company’s stockholders voted to approve the Guaranty Federal Bancshares, Inc. 2015 Equity Plan (the”2015 Plan”). The Plan provides for the grant of up to 250,000 shares of Common Stock under equity awards including stock options, stock awards, restricted stock, stock appreciation rights, performance units, or other equity-based awards payable in cash or stock to key employees and directors of the Company and the Bank. As of December 31, 2017, restricted stock for 41,031 shares of Common Stock and 55,823 of performance stock units has been granted under the Plan.
On May 26, 2010, the Company’s stockholders voted to approve the Guaranty Federal Bancshares, Inc. 2010 Equity Plan (the”2010 Plan”). The Plan provides for the grant of up to 200,000 shares of Common Stock under equity awards including stock options, stock awards, restricted stock, stock appreciation rights, performance units, or other equity-based awards payable in cash or stock to key employees and directors of the Company and the Bank. As of December 31, 2017, non-incentive stock options for 25,000 shares and restricted stock for 139,330 shares of Common Stock have been granted under the Plan.
In addition, the Company established four stock option plans for the benefit of certain directors, officers and employees of the Company and its subsidiary. A committee of the Company’s Board of Directors administers the plans. The stock options under these plans may be either incentive stock options or nonqualified stock options. Incentive stock options can be granted only to participants who are employees of the Company or its subsidiary. The option price must not be less than the market value of the Company stock on the date of grant. All options expire no later than ten years from the date of grant. The options vest at the rate of 20% per year over a five-year period.
The tables below summarize transactions under the Company’s equity plans:
Stock Options
|
Number of shares |
||||||||||||
|
Incentive Stock Option |
Non-Incentive Stock Option |
Weighted Average Exercise Price |
||||||||||
|
Balance outstanding as of January 1, 2015 |
140,300 | 82,500 | 18.23 | |||||||||
|
Granted |
- | - | - | |||||||||
|
Exercised |
(10,800 | ) | (25,000 | ) | 5.22 | |||||||
|
Forfeited |
(38,000 | ) | - | 25.19 | ||||||||
|
Balance outstanding as of December 31, 2015 |
91,500 | 57,500 | 19.58 | |||||||||
|
Granted |
- | - | - | |||||||||
|
Exercised |
(11,500 | ) | (5,000 | ) | 5.20 | |||||||
|
Forfeited |
(20,000 | ) | (2,500 | ) | 28.34 | |||||||
|
Balance outstanding as of December 31, 2016 |
60,000 | 50,000 | 19.95 | |||||||||
|
Granted |
- | - | ||||||||||
|
Exercised |
(3,000 | ) | - | 5.19 | ||||||||
|
Forfeited |
(11,000 | ) | (25,000 | ) | 29.48 | |||||||
|
Balance outstanding as of December 31, 2017 |
46,000 | 25,000 | $ | 15.74 | ||||||||
|
Options exercisable as of December 31, 2017 |
46,000 | 25,000 | $ | 15.74 | ||||||||
As of December 31, 2017, total outstanding stock options of 71,000 had a remaining contractual life of 0.85 years.
The total intrinsic value of outstanding stock options was $664,220 and $660,120 at December 31, 2017 and 2016, respectively. The total intrinsic value of outstanding exercisable stock options was $664,220 and $660,120 at December 31, 2017 and 2016, respectively. The fair value of options vested during 2017, 2016 and 2015 was $0, $0 and $143,350, respectively.
Restricted Stock
|
Number of shares |
Weighted Average Grant- Date Price |
|||||||
|
Balance of shares non-vested as of January 1, 2015 |
30,503 | 10.26 | ||||||
|
Granted |
28,951 | 14.78 | ||||||
|
Vested |
(15,083 | ) | 11.64 | |||||
|
Forfeited |
(894 | ) | 12.26 | |||||
|
Balance of shares non-vested as of December 31, 2015 |
43,477 | 12.75 | ||||||
|
Granted |
24,679 | 15.01 | ||||||
|
Vested |
(7,201 | ) | 13.13 | |||||
|
Forfeited |
- | - | ||||||
|
Balance of shares non-vested as of December 31, 2016 |
60,955 | 13.62 | ||||||
|
Granted |
13,386 | 20.33 | ||||||
|
Vested |
(28,791 | ) | 12.29 | |||||
|
Forfeited |
- | - | ||||||
|
Balance of shares non-vested as of December 31, 2017 |
45,550 | $ | 16.44 | |||||
In February 2017, the Company granted 6,960 shares of restricted stock to directors pursuant to the 2015 Equity Plan of which 6,195 have a cliff vesting at the end of one year and thus, expensed over that same period and 765 shares have a cliff vesting at the end of three years, and thus, expensed over that same period. In February 2016, the Company granted 9,336 shares of restricted stock to directors that have a one year cliff vesting. In February 2015, the Company granted 8,281 of restricted stock to directors that was fully vested and thus, expensed in full during the year ended December 31, 2015. In June 2015, the Company granted 966 shares of restricted stock to directors that have a cliff vesting at the end of three years. The expense is being recognized over the applicable vesting period. The expense relating to these awards for the years ended December 31, 2017, 2016 and 2015 was $135,274, $126,032 and $124,910, respectively.
During 2017, 2016 and 2015, the Company granted 6,426, 15,343 and 19,704 shares of restricted stock to officers that all have a cliff vesting at the end of three years. The expense is being recognized over the applicable vesting period. The expense relating to these awards for the years ended December 31, 2017, 2016 and 2015 was $210,008, $267,606 and $176,644, respectively.
Performance Stock Units
|
Performance Stock Units |
Weighted Average Grant-Date Fair Value |
|||||||
|
Balance of shares non-vested as of January 1, 2017 |
- | $ | - | |||||
|
Granted |
55,823 | 20.48 | ||||||
|
Vested |
- | - | ||||||
|
Forfeited |
- | - | ||||||
|
Balance of shares non-vested as of December 31, 2017 |
55,823 | $ | 20.48 | |||||
On March 29, 2017, the Company granted restricted stock units representing 55,823 hypothetical shares of common stock to officers. There are three possible levels of incentive awards: threshold (25%); target (50%); and maximum (100%). The restricted stock units vest based on two financial performance factors over the period from March 29, 2017 to December 31, 2019 (the “Performance Period”). The two performance measurements of the Company (and the weight given to each measurement) applicable to each award level are as follows: (i) Total Assets (50%) and (ii) Return on Average Assets (50%). In determining compensation expense, the fair value of the restricted stock unit awards was determined based on the closing price of the Company’s common stock on the date of grant, which was $20.48 per share. The expense is being recognized over the applicable vesting period. Due to the fact that the measurements cannot be determined at the time of the grant, the Company estimated that the most likely outcome is the achievement of the target level. If during the Performance Period, additional information becomes available to lead the Company to believe a different level will be achieved for the Performance Period, the Company will reassess the number of units that will vest for the grant and adjust its compensation expense accordingly on a prospective basis. The total amount of expense for restricted stock units during the year ended December 31, 2017 was $153,242.
Total stock-based compensation expense is comprised of expense for restricted stock awards, restricted stock units and stock options. Expense recognized for the years ended December 31, 2017, 2016 and 2015 was $498,524, $393,638 and $297,295, respectively. As of December 31, 2017, there was $632,742 of unrecognized compensation expense related to nonvested restricted stock awards and restricted stock units, which will be recognized over the remaining vesting periods.
NOTE 14: NEW ACCOUNTING PRONOUNCEMENTS
In May 2014, the Financial Accounting Standards Board (“FASB”) issued Accounting Standards Update (“ASU”) 2014-09, (Topic 606): Revenue from Contracts with Customers (“ASU 2014-09”). The scope of the guidance applies to revenue arising from contracts with customers, except for the following: lease contracts, insurance contracts, contractual rights and obligations within the scope of other guidance and nonmonetary exchanges between entities in the same line of business to facilitate sales to customers. The core principle of the new guidance is that an entity should recognize revenue to reflect the transfer of goods and services to customers in an amount equal to the consideration that the entity receives or expects to receive. ASU 2014-09 is not expected to significantly impact the timing or approach to revenue recognition for financial institutions. Initially, the amendments were effective for public entities for annual reporting periods beginning after December 15, 2016, however, the FASB issued ASU 2015-14 Revenue from Contracts with Customers (Topic 606) – Deferral of the Effective Date” which deferred the effective date of ASU 2014-09 by one year to annual and interim periods beginning after December 15, 2017. The guidance does not apply to revenue associated with financial instruments, including loans and securities that are accounted for under GAAP, which comprises a significant portion of our revenue stream. The Company adopted ASU 2014-09 during the first quarter of 2018 and completed an evaluation of the impact of the revenue streams which are included in the scope of these updates, such as deposit fees and revenue from the sale of other real estate owned. The Company concluded that the adoption of this update did not materially impact the Company’s consolidated statements of income however may result in new disclosure requirements to be included in the first quarter 2018 Quarterly Report on Form 10-Q.
In January 2016, the FASB issued ASU 2016-01, Financial Instruments- Overall (Subtopic 825-10): Recognition and Measurement of Financial Assets and Financial Liabilities (“ASU 2016-01”). ASU 2016-01 simplifies the impairment assessment of equity investments, clarifies reporting disclosure requirements for financial instruments measured at amortized cost, and requires the exit price notion be disclosed when measuring fair value of financial instruments. ASU 2016-01 details the required separate presentation in other comprehensive income for the change in fair value of a liability related to change in instrument specific credit risk and details the required separate presentation of financial assets and liabilities by measurement category and clarifies the guidance for a valuation allowance on deferred tax assets related to available-for-sale securities. ASU 2016-01 is effective for annual and interim reporting periods beginning after December 15, 2017. ASU 2016-01 was effective for the Company on January 1, 2018 and did not have a material impact on our consolidated financial statements but will have an impact on our fair value disclosures going forward. The Company does not currently hold any equity investments.
In February 2016, the FASB issued ASU 2016-02, Leases (“ASU 2016-02”). ASU 2016-02 establishes a right-of-use (ROU) model that requires a lessee to record a ROU asset and a lease liability on the balance sheet for all leases with terms longer than 12 months. Leases will be classified as either finance or operating, with classification affecting the pattern of expense recognition in the income statement. ASU 2016-02 is effective for fiscal years beginning after December 15, 2018, including interim periods within those fiscal years. A modified retrospective transition approach is required for lessees for capital and operating leases existing at, or entered into after, the beginning of the earliest comparative period presented in the financial statements, with certain practical expedients available. The Company is currently evaluating the impact that this standard will have on its Consolidated Financial Statements when adopted in the first quarter of 2019.
In March 2016, the FASB issued ASU 2016-09, Compensation-Stock Compensation (Topic 718): Improvements to Employee Share-Based Payment Accounting. The purpose of the update was to simplify the accounting for share-based payment transactions, including the income tax consequences of such transactions. Under the provisions of the update the income tax consequences of excess tax benefits and deficiencies are to be recognized in income tax expense in the reporting period in which the awards vest. Previously, excess tax benefits or deficiencies impact stockholders’ equity directly to the extent there was a cumulative excess tax benefit. In the event that a tax deficiency had occurred during the reporting period and a cumulative excess tax benefit did not exist, the tax deficiency was recognized in income tax expense under previous GAAP. The update also provided that entities may continue to estimate forfeitures in accounting for stock-based compensation or recognize them as they occur. The provisions of this update became effective for interim and annual periods beginning after December 15, 2016. The adoption of this amendment did not have a material impact on the Company’s financial position, results of operations or cash flows.
In June 2016, the FASB issued ASU 2016-13, Financial Instruments-Credit Losses (Topic 326): Measurement of Credit Losses on Financial Instruments. Among other things, the amendments in this ASU require the measurement of all expected credit losses for financial assets held at the reporting date based on historical experience, current conditions, and reasonable and supportable forecasts. Financial institutions and other organizations will now use forward-looking information to better inform their credit loss estimates. Many of the loss estimation techniques applied today will still be permitted, although the inputs to those techniques will change to reflect the full amount of expected credit losses. In addition, the ASU amends the accounting for credit losses on available-for-sale debt securities and purchased financial assets with credit deterioration. For SEC filers, the amendments in this ASU are effective for fiscal years, and interim periods within those fiscal years, beginning after December 15, 2019, with later effective dates for non-SEC registrant public companies and other organizations. Early adoption will be permitted for all organizations for fiscal years, and interim periods within those fiscal years, beginning after December 15, 2018. The Company is currently evaluating the provisions of ASU No. 2016-13 to determine the potential impact the new standard will have on the Company’s consolidated financial statements, and it is too early at this time to determine the impact on the financial statements.
In August 2016, the FASB issued ASU 2016-15, Statement of Cash Flows (Topic 230): Classification of Certain Cash Receipts and Cash Payments. The update is intended to reduce the diversity in practice around how certain transactions are classified within the statement of cash flows with respect to eight types of cash flows. This new accounting guidance will be effective for interim and annual reporting periods beginning after December 15, 2017. Adoption of ASU 2016-15 is not expected to have a material impact on our consolidated financial statements.
In March 2017, the FASB issued ASU 2017-08, Receivables-Nonrefundable Fees and Other Costs (Subtopic) 310-20): Premium Amortization of Purchased Callable Debt Securities. The amendments in this ASU shorten the amortization period for certain callable debt securities held at a premium. The amendments require the premium to be amortized to the earliest call date. The amendments do not require an accounting change for securities held at a discount; the discount continues to be amortized to maturity. The amendment will be effective for interim and annual reporting periods beginning after December 15, 2018. The Company elected to early adopt ASU 2017-08 during 2017 and it did not have a significant effect on our consolidated financial statements.
In May 2017, the FASB issued ASU 2017-09, Compensation-Stock Compensation (Subtopic 718): Scope of Modification Accounting. ASU 2017-09 clarifies when changes to terms or conditions of a share-based payment award must be accounted for as a modification. Under the new guidance, an entity will not apply modification accounting to a share-based payment award if all of the following are the same immediately before and after the change: (i) the fair value of the award, (ii) the vesting conditions of the award, and (iii) the classification of the award as either an equity or liability instrument. ASU 2017-09 is effective for the fiscal years, and interim periods within those fiscal years, beginning after December 15, 2017. The guidance requires companies to apply the requirements prospectively to awards modified on or after the adoption date. ASU 2017-09 was effective for the Company on January 1, 2018 and did not have a material impact on our consolidated financial statements.
In July 2017, the FASB issued ASU 2017-11, Earnings Per Share (Topic 260); Distinguishing Liabilities from Equity (Topic 480); Derivatives and Hedging (Topic 815): (Part 1) Accounting for certain financial instruments with down round features and (Part II), Replacement of the indefinite deferral for mandatory redeemable financial instruments of certain nonpublic entities and certain mandatory redeemable non-controlling interests with a scope exception. Part I of the update addresses the complexity of accounting for certain financial instruments with down round features such as warrants or convertible instruments and will be effective for interim and annual reporting periods beginning after December 15, 2019. The Company is currently evaluating the impact of our pending adoption of the new standard on our consolidated financial statements, but at this time do not believe the standard will have a significant impact on the financial statements.
In August 2017, the FASB issued ASU 2017-12, Derivatives and Hedging (Topic 815): Targeted improvements to accounting for hedging activities. The purpose of this updated guidance is to better align financial reporting for hedging activities with the economic objectives of those activities. The amendments in this update are effective for fiscal years beginning after December 15, 2018, with early adoption, including adoption in an interim period, permitted. The standard requires the modified retrospective transition approach as of the date of adoption. The Company is currently evaluating the impact that this standard will have on its Consolidated Financial Statements.
In February 2018, the FASB issued ASU 2018-02, Income Statement-Reporting Comprehensive Income (Topic 220): Reclassification of Certain Tax Effects from Accumulated Other Comprehensive Income. This ASU provides financial statement preparers with an option to reclassify stranded tax effects within AOCI to retained earnings in each period in which the effect of the change in the U.S. federal corporate income tax rate in the Tax Cuts and Jobs Act (or portion thereof) are recorded. This standard is effective for all organizations for fiscal years beginning after December 15, 2018, and interim periods within those fiscal years. Early adoption is permitted. Organizations should apply the proposed amendments either in the period of adoption or retrospectively to each period (or periods) in which the effect of the change in the U.S. federal corporate income tax rate in the Tax Cuts and Jobs Act is recognized. The Company elected to early adopt ASU 2018-02 and, as a result, reclassified $31,818 from accumulated other comprehensive income to retained earnings as of December 31, 2017. The reclassification impacted the Consolidated Balance Sheet and the Consolidated Statement of Stockholder’s Equity as of and for the year ended December 31, 2017.
NOTE 15: OTHER EXPENSES
Other expenses for the years ended December 31, 2017, 2016 and 2015 were as follows:
|
December 31, |
December 31, |
December 31, |
||||||||||
|
2017 |
2016 |
2015 |
||||||||||
|
Directors compensation |
$ | 231,479 | $ | 221,072 | $ | 216,770 | ||||||
|
Outside services |
73,966 | 132,500 | 75,000 | |||||||||
|
Legal expense |
261,088 | 251,051 | 275,657 | |||||||||
|
Deposit expense |
110,897 | 139,234 | 77,862 | |||||||||
|
Office supplies |
105,780 | 94,189 | 74,798 | |||||||||
|
Telephone |
173,160 | 158,434 | 141,674 | |||||||||
|
Postage |
138,864 | 141,529 | 155,901 | |||||||||
|
Insurance |
118,483 | 115,430 | 113,341 | |||||||||
|
Supervisory exam |
55,849 | 53,951 | 51,433 | |||||||||
|
Accounting |
207,652 | 210,939 | 171,759 | |||||||||
|
Organization dues |
155,121 | 145,709 | 137,723 | |||||||||
|
Loan expense |
361,389 | 271,739 | 397,438 | |||||||||
|
Contributions |
60,000 | 60,000 | 52,500 | |||||||||
|
ATM expense |
170,455 | 152,581 | 238,744 | |||||||||
|
Other operating |
637,961 | 673,565 | 491,941 | |||||||||
| $ | 2,862,144 | $ | 2,821,923 | $ | 2,672,541 | |||||||
NOTE 16: RELATED PARTY TRANSACTIONS
In the ordinary course of business, the Bank has granted loans to executive officers and directors and their affiliates. Annual activity consisted of the following:
|
Year ended December 31, |
||||||||||||
|
2017 |
2016 |
2015 |
||||||||||
|
Balance, beginning of year |
$ | 5,822,136 | $ | 3,946,621 | $ | 4,409,644 | ||||||
|
New Loans |
1,523,847 | 3,112,689 | - | |||||||||
|
Repayments |
(817,050 | ) | (1,237,174 | ) | (463,023 | ) | ||||||
|
Balance, end of year |
$ | 6,528,933 | $ | 5,822,136 | $ | 3,946,621 | ||||||
In management's opinion, such loans and other extensions of credit and deposits were made in the ordinary course of business and were made on substantially the same terms as those prevailing at the time for comparable transactions with other persons. Further, in management's opinion, these loans did not involve more than normal risk of collectability or present other unfavorable features.
NOTE 17: COMMITMENTS AND CREDIT RISK
Commitments to extend credit are agreements to lend to a customer as long as there is no violation of any condition established in the contract. Commitments generally have fixed expiration dates or other termination clauses and may require payment of a fee. Since a portion of the commitments may expire without being drawn upon, the total commitment amounts do not necessarily represent future cash requirements. The Bank evaluates each customer's credit worthiness on a case-by-case basis. The amount of collateral obtained, if deemed necessary by the Bank upon extension of credit, is based on management's credit evaluation of the counterparty. Collateral held varies but may include accounts receivable, inventory, property and equipment, commercial real estate and residential real estate.
As of December 31, 2017 and 2016, the Bank had outstanding commitments to originate fixed-rate mortgage loans of approximately $7,692,000 and $6,152,000, respectively. The commitments extend over varying periods of time with the majority being disbursed within a thirty-day period.
Standby letters of credit are irrevocable conditional commitments issued by the Bank to guarantee the performance of a customer to a third party. Financial standby letters of credit are primarily issued to support public and private borrowing arrangements, including commercial paper, bond financing and similar transactions. Performance standby letters of credit are issued to guarantee performance of certain customers under non-financial contractual obligations. The credit risk involved in issuing standby letters of credit is essentially the same as that involved in extending loans to customers. Fees for letters of credit are initially recorded by the Bank as deferred revenue and are included in earnings at the termination of the respective agreements. Should the Bank be obligated to perform under the standby letters of credit, the Bank may seek recourse from the customer for reimbursement of amounts paid.
The Bank had total outstanding standby letters of credit amounting to $12,733,000 and $11,596,000 as of December 31, 2017 and 2016, respectively, with terms ranging from 1 year to 2 years.
The Bank has confirming letters of credit from the FHLB issued for collateral on public deposits and to enhance Bank issued letters of credit granted to various customers for industrial revenue bond issues. As of December 31, 2017 and 2016, these letters of credit aggregated approximately $39,422,000 and $19,725,000.
Lines of credit are agreements to lend to a customer as long as there is no violation of any condition established in the contract. Lines of credit generally have fixed expiration dates. Since a portion of the line may expire without being drawn upon, the total unused lines do not necessarily represent future cash requirements. Each customer's credit worthiness is evaluated on a case-by-case basis. The amount of collateral obtained, if deemed necessary, is based on management's credit evaluation of the counterparty. Collateral held varies but may include accounts receivable, inventory, property and equipment, commercial real estate and residential real estate. Management uses the same credit policies in granting lines of credit as it does for on balance sheet instruments.
As of December 31, 2017 and 2016, unused lines of credit to borrowers aggregated approximately $117,068,000 and $89,103,000, respectively, for commercial lines and $15,929,000 and $15,960,000, respectively, for open-end consumer lines.
NOTE 18: DERIVATIVE FINANCIAL INSTRUMENTS
The Company records all derivative financial instruments at fair value in the financial statements. Derivatives are used as a risk management tool to hedge the exposure to changes in interest rates or other identified market risks.
When a derivative is intended to be a qualifying hedged instrument, the Company prepares written hedge documentation that designates the derivative as 1) a hedge of fair value of a recognized asset or liability (fair value hedge) or 2) a hedge of a forecasted transaction, such as, the variability of cash flows to be received or paid related to a recognized asset or liability (cash flow hedge). The written documentation includes identification of, among other items, the risk management objective, hedging instrument, hedged item, and methodologies for assessing and measuring hedge effectiveness and ineffectiveness, along with support for management’s assertion that the hedge will be highly effective.
In June 2017, the Company entered into a forward start interest rate swap agreement totaling $50 million notional amount to hedge against interest rate risk on FHLB advances. As a cash flow hedge, the portion of the change in the fair value of the derivative that has been deemed highly effective is recognized in other comprehensive income until the related cash flows from the hedged item are recognized in earnings. At December 31, 2017, the Company reported a $422,939 unrealized gain, net of a $144,765 tax effect, in other comprehensive income related to this cash flow hedge. The Company documents, both at inception and periodically over the life of the hedge, its analysis of actual and expected hedge effectiveness. To the extent that the hedge of future cash flows is deemed ineffective, changes in the fair value of the derivative are recognized in earnings as a component of other noninterest expense. For the year ended December 31, 2017, there was no ineffectiveness attributable to the cash flow hedge.
A summary of the Company’s derivative financial instruments at December 31, 2017 is shown in the following table:
|
Forward Start |
Termination |
Derivative |
Notional |
Rate |
Rate |
Estimated Fair Value |
||||||||||||
|
Inception Date |
Date |
Type |
Amount |
Paid |
Hedged |
at December 31, 2017 |
||||||||||||
|
2/28/2018 |
2/28/2025 |
Interest rate swap |
$ | 50,000,000 | 2.12 | % |
3 month LIBOR Floating |
$ | 567,704 | |||||||||
NOTE 19: CONDENSED PARENT COMPANY STATEMENTS
The condensed balance sheets as of December 31, 2017 and 2016, and statements of income and cash flows for the years ended December 31, 2017, 2016 and 2015 for the parent company, Guaranty Federal Bancshares, Inc., are as follows:
|
Condensed Balance Sheets |
December 31, |
|||||||
|
2017 |
2016 |
|||||||
|
Assets |
||||||||
|
Cash |
$ | 713,996 | $ | 1,571,915 | ||||
|
Available-for-sale securities |
- | - | ||||||
|
Investment in subsidiary |
89,319,774 | 83,946,411 | ||||||
|
Investment in Capital Trust I & II |
465,000 | 465,000 | ||||||
|
Prepaid expenses and other assets |
19,148 | 14,597 | ||||||
|
Deferred and receivable income taxes |
469,020 | - | ||||||
| $ | 90,986,938 | $ | 85,997,923 | |||||
|
Liabilities |
||||||||
|
Subordinated debentures |
$ | 15,465,000 | $ | 15,465,000 | ||||
|
Accrued expenses and other liabilities |
623,545 | 551,643 | ||||||
|
Due to subsidiary |
6,900 | 6,900 | ||||||
|
Stockholders' equity |
||||||||
|
Common stock |
687,850 | 687,550 | ||||||
|
Additional paid-in capital |
50,856,069 | 50,552,077 | ||||||
|
Retained earnings |
60,679,308 | 57,347,282 | ||||||
|
Unrealized loss on available-for-sale securities, net |
(206,193 | ) | (1,309,241 | ) | ||||
|
Treasury stock |
(37,125,541 | ) | (37,303,288 | ) | ||||
| $ | 90,986,938 | $ | 85,997,923 | |||||
|
Condensed Statements of Income |
Years ended December 31, |
|||||||||||
|
2017 |
2016 |
2015 |
||||||||||
|
Income |
||||||||||||
|
Dividends from subsidiary bank |
$ | 2,000,000 | $ | - | $ | - | ||||||
|
Interest income: |
||||||||||||
|
Other |
19,017 | 50,332 | 16,200 | |||||||||
| 2,019,017 | 50,332 | 16,200 | ||||||||||
|
Expense |
||||||||||||
|
Interest expense: |
||||||||||||
|
Related party |
631,202 | 579,410 | 538,785 | |||||||||
|
Other |
1,158,462 | 931,816 | 734,780 | |||||||||
| 1,789,664 | 1,511,226 | 1,273,565 | ||||||||||
|
Income (loss) before income taxes and equity in undistributed income (loss) of subsidiaries |
229,353 | (1,460,894 | ) | (1,257,365 | ) | |||||||
|
Credit for income taxes |
(689,813 | ) | (435,000 | ) | (415,000 | ) | ||||||
|
Income (loss) before equity in undistributed earnings of subsidiaries |
919,166 | (1,025,894 | ) | (842,365 | ) | |||||||
|
Equity in undistributed income of subsidiaries |
4,238,498 | 6,619,905 | 6,559,132 | |||||||||
|
Net income |
$ | 5,157,664 | $ | 5,594,011 | $ | 5,716,767 | ||||||
|
Condensed Statements of Cash Flows |
Years ended December 31, |
|||||||||||
|
2017 |
2016 |
2015 |
||||||||||
|
Cash Flows From Operating Activities |
||||||||||||
|
Net income |
$ | 5,157,664 | $ | 5,594,011 | $ | 5,716,767 | ||||||
|
Items not requiring (providing) cash: |
||||||||||||
|
Equity in undistributed income of subsidiaries |
(4,238,498 | ) | (6,619,905 | ) | (6,559,132 | ) | ||||||
|
Deferred income taxes |
- | 8,988 | - | |||||||||
|
Stock award plan expense |
466,469 | 373,782 | 285,589 | |||||||||
|
Gain on investment securities |
- | (18,889 | ) | - | ||||||||
|
Changes in: |
||||||||||||
|
Prepaid expenses and other assets |
(73,584 | ) | (700 | ) | 2,060 | |||||||
|
Income taxes payable/refundable |
(420,444 | ) | 139,837 | 1,096,653 | ||||||||
|
Accrued expenses |
2,390 | 32,450 | (95,779 | ) | ||||||||
|
Net cash provided by (used in) operating activities |
893,997 | (490,426 | ) | 446,158 | ||||||||
|
Cash Flows From Investing Activities |
||||||||||||
|
Proceeds from sales of AFS securities |
- | 121,101 | - | |||||||||
|
Net cash provided by investing activities |
- | 121,101 | - | |||||||||
|
Cash Flows From Financing Activities |
||||||||||||
|
Stock options exercised |
15,570 | 85,800 | 187,129 | |||||||||
|
Cash dividends paid on common and preferred stock |
(1,767,486 | ) | (1,415,180 | ) | (873,499 | ) | ||||||
|
Treasury Stock purchased |
- | (371,538 | ) | - | ||||||||
|
Net cash provided by (used in) financing activities |
(1,751,916 | ) | (1,700,918 | ) | (686,370 | ) | ||||||
|
Increase (Decrease) in cash |
(857,919 | ) | (2,070,243 | ) | (240,212 | ) | ||||||
|
Cash, beginning of year |
1,571,915 | 3,642,158 | 3,882,370 | |||||||||
|
Cash, end of year |
$ | 713,996 | $ | 1,571,915 | $ | 3,642,158 | ||||||
|
Statements of Comprehensive Income |
Years ended December 31, |
|||||||||||
|
2017 |
2016 |
2015 |
||||||||||
|
NET INCOME |
$ | 5,157,664 | $ | 5,594,011 | $ | 5,716,767 | ||||||
|
OTHER ITEMS OF COMPREHENSIVE INCOME (LOSS): |
||||||||||||
|
Change in unrealized gain (loss) on investment securities available-for-sale, before income taxes |
- | 2,695 | (5,507 | ) | ||||||||
|
Income tax expense related to other items of comprehensive income |
- | (997 | ) | 2,038 | ||||||||
|
Other comprehensive income (loss) |
- | 3,692 | (7,545 | ) | ||||||||
|
Comprehensive income (loss) of Bank |
1,103,048 | (628,977 | ) | (227,990 | ) | |||||||
|
TOTAL COMPREHENSIVE INCOME |
$ | 6,260,712 | $ | 4,968,726 | $ | 5,481,232 | ||||||
NOTE 20: UNAUDITED QUARTERLY OPERATING RESULTS
|
Year Ended December 31, 2017, Quarter ended |
||||||||||||||||
|
Mar-17 |
Jun-17 |
Sep-17 |
Dec-17 |
|||||||||||||
|
Interest income |
$ | 6,771,402 | $ | 7,241,508 | $ | 7,525,187 | $ | 7,902,636 | ||||||||
|
Interest expense |
1,173,461 | 1,352,309 | 1,473,190 | 2,087,594 | ||||||||||||
|
Net interest income |
5,597,941 | 5,889,199 | 6,051,997 | 5,815,042 | ||||||||||||
|
Provision for loan losses |
475,000 | 575,000 | 450,000 | 250,000 | ||||||||||||
|
Gain on loans and investment securities |
539,102 | 710,665 | 858,826 | 705,583 | ||||||||||||
|
Other noninterest income, net |
690,263 | 656,395 | 712,043 | 854,443 | ||||||||||||
|
Noninterest expense |
4,419,620 | 4,567,916 | 5,011,832 | 5,603,718 | ||||||||||||
|
Income before income taxes |
1,932,686 | 2,113,343 | 2,161,034 | 1,521,350 | ||||||||||||
|
Provision for income taxes |
503,445 | 520,770 | 443,651 | 1,102,883 | ||||||||||||
|
Net income available to common shareholders |
$ | 1,429,241 | $ | 1,592,573 | $ | 1,717,383 | $ | 418,467 | ||||||||
|
Basic income per common share |
$ | 0.33 | $ | 0.36 | $ | 0.39 | $ | 0.10 | ||||||||
|
Diluted income per common share |
$ | 0.32 | $ | 0.36 | $ | 0.39 | $ | 0.09 | ||||||||
|
Year Ended December 31, 2016, Quarter ended |
||||||||||||||||
|
Mar-16 |
Jun-16 |
Sep-16 |
Dec-16 |
|||||||||||||
|
Interest income |
$ | 6,205,045 | $ | 6,204,314 | $ | 6,354,303 | $ | 6,625,664 | ||||||||
|
Interest expense |
1,025,411 | 1,026,782 | 1,056,181 | 1,068,638 | ||||||||||||
|
Net interest income |
5,179,634 | 5,177,532 | 5,298,122 | 5,557,026 | ||||||||||||
|
Provision for loan losses |
375,000 | 375,000 | 200,000 | 425,000 | ||||||||||||
|
Gain on loans and investment securities |
470,456 | 525,644 | 658,205 | 544,172 | ||||||||||||
|
Other noninterest income, net |
638,366 | 653,769 | 657,296 | 722,299 | ||||||||||||
|
Noninterest expense |
4,109,476 | 4,309,394 | 4,317,707 | 4,364,169 | ||||||||||||
|
Income before income taxes |
1,803,980 | 1,672,551 | 2,095,916 | 2,034,328 | ||||||||||||
|
Provision for income taxes |
527,375 | 416,399 | 554,009 | 514,981 | ||||||||||||
|
Net income available to common shareholders |
$ | 1,276,605 | $ | 1,256,152 | $ | 1,541,907 | $ | 1,519,347 | ||||||||
|
Basic income per common share |
$ | 0.29 | $ | 0.29 | $ | 0.35 | $ | 0.35 | ||||||||
|
Diluted income per common share |
$ | 0.29 | $ | 0.28 | $ | 0.35 | $ | 0.34 | ||||||||
NOTE 21: PENDING MERGER
On November 30, 2017, the Company entered into an Agreement and Plan of Merger with Hometown Bancshares, Inc., a Missouri corporation (“Hometown”) (the “Agreement”). Pursuant to the terms of the Agreement, Hometown will merge into Guaranty, with Guaranty being the surviving corporation. The transaction is expected to close on April 2, 2018. Under the terms of the Agreement, each share of Hometown common stock will be exchanged for $20.00 in cash and the transaction is valued at approximately $4.6 million. In its December 31, 2017, unaudited Consolidated Report of Condition, Hometown Bank, N.A., the subsidiary bank of Hometown, reported total assets of $179.6 million, total liabilities of $163.2 million and total equity of $16.4 million. The Bank reported $210,000 in net income for the twelve months ended December 31, 2017. The Company anticipates there will be goodwill and a core deposit intangible recorded with this acquisition.
Report of Independent Registered Public Accounting Firm
Audit Committee, Board of Directors and Stockholders
Guaranty Federal Bancshares, Inc.
Springfield, Missouri
Opinion on the Financial Statements
We have audited the accompanying consolidated balance sheets of Guaranty Federal Bancshares, Inc. (the “Company”) as of December 31, 2017 and 2016, and the related consolidated statements of income, comprehensive income, stockholders’ equity and cash flows for each of the years in the three-year period ended December 31, 2017, and the related notes (collectively referred to as the “financial statements”). In our opinion, the consolidated financial statements referred to above present fairly, in all material respects, the financial position of the Company as of December 31, 2017 and 2016, and the results of its operations and its cash flows for each of the years in the three-year period ended December 31, 2017, in the conformity with accounting principles generally accepted in the United States of America.
Basis for Opinion
These financial statements are the responsibility of the Company’s management. Our responsibility is to express an opinion on the Company’s financial statements based on our audits.
We are a public accounting firm registered with the Public Company Accounting Oversight Board (United States) (“PCAOB”) and are required to be independent with respect to the Company in accordance with the U.S. federal securities law and the applicable rules and regulations of the Securities and Exchange Commission and the PCAOB.
We conducted our audits in accordance with the standards of the PCAOB. Those standards require that we plan and perform the audit to obtain reasonable assurance about whether the financials statements are free of material misstatement, whether due to error or fraud. The Company is not required to have, nor were we engaged to perform, an audit of its internal control over financial reporting. As a part of our audits we are required to obtain an understanding of internal controls over financial reporting but not for the purpose of expressing an opinion on the effectiveness of the Company’s internal control over financial reporting. Accordingly, we express no such opinion.
Our audits included performing procedures to assess the risks of material misstatement of the financial statements, whether due to error or fraud, and performing procedures that respond to those risks. Such procedures include examining, on a test basis, evidence regarding the amounts and disclosures in the financial statements. Our audits also included evaluating the accounting principles used and significant estimates made by management, as well as evaluating the overall presentation of the financial statements. We believe that our audits provide a reasonable basis for our opinion.
/s/BKD, LLP
We have served as the Company’s auditor since 1980.
Springfield, Missouri
March 30, 2018
Item 9. Changes in and Disagreements with Accountants On Accounting and Financial Disclosure
Not applicable.
Item 9A. Controls and Procedures
Disclosure Controls and Procedures
The Company maintains disclosure controls and procedures as defined in Rule 13a-15(e) of the Securities Exchange Act of 1934, as amended (the “Exchange Act”), that are designed to ensure that information required to be disclosed in the Company’s Exchange Act reports is recorded, processed, summarized and reported within the time periods specified in the Securities and Exchange Commission’s rules and forms, and that such information is accumulated and communicated to the Company’s management, including its Chief Executive Officer and Chief Financial Officer, as appropriate to allow timely decisions regarding required disclosure.
The Company carried out an evaluation, under the supervision and with the participation of the Company’s management, including the Company’s Chief Executive Officer and Chief Financial Officer, of the effectiveness of the Company’s disclosure controls and procedures. Based on the foregoing evaluation, the Company’s Chief Executive Officer and Chief Financial Officer concluded that the Company’s disclosure controls and procedures were effective as of December 31, 2017.
Internal Control Over Financial Reporting
There have been no changes in the Company’s internal controls over financial reporting during the fourth quarter ending December 31, 2017 that have materially affected, or are reasonably likely to materially affect, the Company’s internal controls over financial reporting.
Management’s Report on Internal Control Over Financial Reporting
The management of Guaranty Federal Bancshares, Inc. (the “Company”) is responsible for establishing and maintaining adequate internal control over financial reporting, as such term is defined in Exchange Act Rule 13a-15(f). The Company’s internal control over financial reporting is a process designed to provide reasonable assurance regarding the reliability of financial reporting and the preparation of the financial statements for external purposes in accordance with accounting principles generally accepted in the United States of America. The Company’s internal control over financial reporting includes those policies and procedures that (i) pertain to the maintenance of records that, in reasonable detail, accurately and fairly reflect the transactions and dispositions of the assets of the Company; (ii) provide reasonable assurance that transactions are recorded as necessary to permit preparation of financial statements in accordance with accounting principles generally accepted in the United States of America, and that receipts and expenditures of the Company are being made only in accordance with authorizations of management and directors of the Company; and (iii) provide reasonable assurance regarding prevention or timely detection of unauthorized acquisition, use, or disposition of the Company’s assets that could have a material effect on the financial statements.
Because of its inherent limitations, internal control over financial reporting may not prevent or detect misstatements. All internal control systems, no matter how well designed, have inherent limitations, including the possibility of human error and the circumvention of overriding controls. Accordingly, even effective internal controls over financial reporting can provide only reasonable assurance with respect to financial statement preparation. Also, projections of any evaluation of effectiveness to future periods are subject to the risk that controls may become inadequate because of changes in conditions, or that the degree of compliance with the policies or procedures may deteriorate.
Management assessed the effectiveness of the Company’s internal control over financial reporting as of December 31, 2017, based on the framework set forth in Internal Control-Integrated Framework (2013) issued by the Committee of Sponsoring Organizations of the Treadway Commission. Based on that assessment, management concluded that, as of December 31, 2017, the Company’s internal control over financial reporting was effective.
Item 9B. Other Information
Not applicable.
PART III
Item 10. Directors, Executive Officers and Corporate Governance
The information contained under the section captioned "First Proposal: Election of Directors" (excluding any information contained under the section captioned “Meetings and Committees of the Board of Directors”) of the Proxy Statement is incorporated herein by reference.
The Company has adopted a Code of Conduct and Ethics, and it applies to all of the members of the board of directors, officers and employees of the Company (including the Bank), with special emphasis on compliance by the directors of the Company and the Company’s Chief Executive Officer, Chief Financial Officer, Principal Accounting Officer or Controller or persons performing similar functions for the Company. The Company’s Code of Conduct and Ethics is available on the Company’s website at www.gbankmo.com and may be accessed by logging onto the Company’s website and clicking on the “About Us” link and then the “Code of Conduct” link. You will then be able to click on, and access, the Company’s Code of Conduct and Ethics. Amendments to, and waivers granted under, the Company’s Code of Conduct and Ethics, if any, will be posted to the Company’s website as well.
The information required by Item 10 regarding an audit committee financial expert and the identification of the members of the audit committee, a separately designated committee of the Company’s board of directors established in accordance with section 3(a)(58)(A) of the Securities Exchange Act of 1934, is contained under the section captioned “Report of the Audit Committee” of the Proxy Statement and is incorporated herein by reference.
Additional information required by this item is contained (i) in the Proxy Statement under the section captioned "Section 16(a) Beneficial Ownership Reporting Compliance" and is incorporated herein by reference, and (ii) under the section captioned "Executive Officers of the Registrant" in Item 1 of this report.
Item 11. Executive Compensation
The information contained in the Proxy Statement under the section captioned "Report of the Compensation Committee” is incorporated herein by reference.
Item 12. Security Ownership of Certain Beneficial Owners and Management and Related Stockholder Matters
Information required by this item is contained under the section captioned "Ownership of Certain Beneficial Owners and Management" in the Proxy Statement and is incorporated herein by reference.
The following table sets forth information as of December 31, 2017 with respect to equity plans under which shares of the Company’s common stock may be issued:
|
Equity Compensation Plan Information |
||||||||||||
|
(c) |
||||||||||||
|
Number of securities |
||||||||||||
|
remaining available |
||||||||||||
|
(a) |
(b) |
for future issuance |
||||||||||
|
Number of securities to be |
Weighted-average |
under equity |
||||||||||
|
issued upon exercise of |
exercise price of |
compensation plans |
||||||||||
|
outstanding options, |
outstanding options, |
(excluding securities |
||||||||||
|
Plan category |
warrants and rights |
warrants and rights |
reflected in column (a)) |
|||||||||
|
Equity compensation plans approved by security holders |
112,500 | $ | 15.74 | 153,146 | ||||||||
|
Equity compensation plans not approved by security holders |
- | - | - | |||||||||
|
Totals |
71,000 | $ | 15.74 | 153,146 | ||||||||
Item 13. Certain Relationships and Related Transactions, and Director Independence
The information required by this item is contained under the sections captioned "Indebtedness of Management and Directors and Transactions with Certain Related Persons" and “Director Independence” in the Proxy Statement and is incorporated herein by reference.
Item 14. Principal Accounting Fees and Services
The information required by this item is contained under the section captioned "Principal Accountant Fees and Services" in the Proxy Statement and is incorporated herein by reference.
PART IV
Item 15. Exhibits and Financial Schedules
|
1. |
Financial Statements |
The following consolidated financial statements and the report of independent registered public accounting firm are filed as part of this report under Item 8.
Report of Independent Registered Public Accounting Firm
Consolidated Balance Sheets as of December 31, 2017 and 2016.
Consolidated Statements of Income for the Years Ended December 31, 2017, 2016 and 2015.
Consolidated Statements of Comprehensive Income for the Years Ended December 31, 2017, 2016 and 2015.
Consolidated Statements of Cash Flows for the Years Ended December 31, 2017, 2016 and 2015.
Consolidated Statements of Stockholders' Equity for the Years Ended December 31, 2017, 2016 and 2015.
Notes to Consolidated Financial Statements.
|
2. |
Financial statement schedules for which provision is made in the applicable accounting regulations of the SEC are not required under the related instructions or are inapplicable and therefore have been omitted. |
|
| 3. | The following exhibits are filed with this Report or incorporated herein by reference: |
Index to Exhibits
Exhibit
Number Exhibit Description
|
2.1 |
|
10.9 |
Form of Non-Incentive Stock Option Agreement under the 2004 Stock Option Plan *(10) |
|
10.10 |
|
10.11 |
|
10.12 |
|
10.13 |
|
10.14 |
Written Description of 2009 Executive Incentive Compensation Annual Plan-Chief Lending Officer *(15) |
|
10.15 |
|
10.16 |
|
10.17 |
|
10.18 |
|
10.19 |
|
10.20 |
|
10.21 |
|
10.22 |
|
10.23 |
|
10.24 |
|
10.25 |
|
10.26 |
|
21 |
Subsidiaries of the Registrant (See Item 1. Business – Subsidiary and Segment Information) |
| 23 | Consent of BKD, LLP | |
|
31(i).1 |
Certification of the Principal Executive Officer pursuant to Rule 13a-14(a) of the Exchange Act |
|
31(i).2 |
Certification of the Principal Financial Officer pursuant to Rule 13a-14(a) of the Exchange Act |
|
32 |
|
101 |
The following materials from Guaranty Federal Bancshares, Inc.’s Annual Report on Form 10-K for the year ended December 31, 2017 formatted in Extensible Business Reporting Language (XBRL): (i) Condensed Consolidated Statements of Financial Condition (unaudited), (ii) Condensed Consolidated Statements of Operations (unaudited), (iii) Condensed Consolidated Statements of Comprehensive Income (Loss) (unaudited), (iv) Condensed Consolidated Statement of Stockholders’ Equity (unaudited), (v) the Consolidated Statements of Cash Flows (unaudited), and (vi) related notes. |
* Management contract or compensatory plan or arrangement
_____________________
|
(1) |
Filed as an exhibit to the Annual Report on Form 10-K for the fiscal year ended June 30, 1998 (SEC File No. 0-23325) and incorporated herein by reference. |
|
(2) |
Filed as an exhibit to the Form 8A filed by Registrant on January 22, 1999 and incorporated herein by reference. |
|
(3) |
Filed as Exhibit 10.1 of the Registration Statement on Form S-1 filed by the Registrant on September 23, 1997 (SEC File No. 333-36141) and incorporated herein by reference. |
|
(4) |
Filed as Exhibit 10.2 of the Registration Statement on Form S-1 filed by the Registrant on September 23, 1997 (SEC File No. 333-36141) and incorporated herein by reference. |
|
(5) |
Filed as Exhibit 4 to the Form S-8 Registration Statement filed by the Registrant on March 6, 2002 (SEC File No. 333-83822) and incorporated herein by reference. |
|
(6) |
Filed as an exhibit to the Annual Report on Form 10-K for the fiscal year ended June 30, 2001 (SEC File No. 0-23325) and incorporated herein by reference. |
|
(7) |
Filed as Exhibit 10.8 to the Annual Report on Form 10-K for the transition period ended December 31, 2003 filed by the Registrant on March 30, 2004 (SEC File No. 0-23325) and incorporated herein by reference. |
|
(8) |
Filed as Appendix A to the proxy statement for the annual meeting of stockholders held on May 19, 2004 (SEC File No. 0-23325) and incorporated herein by reference. |
|
(9) |
Filed as Exhibit 10.12 to the Annual Report on Form 10-K for the fiscal year ended December 31, 2004 filed by the Registrant on March 30, 2005 and incorporated herein by reference. |
|
(10) |
Filed as Exhibit 10.13 to the Annual Report on Form 10-K for the fiscal year ended December 31, 2004 filed by the Registrant on March 30, 2005 and incorporated herein by reference. |
|
(11) |
Filed as Exhibit 10.1 to the Current Report on Form 8-K filed by the Registrant on February 3, 2009 and incorporated herein by reference. |
|
(12) |
Filed as Exhibit 10.2 to the Current Report on Form 8-K filed by the Registrant on February 3, 2009 and incorporated herein by reference. |
|
(13) |
Filed as Exhibit 10.23 to the Current Report on Form 8-K filed by the Registrant on February 9, 2009 and incorporated herein by reference. |
|
(14) |
Filed as Exhibit 10.24 to the Current Report on Form 8-K filed by the Registrant on February 9, 2009 and incorporated herein by reference. |
|
(15) |
Filed as Exhibit 10.25 to the Current Report on Form 8-K filed by the Registrant on February 9, 2009 and incorporated herein by reference. |
|
(16) |
Filed as Exhibits 10.1 through 10.3 to the Current Report on Form 8-K filed by the Registrant on February 2, 2010 and incorporated herein by reference. |
|
(17) |
Filed as Exhibit 10.4 to the Current Report on Form 8-K filed by the Registrant on April 26, 2010 and incorporated herein by reference. |
|
(18) |
Filed as Exhibit 99.1 to the Form S-8 Registration Statement filed by the Registrant on October 29, 2010 (SEC File No. 333-170205) and incorporated herein by reference. |
|
(19) |
Filed as Exhibits 10.1 through 10.5 to the Current Report on Form 8-K filed by the Registrant on February 28, 2011 and incorporated herein by reference. |
|
(20) |
Filed as Exhibits 10.1 through 10.5 to the Current Report on Form 8-K filed by the Registrant on February 2, 2012 and incorporated herein by reference. |
|
(21) |
Filed as Exhibits 10.1 through 10.5 to the Current Report on Form 8-K filed by the Registrant on February 8, 2013 and incorporated herein by reference. |
|
(22) |
Filed as Exhibits 10.1 through 10.10 to the Current Report on Form 8-K filed by the Registrant on March 26, 2014 and incorporated herein by reference. |
|
(23) |
Filed as Exhibits 10.1 through 10.5 to the Current Report on Form 8-K filed by the Registrant on March 3, 2015 and incorporated herein by reference. |
|
(24) |
Filed as Exhibit 3.1 to the Current Report on Form 8-K filed by the Registrant on November 3, 2015 and incorporated herein by reference. |
|
(25) |
Filed as Exhibit 10.1 to the Current Report on Form 8-K filed by the Registrant on May 28, 2015 and incorporated herein by reference. |
|
(26) |
Filed as Exhibits 10.1 through 10.9 to the Current Report on Form 8-K filed by the Registrant on June 3, 2016 and incorporated herein by reference. |
|
(27) |
Filed as Exhibits 10.1 and 10.2 to the Current Report on Form 8-K filed by the Registrant on June 28, 2016 and incorporated herein by reference. |
|
(28) |
Filed as Exhibits 10.1 through 10.10 to the Current Report on Form 8-K filed by the Registrant on March 29, 2017 and incorporated herein by reference. |
|
(29) |
Filed as Exhibit 2.1 to the Current Report on Form 8-K filed by the Registrant on December 1, 2017 and incorporated herein by reference. |
| (30) | Filed as Exhibit 10.4 to the Annual Report on Form 10-K for the fiscal year ended December 31, 2004 filed by the Registrant on March 30, 2005 and incorporated herein by reference. |
Item 16. Form 10-K Summary
None
SIGNATURES
Pursuant to the requirements of Section 13 or 15(d) of the Securities Exchange Act of 1934, the registrant has duly caused this report to be signed on its behalf by the undersigned, thereunto duly authorized.
|
|
|
GUARANTY FEDERAL BANCSHARES, INC. |
|
|
|
|
|
|
|
Dated: March 30, 2018 |
By: |
/s/ Shaun A. Burke |
|
|
|
|
Shaun A. Burke |
|
| President and Chief Executive Officer | |||
|
|
|
(Duly Authorized Representative) |
|
Pursuant to the requirement of the Securities Exchange Act of 1934, this report has been signed below by the following persons on behalf of the registrant and in the capacities and on the dates indicated.
| By: | /s/ Shaun A. Burke | By: | /s/ Tim Rosenbury |
| Shaun A. Burke | Tim Rosenbury | ||
| President and Chief Executive Officer and Director | Director | ||
| (Principal Executive Officer) | |||
| Date: | March 30, 2018 | Date: | March 30, 2018 |
| By: | /s/ Carter Peters | By: | /s/ James R. Batten |
| Carter Peters | James R. Batten | ||
| EVP and Chief Financial Officer | Chairman of the Board and Director | ||
| (Principal Accounting and Financial Officer) | |||
| Date: | March 30, 2018 | Date: | March 30, 2018 |
| By: | /s/ John Griesemer | By: | /s/ James L. Sivils, III |
| John Griesemer | James L. Sivils, III | ||
| Director | Director | ||
| Date: | March 30, 2018 | Date: | March 30, 2018 |
| By: | /s/ David T. Moore | By: | /s/ Greg A. Horton |
| David T. Moore | Greg A. Horton | ||
| Director | Director | ||
| Date: | March 30, 2018 | Date: | March 30, 2018 |
| By: | /s/ Kurt D. Hellweg | By: | /s/ Tony Scavuzzo |
| Kurt D. Hellweg | Tony Scavuzzo | ||
| Director | Director | ||
| Date: | March 30, 2018 | Date: | March 30, 2018 |
115