Attached files
| file | filename |
|---|---|
| EX-32.2 - EX-32.2 - Victory Capital Holdings, Inc. | a2234849zex-32_2.htm |
| EX-32.1 - EX-32.1 - Victory Capital Holdings, Inc. | a2234849zex-32_1.htm |
| EX-31.2 - EX-31.2 - Victory Capital Holdings, Inc. | a2234849zex-31_2.htm |
| EX-31.1 - EX-31.1 - Victory Capital Holdings, Inc. | a2234849zex-31_1.htm |
| EX-23.1 - EX-23.1 - Victory Capital Holdings, Inc. | a2234849zex-23_1.htm |
| EX-21.1 - EX-21.1 - Victory Capital Holdings, Inc. | a2234849zex-21_1.htm |
| EX-4.4 - EX-4.4 - Victory Capital Holdings, Inc. | a2234849zex-4_4.htm |
| EX-4.3 - EX-4.3 - Victory Capital Holdings, Inc. | a2234849zex-4_3.htm |
| EX-3.2 - EX-3.2 - Victory Capital Holdings, Inc. | a2234849zex-3_2.htm |
| EX-3.1 - EX-3.1 - Victory Capital Holdings, Inc. | a2234849zex-3_1.htm |
Use these links to rapidly review the document
TABLE OF CONTENTS
UNITED STATES
SECURITIES AND EXCHANGE COMMISSION
Washington, D.C. 20549
Form 10-K
| (Mark One) | ||
ý |
ANNUAL REPORT PURSUANT TO SECTION 13 OR 15(d) OF THE SECURITIES EXCHANGE ACT OF 1934 |
|
FOR THE FISCAL YEAR ENDED DECEMBER 31, 2017 |
||
OR |
||
o |
TRANSITION REPORT PURSUANT TO SECTION 13 OR 15(d) OF THE SECURITIES EXCHANGE ACT OF 1934 |
|
FOR THE TRANSITION PERIOD FROM TO |
||
Commission file number: 001-38388
Victory Capital Holdings, Inc.
(Exact name of registrant as specified in its charter)
| Delaware (State or other jurisdiction of incorporation or organization) |
32-0402956 (I.R.S. Employer Identification No.) |
|
4900 Tiedeman Road 4th Floor Brooklyn, OH (Address of principal executive offices) |
44144 (Zip Code) |
(216) 898-2400
(Registrant's telephone number, including area code)
Securities registered pursuant to Section 12(b) of the Act:
| Class A Common Stock, $0.01 par value | The NASDAQ Stock Market LLC | |
|---|---|---|
| (Title of each class) | (Name of each exchange on which registered) |
Securities registered pursuant to section 12(g) of the Act: None
Indicate by check mark if the registrant is a well-known seasoned issuer, as defined in Rule 405 of the Securities Act. Yes o No ý
Indicate by check mark if the registrant is not required to file reports pursuant to Section 13 or 15(d) of the Act. Yes o No ý
Indicate by check mark whether the registrant: (1) has filed all reports required to be filed by Section 13 or 15(d) of the Securities Exchange Act of 1934 during the preceding 12 months (or for such shorter period that the registrant was required to file such reports), and (2) has been subject to such filing requirements for the past 90 days. Yes o No ý
Indicate by check mark whether the registrant has submitted electronically and posted on its corporate Web site, if any, every Interactive Data File required to be submitted and posted pursuant to Rule 405 of Regulation S-T (§ 232.405 of this chapter) during the preceding 12 months (or for such shorter period that the registrant was required to submit and post such files). Yes ý No o
Indicate by check mark if disclosure of delinquent filers pursuant to Item 405 of Regulation S-K (§ 229.405 of this chapter) is not contained herein, and will not be contained, to the best of registrant's knowledge, in definitive proxy or information statements incorporated by reference in Part III of this Form 10-K or any amendment to this Form 10-K. ý
Indicate by check mark whether the registrant is a large accelerated filer, an accelerated filer, a non-accelerated filer, a smaller reporting company, or an emerging growth company. See the definitions of "large accelerated filer," "accelerated filer," "smaller reporting company," and "emerging growth company" in Rule 12b-2 of the Exchange Act.
| Large accelerated filer o | Accelerated filer o | Non-accelerated filer ý (Do not check if a smaller reporting company) |
Smaller reporting company o Emerging growth company ý |
If an emerging growth company, indicate by check mark if the registrant has elected not to use the extended transition period for complying with any new or revised financial accounting standards provided pursuant to Section 13(a) of the Exchange Act. o
Indicate by check mark whether the registrant is a shell company (as defined in Rule 12b-2 of the Exchange Act). Yes o No ý
As of June 30, 2017, the last business day of the registrant's most recently completed second quarter, there was no public market for the registrant's Class A common stock. The registrant's Class A common stock began trading on the NASDAQ Stock Market LLC on February 8, 2018.
The number of outstanding shares of the registrant's Class A common stock, par value $0.01 per share and Class B common stock, par value $0.01 per share, as of March 13, 2018 were 12,899,315 and 55,046,787, respectively.
Our design logos and the marks "Victory Capital," "Victory Capital Management," "Victory Capital Advisers," "Victory Funds," "VictoryShares," "Victory Connect," "CEMP," "CEMP Volatility Weighted Indexes," "Diversified," "Diversified Equity Management," "Expedition Investment Partners," "INCORE Capital Management," "Integrity," "Integrity Asset Management," "Munder," "Munder Capital Management," "The Munder Funds," "NewBridge," "NewBridge Asset
2
Management," "RS Funds," "RS Investments," "Sophus Capital," "Sycamore Capital" and "Trivalent Investments," are owned by us or one of our subsidiaries. All other trademarks, service marks and trade names appearing in this report are the property of their respective owners.
In this report, when we refer to:
- •
- "CEMP," we are referring to Compass Efficient Model Portfolios, LLC;
- •
- the "CEMP Acquisition," we are referring to our acquisition of the CEMP business in 2015;
- •
- "Cerebellum Capital," we are referring to Cerebellum Capital, LLC;
- •
- "Crestview," we are referring to Crestview Advisors, L.L.C.;
- •
- "Crestview GP," we are referring to Crestview Partners II GP, L.P.;
- •
- "Crestview Victory," we are referring to Crestview Victory, L.P.;
- •
- "ETFs," we are referring to exchange-traded funds;
- •
- "IPO," we are referring to the initial public offering of shares of 12,899,315 Class A common stock of Victory Capital
Holdings, Inc.;
- •
- "Munder," we are referring to our Munder Capital Management Franchise;
- •
- the "Munder Acquisition," we are referring to our acquisition of Munder Capital in 2014;
- •
- "Munder Capital," we are referring to Munder Capital Management;
- •
- "Reverence Capital," we are referring to Reverence Capital Partners;
- •
- the "RS Acquisition," we are referring to our acquisition of RS Investments in 2016;
- •
- "RS Investments," we are referring to RS Investment Management Co. LLC;
- •
- "Victory," the "Company," "we," "our" or "us," we are referring to Victory Capital Holdings, Inc. and its consolidated subsidiaries,
except where otherwise stated or where it is clear that the term means only Victory Capital Holdings, Inc. exclusive of its subsidiaries;
- •
- "VCM," we are referring to Victory Capital Management Inc., our wholly owned registered investment adviser; and
- •
- "VCA" we are referring to Victory Capital Advisers, Inc., our broker-dealer subsidiary registered with the Securities and Exchange Commission.
In this report, we rely on and refer to certain market and industry data and forecasts related thereto. We obtained this information and these statistics from sources other than us, which we have supplemented where necessary with information from publicly available sources and our own internal estimates. We use these sources and estimates and believe them to be reliable, but we cannot give any assurance that any of the projected results will be achieved.
3
Forward-Looking Statements
This report includes forward-looking statements, including in the sections entitled "Risk Factors," "Management's Discussion and Analysis of Financial Condition and Results of Operations" and "Business." These forward-looking statements include, without limitation, statements regarding our industry, business strategy, plans, goals and expectations concerning our market position, future operations, margins, profitability, future efficiencies, capital expenditures, liquidity and capital resources and other financial and operating information. When used in this discussion, the words "may," "believes," "intends," "seeks," "anticipates," "plans," "estimates," "expects," "should," "assumes," "continues," "could," "will," "future" and the negative of these or similar terms and phrases are intended to identify forward-looking statements in this report.
Forward-looking statements reflect our current expectations regarding future events, results or outcomes. These expectations may or may not be realized. Although we believe the expectations reflected in the forward-looking statements are reasonable, we can give no assurance that these expectations will prove to have been correct. Some of these expectations may be based upon assumptions, data or judgments that prove to be incorrect. Actual events, results and outcomes may differ materially from our expectations due to a variety of known and unknown risks, uncertainties and other factors. Although it is not possible to identify all of these risks and factors, they include, among others, the following:
- •
- reductions in AUM based on investment performance, client withdrawals, difficult market conditions and other factors;
- •
- the nature of our contracts and investment advisory agreements;
- •
- our ability to maintain historical returns and sustain our historical growth;
- •
- our dependence on third parties to market our strategies and provide products or services for the operation of our business;
- •
- our ability to retain key investment professionals or members of our senior management team;
- •
- our reliance on the technology systems supporting our operations;
- •
- our ability to successfully acquire and integrate new companies;
- •
- the concentration of our investments in long only small- and mid-cap equity and U.S. clients;
- •
- risks and uncertainties associated with non-U.S. investments;
- •
- our efforts to establish and develop new teams and strategies;
- •
- the ability of our investment teams to identify appropriate investment opportunities;
- •
- our ability to limit employee misconduct;
- •
- our ability to meet the guidelines set by our clients;
- •
- our exposure to potential litigation (including administrative or tax proceedings) or regulatory actions;
- •
- our ability to implement effective information and cyber security policies, procedures and capabilities;
- •
- our substantial indebtedness;
- •
- the potential impairment of our goodwill and intangible assets;
- •
- disruption to the operations of third parties whose functions are integral to our ETF platform;
4
- •
- our determination that we are not required to register as an "investment company" under the 1940 Act;
- •
- the fluctuation of our expenses;
- •
- our ability to respond to recent trends in the investment management industry;
- •
- the level of regulation on investment management firms and our ability to respond to regulatory developments;
- •
- the competitiveness of the investment management industry;
- •
- the dual class structure of our common stock;
- •
- the level of control over us retained by Crestview GP;
- •
- our status as an emerging growth company and a controlled company; and
- •
- other risks and factors listed under "Risk Factors" and elsewhere in this report.
In light of these risks, uncertainties and other factors, the forward-looking statements contained in this report might not prove to be accurate. All forward-looking statements speak only as of the date made and we undertake no obligation to update or revise publicly any forward-looking statements, whether as a result of new information, future events or otherwise.
Non-GAAP Financial Measures
This report contains "non-GAAP financial measures" that are financial measures that either exclude or include amounts that are not excluded or included in the most directly comparable measures calculated and presented in accordance with generally accepted accounting principles in the United States, or GAAP. Specifically, we make use of the non-GAAP financial measures "Adjusted EBITDA" and "Adjusted Net Income."
Adjustments we make to GAAP net income to calculate Adjusted EBITDA are:
- •
- We add back interest paid on debt net of interest income;
- •
- We add back depreciation on property and equipment;
- •
- We add back other business taxes;
- •
- We add back GAAP amortization of acquisition-related intangibles;
- •
- We add back the expense associated with stock-based compensation associated with equity issued from pools that were created in connection with
our management-led buyout with Crestview GP from KeyCorp, the Munder Acquisition and the RS Acquisition and as a result of any equity grants related to our initial public offering, or IPO;
- •
- We add back direct incremental costs of acquisitions and IPO, including expenses associated with third-party advisors, proxy solicitations of
mutual fund shareholders for transaction consents, vendor contract early termination costs, impairment of receivables recorded in connection with an acquisition and severance, retention and
transaction incentive compensation;
- •
- We add back debt issuance costs;
- •
- We add back pre-IPO governance expenses paid to Crestview and Reverence Capital (which payments terminated as of the completion of the IPO);
- •
- We adjust for earnings/losses on equity method investments; and
5
- •
- We add back annual incentive compensation paid in excess of expected levels due to acquisitions.
Adjustments we make to GAAP net income to calculate Adjusted Net Income are:
- •
- We add back other business taxes;
- •
- We add back GAAP amortization of acquisition-related intangibles;
- •
- We add back the expense associated with stock-based compensation associated with equity issued from pools that were created in connection with
our management-led buyout with Crestview GP from KeyCorp, the Munder Acquisition and the RS Acquisition and as a result of any equity grants related to the IPO;
- •
- We add back direct incremental costs of acquisitions and IPO, including expenses associated with third-party advisors, proxy solicitations of
mutual fund shareholders for transaction consents, vendor contract early termination costs, impairment of receivables recorded in connection with an acquisition and severance, retention and
transaction incentive compensation;
- •
- We add back debt issuance costs;
- •
- We add back pre-IPO governance expenses paid to Crestview and Reverence Capital (which payments terminated as of the completion of the IPO);
- •
- We add back annual incentive compensation paid in excess of expected levels due to acquisitions;
- •
- We subtract an estimate of income tax expense on the adjustments; and
- •
- We subtract the impact of re-measuring our U.S. net deferred taxes under the Tax Cuts and Jobs Act enacted on December 22, 2017.
Adjusted EBITDA and Adjusted Net Income are not recognized terms under GAAP and do not purport to be alternatives to net income (loss) attributable to us as a measure of operating performance. Non-GAAP financial measures are used to supplement GAAP results to provide a more complete understanding of the factors and trends affecting our business than GAAP results alone.
Our management uses these non-GAAP performance measures to evaluate the underlying operations of our business. Due to our acquisitive nature, there are a number of acquisition and restructuring related expenses included in GAAP measures that we believe distort the economic value of our organization and we believe that many investors use this information when assessing the financial performance of companies in the investment management industry. We have included these non-GAAP measures to provide investors with the same financial metrics used by management to assess the operating performance of our Company.
Non-GAAP measures should be considered in addition to, and not as a substitute for, financial measures prepared in accordance with GAAP. Our non-GAAP measures may differ from similar measures at other companies, even if similar terms are used to identify these measures.
6
Overview
We are an independent investment management firm operating a next generation, integrated multi-boutique model with $61.8 billion in AUM as of December 31, 2017. Our differentiated model features a scalable operating platform that provides centralized distribution, marketing and operations infrastructure to our Franchises and Solutions Platform. As of December 31, 2017, our Franchises and our Solutions Platform collectively managed a diversified set of 65 investment strategies for a wide range of institutional and retail clients.
Our Franchises are operationally integrated, but are separately branded and make investment decisions independently from one another within guidelines established by their respective investment mandates. Our integrated multi-boutique model creates a supportive environment in which our investment professionals, largely unencumbered by administrative and operational responsibilities, can focus on their pursuit of investment excellence. VCM employs all of our U.S. investment professionals across our Franchises, which are not separate legal entities.
Our Solutions Platform consists of multi-Franchise and customized solutions strategies that are primarily rules-based. We offer our Solutions Platform through a variety of vehicles, including separate accounts, mutual funds and VictoryShares which is our ETF brand. Like our Franchises, our Solutions Platform is operationally integrated and supported by our centralized distribution, marketing and operational support functions.
Our centralized key functions include distribution, marketing, trading, middle- and back-office administration, legal, compliance and finance. Our integrated model aims to "centralize, not standardize." We believe by providing our Franchises with control over their portfolio management tools, risk analytics and other investment-related functions, we can minimize disruptions to their investment process and ensure that they are able to invest in the fashion that they find most optimal.
In addition to our integrated multi-boutique business model, we believe there are four main attributes that differentiate us from other publicly traded investment management firms:
- •
- We have constructed a set of distinct investment approaches in specialized asset classes where we believe active managers are well positioned
to generate alpha over a full market cycle through security selection and portfolio construction. We believe our strategies in these specialized asset classes, which we refer to as our current focus
asset classes, will drive our future growth. These strategies have experienced less fee compression than strategies in more commoditized asset classes, and we believe demand for them typically exceeds
capacity. For the year ended December 31, 2017, we had an AUM-weighted average fee rate of 71 basis points. From 2013 through the end of 2017, our AUM-weighted average fee rate has increased
due to a shift to higher fee products as we positioned our business to focus on higher-fee asset classes. We attribute part of our ability to attract flows and drive revenue growth—in the
face of significant headwinds for active managers—to our selection of specialized asset classes and to the quality of our Franchises.
- •
- We have a track record of successfully sourcing, executing and integrating sizable acquisitions and making these acquisitions financially
attractive by extracting significant synergies. We believe our differentiated platform combining scale and boutique-like qualities is appealing to investment professionals, making us an attractive
acquirer to firms looking for a strategic partner.
- •
- We have a diversified business that offers a suite of active products and hybrid rules-based products through our proprietary ETF brand, VictoryShares, across a wide range of asset classes and distinct investment approaches, to a broad and diverse group of institutional and retail
7
- •
- We foster a culture that encourages long-term thinking through promoting meaningful employee ownership. We have a high degree of employee ownership, with over 70% of our employees beneficially owning approximately 27% of our shares as of January 29, 2018. Many of such employees have purchased their equity interests in our firm. In addition, as of December 31, 2017 our employees have collectively invested approximately $100 million in products we manage, directly aligning their investment outcomes with those of our clients.
clients. We offer our 65 investment strategies through nine Franchises and our Solutions Platform, with no Franchise accounting for more than 32% of total AUM as of December 31, 2017. Each of our Franchises employs a different investment approach, which we believe leads to diversification in investment return streams among Franchises, even when asset classes overlap. These factors also mitigate key man risk.
Since our management-led buyout with Crestview GP from KeyCorp in August 2013, we have completed three acquisitions and a strategic minority investment and grown our AUM from $17.9 billion to $61.8 billion as of December 31, 2017. We regularly evaluate potential acquisition candidates and maintain a strong network of industry participants and advisors that provide opportunities to establish potential target relationships and source transactions. Our management leads and participates in our acquisition strategy, leveraging their many years of experience actively operating our Company on a day-to-day basis towards successfully sourcing, executing and integrating sizable acquisitions. We are seeking to make acquisitions that will add high quality investment teams, that enhance our growth and financial profile, improve our diversification by asset class and investment strategy, achieve our integration and synergy expectations, expand our distribution capabilities and optimize our operating platform.
We believe, based on our acquisition experience, that there is a significant opportunity for us to grow through additional acquisitions. We believe the universe of potential acquisition targets has grown as a result of the evolution of the distribution landscape, the increasing cost of regulatory compliance, management fee compression and outflows from actively managed funds to passive products. In the United States, as of December 31, 2017, investment management firms with up to $100 billion of AUM collectively manage approximately $9.3 trillion total AUM. We intend to focus our acquisition efforts on firms with $10 billion to $75 billion in AUM, a size range in which we have successfully executed two transactions—the Munder Acquisition and the RS Acquisition—and in which investment management firms in the United States collectively manage approximately $5.8 trillion of AUM.
Through our acquisitions to date, we have added Franchises we believe can outperform the market, and where we have a strong understanding of the core business's ability to drive growth for those Franchises and our Company as a whole. These acquisitions have shifted our AUM mix from 38% in our current focus asset classes at the time of our management-led buyout in 2013 to 78% in our current focus asset classes as of December 31, 2017. We believe our deliberate repositioning of our
8
business through acquisitions has equipped us with stronger investment strategies in more compelling asset classes, providing us with a next generation investment management platform.
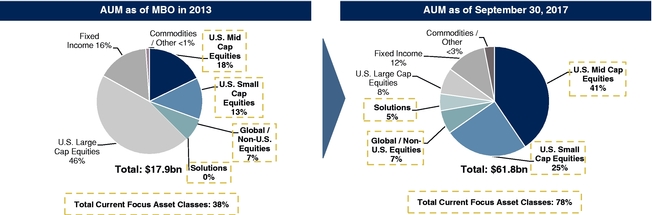
We offer our clients an array of equity and fixed income strategies that encompass a diverse spectrum of market capitalization segments, investment styles and approaches. Our current focus asset classes—which consist of U.S. small- and mid-cap equities, global/non-U.S. equities and solutions—collectively comprised 78% of our AUM as of December 31, 2017. We believe strategies in these asset classes are better positioned to attract positive net flows and maintain stable fee rates over the long term. Furthermore, we believe we are generally able to meet investor demand in these asset classes; as of December 31, 2017, we estimate we had approximately $110 billion of total excess capacity in our four- and five-star funds in these asset classes that were open to new investors (of which approximately $63 billion is in our Solutions Platform).
9
As outlined below, our business is diversified on multiple fronts, including by business, Franchise and Solutions Platform, client type and product wrapper.
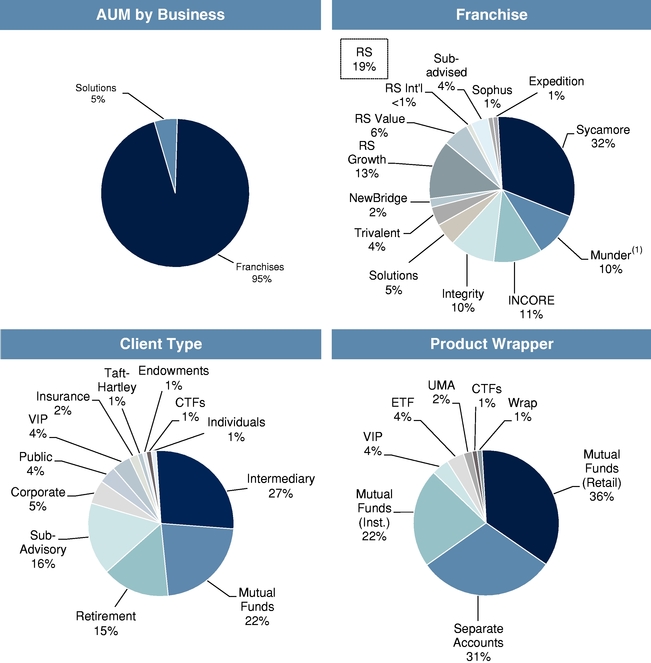
Data as of December 31, 2017.
- (1)
- Includes assets managed by Diversified, which were transferred to Munder on May 15, 2017. See "—Our Franchises—Munder Capital Management."
Within individual asset classes, our Franchises employ different investment approaches. This diversification reduces the correlation between return streams generated by multiple Franchises investing within the same asset class. For example, we have three Franchises focused on Emerging Markets within global/non-U.S. equity, each with a different investment approach. Trivalent's investment team is one of the longest industry practitioners of small cap investing and primarily focuses on quantitative analysis for stock selection. Sophus employs a front-end quantitative screen balanced to
10
first rank stocks, then further applies fundamental research to make investment decisions. Expedition pursues a fundamental bottoms-up approach, with an investment team that travels extensively for on-site due diligence. Due to the differences in investment approaches, each Franchise has a different return profile for investors in different market environments while having exposure to their desired asset classes. In this manner, we purposefully manage our Franchises to ensure that each has a distinct approach within its respective asset classes.
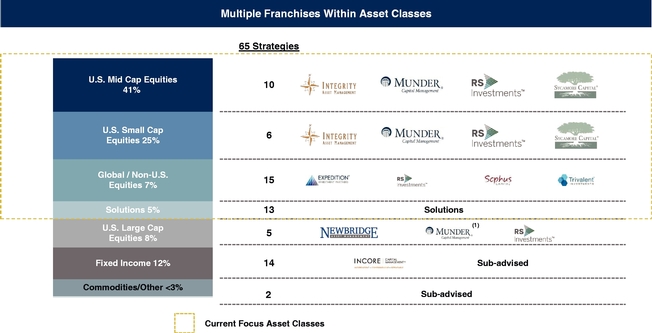
Data as of December 31, 2017.
- (1)
- Includes assets managed by Diversified, which were transferred to Munder on May 15, 2017. See "—Our Franchises—Munder Capital Management."
Our multi-channel distribution capabilities provide another degree of diversification, with approximately 58% of our AUM from institutional clients and 42% from retail clients as of December 31, 2017. We believe this client diversification has a stabilizing effect on our revenue, as institutional and retail investors have shown to exhibit different demand patterns and respond to trends in different ways.
We believe we have created a strong alignment of interests through employee ownership, our Franchise revenue share structure and employee investments in Victory products. Notably, the majority of our employee stockholders acquired their equity in connection with the management-led buyout with Crestview GP from KeyCorp, as well as in connection with the Munder Acquisition and the RS Acquisition. We believe the opportunity to own equity in a well-diversified company is attractive, both to existing employees and those who join as part of acquisitions. We principally compensate our investment professionals through a revenue share program, which we believe further incentivizes our investment professionals to focus on investment performance, while simultaneously minimizing potential distractions from the expense allocation process that would be involved in a profit-sharing program. In addition, as of December 31, 2017, our employees collectively have invested approximately $100 million in products we manage, directly aligning their investment outcomes with those of our clients. We believe the combination of these mechanisms has promoted long-term thinking, an enhanced client experience and ultimately the creation of value for our stockholders.
11
Our senior management team has an average of over 20 years of experience in the sector, each bringing significant expertise to his or her role. Our CEO and COO have been with us (and our predecessor) for 13 and 12 years, respectively, overseeing the transformation of the business from a bank subsidiary to an independent investment management firm. Our Franchises' CIOs are highly experienced, having an average of approximately 26 years of experience. Our sales leaders have had significant tenures, with an average of approximately 28 years of experience with us or a predecessor firm.
Competitive Strengths
We believe we have significant competitive strengths that position us for sustained growth over the long term.
Integrated Multi-Boutique Model Providing Investment Autonomy, Centralized Distribution, Marketing and Support Functions to Investment Franchises
We believe our integrated multi-boutique model allows us to achieve the benefits from both the scale of large managers and the focus of smaller managers. Our Franchises retain investment autonomy while benefiting from our centralized middle- and back-office functions. We have demonstrated an ability to integrate our Franchises onto our flexible infrastructure without significantly increasing incremental fixed costs, which is a key component to the scalability of our model. Our structure enables our Franchises to focus their efforts on the investment process, providing them the platform to enhance their investment performance and consequently their growth prospects. Our centralized operations allow our Franchises to customize their desired investment support functions in ways that are best suited for their investment workflow. Through our centralized distribution platform, our Franchises are able to sell their products to institutional investors, retirement plans, brokerages and wealth managers to which it is challenging for smaller managers to gain access.
Within our model, each Franchise retains its own brand and logo, which it has built over time. Unlike other models with unified branding, there is no requirement for newly acquired Franchises to adjust their product set due to pre-existing products on our platform; they are simply marketed under their own brand as they were previously. Because of this dynamic, we have the flexibility to add new Franchises either to gain greater exposure to certain asset classes or increase capacity in places where we already have exposure.
Proven Acquirer with Compelling Proposition
We believe our platform will allow us to continue to be a consolidator within the investment management industry, providing us with an opportunity to further grow and scale our business. Through several transactions, we have demonstrated an ability to successfully source, execute and integrate new Franchises.
We believe our integrated multi-boutique model is compelling for potential Franchises with entrepreneurial leaders. Under our model, Franchises retain the brands they have built as well as autonomy over their investment decisions, while simultaneously benefiting from the ability to leverage our centralized distribution, marketing and operations platform. Our model further relieves our Franchises of much of their administrative burdens and allows them instead to focus on the investment process, which we believe provides them a platform to enhance their performance. By offering a platform on which Franchises can focus on their core competencies, grow their own brand faster and participate in a revenue share program focused on investment performance rather than expense allocation, we believe we are providing an attractive proposition. Furthermore, we believe Victory equity is attractive to Franchise investment personnel, as these personnel receive the advantage of sharing in the potential upside of the entirety of our diversified investment management business.
12
Because we integrate a significant portion of each Franchise's distribution, operational and administrative functions, we have been able to extract significant expense synergies from our acquisitions, enabling us to create greater value from transactions. As of December 31, 2017, we had generated net annualized expense synergies of approximately $76 million from our three acquisitions. In our most recent acquisition of RS Investments, we successfully achieved net annual expense synergies of $52 million, which represents over 45% of RS Investments' expenses in the year prior to the acquisition. We incurred $9.9 million in total one-time expenses as of December 31, 2017 to achieve those synergies.
As a disciplined acquirer, we will seek to continue to augment our next generation investment management platform by focusing on acquisition candidates that provide capabilities that are complementary to achieve our integration and synergy expectations, expand our distribution capabilities and optimize our operating platform. Since our management-led buyout with Crestview GP, our strategy of enhancing our capabilities within our current focus asset classes has driven strong organic growth within these asset classes and for our Company overall. Furthermore, the distribution channels obtained through acquisitions have enhanced our flows.
Portfolio of Specialized Asset Classes with Potential for Outperformance
In assembling our portfolio of Franchises, we have selected investment managers offering strategies in specialized asset classes where active managers have shown an established track record of outperformance relative to benchmarks through security selection and portfolio construction. We continue to build our platform to address the needs of clients who would like exposure to asset classes that have potential for alpha generation. We find that larger industry trends of flows moving from actively managed strategies to passive ones are not as pronounced in our current focus asset classes.
Diversified Platform Across Investment Strategies, Franchises and Client Type
We have strategically built an investment platform that is diversified by investment strategy, Franchise and client type. Within each asset class, Franchises with overlapping investment mandates still contribute to our diversification by pursuing different investment philosophies and/or processes. For example, U.S. small cap equities, which accounted for approximately 25% of our AUM as of December 31, 2017, consists of four Franchises, each following a different investment strategy. We believe the diversity in investment styles reduces the correlation between the return profiles of strategies within the same asset class, and consequently provides an additional layer of diversification and AUM and revenue stability.
We believe our AUM is well diversified at the Franchise level, with no Franchise accounting for more than 32% of AUM, and the median Franchise comprising 8% of AUM, as of December 31, 2017. Furthermore, we believe our Franchises' brand independence reduces the impact of each individual Franchise's performance on clients' perceptions of the other Franchises. The distribution of AUM by Franchise, as well as succession planning, mitigates the level of key man risk typically associated with investment management businesses.
We believe our client base serves as another important diversifying element, as different client segments have shown to have distinct characteristics, including asset class and product preferences, sales and redemptions trends, and exposure to secular trends. We strive to maintain a balance between institutional and retail clients, with 58% and 42% of our AUM as of December 31, 2017 in each of these channels, respectively. We also have the capability to deliver our strategies in product wrappers designed to meet the needs and preferences of investors in each channel. These product wrappers include mutual funds with channel-specific share classes, institutional separate accounts, SMA/UMA/CTF products and ETFs. If a strategy is currently not offered in the wrapper of choice for a client, we have the infrastructure and ability to create a new product wrapper, which helps our Franchises further diversify their investor bases.
13
Attractive Financial Profile
Our revenues have shown to be recurring in nature, as they are based on the level of client assets we manage. The fees we earn have remained high relative to industry averages, as the majority of our strategies are in asset classes that are in higher demand and typically command higher fee rates. From 2013 through December 31, 2017, our AUM-weighted average fee rate increased by seven basis points, primarily due to changes in asset class, product and client mix as we repositioned our business to focus on higher-fee asset classes. We would note that with the growth of our Solutions Platform, our average fee rate is likely to decline as that business continues to grow. In addition, our fee revenue is generated from strategies with differing return profiles, thus diversifying our revenue stream.
Because we largely outsource our middle- and back-office functions, as well as technology support, we have relatively minimal capital expenditure requirements. Approximately two-thirds of our expenses are variable in nature, consisting of the incentive compensation pool for employees, sales commissions, third-party distribution costs, sub-advising and the fees we pay to certain of our vendors.
We have identified three primary net income growth drivers. Firstly, we grow our AUM organically through inflows into our strategies and the market appreciation of those strategies. Secondly, we have a proven ability to grow through synergistic acquisitions. Thirdly, we have constructed a scalable platform; as our AUM increases, we expect margins to expand.
Economic and Structural Alignment of Interests Promotes Owner-Centric Culture
Through our revenue share compensation model and broad employee ownership, we have structurally aligned our employees' interests with those of our clients and other stockholders and have created an owner-centric culture that encourages employees to act in the best interests of clients and our Company, as well as to think long term. Additionally, our employees invest in products managed by our Franchises and Solutions Platform, providing direct alignment with the interests of our clients.
We directly align the compensation paid to our investment teams with the performance of their respective Franchises by structuring formula-based revenue sharing on the products they manage. We believe that compensation based on revenue rather than profits encourages investment professionals to focus their attention on investment performance, while encouraging them to provide good client service, focus on client retention and attract new flows. We believe the formula-based, client-aligned nature of our revenue sharing fosters a culture of transparency where Franchises understand how and on what terms they are being measured to earn compensation.
We believe both the high percentage of employee ownership and employees' purchase of a significant percentage of their equity creates a collective alignment with our success. Further, we believe granting equity is attractive to potential new employees and is a retentive mechanism for current employees. As of January 29, 2018, our employees beneficially owned approximately 27% of our shares, having purchased approximately 40% of this equity. In addition to being aligned with our financial success through their equity ownership, our employees collectively have invested approximately $100 million in products we manage.
Our Growth Strategy
We have a purposeful strategy aimed to achieve continued growth and success for our Company and our Franchises. The growth we pursue is both organic and inorganic. We seek to grow organically by offering our clients strategies with strong performance track records in specialized asset classes. We intend to continue to supplement our growth through disciplined acquisitions. We primarily seek to acquire investment management firms that will add high quality investment teams, that enhance our growth and financial profile, improve our diversification by asset class and investment strategy, achieve our integration and synergy expectations, expand our distribution capabilities and optimize our
14
operating platform. We believe one of our key advantages in a competitive sales process is our ability to provide access to new distribution channels. We believe that our centralized distribution and marketing platform drives organic growth at our acquired Franchises both by opening new distribution channels to them and providing them with the support of our sales and marketing professionals while allowing them to focus on investment performance.
Organic Growth
A key driver of our growth strategy lies in enhancing the strength of each of our existing Franchises. We primarily do this by providing them with access to our centralized distribution, marketing and operations platform. Largely unencumbered by the burdens of administrative and operational tasks, our investment professionals can focus on delivering investment excellence and maintaining strong client relationships, thus driving net flows. We also expect to help our Franchises through fund and share class launches and product development. We believe we are well positioned to help our Franchises grow their product offerings and diversify their investor base, with the ability to offer their strategies in multiple product wrappers to meet clients' needs.
Our platform provides significant operating leverage to our Franchises and is a key factor in our continued success. As we continue to grow and expand, we will continue to look for ways to invest in our operations, in order to achieve greater economies of scale and provide better products to our Franchises. We continue to expand our distribution capabilities as well, demonstrated by our entry in 2016 into an exclusive distribution agreement with an independent investment management firm in Japan, as well as our launch during the first quarter of 2017 of two emerging market UCITS funds with a global financial advisory firm.
We continually look to the future, and as a result, our infrastructure investments can range from the immediate to the long term. As an example, we have acquired a minority interest in Cerebellum Capital, an investment management firm that specializes in machine learning. Cerebellum Capital's techniques help to design, execute and improve investment programs and the firm is working with a number of our Franchises to help them optimize their investment processes. We believe investments like these provide tools that can provide enhancements to our Franchises' investment processes, give our Franchises access to proprietary technology that can give them an advantage and help position our Franchises for the future.
Certain of our Franchise strategies have or may have capacity constraints, and we may choose to limit access to new or existing investors in these strategies. We have generally closed to new investors two Sycamore mutual funds with an aggregate of $16.0 billion in AUM as of December 31, 2017.
We believe there is significant growth potential in solutions products, most notably in ETFs. Through our VictoryShares brand, we offer ETFs that seek to improve the risk, return and diversification profile of client portfolios. Our approach furthers our commitment to rules-based investing and includes single-and multi-factor strategies designed to provide a variety of outcomes, including maximum diversification, dividend income, downside mitigation, minimum volatility and targeted factor exposure. VictoryShares is designed to provide investors with rules-based solutions that bridge the gap between the active and passive elements of their portfolios.
Since the CEMP Acquisition in 2015, our ETF products have grown by over 1000% to approximately $2.2 billion in AUM as of December 31, 2017. As of December 31, 2017, we ranked among the top 30 U.S. ETF issuers by net sales for the preceding 12 months as a percentage of beginning of period assets and ranked in the top quartile for annual growth for the preceding 12 months. Since December 31, 2017, we have launched three new ETFs that track volatility weighted indexes developed in partnership with NASDAQ.
15
Growth through Acquisitions
We intend to continue to accelerate growth through disciplined acquisitions. We regularly evaluate potential acquisition candidates and maintain a strong network among industry participants and advisers that provide opportunities to establish potential target relationships and source transactions. We primarily seek investment management firms that will add high quality investment teams, that enhance our growth and financial profile, improve our diversification by asset class and investment strategy, achieve our integration and synergy expectations, expand our distribution capabilities and optimize our operating platform. We have a preference for investing in asset classes where we have knowledge, provided that further acquisitions must continue to diversify our portfolio in terms of investment strategy. Our focus is not only on U.S. investment managers but also on investment styles that have an international or emerging market presence.
We believe the universe of potential acquisition targets has grown as a result of the evolution of the distribution landscape, the increasing cost of regulatory compliance, management fee compression and outflows from actively managed funds to passive products. We believe our integrated multi-boutique model makes us an attractive acquirer. Further, our centralized distribution, marketing and operations platform allows us to achieve synergies.
Our Franchises
As of December 31, 2017, seven of our nine Franchises managed over $1 billion in AUM, providing us with diversification across investment approaches, with no Franchise accounting for more than 32% of our AUM. Our Franchises are independent from one another from an investment perspective, maintain their own separate brands and logos, which they have built over time, and are led by dedicated CIOs. We customize each Franchise's interactions with our centralized platform and the formula for its respective revenue share.
Our Franchises are:
Expedition Investment Partners
Expedition Investment Partners applies a fundamental growth-oriented approach to investing in secular changes occurring in the small-capitalization companies of emerging and frontier classified countries. Expedition's team has diverse backgrounds, is fluent in multiple languages and travels extensively for on-site due diligence at opportunistic and lesser known companies in the emerging and frontier market areas. Expedition is based in New York, NY and managed $0.5 billion in AUM as of December 31, 2017. Expedition's investment team consists of eight professionals with an average industry experience of approximately 17 years.
INCORE Capital Management
INCORE Capital Management uses niche and customized fixed income strategies focusing on exploiting structural inefficiencies in the U.S. fixed income markets. INCORE conducts extensive research that includes identifying slower prepayment rates on mortgages, market inefficiencies along particular areas of the yield curve, and proprietary quantitative credit quality modeling. INCORE is based in Birmingham, MI and Brooklyn, OH and managed $6.5 billion in AUM as of December 31, 2017. INCORE's investment team consists of 14 professionals with an average industry experience of approximately 19 years.
Integrity Asset Management
Integrity Asset Management utilizes a dynamic value-oriented approach to U.S. mid- and small-capitalization companies. Integrity conducts fundamental stock research to find attractive companies
16
that have compelling discounts to the prevailing market conditions. Integrity is based in Rocky River, OH, and managed $6.3 billion in AUM as of December 31, 2017. Integrity's investment team consists of eleven professionals with an average industry experience of approximately 18 years.
Munder Capital Management
Munder Capital Management has an experienced team utilizing a "Growth-at-a-Reasonable-Price" strategy in the U.S. equity markets designed to generate consistently strong performance over a market cycle. Munder performs extensive fundamental research in order to find attractive growth companies that it expects will exceed market expectations. Of the companies with independently determined growth attributes, valuation is applied to find the most inexpensive growth companies. Munder is based in Birmingham, MI, and managed $6.4 billion in AUM (including assets formerly managed by Diversified) as of December 31, 2017. Munder's investment team consists of eight professionals with an average industry experience of approximately 25 years.
NewBridge Asset Management
NewBridge Asset Management applies a high conviction growth-oriented strategy focusing on U.S. large-capitalization companies experiencing superior long-term growth rates with strong management teams. Most of NewBridge's team has worked together since 1996 doing fundamental research on high growth companies. NewBridge usually holds between 25 and 35 securities. NewBridge is based in New York, NY and managed $1.4 billion in AUM as of December 31, 2017. NewBridge's investment team consists of six professionals with an average industry experience of approximately 23 years.
RS Investments
RS Investments is made up of three investment teams: RS Value; RS Growth; and RS International. RS Value and RS Growth apply an original and proprietary fundamental approach to investing in value and growth-oriented U.S. equity strategies. The RS Value and RS Growth teams conduct hundreds of company research meetings each year. RS International utilizes a highly disciplined quantitative approach to managing core-oriented global and international equity strategies. RS Investments is based in San Francisco, CA and managed $11.6 billion in AUM as of December 31, 2017. RS Investments' three investment teams consist of 17 professionals with an average industry experience of approximately 18 years.
Sophus Capital
Sophus Capital utilizes a disciplined quantitative process that accesses market conditions in emerging equity markets and rank orders attractive companies that are further researched from a fundamental basis. Sophus' team members travel to companies to conduct fundamental research. Sophus is based in Des Moines, IA, with offices in London, Hong Kong and Singapore, and managed $0.8 billion in AUM as of December 31, 2017. Sophus' investment team consists of ten professionals with an average industry experience of approximately 15 years.
Sycamore Capital
Sycamore Capital applies a quality value-oriented approach to U.S. mid- and small- capitalization companies. Sycamore conducts fundamental research to find companies with strong high-quality balance sheets that are undervalued versus comparable high quality companies. Sycamore is based in Cincinnati, OH and managed $20.0 billion in AUM as of December 31, 2017, which includes two mutual funds with an aggregate of $16.0 billion in AUM that we have generally closed to new investors. Sycamore's investment team consists of eight professionals with an average industry experience of approximately 16 years.
17
Trivalent Investments
Trivalent Investments utilizes a disciplined approach to stock selection across large to small companies in the international and emerging markets space. Trivalent is one of the longest standing practitioners of international small-capitalization investing in the industry. Trivalent's investment strategy is primarily a proprietary quantitative process that drives stock selection across various countries. Trivalent frequently conducts reviews of stock selection rankings within a portfolio construction and risk management context in order to isolate performance to stock selection. Trivalent is based in Boston, MA, and managed $2.6 billion in AUM as of December 31, 2017. Trivalent's investment team consists of six professionals with an average industry experience of approximately 23 years.
Non-Franchise/Subadvisory Relationships
Park Avenue
Park Avenue Institutional Advisers LLC, a unit of New York-based Guardian Life Insurance Company of America, subadvises five of our fixed income funds: the Victory Floating Rate, High Yield, Strategic Income, Tax-Exempt, and High Income Municipal Bond funds. Guardian was the controlling shareholder of RS Investments prior to the RS Acquisition. Park Avenue and VCM have entered into a written sub-advisory agreement, pursuant to which Park Avenue provides sub-advisory services with respect to those fixed income funds, subject to the general oversight of VCM and the board of trustees of the Victory Funds.
Under the sub-advisory agreement, VCM pays Park Avenue monthly fees for each sub-advised fund based on a percentage of the fees due from such fund to VCM for such month.
Park Avenue employs a fundamental value approach to investing that gauges value relative to risk, rather than simply reaching for yield. Investment decisions are based on rigorous, independent research into each investment's credit quality, structure and collateral. Park Avenue is based in New York, NY, and managed $1.0 billion in AUM for the Company as of December 31, 2017. Park Avenue's investment team consists of 25 analysts and portfolio managers with an average industry experience of approximately 26 years.
SailingStone
SailingStone Capital Partners is an independent investment advisory firm focused exclusively on providing investment solutions in the global natural resource sector. SailingStone manages concentrated, long-only natural resource equity portfolios for investors and subadvises our Victory Global Natural Resources Fund. SailingStone was formed in 2014 by members of the RS Investments global natural resources, or GNR, team, pursuant to a written agreement between RS Investments and the GNR team to spin off the GNR business into an independent specialized investment management firm. RS Investments assigned all of its rights in the agreement to VCM in the RS Acquisition. SailingStone's sub-advisory services are subject to the general oversight of VCM and the board of trustees of the Victory Funds.
Under the sub-advisory agreement, VCM pays SailingStone a monthly fee, based on the Victory Global Natural Resource Fund's assets.
In addition, through December 31, 2018, we are entitled to a declining percentage of the revenue of SailingStone from certain separate account clients that were transferred in January 2014.
SailingStone is based in San Francisco, CA, and managed $1.4 billion in AUM for the Company as of December 31, 2017. SailingStone's investment team consists of five professionals with an average industry experience of approximately 21 years.
18
Solutions Platform
Our Solutions Platform consists of multi-Franchise and customized solutions strategies that are primarily rules-based. We offer our Solutions Platform through a variety of vehicles, including separate accounts, mutual funds and VictoryShares, which is our ETF brand. Like our Franchises, our Solutions Platform is operationally integrated and supported by our centralized distribution, marketing and operational support functions. As of December 31, 2017, VictoryShares' investment management fees were generally between 30 and 45 basis points.
Our Products and Investment Performance
As of December 31, 2017, our nine Franchises and Solutions Platform offered 65 investment strategies with the majority in our current focus asset classes, consisting of U.S. small- and mid-cap equities, global/non-U.S. equities and solutions. These asset classes collectively comprised 78% of our $61.8 billion AUM as of December 31, 2017.
Product Mix
Our investment strategies are offered through open-end mutual funds, SMAs, UMAs, ETFs, CTFs and wrap separate account programs. Our product mix is expanding, as we have the ability to add product wrappers to any strategy that is offered by our Franchises.
Each individual asset class is diversified through the investment strategies of our Franchises, which each employ different investment approaches. Due to the differences in investment approaches, each of our Franchises has different return profiles for investors in different market environments while having exposure to their desired asset classes.
We have repositioned our business to focus on higher-fee asset classes, resulting in increased average fees. From 2013 through the year ended December 31, 2017, our AUM-weighted average fee rate increased by seven basis points, primarily due to changes in asset class, product and client mix. We would note that with the growth of our Solutions Platform, our average fee rate is likely to decline as that business continues to grow. Our ability to sustain this level of fee rates depends on future growth in specific asset classes and distribution channels.
We believe we are well-positioned for the phased implementation of the DOL's final regulation defining what constitutes investment advice. Among other things, the DOL's final rules restrict investment advisors from selling to ERISA plans and IRAs investment products that generate direct or indirect commissions payable by the holders thereof, unless an exemption applies. The DOL's final rule applies only to sales after June 9, 2017, and there is an exception, generally, for existing assets. In addition, certain provisions of relevant exemptions under the DOL's final rule will not be applicable until July 1, 2019. We believe we offer a wide range of products to investors covered by the DOL's final rules, and we believe the phased implementation of the DOL Rule and related exemptions will not impair our competitiveness with respect to sales from retirement investors.
Investment Performance
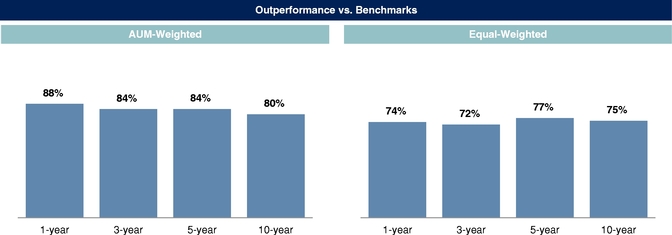
Our Franchises have established a long track record of benchmark-relative outperformance, including prior to their acquisition by us. As of December 31, 2017, 80% of our strategies by AUM had returns in excess of their respective benchmarks over a ten-year period, 84% over a five-year period and 84% over a three-year period. On an equal-weighted basis, 75% of our strategies have outperformed their benchmarks over a ten-year period, 77% over a five-year period and 72% over a three-year period. We consider both the AUM-weighted and equal-weighted metrics in evaluating our investment performance. The advantage of the AUM-weighted metric is that it reflects the investment performance of our Company as a whole, indicating whether we tend to outperform our benchmarks
19
for the assets we manage. The disadvantage is that the metric fails to capture the overall effectiveness of our individual investment strategies; it does not capture whether most of our strategies tend to outperform their respective benchmarks. Conversely, the Equal-weighted metric reflects the overall effectiveness of our individual investment strategies, but fails to capture the investment performance of our Company as a whole.
The table below sets forth our 10 largest strategies by AUM as of December 31, 2017 and their average annual total returns compared to their respective benchmark index over the one-, three-, five- and 10-year periods ended December 31, 2017. These strategies represented approximately 64% of our total AUM as of December 31, 2017.
Strategy/Benchmark Index
|
1 year | 3 years | 5 years | 10 years | |||||||||
|---|---|---|---|---|---|---|---|---|---|---|---|---|---|
Sycamore Mid Cap Value(1) |
16.74 | % | 13.12 | % | 17.41 | % | 11.86 | % | |||||
Russell Midcap Value |
13.34 | % | 9.00 | % | 14.68 | % | 9.10 | % | |||||
| | | | | | | | | | | | | | |
Excess Return |
3.40 | % | 4.12 | % | 2.73 | % | 2.76 | % | |||||
Sycamore Small Cap Value(1) |
12.92 | % | 14.24 | % | 16.71 | % | 11.90 | % | |||||
Russell 2000 Value |
7.84 | % | 9.55 | % | 13.01 | % | 8.17 | % | |||||
| | | | | | | | | | | | | | |
Excess Return |
5.08 | % | 4.69 | % | 3.70 | % | 3.73 | % | |||||
Munder Mid-Cap Core Growth |
25.73 | % | 9.66 | % | 14.68 | % | 8.55 | % | |||||
Russell Midcap |
18.52 | % | 9.58 | % | 14.96 | % | 9.11 | % | |||||
| | | | | | | | | | | | | | |
Excess Return |
7.21 | % | 0.08 | % | –0.28 | % | –0.56 | % | |||||
Integrity Small Cap Value Equity |
13.60 | % | 10.51 | % | 15.95 | % | 11.39 | % | |||||
Russell 2000 Value |
7.84 | % | 9.55 | % | 13.01 | % | 8.17 | % | |||||
| | | | | | | | | | | | | | |
Excess Return |
5.76 | % | 0.96 | % | 2.94 | % | 3.22 | % | |||||
RS Mid Cap Growth |
22.42 | % | 9.91 | % | 15.98 | % | 8.11 | % | |||||
Russell Midcap Growth |
25.27 | % | 10.30 | % | 15.30 | % | 9.10 | % | |||||
| | | | | | | | | | | | | | |
Excess Return |
–2.85 | % | –0.39 | % | 0.68 | % | –0.99 | % | |||||
RS Small Cap Growth |
38.72 | % | 12.94 | % | 19.27 | % | 11.36 | % | |||||
Russell 2000 Growth |
22.17 | % | 10.28 | % | 15.21 | % | 9.19 | % | |||||
| | | | | | | | | | | | | | |
Excess Return |
16.55 | % | 2.66 | % | 4.06 | % | 2.17 | % | |||||
Trivalent International Small-Cap Equity |
38.21 | % | 14.77 | % | 15.77 | % | 6.88 | % | |||||
S&P Developed ex-U.S. SmallCap |
32.37 | % | 13.32 | % | 12.12 | % | 5.22 | % | |||||
| | | | | | | | | | | | | | |
Excess Return |
5.84 | % | 1.45 | % | 3.65 | % | 1.66 | % | |||||
RS Large Cap Value |
19.31 | % | 8.87 | % | 15.48 | % | N/A | ||||||
Russell 1000 Value |
13.66 | % | 8.65 | % | 14.04 | % | 7.10 | % | |||||
| | | | | | | | | | | | | | |
Excess Return |
5.65 | % | 0.22 | % | 1.44 | % | N/A | ||||||
RS Small Cap Value |
15.77 | % | 9.46 | % | 13.05 | % | 9.45 | % | |||||
Russell 2000 Value |
7.84 | % | 9.55 | % | 13.01 | % | 8.17 | % | |||||
| | | | | | | | | | | | | | |
Excess Return |
7.93 | % | –0.09 | % | 0.04 | % | 1.28 | % | |||||
Integrity Small/Mid Cap Value Equity |
19.62 | % | 11.13 | % | 15.24 | % | 10.22 | % | |||||
Russell 2500 Value |
10.36 | % | 9.30 | % | 13.27 | % | 8.82 | % | |||||
| | | | | | | | | | | | | | |
Excess Return |
9.26 | % | 1.83 | % | 1.97 | % | 1.40 | % | |||||
- (1)
- Includes two mutual funds with an aggregate of $16.0 billion in AUM as of December 31, 2017 that we have generally closed to new investors.
20
For each period shown, performance statistics include only strategies that existed during that entire period (including prior to our acquisition of the strategies).
Our products have consistently won awards for performance, with four consecutive years of ranking in Barron's Top Fund Families ratings, coming in at #10, #21, #25 and #15 overall for 2017, 2016, 2015 and 2014, respectively.
In addition, a significant percentage of our mutual fund assets have high Morningstar ratings. As of December 31, 2017, 24 Victory Funds and ETFs had four or five star overall ratings. On an AUM-weighted basis, 66% of our fund AUM had an overall rating of four or five stars by Morningstar. Over a five-year and three-year basis, 68% and 56% of our fund AUM achieved four or five star ratings, respectively.
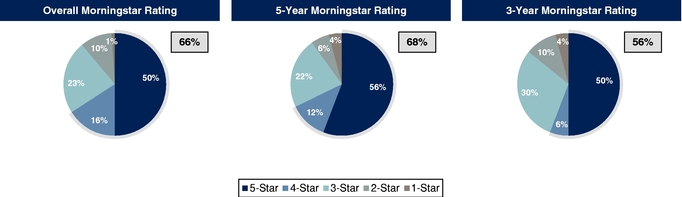
Morningstar data as of December 31, 2017.
Integrated Distribution, Marketing and Operations
The centralization of our distribution, marketing and operational functions is a key component in our model, allowing our Franchises to focus on their core competencies of security selection and portfolio construction. In addition, we believe it provides our Franchises with the benefits of operating at scale, providing them with access to larger clients as well as a more streamlined cost structure. As of December 31, 2017, we had 59 employees in management and support functions, 96 sales and marketing professionals and 112 investment professionals.
Our centralized distribution and marketing functions lead the sales effort for both our institutional and retail channels. Our sales teams are staffed with accomplished professionals that are given specific training on how to position each of our strategies. Partially due to our background in the institutional
21
market, our teams have focused on developing relationships with institutional consultants and retail intermediaries. These relationships can enhance our platform's overall reach and allow our Franchises and Solutions Platform to access larger clients that typically would not be willing to spend time with smaller investment management firms.
To ensure high levels of client service, our sales teams liaise regularly with product specialists at our Franchises. The specialists are tasked with responding to institutional client and retail inquiries on product performance and also educating prospective investors and retail partners in coordination with the relevant internal sales team members. Our distribution and marketing professionals collaborate closely with our Franchises' product specialists in order to attract new clients while also servicing and generating additional sales from existing clients.
Institutional Sales: Our institutional sales team attracts and builds relationships with institutional clients, the largest institutional consultants and mutual fund complexes and other organizations seeking sub-advisers. Our institutional clientele includes corporations, public funds, non-profit organizations, Taft-Hartley plans, sub-advisory clients, international clients and insurance companies. Our institutional sales and client-service professionals manage existing client relationships, serve consultants and prospects and/or focus on specific segments. They have extensive experience and a comprehensive understanding of our investment activities. On average, each of our client-facing institutional sales professionals has over 20 years of industry tenure.
Retail Sales: Our retail sales team is split among regional external wholesalers, retirement specialists and national account specialists, all of whom are supported by an internal calling desk. In the retail channel, we focus on gathering assets through intermediaries, such as banks, broker-dealers, wirehouses, retirement platforms and RIA networks. As of December 31, 2017, 65% of our retail AUM was through intermediaries, while 35% was through retirement platforms. We offer mutual funds and separately managed wrap and unified managed accounts on intermediary and retirement platforms. We have agreements with many of the largest platforms in our retail channel, which has provided an opportunity to place our retail products on those platforms. Further, to enhance our presence on large distribution platforms, we have focused our efforts on servicing intermediary home offices and research departments. These efforts have led to strong growth in platform penetration, as measured by investment products on approved and recommended lists, as well as our inclusion in model portfolios. This penetration provides the opportunity for us to sell more products through distribution platforms. As of December 31, 2017, we had at least two and as many as 13 products on the research recommended/model portfolios of the top ten U.S. intermediary platforms by AUM. These top intermediary platforms included Morgan Stanley, Wells Fargo, Merrill Lynch and Raymond James. We also have agreements with all of the top 20 retirement platforms by AUM, including Fidelity, Vanguard, Voya and Merrill Lynch. As of December 31, 2017, we had at least one and as many as eight approved products on the recommended list of each of those top 20 retirement platforms that have recommended lists.
Marketing: Our distribution efforts are supplemented by our marketing function, which is primarily responsible for enhancing the visibility and quality of our portfolio of brands. They are specifically tasked with managing corporate, Franchise and Solutions Platform branding efforts, database management, the development of marketing materials, website design and the publishing of white papers. They are also a key component in our responses to requests for proposals sent over by prospective clients. The success of their efforts can be seen by our eVestment #1 ranking for Institutional Brand Awareness among asset managers with between $25 billion and $50 billion in AUM in 2015 and our #4 ranking among asset managers with between $50 billion and $100 billion in AUM in both 2016 and 2017.
Operations: Our centralized operations functions provide our Franchises and Solutions Platform with the support they need so that they can focus on their investment processes. Our centralized
22
functions include distribution, marketing, trading platforms, risk and compliance, middle- and back-office support, finance, human resources, accounting and legal. Although our operations are centralized, we do allow our Franchises a degree of customization with respect to their desired investment support functions, which we believe helps them maintain their individualized investment processes and minimize undue disruptions.
We outsource certain middle- and back-office activities, such as trade settlement, portfolio analytics, custodian reconciliation, portfolio accounting, corporate action processing, performance calculation and client reporting, to scaled, recognized service providers, who provide their services to us on a variable-cost basis. Systems and processes are customized as necessary to support our investment processes and operations. We maintain relationships with multiple vendors for the majority of our outsourced functions, which we believe mitigates vendor-specific risk. We also have information security, business continuity and data privacy programs in place to help mitigate risk.
Outsourcing these functions enables us to grow our AUM, both organically and through acquisitions, without the incremental capital expenditures and working capital that would typically be needed. Under our direction and oversight, our outsourced model enhances our ability to integrate our acquisitions, as we are experienced in working with our vendors to efficiently bring additional Franchises onto our platform in a cost-efficient manner.
We believe both the scalability of our business and our cost structure, in which approximately two-thirds of our expenses are variable, should drive increasing margins and facilitate free cash flow conversion. Additionally, we believe having a majority of our expenses tied to AUM and the number of client accounts provides downside margin protection should there be sustained net outflows or adverse market conditions.
Competition
We compete in various markets, asset classes and structured vehicles. We sell our investment products in the traditional institutional segments and intermediary and retirement distribution channels, which include mutual funds, wrap accounts, UMAs and ETFs. We face competition in attracting and retaining assets from other investment management firms. Additionally, we compete with other acquirers of investment management firms, including independent, fully integrated investment management firms and multi-boutique businesses, insurance companies, banks, private equity firms and other financial institutions.
We compete with other managers offering similar strategies. Some of these organizations have greater financial resources and capabilities than we are able to offer and have had strong performance track records. We compete with other investment management firms for client assets based on the following primary factors:
- •
- our investment performance track record of delivering alpha;
- •
- the specialized nature of our investment strategies;
- •
- fees charged;
- •
- access to distribution channels;
- •
- client service; and
- •
- our employees' alignment of interests with investors.
We compete with other potential acquirers of investment management firms primarily on the basis of the following factors:
- •
- the strength of our distribution relationships;
23
- •
- the value we add through centralized distribution, marketing and operations platforms;
- •
- the investment autonomy Franchises retain post acquisition;
- •
- the tenure and continuity of our management and investment professionals; and
- •
- the value that can be delivered to the seller through realization of synergies created by the combination of the businesses.
Our ability to continue to compete effectively will also depend upon our ability to retain our current investment professionals and employees and to attract highly qualified new investment professionals and employees. For additional information concerning the competitive risks that we face, see "Risk Factors—Risks Related to Our Industry—The investment management industry is intensely competitive."
Employees
As of December 31, 2017, we had approximately 267 employees. We are not subject to any collective bargaining agreement and have never been subject to a work stoppage. We believe we have maintained satisfactory relationships with our employees.
Business Organization
Victory Capital Holdings, Inc. was formed in 2013 for the purpose of acquiring VCM and VCA from KeyCorp. VCM is a registered investment adviser managing assets through open-end mutual funds, separately managed accounts, unified management accounts, ETFs, collective trust funds, wrap separate account programs and UCITs. VCM also provides mutual fund administrative services for the Victory Portfolios, Victory Variable Insurance Funds, Victory Institutional Funds and the mutual fund series of Victory Portfolios II, a family of open-end mutual funds, collectively, the Victory Funds. VCM additionally employs all of our U.S. investment professionals across our Franchises and Solutions Platform, which are not separate legal entities. VCA is registered with the SEC as an introducing broker-dealer and serves as distributor and underwriter for the Victory Funds.
Initial Public Offering and Debt Repayment
On February 12, 2018, we issued 11,700,000 shares of Class A common stock in the IPO at a price of $13.00 per share. On March 13, 2018, the Company issued an additional 1,110,860 shares of Class A common stock pursuant to the underwriters' exercise of their option. The net proceeds totaled $156.5 million: $143.0 million received at the closing of the IPO and $13.5 million received at the subsequent closing of the underwriters' exercise of their option, after deducting in each case underwriting discounts.
Net proceeds received from the IPO and the Credit Agreement of $143.0 million and $355.9 million, respectively, were used concurrent with the closing of the IPO, together with $0.8 million of cash on hand, to repay the $499.7 million of outstanding term loans under the 2014 Credit Agreement. On February 21, 2018, the Company repaid $10.0 million of outstanding term loans under the Credit Agreement, and on March 19, 2018, the Company used the net proceeds from the underwriters' exercise of their option and cash on hand to repay an additional $27.0 million of the outstanding term loans under the Credit Agreement. See Note 20 of our audited financial statements included elsewhere in this report.
Regulatory Environment and Compliance
Our business is subject to extensive regulation in the United States at the federal level and, to a lesser extent, the state level, as well as regulation by self-regulatory organizations and outside the
24
United States. Under these laws and regulations, agencies that regulate investment advisers have broad administrative powers, including the power to limit, restrict or prohibit an investment adviser from carrying on its business in the event that it fails to comply with such laws and regulations. Possible sanctions that may be imposed include the suspension of individual employees, limitations on engaging in certain lines of business for specified periods of time, revocation of investment adviser and other registrations, censures and fines.
SEC Investment Adviser and Investment Company Registration/Regulation
VCM is registered with the SEC as an investment adviser under the Advisers Act, and the Victory Funds, VictoryShares and several of the investment companies we sub-advise are registered under the 1940 Act. The Advisers Act and the 1940 Act, together with the SEC's regulations and interpretations thereunder, impose substantive and material restrictions and requirements on the operations of advisers and registered funds. The SEC is authorized to institute proceedings and impose sanctions for violations of the Advisers Act and the 1940 Act, ranging from fines and censures to termination of an adviser's registration. As an investment adviser, we have a fiduciary duty to our clients. The SEC has interpreted that duty to impose standards, requirements and limitations on, among other things: trading for proprietary, personal and client accounts; allocations of investment opportunities among clients; use of soft dollars; execution of transactions; and recommendations to clients. We manage accounts for all of our clients on a discretionary basis, with authority to buy and sell securities for each portfolio, select broker-dealers to execute trades and negotiate brokerage commission rates. In connection with certain of these transactions, we receive soft dollar credits from broker-dealers that have the effect of reducing certain of our expenses. All of our soft dollar arrangements are intended to be within the safe harbor provided by Section 28(e) of the Exchange Act. If our ability to use soft dollars were reduced or eliminated as a result of the implementation of statutory amendments or new regulations, our operating expenses would increase.
As a registered adviser, VCM is subject to many additional requirements that cover, among other things: disclosure of information about our business to clients; maintenance of written policies and procedures; maintenance of extensive books and records; restrictions on the types of fees we may charge; custody of client assets; client privacy; advertising; and solicitation of clients. The SEC has authority to inspect any investment adviser and typically inspects a registered adviser periodically to determine whether the adviser is conducting its activities (i) in accordance with applicable laws, (ii) in a manner that is consistent with disclosures made to clients and (iii) with adequate systems and procedures to ensure compliance.
For the year ended December 31, 2017, 83% of our revenues were derived from our services to investment companies registered under the 1940 Act—i.e., mutual funds and ETFs. The 1940 Act imposes significant requirements and limitations on a registered fund, including with respect to its capital structure, investments and transactions. While we exercise broad discretion over the day-to-day management of the business and affairs of the Victory Funds, VictoryShares and the investment portfolios of the Victory Funds and VictoryShares and the funds we sub-advise, our own operations are subject to oversight and management by each fund's board of directors. Under the 1940 Act, a majority of the directors of our registered funds must not be "interested persons" with respect to us (sometimes referred to as the "independent director" requirement) in order to rely on certain exemptive rules under the 1940 Act relevant to the operation of registered funds. The responsibilities of the fund's board include, among other things: approving our investment advisory agreement with the fund (or, for sub-advisory arrangements, our sub-advisory agreement with the fund's investment adviser); approving other service providers; determining the method of valuing assets; and monitoring transactions involving affiliates. Our investment advisory agreements with these funds may be terminated by the funds on not more than 60 days' notice and are subject to annual renewal by the fund's board after the initial term of one to two years. The 1940 Act also imposes on the investment adviser or sub-adviser to a registered
25
fund a fiduciary duty with respect to the receipt of the adviser's investment management fees or the sub-adviser's sub-advisory fees. That fiduciary duty may be enforced by the SEC, by administrative action or by litigation by investors in the fund pursuant to a private right of action.
As required by the Advisers Act, our investment advisory agreements may not be assigned without the client's consent. Under the 1940 Act, investment advisory agreements with registered funds (such as the mutual funds and ETFs we manage) terminate automatically upon assignment. The term "assignment" is broadly defined and includes direct assignments as well as assignments that may be deemed to occur upon the transfer, directly or indirectly, of a "controlling block" of our outstanding voting securities. See "Risk Factors—Risks Related to Our Business—An assignment could result in termination of our investment advisory agreements to manage SEC-registered funds and could trigger consent requirements in our other investment advisory agreements."
SEC Broker-Dealer Registration/FINRA Regulation
VCA is subject to regulation by the SEC, FINRA and various states. In addition, certain of our employees are registered with FINRA and such states and subject to SEC, state and FINRA regulation. The failure of these companies and/or employees to comply with relevant regulation could have a material adverse effect on our business.
ERISA-Related Regulation
We are a fiduciary under ERISA with respect to assets that we manage for benefit plan clients subject to ERISA. ERISA, the regulations promulgated thereunder and applicable provisions of the Internal Revenue Code impose certain duties on persons who are fiduciaries under ERISA, prohibit certain transactions involving ERISA plan clients and impose monetary penalties for violations of these prohibitions. The duties under ERISA require, among other obligations, that fiduciaries perform their duties solely in the interests of ERISA plan participants and beneficiaries.
The DOL issued new regulations on April 6, 2016 with an original applicable date for most provisions of April 10, 2017. On April 4, 2017, the DOL released its final rule delaying the original applicable date for 60 days until June 9, 2017. In a memorandum dated February 3, 2017, the President directed the DOL to conduct an examination of the final rule to determine whether it may adversely affect the ability of Americans to gain access to retirement information and financial advice. The DOL is engaging in a careful analysis of the issues raised in the President's memorandum and it is possible, based on the results of the examination, that additional changes may be proposed. The final fiduciary rule substantially expands the definition of "investment advice" and thereby broadens the circumstances under which product distributors could be considered fiduciaries under ERISA or the Internal Revenue Code. Under the final rule, certain communications with plans, plan participants and IRA holders, including the marketing of products, and marketing of investment management or advisory services, could be deemed fiduciary investment advice, causing increased exposure to fiduciary liability if the distributor does not recommend what is in the client's best interests. The DOL also issued amendments to certain of its prohibited transaction exemptions, and issued a new exemption that applies more onerous disclosure and contact requirements to, and increases fiduciary requirements and fiduciary liability exposure in respect of, transactions involving ERISA plans, plan participants and IRAs. While the DOL's definition of what constitutes "investment advice" took effect on June 9, 2017, there is a transition period with respect to the amendments to the existing exemptions and the new exemption until July 1, 2019. During the transition period for these exemptions, financial institutions and advisers must comply with the "impartial conduct standards," including providing advice that is in the "best interest" of the ERISA plan or IRAs. Full compliance with the conditions of the exemptions will be required from and on July 1, 2019. We cannot predict what other proposals may be made, what legislation may be introduced or enacted, or what impact any such legislation may have on our business, results of operations and financial condition.
26
CFTC Regulation
VCM is registered with the CFTC as a commodity pool operator and is a member of the NFA, a self-regulatory organization for the U.S. derivatives industry. In addition, certain of our employees are registered with the CFTC and members of NFA. Registration with the CFTC and NFA membership subject VCM to regulation by the CFTC and the NFA including, but not limited to, reporting, recordkeeping, disclosure, self-examination and training requirements. Registration with the CFTC also subjects VCM to periodic on-site audits. Each of the CFTC and NFA is authorized to institute proceedings and impose sanctions for violations of applicable regulations.
Non-U.S. Regulation
In addition to the extensive regulation to which we are subject in the United States, we are subject to regulation internationally. Our business is also subject to the rules and regulations of the countries in which we market our funds or services and conduct investment activities.
In Singapore, we are subject to, among others, the Securities and Futures Act, or the SFA, the Financial Advisers Act, or the FAA, and the subsidiary legislation promulgated pursuant to these Acts, which are administered by the Monetary Authority of Singapore, or the MAS. We and our employees conducting regulated activities specified in the SFA and/or the FAA are required to be licensed with the MAS. Failure to comply with applicable laws, regulations, codes, directives, notices and guidelines issued by the MAS may result in penalties including fines, censures and the suspension or revocation of licenses granted by the MAS.
In Hong Kong, we are subject to the Securities and Futures Ordinance, or the SFO, and its subsidiary legislation, which governs the securities and futures markets and regulates, among others, offers of investments to the public and provides for the licensing of dealing in securities and investment management activities and intermediaries. This legislation is administered by the Securities and Futures Commission, or the SFC. The SFC is also empowered under the SFO to establish standards for compliance as well as codes and guidelines. We and our employees conducting any of the regulated activities specified in the SFO are required to be licensed with the SFC, and are subject to the rules, codes and guidelines issued by the SFC from time to time. Failure to comply with the applicable laws, regulations, codes and guidelines could result in various sanctions being imposed, including fines, reprimands and the suspension or revocation of the licenses granted by the SFC.
Compliance
Our legal and compliance functions are integrated into one team of 10 professionals as of December 31, 2017. This group is responsible for all legal and regulatory compliance matters, as well as for monitoring adherence to client investment guidelines. Our legal and compliance teams work through a well-established reporting and communication structure to ensure we have a consistent and holistic program for legal and regulatory compliance. Senior management is also involved at various levels in all of these functions. We cannot assure that our legal and compliance functions will be effective to prevent all losses. See "Risk Factors—Risks Relating to Our Business—If our techniques for managing risk are ineffective, we may be exposed to material unanticipated losses."
For more information about our regulatory environment, see "Risk Factors—Risks Relating to Our Industry—As an investment management firm, we are subject to extensive regulation" and "Risk Factors—Risks Relating to Our Industry—The regulatory environment in which we operate is subject to continual change and regulatory developments designed to increase oversight may materially adversely affect our business."
27
The risks described below are not the only ones facing us. The occurrence of any of the following risks or additional risks and uncertainties not presently known to us or that we currently believe to be immaterial could materially and adversely affect our business, financial condition or results of operations. In such case the trading price of our Class A common stock could decline. This report also contains forward-looking statements and estimates that involve risks and uncertainties. Our actual results could differ materially from those anticipated in the forward-looking statements as a result of specific factors, including the risks and uncertainties described below.
Risks Relating to Our Business
We earn substantially all of our revenues based on AUM, and any reduction in AUM would reduce our revenues and profitability. AUM fluctuates based on many factors, including investment performance, client withdrawals and difficult market conditions.
We earn substantially all of our revenues from asset-based fees from investment management products and services to individuals and institutions. Therefore, if our AUM declines, our fee revenue will decline, which will reduce our profitability as certain of our expenses are fixed. There are several reasons that AUM could decline:
- •
- The performance of our investment strategies is critical to our business, and any real or perceived negative absolute or relative performance
could negatively impact the maintenance and growth of AUM. Net flows related to our strategies can be affected by investment performance relative to other competing strategies or to established
benchmarks. Our investment strategies are rated, ranked, recommended or assessed by independent third parties, distribution partners, and industry periodicals and services. These assessments may
influence the investment decisions of our clients. If the performance or assessment of our strategies is seen as underperforming relative to peers, it could result in an increase in the withdrawal of
assets by existing clients and the inability to attract additional commitments from existing and new clients. In addition, certain of our strategies have or may have capacity constraints, as there is
a limit to the number of securities available for the strategy to operate effectively. In those instances, we may choose to limit access to those strategies to new or existing investors, which we have
recently done for two mutual funds managed by Sycamore Capital, or Sycamore, which had an aggregate of $16.0 billion in AUM as of December 31, 2017.
- •
- General domestic and global economic and political conditions can influence AUM. Changes in interest rates, the availability and cost of
credit, inflation rates, economic uncertainty, changes in laws, trade barriers, commodity prices, currency exchange rates and controls and national and international political circumstances (including
wars, terrorist acts and security operations) and other conditions may impact the equity and credit markets, which may influence our AUM. If the security markets decline or experience volatility, our
AUM and our revenues could be negatively impacted. In addition, diminishing investor confidence in the markets and/or adverse market conditions could result in a decrease in investor risk tolerance.
Such a decrease could prompt investors to reduce their rate of commitment or to fully withdraw from markets, which could lower our overall AUM.
- •
- Capital and credit markets can experience substantial volatility. The significant volatility in the markets in the recent past has highlighted the interconnection of the global markets and demonstrated how the deteriorating financial condition of one institution may materially adversely impact the performance of other institutions. In the event of extreme circumstances, including economic, political or business crises, such as a widespread systemic failure in the global financial system or failures of firms that have significant obligations as counterparties, we may suffer significant declines in AUM and severe liquidity or valuation issues.
28
- •
- Changes in interest rates can have adverse effects on our AUM. Increases in interest rates from their historically low present levels may adversely affect the net asset values of our AUM. Furthermore, increases in interest rates may result in reduced prices in equity markets. Conversely, decreases in interest rates could lead to outflows in fixed income assets that we manage as investors seek higher yields.
Any of these factors could reduce our AUM and revenues and, if our revenues decline without a commensurate reduction in our expenses, would lead to a reduction in our net income.
We derive substantially all of our revenues from contracts and relationships that may be terminated upon short or no notice.
We derive substantially all of our revenues from investment advisory and sub-advisory agreements, all of which are terminable by clients upon short notice or no notice.
Our investment advisory agreements with registered funds, which are funds registered under the Investment Company Act of 1940, as amended, or the 1940 Act, including mutual funds and ETFs, are generally terminable by the funds' boards or a vote of a majority of the funds' outstanding voting securities on not more than 60 days' written notice, as required by law. After an initial term (not to exceed two years), each registered fund's investment advisory agreement must be approved and renewed annually by that fund's board, including by its independent members. In addition, all of our separate account clients and certain of the mutual funds that we sub-advise have the ability to re-allocate all or any portion of the assets that we manage away from us at any time with little or no notice. When a sub-adviser terminates its sub-advisory agreement to manage a fund that we advise there is a risk that investors in the fund could redeem their assets in the fund, which would cause our AUM to decrease.
These investment advisory agreements and client relationships may be terminated or not renewed for any number of reasons. The decrease in revenues that could result from the termination of a material client relationship or group of client relationships could have a material adverse effect on our business.
Investors in certain funds that we advise can redeem their assets from those funds at any time without prior notice.
Investors in the mutual funds and certain other pooled investment vehicles that we advise or sub-advise may redeem their assets from those funds at any time on fairly limited or no prior notice, thereby reducing our AUM. These investors may redeem for any number of reasons, including general financial market conditions, the absolute or relative investment performance we have achieved, or their own financial conditions and requirements. In a declining stock market, the pace of redemptions could accelerate. Poor investment performance relative to other funds tends to result in decreased client commitments and increased redemptions. For the year ended December 31, 2017, we generated approximately 86% of our revenues from mutual funds and other pooled investment vehicles that we advise (including our proprietary mutual funds, or the Victory Funds, VictoryShares, and other entities for which we are adviser or sub-adviser). The redemption of assets from those funds could adversely affect our revenues and have a material adverse effect on our earnings.
29
If our strategies perform poorly, clients could redeem their assets and we could suffer a decline in our AUM, which would reduce our earnings.
The performance of our strategies is critical in retaining existing client assets as well as attracting new client assets. If our strategies perform poorly for any reason, our earnings could decline because:
- •
- our existing clients may redeem their assets from our strategies or terminate their relationships with us;
- •
- the Morningstar and Lipper ratings and rankings of mutual funds and ETFs we manage may decline, which may adversely affect the ability of those
funds to attract new or retain existing assets; and
- •
- third-party financial intermediaries, advisors or consultants may remove our investment products from recommended lists due to poor performance or for other reasons, which may lead our existing clients to redeem their assets from our strategies or reduce asset inflows from these third parties or their clients.
Our strategies can perform poorly for a number of reasons, including: general market conditions; investor sentiment about market and economic conditions; investment styles and philosophies; investment decisions; the performance of the companies in which our strategies invest and the currencies in which those investment are made; the fees we charge; the liquidity of securities or instruments in which our strategies invest; and our inability to identify sufficient appropriate investment opportunities for existing and new client assets on a timely basis. In addition, while we seek to deliver long-term value to our clients, volatility may lead to under-performance in the short term, which could adversely affect our results of operations.
In addition, when our strategies experience strong results relative to the market, clients' allocations to our strategies typically increase relative to their other investments and we sometimes experience withdrawals as our clients rebalance their investments to fit their asset allocation preferences despite our strong results.
While clients do not have legal recourse against us solely on the basis of poor investment results, if our strategies perform poorly, we are more likely to become subject to litigation brought by dissatisfied clients. In addition, to the extent clients are successful in claiming that their losses resulted from fraud, negligence, willful misconduct, breach of contract or other similar misconduct, these clients may have remedies against us, the mutual funds and other pooled investment vehicles we advise and/or our investment professionals under various U.S. and non-U.S. laws.
The historical returns of our existing strategies may not be indicative of their future results or of the strategies we may develop in the future.
The historical returns of our strategies and the ratings and rankings we or the mutual funds and ETFs that we advise have received in the past should not be considered indicative of the future results of these strategies or of any other strategies that we may develop in the future. The investment performance we achieve for our clients varies over time and the variance can be wide. The ratings and rankings we or the mutual funds and ETFs we advise have received are typically revised monthly. Our strategies' returns have benefited during some periods from investment opportunities and positive economic and market conditions. In other periods, general economic and market conditions have negatively affected investment opportunities and our strategies' returns. These negative conditions may occur again, and in the future we may not be able to identify and invest in profitable investment opportunities within our current or future strategies.
New strategies that we launch or acquire in the future may present new and different investment, regulatory, operational, distribution and other risks than those presented by our current strategies. New
30
strategies may invest in instruments with which we have no or limited experience, create portfolios that present new or different risks or have higher performance expectations that are more difficult to meet. Any real or perceived problems with future strategies or vehicles could cause a disproportionate negative impact on our business and reputation.
We depend on third parties to market our strategies.
Our ability to attract additional assets to manage is highly dependent on our access to third-party intermediaries. We gain access to investors in the Victory Funds and VictoryShares primarily through consultants, 401(k) platforms, broker-dealers, financial advisors and mutual fund platforms through which shares of the funds are sold. We have relationships with certain third-party intermediaries through which we access clients in multiple distribution channels. Our 10 largest intermediary relationships across multiple distribution channels represented approximately 34% of our total AUM as of December 31, 2017.
We compensate most of the intermediaries through which we gain access to investors in the Victory Funds and VictoryShares by paying fees, most of which are a percentage of assets invested in the Victory Funds and VictoryShares through that intermediary and with respect to which that intermediary provides stockholder and administrative services. The allocation of such fees between us and the Victory Funds and VictoryShares is determined by the board of the Victory Funds and VictoryShares, based on information and a recommendation from us, with the intent of allocating to us all costs attributable to marketing and distribution of (i) shares of the Victory Funds not otherwise covered by distribution fees paid pursuant to a distribution and service plan adopted in accordance with Rule 12b-1 under the 1940 Act and (ii) VictoryShares.
In the future, our expenses in connection with those intermediary relationships could increase if the portion of those fees determined to be in connection with marketing and distribution, or otherwise allocated to us, increased. Clients of these intermediaries may not continue to be accessible to us on terms we consider commercially reasonable, or at all. The absence of such access could have a material adverse effect on our results of operations.
We access institutional clients primarily through consultants. Our institutional business is dependent upon referrals from consultants. Many of these consultants review and evaluate our products and our firm from time to time. As of December 31, 2017, 37% of our institutional separate accounts AUM was acquired through consultants. Poor reviews or evaluations of either a particular strategy or us as an investment management firm may result in client withdrawals or may impair our ability to attract new assets through these consultants.
The loss of key investment professionals or members of our senior management team could have a material adverse effect on our business.
We depend on the skills and expertise of our portfolio managers and other investment professionals and our success depends on our ability to retain the key members of our investment teams, who possess substantial experience in investing and have been primarily responsible for the historical investment performance we have achieved.
Because of the tenure and stability of our portfolio managers, our clients may attribute the investment performance we have achieved to these individuals. The departure of a portfolio manager could cause clients to withdraw assets from the strategy, which would reduce our AUM, investment management fees and our net income. The departure of a portfolio manager also could cause consultants and intermediaries to stop recommending a strategy, clients to refrain from allocating additional assets to the strategy or delay such additional assets until a sufficient new track record has been established, and could also cause the departure of other portfolio managers or investment professionals. We have instituted succession planning at our Franchises in an attempt to minimize the
31
disruption resulting from these potential changes, but we cannot predict whether such efforts will be successful (for example, we recently made the strategic decision to wind down our Diversified Franchise due to the retirement of both its CIOs).
We also rely upon the contributions of our senior management team to establish and implement our business strategy and to manage the future growth of our business. The loss of any of the senior management team could limit our ability to successfully execute our business strategy or adversely affect our ability to retain existing and attract new client assets and related revenues.
Any of our investment or management professionals may resign at any time, join our competitors or form a competing company. Although many of our portfolio managers and each of our named executive officers are subject to post-employment non-compete obligations, these non-competition provisions may not be enforceable or may not be enforceable to their full extent. In addition, we may agree to waive non-competition provisions or other restrictive covenants applicable to former investment or management professionals in light of the circumstances surrounding their relationship with us. We do not generally carry "key man" insurance that would provide us with proceeds in the event of the death or disability of any of the key members of our investment or management teams.
Competition for qualified investment and management professionals is intense and we may fail to successfully attract and retain qualified personnel in the future. Our ability to attract and retain these personnel will depend heavily on the amount and structure of compensation and opportunities for equity ownership we offer. Any cost-reduction initiative or adjustments or reductions to compensation or changes to our equity ownership culture could cause instability within our existing investment teams and negatively impact our ability to retain key personnel. In addition, changes to our management structure, corporate culture and corporate governance arrangements could negatively impact our ability to retain key personnel.
We rely on third parties to provide products or services for the operation of our business, and a failure or inability by such parties to provide these products or services could materially adversely affect our business.
We have determined, based on an evaluation of various factors that it is more efficient to use third parties for certain functions and services. As a result, we have contracted with a limited number of third parties to provide critical operational support, such as middle- and back-office functions, information technology services and various fund administration and accounting roles, and the funds contract with third parties in custody and transfer agent roles. We have a limited ability to monitor or control the performance of these third parties and our business would be disrupted if key service providers fail or become unable to continue to perform those services. We are also limited in our ability to ensure such providers have appropriate back-up and system redundancies in place to ensure their continuous operation. Moreover, to the extent our third-party providers increase their pricing, our financial performance will be negatively impacted. In addition, upon termination of a third-party contract, we may encounter difficulties in replacing the third-party on favorable terms, transitioning services to another vendor, or in assuming those responsibilities ourselves, which may have a material adverse effect on our business.
Operational risks may disrupt our business, result in losses or limit our growth.
We are heavily dependent on the capacity and reliability of the communications, information and technology systems supporting our operations, whether developed, owned and operated by us or by third parties. We also rely on manual workflows and a variety of manual user controls. Operational risks such as trading or other operational errors or interruption of our financial, accounting, trading, compliance and other data processing systems, whether caused by human error, fire, other natural disaster or pandemic, power or telecommunications failure, cyber-attack or viruses, act of terrorism or war or otherwise, could result in a disruption of our business, liability to clients, regulatory intervention
32
or reputational damage, and thus materially adversely affect our business. The potential for some types of operational risks, including, for example, trading errors, may be increased in periods of increased volatility, which can magnify the cost of an error. Insurance and other safeguards might not be available or might only partially reimburse us for our losses.
Although we have backup systems in place, our backup procedures and capabilities in the event of a failure or interruption may not be adequate. As our client base, number and complexity of strategies and client relationships increase, developing and maintaining our operational systems and infrastructure may become increasingly challenging.
We may also suffer losses due to employee negligence, fraud or misconduct. Non-compliance with policies, employee misconduct, negligence or fraud could result in legal liability, regulatory sanctions and serious reputational or financial harm. In recent years, a number of multinational financial institutions have suffered material losses due to the actions of "rogue traders" or other employees. It is not always possible to deter or detect employee misconduct and the precautions we take to prevent and detect this activity may not always be effective. Employee misconduct could have a material adverse effect on our business.
The significant growth we have experienced over the past few years may be difficult to sustain and our growth strategy is dependent in part upon our ability to make and successfully integrate new strategic acquisitions.
Our AUM has increased from $17.9 billion following our 2013 management-led buyout with Crestview GP from KeyCorp to $61.8 billion as of December 31, 2017, primarily as a result of acquisitions. The absolute measure of our AUM represents a significant rate of growth that has been and may continue to be difficult to sustain. The continued long-term growth of our business will depend on, among other things, successfully making new acquisitions, retaining key investment professionals, maintaining existing strategies and selectively developing new, value-added strategies. There is no certainty that we will be able to identify suitable candidates for acquisition at prices and terms we consider attractive, consummate any such acquisition on acceptable terms, have sufficient resources to complete an identified acquisition or that our strategy for pursuing acquisitions will be effective. In addition, any acquisition can involve a number of risks, including the existence of known, unknown or contingent liabilities. An acquisition may impose additional demands on our staff that could strain our operational resources and require expenditure of substantial legal, investment banking and accounting fees. We may be required to issue additional shares of common stock or spend significant cash to consummate an acquisition, resulting in dilution of ownership or additional debt leverage, or spend additional time and money on facilitating the acquisition that otherwise would be spent on the development and expansion of our existing business.
We may not be able to successfully manage the process of integrating an acquired company's people and other applicable assets to extract the value and synergies projected to be realized in connection with the acquisition. The process of integrating operations could cause an interruption of, or loss of momentum in, the activities of one or more of our combined businesses and the possible loss of key personnel and AUM. The diversion of management's attention and any delays or difficulties encountered in connection with acquisitions and the integration of an acquired company's operations could have an adverse effect on our business.
Our business growth will also depend on our success in achieving superior investment performance from our strategies, as well as our ability to maintain and extend our distribution capabilities, to deal with changing market and industry conditions, to maintain adequate financial and business controls and to comply with new legal and regulatory requirements arising in response to both the increased sophistication of the investment management industry and the significant market and economic events of the last decade.
33
We may not be able to manage our growing business effectively or be able to sustain the level of growth we have achieved historically.
A majority of our existing AUM is managed in long-only equity investments. We have also historically derived a substantial portion of our revenues from fees on investments in small- and mid-cap equities and substantially all of our revenues from U.S. clients.
As of December 31, 2017, approximately 81% of our AUM was invested in U.S. and international equity. Under market conditions in which there is a general decline in the value of equity securities, the AUM in each of our equity strategies is likely to decline. Unlike some of our competitors, we do not currently offer strategies that invest in privately held companies or take short positions in equity securities, which could offset some of the poor performance of our long-only equity strategies under such market conditions. Even if our investment performance remains strong during such market conditions relative to other long-only equity strategies, investors may choose to withdraw assets from our management or allocate a larger portion of their assets to non-long-only or non-equity strategies. In addition, the prices of equity securities may fluctuate more widely than the prices of other types of securities, making the level of our AUM and related revenues more volatile.
As of December 31, 2017, approximately 66% of our total AUM was concentrated in small- and mid-cap equities. As a result, a substantial portion of our operating results depends upon the performance of those investments, and our ability to retain client assets in those investments. If a significant portion of the investors in such investments decided to withdraw their assets or terminate their investment advisory agreements for any reason, including poor investment performance or adverse market conditions, our revenues from those investments would decline, which would have a material adverse effect on our earnings and financial condition.
In addition, we have historically derived substantially all of our revenue from clients in the United States. If economic conditions weaken or slow, particularly in the United States, this could have a substantial adverse impact on our results of operations.
Our efforts to establish and develop new teams and strategies may be unsuccessful and could negatively impact our results of operations and could negatively impact our reputation and culture.
We seek to add new investment teams that invest in a way that is consistent with our philosophy of offering high value-added strategies. We also look to offer new strategies managed by our existing teams. We expect the costs associated with establishing a new team and/or strategy initially to exceed the revenues generated, which will likely negatively impact our results of operations. If new strategies, whether managed by a new team or by an existing team, invest in instruments, or present operational issues and risks, with which we have little or no experience, it could strain our resources and increase the likelihood of an error or failure.
In addition, the historical returns of our existing strategies may not be indicative of the investment performance of any new strategy, and the poor performance of any new strategy could negatively impact the reputation of our other strategies.
We may support the development of new strategies by making one or more seed investments using capital that would otherwise be available for our general corporate purposes and acquisitions. Making such a seed investment could expose us to potential capital losses.
The performance of our strategies or the growth of our AUM may be constrained by unavailability of appropriate investment opportunities.
The ability of our investment teams to deliver strong investment performance depends in large part on their ability to identify appropriate investment opportunities in which to invest client assets. If
34
the investment team for any of our strategies is unable to identify sufficient appropriate investment opportunities for existing and new client assets on a timely basis, the investment performance of the strategy could be adversely affected. In addition, if we determine that sufficient investment opportunities are not available for a strategy, we may choose to limit the growth of the strategy by limiting the rate at which we accept additional client assets for management under the strategy, closing the strategy to all or substantially all new investors or otherwise taking action to limit the flow of assets into the strategy. If we misjudge the point at which it would be optimal to limit access to or close a strategy, the investment performance of the strategy could be negatively impacted. The risk that sufficient appropriate investment opportunities may be unavailable is influenced by a number of factors, including general market conditions, but is particularly acute with respect to our strategies that focus on small- and mid-cap equities, and is likely to increase as our AUM increases, particularly if these increases occur very rapidly. By limiting the growth of strategies, we may be managing the business in a manner that reduces the total amount of our AUM and our investment management fees over the short term.
An assignment could result in termination of our investment advisory agreements to manage SEC-registered funds and could trigger consent requirements in our other investment advisory agreements.
Under the 1940 Act, each of the investment advisory agreements between registered funds and our subsidiary, VCM, and investment sub-advisory agreements between the investment adviser to a registered fund and VCM, will terminate automatically in the event of its assignment, as defined in the 1940 Act.
Assignment, as generally defined under the 1940 Act and the Investment Advisers Act of 1940, as amended, or the Advisers Act, includes direct assignments as well as assignments that may be deemed to occur, under certain circumstances, upon the direct or indirect transfer of a "controlling block" of our outstanding voting securities. A transaction is not an assignment under the 1940 Act or the Advisers Act, however, if it does not result in a change of actual control or management of VCM.
Upon the occurrence of such an assignment, VCM could continue to act as adviser or sub-adviser to any such registered fund only if that fund's board and shareholders approved a new investment advisory agreement, except in the case of certain of the registered funds that we sub-advise for which only board approval would be necessary pursuant to a manager-of-managers SEC exemptive order. In addition, as required by the Advisers Act, each of the investment advisory agreements for the separate accounts and pooled investment vehicles we manage provides that it may not be assigned, as defined in the Advisers Act, without the consent of the client. If an assignment were to occur, we cannot be certain that we would be able to obtain the necessary approvals from the boards and shareholders of the registered funds we advise or the necessary consents from our separate account or pooled investment vehicle clients.
If an assignment of an investment advisory agreement is deemed to occur, and our clients do not consent to the assignment or enter into a new agreement, our results of operations could be materially and adversely affected.
Reputational harm could result in a loss of AUM and revenues.
The integrity of our brands and reputation is critical to our ability to attract and retain clients, business partners and employees and maintain relationships with consultants. We operate within the highly regulated financial services industry and various potential scenarios could result in harm to our reputation. They include internal operational failures, failure to follow investment or legal guidelines in the management of accounts, intentional or unintentional misrepresentation of our products and services in offering or advertising materials, public relations information, social media or other external communications, employee misconduct or investments in businesses or industries that are controversial
35
to certain special interest groups. Any real or perceived conflict between our and our stockholders' interests and our clients' interests, as well as any fraudulent activity or other exposure of client assets or information, may harm our reputation. The negative publicity associated with any of these factors could harm our reputation and adversely impact relationships with existing and potential clients, third-party distributors, consultants and other business partners and subject us to regulatory sanctions or litigation. Damage to our brands or reputation could negatively impact our standing in the industry and result in loss of business in both the short term and the long term.
Additionally, while we have ultimate control over the business activities of our Franchises, they generally have the autonomy to manage their day-to-day operations, and if we fail to intervene in potentially serious matters that may arise, our reputation could be damaged and our results of operations could be materially adversely affected.
Our failure to comply with investment guidelines set by our clients, including the boards of registered funds, and limitations imposed by applicable law, could result in damage awards against us and a loss of AUM, either of which could adversely affect our results of operations or financial condition.
When clients retain us to manage assets on their behalf, they generally specify certain guidelines regarding investment allocation and strategy that we are required to follow in managing their assets. The boards of registered funds we manage generally establish similar guidelines regarding the investment of assets in those funds. We are also required to invest the registered funds' assets in accordance with limitations under the 1940 Act and applicable provisions of the Internal Revenue Code of 1986, as amended, or the Internal Revenue Code. Other clients, such as plans subject to the Employee Retirement Income Security Act of 1974, as amended, or ERISA, or non-U.S. funds, require us to invest their assets in accordance with applicable law. Our failure to comply with any of these guidelines and other limitations could result in losses to clients or investors in a fund which, depending on the circumstances, could result in our obligation to make clients or fund investors whole for such losses. If we believed that the circumstances did not justify a reimbursement, or clients and investors believed the reimbursement we offered was insufficient, they could seek to recover damages from us or could withdraw assets from our management or terminate their investment advisory agreement with us. Any of these events could harm our reputation and materially adversely affect our business.
If our techniques for managing risk are ineffective, we may be exposed to material unanticipated losses.
In order to manage the significant risks inherent in our business, we must maintain effective policies, procedures and systems that enable us to identify, monitor and mitigate our exposure to operational, legal and reputational risks, including from the investment autonomy of our Franchises. Our risk management methods may prove to be ineffective due to their design or implementation, or as a result of the lack of adequate, accurate or timely information or otherwise. If our risk management efforts are ineffective, we could suffer losses that could have a material adverse effect on our financial condition or operating results. Additionally, we could be subject to litigation, particularly from our clients or investors, and sanctions or fines from regulators.
Our techniques for managing operational, legal and reputational risks in client portfolios may not fully mitigate the risk exposure in all economic or market environments, including exposure to risks that we might fail to identify or anticipate. Because our clients invest in our strategies in order to gain exposure to the portfolio securities of the respective strategies, we have not adopted corporate-level risk management policies to manage market, interest rate or exchange rate risks that could affect the value of our overall AUM.
36
We provide a broad range of services to the Victory Funds, VictoryShares and sub-advised mutual funds which may expose us to liability.
We provide a broad range of administrative services to the Victory Funds and VictoryShares, including providing personnel to the Victory Funds and VictoryShares to serve as directors and officers, the preparation or supervision of the preparation of the Victory Funds' and VictoryShares' regulatory filings, maintenance of board calendars and preparation or supervision of the preparation of board meeting materials, management of compliance and regulatory matters, provision of stockholder services and communications, accounting services, including the supervision of the activities of the Victory Funds' and VictoryShares' accounting services provider in the calculation of the funds' net asset values, supervision of the preparation of the Victory Funds' and VictoryShares' financial statements and coordination of the audits of those financial statements, tax services, including calculation of dividend and distribution amounts and supervision of tax return preparation, supervision of the work of the Victory Funds' and VictoryShares' other service providers and VCA acting as a distributor. If we make a mistake in the provision of those services, the Victory Funds or VictoryShares could incur costs for which we might be liable. In addition, if it were determined that the Victory Funds or VictoryShares failed to comply with applicable regulatory requirements as a result of action or failure to act by our employees, we could be responsible for losses suffered or penalties imposed. In addition, we could have penalties imposed on us, be required to pay fines or be subject to private litigation, any of which could decrease our future income or negatively affect our current business or our future growth prospects. Although less extensive than the range of services we provide to the Victory Funds and VictoryShares, we also provide a limited range of services, in addition to investment management services, to sub-advised mutual funds.
In addition, we from time to time provide information to the funds for which we act as sub-adviser (or to a person or entity providing administrative services to such a fund), and to UCITS, for which we act as investment manager (or to the promotor of the UCITS or a person or entity providing administrative services to such a UCITS), which is used by those funds or UCITS in their efforts to comply with various regulatory requirements. If we make a mistake in the provision of those services, the sub-advised fund or UCITS could incur costs for which we might be liable. In addition, if it were determined that the sub-advised fund or UCITS failed to comply with applicable regulatory requirements as a result of action or failure to act by our employees, we could be responsible for losses suffered or penalties imposed. In addition, we could have penalties imposed on us, be required to pay fines or be subject to private litigation, any of which could decrease our future income or negatively affect our current business or our future growth prospects.
Failure to implement effective information and cyber security policies, procedures and capabilities could disrupt operations and cause financial losses.
Our operations rely on the effectiveness of our information and cyber security policies, procedures and capabilities to provide secure processing, storage and transmission of confidential and other information in our computer systems, networks and mobile devices and on the computer systems, networks and mobile devices of third parties on which we rely. Although we take protective measures and endeavor to modify them as circumstances warrant, our computer systems, software, networks and mobile devices may be vulnerable to cyber-attacks, sabotage, unauthorized access, computer viruses, worms or other malicious code, and other events that have a security impact. We also cannot directly control any cyber security plans and systems put in place by third-party service providers, on whom we rely. An externally caused information security incident, such as a hacker attack, virus or worm, or an internally caused issue, such as failure to control access to sensitive systems, could materially interrupt business operations or cause disclosure or modification of sensitive or confidential client or competitive information and could result in material financial loss, loss of competitive position, regulatory actions, breach of client contracts, reputational harm or legal liability. If one or more of such events occur, it potentially could jeopardize our or our clients', employees' or counterparties' confidential and other
37
information processed and stored in, and transmitted through, our or third-party computer systems, networks and mobile devices, or otherwise cause interruptions or malfunctions in our, our clients', our counterparties' or third parties' operations. As a result, we could experience material financial loss, loss of competitive position, regulatory actions, breach of client contracts, reputational harm or legal liability, which, in turn, could cause a decline in our earnings. Additionally, some of our client contracts require us to indemnify clients in the event of a cyber breach if our systems do not meet minimum security standards. We may be required to spend significant additional resources to modify our protective measures or to investigate and remediate vulnerabilities or other exposures, and we may be subject to litigation and financial losses that are either not insured against fully or not fully covered through any insurance that we maintain.
Certain of our strategies invest principally in the securities of non-U.S. companies, which involve foreign currency exchange, tax, political, social and economic uncertainties and risks.
As of December 31, 2017, approximately 7% of our total AUM was invested in strategies that primarily invest in securities of non-U.S. companies and securities denominated in currencies other than the U.S. dollar. Fluctuations in foreign currency exchange rates could negatively affect the returns of our clients who are invested in these securities. In addition, an increase in the value of the U.S. dollar relative to non-U.S. currencies is likely to result in a decrease in the U.S. dollar value of our AUM, which, in turn, would likely result in lower revenue and profits.
Investments in non-U.S. issuers may also be affected by tax positions taken in countries or regions in which we are invested as well as political, social and economic uncertainty. Declining tax revenues may cause governments to assert their ability to tax the local gains and/or income of foreign investors (including our clients), which could adversely affect client interests in investing outside their home markets. Many financial markets are not as developed, or as efficient, as the U.S. financial markets, and, as a result, those markets may have limited liquidity and higher price volatility, and may lack established regulations. Liquidity may also be adversely affected by political or economic events, government policies, and social or civil unrest within a particular country, and our ability to dispose of an investment may also be adversely affected if we increase the size of our investments in smaller non-U.S. issuers. Non-U.S. legal and regulatory environments, including financial accounting standards and practices, may also be different, and there may be less publicly available information about such companies. These risks could adversely affect the performance of our strategies that are invested in securities of non-U.S. issuers and may be particularly acute in the emerging or less developed markets in which we invest. In addition to our Trivalent, Sophus and Expedition Franchises, certain of our other Franchises invest in emerging or less developed markets.
The expansion of our business outside of the United States raises tax and regulatory risks, may adversely affect our profit margins and places additional demands on our resources and employees.
We have expanded and intend to continue to expand our distribution efforts into non-U.S. markets through partnered distribution efforts and product offerings, including Europe, Japan, Singapore and Hong Kong. For example, we organized and serve as investment manager of two Ireland-domiciled UCITS, the Victory Sophus Emerging Markets UCITS Fund and the Victory Expedition Emerging Markets Small Cap UCITS Fund, each of which launched during the first quarter of 2017. Clients outside the United States may be adversely affected by political, social and economic uncertainty in their respective home countries and regions, which could result in a decrease in the net client cash flows that come from such clients. This expansion has required and will continue to require us to incur a number of up-front expenses, including those associated with obtaining and maintaining regulatory approvals and office space, as well as additional ongoing expenses, including those associated with leases, the employment of additional support staff and regulatory compliance.
38
Non-U.S. clients may be less accepting of the U.S. practice of payment for certain research products and services through soft dollars ("soft dollars" are a means of paying brokerage firms for their services through commission revenue, rather than through direct payments) or such practices may not be permissible in certain jurisdictions, which could have the effect of increasing our expenses. In addition, the European Commission recently adopted several acts under the revised Markets in Financial Instruments Directive (known as "MiFID II") that would prevent the "bundling" of the cost of research together with trading commissions. As a result, clients subject to MiFID II will be unable to use soft dollars to pay for research services once MiFID II becomes effective in the United Kingdom and in Europe in 2018.
Our U.S.-based employees routinely travel outside the United States as a part of our investment research process or to market our services and may spend extended periods of time in one or more non-U.S. jurisdictions. Their activities outside the United States on our behalf may raise both tax and regulatory issues. If and to the extent we are incorrect in our analysis of the applicability or impact of non-U.S. tax or regulatory requirements, we could incur costs or penalties or be the subject of an enforcement or other action. Operating our business in non-U.S. markets is generally more expensive than in the United States. In addition, costs related to our distribution and marketing efforts in non-U.S. markets generally have been more expensive than comparable costs in the United States. To the extent that our revenues do not increase to the same degree as our expenses increase in connection with our continuing expansion outside the United States, our profitability could be adversely affected. Expanding our business into non-U.S. markets may also place significant demands on our existing infrastructure and employees.
We are also subject to a number of laws and regulations governing payments and contributions to political persons or other third parties, including restrictions imposed by the Foreign Corrupt Practices Act, or the FCPA, as well as trade sanctions administered by the Office of Foreign Assets Control, or OFAC, the U.S. Department of Commerce and the U.S. Department of State. Similar laws in non-U.S. jurisdictions may also impose stricter or more onerous requirements and implementing them may disrupt our business or cause us to incur significantly more costs to comply with those laws. Different laws may also contain conflicting provisions, making compliance with all laws more difficult. Any determination that we have violated the FCPA or other applicable anti-corruption laws or sanctions could subject us to, among other things, civil and criminal penalties, material fines, profit disgorgement, injunctions on future conduct, securities litigation and a general loss of investor confidence, any one of which could adversely affect our business prospects, financial condition, results of operations or the market value of our Class A common stock. While we have developed and implemented policies and procedures designed to ensure strict compliance by us and our personnel with the FCPA and other anti-corruption laws or sanctions in jurisdictions in which we operate, such policies and procedures may not be effective in all instances to prevent violations.
On June 23, 2016, United Kingdom citizens voted in a referendum to leave the European Union, and on March 29, 2017, the United Kingdom provided formal notice to the European Union of its intent to withdraw. The consequence of the exit of the United Kingdom, together with what may be protracted negotiations around the terms of the exit, are uncertain and may have adverse effects on the United Kingdom, European and worldwide economy and market conditions and contribute to currency exchange fluctuations. Any negative impact to overall investor confidence or instability in the global macroeconomic environment could have an adverse economic impact on our results of operations.
Our substantial indebtedness may expose us to material risks.
As of December 31, 2017, we had $499.7 million of outstanding term loans under the 2014 Credit Agreement. Following the completion of the IPO and the refinancing of the 2014 Credit Agreement, we had $360.0 million of outstanding term loans under the Credit Agreement. Our substantial indebtedness may make it more difficult for us to withstand or respond to adverse or changing
39
business, regulatory and economic conditions or to take advantage of new business opportunities or make necessary capital expenditures. In addition, the Credit Agreement contains financial and operating covenants that may limit our ability to conduct our business. While we are currently in compliance in all material respects with the financial and operating covenants under the Credit Agreement, we cannot assure that at all times in the future we will satisfy all such financial and operating covenants (or any such covenants applicable at the time) or obtain any required waiver or amendment, in which event all outstanding indebtedness could become immediately due and payable. This could result in a substantial reduction in our liquidity and could challenge our ability to meet future cash needs of the business.
To the extent we service our debt from our cash flow, such cash will not be available for our operations or other purposes. Because of our significant debt service obligations, the portion of our cash flow used to service those obligations could be substantial if our revenues decline, whether because of market declines or for other reasons. Any substantial decrease in net operating cash flows or any substantial increase in expenses could make it difficult for us to meet our debt service requirements or force us to modify our operations. Our ability to repay the principal amount of any outstanding loans under the Credit Agreement, to refinance our debt or to obtain additional financing through debt or the sale of additional equity securities will depend on our performance, as well as financial, business and other general economic factors affecting the credit and equity markets generally or our business in particular, many of which are beyond our control. Any such alternatives may not be available to us on satisfactory terms or at all.
Potential impairment of goodwill and intangible assets could reduce our assets.
As of December 31, 2017, our goodwill and intangible assets totaled $692.1 million. The value of these assets may not be realized for a variety of reasons, including, but not limited to, significant redemptions, loss of clients, damage to brand name and unfavorable economic conditions. In accordance with the guidance under Financial Accounting Standards Board, or FASB, ASC 350-20 "Intangibles—Goodwill and Other," we review the carrying value of goodwill and intangible assets not subject to amortization on an annual basis, or more frequently if indications exist suggesting that the fair value of our intangible assets may be below their carrying value. Determining goodwill and intangible assets, and evaluating them for impairment, requires significant management estimates and judgment, including estimating value and assessing useful life in connection with the allocation of purchase price in the acquisition creating them. We evaluate the value of intangible assets subject to amortization whenever events or changes in circumstances indicate that the carrying amount of an asset may not be recoverable. Should such reviews indicate impairment, a reduction of the carrying value of the intangible asset could occur, resulting in a charge that may, in turn, adversely affect our AUM, results of operations and financial condition.
Disruption to the operations of third parties whose functions are integral to our ETF platform may adversely affect the prices at which VictoryShares trade, particularly during periods of market volatility.
Shares of ETFs, such as VictoryShares, trade on stock exchanges at prices at, above or below the ETF's most recent net asset value. While ETFs utilize a creation/redemption feature and arbitrage mechanism designed to make it more likely that the ETF's shares normally will trade at prices close to the ETF's net asset value, exchange prices may deviate significantly from the ETF's net asset value. ETF market prices are subject to numerous potential risks, including trading halts invoked by a stock exchange, inability or unwillingness of market makers, authorized participants, settlement systems or other market participants to perform functions necessary for an ETF's arbitrage mechanism to function effectively, or significant market volatility. If market events lead to incidences where ETFs trade at prices that deviate significantly from an ETF's net asset value, or trading halts are invoked by the relevant stock exchange or market, investors may lose confidence in ETF products and redeem their holdings, which may cause our AUM, revenue and earnings to decline.
40
If we were deemed an investment company required to register under the 1940 Act, we would become subject to burdensome regulatory requirements and our business activities could be restricted.
Generally, a company is an "investment company" required to register under the 1940 Act if, absent an applicable exception or exemption, it (i) is, or holds itself out as being, engaged primarily, or proposes to engage primarily, in the business of investing, reinvesting or trading in securities; or (ii) engages, or proposes to engage, in the business of investing, reinvesting, owning, holding or trading in securities and owns or proposes to acquire "investment securities" having a value exceeding 40% of the value of its total assets (exclusive of U.S. government securities and cash items) on an unconsolidated basis.
We hold ourselves out as an investment management firm and do not propose to engage primarily in the business of investing, reinvesting or trading in securities. We believe we are engaged primarily in the business of providing investment management services and not in the business of investing, reinvesting or trading in securities. We also believe our primary source of income is properly characterized as income earned in exchange for the provision of services. We believe less than 40% of our total assets (exclusive of U.S. government securities and cash items) on an unconsolidated basis comprise assets that could be considered investment securities.
We intend to conduct our operations so that we will not be deemed an investment company required to register under the 1940 Act. However, if we were to be deemed an investment company required to register under the 1940 Act, restrictions imposed by the 1940 Act, including limitations on our capital structure and our ability to transact with our affiliates, could make it impractical for us to continue our business as currently conducted and could have a material adverse effect on our financial performance and operations.
Our expenses are subject to fluctuations that could materially impact our results of operations.
Our results of operations are dependent upon the level of our expenses, which can vary from period to period. We have certain fixed expenses that we incur as a going concern, and some of those expenses are not subject to adjustment. If our revenues decrease, without a corresponding decrease in expenses, our results of operations would be negatively impacted. While a majority of our expenses are variable and we attempt to project expense levels in advance, there is no guarantee that an unforeseen expense will not arise or that we will be able to adjust our variable expenses quickly enough to match a declining asset base. Consequently, either event could have either a temporary or permanent negative impact on our results of operations.
Risks Relating to Our Industry
Recent trends in the investment management industry could reduce our AUM, revenues and net income.
Certain passive products and asset classes, such as index and certain types of ETFs, are becoming increasingly popular with investors, including institutional investors. In recent years, across the investment management industry, passive products have experienced inflows and traditional actively managed products have experienced outflows, in each case, in the aggregate. In order to maintain appropriate fee levels in a competitive environment, we must be able to continue to provide clients with investment products and services that are viewed as appropriate in relation to the fees charged, which may require us to demonstrate that our strategies can outperform such passive products. If our clients, including our funds' boards, were to view our fees as being high relative to the market or the returns provided by our investment products, we may choose to reduce our fee levels or existing clients may withdraw their assets in order to invest in passive products, and we may be unable to attract additional commitments from existing and new clients, which would lead to a decline in our AUM and market share. To the extent we offer such passive products, we may not be able to compete with other firms offering similar products.
41
Our revenues and net income are dependent on our ability to maintain current fee levels for the products and services we offer. The competitive nature of the investment management industry has led to a trend toward lower fees in certain segments of the investment management market. Although our AUM-average weighted average fee rate increased from 2013 through the end of 2017 as we repositioned our business to focus on higher-fee asset classes, we anticipate that the average fee rate is likely to decline as our Solutions Platform (which has a lower fee rate than other products) continues to grow. Our ability to sustain fee levels depends on future growth in specific asset classes and distribution channels. These factors, as well as regulatory changes, could further inhibit our ability to sustain fees for certain products. A reduction in the fees charged by us could reduce our revenues and net income.
Our fees vary by asset class and produce different revenues per dollar of AUM based on factors such as the type of assets being managed, the applicable strategy, the type of client and the client fee schedule. Institutional clients may have significant negotiating leverage in establishing the terms of an advisory relationship, particularly with respect to the level of fees paid, and the competitive pressure to attract and retain institutional clients may impact the level of fee income earned by us. We may decline to manage assets from potential clients who demand lower fees even though such assets would increase our revenue and AUM in the short term.
As an investment management firm, we are subject to extensive regulation.
Investment management firms are subject to extensive regulation in the United States, primarily at the federal level, including regulation by the SEC under the 1940 Act and the Advisers Act, by the U.S. Department of Labor, or the DOL, under ERISA, by the Commodity Futures Trading Commission, or the CFTC, by the National Futures Association, or NFA, under the Commodity Exchange Act, and by the Financial Industry Regulatory Authority, Inc., or FINRA. The U.S. mutual funds and ETFs we manage are registered with and regulated by the SEC as investment companies under the 1940 Act. The Advisers Act imposes numerous obligations on investment advisers, including recordkeeping, advertising and operating requirements, disclosure obligations and prohibitions on fraudulent activities. The 1940 Act imposes similar obligations, as well as additional detailed operational requirements, on registered funds, which must be adhered to by their investment advisers. We have also expanded our distribution effort into non-U.S. markets through partnered distribution efforts and product offerings, including Europe, Japan, Singapore and Hong Kong. In the future, we may further expand our business outside of the United States in such a way or to such an extent that we may be required to register with additional foreign regulatory agencies or otherwise comply with additional non-U.S. laws and regulations that do not currently apply to us and with respect to which we do not have compliance experience. Our lack of experience in complying with any such non-U.S. laws and regulations may increase our risk of being subject to regulatory actions and becoming party to litigation in such non-U.S. jurisdictions, which could be more expensive. Moreover, being subject to regulation in multiple jurisdictions may increase the cost, complexity and time required for engaging in transactions that require regulatory approval.
Accordingly, we face the risk of significant intervention by regulatory authorities, including extended investigation and surveillance activity, adoption of costly or restrictive new regulations and judicial or administrative proceedings that may result in substantial penalties. Among other things, we could be fined, lose our licenses or be prohibited or limited from engaging in some of our business activities or corporate transactions. The requirements imposed by our regulators are designed to ensure the integrity of the financial markets and to protect clients and other third parties who deal with us, and are not designed to protect our stockholders. Consequently, these regulations often serve to limit our activities, including through net capital, client protection and market conduct requirements.
42
The regulatory environment in which we operate is subject to continual change and regulatory developments designed to increase oversight may materially adversely affect our business.
We operate in a legislative and regulatory environment that is subject to continual change, the nature of which we cannot predict. We may be adversely affected as a result of new or revised legislation or regulations imposed by the SEC, other U.S. or non-U.S. governmental regulatory authorities or self-regulatory organizations that supervise the financial markets. For example, the DOL's fiduciary rule and related exemptions began a phased implementation with the fiduciary rule becoming applicable on June 9, 2017 and certain related exemptions becoming applicable July 1, 2019. These rules substantially expand the definition of "investment advice" and thereby broaden the circumstances under which product distributors could be considered fiduciaries under ERISA or the Internal Revenue Code. Under the fiduciary rule, certain communications with plans, plan participants and individual retirement account, or IRA, holders, including the marketing of products, and marketing of investment management or advisory services, could be deemed fiduciary investment advice, causing increased exposure to fiduciary liability if the distributor does not recommend what is in the client's best interests. The DOL also issued amendments to certain of its prohibited transaction exemptions, and issued a new exemption that applies more onerous disclosure and contract requirements to, and increases fiduciary requirements and fiduciary liability exposure in respect of, transactions involving ERISA plans, plan participants and IRAs. To the extent that the fiduciary rule and exemptions lead to changes in financial intermediary and retirement plan investment preferences, and increased pressure on product fees and expenses, such changes could have a material adverse effect on our financial performance and operations.
The requirements imposed by our regulators (including both U.S. and non-U.S. regulators) are designed to ensure the integrity of the financial markets and to protect clients and other third parties who deal with us, and are not designed to protect our stockholders. Consequently, these regulations often serve to limit our activities and/or increase our costs, including through client protection and market conduct requirements. New laws or regulations, or changes in the enforcement of existing laws or regulations, applicable to us and our clients may adversely affect our business. Our ability to function in this environment will depend on our ability to constantly monitor and promptly react to legislative and regulatory changes. There have been a number of highly publicized regulatory inquiries that have focused on the investment management industry. These inquiries already have resulted in increased scrutiny of the industry and new rules and regulations for mutual funds and investment managers. This regulatory scrutiny may limit our ability to engage in certain activities that might be beneficial to our stockholders.
We also may be adversely affected by changes in the interpretation or enforcement of existing laws and rules by these governmental authorities and self-regulatory organizations, as well as by courts. It is impossible to determine the extent of the impact of any new U.S. or non-U.S. laws, regulations or initiatives that may be proposed, or whether any of the proposals will become law. Compliance with any new laws or regulations could be more difficult and expensive and affect the manner in which we conduct business. See "Regulatory Environment and Compliance."
The investment management industry is intensely competitive.
The investment management industry is intensely competitive, with competition based on a variety of factors, including investment performance, fees, continuity of investment professionals and client relationships, the quality of services provided to clients, corporate positioning and business reputation, continuity of selling arrangements with intermediaries and differentiated products. A number of factors, including the following, serve to increase our competitive risks:
- •
- a number of our competitors have greater financial, technical, marketing and other resources, more comprehensive name recognition and more personnel than we do;
43
- •
- potential competitors have a relatively low cost of entering the investment management industry;
- •
- certain investors may prefer to invest with an investment manager that is not publicly traded based on the perception that a publicly traded
asset manager may focus on the manager's own growth to the detriment of investment performance for clients;
- •
- other industry participants, hedge funds and alternative asset managers may seek to recruit our investment professionals; and
- •
- certain competitors charge lower fees for their investment management services than we do.
Additionally, intermediaries through which we distribute our funds may also sell their own proprietary funds and investment products, which could limit the distribution of our strategies. If we are unable to compete effectively, our earnings could be reduced and our business could be materially adversely affected.
Risks Relating to Our Capital Structure
An active trading market for our Class A common stock may not develop and the market price for our Class A common stock may decline.
Prior to the IPO, there was no public market for our Class A common stock. An active trading market for our Class A common stock may never develop or be sustained, which could adversely impact the market to sell our shares and could depress the market price of our shares.
The market price of our Class A common stock is likely to be volatile and could decline.
The stock market in general has been highly volatile. As a result, the market price and trading volume for our Class A common stock may also be highly volatile, and investors in our Class A common stock may experience a decrease in the value of their shares, including decreases unrelated to our operating performance or prospects. Factors that could cause the market price of our Class A common stock to fluctuate significantly include:
- •
- our operating and financial performance and prospects and the performance of other similar companies;
- •
- our quarterly or annual earnings or those of other companies in our industry;
- •
- conditions that impact demand for our products and services;
- •
- the public's reaction to our press releases, financial guidance and other public announcements, and filings with the SEC;
- •
- changes in earnings estimates or recommendations by securities or research analysts who track our Class A common stock;
- •
- market and industry perception of our level of success in pursuing our growth strategy;
- •
- strategic actions by us or our competitors, such as acquisitions or restructurings;
- •
- changes in government and other regulations;
- •
- changes in accounting standards, policies, guidance, interpretations or principles;
- •
- departure of key personnel;
- •
- the number of shares publicly traded;
- •
- investor scrutiny of our dual-class structure, including new rules adopted by certain index providers, such as S&P Dow Jones and FTSE Russell, that limit or preclude inclusion of companies with multiple-class capital structure in certain indices;
44
- •
- sales of common stock by us, our investors or members of our management team; and
- •
- changes in general market, economic and political conditions in the U.S. and global economies or financial markets, including those resulting from natural disasters, telecommunications failures, cyber-attacks, civil unrest in various parts of the world, acts of war, terrorist attacks or other catastrophic events.
Any of these factors may result in large and sudden changes in the trading volume and market price of our Class A common stock.
Following periods of volatility in the market price of a company's securities, stockholders often file securities class-action lawsuits against such company. Our involvement in a class-action lawsuit could divert our senior management's attention and, if adversely determined, could have a material and adverse effect on our business, financial condition and results of operations.
The dual class structure of our common stock has the effect of concentrating voting control with those stockholders who hold our Class B common stock.
Our Class B common stock has ten votes per share and our Class A common stock has one vote per share. Our Employee Shareholders Committee, Crestview GP, Reverence Capital, our directors and executive officers and each of and their respective affiliates, hold in the aggregate 97.9% of the total voting power of our outstanding common stock and the unvested restricted stock. Because of the ten-to-one voting ratio between our Class B common stock and Class A common stock, the holders of our Class B common stock collectively will continue to control a majority of the voting power of our common stock and therefore will be able to control all matters submitted to our stockholders for approval. Our Class B common stock will be converted into shares of Class A common stock, which conversion will occur automatically, in the case of each share of Class B common stock, upon transfers (subject to limited exceptions, such as certain transfers effected for estate planning purposes), a termination of employment by an employee stockholder or upon the date the number of shares of Class B common stock then outstanding (including unvested restricted shares) is less than 10% of the aggregate number of shares of Class A common stock and Class B common stock then outstanding (including unvested restricted shares). We may issue additional shares of our Class B common stock in the future, including in connection with acquisitions or equity grants to employees.
The conversion of Class B common stock to Class A common stock will have the effect, over time, of increasing the relative voting power of those holders of Class B common stock who retain their shares in the long term, including the holders of newly issued shares of Class B common stock and the holders of Class B common stock subject to the Employee Shareholders' Agreement, whose shares will be voted by the Employee Shareholders Committee.
Crestview GP controls us and its interests may conflict with ours or other shareholders' in the future.
Crestview GP does not hold any of our Class A common stock, but beneficially owns 51.9% of our common stock through its beneficial ownership of our Class B common stock and 62.6% of the total voting power of our outstanding common stock and unvested restricted stock. As a result, Crestview GP has the ability to elect a majority of the members of our board of directors and thereby control our policies and operations, including the appointment of management, future issuances of our common stock or other securities, the payment of dividends, if any, on our common stock (including the Class A common stock), the incurrence of debt by us, amendments to our amended and restated certificate of incorporation and amended and restated bylaws, and the entering into of extraordinary transactions. Crestview GP will also be able to determine the outcome of all matters requiring stockholder approval and will be able to cause or prevent a change in control of us or a change in the composition of our board of directors and could preclude any acquisition of us. This concentration of voting control could deprive other stockholders of an opportunity to receive a premium for shares of
45
their Class A common stock as part of a sale of us and ultimately might affect the market price of our Class A common stock. Further, the interests of Crestview GP may not in all cases be aligned with other shareholders' interests.
In addition, Crestview GP may have an interest in pursuing acquisitions, divestitures and other transactions that, in its judgment, could enhance its investment, even though such transactions might involve risks to other stockholders. For example, Crestview GP could cause us to make acquisitions that increase our indebtedness or cause us to sell revenue-generating assets. Crestview GP is in the business of making investments in companies and may from time to time acquire and hold interests in businesses that compete directly or indirectly with us. Our amended and restated certificate of incorporation provides that none of Crestview GP or Reverence Capital or any of their respective affiliates will have any duty to refrain from engaging, directly or indirectly, in the same business activities or similar business activities or lines of business in which we operate. Crestview GP or Reverence Capital also may pursue acquisition opportunities that may be complementary to our business, and, as a result, those acquisition opportunities may not be available to us, which could have an adverse effect on our growth prospects.
Future sales of shares by stockholders could cause our stock price to decline.
Sales of substantial amounts of our Class A common stock in the public market, or the perception that these sales could occur, could cause the market price of our Class A common stock to decline. 12,899,315 shares of our Class A common stock and 55,046,787 shares of our Class B common stock, which are convertible, at the option of the holder, into an equal number of shares of Class A common stock, are outstanding. Of these shares, all of the shares of Class A common stock is freely tradable without restriction under the Securities Act, unless purchased by our "affiliates," as that term is defined in Rule 144 under the Securities Act. The 55,046,787 shares of our Class B common stock held by Crestview GP, Reverence Capital, our directors and officers and other existing stockholders, are "restricted securities" within the meaning of Rule 144 under the Securities Act. Restricted securities may be sold in the public market only if they are registered under the Securities Act or are sold pursuant to an exemption from registration under Rule 144 or Rule 701 under the Securities Act. Subject to the lock-up agreements described below, restricted shares held by non-affiliates that have been owned for more than six months may be sold without regard to the provisions of Rule 144 (other than the current information requirement).
We, our executive officers, directors, institutional shareholders and substantially all of our other existing security holders have agreed to a "lock-up," meaning that, subject to certain exceptions, neither we nor they will sell any shares without the prior consent of the representatives of the underwriters, for 180 days after February 7, 2018, the date our IPO registration statement became effective. In addition, certain of our significant stockholders may distribute shares that they hold to their investors who themselves may then sell into the public market following the expiration of the lock-up period. Such sales may not be subject to the volume, manner of sale, holding period and other limitations of Rule 144. As resale restrictions end, the market price of our Class A common stock could decline if the holders of shares sell them or are perceived by the market as intending to sell them. In addition, holders of approximately 46,214,267 shares, or 84.0%, of our Class B common stock have registration rights, subject to certain conditions, to require us to file registration statements covering the sale of their shares or to include their shares in registration statements that we may file for ourselves or other stockholders in the future. Once we register the shares for the holders of registration rights, they can be freely sold in the public market upon issuance, subject to the restrictions contained in the lock-up agreements.
In the future, we may issue additional shares of common stock or other equity or debt securities convertible into common stock in connection with a financing, acquisition or employee arrangement, or
46
in certain other circumstances. Any of these issuances could result in substantial dilution to our existing stockholders and could cause the trading price of our Class A common stock to decline.
If securities or industry analysts do not publish research or publish misleading or unfavorable research about our business, our stock price and trading volume could decline.
The trading market for our Class A common stock will depend in part on the research and reports that securities or industry analysts publish about us or our business. If there is no coverage of us by securities or industry analysts, the trading price for our shares could be negatively impacted. In the event we obtain securities or industry analyst coverage and if one or more of these analysts downgrades our shares or publishes misleading or unfavorable research about our business, our stock price would likely decline. If one or more of these analysts ceases coverage of us or fails to publish reports on us regularly, demand for our shares could decrease, which could cause our stock price or trading volume to decline.
We are an "emerging growth company," and any decision on our part to comply with certain reduced disclosure requirements applicable to emerging growth companies could make our Class A common stock less attractive to investors.
We are an "emerging growth company," as defined in the JOBS Act, enacted in April 2012, and, for as long as we continue to be an emerging growth company, we may choose to take advantage of exemptions from various reporting requirements applicable to other public companies, including, but not limited to, reduced disclosure obligations regarding executive compensation (including Chief Executive Officer pay ratio disclosure) in our periodic reports and proxy statements, and exemptions from the requirements of holding a nonbinding advisory vote on executive compensation and stockholder approval of any golden parachute payments not previously approved. As an emerging growth company, we have elected to use the extended transition period for complying with new or revised accounting standards until those standards would otherwise apply to private companies. As a result, our consolidated financial statements may not be comparable to the financial statements of issuers who are required to comply with the effective dates for new or revised accounting standards that are applicable to public companies.
We may take advantage of these exemptions until such time that we are no longer an emerging growth company. Accordingly, the information contained herein may be different than the information provided by other public companies. We could remain an emerging growth company for up to five years, or until the earliest of (i) the last day of the first fiscal year in which our annual gross revenues are at least $1.07 billion, (ii) the date that we become a "large accelerated filer" as defined in Rule 12b-2 under the Exchange Act, which would occur if, among other things, the market value of our common equity securities held by non-affiliates exceeds $700 million as of the last business day of our most recently completed second fiscal quarter, or (iii) the date on which we have issued more than $1 billion in nonconvertible debt securities during the preceding three-year period.
We cannot predict whether investors will find our Class A common stock less attractive if we choose to rely on one or more of the exemptions described above. If investors find our Class A common stock less attractive as a result of any decisions to reduce future disclosure, there may be a less active trading market for our Class A common stock and our stock price may be more volatile.
The requirements of being a public company may strain our resources and distract our management, which could make it difficult to manage our business, particularly after we are no longer an "emerging growth company."
We have historically operated as a private company and have not been subject to the same financial and other reporting and corporate governance requirements as a public company. We are now required to file annual, quarterly and other reports with the SEC. We need to prepare and timely file
47
financial statements that comply with SEC reporting requirements. We also are subject to other reporting and corporate governance requirements under the listing standards of NASDAQ and the Sarbanes-Oxley Act, which will impose significant compliance costs and obligations upon us. Being a public company requires a significant commitment of additional resources and management oversight, which add to operating costs. These changes will also place significant additional demands on our finance and accounting staff, which may not have prior public company experience or experience working for a newly public company, and on our financial accounting and information systems, and we may need to, in the future, hire additional accounting and financial staff with appropriate public company reporting experience and technical accounting knowledge. Other expenses associated with being a public company include increases in auditing, accounting and legal fees and expenses, investor relations expenses, increased directors' fees and director and officer liability insurance costs, registrar and transfer agent fees and listing fees, as well as other expenses. As a public company, we are required, among other things, to:
- •
- prepare and file periodic reports, and distribute other stockholder communications, in compliance with the federal securities laws and the
NASDAQ rules;
- •
- define and expand the roles and the duties of our board of directors and its committees;
- •
- institute more comprehensive compliance, investor relations and internal audit functions; and
- •
- evaluate and maintain our system of internal control over financial reporting, and report on management's assessment thereof, in compliance with rules and regulations of the SEC and the PCAOB.
In particular, the Sarbanes-Oxley Act requires us to document and test the effectiveness of our internal control over financial reporting in accordance with an established internal control framework, and to report on our conclusions as to the effectiveness of our internal controls. Likewise, our independent registered public accounting firm is required to provide an attestation report on the effectiveness of our internal control over financial reporting pursuant to Section 404(b) of the Sarbanes-Oxley Act unless we choose to utilize the exemption from such attestation requirement available to "emerging growth companies." As described in the previous risk factor, we could potentially qualify as an emerging growth company until December 30, 2023. In addition, we are required under the Exchange Act to maintain disclosure controls and procedures and internal control over financial reporting. Any failure to implement required new or improved controls, or difficulties encountered in their implementation, could harm our operating results or cause us to fail to meet our reporting obligations. If we are unable to conclude that we have effective internal control over financial reporting, investors could lose confidence in the reliability of our financial statements. This could result in a decrease in the value of our Class A common stock. Failure to comply with the Sarbanes-Oxley Act could potentially subject us to sanctions or investigations by the SEC or other regulatory authorities.
We do not currently intend to pay regular cash dividends on our common stock.
We have no current plans to declare and pay any cash dividends. We currently intend to retain all our future earnings, if any, to fund our growth. Therefore, the success of an investment in our Class A common stock will depend upon any future appreciation in its value. There is no guarantee that our Class A common stock will appreciate in value or even maintain the price at which our stockholders have purchased their shares.
Future offerings of debt or equity securities may rank senior to our Class A common stock.
If we decide to issue debt securities in the future, which would rank senior to shares of our common stock, it is likely that they will be governed by an indenture or other instrument containing covenants restricting our operating flexibility. We and, indirectly, our stockholders will bear the cost of
48
issuing and servicing such securities. We may also issue preferred equity, which will have superior rights relative to our common stock, including with respect to voting and liquidation.
Furthermore, if our future access to public markets is limited or our performance decreases, we may need to carry out a private placement or public offering of our Class A common stock at a lower price than the initial public offering price.
Because our decision to issue debt, preferred or other equity or equity-linked securities in any future offering will depend on market conditions and other factors beyond our control, we cannot predict or estimate the amount, timing or nature of our future offerings. Thus, holders of our Class A common stock will bear the risk of our future offerings reducing the market price of our Class A common stock and diluting the value of their shareholdings in us.
We are a "controlled company" within the meaning of the rules of NASDAQ, and, as a result, we will qualify for, and intend to rely on, exemptions from certain corporate governance requirements.
Crestview GP controls a majority of the voting power of our common stock. As a result, we are a "controlled company" under NASDAQ's corporate governance listing standards. As a controlled company, we are exempt from the obligation to comply with certain corporate governance requirements, including the requirements:
- •
- that a majority of our board of directors consist of independent directors, as defined under the rules of NASDAQ;
- •
- that we have a corporate governance and nominating committee that is composed entirely of independent directors with a written charter
addressing the committee's purpose and responsibilities; and
- •
- that we have a compensation committee that is composed entirely of independent directors with a written charter addressing the committee's purpose and responsibilities.
We intend to take advantage of these exemptions for so long as Crestview GP holds a majority of our voting power. Accordingly, our stockholders will not have the same protections afforded to stockholders of companies that are subject to all of NASDAQ's corporate governance requirements, which could make our stock less attractive to investors or otherwise harm our stock price.
Provisions in our charter documents could discourage a takeover that stockholders may consider favorable.
Certain provisions in our governing documents could make a merger, tender offer or proxy contest involving us difficult, even if such events would be beneficial to the interests of our stockholders. Among other things, these provisions:
- •
- permit our board of directors to establish the number of directors and fill any vacancies and newly created directorships;
- •
- authorize the issuance of "blank check" preferred stock that our board of directors could use to implement a stockholder rights plan;
- •
- provide that our board of directors is expressly authorized to amend or repeal any provision of our bylaws;
- •
- restrict the forum for certain litigation against us to Delaware;
- •
- establish advance notice requirements for nominations for election to our board of directors or for proposing matters that can be acted upon by
stockholders at annual stockholder meetings;
- •
- provide for a dual-class common stock structure pursuant to which holders of our Class B common stock will have ten votes per share compared to the one vote per share of our Class A
49
- •
- establish a classified board of directors with three classes of directors and the removal of directors only for cause;
- •
- require that actions to be taken by our stockholders be taken only at an annual or special meeting of our stockholders, and not by written
consent, once Crestview GP owns 50% or less of the voting power of our outstanding capital stock;
- •
- establish certain limitations on convening special stockholder meetings; and
- •
- restrict business combinations with interested stockholders.
common stock and thereby will have the ability to control the outcome of matters requiring stockholder approval;
These provisions may delay or prevent attempts by our stockholders to replace members of our management by making it more difficult for stockholders to replace members of our board of directors, which is responsible for appointing the members of our management. Anti-takeover provisions could depress the price of our Class A common stock by acting to delay or prevent a change in control of us.
Our amended and restated certificate of incorporation provides that the Court of Chancery of the State of Delaware is the exclusive forum for substantially all disputes between us and our stockholders, which could limit our stockholders' ability to obtain a favorable judicial forum for disputes with us or our directors, officers or employees.
Our amended and restated certificate of incorporation provides that the Court of Chancery of the State of Delaware is the exclusive forum for any derivative action or proceeding brought on our behalf, any action asserting a breach of fiduciary duty, any action asserting a claim against us arising pursuant to the Delaware General Corporation Law, our amended and restated certificate of incorporation or our amended and restated bylaws or any action asserting a claim against us that is governed by the internal affairs doctrine. This choice of forum provision may limit a stockholder's ability to bring a claim in a judicial forum that it finds favorable for disputes with us or our directors, officers or other employees and may discourage these types of lawsuits.
Item 1B. Unresolved Staff Comments
None
The Company leases its principal executive offices, which are located in Brooklyn, OH. In the United States, the Company also leases office space in New York, NY; Birmingham, MI; Boston, MA; Brentwood, TN; Rocky River, OH; Cincinnati, OH; Denver, CO; Des Moines, IA; and San Francisco, CA. Outside the United States, the Company leases office space in Singapore, Hong Kong and London. The Company believes its existing facilities are adequate to meet its current and future business requirements.
From time to time, the Company may be subject to legal proceedings and claims in the ordinary course of business. The Company is not currently a party to any material legal proceedings.
Item 4. Mine Safety Disclosures
Not applicable
50
PART II
Item 5. Market for Registrant's Common Equity, Related Stockholder Matters and Issuer Purchases of Equity Securities.
Shares of the Company's Class A common stock have been listed and traded on NASDAQ under the symbol "VCTR" since February 8, 2018. Prior to that date, there was no public trading market for the shares of the Class A common stock. As a result, we have not set forth quarterly information with respect to the high and low sales prices for our Class A common stock or provided a performance graph. On March 27, 2018, the last reported sale price of our common stock was $12.42.
There is no established public trading market for the Company's Class B common stock.
As of March 13, 2018, there were approximately two stockholders of record of the Company's Class A common stock and 236 stockholders of record of the Company's Class B common stock. These figures do not reflect persons who held shares of Class A common stock in nominee or "street name" accounts through brokers.
Dividend Policy
We paid aggregate special dividends of $119.8 million on February 9, 2017 and $12.6 million on December 5, 2017 to holders of our common stock. See "Management's Discussion and Analysis of Financial Condition and Results of Operations—Off-Balance Sheet Arrangements" for detail on unpaid amounts with respect to these dividends as of December 31, 2017.
We do not currently intend to pay cash dividends on our common stock. Any future determinations relating to our dividend policies is limited by the terms of our indebtedness and will be made at the discretion of our board of directors, which will depend on conditions then existing, including our financial condition, results of operations, contractual restrictions, capital requirements, business prospects and other factors our board of directors may deem relevant.
Recent Sales of Unregistered Securities
On July 31, 2016, the registrant issued and sold 8,594,580 shares of its common stock for aggregate cash consideration equal to $88.3 million in connection with financing the RS Acquisition and issued 491,675 shares of its common stock to RS Investments employees in exchange for a portion of their RS Investments equity.
Since January 1, 2015, the registrant has granted to its directors, officers, employees, consultants, and other service providers options to purchase an aggregate of 4,215,882 shares of its common stock under its equity compensation plans at exercise prices ranging from approximately $5.71 to $14.27 per share.
Since January 1, 2015, the registrant has granted to its directors, officers, employees, consultants, and other service providers an aggregate of 3,143,213 shares of restricted stock under its equity compensation plans.
None of the foregoing transactions involved any underwriters, underwriting discounts or commissions, or any public offering, and the registrant believes the transactions were exempt from the registration requirements of the Securities Act of 1933 in reliance on Section 4(2) thereof, and the rules and regulations promulgated thereunder, or Rule 701 thereunder, as transactions by an issuer not involving a public offering or transactions pursuant to compensatory benefit plans and contracts relating to compensation as provided under such Rule 701. The recipients of securities in such transactions represented their intention to acquire the securities for investment only and not with a view to or for sale in connection with any distribution thereof, and appropriate legends were affixed to the share certificates and instruments issued in such transactions. If applicable, the recipients of securities were
51
accredited or sophisticated and either received adequate information about the registrant or had access, through relationships with the registrant, to such information.
Use of Proceeds
On February 7, 2018, our Registration Statement on Form S-1 (File No. 333-222509), as amended, was declared effective by the SEC for our IPO pursuant to which we registered 13,455,0000 and sold an aggregate of 12,810,860 shares of our Class A common stock at a price of $13.00 per share. J.P. Morgan Securities LLC, Merrill Lynch, Pierce, Fenner & Smith Incorporated, and Morgan Stanley & Co. LLC acted as joint book-running managers in the IPO. The IPO commenced on February 7, 2018.
On February 12, 2018, we issued 11,700,000 shares of Class A common stock in the IPO at a price of $13.00 per share. On March 13, 2018, the Company issued an additional 1,110,860 shares of Class A common stock pursuant to the underwriters' exercise of their option. The net proceeds totaled $156.5 million: $143.0 million received at the closing of the IPO and $13.5 million received at the subsequent closing of the underwriters' exercise of their option, after deducting in each case underwriting discounts.
Net proceeds received from the IPO and the Credit Agreement of $143.0 million and $355.9 million, respectively, were used concurrent with the closing of the IPO, together with $0.8 million of cash on hand, to repay the $499.7 million of outstanding term loans under the 2014 Credit Agreement. On February 21, 2018, the Company repaid $10.0 million of outstanding term loans under the Credit Agreement, and on March 19, 2018, the Company used the net proceeds from the underwriters' exercise of their option and cash on hand to repay an additional $27.0 million of the outstanding term loans under the Credit Agreement. See Note 20 of our audited financial statements included elsewhere in this report.
Item 6. Selected Financial Data
The following tables set forth our historical consolidated financial data as of and for the periods indicated. The selected consolidated financial data for the years ended, and as of, December 31, 2017, 2016 and 2015 have been derived from our audited consolidated financial statements and the notes thereto included elsewhere in this report. Our historical operating results are not necessarily indicative of future operating results.
52
The following data should be read together with our consolidated financial statements and the related notes thereto, as well as the section entitled "Management's Discussion and Analysis of Financial Condition and Results of Operations," included elsewhere in this report.
| |
Years Ended December 31, | |||||||||
|---|---|---|---|---|---|---|---|---|---|---|
| ($ in thousands, except per share data as noted) |
2017 | 2016 | 2015 | |||||||
Statement of Operations Data: |
||||||||||
Investment management fees |
$ | 343,811 | $ | 248,482 | 201,553 | |||||
Fund administration and distribution fees |
65,818 | 49,401 | 39,210 | |||||||
| | | | | | | | | | | |
Total revenue |
409,629 | 297,883 | 240,763 | |||||||
| | | | | | | | | | | |
| | | | | | | | | | | |
| | | | | | | | | | | |
Income from operations |
$ | 90,168 | $ | 24,485 | $ | 33,220 | ||||
Interest expense |
51,710 | 33,556 | 25,998 | |||||||
Income/(loss) before income taxes |
38,458 | (9,071 | ) | 7,222 | ||||||
Net income/(loss) |
25,826 | (6,071 | ) | 3,800 | ||||||
GAAP operating margin |
22.0 | % | 8.2 | % | 13.8 | % | ||||
Basic earnings per share |
$ | 0.47 | $ | (0.12 | ) | $ | 0.08 | |||
Diluted earnings per share |
$ | 0.43 | $ | (0.12 | ) | $ | 0.08 | |||
| |
Years Ended December 31, | |||||||||
|---|---|---|---|---|---|---|---|---|---|---|
| ($ in thousands) |
2017 | 2016 | 2015 | |||||||
Balance Sheet Data: |
||||||||||
Total assets |
$ | 792,622 | $ | 850,951 | $ | 620,389 | ||||
Total debt(1) |
483,225 | 418,528 | 311,898 | |||||||
Total liabilities |
561,439 | 519,953 | 370,960 | |||||||
Total equity |
231,183 | 330,998 | 249,429 | |||||||
- (1)
- Balance at December 31, 2017 is shown net of unamortized loan discount and debt issuance costs in the amount of $16.5 million. The gross principal amount of outstanding term loans under the 2014 Credit Agreement was $499.7 million.
On July 29, 2016, we acquired RS Investments, an SEC registered investment adviser, and RS Investments' wholly owned subsidiaries. Our financial results for the year ended December 31, 2016 reflect five months of post-acquisition RS Investments operations and significant acquisition-related and restructuring and integration costs related to this transaction. The year ended December 31, 2017 includes a full year of RS Investments operations. See Note 2 Significant Accounting Policies and Note 3 Acquisitions in the Consolidated Financial Statements included elsewhere in this report.
In the years ended December 31, 2017 and 2015, we made special distributions to shareholders and incurred incremental debt to fund these payments. In the year ended December 31, 2016, we incurred incremental debt to partially finance the acquisition of RS Investments. See Note 10 Debt in the Consolidated Financial Statements included elsewhere in this report.
Item 7. Management's Discussion and Analysis of Financial Condition and Results of Operations
The following discussion and analysis should be read in conjunction with the "Selected Financial Data" and our consolidated financial statements and related notes thereto included elsewhere in this report. In addition to historical information, this discussion contains forward-looking statements that involve risks, uncertainties and assumptions that could cause actual results to differ materially from management's expectations. Factors that could cause such differences are discussed in the sections entitled "Forward-Looking Statements" and "Risk Factors." We are not undertaking any obligation to update any forward-looking statements or other statements we may make in the following discussion or elsewhere in this
53
document even though these statements may be affected by events or circumstances occurring after the forward-looking statements or other statements were made. Therefore, no reader of this document should rely on these statements being current as of any time other than the date of this report.
Overview
We are an independent investment management firm operating a next generation, integrated multi-boutique model with $61.8 billion in AUM as of December 31, 2017. Our differentiated model features a scalable operating platform that provides centralized distribution, marketing and operations infrastructure to our select group of Franchises. Our earnings are primarily driven by asset-based fees charged for services related to the investment strategies we deliver and consist of investment management, fund administration and distribution fees.
We sell our products through our centralized distribution model with 96 professionals across both our institutional and retail distribution channels and marketing organization. We distribute our products through broker-dealers, retirement platforms and RIA networks. Our institutional sales team focuses on cultivating relationships with institutional consultants, who account for the majority of the institutional market, as well as mutual fund complexes seeking sub-advisers. Our retail sales team offers intermediary and retirement platform clients mutual funds and ETFs as well as SMAs through wrap fee programs and access to our investment models through UMAs.
We have grown our AUM from $17.9 billion following the management-led buyout with Crestview GP from KeyCorp in August 2013 to $61.8 billion at December 31, 2017. We attribute this growth to our success in sourcing and executing acquisitions, generating strong investment returns, and developing retail and institutional distribution channels with deep penetration.
Company History
On August 1, 2013, our management team and employees along with Crestview GP purchased all of the outstanding stock of VCM and VCA from KeyCorp. Following the acquisition, taking into account post-closing outflows, Victory had $17.9 billion in AUM, consisting of $13.7 billion in U.S. equities, $1.3 billion in international and global equities and $2.9 billion in fixed income. The investment teams consisted of the Sycamore, Expedition, NewBridge Asset Management, or NewBridge, and Diversified Franchises and included short government and investment grade convertible capabilities, which are currently part of the INCORE Capital Management, or INCORE, Franchise.
On October 31, 2014, we acquired Munder Capital. Munder Capital was an institutional investment management firm providing domestic and international equity, as well as fixed income investment solutions. The Munder Acquisition increased our AUM by $18.1 billion. The Munder Capital AUM consisted of $14.4 billion in U.S. equities, $0.7 billion in international and global equities and $3.0 billion in fixed income. The Munder, Integrity and Trivalent Franchises joined us as a result of the Munder Acquisition. In addition, Munder Capital had a core fixed income team that we combined with our short government and investment grade convertible teams to form the current INCORE Franchise. As a result of integrating the Munder Capital business onto our operating platform, we achieved approximately $23 million in annualized expense synergies.
On April 30, 2015, we acquired the business of CEMP. CEMP provided rules-based investment products that combine fundamental criteria with a long-term volatility-weighted investment philosophy through a series of mutual funds and ETF offerings. With CEMP, we acquired $1.0 billion of rules-based AUM. The CEMP Acquisition also marked our entry into the ETF marketplace. For each year during the four-year period following the closing, the CEMP sellers are entitled to future payments in fixed amounts, with the fixed amounts increasing over the four-year period, and variable amounts in respect of investment management revenue attributable to the CEMP business. The first earn-out
54
payments were made in 2016. See "—Contractual Obligations" and Note 3 of our audited financial statements included elsewhere in this report.
On July 29, 2016, we acquired RS Investments, an SEC-registered investment adviser, and RS Investments' wholly owned subsidiaries. RS Investments provided investment advisory and related services to institutional and retail clients. The RS Acquisition increased our AUM by $16.7 billion at closing. The RS Investments AUM at closing consisted of $10.4 billion in U.S. equities, $0.9 billion in international and global equities, $3.3 billion in fixed income and $2.1 billion in commodities. We added the RS Investments and Sophus Capital Franchises as a result of the acquisition. In addition, the INCORE Franchise began managing two of RS Investments' fixed income strategies that had been sub-advised by a third-party prior to the RS Acquisition, and we acquired two significant sub-advising relationships. As a result of integrating the RS Investments business onto our operating platform, we achieved approximately $52 million in annualized net expense synergies as of December 31, 2017 ($2.5 million of which was not reflected in our earnings as of such date).
On February 12, 2018, we issued 11,700,000 shares of Class A common stock in the IPO at a price of $13.00 per share. On March 13, 2018, the Company issued an additional 1,110,860 shares of Class A common stock pursuant to the underwriters' exercise of their option. The net proceeds totaled $156.5 million: $143.0 million received at the closing of the IPO and $13.5 million received at the subsequent closing of the underwriters' exercise of their option, after deducting in each case underwriting discounts.
Net proceeds received from the IPO and the Credit Agreement of $143.0 million and $355.9 million, respectively, were used concurrent with the closing of the IPO, together with $0.8 million of cash on hand, to repay the $499.7 million of outstanding term loans under the 2014 Credit Agreement. On February 21, 2018, the Company repaid $10.0 million of outstanding term loans under the Credit Agreement, and on March 19, 2018, the Company used the net proceeds from the underwriters' exercise of their option and cash on hand to repay an additional $27.0 million of the outstanding term loans under the Credit Agreement. See Note 20 of our audited financial statements included elsewhere in this report.
Highlights for 2017
2017 business and financial highlights included:
- •
- AUM was $61.8 billion at December 31, 2017 compared to $55.0 billion at December 31, 2016, up 12% driven primarily
by market appreciation. We had strong growth in gross flows and saw negative net flows primarily due to the decision to exit the Diversified Equity Franchise and client reallocations due to strong
investment performance. We generated $16.9 billion in gross flows and ($1.5) billion in negative net flows for the year ended December 31, 2017 compared to $16.0 billion and
$0.9 billion, respectively, for the year ended December 31, 2016.
- •
- Our Franchises had strong investment performance. As of December 31, 2017, 24 of our mutual funds and ETFs have overall Morningstar
ratings of four or five stars and 66% of our fund AUM was rated four or five stars by Morningstar. As of December 31, 2017, 80% of our strategies by AUM had returns in excess of their
respective benchmarks over a ten-year period, 84% over a five-year period and 84% over a three-year period. On an equal-weighted basis, 75% of our strategies have outperformed their benchmarks over a
ten-year period, 77% over a five-year period and 72% over a three-year period.
- •
- The industry recognized us for our achievements. We were ranked #1 for Institutional Brand Awareness among asset managers with between $25 billion and $50 billion in AUM in 2015 and #4 for Institutional Brand Awareness among asset managers with between $50 billion and $100 billion in both 2016 and 2017 by eVestment. We ranked 10th in Barron's Best Fund Families
55
- •
- We completed the integration of the RS Investments business onto our operating platform and we achieved approximately $52 million in net
annualized expense synergies as of December 31, 2017 ($2.5 million of which was not reflected in our earnings as of such date).
- •
- Total revenue for the year ended December 31, 2017 was $409.6 million compared to $297.9 million for the year ended
December 31, 2016.
- •
- Net income was $25.8 million for the year ended December 31, 2017 compared to net loss of ($6.1) million for the year ended
December 31, 2016.
- •
- Adjusted EBITDA was $149.1 million for the year ended December 31, 2017 compared to $98.1 million for the year ended
December 31, 2016. See "—Supplemental Non-GAAP Financial Information" for more information about how we calculate Adjusted EBITDA and a reconciliation of net income to Adjusted
EBITDA.
- •
- Adjusted Net Income was $61.9 million for the year ended December 31, 2017 compared to $39.0 million for the year ended December 31, 2016. See "—Supplemental Non-GAAP Financial Information" for more information about how we calculate Adjusted Net Income and a reconciliation of net income to Adjusted Net Income.
for 2017. This is the fourth consecutive year that we have been ranked among the top 25 fund families by Barron's.
Key Performance Indicators
When we review our performance we focus on the indicators described below:
| |
Year Ended December 31, | |||||||||
|---|---|---|---|---|---|---|---|---|---|---|
| ($ in millions) |
2017 | 2016 | 2015 | |||||||
AUM at period end |
$ | 61,771 | $ | 54,965 | $ | 33,111 | ||||
Average AUM |
57,823 | 41,756 | 35,418 | |||||||
Gross flows |
16,929 | 16,037 | 7,792 | |||||||
Net flows (excluding Diversified)(1) |
(853 | ) | 2,266 | (889 | ) | |||||
Total revenue |
409.6 | 297.9 | 240.8 | |||||||
Revenue on average AUM |
71 bps | 71 bps | 68 bps | |||||||
Net income/(loss) |
25.8 | (6.1 | ) | 3.8 | ||||||
Adjusted EBITDA(2) |
149.1 | 98.1 | 82.1 | |||||||
Adjusted EBITDA Margin(3) |
36.4 | % | 32.9 | % | 34.1 | % | ||||
Adjusted Net Income(2) |
62.0 | 39.0 | 34.3 | |||||||
Tax benefit of goodwill and acquired intangibles(4) |
19.7 | 16.8 | 14.8 | |||||||
- (1)
- Total
net flows including Diversified were ($1,471), $875, ($2,776) for the years ended December 31, 2017, 2016 and 2015. See "Business—Our
Franchises—Munder Capital Management."
- (2)
- Our
management uses Adjusted EBITDA and Adjusted Net Income to measure the operating profitability of the business. These measures eliminate the impact of one-time
acquisition, restructuring and integration costs and demonstrate the ongoing operating earnings metrics of the business. These measures are explained in more detail and reconciled to net income
calculated in accordance with GAAP in "—Supplemental Non-GAAP Financial Information."
- (3)
- Adjusted
EBITDA margin represents Adjusted EBITDA as a percentage of total revenue.
- (4)
- Represents the tax benefits associated with deductions allowed for intangibles and goodwill generated from prior acquisitions in which we received a step-up in basis for tax purposes.
56
Acquired intangible assets and goodwill may be amortized for tax purposes, generally over a 15-year period. The tax benefit from amortization on these assets is included to show the full economic benefit of deductions for all acquired intangibles with a step-up in tax basis. Due to our acquisitive nature, tax deductions allowed on acquired intangible assets and goodwill provide us with a significant supplemental economic benefit. On December 22, 2017, the Tax Cuts and Jobs Act ("Tax Act") was enacted. The Tax Act significantly revises the U.S. corporate income tax law by, among other things, decreasing the federal corporate income tax rate from 35% to 21% effective January 1, 2018. As a result of the reduction in the corporate income tax rate, we are required to remeasure our U.S. net deferred taxes at December 31, 2017. The impact of the remeasurement resulted in a one-time credit to income tax expense of $2.4 million for the three months and year ended December 31, 2017. Effective January 1, 2018, we estimate the impact of the Tax Act will lower our combined statutory federal income tax rate plus an estimate for state, local and foreign income taxes from approximately 38% to 24% thus lowering our income tax expense beginning in calendar year 2018. The reduction in our combined statutory federal income tax rate plus an estimate for state, local and foreign income taxes from approximately 38% to 24% will also reduce the tax benefit of goodwill and acquired intangible assets beginning in 2018.
Assets Under Management
Our profitability is largely affected by the level and composition of our AUM (including asset class and distribution channel) and the effective fee rates on our products. The amount and composition of our AUM are, and will continue to be, influenced by a number of factors, including:
- •
- investment performance, including fluctuations in the financial markets and the quality of our investment decisions;
- •
- client flows into and out of our various strategies and investment vehicles;
- •
- industry trends toward products or strategies that we either do or do not offer;
- •
- our ability to attract and retain high quality investment, distribution, marketing and management personnel;
- •
- our decision to close strategies or limit growth of assets in a strategy when we believe it is in the best interest of our clients or
conversely to re-open strategies in part or entirely; and
- •
- general investor sentiment and confidence.
57
Our goal is to establish and maintain a client base that is diversified by Franchise and Solutions Platform, asset class, distribution channel and vehicle. The chart below sets forth our AUM by Franchise and Solutions Platform as of December 31, 2017:
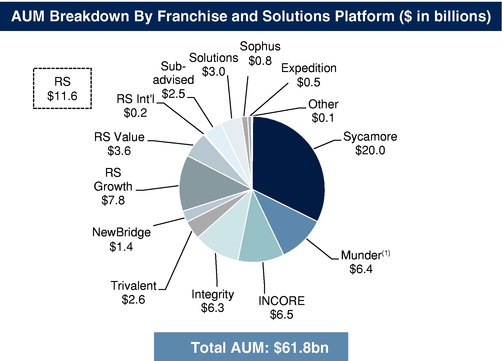
- (1)
- Includes assets managed by Diversified, which were transferred to Munder on May 15, 2017. See "Business—Our Franchises—Munder Capital Management."
The following table presents our AUM by asset class as of the dates indicated:
| |
As of December 31, | As of July 31, |
||||||||||||||
|---|---|---|---|---|---|---|---|---|---|---|---|---|---|---|---|---|
| ($ in millions) |
2017 | 2016(1) | 2015(2) | 2014(3) | 2013 | |||||||||||
U.S. Mid Cap Equity |
$ | 25,185 | $ | 20,083 | $ | 12,401 | $ | 13,887 | $ | 3,269 | ||||||
U.S. Small Cap Equity |
15,308 | 14,090 | 6,500 | 5,882 | 2,261 | |||||||||||
Fixed Income |
7,551 | 7,726 | 5,058 | 5,338 | 2,870 | |||||||||||
U.S. Large Cap Equity |
4,789 | 5,921 | 5,763 | 8,906 | 8,195 | |||||||||||
Global / Non-U.S. Equity |
4,105 | 3,460 | 2,114 | 1,474 | 1,267 | |||||||||||
Solutions |
3,028 | 1,575 | 953 | — | — | |||||||||||
Commodity |
1,419 | 1,882 | — | — | — | |||||||||||
Other |
386 | 229 | 322 | 450 | 27 | |||||||||||
| | | | | | | | | | | | | | | | | |
Total |
$ | 61,771 | $ | 54,965 | $ | 33,111 | $ | 35,936 | $ | 17,887 | ||||||
| | | | | | | | | | | | | | | | | |
| | | | | | | | | | | | | | | | | |
| | | | | | | | | | | | | | | | | |
- (1)
- Includes
the impact of the RS Acquisition, which closed on July 29, 2016, and increased our AUM by $16.7 billion.
- (2)
- Includes
the impact of the CEMP Acquisition, which closed on April 30, 2015, and increased our AUM by $1.0 billion.
- (3)
- Includes the impact of the Munder Acquisition, which closed on October 31, 2014, and increased our AUM by $18.1 billion.
58
- (4)
- Represents the AUM acquired in our management-led buyout with Crestview GP from KeyCorp, which closed on July 31, 2013, taking into account post-closing outflows.
The following table summarizes our asset flows by asset class for the periods indicated:
| ($ in millions) |
U.S. Mid Cap Equity |
U.S. Small Cap Equity |
Fixed Income |
U.S. Large Cap Equity(1) |
Global / Non-U.S. Equity |
Commodity | Solutions | Other | Total | |||||||||||||||||||
|---|---|---|---|---|---|---|---|---|---|---|---|---|---|---|---|---|---|---|---|---|---|---|---|---|---|---|---|---|
Year Ended December 31, 2017 |
||||||||||||||||||||||||||||
Beginning AUM |
$ | 20,083 | $ | 14,090 | $ | 7,726 | $ | 5,921 | $ | 3,460 | $ | 1,882 | $ | 1,575 | $ | 229 | $ | 54,965 | ||||||||||
Gross client cash inflows |
8,622 | 3,613 | 1,777 | 230 | 924 | 305 | 1,342 | 116 | 16,929 | |||||||||||||||||||
Gross client cash outflows |
(7,299 | ) | (4,722 | ) | (2,240 | ) | (1,702 | ) | (1,333 | ) | (778 | ) | (213 | ) | (113 | ) | (18,400 | ) | ||||||||||
| | | | | | | | | | | | | | | | | | | | | | | | | | | | | |
Net client cash flows |
1,323 | (1,109 | ) | (462 | ) | (1,472 | ) | (410 | ) | (473 | ) | 1,129 | 3 | (1,471 | ) | |||||||||||||
Net transfers |
1 | — | (101 | ) | (7 | ) | (18 | ) | — | (28 | ) | 57 | (95 | ) | ||||||||||||||
Market appreciation / (depreciation) |
3,778 | 2,327 | 388 | 347 | 1,073 | 10 | 352 | 96 | 8,372 | |||||||||||||||||||
| | | | | | | | | | | | | | | | | | | | | | | | | | | | | |
Ending AUM |
$ | 25,185 | $ | 15,308 | $ | 7,551 | $ | 4,789 | $ | 4,105 | $ | 1,419 | $ | 3,028 | $ | 386 | $ | 61,771 | ||||||||||
| | | | | | | | | | | | | | | | | | | | | | | | | | | | | |
| | | | | | | | | | | | | | | | | | | | | | | | | | | | | |
| | | | | | | | | | | | | | | | | | | | | | | | | | | | | |
Year Ended December 31, 2016 |
||||||||||||||||||||||||||||
Beginning AUM(2) |
$ | 12,396 | $ | 6,500 | $ | 5,058 | $ | 5,763 | $ | 2,114 | — | $ | 953 | $ | 327 | $ | 33,111 | |||||||||||
Gross client cash inflows |
8,965 | 3,263 | 1,639 | 276 | 1,021 | 169 | 691 | 12 | 16,037 | |||||||||||||||||||
Gross client cash outflows |
(5,898 | ) | (3,341 | ) | (2,400 | ) | (1,962 | ) | (537 | ) | (500 | ) | (491 | ) | (34 | ) | (15,162 | ) | ||||||||||
| | | | | | | | | | | | | | | | | | | | | | | | | | | | | |
Net client cash flows |
3,067 | (78 | ) | (761 | ) | (1,686 | ) | 484 | (330 | ) | 201 | (22 | ) | 875 | ||||||||||||||
Net transfers(3) |
2,658 | 5,360 | 3,323 | 2,087 | 852 | 2,110 | 283 | (87 | ) | 16,587 | ||||||||||||||||||
Market appreciation / (depreciation) |
1,961 | 2,307 | 107 | (243 | ) | 9 | 102 | 139 | 11 | 4,393 | ||||||||||||||||||
| | | | | | | | | | | | | | | | | | | | | | | | | | | | | |
Ending AUM |
$ | 20,083 | $ | 14,090 | $ | 7,726 | $ | 5,921 | $ | 3,460 | $ | 1,882 | $ | 1,575 | $ | 229 | $ | 54,965 | ||||||||||
| | | | | | | | | | | | | | | | | | | | | | | | | | | | | |
| | | | | | | | | | | | | | | | | | | | | | | | | | | | | |
| | | | | | | | | | | | | | | | | | | | | | | | | | | | | |
Year Ended December 31, 2015 |
||||||||||||||||||||||||||||
Beginning AUM |
$ | 13,887 | $ | 5,882 | $ | 5,338 | $ | 8,906 | $ | 1,474 | $ | — | $ | — | $ | 450 | $ | 35,936 | ||||||||||
Gross client cash inflows |
2,789 | 2,302 | 975 | 383 | 875 | — | 420 | 48 | 7,792 | |||||||||||||||||||
Gross client cash outflows |
(3,767 | ) | (1,437 | ) | (1,243 | ) | (3,326 | ) | (277 | ) | — | (357 | ) | (160 | ) | (10,567 | ) | |||||||||||
| | | | | | | | | | | | | | | | | | | | | | | | | | | | | |
Net client cash flows |
(978 | ) | 865 | (267 | ) | (2,943 | ) | 598 | — | 63 | (113 | ) | (2,776 | ) | ||||||||||||||
Net transfers(4) |
6 | — | 0 | 26 | — | — | 958 | (26 | ) | 964 | ||||||||||||||||||
Market appreciation / (depreciation) |
(513 | ) | (246 | ) | (14 | ) | (225 | ) | 42 | — | (68 | ) | 11 | (1,013 | ) | |||||||||||||
| | | | | | | | | | | | | | | | | | | | | | | | | | | | | |
Ending AUM |
$ | 12,401 | $ | 6,500 | $ | 5,058 | $ | 5,763 | $ | 2,114 | $ | — | $ | 953 | $ | 322 | $ | 33,111 | ||||||||||
| | | | | | | | | | | | | | | | | | | | | | | | | | | | | |
| | | | | | | | | | | | | | | | | | | | | | | | | | | | | |
| | | | | | | | | | | | | | | | | | | | | | | | | | | | | |
- (1)
- Includes
Diversified. See "Business—Our Franchises—Munder Capital Management."
- (2)
- Reflects
transfer of $5.0 million in assets from U.S. mid cap Equity to Other effective January 1, 2016.
- (3)
- Includes
the impact of the RS Acquisition, which closed on July 29, 2016, and increased our AUM by $16.7 billion.
- (4)
- Reflects the impact of the CEMP Acquisition, which closed on April 30, 2015, and increased our AUM by $1.0 billion.
In connection with the retirement of our two CIOs at Diversified, we made the strategic decision to exit this Franchise and move the remaining AUM into our Munder Franchise, which was completed as of May 15, 2017. The following table presents the impact of Diversified on net client cash flows for
59
the periods indicated. Given this decision, we believe this presentation is a better representation of our business on a going-forward basis.
| |
Year Ended December 31, | |||||||||
|---|---|---|---|---|---|---|---|---|---|---|
| ($ in millions) |
2017 | 2016 | 2015 | |||||||
Net client cash flows—Total Company |
$ | (1,471 | ) | $ | 875 | $ | (2,776 | ) | ||
Net client cash flows—Diversified |
(618 | ) | (1,391 | ) | (1,887 | ) | ||||
| | | | | | | | | | | |
Net client cash flows—Total Company excluding Diversified |
$ | (853 | ) | $ | 2,266 | $ | (889 | ) | ||
| | | | | | | | | | | |
| | | | | | | | | | | |
| | | | | | | | | | | |
The following table presents our AUM by distribution channel as of the dates indicated:
| |
As of December 31, | ||||||||||||||||||
|---|---|---|---|---|---|---|---|---|---|---|---|---|---|---|---|---|---|---|---|
| |
2017 | 2016 | 2015 | ||||||||||||||||
| ($ in millions) |
Amount | % of total | Amount | % of total | Amount | % of total | |||||||||||||
Institutional |
$ | 35,695 | 58 | % | $ | 30,360 | 55 | % | $ | 16,988 | 51 | % | |||||||
Retail |
26,076 | 42 | % | 24,605 | 45 | % | 16,123 | 49 | % | ||||||||||
| | | | | | | | | | | | | | | | | | | | |
Total AUM(1) |
$ | 61,771 | 100 | % | $ | 54,965 | 100 | % | $ | 33,111 | 100 | % | |||||||
| | | | | | | | | | | | | | | | | | | | |
| | | | | | | | | | | | | | | | | | | | |
| | | | | | | | | | | | | | | | | | | | |
- (1)
- The allocation of AUM by distribution channel involves the use of estimates and the exercise of judgment.
60
The following table summarizes our asset flows by vehicle for the periods indicated:
| ($ in millions) |
Mutual Funds(1) | ETFs | Other(2) | Total | |||||||||
|---|---|---|---|---|---|---|---|---|---|---|---|---|---|
Year Ended December 31, 2017 |
|||||||||||||
Beginning AUM |
$ | 33,975 | $ | 906 | $ | 20,085 | $ | 54,965 | |||||
Gross client cash inflows |
11,922 | 1,111 | 3,896 | 16,929 | |||||||||
Gross client cash outflows |
(13,259 | ) | (20 | ) | (5,121 | ) | (18,400 | ) | |||||
| | | | | | | | | | | | | | |
Net client cash flows |
(1,337 | ) | 1,091 | (1,225 | ) | (1,471 | ) | ||||||
Net transfers |
(98 | ) | — | 3 | (95 | ) | |||||||
Market appreciation / (depreciation) |
5,427 | 253 | 2,692 | 8,372 | |||||||||
| | | | | | | | | | | | | | |
Ending AUM |
$ | 37,967 | $ | 2,250 | $ | 21,555 | $ | 61,771 | |||||
| | | | | | | | | | | | | | |
| | | | | | | | | | | | | | |
| | | | | | | | | | | | | | |
Year Ended December 31, 2016 |
|||||||||||||
Beginning AUM |
$ | 17,103 | $ | 353 | $ | 15,655 | $ | 33,111 | |||||
Gross client cash inflows |
10,388 | 536 | 5,112 | 16,037 | |||||||||
Gross client cash outflows |
(9,703 | ) | (61 | ) | (5,397 | ) | (15,162 | ) | |||||
| | | | | | | | | | | | | | |
Net client cash flows |
685 | 475 | (285 | ) | 875 | ||||||||
Net transfers(3) |
13,043 | — | 3,543 | 16,587 | |||||||||
Market appreciation/(depreciation) |
3,144 | 77 | 1,171 | 4,393 | |||||||||
| | | | | | | | | | | | | | |
Ending AUM |
$ | 33,975 | $ | 906 | $ | 20,085 | $ | 54,965 | |||||
| | | | | | | | | | | | | | |
| | | | | | | | | | | | | | |
| | | | | | | | | | | | | | |
Year Ended December 31, 2015 |
|||||||||||||
Beginning AUM |
$ | 16,814 | $ | — | $ | 19,122 | $ | 35,936 | |||||
Gross client cash inflows |
5,776 | 233 | 1,783 | 7,792 | |||||||||
Gross client cash outflows |
(5,587 | ) | (53 | ) | (4,927 | ) | (10,567 | ) | |||||
| | | | | | | | | | | | | | |
Net client cash flows |
189 | 180 | (3,144 | ) | (2,776 | ) | |||||||
Net transfers(4) |
646 | 198 | 119 | 964 | |||||||||
Market appreciation/(depreciation) |
(546 | ) | (25 | ) | (443 | ) | (1,013 | ) | |||||
| | | | | | | | | | | | | | |
Ending AUM |
$ | 17,103 | $ | 353 | $ | 15,655 | $ | 33,111 | |||||
| | | | | | | | | | | | | | |
| | | | | | | | | | | | | | |
| | | | | | | | | | | | | | |
- (1)
- Includes
institutional and retail share classes.
- (2)
- Includes
institutional separate accounts, collective trust funds, wrap program separate accounts and UMAs.
- (3)
- Includes
the impact of the RS Acquisition, which closed on July 29, 2016, and increased our AUM by $16.7 billion.
- (4)
- Reflects the impact of the CEMP Acquisition, which closed on April 30, 2015, and increased our AUM by $1.0 billion.
At December 31, 2017, our total AUM was $61.8 billion, an increase of $6.8 billion, or 12% compared to $55.0 billion at December 31, 2016. The change in AUM during the year ended December 31, 2017 reflects net market appreciation of $8.4 billion, net outflows of ($1.5) billion and a ($0.1) billion reduction primarily related to mutual fund liquidation. Excluding the impact of outflows from Diversified, net outflows would have been ($0.9) billion for the period. The net outflows were primarily a result of ($1.5) billion net outflows in our U.S. large cap equity strategies, ($1.1) billion in our U.S. small cap equity strategies, ($0.5) billion in our commodity strategies, ($0.4) billion in our global / non-U.S. equity strategies and ($0.4) billion in our fixed income strategies, which was partially offset by $1.3 billion of net inflows in our U.S. mid cap equity strategies and $1.1 billion in our Solutions Platform.
61
At December 31, 2016, our total AUM was $55.0 billion, an increase of $21.9 billion, or 66%, compared to $33.1 billion at December 31, 2015. In addition to the RS Acquisition, which accounted for an increase in AUM of $16.7 billion as of the closing on July 29, 2016, the change in AUM during the year ended December 31, 2016 reflects net market appreciation of $4.4 billion and net inflows of $0.9 billion. The change in AUM during the year ended December 31, 2015 reflects net market depreciation of ($1.0) billion and net outflows of ($2.8) billion partially offset by the addition of $1.0 billion of AUM as a result of the CEMP Acquisition.
For the year ended December 31, 2016, our net inflows were $0.9 billion. Excluding the impact of outflows from Diversified, net inflows would have been $2.3 billion in 2016. The net inflows were primarily a result of $3.1 billion of net inflows in our U.S. mid cap equity strategies, $0.5 billion in our global / non-U.S. equity strategies and $0.2 billion in our Solutions Platform, which was largely offset by ($1.7) billion net outflows in our U.S. large cap equity strategies, ($0.8) billion in our fixed income strategies and ($0.3) billion in our commodity strategies. For the year ended December 31, 2015, our net outflows were ($2.8) billion primarily due to ($2.9) billion net outflows in our U.S. large cap equity strategies. Excluding the impact of outflows from Diversified, net outflows would have been ($0.9) billion in 2015.
GAAP Results of Operations
Our GAAP revenues principally consist of:
- i.
- Investment
management fees, which are based on our overall weighted average fee rate charged to our clients and our level of AUM; and
- ii.
- Fund administration and distribution fees, which are asset-based fees earned from open-end mutual funds for administration and distribution services.
Investment Management Fees
Investment management fees are earned from managing clients' assets. Our investment management fee revenue fluctuates based on a number of factors, including the total value of our AUM, the composition of AUM across investment strategies and vehicles, changes in the investment management fee rates on our products and the extent to which we enter into fee arrangements that differ from our standard fee schedule. Investment management fees are earned based on a percentage of AUM as delineated in the respective investment management agreements. Approximately 87% of our management fees are calculated based on daily average AUM with the remainder calculated based on monthly average AUM or point in time AUM.
Fund Administration and Distribution Fees
Fund administration fees are asset-based fees earned from open-end funds for administration services. Fund administration fees fluctuate based on the level of average open-end AUM and the fee rates charged for these services.
Fund distribution fees are asset-based fees earned from open-end funds for distribution services. Fund distribution fees fluctuate based on the level of average open-end AUM and the composition of those assets across share classes that pay varying levels of fund distribution fees.
Our GAAP expenses principally consist of:
- i.
- Personnel
compensation and benefits;
- ii.
- Distribution
and other asset-based expenses;
- iii.
- General and administration expenses;
62
- iv.
- Depreciation
and amortization charges; and
- v.
- Acquisition-related costs and restructuring / integration costs.
Personnel Compensation and Benefits
Personnel compensation and benefits is our most significant category of expense. Personnel compensation and benefits consists of (i) salaries, payroll related taxes and employee benefits, (ii) incentive compensation, (iii) sales-based compensation, (iv) compensation expense related to equity awards granted to employees and (v) acquisition-related compensation in the form of cash retention bonuses.
Incentive compensation is the largest component of the total compensation of our employees. The aggregate amount of cash incentive compensation is funded by a pool that is based on a percentage of total Company earnings (before taking into account incentive compensation). This incentive pool is used to pay the investment teams a percentage of the revenue earned by their respective Franchise on a quarterly basis. This incentive pool is also used to pay incentive compensation to senior management and other non-investment employees on an annual basis. Incentive compensation paid to senior management and to other non-investment employees is discretionary and subjectively determined based on Company and individual performance and the total amount of the incentive compensation pool.
Distribution and Other Asset-based Expenses
Distribution and other asset-based expenses consists of (i) broker-dealer distribution fees and platform distribution fees, (ii) fund expense reimbursements to affiliates and (iii) sub-administration, sub-advisory and middle-office expenses.
Broker-dealer distribution fees are paid by VCA as the broker-dealer for the Victory Funds to third-party distributors. The Victory Funds pay VCA for distribution services and VCA, in turn, pays third-party distributors.
Platform distribution fees are paid by VCM as the investment adviser to the Victory Funds. Platform distribution fees are paid to financial advisors, retirement plan providers and intermediaries for servicing and administering accounts invested in shares of the Victory Funds. Distribution fees typically vary based on the level of AUM and the composition of those assets across share classes.
Fund expense reimbursements result from VCM, as investment adviser for the Victory Funds and VictoryShares, agreeing to cap the annual operating expenses for certain share classes of the Victory Funds and VictoryShares. VCM has contractually agreed to reimburse the Victory Funds and VictoryShares for expenses in excess of these caps but may recoup these reimbursements for a period of time if the applicable Fund's share class expenses and/or VictoryShares ETF expenses fall below the cap.
Sub-administration, sub-advisory and middle-office expenses consist of fees paid to our sub-administrator of the Victory Funds, fees paid to sub-advisers on certain Victory Funds and fees paid to vendors to which we outsource middle-office functions.
- •
- VCM acts as the administrator to the Victory Funds and VictoryShares. VCM has hired a sub-administrator, the fees for which are captured in
sub-administration expense. As administrator, VCM supervises the operations of the Victory Funds and VictoryShares, including the services provided by the sub-administrator. The sub-administrator is
paid through a contractual arrangement based on a percentage of the average open-end mutual fund AUM.
- •
- VCM, as the investment adviser for the Victory Funds, has hired unaffiliated sub-advisers to manage funds for which we do not have in-house capabilities. The fees paid to the sub-advisers are contractual based on a percentage of assets that they manage.
63
- •
- We have outsourced middle-office operations to achieve a scalable operational infrastructure that utilizes a variable-cost model. We have selected to partner with top-tier vendors who perform trade operations, portfolio accounting and performance measurement with oversight from our operations team. The fees paid to these vendors are variable and structured based on the number of accounts, assets and specific services performed.
General and Administrative Expenses
General and administrative expenses primarily consist of investment research and technology costs, professional and marketing fees, travel, rent and insurance expenses.
Depreciation and Amortization
Depreciation and amortization expense consists primarily of the depreciation of property and equipment as well as the amortization of acquired intangibles that have a definite life. These intangibles include customer relationships, investment advisory contracts, intellectual property and non-compete clauses acquired in connection with a business or asset acquisition. Both depreciation and amortization are recorded ratably over the assets' useful lives.
Acquisition-Related Costs
Acquisition-related costs include legal fees, advisory services, mutual fund proxy voting costs and other one-time expenses related to acquisitions.
Restructuring and Integration Costs
Restructuring and integration costs include costs incurred in connection with business combinations, asset purchases and changes in business strategy. These include severance related expenses related to one-time benefit arrangements, contract termination and other costs to integrate investment platforms, products and personnel into existing systems, processes and service provider arrangements and restructure the business to capture operating expenses synergies.
Other non-operating items of income and expense consist of:
- i.
- Interest
expense and other financing costs; and
- ii.
- Income tax (expense)/benefit.
Interest Expense and Other Financing Costs
Interest expense and other financing costs consists primarily of interest expense attributable to long-term debt. See "—Liquidity and Capital Resources" for more information.
Income Tax (Expense)/Benefit
The provision for income taxes includes U.S. federal, state and local taxes, and following the RS Acquisition in 2016, foreign income taxes payable by certain of our subsidiaries. The effective tax rate is primarily driven by state and local taxes and permanent differences related to meals and entertainment. The portion of the effective income tax rate attributable to state and local income taxes varies from year to year depending on amounts of income apportioned to each jurisdiction, whether we file income tax returns on a unitary or separate return basis and with changes in tax laws.
64
Our GAAP results of operations were as follows for the years ended December 31, 2017 and 2016.
| |
Year Ended December 31, | Change | |||||||||||
|---|---|---|---|---|---|---|---|---|---|---|---|---|---|
| ($ in thousands, other than per share amounts) |
2017 | 2016 | Amount | % | |||||||||
Revenue |
|||||||||||||
Investment management fees |
$ | 343,811 | $ | 248,482 | $ | 95,329 | 38 | % | |||||
Fund administration and distribution fees |
65,818 | 49,401 | 16,417 | 33 | % | ||||||||
| | | | | | | | | | | | | | |
Total revenue |
409,629 | 297,883 | 111,746 | 38 | % | ||||||||
| | | | | | | | | | | | | | |
Expenses |
|||||||||||||
Personnel compensation and benefits |
$ | 144,111 | $ | 122,615 | $ | 21,496 | 18 | % | |||||
Distribution and other asset-based expenses |
103,439 | 77,497 | 25,942 | 33 | % | ||||||||
General and administrative |
33,996 | 26,628 | 7,368 | 28 | % | ||||||||
Depreciation and amortization |
29,910 | 30,405 | (495 | ) | –2 | % | |||||||
Change in value of consideration payable for acquisition of business |
(294 | ) | (378 | ) | 84 | –22 | % | ||||||
Acquisition-related costs |
2,094 | 6,619 | (4,525 | ) | –68 | % | |||||||
Restructuring and integration costs |
6,205 | 10,012 | (3,807 | ) | –38 | % | |||||||
| | | | | | | | | | | | | | |
Total operating expenses |
319,461 | 273,398 | 46,063 | 17 | % | ||||||||
| | | | | | | | | | | | | | |
Income from operations |
90,168 | 24,485 | 65,683 | 268 | % | ||||||||
Other income (expense) |
|||||||||||||
Interest income and other income/(expense) |
$ | (2,913 | ) | $ | 1,086 | $ | (3,999 | ) | n/m | ||||
Interest expense and other financing costs |
(48,797 | ) | (34,642 | ) | (14,155 | ) | 41 | % | |||||
| | | | | | | | | | | | | | |
Total other income (expense), net |
(51,710 | ) | (33,556 | ) | (18,154 | ) | 54 | % | |||||
| | | | | | | | | | | | | | |
Income/(loss) before income taxes |
38,458 | (9,071 | ) | 47,529 | n/m | ||||||||
Income tax (expense)/benefit |
(12,632 | ) | 3,000 | (15,632 | ) | n/m | |||||||
| | | | | | | | | | | | | | |
Net income/(loss) |
$ | 25,826 | $ | (6,071 | ) | $ | 31,897 | n/m | |||||
| | | | | | | | | | | | | | |
| | | | | | | | | | | | | | |
| | | | | | | | | | | | | | |
Earnings per share—basic |
$ | 0.47 | $ | (0.12 | ) | $ | 0.59 | n/m | |||||
Earnings per share—diluted |
$ | 0.43 | $ | (0.12 | ) | $ | 0.55 | n/m | |||||
Weighted average shares outstanding—basic |
54,930,852 | 50,017,712 | 4,913,140 | 10 | % | ||||||||
Weighted average shares outstanding—diluted |
59,577,348 | 50,017,712 | 9,559,636 | 19 | % | ||||||||
Dividends declared per share |
$ | 2.42 | $ | — | $ | 2.42 | n/m | ||||||
Investment Management Fees
Investment management fees increased $95.3 million, or 38%, for the year ended December 31, 2017 compared to the year ended December 31, 2016 due to an increase in AUM year over year. AUM increased by $6.8 billion to $61.8 billion at December 31, 2017 from $55.0 billion at December 31, 2016, due to $8.4 billion of market appreciation partially offset by $1.5 billion of net outflows and a $0.1 billion reduction primarily related to mutual fund liquidations during the 12 months ended December 31, 2017.
Fund Administration and Distribution Fees
Fund administration and distribution fees totaled $65.8 million for the year ended December 31, 2017, an increase of $16.4 million, or 33%, when compared to the year ended December 31, 2016, due to an increase in open-end mutual fund AUM. Open-end mutual fund daily average AUM grew by $12.0 billion from $24.2 billion for the year ended December 31, 2016 to $36.2 billion for the year ended December 31, 2017 due primarily to the RS Acquisition (which was completed in July 2016 and included $13.2 billion of open-end mutual fund AUM at the date of acquisition). The increase in fees
65
due to higher average AUM was partially offset by a reduction in the fee rate earned for administrative services. The administrative fee schedule is tiered such that the average fee rate earned declines as AUM increase.
Personnel Compensation and Benefits
The following table presents the components of GAAP compensation expense for the year ended December 31, 2017 and 2016:
| |
Year Ended December 31, |
||||||
|---|---|---|---|---|---|---|---|
| ($ in thousands) |
2017 | 2016 | |||||
Salaries, payroll related taxes and employee benefits |
$ | 49,745 | $ | 42,963 | |||
Incentive compensation |
65,984 | 51,738 | |||||
Sales-based compensation(1) |
15,051 | 12,693 | |||||
Equity awards granted to employees(2) |
11,752 | 8,827 | |||||
Acquisition-related cash retention compensation |
1,579 | 6,394 | |||||
| | | | | | | | |
Total compensation and benefits expense |
$ | 144,111 | $ | 122,615 | |||
| | | | | | | | |
| | | | | | | | |
| | | | | | | | |
- (1)
- Represents
sales-based commissions paid to our distribution teams. Sales-based compensation varies based on gross client cash flows and revenue earned on sales.
- (2)
- Equity awards typically vest over several years based on service and the achievement of specific business and financial targets. The value of the equity awards are recognized as compensation expense over the vesting period.
Personnel compensation and benefits was $144.1 million for the year ended December 31, 2017, an increase of $21.5 million, or 18%, from $122.6 million for the year ended December 31, 2016. Salaries and benefits was $49.7 million for the year ended December 31, 2017, an increase of $6.7 million, or 16%, from $43.0 million for the year ended December 31, 2016. This increase reflects the effect of increased headcount due to the RS Acquisition as well as new hires and annual salary increases. Incentive compensation was $66.0 million for the year ended December 31, 2017, an increase of $14.3 million, or 28%, from $51.7 million for the year ended December 31, 2016, due to higher pre-incentive compensation earnings and the effect of the RS Acquisition. Sales-based compensation was $15.0 million for the year ended December 31, 2017, an increase of $2.3 million, or 18%, from $12.7 million for the year ended December 31, 2016, as a result of higher gross flows and revenue. Equity award expense was $11.8 million for the year ended December 31, 2017, an increase of $3.0 million, or 34%, from $8.8 million for the year ended December 31, 2016, due to the equity awards to RS Investments employees in connection with the RS Acquisition and pre-existing awards that are still being expensed. Acquisition-related compensation was $1.6 million for the year ended December 31, 2017, a decrease of $4.8 million from $6.4 million for the year ended December 31, 2016, due to cash retention payments made in 2016 to former RS Investments employees in connection with the RS Acquisition and the impact of certain one-time compensation costs related to the integration of the RS Investments business onto our platform.
Distribution and Other Asset-based Expenses
Broker-dealer and platform distribution expenses along with fund expense reimbursements, sub-administration, sub-advisory and middle-office expenses are based on AUM. The following table
66
presents the components of distribution and other asset-based expenses for the year ended December 31, 2017 and 2016:
| |
Year Ended December 31, |
||||||
|---|---|---|---|---|---|---|---|
| ($ in thousands) |
2017 | 2016 | |||||
Broker-dealer distribution fees |
$ | 40,521 | $ | 30,983 | |||
Platform distribution fees |
29,701 | 19,705 | |||||
Fund expense reimbursements |
11,896 | 10,342 | |||||
Sub-administration |
5,754 | 5,509 | |||||
Sub-advisory |
8,352 | 4,365 | |||||
Middle-office |
7,215 | 6,593 | |||||
| | | | | | | | |
Total distribution and other asset-based expenses |
$ | 103,439 | $ | 77,497 | |||
| | | | | | | | |
| | | | | | | | |
| | | | | | | | |
Distribution and other asset-based expenses are primarily based on percentages of AUM and increased by $25.9 million, or 33%, to $103.4 million for the year ended December 31, 2017, from $77.5 million for the year ended December 31, 2016, due to higher average open-end mutual fund AUM and an increase in the cost of third-party distribution. Asset-based expenses associated with fund reimbursements, sub-administration and middle-office outsourcing have increased year over year due to the increase in AUM as a result of the RS Acquisition and market appreciation. The increase in sub-advisory expenses is a result of the RS Acquisition, which included two sub-advisory relationships (Park Avenue and SailingStone).
General and Administrative Expenses
General and administrative expenses increased by $7.4 million, or 28%, to $34.0 million for the year ended December 31, 2017, from $26.6 million for the year ended December 31, 2016, driven by systems and data costs related to incremental Franchises and additional risk tools as well as database development and marketing costs for new products and ETFs. In addition, included in General and administrative expenses for the year ended December 31, 2017 was $2.1 million of costs related to debt modification as a result of the incremental term loan borrowing of $125 million in February 2017 and the repricing of the term loan in August 2017.
Depreciation and Amortization
Depreciation and amortization decreased by $0.5 million, or 2%, to $29.9 million for the year ended December 31, 2017, from $30.4 million for the year ended December 31, 2016, primarily due lower amortization of certain intangible assets acquired in connection with the management-led buyout with Crestview GP from KeyCorp that were fully amortized in 2017 partially offset by higher intangible asset amortization as a result of the RS Acquisition.
Acquisition-Related Costs
Acquisition-related costs decreased by $4.5 million to $2.1 million for the year ended December 31, 2017, from $6.6 million for the year ended December 30, 2016, due to the RS Acquisition costs incurred in the earlier period.
Restructuring and Integration Costs
Restructuring and integration costs decreased by $3.8 million to $6.2 million for the year ended December 31, 2017, from $10.0 million for the year ended December 31, 2016, due to costs related to the RS Acquisition which occurred in the third quarter of 2016. Included in the $6.2 million for the
67
year ended December 31, 2017 were $3.0 million of loss on disposal of assets, $2.0 million of contract breakage, $0.6 million of severance and $0.6 million of other.
Interest Expense and Other Financing Costs
Interest expense increased by $14.2 million, or 41%, to $48.8 million for the year ended December 31, 2017, from $34.6 million for the year ended December 31, 2016. This increase was primarily due to incremental term loans incurred under the 2014 Credit Agreement in the amounts of $135.0 million and $125.0 million in July 2016 and February 2017, respectively. We used the proceeds of the incremental term loans to fund the RS Acquisition and associated transaction costs and to pay a dividend to our stockholders. On August 1, 2017, the 2014 Credit Agreement was amended to refinance all existing term loans outstanding, effective as of that date, reducing the spread above LIBOR from 7.50% to 5.25%. Our ongoing interest expense will further decrease as a result of the refinancing of the 2014 Credit Agreement that was completed concurrent with the IPO. The refinancing of the 2014 Credit Agreement reduced the interest rate on our credit agreement borrowings from LIBOR plus 5.25% to LIBOR plus 2.75%. See "—Liquidity and Capital Resources—Debt Refinancing."
Income Tax (Expense)/Benefit
The provision for income taxes for the year ended December 31, 2017 and 2016 comprises federal and state taxes and, in addition, for the year ended December 31, 2017, foreign income taxes. The difference between our effective tax rate and the statutory federal rate of 35% are state, local and foreign income taxes and non-deductible expenses.
On December 22, 2017, the Tax Act was enacted. The Tax Act significantly revises the U.S. corporate income tax law by, among other things, decreasing the federal corporate income tax rate from 35% to 21% effective January 1, 2018. As a result of the reduction in the corporate income tax rate, we are required to remeasure our U.S. net deferred taxes at December 31, 2017. The impact of the remeasurement resulted in a one-time credit to income tax expense of $2.4 million for the three months and year ended December 31, 2017.
Effective January 1, 2018, we estimate the impact of the Tax Act will lower our combined statutory federal income tax rate plus an estimate for state, local and foreign income taxes from approximately 38% to 24% thus lowering our income tax expense beginning in calendar year 2018. The reduction in our combined statutory federal income tax rate plus an estimate for state, local and foreign income taxes from approximately 38% to 24% will also reduce the tax benefit of goodwill and acquired intangible assets beginning in 2018.
68
Our GAAP results of operations were as follows for the years ended December 31, 2016 and 2015.
| |
Year Ended December 31, |
Change | |||||||||||
|---|---|---|---|---|---|---|---|---|---|---|---|---|---|
| ($ in thousands, other than per share amounts) |
2016 | 2015 | Amount | % | |||||||||
Revenue |
|||||||||||||
Investment management fees |
$ | 248,482 | $ | 201,553 | $ | 46,929 | 23 | % | |||||
Fund administration and distribution fees |
49,401 | 39,210 | 10,191 | 26 | % | ||||||||
| | | | | | | | | | | | | | |
Total revenue |
297,883 | 240,763 | 57,120 | 24 | % | ||||||||
| | | | | | | | | | | | | | |
Expenses |
|||||||||||||
Personnel compensation and benefits |
122,615 | 93,819 | 28,796 | 31 | % | ||||||||
Distribution and other asset-based expenses |
77,497 | 51,481 | 26,016 | 51 | % | ||||||||
General and administrative |
26,628 | 22,959 | 3,669 | 16 | % | ||||||||
Depreciation and amortization |
30,405 | 27,291 | 3,114 | 11 | % | ||||||||
Change in value of consideration payable for acquisition of business |
(378 | ) | 193 | (571 | ) | n/m | |||||||
Acquisition-related costs |
6,619 | 3,187 | 3,432 | 108 | % | ||||||||
Restructuring and integration costs |
10,012 | 8,613 | 1,399 | 16 | % | ||||||||
| | | | | | | | | | | | | | |
Total operating expenses |
273,398 | 207,543 | 65,855 | 32 | % | ||||||||
| | | | | | | | | | | | | | |
Income/(loss) from operations |
24,485 | 33,220 | (8,735 | ) | (26 | )% | |||||||
Other income (expense) |
|||||||||||||
Interest income and other income |
1,086 | 47 | 1,039 | n/m | |||||||||
Interest expense and other financing costs |
(34,642 | ) | (26,045 | ) | (8,597 | ) | 33 | % | |||||
| | | | | | | | | | | | | | |
Total other income (expense), net |
(33,556 | ) | (25,998 | ) | (7,558 | ) | 29 | % | |||||
| | | | | | | | | | | | | | |
Income/(loss) before income taxes |
(9,071 | ) | 7,222 | (16,293 | ) | n/m | |||||||
Income tax (expense)/benefit |
3,000 | (3,422 | ) | 6,422 | n/m | ||||||||
| | | | | | | | | | | | | | |
Net income/(loss) |
$ | (6,071 | ) | $ | 3,800 | $ | (9,871 | ) | n/m | ||||
| | | | | | | | | | | | | | |
| | | | | | | | | | | | | | |
| | | | | | | | | | | | | | |
Earnings per share—basic |
$ | (0.12 | ) | $ | 0.08 | $ | (0.20 | ) | n/m | ||||
Earnings per share—diluted |
$ | (0.12 | ) | $ | 0.08 | $ | (0.20 | ) | n/m | ||||
Weighted average shares outstanding—basic |
50,017,712 | 46,408,891 | 3,608,821 | 8 | % | ||||||||
Weighted average shares outstanding—diluted |
50,017,712 | 48,090,753 | 1,926,959 | 4 | % | ||||||||
Dividends declared per share |
$ | — | $ | 1.28 | $ | (1.28 | ) | 100 | % | ||||
Investment Management Fees
Investment management fees increased $46.9 million, or 23%, for the year ended December 31, 2016 compared to 2015 due to an increase in AUM and an increase in realized fee rate of approximately two basis points year over year. This increase was partially offset by a decrease in investment management fees of $8.7 million attributable to Diversified from 2015 to 2016. AUM increased by $21.9 billion from $33.1 billion at December 31, 2015 to $55.0 billion at December 31, 2016, of which $16.7 billion was from the RS Acquisition, $4.4 billion was due to market appreciation and $0.9 billion was from net inflows during the year.
Fund Administration and Distribution Fees
Fund administration and distribution fees totaled $49.4 million for the year ended December 31, 2016, an increase of $10.2 million, or 26%, when compared to the year ended December 31, 2015, due to an increase in open-end mutual fund AUM. Open-end mutual fund daily average AUM grew by $6.6 billion from $17.6 billion in 2015 to $24.2 billion in 2016 due to the RS Acquisition (which was
69
completed in July 2016 and included $13.2 billion of open-end mutual fund AUM at the date of acquisition). The increase in fees due to higher average AUM was partially offset by a reduction in the fee rate earned for administrative services. The administrative fee schedule is tiered such that the average fee rate earned declines as AUM increase.
Personnel Compensation and Benefits
The following table presents the components of GAAP compensation expense for the years ended December 31, 2016 and 2015:
| |
Year Ended December 31, |
||||||
|---|---|---|---|---|---|---|---|
| ($ in thousands) |
2016 | 2015 | |||||
Salaries, payroll related taxes and employee benefits |
$ | 42,963 | $ | 35,865 | |||
Incentive compensation |
51,738 | 42,605 | |||||
Sales-based compensation(1) |
12,693 | 8,030 | |||||
Equity awards granted to employees(2) |
8,827 | 5,726 | |||||
Acquisition-related cash retention compensation |
6,394 | 1,593 | |||||
| | | | | | | | |
Total GAAP compensation and benefits expense |
$ | 122,615 | $ | 93,819 | |||
| | | | | | | | |
| | | | | | | | |
| | | | | | | | |
- (1)
- Represents
sales-based commissions paid to our distribution teams. Sales-based compensation varies based on gross client cash flows and revenue earned on sales.
- (2)
- Equity awards typically vest over several years based on service and the achievement of specific financial and business targets. The value of the equity awards are recognized as compensation expense over the vesting period.
Personnel compensation and benefits was $122.6 million for the year ended December 31, 2016, an increase of $28.8 million, or 31%, from $93.8 million for the year ended December 31, 2015. Salaries and benefits was $43.0 million for the year ended December 31, 2016, an increase of $7.1 million, or 20%, from $35.9 million for the year ended December 31, 2015. This increase reflects the effect of increased headcount due to the RS Acquisition as well as new hires and annual salary increases. Incentive compensation was $51.7 million for the year ended December 31, 2016, an increase of $9.1 million, or 21%, from $42.6 million for the year ended December 31, 2015, due to higher pre-incentive compensation earnings and the effect of the RS Acquisition. Sales-based compensation was $12.7 million for the year ended December 31, 2016, an increase of $4.7 million, or 59%, from $8.0 million for the year ended December 31, 2015, as a result of higher gross flows and revenue. Equity award expense was $8.8 million for the year ended December 31, 2016, an increase of $3.1 million, or 54%, from $5.7 million for the year ended December 31, 2015, due to the equity awards to RS Investments employees in connection with the RS Acquisition, pre-existing awards that are still being expensed and the achievement of certain performance-vesting metrics for other pre-existing awards. Acquisition-related compensation was $6.4 million for the year ended December 31, 2016, an increase of $4.8 million, or 300%, from $1.6 million for the year ended December 31, 2015, due to cash retention payments made in 2016 to former RS Investments employees in connection with the RS Acquisition and the impact of certain one-time compensation costs related to the integration of the RS Investments business onto our platform.
Distribution and Other Asset-based Expenses
Broker-dealer and platform distribution expenses along with fund expense reimbursements, sub-administration, sub-advisory and middle-office expenses are based on AUM. The following table
70
presents the components of distribution and other asset-based expenses for the years ended December 31, 2016 and 2015:
| |
Year ended December 31, |
||||||
|---|---|---|---|---|---|---|---|
| ($ in thousands) |
2016 | 2015 | |||||
Broker-dealer distribution fees |
$ | 30,983 | $ | 23,554 | |||
Platform distribution fees |
19,705 | 13,267 | |||||
Fund expense reimbursements |
10,342 | 5,179 | |||||
Sub-administration |
5,509 | 5,288 | |||||
Sub-advisory |
4,365 | 403 | |||||
Middle-office |
6,593 | 3,790 | |||||
| | | | | | | | |
Total distribution and other asset-based expenses |
$ | 77,497 | $ | 51,481 | |||
| | | | | | | | |
| | | | | | | | |
| | | | | | | | |
Distribution and other asset-based expenses are primarily based on percentages of AUM and have increased by $26.0 million, or 50%, to $77.5 million for the year ended December 31, 2016, from $51.5 million for the year ended December 31, 2015, due to higher average open-end mutual fund AUM and an increase in the cost of third-party distribution. Asset-based expenses associated with fund reimbursements, sub-advisory, sub-administration and middle-office outsourcing have increased year over year due to the increase in AUM as a result of the RS Acquisition, market appreciation and net inflows in 2016.
General and Administrative Expenses
General and administrative expenses increased by $3.6 million, or 16%, to $26.6 million for the year ended December 31, 2016, from $23.0 million for the year ended December 31, 2015, driven by systems and data costs related to incremental Franchises and additional risk tools as well as database development and marketing costs for new products and ETFs.
Depreciation and Amortization
Depreciation and amortization increased by $3.1 million, or 11%, to $30.4 million for the year ended December 31, 2016, from $27.3 million for the year ended December 31, 2015, primarily due to higher intangible asset amortization as a result of the RS Acquisition.
Acquisition-Related Costs
Acquisition-related costs increased by $3.4 million to $6.6 million for the year ended December 31, 2016, from $3.2 million for the year ended December 31, 2015, due to the RS Acquisition.
Restructuring and Integration Costs
Restructuring and integration costs increased by $1.4 million to $10.0 million for the year ended December 31, 2016, from $8.6 million for the year ended December 31, 2015 due to costs related to the RS Acquisition in 2016 being higher than similar costs incurred in 2015 related to the CEMP Acquisition as well as the remaining such costs from the Munder Acquisition and other business restructuring costs.
Interest Expense and Other Financing Costs
Interest expense increased by $8.6 million, or 33%, to $34.6 million for the year ended December 31, 2016, from $26.0 million for the year ended December 31, 2015. This increase was primarily due to incremental term loans incurred under the 2014 Credit Agreement in the amounts of $50.0 million and $135.0 million in May 2015 and July 2016, respectively. We used the proceeds of the incremental term loans to fund the RS Acquisition and associated transaction costs and to pay a dividend to our stockholders.
71
Income Tax (Expense)/Benefit
The effective tax rate for 2016 reflects the impact of the state taxes and permanent differences on a pre-tax loss in 2016 compared to pre-tax income in 2015.
Effects of Inflation
For the years ended December 31, 2017, 2016 and 2015, inflation did not have a material effect on our consolidated results of operations. Inflationary pressures can result in increases to our cost structure, especially to the extent that large expense components such as compensation are impacted. To the degree that these expense increases are not recoverable or cannot be counterbalanced through price increases due to the competitive environment, our profitability could be negatively impacted. In addition, the value of the fixed income assets that we manage may be negatively impacted when inflationary expectations result in a rising interest rate environment. Declines in the values of AUM could lead to reduced revenues as management fees are generally earned as a percentage of AUM.
Supplemental Non-GAAP Financial Information
Our management uses non-GAAP performance measures to evaluate the underlying operations of our business. Due to our acquisitive nature, there are a number of acquisition and restructuring related expenses included in GAAP measures that we believe distort the economic value of our organization and we believe that many investors use this information when assessing the financial performance of companies in the investment management industry. We have included these non-GAAP measures to provide investors with the same financial metrics used by management to assess the operating performance of our Company. The non-GAAP measures we report are Adjusted EBITDA and Adjusted Net Income.
The following table sets forth a reconciliation from GAAP financial measures to non-GAAP measures for the periods indicated:
| |
Years Ended December 31, | |||||||||
|---|---|---|---|---|---|---|---|---|---|---|
($ in thousands)
|
2017 | 2016 | 2015 | |||||||
Reconciliation of non-GAAP financial measures: |
||||||||||
Net income / (loss) |
$ | 25,826 | $ | (6,071 | ) | $ | 3,800 | |||
GAAP income tax (expense)/benefit |
(12,632 | ) | 3,000 | (3,422 | ) | |||||
| | | | | | | | | | | |
Income/(loss) before taxes |
$ | 38,458 | $ | (9,071 | ) | $ | 7,222 | |||
Interest expense / (income)(1) |
44,330 | 31,286 | 23,397 | |||||||
Depreciation(2) |
3,561 | 3,156 | 2,262 | |||||||
Other business taxes(3) |
1,887 | 1,137 | 1,008 | |||||||
GAAP amortization of acquisition-related intangibles(4) |
26,349 | 27,250 | 25,029 | |||||||
Stock-based compensation(5) |
11,752 | 8,827 | 5,726 | |||||||
Acquisition, restructuring and exit costs(6) |
15,041 | 23,025 | 13,393 | |||||||
Debt issuance costs(7) |
6,035 | 2,749 | 2,188 | |||||||
Pre-IPO governance expenses(8) |
1,248 | 1,181 | 1,199 | |||||||
Earnings/losses on equity method investments(9) |
427 | 0 | 0 | |||||||
Compensation in excess of expected levels due to acquisitions(10) |
— | 8,534 | 694 | |||||||
| | | | | | | | | | | |
Adjusted EBITDA |
$ | 149,088 | $ | 98,074 | $ | 82,118 | ||||
72
| |
|
Years Ended December 31, | ||||||||||
|---|---|---|---|---|---|---|---|---|---|---|---|---|
($ in thousands)
|
2017 | 2016 | 2015 | |||||||||
Reconciliation of non-GAAP financial measures: |
||||||||||||
Net income / (loss) |
$ | 25,826 | $ | (6,071 | ) | $ | 3,800 | |||||
Adjustments to reflect the operating performance of the Company: |
||||||||||||
i. |
Other business taxes(3) |
1,887 | 1,137 | 1,008 | ||||||||
ii. |
GAAP amortization of acquisition-related intangibles(4) |
26,349 | 27,250 | 25,029 | ||||||||
iii. |
Stock-based compensation(5) |
11,752 | 8,827 | 5,726 | ||||||||
iv. |
Acquisition, restructuring and exit costs(6) |
15,041 | 23,025 | 13,393 | ||||||||
v. |
Debt issuance costs(7) |
6,035 | 2,749 | 2,188 | ||||||||
vi. |
Pre-IPO governance expenses(8) |
1,248 | 1,181 | 1,199 | ||||||||
vii. |
Compensation in excess of expected levels due to acquisitions(10) |
8,534 | 694 | |||||||||
Tax effect of above adjustments(11) |
(23,678 | ) | (27,627 | ) | (18,710 | ) | ||||||
viii. |
Remeasurement of net deferred taxes (12) |
(2,422 | ) | — | — | |||||||
| | | | | | | | | | | | | |
Adjusted Net Income |
$ | 62,038 | $ | 39,005 | $ | 34,327 | ||||||
| | | | | | | | | | | | | |
| | | | | | | | | | | | | |
| | | | | | | | | | | | | |
Tax benefit of goodwill and acquired intangibles(13) |
19,691 | 16,786 | 14,813 | |||||||||
| | | | | | | | | | | | | |
| | | | | | | | | | | | | |
| | | | | | | | | | | | | |
- (1)
- We
add back interest paid on debt net of interest income; interest expense is included in "Interest expense and other financing costs" in our consolidated financial
statements while interest income is shown in "Interest income and other income" in our consolidated financial statements.
- (2)
- We
add back depreciation on property and equipment; included in "Depreciation and amortization" in our consolidated financial statements.
- (3)
- We
add back other business taxes; other business taxes are included in "General and administrative" in our consolidated financial statements.
- (4)
- We
add back amortization of acquisition-related intangibles; included in "Depreciation and amortization" in our consolidated financial statements.
- (5)
- We
add back the expense associated with stock-based compensation associated with equity issued from pools that were created in connection with the management-led
buyout with Crestview GP from KeyCorp, the Munder Acquisition and the RS Acquisition and as a result of IPO-related equity grants; included in "Personnel compensation and benefits" in our
consolidated financial statements.
- (6)
- We add back direct incremental costs of acquisitions and the IPO, including expenses associated with third-party advisors, proxy solicitations of mutual fund shareholders for transaction consents, vendor contract early termination costs, impairment of receivables recorded in connection with an acquisition, and severance, retention and transaction incentive compensation. Severance, retention and transaction incentive compensation is included in "Personnel compensation and benefits" in our consolidated financial statements, impairment of receivables recorded in connection with an acquisition is included in "Interest income and other income/(expense)," costs associated with professional services incurred in connection with IPO readiness are included in "General and administrative"; all other incremental costs are included in "Restructuring and integration costs" or "Acquisition-related costs."
| |
Years Ended December 31, | |||||||||
|---|---|---|---|---|---|---|---|---|---|---|
($ in thousands)
|
2017 | 2016 | 2015 | |||||||
Restructuring and integration costs |
$ | 6,205 | $ | 10,012 | $ | 8,613 | ||||
Interest income and other income/(expense) |
4,429 | — | — | |||||||
Acquisition-related costs |
2,094 | 6,619 | 3,187 | |||||||
General and administrative |
732 | — | — | |||||||
Personnel compensation and benefits |
1,580 | 6,394 | 1,593 | |||||||
73
- (7)
- We
add back debt issuance costs; included in "Interest expense and other financing costs" and "General and administrative" in our consolidated financial statements.
See "—Liquidity and Capital Resources" for more information.
- (8)
- We
add back pre-IPO governance expenses paid to Crestview and Reverence Capital, included in "General and administrative" in our consolidated financial statements.
These payments terminated as of the completion of the IPO.
- (9)
- We
adjust for earnings/losses on equity method investments, included in "Interest income and other income/(expenses)" in our consolidated financial statements.
- (10)
- Our
compensation committee, together with our CEO, establishes a target percentage of our pre-bonus EBITDA to be allocated to employees as annual cash incentive
compensation. If, as a result of a significant acquisition, we pay annual cash incentive compensation that is a greater percentage of pre-bonus EBITDA than our target percentage, we add back the
amount of the annual incentive cash compensation in excess of the target percentage. For example, in 2016, as a result of the RS Acquisition, we paid incentive cash compensation at a greater
percentage of pre-bonus EBITDA than our target percentage. We paid incentive cash compensation in 2016 at levels we considered appropriate taking into account the RS Acquisition (including the size of
our Company post-acquisition) without the benefit of a full year of those earnings and before expense synergies were fully realized. We also paid incentive cash compensation on duplicative headcount
while the integration of the RS Investments platform was being completed; included in "Personnel compensation and benefits" in our consolidated financial statements.
- (11)
- Reflects
income taxes of 38% applied to the sum of line items i. to vii.; 38% represents statutory federal income tax rate of 35% plus an estimate for state,
local and foreign income taxes.
- (12)
- On
December 22, 2017, the Tax Act was enacted. The Tax Act significantly revises the U.S. corporate income tax law by, among other things, decreasing the
federal corporate income tax rate from 35% to 21% effective January 1, 2018. As a result of the reduction in the corporate income tax rate, we are required to remeasure our U.S. net deferred
taxes at December 31, 2017. The impact of the remeasurement was a one-time credit to income tax expense of $2.4 million for the three months and year ended December 31, 2017.
- (13)
- Represents
the tax benefits associated with deductions allowed for intangibles and goodwill generated from prior acquisitions in which we received a step-up in
basis for tax purposes. Acquired intangible assets and goodwill may be amortized for tax purposes, generally over a 15-year period. The tax benefit from amortization on these assets is included to
show the full economic benefit of deductions for all acquired intangibles with a step-up in tax basis. Due to our acquisitive nature, tax deductions allowed on acquired intangible assets and goodwill
provide us with a significant supplemental economic benefit.
Effective January 1, 2018, we estimate the impact of the Tax Act will lower our combined statutory federal income tax rate plus an estimate for state, local and foreign income taxes from approximately 38% to 24% thus lowering our income tax expense beginning in calendar year 2018. The reduction in our combined statutory federal income tax rate plus an estimate for state, local and foreign income taxes from approximately 38% to 24% will also reduce the tax benefit of goodwill and acquired intangible assets beginning in 2018.
Non-GAAP measures should be considered in addition to, and not as a substitute for, financial measures prepared in accordance with GAAP. Our non-GAAP measures may differ from similar measures at other companies, even if similar terms are used to identify these measures.
74
Liquidity and Capital Resources
Our primary uses of cash relate to repayment of our debt obligations and funding working capital needs and are expected to be met primarily through cash generated from our operations. The following table shows our liquidity position as of December 31, 2017 and 2016.
| |
December 31, | ||||||
|---|---|---|---|---|---|---|---|
($ in thousands)
|
2017 | 2016 | |||||
Cash and cash equivalents |
$ | 12,921 | $ | 16,441 | |||
Accounts and other receivables |
55,917 | 83,870 | |||||
Undrawn commitment on revolving credit facility |
25,000 | 21,500 | |||||
Accounts and other payables |
(51,301 | ) | (71,786 | ) | |||
We manage our cash balances in order to fund our day-to-day operations. Our accounts receivable consist primarily of investment management fees that have been earned but not yet received from clients. Included in other receivables are amounts due under a contract with a third party acquired in connection with the RS Acquisition, net income and other taxes receivable and amounts receivable from the funds. We perform a review of our receivables on a monthly basis to access collectability.
The decrease in accounts and other receivables from December 31, 2016 to December 31, 2017 is due primarily to changes in other receivables, including a $14.3 million decrease in amounts due under the contract with a third party acquired in connection with the RS Acquisition (see Note 3 Acquisitions to the Consolidated Financial Statements included elsewhere in this report), $5.3 million decrease in net income taxes receivable and $6.3 million decrease in amounts receivable from the funds and other taxes receivable. The remaining $2.1 million decrease in accounts and other receivables from December 31, 2016 to December 31, 2017 relates to timing of collections of investment management fees invoiced to clients.
We also maintained a $25.0 million revolving credit facility, as described below, which had $25.0 million undrawn as of December 31, 2017 and had $21.5 million undrawn as of December 31, 2016.
2014 Credit Agreement
As of December 31, 2017, we had $499.7 million aggregate principal amount of outstanding term loans under our credit agreement, dated as of October 31, 2014 (as amended), or the 2014 Credit Agreement. Our 2014 Credit Agreement includes a revolving credit facility and provided for up to $25.0 million of revolving loans and a sublimit of up to $10.0 million of letters of credit. As of December 31, 2017, we had no amounts drawn on our revolving credit facility. Amounts outstanding under our 2014 Credit Agreement bore interest at a rate equal to, at our election, (i) a reserve-adjusted LIBOR rate (which, in the case of the term loans, shall not be less than 1.0% per annum and, in the case of our revolving credit facility, shall not be less than 0.0% per annum) plus an applicable margin of 6.0% per annum for the revolving credit facility and 5.25% for the term loans or (ii) an alternate base rate equal to the highest of (x) the prime rate announced by Morgan Stanley Senior Funding, Inc. from time to time, (y) the federal funds effective rate plus 0.50% and (z) the daily one-month reserve-adjusted LIBOR rate plus 1.0%, plus 5.0% per annum for the revolving credit facility and 4.25% for the term loans. Until the revolving credit facility terminates, we were required to pay each lender thereunder a commitment fee, which accrued at the rate of 0.50% per annum on the average daily unused amount of the revolving commitment of such lender. Under the terms of the 2014 Credit Agreement, we were required to pay an administration fee of $125,000 per year. We used the net proceeds from the IPO, together with proceeds of the Credit Agreement and cash on hand, to repay in full all indebtedness outstanding under our 2014 Credit Agreement.
75
Debt Refinancing
On February 12, 2018, concurrently with the closing of the IPO, we entered into a credit agreement, or the Credit Agreement, among the Company, as borrower, the lenders from time to time party thereto, Royal Bank of Canada, as administrative agent and collateral agent, and the other parties thereto, under which we received seven-year term loans in an aggregate principal amount of $360.0 million and established a five-year revolving credit facility (which was unfunded as of closing) with aggregate commitments of $50.0 million (with a $10.0 million sub-limit for the issuance of letters of credit). Subject to certain terms and conditions set forth in the Credit Agreement (including obtaining commitments from one or more new or existing lenders), we may incur additional loans or commitments under the Credit Agreement in an aggregate principal amount of up to $154.0 million (or, if greater, 100% of Consolidated Adjusted EBITDA (as defined in the Credit Agreement) for the most recently ended period of four fiscal quarters), plus certain additional amounts set forth in the Credit Agreement (including an unlimited amount of additional loans or commitments based on achievement of a specified first lien leverage ratio).
Amounts outstanding under the Credit Agreement bear interest at an annual rate equal to, at our option, either LIBOR (adjusted for reserves) plus a margin of 2.75% or an alternate base rate plus a margin of 1.75%. We are also required to pay certain fees to the lenders, including, among others, a quarterly commitment fee on the average unused amount of the revolving credit facility.
Term loans under the Credit Agreement will amortize at a rate of 1.00% per annum. In addition, the Credit Agreement requires that the term loans be mandatorily prepaid with (a) a percentage (ranging from 0% to 50%, depending on our first lien leverage ratio) of our annual excess cash flow on an annual basis (commencing with the fiscal year ending December 31, 2019), (b) all or a portion of the net cash proceeds of certain asset sales, casualty or condemnation events, subject to customary reinvestment rights, and (c) the proceeds of certain incurrences of indebtedness. At any time, subject to timely prior written notice, we may terminate the commitments under the revolving credit facility in full or in part or prepay term loans in whole or in part, subject to the payment of LIBOR breakage fees, if any, and, in the case of certain prepayments of term loans occurring within the six-month period following closing, a 1.00% premium.
Our obligations under the Credit Agreement are guaranteed by all of our domestic subsidiaries (other than Victory Capital Advisers, Inc., our broker-dealer subsidiary), or the Guarantors, and secured by substantially all of the assets of the Company and the Guarantors, subject in each case to certain customary exceptions.
The Credit Agreement contains customary affirmative and negative covenants, including covenants that affect, among other things, the ability of us and our subsidiaries to incur additional indebtedness, create liens, merge or dissolve, make investments, dispose of assets, engage in sale and leaseback transactions, make distributions and dividends and prepayments of junior indebtedness, engage in transactions with affiliates, enter into restrictive agreements, amend documentation governing junior indebtedness, modify our fiscal year and modify our organizational documents, subject to customary exceptions, thresholds, qualifications and "baskets." In addition, the Credit Agreement contains a financial performance covenant, requiring a maximum first lien leverage ratio, measured as of the last day of each fiscal quarter on which outstanding borrowings under the revolving credit facility exceed 35.0% of the commitments thereunder (excluding certain letters of credit), of no greater than 4.00 to 1.00.
The repayment obligation under the Credit Agreement may be accelerated upon the occurrence of an event of default thereunder, including, among other things, failure to pay principal or interest on a timely basis, material inaccuracy of any representation or warranty, failure to comply with covenants, cross-default, change of control, certain insolvency or bankruptcy-related events and material judgments, subject, in each case, to any applicable grace and/or cure periods.
76
Proceeds from both the term loans under the Credit Agreement and the IPO, as well as cash on hand, were used (i) to repay all indebtedness outstanding under our 2014 Credit Agreement, which was terminated as of closing, and (ii) for the payment of fees, commissions, premiums, expenses and other transaction costs (including original issue discount or upfront fees) payable in connection with the IPO, the Credit Agreement and the transactions related thereto. The proceeds of revolving loans incurred under the Credit Agreement may be used for general corporate purposes, including ongoing working capital requirements.
Capital Requirements
VCA is a registered broker-dealer subject to the Uniform Net Capital requirements under the Exchange Act, which requires maintenance of certain minimum net capital levels. In addition, we have certain non-U.S. subsidiaries that have minimum capital requirements. As a result, such subsidiaries of our Company may be restricted in their ability to transfer cash to their parents. VCA and our non-U.S. subsidiaries were in compliance with these requirements as of and for the years ended December 31, 2017, 2016 and (to the extent then-owned) 2015.
Cash Flows for the Years Ended December 31, 2017, 2016 and 2015
| |
Year Ended December 31, | |||||||||
|---|---|---|---|---|---|---|---|---|---|---|
($ in thousands)
|
2017 | 2016 | 2015 | |||||||
Net cash from operating activities |
$ | 96,169 | $ | 39,540 | $ | 40,654 | ||||
Net cash used in investing activities |
(8,532 | ) | (210,082 | ) | (20,149 | ) | ||||
Net cash (used)/provided by financing activities |
(91,273 | ) | 171,839 | (31,124 | ) | |||||
Year Ended December 31, 2017 and 2016
Operating activities provided net cash of $96.2 million and $39.5 million for the years ended December 31, 2017 and 2016, respectively. The $56.7 million increase in net cash provided by operating activities was primarily due to the impact of the RS Acquisition on our earnings.
Investing activities consist primarily of acquisitions and sales of property and equipment, as well as the purchase and sales of trading securities related to our deferred compensation plan. Investing activities used net cash of $8.5 million and $210.1 million for the years ended December 31, 2017 and 2016, respectively. The $201.6 million decrease in the net cash used in investing activities was primarily due to the RS Acquisition in August 2016.
Financing activities consist primarily of dividend payments to our stockholders, proceeds received or paid from the issuance or repurchase of equity and debt-related activity. For the year ended December 31, 2017, financing activities included, but were not limited to, the incurrence of $125.0 million of incremental term loans under the 2014 Credit Agreement, the payment of a dividend to stockholders in the amount of $135.2 million and the repayment of long-term debt in the amount of $63.9 million. For the year ended December 31, 2016, financing activities included, but were not limited to, the incurrence of $135 million in incremental term loans under the 2014 Credit Agreement and the issuance of $88.3 million of equity, both in connection with the RS Acquisition, and the repayment of long-term debt in the amount of $21.0 million. Financing activities used net cash of $91.3 million for the year ended December 31, 2017. Financing activities generated net cash of $171.8 million for the year ended December 31, 2016.
77
Year Ended December 31, 2016 and 2015
Operating activities provided net cash of $39.5 million and $40.7 million for the years ended December 31, 2016 and 2015, respectively. The $1.2 million decrease in net cash provided by operating activities was primarily due to the one-time, acquisition-related restructuring and integration-related costs incurred as a result of the RS Acquisition.
Investing activities consist primarily of acquisitions of businesses and assets and acquisitions and sales of property and equipment. In 2016, investing activities included the RS Acquisition and in 2015 the CEMP Acquisition. Investing activities used net cash of $210.1 million and $20.1 million for the years ended December 31, 2016 and 2015, respectively. The $190.0 million increase in net cash used in investing activities was primarily due to the RS Acquisition.
Financing activities consist primarily of dividend payments to our stockholders, proceeds received or paid from the issuance or repurchase of equity and debt-related activity. In 2016, financing activities included the incurrence of $135.0 million of incremental term loans under the 2014 Credit Agreement and the issuance of $88.3 million in equity to finance the RS Acquisition and in 2015 included the incurrence of $50.0 million of incremental term loans under the 2014 Credit Agreement to pay a $50.0 million dividend to our stockholders. Financing activities provided net cash of $171.8 million for the year ended December 31, 2016. Financing activities used net cash of $31.1 million for the year ended December 31, 2015. The $202.9 million increase in net cash from financing activities was related to the incurrence of $135.0 million in incremental indebtedness under the term loans under our 2014 Credit Agreement and the issuance of $88.3 million of equity related to the RS Acquisition in July 2016.
Contractual Obligations
The following summarizes our contractual obligations as of December 31, 2017:
| |
Payments Due | |||||||||||||||
|---|---|---|---|---|---|---|---|---|---|---|---|---|---|---|---|---|
| ($ in thousands) |
Total | Less Than One Year |
One to Three Years |
Three to Five Years |
More Than Five Years |
|||||||||||
Principal payments on borrowings(1) |
$ | 499,750 | $ | — | $ | 63,138 | $ | 436,612 | $ | — | ||||||
Interest payable(1)(2) |
124,523 | 34,551 | 65,384 | 24,588 | — | |||||||||||
Lease obligations |
20,800 | 4,241 | 8,332 | 5,650 | 2,577 | |||||||||||
Promissory note payments |
671 | 575 | 96 | — | — | |||||||||||
CEMP deferred consideration |
9,856 | 4,451 | 5,405 | — | — | |||||||||||
| | | | | | | | | | | | | | | | | |
Total |
$ | 655,600 | $ | 43,818 | $ | 142,355 | $ | 466,850 | $ | 2,577 | ||||||
| | | | | | | | | | | | | | | | | |
| | | | | | | | | | | | | | | | | |
| | | | | | | | | | | | | | | | | |
- (1)
- The
total principal payments on borrowings reflects the gross amount of principal outstanding on the term loans under the 2014 Credit Agreement as of
December 31, 2017. Net proceeds received from the IPO and the Credit Agreement of $143.0 million and $355.9 million, respectively, were used concurrent with the closing of the
IPO, together with $0.8 million of cash on hand, to repay the $499.7 million of outstanding term loans under the 2014 Credit Agreement. On February 21, 2018, the Company repaid
$10.0 million of outstanding term loans under the Credit Agreement, and on March 18, 2018, the Company used the net proceeds from the underwriters' exercise of their option and cash on
hand to repay an additional $27.0 million of the outstanding term loans under the Credit Agreement. After giving effect to such repayments, the current gross amount of term loans outstanding
under the Credit Agreement is $323.0 million.
- (2)
- The total interest payable reflects the interest due on the principal outstanding on the term loans under the 2014 Credit Agreement as of December 31, 2017 using the 6.82% interest rate in effect
78
on that date. The current interest rate on the term loans outstanding under the Credit Agreement decreased to 4.40% as of February 12, 2018, which is subject to adjustment as described herein.
Off-Balance Sheet Arrangements
In connection with dividends declared in May 2015, November 2015, February 2017 and December 2017, holders of restricted stock awards that were unvested at the time such dividends were declared are entitled to be paid the dividends as and when the restricted stock vests. Holders of stock options that were unvested at the time the November 2015 dividend was declared are entitled to receive a cash bonus equivalent of the November 2015 dividend as and when their stock options vest. These amounts are not recorded as a liability until and unless the awards vest in accordance with their respective agreements.
As of December 31, 2017, the cash bonuses and distributions related to the May 2015, November 2015, February 2017 and December 2017 dividends on restricted shares and options that are expected to vest in the future totaled $2.0 million.
Critical Accounting Policies and Estimates
Our consolidated financial statements have been prepared in accordance with GAAP. In preparing the financial statements, we are required to make estimates, judgments and assumptions that affect the amounts reported in our consolidated financial statements and accompanying notes. We continually evaluate the accounting policies and estimates we use to prepare our consolidated financial statements. In general, our estimates are based on historical experience, information from third-party valuation professionals and various other assumptions that we believe to be reasonable under the facts and circumstances. Actual results may differ from our estimates and those differences may be material. Of the significant accounting policies described in Note 2 to the audited consolidated financial statements included in this report, we believe the following policies involve a higher degree of judgment and complexity.
Indefinite-lived Intangible Assets
The accounting for indefinite-lived intangible assets requires significant estimates and judgment in several areas: (1) valuation in connection with the initial purchase price allocation; (2) ongoing evaluation for impairment; and (3) reconsideration of an asset's useful life. The process of determining the fair value of identifiable intangible assets at the date of acquisition utilizes an income approach and requires significant estimates and judgment as to expectations for earnings on the related managed assets acquired, redemption rates, growth rates from sales efforts, the effects of market conditions and a discount rate. The process for estimating the fair value of acquired trade names considers comparable royalty rates and projected revenue streams. We typically utilize an independent valuation expert to assist with these valuations. Because the advisory and distribution contracts are with the funds, renewable annually and have a history of being renewed, industry practice under GAAP is to consider the contract lives to be indefinite and, as a result, not amortizable. Indefinite-lived intangible assets are reviewed for impairment annually as of October 1 using a qualitative approach which requires the weighing of positive and negative evidence collected through the consideration of various factors to determine whether it is more likely than not that an indefinite-lived intangible asset is impaired. We consider macroeconomic and entity-specific factors, including changes to legal, regulatory or contractual provisions of the renewable advisory and distribution contracts, the effects of obsolescence, demand, competition and other economic factors that could impact the funds' projected performance and the existence or expectation of significant changes in the level and mix of managed assets. In addition, we consider whether events or circumstances indicate that a change in the useful life may have occurred. Indicators of a possible change in useful life monitored by us generally include changes in the use of the asset, a significant decline in the level of managed assets and significant reductions in underlying
79
operating cash flows. If actual changes in the underlying managed assets or other conditions, such as redemption rates or changes to contractual provisions, indicate that it is more likely than not that the asset is impaired, or if the estimated useful life is reduced, we estimate the fair value of the intangible asset. The process of estimating the fair value of the intangible asset requires us to estimate the level and mix of managed assets, considering future redemption rates, growth rates, market appreciation/depreciation and a discount rate. If the carrying value of the intangible asset exceeds its fair value, we recognize an impairment charge equal to that excess.
Definite-Lived Intangible Assets
Definite-lived intangible assets are primarily comprised of customer relationships. These assets have definite lives given the underlying advisory contracts are between the Company and an institutional customer or the underlying advisory contract with the fund does not have a sufficient history of annual renewal to support an indefinite useful life. We monitor the useful lives of definite-lived intangible assets and revise the useful lives, if necessary, based on the circumstances. We review historical and projected attrition rates and other events that may influence our projections of the future economic benefit that we will derive from these relationships. Significant judgment is required to estimate the period during which these assets will contribute to our cash flows and the pattern over which these assets will be consumed. A change in the remaining useful life of any of these assets could have a significant impact on our amortization expense. All amortization expense is calculated on a straight-line basis. We periodically evaluate the remaining useful lives and carrying values of the definite-lived intangible assets to determine whether events and circumstances indicate that a change in the useful life or impairment in value may have occurred. Indicators of impairment monitored by us include a decline in the level of managed assets, changes to contractual provisions underlying certain intangible assets and reductions in underlying operating cash flows. If there is an indication of a change in the useful life or impairment in value of the definite-lived intangible assets, we compare the carrying value of the asset to the projected undiscounted cash flows expected to be generated from the underlying asset over its remaining useful life to determine whether impairment has occurred. If the carrying value of the asset exceeds the undiscounted cash flows, the asset is written down to its fair value determined by discounting the projected cash flows.
Goodwill
Goodwill represents the excess of the purchase price of acquisitions over the fair value of identified net assets and liabilities acquired. We have determined that we have only one reporting unit for purposes of assessing the carrying value of goodwill. Goodwill impairment testing is performed at the reporting unit level annually or whenever events or changes in circumstances indicate that the carrying amount may not be recoverable. We complete our annual goodwill impairment assessment as of October 1. For purposes of this assessment, we consider various qualitative factors, including but not limited to, AUM levels and flows, market performance of our products compared to peers, turnover of key personnel, projected operating results and the implied fair value of our business based on recent transactions. If we conclude based on the qualitative assessment that it is more likely than not that the fair value of the reporting unit is less than its carrying amount, we compare the fair value of the reporting unit to its carrying value. If we determine that the fair value of the reporting unit is less than the carrying value, we measure the amount of impairment loss, if any, by comparing the implied fair value of goodwill to its recorded value. On October 1, 2017, we qualitatively determined that it was more likely than not that the fair value of our reporting unit was greater than its carrying value.
Income Taxes
Deferred income taxes arise from temporary differences between the tax basis of assets and liabilities and their reported amounts in the financial statements, which will result in taxable or
80
deductible amounts in the future. We measure our deferred tax assets and liabilities based on enacted tax rates and projected state apportionment percentages for the years in which the differences are expected to reverse. Our primary deferred tax assets relate to intangible asset amortization, share-based compensation, acquisition-related costs, restructuring costs, deferred compensation and operating loss carryforwards. We regularly assess the recoverability of our deferred tax assets, considering all available positive and negative evidence, including the results of recent operations and the timing, level and character of projected future taxable income. These estimates are projected through the life of the related deferred tax assets based on assumptions that we believe to be reasonable and consistent with demonstrated operating results. Based on this analysis and sensitivities of future operating results, we have concluded that it is more likely than not that the recorded deferred tax assets will be realized. Changes in future operating results not currently forecasted may have a significant impact on the realization of deferred tax assets. On December 22, 2017, the Tax Act was enacted. The Tax Act significantly revises the U.S. corporate income tax law by, among other things, decreasing the federal corporate income tax rate from 35% to 21% effective January 1, 2018. As a result of the reduction in the corporate income tax rate, we are required to remeasure our U.S. net deferred taxes at December 31, 2017. The impact of the remeasurement resulted in a one-time credit to income tax expense of $2.4 million for the three months and year ended December 31, 2017. Effective January 1, 2018, the impact of the Tax Act will lower our combined statutory federal income tax rate plus an estimate for state, local and foreign income taxes from approximately 38% to 24% thus lowering our income tax expense beginning in calendar year 2018. The reduction in our combined statutory federal income tax rate plus an estimate for state, local and foreign income taxes from approximately 38% to 24% will also reduce the tax benefit of goodwill and acquired intangible assets beginning in 2018.
Share-Based Compensation
We have share-based compensation arrangements covering directors, senior management, investment professionals and other employees. We calculate share-based compensation using the fair value of the awards on the grant date. Our share-based compensation arrangements include restricted stock and options which vest based on service and performance conditions. We recognize expense net of expected forfeitures on a straight-line basis over the requisite service period for service based awards and on an accelerated basis for performance based awards. We estimate the fair value of stock option awards using the Black-Scholes option pricing model. The Black-Scholes model requires us to make assumptions about the volatility of our stock and the expected life of our stock options. In measuring expected volatility, we consider the historical volatility of the common stock of several public peer companies. For restricted stock awards with service or performance conditions, we have historically determined the fair value of the awards using our share price on the date of grant. The most subjective assumption in the determination of the fair value of share-based awards is the estimated fair value of our stock on the date of grant. We have historically considered the implied fair value of the stock-based on periodic transactions with third parties, as well as an annual valuation of our Company performed by an independent third-party. Following the IPO, we have established a policy of considering the closing sale price of our Class A common stock as quoted on NASDAQ on the date of grant for purposes of determining fair value of such awards.
Item 7A. Qualitative and Quantitative Disclosures Regarding Market Risk
Market Risk
Substantially all of our revenues are derived from investment management, fund administration and distribution fees, which are based on the market value of our AUM. Accordingly, our revenues and net income may decline as a result of our AUM decreasing due to depreciation of our investment portfolios. In addition, such depreciation could cause our clients to withdraw their assets in favor of
81
other investment alternatives that they perceive to offer higher returns or lower risk, which could cause our revenues and net income to decline further.
The value of our AUM was $61.8 billion at December 31, 2017. A 10% increase or decrease in the value of our AUM, if proportionately distributed over all of our strategies, products and client relationships, would cause an annualized increase or decrease in our revenues of approximately $43.8 million at our weighted-average fee rate of 71 basis points for the year ended December 31, 2017. Because of declining fee rates from larger relationships and differences in our fee rates across investment strategies, a change in the composition of our AUM, in particular, an increase in the proportion of our total AUM attributable to strategies, clients or relationships with lower effective fee rates, could have a material negative impact on our overall weighted-average fee rate. The same 10% increase or decrease in the value of our total AUM, if attributed entirely to a proportionate increase or decrease in the AUM of the Victory Funds, to which we provide a range of services in addition to those provided to institutional separate accounts, would cause an annualized increase or decrease in our revenues of approximately $53.5 million at the Victory Funds' aggregate weighted-average fee rate of 87 basis points. If the same 10% increase or decrease in the value of our total AUM was attributable entirely to a proportionate increase or decrease in the assets of our institutional separate accounts, it would cause an annualized increase or decrease in our revenues of approximately $29.2 million at the weighted-average fee rate across all of our institutional separate accounts of 47 basis points for the year ended December 31, 2017.
As is customary in the investment management industry, clients invest in particular strategies to gain exposure to certain asset classes, which exposes their investment to the benefits and risks of those asset classes. We believe our clients invest in each of our strategies in order to gain exposure to the portfolio securities of the respective strategies and may implement their own risk management program or procedures. We have not adopted a corporate-level risk management policy regarding client assets, nor have we attempted to hedge at the corporate level or within individual strategies the market risks that would affect the value of our overall AUM and related revenues. Some of these risks, such as sector and currency risks, are inherent in certain strategies, and clients may invest in particular strategies to gain exposure to particular risks. While negative returns in our strategies and net client cash outflows do not directly reduce the assets on our balance sheet (because the assets we manage are owned by our clients, not us), any reduction in the value of our AUM would result in a reduction in our revenues.
Exchange Rate Risk
A portion of the accounts that we advise hold investments that are denominated in currencies other than the U.S. dollar. To the extent our AUM are denominated in currencies other than the U.S. dollar, the value of that AUM will decrease with an increase in the value of the U.S. dollar, or increase with a decrease in the value of the U.S. dollar. Each investment team monitors its own exposure to exchange rate risk and makes decisions on how to manage that risk in the portfolios they manage. We believe many of our clients invest in those strategies in order to gain exposure to non-U.S. currencies, or may implement their own hedging programs. As a result, we generally do not hedge an investment portfolio's exposure to non-U.S. currency.
We have not adopted a corporate-level risk management policy to manage this exchange rate risk. Assuming 7% of our AUM are invested in securities denominated in currencies other than the U.S. dollar and excluding the impact of any hedging arrangement, a 10% increase or decrease in the value of the U.S. dollar would decrease or increase the fair value of our AUM by $432.4 million, which would cause an annualized increase or decrease in revenues of approximately $3.1 million at our weighted-average fee rate for the business of 71 basis points for the year December 31, 2017.
82
We operate in several foreign countries and incur operating expenses associated with these operations. In addition, we have revenue and revenue-sharing arrangements that are denominated in non-U.S. currencies. We do not believe foreign currency fluctuations materially affect our results of operations.
Interest Rate Risk
Interest rate risk is the risk that the fair value of future cash flows of a financial instrument will fluctuate because of changes in market interest rates. At December 31, 2017, we were exposed to interest rate risk as a result of the amounts outstanding under the 2014 Credit Agreement. See "—Liquidity and Capital Resources—2014 Credit Agreement" for a description of the amounts outstanding as of such date and the applicable interest rate.
83
Item 8. Financial Information and Supplementary Data
Report of Independent Registered Public Accounting Firm
To
the Stockholders and the Board of Directors of
Victory Capital Holdings, Inc.
Opinion on the Financial Statements
We have audited the accompanying consolidated balance sheets of Victory Capital Holdings, Inc. and subsidiaries (the Company) as of December 31, 2017 and 2016, the related consolidated statements of operations, comprehensive income (loss), changes in stockholders' equity, cash flows, for each of the three years in the period ended December 31, 2017, and the related notes (collectively referred to as the "consolidated financial statements"). In our opinion, the consolidated financial statements present fairly, in all material respects, the financial position of the Company at December 31, 2017 and 2016, and the results of its operations and its cash flows for each of the three years in the period ended December 31, 2017, in conformity with U.S. generally accepted accounting principles.
Basis for the Opinion
These financial statements are the responsibility of the Company's management. Our responsibility is to express an opinion on the Company's financial statements based on our audit. We are a public accounting firm registered with the Public Company Accounting Oversight Board (United States) (PCAOB) and are required to be independent with respect to the Company in accordance with the U.S. federal securities laws and the applicable rules and regulations of the Securities and Exchange Commission and the PCAOB.
We conducted our audit in accordance with the standards of the PCAOB. Those standards require that we plan and perform the audit to obtain reasonable assurance about whether the financial statements are free of material misstatement, whether due to error or fraud. The Company is not required to have, nor were we engaged to perform, an audit of its internal control over financial reporting. As part of our audits we are required to obtain an understanding of internal control over financial reporting but not for the purpose of expressing an opinion on the effectiveness of the Company's internal control over financial reporting. Accordingly, we express no such opinion.
Our audits included performing procedures to assess the risks of material misstatement of the financial statements, whether due to error or fraud, and performing procedures that respond to those risks. Such procedures included examining, on a test basis, evidence regarding the amounts and disclosures in the financial statements. Our audits also included evaluating the accounting principles used and significant estimates made by management, as well as evaluating the overall presentation of the financial statements. We believe that our audits provide a reasonable basis for our opinion.
/s/ Ernst & Young LLP
We have served as the Company's auditor since 2013.
Cleveland,
Ohio
March 29, 2018
84
Victory Capital Holdings, Inc. and Subsidiaries
Consolidated Balance Sheets
(In thousands, except for shares)
| |
December 31, 2017 |
December 31, 2016 |
|||||
|---|---|---|---|---|---|---|---|
ASSETS |
|||||||
Cash and cash equivalents |
$ | 12,921 | $ | 16,441 | |||
Investment management fees receivable |
42,264 | 43,597 | |||||
Fund administration and distribution fees receivable |
3,925 | 4,604 | |||||
Other receivables |
9,728 | 35,669 | |||||
Prepaid expenses |
5,441 | 4,208 | |||||
Available-for-sale securities, at fair value |
677 | 525 | |||||
Trading securities, at fair value |
10,659 | 5,638 | |||||
Property and equipment, net |
8,844 | 9,544 | |||||
Goodwill |
284,108 | 284,108 | |||||
Other intangible assets, net |
408,000 | 434,349 | |||||
Deferred tax asset, net |
— | 7,452 | |||||
Other assets |
6,055 | 4,816 | |||||
| | | | | | | | |
Total assets |
$ | 792,622 | $ | 850,951 | |||
| | | | | | | | |
| | | | | | | | |
| | | | | | | | |
LIABILITIES AND STOCKHOLDERS' EQUITY |
|||||||
Accounts payable |
$ | 327 | $ | 3,712 | |||
Accrued compensation and benefits |
29,305 | 40,539 | |||||
Accrued expenses |
21,669 | 27,535 | |||||
Consideration payable for acquisition of business |
9,856 | 17,267 | |||||
Deferred compensation plan liability |
10,659 | 5,638 | |||||
Deferred tax liability, net |
4,068 | — | |||||
Other liabilities |
2,330 | 6,734 | |||||
Long-term debt |
483,225 | 418,528 | |||||
| | | | | | | | |
Total liabilities |
561,439 | 519,953 | |||||
Stockholders' equity: |
|||||||
Common stock, par value $0.01 per share; 2017—78,837,300 shares authorized, 57,182,730 shares issued and 55,118,673 shares outstanding; 2016—78,837,300 shares authorized, 56,505,321 shares issued, 54,785,792 shares outstanding |
572 | 565 | |||||
Additional paid-in capital |
435,334 | 421,747 | |||||
Treasury stock, at cost: 2017—2,064,057 shares; 2016—1,719,529 shares |
(20,899 | ) | (16,245 | ) | |||
Accumulated other comprehensive loss |
64 | (537 | ) | ||||
Retained deficit |
(183,888 | ) | (74,532 | ) | |||
| | | | | | | | |
Total stockholders' equity |
231,183 | 330,998 | |||||
| | | | | | | | |
Total liabilities and stockholders' equity |
$ | 792,622 | $ | 850,951 | |||
| | | | | | | | |
| | | | | | | | |
| | | | | | | | |
The accompanying notes are an integral part of the consolidated financial statements.
85
Victory Capital Holdings, Inc. and Subsidiaries
Consolidated Statements of Operations
(in thousands except share amounts)
| |
Year Ended December 31, 2017 |
Year Ended December 31, 2016 |
Year Ended December 31, 2015 |
|||||||
|---|---|---|---|---|---|---|---|---|---|---|
Revenue |
||||||||||
Investment management fees |
$ | 343,811 | $ | 248,482 | $ | 201,553 | ||||
Fund administration and distribution fees |
65,818 | 49,401 | 39,210 | |||||||
| | | | | | | | | | | |
Total revenue |
409,629 | 297,883 | 240,763 | |||||||
Expenses |
||||||||||
Personnel compensation and benefits |
144,111 | 122,615 | 93,819 | |||||||
Distribution and other asset-based expenses |
103,439 | 77,497 | 51,481 | |||||||
General and administrative |
33,996 | 26,628 | 22,959 | |||||||
Depreciation and amortization |
29,910 | 30,405 | 27,291 | |||||||
Change in value of consideration payable for acquisition of business |
(294 | ) | (378 | ) | 193 | |||||
Acquisition-related costs |
2,094 | 6,619 | 3,187 | |||||||
Restructuring and integration costs |
6,205 | 10,012 | 8,613 | |||||||
| | | | | | | | | | | |
Total operating expenses |
319,461 | 273,398 | 207,543 | |||||||
| | | | | | | | | | | |
Income from operations |
90,168 | 24,485 | 33,220 | |||||||
Other income (expense) |
||||||||||
Interest income and other income/(expense) |
(2,913 | ) | 1,086 | 47 | ||||||
Interest expense and other financing costs |
(48,797 | ) | (34,642 | ) | (26,045 | ) | ||||
| | | | | | | | | | | |
Total other income (expense), net |
(51,710 | ) | (33,556 | ) | (25,998 | ) | ||||
| | | | | | | | | | | |
Income/(loss) before income taxes |
38,458 | (9,071 | ) | 7,222 | ||||||
Income tax (expense)/benefit |
(12,632 |
) |
3,000 |
(3,422 |
) |
|||||
| | | | | | | | | | | |
Net income/(loss) |
$ | 25,826 | $ | (6,071 | ) | $ | 3,800 | |||
| | | | | | | | | | | |
| | | | | | | | | | | |
| | | | | | | | | | | |
Earnings per share—basic |
$ | 0.47 | $ | (0.12 | ) | $ | 0.08 | |||
Earnings per share—diluted |
$ | 0.43 | (0.12 | ) | 0.08 | |||||
Weighted average shares outstanding—basic |
54,930,852 | 50,017,712 | 46,408,891 | |||||||
Weighted average shares outstanding—diluted |
59,577,348 | 50,017,712 | 48,090,753 | |||||||
Dividends declared per share |
$ | 2.42 | $ | — | $ | 1.28 | ||||
The accompanying notes are an integral part of the consolidated financial statements.
86
Victory Capital Holdings, Inc. and Subsidiaries
Consolidated Statements of Comprehensive Income (Loss)
(in thousands except shares)
| |
Year Ended December 31, 2017 |
Year Ended December 31, 2016 |
Year Ended December 31, 2015 |
|||||||
|---|---|---|---|---|---|---|---|---|---|---|
Net income/(loss) |
$ | 25,826 | $ | (6,071 | ) | $ | 3,800 | |||
Other comprehensive income/(loss): |
||||||||||
Net unrealized income/(loss) on available-for-sale securities |
64 | 18 | (15 | ) | ||||||
Net unrealized income/(loss) on cash flow hedge |
462 | 49 | (477 | ) | ||||||
Net unrealized loss on foreign currency translation adjustment |
75 | (62 | ) | — | ||||||
| | | | | | | | | | | |
Total other comprehensive income/(loss) |
601 | 5 | (492 | ) | ||||||
| | | | | | | | | | | |
Comprehensive income/(loss) |
$ | 26,427 | $ | (6,066 | ) | $ | 3,308 | |||
| | | | | | | | | | | |
| | | | | | | | | | | |
| | | | | | | | | | | |
The accompanying notes are an integral part of the consolidated financial statements.
87
Victory Capital Holdings, Inc. and Subsidiaries
Consolidated Statements of Changes in Stockholders' Equity
(in thousands, except for shares)
| |
Common Stock | Treasury Stock | |
Accumulated Other Comprehensive Loss |
|
|
|||||||||||||||||||
|---|---|---|---|---|---|---|---|---|---|---|---|---|---|---|---|---|---|---|---|---|---|---|---|---|---|
| |
Additional Paid-In Capital |
Retained Deficit |
|
||||||||||||||||||||||
| |
Shares | Amount | Shares | Amount | Total | ||||||||||||||||||||
Balance, January 1, 2015 |
46,592,669 | $ | 466 | (351,264 | ) | $ | (2,807 | ) | $ | 315,238 | $ | (50 | ) | $ | (11,533 | ) | $ | 301,314 | |||||||
| | | | | | | | | | | | | | | | | | | | | | | | | | |
Issuance of common stock |
209,007 | $ | 2 | — | $ | — | $ | 1,669 | $ | — | $ | — | $ | 1,671 | |||||||||||
Vesting of restricted share grants |
223,197 | $ | 2 | — | $ | — | $ | (2 | ) | $ | — | $ | — | $ | — | ||||||||||
Vesting of director share grants |
82,166 | $ | 1 | — | $ | — | $ | (1 | ) | $ | — | $ | — | $ | — | ||||||||||
Common stock repurchased |
— | $ | — | (148,214 | ) | $ | (1,185 | ) | $ | — | $ | — | $ | — | $ | (1,185 | ) | ||||||||
Equity awards modified to liabilities |
(40,295 | ) | $ | — | — | $ | — | $ | (1,305 | ) | $ | — | $ | — | $ | (1,305 | ) | ||||||||
Other comprehensive loss |
— | $ | — | — | $ | — | $ | — | $ | (492 | ) | $ | — | $ | (492 | ) | |||||||||
Stock-based compensation |
— | $ | — | — | $ | — | $ | 5,727 | $ | — | $ | — | $ | 5,727 | |||||||||||
Dividend |
— | $ | — | — | $ | — | $ | — | $ | — | $ | (60,101 | ) | $ | (60,101 | ) | |||||||||
Net income |
— | $ | — | — | $ | — | $ | — | $ | — | $ | 3,800 | $ | 3,800 | |||||||||||
| | | | | | | | | | | | | | | | | | | | | | | | | | |
Balance, December 31, 2015 |
47,066,744 | $ | 471 | (499,478 | ) | $ | (3,992 | ) | $ | 321,326 | $ | (542 | ) | $ | (67,834 | ) | $ | 249,429 | |||||||
| | | | | | | | | | | | | | | | | | | | | | | | | | |
Issuance of common stock |
9,206,095 | $ | 92 | — | $ | — | $ | 94,429 | $ | — | $ | — | $ | 94,521 | |||||||||||
Equity issuance costs |
— | $ | — | — | $ | — | $ | (210 | ) | $ | — | $ | — | $ | (210 | ) | |||||||||
Vesting of restricted share grants |
194,290 | $ | 2 | — | $ | — | $ | (2 | ) | $ | — | $ | — | $ | — | ||||||||||
Vesting of director share grants |
65,698 | $ | — | — | $ | — | $ | — | $ | — | $ | — | $ | — | |||||||||||
Common stock repurchased |
— | $ | — | (1,220,051 | ) | $ | (12,253 | ) | $ | — | $ | — | $ | — | $ | (12,253 | ) | ||||||||
Equity awards modified to liabilities |
(27,506 | ) | $ | — | — | $ | — | $ | (2,316 | ) | $ | — | $ | — | $ | (2,316 | ) | ||||||||
Other comprehensive loss |
— | $ | — | — | $ | — | $ | — | $ | 5 | $ | — | $ | 5 | |||||||||||
Stock-based compensation |
— | $ | — | — | $ | — | $ | 8,520 | $ | — | $ | — | $ | 8,520 | |||||||||||
Dividend |
— | $ | — | — | $ | — | $ | — | $ | — | $ | (627 | ) | $ | (627 | ) | |||||||||
Net income |
— | $ | — | — | $ | — | $ | — | $ | — | $ | (6,071 | ) | $ | (6,071 | ) | |||||||||
| | | | | | | | | | | | | | | | | | | | | | | | | | |
Balance, December 31, 2016 |
56,505,321 | 565 | (1,719,529 | ) | $ | (16,245 | ) | $ | 421,747 | $ | (537 | ) | $ | (74,532 | ) | $ | 330,998 | ||||||||
| | | | | | | | | | | | | | | | | | | | | | | | | | |
| | | | | | | | | | | | | | | | | | | | | | | | | | |
| | | | | | | | | | | | | | | | | | | | | | | | | | |
Issuance of common stock |
296,363 | $ | 3 | — | $ | — | $ | 3,190 | $ | — | $ | — | $ | 3,193 | |||||||||||
Vesting of restricted share grants |
339,701 | $ | 3 | — | $ | — | $ | (3 | ) | $ | — | $ | — | $ | — | ||||||||||
Vesting of director share grants |
49,405 | $ | 1 | — | $ | — | $ | (1 | ) | $ | — | $ | — | $ | — | ||||||||||
Common stock repurchased |
— | $ | — | (344,528 | ) | $ | (4,654 | ) | $ | — | $ | — | $ | — | $ | (4,654 | ) | ||||||||
Equity awards modified to liabilities |
(8,060 | ) | $ | — | — | $ | — | $ | (1,553 | ) | $ | — | $ | — | $ | (1,553 | ) | ||||||||
Other comprehensive loss |
— | $ | — | — | $ | — | $ | — | $ | 601 | $ | — | $ | 601 | |||||||||||
Stock-based compensation |
— | $ | — | — | $ | — | $ | 11,693 | $ | — | $ | — | $ | 11,693 | |||||||||||
Dividend |
— | $ | — | — | $ | — | $ | — | $ | — | $ | (135,171 | ) | $ | (135,171 | ) | |||||||||
Excess tax benefits realized on stock-based compensation |
— | $ | — | — | $ | — | $ | 261 | $ | — | $ | — | $ | 261 | |||||||||||
Other |
— | $ | — | — | $ | — | $ | — | $ | — | $ | (11 | ) | $ | (11 | ) | |||||||||
Net income |
— | $ | — | — | $ | — | $ | — | $ | — | $ | 25,826 | $ | 25,826 | |||||||||||
| | | | | | | | | | | | | | | | | | | | | | | | | | |
Balance, December 31, 2017 |
57,182,730 | $ | 572 | (2,064,057 | ) | $ | (20,899 | ) | $ | 435,334 | $ | 64 | $ | (183,888 | ) | $ | 231,183 | ||||||||
| | | | | | | | | | | | | | | | | | | | | | | | | | |
| | | | | | | | | | | | | | | | | | | | | | | | | | |
| | | | | | | | | | | | | | | | | | | | | | | | | | |
The accompanying notes are an integral part of the consolidated financial statements.
88
Victory Capital Holdings, Inc. and Subsidiaries
Consolidated Statement of Cash Flows
(in thousands)
| |
Year Ended December 31, 2017 |
Year Ended December 31, 2016 |
Year Ended December 31, 2015 |
|||||||
|---|---|---|---|---|---|---|---|---|---|---|
Cash flows from operating activities |
||||||||||
Net income |
$ | 25,826 | $ | (6,071 | ) | $ | 3,800 | |||
Adjustments to reconcile net gain/(loss) to net cash provided by operating activities: |
||||||||||
Provision for deferred income taxes |
11,191 | (3,080 | ) | 2,480 | ||||||
Depreciation and amortization |
29,910 | 30,405 | 27,291 | |||||||
Deferred financing costs and derivative and accretion expense |
6,936 | 4,792 | 3,208 | |||||||
Stock-based and deferred compensation |
17,179 | 12,022 | 8,992 | |||||||
Change in fair value of contingent consideration obligations |
(294 | ) | (378 | ) | 193 | |||||
Payments for settlement of contingent consideration |
— | — | (1,317 | ) | ||||||
Impairment of other receivable |
4,429 | — | — | |||||||
Unrealized depreciation (appreciation) on trading securities |
(620 | ) | (394 | ) | 196 | |||||
Losses (earnings) on equity method investment |
427 | — | — | |||||||
Changes in operating assets and liabilities: |
||||||||||
Investment management fees receivable |
1,333 | (4,411 | ) | 3,043 | ||||||
Fund administration and distribution fees receivable |
679 | (895 | ) | (121 | ) | |||||
Other receivables |
21,456 | 98 | 820 | |||||||
Prepaid expenses |
(1,231 | ) | 1,304 | 661 | ||||||
Other assets |
79 | (7 | ) | — | ||||||
Accounts payable |
(3,550 | ) | 2,299 | (60 | ) | |||||
Accrued compensation and benefits |
(10,607 | ) | 2,178 | (7,376 | ) | |||||
Accrued expenses |
(5,701 | ) | 3,520 | (2,372 | ) | |||||
Deferred compensation plan liability |
(181 | ) | (17 | ) | (409 | ) | ||||
Other liabilities |
(1,092 | ) | (1,825 | ) | 1,625 | |||||
| | | | | | | | | | | |
Net cash provided by operating activities |
96,169 | 39,540 | 40,654 | |||||||
Cash flows from investing activities |
||||||||||
Purchases of property and equipment |
(5,105 | ) | (1,164 | ) | (1,928 | ) | ||||
Disposal of property and equipment due to restructuring |
3,006 | 12 | 31 | |||||||
Purchases of trading securities |
(9,567 | ) | (4,991 | ) | (4,807 | ) | ||||
Sales of trading securities |
5,166 | 2,585 | 2,132 | |||||||
Purchases of available-for-sale securities |
(111 | ) | (355 | ) | (369 | ) | ||||
Sales of available-for-sale securities |
79 | 1,290 | 792 | |||||||
Equity method investment |
(2,000 | ) | (3,025 | ) | — | |||||
Purchase and sale of options |
— | (21 | ) | — | ||||||
Acquisition of business, net of cash acquired |
— | (204,413 | ) | (16,000 | ) | |||||
| | | | | | | | | | | |
Net cash used in investing activities |
(8,532 | ) | (210,082 | ) | (20,149 | ) | ||||
Cash flows from financing activities |
||||||||||
Issuance of common stock, net of costs |
3,193 | 89,259 | 1,671 | |||||||
Repurchase of common stock |
(4,654 | ) | (10,529 | ) | (1,185 | ) | ||||
Payment of equity awards modified to liabilities |
(1,836 | ) | (4,632 | ) | (51 | ) | ||||
Excess tax benefits on share-based compensation |
261 | — | — | |||||||
Proceeds from long-term senior debt |
125,000 | 129,975 | 49,625 | |||||||
Proceeds from draw on line of credit |
— | 3,500 | — | |||||||
Repayment of draw on line of credit |
(3,500 | ) | — | — | ||||||
Payment for interest rate cap on debt |
— | — | (375 | ) | ||||||
Payment of debt financing fees |
(1,733 | ) | (5,854 | ) | (1,979 | ) | ||||
Repayment of long-term senior debt |
(63,877 | ) | (21,013 | ) | (16,673 | ) | ||||
Repayment of promissory note |
(575 | ) | (479 | ) | — | |||||
Payment of dividends |
(135,171 | ) | (627 | ) | (60,101 | ) | ||||
Payment of consideration for acquisition |
(8,381 | ) | (7,761 | ) | (2,056 | ) | ||||
| | | | | | | | | | | |
Net cash provided by financing activities |
(91,273 | ) | 171,839 | (31,124 | ) | |||||
Effect of changes of foreign exchange rate on cash and cash equivalents |
116 |
— |
— |
|||||||
Net (decrease) increase in cash and cash equivalents |
(3,520 | ) | 1,297 | (10,619 | ) | |||||
Cash and cash equivalents, beginning of period |
16,441 |
15,144 |
25,763 |
|||||||
| | | | | | | | | | | |
Cash and cash equivalents, end of period |
$ | 12,921 | $ | 16,441 | $ | 15,144 | ||||
| | | | | | | | | | | |
| | | | | | | | | | | |
| | | | | | | | | | | |
Supplemental cash flow information |
||||||||||
Cash paid for interest |
$ | 41,489 | $ | 29,393 | $ | 22,579 | ||||
Cash paid for income taxes |
758 | 495 | 613 | |||||||
Supplemental disclosure of non-cash item |
||||||||||
Promissory note issued for repurchase of common stock and equity awards |
— | 1,724 | — | |||||||
Equity awards modified to liabilities pending payment |
— | — | (1,255 | ) | ||||||
The accompanying notes are an integral part of the consolidated financial statements.
89
Victory Capital Holdings, Inc. and Subsidiaries
Notes to Consolidated Financial Statements
Years Ended December 31, 2017, 2016 and 2015
1. Organization and Nature of Business
Victory Capital Holdings, Inc., a Delaware corporation (along with its wholly-owned subsidiaries, collectively referred to as the Company) was formed on February 13, 2013 for the purpose of acquiring Victory Capital Management Inc. (Victory) and Victory Capital Advisers, Inc. (VCA), which occurred on August 1, 2013. The Company has one class of common stock with a par value of $0.01. Holders of common stock are entitled to one vote for each share held.
Victory, a registered investment adviser under the Investment Advisers Act of 1940, manages assets for institutional, intermediary and retirement clients through separately managed accounts, collective trust funds, open-end mutual funds, exchanged-traded funds (ETFs) and unified managed account and wrap separate account programs. Victory also provides mutual fund administrative services to the Victory Portfolios, Victory Variable Insurance Funds, Victory Institutional Funds and the mutual fund series of Victory Portfolios II (collectively, the Victory Funds), a family of open-end mutual funds.
VCA is registered with the Securities and Exchange Commission (SEC) as an introducing broker-dealer and is a member of the Financial Industry Regulatory Authority (FINRA) and Securities Investor Protection Corporation (SIPC). VCA serves as distributor and underwriter for the Victory Funds and placement agent for Victory Capital Series, LLC, a Delaware multi-series limited liability company.
On November 1, 2014, the Company acquired all of the outstanding membership interests in Munder Capital Management GP (Munder), a registered investment adviser and Delaware general partnership formed on December 31, 1994, and Munder's wholly-owned subsidiary, Integrity Asset Management LLC (Integrity), a registered investment adviser and Delaware limited liability company formed on February 13, 2003. Munder and Integrity provided investment management services to institutional investors such as pension plans, profit sharing plans and endowments. In addition, all series of the Munder Funds were reorganized and moved into the Victory Portfolios.
On May 1, 2015, with the acquisition of Compass EMP (CEMP), Victory became the advisor to Victory Portfolios II, an open-end investment management company organized as a Delaware statutory trust and formerly known as Compass EMP Funds Trust. Victory Portfolios II includes mutual fund series and exchange-traded funds series (Victory ETFs). On November 1, 2015, VCA became the distributor for the mutual fund series of Victory Portfolios II.
On July 29, 2016, Victory Capital Operating, LLC (Operating) acquired all of the outstanding membership interests in RS Investment Management Co. LLC (RSIM) and its wholly-owned subsidiaries. On August 1, 2016, RSIM was merged into Victory, and RSIM's subsidiaries became subsidiaries of Victory.
RSIM was a registered investment adviser and Delaware limited liability company formed on November 10, 1998 and provided investment advisory and related services to the RS Investment Trust (mutual funds), RS Variable Products Trust (variable investment trusts), and institutional and other clients. RSIM's four subsidiaries include RS Investment Management (Singapore) Pte. Ltd. (RSSI), RS Investments (Hong Kong) Limited (RSHK), RS Investments (UK) Limited (RSUK) and RS Funds Distributor LLC (RSFD). RSFD was merged into Victory in July 2017.
90
Victory Capital Holdings, Inc. and Subsidiaries
Notes to Consolidated Financial Statements (Continued)
Years Ended December 31, 2017, 2016 and 2015
1. Organization and Nature of Business (Continued)
Concurrent with the RSIM acquisition, the RS Investment Trust and RS Variable Products Trust were re-organized into newly created series of the Victory Portfolios and Victory Variable Insurance Funds, and VCA became the distributor for the newly re-organized funds.
2. Significant Accounting Policies
Basis of Presentation
The Company prepares its consolidated financial statements on the accrual basis of accounting in accordance with accounting principles generally accepted in the United States of America (GAAP).
All dollar amounts, except per share data in the text and tables herein, are stated in thousands unless otherwise indicated.
Retroactive Adjustments for Common Stock Split
The Company's Board of Directors and stockholders approved a 175.194 for 1 stock split of the Company's common stock on February 1, 2018. All common share and common per share amounts in the consolidated financial statements and notes thereto have been retroactively adjusted for all periods presented to give effect to this stock split (see Notes 13 and 16).
Principles of Consolidation
The consolidated financial statements include the accounts of the Company and its wholly-owned subsidiaries. All significant intercompany transactions and balances have been eliminated. Certain prior year amounts have been reclassified to conform to the current year presentation.
The Company evaluates entities in which it invests and investment funds that it sponsors to determine whether the Company has a controlling financial interest in these entities and is required to consolidate them. A controlling financial interest generally exists if 1) the Company holds greater than 50% voting interest in entities controlled through voting interests or if 2) the Company has the ability to direct significant activities of a fund not controlled through voting interests (a variable interest entity or VIE) and the obligation to absorb losses of and/or the right to receive benefits from the VIE that could potentially be significant to the VIE.
The Company's involvement with non-consolidated sponsored investment funds that are considered VIEs include providing investment advisory services, fund administration and distribution services and/or holding a minority interest. At December 31, 2017, 2016 and 2015, the Company's investments in and maximum risk of loss related to unconsolidated sponsored VIE investment funds totaled $10.9 million, $5.6 million and $2.3 million respectively which are included in available-for-sale securities and trading securities on the consolidated balance sheets. The Company has not provided financial support to these entities outside the ordinary course of business, which includes assuming operating expenses of funds for competitive or contractual reasons through fee waivers and fund expense reimbursements. The Company does not consolidate the sponsored investment funds in which it had an equity investment as it holds a minority interest, does not direct significant activities of these funds and does not have the right to receive benefits nor the obligation to absorb losses that could potentially be significant to these funds.
91
Victory Capital Holdings, Inc. and Subsidiaries
Notes to Consolidated Financial Statements (Continued)
Years Ended December 31, 2017, 2016 and 2015
2. Significant Accounting Policies (Continued)
During the years ended December 31, 2017 and 2016, the Company's involvement with other non-consolidated VIEs included an equity method investment and put and call option arrangements with Cerebellum Capital, LLC (Cerebellum). The Company's maximum risk of loss associated with Cerebellum totaled $6.0 million at December 31, 2017 and 2016, which includes the $5.0 million and $3.0 million investment and $1.0 million and $3.0 million exposure under the put option for the purchase of additional equity, respectively(see Note 12).
The Company applies the equity method of accounting to investments where it does not hold a controlling equity interest but has the ability to exercise significant influence over operating and financial matters. In the event that management identifies an other than temporary decline in the estimated fair value of an equity method investment to an amount below its carrying value, the investment is written down to its estimated fair value.
Use of Estimates and Assumptions
The preparation of consolidated financial statements in conformity with GAAP requires management to make estimates and assumptions that affect the reported amounts and disclosures in the financial statements. Actual results may ultimately differ from those estimates and the differences may be material.
Revenue Recognition
Investment Management Fees
Investment management fees are accrued as earned and are calculated as a contractual percentage of assets under management and advisement (AUM) and vary as levels of AUM change from inflows, outflows and market movement and with number of days in a reporting period. Any investment management fees collected in advance are deferred and recognized as income over the period earned.
Waivers of investment management fees from affiliated funds are included in investment management fees on the consolidated statements of operations. In 2017, 2016 and 2015, the amount of waivers of investment management fees from affiliated funds was immaterial.
Performance-based investment management fees are accrued only when the performance period is complete, the amount of revenue is no longer subject to adjustment and collectability is reasonably assured. Performance-based investment management fees are recorded in investment management fees on the consolidated statements of operation. In 2017 the Company recognized $1.2 million of performance-based investment management fees. In 2016 the Company recognized an immaterial amount of performance-based investment management fees In 2015, the Company did not have any investment management agreements that included performance-based investment management fees.
Fund Administration and Distribution Fees
Fund administration fees are accrued on a monthly basis and are determined based on the contractual rate applied to average daily net assets of the Victory Funds for which administration services are provided. The Company is the primary obligor and has the ability to select the service
92
Victory Capital Holdings, Inc. and Subsidiaries
Notes to Consolidated Financial Statements (Continued)
Years Ended December 31, 2017, 2016 and 2015
2. Significant Accounting Policies (Continued)
provider and establish pricing and therefore, records fund administration fees and expenses on a gross basis.
Fund distribution fees are accrued on a monthly basis and are determined based on the contractual rate applied to average daily net assets of the Victory Funds for which distribution services are provided. The Company is the primary obligor and has the ability to select the service provider and establish pricing and therefore, records distribution fees and expenses on a gross basis.
The fair value of AUM of the Victory Funds is primarily determined using quoted market prices or independent third-party pricing services or broker price quotes. In limited circumstances, a quotation or price evaluation is not readily available from a pricing service. In these cases, pricing is determined by management based on a prescribed valuation process that has been approved by the directors/trustees of the sponsored products. The same prescribed valuation process is used to price securities in separate accounts and other vehicles for which a quotation or price evaluation is not readily available from a pricing service. For the periods presented, a de minimis amount of the AUM was priced in this manner.
Distribution and Other Asset-Based Expenses
Distribution and other asset-based expenses include broker dealer distribution, platform distribution, sub-administration, and sub-advisory expenses. These expenses are accrued on a monthly basis and are generally calculated as a percentage of AUM and vary as levels of AUM change from inflows, outflows and market movement and with the number of days in the month.
Also included in distribution and other asset-based expenses are middle office expenses. Middle office expenses are accrued on a monthly basis and vary with changes in mutual fund, institutional and wrap separate account AUM levels, the number of accounts and volume of account transaction activity.
Restructuring and Integration Costs
In connection with business combinations, asset purchases and changes in business strategy, the Company incurs costs integrating investment platforms, products and personnel into existing systems, processes and service provider arrangements and restructuring the business to capture operating expense synergies. In the case of business combinations, these costs are incurred after the closing date.
These costs include severance-related expenses related to one-time benefit arrangements and contract termination costs. A liability for restructuring costs is recognized only after management has developed a formal plan to which it has committed. The costs included in the restructuring liability are those costs that are either incremental or incurred as a direct result of the plan, or are the result of a continuing contractual obligation with no continuing economic benefit to the Company, or a penalty incurred to cancel the contractual obligation. Severance expense is recorded when management has committed to a plan for a reduction in workforce, the plan has been communicated to employees and it is unlikely that there will be significant changes to the plan.
Contract termination liabilities are recorded for contract termination costs when the Company terminates a contract or stops using the product or service covered by the contract. Contract termination liabilities are recognized and measured at fair value. Contract termination costs are
93
Victory Capital Holdings, Inc. and Subsidiaries
Notes to Consolidated Financial Statements (Continued)
Years Ended December 31, 2017, 2016 and 2015
2. Significant Accounting Policies (Continued)
recorded in restructuring and integration costs on the consolidated statements of operations. A rollforward of restructuring and integration liabilities for 2017, 2016 and 2015 appears below.
| (in millions) |
2017 | 2016 | 2015 | |||||||
|---|---|---|---|---|---|---|---|---|---|---|
Liability balance, beginning of year |
$ | 7.4 | $ | 5.0 | $ | 4.3 | ||||
| | | | | | | | | | | |
Severance expense |
||||||||||
RSIM |
0.5 | 7.4 | — | |||||||
Other |
0.3 | — | 5.0 | |||||||
CEMP |
— | — | 0.5 | |||||||
Munder |
— | — | 2.1 | |||||||
Contract termination expense |
||||||||||
RSIM |
5.0 | 2.4 | — | |||||||
CEMP |
— | — | — | |||||||
Munder |
— | — | 0.9 | |||||||
Integration costs |
0.4 | 0.2 | 0.1 | |||||||
| | | | | | | | | | | |
Restructuring and integration costs |
6.2 | 10.0 | 8.6 | |||||||
Settlement of liabilities |
(13.5 | ) | (7.6 | ) | (7.9 | ) | ||||
| | | | | | | | | | | |
Liability balance, end of year |
$ | 0.1 | $ | 7.4 | $ | 5.0 | ||||
| | | | | | | | | | | |
| | | | | | | | | | | |
| | | | | | | | | | | |
Accrued expenses |
$ | 0.1 | $ | 6.9 | $ | 2.7 | ||||
Other liabilities |
— | 0.5 | 2.3 | |||||||
| | | | | | | | | | | |
Liability balance, end of year |
$ | 0.1 | $ | 7.4 | $ | 5.0 | ||||
| | | | | | | | | | | |
| | | | | | | | | | | |
| | | | | | | | | | | |
As a result of recent growth and changes in the business and additional senior management hires, the Company made the decision in late 2015 to streamline the leadership team. The Company recorded $5.0 million in restructuring and integration costs on the consolidated statements of operation related to one-time benefit arrangements in connection with this restructuring plan.
Cash and Cash Equivalents
Cash and cash equivalents consist of cash at banks, money market funds and short-term liquid investments with original maturities of three months or less at the time of purchase. For the Company and certain subsidiaries, cash deposits at a financial institution may exceed Federal Deposit Insurance Corporation insurance limits.
Investments
Available-For-Sale Securities
Available-for-sale securities include investments in affiliated mutual funds and are recorded in available-for-sale securities on the consolidated balance sheets. Investments in available-for-sale securities are carried at fair value. Changes in fair value are recognized as a component of other comprehensive income (loss) until the securities are sold. Unrealized holdings gains or losses (to the extent such losses are considered temporary) are reported net of deferred tax as a separate component
94
Victory Capital Holdings, Inc. and Subsidiaries
Notes to Consolidated Financial Statements (Continued)
Years Ended December 31, 2017, 2016 and 2015
2. Significant Accounting Policies (Continued)
of accumulated other comprehensive income (loss) until realized. Upon disposition, the gain or loss on the security is reclassified from other comprehensive income (loss) to other income (expense) on the consolidated statements of operations. The cost of securities sold is determined using the specific identification method. Dividend income is accrued on the declaration date and is included in other income in the consolidated statements of operations. Transactions are recorded on a trade-date basis.
The Company periodically reviews each individual security that is in an unrealized loss position to determine if the impairment is other-than-temporary. Factors that are considered in determining whether other-than-temporary declines in value have occurred include the severity and duration of the unrealized loss and the Company's ability and intent to hold the security for a length of time sufficient to allow for recovery of such unrealized losses. Impairment charges are recorded in other income (expense) on the consolidated statements of operations. No impairments were recognized as a result of such review in the years ended December 31, 2017, 2016 and 2015.
Trading Securities
Trading securities include investments in affiliated and third party mutual funds held in a rabbi trust under a deferred compensation plan. Trading securities are recorded at fair value on the consolidated balance sheets. Changes in value in trading securities are recognized by the Company in other income (expense) on the consolidated statements of operations.
The Company's available-for-sale and trading securities are valued through the use of quoted market prices available in an active market, which is the NAV of the funds.
Derivative Financial Instruments
The Company evaluates financial instruments and other contracts to determine if the arrangement meets the characteristics of a derivative under ASC 815 and the criteria to use hedge accounting.
Hedging instruments
The Company uses derivative financial instruments to manage interest rate risk related to a portion of its long-term debt. Derivatives are recorded as other assets and other liabilities on the balance sheet and are measured at fair value. To qualify for hedge accounting, the derivative must be deemed to be highly effective in offsetting the designated changes in the hedged item. If the Company's derivatives qualify as cash flow hedges, the effective portion of fluctuations in the fair value of the derivatives are recorded in accumulated other comprehensive income and reclassified, as adjustments to interest expense, as the underlying hedged item impacts earnings.
The change in fair value of the ineffective portion of the derivative, if any, is recognized immediately in earnings. If a cash flow hedge is terminated or is no longer considered to be effective, hedge accounting is discontinued prospectively. If the derivative continues to exist, future changes in fair value are accounted for in income unless the derivative is re-designated in a new qualifying hedge relationship.
95
Victory Capital Holdings, Inc. and Subsidiaries
Notes to Consolidated Financial Statements (Continued)
Years Ended December 31, 2017, 2016 and 2015
2. Significant Accounting Policies (Continued)
The Company assesses ongoing effectiveness for its interest rate cap derivatives, which have been designated as cash flow hedges, based on total changes in the cap's cash flows and by reviewing whether there have been any changes in the critical terms of the cap or transaction being hedged or any adverse changes in the counterparty's credit. If no such changes have occurred, no ineffectiveness is recorded. If there are changes in critical terms, prospective and retrospective hedge effectiveness is assessed via a cumulative dollar offset test and ineffectiveness is recognized in earnings. No hedge ineffectiveness was recorded in the years ended December 31, 2017, 2016 and 2015.
Property and Equipment
Property and equipment is recorded at cost less accumulated depreciation. Depreciation and amortization is computed using the straight-line method over the estimated useful lives of the related assets, generally three to ten years. Improvements to leased property are amortized on a straight-line basis over the lesser of the useful life of the improvements or the term of the applicable lease. When assets are sold or retired, the related cost and accumulated depreciation are removed from the respective accounts and any resulting gain or loss is included in other income (expense) in the consolidated statements of operation. Gains and losses resulting from the sale or disposal of assets as part of a restructuring plan are included in restructuring and integration costs in the consolidated statements of operation. The cost of repairs and maintenance are expensed as incurred. Equipment and leasehold improvements are tested for impairment whenever changes in facts or circumstances indicate that the carrying amount of an asset may not be recoverable.
Segment Reporting
The Company operates in one business segment that provides investment management services and products to institutional and intermediary clients. The Company's determination that it has one operating segment is based on the fact that the Chief Operating Decision Maker (CODM) reviews the Company's financial performance on an aggregate level.
Goodwill
Goodwill represents the excess cost of the acquisition over the fair value of net assets acquired in a business combination. For goodwill impairment testing purposes, the Company has determined that there is only one reporting unit.
The Company tests goodwill for impairment on an annual basis, or more frequently if facts and circumstances indicate that goodwill may be impaired. Factors that could trigger an impairment review include significant underperformance relative to historical or projected future operating results, significant changes in the Company's use of the acquired assets in a business combination or strategy for the Company's overall business, and significant negative industry or economic trends. The Company conducts the annual impairment assessment as of October 1st. The Company uses a qualitative approach to test for potential impairment of goodwill. If, after considering various factors, management determines that it is more likely than not that goodwill is impaired, a two-step process to test for and measure impairment is performed which begins with an estimation of the fair value of the Company by considering discounted cash flows. The assumptions used to estimate fair value include management's estimates of future growth rates, operating cash flows, discount rates and terminal value. These
96
Victory Capital Holdings, Inc. and Subsidiaries
Notes to Consolidated Financial Statements (Continued)
Years Ended December 31, 2017, 2016 and 2015
2. Significant Accounting Policies (Continued)
assumptions and estimates can change in future periods based on market movement and factors impacting the expected business performance. Changes in assumptions or estimates could materially affect the determination of the fair value of the Company. If the present value of future expected cash flows falls below the recorded book value of equity, the Company's goodwill would be considered impaired. There were no impairments to goodwill recognized during the years ended December 31, 2017, 2016 or 2015.
Intangible Assets
Intangible assets acquired by the Company outside of a business combination are initially recognized and measured based on the Company's cost to acquire the intangible assets. If a group of assets is acquired, the cost is allocated to individual assets based on their relative fair value. Intangible assets acquired in a business combination are initially recognized and measured at fair value. In valuing these assets, the Company makes assumptions regarding useful lives and projected growth rates, and significant judgment is required.
Definite-lived intangible assets represent the value of acquired customer relationships in institutional separate accounts, collective funds, intermediary wrap separate account (wrap SMA) and unified managed account/model (UMA) programs. Definite-lived intangible assets also include intellectual property, advisory contracts that do not have a sufficient history of annual renewal and non-competition agreements.
The Company amortizes definite-lived identifiable intangible assets on a straight-line basis over a period that is shorter than the asset's economic life as the pattern of economic benefit cannot be reliably determined. Management periodically evaluates the remaining useful lives and carrying values of the intangible assets to determine whether events and circumstances indicate that a change in the useful life or impairment in value may have occurred. Indicators of impairment monitored by management include a decline in the level of managed assets, changes to contractual provisions underlying certain intangible assets and reductions in underlying operating cash flows. Should there be an indication of a change in the useful life or impairment in value of the definite-lived intangible assets, the Company compares the carrying value of the asset to the projected undiscounted cash flows expected to be generated from the underlying asset over its remaining useful life to determine whether impairment has occurred. If the carrying value of the asset exceeds the undiscounted cash flows, the asset is written down to its fair value determined using discounted cash flows. The Company writes off the cost and accumulated amortization balances for all fully amortized intangible assets.
There were no impairments to definite-lived intangible assets recognized in 2017, 2016 or 2015.
Indefinite-lived intangible assets include trade names and contracts for advisory and distribution services where the Company expects to, and has the ability to continue to manage these funds indefinitely, the contracts have annual renewal provisions, and there is a high likelihood of continued renewal based on historical experience. Trade names are considered indefinite-lived intangible assets when they are expected to generate cash flows indefinitely.
Indefinite-lived intangible assets are reviewed for impairment annually as of October 1st using a qualitative approach which requires that positive and negative evidence collected as a result of considering various factors be weighed in order to determine whether it is more likely than not that an
97
Victory Capital Holdings, Inc. and Subsidiaries
Notes to Consolidated Financial Statements (Continued)
Years Ended December 31, 2017, 2016 and 2015
2. Significant Accounting Policies (Continued)
indefinite-lived intangible asset is impaired. In addition, periodically management reconsiders whether events or circumstances indicate that a change in the useful life may have occurred.
Indicators of a possible change in useful life monitored by management include a significant decline in the level of managed assets, changes to legal, regulatory or contractual provisions of the renewable investment advisory contracts and reductions in underlying operating cash flows. The Company estimates the fair value of the indefinite-lived intangible asset and compares it to the book value of the asset to determine whether an impairment charge is necessary. Impairment is indicated when the carrying value of the intangible asset exceeds its fair value. In 2015, the Company recorded an immaterial impairment loss related to the CEMP trade name indefinite lived intangible asset following the launch of a new logo for CEMP. There were no other impairment losses recognized on indefinite-lived intangible assets in 2017, 2016 or 2015.
Accounts Receivable
Accounts receivable includes investment management, fund administration, and fund distribution fees due from the Victory Funds and Victory ETFs and investment management fees due from non-affiliated parties. Provision for credit losses on customer accounts is made in amounts required to maintain an adequate allowance to cover anticipated losses. All accounts receivable were determined to be collectible as of December 31, 2017, 2016 and 2015, and accordingly, no reserve for credit losses and no provision for credit losses were recognized as of and for the years ended December 31, 2017, 2016 and 2015.
Other Receivables
Other receivables primarily include income and other taxes receivable and amounts due to the Company under a contract with a third party acquired in the acquisition of RSIM. All amounts included in other receivables were determined to be collectible as of December 31, 2017, 2016 and 2015.
Share-Based Compensation
Compensation expense related to share-based payments is measured at the grant date based on the fair value of the award. The fair value of each option granted is estimated using the Black-Scholes option valuation model. The Black-Scholes option valuation model incorporates assumptions as to dividend yield, expected volatility, an appropriate risk-free interest rate and the expected life of the option. Compensation expense is adjusted for estimated forfeitures and is recognized on a straight-line basis over the total vesting period of the award for restricted share awards and the service portion of stock option awards. Compensation expense for performance based stock option awards is recognized on an accelerated basis over the requisite service period if it is probable that the performance conditions will be satisfied. Compensation expense is adjusted for estimated forfeitures. The corresponding credit for restricted share and stock option compensation expense is recorded to additional paid in capital.
As the Company was not a taxpayer in 2015, 2016 and 2017 due to net operating loss carryforwards, stock based compensation deductions for tax provision purposes were limited to the
98
Victory Capital Holdings, Inc. and Subsidiaries
Notes to Consolidated Financial Statements (Continued)
Years Ended December 31, 2017, 2016 and 2015
2. Significant Accounting Policies (Continued)
amount of the expense recorded for financial reporting purposes for vested restricted shares, stock options cancelled with cash payment in lieu of exercise, dividends paid on newly vested restricted shares and the cash bonus equivalent of dividends paid on vested options in 2015, 2016 and 2017.
Earnings per share
The calculation of basic earnings per share is based on the weighted average number of shares of the Company's common stock outstanding during the period. Diluted earnings per share is similar to basic earnings per share, but adjusts for the dilutive effect of the potential issuance of incremental shares of the Company's common stock. The Company had vested and unvested stock options and unvested restricted stock grants outstanding during the periods presented and applies the treasury stock method to these securities in its calculation of diluted earnings per share. The treasury stock method assumes that the proceeds of exercise are used to purchase common stock at the average market price for the period. The Company does not have any participating securities that would require the use of the two-class method of computing earnings per share.
Deferred Financing Fees
The costs of obtaining term loan financing are capitalized in long-term debt and amortized to interest expense over the term of the respective financing using the effective interest method. The costs of obtaining revolving line of credit financing are capitalized in other assets and amortized to interest expense on a straight-line basis over the term of the facility.
Debt Modification
Gains and losses on debt modifications that are considered extinguishments are recognized in current earnings. Debt modifications that are not considered extinguishments are accounted for prospectively through yield adjustments, based on the revised terms. Legal fees and other costs incurred with third parties that are directly related to debt modifications are expensed as incurred and included in acquisition-related costs on the consolidated statements of operations. In 2017, the Company expensed $1.2 million in costs related to debt modifications upon the issuance of Incremental Term Loan 3 to fund the 2017 Special Dividend and an additional $1.0 million in costs related to debt modifications upon the 2017 Debt Refinancing (see Note 10). During 2016, the Company expensed $0.8 million in costs related to debt modifications upon the issuance of Incremental Term Loan 2 to finance the RSIM acquisition (see Note 10). The analysis as to whether a modification of debt is an extinguishment or modification is performed on a creditor-by-creditor basis.
Leases
The Company currently leases office space and equipment under various leasing arrangements. As these leases expire, it can be expected that in the normal course of business they will be renewed or replaced. Leases are classified as either capital leases or operating leases, as appropriate. Lease agreements that are classified as operating leases may contain renewal options, rent escalation clauses or other inducements provided by the landlord. Rent expense is accrued to recognize lease escalation provisions and inducements provided by the landlord, if any, on a straight-line basis over the lease term commencing when the Company obtains the right to control the use of the leased property.
99
Victory Capital Holdings, Inc. and Subsidiaries
Notes to Consolidated Financial Statements (Continued)
Years Ended December 31, 2017, 2016 and 2015
2. Significant Accounting Policies (Continued)
Treasury Stock
Acquisitions of treasury stock are recorded at cost. Treasury stock held is reported as a deduction from stockholders' equity on the consolidated balance sheets. At the date of subsequent reissue, the treasury stock account is reduced by the cost of such stock on a specific-identification basis. Additional paid-in capital from treasury stock transactions is increased as the Company reissues treasury stock for more than the cost of the shares. If the Company issues treasury stock for less than its cost, additional paid-in capital from treasury stock transactions is reduced to no less than zero. Once this account is at zero, any further required reductions are recorded to retained deficit on the consolidated balance sheets. To date, the Company has not reissued any treasury stock.
Foreign Currency Transactions
The financial statements of RSSI, RSHK and RSUK, which operate outside of the United States (U.S.), are measured using the local currency as the functional currency. Adjustments to translate those statements into U.S. dollars are recorded in other comprehensive income (loss) (OCI), which were immaterial in amount at December 31, 2017 and 2016. There was no currency translation adjustments in accumulated OCI at December 31, 2015.
Transactions denominated in currencies other than the functional currency are recorded using the exchange rate on the date of the transaction. Exchange differences arising on the settlement of financial assets and liabilities are recorded in other income (expense) on the consolidated statements of operations. Foreign exchange gains and losses for the year ended December 31, 2017 and 2016 were immaterial. There were no foreign exchange gains and losses for the year ended December 31, 2015.
Income Taxes
Income taxes are accounted for using the assets and liability method as required by ASC 740, Income Taxes (ASC 740). Deferred tax assets and liabilities are recognized for the future tax consequences attributable to differences between the financial statement carrying amounts of existing assets and liabilities and their respective tax bases. Deferred tax assets and liabilities are measured using enacted tax rates expected to apply to taxable income in the years in which those temporary differences are expected to be recovered or settled. Deferred tax liabilities are generally attributable to indefinite-lived intangible assets and depreciation. Deferred tax assets are generally attributable to definite-lived intangible assets, stock compensation, deferred compensation and federal, state and foreign loss carryforwards and the benefit of uncertain tax positions. The effect on deferred tax assets and liabilities of a change in tax rates is recognized in income in the period that includes the enactment date.
The Company assesses whether a valuation allowance should be established against its deferred income tax assets based on consideration of all available evidence, both positive and negative, using a more likely than not standard. The assessment considers, among other matters, the nature, frequency and severity of recent operating results, forecasts of future profitability, the duration of statutory carry back and carry forward periods and the Company's experience with tax attributes expiring unused. Changes in circumstance could cause the Company to revalue its deferred tax balances with the resulting change impacting the consolidated statements of operations in the period of the change.
100
Victory Capital Holdings, Inc. and Subsidiaries
Notes to Consolidated Financial Statements (Continued)
Years Ended December 31, 2017, 2016 and 2015
2. Significant Accounting Policies (Continued)
The Company records income tax liabilities pursuant to ASC 740, which prescribes the recognition and measurement of a tax position taken or expected to be taken in a tax return. It also provides guidance on de-recognition, classification of interest and penalties, accounting in interim periods, disclosure and transition. For tax positions meeting a "more-likely-than-not" threshold, the amount recognized in the financial statements is the largest amount of benefit greater than 50% likely of being sustained. The more-likely-than-not threshold must continue to be met in each reporting period to support continued recognition of the benefit. The Company's accounting policy with respect to interest and penalties related to tax uncertainties is to classify these amounts as income taxes.
Certain income tax effects of the Tax Cuts and Jobs Act enacted in December 2017 ("Tax Act") are reflected in our financial results in accordance with Staff Accounting Bulletin No. 118 (SAB 118), which provides SEC staff guidance regarding the application of ASC Topic 740 in the reporting period in which the Tax Act became law. See also Note 9 "Income Taxes" for further detail and additional discussion on estimated amounts recorded as of December 31, 2017 for the Tax Act.
Loss Contingencies
The Company continuously reviews any investor, client, employee or vendor complaints and pending or threatened litigation. The Company evaluates the likelihood that a loss contingency exists under the criteria of applicable accounting standards through consultation with legal counsel and records a loss contingency, inclusive of legal costs, if the contingency is probable and reasonably estimable at the date of the financial statements.
Business Combinations
The Company accounts for business combinations under the acquisition method of accounting and allocates the purchase price to the assets acquired and liabilities assumed based on their estimated fair values on the date of acquisition. The fair values are determined in accordance with the guidance in ASC 820 based on valuations performed by the Company and independent valuation specialists.
Contingent and Deferred Payment Arrangements
The Company periodically enters into contingent and/or deferred payment arrangements in connection with its business combinations. Liabilities under contingent and deferred payment arrangements are recorded in consideration payable for acquisition of business on the consolidated balance sheets. In contingent payment arrangements, the Company agrees to pay additional consideration to the sellers based on future performance, such as future net revenue levels. The Company estimates the fair value of these potential future obligations at the time a business combination is consummated and records a liability on the consolidated balance sheet at estimated fair value. In deferred payment arrangements, the Company records a liability on the consolidated balance sheet for the estimated fair value, which is the present value, of the future payments as of the acquisition date.
If the Company's expected payments under contingent payment obligations subsequently change, the obligation is reduced or increased in the current period resulting in a gain or loss, respectively. Gains and losses resulting from changes to expected payments under contingent payment obligations
101
Victory Capital Holdings, Inc. and Subsidiaries
Notes to Consolidated Financial Statements (Continued)
Years Ended December 31, 2017, 2016 and 2015
2. Significant Accounting Policies (Continued)
are reflected in change in value of consideration payable for acquisition of business in the consolidated statements of operations.
The Company accretes deferred payment obligations to their expected payment amounts over the period covered by the arrangement. Accretion expense related to deferred payment obligations is reflected in interest expense and other financing costs on the consolidated statements of operations and totaled $0.6 million, $0.7 million and $0.5 million in 2017, 2016 and 2015, respectively.
Recent Accounting Pronouncements
In May 2014, the FASB issued ASU 2014-09, Revenue from Contracts with Customers, to clarify the principles of recognizing revenue from contracts with customer and to improve financial reporting by creating common revenue recognition guidance for GAAP and International Financial Reporting Standards. This ASU will supersede existing revenue recognition guidance and require the following steps when recognizing revenue under ASU 2014-09: 1) identify the contract with the customer 2) identify performance obligations in the contract 3) determine the transaction price 4) allocate the transaction price to the performance obligations in the contract and 5) recognize revenue when or as the entity satisfies the performance obligation. This ASU also requires additional disclosures related to the nature, amount, timing and uncertainty of revenue and cash flows arising from customer contracts. An entity may apply the new guidance by using one of two methods 1) retrospective application to each prior reporting period presented or 2) a modified retrospective approach, requiring the standard by applied only to the most current period presented, with the cumulative effect of initially applying the standard recognized at the date of initial application. ASU 2014-09 is effective for annual reporting periods beginning after December 15, 2017, including interim periods within that reporting period, for non-emerging growth companies, and for annual reporting periods beginning after December 15, 2018, including interim periods within that reporting period, for the Company.
The Company's SEC registered broker dealer VCA adopted ASU 2014-09 effective January 1, 2018. VCA receives compensation for sales and sales-related services promised under distribution contracts with the Funds. There are no direct costs incurred to obtain these contracts. Direct costs incurred to fulfill services under the distribution contracts include sales commissions paid to third party dealers for the sale of Class C Shares. The Company concluded that VCA's adoption of ASU 2014-09 will result in no impact to financial statements issued by the Company for prior periods and no change to how VCA records revenue from contracts with customers and accounts for costs incurred to fulfill services under distribution contracts. The Company is currently evaluating the potential impact of other revenue and related direct costs on its financial statements.
In early 2016, the FASB issued ASU 2016-01. This update requires equity securities to be measured at fair value and changes in the fair value of equity securities to be recognized in net income. The update is effective for fiscal years beginning after December 15, 2017 for non-emerging growth companies and for fiscal years beginning after December 31, 2018 for the Company. Management does not expect the adoption of the standard to have a significant impact on the Company's consolidated financial statements.
In February 2016, the FASB issued ASU 2016-02 on leases. The new guidance requires lessees to record most leases on their balance sheets. Expense will be recognized in the income statement in a
102
Victory Capital Holdings, Inc. and Subsidiaries
Notes to Consolidated Financial Statements (Continued)
Years Ended December 31, 2017, 2016 and 2015
2. Significant Accounting Policies (Continued)
manner that is similar to today's accounting. The update is effective for fiscal years beginning after December 15, 2018 for non-emerging growth companies and for fiscal years beginning after December 15, 2019 for the Company. The Company is in the early process of analyzing how the new rules will impact financial reporting.
In March 2016, the FASB issued ASU 2016-09 on stock compensation. This update is meant to remove the cost and complexity of reporting on employee share-based payments and to address the tax reporting, forfeitures, and expected term related to equity awards. The update is effective for fiscal years beginning after December 15, 2016 for non-emerging growth companies and for fiscal years beginning after December 15, 2017 for the Company.
ASU 2016-09 eliminates the requirement that excess tax benefits be realized through a reduction in income taxes payable before the benefits can be recognized. Upon adoption, the income tax effects of stock-based compensation that are currently recognized in additional paid-in-capital will be prospectively recognized in income tax expense, and the Company anticipates that there will be fluctuations in the reported amount of income tax expense in its consolidated statements of operation as well as in its effective tax rate. In addition, upon adoption of ASU 2016-09, the Company will elect to account for forfeitures of equity awards as they occur, which is not expected to have a material impact on the consolidated financial statements.
The Company will use a modified retrospective transition method to adopt ASU 2016-09 and estimates it will record a credit to retained earnings of $1.3 million as the cumulative-effect adjustment for excess tax benefits that have not previously been recognized and to adjust compensation cost on awards outstanding at January 1, 2018 as if the Company had not historically recorded a forfeiture estimate on these awards and instead had accounted for forfeitures as the forfeitures occurred.
In August 2016, the FASB issued ASU 2016-15. The update provides guidance on certain cash flow statement classifications that were previously unclear or lacked specific guidance. The classifications addressed in the update include debt extinguishment costs, contingent consideration payments made after a business combination, and distributions received from equity method investees. The update is effective for fiscal years beginning after December 15, 2017 for non-emerging growth companies and for fiscal years beginning after December 15, 2018 for the Company. The Company is in the process of analyzing how the new rules will impact financial reporting.
In January 2017, the FASB issued ASU 2017-04 simplifying the test for goodwill impairment. The standard eliminates Step 2 from the goodwill impairment test. Under the amended guidance, an entity will perform its goodwill impairment test by comparing the fair value of a reporting unit with its carrying amount. An entity will recognize an impairment charge for the amount by which the carrying amount exceeds the reporting unit's fair value, but the loss cannot exceed the total amount of goodwill allocated to the reporting unit. The new guidance is effective for the Company's fiscal year that begins after December 15, 2020 and requires a prospective approach to adoption. Early adoption is permitted for interim or annual goodwill impairment tests. The Company is currently evaluating the potential impact on its consolidated financial statements and related disclosures.
In May 2017, the FASB issued ASU 2017-09 clarifying when changes in the terms or conditions of a share-based payment award qualify for accounting treatment as a modification. The new guidance is effective for the Company and non-emerging growth companies for fiscal years that begin after December 15, 2017 and is applied prospectively to awards modified on or after the adoption date. The Company is currently considering how the new guidance may impact the accounting for changes in its share-based payments.
103
Victory Capital Holdings, Inc. and Subsidiaries
Notes to Consolidated Financial Statements (Continued)
Years Ended December 31, 2017, 2016 and 2015
3. Acquisitions
On November 1, 2014, the Company acquired all of the outstanding membership interests in Munder. In 2015, the Company re-valued consideration payable and recorded a $1.3 million liability and expense. Also, in 2015, the Company paid sellers deferred consideration of $2.1 million in cash and an additional $1.3 million in cash which satisfied the remaining consideration payable. All amounts previously held in escrow have been released to sellers.
On November 26, 2014, the Company signed an asset purchase agreement with CEMP, a Tennessee limited liability company and rules-based index investment manager offering mutual fund and ETF products. The transaction closed on April 30, 2015.
Consideration for the CEMP transaction included cash payments of $15.8 million on the closing date and an additional $0.2 million in May 2015 as well as a total of $10.7 million in future base payments and a total of $3.1 million in future earn-out payments. The base payments and earn-out payments will be made to sellers following each of the first four anniversaries of the closing date. Each annual base payment is fixed in amount, with the amounts increasing over the four year period. The earn-out payments are calculated as a fixed percentage of the net revenue earned by the Company on the CEMP business over the twelve month period ending on each of the first four anniversaries of the CEMP closing date.
The fair values of assets acquired and liabilities assumed were determined in accordance with the guidance in ASC 820 based on valuations performed by an independent valuation specialist and are disclosed in the table below.
The following represents the May 1, 2015 allocation of the purchase price of the CEMP acquisition:
Investment management fees receivable |
$ | 569 | ||
Other receivables |
656 | |||
Prepaid expenses |
32 | |||
Property and equipment |
12 | |||
Intangible assets |
10,694 | |||
Goodwill |
18,703 | |||
Accrued compensation |
(54 | ) | ||
Accrued expenses |
(984 | ) | ||
Consideration payable for acquisition of business |
(13,779 | ) | ||
| | | | | |
Consideration paid at closing, net of cash acquired |
$ | 15,849 | ||
| | | | | |
| | | | | |
| | | | | |
Intangible assets acquired in the CEMP transaction include advisory contracts with the CEMP mutual funds and ETFs, trade name, intellectual property and non-competition clause, which were valued using the income approach by discounting future cash flows to their present value at a risk adjusted required rate of return. Significant assumptions related to the May 1, 2015 valuation of assets and liabilities include the following:
- •
- The advisory contracts with the CEMP mutual fund and ETFs were valued using an excess earnings model and were assigned a definite life.
104
Victory Capital Holdings, Inc. and Subsidiaries
Notes to Consolidated Financial Statements (Continued)
Years Ended December 31, 2017, 2016 and 2015
3. Acquisitions (Continued)
- •
- The investment process and trade name intangible assets were valued using the relief from royalty approach and assumed 15% and 1% royalty rates
respectively.
- •
- The non-competition provision was valued using an economic loss model, which considers a base case scenario with a sensitivity analysis of certain scenarios without the non-competition clause in place.
The acquisition date fair value of the base payment liability was determined by discounting the four required annual payments by the Company's pre-tax cost of debt. The liability is being accreted to the amount of cash to be paid in the future.
The acquisition date fair value of the earn-out payment liability of $3.1 million was calculated by discounting the probability-weighted future cash flows under a base case scenario and various sensitized scenarios.
As of December 31, 2017, 2016 and 2015, the earn-out liability was valued at $1.2 million, $1.5 million and $1.9 million respectively. During the years ended December 31, 2017, 2016 and 2015, the Company recorded gains in the amount of $0.3 million, $0.4 million and $1.2 million as a result of decreases in the estimated fair value of future earn-out payments. The Company paid sellers a total of $2.7 million and $1.3 million in base payments and earn-out payments in 2017 and 2016.
On December 17, 2015, the Company entered into an agreement to acquire RSIM, a Delaware limited liability company and SEC registered investment advisor, and RSIM's wholly-owned subsidiaries, including RS Funds Distributor LLC, an SEC registered broker dealer and FINRA member, and RSIM's three non-U.S. subsidiaries. RSIM provided investment advisory and related services to the RS Investment Trust (mutual funds) and RS Variable Products Trust (variable investment trusts), collectively referred to as the RS Funds, private investment unit trusts, institutional and other clients.
On July 29, 2016, the RSIM acquisition closed for total purchase consideration, net of cash acquired, of $221.6 million. On the closing date, the Company paid cash consideration, net of cash acquired, of $204.4 million and issued $5.1 million of equity to RSIM employees in exchange for certain of their outstanding RSIM membership interests. The Company paid additional cash consideration of $6.5 million in the third and fourth quarters of 2016 and $5.6 million in the first and second quarter of 2017 and an immaterial amount of cash consideration in the third quarter of 2017.
105
Victory Capital Holdings, Inc. and Subsidiaries
Notes to Consolidated Financial Statements (Continued)
Years Ended December 31, 2017, 2016 and 2015
3. Acquisitions (Continued)
The Company used an independent valuation specialist to assist with the determination of fair value for certain of the acquired assets and assumed liabilities that are disclosed below.
Investment management fees receivable |
$ | 12,368 | ||
Fund distribution fees receivable |
180 | |||
Available-for-sale securities |
900 | |||
Other receivables |
29,192 | |||
Prepaid expenses |
1,867 | |||
Property and equipment |
4,956 | |||
Other assets |
302 | |||
Intangible assets |
132,200 | |||
Goodwill |
64,376 | |||
Accrued expenses |
(10,628 | ) | ||
Accrued compensation |
(14,075 | ) | ||
| | | | | |
Total consideration, net of cash acquired |
$ | 221,638 | ||
| | | | | |
| | | | | |
| | | | | |
Significant assumptions related to the acquisition date valuation of assets and liabilities include the following:
- •
- The advisory contracts with the RS Funds were valued using an excess earnings model and assumed a 3% attrition rate.
- •
- The institutional customer relationships were valued using an excess earnings model and assumed a 10% attrition rate.
- •
- The trade name intangible asset was valued using the relief from royalty approach and assumed a 1% royalty rate.
At the time of the RSIM acquisition, the Company recorded a $25.6 million receivable for cash flows expected to be received from a third party under an agreement signed by RSIM with that party for the transfer of certain separate accounts in 2014. Pursuant to this agreement, Victory is entitled to receive earn-out payments from the buyer in the form of revenue share on the transferred separate accounts through December 31, 2018.
The acquisition date fair value of the amounts receivable under this arrangement was calculated by discounting the probability-weighted future cash flows under a base case scenario and various sensitized scenarios. The discount rate used was 6.2% which represents the Company's estimated pre-tax cost of debt at the acquisition date. Interest income on the receivable, which totaled $0.5 million and $0.3 million for 2017 and 2016, respectively, is being accreted over the life of the receivable and is recorded in interest income and other income in the consolidated statements of operations.
The Company assesses the collectability of the receivable on a periodic basis. During 2017, the Company recorded a $4.4 million loss, included in interest income and other income/(expense) on the consolidated statements of operations and in impairment of other receivable in the consolidated statement of cash flows, to write down this receivable to the estimate fair value of the remaining cash flows expected to be received under the earn-out arrangement.
106
Victory Capital Holdings, Inc. and Subsidiaries
Notes to Consolidated Financial Statements (Continued)
Years Ended December 31, 2017, 2016 and 2015
3. Acquisitions (Continued)
The Company collected $10.3 million and $3.3 million of this receivable in 2017 and 2016, respectively. As of December 31, 2017 and 2016, the receivable totaled $8.4 million and $22.7 million, respectively, which is recorded in other receivables on the consolidated balance sheets.
The Company's consolidated financial statements for 2016 include RSIM's operating results from the date of acquisition through December 31, 2016. The following unaudited pro forma information gives effect to the Company's acquisition of RSIM as if the acquisition had occurred on January 1, 2015 and RSIM had been included in the Company's consolidated statements of operations for the years ended December 31, 2016 and 2015.
| |
Pro Forma Data for the Year Ended December 31, |
||||||
|---|---|---|---|---|---|---|---|
| (in millions) |
2016 | 2015 | |||||
Revenue |
$ | 381.1 | $ | 420.6 | |||
Net loss |
(22.1 | ) | (48.2 | ) | |||
The historical consolidated financial information of the Company and RSIM has been adjusted to give effect to pro forma events that are directly attributable to the transaction, factually supportable and expected to have continuing impact on the combined results. These amounts have been calculated after adjusting the results of RSIM to reflect additional interest expense and income taxes as well as intangible asset amortization that would have been charged assuming the fair value adjustments had been applied on January 1, 2015. In addition, the Company's and RSIM's results were adjusted to remove incentive compensation, legal fees and mutual fund proxy costs directly attributable to the acquisition.
For the period from July 30, 2016 to December 31, 2016, RSIM revenue was $53.4 million. Net income attributable to RSIM is impractical to determine as the Company does not prepare discrete financial information at that level.
Costs related to acquisitions are summarized below and include legal and filing fees, advisory services, mutual fund proxy voting costs and other one-time expenses related to the transactions. These costs were expensed in 2017, 2016 and 2015 and are included in acquisition-related costs in the consolidated statements of operations.
| |
Acquisition-related costs |
|||||||||
|---|---|---|---|---|---|---|---|---|---|---|
| (in millions) |
2017 | 2016 | 2015 | |||||||
RSIM |
$ | 0.4 | $ | 6.4 | $ | 2.0 | ||||
CEMP |
— | — | 0.7 | |||||||
Munder |
— | — | 0.5 | |||||||
Other |
1.7 | 0.2 | — | |||||||
| | | | | | | | | | | |
|
$ | 2.1 | $ | 6.6 | $ | 3.2 | ||||
| | | | | | | | | | | |
| | | | | | | | | | | |
| | | | | | | | | | | |
In 2016, the Company incurred additional costs of $6.1 million of which $5.9 million was capitalized as debt issuance costs and $0.2 million was recorded as equity issuance costs.
107
Victory Capital Holdings, Inc. and Subsidiaries
Notes to Consolidated Financial Statements (Continued)
Years Ended December 31, 2017, 2016 and 2015
4. Fair Value Measurements
The Company determines the fair value of certain financial and nonfinancial assets and liabilities. Fair value is determined based on the price that would be received for an asset or paid to transfer a liability in an orderly transaction between market participants at the measurement date. Fair value determinations utilize a valuation hierarchy based upon the transparency of inputs used in the valuation of an asset or liability. Classification within the fair value hierarchy contains three levels:
- •
- Level 1—Valuation inputs are unadjusted quoted market prices for identical assets or liabilities in active markets.
- •
- Level 2—Valuation inputs are quoted prices for identical assets or liabilities in markets that are not active, quoted market
prices for similar assets and liabilities in active markets and other observable inputs directly or indirectly related to the asset or liability being measured.
- •
- Level 3—Valuation inputs are unobservable and significant to the fair value measurement. These inputs reflect management's own assumptions about the assumptions a market participant would use in pricing the asset or liability.
The table below shows assets measured at fair value on a recurring basis, all dollars are in thousands:
| |
As of December 31, 2017 | ||||||||||||
|---|---|---|---|---|---|---|---|---|---|---|---|---|---|
| |
Total | Level 1 | Level 2 | Level 3 | |||||||||
Financial Liabilities |
|||||||||||||
Contingent Consideration Arrangements |
$ | (1,195 | ) | $ | — | $ | — | $ | (1,195 | ) | |||
| | | | | | | | | | | | | | |
Total Financial Liabilities |
$ | (1,195 | ) | $ | — | $ | — | $ | (1,195 | ) | |||
| | | | | | | | | | | | | | |
| | | | | | | | | | | | | | |
| | | | | | | | | | | | | | |
| |
As of December 31, 2016 | ||||||||||||
|---|---|---|---|---|---|---|---|---|---|---|---|---|---|
| |
Total | Level 1 | Level 2 | Level 3 | |||||||||
Financial Assets |
|||||||||||||
Interest rate cap |
$ | 20 | $ | — | $ | 20 | $ | — | |||||
| | | | | | | | | | | | | | |
Total Financial Assets |
$ | 20 | $ | — | $ | 20 | $ | — | |||||
| | | | | | | | | | | | | | |
| | | | | | | | | | | | | | |
| | | | | | | | | | | | | | |
Financial Liabilities |
|||||||||||||
Contingent Consideration Arrangements |
$ | (1,523 | ) | $ | — | $ | — | $ | (1,523 | ) | |||
| | | | | | | | | | | | | | |
Total Financial Liabilities |
$ | (1,523 | ) | $ | — | $ | — | $ | (1,523 | ) | |||
| | | | | | | | | | | | | | |
| | | | | | | | | | | | | | |
| | | | | | | | | | | | | | |
The fair value of the Company's interest rate cap was included in other assets on the consolidated balance sheets as of December 31, 2016. Pricing was determined based on a third-party, model-derived valuation in which all significant inputs are observable in active markets (Level 2).
Contingent consideration arrangements at December 31, 2017 and 2016 consist of the CEMP earn-out payment liability, which is included in consideration payable for acquisition of business on the consolidated balance sheets. Level 3 inputs were utilized to determine fair value, or the present value of the expected future settlement, of the contingent consideration arrangement (see Note 3). Changes in the fair value of the liability, realized or unrealized, are recorded in earnings and are included in
108
Victory Capital Holdings, Inc. and Subsidiaries
Notes to Consolidated Financial Statements (Continued)
Years Ended December 31, 2017, 2016 and 2015
4. Fair Value Measurements (Continued)
change in value of consideration payable for acquisition of business on the consolidated statements of operations.
Significant unobservable inputs used in the fair value calculation for this obligation include discount rates and growth assumptions.
Four scenarios were used in formulating the growth rate assumptions with varying levels of revenue growth and were probability-weighted. An increase to the discount rate would result in a lower fair value, while an increase to growth rate assumptions would result in a higher fair value.
| |
Contingent Consideration Arrangements |
|||
|---|---|---|---|---|
Balance, December 31, 2015 |
$ | (1,926 | ) | |
| | | | | |
CEMP change in fair value measurement |
378 | |||
CEMP year 2 earn-out payment |
25 | |||
Balance, December 31, 2016 |
$ | (1,523 | ) | |
| | | | | |
CEMP change in fair value measurement |
294 | |||
CEMP year 2 earn-out payment |
34 | |||
| | | | | |
Balance, December 31, 2017 |
$ | (1,195 | ) | |
| | | | | |
| | | | | |
| | | | | |
There were no transfers between any of the Level 1, 2 and 3 categories in the fair value measurement hierarchy for the years ended December 31, 2017 and 2016. The Company recognizes transfers at the end of the reporting period.
The net carrying value of cash and cash equivalents, accounts receivable, and accounts payable approximates fair value due to the short-term nature of these assets and liabilities. The fair value of the Company's long-term debt at December 31, 2016 is considered to be its carrying amount as the interest rate reset with the issuance of Incremental Term Loan 2 in July 2016. In addition, Incremental Term Loan 3 (see Note 10) in February 2017 was issued with terms similar to those of the Term Loans at December 31, 2016. The fair value of the Company's long-term debt at December 31, 2017 is considered to be its carrying amount as the interest rate was reset with the 2017 Debt Refinancing (see Note 10). Level 2 inputs are utilized to determine the fair value of the Company's long-term debt.
At December 31, 2017, the Company had one receivable that was recorded at estimated fair value on a non-recurring basis. The receivable was identified as impaired in the fourth quarter of 2017 and written down to its estimated fair value of $8.4 million (see Note 3). Level 3 inputs were utilized to determine fair value, or the present value of the probability-weighted expected future cash flows receivable under a base case scenario and various sensitized scenarios. The Company used a discount rate of 6.2%. Other significant unobservable inputs used in the fair value calculation for this receivable include growth assumptions for assets in the transferred separate accounts and average fee rates earned by the third party on these accounts.
109
Victory Capital Holdings, Inc. and Subsidiaries
Notes to Consolidated Financial Statements (Continued)
Years Ended December 31, 2017, 2016 and 2015
5. Related-Party Transactions
The Company considers certain funds that it manages, including the Victory Funds, the Victory ETFs, the Victory Collective Funds and Victory Capital Series, LLC, to be related parties as a result of the Company's advisory relationship.
The Company receives investment management, administrative, distribution and compliance fees in accordance with contracts that Victory and VCA have with the Victory Funds. The Company also receives investment management fees from the Victory ETFs, Victory Collective Funds and Victory Capital Series, LLC under Victory's advisory contracts with these funds.
Under the terms of monitoring agreements with affiliates of two shareholders of the Company, the Company pays annual fees for monitoring services which are included in general and administrative expense in the consolidated statements of operations.
In March 2016, the Company issued a promissory note for $1.7 million for amounts due upon repurchase of Company common stock from a shareholder (see Note 10). Balances and transactions involving related parties are included in the consolidated balance sheets and consolidated statements of operations are summarized below. Included in fund administration and distribution fees receivable are amounts due from the Victory Funds for compliance services and expense reimbursements. Included in fund administration and distribution revenue are fees earned for compliance services. Realized gains and losses on investments in the Victory Funds, as well as the unrealized gains and losses on investments in the Victory Funds that are classified as trading securities, are included in interest income and other income/(expense) in the consolidated statements of operation.
| |
As of December 31, | ||||||
|---|---|---|---|---|---|---|---|
| |
2017 | 2016 | |||||
Related party assets |
|||||||
Investment management fees receivable |
$ | 23,027 | $ | 20,811 | |||
Fund administration and distribution fees receivable |
3,925 | 4,604 | |||||
Available-for-sale securities, at fair value |
677 | 525 | |||||
Trading securities, at fair value |
10,248 | 5,054 | |||||
| | | | | | | | |
Total |
$ | 37,877 | $ | 30,994 | |||
| | | | | | | | |
| | | | | | | | |
| | | | | | | | |
Related party liabilities |
|||||||
Accrued expenses (fund reimbursements) |
$ | 1,155 | $ | 2,380 | |||
Other liabilities (promissory note) |
671 | 1,245 | |||||
| | | | | | | | |
Total |
$ | 1,826 | $ | 3,625 | |||
| | | | | | | | |
| | | | | | | | |
| | | | | | | | |
110
Victory Capital Holdings, Inc. and Subsidiaries
Notes to Consolidated Financial Statements (Continued)
Years Ended December 31, 2017, 2016 and 2015
5. Related-Party Transactions (Continued)
| |
Years ended December 31, | |||||||||
|---|---|---|---|---|---|---|---|---|---|---|
| |
2017 | 2016 | 2015 | |||||||
Related party revenue |
||||||||||
Investment management fees |
$ | 254,318 | $ | 171,112 | $ | 124,338 | ||||
Fund administration and distribution fees |
65,818 | 49,401 | 39,210 | |||||||
| | | | | | | | | | | |
Total |
$ | 320,136 | $ | 220,513 | $ | 163,548 | ||||
| | | | | | | | | | | |
| | | | | | | | | | | |
| | | | | | | | | | | |
Related party expense |
||||||||||
Distribution and other asset-based expenses (fund reimbursements) |
$ | 11,896 | $ | 10,342 | $ | 5,179 | ||||
General and administrative |
1,203 | 1,150 | 1,150 | |||||||
Interest income and other income/(expense) |
589 | 224 | (177 | ) | ||||||
Interest expense and other financing costs (promissory note) |
(39 | ) | (42 | ) | — | |||||
| | | | | | | | | | | |
Total |
13,649 | 11,674 | 6,152 | |||||||
| | | | | | | | | | | |
| | | | | | | | | | | |
| | | | | | | | | | | |
6. Investments
As of December 31, 2017 and 2016, the Company held both available-for-sale securities and trading securities. Available-for-sale investments consist entirely of seed capital investments in certain Victory sponsored mutual funds. Trading securities are held under a deferred compensation plan and include Victory sponsored and third party mutual funds held under a deferred compensation plan.
Available-For-Sale Securities
A summary of the cost and fair value of investments classified as available-for-sale is as follows:
| |
|
Gross Unrealized | |
||||||||||
|---|---|---|---|---|---|---|---|---|---|---|---|---|---|
(in thousands)
|
Cost | Gains | (Losses) | Fair Value | |||||||||
As of December 31, 2017 |
$ | 595 | $ | 82 | $ | — | $ | 677 | |||||
As of December 31, 2016 |
548 | 4 | (27 | ) | 525 | ||||||||
Unrealized gains and losses on available-for-sale investments are recorded, net of tax, to accumulated other comprehensive loss.
Upon sale, accrued unrealized gains or losses are reclassed out of accumulated comprehensive income (see Note 18), and realized gains and losses are recongnized on the consolidated statements of operations as other income (expense). Proceeds and realized gains and losses recognized during 2017, 2016 and 2015 are as follows:
| |
|
Realized | ||||||||
|---|---|---|---|---|---|---|---|---|---|---|
| |
Sale Proceeds |
|||||||||
| |
Gains | (Losses) | ||||||||
For the year ending December 31, 2017 |
$ | 79 | $ | 15 | $ | — | ||||
For the year ending December 31, 2016 |
1,290 | 78 | (27 | ) | ||||||
For the year ending December 31, 2015 |
792 | 14 | (17 | ) | ||||||
111
Victory Capital Holdings, Inc. and Subsidiaries
Notes to Consolidated Financial Statements (Continued)
Years Ended December 31, 2017, 2016 and 2015
6. Investments (Continued)
Trading Securities
A summary of the cost and fair value of investments classified as trading securities is as follows:
| |
|
Gross Unrealized | |
||||||||||
|---|---|---|---|---|---|---|---|---|---|---|---|---|---|
(in thousands)
|
Cost | Gains | (Losses) | Fair Value | |||||||||
As of December 31, 2017 |
$ | 9,978 | $ | 950 | $ | (269 | ) | $ | 10,659 | ||||
As of December 31, 2016 |
5,453 | 406 | (221 | ) | 5,638 | ||||||||
Unrealized gains and losses on trading securities are recorded in earnings in other income (expense). Sales of trading investments throughout the year result in realized gains or losses that are recognized on the consolidated statements of operations as other income (expense). Proceeds and realized gains and losses recognized in 2017, 2016 and 2015 are as follows:
| |
|
Realized | ||||||||
|---|---|---|---|---|---|---|---|---|---|---|
| |
Sale Proceeds |
|||||||||
| |
Gains | (Losses) | ||||||||
For the year ending December 31, 2017 |
$ | 5,166 | $ | 159 | $ | (34 | ) | |||
For the year ending December 31, 2016 |
2,585 | 64 | (72 | ) | ||||||
For the year ending December 31, 2015 |
2,132 | 4 | (91 | ) | ||||||
7. Property and Equipment
Property and equipment consisted of the following as of December 31, 2017 and 2016, all dollars are in thousands:
| |
As of December 31, | ||||||
|---|---|---|---|---|---|---|---|
| |
2017 | 2016 | |||||
Equipment, Purchased Software and Implementation Costs |
$ | 14,685 | $ | 10,979 | |||
Leasehold Improvements |
2,720 | 4,274 | |||||
Furniture and Fixtures |
1,501 | 1,382 | |||||
| | | | | | | | |
Total |
18,906 | 16,635 | |||||
Accumulated Depreciation and Amortization |
(10,062 | ) | (7,091 | ) | |||
| | | | | | | | |
Total Property and Equipment, Net |
$ | 8,844 | $ | 9,544 | |||
| | | | | | | | |
| | | | | | | | |
| | | | | | | | |
Depreciation and amortization expense for property and equipment was $3.6 million, $3.2 million, and $2.3 million for the years ended December 31, 2017, 2016 , and 2015, respectively.
112
Victory Capital Holdings, Inc. and Subsidiaries
Notes to Consolidated Financial Statements (Continued)
Years Ended December 31, 2017, 2016 and 2015
8. Goodwill and Other Intangible Assets
The table below shows changes in the goodwill balance from December 31, 2016 to December 31, 2017, all dollars are in thousands:
| |
As of December 31, | ||||||
|---|---|---|---|---|---|---|---|
| |
2017 | 2016 | |||||
Balance, beginning of period |
$ | 284,108 | $ | 219,732 | |||
| | | | | | | | |
Goodwill recorded in acquisition |
— | 64,376 | |||||
| | | | | | | | |
Balance, end of period |
$ | 284,108 | $ | 284,108 | |||
| | | | | | | | |
| | | | | | | | |
| | | | | | | | |
Identifiable Intangible Assets
A summary of definite-lived intangible assets by type is as follows, all dollars are in thousands.
| |
Customer Relationships |
Fund Advisory Contracts |
Intellectual Property/ Other |
Totals | |||||||||
|---|---|---|---|---|---|---|---|---|---|---|---|---|---|
Gross Book Value—12/31/16 |
$ | 123,200 | $ | 2,368 | $ | 7,177 | $ | 132,745 | |||||
2016 Accumulated Amortization |
(61,022 | ) | (1,316 | ) | (3,789 | ) | (66,127 | ) | |||||
| | | | | | | | | | | | | | |
2016 Net Book Value—12/31/16 |
$ | 62,178 | $ | 1,052 | $ | 3,388 | $ | 66,618 | |||||
| | | | | | | | | | | | | | |
| | | | | | | | | | | | | | |
| | | | | | | | | | | | | | |
Weighted Average Useful Life (yrs) |
2.5 | 1.3 | 1.6 | 2.4 | |||||||||
Gross Book Value—12/31/17 |
$ |
123,200 |
$ |
2,368 |
$ |
7,177 |
$ |
132,745 |
|||||
2017 Accumulated Amortization |
(84,309 | ) | (2,105 | ) | (6,062 | ) | (92,476 | ) | |||||
| | | | | | | | | | | | | | |
2017 Net Book Value—12/31/17 |
$ | 38,891 | $ | 263 | $ | 1,115 | $ | 40,269 | |||||
| | | | | | | | | | | | | | |
| | | | | | | | | | | | | | |
| | | | | | | | | | | | | | |
Weighted Average Useful Life (yrs) |
1.6 | 0.3 | 0.6 | 1.5 | |||||||||
Amortization expense for definite-lived intangible assets for the years ended December 31, 2017, 2016 and 2015, was $26.3 million, $27.2, million and $25.0 million, respectively, and is recorded in depreciation and amortization within the consolidated statements of operations.
Estimated amortization expense for definite-lived intangible assets for each of the five succeeding years is as follows, all dollars are in thousands:
2018 |
$ | 20,038 | ||
2019 |
15,548 | |||
2020 |
2,979 | |||
2021 |
1,704 | |||
| | | | | |
2022 |
0 | |||
| | | | | |
|
$ | 40,269 | ||
| | | | | |
| | | | | |
| | | | | |
113
Victory Capital Holdings, Inc. and Subsidiaries
Notes to Consolidated Financial Statements (Continued)
Years Ended December 31, 2017, 2016 and 2015
8. Goodwill and Other Intangible Assets (Continued)
The carrying amount of indefinite-lived intangible assets, which are not amortized, totaled $367.7 million at December 31, 2017 and 2016, and included $342.9 million for advisory and distribution contracts with the Victory Funds and $24.8 million related to the Victory, Munder, Integrity, CEMP and RSIM trade names.
9. Income Taxes
On December 22, 2017, the Tax Cuts and Jobs Act ("Tax Act") was enacted. The Tax Act significantly revises the U.S. corporate income tax law by, among other things, decreasing the federal corporate income tax rate from 35% to 21% effective January 1, 2018. As a result of the reduction in the corporate income tax rate, the Company was required to remeasure its deferred tax assets and deferred tax liabilities on the enactment date using the new rate.
SEC Staff Accounting Bulletin No. 118 (SAB 118) addresses situations when a company has not completed the accounting for certain income tax effects of the Tax Act and provides a measurement period of up to one year after the enactment date for the accounting to be completed. Companies are required to report provisional amounts for income tax effects of the Tax Act for which the accounting is incomplete but a reasonable estimate can be determined.
As of December 31, 2017 the Company has substantially completed the accounting for the tax effects of the Tax Act. The Company has recognized provisional adjustments for the revaluation of deferred tax assets and deferred tax liabilities to reflect the reduced rate that will apply in future periods when these deferred taxes are settled and realized. Although the tax rate reduction is known, the Company has not fully collected all of the necessary data to complete the analysis of the effect of the Tax Act on the underlying deferred taxes and as such, the amounts recorded as of December 31, 2017 are provisional. Any subsequent adjustment to these amounts, if any, will be recorded to provision for income taxes during 2018.
During the year ended December 31, 2017, the Company recorded a provisional credit to federal tax expense of $2.4 million from remeasuring deferred tax assets and deferred tax liabilities due to the Tax Act.
The actual impact of the Tax Act on effective tax rates and deferred tax assets and liabilities may differ from these estimates due to changes in interpretations and assumptions made in determining these estimates, future guidance issued by the IRS and the completion of the Company's U.S. tax return.
114
Victory Capital Holdings, Inc. and Subsidiaries
Notes to Consolidated Financial Statements (Continued)
Years Ended December 31, 2017, 2016 and 2015
9. Income Taxes (Continued)
The provision for income taxes consists of the following for the years ended December 31, 2017, 2016 and 2015, all dollars are in thousands:
| |
2017 | 2016 | 2015 | |||||||
|---|---|---|---|---|---|---|---|---|---|---|
Current tax expense (benefit): |
||||||||||
Federal |
$ | 640 | $ | (3 | ) | $ | 129 | |||
State |
779 | 93 | 813 | |||||||
Foreign |
22 | (10 | ) | — | ||||||
| | | | | | | | | | | |
Total current tax expense (benefit) |
1,441 | 80 | 942 | |||||||
| | | | | | | | | | | |
| | | | | | | | | | | |
| | | | | | | | | | | |
Deferred tax expense (benefit): |
||||||||||
Federal |
9,162 | (2,728 | ) | 2,188 | ||||||
State |
2,010 | (388 | ) | 292 | ||||||
Foreign |
19 | 36 | — | |||||||
| | | | | | | | | | | |
Total deferred tax expense (benefit) |
11,191 | (3,080 | ) | 2,480 | ||||||
| | | | | | | | | | | |
Income tax expense (benefit) |
$ | 12,632 | $ | (3,000 | ) | $ | 3,422 | |||
| | | | | | | | | | | |
| | | | | | | | | | | |
| | | | | | | | | | | |
The effective tax rate for the years ended December 31, 2017, 2016 and 2015 differs from the U.S. federal statutory rate primarily as a result of certain non-deductible expenses and state and local income taxes, and for 2017, due to the remeasurement of net deferred tax liabilities upon enactment of the Tax Act.
| |
2017 | 2016 | 2015 | |||||||
|---|---|---|---|---|---|---|---|---|---|---|
Federal income tax at U.S. statutory rate |
35.0 | % | 35.0 | % | 35.0 | % | ||||
State income tax rate, net of federal tax benefit |
4.0 | % | 1.2 | % | 7.6 | % | ||||
Prior year provision to return adjustment |
–0.2 | % | 0.3 | % | 2.5 | % | ||||
Change of state income tax rate, net of federal tax benefit |
–0.2 | % | 0.5 | % | –0.2 | % | ||||
Remeasurement of deferred taxes due to Tax Act |
–6.3 | % | — | — | ||||||
Non-deductible expenses |
0.8 | % | –3.1 | % | 2.4 | % | ||||
Foreign taxes and other |
–0.2 | % | –0.9 | % | 0.1 | % | ||||
| | | | | | | | | | | |
Income tax expense (benefit) |
32.9 | % | 33.0 | % | 47.4 | % | ||||
| | | | | | | | | | | |
| | | | | | | | | | | |
| | | | | | | | | | | |
Deferred income taxes reflect the net tax effect of temporary differences between the carrying amounts of assets and liabilities for financial reporting purposes and the amount used for income tax reporting purposes.
In assessing the realization of deferred tax assets, management considers the reversal of deferred tax liabilities as well as projections of future taxable income during the periods in which temporary differences are expected to reverse. Based on the consideration of these facts, the Company believes it is more likely than not that all of its gross deferred tax assets will be realized in the future, and as a result has not recorded a valuation allowance on these amounts as of December 31, 2017 and 2016.
115
Victory Capital Holdings, Inc. and Subsidiaries
Notes to Consolidated Financial Statements (Continued)
Years Ended December 31, 2017, 2016 and 2015
9. Income Taxes (Continued)
The components of deferred income tax assets and deferred tax liabilities were as follows at December 31, 2017 and 2016, all dollars are in thousands:
| |
2017 | 2016 | |||||
|---|---|---|---|---|---|---|---|
Deferred tax assets: |
|||||||
Definite-lived intangible assets |
$ | 16,078 | $ | 17,703 | |||
Share-based compensation expense |
5,271 | 5,464 | |||||
Acquisition-related costs |
4,118 | 6,740 | |||||
Deferred compensation |
2,738 | 2,163 | |||||
Loss carryforward |
— | 6,497 | |||||
Impairment of other receivable |
1,119 | — | |||||
Restructuring expenses |
1,033 | 2,995 | |||||
Other comprehensive loss |
— | 330 | |||||
Contingent consideration arrangements |
273 | 448 | |||||
CEMP goodwill |
468 | 556 | |||||
AMT credit carryforward |
492 | 125 | |||||
Other |
— | 38 | |||||
| | | | | | | | |
Total deferred tax assets |
31,590 | 43,059 | |||||
| | | | | | | | |
| | | | | | | | |
| | | | | | | | |
Deferred tax liabilities: |
|||||||
Indefinite-lived intangible assets |
30,939 | 31,111 | |||||
Debt issuance costs |
2,573 | 2,762 | |||||
Depreciation |
1,239 | 470 | |||||
Prepaid expenses |
139 | 315 | |||||
CEMP base payments interest expense |
125 | 373 | |||||
Change in value of consideration payable for acquisition of business |
454 | 576 | |||||
Unrealized gain on deferred compensation investments |
175 | — | |||||
Other |
14 | — | |||||
| | | | | | | | |
Total deferred tax liabilities |
35,658 | 35,607 | |||||
| | | | | | | | |
Net deferred tax asset/(liability) |
$ | (4,068 | ) | $ | 7,452 | ||
| | | | | | | | |
| | | | | | | | |
| | | | | | | | |
As of December 31, 2017, for Federal tax purposes, the Company has estimated net operating loss carryforwards of $5.5 million of which $1.7 million will expire in 2036 and $3.8 million will expire in 2037.
The Company has analyzed its tax positions for all open years (December 31, 2013, 2014, 2015 and 2016) and has concluded that no additional provision for income tax is required in the financial statements. The Company did not record any amounts at December 31, 2017, 2016 or 2015 related to uncertain tax positions or tax contingencies.
116
Victory Capital Holdings, Inc. and Subsidiaries
Notes to Consolidated Financial Statements (Continued)
Years Ended December 31, 2017, 2016 and 2015
10. Debt
Senior Credit Facility
On October 31, 2014, Operating entered into a syndicated senior credit facility (the 2014 Credit Agreement), which provided for a seven-year $295 million term-loan facility (the Term Loan) and a five-year $25 million revolving credit facility (the Revolver Commitments). The Term Loan was issued at a discount of $2.95 million, and proceeds from the facility were utilized to pay off prior debt, acquire Munder and pay transaction costs to lenders and other third parties.
On May 5, 2015, the 2014 Credit Agreement was amended to increase principal borrowed under the Term Loan facility by $50 million (Incremental Term Loan). Proceeds from the Incremental Term Loan were used to make a $50 million special distribution to the Company's shareholders. The Incremental Term Loan was issued at a discount of $0.4 million and the Company incurred $2.0 million in new debt issuance costs.
On July 29, 2016, the 2014 Credit Agreement was amended to increase principal borrowed under the Term Loan facility by $135 million (Incremental Term Loan 2). Proceeds from Incremental Term Loan 2 were used to finance the RSIM acquisition and pay transaction costs to lenders and other third parties. Incremental Term Loan 2 was issued at a discount of $5.0 million. The Company incurred $6.7 million in costs related to the issuance of Incremental Term Loan 2, of which $5.9 million was recorded in debt issuance costs and capitalized to long-term debt and $0.8 million was expensed and is included in acquisition-related costs.
On February 6, 2017, the 2014 Credit Agreement was amended to increase principal borrowed under the Team Loan Facility by $125 million (Incremental Term Loan 3). The proceeds, net of transaction costs, were used to finance a special distribution (2017 Special Dividend) to the Company's shareholders at $2.19 per share. Holders of restricted shares that were unvested at the time the 2017 Special Dividend was declared will be paid the 2017 Special Dividend when the restricted shares vest.
The declaration of the 2017 Special Dividend resulted in the payment of cash dividends totaling $120 million in February 2017 and $0.8 million in the remainder of the 2017.
Incremental Term Loan 3 was issued at par. The Company recorded $2.7 million in costs related to the issuance of Incremental Term Loan 3, of which $1.7 million was recorded in debt issuance costs and capitalized to long-term debt and $1.0 million was expensed and is included in general and administrative expense.
With the issuance of Incremental Term Loan 3, the terms of the 2014 Credit Agreement were amended to require principal payments of $7.9 million per calendar quarter. No other terms or conditions were changed. The Company concluded that the change resulted in debt modification rather than an extinguishment of debt.
The Term Loan, Incremental Term Loan, Incremental Term Loan 2 and Incremental Term Loan 3 are hereafter collectively referred to as the Term Loans.
On August 1, 2017 (the Effective Date), the 2014 Credit Agreement was amended to refinance all existing Term Loans outstanding immediately prior to the Effective Date (2017 Debt Refinancing). The spread above LIBOR on Eurocurrency Loans was reduced to 5.25% from 7.50%, and the spread above the applicable interest rate for Alternative Base Rate Loans was reduced to 4.25% from 6.50%.
117
Victory Capital Holdings, Inc. and Subsidiaries
Notes to Consolidated Financial Statements (Continued)
Years Ended December 31, 2017, 2016 and 2015
10. Debt (Continued)
With the 2017 Debt Refinancing, a prepayment penalty of 1.0% went into effect for six months following the Effective Date in the event all or a portion of the Term Loans are repaid or refinanced (other than in connection with an initial public filing or change in control transaction) with debt having an effective interest cost or weighted average yield less than that of the Term Loans. No other terms or conditions were changed. The Company incurred $1.2 million in arranger and legal costs related to this amendment that are reflected in general and administrative costs on the consolidated statements of operations. The Company recognized a $0.3 million loss on debt extinguishment with the refinancing of the Term Loans that is reflected in interest expense and other financing costs in the consolidated statements of operations. No new debt issuance costs were recorded in conjunction with the debt refinancing.
As of December 31, 2017, 2016 and 2015, the unamortized debt discount is $5.1 million, $6.7 million and $2.7 million respectively, and is included in long-term debt on the consolidated balance sheets. The Company recorded $1.5 million, $1.0 million and $0.5 million of debt discount amortization expense in 2017, 2016 and 2015, respectively, which is included in interest expense and other financing costs on the consolidated statements of operations.
Borrowings under the 2014 Credit Agreement are designated as either Eurocurrency or Alternative Base Rate (ABR) Loans. Until the issuance of Incremental Term Loan 2, Eurocurrency Loans accrued interest at a rate equal to the LIBOR rate for that interest period multiplied by the Statutory Reserve Rate plus 6.0%. With the issuance of Incremental Term Loan 2 on July 29,2016, the spread above the LIBOR rate for Eurocurrency Loans increased from 6.0% to 7.5%. With the August 1, 2017 amendment to the 2014 Credit Agreement, the spread above LIBOR on Eurocurrency Loans was reduced to 5.25% from 7.5%, and the spread above the applicable interest rate for Alternative Base Rate Loans was reduced to 4.25% from 6.5%. For the Term Loans only, the adjusted LIBOR rate for Eurocurrency Loans is subject to a 1.0% floor. ABR Loans bear interest at an annual rate equal to the sum of a) the greatest of the Prime Rate, the Federal Funds Effective Rate plus 1/2 of 1%, or the adjusted one month LIBOR rate plus 100 basis points and b) 4.25%. Revolver Commitment borrowings may be prepaid at any time without penalty. With the amendment to the 2014 Credit Agreement on July 29, 2016, a prepayment penalty of 1.0% went into effect for the Term Loans for one year in the event all or a portion of the Term Loans are repaid or refinanced with debt having an effective interest cost or weighted average yield less than that of the Term Loans through other than a change of control transaction. With the amendment to the 2014 Credit Agreement on August 1, 2017, a prepayment penalty of 1.0% went into effect for six months in the event all or a portion of the Term Loans are repaid or refinanced (other than in connection with an initial public filing or change in control transaction) with debt having an effective interest cost or weighted average yield less than that of the Term Loans.
As of December 31, 2017, 2016 and 2015, the Term Loans were designated as Eurocurrency Loans with an interest period of one month as of December 31, 2017 and three months as of December 31, 2016 and 2015. The interest rate per annum was 6.82%, 8.5% and 7.0% as of December 31, 2017, 2016 and 2015. Including the impact of amortization of debt issuance costs and original issue discount described herein, the effective yield for obligations under the Term Loans as of December 31, 2017, 2016 and 2015 was 7.73%, 9.59%, 7.79% respectively.
118
Victory Capital Holdings, Inc. and Subsidiaries
Notes to Consolidated Financial Statements (Continued)
Years Ended December 31, 2017, 2016 and 2015
10. Debt (Continued)
Prior to the issuance of the Incremental Term Loan, Term Loan principal was repaid quarterly at the end of each calendar quarter in an amount equal to 1.25% multiplied by initial principal of $295 million. With the issuance of the Incremental Term Loan, the terms of the Term Loan facility were changed to require principal payments at the end of each calendar quarter of $4.3 million. The required principal payments increased to $6.2 million and $7.9 million per calendar quarter under the terms of the 2014 Credit Agreement as amended upon the issuance of Incremental Term Loan 2 and Incremental Term Loan 3, respectively. Additional required principal payments are triggered upon receipt of certain proceeds and generation of excess cash. The final scheduled principal payment on the outstanding borrowings under the Term Loans is due on October 31, 2021.
As of December 31, 2017 and 2015, no borrowings were outstanding under the Revolver Commitments. As of December 31, 2016, $3.5 million was outstanding on the Revolver Commitments, which was repaid in full on January 5, 2017. Outstandings under the Revolver Commitments are included in other liabilities on the consolidated balance sheets.
Borrowings and interest under the 2014 Credit Agreement are guaranteed by Victory Capital Holdings, Inc. (Holdings) and Victory and are collateralized by certain assets of Holdings and Operating. The 2014 Credit Agreement restricts Operating's, and Holdings' ability to incur additional indebtedness, issue capital securities, make investments, pay dividends, use assets as security in other transactions, sell certain assets, or merge with or into other companies. As of December 31, 2017, 2016 and 2015, Operating was in compliance with all covenants for the 2014 Credit Agreement.
The components of interest expense and other financing costs on the consolidated statement of operations for the years ended December 31, 2017, 2016 and 2015 appear below.
| |
2017 | 2016 | 2015 | |||||||
|---|---|---|---|---|---|---|---|---|---|---|
Interest expense |
$ | 41,569 | $ | 29,544 | $ | 22,585 | ||||
Amortization of debt issuance costs |
3,657 | 2,749 | 2,188 | |||||||
Amortization of debt discount |
1,544 | 999 | 538 | |||||||
Interest rate cap expense |
767 | 327 | 4 | |||||||
CEMP base payment accretion expense |
638 | 718 | 477 | |||||||
Loss on debt extinguishment |
330 | — | — | |||||||
Other |
292 | 305 | 253 | |||||||
| | | | | | | | | | | |
Total |
$ | 48,797 | $ | 34,642 | $ | 26,045 | ||||
| | | | | | | | | | | |
| | | | | | | | | | | |
| | | | | | | | | | | |
The components of long-term debt on the consolidated balance sheet at December 31, 2017, 2016 and 2015 appear below.
| |
2017 | 2016 | |||||
|---|---|---|---|---|---|---|---|
Principal outstanding |
$ | 499,750 | $ | 438,626 | |||
Unamortized debt issuance costs |
(11,442 | ) | (13,370 | ) | |||
Unamortized debt discount |
(5,083 | ) | (6,728 | ) | |||
| | | | | | | | |
Long-term debt |
$ | 483,225 | $ | 418,528 | |||
| | | | | | | | |
| | | | | | | | |
| | | | | | | | |
119
Victory Capital Holdings, Inc. and Subsidiaries
Notes to Consolidated Financial Statements (Continued)
Years Ended December 31, 2017, 2016 and 2015
10. Debt (Continued)
Debt issuance costs related to the Term Loans totaled $19.9 million and $18.2 million at December 31, 2017 and 2016 and are reflected net of accumulated amortization and loss on debt extinguishment of $8.5 million and $4.8 million respectively. Debt issuance costs of $1.1 million related to the Revolver Commitments are included in other assets on the consolidated balance sheets and are reflected net of accumulated amortization of $0.7 million and $0.5 million as of December 31, 2017 and 2016.
Promissory Note
On March 11, 2016 the Company issued a promissory note for $1.7 million for amounts due to a shareholder upon the repurchase of shares of Company common stock at fair value. The promissory note is subordinate to the Term Loans. Principal and interest on the promissory note is payable monthly for a period of 36 months beginning in March 2016. Interest on outstanding principal is calculated at prime rate. In 2017 and 2016, the Company paid $0.6 million and $0.5 million in principal and interest on the promissory note. The promissory note is included in other liabilities on the consolidated balance sheets.
11. Derivatives
Interest Rate Caps
Under the terms of the 2014 Credit Agreement, at least 50% of the initial principal outstanding of $295 million on the Term Loan is required to be protected from interest rate fluctuations for a period of at least two years.
Operating entered into two interest rate caps, one in late 2014 and one in early 2015, to manage interest rate exposure on 50% of the initial principal outstanding on the Term Loan for a three year period expiring December 31, 2017. The caps were designated as cash flow hedges of the variability in expected future cash flows on the Term Loan based on fluctuations in 3-month LIBOR above 1.50%. The caps were considered to be perfectly effective as all critical terms of the interest rate caps completely match the hedged forecasted interest on the Term Loan. For the year end December 31, 2017, $0.8 million of interest expense was recognized in the consolidated statements of operations. The impact on other comprehensive income (loss) and earnings for 2016 and 2015 was immaterial.
The interest rate caps expired on December 31, 2017 as per their original contractual terms.
12. Equity Method Investment
In December 2016, the Company acquired a 7.6% ownership interest in Cerebellum. Cerebellum is an investment management firm that develops machine learning-focused technology to invent and manage investment strategies. As the Company does not have the ability to direct significant activities of Cerebellum and does not have the right to receive benefits nor the obligation to absorb losses that could potentially be significant to Cerebellum, the Company does not consolidate Cerebellum.
Given the level of ownership interest in Cerebellum, the fact that Cerebellum maintains specific ownership accounts for the investors, which makes Cerebellum more like a limited partnership, and the
120
Victory Capital Holdings, Inc. and Subsidiaries
Notes to Consolidated Financial Statements (Continued)
Years Ended December 31, 2017, 2016 and 2015
12. Equity Method Investment (Continued)
Company's influence through assignment of one of eight board positions, the Company accounts for its investment in Cerebellum using the equity method of accounting.
In conjunction with making the equity investment, Operating entered into put and call options on additional Cerebellum equity interests. The options were determined to be free-standing instruments as Operating has the right to transfer or assign its obligations and rights under the options to other parties. Under the put option written by Cerebellum, provided certain conditions are met, Cerebellum can require Operating to purchase up to $3 million of additional equity at the December 5, 2016 (Closing Date) price per unit in quarterly installments during a one year period starting on the first anniversary of the Closing Date through the second anniversary of the Closing Date.
Under the call option, Operating has the ability to purchase up to $3 million of additional equity at the Closing Date price per unit during a two year period starting on the first anniversary of the Closing Date through the third anniversary of the Closing Date, provided these units have not already been purchased under the put option.
The options were valued on the Closing Date using an option pricing model, resulting in a call option asset valuation of $0.8 million and put option liability of $0.8 million. Significant inputs include the exercise period, which was determined to be 1.375 years and expected volatility, which was determined to be 60%. The call option is included in other assets and the put option in other liabilities on the consolidated balance sheets. As the put and call options did not meet the net settlement characteristic of a derivative under ASC 815, the options are not marked to market.
On August 1, 2017, the Company signed an amendment to the Cerebellum equity investment agreement accelerating the timeframe under which Cerebellum can require Operating to purchase up to $3 million of additional equity at the Closing Date price per unit. Under the terms of the amendment, Cerebellum can require Operating to purchase the additional $3 million in equity between August 1, 2017 and May 1, 2018 in quarterly installments not to exceed $1 million each. The Company made equity investments in the amount of $1 million on August 1, 2017 and $1 million on November 1, 2017 under the put option. The third and final $1 million equity investment under the put option was made on February 1, 2018.
As of December 31, 2017, the Company's equity investment in Cerebellum totaled $4.6 million, which is net of $0.4 mllion in losses recorded in 2017 under the equity method of accounting. Losses from equity method investments are recorded in interest income and other income/(expense) on the consolidated statement of operations. Equity method investments are recorded in other assets on the consolidated balance sheets. The Company's equity investment in Cerebellum was $3.0 million as of December 31, 2016.
The Company's ownership percentage in Cerebellum was 11.9% and 7.6% as of December 31, 2017 and 2016, respectively.
121
Victory Capital Holdings, Inc. and Subsidiaries
Notes to Consolidated Financial Statements (Continued)
Years Ended December 31, 2017, 2016 and 2015
13. Share-Based Compensation
The Company maintains an Equity Incentive Plan (Equity Plan) for equity-based compensation awards. Under the Equity Plan, executives and key employees of the Company receive restricted share awards and stock option awards.
The total number of shares of common stock of the Company which may be awarded under restricted share and stock option awards was 8,243,650 as of December 31, 2015. In conjunction with the closing of the RSIM transaction, the Company's board approved an increase in the total number of shares of common stock which may be awarded under restricted share and stock option awards to 12,136,850.
On March 30, 2017, the Equity Plan was amended to increase the maximum number of shares that may be issued in connection with awards granted under this plan to 15,097,459 shares, of which 10,118,245 shares are allocated for issuance of stock options and 4,979,214 shares are allocated for issuances of restricted shares.
All stock option awards are considered non-qualified. For certain stock option awards granted on July 29, 2016, fifty percent of the shares of common stock subject to each option vest based on service and the remaining fifty percent of the shares of common stock subject to each option vest upon satisfaction of various performance conditions. For all other stock option awards, sixty percent of the shares of common stock subject to each option vest based on service; the remaining forty percent of the shares of common stock subject to each option vest upon satisfaction of various performance conditions.
As of December 31, 2017, stock option awards to purchase an aggregate of 9,078,728 shares of common stock and restricted share awards for 2,116,168 shares of common stock had been granted and were outstanding. As of December 31, 2016, stock option awards to purchase an aggregate of 8,669,475 shares of common stock and restricted share awards for 1,536,977 shares of common stock had been granted and were outstanding. As of December 31, 2015, stock option awards to purchase an aggregate of 6,530,181 shares of common stock and restricted share awards for 770,153 shares of common stock had been granted and were outstanding.
122
Victory Capital Holdings, Inc. and Subsidiaries
Notes to Consolidated Financial Statements (Continued)
Years Ended December 31, 2017, 2016 and 2015
13. Share-Based Compensation (Continued)
Current Year Grants and Activity
Activity during the years ended December 31, 2017, 2016 and 2015 related to stock option awards and restricted stock awards is shown in the tables below.
| |
Shares Subject to Stock Option Awards Year to Date Ended December 31, |
|||||||||||||||||||||||||||
|---|---|---|---|---|---|---|---|---|---|---|---|---|---|---|---|---|---|---|---|---|---|---|---|---|---|---|---|---|
| |
2017 | 2016 | 2015 | |||||||||||||||||||||||||
| |
Avg wtd grant-date fair value |
Avg wtd exercise price(1) |
Units | Avg wtd grant-date fair value |
Avg wtd exercise price(1) |
Units | Avg wtd grant-date fair value |
Avg wtd exercise price(1)(2) |
Units | |||||||||||||||||||
Outstanding at the beginning of period |
$ | 3.40 | $ | 4.90 | 8,669,475 | $ | 2.93 | $ | 3.30 | 6,530,181 | $ | 2.89 | $ | 4.29 | 6,917,010 | |||||||||||||
Granted |
6.14 | 13.52 | 774,357 | 4.27 | 7.91 | 2,961,655 | 3.49 | 4.93 | 131,396 | |||||||||||||||||||
Forfeited |
3.02 | 3.81 | (132,972 | ) | 3.09 | 3.70 | (286,793 | ) | 2.60 | 2.59 | (252,981 | ) | ||||||||||||||||
Exercised(3) |
2.54 | 2.45 | (73,406 | ) | — | — | — | — | — | — | ||||||||||||||||||
Modified to liability to be cash settled |
2.61 | 2.62 | (158,726 | ) | 2.67 | 2.74 | (535,568 | ) | 2.54 | 2.45 | (265,244 | ) | ||||||||||||||||
| | | | | | | | | | | | | | | | | | | | | | | | | | | | | |
Outstanding at the end of the period |
$ | 3.66 | $ | 5.71 | 9,078,728 | $ | 3.40 | $ | 4.90 | 8,669,475 | $ | 2.93 | $ | 3.30 | 6,530,181 | |||||||||||||
| | | | | | | | | | | | | | | | | | | | | | | | | | | | | |
| | | | | | | | | | | | | | | | | | | | | | | | | | | | | |
| | | | | | | | | | | | | | | | | | | | | | | | | | | | | |
Vested |
$ | 3.17 | $ | 4.19 | 5,731,647 | $ | 2.93 | $ | 3.43 | 3,493,018 | $ | 2.70 | $ | 2.80 | 2,378,434 | |||||||||||||
Nonvested |
4.49 | 8.31 | 3,347,081 | 3.71 | 5.89 | 5,176,457 | 3.06 | 3.59 | 4,151,747 | |||||||||||||||||||
Expected to vest |
4.41 | 8.15 | 2,279,800 | 3.53 | 5.40 | 4,238,468 | 3.01 | 3.48 | 3,699,046 | |||||||||||||||||||
- (1)
- Reflects
the reduction of exercise price on options granted prior to February 2017 from the 2017 Special Dividend
- (2)
- Reflects
the reduction of exercise price on options granted prior to May 2015 from the 2015 Special Dividend
- (3)
- Total intrinsic value of options exercised in 2017 was $0.8 million
| |
Restricted Stock Awards For Year Ended December 31, |
||||||||||||||||||
|---|---|---|---|---|---|---|---|---|---|---|---|---|---|---|---|---|---|---|---|
| |
2017 | 2016 | 2015 | ||||||||||||||||
| |
Avg wtd grant-date fair value |
Units | Avg wtd grant-date fair value |
Units | Avg wtd grant-date fair value |
Units | |||||||||||||
Nonvested at beginning of period |
$ | 9.48 | 1,018,228 | $ | 5.84 | 378,769 | $ | 5.78 | 644,364 | ||||||||||
Granted |
13.52 | 623,165 | 10.27 | 833,574 | 7.99 | 8,059 | |||||||||||||
Vested |
7.99 | (339,701 | ) | 5.79 | (194,115 | ) | 5.75 | (223,198 | ) | ||||||||||
Forfeited |
8.81 | (8,585 | ) | — | — | 5.71 | (50,456 | ) | |||||||||||
| | | | | | | | | | | | | | | | | | | | |
Nonvested at end of period |
$ | 11.82 | 1,293,107 | $ | 9.48 | 1,018,228 | $ | 5.84 | 378,769 | ||||||||||
| | | | | | | | | | | | | | | | | | | | |
| | | | | | | | | | | | | | | | | | | | |
| | | | | | | | | | | | | | | | | | | | |
Vested and outstanding at end of period |
$ | 6.67 | 823,061 | $ | 5.76 | 518,749 | $ | 5.74 | 391,383 | ||||||||||
Expected to vest |
11.99 | 1,080,947 | 9.23 | 848,834 | 5.82 | 360,374 | |||||||||||||
123
Victory Capital Holdings, Inc. and Subsidiaries
Notes to Consolidated Financial Statements (Continued)
Years Ended December 31, 2017, 2016 and 2015
13. Share-Based Compensation (Continued)
| |
Director Plan Restricted Stock Awards For Year Ended December 31, |
||||||||||||||||||
|---|---|---|---|---|---|---|---|---|---|---|---|---|---|---|---|---|---|---|---|
| |
2017 | 2016 | 2015 | ||||||||||||||||
| |
Avg wtd grant-date fair value |
Units | Avg wtd grant-date fair value |
Units | Avg wtd grant-date fair value |
Units | |||||||||||||
Nonvested at beginning of period |
$ | 5.71 | 49,230 | $ | 5.71 | 114,927 | $ | 5.71 | 197,093 | ||||||||||
Granted |
— | — | — | — | — | — | |||||||||||||
Vested |
5.71 | (49,230 | ) | 5.71 | (65,697 | ) | 5.71 | (82,166 | ) | ||||||||||
Forfeited |
— | — | — | — | — | — | |||||||||||||
| | | | | | | | | | | | | | | | | | | | |
Nonvested at end of period |
$ | 5.71 | — | $ | 5.71 | 49,230 | $ | 5.71 | 114,927 | ||||||||||
| | | | | | | | | | | | | | | | | | | | |
| | | | | | | | | | | | | | | | | | | | |
| | | | | | | | | | | | | | | | | | | | |
Vested and outstanding at end of period |
$ | 5.71 | 262,791 | $ | 5.71 | 213,561 | $ | 5.71 | 147,864 | ||||||||||
Expected to vest |
5.71 | — | 5.71 | 43,098 | 5.71 | 102,138 | |||||||||||||
Share-based compensation expense for equity awards is measured at the grant date, based on the estimated fair value of the award, and recognized over the requisite employee service period. Stock option awards have an expiration date of ten years from the grant date.
For restricted share awards granted on March 31, 2017 and July 1, 2017, fifty percent of the shares vest on the third anniversary of the grant date and the remaining fifty percent vest upon achievement of certain share prices for the Company's stock. For restricted share awards granted on July 29, 2016 and certain stock option awards granted on July 31, 2017 and July 29, 2016, the restricted shares and the service portion of the stock option awards vest ratably at 20% per year over a five-year period. The remaining restricted stock awards, including restricted stock awards granted on March 10, 2017, and service portion of all other stock option awards vest ratably at 25% over a four-year period from date of grant. The performance portion of certain stock option awards granted on July 31, 2017 and July 29, 2016 vest based on achievement of revenue and AUM levels related to specific investment franchises. For all other stock option awards, the performance portion of the awards vests upon the Company's achievement of certain revenue, assets under management, and earnings before interest, taxes, depreciation and amortization levels.
The grant date fair value of stock option awards is computed using Black-Scholes option pricing framework. The grant date fair value of stock option awards granted during 2017 and upon the Company's acquisition of RSIM on July 29, 2016 was computed using the following assumptions as of the date of the grant:
| |
2017 | July 29, 2016 | ||||
|---|---|---|---|---|---|---|
Current stock price |
$13.52 | $ | 10.27 | |||
Exercise price |
$13.52 | $ | 10.27 | |||
Expected volatility |
50% | 50 | % | |||
Risk free rate |
1.92% - 2.22% | 1.10 | % | |||
Expected average years to exit |
5 | 5 | ||||
The Company used both a market approach and income approach to estimate the current stock price used in the valuation of restricted share and stock option awards during 2017. The market
124
Victory Capital Holdings, Inc. and Subsidiaries
Notes to Consolidated Financial Statements (Continued)
Years Ended December 31, 2017, 2016 and 2015
13. Share-Based Compensation (Continued)
approach considered the then current EBITDA multiples and price/earnings multiples of comparable public companies. The income approach considered management's forecast of operating results, a long-term growth rate and a discount rate. The results of the market and income approach were weighted in developing the estimate of fair value. The current stock price used in the valuation of equity awards granted on July 29, 2016 upon the Company's acquisition of RSIM was the price per share used for all equity issued on that date.
The expected life of the options granted in 2017 and 2016 was based on the average holding period for a private equity investment. The risk free interest rate was based on the yield for the U.S. Treasury coupon strip with a maturity date equal to the expected life of the award. As the Company's common shares were not publicly traded in 2017 and 2016, the Company has calculated expected volatility based on an average volatility of companies in the same or similar lines of business adjusted for differing levels of leverage.
Award Modifications
In December 2017, the Company revised the estimate of the time it is expected to take to achieve performance conditions on stock option awards. A cumulative catch up adjustment was recorded so that the cumulative recognized compensation cost on the performance options was equal to what would have been recognized had the new estimate been used since the grant date.
In October 2017, the Company's board of directors approved a modification to a limited number of stock option awards to revise performance conditions to be achieved for vesting. The modification resulted in an adjustment to expense of an immaterial amount.
On July 29, 2016, the Company's board of directors approved a modification to outstanding options issued on or after October 31, 2014 and prior to the RSIM acquisition providing that 50% of the performance options were deemed to be vested. As a result of accelerated vesting on these awards, the Company recognized an additional $0.5 million in expense related to options that vested on July 29, 2016 that the Company had previously not expected to vest. The incremental expense was calculated using the fair value per unit on the vesting date.
The Company also established a new vesting schedule for all remaining unvested performance options issued prior to July 29, 2016 to align with the combined company's financial projections. No other terms and conditions for stock option awards issued prior to July 29, 2016 were modified (i.e. the exercise price per option or term of the option).
The Company considered it probable that both the original and modified performance options would vest and calculated that the per share option fair value immediately prior to the modification based on current circumstances was approximately the same as the per share option fair value of the award immediately following the modification.
Compensation expense not yet recognized at July 31, 2016 related to the remaining 50% of the performance options under awards granted between October 31, 2014 and July 29, 2016 is being recognized over the period of time it is expected to take to achieve the performance conditions. No cumulative catch up adjustment was recorded as the period of time expected to take to achieve the performance conditions did not change.
125
Victory Capital Holdings, Inc. and Subsidiaries
Notes to Consolidated Financial Statements (Continued)
Years Ended December 31, 2017, 2016 and 2015
13. Share-Based Compensation (Continued)
For options granted prior to October 31, 2014, the Company revised the estimate of time it expected to take to achieve the performance conditions as modified on July 29, 2016 on the remaining unvested options. A cumulative catch up adjustment was recorded so that the cumulative recognized compensation costs on these performance options was equal to what would have been recognized had the new estimate been used since the grant date.
In the fourth quarter of 2015, the Company revised the estimate of the time it is expected to take to achieve the performance conditions on the stock option awards. A cumulative catch up adjustment was recorded so that the cumulative recognized compensation cost on the performance options was equal to what would have been recognized had the new estimate been used since the grant date.
During 2015, the Company modified certain equity awards through the exercise of an employee call right only upon termination of employment to settle these awards in cash versus stock as originally intended. At the time of the modification, the Company recorded a reduction to equity of $1.3 million and additional compensation expense of $0.4 million, which represented the difference between the market value of the awards on the modification date in excess of the grant date fair value. The resulting liability of $1.7 million was paid in 2016. During 2016 and 2017, the Company also modified equity awards to provide for the settlement of these awards in cash versus stock as originally intended. At the time of the modification, the Company recorded a reduction to equity of $2.3 million and $1.5 million and additional compensation expense of $0.7 million and $0.3 million, respectively, which represented the difference between the market value of the awards on the modification date in excess of the grant date fair value. The resulting liabilities of $3.0 million and $1.8 million were paid in cash in 2016 and 2017 and are included in cash flows from financing activities in the consolidated statement of cash flows as payments related to equity awards modified to liabilities.
Dividend Payments
In May 2015, the Company declared and paid a special dividend (2015 Special Dividend) of $1.08 per share. Holders of restricted shares that were unvested at the time Special Dividend 1 was declared are paid Special Dividend 1 when the restricted shares vest. The strike price per share for all stock option awards granted prior to May 2015 was reduced by $1.08 under the anti-dilution provisions of the stock option grant agreements.
In November 2015, the Company declared and paid a second dividend (Second Dividend) of $0.20 per share. Holders of restricted stock awards that were unvested at the time the Second Dividend was declared are paid the Second Dividend when the restricted stock vests. Holders of stock options that were unvested at the time the Second Dividend was declared receive a cash bonus equivalent of $0.20 per share when the stock options vest.
In February 2017, the Company declared and paid a special dividend (2017 Special Dividend) of $2.19 per share. Holders of restricted shares that were unvested at the time the 2017 Special Dividend was declared are paid the 2017 Special Dividend when the restricted shares vest. The strike price per share for all stock option awards granted prior to February 2017 was reduced by $2.19 under the anti dilution provisions of the stock option grant agreements.
In December 2017, the Company declared a dividend of $0.23 per share (Fourth Dividend). Holders of restricted stock awards that were unvested at the time the Fourth Dividend was declared
126
Victory Capital Holdings, Inc. and Subsidiaries
Notes to Consolidated Financial Statements (Continued)
Years Ended December 31, 2017, 2016 and 2015
13. Share-Based Compensation (Continued)
are paid the Fourth Dividend when the restricted stock vests. Holders of stock options that were unvested at the time the Fourth Dividend was declared receive a cash bonus equivalent of $0.23 per share when the stock options vest.
As of December 31, 2017, 2016 and 2015, the amount of cash bonuses and distributions related to all dividends previously declared on restricted shares and options expected to vest in the future totaled $2.0 million, $0.8 million and $1.3 million, respectively, which is not recorded as a liability as of the balance sheet date. A liability will be recorded for these cash bonuses and dividends when the restricted shares and options vest.
Stock Compensation Expense
The Company recorded $11.8 million, $8.8 million and $5.7 million of stock based compensation expense related to the Equity Plan in personnel compensation and benefits expense within the consolidated statement of operations for the years ended December 31, 2017, 2016 and 2015.
In addition to the Equity Plan, the Company maintains an Outside Director Equity Incentive Plan (the Director Plan) to attract and retain highly qualified independent directors. The maximum number of shares that may be issued under the Director Plan is 262,791. Compensation expense for Director Plan shares is recognized over the requisite service period.
The Company recognized Director Plan expense of $0.2 million in 2017 and $0.4 million in 2016 and 2015, which is recorded in general and administrative expense.
The Company expects to recognize total share-based compensation expense of $17.3 million over a weighted average period of 1.9 years. The total fair value of restricted share awards vested during the years ended December 31, 2017, 2016 and 2015 under the Equity Plan was $4.6 million, $2.0 million and $1.8 million respectively; the fair value of restricted share awards vested under the Director Plan for these same periods was $0.7 million for each period. The aggregate intrinsic value of stock options currently exercisable at December 31, 2017, 2016 and 2015 was $57.8 million, $35.2 million and $11.2 million respectively.
14. Commitments
The Company leases office space and equipment under operating leases expiring at various dates. The Company has the right to renew or extend the leases under the agreements for certain
127
Victory Capital Holdings, Inc. and Subsidiaries
Notes to Consolidated Financial Statements (Continued)
Years Ended December 31, 2017, 2016 and 2015
14. Commitments (Continued)
non-headquarter office spaces. Future calendar year minimum lease payments under the leases are as follows, all dollars are in thousands:
2018 |
4,241 | |||
2019 |
4,292 | |||
2020 |
4,040 | |||
2021 |
3,298 | |||
| | | | | |
2022 |
2,352 | |||
| | | | | |
Thereafter |
2,577 | |||
| | | | | |
|
$ | 20,800 | ||
| | | | | |
| | | | | |
| | | | | |
Rent expense for the years ended December 31, 2017, 2016 and 2015 was $7.3 million, $5.9 million, and $5.2 million, respectively, and is included in general and administrative expense in the consolidated statements of operations.
15. Employee Benefit Plans
The Company maintains a defined contribution 401(k) Plan (the 401(k) Plan), covering substantially all employees who have met the eligibility requirements. The 401(k) Plan is subject to the provisions of the Employee Retirement Income Security Act of 1974 and the Economic Growth and Tax Relief Reconciliation Act of 2001. In 2017, the Company recognized expense of $2.4 million in employer matched contributions. For each of the years ended December 31, 2016 and 2015, the Company recognized expense of $1.9 million in employer matched contributions. The Company made employer declared discretionary (profit-sharing) contributions of $0.4 million in early 2015 for the year ended December 31, 2014 to the 401(k) Plan and deferred compensation plan. No profit-sharing contributions were approved for the years ended December 31, 2017, 2016 and 2015.
The Company sponsors a deferred compensation plan for key investment professionals and executives as a means to reward and motivate them. The Company purchases mutual funds as directed by the plan participants to fund its related obligations. Such securities are held in a rabbi trust for the participants, and under the terms of the trust agreement, the assets of the trust are available to satisfy the claims of the Company's general creditors in the event of bankruptcy.
Gains and losses from fluctuations in value of deferred compensation plan investments are offset entirely in the consolidated statements of operations by the corresponding changes in value of the deferred compensation liability. Investments held under the deferred compensation plan are recorded
128
Victory Capital Holdings, Inc. and Subsidiaries
Notes to Consolidated Financial Statements (Continued)
Years Ended December 31, 2017, 2016 and 2015
15. Employee Benefit Plans (Continued)
as trading securities on the consolidated balance sheets. Components of deferred compensation plan-related expense appear below.
| |
2017 | 2016 | 2015 | |||||||
|---|---|---|---|---|---|---|---|---|---|---|
Employee compensation |
$ | 3.1 | $ | 1.5 | $ | 2.0 | ||||
Employer contributions |
0.8 | 0.7 | 1.0 | |||||||
Change in value of deferred compensation plan liability |
1.3 | 0.6 | (0.1 | ) | ||||||
| | | | | | | | | | | |
Total |
$ | 5.2 | $ | 2.8 | $ | 2.9 | ||||
| | | | | | | | | | | |
| | | | | | | | | | | |
| | | | | | | | | | | |
16. Earnings Per Share
The computation of basic and diluted earnings per share is as follows:
| |
Years Ended December 31, | |||||||||
|---|---|---|---|---|---|---|---|---|---|---|
(in thousands except per share amounts)
|
2017 | 2016 | 2015 | |||||||
Net income/(loss) |
$ | 25,826 | $ | (6,071 | ) | $ | 3,800 | |||
Shares: |
||||||||||
Basic: Weighted average number of shares outstanding |
54,930,852 | 50,017,712 | 46,408,891 | |||||||
Plus: Incremental shares from assumed conversion of dilutive instruments |
4,646,496 | — | 1,681,862 | |||||||
| | | | | | | | | | | |
Diluted: Weighted average number of shares outstanding |
59,577,348 | 50,017,712 | 48,090,753 | |||||||
| | | | | | | | | | | |
| | | | | | | | | | | |
| | | | | | | | | | | |
For the years ended December 31, 2017, 2016 and 2015, there were 434,656, 6,614,274 and 1,480,740 outstanding instruments, respectively, excluded from the above computations of weighted average shares for diluted EPS because the effects would be anti-dilutive. Holders of non-vested share-based compensation awards do not have rights to receive nonforfeitable dividends on the shares covered by the awards.
17. Net Capital Requirements
VCA is subject to the SEC Uniform Net Capital Rule (Rule 15c3-1 under the Exchange Act) administered by the SEC and FINRA, which requires the maintenance of minimum net capital, as defined, and requires that the ratio of aggregate indebtedness to net capital, cannot exceed 15 to 1. Net capital and the related net capital requirement may fluctuate on a daily basis.
At December 31, 2017, VCA had net capital under the Rule 15c3-1 of $2.3 million which was $2.1 million in excess of its minimum required net capital of $0.2 million. At December 31, 2016, VCA had net capital under Rule 15c3-1 of $1.6 million, which was $1.3 million in excess of its minimum required net capital of $0.3 million. The Company's ratio of aggregate indebtedness to net capital at December 31, 2017 and 2016 was 1.55 to 1 and 2.63 to 1 respectively.
Capital requirements may limit the amount of cash available for dividend from VCA to the parent company. VCA's cash and cash equivalents is generally not available for corporate purposes.
129
Victory Capital Holdings, Inc. and Subsidiaries
Notes to Consolidated Financial Statements (Continued)
Years Ended December 31, 2017, 2016 and 2015
18. Accumulated Other Comprehensive Loss
The following table presents changes in accumulated other comprehensive income/(loss) by component for the years ending December 31, 2017, 2016, and 2015, all dollars are in thousands.
| |
Available-for-sale Securities(a) |
Cash Flow Hedges(b) |
Cumulative Translation Adjustment |
Total | |||||||||
|---|---|---|---|---|---|---|---|---|---|---|---|---|---|
Balance, December 31, 2014 |
$ | (16 | ) | $ | (34 | ) | $ | — | $ | (50 | ) | ||
Other comprehensive income/(loss) before reclassification and tax |
(35 | ) | (768 | ) | — | (803 | ) | ||||||
Tax impact |
14 | 291 | 305 | ||||||||||
Reclassification adjustments, before tax |
8 | — | — | 8 | |||||||||
Tax impact |
(2 | ) | — | — | (2 | ) | |||||||
| | | | | | | | | | | | | | |
Net current period other comprehensive income/(loss) |
(15 | ) | (477 | ) | — | (492 | ) | ||||||
| | | | | | | | | | | | | | |
Balance, December 31, 2015 |
$ | (31 | ) | $ | (511 | ) | $ | — | $ | (542 | ) | ||
| | | | | | | | | | | | | | |
| | | | | | | | | | | | | | |
| | | | | | | | | | | | | | |
Other comprehensive income/(loss) before reclassification and tax |
28 | (254 | ) | (100 | ) | (326 | ) | ||||||
Tax impact |
(9 | ) | 98 | 38 | 127 | ||||||||
Reclassification adjustments, before tax |
(2 | ) | 327 | — | 325 | ||||||||
Tax impact |
1 | (122 | ) | — | (121 | ) | |||||||
| | | | | | | | | | | | | | |
Net current period other comprehensive income/(loss) |
18 | 49 | (62 | ) | 5 | ||||||||
| | | | | | | | | | | | | | |
Balance, December 31, 2016 |
$ | (13 | ) | $ | (462 | ) | $ | (62 | ) | $ | (537 | ) | |
| | | | | | | | | | | | | | |
| | | | | | | | | | | | | | |
| | | | | | | | | | | | | | |
Other comprehensive income/(loss) before reclassification and tax |
121 | (20 | ) | 122 | 223 | ||||||||
Tax impact |
(48 | ) | 7 | (47 | ) | (88 | ) | ||||||
Reclassification adjustments, before tax |
(15 | ) | 767 | — | 752 | ||||||||
Tax impact |
6 | (292 | ) | — | (286 | ) | |||||||
| | | | | | | | | | | | | | |
Net current period other comprehensive income/(loss) |
64 | 462 | 75 | 601 | |||||||||
| | | | | | | | | | | | | | |
Balance, December 31, 2017 |
$ | 51 | $ | — | $ | 13 | $ | 64 | |||||
| | | | | | | | | | | | | | |
| | | | | | | | | | | | | | |
| | | | | | | | | | | | | | |
- (a)
- Reclassifications
out of AOCL related to available-for-sale securities are recorded in interest income and other income/(expense)
- (b)
- Reclassifications out of AOCL related to cash flow hedges are recorded in interest expense and other financing costs
19. Selected Quarterly Information (Unaudited)
The following table presents unaudited quarterly financial results for 2017 and 2016. These quarterly results reflect all normal recurring adjustments that management considers necessary for a
130
Victory Capital Holdings, Inc. and Subsidiaries
Notes to Consolidated Financial Statements (Continued)
Years Ended December 31, 2017, 2016 and 2015
19. Selected Quarterly Information (Unaudited) (Continued)
fair statement of the results. Revenues and net income can vary significantly from quarter to quarter due to our business activities and acquisitive nature.
| |
For the Quarters Ended | ||||||||||||
|---|---|---|---|---|---|---|---|---|---|---|---|---|---|
| |
March 31, 2017 | June 30, 2017 | Sept. 30, 2017 | Dec. 31, 2017 | |||||||||
Total revenue |
$ | 100,661 | $ | 100,934 | $ | 102,388 | $ | 105,646 | |||||
Operating expenses |
$ | 81,099 | $ | 81,495 | $ | 78,147 | $ | 78,720 | |||||
Income/(loss) from operations |
$ | 19,562 | $ | 19,439 | $ | 24,241 | $ | 26,926 | |||||
Net income/(loss) |
$ | 4,413 | $ | 2,354 | $ | 7,850 | $ | 11,209 | |||||
Basic earnings/(loss) per share |
$ | 0.08 | $ | 0.04 | $ | 0.14 | $ | 0.20 | |||||
Diluted earnings/(loss) per share |
$ | 0.08 | $ | 0.04 | $ | 0.13 | $ | 0.19 | |||||
| |
For the Quarters Ended | ||||||||||||
|---|---|---|---|---|---|---|---|---|---|---|---|---|---|
| |
March 31, 2016 | June 30, 2016 | Sept. 30, 2016 | Dec. 31, 2016 | |||||||||
Total revenue |
$ | 55,001 | $ | 58,632 | $ | 86,171 | $ | 98,079 | |||||
Operating expenses |
$ | 48,537 | $ | 51,300 | $ | 82,052 | $ | 91,509 | |||||
Income/(loss) from operations |
$ | 6,464 | $ | 7,332 | $ | 4,119 | $ | 6,570 | |||||
Net income/(loss) |
$ | (89 | ) | $ | 449 | $ | (3,743 | ) | $ | (2,688 | ) | ||
Basic earnings/(loss) per share |
$ | (0.00 | ) | $ | 0.01 | $ | (0.07 | ) | $ | (0.05 | ) | ||
Diluted earnings/(loss) per share |
$ | (0.00 | ) | $ | 0.01 | $ | (0.07 | ) | $ | (0.05 | ) | ||
20. Subsequent Events
Equity Award Grants
On January 1, 2018, the Company issued grants for 1,678,743 restricted shares of common stock and stock option awards for 357,256 shares of common stock.
Grants for 1,609,857 restricted shares of common stock consisted of time-vested restricted shares (50%) and performance-vested restricted shares (50%). The performance-vested restricted shares will vest based on achievement of share price targets as follows: one-third of the performance-vested restricted shares will vest when the fair market value of a share equals or exceeds $19.98; one-third of the performance-vested restricted shares will vest when the fair market value of a share equals or exceeds $22.84; and one-third of the performance-vested restricted shares will vest when the fair market value of a share equals or exceeds $25.69. The time-vested portion of 1,509,121 of the restricted share awards vests 50% on January 1, 2021, 25% on January 1, 2022 and 25% on January 1, 2023. The time-vested portion of 100,736 restricted share awards cliff-vests on January 1, 2021.
For the remaining grants of 68,886 restricted shares of common stock, sixty percent of the shares vest based on service over a four year period and forty percent vest on satisfaction of various performance conditions.
For the stock option awards granted on January 1, 2018, sixty percent of the shares of common stock subject to each option vest based on service over a four year period; the remaining forty percent of the shares of common stock subject to each option vest upon satisfaction of various performance conditions. The Company estimated the price per share of common stock on January 1, 2018 to be
131
Victory Capital Holdings, Inc. and Subsidiaries
Notes to Consolidated Financial Statements (Continued)
Years Ended December 31, 2017, 2016 and 2015
20. Subsequent Events (Continued)
$14.27. Following the completion of the Company's IPO in February 2018, the Company will use the public share price in the determination of the grant date fair value of equity award grants.
Initial Public Offering and Debt Refinancing
On February 12, 2018, the Company issued 11,700,000 shares of Class A common stock in an initial public offering at a price of $13.00 per share. On March 31, 2018, the Company issued an additional 1,110,860 shares of Class A common stock pursuant to the underwriters' exercise of their option. The net proceeds totaled $156.5 million, $143.0 million received at the closing of the IPO and $13.5 million received at the subsequent closing of the underwriters' exercise of their option, after deducting underwriting discounts that aggregated to $10.0 million. The Company also incurred offering costs of approximately $4.5 million, of which $2.9 million of legal, accounting and other costs were included in prepaid expenses on the consolidated balance sheets at December 31, 2017 and were subsequently reclassified to equity issuance costs upon completion of the IPO.
In connection with the IPO, the following transactions were completed:
- •
- Our certificate of incorporation was amended and restated to, among other things, provide for Class A common stock and Class B
common stock, specify voting rights for the Class A common stock and Class B common stock, establish a classified board of directors and adopt the 2018 Stock Incentive Plan and 2018
Employee Stock Purchase Plan.
- •
- All shares of common stock outstanding prior to the IPO were immediately converted into Class B common stock at a one to one ratio.
On February 12, 2018, concurrently with the closing of the IPO, the Company entered into a credit agreement (the Credit Agreement) under which the Company received seven-year term loans in an aggregate principal amount of $360.0 million and established a five-year revolving credit facility (which was unfunded as of closing) with aggregate commitments of $50.0 million. The term loans were issued at a discount of $0.9 million at an interest rate of LIBOR plus 2.75%. The Company incurred upfront lender fees of $0.3 million related to the Credit Agreement's revolving credit facility. Arranger fees and other third party costs of $3.7 million were incurred upon entering into the Credit Agreement. It is anticipated that approximately $8.0 million of expense will be recorded in the first quarter of 2018 related to the write-off of unamortized debt discount, debt issuance costs and third party costs.
Net proceeds received from the IPO and the Credit Agreement of $143.0 million and $355.9 million, respectively, were used concurrent with the closing of the IPO, together with $0.8 million of cash on hand, to repay the $499.7 million outstanding term loans under the 2014 Credit Agreement. On February 21, 2018, the Company repaid $10.0 million of the outstanding term loans under the Credit Agreement, and on March 19, 2018, the Company used the net proceeds from the underwriters' exercise of their option and cash on hand to repay an additional $27.0 million of outstanding term loans under the Credit Agreement.
132
Victory Capital Holdings, Inc. and Subsidiaries
Notes to Consolidated Financial Statements (Continued)
Years Ended December 31, 2017, 2016 and 2015
20. Subsequent Events (Continued)
Additional Cerebellum Investment
On March 2, 2018, the Company agreed to purchase an additional $3 million of participating preferred units in Cerebellum at the December 5, 2016 price per unit. The investment will be made in 3 installments of $1 million on April 1, 2018, July 1, 2018 and September 1, 2018.
133
Item 9. Changes in and Disagreements With Accountants on Accounting and Financial Disclosure
None
Item 9A. Controls and Procedures
Disclosure Controls and Procedures
We maintain disclosure controls and procedures, as defined in Rules 13a-15(e) and 15d-15(e) of the Exchange Act, that are designed to ensure that information required to be disclosed in our reports filed or submitted under the Securities Exchange Act of 1934 is recorded, processed, summarized and reported within the time periods specified in the SEC's rules and forms, and that such information is accumulated and communicated to our management, including our principal executive and principal financial officers, as appropriate, to allow for timely decisions regarding required disclosure.
Our management, including our Chief Executive Officer and Chief Financial Officer, evaluated the effectiveness of our disclosure controls and procedures (as such term is defined in Rule 13a-15(e) and 15d-15(e) under the Exchange Act) at December 31, 2017. Based on that evaluation, our Chief Executive Officer and Chief Financial Officer have concluded that our disclosure controls and procedures are effective.
Report of Management on Internal Control over Financial Reporting
This annual report does not include a report of management's assessment regarding internal control over financial reporting or an attestation report of the Company's registered public accounting firm due to a transition period established by rules of the Securities and Exchange Commission for newly public companies.
Changes in Internal Control over Financial Reporting
There has been no change in the Company's internal control over financial reporting (as such term is defined in Rules 13a-15 and 15d-15 under the Exchange Act) during the quarter ended December 31, 2017, that has materially affected, or is reasonably likely to materially affect, the Company's internal control over financial reporting.
None
134
PART III
Item 10. Directors, Executive Officers and Corporate Governance.
Executive Officers and Directors
Our executive officers and directors are:
Name
|
Age | Position | |||
|---|---|---|---|---|---|
David C. Brown |
45 | Chief Executive Officer and Chairman | |||
Michael D. Policarpo |
43 | Chief Operating Officer | |||
Kelly S. Cliff |
48 | President, Investment Franchises | |||
Terence F. Sullivan |
44 | Chief Financial Officer and Head of Strategy | |||
Nina Gupta |
43 | Chief Legal Officer | |||
Milton R. Berlinski |
61 | Director | |||
Alex Binderow |
36 | Director | |||
Lawrence Davanzo |
65 | Director | |||
Richard M. DeMartini |
65 | Director | |||
James B. Hawkes |
76 | Director | |||
Karin Hirtler-Garvey |
61 | Director | |||
Robert J. Hurst |
72 | Director | |||
Alan H. Rappaport |
65 | Director | |||
Executive Officers
David C. Brown has served as our Chief Executive Officer since our acquisition from KeyCorp in August 2013 and Chairman of our board of directors since April 2014. He joined our board of directors upon its formation. Mr. Brown serves as Chairman and Chief Executive Officer of VCM, responsible for the development, execution and oversight of firm strategy. He is also Chairman of the VCM investment committee and a trustee for the Victory Funds. Mr. Brown joined the firm in 2004 and has held multiple senior level positions including Chief Operating Officer prior to his current role. Before joining Victory, Mr. Brown spent five years at Gartmore Global Investments, Inc. in a number of senior management positions including Chief Financial Officer and Chief Operating Officer of Gartmore Emerging Managers, LLC. Prior to joining Gartmore, he worked for Ernst & Young LLP as a manager in the Assurance & Advisory Business Services unit focusing on investment management businesses. Mr. Brown also currently serves as a director of Cerebellum Capital. He previously was a member of the Bluecoats, Inc. of Cuyahoga County, OH, and previously served on the Summa Health Systems of Ohio Investment Committee and on the board of directors for JumpStart of Ohio. Mr. Brown holds a Bachelor of Arts degree in political science with an emphasis on accounting from Ursinus College and a Master of Business Administration from Case Western Reserve University. He is a Certified Public Accountant. Mr. Brown's extensive business, finance and leadership skills gained and developed through years of experience in the financial services industry, including tenure overseeing our strategic direction as Chief Executive Officer, brings valuable industry-specific knowledge and insights to our board of directors. Mr. Brown has also overseen several transactions in the asset management sector during his tenure with us. He has significant expertise in identifying, structuring and executing strategic acquisitions, as well as in managing boutique firms post-acquisition. These skills, combined with Mr. Brown's extensive knowledge of our business and our industry, enable him to provide valuable insights to our board of directors on our strategic direction.
Michael D. Policarpo has served as our Chief Operating Officer since February 2016, responsible for the day to day operations of the business platform, including all operations and administration functions, support in inorganic growth sourcing, evaluation and execution and business platform integration. In addition, Mr. Policarpo is responsible for acquisition integration. Mr. Policarpo joined
135
the firm in 2005 and served as our Chief Financial Officer from our acquisition from KeyCorp in August 2013 until July 1, 2017, among various other roles. Prior to joining Victory, he served as Vice President of Finance for Gartmore Global Investments, Inc. where he was responsible for strategic planning in conjunction with Gartmore's senior management teams. He held several other positions during his five years at Gartmore, including Chief Financial Officer of Advisor Services and corporate controller. Prior to his tenure with Gartmore, he worked for Ernst & Young LLP as a senior accountant in the Assurance & Advisory Business Services unit with a focus on investment management companies, registered investment companies and broker-dealers. Mr. Policarpo holds a Bachelor of Science degree in accounting and finance from Lehigh University. He is a Certified Public Accountant and holds Series 7, 24, 27 and 99 securities licenses.
Kelly S. Cliff has served as our President, Investment Franchises since November 2015 and was on our board of directors from November 2015 until January 2018. In his role as our President, Investment Franchises, he serves as a strategic resource for our Franchises, focusing on best practices in alpha generation, risk management and alignment of investment management capabilities with client needs. He is also responsible for providing tactical analysis of our existing Franchises as well as evaluating the capabilities of potential new franchises as part of our acquisition strategy. Mr. Cliff oversees the centralized investment functions that support our Franchises, including trading, quantitative analysis and risk management. He is also a member of the VCM investment committee. Prior to joining Victory in 2014, Mr. Cliff spent 22 years with Callan Associates, most recently serving as the Chief Investment Officer of public markets and co-lead of the Global Manager Research Group. Previously, he was Chief Investment Officer of Callan's Trust Advisory Group. Mr. Cliff graduated from the University of the Pacific with a Bachelor of Science in Business Administration and has earned the Chartered Financial Analyst designation and the Chartered Alternative Investment Analyst designation.
Terence F. Sullivan has served as our Chief Financial Officer and Head of Strategy since July 2017. He is responsible for all finance, accounting, treasury and corporate development activity for the firm. Before joining Victory, Mr. Sullivan was an investment banker at Morgan Stanley in their Financial Institutions Group. Mr. Sullivan joined Morgan Stanley in 2003 and served as Global Head of the Asset Management Sector since 2013 and North American Head of the Asset Management Sector from 2008 to 2013, responsible for advising investment management firms on mergers and acquisitions, capital markets transactions and other strategic initiatives, advising on over $100 billion in transaction values during his tenure. Prior to joining Morgan Stanley, Mr. Sullivan was an associate at Putnam Lovell NBF, an investment banking boutique focused on the financial institutions sector. Before his investment banking career, Mr. Sullivan was a management consultant in the Financial Services Practice at KPMG Consulting where he worked on strategic advisory and business process improvement engagements for banks, investment managers and financial technology firms. Mr. Sullivan holds a Master of Business Administration degree from Columbia Business School and a Bachelor of Science degree in Business Administration with a concentration in Finance from Villanova University.
Nina Gupta has served as our Chief Legal Officer and Secretary since July 2016. Previously, Ms. Gupta was General Counsel and Secretary of RS Investments from April 2013 until RS Investments was acquired by Victory in July 2016. Prior to joining RS Investments, Ms. Gupta worked at BlackRock Inc., where she was Deputy General Counsel of BlackRock Institutional Trust Company, responsible for providing legal advice in connection with corporate matters, counterparty trading, transactional documentation and regulatory issues in connection with a variety of different fund structures and accounts. Previously, Ms. Gupta was an associate at the law firm of Shearman & Sterling LLP in New York, NY and Menlo Park, CA, where her practice focused on general corporate, structured finance and banking matters. Ms. Gupta earned a law degree from the University of London in 1996 and a Masters in Law from the University of Cambridge in 1997.
136
Directors
Milton R. Berlinski joined our board of directors at the time of our acquisition from KeyCorp in August 2013. Mr. Berlinski co-founded Reverence Capital in June 2013 after concluding a 26-year career at Goldman, Sachs & Co., or Goldman Sachs, as a Partner and Managing Director. He joined Goldman Sachs in 1986 as Vice President of the investment banking division and as one of the founders of Goldman Sachs' Financial Institutions business. He became a Partner and Managing Director in 1996, responsible for Advisory, Principal Investing and Merchant Banking for financial institutions. In 1999, he was named head of the firm's Strategy and Corporate Development Group, and in 2001 he assumed additional responsibility as head of Firm Wide Strategy. Mr. Berlinski also served as a member of the Operating Committee and Compensation Committee. Mr. Berlinski also served as Global Head of the Financial Sponsors Group from 2005 until 2012 and was a founding member of the Financial Institutions Group. Mr. Berlinski is a founding partner of the Aruba Growth Fund, a private equity fund funded by and invested in local companies and institutions in Aruba. Mr. Berlinski received a Master of Business Administration in finance from The Wharton School of Finance at the University of Pennsylvania and a Bachelor of Arts in engineering from California State University. Mr. Berlinski's qualifications to serve on our board of directors include his extensive background in the investment management industry, business development, corporate strategy and international finance, as well as his substantial board experience (both public and private). In addition, he brings experience relating to operations and compensation matters having served as a member of Goldman Sachs Operating and Compensation Committees for several years.
Alex Binderow joined our board of directors at the time of our acquisition from KeyCorp in August 2013. Mr. Binderow joined Crestview in 2005. At Crestview, Mr. Binderow is a partner and a leader on the financial services team, specializing in asset and wealth management investments. Prior to joining Crestview, he worked at Bear, Stearns & Co. in the company's acquisition finance group on a range of assignments, which included leveraged buyouts, strategic refinancings and M&A financings across various industries. Mr. Binderow is currently a director of certain Crestview portfolio companies and previously served on the board of directors of Munder, a registered investment company, until the Munder Acquisition. Mr. Binderow received his Bachelor of Business Administration, with high distinction, from Emory University's Goizueta Business School with majors in finance and organization & management. Mr. Binderow's qualifications to serve on our board of directors include his in-depth knowledge and experience in mergers and acquisitions, investing, leveraged finance, capital markets and asset management.
Lawrence Davanzo joined our board of directors in October 2014. Mr. Davanzo most recently served as President of Wilshire Associates Incorporated, overseeing the asset management areas of the firm, and as Vice Chairman of the board of directors of Wilshire and on its executive committee until his retirement in 2012. He first joined Wilshire in 1978 and rejoined in October 2004. During his tenure at Wilshire, he founded Wilshire's Pension Consulting business and built the firm's Funds Management Group. With over $70 billion in AUM for financial intermediaries, Funds Management became the firm's primary source of revenue growth. He also served as President of the firm's mutual fund complexes. During Mr. Davanzo's career, he also founded Asset Strategy Consulting and served as its managing director from February 1991 to February 2000. Mr. Davanzo earned both his Master of Finance and Bachelor of Arts degrees at the University of Wisconsin-Madison. Mr. Davanzo's qualifications to serve on our board of directors include the knowledge and experience gained in the combination of more than 40 years of asset management experience through his extensive career at Wilshire Associates and also managing and running his own investment consulting firm. This allows him to bring to the board of directors a deep understanding of issues associated with operating a business and the importance of client service and customer satisfaction unique to the asset management business.
137
Richard M. DeMartini joined our board of directors at the time of our acquisition from KeyCorp in August 2013. Mr. DeMartini joined Crestview as a partner in 2005. He leads Crestview's financial services strategy. Prior to Crestview, Mr. DeMartini served as President of the Bank of America Asset Management Group from March 2001 until December 2004. At Bank of America, Mr. DeMartini was responsible for all wealth and asset management activities and oversaw approximately $400 billion in AUM. He was also a member of Bank of America's operating committee. Prior to working at Bank of America, Mr. DeMartini served as Chairman and Chief Executive Officer of the international private client group at Morgan Stanley Dean Witter. His 26-year career at Morgan Stanley included roles as President of individual asset management, Co-President of Dean Witter & Company, Inc. and Chairman of Discover Card. He was also a member of the Morgan Stanley management committee. He also currently serves as a director of Partners Capital and as a trustee and President of the Whitney Museum of American Art. Mr. DeMartini has served as Chairman of the board of directors of the NASDAQ Stock Market, Vice Chairman of the board of directors of the National Association of Securities Dealers, Inc. and a director of Capital Bank Financial Corp. Mr. DeMartini received a Bachelor of Arts from San Diego State University. Mr. DeMartini's qualifications to serve on our board of directors include his in-depth knowledge and operating experience in financial services, particularly in the asset and wealth management sectors, having held senior executive positions at major institutions. In addition, Mr. DeMartini has significant experience as a director on the boards of public and private companies. He provides the board of directors with a valuable perspective on global investment management and capital markets and has extensive experience in assessing value, strategy and risks related to potential acquisitions.
James B. Hawkes joined our board of directors at the time of our acquisition from KeyCorp in August 2013. Mr. Hawkes also serves as Chairman Emeritus of Eaton Vance. In his 37-year career at Eaton Vance, Mr. Hawkes served in numerous senior executive roles, including Chairman, President and Chief Executive Officer, Chief Investment Officer and Director of Investment Research. Mr. Hawkes also serves on the board of managers of Central Park Group, an alternative investment advisory firm, and on other private company boards. He is a trustee of the Peabody Essex Museum and Winterthur Museum. Mr. Hawkes earned a Master of Business Administration from Harvard Business School and a Bachelor of Science in aerospace engineering from the University of Oklahoma. He also earned the Chartered Financial Analyst designation. Mr. Hawkes' qualifications to serve on our board of directors include his extensive business, finance, investment and leadership skills gained and developed through years of experience in the numerous senior executive roles held during his 37-year career at Eaton Vance. In particular, as former Chief Executive Officer of Eaton Vance, Mr. Hawkes has substantial experience managing and leading a firm in the financial services industry. These skills, combined with Mr. Hawkes' extensive knowledge of our business and our industry, enable him to provide valuable insights to our board of directors on our strategic direction.
Karin Hirtler-Garvey joined our board of directors in October 2014. Ms. Hirtler-Garvey has over nine years of experience as a board director in diversified industries and over 25 years of leadership experience in the financial services industry, preceded by eight years in public accounting as a CPA licensed in New Jersey. She commenced her board services in 2005 as a director at ARO Liquidation, Inc. (formerly Aeropostale, Inc.), where she currently serves as Chairman of the board of directors (previously the Lead Independent Director and Audit Committee Chair). Ms. Hirtler-Garvey is also a director at Medley Capital Corporation, where she serves as the Compensation Committee Chair and a member of the Audit Committee and the Nominating and Governance Committee, USAA Federal Savings Bank, where she serves as the Risk Committee Chair and a member of the Audit and Compensation Committees, Validus Holdings, Ltd., where she serves as a member of the Audit and Risk Committee, and Western World Insurance Company, where she serves as the Audit Committee Chair. Ms. Hirtler-Garvey also serves on other private company boards, including the audit and risk committees of such boards. Previously, Ms. Hirtler-Garvey served as a director and Audit Committee Chair at Residential Capital LLC. Ms. Hirtler-Garvey was previously Chief Risk Officer at Ally
138
Financial (formerly GMAC) and held a broad range of leadership positions at Bank of America and its predecessor NationsBank and a broad range of mid-level assignments at J.P. Morgan in both the finance and risk groups. Prior to this, she worked for eight years at Ernst & Young LLP with a focus on banking, insurance, garment industry and technology clients. Ms. Hirtler-Garvey earned a Bachelor of Science from Fairleigh Dickinson University and is a Certified Public Accountant. Ms. Hirtler-Garvey brings executive experience from large national and international, diversified financial services companies providing traditional banking, real estate, insurance and asset management services and through her service on other public company boards. Ms. Hirtler-Garvey provides our board of directors with unique insight and perspective to its oversight of our global operations, corporate governance and risk management. She qualifies as an audit committee financial expert under the rules and regulations of the SEC.
Robert J. Hurst joined our board of directors in October 2016. Mr. Hurst joined Crestview in 2005 and is Vice Chairman of Crestview and a member of its investment committee. He retired as Vice Chairman of Goldman Sachs in June 2004. At Goldman Sachs, Mr. Hurst spent 30 years in a variety of leadership positions, including head of the investment banking division from 1990 to 1999. Following Goldman Sachs' initial public offering, Mr. Hurst became Vice Chairman and a member of the board of directors and focused on firm-wide matters in addition to having client responsibilities. He is currently a director of VF Corporation and has served on the board of directors of six other public companies. He has been active in the nonprofit sector and currently serves as Chairman of the board of directors of the Aspen Music Festival and School, Chairman of the National Cybersecurity Center, former Chairman of the board of directors and currently Chairman of the executive committee of the Whitney Museum of American Art, a trustee and member of the executive committee of The Aspen Institute, Chairman emeritus of the Jewish Museum and a former member of the board of overseers of The Wharton School. He is a member of the Council on Foreign Relations. Mr. Hurst was also founding Chief Executive Officer of the 9/11 United Services Group, the coordinating arm for 13 social service agencies involved in relief activities, including the Red Cross. Mr. Hurst received a Master of Business Administration from The Wharton School at the University of Pennsylvania and a Bachelor of Arts from Clark University. He also did additional graduate work as a Public Finance Fellow at the University of Pennsylvania. Mr. Hurst's qualifications to serve on our board of directors include his 30 years of operating and leadership experience at Goldman Sachs and as a partner in a private equity firm. Through his involvement with Crestview, he has provided leadership to both public and private companies. Mr. Hurst brings to our board of directors extensive experience in the financial services industry, finance and business development.
Alan H. Rappaport joined our board of directors at the time of our acquisition from KeyCorp in August 2013. Mr. Rappaport was formerly the Chairman and President of Bank of America's Private Bank as well as managing director of Chase Investment Advisors and a member of the management committee of Chase Global Private Bank. Prior to Bank of America, Mr. Rappaport served as a Managing Director of the Chase Global Private Bank and a Partner of the Beacon Group. Mr. Rappaport also spent 17 years with CIBC Oppenheimer, where he was the senior executive responsible for the Asset Management Division. Mr. Rappaport serves as an adjunct professor of finance at New York University's Stern School of Business and a lecturer at Stanford University's Graduate School of Business. Previously, Mr. Rappaport had served as Chairman of the Board of Trustees of GuideStar, trustee of NYU Langone Medical Center, trustee of the American Museum of Natural History and national co-chair of the Duke University Parents Committee. He is currently a member of the Council on Foreign Relations, an advisory director of Roundtable Investment Partners, and serves on the boards of directors of PIMCO multifund complex and Allianz multifund complex. Mr. Rappaport earned a Master of Business Administration from Stanford University and a Bachelor of Arts from Harvard University. Mr. Rappaport's qualifications to serve on our board of directors include the knowledge, leadership and experience gained in over 40 years of working in the investment management business of a large global, complex asset management organization, including serving as
139
Chairman and President of Bank of America's Private Bank. Mr. Rappaport's leadership and experience in academia provide our board of directors with a unique perspective and in-depth understanding of issues concerning international finance, economics and public policy.
Section 16(a) Beneficial Ownership Reporting Compliance
Section 16(a) of the Exchange Act and regulations of the SEC require our directors, executive officers and, with certain exceptions, persons who own more than 10% of a registered class of our equity securities, as well as certain affiliates of such persons, to file with the SEC reports of ownership of, and transactions in, such equity securities. These reporting persons are further required to provide us with copies of these reports. During the fiscal year ended December 31, 2017, we did not have a registered class of equity securities. As a result, none of our directors, officers or other affiliates persons were subject to Section 16 of the Exchange Act during such year.
Code of Business Conduct and Ethics
We have adopted a code of business conduct and ethics that applies to all of our employees, officers and directors, including those officers responsible for financial reporting. The code of business conduct and ethics is available under the Investor Relations link on our website at www.vcm.com. Any amendments to the code, or any waivers of its requirements, will be disclosed on our website.
Audit Committee
We have an Audit Committee that is responsible for, among other things, assisting the board of directors in reviewing: our financial reporting and other internal control processes; our financial statements; the independent auditors' qualifications, independence and compensation; the performance of our internal audit function and independent auditors; and our compliance with legal and regulatory requirements and our Code of Business Conduct and Ethics.
The Audit Committee consists of Karin Hirtler-Garvey (Chair), Lawrence Davanzo and Alan H. Rappaport. Our board of directors has affirmatively determined that each of Karin Hirtler-Garvey, Lawrence Davanzo and Alan H. Rappaport meet the definition of "independent director" for purposes of serving on an audit committee under Rule 10A-3 and the NASDAQ rules. Karin Hirtler-Garvey has been identified as an "audit committee financial expert" as that term is defined in the rules and regulations of the SEC. The Audit Committee has adopted a written charter that, among other things, specifies the scope of its rights and responsibilities and satisfies the applicable standards of the SEC and NASDAQ. The charter of the Audit Committee is available under the Investor Relations link on our website at www.vcm.com.
Item 11. Executive Compensation.
Compensation of our Named Executive Officers
The following table sets forth information regarding the compensation awarded to, earned by or paid to certain of our executive officers during the fiscal year ended December 31, 2017. As an emerging growth company, we have chosen to comply with the executive compensation disclosure rules applicable to "smaller reporting companies" as such term is defined in the rules promulgated under the Securities Act, which require compensation disclosure for our principal executive officer and our next two most highly compensated executive officers. Throughout this report, these three officers are referred to as our "named executive officers."
The compensation reported in this Summary Compensation Table below is not necessarily indicative of how we will compensate our named executive officers in the future. We expect that we will continue to review, evaluate and modify our compensation framework as a result of becoming a
140
publicly traded company and our compensation program following the completion of the IPO could vary significantly from our historical practices.
Name and Principal Position
|
Year | Salary ($) |
Bonus ($)(1) |
Stock Awards ($)(5) |
Option Awards ($)(2) |
Nonqualified Deferred Compensation Earnings ($)(3) |
All Other Compensation ($)(4) |
Total ($) |
|||||||||||||||||
|---|---|---|---|---|---|---|---|---|---|---|---|---|---|---|---|---|---|---|---|---|---|---|---|---|---|
David C. Brown |
2017 | 600,000 | 3,684,135 | 3,000,000 | 113,970 | — | 460,776 | 7,858,881 | |||||||||||||||||
Chief Executive Officer and Chairman |
|||||||||||||||||||||||||
Michael D. Policarpo |
2017 | 375,000 | 830,979 | 1,700,000 | 410,293 | — | 272,612 | 3,588,884 | |||||||||||||||||
Chief Operating Officer |
|||||||||||||||||||||||||
Kelly S. Cliff |
2017 | 425,000 | 914,978 | 1,850,000 | 615,439 | — | 212,152 | 4,017,569 | |||||||||||||||||
President, Investment Franchises |
|||||||||||||||||||||||||
- (1)
- The
amounts reported as earned in this column represent the bonuses earned with respect to 2017 by each executive pursuant to our annual bonus plan. These amounts
were paid in 2017. For additional information, please see "—Summary Compensation Table—Narrative to Summary Compensation Table—Annual Bonus Plan" below.
- (2)
- Represents
the aggregate grant date fair value of options granted to our named executive officers in 2017, equal to $113,970 for Mr. Brown, $410,293 for
Mr. Policarpo and $615,439 for Mr. Cliff. With respect to time-vesting options, the grant date fair value was determined using a Black-Scholes option-pricing model, and with respect to
performance-vesting options, the grant date fair value was determined based on the probable outcome of the performance conditions as of the grant date. For additional information with respect to
options granted during 2017, including a discussion of the assumptions made in valuation, see note 13 to our consolidated financial statements included elsewhere in this report. The amounts
above reflect our aggregate accounting expense for these awards and do not necessarily correspond to the actual value that will be recognized by our named executive officers, which depends on the
market value of our Class B common stock on a date in the future.
- (3)
- Our
named executive officers had no above-market or preferential earnings on deferred compensation during 2017.
- (4)
- The
amounts reported as earned by each named executive officer in this column represent employer matching contributions made to Messrs. Brown, Policarpo and
Cliff of $16,200, $16,200 and $15,369, respectively, under our 401(k) plan during 2017, as well as employer matching contributions made to Messrs. Brown, Policarpo and Cliff of $163,800,
$144,024 and $124,603, respectively, under our nonqualified deferred compensation plan. Amounts reported also include dividend payments in respect of outstanding equity-based awards of $280,776,
$112,388 and $72,180 for Messrs. Brown, Policarpo and Cliff, respectively.
- (5)
- Represents the aggregate grant date fair value of the shares of restricted stock granted to our named executive officers in 2017. With respect to performance-vesting shares of restricted stock, the grant date fair value was determined based on the probable outcome of the performance conditions as of the grant date. For additional information with respect to shares of restricted stock granted during 2017, including a discussion of the assumptions made in valuation, see note 13 to our consolidated financial statements included elsewhere in this report. The amounts above reflect our aggregate accounting expense for these awards and do not necessarily correspond to the actual value that will be recognized by our named executive officers, which depends on the market value of our Class B common stock on a date in the future.
141
Narrative to Summary Compensation Table
Certain of the compensation paid to our named executive officers reflected in the Summary Compensation Table was provided pursuant to the agreements, plans and programs which are summarized below. For a discussion of the severance pay and other benefits to be provided to our named executive officers in connection with a termination of employment and/or a change in control, please see "—Potential Payments Upon Termination or Change in Control" below.
Employment Agreement with David C. Brown. We have entered into an employment agreement with Mr. Brown, dated August 5, 2014, pursuant to which he serves as the Chief Executive Officer of VCM and as a director on our board of directors (of which he is currently the Chairman). The employment agreement provided for an initial term ending July 31, 2017, with automatic one-year extensions thereafter. On July 31, 2017, the term of the agreement was automatically extended to July 31, 2018. Pursuant to his employment agreement, Mr. Brown is entitled to an annual base salary of $600,000 and an annual cash bonus of $600,000 (payable quarterly). In addition, Mr. Brown is eligible for an additional incentive award based on the achievement of specified performance criteria as determined by our board of directors, as described further under "—Summary Compensation Table—Narrative to Summary Compensation Table—Annual Bonus Plan" below. The 2014 employment agreement provides that Mr. Brown's additional incentive award will have an annual target of $1,200,000 and will be payable 50% in cash and 50% in fully-vested equity. However, for 2017, we and Mr. Brown agreed that the additional incentive award would be determined by our Compensation Committee in its sole discretion after considering market competitiveness, Company performance factors and individual performance (including in connection with the IPO) and without regard to the target or form of payment provisions set forth in the 2014 employment agreement. For a discussion of Mr. Brown's severance entitlements pursuant to his 2014 employment agreement, see "—Potential Payments Upon Termination or Change in Control" below.
In connection with the IPO, we entered into a new employment agreement with Mr. Brown, dated March 20, 2017, which took effect as of February 12, 2018 and supersedes Mr. Brown's 2014 employment agreement. The terms of Mr. Brown's 2017 employment agreement are substantially similar to those of his 2014 employment agreement, except that his 2017 employment agreement provides that he will serve as our Chief Executive Officer and Chairman for an indefinite term, that his target annual incentive award will be determined by our board of directors and Compensation Committee and be payable partly in cash and partly in fully-vested equity, that the severance benefits payable in the event of a termination without "cause" or for "good reason" (each as defined in the 2017 employment agreement) that are tied to the base salary, annual bonus and annual incentive award will be two times the average for the previous two years (as opposed to two times the previous year total), and that Mr. Brown will receive an additional pro-rated annual bonus in the event of a termination due to his death or "disability" (as defined in the 2017 employment agreement). In addition, Mr. Brown's 2017 employment agreement provides that, upon a "change in control" (as defined in the 2017 employment agreement), only unvested equity awards granted prior to March 11, 2017 will be accelerated. For a discussion of Mr. Brown's severance entitlements pursuant to his 2014 employment agreement, see "—Potential Payments Upon Termination or Change in Control" below.
Annual Bonus Plan. Certain employees, including our named executive officers, are eligible to participate in the Victory Capital Holdings, Inc. Bonus Plan, pursuant to which participants are eligible to earn a bonus with respect to each fiscal year, typically paid in the first calendar quarter of the subsequent calendar year for which the bonus is earned, subject to the participant remaining employed with us through the payment date. Individual awards may be discretionary or earned based on individual, Company or other performance criteria determined by our Compensation Committee. 2017 annual bonuses for our named executive officers, which were paid in 2017, were determined at the discretion of the Compensation Committee after consideration of both Company and individual performance (including in connection with this offering), and in the case of Messrs. Policarpo and Cliff,
142
recommendations from Mr. Brown. For 2017, Messrs. Policarpo and Cliff were eligible to earn target bonuses equal to $750,000 and $1,000,000, respectively, and were awarded actual bonuses of $830,979 and $914,978, respectively. In addition, Mr. Brown was awarded an actual bonus of $3,684,135. Mr. Brown did not have a target bonus for 2017, and the Compensation Committee determined the amount of his bonus after considering market competitiveness, Company performance factors and individual performance (including in connection with this offering). None of our named executive officers received any annual bonus amounts that were payable in shares of our Class B common stock. For each fiscal year, such pool, unless otherwise determined by our board of directors or Compensation Committee in accordance with the plan, will be equal to 35% of pre-bonus EBITDA, of which 30% is payable in cash and 5% is payable in shares of our Class B common stock, subject to the discretion of our board of directors to adjust such bonus pool based on extraordinary events, non-cash GAAP charges or transactions. For this purpose, and subject to additional adjustments as may be determined by our board of directors in its discretion, pre-bonus EBITDA is generally calculated using our Adjusted EBITDA, to which we add back pre-IPO governance expenses, director fees, and board-related expenses, and from which we deduct compensation in excess of expected levels due to acquisitions and lease amortization costs, to arrive at Management reported EBITDA. We then add back our incentive compensation expense to Management reported EBITDA to arrive at pre-bonus EBITDA. See "Management's Discussion and Analysis of Financial Condition and Results of Operations—Supplemental Non-GAAP Financial Information" for a discussion of how Adjusted EBITDA is calculated and a reconciliation of net income to Adjusted EBITDA. For 2017, the pool payable in cash exceeded 30% of our pre-bonus EBITDA on account of special, one-time bonuses awarded in connection with the IPO.
Stock Plans. We currently provide grants of equity-based awards to eligible service providers under the Victory Capital Holdings, Inc. Equity Incentive Plan, or the 2013 Plan. In 2017, we granted options to members of our management team, including to each of our named executive officers, under the 2013 Plan. For a summary of the principal features of the 2013 Plan, see "—Additional Incentive Compensation Plans and Awards—Equity Incentive Plans" below. Historically, the options granted to our named executive officers have consisted of 60% options subject to time-vesting conditions, or time-vesting options, which vest over a period of four years, 25% per year, beginning on the first anniversary of the applicable grant date, and 40% options subject to performance-vesting conditions, or performance-vesting options, which are earned based on level of achievement of the following performance goals prior to the applicable expiration date:
For performance-vesting options granted to our named executive officers in March 2017:
| |
|
Performance/Vesting Levels ($) |
|||||||||||
|---|---|---|---|---|---|---|---|---|---|---|---|---|---|
Performance Goal
|
Weighting | 50% Vesting |
75% Vesting |
100% Vesting |
|||||||||
Management reported EBITDA (in millions)(1) |
45 | % | 134.0 | 155.0 | 165.0 | ||||||||
Revenue (in millions) |
35 | % | 385.0 | 400.0 | 435.0 | ||||||||
AUM (in billions) |
20 | % | 57.0 | — | (2) | 61.0 | |||||||
- (1)
- See
above in "—Annual Bonus Plan" for a description of how Management reported EBITDA is calculated.
- (2)
- There is no 75% performance/vesting level specified for the AUM performance goal.
143
For all other performance-vesting options granted to our named executive officers:
| |
|
Performance/Vesting Levels ($) |
||||||||||
|---|---|---|---|---|---|---|---|---|---|---|---|---|
Performance Goal
|
Weighting | 50% Vesting(2) |
75% Vesting |
100% Vesting |
||||||||
Management reported EBITDA (in millions)(1) |
45 | % | Vested | 134.0 | 155.0 | |||||||
Revenue (in millions) |
35 | % | Vested | 385.0 | 400.0 | |||||||
AUM (in billions) |
20 | % | Vested | 54.0 | 57.0 | |||||||
- (1)
- See
above in "—Annual Bonus Plan" for a description of how Management reported EBITDA is calculated.
- (2)
- 50% of the performance-vesting options were vested in connection with the Munder Acquisition and/or the RS Acquisition.
Vesting of performance-vesting options is determined on an absolute basis and is not determined by interpolation for performance between achievement levels. Time-vesting options and performance-vesting options are subject to additional vesting in connection with certain terminations of employment and/or a change in control, as discussed under "—Potential Payments Upon Termination or Change in Control" below.
In 2017, we granted restricted shares to each of our named executive officers under the 2013 Plan. In connection with the first such grant, Messrs. Brown, Policarpo and Cliff received 222,045, 111,022 and 111,022 restricted shares, respectively. The restricted share grants were made to each of our named executive officers on March 31, 2017 and consisted 50% of restricted shares subject to time-vesting conditions, or time-vested restricted shares, which vest 100% on March 31, 2020, and 50% of restricted shares subject to performance-vesting conditions, or performance-vested restricted shares. These performance-vested shares are earned based on achievement of share price targets as follows: one-third of the performance-vested restricted shares will vest when the fair market value of a share equals or exceeds $19.98; one-third of the performance-vested restricted shares will vest when the fair market value of a share equals or exceeds $22.84; and one-third of the performance-vested restricted shares will vest when the fair market value of a share equals or exceeds $25.69. We made an additional grant of restricted shares to each of our named executive officers on January 1, 2018, under the 2013 Plan. In connection with such grant, Messrs. Brown, Policarpo and Cliff received 613,179, 350,388 and 297,829 restricted shares, respectively. Such grant consisted 50% of time-vested restricted shares, which will vest 50% on January 1, 2021, 25% on January 1, 2022 and 25% on January 1, 2023, and 50% of performance-vested restricted shares, which will be earned based on the share price performance criteria described above. Except as may otherwise be provided in an employment agreement, as discussed under "—Potential Payments Upon Termination or Change in Control" below, the restricted shares granted in 2017, or the 2017 restricted shares, are not subject to accelerated vesting upon a change in control and will generally be forfeited upon a termination of employment for any reason prior to vesting.
In connection with the IPO, our board of directors adopted, and our stockholders approved, the Victory Capital Holdings, Inc. 2018 Stock Incentive Plan, or the 2018 Plan, and the Victory Capital Holdings, Inc. 2018 Employee Stock Purchase Plan, or the 2018 ESPP, each of which became effective upon the completion of the IPO. For summaries of the 2018 Plan and the 2018 ESPP, see "—Additional Incentive Compensation Plans and Awards—Equity Incentive Plans" below.
Health and Welfare Plans. Our named executive officers are eligible to participate in the employee benefit plans that we offer to our employees generally, including medical, dental, vision, life and accidental death and dismemberment, disability, supplemental life, a health savings account, health and
144
dependent care flexible spending accounts, critical illness and accident benefit plans, as well as commuter benefits and health and wellness rewards.
Nonqualified Deferred Compensation Plan. Messrs. Brown, Policarpo and Cliff currently participate in the Victory Capital Management Inc. Deferred Compensation Plan, or the NQDC Plan, a nonqualified deferred compensation plan maintained by us primarily for the benefit of a select group of management or highly compensated employees. Pursuant to the NQDC Plan, participants may elect to defer up to 100% of their base compensation and cash incentive compensation. In addition, we currently provide a matching contribution equal to 100% of a participant's deferral contribution, up to a maximum of the lesser of 6% of compensation in excess of the Internal Revenue Code Section 401(a)(17) limit for the applicable year or $3,000,000 per year. We may also elect to provide discretionary contributions pursuant to the NQDC Plan. Deferred amounts and employer contributions are contributed to individual accounts in the NQDC Plan trust, and participants self-direct the notional investment of deferred contribution accounts in various investment funds. A participant is 100% vested in his deferral contributions when contributed, and will become 100% vested in our matching contributions and discretionary contributions after three years of continuous service. The vested balance of a participant's account may be distributed in a lump sum, in five equal installments or in another approved form upon a participant's death, disability, separation from service (including retirement), a change in control event, or on a time or fixed schedule, in each case, as elected by the participant in accordance with the terms of the NQDC Plan. As of January 11, 2018, Messrs. Brown, Policarpo and Cliff were fully vested in their NQDC account balances. For a summary of the treatment of named executive officers' account balances under the NQDC Plan in connection with certain terminations of employment and/or a change in control, see "—Potential Payments Upon Termination or Change in Control" below.
401(k) Plan. We sponsor a retirement plan intended to qualify for favorable tax treatment under Section 401(a) of the Internal Revenue Code, containing a cash or deferred feature that is intended to meet the requirements of Section 401(k) of the Internal Revenue Code. Full-time employees, other than nonresident aliens and leased employees, who are paid from our U.S. payroll are generally eligible to participate in the plan. Participants may make pre-tax contributions to the plan from their eligible earnings up to the statutorily prescribed annual limit on pre-tax contributions under the Internal Revenue Code. Participants who are 50 years of age or older may contribute additional amounts based on the statutory limits for catch-up contributions. All employee and employer contributions are allocated to each participant's individual account and are then invested in selected investment alternatives according to the participant's directions. Pre-tax contributions by participants and contributions that we make to the plan and the income earned on those contributions are generally not taxable to participants until withdrawn, and all contributions are generally deductible by us when made. Participant contributions are held in trust as required by law. No minimum benefit is provided under the plan. An employee is 100% vested in his pre-tax deferrals and any employer contributions when contributed. The plan provides for an employer matching contribution for employees who have completed at least one year of service equal to 100% of a participant's 401(k) contributions, up to 6% of the participant's compensation, as well as discretionary profit sharing contributions.
145
Outstanding Equity Awards at Fiscal Year End
The following table sets forth outstanding equity awards to acquire shares of our Class B common stock held by each of our named executive officers as of December 31, 2017.
| |
|
Option Awards | Stock Awards | ||||||||||||||||||||||||||||
|---|---|---|---|---|---|---|---|---|---|---|---|---|---|---|---|---|---|---|---|---|---|---|---|---|---|---|---|---|---|---|---|
Name
|
Grant Date |
Number of Securities Underlying Unexercised Options Exercisable (#) |
Number of Securities Underlying Unexercised Options Unexercisable (#)(1)(5) |
Equity Incentive Plan Awards: Number of Securities Underlying Unexercised Unearned Options (#)(2)(5) |
Option Exercise Price ($)(6) |
Option Expiration Date |
Number of Shares or Units of Stock That Have Not Vested (#)(3)(5) |
Market Value of Shares Or Units of Stock That Have Not Vested ($)(4) |
Equity Incentive Plan Awards: Number of Unearned Shares or Units of Stock That Have Not Vested (#)(3)(5) |
Equity Incentive Plan Awards: Market or Payout Value of Unearned Shares or Units of Stock That Have Not Vested ($)(4) |
|||||||||||||||||||||
David C. Brown |
7/31/2013 | 367,782 | 0 | 17,330 | $ | 2.45 | 7/31/2023 | — | $ | — | — | $ | — | ||||||||||||||||||
|
2/5/2014 | 70,515 | 13,139 | 3,941 | $ | 2.45 | 2/5/2024 | — | $ | — | — | $ | — | ||||||||||||||||||
|
12/17/2014 | 32,739 | 6,100 | 1,830 | $ | 4.73 | 12/17/2024 | — | $ | — | — | $ | — | ||||||||||||||||||
|
3/11/2016 | 31,225 | 27,824 | 2,782 | $ | 7.52 | 3/11/2026 | — | $ | — | — | $ | — | ||||||||||||||||||
|
4/15/2016 | 130,107 | 115,937 | 11,593 | $ | 7.52 | 4/15/2026 | — | $ | — | — | $ | — | ||||||||||||||||||
|
3/10/2017 | 5,088 | 11,102 | 2,312 | $ | 13.52 | 3/10/2027 | — | $ | — | — | $ | — | ||||||||||||||||||
|
3/31/2017 | 0 | 0 | 0 | $ | — | — | 111,022 | $ | 1,584,284 | 111,022 | $ | 1,584,284 | ||||||||||||||||||
Michael D Policarpo |
7/31/2013 | 171,631 | 0 | 8,087 | $ | 2.45 | 7/31/2023 | — | $ | — | — | $ | — | ||||||||||||||||||
|
2/5/2014 | 29,616 | 5,518 | 1,655 | $ | 2.45 | 2/5/2024 | — | $ | — | — | $ | — | ||||||||||||||||||
|
12/17/2014 | 25,184 | 4,692 | 1,407 | $ | 4.73 | 12/17/2024 | — | $ | — | — | $ | — | ||||||||||||||||||
|
3/11/2016 | 23,419 | 20,868 | 2,086 | $ | 7.52 | 3/11/2026 | — | $ | — | — | $ | — | ||||||||||||||||||
|
4/15/2016 | 78,064 | 69,562 | 6,956 | $ | 7.52 | 4/15/2026 | — | $ | — | — | $ | — | ||||||||||||||||||
|
3/10/2017 | 18,318 | 39,968 | 8,326 | $ | 13.52 | 3/10/2027 | 14,803 | $ | 211,238 | — | $ | — | ||||||||||||||||||
|
3/31/2017 | 0 | 0 | 0 | $ | — | — | 55,511 | $ | 792,143 | 55,511 | $ | 792,143 | ||||||||||||||||||
Kelly S. Cliff |
9/8/2014 | 60,441 | 11,262 | 3,378 | $ | 4.73 | 9/8/2024 | 4,692 | $ | 66,964 | — | $ | — | ||||||||||||||||||
|
10/29/2015 | 16,393 | 7,508 | 1,126 | $ | 5.81 | 10/29/2025 | — | $ | — | — | $ | — | ||||||||||||||||||
|
3/11/2016 | 9,107 | 8,115 | 811 | $ | 7.52 | 3/11/2026 | — | $ | — | — | $ | — | ||||||||||||||||||
|
4/15/2016 | 104,085 | 92,749 | 9,274 | $ | 7.52 | 4/15/2026 | — | $ | — | — | $ | — | ||||||||||||||||||
|
3/10/2017 | 27,478 | 59,952 | 12,490 | $ | 13.52 | 3/10/2027 | 25,905 | $ | 369,665 | — | $ | — | ||||||||||||||||||
|
3/31/2017 | 0 | 0 | 0 | $ | — | — | 55,511 | $ | 792,143 | 55,511 | $ | 792,143 | ||||||||||||||||||
- (1)
- Time-vesting
options vest 25% on each of the first four anniversaries of the grant date.
- (2)
- Performance-vesting
options are reported at the target number of shares and vest based on the level of achievement of the certain performance goals prior to the
applicable expiration date, as discussed under "—Summary Compensation Table—Narrative to Summary Compensation Table—Equity Plans" above.
- (3)
- Restricted
shares granted on March 31, 2017 vest 50% based on continued employment through March 31, 2020 and 50% when the value of a share of our
Class B common stock first exceeds certain thresholds, subject to continued employment through the date on which such thresholds are exceeded. All other restricted shares vest 25% on each of
the first four anniversaries of the grant date.
- (4)
- Values
determined based on the fair market value of our Class B common stock on December 31, 2017, which was determined to be $14.27 per share by our
board of directors as of such date based on an independent valuation.
- (5)
- Time-vesting
options, performance-vesting options and certain restricted shares are subject to additional vesting upon a termination of employment due to death or
"disability," by us without "cause" or by the named executive officer without "good reason" (each such term, as defined in the 2013 Plan), as discussed under "—Potential Payments Upon
Termination or Change in Control" below.
- (6)
- Options were adjusted in February 2017 due to declaration and payment of a special dividend to our stockholders. Amounts shown in the above table are post-adjustment.
Potential Payments Upon Termination or Change in Control
The following summaries describe the potential payments and benefits that we would provide to our named executive officers in connection with a termination of employment and/or a change in control.
We have entered into an employment agreement with Mr. Brown, which provides for certain payments to be made in connection with certain terminations of employment and/or a change in control. In addition, Messrs. Policarpo and Cliff are eligible to receive severance pursuant to our severance plan in connection with certain terminations of employment. Our named executive officers are also entitled to additional vesting of options and restricted shares pursuant to the terms of the 2013 Plan and their award agreements, as well as to distributions pursuant to the NQDC Plan, in connection with certain terminations of employment.
146
Employment Agreement with David C. Brown. Mr. Brown's 2014 employment agreement provides that if his employment is terminated by us without "cause" or by him for "good reason," each as defined in the 2014 employment agreement, subject to his execution of a release of claims, he will be entitled to severance benefits consisting of: (i) an amount equal to two times the sum of the base salary, the annual cash bonus and the annual incentive award earned in the year prior to the year of termination, payable in eight quarterly installments beginning within 30 days of the termination date; (ii) continuation of all medical benefits for up to 18 months following termination or an amount equal to the cost of such benefits; and (iii) a payment in respect of accrued but unused vacation and sick days. The 2014 employment agreement also provides that, in the event of a "change in control," as defined in the 2014 employment agreement, Mr. Brown will be entitled to accelerated vesting of all then-outstanding equity awards, and that in the event of a termination of employment by us without "cause" within 90 days prior to a "change in control," Mr. Brown will be entitled to accelerated vesting of all equity awards that would have vested as of the date of the change in control but for the termination (or the economic equivalent of such accelerated vesting). Following completion of the IPO, such severance payments will be subject to a modified cutback provision which acts to reduce the amounts payable to Mr. Brown to the extent necessary so that no excise tax would be imposed pursuant to Section 280G of the Internal Revenue Code, but only if doing so would result in Mr. Brown retaining a larger after-tax amount. In the event of a termination of Mr. Brown's employment due to death or "disability," as defined in the 2014 employment agreement, he will be entitled to (i) a payment in respect of accrued but unused vacation and sick days and, (ii) for terminations due to disability, continuation of all medical benefits at no cost for up to 18 months following termination or an amount equal to the cost of such benefits. The 2014 employment agreement subjects Mr. Brown to confidentiality restrictions that apply while he is employed with us and indefinitely thereafter, to an inventions assignment commitment, to a non-compete restriction that applies during his employment with us and for one year thereafter, and to a non-solicitation restriction with respect to our customers and employees that applies during his employment with us and for two years thereafter. In connection with the IPO, we have entered into a new employment agreement with Mr. Brown, which took effect on February 12, 2018, as discussed under "—Summary Compensation Table—Narrative to Summary Compensation Table—Employment Agreement with David C. Brown" above.
Victory Capital Management Inc. Severance Pay Plan. Messrs. Policarpo and Cliff are participants in the Victory Capital Management Inc. Severance Pay Plan, or the Severance Plan. Pursuant to the Severance Plan, in the event that a participant is terminated involuntarily without "cause," as defined in the Severance Plan, as part of a restructuring or reduction in force, subject to the execution of a release of claims, the participant will receive a severance payment that will be determined by the plan administrator (currently, Mr. Brown) in accordance with the following guidelines:
Benefit Type
|
Severance Formula | Maximum Payout(2) |
||
|---|---|---|---|---|
Basic Benefit |
Two weeks of pay for each full year of continuous service. | 30 weeks of pay | ||
Enhanced Benefit(1) |
Four weeks of pay for each full year of continuous service. | 52 weeks of pay |
- (1)
- For
Chief Investment Officers, members of senior management and other designated participants. Messrs. Policarpo and Cliff would each be entitled to receive
the enhanced benefit.
- (2)
- Subject to an additional limitation that the maximum payout may not exceed two times the lesser of (i) the Internal Revenue Code Section 401(a)(17) limit for the applicable
147
year or (ii) the participant's annualized compensation for the year preceding the year of the termination.
The payment schedule for severance benefits under the Severance Plan is determined by the plan administrator, subject to a requirement that all benefits be paid no later than the last day of the second taxable year following the taxable year in which the termination occurs. The Severance Plan provides that we have the right to amend, modify, suspend or terminate the plan at any time by formal action by our board of directors or by the plan administrator.
Vesting of Options and Restricted Shares. Our named executive officers are entitled to additional vesting of unvested options and restricted shares held by them in connection with certain terminations of employment pursuant to the 2013 Plan and their award agreements. Other than with respect to the 2017 restricted shares, upon a termination of employment due to death or "disability," by us without "cause" or by the named executive officer without "good reason" (each such term as defined in the 2013 Plan), time-vesting options and restricted shares will be subject to additional, pro-rated vesting, determined by multiplying the number of time-vesting options or restricted shares, as applicable, that are unvested as of the termination date by a fraction, the numerator of which is the number of days elapsed between the most recent vesting date (or the grant date, if no vesting date has occurred) and the termination date, and the denominator of which is the number of days between the most recent vesting date (or the grant date, if no vesting date has occurred) and the final vesting date. In addition, performance-vesting options will vest based on certain assumed levels of achievement which are enumerated in the award agreements upon a termination of employment due to death or "disability," and based on actual performance during the 12-month period preceding the termination date upon a termination by us without "cause" or by the named executive officer without "good reason." Except as may otherwise be provided in an employment agreement, the 2017 restricted shares are not subject to accelerated vesting upon a change in control and will generally be forfeited upon a termination of employment for any reason prior to vesting.
Nonqualified Deferred Compensation Plan. The NQDC Plan provides that, in the event of a termination due to death or "disability" or a "change in control" (each such term, as defined in the NQDC Plan), a participant will become 100% vested in his accrued but unvested benefits attributable to our matching contributions and discretionary contributions. In addition, the vested balance of a participant's NQDC Plan account may be distributed to such participant upon his death, disability, separation from service (including retirement) or a change in control event, in each case, as elected by the participant in accordance with the terms of the NQDC Plan, as discussed under "—Summary Compensation Table—Narrative to Summary Compensation Table—Nonqualified Deferred Compensation Plan" above.
Additional Incentive Compensation Plans and Awards
Equity Incentive Plans
We currently maintain the 2013 Plan, pursuant to which we previously granted various forms of equity compensation to our service providers, including our officers, non-employee directors and consultants. We have historically granted options and restricted shares to individual service providers under the 2013 Plan. We also maintain an Outside Director Equity Plan, which is discussed under "Director Remuneration" below. In connection with the IPO, our board of directors adopted, and our stockholders approved, the 2018 Plan and the 2018 ESPP, which became effective upon the completion of the IPO. The principal features of the 2013 Plan, the 2018 Plan and the 2018 ESPP are summarized below. This summary is qualified in its entirety by reference to the actual text of the 2013 Plan, the 2018 Plan and the 2018 ESPP, which are filed as exhibits to this report.
148
2013 Plan
In 2013, our board of directors approved the 2013 Plan. Under the 2013 Plan, we previously granted stock options, restricted shares and other stock-based awards to our key employees, directors and consultants.
There are 13,230,837 shares of our Class B common stock reserved for issuance under the 2013 Plan. This number is subject to additional adjustment in the event of a corporate transaction, distribution or similar event, as determined by the Compensation Committee of the board of directors. As of March 13, 2018 options in respect of 9,432,834 shares of Class B common stock, and 3,794,863 restricted shares of Class B Common Stock, were outstanding under the 2013 Plan, of which 2,955,050 were unvested. Our Compensation Committee has had full power and authority to determine the terms of awards granted pursuant to the 2013 Plan, including, without limitation, which key employees, directors and consultants will be granted awards and the number of shares of Class B common stock subject to awards.
Our board of directors may amend or discontinue the 2013 Plan at any time, provided that stockholder approval is required for any share reserve increase or change to the employees eligible to participate in the 2013 Plan, and may amend or cancel any outstanding award. No such amendment may adversely affect the rights under any outstanding award without the holder's consent.
2018 Plan
We adopted the 2018 Stock Incentive Plan, or the 2018 Plan, at the completion of the IPO. The 2018 Plan authorizes the grant of stock options, restricted stock awards, restricted stock units, stock appreciation rights, performance awards and other awards that may be settled in or based upon shares of our Class A common stock or Class B common stock, collectively, our Shares, though we currently intend to grant these awards based upon shares of our Class B common stock. The 2018 Plan became effective immediately upon the effective date of the IPO and no further grants will be made under any other stock incentive plan maintained by us, including the 2013 Plan.
Purpose. The purpose of the 2018 Plan is to give us the ability to attract, retain, motivate and reward certain officers, employees, directors and consultants and to provide a means whereby officers, employees, directors and/or consultants can acquire and maintain ownership of our Shares or be paid incentive compensation measured by reference to the value of our Shares, thereby strengthening their commitment to our Company and encouraging such eligible people to expend maximum effort in the creation of stockholder value.
The following summary is not a complete description of all provisions of the 2018 Plan and is qualified in its entirety by reference to the 2018 Plan.
Plan Administration. The 2018 Plan is administered by our Compensation Committee. Our Compensation Committee has the authority, among other things, to select participants, grant awards, determine types of awards, types of Shares subject to awards, and terms and conditions of awards for participants, prescribe rules and regulations for the administration of the plan and make all decisions and determinations as deemed necessary or advisable for the administration of the 2018 Plan. Our Compensation Committee may delegate certain of its authority as it deems appropriate, pursuant to the terms of the 2018 Plan and to the extent permitted by applicable law, to our officers or employees, although any award granted to any person who is not our employee or who is subject to Section 16 of the Exchange Act must be expressly approved by the Compensation Committee. Our Compensation Committee's actions are final, conclusive and binding.
Authorized Stock. A total of 3,372,484 shares of either Class A common stock or Class B common stock, or any combination thereof, as determined by the Compensation Committee are reserved and
149
available for issuance under the 2018 Plan, subject to adjustment in accordance with its terms. The number of Shares reserved and available for issuance under the 2018 Plan is subject to adjustment, as described below in the section titled "—Adjustments." The maximum number of Shares that may be issued in respect of incentive stock options is 3,372,484. Shares issued under the 2018 Plan may consist of authorized but unissued stock or previously issued Shares. Shares underlying awards that are settled in cash, expire or are canceled, forfeited or otherwise terminated without delivery to a participant will again be available for issuance under the 2018 Plan. Shares withheld or surrendered in connection with the payment of an exercise price of an award or to satisfy tax withholding will again become available for issuance under the 2018 Plan. The Shares issuable and issued, and awards granted, pursuant to the 2018 Plan are subject to the Employee Shareholders' Agreement, as well as to the provisions of the amended and restated certificate of incorporation regarding the conversion of shares of Class B common stock to Class A common stock.
Types of Awards. The types of awards that may be available under the 2018 Plan are described below. All of the awards described below are subject to the terms and conditions determined by our Compensation Committee in its sole discretion, subject to certain limitations provided in the 2018 Plan. Each award granted under the 2018 Plan is evidenced by an award agreement, which governs that award's terms and conditions.
Non-qualified Stock Options. A non-qualified stock option is an option that is not intended to meet the qualifications of an incentive stock option, as described below. An award of a non-qualified stock option grants a participant the right to purchase a certain number of Shares during a specified term in the future, or upon the achievement of performance or other conditions, at an exercise price set by our Compensation Committee on the grant date. The term of a non-qualified stock option will be set by our Compensation Committee but may not exceed 10 years from the grant date. The exercise price may be paid using any of the following payment methods: (i) immediately available funds in U.S. dollars or by certified or bank cashier's check; (ii) by delivery of stock having a value equal to the exercise price; (iii) a broker assisted cashless exercise; or (iv) by any other means approved by our Compensation Committee. The 2018 Plan provides that unless otherwise specifically determined by the Compensation Committee, vesting of non-qualified stock options will be suspended during the period of any approved leave of absence by a participant following which the participant has a right to reinstatement and will resume upon such participant's return to employment. The 2018 Plan also provides that participants terminated for "cause" (as such term is defined in the 2018 Plan) will forfeit all of their non-qualified stock options, whether or not vested. Participants terminated for any other reason will forfeit their unvested non-qualified stock options, retain their vested non-qualified stock options, and will have one year (in the case of a termination by reason of death or disability) or 90 days (in all other cases) following their termination date to exercise their vested non-qualified stock options. The 2018 Plan authorizes our Compensation Committee to provide for different treatment of non-qualified stock options upon termination than that described above, as determined in its discretion.
Incentive Stock Options. An incentive stock option is a stock option that meets the requirements of Section 422 of the Internal Revenue Code. Incentive stock options may be granted only to our employees or employees of certain of our subsidiaries and must have an exercise price of no less than 100% of the fair market value (or 110% with respect to a 10% stockholder) of a Share on the grant date and a term of no more than 10 years (or 5 years with respect to a 10% stockholder). The aggregate fair market value, determined at the time of grant, of our Shares subject to incentive stock options that are exercisable for the first time by a participant during any calendar year may not exceed $100,000. The 2018 Plan provides that unless otherwise specifically determined by our Compensation Committee, vesting of incentive stock options will be suspended during the period of any approved leave of absence by a participant following which the participant has a right to reinstatement and will resume upon such participant's return to employment. The 2018 Plan also provides that participants terminated for "cause" will forfeit all of their incentive stock options, whether or not vested.
150
Participants terminated for any other reason will forfeit their unvested incentive stock options, retain their vested incentive stock options, and will have one year (in the case of a termination by reason of death or disability) or 90 days (in all other cases) following their termination date to exercise their vested incentive stock options, unless such incentive stock option expires sooner. The 2018 Plan authorizes our Compensation Committee to provide for different treatment of incentive stock options upon termination than that described above, as determined in its discretion.
Stock Appreciation Rights. A stock appreciation right entitles the participant to receive an amount equal to the difference between the fair market value of our Shares on the exercise date and the base price of the stock appreciation right that is set by our Compensation Committee on the grant date, multiplied by the number of Shares subject to the stock appreciation right. The term of a stock appreciation right will be set by our Compensation Committee but may not exceed 10 years from the grant date. Payment to a participant upon the exercise of a stock appreciation right may be either in cash, stock or property as specified in the award agreement or as determined by our Compensation Committee. The 2018 Plan provides that unless otherwise specifically determined by our Compensation Committee, vesting of stock appreciation rights will be suspended during the period of any approved leave of absence by a participant following which the participant has a right to reinstatement and will resume upon such participant's return to employment. The 2018 Plan provides that participants terminated for "cause" will forfeit all of their stock appreciation rights, whether or not vested. Participants terminated for any other reason will forfeit their unvested stock appreciation rights, retain their vested stock appreciation rights, and will have one year (in the case of a termination by reason of death or disability) or 90 days (in all other cases) following their termination date to exercise their vested stock appreciation rights, unless such appreciation right expires sooner. The 2018 Plan authorizes our Compensation Committee to provide for different treatment of stock appreciation rights upon termination than that described above, as determined in its discretion.
Restricted Stock. A restricted stock award is an award of restricted Shares that does not vest until a specified period of time has elapsed, and/or upon the achievement of certain performance or other conditions determined by our Compensation Committee, and which will be forfeited if the conditions to vesting are not met. During the period that any vesting restrictions apply, transfer of the restricted Shares is generally prohibited. Unless otherwise specified in their award agreement, participants generally have all of the rights of a stockholder as to the restricted Shares, including the right to vote such Shares, provided, that any cash or stock dividends with respect to the restricted Shares will be withheld by us and will be subject to forfeiture to the same degree as the restricted Shares to which such dividends relate. The 2018 Plan provides that unless otherwise specifically determined by our Compensation Committee, vesting of restricted stock awards will be suspended during the period of any approved leave of absence by a participant following which the participant has a right to reinstatement and will resume upon such participant's return to employment. Except as otherwise determined by our Compensation Committee, in the event a participant is terminated for any reason, the vesting with respect to the participant's restricted stock will cease, and as soon as practicable following the termination, we will repurchase all of such participant's unvested restricted stock at a purchase price equal to the original purchase price paid for the restricted stock, or if the original purchase price is equal to $0, the unvested restricted stock will be forfeited by the participant to us for no consideration.
Restricted Stock Units. A restricted stock unit is an unfunded and unsecured obligation to issue Shares (or an equivalent cash amount) to the participant in the future. Restricted stock units become payable on terms and conditions determined by our Compensation Committee and will vest and be settled at such times in cash, Shares, or other specified property, as determined by our Compensation Committee. Participants have no rights of a stockholder as to the restricted stock units, including no voting rights or rights to dividends, until the underlying Shares are issued or become payable to the participant. The 2018 Plan provides that unless otherwise specifically determined by our Compensation Committee, vesting of restricted stock units will be suspended during the period of any approved leave
151
of absence by a participant following which the participant has a right to reinstatement and will resume upon such participant's return to employment. Except as otherwise provided by our Compensation Committee, in the event a participant is terminated for any reason, the vesting with respect to the participant's restricted stock units will cease, each of the participant's outstanding unvested restricted stock units will be forfeited for no consideration as of the date of such termination, and any stock remaining undelivered with respect to the participant's vested restricted stock units will be delivered on the delivery date specified in the applicable award agreement.
Other Stock-Based Compensation. Under the 2018 Plan, our Compensation Committee may grant other types of equity-based awards subject to such terms and conditions as our Compensation Committee may determine. Such awards may include the grant of dividend equivalents, which generally entitle the participant to receive amounts equal to the dividends that are paid on the stock underlying the award.
Adjustments. The aggregate number of Shares reserved and available for issuance under the 2018 Plan, the individual limitations, the number of Shares covered by each outstanding award, and the price per Share underlying each outstanding award will be equitably and proportionally adjusted or substituted, as determined by our Compensation Committee in its sole discretion, as to the number, price or kind of stock or other consideration subject to such awards in connection with stock dividends, extraordinary cash dividends, stock splits, reverse stock splits, recapitalizations, reorganizations, mergers, amalgamations, consolidations, combinations, exchanges, or other relevant changes in our capitalization affecting our Shares or our capital structure which occurs after the date of grant of any award, in connection with any extraordinary dividend declared and paid in respect of stock or in the event of any change in applicable law or circumstances that results in or could result in, as determined by our Compensation Committee in its sole discretion, any substantial dilution or enlargement of the rights intended to be granted to, or available for, participants in the 2018 Plan.
Corporate Events. In the event of a merger, amalgamation or consolidation involving us in which we are not the surviving corporation or in which we are the surviving corporation but the holders of our Shares receive securities of another corporation or other property or cash, a "change in control" (as defined in the 2018 Plan), or a reorganization, dissolution or liquidation of us, our Compensation Committee may, in its discretion, provide for the assumption or substitution of outstanding awards, accelerate the vesting of outstanding awards, cash-out outstanding awards or replace outstanding awards with a cash incentive program that preserves the value of the awards so replaced. With respect to any award that is assumed or substituted in connection with a "change in control," the vesting, payment, purchase or distribution of such award will not be accelerated by reason of the "change in control" for any participant unless the participant's employment is involuntarily terminated as a result of the "change in control" during a period not exceeding two years commencing on the "change in control."
Transferability. Awards under the 2018 Plan may not be sold, transferred, pledged or assigned other than by will or by the applicable laws of descent and distribution, unless (for awards other than incentive stock options) otherwise provided in an award agreement or determined by our Compensation Committee.
Amendment. Our board of directors or our Compensation Committee may amend the 2018 Plan or outstanding awards at any time. Our stockholders must approve any amendment if their approval is required pursuant to applicable law or the applicable rules of each national securities exchange on which our Shares are traded. No amendment to the 2018 Plan or outstanding awards which materially impairs the right of a participant is permitted unless the participant consents in writing.
152
Termination. The 2018 Plan will terminate on the day before the tenth anniversary of the date our stockholders approve the 2018 Plan, although incentive stock options may not be granted following the earlier of the tenth anniversary of (i) the date the 2018 Plan is adopted by our board of directors and (ii) the date our stockholders approve the 2018 Plan. In addition, our board of directors or our Compensation Committee may suspend or terminate the 2018 Plan at any time. Following any such suspension or termination, the 2018 Plan will remain in effect to govern any then outstanding awards until such awards are forfeited, terminated or otherwise canceled or earned, exercised, settled or otherwise paid out, in accordance with their terms.
Clawback; Sub-Plans. All awards under the 2018 Plan are subject to any incentive compensation clawback or recoupment policy currently in effect, or as may be adopted by our board of directors (or any committee or subcommittee thereof) and, in each case, as may be amended from time to time. In addition, our Compensation Committee may adopt such procedures and sub-plans as are necessary or appropriate to permit participation in the 2018 Plan by individuals who are non-U.S. nationals or are primarily employed or providing services outside the U.S., and may modify the terms of any awards granted to such participants in a manner deemed by our Compensation Committee to be necessary or appropriate in order that such awards conform with the laws of the country or countries where such participants are located.
No-Repricing of Awards. No awards under the 2018 Plan may be repriced without stockholder approval. For purposes of the 2018 Plan, "repricing" means any of the following (or any other action that has the same effect as any of the following): (i) changing the terms of the award to lower its exercise price or base price (other than on account of capital adjustments resulting from stock splits); (ii) any other action that is treated as a repricing under GAAP; and (iii) repurchasing for cash or canceling an award in exchange for another award at a time when its exercise price or base price is greater than the fair market value of the underlying stock.
2018 Employee Stock Purchase Plan
We adopted the 2018 Employee Stock Purchase Plan, or the 2018 ESPP upon the completion of the IPO. We did not grant purchase rights under the 2018 ESPP prior to the completion of the IPO.
Share Reserve. The maximum number of shares of our Class A common stock that may be issued under the 2018 ESPP is 350,388 shares. Shares subject to purchase rights granted under the 2018 ESPP that terminate without having been exercised in full will not reduce the number of shares available for issuance under our 2018 ESPP. The Shares issuable and issued, and awards granted, pursuant to the 2018 ESPP will be subject to the Employee Shareholders' Agreement, as well as to the provisions of the amended and restated certificate of incorporation regarding the conversion of shares of Class B common stock to Class A common stock.
Administration. Our Compensation Committee, or such other duly authorized committee or subcommittee of our board of directors, administers the 2018 ESPP.
Limitations. Our employees, including executive officers, and the employees of any of our designated parent or subsidiary corporations are eligible to participate in the 2018 ESPP, provided they may have to satisfy one or more of the following service requirements before participating in the 2018 ESPP, as determined by the administrator: (i) customary employment with us or one of our parents or subsidiaries for more than 20 hours per week and more than five months per calendar year; or (ii) continuous employment with us or one of our parents or subsidiaries for a minimum period of time, not to exceed two years, prior to the first date of an offering. An employee may not be granted rights to purchase stock under the 2018 ESPP (x) if such employee immediately after the grant would own stock possessing 5% or more of the total combined voting power or value of all classes of our common stock or (y) to the extent that such rights would accrue at a rate that exceeds $25,000 worth of
153
our stock for each calendar year that the rights remain outstanding, as determined under Section 423 of the Internal Revenue Code and the rules thereunder.
The 2018 ESPP is intended to qualify as an employee stock purchase plan under Section 423 of the Internal Revenue Code. The administrator may specify offerings with a duration of not more than 27 months and may specify one or more shorter purchase periods within each offering. Each offering will have one or more purchase dates on which shares of our Class A common stock will be purchased for the employees who are participating in the offering. The administrator, in its discretion, determines the terms of offerings under the 2018 ESPP.
A participant may not transfer purchase rights under the 2018 ESPP other than by will, the laws of descent and distribution or as otherwise provided under the 2018 ESPP.
Holding Period. The 2018 ESPP permits our Compensation Committee to establish a holding period for any shares of Class A common stock purchased in a particular offering, during which such shares will be subject to a resale restriction barring the holder from selling such shares. The holding period, if any, will commence on the purchase date and will end automatically on the earliest of (i) the termination of the participant's employment, (ii) the occurrence of certain specified significant corporate transactions, such as our merger or change in control, or (iii) the six month anniversary of the purchase date or such earlier date as established by our Compensation Committee.
Payroll Deductions. The 2018 ESPP permits participants to purchase shares of our Class A common stock through payroll deductions up to 5% of their earnings. Unless otherwise determined by the administrator, the purchase price of the shares will be not less than 95% of the fair market value of the shares on the applicable purchase date. Participants may end their participation at any time during an offering and will be paid their accrued contributions that have not yet been used to purchase shares. Participation ends automatically upon termination of employment with us.
Corporate Transactions. In the event of certain specified significant corporate transactions, such as our merger or change in control, a successor corporation may assume, continue or substitute each outstanding purchase right. If the successor corporation does not assume, continue or substitute for the outstanding purchase rights, the offering in progress will be shortened and a new exercise date will be set. The participants' purchase rights will be exercised on the new exercise date and such purchase rights will terminate immediately thereafter.
Amendment and Termination. Our board of directors or our Compensation Committee has the authority to amend, suspend or terminate the 2018 ESPP, at any time and for any reason, provided certain types of amendments will require the approval of our stockholders. The 2018 ESPP will remain in effect until terminated by our board of directors or our Compensation Committee in accordance with the terms of the 2018 ESPP.
Director Compensation
During 2017, Messrs. Davanzo and Minetti and Ms. Hirtler-Garvey each received $125,000, payable in quarterly installments, as annual compensation for service on our board of directors. In addition, Messrs. Hawkes and Rappaport each received $52,083 as compensation for the period from August 1, 2017 through December 31, 2017. In 2017, Messrs. Davanzo, Hawkes, Minetti and Rappaport, and Ms. Hirtler-Garvey, had the opportunity to elect to receive all or a portion of their director fees in fully-vested shares of the Company's Class B common stock. In 2013, Messrs. Berlinski, Hawkes and Rappaport each received director compensation in the form of a grant of restricted shares, as discussed below, and in 2017, received certain dividend payments in respect of such restricted shares, as reflected in the Director Compensation table. The other members of our board of directors,
154
including directors who are also employed as our executive officers, received no director compensation in 2017.
In 2013, our board of directors approved our Outside Director Equity Plan, or the Director Plan. Under the Director Plan, we may grant restricted shares to our outside directors. There were 262,791 shares of our Class B common stock reserved for issuance under the Director Plan, all of which were granted in July 2013, as discussed below. As of December 31, 2017, no restricted shares were outstanding under the Director Plan. In July 2013, Messrs. Berlinski, Hawkes and Rappaport each received a grant of 87,597 restricted shares pursuant to the Director Plan, which grants were subject to quarterly vesting over a period of four years and which fully vested in July 2017.
The foregoing summary of the Director Plan is qualified in its entirety by reference to the actual text of the Director Plan, which is filed as an exhibit to this report.
We also reimburse our directors for reasonable and necessary out-of-pocket expenses incurred in attending board and committee meetings or performing other services for us in their capacities as directors.
Except as described above, we currently have no other formal arrangements under which our directors receive compensation for service to the board of directors or its committees.
The following table sets forth information concerning director compensation paid during the year ended December 31, 2017.
Name
|
Fees Earned or Paid in Cash ($)(1) |
Stock Awards ($)(2) |
All Other Compensation ($)(3) |
Total ($) |
|||||||||
|---|---|---|---|---|---|---|---|---|---|---|---|---|---|
Milton R. Berlinski |
— | — | 44,977 | 44,977 | |||||||||
Alex Binderow |
— | — | — | — | |||||||||
Lawrence Davanzo |
125,000 | — | — | 125,000 | |||||||||
Richard M. DeMartini |
— | — | — | — | |||||||||
James B. Hawkes |
52,083 | — | 44,977 | 97,060 | |||||||||
Karin Hirtler-Garvey |
125,000 | — | — | 125,000 | |||||||||
Robert J. Hurst |
— | — | — | — | |||||||||
T. Guy Minetti |
125,000 | — | — | 125,000 | |||||||||
Alan H. Rappaport |
52,083 | — | 44,977 | 97,060 | |||||||||
- (1)
- In
2017, Messrs. Hawkes and Rappaport elected to receive all, and Ms. Hirtler-Garvey elected to receive 20%, of their directors fees in shares of the
Company's Class B common stock.
- (2)
- As
discussed above, Messrs. Berlinski, Hawkes and Rappaport received restricted share grants in 2013, which fully vested in July 2017. As of
December 31, 2017, none of the non-employee directors had any restricted shares outstanding.
- (3)
- Amounts reported represent dividend payments in respect of restricted shares received by the directors in 2017.
Compensation Committee Interlocks and Insider Participation
None of the members of our Compensation Committee is, or has at any time during the past year been, one of our officers or employees. None of our executive officers currently serves, or in the past year has served, as a member of the board of directors or compensation committee of any entity that has one or more executive officers serving on our board of directors or Compensation Committee.
155
Item 12. Security Ownership of Certain Beneficial Owners and Management and Related Stockholder Matters.
Principal Stockholders
The following table sets forth the beneficial ownership of our common stock as of March 13, 2018 by (1) each person, or group of affiliated persons, known by us to be the beneficial owner of 5% or more of either class of our outstanding common stock, (2) each of our directors, (3) each of our named executive officers and (4) all of our directors and executive officers as a group.
To our knowledge, each person named in the table has sole voting and investment power with respect to all of the securities shown as beneficially owned by such person, except as otherwise set forth in the notes to the table. The number of securities shown represents the number of securities the person "beneficially owns," as determined by the rules of the SEC. The SEC has defined "beneficial" ownership of a security to mean the possession, directly or indirectly, of voting power and/or investment power. A security holder is also deemed to be, as of any date, the beneficial owner of all securities that such security holder has the right to acquire within 60 days after that date through (1) the exercise of any option, warrant or right, (2) the conversion of a security, (3) the power to revoke a trust, discretionary account or similar arrangement, or (4) the automatic termination of a trust, discretionary account or similar arrangement. These shares, and shares of unvested restricted stock (which have voting rights but are subject to future vesting based on time or performance criteria), are deemed to be outstanding and beneficially owned by the person holding such securities for the purpose of computing the percentage ownership and voting of that person, but they are not treated as outstanding for the purpose of computing the percentage ownership or voting of any other person.
The percentages reflect beneficial ownership as determined in accordance with Rule 13d-3 under the Exchange Act and are based on 12,899,315 shares of our Class A common stock and 55,046,787 shares of our Class B common stock outstanding as of March 13, 2018 (excluding 2,955,050 shares of
156
restricted stock). Unless otherwise noted below, the address for each of the stockholders in the table below is c/o Victory Capital Holdings, Inc., 4900 Tiedeman Road, 4th Floor, Brooklyn, OH 44144.
| |
Shares Beneficially Owned As of 3.13.18 |
||||||||||||||||||
|---|---|---|---|---|---|---|---|---|---|---|---|---|---|---|---|---|---|---|---|
Name and Address
|
# of Class A Shares(1) |
% of Class A Shares |
# of Class B Shares |
% of Class B Shares |
% of Total Common Stock |
% of Total Voting Power(2) |
|||||||||||||
5% Stockholders |
|||||||||||||||||||
Crestview GP(3) |
— | * | 35,251,137 | 64.0 | % | 51.9 | % | 62.6 | % | ||||||||||
Reverence Capital Partners LLC(4) |
— | * | 9,711,745 | 17.6 | % | 14.3 | % | 17.2 | % | ||||||||||
Employee Shareholders Committee(5) |
— | * | 15,700,544 | 24.8 | % | 20.6 | % | 24.3 | % | ||||||||||
Citadel Advisors LLC, Citadel Advisors Holdings LP, Citadel GP LLC and Kenneth Griffin(6) |
950,402 | 7.4 | % | — | * | 1.4 | % | * | |||||||||||
Wellington Management Group LLP, Wellington Group Holdings LLP, Wellington Investment Advisors Holdings LLP and Wellington Management Company LLP(7) |
2,125,566 | 16.5 | % | — | * | 3.1 | % | * | |||||||||||
Directors and Named Executive Officers |
|||||||||||||||||||
David C. Brown(8)(9) |
16,500 | * | 2,404,785 | 4.2 | % | 3.5 | % | 4.2 | % | ||||||||||
Michael D. Policarpo(8)(10) |
— | * | 1,197,394 | 2.1 | % | 1.7 | % | 2.1 | % | ||||||||||
Kelly S. Cliff(8)(11) |
— | * | 771,438 | 1.4 | % | 1.1 | % | 1.4 | % | ||||||||||
Milton R. Berlinski(12) |
— | * | 470,660 | * | * | * | |||||||||||||
Alex Binderow |
— | * | — | * | * | * | |||||||||||||
Lawrence Davanzo(13) |
20,000 | * | 149,471 | * | * | * | |||||||||||||
Richard M. DeMartini |
— | * | — | * | * | * | |||||||||||||
James B. Hawkes(14) |
336,071 | 2.6 | % | 663,929 | 1.2 | % | 1.5 | % | 1.2 | % | |||||||||
Karin Hirtler-Garvey |
— | * | 17,380 | * | * | * | |||||||||||||
Robert J. Hurst |
— | * | — | * | * | * | |||||||||||||
Alan H. Rappaport(15) |
— | * | 388,624 | * | * | * | |||||||||||||
All directors and executive officers as a group (13 persons) |
386,571 | 3.0 | % | 6,525,039 | 11.7 | % | 10.1 | % | 11.5 | % | |||||||||
- *
- Represents
beneficial ownership of less than 1%.
- (1)
- The
persons who hold shares of our Class B common stock (which are convertible, at the option of the holder, into an equal number of shares of Class A
common stock) are currently deemed to have beneficial ownership over a number of shares of our Class A common stock equal to the number of shares of our Class B common stock reflected in
the table above. Because we have disclosed the ownership of shares of our Class B common stock, the shares of Class A common stock underlying Class B common stock are not
separately reflected in the table above.
- (2)
- Percentage of total voting power represents voting power with respect to all shares of our Class A and Class B common stock, as a single class, calculated on the basis of beneficial ownership. The holders of our Class B common stock are entitled to ten votes per share, and holders of our Class A common stock are entitled to one vote per share.
157
- (3)
- This
number does not include 28,730,364 shares of Class B common stock owned by other parties to the Shareholders' Agreement for which Crestview GP may
be deemed to have beneficial ownership. See "Certain Relationships and Related Transactions, and Director Independence—Related-Party Transactions—Amended and Restated
Shareholders' Agreement." Crestview GP disclaims beneficial ownership of all such shares. Crestview GP may be deemed to be the beneficial owner of 35,251,137 shares of Class B
common stock owned directly by Crestview Victory. Crestview Victory GP, LLC is the general partner of Crestview Victory. Crestview Partners II, L.P., Crestview Partners II
(TE), L.P., Crestview Partners II (FF), L.P., Crestview Offshore Holdings II (Cayman), L.P., Crestview Offshore Holdings II (FF Cayman), L.P. and Crestview Offshore
Holdings II (892 Cayman), L.P. (collectively, the "Crestview Funds") are members of Crestview Victory GP, LLC and limited partners of Crestview Victory. Crestview GP is the
general partner of each of the Crestview Funds. Crestview GP and the Crestview Funds may be deemed to be beneficial owners of the shares owned directly by Crestview Victory. Crestview GP
has voting and investment control over such shares. Decisions by Crestview GP to vote or dispose of such shares require the approval of a majority of the nine members of its investment
committee, which is composed of the following individuals: Barry S. Volpert, Thomas S. Murphy, Jr., Jeffrey A. Marcus, Robert J. Hurst, Richard M. DeMartini,
Robert V. Delaney, Jr., Brian P. Cassidy, Alexander M. Rose and Adam J. Klein. None of the foregoing persons has the power individually to vote or dispose of such shares.
Each of the foregoing individuals disclaims beneficial ownership of all such shares. The address of each of the foregoing is c/o Crestview, 667 Madison Avenue, 10th Floor, New York, NY 10065.
- (4)
- This
number does not include 54,269,756 shares of Class B common stock owned by other parties to the Shareholders' Agreement for which RCP GenPar
Holdco LLC and RCP Co-Invest GP LLC (the "RCP Entities") may be deemed to have beneficial ownership. See "Certain Relationships and Related Transactions, and Director
Independence—Related-Party Transactions—Amended and Restated Shareholders' Agreement." The RCP Entities disclaim beneficial ownership of all such shares. The RCP Entities may
be deemed to be the beneficial owners of 9,711,745 shares of Class B common stock owned directly by Reverence Capital Partners Opportunities Fund I, L.P., Reverence Capital Partners
Opportunities Fund I (Cayman), L.P., and Reverence Capital Partners Opportunities Fund I (AI), L.P. (collectively, the "Reverence Capital Funds") and RCP Lake Co-Invest, L.P. RCP
GenPar Holdco LLC is the general partner of each of the Reverence Capital Funds and RCP Co-Invest GP LLC is the general partner of RCP Lake Co-Invest, L.P. The RCP
Entities, Reverence Capital Funds and RCP Lake Co-Invest, L.P. may be deemed to be beneficial owners of the shares. The RCP Entities have voting and investment control over such shares.
Decisions by each of the RCP Entities to vote or dispose of such shares require the approval of a majority of the three members of the investment committee, which is composed of the following
individuals: Milton Berlinski, Peter Aberg and Alexander Chulack. None of the foregoing persons has the power individually to vote or dispose of such shares. Each of the foregoing individuals
disclaims beneficial ownership of all such shares. The address of each of the foregoing is c/o Reverence Capital Partners, 477 Madison Ave., 23rd Floor, New York, NY 10022.
- (5)
- Upon the completion of the IPO, a substantial majority of our employee stockholders entered into the Employee Shareholders' Agreement pursuant to which they have granted an irrevocable voting proxy with respect to the shares of our common stock they have acquired from us and any shares they may acquire from us in the future to the Employee Shareholders Committee initially consisting of Mr. Brown, Mr. Policarpo and Mr. Cliff. All shares subject to the Employee Shareholders' Agreement will be voted in accordance with the majority decision of those three members. Shares originally subject to the agreement cease to be subject to it when sold by the employee or upon the termination of the employee's employment with us.
158
The
number of shares of common stock in this row includes the shares of common stock currently beneficially owned by current employees party to the Employee Shareholders' Agreement, which consist
of (i) 7,353,043 shares of Class B common stock, (ii) 2,915,917 unvested restricted shares of Class B common stock and (iii) 5,431,584 shares of Class B
common stock issuable upon the exercise of options. As members of our Employee Shareholders Committee, Mr. Brown, Mr. Policarpo and Mr. Cliff share voting power over all of these
shares. Other than as shown in the row applicable to each of them individually, none of Mr. Brown, Mr. Policarpo or Mr. Cliff has investment power with respect to any of the
shares subject to the Employee Shareholders' Agreement, and each disclaims beneficial ownership of such shares. See "Certain Relationships and Related Transactions, and Director
Independence—Related-Party Transactions—Employee Shareholders' Agreement."
This number does not include 48,280,957 shares of Class B common stock owned by other parties to the Shareholders' Agreement for which the Employee Shareholders Committee may be deemed to have beneficial ownership. The Employee Shareholders Committee disclaims beneficial of all such shares.
- (6)
- Based
solely on a Schedule 13G filed with the SEC on February 15, 2018. The Schedule 13G was filed by Citadel Advisors LLC, Citadel
Advisors Holdings LP, Citadel GP LLC and Kenneth Griffin. According to the Schedule 13G, Citadel Advisors LLC, Citadel Advisors Holdings LP,
Citadel GP LLC and Kenneth Griffin each had (i) sole power to vote or direct the vote of 0 shares, (ii) shared power to vote or direct the vote of 950,402 shares of
Class A common stock, (iii) sole power to dispose or to direct the disposition of 0 shares and (iv) shared power to dispose or direct the disposition of 950,402 shares of
Class A common stock.
- (7)
- Based
solely on a Schedule 13G filed with the SEC on March 9, 2018. The Schedule 13G was filed by Wellington Management Group LLP,
Wellington Group Holdings LLP, Wellington Investment Advisors Holdings LLP and Wellington Management Company LLP. According to the Schedule 13G, (A) Wellington
Management Group LLP, Wellington Group Holdings LLP and Wellington Investment Advisors Holdings LLP each had (i) sole power to vote or direct the vote of 0 shares,
(ii) shared power to vote or direct the vote of 2,003,566 shares of Class A common stock, (iii) sole power to dispose or to direct the disposition of 0 shares and
(iv) shared power to dispose or direct the disposition of 2,125,566 shares of Class A common stock, and (B) Wellington Management Company LLP had (i) sole power to
vote or direct the vote of 0 shares, (ii) shared power to vote or direct the vote of 1,990,690 shares of Class A common stock, (iii) sole power to dispose or to direct the
disposition of 0 shares and (iv) shared power to dispose or direct the disposition of 2,112,690 shares of Class A common stock.
- (8)
- Pursuant
to the Employee Shareholders' Agreement, Mr. Brown, Mr. Policarpo and Mr. Cliff each granted an irrevocable voting proxy with respect
to all of the shares of our Class B common stock he has acquired from us and any shares he may acquire from us in the future to the Employee Shareholders Committee as described in footnote 5
above. Each retains investment power with respect to the shares of our common stock he holds, which are the shares reflected in the row applicable to each person. This amount does not include shares
owned by other parties to Employee Shareholders' Agreement for which each of Mr. Brown, Mr. Policarpo and Mr. Cliff may be deemed to have beneficial ownership. Each of such
persons disclaims beneficial ownership of all such shares.
- (9)
- Consists of (i) 16,500 shares of Class A common stock, (ii) 868,265 shares of Class B common stock, (iii) 835,225 unvested restricted shares of Class B common stock and (iv) 701,295 shares of Class B common stock issuable upon the exercise of options. Excludes 150,059 shares of Class B common stock issuable upon the exercise of unvested options.
159
- (10)
- Consists
of (i) 332,991 shares of Class B common stock, (ii) 472,514 unvested restricted shares of Class B common stock and
(iii) 391,889 shares of Class B common stock issuable upon the exercise of options. Excludes 123,476 shares of Class B common stock issuable upon the exercise of unvested options.
- (11)
- Consists
of (i) 72,347 shares of Class B common stock, (ii) 432,975 unvested restricted shares of Class B common stock and
(iii) 266,116 shares of Class B common stock issuable upon the exercise of options. Excludes 158,061 shares of Class B common stock issuable upon the exercise of unvested options.
- (12)
- Consists
of (i) 286,428 shares of Class B common stock held of record by Mr. Berlinski and (ii) 184,232 shares of Class B common
stock held of record by MRB ICBC LLC, an entity which Mr. Berlinski controls.
- (13)
- Consists
of (i) 20,000 shares of Class A common stock and (ii) 149,471 shares of Class B common stock, in each case held of record by
The Lawrence & Christine Davanzo Family Trust, for which Mr. Davanzo serves as trustee.
- (14)
- Consists
of (i) (A) 246,071 shares of Class A common stock held of record by Mr. Hawkes and (B) 90,000 shares of Class A common
stock held of record by Hawkes Family LLC, an entity which Mr. Hawkes controls, and (ii) (A) 371,244 shares of Class B common stock held of record by
Mr. Hawkes and (B) 292,685 shares of Class B common stock held of record by Hawkes Family LLC.
- (16)
- Consists of (i) 99,763 shares of Class B common stock held of record by Mr. Rappaport and (ii) 288,861 shares of Class B common stock held of record by ADR Partners, an entity which Mr. Rappaport controls.
Securities Authorized for Issuance Under Equity Compensation Plans
The following table sets forth the total shares of our common stock authorized and issued (or to be issued) under our equity compensation plans as of December 31, 2017:
| |
As of December 31, 2017 | |||||||||
|---|---|---|---|---|---|---|---|---|---|---|
| |
Number of securities to be issued upon exercise of outstanding options, warrants and rights |
Weighted-average exercise price of outstanding options, warrants and rights |
Number of securities remaining available for future issuance under equity compensation plans (excluding securities reflected in column (a))(1) |
|||||||
| |
(a) |
(b) |
(c) |
|||||||
Equity compensation plans approved by security holders |
9,078,718 | $ | 5.71 | 2,224,051 | ||||||
Equity compensation plans not approved by security holders |
||||||||||
Total |
9,078,718 | $ | 5.71 | 2,224,051 | ||||||
(1)- Reflects the amount equal to (i) 15,097,458 shares of our Class B common stock reserved for issuance under the 2013 Plan, less (ii) the sum of (a) 9,078,718 shares of our Class B common stock issuable upon the exercise of options outstanding as of December 31, 2017 under the 2013 Plan and (b) 3,794,689 restricted shares of Class B common stock as of December 31, 2017 under the 2013 Plan.
160
Item 13. Certain Relationships and Related Transactions, and Director Independence.
Policies and Procedures for Related-Party Transactions
Upon the completion of the IPO, we adopted a related-party transactions policy pursuant to which our executive officers, directors, nominees for director, any immediate family member of any of our executive officers, directors or nominees for director and any person, and his or her immediate family members, or entity, including affiliates, that was a beneficial owner of 5% or more of any class of our outstanding voting securities at the time the transaction occurred or existed, will not be permitted to enter into a related-party transaction with us, in which the amount involved exceeds $120,000, without the consent of our Audit Committee, another independent committee of our board of directors or the full board of directors. Any request for us to enter into a transaction with an executive officer, director, principal stockholder or any of such persons' immediate family members, will be required to be presented to our Audit Committee for review, consideration and approval. All of our directors, executive officers and employees will be required to report to our Audit Committee any such related-party transaction. In approving or rejecting the proposed transaction, our Audit Committee will take into account, among other factors it deems appropriate, whether the proposed related-party transaction is on terms no less favorable than terms generally available to an unaffiliated third party under the same or similar circumstances, the extent of the related party's interest in the transaction and, if applicable, the impact on a director's independence. Under the policy, if we should discover related-party transactions that have not been approved, our Audit Committee will be notified and will determine the appropriate action, including ratification, rescission or amendment of the transaction. A copy of our related-party transactions policy is available on our website.
Related-Party Transactions
Amended and Restated Shareholders' Agreement
On October 31, 2014, we entered into the Shareholders' Agreement with Crestview Victory, Reverence Capital and certain other persons named therein. In connection with the IPO, we amended and restated the Shareholders' Agreement.
Upon the closing of the IPO, each of Crestview Victory and Reverence Capital have rights to nominate a certain number of our directors depending on their ownership and each of the stockholders party to the Shareholders' Agreement have agreed to vote, or cause to vote, all of their outstanding shares to ensure the election of such directors.
The Shareholders' Agreement provides for certain registration rights, pursuant to which either Crestview Victory or Reverence Capital may request us, (a) beginning 180 days after the effective date of the IPO, to file a registration statement with the SEC, and (b) beginning after the first anniversary of the completion of the IPO, to file a shelf registration statement with the SEC, in each case, if the registration statement relates to a firmly underwritten public offering, only if the expected aggregate gross proceeds are expected to be at least $25 million or either Crestview Victory or Reverence Capital propose to sell 100% of their respective shares. Subject to certain conditions, we will not be obligated to (i) effect more than one underwritten offering involving substantial marketing effort in any consecutive 120-day period, and (ii) effect more than five demand registrations for Crestview Victory and three demand registrations for Reverence Capital. In addition, each of Crestview Victory and Reverence Capital, and each of the remaining 2% holders of registrable securities to the extent either Crestview Victory or Reverence Capital participate, have certain "piggyback" registration rights, pursuant to which, subject to certain exceptions, it will be entitled to register its registrable securities alongside any offering of securities that we may undertake, subject to cutback in certain cases. The Shareholders' Agreement also provides that we will pay certain expenses relating to such registrations and indemnify the holders against certain liabilities which may arise in connection with the registration.
161
Employee Shareholders' Agreement
A substantial majority of our employee stockholders entered into the Employee Shareholders' Agreement upon the completion of the IPO, pursuant to which they have granted an irrevocable voting proxy with respect to the shares of our common stock they have acquired from us, and any shares they may acquire from us in the future, to the Employee Shareholders Committee. The employee stockholders who are party to the agreement beneficially own in the aggregate 21% of the total common stock and 17% of the total voting power of the outstanding common stock and the unvested restricted shares as of March 13, 2018. Any shares of our common stock that we may issue in the future to our employees will be subject to the Employee Shareholders' Agreement. All of the shares of our common stock issued to employees under the 2018 Plan will be subject to the Employee Shareholders' Agreement. Shares held by an employee stockholder will cease to be subject to the Employee Shareholders' Agreement upon termination of employment by such employee stockholder (including by death).
The members of the Employee Shareholders Committee must be our employees and holders of shares subject to the agreement. The Employee Shareholders Committee is currently composed of our Chief Executive Officer, Chief Operating Officer and President, Investment Franchises. Employee stockholders holding shares representing a majority of the shares subject to the Employee Shareholders' Agreement will be entitled to remove and replace the Employee Shareholders Committee members (other than the Chief Executive Officer). Each member of the Employee Shareholders Committee will be entitled to indemnification from us in his or her capacity as a member of the Employee Shareholders Committee.
The Employee Shareholders Committee will have the sole right to determine how to vote all shares subject to the Employee Shareholders' Agreement, and such shares will be voted in accordance with the majority decision of those three members. Subject to its obligations under the Shareholders' Agreement, the Employee Shareholders Committee may in its discretion vote, or abstain from voting, all or any of the shares subject to the Employee Shareholders' Agreement on any matter on which holders of shares of our common stock are entitled to vote, including, but not limited to, the election of directors to our board of directors, amendments to our certificate of incorporation or bylaws, changes to our capitalization, a merger or consolidation, a sale of substantially all of our assets, and a liquidation, dissolution or winding up.
Pre-IPO Governance Agreements
In connection with our 2013 management-led buyout with Crestview GP from KeyCorp, we entered into a monitoring agreement with Crestview on November 22, 2013, pursuant to which Crestview provided advisory services to us and received fees and reimbursements of related out-of-pocket expenses. The monitoring agreement terminated upon the completion of the IPO. Upon such termination, Crestview was entitled to any amounts that were accrued but unpaid under the agreement. The monitoring agreement also contains customary indemnification provisions in favor of Crestview. During 2017, we paid $1.0 million of monitoring fees to Crestview under the agreement.
In connection with the Munder Acquisition, we entered into an investment agreement with Reverence Capital on April 16, 2014, pursuant to which, among other things, for so long as Reverence Capital was entitled to appoint a director to our board of directors and in the event that any deal, monitoring or management fees were paid to Crestview, Reverence Capital had the right to receive a fee based on its ownership of us relative to Crestview GP's ownership. The right to receive a fee under the investment agreement was terminated upon the completion of the IPO. Upon such termination, Reverence Capital was entitled to any amounts that were accrued but unpaid under the agreement. During 2017, we paid $150,480 of monitoring fees to Reverence Capital under the agreement.
162
Indemnification Agreements
We have entered into indemnification agreements with each of our directors, executive officers and members of the Employee Shareholders Committee. The indemnification agreements and our amended and restated certificate of incorporation and bylaws, require us to indemnify our directors and executive officers to the fullest extent not prohibited by Delaware law. Subject to certain limitations, our amended and restated certificate of incorporation and bylaws also require us to advance expenses incurred by our directors and officers.
Investment Advisory Agreements
VCM has agreements to serve as the investment adviser of the Victory Funds and VictoryShares, in each case with which certain of our employees are affiliated. Under the terms of the investment advisory agreements with the Victory Funds and the VictoryShares, the continuation of which is subject to annual review and approval by the board of the Victory Funds and VictoryShares, VCM earns investment management fees based on a percentage of AUM as delineated in the respective investment advisory agreements and disclosed in the prospectus for each Victory Fund and each of the VictoryShares. The gross amount earned from advising the Victory Funds and the VictoryShares was $251.9 million for the year ended December 31, 2017.
VCM has agreed to waive its management fee and/or reimburse expenses for certain of the share classes of certain of the Victory Funds and for certain of the VictoryShares, to the extent their respective expenses exceed certain levels. In addition, VCM may decide to voluntarily reduce additional fees or reimburse any Victory Fund or any of the VictoryShares for other expenses. Amount VCM waived or reimbursed for the Victory Funds and the VictoryShares was $12.2 million for the year ended December 31, 2017.
VCM has agreements to serve as the investment adviser of the Victory Collective Funds. Under the terms of the investment advisory agreements with the Victory Collective Funds, VCM earns investment management fees based on a percentage of AUM. Amount earned from advising the Victory Collective Funds was $2.7 million for the year ended December 31, 2017.
Administration Agreements
VCM has agreements to serve as the administrator and fund accountant for the Victory Funds and VictoryShares, with which certain of our employees are affiliated. Under the terms of the administration agreements with the Victory Funds and VictoryShares, the continuation of which is subject to annual approval by the board of the Victory Funds and VictoryShares, VCM earns administration fees based on a percentage of AUM as delineated in the respective administration agreements and disclosed in the statement of additional information for each Victory Fund and each of the VictoryShares. Gross amount earned from providing administration and fund accounting services to the Victory Funds and VictoryShares was $22.5 million for the year ended December 31, 2017.
VCM pays a portion of these administration fees to an unaffiliated sub-administrator for services it provides as sub-administrator and sub-fund accountant to the Victory Funds and VictoryShares. VCM has agreed to waive a portion of its administration fees for VictoryShares to the extent the fees earned exceed the portion of fees paid to the sub-administrator for services it provides to the VictoryShares. Amount of administration fees waived by VCM for the VictoryShares was $0.4 million for the year ended December 31, 2017.
Distribution Agreements
VCA has agreements to serve as the distributor for the Victory Funds, with which certain of our employees are affiliated. Under the terms of the distribution agreements with the Victory Funds, the
163
continuation of which is subject to annual approval by the board of the Victory Funds, VCA is entitled to receive payments, if any, under the 12b-1 plan for the Victory Funds in accordance with the terms thereof and payments, if any, of sales charges as set forth in the prospectus and statement of additional information of each Victory Fund. Amount earned from providing distribution services to the Victory Funds was $43.5 million for the year ended December 31, 2017.
Compliance Services Agreement
VCM has an agreement to furnish a VCM employee to serve as the Chief Compliance Officer as well as other compliance personnel and resources reasonably necessary to provide compliance design, administration and oversight services for the Victory Funds and VictoryShares with which certain of our employees are affiliated, in accordance with Rule 38a-1 under the Investment Company Act. The term of the agreement began on July 1, 2017 and initially expires on July 1, 2019 but is subject to renewal thereafter. Amount earned from providing these services to the Victory Funds and VictoryShares was $150,000 in the twelve months ended December 31, 2017.
Item 14. Principal Accountant Fees and Services.
Audit and Non-Audit Fees
Aggregate fees for professional services rendered for us by Ernst & Young LLP as of and for the fiscal years ended December 31, 2017 and 2016 are set forth below.
| |
Fiscal Year 2017 | Fiscal Year 2016 | |||||
|---|---|---|---|---|---|---|---|
Audit fees |
$ | 1,508,804 | $ | 593,000 | |||
Audit-related fees |
69,459 | — | |||||
Tax fees |
149,000 | 77,500 | |||||
All other fees |
38,400 | — | |||||
| | | | | | | | |
Total |
$ | 1,765,663 | $ | 670,500 | |||
Audit fees include fees and expenses related to the fiscal year audits of our consolidated financial statements and financial statements of our broker-dealer and foreign subsidiaries, reviews of quarterly consolidated financial statements, comfort letters, reviews of registration statements, and services that are customarily provided in connection with statutory or regulatory filings.
Audit-related fees for fiscal year 2017 were for consultation relating to accounting matters.
Tax fees were for domestic tax return compliance, and for fiscal year 2017 included foreign tax return compliance as well, and consultations related to technical interpretations, applicable laws and regulations and tax accounting. During fiscal year 2017, $101,500 of the tax fees related to tax return compliance and preparation.
All other fees for fiscal year 2017 included IPO readiness consultation services.
Policy on Audit Committee Pre-Approval of Audit and Permissible Non-Audit Services of Independent Registered Public Accounting Firm
The Audit Committee is required to pre-approve, or adopt appropriate procedures to pre-approve, all audit and non-audit services to be provided by the independent auditors. The Audit Committee will typically pre-approve specific types of audit, audit-related and tax services on an annual basis. The Audit Committee pre-approves all other services on an individual basis throughout the year as needed. The Audit Committee has delegated to its chairperson the authority to pre-approve independent auditor engagements between meetings of the Committee. Any such pre-approvals will be reported to and ratified by the entire Audit Committee at its next regular meeting.
164
All audit, audit-related and tax services in fiscal 2017 were pre-approved by the Audit Committee, and the Audit Committee concluded that the provision of such services by Ernst & Young LLP was compatible with the maintenance of Ernst & Young LLP's independence.
PART IV
Item 15. Exhibits, Financial Statement Schedules
- (1)
- Financial
Statements: The information required by this Item is contained in Item 8 of Part II of this report.
- (2)
- Financial
Statement Schedules: None
- (3)
- Exhibits: See Exhibit Index
None
165
166
- (1)
- Incorporated
by reference to the Current Report on Form S-1 filed on February 6, 2018
- (2)
- Incorporated by reference to the Registration Statement on Form 8-K filed on February 15, 2018
167
Pursuant to the requirements of Section 13 or 15(d) of the Securities Exchange Act of 1934, the registrant has duly caused this report to be signed on its behalf by the undersigned, thereunto duly authorized on this 29th day of March, 2018.
|
VICTORY CAPITAL HOLDINGS, INC. | |||||
|
By: |
/s/ DAVID C. BROWN |
||||
|
Name: | David C. Brown | ||||
|
Title: | Chief Executive Officer | ||||
Pursuant to the requirements of the Securities Exchange Act of 1934, this report has been signed by the following persons in the capacities and on the dates indicated.
Signature
|
Title
|
Date
|
||
|---|---|---|---|---|
| /s/ DAVID C. BROWN David C. Brown |
Chief Executive Officer and Chairman (Principal Executive Officer) |
March 29, 2018 | ||
/s/ TERENCE F. SULLIVAN Terence F. Sullivan |
Chief Financial Officer and Head of Strategy (Principal Financial Officer and Principal Accounting Officer) |
March 29, 2018 |
||
/s/ MILTON R. BERLINSKI Milton R. Berlinski |
Director |
March 29, 2018 |
||
/s/ ALEX BINDEROW Alex Binderow |
Director |
March 29, 2018 |
||
/s/ LAWRENCE DAVANZO Lawrence Davanzo |
Director |
March 29, 2018 |
||
/s/ RICHARD M. DEMARTINI Richard M. DeMartini |
Director |
March 29, 2018 |
||
/s/ JAMES B. HAWKES James B. Hawkes |
Director |
March 29, 2018 |
||
/s/ ROBERT J. HURST Robert J. Hurst |
Director |
March 29, 2018 |
Signature
|
Title
|
Date
|
||
|---|---|---|---|---|
| /s/ KARIN HIRTLER-GARVEY Karin Hirtler-Garvey |
Director | March 29, 2018 | ||
/s/ ALAN H. RAPPAPORT Alan H. Rappaport |
Director |
March 29, 2018 |