Attached files
| file | filename |
|---|---|
| EX-99.1 - EX-99.1 - RENASANT CORP | d558458dex991.htm |
| 8-K - 8-K - RENASANT CORP | d558458d8k.htm |
Merger of Renasant Corporation and Brand Group Holdings, Inc. March 28, 2018 Exhibit 99.2
Forward-Looking Statements This presentation contains various “forward looking statements” within the meaning of the Private Securities Litigation Reform Act of 1995 about Renasant Corporation (“Renasant” or “RNST”), Brand Group Holdings, Inc. (“Brand”) or the combined company that are subject to risks and uncertainties. Congress passed the Private Securities Litigation Reform Act of 1995 in an effort to encourage companies to provide information about their anticipated future financial performance. This act provides a safe harbor for such disclosure, which protects a company from unwarranted litigation if actual results are different from management expectations. forward looking statements include information concerning the future financial performance, business strategy, projected plans and objectives of Renasant, Brand and the combined company. These statement are based upon the current beliefs and expectations of Renasant’s and Brand’s management and are inherently subject to significant business, economic and competitive risks and uncertainties, many of which are beyond the control of Renasant’s or Brand’s management. Actual results may differ from those indicated or implied in the forward looking statements, and such differences may be material. Statements preceded by, followed by or that otherwise include the words “believes,” “expects,” “anticipates,” “intends,” “estimates,” “plans,” “may increase,” “may fluctuate,” “will likely result,” and similar expressions, or future or conditional verbs such as “will,” “should,” “would,” and could,” are generally forward looking in nature and not historical facts. Investors should understand that, in addition to factors previously disclosed in Renasant’s reports filed with the SEC and those identified elsewhere in this presentation, forward-looking statements include, but are not limited to, statements about (1) the expected benefits of the transaction between Renasant and Brand, including future financial and operating results, cost savings, enhanced revenues and the expected market position of the combined company that may be realized from the transaction, and (2) Renasant’s and Brand’s plans, objectives, expectations and intentions and other statements contained in this presentation that are not historical facts. Renasant’s and Brand’s management believe the forward looking statements about Renasant, Brand and the combined company in this presentation are reasonable. However, investors should not place undue reliance on them. Any forward looking statements are not guarantees of future performance. They involve risks, uncertainties and assumptions, and actual results, developments and business decisions may differ from those contemplated by the forward looking statements. Many of the factors that will determine these results are beyond the ability of Renasant’s or Brand’s ability to control or predict. Renasant and Brand expressly disclaim any duty to update or revise any forward looking statements, all of which are expressly qualified by the statements in this section.
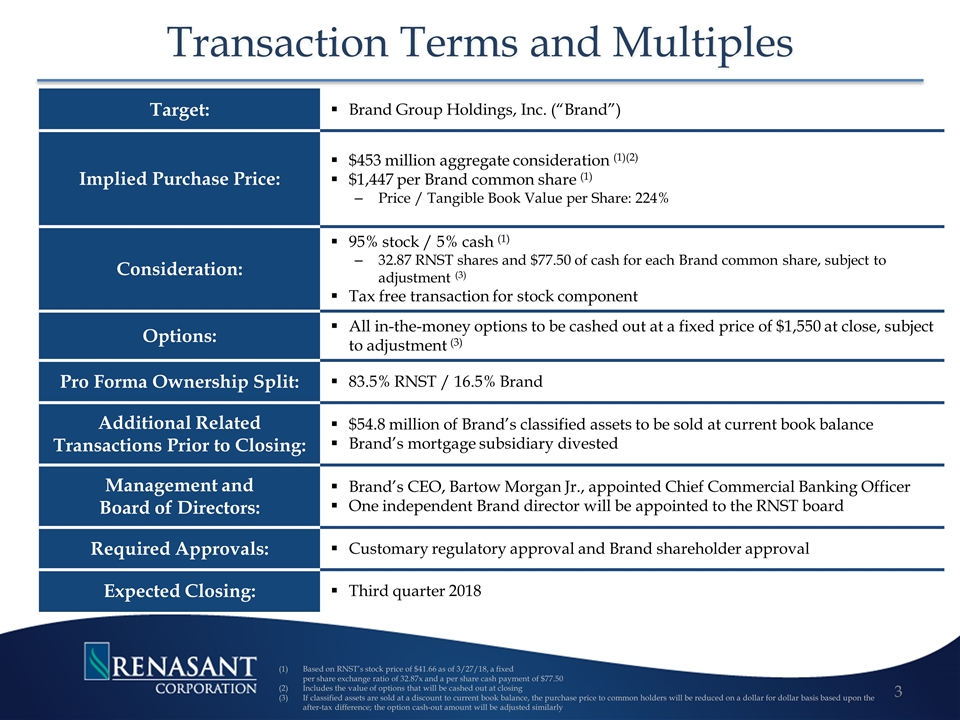
Transaction Terms and Multiples 3 Target: Brand Group Holdings, Inc. (“Brand”) Implied Purchase Price: $453 million aggregate consideration (1)(2) $1,447 per Brand common share (1) Price / Tangible Book Value per Share: 224% Consideration: 95% stock / 5% cash (1) 32.87 RNST shares and $77.50 of cash for each Brand common share, subject to adjustment (3) Tax free transaction for stock component Options: All in-the-money options to be cashed out at a fixed price of $1,550 at close, subject to adjustment (3) Pro Forma Ownership Split: 83.5% RNST / 16.5% Brand Additional Related Transactions Prior to Closing: $54.8 million of Brand’s classified assets to be sold at current book balance Brand’s mortgage subsidiary divested Management and Board of Directors: Brand’s CEO, Bartow Morgan Jr., appointed Chief Commercial Banking Officer One independent Brand director will be appointed to the RNST board Required Approvals: Customary regulatory approval and Brand shareholder approval Expected Closing: Third quarter 2018 Based on RNST’s stock price of $41.66 as of 3/27/18, a fixed per share exchange ratio of 32.87x and a per share cash payment of $77.50 Includes the value of options that will be cashed out at closing If classified assets are sold at a discount to current book balance, the purchase price to common holders will be reduced on a dollar for dollar basis based upon the after-tax difference; the option cash-out amount will be adjusted similarly
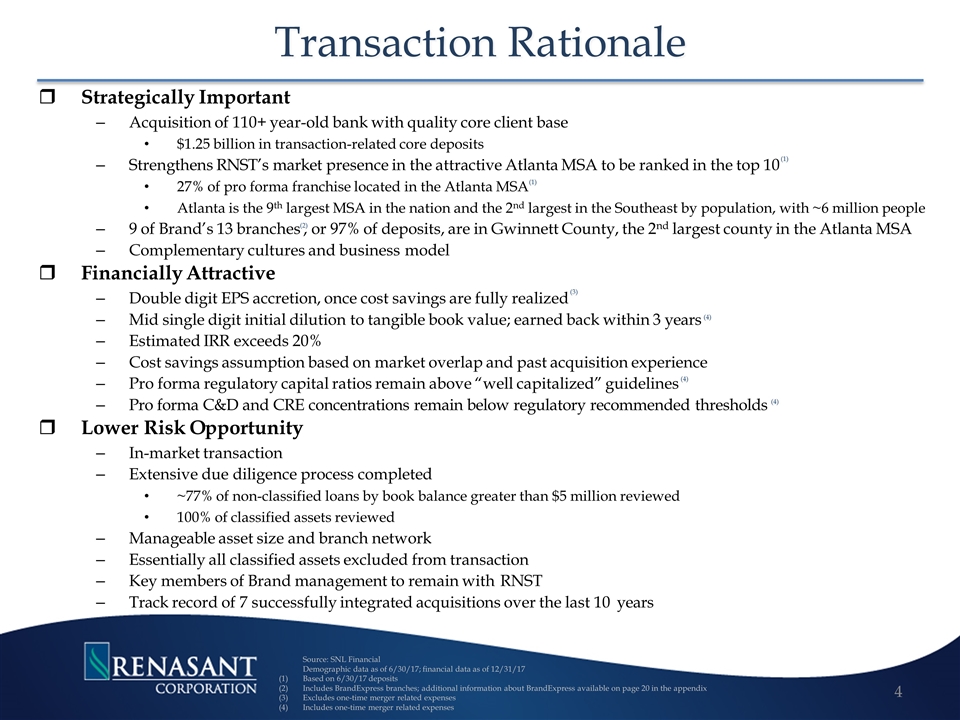
Transaction Rationale Strategically Important Acquisition of 110+ year-old bank with quality core client base $1.25 billion in transaction-related core deposits Strengthens RNST’s market presence in the attractive Atlanta MSA to be ranked in the top 10 27% of pro forma franchise located in the Atlanta MSA Atlanta is the 9th largest MSA in the nation and the 2nd largest in the Southeast by population, with ~6 million people 9 of Brand’s 13 branches , or 97% of deposits, are in Gwinnett County, the 2nd largest county in the Atlanta MSA Complementary cultures and business model Financially Attractive Double digit EPS accretion, once cost savings are fully realized Mid single digit initial dilution to tangible book value; earned back within 3 years Estimated IRR exceeds 20% Cost savings assumption based on market overlap and past acquisition experience Pro forma regulatory capital ratios remain above “well capitalized” guidelines Pro forma C&D and CRE concentrations remain below regulatory recommended thresholds Lower Risk Opportunity In-market transaction Extensive due diligence process completed ~77% of non-classified loans by book balance greater than $5 million reviewed 100% of classified assets reviewed Manageable asset size and branch network Essentially all classified assets excluded from transaction Key members of Brand management to remain with RNST Track record of 7 successfully integrated acquisitions over the last 10 years Source: SNL Financial Demographic data as of 6/30/17; financial data as of 12/31/17 Based on 6/30/17 deposits Includes BrandExpress branches; additional information about BrandExpress available on page 20 in the appendix Excludes one-time merger related expenses Includes one-time merger related expenses (2) (1) (1) (3) (4) (4) (4)
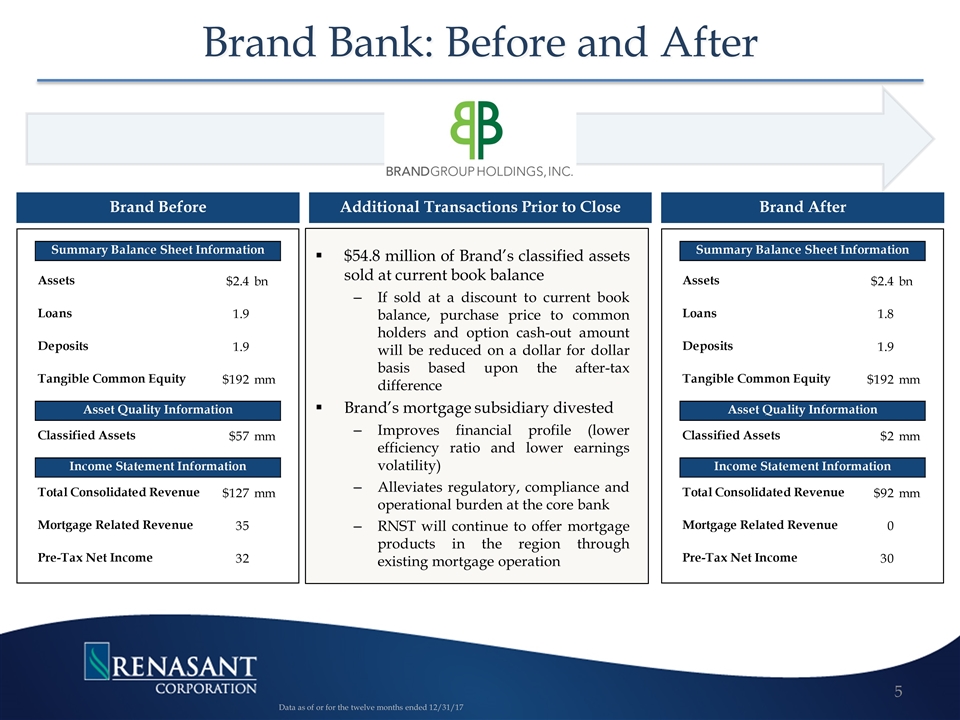
Brand Bank: Before and After Brand Before Brand After Additional Transactions Prior to Close Data as of or for the twelve months ended 12/31/17 $54.8 million of Brand’s classified assets sold at current book balance If sold at a discount to current book balance, purchase price to common holders and option cash-out amount will be reduced on a dollar for dollar basis based upon the after-tax difference Brand’s mortgage subsidiary divested Improves financial profile (lower efficiency ratio and lower earnings volatility) Alleviates regulatory, compliance and operational burden at the core bank RNST will continue to offer mortgage products in the region through existing mortgage operation
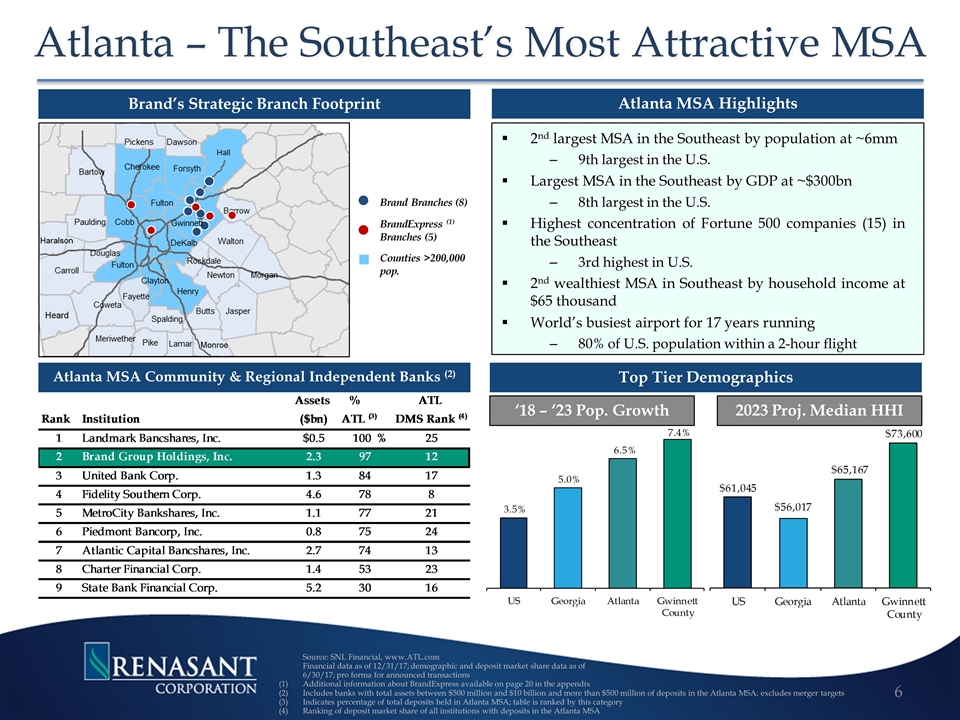
Brand’s Strategic Branch Footprint Atlanta MSA Highlights Atlanta MSA Community & Regional Independent Banks (2) Atlanta – The Southeast’s Most Attractive MSA BrandExpress (1) Branches (5) Brand Branches (8) Counties >200,000 pop. Top Tier Demographics ‘18 – ‘23 Pop. Growth 2023 Proj. Median HHI Source: SNL Financial, www.ATL.com Financial data as of 12/31/17; demographic and deposit market share data as of 6/30/17; pro forma for announced transactions Additional information about BrandExpress available on page 20 in the appendix Includes banks with total assets between $500 million and $10 billion and more than $500 million of deposits in the Atlanta MSA; excludes merger targets Indicates percentage of total deposits held in Atlanta MSA; table is ranked by this category Ranking of deposit market share of all institutions with deposits in the Atlanta MSA 2nd largest MSA in the Southeast by population at ~6mm 9th largest in the U.S. Largest MSA in the Southeast by GDP at ~$300bn 8th largest in the U.S. Highest concentration of Fortune 500 companies (15) in the Southeast 3rd highest in U.S. 2nd wealthiest MSA in Southeast by household income at $65 thousand World’s busiest airport for 17 years running 80% of U.S. population within a 2-hour flight
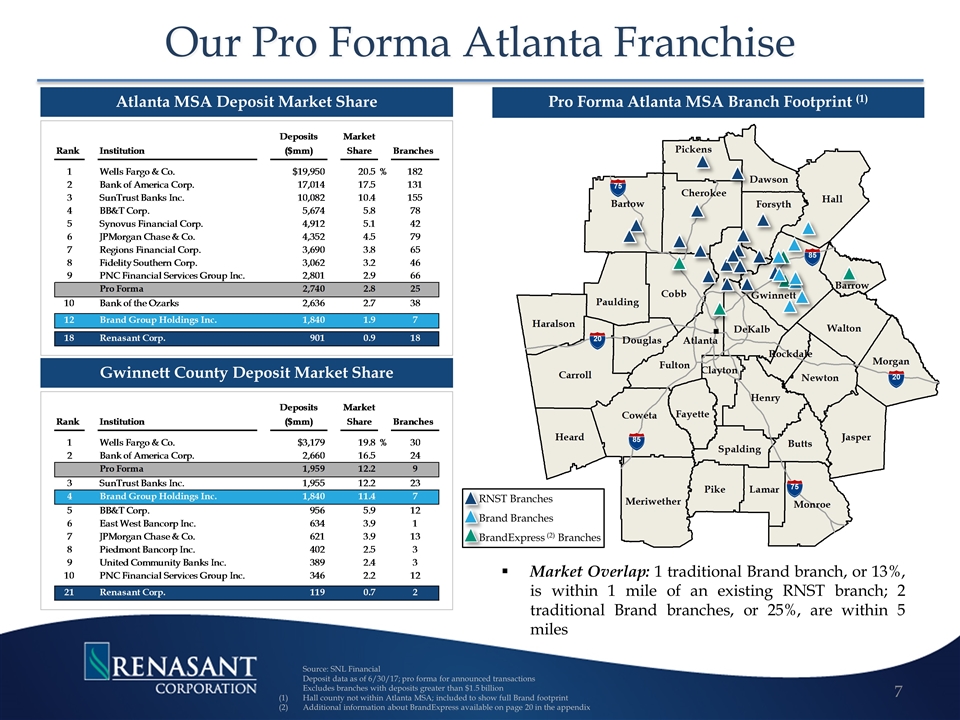
20 20 85 75 75 85 20 20 85 75 75 85 Our Pro Forma Atlanta Franchise Source: SNL Financial Deposit data as of 6/30/17; pro forma for announced transactions Excludes branches with deposits greater than $1.5 billion Hall county not within Atlanta MSA; included to show full Brand footprint Additional information about BrandExpress available on page 20 in the appendix Atlanta MSA Deposit Market Share Gwinnett County Deposit Market Share Pro Forma Atlanta MSA Branch Footprint (1) Market Overlap: 1 traditional Brand branch, or 13%, is within 1 mile of an existing RNST branch; 2 traditional Brand branches, or 25%, are within 5 miles RNST Branches Brand Branches BrandExpress (2) Branches
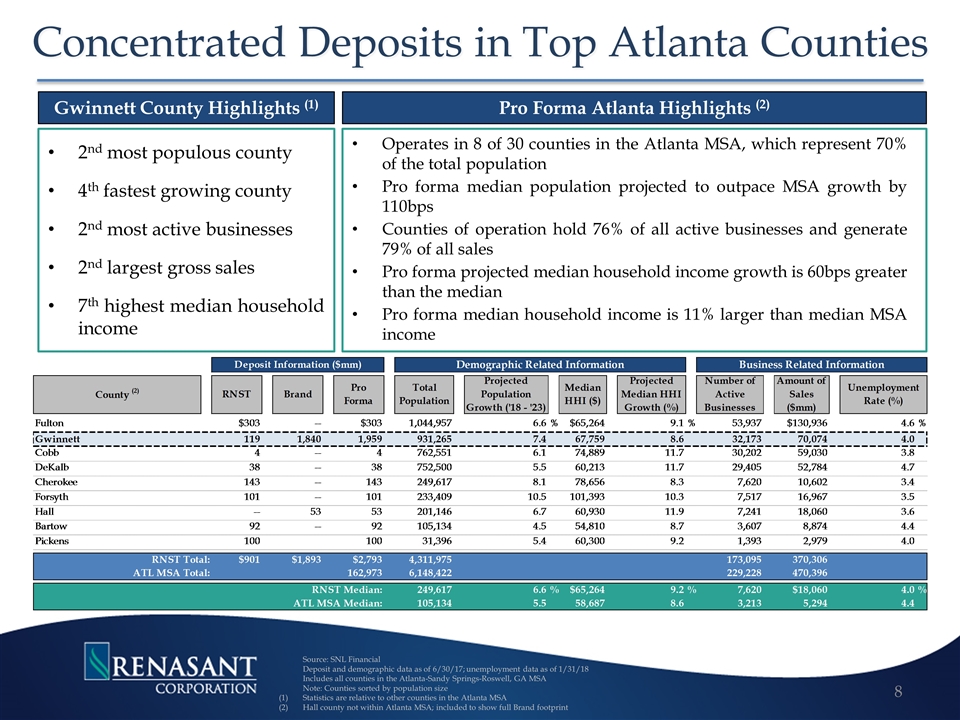
Concentrated Deposits in Top Atlanta Counties Source: SNL Financial Deposit and demographic data as of 6/30/17; unemployment data as of 1/31/18 Includes all counties in the Atlanta-Sandy Springs-Roswell, GA MSA Note: Counties sorted by population size Statistics are relative to other counties in the Atlanta MSA Hall county not within Atlanta MSA; included to show full Brand footprint Gwinnett County Highlights (1) 2nd most populous county 4th fastest growing county 2nd most active businesses 2nd largest gross sales 7th highest median household income Pro Forma Atlanta Highlights (2) Operates in 8 of 30 counties in the Atlanta MSA, which represent 70% of the total population Pro forma median population projected to outpace MSA growth by 110bps Counties of operation hold 76% of all active businesses and generate 79% of all sales Pro forma projected median household income growth is 60bps greater than the median Pro forma median household income is 11% larger than median MSA income
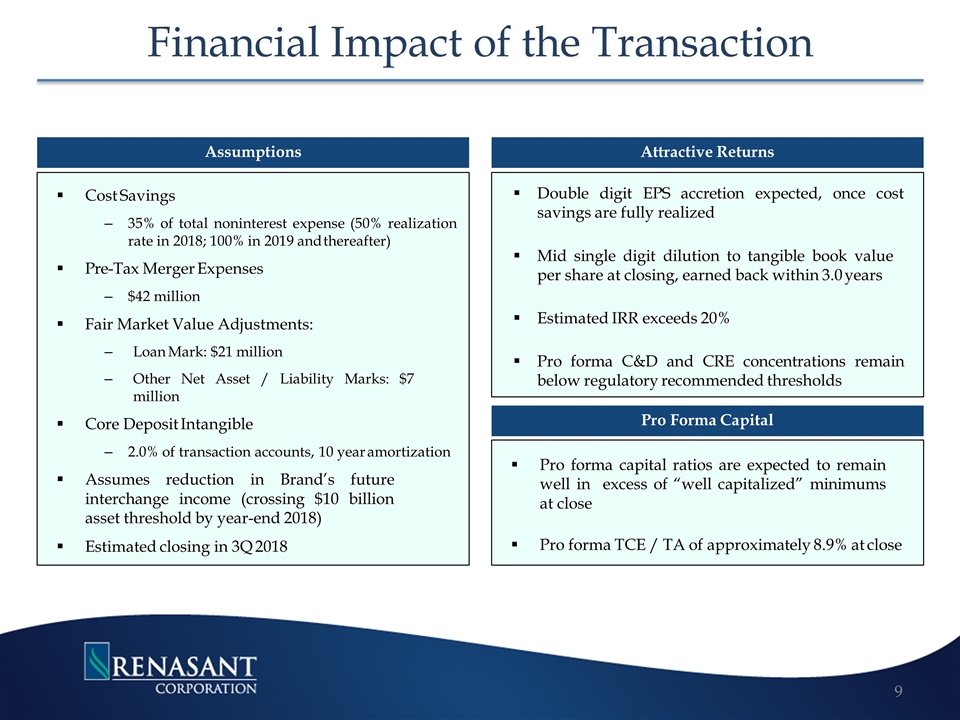
Financial Impact of the Transaction Assumptions Attractive Returns Pro Forma Capital Double digit EPS accretion expected, once cost savings are fully realized Mid single digit dilution to tangible book value per share at closing, earned back within 3.0 years Estimated IRR exceeds 20% Pro forma C&D and CRE concentrations remain below regulatory recommended thresholds Pro forma capital ratios are expected to remain well in excess of “well capitalized” minimums at close Pro forma TCE / TA of approximately 8.9% at close Cost Savings 35% of total noninterest expense (50% realization rate in 2018; 100% in 2019 and thereafter) Pre-Tax Merger Expenses $42 million Fair Market Value Adjustments: Loan Mark: $21 million Other Net Asset / Liability Marks: $7 million Core Deposit Intangible 2.0% of transaction accounts, 10 year amortization Assumes reduction in Brand’s future interchange income (crossing $10 billion asset threshold by year-end 2018) Estimated closing in 3Q 2018 Pro Forma Capital
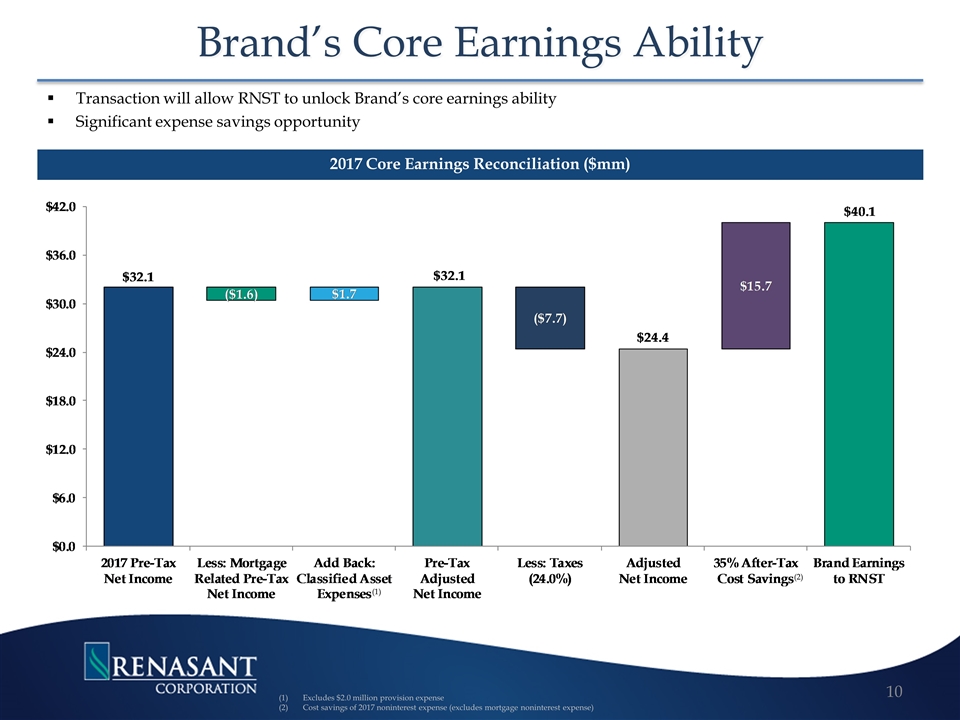
Brand’s Core Earnings Ability 2017 Core Earnings Reconciliation ($mm) Excludes $2.0 million provision expense Cost savings of 2017 noninterest expense (excludes mortgage noninterest expense) Transaction will allow RNST to unlock Brand’s core earnings ability Significant expense savings opportunity (2) (1)
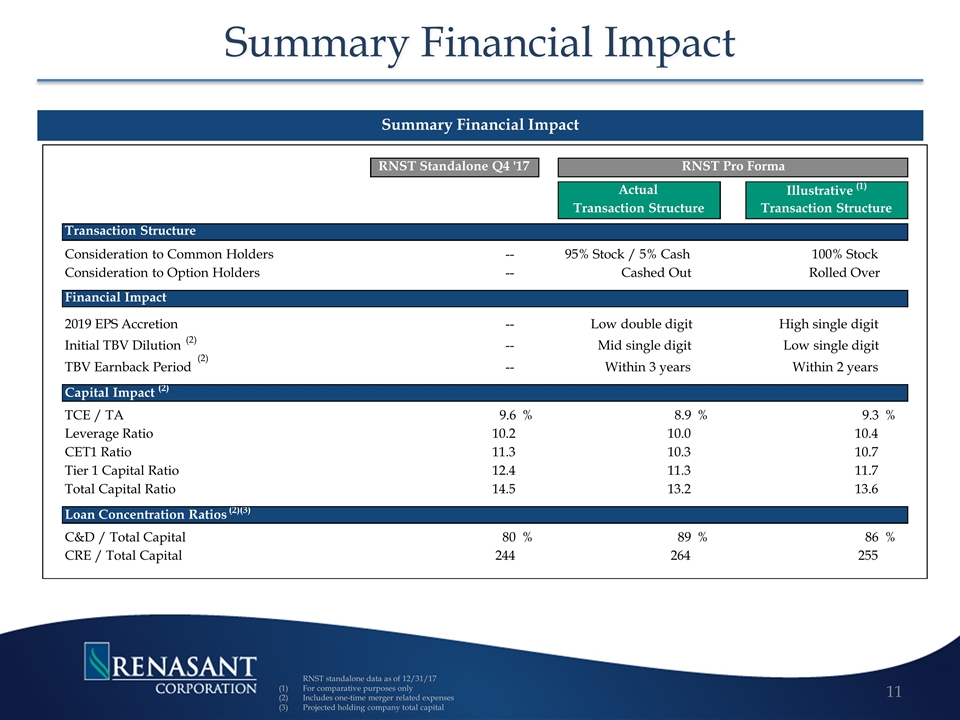
Summary Financial Impact Summary Financial Impact RNST standalone data as of 12/31/17 For comparative purposes only Includes one-time merger related expenses Projected holding company total capital RNST Standalone Q4 '17 RNST Pro Forma Actual Illustrative (1) Transaction Structure Transaction Structure Transaction Structure Consideration to Common Holders -- 95% Stock / 5% Cash 100% Stock Consideration to Option Holders -- Cashed Out Rolled Over Financial Impact 2019 EPS Accretion -- Low double digit High single digit Initial TBV Dilution (2) -- Mid single digit Low single digit TBV Earnback Period -- Within 3 years Within 2 years Capital Impact (2) TCE / TA 9.6 % 8.9 % 9.3 % Leverage Ratio 10.2 10.0 10.4 CET1 Ratio 11.3 10.3 10.7 Tier 1 Capital Ratio 12.4 11.3 11.7 Total Capital Ratio 14.5 13.2 13.6 Loan Concentration Ratios (2)(3) C&D / Total Capital 80 % 89 % 86 % CRE / Total Capital 244 264 255 (2)
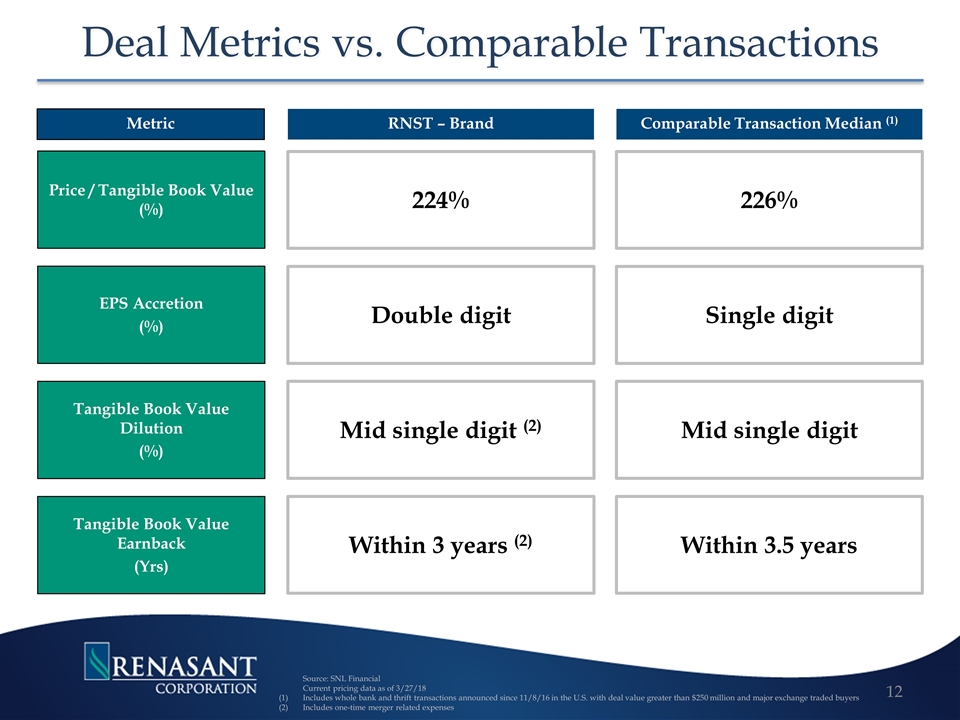
Deal Metrics vs. Comparable Transactions Metric RNST – Brand Comparable Transaction Median (1) Source: SNL Financial Current pricing data as of 3/27/18 Includes whole bank and thrift transactions announced since 11/8/16 in the U.S. with deal value greater than $250 million and major exchange traded buyers Includes one-time merger related expenses EPS Accretion (%) Tangible Book Value Dilution (%) Tangible Book Value Earnback (Yrs) Price / Tangible Book Value (%) Double digit Single digit Mid single digit (2) Mid single digit Within 3 years (2) Within 3.5 years 224% 226%
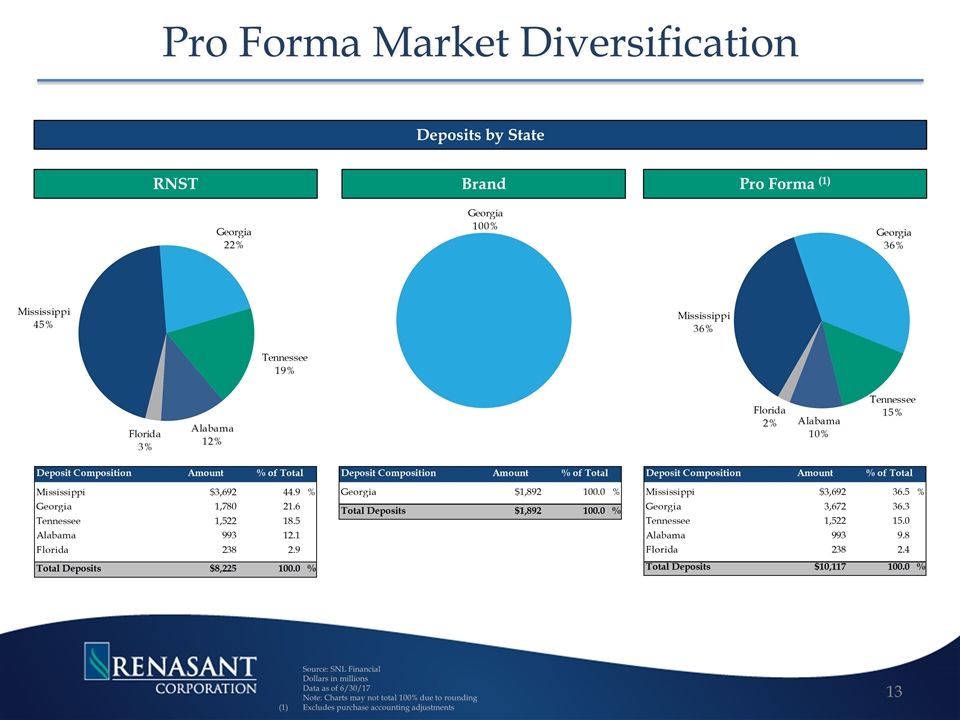
Pro Forma Market Diversification Source: SNL Financial Dollars in millions Data as of 6/30/17 Note: Charts may not total 100% due to rounding Excludes purchase accounting adjustments RNST Brand Pro Forma (1) Deposits by State
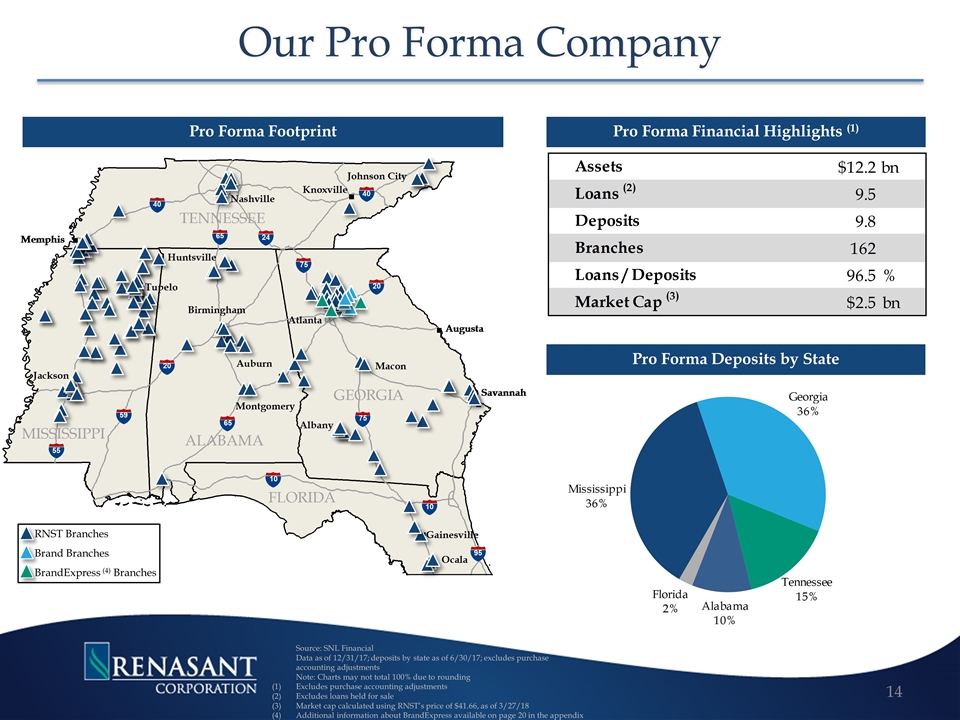
75 75 24 40 65 40 20 20 59 55 95 10 10 65 Our Pro Forma Company Pro Forma Footprint Source: SNL Financial Data as of 12/31/17; deposits by state as of 6/30/17; excludes purchase accounting adjustments Note: Charts may not total 100% due to rounding Excludes purchase accounting adjustments Excludes loans held for sale Market cap calculated using RNST’s price of $41.66, as of 3/27/18 Additional information about BrandExpress available on page 20 in the appendix Pro Forma Financial Highlights (1) Pro Forma Deposits by State RNST Branches Brand Branches BrandExpress (4) Branches

Appendix
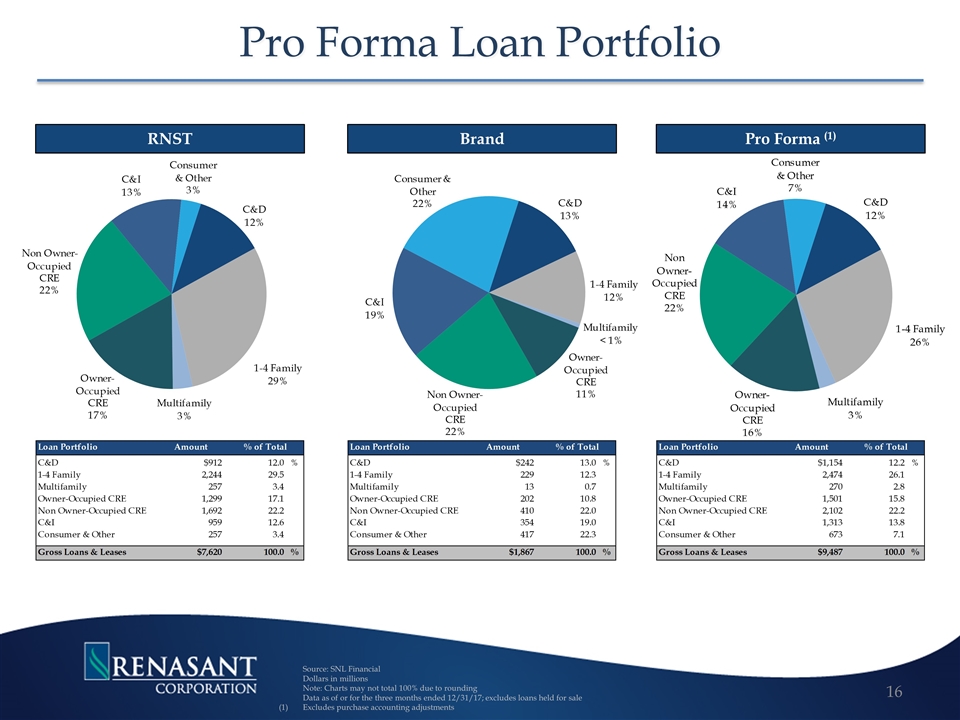
Pro Forma Loan Portfolio Source: SNL Financial Dollars in millions Note: Charts may not total 100% due to rounding Data as of or for the three months ended 12/31/17; excludes loans held for sale Excludes purchase accounting adjustments RNST Brand Pro Forma (1)
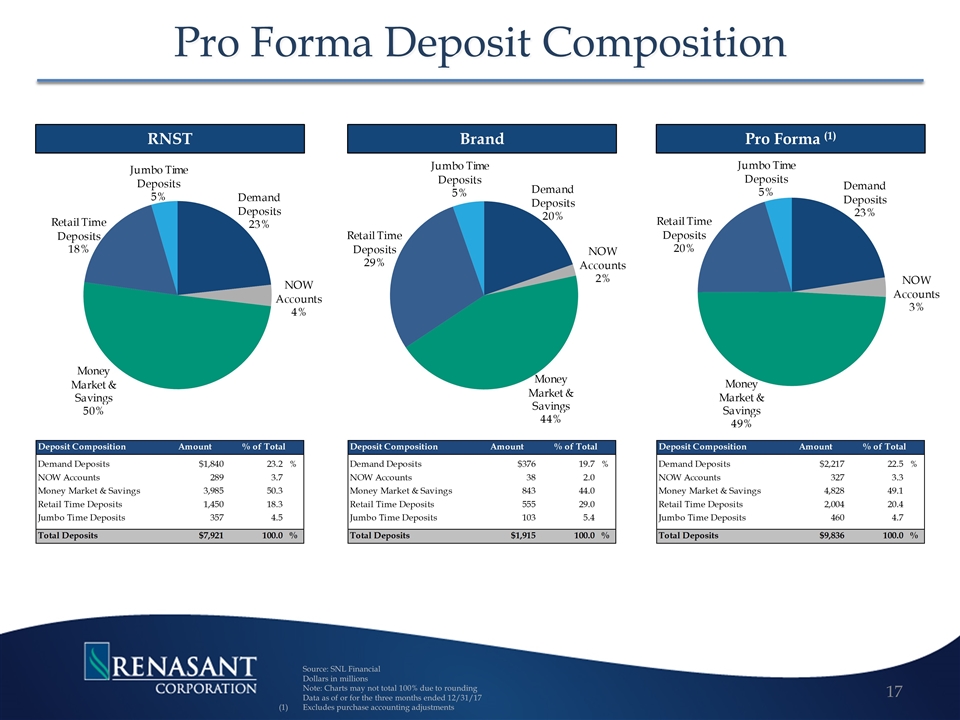
Pro Forma Deposit Composition Source: SNL Financial Dollars in millions Note: Charts may not total 100% due to rounding Data as of or for the three months ended 12/31/17 Excludes purchase accounting adjustments RNST Brand Pro Forma (1)
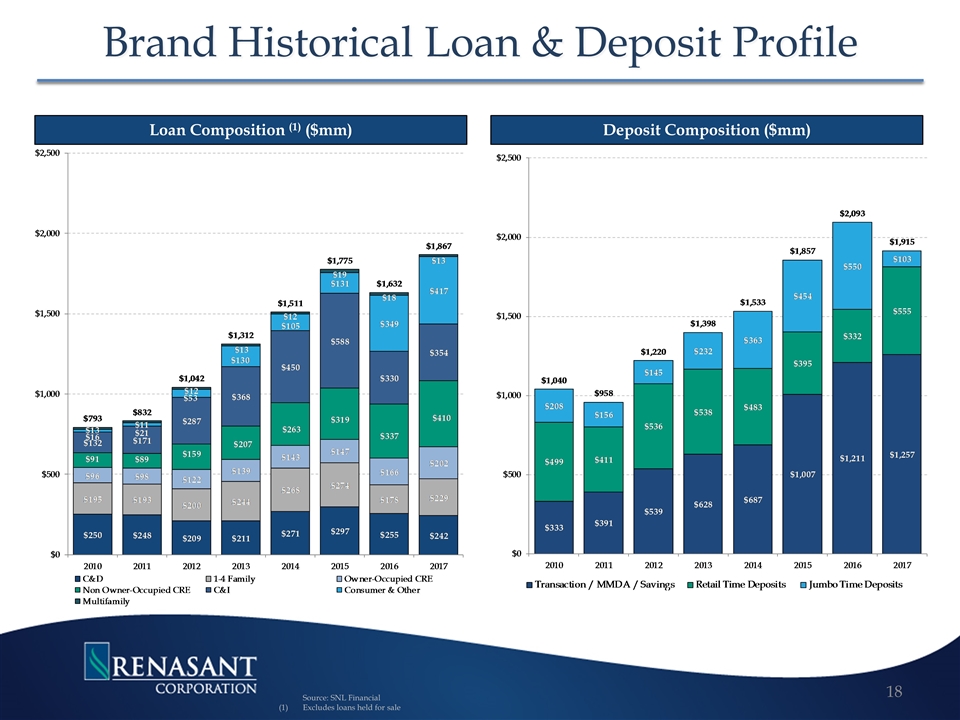
Brand Historical Loan & Deposit Profile Source: SNL Financial Excludes loans held for sale Loan Composition (1) ($mm) Deposit Composition ($mm)
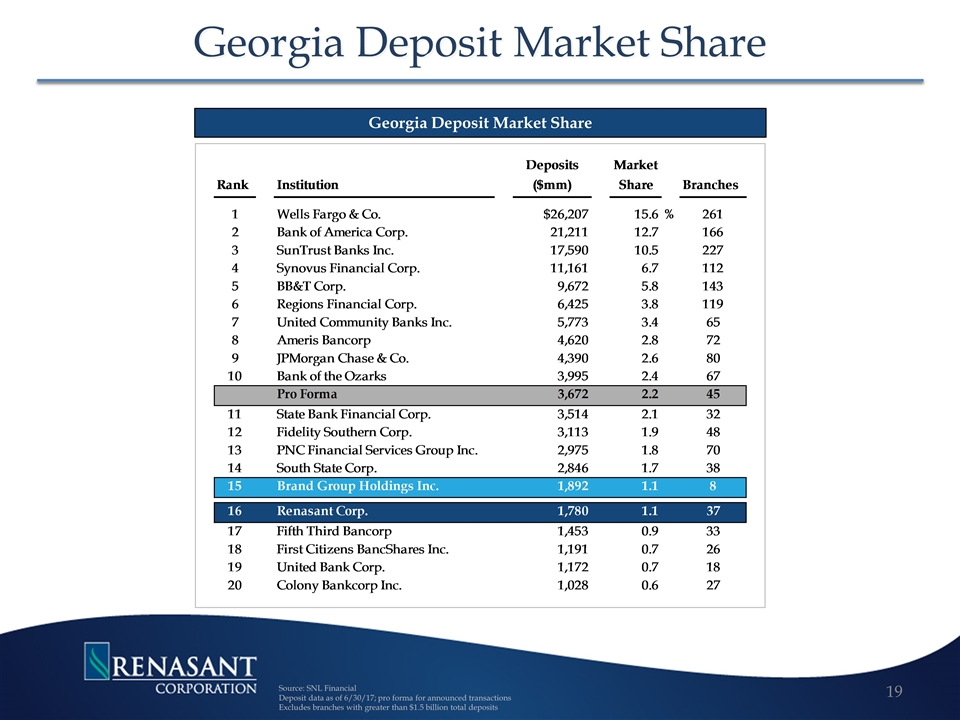
Georgia Deposit Market Share Source: SNL Financial Deposit data as of 6/30/17; pro forma for announced transactions Excludes branches with greater than $1.5 billion total deposits Georgia Deposit Market Share
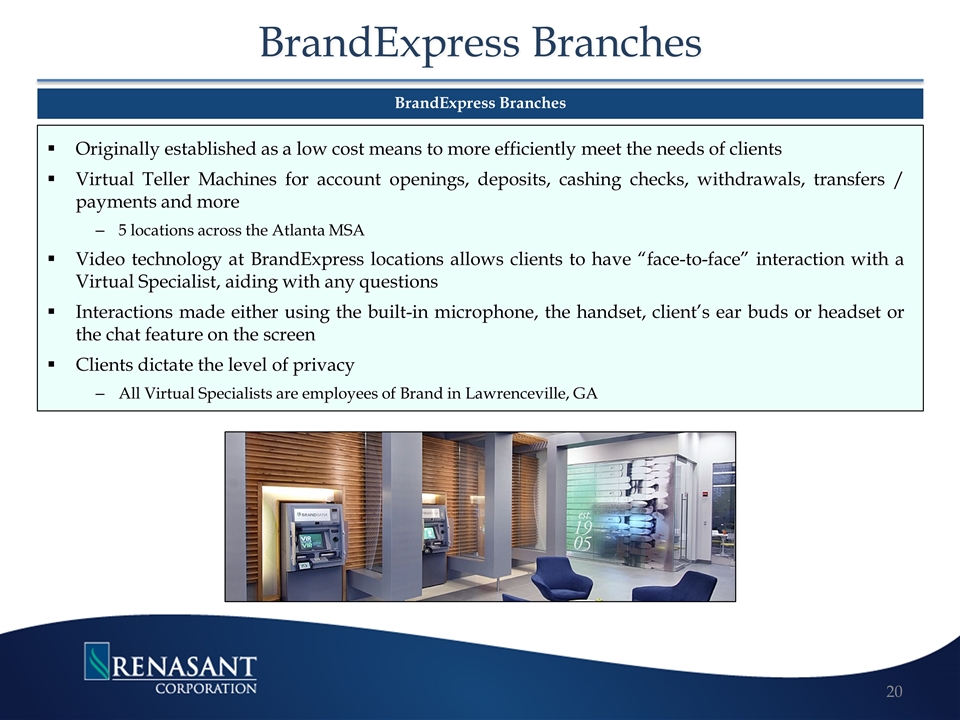
BrandExpress Branches BrandExpress Branches Originally established as a low cost means to more efficiently meet the needs of clients Virtual Teller Machines for account openings, deposits, cashing checks, withdrawals, transfers / payments and more 5 locations across the Atlanta MSA Video technology at BrandExpress locations allows clients to have “face-to-face” interaction with a Virtual Specialist, aiding with any questions Interactions made either using the built-in microphone, the handset, client’s ear buds or headset or the chat feature on the screen Clients dictate the level of privacy All Virtual Specialists are employees of Brand in Lawrenceville, GA
Additional Information Renasant intends to file a registration statement on Form S-4 that will include a proxy statement for Brand and a prospectus of Renasant, and Renasant will file relevant documents concerning the merger with the Securities and Exchange Commission (the “SEC”). This presentation does not constitute an offer to sell or the solicitation of an offer to buy any securities. BRAND INVESTORS ARE URGED TO READ THE PROXY STATEMENT/PROSPECTUS AND ANY OTHER DOCUMENTS TO BE FILED WITH THE SEC IN CONNECTION WITH THE MERGER OR INCORPORATED BY REFERENCE IN THE PROXY STATEMENT/PROSPECTUS BECAUSE THEY WILL CONTAIN IMPORTANT INFORMATION ABOUT RENASANT, BRAND AND THE PROPOSED MERGER. When available, the proxy statement/prospectus will be mailed to shareholders of Brand. Investors will also be able to obtain copies of the proxy statement/prospectus and other relevant documents (when they become available) free of charge at the SEC’s Web site (www.sec.gov). In addition, documents filed with the SEC by Renasant will be available free of charge from Kevin Chapman, Executive Vice President and Chief Financial Officer, Renasant Corporation, 209 Troy Street, Tupelo, Mississippi 38804-4827, telephone: (662) 680-1450.
Investor Inquiries E. Robinson McGraw Chairman Chief Executive Officer C. Mitchell Waycaster President Chief Operating Officer Kevin D. Chapman Executive Vice President Chief Financial Officer 209 TROY STREET TUPELO, MS 38804-4827 PHONE: 1-800-680-1001 FACSIMILE: 1-662-680-1234 WWW.RENASANT.COM WWW.RENASANTBANK.COM
