Attached files
| file | filename |
|---|---|
| EX-21.1 - EXHIBIT 21.1 - SecureWorks Corp | exhibit21110kfy2018.htm |
| EX-32.1 - EXHIBIT 32.1 - SecureWorks Corp | exhibit32110kfy2018.htm |
| EX-31.2 - EXHIBIT 31.2 - SecureWorks Corp | exhibit31210kfy2018.htm |
| EX-31.1 - EXHIBIT 31.1 - SecureWorks Corp | exhibit31110kfy2018.htm |
| EX-23.1 - EXHIBIT 23.1 - SecureWorks Corp | exhibit23110kfy2018.htm |
| EX-10.8.1 - EXHIBIT 10.8.1 - SecureWorks Corp | exhibit108110kfy2018.htm |
| EX-10.1.2 - EXHIBIT 10.1.2 - SecureWorks Corp | exhibit101210kfy2018.htm |
UNITED STATES
SECURITIES AND EXCHANGE COMMISSION
WASHINGTON, D.C. 20549
FORM 10-K
(Mark One) | ||
þ | ANNUAL REPORT PURSUANT TO SECTION 13 OR 15(d) OF THE SECURITIES EXCHANGE ACT OF 1934 | |
For the fiscal year ended February 2, 2018 | ||
or | ||
o | TRANSITION REPORT PURSUANT TO SECTION 13 OR 15(d) OF THE SECURITIES EXCHANGE ACT OF 1934 | |
For the transition period from to | ||
Commission file number: 001-37748

SecureWorks Corp.
(Exact name of registrant as specified in its charter)
Delaware | 27-0463349 | |
(State or other jurisdiction of incorporation or organization) | (I.R.S. Employer Identification No.) | |
One Concourse Parkway NE Suite 500, Atlanta, Georgia 30328
(Address of principal executive offices) (Zip Code)
Registrant’s telephone number, including area code: (404)327-6339
Securities registered pursuant to Section 12(b) of the Act:
Title of each class | Name of each exchange on which registered | |
Class A Common Stock, par value $0.01 per share | The NASDAQ Stock Market LLC (NASDAQ Global Select Market) | |
Securities registered pursuant to Section 12(g) of the Act: None
Indicate by check mark if the registrant is a well-known seasoned issuer, as defined in Rule 405 of the Securities Act. Yes o No R
Indicate by check mark if the registrant is not required to file reports pursuant to Section 13 or Section 15(d) of the Act. Yes o No R
Indicate by check mark whether the registrant (1) has filed all reports required to be filed by Section 13 or 15(d) of the Securities Exchange Act of 1934 during the preceding 12 months (or for such shorter period that the registrant was required to file such reports), and (2) has been subject to such filing requirements for the past 90 days. Yes R No o
Indicate by check mark whether the registrant has submitted electronically and posted on its corporate Web site, if any, every Interactive Data File required to be submitted and posted pursuant to Rule 405 of Regulation S-T during the preceding 12 months (or for such shorter period that the registrant was required to submit and post such files). Yes R No o
Indicate by check mark if disclosure of delinquent filers pursuant to Item 405 of Regulation S-K is not contained herein, and will not be contained, to the best of registrant’s knowledge, in definitive proxy or information statements incorporated by reference in Part III of this Form 10-K or any amendment to this Form 10-K. R
Indicate by check mark whether the registrant is a large accelerated filer, an accelerated filer, a non-accelerated filer, smaller reporting company, or an emerging growth company. See the definitions of “large accelerated filer,” “accelerated filer,” “smaller reporting company,” and “emerging growth company” in Rule 12b-2 of the Exchange Act.
Large accelerated filer ¨ | Accelerated filer þ | |
Non-accelerated filer ¨ (Do not check if a smaller reporting company) | Smaller reporting company ¨ | |
Emerging growth company þ | ||
If an emerging growth company, indicate by check mark if the registrant has elected not to use the extended transition period for complying with any new or revised financial accounting standards provided pursuant to Section 13(a) of the Exchange Act. þ
Indicate by check mark whether the registrant is a shell company (as defined in Rule 12b-2 of the Exchange Act). Yes ¨ No þ
As of August 4, 2017, the last business day of the registrant’s most recently completed second fiscal quarter, the aggregate market value of the registrant’s common stock held by non-affiliates was approximately $104.2 million (based on the closing price of $10.70 per share of Class A common stock reported on the NASDAQ Global Select Market on that date).
As of March 26, 2018, there were 81,772,505 shares of the registrant’s common stock outstanding, consisting of 11,772,505 outstanding shares of Class A common stock and 70,000,000 outstanding shares of Class B common stock.
DOCUMENTS INCORPORATED BY REFERENCE
The information required by Part III of this report, to the extent not set forth herein, is incorporated by reference from the registrant’s proxy statement relating to the annual meeting of stockholders in 2018. Such proxy statement will be filed with the Securities and Exchange Commission within 120 days after the end of the fiscal year to which this report relates.
TABLE OF CONTENTS | |||||
PAGE | |||||
CAUTIONARY NOTE REGARDING FORWARD-LOOKING STATEMENTS
This report contains “forward-looking statements” within the meaning of Section 27A of the Securities Act of 1933 and Section 21E of the Securities Exchange Act of 1934. The words “may,” “will,” “anticipate,” “estimate,” “expect,” “intend,” “plan,” “aim,” “seek” and similar expressions as they relate to us or our management are intended to identify these forward-looking statements. All statements by us regarding our expected financial position, revenues, cash flows and other operating results, business strategy, legal proceedings, and similar matters are forward-looking statements. Our expectations expressed or implied in these forward-looking statements may not turn out to be correct. Our results could be materially different from our expectations because of various risks, including the risks discussed in this report under “Part I – Item 1A – Risk Factors” and in our other periodic and current reports filed with the Securities and Exchange Commission. Any forward-looking statement speaks only as of the date as of which such statement is made, and, except as required by law, we undertake no obligation to update any forward-looking statement after the date as of which such statement was made, whether to reflect changes in circumstances or our expectations, the occurrence of unanticipated events, or otherwise.
3
Except where the context otherwise requires or where otherwise indicated, all references in this report to “Secureworks,” “we.” “us,” “our” and “our company” refer to SecureWorks Corp. and our subsidiaries on a consolidated basis, and all references to “Dell” refer to Dell Inc. and its subsidiaries on a consolidated basis.
Our fiscal year is the 52- or 53-week period ending on the Friday nearest January 31. Our 2018 fiscal year ended on February 2, 2018, our 2017 fiscal year ended on February 3, 2017 and our 2016 fiscal year ended on January 29, 2016.
Part I
Item 1. Business
Our Mission
Our mission is to protect organizations in the digitally connected world.
Overview
We are a leading global cybersecurity company that protects organizations in the digitally connected world. We combine visibility from thousands of clients, machine learning and automation from our industry-leading SecureWorks Counter Threat PlatformTM, and actionable insights from our team of elite researchers, analysts and consultants to create a powerful network effect that provides increasingly strong protection for our clients. By aggregating and analyzing data from various sources around the world, we prevent security breaches, detect malicious activity in real time, respond rapidly and predict emerging threats.
Our mission is to unlock the value of our clients’ security investments by simplifying their complex security operations and amplifying their defenses. Through our vendor-neutral approach, we create integrated and comprehensive solutions by proactively managing the collection of “point” products deployed by our clients to address specific security issues and provide supplemental solutions where gaps exist in our clients’ defenses. We customize the right level of security for each client's unique situation, which evolves as the client's organization grows and changes.
We have pioneered an integrated approach that delivers a broad portfolio of information security solutions to organizations of varying size and complexity. Our flexible and scalable solutions support the evolving needs of the largest, most sophisticated enterprises staffed with in-house security experts, as well as small and medium-sized businesses and government agencies with limited in-house capabilities and resources.
Our solutions enable organizations to:
• | prevent security breaches by fortifying their cyber defenses, |
• | detect malicious activity, |
• | respond rapidly to security breaches, and |
• | predict emerging threats. |
The solutions leverage our proprietary technologies, processes and extensive expertise in the information security industry, which we have developed over more than 18 years. Key elements of our strategy include:
• | maintain and extend our technology leadership, |
• | expand and diversify our client base, |
• | deepen our existing client relationships, and |
• | attract and retain top talent. |
As of February 2, 2018, we served approximately 4,400 clients across 59 countries. Our success in serving our clients has resulted in consistent recognition of our company as a market leader in managed security services by leading industry research firms.
4
The fees we charge for our solutions vary based on a number of factors, including the solutions selected, the number of client devices covered by the selected solutions, and the level of management we provide for the solutions. Historically, approximately 80% of our revenue was derived from subscription-based solutions, provided under managed security services, while approximately 20% was derived from professional services engagements. As we respond to the evolving needs of our clients, the relative mix of subscription-based solutions and professional services we provide our clients may fluctuate.
Corporate Information
We are a holding company that conducts operations through our wholly-owned subsidiaries. The mailing address of our principal executive offices is One Concourse Parkway NE, Suite 500, Atlanta, Georgia 30328. Our telephone number at that address is (404) 327-6339.
The predecessor company of SecureWorks Corp. was originally formed as a limited liability company in Georgia in March 1999, and SecureWorks was incorporated in Georgia in May 2009. In February 2011, SecureWorks was acquired by Dell Inc. In November 2015, our company reincorporated from Georgia to Delaware and, in connection with the reincorporation, changed its name from SecureWorks Holding Corporation to SecureWorks Corp. On April 27, 2016, SecureWorks completed its initial public offering, or IPO. Upon the closing of the IPO, Dell Technologies Inc., the ultimate parent company of Dell, Inc., owned indirectly through Dell Inc. and Dell Inc.’s subsidiaries no shares of our outstanding Class A common stock and all shares of our outstanding Class B common stock, which as of February 2, 2018 represented approximately 86.3% of our total outstanding shares of common stock and approximately 98.4% of the combined voting power of both classes of our outstanding common stock.
We maintain a corporate Internet website at www.secureworks.com. We make available free of charge through our website our annual reports on Form 10-K, quarterly reports on Form 10-Q, current reports on Form 8-K, and amendments to those reports, as soon as reasonably practicable after we electronically file the reports with, or furnish the reports to, the Securities and Exchange Commission. Information appearing on, or that can be accessed through, our website is not a part of this report.
Industry Background
Increasing cybersecurity challenges have created a large and fragmented market for IT security products and services.
We believe that many organizations that use the information technology, or IT, security products and services available in the market remain vulnerable to cyber attacks because they rely on a collection of uncoordinated “point” products that address specific security issues but fall short in identifying and defending against next-generation cyber threats.
Organizations of all sizes are using new information technologies to make their businesses more productive and effective.
Modern IT infrastructures are growing in complexity and often include a combination of on-premises, cloud and hybrid environments. In addition, the adoption of mobile computing allows access to critical business information from various devices and locations. The widespread adoption of these advanced IT architectures, along with the rapid growth of connected devices and new ways of delivering IT services, enables organizations to benefit from business applications that are more powerful and easier to deploy, use and maintain.
This rapidly evolving IT environment is increasingly vulnerable to frequent and sophisticated cyber attacks.
The evolving landscape of applications, modes of communication and IT architectures makes it increasingly challenging for businesses to protect their critical business assets from cyber threats. New technologies heighten security risks by increasing the number of ways a threat actor can attack a target by giving users greater access to important business networks and information and by facilitating the transfer of control of underlying applications and infrastructure to third-party vendors.
Cyber attacks have evolved from computer viruses written by amateur hackers into highly complex and targeted attacks led by highly skilled adversaries intent on stealing information or causing financial and reputational damage.
5
The economic and reputational impact of attacks, coupled with growing regulatory requirements, makes cybersecurity defense increasingly a priority for senior management and boards of directors.
In the wake of numerous high-profile data breaches, organizations are increasingly aware of the financial and reputational risks associated with IT security vulnerabilities. We believe that the cybersecurity programs of most organizations do not rival the persistence, tactical skill and technological prowess of today’s cyber adversaries. As a result, cyber attacks are successfully breaching organizations’ networks. Security breaches can be highly public and result in reputational damage and legal liability as well as large losses in productivity and revenue. Many organizations are particularly concerned about attacks that attempt to misappropriate sensitive and valuable business information. Adding to the urgency of the IT security challenge, new regulations and industry-specific compliance requirements direct organizations to design, implement, document and demonstrate controls and processes to maintain the integrity and confidentiality of information received and stored on their systems.
The traditional cybersecurity approach of using numerous point products often fails to detect threats and block attacks.
Information systems at many organizations are vulnerable to breach because they rely on a collection of uncoordinated point security products that address security risks in a piecemeal fashion rather than in a proactive and coordinated manner. An effective cyber defense strategy requires the coordinated deployment of multiple products and services tailored to an organization’s specific security needs. Point products, however, primarily address security issues in a reactive manner by employing passive auditing or basic blocking techniques, and often lack the integration and intelligent monitoring capabilities and management within a common framework necessary to provide effective information security throughout an organization.
Identifying and hiring qualified security professionals are significant challenges for many organizations.
The difficulty in providing effective information security is exacerbated by the highly competitive environment for identifying, hiring and retaining qualified information security professionals.
As a result, organizations engage information security services vendors to integrate, monitor and manage their point products to enhance their defenses against cyber threats.
Because many organizations cannot adequately protect their networks from cyber threats, they are augmenting their IT security strategies to include information security services. By using these services, organizations seek to decrease their vulnerability to security breaches, increase the effectiveness of their existing investments in security products and free their own IT staff to focus on other responsibilities.
Traditional information security services vendors, however, often fail to satisfy the IT security needs of organizations, causing many of them to seek the advantages of our solutions.
Many organizations lack sufficient internal cybersecurity expertise to keep pace with the rapidly evolving threat landscape. As a result, these organizations engage the support of information security services providers as part of their IT security strategy. However, traditional information security services offered by telecommunications providers, security product vendors, large IT outsourcing firms and small regional providers often lack a broad perspective on the threat landscape, are unable to scale their services to match organizations’ data processing requirements, fail to provide actionable security information, focus only on a subset of organizations’ security needs or have limited deployment options.
Our intelligence-driven information security solutions, as described below, offer an innovative approach to prevent, detect, respond to and predict cybersecurity breaches. We believe that our singular focus on providing a comprehensive portfolio of information security solutions makes us a trusted advisor and an attractive partner for our clients. This focus enables us to pursue a go-to-market strategy that addresses the diverse needs of our clients around the world. Our vendor-neutral approach enables our clients to enhance their evolving IT security infrastructure, appliances and best of breed technologies with our solutions and capabilities, which together provide our clients with both a comprehensive and highly-effective security defense posture.
6
Our Solutions
Our Counter Threat PlatformTM constitutes the core of our intelligence-driven information security solutions and provides our clients with a powerful integrated perspective regarding their network environments and security threats. Our integrated suite of solutions includes:
▪ | Managed security, through which we provide our clients global visibility and insight into malicious activity enabling them to detect and effectively remediate threats quickly |
▪ | Threat intelligence, through which we deliver early warnings of vulnerabilities and threats, along with actionable information to help prevent any adverse impact |
▪ | Security and risk consulting, through which we advise our clients on a variety of security and risk-related matters, such as how to design and build strategic security programs, assess and test security capabilities and meet regulatory requirements |
▪ | Incident response, through which we help our clients minimize the impact and duration of security breaches through proactive client preparation, rapid containment and thorough event analysis followed by effective remediation |
As part of our security and risk consulting solutions, we emphasize cloud security, through which we help clients deliver cloud-based services securely.
Our clients may subscribe to our full suite of solutions or elect to subscribe to various combinations of our individual solutions. All of our solutions are enabled by our Counter Threat Platform and our large team of highly-skilled security experts.
The key capabilities of our solutions currently include:
Global Visibility. We have global visibility into the cyber threat landscape through our approximately 4,400 subscription-based clients across 59 countries. We are able to gain near real time insights that enable us to predict, detect and respond to threats quickly and effectively. We also are able to identify threats originating within a particular geographic area or relating to a particular industry and proactively leverage this threat intelligence to protect other clients against these threats.
Scalable Platform with Powerful Network Effects. Our proprietary Counter Threat Platform features a multi-tenant, distributed architecture that enables our software to scale and to provide faster performance while efficiently utilizing its underlying infrastructure. The platform collects, aggregates, correlates and analyzes as many as 250 billion events daily from our extensive client base to provide near real time risk assessment and rapid response. As our client base increases, our platform is able to analyze more events, and the intelligence derived from these additional events makes the platform more effective. This in turn drives broader client adoption and enhances the value of the solutions to both new and existing clients.
Contextual and Predictive Threat Intelligence. Our proprietary and purpose-built technology analyzes and correlates billions of events using advanced analytical tools and sophisticated algorithms to generate threat intelligence. This intelligence is augmented by our Counter Threat UnitTM research team, which conducts research into threat actors, uncovers new attack techniques, analyzes emerging threats and evaluates the risks posed to our clients. Applying this intelligence across our solutions portfolio provides clients with deeper insights and enriched context regarding tactics, techniques and procedures employed by those threat actors.
Integrated, Vendor-Neutral Approach. Our solutions are designed to monitor alerts, logs and other messages across multiple stages of the threat lifecycle by integrating a wide array of proprietary and third-party security products. This vendor-neutral approach allows us to aggregate events from a wide range of security and network devices, applications and endpoints to enhance our understanding of clients’ networks and increase the effectiveness of our monitoring solutions.
Flexible Solution and Delivery Options. Our intelligence-driven information security solutions are purpose-built to serve a broad array of evolving client needs, regardless of a client’s size or the complexity of its security infrastructure. Our clients may subscribe to any combination of our solutions and also choose how much control they will maintain over their IT security infrastructure by selecting among our fully managed, co-managed or monitored delivery options. Our flexible approach enables clients to tailor our solutions to reduce large and risky investments and costly implementations and to ensure quick and easy deployment.
7
Our Competitive Strengths
We believe that the following key competitive advantages will allow us to maintain and extend our leadership position in providing intelligence-driven information security solutions:
A Leader in Intelligence-Driven Information Security Solutions. We are a global leader in providing intelligence-driven information security solutions and believe we have become a mission-critical vendor to many of the large enterprises, small and medium-sized businesses and U.S. state and local government agencies we serve. We believe our position as a technology and market leader enhances our brand and positions us as a comprehensive solution. During fiscal 2018, we were once again positioned in the Leaders quadrant in Gartner’s most recent Magic Quadrant for Managed Security Services Providers (“MSSPs”), Worldwide1 making this the tenth time Secureworks has been recognized in this report.
Purpose-Built, Proprietary Technology. At the core of our solutions is the Counter Threat Platform, a proprietary technology platform we have developed during our 18 years of operations. This platform collects, correlates and analyzes billions of daily events and data points, and generates enriched security intelligence on threat actor groups and global threat indicators.
Specialist Focus and Expertise. We have built our company, technology and culture with a singular focus on protecting our clients by delivering intelligence-driven information security solutions. We believe this continued focus reinforces our differentiation from other information security services vendors, including telecommunications and network providers, IT security product companies, and local and regional information security solutions providers.
Strong Team Culture. At our company, the fight against sophisticated and malicious cybersecurity threats is a personal one, and we take great pride in helping our clients protect their critical business data and processes. We dedicate significant resources to ensure that our culture and brand reflect our focus on protecting our clients.
Seasoned Management Team and Extensive IT Security Expertise. We have a highly experienced and tenured management team with extensive IT security expertise and a record of developing successful new technologies and solutions to help protect our clients.
Our Growth Strategy
Our goal is to be the global leader of intelligence-driven information security solutions. To pursue our strategy, we seek to:
Maintain and extend our technology leadership: We intend to enhance our leading intelligence-driven integrated suite of solutions by adding complementary solutions that strengthen the security posture of our clients, such as security solutions for cloud-based environments. We intend to meet this goal by continuing to invest in research and development, increasing our global threat research capabilities and hiring personnel with extensive IT security expertise.
Expand and diversify our client base: We intend to continue to expand and diversify our client base, both domestically and internationally, by investing in our direct sales force, further developing our strategic and distribution relationships, pursuing opportunities across a broad range of industries and creating new cloud-based solutions. We also intend to continue increasing our geographic footprint to further enhance our deep insight into the global threat landscape and our ability to deliver comprehensive threat intelligence to our clients.
Deepen our existing client relationships: We intend to continue leveraging the strong client relationships and high client satisfaction from across our client base to sell additional solutions to existing clients. We will continue to invest in our account management, marketing initiatives and client support programs in seeking to achieve high client renewal rates, help clients realize greater value from their existing solutions and encourage them to expand their use of our solutions over time.
Attract and retain top talent: Our technology leadership, brand, exclusive focus on information security, client-first culture and robust training and development program have enabled us to attract and retain highly talented professionals with a passion for building a career in the information security industry. We will continue to invest in attracting and retaining top talent to support and enhance our information security offerings.
1 Gartner Magic Quadrant for Managed Security Services, Worldwide, Toby Bussa, Kelly M. Kavanagh, Sid Deshpande, Pete Shoard, 27 February 2018.
The Gartner Report described herein, (the “Gartner Reports”) represents research opinion or viewpoints published, as part of a syndicated subscription service, by Gartner, Inc. (“Gartner”), and are not representations of fact. Each Gartner Report speaks as of its original publication date (and not as of the date of this Form 10-K) and the opinions expressed in the Gartner Report are subject to change without notice.
Gartner does not endorse any vendor, product or service depicted in its research publications, and does not advise technology users to select only those vendors with the highest ratings or other designation. Gartner research publications consist of the opinions of Gartner’s research organization and should not be construed as statements of fact. Gartner disclaims all warranties, expressed or implied, with respect to this research, including any warranties of merchantability or fitness for a particular purpose.
8
Our Clients
As of February 2, 2018, we had approximately 4,400 subscription-based clients across 59 countries. Our subscription-based clients included 39% of the companies in the Fortune 100 for both fiscal 2018 and fiscal 2017 and 29% of the companies in the Fortune 1000 for fiscal 2016. Historically, approximately half of our professional services clients have also subscribed to our managed security solutions. Our largest client, Bank of America, N.A., accounted for approximately 6% of our revenue in fiscal 2018. We did not have any single client that represented 10% or more of our annual revenue in any of our last three fiscal years.
We serve clients in a broad range of industries, including the financial, manufacturing, technology, retail, insurance, utility and healthcare sectors. In fiscal 2018, financial services and manufacturing clients accounted for 30.0% and 17.4%, respectively, of our revenue. No other industries accounted for 10% or more of our fiscal 2018 revenue.
International revenue, which we define as revenue contracted through non-U.S. entities, represented approximately 16%, 13% and 12% of our total net revenue in fiscal 2018, fiscal 2017 and fiscal 2016, respectively. For additional information about our non-U.S. revenues and assets, see “Notes to Consolidated Financial Statements—Note 9—Selected Financial Information” in our consolidated financial statements included in this report.
Our Technology Platform
We utilize the key components of our infrastructure described below to deliver our intelligence-driven information solutions to our clients.
Counter Threat Platform
Our proprietary Counter Threat Platform was purpose-built to be the foundation of our information security solutions. It has a multi-tenant, distributed architecture that enables our software to run on a single platform while providing simultaneous access to multiple users. The platform collects, aggregates, correlates and analyzes billions of daily events (currently as many as 250 billion per day) from our extensive client base, and uses sophisticated algorithms to detect malicious activity and deliver security countermeasures, dynamic intelligence and valuable context regarding the intentions and actions of cyber adversaries. The timely analysis and routing of this security information enables our solutions to assess risk in near real time and allows us to report rapidly to our clients worldwide. The platform is highly flexible, permitting us to tailor our solutions to a client’s unique environment, and can be configured to identify specific security events of interest to a particular client. Our platform was designed to be vendor-neutral. As a result, it can aggregate events from a wide range of security and network devices, applications and endpoints.
The platform leverages our intelligence gained over 18 years of processing and handling events to provide insight into how attacks are initiated and spread across our clients’ networks. The platform also applies security intelligence based on threat indicators continuously gathered by our Counter Threat Unit research team through in-depth analysis of the cyber threat environment. This team conducts research into emerging threat actors and new attack tactics, and develops countermeasures that we apply to the platform to enable our clients proactively to prevent and detect compromises of their security. Our ability to see more security incidents along with the applied intelligence acts as an early warning system that enables our security analysts proactively to alert clients, apply protections and respond quickly with appropriate context. The more security events we see, the more accurate our protections are and the more accurately we can respond.
The Counter Threat Platform is supported by the following proprietary technologies:
• | Counter Threat Appliance. Our Counter Threat Appliance performs several of the important functions of the Counter Threat Platform. The Counter Threat Appliance is a physical or virtual appliance deployed in a client’s data center, branch office or cloud environment, or our own data center. This technology supports a wide range of security and network devices, applications and endpoints to collect information on the client environment, perform analytics and report to our counter threat operations centers. The Counter Threat Appliance establishes secure non-intrusive communications to transmit data back to our data centers, where the Counter Threat Platform enriches data with our intelligence based on our intimate knowledge of threats and client specific intelligence to detect security incidents. |
• | Foresee. Foresee, our behavioral and self-learning technology, identifies malicious events through the use of machine learning algorithms to determine the probability and confidence that a particular event or a collection of events is malicious. Foresee learns which events are malicious or non-malicious based on ongoing feedback from our certified security analysts and applies machine-learning analysis techniques for the discovery of previously unknown threats. |
9
• | Multi-Purpose Logic Engine. Our Multi-Purpose Logic Engine is an analytics engine that leverages our broad visibility into the global threat environment and applied intelligence from the Counter Threat Unit to identify security incidents of interest. The engine intelligently analyzes billions of events into actionable information, providing valuable context to our security analysts to help inform their analysis of the security incidents and shorten the client’s response time. |
• | Very Large Database. Our Very Large Database efficiently and cost-effectively collects, correlates, analyzes and stores billions of structured and unstructured data elements, which help us to identify new security threats, provide valuable context to our security analysts and clients and enable Counter Threat Unit researchers to perform historical threat analysis. |
• | Threat Intelligence Management System, or TIMS. We manage structured and unstructured data in TIMS. TIMS collects, correlates and analyzes billions of data points to catalogue threat actors and generate threat indicators applied to the Counter Threat Platform and across our solutions. The data points are sourced from our managed security solutions, malware, social media, honeypots (or traps set to detect or counteract attempts at unauthorized use of information systems), open source intelligence, hunting and incident response engagements, strategic relationships and priority research. |
• | Catalog for Artifact and Signal Extraction, or CASE. CASE is a repository and a set of tools for the dynamic analysis of malware to catalogue its behaviors and generate threat indicators. CASE feeds into TIMS threat indicators identified from the analysis of malware. |
• | Attacker Database. Our Counter Threat Unit research team maintains a patented process for generating a proprietary Attacker Database that contains machine readable threat intelligence we apply to the Counter Threat Platform, iSensor, Red Cloak and third-party security controls. |
• | Portal. Powered by integrated intelligence and analytics tools, the portal delivers near real time information to client executives, managers and security professionals and provides insights that help clients make better security decisions. It also facilitates near real time communication between clients and our security analysts, measures the effectiveness of a client’s security profile using asset-based and risk-weighted analyses, supports regulatory compliance requirements, links threat intelligence from our Counter Threat Unit and enables a visualization of point-in-time, comparative and historical security trends across multiple security metrics. Our portal is accessible via web and mobile applications as well as via client applications that leverage our application programming interfaces. |
Counter Threat Operations Center Automation
We have developed several technologies integrated into the Counter Threat Platform to automate operations within our counter threat operations centers, where our security professionals identify, diagnose and respond to security information.
• | Threat Analysis Platform. We present threat information to our certified security analysts in a graphical user interface. This interface supports the delivery of high-quality security analysis of threats targeting or occurring within a client’s environment. Visualization enables our security analysts to detect patterns and to determine in near real time relationships of security incidents within a client environment and across our entire client base. Our security analysts have access to all data collected from client environments and human readable threat intelligence from our Counter Threat Unit to provide them with the context necessary to inform their analysis and to help them determine whether they should communicate information about a security incident to a client. |
• | Ticket Management. Our ticket management system is based on Information Technology Infrastructure Library principles and delivers security monitoring and device management solutions to clients. A sophisticated and configurable workflow provides incident, change and problem management in a leveraged-service delivery model to enable our counter threat operations centers to handle a higher volume of work with consistent quality. |
• | Management and Monitoring Tools. To effectively manage and monitor our infrastructure at client sites and our data centers, we rely on a suite of purpose-built software applications to facilitate the full lifecycle management of all software and configuration deployments and updates, efficient management and troubleshooting, and monitoring of the health and availability of devices. |
10
Other Enabling Technologies
• | iSensor. Many of our clients use our proprietary network intrusion detection and prevention appliance, the iSensor. The iSensor eliminates malicious inbound and outbound traffic in near real time by performing in-line deep packet inspection (which is an examination of packet data as the data pass through the device for signs of malware, intrusions or other threats) and by applying countermeasures from the Counter Threat Unit. |
• | Red Cloak. Red Cloak, our endpoint threat detection software, allows us to apply our threat intelligence and advanced analytics to the endpoint to reduce the amount of time required to detect a compromise of security and reduce the effort required to respond. Red Cloak also allows us to develop strategic countermeasures that interdict tactics used by threat actors. |
• | Third-Party Technologies. Our intelligence-driven information security solutions are designed to monitor alerts, logs and other messages across multiple stages of the threat lifecycle. In addition to security monitoring, we offer device management for many leading security platforms. In deploying these solutions, we integrate a wide array of proprietary and third-party security products. Our technology supports firewalls from market-leading vendors, including, but not limited to, Cisco Systems, Inc., Palo Alto Networks, Inc., Check Point Software Technologies Ltd., Juniper Networks, Inc., Fortinet, Inc. and SonicWall. In addition, we also support intrusion prevention systems from vendors such as Intel Corp. (McAfee), and web application firewalls from vendors such as Imperva, Inc., F5 Networks, Inc. and Citrix Systems, Inc. |
Further, we maintain alliance partnerships with key technology providers who deliver capabilities we see as valuable in keeping our clients secure. These partnerships involve technology licensing, joint technology development, integration, research cooperation, co-marketing and sell-through arrangements. Key technology partners include Qualys, Inc., Kenna Security, Inc., Cisco Systems, Inc. (Sourcefire), Lastline, Inc., TIBCO Software Inc. (LogLogic) and Carbon Black. The principal technologies we license from some of these providers provide us with the following capabilities we integrate into our solutions:
• | Qualys – vulnerability management |
• | Kenna Security – vulnerability management |
• | Cisco (Sourcefire) – network security |
• | Lastline – malware detection and protection |
• | TIBCO (LogLogic) – log management |
• | Carbon Black – endpoint security |
We license the technologies under agreements that generally have terms ranging from one to five years, subject to renewal in most cases either upon notice of renewal or upon failure by us or the provider to give notice of termination to the other party. The provider generally may terminate any license upon advance notice to us of between 90 and 270 days. The technology partner license agreements generally provide for post-termination support, transition and wind-down periods that are intended to limit any disruption to our business that could result from a license termination. We generally are required under the agreements to make licensing payments in the form of fees or royalties at a discount off the list price, although some agreements also include volume or tiered pricing.
Our Offerings
We offer an integrated suite of intelligence-driven information security solutions. Our clients may subscribe to our full suite of solutions or elect to subscribe to various combinations of our individual solutions. All of our solutions are enabled by our Counter Threat Platform and our large team of highly-skilled security experts.
11
Managed Security
We offer a broad range of managed security solutions, including those highlighted below.
Security Monitoring. Security appliances, systems and servers generate extensive logs, alerts and other messages every day. This raw information must be continuously monitored, correlated and analyzed in order to identify security events of actual concern while generating a minimal number of falsely positive results. Our security monitoring solution collects, correlates and analyzes logs, alerts and other messages generated by most leading security technologies and critical information assets, on a 24/7 basis, to identify anomalies and respond to threats in near real time. This solution functions either on a stand-alone basis or in concert with client-owned security information and event management platforms.
Advanced Malware Protection and Detection. Our advanced malware protection and detection solution, or AMPD, provides a layer of defense against emerging zero-day threats for enterprise and medium-sized organizations, which are threats whose existence is unknown to the targeted organization or those responsible for its security before the first exploitation occurs. AMPD uses next-generation sandboxing technology with full-system emulation to execute and analyze malware within a controlled environment, and draws on our threat intelligence data pool and our expert threat analysis teams. AMPD’s combination of deep intelligence capabilities developed by the Counter Threat Unit and advanced technology permits our clients to see, rapidly analyze and accurately diagnose previously unknown malware, and to obtain focused guidance that expedites threat remediation.
Advanced Endpoint Threat Detection. Advanced endpoint threat detection, or AETD, improves situational awareness and visibility through proprietary endpoint intelligence developed by the Counter Threat Unit. AETD is a fully managed security solution that monitors the state of endpoints, which include Windows servers, laptops and desktops, for threat indicators, investigates events to determine their severity, accuracy and context, and quickly escalates critical events to the client’s attention indicating that an endpoint may be compromised.
Firewall and Next-Generation Firewall Solutions. Firewalls provide critical information necessary to identify and evaluate security events. We provide an array of firewall solutions ranging from the collection, organization and reporting of firewall information to the full management of a client’s firewall by our security analysts, including rule-set changes and overall configuration of the device for optimal performance. Our experts hold certifications from leading vendors and have significant experience with the relevant technologies, enabling us to provide solutions to support market-leading vendors in various types of environments. Our firewall management solutions ease the adoption of next-generation firewall technology through policy-based control over applications, users and content, device provisioning and deployment and enable clients to respond immediately to security events.
Managed Web Application Firewall Solutions. Web application firewalls are designed specifically to protect applications that deliver critical services via Internet web protocols. These firewalls block certain connections while permitting others based on the configuration of the firewall in order to ensure that only legitimate traffic reaches protected applications. Web application firewalls are increasingly utilized to address various compliance mandates, including the Payment Card Industry Data Security Standard, or PCI DSS. Our managed web application firewall solution assists clients with the end-to-end management of these complex devices, from initial configuration and periodic policy changes to patching, updating and full-time monitoring of system health and performance.
Managed Network Intrusion Detection System, or IDS, and Intrusion Prevention System, or IPS, Solutions. IDS and IPS technologies can provide a highly effective layer of security. We provide a wide range of solutions to enable our clients to realize the benefits from these technologies, and effectively identify threats faster. Our solutions include security monitoring, performance and availability management, device upgrades and patch management, policy and signature management, integration of Counter Threat Unit intelligence and use of our proprietary iSensor device. We manage leading vendors’ IDS and IPS products as well as our iSensor.
Vulnerability Management. Our Vulnerability Management solution, which is fully managed and maintained by a dedicated vulnerability management team, encompasses the two solutions described below.
• | Managed Vulnerability Scanning. A vulnerability scan is designed to alert an organization to potential exposures and vulnerabilities in its network. As part of our solution, we perform internal and external scan audits across network devices, servers, databases and other assets in on-premises and cloud environments. |
• | Managed Web Application Scanning. Applications that deliver services via the web are the lifeblood of business-to-business and business-to-consumer e-commerce. A vulnerability scan can alert an organization to potential exposures |
12
and weaknesses in these web-based applications before a threat actor exploits those weaknesses. Our managed web application scanning solution performs deep and accurate scans of web applications that are hosted on client premises or in cloud environments. These scans search for vulnerabilities specific to the web protocols that are foundational to web applications. Our solution also supports the ability to log into web applications and discover vulnerabilities that may lie behind the login page.
Log Retention Solutions. We offer comprehensive log aggregation, retention, searching and reporting solutions. Log retention enables our clients to satisfy various compliance obligations, which require full log retention from critical IT systems to ensure the integrity of confidential data, and to conduct forensic investigations. Our log retention solutions provide support for a wide range of sources, allowing the capture and aggregation of millions of logs generated every day by critical information assets such as servers, routers, firewalls, databases, applications and other systems of the log retention appliance.
Managed Policy Compliance. To assist clients in improving their security and compliance with regulatory mandates, our managed policy compliance solution ensures that the configurations of clients’ critical systems are known and tracked and comply with pre-established security guidelines. Our solution consists of two key components, software that automatically retrieves the configurations of critical systems and compares them to pre-established configuration targets, and a library of security and compliance-driven configuration checks across three systems. Our solution helps clients establish configuration targets, set up the scans, monitor the output and report on the results.
Delivery Options for Managed Security
Our managed security clients can choose how much control they maintain over their IT security infrastructure by selecting among our fully managed, co-managed or monitored solution delivery options. Our solutions are designed to be flexible and scalable to complement the evolving security needs of our clients. Our clients often migrate between the different delivery options in response to their changing needs as well as to the changing threat landscape.
Fully Managed. With our fully managed delivery options, we assume control of a client’s security technology so the client can focus on running its business rather than becoming a security administrator. Clients selecting fully managed delivery obtain all of the benefits of our monitored delivery option, including access to our on-demand Counter Threat Platform. In addition, our team of security analysts will monitor and manage a client’s security technology or selected devices, proactively update that security infrastructure to protect against emerging threats, identify vulnerabilities, ensure that the devices are properly configured with our latest countermeasures, and block or respond to immediate threats in accordance with the client’s escalation policies. We believe that our fully managed solutions provide clients with increased security protection based on our best practices and security expertise applied across our client base, as well as improved operational efficiency by removing the overhead costs associated with managing security technology.
Co-Managed. Clients often deploy our managed solutions on a co-managed basis as an extension of their security personnel. The co-managed delivery option enables the client to retain control over its security infrastructure to the extent that it prefers to do so, and enables its security staff to work with our experts as a team while maintaining full access and visibility into the management process. This option is particularly suitable for organizations that already possess in-house security expertise, but that seek to remove the burden of managing devices from their staff so they can focus on more strategic security initiatives.
Monitored. Clients selecting our monitored solutions obtain access to our on-demand Counter Threat Platform through our web-based portal, plus near real time monitoring and analysis by our security analysts of events collected from security and network devices and applications. Our monitored solutions enhance our clients’ security position by providing them with a holistic view of their security activity, valuable context from our team of security analysts and comprehensive reporting to demonstrate regulatory compliance. Our ability to see more security incidents across our entire client base along with our threat intelligence acts as an early warning system, which benefits clients by proactively alerting them to potential threats, applying protections and helping them respond quickly. We believe that the more we see, the more accurate our protections are, and the more accurately we can respond. Through our monitored solutions, we leverage our on-demand Counter Threat Platform to correlate information from many devices and applications, providing security analysts with the context they need to significantly reduce falsely positive results and alert clients to actual threats against their organizations.
In general, our managed delivery options require our security professionals to be directly involved with our client’s security technology, and as a result, the cost to service these delivery options is generally higher than the cost to service monitored delivery options. Over the last three fiscal years, we have generated the majority of our managed security solutions revenue from either fully managed or co-managed delivery options. Our future success depends on our ability to manage efficiently the costs of our security offerings and to price our security solutions in an effective manner.
13
Threat Intelligence
Powered by our Counter Threat Unit research team, threat intelligence provides early warnings and actionable intelligence that enables rapid protection against threats and vulnerabilities before they affect an organization. Threat intelligence is applied as part of our managed security offerings, but also may be offered separately.
Global Threat Intelligence. Our global threat intelligence solutions provide proactive, actionable intelligence tailored to an organization’s environment. This intelligence includes clear, concise threat and vulnerability analysis, detailed remediation information and recommendations, consultation with our threat experts, on-demand access to extensive threat and vulnerability databases, malware analysis upon request, intelligence feeds and integration with our other solutions for correlation and unified reporting.
Borderless Threat Monitoring. Our borderless threat monitoring solution delivers organizations with timely and actionable security intelligence that provides them with insight into threat activities that may exist beyond the edge of their network. This solution proactively informs organizations of network threat indicators that apply to their particular network environment and allows them to manage the threat in accordance with their escalation policies.
Malware Code Analysis. Our malware code analysis solution focuses on reverse engineering malicious or unknown code identified in security events in order to provide an organization with a better understanding of the code’s behavior and its impact on the organization’s systems and information. Using advanced computer forensic tools and techniques, our security experts dissect the code to determine its functionality, purpose, composition and source.
Enterprise Brand Surveillance. Our enterprise brand surveillance solution offers near real time monitoring of a range of intelligence outlets to identify developing threats from exposure of sensitive data, targeting by threat actors and risks to perception of the client’s brand. This solution provides our clients with live notifications delivered upon discovery of actionable intelligence. It also provides clients with context regarding potential threats and helps them to develop informed risk mitigation strategies.
Security and Risk Consulting
Our consulting organization provides expertise and analysis to help clients improve their security posture by comprehensively assessing security capabilities, designing and building robust security programs, preparing employees against cyber attacks, facilitating regulatory compliance and helping clients identify, prioritize and resolve the vulnerabilities that pose the greatest threat. We offer both project-based and long-term contracts, including retainer contracts sold together with our managed security solutions. For example, we may enter into a managed security contract bundled together with an incident response retainer.
Our team has extensive experience conducting security, compliance and risk engagements across many industries and geographic areas, and under recent regulations and industry standards that impose security mandates. Professional services offered by the team include the following:
Technical Testing and Assessments. Our testing and assessment solutions provide clients with the knowledge, expertise and efficiency needed to conduct thorough security and risk evaluations of their environments. We offer testing and assessments that address logical, physical, technical and non-technical threats in order to identify gaps that create risk, construct a stronger security posture and meet compliance mandates. Our testing and assessments solutions include application security, network security and Red Team testing, which simulates cyber attacks using real-world tactics, techniques and procedures.
Security and Governance Program Development. Our security and governance program development solutions provide our clients with security, risk and compliance expertise to help them develop strategic security and governance programs based on industry and observed best practices. These solutions include internal audit support and the development of corporate information security and computer security incident response security awareness programs.
Targeted Threat Hunting. The Targeted Threat Hunting solution uses proprietary technology to search client networks to identify the presence of security compromises and entrenched threat actors operating in a client’s environment. The solution draws on our threat intelligence and extensive experience countering cyber adversaries.
Cloud Security. We help clients to deliver cloud-based services securely and to satisfy their compliance requirements. Our cloud security solutions include cloud security strategic consulting, cloud risk assessment, assurance testing of cloud deployments, incident response in cloud environments and cloud security architecture and design.
14
Security Design and Architecture Solutions. Our security design and architecture solutions help clients to clarify their information security priorities and identify their most vulnerable assets that require security monitoring, as well as to obtain a prioritized roadmap of upgrades to help with budgeting and determining resource requirements. Our solutions include security health check solutions, security architecture assessment solutions and security architecture and design consulting.
Security Residency Solutions. Our security residency solutions provide clients with security consultants who serve as extended members of their staff either on-site or remotely to extend and heighten an organization’s security expertise and capabilities. We offer several levels of resident security consultants, including executive, expert and technical consultants tailored to the security expertise and leadership our clients need. Residency solutions often are combined with managed security solutions in complex enterprise environments to enhance the value clients obtain from our solutions. Consulting residents align our solutions with the clients’ internal processes, integrate our data feeds into client applications and dashboards, and produce customized analytics and reporting. In addition, residents can assist clients with handling the security events identified by our managed security solutions.
Incident Response
Incident response typically is deployed along with security and risk consulting. The professionals who deliver incident response help clients rapidly analyze, contain and remediate security breaches to minimize their duration and impact.
Incident Management Proactive Solutions. Through our incident management proactive solutions, our security consultants work with clients to prepare them to respond quickly and effectively to a security incident. In providing these solutions, we feature both incident management risk assessment and response plan review and development solutions. Our incident management risk assessment solution evaluates a client’s ability to detect, resist and respond to a targeted or advanced threat and is designed to help our clients understand their exposure to these threats, including advanced persistent threats, or APTs, in order to reduce their risk of compromise. Our response plan review and development solution supports our clients in developing an effective computer security incident response plan, or CSIRP, based on IT security best practices, incorporating the latest threat intelligence tailored to the client’s specific needs.
Incident Response Testing and Capability Analysis. Through real-world simulations, incident response testing and capability analysis tests and evaluates the effectiveness of an organization’s CSIRP and attack response procedures. We employ tabletop exercises to subject IT teams to simulated threats, such as cyber-crime and APTs. The exercises demonstrate the ways a client’s systems and network can be breached and the critical actions required during a breach to contain a threat. We also offer an incident response retainer, through which our security experts can provide emergency incident response solutions within minutes of a reported breach.
Emergency Incident Response Solutions. Through our comprehensive range of incident response and management solutions, we seek to ensure that organizations experience minimal economic loss and operational disruption when a security incident occurs. Our security consultants work to minimize the duration and impact of any breach through incident management, surveillance, digital forensic analysis, malware analysis and reverse engineering.
Sales and Marketing
Our sales and marketing organizations work together closely to drive revenue growth by enhancing market awareness of our solutions, building a strong sales pipeline and cultivating client relationships. We offer managed security and threat intelligence on a subscription basis. We sell these solutions under contracts with initial terms that typically range from one to three years and, as of February 2, 2018, averaged two years in duration. We provide security and risk consulting primarily under fixed-price contracts, although we perform some engagements under variable-priced contracts on a time-and-materials basis.
Sales
We sell primarily through our direct sales organization, supplemented by sales through our channel partners, including referral agents, regional value-added resellers and trade associations. Approximately 93% of our revenue in fiscal 2018 was generated through our direct sales force, in some cases in collaboration with members of Dell’s sales force, with the remaining portion generated through our channel partners.
Our direct sales organization consists of insides sales and field sales personnel and solutions architects organized by core client segments and geography. Our sales strategy varies based on the size of the company and the target point-of-entry into an organization, which is primarily through chief information security officers or other IT leaders, including security executives, security specialists, compliance officers and IT generalists. Within North America, our direct sales organization has separate
15
teams focused on the large enterprises, small and medium-sized businesses, and U.S. state and local government agencies. We believe that continued additional investment in our sales staff will contribute to our long-term growth.
We believe that our sales process differentiates us in the marketplace for information security solutions. The process typically begins by emphasizing the importance of educating key IT decision makers within a client organization with respect to the organization’s information security needs. We deliver a technical evaluation performed by a team that includes both highly trained sales personnel and security experts. This allows us to tailor the solution design, including the level of service and deployment options, to the organization’s specific security needs and to become its long-term advisor and partner. A typical large enterprise sales team includes an inside sales team that is responsible for developing sales leads, a direct sales team that is responsible for obtaining new clients and some cross-sales, an enterprise account management team that is responsible for renewals and some cross-sales, and security engineers who provide technical support to our sales personnel.
Since our acquisition by Dell in February 2011, we have marketed our solutions through Dell’s channel partners as well as through our own and have entered into agreements with Dell to preserve, and potentially expand, our existing commercial arrangements with Dell.
Marketing
Our marketing efforts seek to enhance our brand, expand our market awareness, bring our solutions to market and build a strong sales pipeline. Our marketing team consists primarily of solutions marketing, field marketing, demand generation and public and industry analyst relations functions. We actively manage our public relations efforts and communicate directly with IT professionals and the media in an effort to promote our information security solutions and contribute to the business community’s ongoing examination and understanding of information security. We participate in industry trade shows and conferences, drive thought leadership in our industry, host webcasts, conduct online marketing activities and use various other marketing strategies to create awareness of our brand and offerings.
Client Service, Training and Support
Client service, training and support are key elements of our commitment to provide superior client service. We have a comprehensive client service training and support program to communicate our commitment to client service and to enhance the value that our clients derive from our solutions. We provide extensive education, training and support on the functionality of our solutions, so that our clients are able to fully utilize their benefits. Our client service training and support team provides dependable and timely resolution of client security concerns and technical inquiries, and our certified security analysts are continuously available to clients for consultation by telephone or e-mail and over the Internet through our portal. We regularly conduct client surveys to help us evaluate and develop our existing solutions and other solutions that we believe could enhance our client relationships.
Competition
The market for information security services is very competitive, and we expect competition to continue to increase in the future. Changes in the threat landscape and the broader IT infrastructure have led to quickly evolving client requirements for protection from security threats and adversaries.
We compete primarily against the following four types of security services and product providers, some of which operate principally in the large enterprise market and others in the market for small and medium-sized businesses:
▪ | global telecommunications and network services providers such as AT&T Inc., BT Group PLC, Verizon Communications Inc. and NTT Communications Corp.; |
▪ | providers of specialized or niche IT security products and services such as FireEye, Inc., Palo Alto Networks, Inc. and Symantec Corporation; |
▪ | diversified technology companies such as Cisco Systems, Inc., Hewlett Packard Enterprise Company, International Business Machines Corporation and Intel Corporation; and |
▪ | regional information security services providers that compete in the small and medium-sized businesses market with some of the features present in our information security solutions. |
16
We believe that the principal competitive factors in our market include:
▪ | global visibility into the threat landscape; |
▪ | ability to generate actionable intelligence based on historical data and emerging threats; |
▪ | ability to apply threat intelligence from our Counter Threat Unit to our Counter Threat Platform and security controls; |
▪ | scalability and overall performance of platform technologies; |
▪ | ability to integrate with, monitor and manage a variety of third-party products; |
▪ | ability to provide a flexible deployment option to cater to specific client needs; |
▪ | ability to attract and retain high-quality professional staff with information security expertise; |
▪ | brand awareness and reputation; |
▪ | strength of sales and marketing efforts; |
▪ | cost effectiveness; |
▪ | client service and support; and |
▪ | breadth and richness of threat intelligence, including history of data collection and diversity and geographic scope of clients. |
We believe that we generally compete favorably with our competitors on the basis of these factors as a result of the architecture, features and performance of our Counter Threat Platform, the quality of our threat intelligence, the security expertise within our organization, and the ease of integration of our solutions and platform with other technology infrastructures. However, many of our existing and potential competitors, particularly in the large enterprise market, have advantages over us because of their longer operating histories, greater brand name recognition, larger client bases, more extensive relationships within large commercial enterprises, more mature intellectual property portfolios and greater financial and technical resources.
Research and Development
We invest significant time and resources to maintain, enhance and add new functionality to our Counter Threat Platform and purpose-built technologies that are critical enablers of our solutions. Our research and development organization is responsible for the design, development and testing of all aspects of our suite of information security solutions. The members of the organization have deep security and software expertise and work closely with our product management and client service training and support teams to gain insights into clients’ environments for use in threat research, product development and innovations. The organization focuses its research on identifying next-generation threats and adversaries and developing countermeasures, which are continuously applied to our platform and used to respond to the rapidly evolving security threat landscape. The majority of our research and development team is based in our offices in Atlanta, Georgia, Providence, Rhode Island, Pittsburgh, Pennsylvania, Edinburgh, Scotland, and Hyderabad, India.
We believe that innovation and the timely development of new solutions are essential to meeting the needs of our clients and improving our competitive position. Several of the solutions we have released in the past year are the result of our internal processes within our company to identify and solve difficult security issues and use the best ideas to develop new solutions. As our clients move their applications and data into third-party cloud environments, we will extend and integrate our solutions into these environments globally. In addition, point solutions we develop for clients during security and risk consulting engagements often are integrated into our portfolio of solutions and made available to our broader client base.
Our research and development expenses were $80.2 million in fiscal 2018, $71.0 million in fiscal 2017 and $69.6 million in fiscal 2016. We plan to continue to commit significant resources to research and development.
17
Intellectual Property
Our intellectual property is an essential element of our business. To protect our intellectual property rights, we rely on a combination of patent, trademark, copyright, trade secret and other intellectual property laws as well as confidentiality, employee non-disclosure and invention assignment agreements.
Our employees and contractors involved in technology development are required to sign agreements acknowledging that all inventions, trade secrets, works of authorship, developments, processes and other intellectual property rights conceived or reduced to practice by them on our behalf are our property, and assigning to us any ownership that they may claim in those intellectual property rights. We maintain internal policies regarding confidentiality and disclosure. Our client and resale contracts prohibit reverse engineering, decompiling and other similar uses of our technologies and require that our technologies be returned to us upon termination of the contract. We also require our vendors and other third parties who have access to our confidential information or proprietary technology to enter into confidentiality agreements with us.
Despite our precautions, it may be possible for third parties to obtain and use without our consent intellectual property that we own or otherwise have the right to use. Unauthorized use of our intellectual property by third parties, and the expenses we incur in protecting our intellectual property rights, may adversely affect our business.
Our industry is characterized by the existence of a large number of patents, which leads to frequent claims and related litigation regarding patent and other intellectual property rights. In particular, large and established companies in the IT security industry have extensive patent portfolios and are regularly involved in both offensive and defensive litigation. From time to time, third parties, including some of these large companies as well as non-practicing entities, may assert patent, copyright, trademark and other intellectual property rights against us, our channel partners or our end-clients, which we are obligated to indemnify against such claims under our standard license and other agreements. Successful claims of infringement by a third party, if any, could prevent us from performing certain solutions, require us to expend time and money to develop non-infringing solutions, or force us to pay substantial damages (including, in the United States, treble damages if we are found to have willfully infringed patents), royalties or other fees.
Patents and Patent Applications
As of February 2, 2018, we owned 22 issued patents and 26 pending patent applications in the United States and four issued patents and two pending patent applications outside the United States. The issued patents are currently expected to expire between 2019 and 2033. Although we believe that our patents as a whole are important to our business, we are not substantially dependent on any single patent.
We do not know whether any of our patent applications will result in the issuance of a patent or whether the examination process will require us to modify or narrow our claims, as has happened in the past with respect to certain claims. Any patents that may be issued to us may not provide us with any meaningful protection or competitive advantages, or may be contested, circumvented, found unenforceable or invalid, and we may not be able to prevent third parties from infringing them.
Trademarks and Copyrights
The U.S. Patent and Trademark Office has granted us federal registrations for some of our trademarks. Federal registration of trademarks is effective for as long as we continue to use the trademarks and renew our registrations. We also have obtained protection for some of our trademarks, and have pending applications for trademark protection, in the European Community and various countries. We may, however, be unable to obtain trademark protection for our technologies and brands, and any trademarks that may be issued in the future may not distinguish our solutions from those of our competitors.
We do not generally register any of our works of authorship, including software and source code, with the U.S. Copyright Office, but instead rely on the protection afforded to such works by U.S. copyright laws, which provide protection to authors of original works whether published or unpublished and whether registered or unregistered.
We have entered into a trademark license agreement with Dell Inc. under which Dell Inc. has granted us a non-exclusive, royalty-free worldwide license to use the trademark “DELL,” solely in the form of “SECUREWORKS-A DELL COMPANY,” in connection with our business and products, services and advertising and marketing materials related to our business.
18
Employees
As of February 2, 2018, we employed 2,555 full-time employees in the United States and 22 other countries. None of our employees in the United States are represented by a labor organization or the subject of a collective-bargaining agreement. Employees of some of our foreign subsidiaries are represented on workers' councils.
Executive Officers of Secureworks
The following table sets forth information as of March 28, 2018 concerning our executive officers.
Name | Age | Position | ||
Michael R. Cote | 57 | President and Chief Executive Officer | ||
R. Wayne Jackson | 60 | Chief Financial Officer | ||
Each executive officer is appointed by, and serves at the discretion of, our board of directors.
Michael R. Cote has served as our President and Chief Executive Officer since May 2015. He served as our General Manager and as Vice President of Dell from our acquisition by Dell in February 2011 through the closing of our initial public offering in April 2016. Before our acquisition by Dell, Mr. Cote had served as our Chairman, President and Chief Executive Officer since February 2002.
R. Wayne Jackson has served as our Chief Financial Officer since July 2015. Before joining us, Mr. Jackson was a partner at PricewaterhouseCoopers LLP, an independent registered public accounting firm, since May 2003. At that firm, Mr. Jackson was the lead engagement partner for a number of the firm's largest clients.
Item 1A. Risk Factors
Our business, operating results, financial condition and prospects are subject to a variety of significant risks, many of which are beyond our control. The following is a description of some of the important risk factors that may cause our actual results in future periods to differ substantially from those we currently expect or seek. The risks described below are not the only risks we face. There are additional risks and uncertainties not currently known to us or that we currently deem to be immaterial that also may materially adversely affect our business, operating results, financial condition or prospects.
Risks Related to Our Business and Our Industry
We have a history of losses and may not achieve or maintain profitability.
We incurred net losses of $28.1 million in fiscal 2018, $38.2 million in fiscal 2017 and $72.4 million in fiscal 2016. Any failure to increase our revenue as we grow our business could prevent us from achieving or maintaining profitability on a consistent basis or at all. We expect our operating expenses to continue to increase as we implement our growth strategy to maintain and extend our technology leadership, expand and diversify our client base and attract and retain top talent. Our strategic initiatives may be costlier than we expect, and we may not be able to increase our revenue to offset these increased operating expenses. Our revenue growth may slow or revenue may decline for a number of reasons, including increased competition, reduced demand for our solutions, a decrease in the growth or size of the information security market or any failure by us to capitalize on growth opportunities. If we are unable to meet these risks and challenges as we encounter them, our business, financial condition and results of operations may suffer.
19
We must continue to enhance our existing solutions and technologies and develop or acquire new solutions and technologies, or we will lose clients and our competitive position will suffer.
Many of our clients operate in markets characterized by rapidly changing technologies, which require them to support a variety of hardware, software applications, operating systems and networks. As their technologies grow more complex, we expect these clients to face new and increasingly sophisticated methods of cyber attack. To maintain or increase our market share, we must continue to adapt and improve our solutions in response to these changes without compromising the high service levels demanded by our clients. If we fail to predict accurately or react in a timely manner to the changing needs of our clients and emerging technological trends, we will lose clients, which will negatively affect our revenue, financial condition and results of operations. The forces behind changes in technology, which we do not control, include:
▪ | the establishment by organizations of increasingly complex IT networks that often include a combination of on-premise, cloud and hybrid environments; |
▪ | the rapid growth of smart phones, tablets and other mobile devices and the “bring your own device” trend in enterprises; |
▪ | action by hackers and other threat actors seeking to compromise secure systems; |
▪ | evolving computer hardware and software standards and capabilities; |
▪ | changing client requirements for information technology; and |
▪ | introductions of new products and services or enhancements to existing products and services by our competitors. |
Our future growth also depends on our ability to scale our Counter Threat Platform to analyze an ever increasing number of events. As of February 2, 2018, our platform analyzed as many as 250 billion events each day. If the number of events grows to a level that our platform is unable to process effectively, or if our platform fails to handle automatically an increasing percentage of events or is unable to process a sudden, sharp increase in the number of events, we might fail to identify network events as significant threat events, which could harm our clients and negatively affect our business and reputation.
We operate in a rapidly evolving market, and if the new solutions and technologies we develop or acquire do not achieve sufficient market acceptance, our growth rates will decline and our business, results of operations and competitive position will suffer.
We spend substantial time and money researching and developing new information security solutions and technologies and enhancing the functionality of our current solutions and technologies to meet the rapidly evolving demands of our clients for information security in our highly competitive industry. For us to realize the benefits from our significant investments in developing and bringing our solutions to market, our new or enhanced solutions must achieve high levels of market acceptance, which may not occur for many reasons, including as a result of:
▪ | delays in introducing new, enhanced or modified solutions that address and respond to innovations in computer technology and client requirements; |
▪ | defects, errors or failures in any of our solutions; |
▪ | any inability by us to integrate our solutions with the security and network technologies used by our current and prospective clients; |
▪ | any failure by us to anticipate, address and respond to new and increasingly sophisticated security threats or techniques used by hackers and other threat actors; |
▪ | negative publicity about the performance or effectiveness of our solutions; and |
▪ | disruptions or delays in the availability and delivery of our solutions. |
Even if the initial development and commercial introduction of any new solutions or enhancements to our existing solutions are successful, the new or enhanced solutions may not achieve widespread or sustained market acceptance. In such an event, our competitive position may be impaired and our revenue and profitability may be diminished. The negative effect of inadequate market acceptance on our results of operations may be particularly acute because of the significant research, development, marketing, sales and other expenses we will have incurred in connection with the new or enhanced solutions.
We rely on personnel with extensive information security expertise, and the loss of, or our inability to attract and retain, qualified personnel in the highly competitive labor market for such expertise could harm our business.
Our future success depends on our ability to identify, attract, retain and motivate qualified personnel. We depend on the continued contributions of Michael R. Cote, our President and Chief Executive Officer, and our other senior executives, who
20
have extensive information security expertise. The loss of any of these executives could harm our business and distract from their operating responsibilities other senior managers engaged to search for their replacements.
Our Counter Threat Unit and security analyst teams are staffed with experts in information security, software coding and advanced mathematics. Because there are a limited number of individuals with the education and training necessary to fill these roles, such individuals are in high demand. We face intense competition in hiring individuals with the requisite expertise, including from companies with greater resources than ours. As a result, we may be unable to attract and retain suitably qualified individuals who are capable of meeting our growing technical, operational and managerial requirements, or may be required to pay increased compensation to satisfy our staffing needs. Further, if we hire personnel from competitors, we may be subject to allegations that the new employees were improperly solicited or have divulged proprietary or other confidential information in breach of agreements with their former employers. Any inability by us to attract and retain the qualified personnel we need to succeed could adversely affect our competitive market position, revenue, financial condition and results of operations.
Our quarterly results of operations or other operating measures may fluctuate significantly based on a number of factors that could make our future results difficult to predict.
Our results of operations or other operating measures have fluctuated in the past from quarter to quarter. We expect that quarterly fluctuations will continue as a result of a number of factors, many of which are outside of our control and may be difficult to predict, including:
▪ | our ability to increase sales to existing clients and to renew contracts with our clients; |
▪ | delays in deployment of solutions under our client contracts; |
▪ | our ability to attract new clients; |
▪ | interruptions or service outages in our data centers and other technical infrastructure, other technical difficulties or security breaches; |
▪ | client budgeting cycles, seasonal buying patterns and purchasing practices; |
▪ | changes in our pricing policies or those of our competitors; |
▪ | fluctuations in the demand for our information security solutions and in the growth rate of the information security market generally; |
▪ | the level of awareness of IT security threats and the market adoption of information security solutions; |
▪ | the timing of the recognition of revenue and related expenses; |
▪ | our ability to expand our direct sales force and our strategic and distribution relationships; |
▪ | our ability to develop in a timely manner new and enhanced information security solutions and technologies that meet client needs; |
▪ | our ability to retain, hire and train key personnel, including sales personnel, security analysts and members of our security research team; |
▪ | fluctuations in available cash flow from prepayments for our solutions; |
▪ | changes in the competitive dynamics of our market, including the launch of new products and services by our competitors; |
▪ | the effectiveness and efficiency of in-house information security solutions; |
▪ | our ability to control costs, including our operating and capital expenses; |
▪ | our ability to keep our proprietary technologies current; |
▪ | any failure of or technical issues affecting a significant number of our appliances or software; |
▪ | adverse litigation judgments, settlements or other litigation-related costs; |
▪ | costs related to the acquisition of businesses, talent, technologies or intellectual property, including potentially significant amortization costs and possible write-downs; |
▪ | stock-based compensation expense associated with attracting and retaining personnel; and |
▪ | general economic conditions, geopolitical events and natural catastrophes. |
21
The factors above, individually or in combination, may result in significant fluctuations in our financial and other results of operations from quarter to quarter. As a result of this variability and unpredictability, investors should not unduly rely on our historical results of operations as an indication of future performance.
We face intense competition, including from larger companies, and may lack sufficient financial or other resources to maintain or improve our competitive position.
The market for managed security and other information security services is highly competitive, and we expect competition to intensify in the future. Increased competition in our market could result in intensified pricing pressure, reduced profit margins, increased sales and marketing expenses and a failure to increase, or a loss of, market share. Our competitors vary in size and in the scope and breadth of the products and services they offer.
Many of our existing and potential competitors, particularly in the large enterprise market, enjoy substantial competitive advantages because of their longer operating histories, greater brand name recognition, larger client bases, more extensive client relationships within large commercial enterprises, more mature intellectual property portfolios and greater financial and technical resources. As a result, they may be able to adapt more quickly than we can to new or emerging technologies and changing opportunities, standards or client requirements. In addition, several of our competitors have made acquisitions or entered into partnerships or other strategic relationships with one another to offer more comprehensive cybersecurity solutions than each could offer individually. Mergers, consolidations or alliances among competitors, or acquisitions of our competitors by large companies, may result in more formidable competition for us if their security products and services are bundled into sales packages with their widely utilized non-security-related products and services. For example, large telecommunications companies may choose in the future to integrate managed security services aggressively as a complement to their existing communications offerings. In addition, we expect pricing pressures within the information security market to intensify as a result of action by our larger competitors to reduce the prices of their security monitoring, detection and prevention products and managed security services. If we are unable to maintain or improve our competitive position with respect to our current or future competitors, our failure to do so could adversely affect our revenue growth and financial condition. Further, if our competitors are able to successfully use artificial intelligence to enhance the ability of their solutions to prevent, detect, respond to or predict cybersecurity breaches and we are unable to develop or implement comparable technologies, our solutions could be viewed less favorably by potential clients and our revenues and competitive position could be negatively affected.
If we are unable to attract new clients, retain existing clients or increase our annual contract values, our revenue growth will be adversely affected.
To achieve revenue growth, we must expand our client base, retain existing clients and increase our annual contract values. In addition to attracting additional large enterprise and small and medium-sized business clients, our strategy is to pursue non-U.S. clients, government entity clients and clients in other industry sectors in which our competitors may have a stronger position. The renewal rates of our existing clients may decline or fluctuate as a result of a number of factors, including their satisfaction or dissatisfaction with our solutions, the price of our solutions, the prices or availability of competing solutions and technologies or consolidation within our client base. If we fail to attract new clients, or our clients do not renew their contracts for our solutions or renew them on less favorable terms, our revenue may cease to grow or may decline and our business may suffer.
Some clients elect not to renew their contracts with us or renew them on less favorable terms, and we may not be able on a consistent basis to increase our annual contract values by obtaining advantageous contract renewals. We offer managed security and threat intelligence on a subscription basis under contracts with initial terms that typically range from one to three years and, as of February 2, 2018, averaged two years in duration. Our clients have no obligation to renew their contracts after the expiration of their terms, and we cannot be sure that client contracts will be renewed on terms favorable to us or at all. The fees we charge for our solutions vary based on a number of factors, including the solutions selected, the number of client devices covered by the selected solutions and the level of management we provide for the solutions. Our initial contracts with clients may include amounts for hardware, installation and professional services that may not recur. Further, if a client renews a contract for a term longer than the preceding term, it may pay us greater total fees than it paid under the preceding contract, but still pay lower average annual fees, because we generally offer discounted rates in connection with longer contract terms. In any of these situations, we would need to sell additional solutions to maintain the same level of annual fees from the client, but may be unable to do so.
22
The loss of, or significant reduction in purchases by, our largest client could adversely affect our business and financial results.
Our largest client, Bank of America, N.A., accounted for approximately 6% of our revenues in fiscal 2018. Our business, financial condition and results of operations could suffer if Bank of America were to terminate or significantly curtail its purchases of our solutions, if we were unable to sell our solutions to Bank of America on terms substantially as favorable to us as the terms under our current agreement, or if we were to experience delays in collecting payments from Bank of America. We provide managed security solutions to Bank of America under supplements entered into from time to time under a master services agreement. Bank of America may terminate any supplement for convenience and without cause at any time. The master services agreement will terminate automatically two years after the date on which there are no supplements outstanding under the agreement, and may be terminated by the parties for cause under specified circumstances. Bank of America may choose not to continue purchasing solutions from us in the future. The continuation of our business relationship with Bank of America, and the amount and timing of Bank of America’s purchases and payments, might be adversely affected by general economic conditions, significant changes within the financial services industry or in the regulation of that industry, competition from other providers of managed security services, changes in Bank of America’s demand for our solutions and other factors beyond our control.
We generate a significant portion of our revenue from clients in the financial services industry, and changes within that industry or an unfavorable review by the federal banking regulatory agencies could reduce demand for our solutions.
We derived approximately 30% of our revenue in fiscal 2018 from financial services institutions and expect to continue to derive a substantial portion of our revenue from clients in the financial services industry. Any of a variety of changes in that industry could adversely affect our revenue, profitability and financial condition. Spending by financial services clients on technology generally has fluctuated, and may continue to fluctuate, based on changes in economic conditions and on other factors, such as decisions by clients to reduce or restructure their technology spending in an attempt to improve profitability. Further, mergers or consolidations of financial institutions could reduce our current and potential client base, resulting in a smaller market for our solutions.
Some of our solutions have been deemed to be mission-critical functions of our financial institution clients that are regulated by one or more member agencies of the Federal Financial Institutions Examination Council, or the FFIEC. We therefore are subject to examination by the member agencies of the FFIEC. The agencies conduct periodic reviews of our operations to identify existing or potential risks associated with our operations that could adversely affect our financial institution clients, evaluate our risk management systems and controls, and determine our compliance with applicable laws that affect the solutions we provide to financial institutions. Areas of examination include our management of technology, data integrity, information confidentiality, service availability and financial stability. A sufficiently unfavorable review could result in our financial institution clients not being allowed, or not choosing, to continue using our solutions, which could adversely affect our revenue, financial condition and results of operations
If we fail to manage our growth effectively, we may be unable to execute our business plan and maintain high levels of client service, and our operations may be disrupted.
As our client base and solutions offerings continue to grow, we will be required to further expand our operations, which could place a strain on our resources and infrastructure and affect our ability to maintain the quality of our solutions, deploy our solutions, support our clients after deployment and foster our client-focused culture. If we are unable to manage our growth, expenses or business effectively, our financial condition, results of operations and profitability could be adversely affected.
As we grow, we must continue to manage efficiently our employees, operations, finances, research and development and capital investments. Our productivity, client-focused culture and the quality of our solutions may be negatively affected if we do not integrate and train our new employees, particularly our sales and account management personnel, quickly and effectively. In addition, we may need to make substantial investments in additional IT infrastructure to support our growth and will need to maintain or improve our operational, financial and management controls and our reporting procedures, which will require substantial management effort and additional investments in our operations. Further, if we expand our offerings, we may compete more directly with security software and service providers that may be better established or have greater resources than we do, our relationships with our channel and strategic partners may be impaired and we may be required to comply with additional industry regulations.
23
Failure to maintain high-quality client service and support functions could adversely affect our reputation and growth prospects.
Once our solutions are deployed within our clients’ networks, our clients depend on our technical and other support services to ensure the security of their IT systems. If we fail to hire, train and retain qualified technical support and professional services employees, our ability to satisfy our clients’ requirements could be adversely affected, particularly if the demand for our solutions expands more rapidly than our ability to implement our solutions and provide client support. The potential for human error in connection with our client service and support functions or the internal systems and networks that underpin our ability to provide solutions to our clients, even if promptly discovered and remediated, could disrupt client operations, cause losses for clients or harm our internal operations, lead to regulatory fines or damage our reputation. In addition, if we do not effectively assist our clients to deploy our solutions, resolve post-deployment issues or provide effective ongoing support, our ability to sell additional solutions or subscriptions to existing clients could suffer and our reputation with potential clients could be damaged. If we fail to meet the requirements of our existing clients, particularly larger enterprises that may require higher levels of support, it may be more difficult to realize our strategy of selling higher-margin or different types of solutions to those clients.
Our results of operations may be adversely affected by service level agreements with some of our clients that require us to provide them with credits for service failures or inadequacies.
We have agreements with some of our clients in which we have committed to provide them our solutions at specified levels. If we are unable to meet the commitments, we may be obligated to extend service credits to those clients, or could face terminations of the service agreements. Damages for failure to meet the service levels specified in our service level agreements generally are limited to the fees charged over the previous 12 months, but, if challenged, such limits on damages payable by us may not be upheld, and we may be required to pay damages greater than such fees. Repeated or significant service failures or inadequacies could adversely affect our reputation and results of operations.
If we are unable to continue the expansion of our sales force, the growth of our business could be harmed.
We are substantially dependent on our direct sales force to obtain new clients and increase sales to existing clients, and we believe that our growth will be constrained if we are not successful in recruiting, training and retaining a sufficient number of qualified sales personnel. There is significant competition for sales personnel with the deep skills and technical knowledge required to sell our information security solutions. We may be unable to hire or retain sufficient numbers of qualified individuals in the domestic and international markets in which we do business or plan to do business. Because we seek to grow rapidly, many members of our sales force may be new to our company at any time. Newly hired sales personnel require extensive training and experience in selling activity before they achieve full productivity. Sales force members that we have hired recently or plan to hire may not become productive as quickly as we expect. If we are unable to hire and train a sufficient number of effective sales personnel, or the sales personnel we hire are not successful in obtaining new clients or increasing sales to our existing client base, our business, results of operations and growth prospects will be adversely affected.
Our sales cycles are long and unpredictable, and our sales efforts require considerable time and expense, which could adversely affect our results of operations.
Sales of our information security solutions usually require lengthy sales cycles, which are typically three to nine months, but can exceed 12 months for larger clients. Sales to our clients can be complex and require us to educate our clients about our technical capabilities and the use and benefits of our solutions. Clients typically undertake a significant evaluation and acceptance process, and their subscription decisions frequently are influenced by budgetary constraints, technology evaluations, multiple approvals and unplanned administrative, processing and other delays. We spend substantial time, effort and money in our sales efforts without any assurance that our efforts will generate long-term contracts. If we do not realize the sales we expect from potential clients, our revenue and results of operations could be adversely affected.
As we continue to expand sales of our information security solutions to clients located outside the United States, our business increasingly will be susceptible to risks associated with international sales and operations.
We have limited experience operating in international jurisdictions compared to our experience operating in the United States. We expect to increase our presence internationally through additional relationships with local and regional strategic and distribution partners and potentially through acquisitions of other companies. International revenue, which we define as revenue contracted through non-U.S. entities, contributed approximately 16% of our total revenue in fiscal 2018. Our lack of experience in operating our business outside the United States increases the risk that any international expansion efforts will not
24
be successful. In addition, operating in international markets requires significant management attention and financial resources. The investment and additional resources required to establish operations and manage growth in other countries may not produce the expected levels of revenue or earnings.
Conducting international operations subjects us to risks that include:
• | the time, resources and expense required for localization of our solutions, including translation of our Internet-based portal interface into other languages, provision of client support in other languages and creation of localized agreements; |
• | the burdens of complying with a wide variety of international laws, regulations and legal standards, including local data privacy laws, local consumer protection laws that could regulate permitted pricing and promotion practices, and restrictions on the use, import or export of encryption technologies; |
• | longer accounts receivable payment cycles and difficulties in collecting accounts receivable; |
• | fluctuations in currency exchange rates; |
• | tariffs and trade barriers and other regulatory or contractual limitations on our ability to sell or develop our solutions in some international markets; |
• | difficulties in managing and staffing international operations; |
• | compliance with U.S. laws that apply to operations outside of the United States, including the Foreign Corrupt Practices Act, or FCPA, the Trading with the Enemy Act and regulations of the Office of Foreign Assets Control; |
• | potentially adverse tax consequences and compliance costs resulting from the complexities of international tax systems and overlap of different tax regimes; |
• | reduced or varied protection of intellectual property rights in some countries that could expose us to increased risk of infringement of our patents and other intellectual property; and |
• | political, social and economic instability, terrorist attacks and security concerns in general. |
The occurrence of any of these risks could negatively affect our international business and, consequently, our overall business, results of operations and financial condition.
An inability to expand our key distribution relationships would constrain the growth of our business.
We intend to expand our distribution relationships to increase domestic and international sales. Approximately 7% of our revenue in fiscal 2018 was generated through our channel partners, which include referral agents, regional value-added resellers and trade associations. Our strategy is to increase the percentage of our revenue that we derive from sales through our channel partners. Our inability to maintain or further develop relationships with our current and prospective distribution partners could reduce sales of our information security solutions and adversely affect our revenue growth and financial condition.
Our agreements with our partners generally are non-exclusive, and our partners may have more established relationships with one or more of our competitors. If our partners do not effectively market and sell our solutions, if they choose to place greater emphasis on their own products or services or those offered by our competitors or if they fail to meet our clients’ needs, our ability to expand our business and sell our solutions may be adversely affected. Our business also may suffer from the loss of a substantial number of our partners, the failure to recruit additional partners, any reduction or delay in the sales of our solutions by our partners, or conflicts between sales by our partners and our direct sales and marketing activities. The gross margins to us from sales by our partners generally are lower than gross margins to us from direct sales. In addition, sales by our partners are more likely than direct sales to involve collectability concerns and may contribute to periodic fluctuations in our results of operations.
25
Our technology alliance partnerships expose us to a range of business risks and uncertainties that could prevent us from realizing the benefits we seek from these partnerships.
We have entered, and intend to continue to enter, into technology alliance partnerships with third parties to support our future growth plans. Such relationships include technology licensing, joint technology development and integration, research cooperation, co-marketing and sell-through arrangements. We face a number of risks relating to our technology alliance partnerships that could prevent us from realizing the benefits we seek from these partnerships on a timely basis or at all. Technology alliance partnerships can require significant coordination between the partners and a significant commitment of time and resources by their technical staffs. In cases where we wish to integrate a partner’s products or services into our solutions, the integration process may be more difficult than we anticipate, and the risk of integration difficulties, incompatibility and undetected programming errors or defects may be higher than the risks normally associated with the introduction of new products or services. In addition, we have no assurance that any particular relationship will continue for any specific period of time. If we lose a significant technology alliance partner, we could lose the benefit of our investment of time, money and resources in the relationship. Moreover, we could be required to incur significant expenses to develop a new strategic alliance or to formulate and implement an alternative plan to pursue the opportunity that we targeted with the former partner.
Real or perceived defects, errors or vulnerabilities in our solutions or the failure of our solutions to prevent a security breach could disrupt our business, harm our reputation, cause us to lose clients and expose us to costly litigation.
Our solutions are complex and may contain defects or errors that are not detected until after their adoption by our clients. As a result of such defects, our clients may be vulnerable to cyber attacks, and hackers or other threat actors may misappropriate our clients’ data or other assets or otherwise compromise their IT systems. In addition, because the techniques used to access or sabotage IT systems and networks change frequently and generally are not recognized until launched against a target, an advanced attack could emerge that our solutions are unable to detect or prevent. Further, as a well-known information security solutions provider, we are a high-profile target, and our websites, networks, information systems, solutions and technologies may be selected for sabotage, disruption or misappropriation by attacks specifically designed to interrupt our business and harm our reputation. Our solutions frequently involve the collection, filtering and logging of our clients’ information, and our enterprise operations involve the collection, processing, storage and disposition of our own human resources, intellectual property and other information. A security breach of proprietary information could result in significant legal and financial exposure, damage to our reputation and a loss of confidence in the security of our solutions that could have an adverse effect on our business.
If any of our clients experiences an IT security breach after adopting our solutions, even if our solutions have blocked the theft of any data or provided some form of remediation, the client could be disappointed with our solutions and could look to our competitors for alternatives to our solutions. Further, if any enterprise or government entity publicly known to use our solutions is the subject of a publicized cyber attack, some of our other current clients could seek to replace our solutions with those provided by our competitors. Any real or perceived defects, errors or vulnerabilities in our solutions, or any other failure of our solutions to detect an advanced threat, could result in:
• | expenditure of significant financial and development resources in efforts to analyze, correct, eliminate or work around the cause of any related vulnerabilities; |
• | loss of existing or potential clients or channel partners; |
• | delayed or lost revenue; |
• | extension of service credits to affected clients, which would reduce our revenue; |
• | failure to attain or retain market acceptance of our solutions; and |
• | litigation, regulatory inquiries or investigations that may be costly and harm our reputation. |
26
Any person that circumvents our security measures could misappropriate the confidential information or other valuable property of our clients or disrupt their operations. If such an event occurs, affected clients or others may sue us. Defending a lawsuit, regardless of its merit, could be time-consuming and costly. Because our solutions provide and monitor information security and may protect valuable information, we could face liability claims or claims for breach of service level agreements. Provisions in our service agreements that limit our exposure to liability claims may not be enforceable in some circumstances or may not protect us fully against such claims and related costs. Alleviating any of these problems could require significant expenditures by us and result in interruptions to and delays in the delivery of our solutions, which could cause us to lose existing or potential clients and damage our business and prospects.
If our solutions do not interoperate with our clients’ IT infrastructure, our solutions may become less competitive and our results of operations may be harmed.
Our solutions must effectively interoperate with each client’s existing or future IT infrastructure, which often has different specifications, utilizes multiple protocol standards, deploys products and services from multiple vendors and contains multiple generations of products and services that have been added over time. As a result, when problems occur in a network, it may be difficult to identify the sources of these problems and avoid disruptions when we provide software updates or patches to defend against particular vulnerabilities. Ineffective interoperation could increase the risk of a successful cyber attack and violations of our service level agreements, which would require us to provide service credits that would reduce our revenue.
In addition, government entities and other clients may require our solutions to comply with security or other certifications and standards. If our solutions are late in achieving or fail to achieve compliance with these certifications and standards, or our competitors achieve compliance with these certifications and standards before we do, we may be disqualified from selling our solutions to such clients or otherwise may be placed at a competitive disadvantage.
Loss of our right or ability to use various third-party technologies could result in short-term disruptions to our business.
We incorporate some third-party technologies into our solutions and may seek to incorporate additional third-party technologies in the future. Any loss of our right to use third-party or other technologies could result in delays in producing or delivering our solutions until we identify and integrate equivalent technologies. If any of the technologies we license or purchase from others, or functional equivalents of these technologies, are no longer available to us or are no longer offered to us on commercially reasonable terms, we would be required either to redesign our solutions and devices to function with technologies available from other parties or to develop these components ourselves, which could result in increased costs or delays in the delivery of our solutions and in the release of new offerings. We also might have to limit the features available in our current or future solutions. If we fail to maintain or renegotiate some of our technology agreements with third parties, we could face significant delays and diversion of resources in attempting to license and integrate other technologies with equivalent functions. Any errors or defects in third-party technologies, any inability to utilize third-party technologies as contemplated, or any inability to procure and implement suitable replacement technologies could adversely affect our business and results of operations by impeding delivery of our solutions.
Evolving information security and data privacy laws and regulations may result in increased compliance costs, impediments to the development or performance of our offerings, and monetary or other penalties.
Because our solutions process client data that may contain personal data or other potentially sensitive information, we are or may become subject to federal, state and foreign laws and regulations regarding the privacy and protection of such client data. These laws and regulations address a range of issues, including data privacy, cybersecurity and restrictions or technological requirements regarding the collection, use, storage, protection, retention or transfer of data. The regulatory framework for data privacy and cybersecurity issues worldwide can vary substantially from jurisdiction to jurisdiction, is rapidly evolving and is likely to remain uncertain for the foreseeable future. Foreign privacy and data protection laws and regulations can be more restrictive than those in the United States. Internationally, most of the jurisdictions in which we operate have established their own data security and privacy legal frameworks with which we or our clients must comply, including the Data Protection Directive established in the European Union. In addition, the European Council and European Parliament have adopted a data protection regulation, known as the General Data Protection Regulation, or GDPR, which will become effective in May 2018. The GDPR will replace the current Data Protection Directive and related country-specific legislation. The GDPR will include operational and governance requirements for companies that collect or process personal data of residents of the European Union that differ from or expand upon those currently in place in the European Union. The GDPR also provides for significant penalties for non-compliance. The costs of compliance with, and other burdens imposed by, these laws and regulations may become substantial and may limit the use and adoption of our offerings, require us to change our business practices, impede the performance and development of our solutions, or lead to significant fines, penalties or liabilities for noncompliance with such laws or regulations.
27
If we are not able to maintain and enhance our brand, our revenue and profitability could be adversely affected.
We believe that maintaining and enhancing the Secureworks brand is critical to our relationships with our existing and potential clients, channel partners and employees and to our revenue growth and profitability. Our brand promotion activities, however, may not be successful. Any successful promotion of our brand will depend on our marketing and public relations efforts, our ability to continue to offer high-quality information security solutions and our ability to differentiate successfully our solutions from the services offered by our competitors.
We believe our association with Dell has helped us to build relationships with many of our clients because of Dell’s globally recognized brand and favorable market perception of the quality of its products. We have entered into a trademark license agreement with Dell Inc. under which Dell Inc. has granted us a non-exclusive, royalty-free worldwide license to use the trademark “DELL,” solely in the form of “SECUREWORKS-A DELL COMPANY,” in connection with our business and products, services and advertising and marketing materials related to our business. Under the agreement, our use of the Dell trademark in connection with any product, service or otherwise is subject to Dell Inc.’s prior review and written approval, which may be revoked at any time. We must immediately cease use of the licensed trademark generally or in connection with any product, services or materials upon Dell Inc.’s written request. The agreement is terminable at will by either party, and we must cease all use of the Dell trademark upon any such termination. If we discontinue our association with Dell in the future, our ability to attract new clients may suffer.
Extending our brand to new solutions that differ from our current offerings may dilute our brand, particularly if we fail to maintain our quality standards in providing the new solutions. Moreover, it may be difficult to maintain and enhance our brand in connection with sales through channel partners. The promotion of our brand will require us to make substantial expenditures, and we anticipate that the expenditures will increase as the information security market becomes more competitive and as we continue to increase our geographic footprint. Even if our promotional activities yield increased revenue, the increased revenue may not offset the additional expenses we incur.
We may expand through acquisitions of other companies, which could divert our management’s attention from our current business and could result in unforeseen operating difficulties, increased costs and dilution to our stockholders.
We may make strategic acquisitions of other companies to supplement our internal growth. We could experience unforeseen operating difficulties in assimilating or integrating the businesses, technologies, services, products, personnel or operations of acquired companies, especially if the key personnel of any acquired company choose not to work for us. Further, future acquisitions may:
• | involve our entry into geographic or business markets in which we have little or no experience; |
• | create difficulties in retaining the clients of any acquired business; |
• | result in a delay or reduction of client sales for both us and the company we acquire because of client uncertainty about the continuity and effectiveness of solutions offered by either company; and |
• | disrupt our existing business by diverting resources and significant management attention that otherwise would be focused on developing our existing business. |
To complete an acquisition, we may be required to use a substantial amount of our cash, sell or use equity or incur debt to secure additional funds. If we raise additional funds through issuances of equity or convertible debt securities, our existing stockholders could suffer significant dilution, and any new equity securities we issue could have rights, preferences and privileges senior to those of our Class A common stock. Any debt financing obtained by us in the future could involve restrictive covenants that will limit our capital-raising activities and operating flexibility. In addition, we may not be able to obtain additional financing on terms favorable to us or at all, which could limit our ability to engage in acquisitions. We may not realize the anticipated benefits of any acquisition we are able to complete. An acquisition also may negatively
affect our results of operations because it may:
• | expose us to unexpected liabilities; |
• | require us to incur charges and substantial indebtedness or liabilities; |
• | have adverse tax consequences; |
28
• | result in acquired in-process research and development expenses, or in the future require the amortization, write-down or impairment of amounts related to deferred compensation, goodwill and other intangible assets; or |
• | fail to generate a financial return sufficient to offset acquisition costs. |
Because we recognize revenue ratably over the terms of our managed security and threat intelligence contracts, decreases in sales of these solutions may not immediately be reflected in our results of operations.
Historically, approximately 80% of our revenue was derived from subscription-based solutions, attributable to managed security contracts, while approximately 20% was derived from professional services engagements. Our subscription contracts typically range from one to three years in duration and, as of February 2, 2018, averaged two years in duration. Revenue related to these contracts generally is recognized ratably over the contract term. As a result, we derive most of our quarterly revenue from contracts we entered into during previous fiscal quarters. A decline in new or renewed contracts and any renewals at reduced annual dollar amounts in a particular quarter may not be reflected in any significant manner in our revenue for that quarter, but would negatively affect revenue in future quarters. Accordingly, the effect of significant downturns in contracts may not be fully reflected in our results of operations until future periods. As of February 2, 2018, we billed approximately 53% of our recurring revenue in advance. We may not be able to adjust our outflows of cash to match any decreases in cash received from prepayments if sales decline. In addition, we may be unable to adjust our cost structure to reflect reduced revenue, which would have a negative effect on our earnings in future periods. Our subscription model also makes it difficult for us to increase our revenue rapidly through additional sales in any period, as revenue from new clients must be recognized over the applicable contract term. Accordingly, the effect of significant downturns in sales and market acceptance of our solutions may not be fully reflected in our results of operations in the current period, making it more difficult for investors to evaluate our financial performance.
Because we typically expense sales commissions paid to our strategic and distribution partners upon entering contracts for the solutions sold and recognize the revenue associated with such sales over the terms of the contracts, our operating income in any period may not be indicative of our future performance.
In connection with sales facilitated by our strategic and distribution partners, which accounted for approximately 7% of our revenue for fiscal 2018, we typically expense the associated commissions paid to such partners, which totaled $0.4 million for fiscal 2018, at the time we enter into the client contract for our solutions. In contrast, we recognize the revenue associated with the sales of our subscription-based solutions ratably over the term of a client contract, which, as of February 2, 2018, had an average duration of two years. The commissions associated with increased sales from our strategic and distribution partners could reduce our operating income. In addition, the number of sales through our strategic and distribution partners may fluctuate within a period. Therefore, our operating income during any one quarter may not be a reliable indicator of our future financial performance.
If the estimates or judgments relating to our critical accounting policies prove to be incorrect, our reported results of operations may be adversely affected.
The preparation of financial statements in conformity with generally accepted accounting principles in the United States of America, or GAAP, requires our management to make estimates and assumptions that affect the amounts reported in our financial statements and accompanying notes. We base our estimates on historical experience and on various other assumptions that we believe to be reasonable under the circumstances. Our reported results of operations may be adversely affected if our assumptions change or if actual circumstances differ from those in our assumptions. Significant assumptions and estimates used in preparing our financial statements include those related to revenue recognition, stock-based compensation and estimates of the amount of loss contingencies. In addition, GAAP is subject to interpretation by the Securities and Exchange Commission, or the SEC, and various other bodies. A change in GAAP or interpretations of GAAP could have a significant effect on our reported results and may affect our reporting of transactions completed before a change is announced. Changes to those rules or the interpretation of our current practices may adversely affect our reported financial results or the way in which we conduct our business.
29
We are exposed to fluctuations in currency exchange rates, which could negatively affect our financial condition and results of operations.
Our revenue and expenses denominated in foreign currencies are subject to fluctuations due to changes in foreign currency exchange rates. As we expand internationally in accordance with our growth strategy, we will enter into more sales contracts denominated in foreign currencies and incur incremental operating expenses outside the United States. Further, a strengthening of the U.S. dollar could increase the real cost of our solutions and subscriptions to our clients outside the United States, which could adversely affect our non-U.S. sales and results of operations. We do not currently hedge against the risks associated with currency fluctuations, but, as our international operations grow, we may begin to use foreign exchange forward contracts to partially mitigate the impact of fluctuations in net monetary assets denominated in foreign currencies. Any
such hedges may be ineffective to protect us fully against foreign currency risk.
Governmental export or import controls could subject us to liability or limit our ability to compete in foreign markets.
Our information security solutions and technologies incorporate encryption technology and may be exported outside the United States only if we obtain an export license or qualify for an export license exception. Compliance with applicable regulatory requirements regarding the export of our solutions and technologies may create delays in the introduction of our solutions and technologies in international markets, prevent our clients with international operations from utilizing our solutions and technologies throughout their global systems or prevent the export of our solutions and technologies to some countries altogether. In addition, various countries regulate the import of our appliance-based technologies and have enacted laws that could limit our ability to distribute, and our clients’ ability to implement, our technologies in those countries. Any new export or import restrictions, new legislation or shifting approaches in the enforcement or scope of existing regulations, or in the countries, persons or technologies targeted by such regulations, could result in decreased use of our solutions and technologies by existing clients with international operations, loss of sales to potential clients with international operations and decreased revenue. If we fail to comply with export and import regulations, we may be denied export privileges, be subjected to fines or other penalties or fail to obtain entry for our technologies into other countries.
Failure to comply with the Foreign Corrupt Practices Act, and similar laws associated with our current and future international activities, could subject us to penalties and other adverse consequences.
In some countries where we currently operate or expect to conduct business in the future, it is common to engage in business practices that are prohibited by U.S. laws and regulations, including the FCPA, regardless of where such behavior occurs. Such laws prohibit improper payments or offers of payments to foreign governments and their officials and political parties by U.S. and other business entities for the purpose of obtaining or retaining business. Although we have implemented policies and procedures to discourage such practices, some of our employees, consultants, sales agents or channel partners, including those that may be based in or from countries where practices that violate U.S. laws may be customary, may take actions in violation of our procedures and for which we ultimately may be responsible. Violations of the FCPA may result in severe criminal or civil sanctions, including suspension or debarment from contracting with government entities in the United States, and could subject us to other liabilities, which could negatively affect our business and financial condition.
Our disclosure controls and procedures may not prevent or detect all errors or acts of fraud.
We are subject to the periodic reporting requirements of the Securities Exchange Act of 1934, or Exchange Act, and are required to maintain effective disclosure controls and procedures. Our disclosure controls and procedures are designed to provide reasonable assurance that information required to be disclosed by us in reports we file or furnish to the SEC under the Exchange Act is accumulated and communicated to management and is recorded, processed, summarized and reported within the periods specified in SEC rules and forms. Because of the inherent limitations in our control system, however, misstatements due to error or fraud may occur and not be detected. These inherent limitations include the realities that judgments in decision-making can be faulty and that breakdowns can occur because of simple error. In addition, controls can be circumvented by the individual acts of some persons, by collusion of two or more people or by an unauthorized override of the controls.
30
Earthquakes, fires, power outages, floods, terrorist attacks and other catastrophic events could disrupt our business and ability to serve our clients.
A significant natural disaster, such as an earthquake, a fire, a flood or a significant power outage, could have a material adverse effect on our business, results of operations or financial condition. Although our four counter threat operations centers are designed to be redundant and to offer seamless backup support in an emergency, we rely on two primary data centers to sustain our operations. While each of these data centers is capable of sustaining our operations individually, a simultaneous failure of the centers could disrupt our ability to serve our clients. In addition, our ability to deliver our solutions as agreed with our clients depends on the ability of our supply chain, manufacturing vendors or logistics providers to deliver products or perform services we have procured from them. If any natural disaster impairs the ability of our vendors or service providers to support us on a timely basis, our ability to perform our client engagements may suffer. Acts of terrorism or other geopolitical unrest also could cause disruptions in our business or the business of our supply chain, manufacturing vendors or logistics providers. The adverse impacts of these risks may increase if the disaster recovery plans for us and our suppliers prove to be inadequate.
Risks Related to Intellectual Property
We rely in part on patents to protect our intellectual property rights, and if our patents are ineffective in doing so, third parties may be able to use aspects of our proprietary technology without compensating us.
As of February 2, 2018, we owned 22 issued patents and 26 pending patent applications in the United States and four issued patents and two pending patent applications outside the United States. Obtaining, maintaining and enforcing our patent rights is costly and time-consuming. Moreover, any failure of our patents and patent strategy to protect our intellectual property rights adequately could harm our competitive position. We do not know whether any of our pending patent applications will result in the issuance of patents or whether the examination process will require us to modify or narrow our claims, and even if any of our pending patent applications issues, such patents may not provide us with meaningful protection or competitive advantages, and may be circumvented by third parties. Changes in patent laws, implementing regulations or the interpretation of patent laws may diminish the value of our rights. Our competitors may design around technologies we have patented, licensed or developed. In addition, the issuance of a patent does not give us the right to practice the patented invention. Third parties may have blocking patents that could prevent us from marketing our solutions or practicing our own patented technology.
Third parties may challenge any patent that we own or license, through adversarial proceedings in the issuing offices or in court proceedings, including as a response to any assertion of our patents against them. In any of these proceedings, a court or agency with jurisdiction may find our patents invalid or unenforceable or, even if valid and enforceable, insufficient to provide adequate protection against competing solutions. The standards by which the United States Patent and Trademark Office and its foreign counterparts grant technology-related patents are not always applied predictably or uniformly. The legal systems of some countries do not favor the aggressive enforcement of patents, and the laws of other countries may not allow us to protect our inventions with patents to the same extent as U.S. laws. If any of our patents is challenged, invalidated or circumvented by third parties, and if we do not own or have exclusive rights to other enforceable patents protecting our solutions or other technologies, competitors and other third parties could market products or services and use processes that incorporate aspects of our proprietary technology without compensating us, which may have an adverse effect on our business.
If we are unable to protect, maintain or enforce our non-patented intellectual property rights and proprietary information, our competitive position could be harmed and we could be required to incur significant expenses to enforce our rights.
Our business relies in part on non-patented intellectual property rights and proprietary information, such as trade secrets, confidential information and know-how, all of which offer only limited protection to our technology. The legal standards relating to the validity, enforceability and scope of protection of intellectual property rights in the information technology industry are highly uncertain and evolving. Although we regularly enter into non-disclosure and confidentiality agreements with employees, vendors, clients and other third parties, these agreements may be breached or otherwise fail to prevent disclosure of proprietary or confidential information effectively or to provide an adequate remedy in the event of such unauthorized disclosure. In addition, the existence of our own trade secrets, confidential information and know-how affords no protection against independent discovery or development of such intellectual property by other persons. If our employees, consultants or contractors use technology or know-how owned by third parties in their work for us, disputes may arise between us and those third parties as to the rights in related inventions. Our ability to police that misappropriation or infringement is uncertain, particularly in other countries. Costly and time-consuming litigation could be necessary to enforce and determine the scope of our proprietary rights, and failure to maintain trade secret protection could adversely affect our competitive business position.
31
Claims by others that we infringe their proprietary technology could harm our business and financial condition.
Third parties could claim that our technologies and the processes underlying our solutions infringe or otherwise violate their proprietary rights. The software and technology industries are characterized by the existence of a large number of patents, copyrights, trademarks and trade secrets and by frequent litigation, including by non-practicing entities, based on allegations of infringement or other violations of intellectual property rights, and we expect that such claims may increase as competition in the information security market continues to intensify, as we introduce new solutions (including in geographic areas where we currently do not operate) and as business-model or product or service overlaps between our competitors and us continue to occur. For example, in fiscal 2016, we settled litigation in which a third party alleged that aspects of our business and solutions infringed and induced the infringement of two of its U.S. patents relating to network intrusion and event monitoring technology.
To the extent that we achieve greater prominence and market exposure as a public company, we may face a higher risk of being the target of intellectual property infringement claims. From time to time, we may receive notices alleging that we have infringed, misappropriated or misused other parties’ intellectual property rights. There may be third-party intellectual property rights, including patents and pending patent applications, that cover significant aspects of our technologies, processes or business methods. Any claims of infringement by a third party, even claims without merit, could cause us to incur substantial defense costs and could distract our management and technical personnel from our business, and there can be no assurance that our technologies and processes will be able to withstand such claims. Competitors may have the capability to dedicate substantially greater resources to enforce their intellectual property rights and to defend claims that may be brought against them than we do. Further, a party making such a claim, if successful, could secure a judgment that requires us to pay substantial damages, which potentially could include treble damages if we are found to have willfully infringed patents. A judgment also could include an injunction or other court order that could prevent us from offering our solutions. In addition, we might be required to seek a license or enter into royalty arrangements for the use of the infringed intellectual property, which may not be available on commercially reasonable terms or at all. The failure to obtain a license or the costs associated with any license could materially and adversely affect our business, financial condition and results of operations. If a third party does not offer us a license to its technology or other intellectual property on reasonable terms, we could be precluded from continuing to use such intellectual property. Parties with which we currently have license agreements, or with which we may enter into license agreements in the future, including Dell, may have the right to terminate such agreements for our material breach or for convenience at any time, which could affect our ability to make use of material intellectual property rights. Alternatively, we might be required to develop non-infringing technology, which could require significant effort and expense and ultimately might not be successful.
Third parties also may assert infringement claims against our clients relating to our devices or technology. Any of these claims might require us to initiate or defend potentially protracted and costly litigation on their behalf, regardless of the merits of these claims, because under specified conditions we agree to indemnify our clients from claims of infringement of proprietary rights of third parties. If any of these claims were to succeed, we might be forced to pay damages on behalf of our clients, which could adversely affect our profitability and harm our reputation in the industry.
Our use of open source technology could require us in some circumstances to make available source code of our modifications to that technology, which could include source code of our proprietary technologies, and also may restrict our ability to commercialize our solutions.
Some of our solutions and technologies incorporate software licensed by its authors or other third parties under open source licenses. To the extent that we use open source software, we face risks arising from the scope and requirements of common open source software licenses. Some of these licenses contain requirements that we make available source code for modifications or derivative works we create based on the open source software, and that we license such modifications or derivative works under the terms of a particular open source license or other license granting third parties certain rights of further use. If we combine our proprietary technology with open source software in a certain manner, we may face claims from time to time from third parties claiming ownership of, or demanding release of, the open source software or derivative works that we developed using such software, which could include our proprietary source code, or otherwise seeking to enforce the terms of the applicable open source license. For example, the GNU General Public License could subject certain portions of our proprietary technologies to the requirements of that license, and these, or similar requirements, may have adverse effects on our sale of solutions incorporating such open source software.
32
Our ability to commercialize solutions or technologies incorporating open source software may be restricted because, among other reasons, open source license terms may be ambiguous and may result in unanticipated or uncertain obligations regarding our solutions, litigation or loss of the right to use this software. The terms of many open source licenses to which we are subject have not been interpreted by courts in the United States or other countries. Therefore, there is a risk that the terms of these licenses will be construed in a manner that imposes unanticipated conditions or restrictions on our ability to commercialize our solutions, and we could be required to seek licenses from third parties to continue offering our solutions, to re-engineer our technology or to discontinue offering our solutions if re-engineering cannot be accomplished in a commercially reasonable manner. In addition, use of open source software can lead to greater risks than use of third-party commercial software, as open source licensors generally do not provide warranties or controls on the origin of the software, and it may be difficult for us to identify accurately the developers of the open source code and determine whether the open source software infringes third-party intellectual property rights. We would be subject to similar risks with respect to software or technologies we acquire that include open source components. Our need to comply with unanticipated license conditions and restrictions, the need to seek licenses from third parties or any judgments requiring us to provide remedies typically covered by third-party product warranties – each as a result of our use of open source software – could adversely affect our business, results of operations and financial condition.
Risks Related to Our Relationship with Dell and Dell Technologies
As long as Dell Technologies Inc. controls us, the ability of our other stockholders to influence matters requiring stockholder approval will be limited.
We became an indirect wholly-owned subsidiary of Dell Inc. and Dell Inc.’s subsidiaries when we were acquired by Dell on February 8, 2011. On October 29, 2013, Dell Inc. was acquired in a going-private transaction by Denali Holding Inc., a holding company that changed its name to Dell Technologies Inc., or Dell Technologies, in August 2016. Upon the completion of the going-private transaction, we became an indirect wholly-owned subsidiary of Dell Technologies. As of February 2, 2018, the principal beneficial owners of Dell Technologies’ outstanding voting securities were Michael S. Dell, the Chairman, Chief Executive Officer and founder of Dell, and investment funds affiliated with Silver Lake Partners, a global private equity firm.
As of February 2, 2018, Dell Technologies owned, indirectly through Dell Inc. and Dell Inc.’s subsidiaries, no shares of our outstanding Class A common stock and all 70,000,000 outstanding shares of our Class B common stock, which represented approximately 86.3% of our total outstanding shares of common stock and approximately 98.4% of the combined voting power of both classes of our outstanding common stock.
Our other stockholders will not be able to affect the outcome of any stockholder vote while Dell Technologies controls the majority of the voting power of our outstanding common stock. Dell Technologies is able to control, directly or indirectly and subject to applicable law, significant matters affecting us, including:
• | the election and removal of our directors; |
• | amendments to our certificate of incorporation; |
• | determinations with respect to mergers, business combinations, dispositions of assets or other extraordinary corporate transactions; and |
• | agreements that may adversely affect us. |
If Dell Technologies does not provide any requisite affirmative vote on matters requiring stockholder approval allowing us to take particular corporate actions when requested, we will not be able to take such actions, and, as a result, our business and our results of operations may be adversely affected.
Dell Technologies could have interests that differ from, or conflict with, the interests of our other stockholders, and could cause us to take corporate actions even if the actions are not in the interest of our company or our other stockholders, or are opposed by our other stockholders. For example, Dell Technologies’ voting control could discourage or prevent a change in control of our company even if some of our other stockholders might favor such a transaction. Even if Dell Technologies were to control less than a majority of the voting power of our outstanding common stock, it may be able to influence the outcome of significant corporate actions by us for as long as it owns a significant portion of the voting power. If Dell Technologies is acquired or otherwise experiences a change in control, any acquiror or successor will be entitled to exercise Dell Technologies’ voting control with respect to us, and might do so in a manner that could vary significantly from the manner in which Dell Technologies would have exercised such rights.
33
Our inability to resolve in a manner favorable to us any potential conflicts or disputes that arise between us and Dell or Dell Technologies with respect to our past and ongoing relationships may adversely affect our business and prospects.
Potential conflicts or disputes may arise between Dell or Dell Technologies and us in a number of areas relating to our past or ongoing relationships, including:
• | actual or anticipated variations in our quarterly or annual results of operations; |
• | tax, employee benefit, indemnification and other matters arising from our relationship with Dell; |
• | employee retention and recruiting; |
• | business combinations involving us; |
• | our ability to engage in activities with certain channel, technology or other marketing partners; |
• | sales or dispositions by Dell Technologies of all or any portion of its beneficial ownership interest in us; |
• | the nature, quality and pricing of services Dell has agreed to provide us; |
• | business opportunities that may be attractive to both Dell and us; |
• | Dell’s ability to use and sublicense patents that we have licensed to Dell under a patent license agreement; and |
• | product or technology development or marketing activities that may require consent of Dell or Dell Technologies. |
The resolution of any potential conflicts or disputes between us and Dell or Dell Technologies over these or other matters may be less favorable to us than the resolution we might achieve if we were dealing with an unaffiliated party.
In April 2016, in connection with our initial public offering, or IPO, we entered into a shared services agreement, an employee matters agreement, a tax matters agreement, intellectual property agreements, real estate-related agreements and commercial agreements with Dell or Dell Technologies, which are of varying durations and may be amended upon agreement of the parties. The terms of these agreements were primarily determined by Dell and Dell Technologies, and therefore may not be representative of the terms we could obtain on a stand-alone basis or in negotiations with an unaffiliated third party. For so long as we are controlled by Dell Technologies, we may not be able to negotiate renewals or amendments to these agreements, if required, on terms as favorable to us as those we would be able to negotiate with an unaffiliated third party.
If Dell Technologies, Dell or Dell Technologies’ other affiliates or Silver Lake Partners or its affiliates engage in the same type of business we conduct or take advantage of business opportunities that might be attractive to us, our ability to operate successfully and expand our business may be hampered.
Our certificate of incorporation, or charter, provides that, except as otherwise agreed in writing between us and Dell Technologies, Dell or Dell Technologies’ other affiliates (other than us or our controlled affiliates), referred to as the Dell Technologies Entities, have no duty to refrain from:
• | engaging in the same or similar activities or lines of business as those in which we are engaged; |
• | doing business with any of our clients, customers or vendors; or |
• | employing, or otherwise engaging or soliciting for such purpose, any of our officers, directors or employees. |
In addition, under our charter, Silver Lake Partners and its affiliates, referred to as the Silver Lake Entities, have no duty to refrain from any of the foregoing activities except as otherwise agreed in writing between us and a Silver Lake Entity.
Provisions of our charter could result in the Dell Technologies Entities and the Silver Lake Entities having rights to corporate opportunities in which both we and the Dell Technologies Entities or the Silver Lake Entities have an interest. Our charter addresses potential conflicts of interest between our company, on the one hand, and the Dell Technologies Entities or the Silver Lake Entities and their respective officers and directors who are officers or directors of our company, on the other hand. If any
34
Dell Technologies Entity or Silver Lake Entity is offered, or acquires knowledge of, a potential corporate opportunity suitable for both it and us, we will have no interest in that opportunity. Our charter also provides that if any of our directors or officers who is also a director or officer of any Dell Technologies Entity or Silver Lake Entity is offered, or acquires knowledge of, a potential corporate opportunity suitable for both the Dell Technologies Entity or the Silver Lake Entity and us, we will have no interest in that opportunity unless the opportunity is expressly offered to that person in writing solely in such person’s capacity as our director or officer.
Our historical financial information as a subsidiary of Dell before our initial public offering may not be representative of our results as an independent public company.
The historical financial statements and the related financial information presented in this annual report on Form 10-K for periods before our initial public offering do not purport to reflect what our results of operations, financial position, equity or cash flows would have been if we had operated as a stand-alone public company during those periods. Such financial statements include allocations for various corporate services Dell has provided to us in the ordinary course of our business, including finance, tax, human resources, legal, insurance, IT, procurement and facilities-related services. As a result, those historical financial statements may not be comparable to our financial statements as a stand-alone public company.
To preserve Dell Technologies ability to conduct a tax-free distribution of the shares of our Class B common stock that it beneficially owns and its ability to consolidate with us for tax purposes, we may be prevented from pursuing opportunities to raise capital, acquire other companies or undertake other transactions, which could hurt our ability to grow.
To preserve its ability to effect a future tax-free spin-off of our company, or certain other tax-free transactions involving us, Dell Technologies is required to maintain “control” of us within the meaning of Section 368(c) of the Internal Revenue Code, which is defined as 80% of the total voting power and 80% of each class of nonvoting stock. In addition, to preserve its ability to consolidate with us for tax purposes, Dell Technologies generally is required to maintain 80% of the voting power and 80% of the value of our outstanding stock. We have entered into a tax matters agreement with Dell Technologies, which restricts our ability to issue any stock, issue any instrument that is convertible, exercisable or exchangeable into any of our stock or which may be deemed to be equity for tax purposes, or take any other action that would be reasonably expected to cause Dell Technologies to beneficially own stock in us that, on a fully diluted basis, does not constitute “control” within the meaning of Section 368(c) of the Internal Revenue Code or to cause a deconsolidation of us for tax purposes with respect to the Dell Technologies consolidated group. We also have agreed to indemnify Dell Technologies for any breach by us of the tax matters agreement. As a result, we may be prevented from raising equity capital or pursuing acquisitions or other growth initiatives that involve issuing equity securities as consideration.
Our ability to operate our business effectively may suffer if we are unable to establish in a cost-effective manner our own administrative and other support functions in order to operate as a stand-alone company after the expiration of our shared services and other agreements with Dell.
As a subsidiary of Dell, we have relied on administrative and other resources of Dell to operate our business. In connection with our IPO, we entered into various agreements to retain the ability for varying periods to use these Dell resources. These services may not be sufficient to meet our needs, and if our agreements with Dell are not renewed by the parties after their initial terms, we may not be able to replace the services at all or obtain them at prices and on terms as favorable as those under our current arrangements with Dell. In such a case, we may need to create our own administrative and other support systems or contract with third parties to replace Dell’s systems. In addition, we have received informal support from Dell that may not be available under our new agreements, and the level of this informal support may diminish as we become a more independent company. Any significant performance failures affecting our own administrative systems or Dell’s administrative systems on which we rely could result in unexpected costs, adversely affect our results and prevent us from paying our suppliers or employees and performing other administrative services on a timely basis.
In connection with our IPO, we entered into agreements with Dell that formalize the process and terms pursuant to which Dell purchases information security solutions from us, together with related hardware, and pursuant to which we procure hardware and software from Dell from time to time. These agreements may not be renewed after their expiration or, if they are renewed, Dell may not agree to renew them on the existing terms. The expiration or termination of these agreements, or their renewal on less favorable terms to us, could result in a loss of business or require us to procure comparable hardware and software from alternative sources, which could have a material adverse effect on our business, results of operations and financial condition.
35
Risks Related to Ownership of Our Class A Common Stock
The price of our Class A common stock may be volatile.
The trading prices of the securities of technology companies historically have experienced high levels of volatility, and the trading price of our Class A common stock has fluctuated since our IPO and may fluctuate substantially in future periods. The trading price of our Class A common stock could fluctuate as a result of the following factors, among others:
• | announcements of new products, services or technologies, commercial relationships, acquisitions or other events by us or our competitors; |
• | changes in how customers perceive the effectiveness of our solutions in protecting against advanced cyber attacks; |
• | actual or anticipated variations in our quarterly or annual results of operations; |
• | changes in our financial guidance or estimates by securities analysts; |
• | price and volume fluctuations in the overall stock market from time to time; |
• | significant volatility in the market price and trading volume of technology companies in general and of companies in the information security industry in particular; |
• | actual or anticipated changes in the expectations of investors or securities analysts; |
• | fluctuations in the trading volume of our shares or the size of the trading market for our shares held by non-affiliates; |
• | litigation involving us, our industry, or both, including disputes or other developments relating to our ability to patent our processes and technologies and protect our other proprietary rights; |
• | regulatory developments in the United States and other jurisdictions in which we operate; |
• | general economic and political factors, including market conditions in our industry or the industries of our clients; |
• | major catastrophic events; |
• | sales of large blocks of our Class A common stock; and |
• | additions or departures of key employees. |
If the market for technology stocks or the stock market in general experiences a loss of investor confidence, the trading price of our Class A common stock could decline for reasons unrelated to our business, results of operations or financial condition. The market price of our Class A common stock also might decline in reaction to events that affect other companies in our industry, even if these events do not directly affect us.
In the past, following periods of volatility in the market price of a company’s securities, securities class action litigation has often been brought against that company. If our stock price is volatile, we may become the target of securities litigation, which could cause us to incur substantial costs and divert our management’s attention and resources from our business.
If securities or industry analysts do not publish research or reports about our business, or publish inaccurate or unfavorable research reports about our business or prospects, the market price of our Class A common stock and trading volume could decline.
The trading market for our Class A common stock depends in part on the research and reports that securities or industry analysts publish about us, our business or our prospects. We do not have any control over these analysts. If one or more of the analysts covering us should downgrade our shares or express a change of opinion regarding our shares, the market price of our Class A common stock could decline. If one or more of these analysts should cease coverage of our company or fail to publish reports on us on a regular basis, we could lose following in the financial markets, which could cause the market price or trading volume of our Class A common stock to decline.
36
As a “controlled company” under the marketplace rules of the NASDAQ Stock Market, we may rely on exemptions from certain corporate governance requirements that provide protection to stockholders of companies that are subject to such requirements.
As of February 2, 2018, Dell Technologies beneficially owns more than 50% of the combined voting power of both classes of our outstanding shares of common stock. As a result, we are a “controlled company” under the marketplace rules of the NASDAQ Stock Market, or NASDAQ, and eligible to rely on exemptions from NASDAQ corporate governance requirements generally obligating listed companies to maintain:
• | a board of directors having a majority of independent directors; |
• | a compensation committee composed entirely of independent directors that approves the compensation payable to the company’s chief executive officer and other executive officers; and |
• | a nominating committee composed entirely of independent directors that nominates candidates for election to the board of directors, or that recommends such candidates for nomination by the board of directors (or obligating the listed company to cause a majority of the board’s independent directors to exercise this oversight of director nominations). |
Although we do not currently rely on the foregoing exemptions from NASDAQ’s corporate governance requirements, we may decide to avail ourselves of one or more of these exemptions in the future. During any period in which we do so, investors may not have the same protections afforded to stockholders of companies that must comply with all of NASDAQ’s corporate governance requirements. Our status as a controlled company could make our Class A common stock less attractive to some investors or otherwise adversely affect its trading price.
Future sales, or the perception of future sales, of a substantial amount of shares of our Class A common stock could depress the trading price of our Class A common stock.
Sales of a substantial number of shares of our Class A common stock in the public market, or the perception that these sales may occur, could adversely affect the market price of the Class A common stock at such time, which could make it more difficult for investors to sell their shares of our Class A common stock at a time and price that they consider appropriate, and could impair our ability to raise equity capital or use our Class A common stock as consideration for acquisitions of other businesses, investments or other corporate purposes.
As of March 26, 2018, we have outstanding 11,772,505 shares of our Class A common stock and 70,000,000 shares of our Class B common stock. Of these shares, the 8,000,000 shares of Class A common stock that were sold in our IPO are freely tradeable without restriction or further registration under the Securities Act of 1933, or Securities Act, unless these shares are held by our “affiliates,” as that term is defined in Rule 144 under the Securities Act, or Rule 144. As of February 2, 2018, Dell Technologies owned, indirectly through its subsidiary Dell Inc. and through Dell Inc.’s subsidiaries, no shares of our Class A common stock and all 70,000,000 outstanding shares of our Class B common stock. The shares of our Class A common stock eligible for resale by our affiliates under Rule 144, subject to the volume limitations and other requirements of Rule 144, include the 70,000,000 shares of Class A common stock issuable upon conversion of the same number of shares of our Class B common stock that are outstanding.
We have entered into a registration rights agreement with Dell Marketing L.P. (the record holder of our Class B common stock), Michael S. Dell, the Susan Lieberman Dell Separate Property Trust, MSDC Denali Investors, L.P., MSDC Denali EIV, LLC and the Silver Lake Partners investment funds that own Dell Technologies common stock in which we have granted them and their respective permitted transferees demand and piggyback registration rights with respect to the shares of our Class A common stock and Class B common stock held by them from time to time. In addition, we have entered into a registration rights agreement with the holders of shares of Class A common stock issued upon conversion of our convertible notes at the closing of our IPO in which we have granted such holders and their permitted transferees shelf and piggyback registration rights with respect to such shares. Registration of those shares under the Securities Act would permit the stockholders under each registration rights agreement to sell their shares into the public market.
37
Our issuance of additional capital stock in connection with financings, acquisitions, investments, our stock incentive plans or otherwise will dilute all other stockholders.
Our charter authorizes us to issue up to 2,500,000,000 shares of Class A common stock, up to 500,000,000 shares of Class B common stock and up to 200,000,000 shares of preferred stock with such rights and preferences as may be determined by our board of directors. Subject to compliance with applicable law, we may issue our shares of Class A common stock or securities convertible into our Class A common stock from time to time in connection with a financing, acquisition, investment, our stock incentive plans or otherwise. We may issue additional shares of Class A common stock from time to time at a discount to the market price of our Class A common stock at the time of issuance. Any issuance of Class A common stock could result in substantial dilution to our existing stockholders and cause the market price of our Class A common stock to decline.
Provisions in our charter and bylaws and in Delaware law could discourage takeover attempts even if our stockholders might benefit from a change in control of our company.
Provisions in our charter and bylaws and in Delaware law may discourage, delay or prevent a merger, acquisition or other change in control of our company that stockholders may favor, including transactions in which stockholders might receive a premium for their shares of Class A common stock. These provisions also could make it more difficult for investors in our Class A common stock to elect directors of their choosing and to cause us to take other corporate actions they support, including removing or replacing our current management. The charter and bylaw provisions:
• | provide that our Class B common stock is entitled to ten votes per share, while our Class A common stock is entitled to one vote per share, enabling Dell Technologies, as the beneficial owner of all outstanding shares of our Class B common stock, to control the outcome of all matters submitted to a vote of our stockholders, including the election of directors; |
• | provide for the classification of the board of directors into three classes, with approximately one-third of the directors to be elected each year; |
• | limit the number of directors constituting the entire board of directors to a maximum of 15 directors, subject to the rights of the holders of any outstanding series of preferred stock, and provide that the authorized number of directors at any time will be fixed exclusively by a resolution adopted by the affirmative vote of the authorized number of directors (without regard to vacancies); |
• | provide that, at such time (if any) as the Dell Technologies Entities beneficially own capital stock representing less than 40% in voting power of the capital stock entitled to vote generally on the election of directors, any newly-created directorship and any vacancy on the board of directors may be filled only by the affirmative vote of a majority of the remaining directors then in office; |
• | provide that, at such time (if any) as the Dell Technologies Entities beneficially own capital stock representing less than 50% in voting power of the capital stock entitled to vote generally on the election of directors, directors may be removed only for cause and only by the affirmative vote of the holders of at least a majority in voting power of all outstanding shares of capital stock, voting together as a single class; |
• | provide that a special meeting of stockholders may be called only by our chairman of the board, a majority of the directors then in office or, so long as Dell Technologies Entities beneficially own capital stock representing at least 40% in voting power of the capital stock entitled to vote generally on the election of directors, Dell Technologies; |
• | provide that, at such time (if any) as the Dell Technologies Entities beneficially own capital stock representing less than 50% in voting power of the capital stock entitled to vote generally on the election of directors, any action required or permitted to be taken by our stockholders at any annual or special meeting may not be effected by a written consent in lieu of a meeting unless such action and the taking of such action by written consent have been approved in advance by our board of directors; |
• | establish advance notice procedures for stockholders to make nominations of candidates for election as directors or to present any other business for consideration at any annual or special stockholder meeting; and |
• | provide authority for the board of directors without stockholder approval to authorize the issuance of up to 200,000,000 shares of preferred stock, in one or more series, with terms and conditions, and having rights, privileges and preferences, to be determined by the board of directors. |
In addition, we will become subject to Section 203 of the Delaware General Corporation Law at such time (if any) as the Dell Technologies Entities cease to own beneficially capital stock representing at least 10% in voting power of the capital stock entitled to vote generally on the election of directors. With specified exceptions, this statute prohibits a Delaware corporation listed on a national securities exchange from engaging in a business combination (as defined in Section 203) with an interested stockholder (generally a person who, together with its affiliates and associates, owns 15% or more of the corporation’s voting
38
stock) for a period of three years after the date of the transaction in which the person became an interested stockholder (unless the corporation’s board of directors approved in advance the transaction in which such person became an interested stockholder).
Our charter designates the Court of Chancery of the State of Delaware as the sole and exclusive forum for certain types of actions and proceedings that may be initiated by our stockholders, which could limit our stockholders’ ability to obtain a favorable judicial forum for disputes with us or with our directors, our officers or other employees, or our majority stockholder.
Our charter provides that, unless we consent in writing to the selection of an alternative forum, the Court of Chancery of the State of Delaware will be the exclusive forum for:
• | any derivative action or proceeding brought on our behalf; |
• | any action asserting a claim of breach of a fiduciary duty owed by, or other wrongdoing by, any of our directors, officers or other employees, or stockholders to us or our stockholders; |
• | any action asserting a claim arising pursuant to any provision of the Delaware General Corporation Law or as to which the Delaware General Corporation Law confers jurisdiction on the Court of Chancery of the State of Delaware; and |
• | any action asserting a claim governed by the internal affairs doctrine. |
Any person purchasing or otherwise acquiring any interest in shares of our capital stock is deemed to have received notice of and consented to the foregoing provisions. This choice of forum provision may limit a stockholder’s ability to bring a claim in a judicial forum that it finds more favorable for disputes with us or with our directors, our officers or other employees, or our other stockholders, including our majority stockholder, which may discourage such lawsuits against us and such other persons. Alternatively, if a court were to find this choice of forum provision inapplicable to, or unenforceable in respect of, one or more of the specified types of actions or proceedings, we may incur additional costs associated with resolving such matters in other jurisdictions, which could adversely affect our business, results of operations and financial condition.
We do not expect to pay any dividends on our Class A common stock for the foreseeable future.
We intend to retain any earnings to finance the operation and expansion of our business, and do not expect to pay any cash dividends on our Class A common stock for the foreseeable future. Accordingly, investors must rely on sales of our Class A common stock after price appreciation, which may never occur, as the only way to realize any future gains on their investment.
We are an “emerging growth company,” and our election to comply with the reduced disclosure requirements as a public company may make our Class A common stock less attractive to investors.
We qualify as an “emerging growth company” as defined in the Jumpstart Our Business Startups Act of 2012, or JOBS Act. For so long as we remain an emerging growth company, we are permitted and currently intend to rely on the following provisions of the JOBS Act that contain exceptions from disclosure and other requirements that otherwise are applicable to companies that file periodic reports with the SEC. The JOBS Act provisions:
• | provide an exemption from the auditor attestation requirement in the assessment of our internal control over financial reporting under the Sarbanes-Oxley Act of 2002, or the Sarbanes-Oxley Act; |
• | permit us to include reduced disclosure regarding executive compensation in our SEC filings; and |
• | provide an exemption from the requirement to hold a non-binding advisory vote on executive compensation and stockholder approval of any golden parachute arrangements not previously approved. |
We will remain an emerging growth company until: (a) the first to occur of the last day of the fiscal year (1) which follows the fifth anniversary of the completion of our IPO, (2) in which we have total annual gross revenue of at least $1 billion or (3) in which the market value of our capital stock held by non-affiliates was $700 million or more as of the last business day of the preceding second fiscal quarter; or (b) if it occurs before any of the foregoing dates, the date on which we have issued more than $1 billion in non-convertible debt over a three-year period.
Some investors may find our Class A common stock less attractive if we rely on these exemptions, which could result in a less active trading market for our Class A common stock and higher volatility in our stock price.
39
We incur increased costs as a result of operating as a public company, and our management is required to devote substantial time to compliance with our public company responsibilities and corporate governance practices.
As a public company, and particularly after we are no longer an emerging growth company, we will continue to incur significant legal, accounting and other expenses that we did not incur as a private company. The Sarbanes-Oxley Act, the Dodd-Frank Wall Street Reform and Consumer Protection Act, the listing requirements of the NASDAQ Global Select Market and other applicable rules and regulations under the Securities Exchange Act of 1934, or Exchange Act, impose various requirements on public companies. Our management and other personnel must devote a substantial amount of time to compliance with these requirements. Moreover, these rules and regulations increase our legal and financial compliance costs and make some activities more time-consuming and costly.
We are obligated to develop and maintain proper and effective internal control over financial reporting and any failure to maintain the adequacy of our internal controls may adversely affect investor confidence in our company and, as a result, the value of our Class A common stock.
We are required, pursuant to Section 404 of the Sarbanes-Oxley Act, or Section 404, to furnish a report by our management on, among other matters, the effectiveness of our internal control over financial reporting. Our independent registered public accounting firm will not be required to attest to the effectiveness of our internal control over financial reporting until our first annual report required to be filed with the SEC following the date we are no longer an emerging growth company. We are required to disclose significant changes made in our internal control procedures on a quarterly basis. Our compliance with Section 404 requires that we incur substantial accounting expense and expend significant management efforts.
During the evaluation and testing process of our internal controls, if we identify one or more material weaknesses in our internal control over financial reporting, we will be unable to assert that our internal control over financial reporting is effective. We may experience material weaknesses or significant deficiencies in our internal control over financial reporting. Any failure to maintain internal control over financial reporting could severely inhibit our ability to report accurately our financial condition or results of operations. If we are unable to conclude that our internal control over financial reporting is effective, or if our independent registered public accounting firm determines we have a material weakness in our internal control over financial reporting, we could lose investor confidence in the accuracy and completeness of our financial reports, the market price of our Class A common stock could decline, and we could be subject to sanctions or investigations by the SEC or other regulatory authorities. Failure to remedy any material weakness in our internal control over financial reporting, or to implement or maintain other effective control systems required of public companies, also could restrict our future access to the capital markets.
Item 1B. Unresolved Staff Comments
None.
Item 2. Properties
As of February 2, 2018, our facilities consisted of our corporate headquarters, four counter threat operations centers, two primary data centers, and various other Dell facilities housing our research and development, marketing and sales functions, and administrative and IT operations support. We either lease these facilities or have the right to use them pursuant to service agreements, either with Dell or with other third parties. As of February 2, 2018, we did not own any facilities.
Our corporate headquarters, as well as one of our counter threat operations centers and one of our data centers, is located in Atlanta, Georgia, where we lease facilities of approximately 141,229 square feet. As of February 2, 2018, we leased or licensed facilities for our other counter threat operations centers in the following locations: Chicago, Illinois; Providence, Rhode Island; and Edinburgh, Scotland. Our employees also operate out of a number of Dell facilities around the globe pursuant to arrangements with Dell. For information about our facility leases, see “Notes to Consolidated Financial Statements—Note 6—Commitments and Contingencies—Purchase Obligations and Lease Commitments” in our consolidated financial statements included in this report.
As we expand, we intend to lease or license additional sites, either from Dell or other third parties, for counter threat operations centers, sales offices and other functions. We believe that suitable additional facilities will be available on commercially reasonable terms to accommodate the foreseeable expansion of our operations.
40
Item 3. Legal Proceedings
From time to time, we are a party to or otherwise subject to legal proceedings that arise in the ordinary course of our business. As of February 2, 2018, we were not subject to any material pending legal proceedings.
Item 4. Mine Safety Disclosures
Not applicable.
41
Part II
Item 5. Market for Registrant's Common Equity, Related Stockholder Matters and Issuer Purchases of Equity Securities
Market for Class A Common Stock
Our Class A common stock is listed on the NASDAQ Global Select Market under the symbol “SCWX.” The following table sets forth information regarding the high and low sales prices of shares of our Class A common stock in fiscal 2018 and in the portion of fiscal 2017 from April 22, 2016, the date on which our Class A common stock began trading on the NASDAQ Global Select Market, through February 2, 2018.
Fiscal Year | High | Low | ||||||||
2018 | First Quarter | $ | 12.11 | $ | 8.25 | |||||
Second Quarter | 11.75 | 8.76 | ||||||||
Third Quarter | 12.99 | 9.53 | ||||||||
Fourth Quarter | 10.47 | 8.10 | ||||||||
2017 | First Quarter (from April 22, 2016) | $ | 14.60 | $ | 13.10 | |||||
Second Quarter | 16.23 | 11.96 | ||||||||
Third Quarter | 15.80 | 11.04 | ||||||||
Fourth Quarter | 12.82 | 10.15 | ||||||||
There is no public market for our Class B common stock.
Holders
As of March 26, 2018, there were nine holders of record of our Class A common stock and one holder of record of our Class B common stock, which is an indirect wholly-owned subsidiary of Dell Technologies. The number of record holders does not include individuals or entities that beneficially own shares of Class A common stock, but whose shares are held of record by a broker, bank or other nominee.
Dividends
Subsequent to the listing of our Class A common stock on the NASDAQ Global Select Market, we have not declared or paid dividends on our common stock. We do not anticipate declaring or paying any cash dividends on our common stock in the foreseeable future. We currently intend to retain all available funds and any future earnings to support our operations and finance the growth and development of our business. Any future determination related to our dividend policy will be made at the discretion of our board of directors and will depend upon, among other factors, our results of operations, financial condition, capital requirements, contractual restrictions, business prospects and other factors our board of directors may deem relevant.
Use of Proceeds from Initial Public Offering of Class A Common Stock
As of February 2, 2018, we have expended approximately $40.6 million of the net proceeds of our IPO for general corporate purposes and have invested approximately $59.0 million of such proceeds in money market funds pending their use in our business.
42
Stock Performance Graph
The following graph compares the cumulative total return on the Class A common stock for the period from April 22, 2016, the date on which the Class A common stock began trading on the NASDAQ Global Select Market, through February 2, 2018 with the total return over the same period on the Nasdaq Composite Index and the PureFunds ISE Cyber Security ETF Index. The graph assumes that $100 was invested on April 22, 2016 in the Class A common stock and in each of the foregoing indices and assumes reinvestment of dividends, if any. The comparisons in the graph are based on historical data and are not necessarily indicative of the future price performance of the Class A common stock.
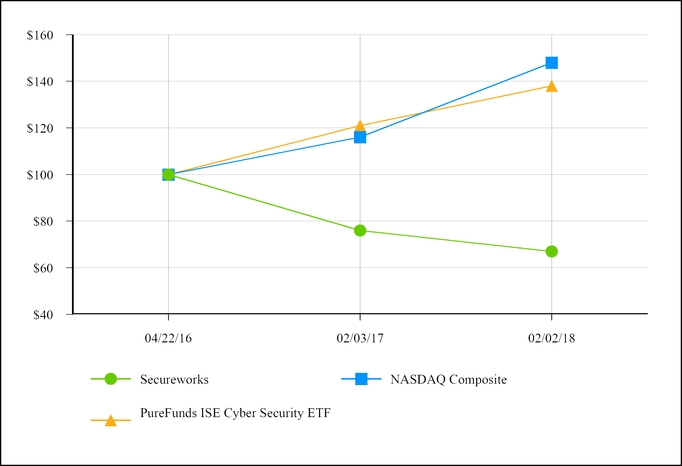
April 22, 2016 | February 3, 2017 | February 2, 2018 | ||||||||||
Secureworks | $ | 100.00 | $ | 75.64 | $ | 67.43 | ||||||
NASDAQ Composite | 100.00 | 115.50 | 147.59 | |||||||||
PureFunds ISE Cyber Security ETF | 100.00 | 121.21 | 137.94 | |||||||||
This performance graph shall not be deemed to be incorporated by reference by means of any general statement incorporating by reference this annual report on Form 10 K into any filing under the Securities Act of 1933 or the Securities Exchange Act of 1934, except to the extent that Secureworks specifically incorporates such information by reference, and shall not otherwise be deemed filed under such Acts.
43
Item 6. Selected Financial Data
The following table presents our selected financial data as derived from audited financial statements included in this report. The selected financial data presented below should be read in conjunction with our audited financial statements and accompanying notes and with “Management’s Discussion and Analysis of Financial Condition and Results of Operations.” Our financial information may not be indicative of our future performance and does not necessarily reflect what our financial position and results of operations would have been if we had operated as a stand-alone public company during the periods presented.
Fiscal Year Ended | ||||||||||||
February 2, 2018 | February 3, 2017 | January 29, 2016 | ||||||||||
(in thousands, except per share data) | ||||||||||||
Results of Operations: | ||||||||||||
Net revenue | $ | 467,904 | $ | 429,502 | $ | 339,522 | ||||||
Gross margin | $ | 241,186 | $ | 216,903 | $ | 155,713 | ||||||
Operating expenses | $ | 324,231 | $ | 282,856 | $ | 261,721 | ||||||
Operating loss | $ | (83,045 | ) | $ | (65,953 | ) | $ | (106,008 | ) | |||
Net loss | $ | (28,077 | ) | $ | (38,213 | ) | $ | (72,381 | ) | |||
Share and Per Share Data | ||||||||||||
Net loss per share - basic and diluted | $ | (0.35 | ) | $ | (0.49 | ) | $ | (1.03 | ) | |||
Weighted average shares outstanding - basic and diluted | 80,280 | 77,635 | 70,000 | |||||||||
February 2, 2018 | February 3, 2017 | January 30, 2016 | ||||||||||
(in thousands) | ||||||||||||
Balance Sheet: | ||||||||||||
Cash and cash equivalents | $ | 101,539 | $ | 116,595 | $ | 33,422 | ||||||
Accounts receivable | $ | 157,764 | $ | 113,546 | $ | 116,357 | ||||||
Total assets | $ | 991,301 | $ | 995,103 | $ | 917,785 | ||||||
Short-term deferred revenue | $ | 139,632 | $ | 119,909 | $ | 109,467 | ||||||
Short-term convertible notes | $ | — | $ | — | $ | 27,993 | ||||||
Long-term deferred revenue | $ | 14,948 | $ | 14,752 | $ | 18,352 | ||||||
Total stockholder's equity | $ | 679,149 | $ | 691,424 | $ | 588,456 | ||||||
44
Item 7. Management's Discussion and Analysis of Financial Condition and Results of Operations
This management’s discussion and analysis is based upon the financial statements of Secureworks which have been prepared in accordance with accounting principles generally accepted in the United States, or GAAP, and should be read in conjunction with our consolidated financial statements and related notes included in this report. In addition to historical financial information, the following discussion contains forward-looking statements that reflect our plans, estimates and beliefs. Our actual results could differ materially from those discussed or implied in our forward-looking statements. Factors that could cause or contribute to these differences include those discussed in “Risk Factors.”
Our fiscal year is the 52- or 53-week period ending on the Friday nearest January 31. We refer to our fiscal years ending February 2, 2018, February 3, 2017, and January 29, 2016 as fiscal 2018, fiscal 2017 and fiscal 2016, respectively. Fiscal 2018 and fiscal 2016 each included 52 weeks, while fiscal 2017 included 53 weeks, with the extra week included in the fourth quarter. All percentage amounts and ratios presented in this management’s discussion and analysis were calculated using the underlying data in thousands. Unless otherwise indicated, all changes identified for the current-period results represent comparisons to results for the prior corresponding fiscal periods.
Except where the context otherwise requires or where otherwise indicated, all references to “Secureworks” “we,” “us,” “our” and “our company” in this management’s discussion and analysis refer to SecureWorks Corp. and our subsidiaries on a consolidated basis, all references to “Dell” refer to Dell Inc. and its subsidiaries on a consolidated basis and all references to “Dell Technologies” refer to Dell Technologies Inc., the ultimate parent company of Dell Inc.
Overview
We are a leading global cybersecurity company that protects organizations in the digitally connected world. We combine visibility from thousands of clients, machine learning and automation from our industry-leading SecureWorks Counter Threat PlatformTM, and actionable insights from our team of elite researchers, analysts and consultants to create a powerful network effect that provides increasingly strong protection for our clients. By aggregating and analyzing data from various sources around the world, we prevent security breaches, detect malicious activity in real time, respond rapidly and predict emerging threats.
Our mission is to unlock the value of our clients’ security investments by simplifying their complex security operations and amplifying their defenses. Through our vendor-neutral approach, we create integrated and comprehensive solutions by proactively managing the collection of “point” products deployed by our clients to address specific security issues and provide supplemental solutions where gaps exist in our clients’ defenses. We customize the right level of security for each client's unique situation, which evolves as the client's organization grows and changes.
We have pioneered an integrated approach that delivers a broad portfolio of information security solutions to organizations of varying size and complexity. Our flexible and scalable solutions support the evolving needs of the largest, most sophisticated enterprises staffed with in-house security experts, as well as small and medium-sized businesses and government agencies with limited in-house capabilities and resources.
Our solutions enable organizations to:
• | prevent security breaches by fortifying their cyber defenses, |
• | detect malicious activity, |
• | respond rapidly to security breaches, and |
• | predict emerging threats. |
The solutions leverage our proprietary technologies, processes and extensive expertise in the information security industry, which we have developed over more than 18 years. Key elements of our strategy include:
• | maintain and extend our technology leadership, |
• | expand and diversify our client base, |
• | deepen our existing client relationships, and |
• | attract and retain top talent. |
45
We opened our first counter threat operations center in Atlanta, Georgia in 1999 to support our managed security business. We began providing security and risk consulting offerings to our clients in 2005. In 2006, we acquired LURHQ Corporation, a leading provider of security information and event monitoring solutions to enterprises. In addition, we launched our information security offerings. Shortly thereafter, we focused our growth strategy on expanding into new market segments and geographic regions. In 2008, we launched our log management solution, among other new solutions. We began offering our managed web application firewall solutions in 2009, shortly before we acquired Verisign, Inc.’s managed security business. In the same year, we also expanded internationally through the acquisition of dns Limited, a managed security and consulting organization, which operated in London, England and in Edinburgh, Scotland. From 2009 to 2012, we capitalized on all of our investments, both organic and acquired, and integrated these technologies into the Counter Threat Platform in order to provide our clients with a comprehensive view of their network environments and security threats, while adapting to a constantly evolving threat landscape. Over the last several years, we have continued to expand our offerings, including through the launch of our advanced endpoint threat detection solution and our advanced malware protection and detection solution. We continuously evaluate potential investments and acquisitions of businesses, services and technologies to expand our offerings and supplement our organic growth.
From April 2009 to February 2, 2018, the number of events processed by our technology platform increased from five billion to as many as 250 billion events per day. Further, our client base has grown to approximately 4,400 subscription-based clients as of February 2, 2018. This significant growth has required continual investment in our business, resulting in net losses. We believe these investments are critical to our success, although they may continue to impact our near-term profitability.
Key Factors Affecting Our Performance
We believe that our future success will depend on many factors, including the adoption of our solutions by organizations, continued investment in our Counter Threat Platform and threat intelligence research, our introduction of new solutions, our ability to increase sales of our solutions to new and existing clients and our ability to attract and retain top talent. Although these areas present significant opportunities, they also present risks that we must manage to ensure our future success. For additional information about these risks, refer to “Risk Factors” in this report. We operate in a highly competitive industry and face, among other competitive challenges, pricing pressures within the information security market as a result of action by our larger competitors to reduce the prices of their security monitoring, detection and prevention products, as well as their managed security services. We must continue to efficiently manage our investments and effectively execute our strategy to succeed. If we are unable to address these challenges, our business could be adversely affected.
Adoption of Intelligence-Driven Solution Strategy. The evolving landscape of applications, modes of communication and IT architectures makes it increasingly challenging for organizations of all sizes to protect their critical business assets, including proprietary information, from cyber threats. New technologies heighten security risks by increasing the number of ways a threat actor can attack a target, by giving users greater access to important business networks and information and by facilitating the transfer of control of underlying applications and infrastructure to third-party vendors. An effective cyber defense strategy requires the coordinated deployment of multiple products and services tailored to an organization’s specific security needs. Our integrated suite of solutions is designed to facilitate the successful implementation of such a strategy, but continuous investment in, and adaptation of, our technology will be required as the threat landscape continues to evolve rapidly. The degree to which prospective and current clients recognize the mission-critical nature of our intelligence-driven information security solutions, and subsequently allocate budget dollars to our solutions, will affect our future financial results.
Investment in Our Platform and Threat Intelligence Research. Our Counter Threat Platform constitutes the core of our intelligence-driven information security solutions. It provides our clients with an integrated perspective and intelligence regarding their network environments and security threats. The platform is augmented by our Counter Threat Unit research team, which conducts exclusive research into threat actors, uncovers new attack techniques, analyzes emerging threats and evaluates the risks posed to our clients. Our performance is significantly dependent on the investments we make in our research and development efforts, and on our ability to be at the forefront of threat intelligence research, and to adapt our platform to new technologies as well as to changes in existing technologies. This is an area in which we will continue to invest, while leveraging a flexible staffing model to align with solutions development. We believe that investment in our platform will contribute to long-term revenue growth, but it may continue to adversely affect our near-term profitability.
Introduction of New Information Security Solutions. Our performance is significantly dependent on our ability to continue to innovate and introduce new information security solutions that protect our clients from an expanding array of cybersecurity threats. We continue to invest in solutions innovation and leadership, including hiring top technical talent and focusing on core technology innovation. In addition, we will continue to evaluate and utilize third-party proprietary technologies, where appropriate, for the continuous development of complementary offerings. We cannot be certain that we will realize increased
46
revenue from our solutions development initiatives. We believe that our investment in solutions development will contribute to long-term revenue growth, but it may continue to adversely affect our near-term profitability.
Investments in Expanding Our Client Base and Deepening Our Client Relationships. To support future sales, we will need to continue to devote resources to the development of our global sales force. We have made and plan to continue to make significant investments in expanding our sales teams and distribution programs with our channel partners and increasing awareness of our brand. Any investments we make in our sales and marketing operations will occur before we realize any benefits from such investments. Therefore, it may be difficult for us to determine if we are efficiently allocating our resources in this area. The investments we have made, or intend to make, to strengthen our sales and marketing efforts may not result in an increase in revenue or an improvement in our results of operations. Although we believe our investment in sales and marketing will help us improve our results of operations in the long term, the resulting increase in operating expenses attributable to these sales and marketing functions may continue to adversely affect our profitability in the near term. The continued growth of our business also depends in part on our ability to sell additional solutions to our existing clients. As our clients realize the benefits of the solutions they previously purchased, our portfolio of solutions provides us with a significant opportunity to expand these relationships.
Investment in Our People. The difficulty in providing effective information security is exacerbated by the highly competitive environment for identifying, hiring and retaining qualified information security professionals. Our technology leadership, brand, exclusive focus on information security, client-first culture, and robust training and development program have enabled us to attract and retain highly-talented professionals with a passion for building a career in the information security industry. These professionals are led by a highly experienced and tenured management team with extensive IT security expertise and a record of developing successful new technologies and solutions to help protect our clients. We will continue to invest in attracting and retaining top talent to support and enhance our information security offerings.
Key Operating Metrics
In recent years, we have experienced broad growth across our portfolio of intelligence-driven information security solutions being provided to all sizes of clients. We have achieved much of this growth by providing solutions to large enterprise clients, which generate substantially more average revenue than our small and medium-sized business, or SMB, clients, and by continually expanding the volume and breadth of the security solutions that we provide to all clients. This has resulted in steady growth in our average revenue per client. This growth has required continuous investment in our business, resulting in net losses. We believe these investments are critical to our success, although they may continue to impact our profitability.
We believe the operating metrics described below provide further insight into the long-term value of our subscription agreements and our ability to maintain and grow our client relationships. Relevant key operating metrics are presented below as of the dates indicated and for the quarterly periods then ended:
February 2, 2018 | February 3, 2017 | January 29, 2016 | |||||||||
Client base | 4,400 | 4,400 | 4,200 | ||||||||
Monthly recurring revenue (in millions) | $ | 35.3 | $ | 31.6 | $ | 28.6 | |||||
Average revenue per client (in thousands) | $ | 95.6 | $ | 86.4 | $ | 81.0 | |||||
Revenue retention rate | 96 | % | 98 | % | 108 | % | |||||
Client Base. We define our client base as the number of clients who subscribe to our managed security solutions as of a particular date. We believe that growing our existing client base and our ability to grow our average revenue per client represent significant future revenue opportunities for us. The increases in our client base and average revenue per client are primarily related to the persistence of cyber threats and the results of our sales and marketing efforts to increase the awareness of our solutions. Additionally, our client composition of both enterprise and SMB companies provides us with an opportunity to expand our professional services revenue. As of February 2, 2018, February 3, 2017, and January 29, 2016, approximately 44%, 49%, and 48%, respectively, of our professional services clients subscribed to our managed security solutions.
Monthly Recurring Revenue. We define monthly recurring revenue as the monthly value of our subscription contracts as of a particular date. Because we use monthly recurring revenue as a leading indicator of future revenue, we include operational backlog. We define operational backlog as the monthly recurring revenue associated with pending contracts, which are contracts that have been sold but for which the service period has not yet commenced. Our increase in monthly recurring revenue has been driven primarily by our continuing ability to expand our offerings and sell additional solutions to existing
47
clients, as well as by growth in our client base. Overall, we expect monthly recurring revenue to continue to grow as we retain and expand our client base, and as our clients extend the use of our solutions over time.
Revenue Retention Rate. Our revenue retention rate is an important measure of our success in retaining and growing revenue from our subscription-based clients. To calculate our revenue retention rate for any period, we compare the monthly recurring revenue excluding operational backlog of our subscription-based client base at the beginning of the fiscal year, which we call our base recurring revenue, to the monthly recurring revenue excluding operational backlog from that same cohort of clients at the end of the period, which we call our retained recurring revenue. By dividing the retained recurring revenue by the base recurring revenue, we measure our success in retaining and growing installed revenue from the specific cohort of clients we served at the beginning of the period. Our calculation includes the positive revenue impacts of selling and installing additional solutions to this cohort of clients and the negative revenue impacts of client or service attrition during the period. However, the calculation does not include the positive impact on revenue from sales of solutions to any clients acquired during the period. Our revenue retention rates may decline or increase from period to period as a result of several factors, including timing of the installation of solutions contracted in prior periods, client satisfaction with our solutions, the price of our solutions, the prices or availability of competing solutions and changing technologies, and consolidation within our client base.
Non-GAAP Financial Measures
We use supplemental measures of our performance, which are derived from our financial information, but which are not presented in our financial statements prepared in accordance with generally accepted accounting principles in the United States of America, referred to as GAAP. Non-GAAP financial measures presented in this management's discussion and analysis include non-GAAP revenue, non-GAAP gross margin, non-GAAP research and development expenses, non-GAAP sales and marketing expenses, non-GAAP general and administrative expenses, non-GAAP operating loss, non-GAAP net loss, non-GAAP net loss per share and adjusted EBITDA. We use non-GAAP financial measures to supplement financial information presented on a GAAP basis. We believe these non-GAAP financial measures provide useful information to help evaluate our operating results by facilitating an enhanced understanding of our operating performance and enabling more meaningful period-to-period comparisons.
In particular, we have excluded the impact of certain purchase accounting adjustments related to a change in the basis of deferred revenue for the acquisition of Dell by Dell Technologies in fiscal 2014. We believe it is useful to exclude such purchase accounting adjustments related to the foregoing transactions as this deferred revenue generally results from multi-year service contracts under which deferred revenue is established upon sale and revenue is recognized over the term of the contract. Pursuant to the fair value provisions applicable to the accounting for business combinations, GAAP requires this deferred revenue to be recorded at its fair value, which is typically less than the book value. In presenting non-GAAP earnings, we add back the reduction in revenue that results from this revaluation on the expectation that a significant majority of these service contracts will be renewed in the future and therefore the revaluation is not helpful in predicting our ongoing revenue trends. We believe that this non-GAAP financial adjustment is useful to investors because it allows investors to (1) evaluate the effectiveness of the methodology and information used by management in its financial and operational decision-making, and (2) compare past and future reports of financial results of our company as the revenue reduction related to acquired deferred revenue will not recur when related service contracts are renewed in future periods.
There are limitations to the use of the non-GAAP financial measures presented in this management’s discussion and analysis. Our non-GAAP financial measures may not be comparable to similarly titled measures of other companies. Other companies, including companies in our industry, may calculate non-GAAP financial measures differently than we do, limiting the usefulness of those measures for comparative purposes.
Non-GAAP revenue, non-GAAP gross margin, non-GAAP research and development expenses, non-GAAP sales and marketing expenses, non-GAAP general and administrative expenses, non-GAAP operating loss, non-GAAP net loss and non-GAAP net loss per share, as defined by us, exclude the items described in the reconciliation below. As the excluded items can have a material impact on earnings, our management compensates for this limitation by relying primarily on GAAP results and using non-GAAP financial measures supplementally. The non-GAAP financial measures are not meant to be considered as indicators of performance in isolation from or as a substitute for revenue, gross margin, research and development expenses, sales and marketing expenses, general and administrative expenses, operating loss or net loss prepared in accordance with GAAP, and should be read only in conjunction with financial information presented on a GAAP basis.
48
Reconciliation of Non-GAAP Financial Measures
The table below presents a reconciliation of each non-GAAP financial measure to its most directly comparable GAAP financial measure. We encourage you to review the reconciliations in conjunction with the presentation of the non-GAAP financial measures for each of the periods presented. In future fiscal periods, we may exclude such items and may incur income and expenses similar to these excluded items. Accordingly, the exclusion of these items and other similar items in our non-GAAP presentation should not be interpreted as implying that these items are non-recurring, infrequent or unusual.
The following is a summary of the items excluded from the most comparable GAAP financial measures to calculate our non-GAAP financial measures:
• | Impact of Purchase Accounting. The impact of purchase accounting consists primarily of purchase accounting adjustments related to a change in the basis of deferred revenue related to the acquisition of Dell by Dell Technologies in fiscal 2014. |
• | Amortization of Intangible Assets. Amortization of intangible assets consists of amortization of customer relationships and acquired technology. In connection with the acquisition of Dell by Dell Technologies in fiscal 2014, all of our tangible and intangible assets and liabilities were accounted for and recognized at fair value on the transaction date. Accordingly, amortization of intangible assets consists of amortization associated with intangible assets recognized in connection with this transaction. |
• | Stock-based Compensation Expense. Non-cash stock-based compensation expense relates to both the Dell Technologies and Secureworks equity plans. We exclude such expense when assessing the effectiveness of our operating performance since stock-based compensation does not necessarily correlate with the underlying operating performance of the business. |
• | Other. Other includes professional fees incurred by us in connection with our IPO and amounts expensed in the settlement of a legal matter. We are excluding these expenses for the purpose of calculating the non-GAAP financial measures presented below because we believe these items are outside our ordinary course of business and do not contribute to a meaningful evaluation of our current operating performance or comparisons to our past operating performance. |
• | Aggregate Adjustment for Income Taxes. The aggregate adjustment for income taxes is the estimated combined income tax effect for the adjustments mentioned above. The tax effects are determined based on the tax jurisdictions where the above items were incurred. |
• | Impact of Tax Cuts and Jobs Act. The impact of the Tax Cuts and Jobs Act relates to a provisional tax benefit of $27.0 million recorded in the fourth quarter of fiscal 2018 as a result of U.S. tax reform that was enacted in December 2017. For additional information, see “Notes to Consolidated Financial Statements—Note 8—Income and Other Taxes” in our consolidated financial statements included in this report. |
Fiscal Year Ended | |||||||||||
February 2, 2018 | February 3, 2017 | January 29, 2016 | |||||||||
GAAP revenue | $ | 467,904 | $ | 429,502 | $ | 339,522 | |||||
Impact of purchase accounting | 584 | 884 | 2,769 | ||||||||
Non-GAAP revenue | $ | 468,488 | $ | 430,386 | $ | 342,291 | |||||
GAAP gross margin | $ | 241,186 | $ | 216,903 | $ | 155,713 | |||||
Amortization of intangibles | 13,642 | 13,642 | 13,640 | ||||||||
Impact of purchase accounting | 624 | 1,160 | 2,932 | ||||||||
Stock-based compensation expense | 891 | 462 | — | ||||||||
Other | — | — | 4,868 | ||||||||
Non-GAAP gross margin | $ | 256,343 | $ | 232,167 | $ | 177,153 | |||||
49
GAAP research and development expenses | $ | 80,164 | $ | 71,030 | $ | 69,598 | |||||
Stock-based compensation expense | (3,261 | ) | (2,033 | ) | (277 | ) | |||||
Non-GAAP research and development expenses | $ | 76,903 | $ | 68,997 | $ | 69,321 | |||||
GAAP sales and marketing expenses | $ | 151,341 | $ | 124,950 | $ | 111,978 | |||||
Stock-based compensation expense | (735 | ) | (1,068 | ) | — | ||||||
Non-GAAP sales and marketing expenses | $ | 150,606 | $ | 123,882 | $ | 111,978 | |||||
GAAP general and administrative expenses | $ | 92,726 | $ | 86,876 | $ | 80,145 | |||||
Amortization of intangibles | (14,095 | ) | (14,094 | ) | (14,660 | ) | |||||
Impact of purchase accounting | (1,025 | ) | (886 | ) | (916 | ) | |||||
Stock-based compensation expense | (8,903 | ) | (5,320 | ) | (564 | ) | |||||
Other | — | (1,164 | ) | (8,917 | ) | ||||||
Non-GAAP general and administrative expenses | $ | 68,703 | $ | 65,412 | $ | 55,088 | |||||
GAAP operating loss | $ | (83,045 | ) | $ | (65,953 | ) | $ | (106,008 | ) | ||
Amortization of intangibles | 27,737 | 27,736 | 28,299 | ||||||||
Impact of purchase accounting | 1,649 | 2,046 | 3,848 | ||||||||
Stock-based compensation expense | 13,789 | 8,883 | 841 | ||||||||
Other | — | 1,164 | 13,786 | ||||||||
Non-GAAP operating loss | $ | (39,870 | ) | $ | (26,124 | ) | $ | (59,234 | ) | ||
GAAP net loss | $ | (28,077 | ) | $ | (38,213 | ) | $ | (72,381 | ) | ||
Amortization of intangibles | 27,737 | 27,736 | 28,299 | ||||||||
Impact of purchase accounting | 1,649 | 2,046 | 3,848 | ||||||||
Stock-based compensation expense | 13,789 | 8,883 | 841 | ||||||||
Impact of Tax Cuts and Jobs Act | (26,994 | ) | — | — | |||||||
Other | — | 1,164 | 13,786 | ||||||||
Aggregate adjustment for income taxes | (15,129 | ) | (16,113 | ) | (17,508 | ) | |||||
Non-GAAP net loss | $ | (27,025 | ) | $ | (14,497 | ) | $ | (43,115 | ) | ||
GAAP net loss per share | $ | (0.35 | ) | $ | (0.49 | ) | $ | (1.03 | ) | ||
Amortization of intangibles | 0.34 | 0.36 | 0.40 | ||||||||
Impact of purchase accounting | 0.02 | 0.03 | 0.05 | ||||||||
Stock-based compensation expense | 0.17 | 0.11 | 0.01 | ||||||||
Impact of Tax Cuts and Jobs Act | (0.34 | ) | — | — | |||||||
Other | — | 0.01 | 0.20 | ||||||||
Aggregate adjustment for income taxes | (0.19 | ) | (0.21 | ) | (0.25 | ) | |||||
Non-GAAP net loss per share * | $ | (0.34 | ) | $ | (0.19 | ) | $ | (0.62 | ) | ||
* Sum of reconciling items may differ from total due to rounding of individual components | |||||||||||
GAAP net loss | $ | (28,077 | ) | $ | (38,213 | ) | $ | (72,381 | ) | ||
Interest and other, net | 2,735 | (2,476 | ) | 6,569 | |||||||
Income tax benefit | (57,703 | ) | (25,264 | ) | (40,196 | ) | |||||
Depreciation and amortization | 42,171 | 39,425 | 40,638 | ||||||||
Stock-based compensation expense | 13,789 | 8,883 | 841 | ||||||||
Impact of purchase accounting | 584 | 884 | 2,769 | ||||||||
Other | — | 1,164 | 13,786 | ||||||||
Adjusted EBITDA | $ | (26,502 | ) | $ | (15,597 | ) | $ | (47,974 | ) | ||
50
Our Relationship with Dell and Dell Technologies
On February 8, 2011, we were acquired by Dell Inc. On October 29, 2013, Dell was acquired by Dell Technologies Inc. (formerly known as Denali Holding Inc.), a parent holding corporation. For the purposes of the accompanying financial statements, we elected to utilize pushdown accounting for the acquisition of Dell by Dell Technologies. On April 27, 2016, we completed our IPO, as further described below. Upon the closing of our IPO, Dell Technologies owned, indirectly through Dell Inc. and Dell Inc.’s subsidiaries, no shares of our outstanding Class A common stock and all shares of our outstanding Class B common stock, which as of February 2, 2018 represented approximately 86.3% of our total outstanding shares of common stock and approximately 98.4% of the combined voting power of both classes of our outstanding common stock.
Since acquiring us in 2011, Dell has provided us with various corporate services in the ordinary course of business, including finance, tax, human resources, legal, insurance, IT, procurement and facilities-related services. Dell also has provided us with the services of a number of its executives and employees. Through the first two quarters of fiscal 2016, the costs of such services were allocated to us based on the most relevant allocation method to the service provided, primarily based on relative percentage of total net sales, relative percentage of headcount, or specific identification. We believe the basis on which the expenses were allocated to be a reasonable reflection of the utilization of services provided to or the benefit received by us during the periods presented. Beginning in the third quarter of fiscal 2016, the costs of these services have been charged in accordance with a shared services agreement that went into effect on August 1, 2015, the effective date of our carve-out from Dell. For more information regarding the allocated costs and related party transactions, see “Notes to Consolidated Financial Statements—Note 10—Related Party Transactions” in our consolidated financial statements included elsewhere in this report.
During the periods presented in the financial statements, Secureworks did not file separate federal tax returns, as Secureworks was generally included in the tax grouping of other Dell entities within the respective entity’s tax jurisdiction. The income tax benefit has been calculated using the separate return method, modified to apply the benefits for loss approach. Under the benefits for loss approach, net operating losses or other tax attributes are characterized as realized or as realizable by Secureworks when those attributes are utilized or expected to be utilized by other members of the Dell consolidated group. For more information, see “Notes to Consolidated Financial Statements—Note 8—Income and Other Taxes” in our consolidated financial statements included in this report.
As a subsidiary of Dell, we have participated in various commercial arrangements with Dell, under which, for example, we provide information security solutions to third-party clients with which Dell has contracted to provide our solutions, procure hardware, software and services from Dell, and sell our solutions through Dell in the United States and some international jurisdictions. In connection with our IPO, effective August 1, 2015, we entered into agreements with Dell that govern these commercial arrangements. The commercial agreements set the terms and conditions for transactions between Dell and us, while our shared services agreement with Dell sets the terms and conditions for certain administrative functions that continue to be provided by Dell. These agreements generally are effective for up to one to three years and include extension and cancellation options. To the extent that we choose to or are required to transition away from the corporate services currently provided by Dell, we may incur additional non-recurring transition costs to establish our own stand-alone corporate functions. As of February 2, 2018, we have established a substantial portion of our stand-alone corporate functions.
Since our IPO, we have instituted compensation policies and programs as a public company, such as an independent share-based compensation program, the expense for which differs from compensation expensed in periods prior to our IPO. In addition, we have become subject to the reporting requirements of the Exchange Act and the Sarbanes-Oxley Act. Accordingly, we have incurred additional costs relating to internal audit, investor relations and stock administration, as well as other regulatory compliance costs.
As a result of the matters discussed above, our historical financial statements and the related financial information presented in this management’s discussion and analysis do not purport to reflect what our results of operations, financial position or cash flows would have been if we had operated as a stand-alone public company during all of the periods presented. For periods prior to August 1, 2015, the carve-out date, our financial information was derived from the accounting records of Dell and us, and required the use of estimates and assumptions. Effective August 1, 2015, assets and liabilities supporting our business were contributed by Dell to us where necessary. For a description of the basis of presentation and an understanding of the limitations of the financial statements, see “Notes to Consolidated Financial Statements—Note 1—Description of the Business and Basis of Presentation” in our consolidated financial statements included in this report.
51
Initial Public Offering
On April 27, 2016, we completed our IPO in which we issued and sold 8,000,000 shares of Class A common stock at a price to the public of $14.00 per share. We received net proceeds of $99.6 million from the sale of shares of Class A common stock after deducting $12.4 million of underwriting discounts and commissions and unpaid offering expenses payable by us.
Components of Results of Operations
Revenue
We sell managed security solutions and threat intelligence solutions on a subscription basis and various professional services, including security and risk consulting and incident response solutions. Our managed security subscription contracts typically range from one to three years and, as of February 2, 2018, averaged approximately two years in duration. Our initial contracts with clients may include amounts for hardware, installation and professional services that may not recur. Revenue related to these contracts is recognized ratably over the terms of the contracts. Professional services clients typically purchase solutions pursuant to customized contracts that are shorter in duration. In general, these contracts have terms of less than one year. Revenue related to professional services is recognized as services are performed.
The fees we charge for our solutions vary based on a number of factors, including the solutions selected, the number of client devices covered by the selected solutions, and the level of management we provide for the solutions. In fiscal 2018, approximately 78% of our revenue is derived from subscription-based solutions, provided under managed security services, while approximately 22% is derived from professional services engagements. As we respond to the evolving needs of our clients, the relative mix of subscription-based solutions and professional services we provide our clients may fluctuate. International revenue, which we define as revenue contracted through non-U.S. entities, represented approximately 16%, 13% and 12% of our total net revenue in fiscal 2018, fiscal 2017, and fiscal 2016, respectively. Although our international clients are located primarily in Europe, Asia Pacific and Canada, we provided managed security services to clients across 59 countries as of February 2, 2018.
Over all of the periods presented in this report, our pricing strategy for our various offerings was relatively consistent, and accordingly did not significantly affect our revenue growth. Because we operate in a competitive environment, however, we may adjust our pricing to support our strategic initiatives.
Gross Margin
We operate in a challenging business environment, where the complexity as well as the number of cyber attacks are constantly increasing. Accordingly, initiatives to drive the efficiency of our Counter Threat Platform and the continued training and development of our employees are critical to our long-term success. Gross margin has been and will continue to be affected by these factors as well as others, including the mix of solutions sold, the mix between large and small clients, timing of revenue recognition and the extent to which we expand our counter threat operations centers.
Cost of revenue consists primarily of personnel expenses, including salaries, benefits and performance-based compensation for employees who maintain our Counter Threat Platform and provide solutions to our clients, as well as perform other critical functions. Also included in cost of revenue are amortization of equipment and costs associated with hardware provided to clients as part of their subscription services, amortization of technology licensing fees, fees paid to contractors who supplement or support our solutions, maintenance fees and overhead allocations. As our business grows, the cost of revenue associated with our solutions may fluctuate.
We operate in a high-growth industry and have experienced significant revenue growth since our inception. Accordingly, we expect our gross margin to increase in absolute dollars. We continue to invest in initiatives to drive the efficiency of our business to increase gross margin as a percentage of total revenue. However, as we balance revenue growth and efficiency initiatives, gross margin as a percentage of total revenue may fluctuate from period to period.
52
Operating Costs and Expenses
Our operating costs and expenses consist of research and development expenses, sales and marketing expenses and general and administrative expenses.
▪ | Research and Development, or R&D, Expenses. Research and development expenses include compensation and related expenses for the continued development of our solutions offerings, including a portion of expenses related to our threat research team, which focuses on the identification of system vulnerabilities, data forensics and malware analysis, and product management. R&D expenses also encompass expenses related to the development of prototypes of new solutions offerings and allocated overhead. Our solutions offerings have generally been developed internally. We operate in a competitive and highly technical industry. Therefore, to maintain and extend our technology leadership, we intend to continue to invest in our R&D efforts by hiring more personnel to enhance our existing security solutions and to add complementary solutions. |
• | Sales and Marketing, or S&M, Expenses. Sales and marketing expenses include salaries, sales commissions and performance-based compensation benefits and related expenses for our S&M personnel, travel and entertainment, marketing and advertising programs (including lead generation), client advocacy events, and other brand-building expenses, as well as allocated overhead. |
▪ | General and Administrative, or G&A, Expenses. General and administrative expenses include primarily the costs of human resources and recruiting, finance and accounting, legal support, information management and information security systems, facilities management, corporate development and other administrative functions, and are partially offset by allocations of information technology and facilities costs to other functions. |
As we continue to grow our business, both domestically and internationally, we will invest in our sales capability, which will increase our sales and marketing expenses in absolute dollars. In addition, we expect to incur additional costs as we increase our G&A functions to further support stand-alone public company requirements.
Interest and Other, Net
Interest and other, net consists primarily of the effect of exchange rates on our foreign currency-denominated asset and liability balances and interest income earned on our cash and cash equivalents. All foreign currency transaction adjustments are recorded as foreign currency gains (losses) in the Consolidated Statements of Operations. To date, we have had minimal interest income.
Income Tax Expense (Benefit)
Our effective tax rate was a benefit of 67.3%, 39.8% and 35.7% for the fiscal years ended February 2, 2018, February 3, 2017, and January 29, 2016, respectively. The change in effective tax rate from fiscal 2017 to fiscal 2018 was primarily attributable to the impact of the Tax Cuts and Jobs Act of 2017 on the blended federal statutory rate and the required adjustment of our deferred tax assets and liabilities for the new lower federal rate as of the end of fiscal 2018. The change in effective tax rate from fiscal 2016 to fiscal 2017 was primarily attributable to the recognition of tax benefits relating to research and development tax credits during fiscal 2017.
We calculate a provision for income taxes using the asset and liability method, under which deferred tax assets and liabilities are recognized by identifying the temporary differences arising from the different treatment of items for tax and accounting purposes. We provide valuation allowances for deferred tax assets, where appropriate. We file U.S. federal returns on a consolidated basis with Dell and we expect to continue doing so until such time (if any) as we are deconsolidated for tax purposes with respect to the Dell consolidated group. According to the terms of the tax matters agreement between Dell Technologies and us that went into effect on August 1, 2015, Dell Technologies will reimburse us for any amounts by which our tax assets reduce the amount of tax liability owed by the Dell group on an unconsolidated basis. For a further discussion of income tax matters, see “Notes to Consolidated Financial Statements—Note 8—Income and Other Taxes" in our consolidated financial statements included in this report.
53
Results of Operations
Fiscal 2018 Compared to Fiscal 2017
The following table summarizes our key performance indicators for the fiscal years ended February 2, 2018 and February 3, 2017.
Fiscal Year Ended | |||||||||||||||||
February 2, 2018 | February 3, 2017 | ||||||||||||||||
$ | % of Revenue | % Change | $ | % of Revenue | |||||||||||||
(in thousands, except percentages) | |||||||||||||||||
Net revenue | $ | 467,904 | 100.0 | % | 8.9 | % | $ | 429,502 | 100.0 | % | |||||||
Cost of revenue | $ | 226,718 | 48.5 | % | 6.6 | % | $ | 212,599 | 49.5 | % | |||||||
Total gross margin | $ | 241,186 | 51.5 | % | 11.2 | % | $ | 216,903 | 50.5 | % | |||||||
Operating expenses | $ | 324,231 | 69.3 | % | 14.6 | % | $ | 282,856 | 65.9 | % | |||||||
Operating loss | $ | (83,045 | ) | (17.7 | )% | 25.9 | % | $ | (65,953 | ) | (15.4 | )% | |||||
Net loss | $ | (28,077 | ) | (6.0 | )% | (26.5 | )% | $ | (38,213 | ) | (8.9 | )% | |||||
Other Financial Information (1) | |||||||||||||||||
Non-GAAP revenue | $ | 468,488 | 100.0 | % | 8.9 | % | $ | 430,386 | 100.0 | % | |||||||
Non-GAAP gross margin | $ | 256,343 | 54.7 | % | 10.4 | % | $ | 232,167 | 53.9 | % | |||||||
Non-GAAP operating expenses | $ | 296,213 | 63.2 | % | 14.7 | % | $ | 258,291 | 60.0 | % | |||||||
Non-GAAP operating loss | $ | (39,870 | ) | (8.5 | )% | 52.6 | % | $ | (26,124 | ) | (6.1 | )% | |||||
Non-GAAP net loss | $ | (27,025 | ) | (5.8 | )% | 86.4 | % | $ | (14,497 | ) | (3.4 | )% | |||||
Adjusted EBITDA | $ | (26,502 | ) | (5.7 | )% | 69.9 | % | $ | (15,597 | ) | (3.6 | )% | |||||
_____________________
(1) | See "Non-GAAP Financial Measures" and "Reconciliation of Non-GAAP Financial Measures" for more information about these non-GAAP financial measures, including our reasons for including the measures, material limitations with respect to the usefulness of the measures, and a reconciliation of each non-GAAP financial measure to the most directly comparable GAAP financial measure. Non-GAAP financial measures as a percentage of revenue are calculated based on non-GAAP revenue. |
Revenue
Net revenue, which we refer to as revenue, increased $38.4 million, or 8.9%, for fiscal 2018, which has 52 weeks, compared to fiscal 2017, which had 53 weeks. Adjusting for the additional week in fiscal 2017, revenue would have been $420.5 million, resulting in an increase of $47.4 million, or 11.3%. On a non-GAAP basis, revenue increased $38.1 million, or 8.9%, for fiscal 2018. Adjusting for the additional week in fiscal 2017, non-GAAP revenue would have been $421.4 million, resulting in an increase of approximately $47.0 million, or 11.2%.
This revenue increase resulted primarily from revenue generated by subscription-based solutions, which represented approximately 78% of revenue for fiscal 2018. The number of clients subscribing to such solutions was approximately the same as in fiscal 2017, while existing clients continued to increase their purchases of our solutions. Average recurring revenue per client increased 10.7% for fiscal 2018. Professional services revenue increased to 22% of total revenue for fiscal 2018 from 20% of total revenue for fiscal 2017.
We primarily generate revenue from sales in the United States. However, international revenue, which we define as revenue contracted through non-U.S. entities, increased to $76.8 million, for fiscal 2018, from $55.2 million for fiscal 2017. Currently, our international clients are primarily located in Europe, Asia/Pacific, and Canada. We are focused on continuing to grow our international client base in future periods.
54
Gross Margin
Our total gross margin increased $24.3 million, or 11.2%, for fiscal 2018. Adjusting for the additional week in fiscal 2017, gross margin increased $29.6 million, or 14.0%. This increase was mainly due to the increase in revenue for fiscal 2018. The gross margin percentage increased 100 basis points to 51.5% for fiscal 2018. The increase in gross margin percentage was mainly driven by efficiencies as we continue to leverage our global service delivery model, partially offset by the impact of the growth in professional services revenue.
Gross margin on a GAAP basis includes amortization of intangible assets and purchase accounting adjustments. On a non-GAAP basis, excluding these adjustments, gross margin increased $24.2 million, or 10.4%, for fiscal 2018.
Operating Expenses
The following table presents information regarding our operating expenses during the fiscal years ended February 2, 2018 and February 3, 2017.
Fiscal Years Ended | ||||||||||||||||
February 2, 2018 | February 3, 2017 | |||||||||||||||
Dollars | % of Revenue | % Change | Dollars | % of Revenue | ||||||||||||
(in thousands, except percentages) | ||||||||||||||||
Operating expenses: | ||||||||||||||||
Research and development | $ | 80,164 | 17.1 | % | 12.9 | % | $ | 71,030 | 16.5 | % | ||||||
Sales and marketing | 151,341 | 32.3 | % | 21.1 | % | 124,950 | 29.1 | % | ||||||||
General and administrative | 92,726 | 19.8 | % | 6.7 | % | 86,876 | 20.2 | % | ||||||||
Total operating expenses | $ | 324,231 | 69.3 | % | 14.6 | % | $ | 282,856 | 65.9 | % | ||||||
Other Financial Information | ||||||||||||||||
Non-GAAP research and development | $ | 76,903 | 16.4 | % | 11.5 | % | $ | 68,997 | 16.0 | % | ||||||
Non-GAAP sales and marketing | 150,606 | 32.1 | % | 21.6 | % | 123,882 | 28.8 | % | ||||||||
Non-GAAP general and administrative | 68,703 | 14.7 | % | 5.0 | % | 65,412 | 15.2 | % | ||||||||
Non-GAAP operating expenses (1) | $ | 296,213 | 63.2 | % | 14.7 | % | $ | 258,291 | 60.0 | % | ||||||
(1) | See “"Non-GAAP Financial Measures" and "Reconciliation of Non-GAAP Financial Measures” for a reconciliation of each non-GAAP financial measure to the most directly comparable GAAP financial measure. |
Research and Development Expenses. R&D expenses increased $9.1 million, or 12.9%, for fiscal 2018, primarily due to an increase in expenses for engineering resources. As a percentage of revenue, R&D expenses increased 60 basis points to 17.1% for fiscal 2018 as a result of incremental investment in orchestration and automation of threat playbooks in support of our growing Managed Detection and Response, or MDR, subscription solutions. On a non-GAAP basis, R&D expenses as a percentage of revenue increased 40 basis points to 16.4% for fiscal 2018.
Sales and Marketing Expenses. S&M expenses increased $26.4 million, or 21.1%, for fiscal 2018. As a percentage of revenue, S&M expenses increased 320 basis points to 32.3% for fiscal 2018. The increase for the current fiscal year was primarily attributable to an increase in compensation-related expense related to our investment in additional quota bearing sales resources, solution engineers and other support personnel. On a non-GAAP basis, S&M expenses as a percentage of revenue increased 330 basis points to 32.1% for fiscal 2018.
General and Administrative Expenses. G&A expenses increased $5.9 million, or 6.7%, for fiscal 2018. The increase was primarily attributable to higher third-party consulting costs and increased amortization expense associated with our implementation of new financial systems in the third quarter of fiscal 2018. As a percentage of revenue, G&A expenses decreased 40 basis points to 19.8% for fiscal 2018 as a result of operating efficiencies and economies of scale. On a non-GAAP basis, G&A expenses as a percentage of revenue decreased 50 basis points to 14.7% for fiscal 2018.
55
Operating Loss
Our GAAP operating loss increased to $83 million for fiscal 2018 from $66 million in fiscal 2017. As a percentage of revenue, our operating loss increased to 17.7% for fiscal 2018. Operating loss on a GAAP basis includes amortization of intangible assets purchase accounting adjustments and stock-based compensation expense. On a non-GAAP basis, excluding these charges, our operating loss as a percentage of revenue increased to 8.5% for fiscal 2018. The increases in both GAAP and non-GAAP operating loss on a dollar basis and as a percentage of revenue were driven by investments in research and development and the sales function to support continued growth. These investments more than offset improved gross margins and lower G&A expenses as a percentage of revenue.
Interest and Other, Net
Interest and other was $2.7 million of expense for fiscal 2018 compared with $2.5 million of income for fiscal 2017. The change in interest and other primarily reflects the effects of foreign currency translation related to our European operations.
Net Loss
Our net loss of $28.1 million decreased $10.1 million, or 26.5%, for fiscal 2018. The decrease in net loss was due to the significant increase in the income tax benefit in fiscal 2018 related to the Tax Cut and Jobs Act, partially offset by the increase in operating loss discussed above. Net loss on a non-GAAP basis was $27.0 million, an increase of $12.5 million, or 86.4%, from fiscal 2017. Overall, this reduction in net loss was due to the increase in operating loss discussed above.
Fiscal 2017 Compared to Fiscal 2016
The following table summarizes our key performance indicators for the fiscal years ended February 3, 2017 and January 29, 2016.
Fiscal Year Ended | |||||||||||||||||
February 3, 2017 | January 29, 2016 | ||||||||||||||||
$ | % of Revenue | % Change | $ | % of Revenue | |||||||||||||
(in thousands, except percentages) | |||||||||||||||||
Net revenue | $ | 429,502 | 100.0 | % | 26.5 | % | $ | 339,522 | 100.0 | % | |||||||
Cost of revenue | $ | 212,599 | 49.5 | % | 15.7 | % | $ | 183,809 | 54.1 | % | |||||||
Total gross margin | $ | 216,903 | 50.5 | % | 39.3 | % | $ | 155,713 | 45.9 | % | |||||||
Operating expenses | $ | 282,856 | 65.9 | % | 8.1 | % | $ | 261,721 | 77.1 | % | |||||||
Operating loss | $ | (65,953 | ) | (15.4 | )% | (37.8 | )% | $ | (106,008 | ) | (31.2 | )% | |||||
Net loss | $ | (38,213 | ) | (8.9 | )% | (47.2 | )% | $ | (72,381 | ) | (21.3 | )% | |||||
Other Financial Information (1) | |||||||||||||||||
Non-GAAP revenue | $ | 430,386 | 100.0 | % | 25.7 | % | $ | 342,291 | 100.0 | % | |||||||
Non-GAAP gross margin | $ | 232,167 | 53.9 | % | 31.1 | % | $ | 177,153 | 51.8 | % | |||||||
Non-GAAP operating expenses | $ | 258,291 | 60.0 | % | 9.3 | % | $ | 236,387 | 69.1 | % | |||||||
Non-GAAP operating loss | $ | (26,124 | ) | (6.1 | )% | (55.9 | )% | $ | (59,234 | ) | (17.3 | )% | |||||
Non-GAAP net loss | $ | (14,497 | ) | (3.4 | )% | (66.4 | )% | $ | (43,115 | ) | (12.6 | )% | |||||
Adjusted EBITDA | $ | (15,597 | ) | (3.6 | )% | (67.5 | )% | $ | (47,974 | ) | (14.0 | )% | |||||
_____________________
(1) | See "Non-GAAP Financial Measures" and "Reconciliation of Non-GAAP Financial Measures" for reconciliation of each non-GAAP financial measure to the most directly comparable GAAP financial measure. Non-GAAP financial measures as a percentage of revenue are calculated based on non-GAAP revenue. |
56
Revenue
Revenue increased $90.0 million, or 26.5%, for fiscal 2017, which has 53 weeks, compared to fiscal 2016, which had 52 weeks. Adjusting for the additional week in fiscal 2017, revenue increased $81.0 million, or 23.9%. On a non-GAAP basis, revenue increased $88.1 million, or 25.7%, for fiscal 2017. Adjusting for the additional week in fiscal 2017, non-GAAP revenue increased approximately $79.2 million, or 23.1%.
This revenue increase resulted primarily from an increase in revenue generated by subscription-based solutions, which represented approximately 80% of net revenue for the fiscal 2017. The number of clients subscribing to such solutions grew approximately 5% over fiscal 2016, while existing clients continued to increase their purchases of our solutions. In addition, beginning in the third quarter of fiscal 2016, after the effective date of our commercial agreements with Dell, we began recognizing revenues for certain services provided to or on behalf of Dell in lieu of the prior cost recovery arrangement. Such services totaled approximately $22.0 million and $7.5 million for fiscal 2017 and fiscal 2016, respectively. For more information regarding the commercial agreements, see "Notes to Consolidated Financial Statements—Note 10—Related Party Transactions" in our consolidated financial statements included elsewhere in this report.
We primarily generate revenue from sales in the United States. However, during fiscal 2017, international revenue, which we define as revenue contracted through non-U.S. entities, increased to $54.1 million.
Gross Margin
Our total gross margin increased $61.2 million, or 39.3%, for fiscal 2017. Adjusting for the additional week in fiscal 2017, gross margin increased $55.9 million, or 35.9%. This increase was mainly due to the increase in revenue for fiscal 2017. The gross margin percentage increased 460 basis points to 50.5% for fiscal 2017. The increase in gross margin percentage was mainly driven by efficiencies as we continue to leverage our global service delivery model.
Gross margin on a GAAP basis includes amortization of intangible assets and purchase accounting adjustments. On a non-GAAP basis, excluding these adjustments, gross margin increased $55.0 million, or 31.1%, for fiscal 2017.
Operating Expenses
The following table presents information regarding our operating expenses during the fiscal years ended February 3, 2017 and January 29, 2016.
Fiscal Years Ended | ||||||||||||||||
February 3, 2017 | January 29, 2016 | |||||||||||||||
Dollars | % of Revenue | % Change | Dollars | % of Revenue | ||||||||||||
(in thousands, except percentages) | ||||||||||||||||
Operating expenses: | ||||||||||||||||
Research and development | $ | 71,030 | 16.5 | % | 2.1 | % | $ | 69,598 | 20.5 | % | ||||||
Sales and marketing | 124,950 | 29.1 | % | 11.6 | % | 111,978 | 33.0 | % | ||||||||
General and administrative | 86,876 | 20.2 | % | 8.4 | % | 80,145 | 23.6 | % | ||||||||
Total operating expenses | $ | 282,856 | 65.9 | % | 8.1 | % | $ | 261,721 | 77.1 | % | ||||||
Other Financial Information | ||||||||||||||||
Non-GAAP research and development | $ | 68,997 | 16.0 | % | (0.5 | )% | $ | 69,321 | 20.3 | % | ||||||
Non-GAAP sales and marketing | 123,882 | 28.8 | % | 10.6 | % | 111,978 | 32.7 | % | ||||||||
Non-GAAP general and administrative | 65,412 | 15.2 | % | 18.7 | % | 55,088 | 16.1 | % | ||||||||
Non-GAAP operating expenses (1) | $ | 258,291 | 60.0 | % | 9.3 | % | $ | 236,387 | 69.1 | % | ||||||
(1) | See “"Non-GAAP Financial Measures" and "Reconciliation of Non-GAAP Financial Measures” for a reconciliation of each non-GAAP financial measure to the most directly comparable GAAP financial measure. |
57
Research and Development Expenses. R&D expenses increased $1.4 million, or 2.1%, for fiscal 2017, primarily due to the extra week in that fiscal year. The consistency of R&D expenses over the two fiscal years reflected our greater utilization of more cost-effective off-shore development resources. As a percentage of revenue, R&D expenses decreased 400 basis points to 16.5% for fiscal 2017. On a non-GAAP basis, R&D expenses as a percentage of revenue decreased 430 basis points to 16.0% for fiscal 2017.
Sales and Marketing Expenses. S&M expenses increased $13.0 million, or 11.6%, for fiscal 2017. The increase for the current fiscal year was primarily attributable to an increase in compensation-related expense related to our investment in additional sales and support personnel. As a percentage of revenue, S&M expenses decreased 390 basis points to 29.1% for fiscal 2017. On a non-GAAP basis, S&M expenses as a percentage of revenue decreased 390 basis points to 28.8% for fiscal 2017.
General and Administrative Expenses. G&A expenses increased $6.7 million, or 8.4%, for fiscal 2017. The increase primarily reflected the costs of an increase in administrative functions to operate on a stand-alone basis and as a publicly-traded company. As a percentage of revenue, G&A expenses decreased 340 basis points to 20.2% for fiscal 2017. This decrease resulted from the increase in revenue for fiscal 2017, the effect of which was partially offset by investment in personnel. On a non-GAAP basis, G&A expenses as a percentage of revenue decreased 90 basis points to 15.2% for fiscal 2017.
Operating Loss
Our GAAP operating loss decreased $40.1 million, or 37.8%, for fiscal 2017. As a percentage of revenue, our operating loss decreased to 15.4% for fiscal 2017. Operating loss on a GAAP basis includes amortization of intangible assets purchase accounting adjustments and stock-based compensation expense. On a non-GAAP basis, excluding these charges, our operating loss as a percentage of revenue decreased to 6.1% for fiscal 2017. Overall, decreases in both GAAP and non-GAAP operating loss on a dollar basis and as a percentage of revenue were driven by increased revenue and gross margin, which grew at a faster rate than the increase in operating expenses due to increasing economies of scale.
Interest and Other, net
Our interest and other reflected income of $2.5 million for fiscal 2017 compared to $6.6 million of expense for fiscal 2016. During fiscal 2016, we issued convertible notes that were accounted for at fair value. Changes to fair value of the convertible notes were recognized through earnings, and totaled approximately $5.5 million of expense during fiscal 2016 and $0.1 million in fiscal 2017. In fiscal 2017, the convertible notes were converted into shares of our Class A common stock at the closing of our IPO. The change in interest and other also reflected the effects of foreign currency translation, which resulted in $2.4 million of income for fiscal 2017 compared to $0.3 million of expense for fiscal 2016.
Net Loss
Our net loss decreased $34.2 million, or 47.2%, for fiscal 2017. Net loss on a non-GAAP basis decreased $28.6 million, or 66.4%, for fiscal 2017. Overall, the reduction in net loss was due to the decreases in operating loss discussed above.
Liquidity, Capital Commitments and Contractual Cash Obligations
Overview
We believe that our cash on hand, which includes the net proceeds from our IPO not yet invested in our business, and our accounts receivable will provide us with sufficient liquidity to fund our business and meet our obligations for at least 12 months. Our future capital requirements will depend on many factors, including our rate of revenue growth, the rate of expansion of our workforce, the timing and extent of our expansion into new markets, the timing of introductions of new functionality and enhancements to our solutions, potential acquisitions of complementary businesses and technologies, continuing market acceptance of our solutions, as well as general economic and market conditions. We may need to raise additional capital or incur indebtedness to continue to fund our operations in the future or to fund our needs for less predictable strategic initiatives, such as acquisitions. In addition to our $30 million revolving credit facility from Dell, sources of financing may include arrangements with unaffiliated third parties, depending on the availability of capital, the cost of funds and lender collateral requirements.
58
Selected Measures of Liquidity and Capital Resources
Certain relevant measures of our liquidity and capital resources are as follows:
February 2, 2018 | February 3, 2017 | ||||||
(in thousands) | |||||||
Cash and cash equivalents | $ | 101,539 | $ | 116,595 | |||
Accounts receivable, net | $ | 157,764 | $ | 113,546 | |||
At February 2, 2018, our principal sources of liquidity consisted of cash and cash equivalents of $101.5 million and accounts receivable of $157.8 million. Our cash and cash equivalents balance at February 2, 2018 included $59.0 million of net proceeds from our IPO.
We invoice our clients based on a variety of billing schedules. During fiscal 2018, on average, 53% of our recurring revenue was billed in advance and approximately 47% was billed on either a monthly or a quarterly basis. Invoiced accounts receivable are usually collected over a period of 30 to 120 days. As of February 2, 2018, our accounts receivable, net increased compared to February 3, 2017. This increase resulted primarily from an increase in the amount of annual billing for clients in the fourth quarter of fiscal 2018 compared with the same period in fiscal 2017 and the impact of higher revenue on accounts receivable. We regularly monitor our accounts receivable for collectability, particularly in markets where economic conditions remain uncertain and continue to take actions to reduce our exposure to credit losses. As of February 2, 2018 and February 3, 2017, the allowance for doubtful accounts was $8.2 million and $6.1 million, respectively. The increase in the allowance for doubtful accounts was due to growth in revenue and the impact of certain longer-aged receivables. Based on our assessment, we believe we are adequately reserved for expected credit losses.
Revolving Credit Facility
SecureWorks, Inc., our wholly-owned subsidiary, has entered into a revolving credit agreement with a wholly-owned subsidiary of Dell Inc. under which we have obtained a $30 million senior unsecured revolving credit facility. Under the facility, up to $30 million principal amount of borrowings may be outstanding at any time. The maximum amount of borrowings may be increased by up to an additional $30 million by mutual agreement of the lender and borrower. The proceeds from loans made under the facility may be used for general corporate purposes. The facility is not guaranteed by us or our subsidiaries. There was no outstanding balance under the facility as of February 2, 2018. Effective as of March 27, 2018, the facility agreement was amended and restated to extend the maturity date to March 27, 2019 and to modify the annual rate at which interest accrues.
Each loan made under the revolving credit facility will accrue interest at an annual rate equal to the applicable London interbank offered rate plus 1.15%. Amounts under the facility may be borrowed, repaid and reborrowed from time to time during the term of the facility. The borrower will be required to repay in full all of the loans outstanding, including all accrued interest, and the facility will terminate upon a change of control of us or following a transaction in which SecureWorks, Inc. ceases to be a direct or indirect wholly-owned subsidiary of our company. The credit agreement contains customary representations, warranties, covenants and events of default. The unused portion of the facility is subject to a commitment fee of 0.35%, which is due upon expiration of the facility.
Cash Flows
Our consolidated statements of cash flows for the three fiscal years ended February 2, 2018 include periods prior to August 1, 2015, the effective date of our carve-out from Dell. For periods prior to the carve-out on August 1, 2015, certain financial information is derived from the accounting records of Dell and our company. During the pre-carve-out periods, Dell funded our operating and investing activities as needed and transferred our excess cash at its discretion. These cash transfers are reflected as a component of stockholders' equity within our consolidated statements of financial position, and, accordingly, are classified as a change in cash from financing activities in our consolidated statements of cash flows.
Because we did not manage working capital independently from Dell prior to the carve-out, the summary of our statements of cash flows that include periods prior to the carve-out date does not purport to reflect what our cash flows would have been if we had operated as a stand-alone company for the entire period.
59
Fiscal Years Ended | ||||||||
February 2, 2018 | February 3, 2017 | |||||||
(in thousands) | ||||||||
Net change in cash from: | ||||||||
Operating activities | $ | 787 | $ | (6,838 | ) | |||
Investing activities | (13,819 | ) | (19,361 | ) | ||||
Financing activities | (2,024 | ) | 109,372 | |||||
Change in cash and cash equivalents | $ | (15,056 | ) | $ | 83,173 | |||
• | Operating Activities — Cash flows from operating activities was a source of cash of $0.8 million in fiscal 2018 and a use of cash of $6.8 million in fiscal 2017. Operating cash flows benefited from a lower net loss and a greater source of cash from working capital in fiscal 2018 as increases in liabilities and settlement of transactions with Dell, including an income tax receivable, more than offset increases in accounts receivable. We expect that our future transactions with Dell will be a source of cash over time as we anticipate that our charges to Dell will continue to exceed Dell’s charges to us, although the timing of charges and settlements may vary period to period. |
• | Investing Activities — Cash used in investing activities totaled $13.8 million and $19.4 million for fiscal 2018 and fiscal 2017, respectively. For the periods presented, investing activities consisted of capital expenditures for property and equipment to support our data center and facility infrastructure. Investing activities in fiscal 2017 also included investments in network upgrades, development of our software defined data center and implementation of new and upgraded back office systems and platforms to facilitate our expected growth. |
• | Financing Activities — Cash flows from financing activities was a use of cash of $2.0 million in fiscal 2018 and a source of cash of $109.4 million in fiscal 2017. Financing activities in fiscal 2018 consisted of $1.2 million of withholding tax payments associated with the vesting of stock compensation grants and $0.8 million of repayment of a transaction with Dell Financial Services. Financing activities for fiscal 2017 included $99.6 million in net cash proceeds from our IPO and a $10.0 million capital contribution by Dell in March 2016. |
Fiscal Years Ended | ||||||||
February 3, 2017 | January 29, 2016 | |||||||
(in thousands) | ||||||||
Net change in cash from: | ||||||||
Operating activities | $ | (6,838 | ) | $ | (9,843 | ) | ||
Investing activities | (19,361 | ) | (9,023 | ) | ||||
Financing activities | 109,372 | 45,619 | ||||||
Change in cash and cash equivalents | $ | 83,173 | $ | 26,753 | ||||
• | Operating Activities — Cash used by operating activities totaled $6.8 million and $9.8 million for fiscal 2017 and 2016, respectively. Operating cash flows benefited from a lower net loss and an increase in stock-based compensation, but were offset to a large extent by the effect of operating as a stand-alone company and the settlement of our net payable to Dell existing at the beginning of the year as discussed below. |
We began the year with a net payable to Dell of $21.7 million, which primarily represented amounts directly paid by Dell on our behalf to our vendors for payables and purchase orders that were outstanding as of August 1, 2015, the effective date of our agreements with Dell governing the commercial arrangements between our two companies. In addition, on a continuing basis, we incur liabilities to Dell for charges under the various commercial agreements in place as discussed above, and for costs Dell continues to pay directly on our behalf, such as the cost of Secureworks employee benefits provided for under the Dell benefit plans. Offsetting these liabilities, we charge to, or through, Dell for sales to our clients that we make through Dell legal entities or for services we provide directly to Dell.
During the third quarter of fiscal 2017, we began settling in cash our related party balances with Dell and will continue doing so on a quarterly basis. As a result, the amount due to Dell declined to approximately $10.2 million as of February 3, 2017.
60
• | Investing Activities — Cash used in investing activities totaled $19.4 million and $9.0 million for fiscal 2017 and fiscal 2016, respectively. For the periods presented, investing activities consisted of capital expenditures for property and equipment to support our data center and facility infrastructure. |
• | Financing Activities — Cash flows from financing activities totaled $109.4 million and $45.6 million for fiscal 2017 and fiscal 2016, respectively. Financing activities for fiscal 2017 included $99.6 million in net cash proceeds from our IPO and a $10.0 million capital contribution by Dell in March 2016. Financing activities for fiscal 2016 consisted of cash transfers from Dell of approximately $24.4 million and $22.5 million in cash proceeds from our sale of convertible notes. |
Contractual Cash Obligations
Contractual cash obligations are summarized in the following table:
Payments Due by Fiscal Year | ||||||||||||||||
(in thousands) | Less than 1 year | 1-3 years | 3-5 years | Thereafter | Total | |||||||||||
Operating leases | $ | 5,231 | $ | 8,371 | $ | 9,925 | $ | 16,117 | $ | 39,644 | ||||||
Purchase obligations | 3,446 | 2,008 | — | — | 5,454 | |||||||||||
Credit facilities and other(1) | 2,746 | 1,000 | — | — | 3,746 | |||||||||||
Total | $ | 11,423 | $ | 11,379 | $ | 9,925 | $ | 16,117 | $ | 48,844 | ||||||
(1) | Other reflects purchase obligations of annual maintenance services for hardware systems for internal use financed from a related party. See also “Notes to Consolidated Financial Statements—Note 10—Related Party Transactions” in our consolidated financial statements included in this report. |
For information about operating leases and purchase obligations, see “Notes to Consolidated Financial Statements—Note 6—Commitments and Contingencies” in our consolidated financial statements included in this report.
Off-Balance Sheet Arrangements
As of February 2, 2018, we were not subject to any obligations pursuant to any off-balance sheet arrangements that have or are reasonably likely to have a material effect on our financial condition, results of operations or liquidity.
Critical Accounting Policies
We prepare our financial statements in conformity with GAAP, which requires certain estimates, assumptions and judgments to be made that may affect our consolidated financial statements. Accounting policies that have a significant impact on our results are described in “Notes to Consolidated Financial Statements—Note 2—Significant Accounting Policies” in our consolidated financial statements included in this report. The accounting policies discussed in this section are those that we consider to be the most critical. We consider an accounting policy to be critical if the policy is subject to a material level of judgment and if changes in those judgments are reasonably likely to materially impact our results.
Revenue Recognition. We derive revenue primarily from two sources: (1) subscription revenue related to managed security and threat intelligence solutions; and (2) professional services, including security and risk consulting and incident response solutions.
Revenue is considered realized and earned when persuasive evidence of an arrangement exists, delivery has occurred or services have been rendered, the fee to our client is fixed and determinable and collection of the resulting receivable is reasonably assured.
61
Multiple-Element Arrangements. Our professional services contracts are typically sold separately from our subscription-based solutions. For subscription offerings, revenue arrangements typically include subscription security solutions, hardware that is essential to the delivery of the solutions, and maintenance agreements. The nature and terms of these multiple deliverable arrangements will vary based on the customized needs of our clients. A multiple-element arrangement is separated into more than one unit of accounting if both of the following criteria are met:
▪ | the item has value to the client on a stand-alone basis; and |
▪ | if the arrangement includes a general right of return relative to the delivered item and delivery or performance of the undelivered item is considered probable and substantially in our control. |
If these criteria are not met, the arrangement is accounted for as a single unit of accounting, which would result in revenue being recognized ratably over the contract term or being deferred until the earlier of the date such criteria are met or the date the last undelivered element is delivered. If these criteria are met for each element, consideration is allocated to each deliverable based on its relative selling price.
Subscription-Based Solutions. Subscription-based solutions arrangements typically include security solutions, the associated hardware appliance, up-front installation fees and maintenance agreements, which are all typically deferred and recognized over the life of the related agreement. The hardware appliance contains software components that do not provide customers with the right to take possession of software licenses supporting the solutions. Therefore, software is considered essential to the functionality of the associated hardware, and, accordingly, is excluded from the accounting guidance that is specific to the software industry. We have determined that the hardware appliance included in the subscription-based solutions arrangements does not have stand-alone value to the client and is required to access our Counter Threat Platform. The related maintenance agreements support the associated hardware and similarly do not have stand-alone value to the client. Therefore, we recognize revenue for these arrangements as a single unit of accounting. The revenue and any related costs for these deliverables is recognized ratably over the contract term, beginning on the date on which the solution is made available to clients. Amounts that have been invoiced, but for which the above revenue recognition criteria have not been met, are included in deferred revenue.
We have determined that we are the primary obligor in any arrangements that include third-party hardware sold in connection with our solutions, and, accordingly, we recognize this revenue on a gross basis.
Professional Services. Our professional services consist primarily of fixed-fee and retainer based contracts. Revenue from these engagements is recognized under the proportional performance method of accounting. Revenue from time- and materials-based contracts is recognized as costs are incurred at amounts represented by the agreed-upon billing amounts.
Intangible Assets Including Goodwill. Identifiable intangible assets with finite lives are amortized on a straight-line basis over their estimated useful lives. Finite-lived intangible assets are reviewed for impairment on a quarterly basis. Goodwill and indefinite-lived intangible assets are tested for impairment on an annual basis in the third fiscal quarter, or sooner if an indicator of impairment occurs. To determine whether goodwill and indefinite-lived intangible assets are impaired, we first assess certain qualitative factors. Based on this assessment, if it is determined that the fair value of the goodwill or indefinite-lived intangible asset is less than its carrying amount, we perform the quantitative analysis of the impairment test. We have determined that we have a single goodwill reporting unit, and, accordingly, for the quantitative analysis, we compare the fair value of this goodwill reporting unit to its carrying values. Based on the results of the annual impairment test, the fair value of our reporting unit exceeded its carrying value and no impairment of goodwill or indefinite-lived intangible assets existed at our test date of November 3, 2017. Subsequently, no events occurred through our February 2, 2018 year end that would indicate an impairment exists.
Stock-Based Compensation. Our compensation programs include grants under the SecureWorks Corp. 2016 Long-Term Incentive Plan and, prior to the IPO date, grants under share-based payment plans of Dell Technologies Inc., or Dell Technologies. Under the plans, we and, prior to the IPO date, Dell Technologies have granted stock options, restricted stock awards and restricted stock units. Compensation expense related to stock-based transactions is measured and recognized in the financial statements based on fair value. Fair value for restricted stock awards and restricted stock units under our plan is based on the closing price of our Class A common stock as reported on the NASDAQ Global Select Market on the day of the grant. The fair value of each option award is estimated on the grant date using the Black-Scholes option-pricing model and a single option award approach. This model requires that at the date of grant we determine the fair value of the underlying common stock, the expected term of the award, the expected volatility, risk-free interest rates and expected dividend yield. The restricted stock and restricted stock units issued during the fiscal year ended February 2, 2018 vest over an average service period of three years and approximately 50% of such awards are subject to performance conditions. Stock-based compensation expense, net of forfeitures and adjustments for attainment of performance criteria, is recognized using a straight-line basis over the
62
requisite service periods of the awards, which is generally three to four years. We estimate a forfeiture rate, based on an analysis of actual historical forfeitures, to calculate stock-based compensation expense.
Loss Contingencies. We are subject to the possibility of various losses arising in the ordinary course of business. We consider the likelihood of loss or impairment of an asset or the incurrence of a liability, as well as our ability to reasonably estimate the amount of loss, in determining loss contingencies. An estimated loss contingency is accrued when it is probable that an asset has been impaired or a liability has been incurred and the amount of loss can reasonably be estimated. We regularly evaluate current information available to us to determine whether such accruals should be adjusted and whether new accruals are required.
Recently Issued Accounting Pronouncements
Information about recently issued accounting pronouncements is presented in “Notes to Consolidated Financial Statements— Note 1—Description of the Business and Basis of Presentation” in our consolidated financial statements included in this report.
Item 7A. Quantitative and Qualitative Disclosures About Market Risk
Our results of operations and cash flows have been and will continue to be subject to fluctuations because of changes in foreign currency exchange rates, particularly changes in exchange rates between the U.S. dollar and the Euro, the British Pound, the Romanian Leu and the Canadian Dollar, the currencies of countries where we currently have our most significant international operations. Our expenses in international locations are generally denominated in the currencies of the countries in which our operations are located.
As our international operations grow, we may begin to use foreign exchange forward contracts to partially mitigate the impact of fluctuations in net monetary assets denominated in foreign currencies.
63
Item 8. Financial Statements and Supplementary Data
INDEX TO CONSOLIDATED FINANCIAL STATEMENTS
Audited Consolidated Financial Statements of SecureWorks Corp. | Page | ||
Report of Independent Registered Public Accounting Firm | |||
Consolidated Statements of Financial Position as of February 2, 2018 and February 3, 2017 | |||
Consolidated Statements of Operations for the fiscal years ended February 2, 2018, February 3, 2017, and January 29, 2016 | |||
Consolidated Statements of Comprehensive Loss for the fiscal years ended February 2, 2018, February 3, 2017, and January 29, 2016 | |||
Consolidated Statements of Cash Flows for the fiscal years ended February 2, 2018, February 3, 2017, and January 29, 2016 | |||
Consolidated Statements of Stockholders' Equity for the fiscal years ended February 2, 2018, February 3, 2017, and January 29, 2016 | |||
Notes to Consolidated Financial Statements | |||
Schedule II - Valuation and Qualifying Accounts for the fiscal years ended February 2, 2018, February 3, 2017, and January 29, 2016 | |||
64
Report of Independent Registered Public Accounting Firm
To the Board of Directors and
Stockholders of SecureWorks Corp.
Opinion on the Financial Statements
We have audited the accompanying consolidated statements of financial position of SecureWorks Corp. and its subsidiaries (the “Company”) as of February 2, 2018 and February 3, 2017, and the related consolidated statements of operations, comprehensive loss, stockholders’ equity and cash flows for each of the three years in the period ended February 2, 2018, including the related notes and financial statement schedule listed in the accompanying index (collectively referred to as the “consolidated financial statements”). In our opinion, the consolidated financial statements present fairly, in all material respects, the financial position of the Company as of February 2, 2018 and February 3, 2017, and the results of its operations and its cash flows for each of the three years in the period ended February 2, 2018 in conformity with accounting principles generally accepted in the United States of America.
Basis for Opinion
These consolidated financial statements are the responsibility of the Company’s management. Our responsibility is to express an opinion on the Company’s consolidated financial statements based on our audits. We are a public accounting firm registered with the Public Company Accounting Oversight Board (United States) (“PCAOB”) and are required to be independent with respect to the Company in accordance with the U.S. federal securities laws and the applicable rules and regulations of the Securities and Exchange Commission and the PCAOB.
We conducted our audits of these consolidated financial statements in accordance with the standards of the PCAOB. Those standards require that we plan and perform the audit to obtain reasonable assurance about whether the consolidated financial statements are free of material misstatement, whether due to error or fraud. The Company is not required to have, nor were we engaged to perform, an audit of its internal control over financial reporting. As part of our audits we are required to obtain an understanding of internal control over financial reporting but not for the purpose of expressing an opinion on the effectiveness of the Company's internal control over financial reporting. Accordingly, we express no such opinion.
Our audits included performing procedures to assess the risks of material misstatement of the consolidated financial statements, whether due to error or fraud, and performing procedures that respond to those risks. Such procedures included examining, on a test basis, evidence regarding the amounts and disclosures in the consolidated financial statements. Our audits also included evaluating the accounting principles used and significant estimates made by management, as well as evaluating the overall presentation of the consolidated financial statements. We believe that our audits provide a reasonable basis for our opinion.
/s/ PricewaterhouseCoopers LLP
Atlanta, Georgia
March 28, 2018
We have served as the Company's auditor since 2014.
65
SECUREWORKS CORP.
CONSOLIDATED STATEMENTS OF FINANCIAL POSITION
(in thousands)
February 2, 2018 | February 3, 2017 | ||||||
ASSETS | |||||||
Current assets: | |||||||
Cash and cash equivalents | $ | 101,539 | $ | 116,595 | |||
Accounts receivable, net | 157,764 | 113,546 | |||||
Inventories | 1,030 | 1,947 | |||||
Other current assets | 42,163 | 47,750 | |||||
Total current assets | 302,496 | 279,838 | |||||
Property and equipment, net | 33,457 | 31,153 | |||||
Goodwill | 416,487 | 416,487 | |||||
Purchased intangible assets, net | 234,184 | 261,921 | |||||
Other non-current assets | 4,677 | 5,704 | |||||
Total assets | $ | 991,301 | $ | 995,103 | |||
LIABILITIES AND STOCKHOLDERS' EQUITY | |||||||
Current liabilities: | |||||||
Accounts payable | $ | 23,266 | $ | 19,922 | |||
Accrued and other | 81,625 | 59,704 | |||||
Deferred revenue | 139,632 | 119,909 | |||||
Total current liabilities | 244,523 | 199,535 | |||||
Long-term deferred revenue | 14,948 | 14,752 | |||||
Other non-current liabilities | 52,681 | 89,392 | |||||
Total liabilities | 312,152 | 303,679 | |||||
Commitments and contingencies (Note 6) | |||||||
Stockholders' equity: | |||||||
Preferred stock - $0.01 par value: 200,000 shares authorized; 0 shares issued | — | — | |||||
Common stock - Class A of $.01 par value: 2,500,000 shares authorized; 11,085 issued and outstanding | 111 | 107 | |||||
Common stock - Class B of $.01 par value: 500,000 shares authorized; 70,000 shares issued and outstanding | 700 | 700 | |||||
Additional paid in capital | 867,411 | 854,907 | |||||
Accumulated deficit | (188,936 | ) | (160,859 | ) | |||
Accumulated other comprehensive loss | (137 | ) | (3,431 | ) | |||
Total stockholders' equity | 679,149 | 691,424 | |||||
Total liabilities and stockholders' equity | $ | 991,301 | $ | 995,103 | |||
The accompanying notes are an integral part of these consolidated financial statements.
66
SECUREWORKS CORP.
CONSOLIDATED STATEMENTS OF OPERATIONS
(in thousands, except per share data)
Fiscal Years Ended | |||||||||||
February 2, 2018 | February 3, 2017 | January 29, 2016 | |||||||||
Net revenue | $ | 467,904 | $ | 429,502 | $ | 339,522 | |||||
Cost of revenue | 226,718 | 212,599 | 183,809 | ||||||||
Gross margin | 241,186 | 216,903 | 155,713 | ||||||||
Research and development | 80,164 | 71,030 | 69,598 | ||||||||
Sales and marketing | 151,341 | 124,950 | 111,978 | ||||||||
General and administrative | 92,726 | 86,876 | 80,145 | ||||||||
Total operating expenses | 324,231 | 282,856 | 261,721 | ||||||||
Operating loss | (83,045 | ) | (65,953 | ) | (106,008 | ) | |||||
Interest and other, net | (2,735 | ) | 2,476 | (6,569 | ) | ||||||
Loss before income taxes | (85,780 | ) | (63,477 | ) | (112,577 | ) | |||||
Income tax benefit | (57,703 | ) | (25,264 | ) | (40,196 | ) | |||||
Net loss | (28,077 | ) | (38,213 | ) | (72,381 | ) | |||||
Net loss per common share (basic and diluted) | $ | (0.35 | ) | $ | (0.49 | ) | $ | (1.03 | ) | ||
Weighted-average common shares outstanding (basic and diluted) | 80,280 | 77,635 | 70,000 | ||||||||
The accompanying notes are an integral part of these consolidated financial statements.
67
SECUREWORKS CORP.
CONSOLIDATED STATEMENTS OF COMPREHENSIVE LOSS
(in thousands)
Fiscal Years Ended | |||||||||||
February 2, 2018 | February 3, 2017 | January 29, 2016 | |||||||||
Net loss | $ | (28,077 | ) | $ | (38,213 | ) | $ | (72,381 | ) | ||
Foreign currency translation adjustments, net of tax | 3,294 | (1,910 | ) | (1,496 | ) | ||||||
Comprehensive loss | $ | (24,783 | ) | $ | (40,123 | ) | $ | (73,877 | ) | ||
The accompanying notes are an integral part of these consolidated financial statements.
68
SECUREWORKS CORP.
CONSOLIDATED STATEMENTS OF CASH FLOWS
(in thousands)
Fiscal Years Ended | |||||||||||
February 2, 2018 | February 3, 2017 | January 29, 2016 | |||||||||
Cash flows from operating activities: | |||||||||||
Net loss | $ | (28,077 | ) | $ | (38,213 | ) | (72,381 | ) | |||
Adjustments to reconcile net loss to net cash provided by (used in) operating activities: | |||||||||||
Depreciation and amortization | 42,171 | 39,425 | 40,638 | ||||||||
Change in fair value of convertible notes | — | 132 | 5,493 | ||||||||
Stock-based compensation expense | 13,790 | 8,883 | 841 | ||||||||
Effects of exchange rate changes on monetary assets and liabilities denominated in foreign currencies | 3,256 | (2,239 | ) | 836 | |||||||
Income tax benefit | (57,703 | ) | (25,264 | ) | (40,196 | ) | |||||
Other non cash impacts | — | — | 4,792 | ||||||||
Excess tax benefit from share-based payment | — | (221 | ) | — | |||||||
Provision for doubtful accounts | 3,947 | 2,613 | 4,661 | ||||||||
Changes in assets and liabilities: | |||||||||||
Accounts receivable | (48,540 | ) | 956 | (52,443 | ) | ||||||
Net transactions with parent | 11,024 | (15,582 | ) | 21,691 | |||||||
Inventories | 917 | 1,610 | (1,179 | ) | |||||||
Other assets | 27,699 | (1,724 | ) | (7,453 | ) | ||||||
Accounts payable | 3,302 | 3,626 | (301 | ) | |||||||
Deferred revenue | 19,585 | 7,185 | 34,591 | ||||||||
Accrued and other liabilities | 9,416 | 11,975 | 50,567 | ||||||||
Net cash provided by (used in) operating activities | 787 | (6,838 | ) | (9,843 | ) | ||||||
Cash flows from investing activities: | |||||||||||
Capital expenditures | (13,819 | ) | (19,361 | ) | (9,023 | ) | |||||
Net cash used in investing activities | (13,819 | ) | (19,361 | ) | (9,023 | ) | |||||
Cash flows from financing activities: | |||||||||||
Principal payments on financing arrangement with Dell Financial Services | (800 | ) | — | — | |||||||
Taxes paid on vested restricted shares | (1,224 | ) | — | — | |||||||
Proceeds from initial public offering, net | — | 99,604 | — | ||||||||
Capital contribution from parent, net | — | 9,547 | — | ||||||||
Excess tax benefit from share-based payment | — | 221 | — | ||||||||
Net transactions with parent, net | — | — | 24,383 | ||||||||
Payment of deferred offering costs | — | — | (1,264 | ) | |||||||
Issuance of convertible notes | — | — | 22,500 | ||||||||
Net cash (used in) provided by financing activities | (2,024 | ) | 109,372 | 45,619 | |||||||
Net (decrease) increase in cash and cash equivalents | (15,056 | ) | 83,173 | 26,753 | |||||||
Cash and cash equivalents at beginning of the period | 116,595 | 33,422 | 6,669 | ||||||||
Cash and cash equivalents at end of the period | $ | 101,539 | $ | 116,595 | $ | 33,422 | |||||
Supplemental Disclosures of Non-Cash Investing and Financing Activities: | |||||||||||
Conversion of convertible notes to common stock | $ | — | $ | 28,125 | $ | — | |||||
Financed capital expenditures | $ | 1,390 | $ | 800 | $ | — | |||||
Income taxes paid | $ | 1,152 | $ | 910 | $ | — | |||||
The accompanying notes are an integral part of these consolidated financial statements.
69
SECUREWORKS CORP.
CONSOLIDATED STATEMENTS OF STOCKHOLDERS' EQUITY
(in thousands, except per share data)
Common Stock - Class A | Common Stock - Class B | |||||||||||||||||||||||||||||
Outstanding Shares | Amount | Outstanding Shares | Amount | Additional Paid in Capital | Accumulated Deficit | Accumulated Other Comprehensive (Loss) Income | Total Stockholders' Equity | |||||||||||||||||||||||
Balances, January 31, 2015 | — | $ | — | 70,000 | $ | 700 | $ | 656,516 | $ | (50,265 | ) | $ | (25 | ) | $ | 606,926 | ||||||||||||||
Net loss | — | — | — | — | — | (72,381 | ) | — | (72,381 | ) | ||||||||||||||||||||
Other comprehensive (loss) income | — | — | — | — | — | — | (1,496 | ) | (1,496 | ) | ||||||||||||||||||||
Capital contribution from parent, net | — | — | — | — | 54,566 | — | — | 54,566 | ||||||||||||||||||||||
Stock-based compensation | — | — | — | — | 841 | — | — | 841 | ||||||||||||||||||||||
Balances, January 29, 2016 | — | $ | — | 70,000 | $ | 700 | $ | 711,923 | $ | (122,646 | ) | $ | (1,521 | ) | $ | 588,456 | ||||||||||||||
Net loss | — | — | — | — | — | (38,213 | ) | — | (38,213 | ) | ||||||||||||||||||||
Other comprehensive (loss) income | — | — | — | — | — | — | (1,910 | ) | (1,910 | ) | ||||||||||||||||||||
Issuance of common stock in connection with initial public offering, net of offering costs | 8,000 | 80 | — | — | 96,246 | — | — | — | 96,326 | |||||||||||||||||||||
Conversion of convertible notes to common stock in connection with initial public offering | 2,009 | 20 | — | — | 28,105 | — | — | 28,125 | ||||||||||||||||||||||
Grant of restricted stock awards | 557 | 7 | — | — | (18 | ) | $ | — | $ | — | (11 | ) | ||||||||||||||||||
Capital contribution from parent, net | 9,547 | 9,547 | ||||||||||||||||||||||||||||
Stock-based compensation | — | — | — | — | 8,883 | — | — | 8,883 | ||||||||||||||||||||||
Excess tax benefit from share-based payment | — | — | — | — | 221 | — | — | 221 | ||||||||||||||||||||||
Balances, February 3, 2017 | 10,566 | $ | 107 | 70,000 | $ | 700 | $ | 854,907 | $ | (160,859 | ) | $ | (3,431 | ) | $ | 691,424 | ||||||||||||||
Net loss | — | — | — | — | — | (28,077 | ) | $ | — | (28,077 | ) | |||||||||||||||||||
Other comprehensive (loss) income | — | — | — | — | — | — | 3,294 | 3,294 | ||||||||||||||||||||||
Vesting of restricted stock units | 384 | 4 | — | — | (4 | ) | — | — | — | |||||||||||||||||||||
Grant of restricted stock awards | 284 | 2 | — | — | (2 | ) | — | — | ||||||||||||||||||||||
Common stock withheld as payment for withholding taxes upon the vesting of restricted shares | (149 | ) | (2 | ) | — | — | (1,280 | ) | — | — | (1,282 | ) | ||||||||||||||||||
Stock-based compensation | — | — | — | — | 13,790 | — | — | 13,790 | ||||||||||||||||||||||
Balances, February 2, 2018 | 11,085 | $ | 111 | 70,000 | $ | 700 | $ | 867,411 | $ | (188,936 | ) | $ | (137 | ) | $ | 679,149 | ||||||||||||||
The accompanying notes are an integral part of these consolidated financial statements.
70
SECUREWORKS CORP.
Notes to Consolidated Financial Statements
NOTE 1 - DESCRIPTION OF THE BUSINESS AND BASIS OF PRESENTATION
Description of the Business
SecureWorks Corp. (individually and collectively with its consolidated subsidiaries, “Secureworks” or the “Company”) is a leading global provider of intelligence-driven information security solutions singularly focused on protecting the Company's clients from cyber attacks. The Company's solutions enable organizations of varying size and complexity to fortify their cyber defenses to prevent security breaches, detect malicious activity in near real time, prioritize and respond rapidly to security incidents and predict emerging threats.
The Company has one primary business activity, which is to provide clients with intelligence-driven information security solutions. The Company’s chief operating decision maker, who is the President and Chief Executive Officer, makes operating decisions, assesses performance, and allocates resources on a consolidated basis. Accordingly, Secureworks operates its business as a single reportable segment.
On February 8, 2011, the Company was acquired by Dell Inc. (individually and collectively with its consolidated subsidiaries, “Dell” or “Parent”). On October 29, 2013, Dell was acquired by Dell Technologies Inc., formerly known as Denali Holding Inc. (“Dell Technologies”), a parent holding corporation. For the purposes of the accompanying financial statements, the Company elected to utilize pushdown accounting for the acquisition of Dell by Dell Technologies. On April 27, 2016, the Company completed its initial public offering (“IPO”), as further described below. Upon the closing of the IPO, Dell Technologies owned, indirectly through Dell Inc. and Dell Inc.’s subsidiaries, no shares of the Company's outstanding Class A common stock and all shares of the Company's outstanding Class B common stock, which as of February 2, 2018 represented approximately 86.3% of the Company's total outstanding shares of common stock and approximately 98.4% of the combined voting power of both classes of the Company's outstanding common stock.
Corporate History
The Company was incorporated in Georgia in May 2009. On November 24, 2015, the Company reincorporated from Georgia to Delaware and, in connection with the reincorporation, changed its name from SecureWorks Holding Corporation to SecureWorks Corp. and its authorized capital from 1,000 shares of common stock, par value $0.01 per share, to 1,000 shares of Class A common stock and 1,000 shares of Class B common stock, each with a par value of $0.01 per share. There are no differences in dividend and liquidation rights between the Class A common stock and the Class B common stock. Each share of Class A common stock is entitled to one vote and each share of Class B common stock is entitled to ten votes. Upon the reincorporation, the 1,000 issued and outstanding shares of common stock of the Georgia corporation were reclassified into and became 1,000 issued and outstanding shares of Class B common stock of SecureWorks Corp., the Delaware corporation.
In January 2016, the Company’s board of directors and stockholder approved a 70,000-for-1 stock split of the Company’s Class B common stock. The Company filed an amendment to its certificate of incorporation effecting the stock split on April 8, 2016. The amendment to the certificate of incorporation also increased the number of shares of Class A common stock authorized for issuance from 1,000 to 2,500,000,000 shares and increased the number of shares of Class B common stock authorized for issuance from 1,000 to 500,000,000 shares.
In April 2016, the Company’s board of directors and stockholder approved a restated certificate of incorporation further amending and restating the provisions of the certificate of incorporation. The restated certificate of incorporation, which was filed on April 22, 2016, authorized for issuance 200,000,000 shares of preferred stock, par value $0.01 per share.
Initial Public Offering
On April 27, 2016, the Company completed its IPO in which it issued and sold 8,000,000 shares of Class A common stock at a price to the public of $14.00 per share. The Company received net proceeds of $99.6 million from the sale of shares of Class A common stock, after deducting underwriting discounts and commissions and unpaid offering expenses payable by the Company of $12.4 million.
Upon the closing of the IPO, all of the Company's convertible notes automatically converted into 2,008,924 shares of the Class A common stock. For more information regarding the convertible notes see “Note 5—Debt.”
71
Basis of Presentation and Consolidation
The Company’s consolidated financial statements have been prepared on a stand-alone basis in accordance with accounting principles generally accepted in the United States of America (“GAAP”). The preparation of financial statements in accordance with GAAP requires management to make estimates and assumptions that affect the amounts reported in the Company’s financial statements. The consolidated financial statements include assets, liabilities, revenue and expenses of all majority-owned subsidiaries. Intercompany transactions and balances are eliminated in consolidation.
For the periods presented, Dell has provided various corporate services to the Company in the ordinary course of business, including finance, tax, human resources, legal, insurance, IT, procurement and facilities-related services. Dell also has provided the Company with the services of a number of its executives and employees. Through the first two quarters of the fiscal year ended January 29, 2016, the costs of such services were allocated to the Company based on the most relevant allocation method to the service provided, primarily based on relative percentage of total net sales, relative percentage of headcount, or specific identification. Management believes the basis on which the expenses have been allocated to be a reasonable reflection of the utilization of services provided to or the benefit received by the Company during the periods presented. Beginning in the third quarter of the fiscal year ended January 29, 2016, the costs of these services were charged in accordance with the shared services agreement that went into effect on August 1, 2015. For more information regarding the allocated costs and related party transactions, see “Note 10—Related Party Transactions.”
During the periods presented in the financial statements, Secureworks did not file separate federal tax returns, as the Company was generally included in the tax grouping of other Dell entities within the respective entity’s tax jurisdiction. The income tax benefit has been calculated using the separate return method, modified to apply the benefits for loss approach. Under the benefits for loss approach, net operating losses or other tax attributes are characterized as realized or as realizable by Secureworks when those attributes are utilized or expected to be utilized by other members of the Dell consolidated group. See “Note 8—Income and Other Taxes” for more information.
Fiscal Year
The Company’s fiscal year is the 52- or 53-week period ending on the Friday closest to January 31. The Company refers to the fiscal years ended February 2, 2018, February 3, 2017, and January 29, 2016 as fiscal 2018, fiscal 2017, and fiscal 2016, respectively. Fiscal 2018 and fiscal 2016 included 52 weeks, while fiscal 2017 included 53 weeks, with the extra week included in the fourth quarter.
Use of Estimates
The preparation of financial statements in conformity with GAAP requires management to make estimates and assumptions that affect the reported amounts of assets and liabilities, the disclosure of contingent assets and liabilities at the date of the financial statements and the reported amounts of revenue and expenses during the reporting periods. Estimates are revised as additional information becomes available. In the Consolidated Statements of Operations, estimates are used when accounting for revenue arrangements, determining cost of revenue, allocating cost in the form of depreciation and amortization and estimating the impact of contingencies. In the Statements of Financial Position, estimates are used in determining the valuation and recoverability of assets, such as accounts receivable, inventories, fixed assets, goodwill and other identifiable intangible assets, and estimates are used in determining the reported amounts of liabilities, such as taxes payable and the impact of contingencies, all of which also impact the Consolidated Statements of Operations. Actual results could differ from these estimates.
Revision of Previously Issued Financial Statements
During the fiscal year ended February 2, 2018, the Company revised its balance sheet as of and for the period ended February 3, 2017 as a result of the correction of an error related to prepaid expenses for which the Company had been invoiced, but for which cash had not been remitted. This error resulted in an overstatement of other current assets and accounts payable balances in the Statements of Financial Position and had a corresponding impact to the changes in the balances in the Company’s Statements of Cash Flows, with no impact on the cash used in operating activities, for the periods ended February 3, 2017 and January 29, 2016, respectively. The error had no impact on the Company’s Statements of Operations. Management has concluded that the impact of the misstatement was not material to the previously issued financial statements.
72
The following tables summarize the impacts of the error.
As of February 3, 2017 | As of February 3, 2017 | ||||||||||
Statements of Financial Position (in thousands) | (as reported) | Adjustments | (as revised) | ||||||||
Other current assets | $ | 51,947 | $ | (4,197 | ) | $ | 47,750 | ||||
Total current assets | $ | 284,035 | $ | (4,197 | ) | $ | 279,838 | ||||
Accounts payable | $ | 24,119 | $ | (4,197 | ) | $ | 19,922 | ||||
Total current liabilities | $ | 203,732 | $ | (4,197 | ) | $ | 199,535 | ||||
Fiscal Year Ended February 3, 2017 | Fiscal Year Ended February 3, 2017 | ||||||||||
Statements of Cash Flows (in thousands) | (as reported) | Adjustments | (as revised) | ||||||||
Changes in assets and liabilities: | |||||||||||
Other assets | $ | (139 | ) | $ | (1,585 | ) | $ | (1,724 | ) | ||
Accounts payables | 2,041 | 1,585 | 3,626 | ||||||||
Net cash provided by (used in) operating activities | $ | (6,838 | ) | $ | — | $ | (6,838 | ) | |||
Fiscal Year Ended January 29, 2016 | Fiscal Year Ended January 29, 2016 | ||||||||||
(as reported) | Adjustments | (as revised) | |||||||||
Changes in assets and liabilities: | |||||||||||
Other assets | $ | (10,065 | ) | $ | 2,612 | $ | (7,453 | ) | |||
Accounts payables | 2,311 | (2,612 | ) | (301 | ) | ||||||
Net cash provided by (used in) operating activities | $ | (9,843 | ) | $ | — | $ | (9,843 | ) | |||
Fiscal Year Ended February 3, 2017 | Fiscal Year Ended February 3, 2017 | ||||||||||
Note 9—Selected Financial Data (in thousands) | (as reported) | Adjustments | (as revised) | ||||||||
Other current assets | |||||||||||
Income tax receivable | $ | 25,091 | $ | — | $ | 25,091 | |||||
Prepaid maintenance and support agreements | 16,107 | (4,197 | ) | 11,910 | |||||||
Prepaid other | 10,749 | — | 10,749 | ||||||||
Total | $ | 51,947 | $ | (4,197 | ) | $ | 47,750 | ||||
NOTE 2 — SIGNIFICANT ACCOUNTING POLICIES
Cash and Cash Equivalents. As of February 2, 2018 and February 3, 2017, cash and cash equivalents is comprised of cash held in bank accounts and money market funds. The cash and cash equivalents are reported at their current carrying value, which approximates fair value due to the short-term nature of these instruments. The money market instruments are valued using quoted market prices and are included as Level 1 inputs.
Accounts Receivable. Trade accounts receivable are recorded at the invoiced amount, net of allowances for doubtful accounts. Accounts receivable are charged against the allowance for doubtful accounts when deemed uncollectible. Management regularly reviews the adequacy of the allowance for doubtful accounts by considering the age of each outstanding invoice, each customer’s expected ability to pay, and the collection history with each customer, when applicable, to determine whether a specific allowance is appropriate. As of February 2, 2018 and February 3, 2017, the allowance for doubtful accounts was $8.2 million and $6.1 million, respectively.
73
SECUREWORKS CORP.
Notes to Consolidated Financial Statements (Continued)
Unbilled accounts receivable included in accounts receivable, totaling $18.1 million and $9.4 million as of February 2, 2018 and February 3, 2017, respectively, relate to work that has been performed, though invoicing has not yet occurred. All of the unbilled receivables are expected to be billed and collected within the upcoming year.
Allowance for Doubtful Accounts. The Company recognizes an allowance for losses on accounts receivable in an amount equal to the estimated probable losses, net of recoveries. The allowance is based on an analysis of historical bad debt experience, current receivables aging, and expected future write-offs, as well as an assessment of specific identifiable customer accounts considered at risk or uncollectible. The expense associated with the allowance for doubtful accounts is recognized in general and administrative expenses.
Fair Value Measurements. The carrying amounts of the Company’s financial instruments, including cash equivalents, accounts receivable, accounts payable and accrued expenses, approximate their respective fair values due to their short-term nature.
Inventories. Inventories consist of finished goods, which include hardware devices such as servers, log retention devices and appliances that are sold in connection with the Company’s solutions offerings. Inventories are stated at lower of cost or net realizable value, with cost being determined on a first-in, first-out (FIFO) basis.
Prepaid Maintenance and Support Agreements. Prepaid maintenance and support agreements represent amounts paid to third-party service providers for maintenance, support and software license agreements in connection with the Company’s obligations to provide maintenance and support services. The prepaid maintenance and support agreement balance is amortized on a straight-line basis over the contract term and is primarily recognized as a component of cost of revenue. Amounts that are expected to be amortized within one year are recorded in other current assets and the remaining balance is recorded in other non-current assets.
Property and Equipment. Property and equipment are carried at depreciated cost. Depreciation is calculated using the straight-line method over the estimated economic lives of the assets, which range from two to five years. Leasehold improvements are amortized over the shorter of five years or the lease term. For the fiscal years ended February 2, 2018, February 3, 2017, and January 29, 2016, depreciation expense was $14.4 million, $11.7 million and $12.3 million, respectively. Gains or losses related to retirements or disposition of fixed assets are recognized in the period incurred.
Intangible Assets Including Goodwill. Identifiable intangible assets with finite lives are amortized on a straight-line basis over their estimated useful lives. Finite-lived intangible assets are reviewed for triggering events on a quarterly basis. Goodwill and indefinite-lived intangible assets are tested for impairment on an annual basis in the third fiscal quarter, or sooner if an indicator of impairment occurs. To determine whether goodwill and indefinite-lived intangible assets are impaired, the Company first assesses certain qualitative factors. Based on this assessment, if it is determined that the fair value of the goodwill or indefinite-lived intangible asset is less than its carrying amount, the Company performs the quantitative analysis of the impairment test.
The goodwill impairment test consists of a two-step process, if necessary. The first step is to compare the fair value of the reporting unit to its carrying value, including goodwill. The Company typically uses a discounted cash flow model to determine the fair value of the reporting unit. The assumptions used in the model are consistent with those which the Company believes hypothetical marketplace participants would use. If the fair value of the reporting unit is less than its carrying value, the second step of the impairment test must be performed in order to determine the amount of the impairment loss, if any. The second step compares the implied fair value of the reporting unit’s goodwill with the carrying amount of that goodwill. If the carrying amount of the reporting unit’s goodwill exceeds its implied fair value, an impairment charge is recognized in an amount equal to that excess. The loss recognized cannot exceed the carrying amount of goodwill. The Company has determined that it has a single goodwill reporting unit, and, accordingly, for the quantitative analysis, it compares the fair value of this goodwill reporting unit to its carrying value. For indefinite-lived assets, other than goodwill, if the carrying amount determined through the quantitative analysis exceeds the fair value, an impairment charge is recognized in an amount equal to that excess.
Foreign Currency Translation. During the periods presented, Secureworks primarily operated in the United States. For the majority of the Company’s international businesses, the Company has determined that the functional currency of those subsidiaries is the local currency. Accordingly, assets and liabilities for these entities are translated at current rates of exchange in effect at the balance sheet date. Revenue and expenses from these international subsidiaries are translated using the monthly average exchange rates in effect for the period in which the items occur. Foreign currency translation adjustments are included as a component of accumulated other comprehensive loss, while foreign currency transaction gains and losses are recognized in the Statements of Operations within interest and other, net. These transaction (losses) gains totaled $(3.3) million, $2.2 million and $(0.8) million in the fiscal years ended February 2, 2018, February 3, 2017, and January 29, 2016, respectively.
74
SECUREWORKS CORP.
Notes to Consolidated Financial Statements (Continued)
Revenue Recognition. Secureworks derives revenue primarily from two sources: (1) subscription revenue related to managed security and threat intelligence solutions; and (2) professional services, including security and risk consulting and incident response solutions.
Revenue is considered realized and earned when persuasive evidence of an arrangement exists, delivery has occurred or services have been rendered, the fee to its customer is fixed or determinable and collection of the resulting receivable is reasonably assured.
Multiple-Element Arrangements
Professional services contracts are typically sold separately from subscription-based solutions. For subscription offerings, revenue arrangements typically include subscription security solutions, hardware that is essential to the delivery of the service, and maintenance agreements. The nature and terms of these multiple deliverable arrangements will vary based on the customized needs of clients. A multiple-element arrangement is separated into more than one unit of accounting if both of the following criteria are met:
▪ | the item has value to the client on a stand-alone basis; and |
▪ | if the arrangement includes a general right of return relative to the delivered item, delivery or performance of the undelivered item is considered probable and substantially in the Company’s control. |
If these criteria are not met, the arrangement is accounted for as a single unit of accounting, which would result in revenue being recognized ratably over the contract term or being deferred until the earlier of when such criteria are met or when the last undelivered element is delivered. If these criteria are met for each element, consideration is allocated to the deliverables based on its relative selling price.
Subscription-Based Solutions
Subscription-based arrangements typically include security solutions, the associated hardware appliance, up-front installation fees and maintenance agreements, which are all typically recognized over the life of the related agreement. The hardware appliance contains software components that do not provide customers with the right to take possession of software licenses supporting the solutions. Therefore, software is considered essential to the functionality of the associated hardware, and, accordingly, is excluded from the accounting guidance that is specific to the software industry. The Company has determined that the hardware appliance included in the subscription-based solutions arrangements does not have stand-alone value to the customer and is required to access the Company’s Counter Threat Platform. The related maintenance agreements support the associated hardware and similarly do not have stand-alone value to the customer. The related installations fees are non-refundable and also do not have stand-alone value to the customer. Therefore, Secureworks recognizes revenue for these arrangements as a single unit of accounting. The revenue and any related costs for these deliverables are recognized ratably over the contract term, beginning on the date on which service is made available to clients. Amounts that have been invoiced, but for which the above revenue recognition criteria have not been met, are included in deferred revenue.
The Company has determined that it is the primary obligor in any arrangements that include third-party hardware sold in connection with its solutions, and, accordingly, the Company recognizes this revenue on a gross basis.
Professional Services
Professional services consist primarily of fixed-fee and retainer-based contracts. Revenue from these engagements is recognized under the proportional performance method of accounting. Revenue from time-and materials-based contracts is recognized as costs are incurred at amounts represented by the agreed-upon billing rates.
The Company reports revenue net of any revenue-based taxes assessed by governmental authorities that are imposed on and concurrently with specific revenue-producing transactions.
Deferred Revenue. Deferred revenue represents amounts contractually billed to customers or payments received from customers for which revenue has not yet been recognized. Deferred revenue that is expected to be recognized as revenue within one year is recorded as short-term deferred revenue and the remaining portion is recorded as long-term deferred revenue.
75
SECUREWORKS CORP.
Notes to Consolidated Financial Statements (Continued)
Cost of Revenue. Cost of revenue consists primarily of compensation and related expenses, including salaries, benefits and performance-based compensation for employees who maintain the Counter Threat Platform and provide support services to clients, as well as perform other critical functions. Other expenses include depreciation of equipment and costs associated with maintenance agreements for hardware provided to clients as part of their subscription-based solutions. In addition, cost of revenue includes amortization of technology licensing fees, fees paid to contractors who supplement or support solutions offerings, maintenance fees and overhead allocations.
Research and Development Costs. Research and development costs are expensed as incurred. Research and development expenses include compensation and related expenses for the continued development of solutions offerings, including a portion of expenses related to the threat research team, which focuses on the identification of system vulnerabilities, data forensics and malware analysis and product management. In addition, expenses related to the development and prototype of new solutions offerings also are included in research and development costs, as well as allocated overhead. The Company’s solutions offerings have generally been developed internally.
Sales and Marketing. Sales and marketing expense includes compensation and related expenses, including salaries, benefits, and performance-based compensation, including sales commissions and related expenses for sales and marketing personnel, marketing and advertising programs, including lead generation, client advocacy events, other brand-building expenses, and allocated overhead. Advertising costs are expensed as incurred and were $14.7 million, $12.8 million and $13.0 million for the fiscal years ended February 2, 2018, February 3, 2017, and January 29, 2016, respectively.
General, and Administrative. General and administrative expense primarily includes the costs of human resources and recruiting, finance and accounting, legal support, management information systems and information security systems, facilities management and other administrative functions, offset by allocations of information technology and facilities costs to other functions.
Software Development Costs. Qualifying software costs developed for internal use are capitalized when application development begins, it is probable that the project will be completed, and the software will be used as intended. In order to expedite delivery of the Company’s security solutions, the application stage typically commences before the preliminary development stage is completed. Accordingly, no significant software development costs have been capitalized during any period presented.
Income Taxes. Current income tax expense is the amount of income taxes expected to be payable for the current year. Deferred tax assets and liabilities are recorded based on the difference between the financial statement and tax basis of assets and liabilities using enacted tax rates in effect for the year in which the differences are expected to reverse. The effect on deferred tax assets and liabilities of a change in tax rates is recognized in the Statements of Operations in the period that includes the enactment date. The Company calculates a provision for income taxes using the asset and liability method, under which deferred tax assets and liabilities are recognized by identifying the temporary differences arising from the different treatment of items for tax and accounting purposes. The Company provides valuation allowances for deferred tax assets, where appropriate. In assessing the need for a valuation allowance, Secureworks considers all available evidence for each jurisdiction, including past operating results, estimates of future taxable income, and the feasibility of ongoing tax planning strategies. In the event Secureworks determines all or part of the net deferred tax assets are not realizable in the future, it will make an adjustment to the valuation allowance that would be charged to earnings in the period such determination is made.
The accounting guidance for uncertainties in income tax prescribes a comprehensive model for the financial statement recognition, measurement, presentation and disclosure of uncertain tax positions taken or expected to be taken in income tax returns. The Company recognizes a tax benefit from an uncertain tax position in the financial statements only when it is more likely than not that the position will be sustained upon examination, including resolution of any related appeals or litigation processes, based on the technical merits and a consideration of the relevant taxing authority’s administrative practices and precedents.
During the periods presented in the financial statements, the Company did not file separate federal tax returns, as the Company was generally included in the tax grouping of other Dell entities within the respective entity’s tax jurisdiction. The income tax benefit has been calculated using the separate return method, modified to apply the benefits for loss approach. Under the benefits for loss approach, net operating losses or other tax attributes are characterized as realized or as realizable by the Company when those attributes are utilized or expected to be utilized by other members of the Dell consolidated group.
76
SECUREWORKS CORP.
Notes to Consolidated Financial Statements (Continued)
Sales Commissions and Incentives. The Company recognizes commission expense in the period earned by the employee or when the Company’s rights to recover awards in the event of a customer cancellation have lapsed. During the fiscal years ended February 3, 2017 and January 29, 2016, when clients paid for one or more years of service in advance, sales commissions were paid 50% in the month subsequent to the execution of the service contract and the remaining 50% over the following 12 months. For these commission plans, the Company recognized the sales commission expense related to the entire contract ratably over the first year of the service contract. During the fiscal years ended February 3, 2017 and January 29, 2016, the Company recognized $29.4 million and $29.5 million, respectively, in commission expense. All sales commission amounts were recoverable by the Company throughout the first year of a service contract. Therefore, the portion of any sales commissions paid upon the signing of a contract, for which the related sales commission expense had not yet been recognized, was recorded as a prepaid asset and amortized to expense during the first 12 months of the contract. As of February 3, 2017 and January 29, 2016, the Company had a prepaid commission balance, included in other current assets, of $1.6 million and $1.9 million, respectively.
During the fiscal year ended February 2, 2018, the Company revised the design of many of its sales commission plans. Sales incentives were earned based on an individual’s performance relative to the individual’s annual sales goal or quota. Quarterly advances were paid throughout the year based on proportional performance. As a result of these new incentive plans, which no longer provide the Company with the ability to recover the commission from the employee in the event the customer contract is canceled, the Company recognized commission expense in the month it was earned. During the fiscal year ended February 2, 2018, the Company recognized $42.1 million in commission expense, which included the ratable recognition of the remaining fiscal 2017 commissions earned under the former plans, which had been deferred.
The Company typically expenses sales commissions paid to strategic and distribution partners upon entering contracts for the solutions sold and recognizes the revenue associated with such sales over the terms of the contracts.
Stock-Based Compensation. The Company’s compensation programs include grants under the SecureWorks Corp. 2016 Long-Term Incentive Plan and, prior to the IPO date, grants under share-based payment plans of Dell Technologies. Under the plans, the Company, and prior to the IPO, Dell Technologies have granted stock options, restricted stock awards and restricted stock units. Compensation expense related to stock-based transactions is measured and recognized in the financial statements based on fair value. Fair value for restricted stock awards and restricted stock units under the Company’s plan is based on the closing price of the Company’s Class A common stock as reported on the NASDAQ Global Select Market on the day of the grant. The fair value of each option award is estimated on the grant date using the Black-Scholes option-pricing model and a single option award approach. This model requires that at the date of grant we determine the fair value of the underlying common stock, the expected term of the award, the expected volatility, risk-free interest rates and expected dividend yield. The restricted stock and restricted stock units issued during the fiscal year ended February 2, 2018 vest over an average service period of three years and approximately 50% of such awards are subject to performance conditions. Stock-based compensation expense, net of forfeitures and adjustments for attainment of performance criteria, is recognized using a straight-line basis over the requisite service periods of the awards, which is generally three to four years. The Company estimates a forfeiture rate, based on an analysis of actual historical forfeitures, to calculate stock-based compensation expense.
Loss Contingencies. Secureworks is subject to the possibility of various losses arising in the ordinary course of business. An estimated loss contingency is accrued when it is probable that an asset has been impaired or a liability has been incurred and the amount of loss can be reasonably estimated. The Company regularly evaluates current information available to determine whether such accruals should be adjusted and whether new accruals are required. See “Note 6–Commitments and Contingencies” for more information about these loss contingencies.
Recently Adopted Accounting Pronouncements
Compensation - Stock Compensation. In March 2016, the Financial Accounting Standards Board (the “FASB”) issued Accounting Standards Update (“ASU”) No. 2016-09, “Compensation-Stock Compensation (Topic 718): Improvements to Employee Share-Based Accounting.” The update simplifies the income tax accounting and cash flow presentation related to share-based compensation by requiring the recognition of all excess tax benefits and deficiencies directly on the income statement and classification as cash flows from operating activities on the statement of cash flows. This update also makes several changes to the accounting for forfeitures and employee tax withholding on share-based compensation. The Company adopted this guidance during the fiscal year ended February 2, 2018 with no material impact on its consolidated financial statements.
77
SECUREWORKS CORP.
Notes to Consolidated Financial Statements (Continued)
Recently Issued Accounting Pronouncements
Compensation - Stock Compensation. In May 2017, the FASB issued ASU No. 2017-09, “Compensation – Stock Compensation (Topic 718): Scope of Modification Accounting.” The amendments in this update provide guidance about which changes to the terms or conditions of a share-based payment award require an entity to apply modification accounting under Topic 718. The amendments are effective for the Company beginning with the Company’s 2019 fiscal year, although early adoption is permitted. The Company does not expect these amendments to have a material impact on its consolidated financial statements.
Intangibles - Goodwill and Other. In January 2017, the FASB issued ASU 2017-04, Intangibles-Goodwill and Other (Topic 350): “Simplifying the Test for Goodwill Impairment.” ASU 2017-04 eliminates Step 2 of the goodwill impairment test, which required the Company to determine the implied fair value of goodwill by allocating the reporting unit's fair value to each of its assets and liabilities as if the reporting unit was acquired in a business acquisition. Instead, the updated guidance requires an entity to perform its annual or interim goodwill impairment test by comparing the fair value of the reporting unit to its carrying value, and recognizing a non-cash impairment charge for the amount by which the carrying value exceeds the reporting unit's fair value with the loss not exceeding the total amount of goodwill allocated to that reporting unit. The updated guidance is effective for the Company beginning January 1, 2020, with early adoption permitted, and will be applied on a prospective basis. The Company does not expect that the adoption of this standard will have a material impact on its consolidated financial statements.
Statement of Cash Flows. In August 2016, the FASB issued ASU No. 2016-15, “Statement of Cash Flows (Topic 230): Classification of Certain Cash Receipts and Cash Payments - A consensus of the FASB Emerging Issues Task Force.” The update was issued with the objective of reducing the existing diversity in practice in how certain cash receipts and cash payments are presented and classified in the statement of cash flows under Topic 230 and other topics. The update is effective for the Company for fiscal years beginning with the Company’s 2019 fiscal year, including interim periods within those fiscal years. The Company does not expect that the adoption of this standard will have a material impact on its Consolidated Statements of Cash Flows.
Financial Instruments - Credit Losses. In June 2016, the FASB issued ASU No. 2016-13, “Financial Instruments - Credit Losses (Topic 326): Measurement of Credit Losses on Financial Instruments.” The amendments in this update replace the incurred loss impairment methodology in current GAAP with a methodology that reflects expected credit losses and requires consideration of a broader range of reasonable and supportable information to inform credit loss estimates. The update is effective for the Company for fiscal years beginning with the Company’s 2021 fiscal year, including interim periods within those fiscal years. The Company is currently evaluating the impact of this guidance on its consolidated financial statements.
Leases — In February 2016, the FASB issued ASU No. 2016-02, “Leases (Topic 842),” which requires lessees to recognize most lease liabilities on their balance sheets but recognize the expenses on their income statements in a manner similar to current practice. The update states that a lessee would recognize a lease liability for the obligation to make lease payments and a right-to-use asset for the right to use the underlying asset for the lease term. The update is effective for the Company for annual and interim periods beginning with the Company’s 2020 fiscal year, and early adoption is permitted. Although the Company is currently evaluating the impact of this guidance on its consolidated financial statements and related disclosures, the Company expects that most of its operating lease commitments will be subject to the new standard and recognized as operating lease liabilities and right-of-use assets upon adoption.
Revenue from Contracts with Customers. In May 2014, the FASB issued amended guidance on the recognition of revenue from contracts with customers. The objective of the new standard is to establish a single comprehensive model for entities to use in accounting for revenue arising from contracts with customers and will supersede most of the existing revenue recognition guidance, including industry-specific guidance. The new standard requires entities to recognize revenue when it transfers promised goods or services to customers in an amount that reflects the consideration to which the entity expects to be entitled in exchange for those goods or services. The new standard also provides guidance on the accounting for costs to fulfill or obtain a customer contract. Further, the new standard requires additional disclosures to help enable users of the financial statements to better understand the nature, amount, timing, risks and judgments related to revenue recognition and related cash flows from contracts with customers.
78
SECUREWORKS CORP.
Notes to Consolidated Financial Statements (Continued)
Public entities are required to adopt the new standard for fiscal years, and interim periods within those years, beginning after December 15, 2017. The new revenue standard may be applied retrospectively to each prior period presented (full retrospective method) or retrospectively with the cumulative effect of initially applying the standard recognized at the date of initial application in retained earnings (modified retrospective method). The Company will adopt this standard and its amendments retrospectively to each period presented for the Company’s 2019 fiscal year, including interim periods.
The adoption of this standard will have a material impact on the Company’s consolidated financial statements and related disclosures, primarily related to the Company’s accounting for costs to obtain a contract. These costs are defined as those that an entity incurs to obtain a contract with a customer that it would not have incurred if the contract had not been obtained. Under the new standard, these costs to obtain a contract will now be capitalized and amortized on a systematic basis that is consistent with the transfer to the customer of the goods or services to which the assets relate. A significant portion of the Company’s sales commission cost related to the acquisition of sales contracts will be deferred and recognized over the average life of the arrangement, which is approximately 7 years. Additionally, the Company incurs certain costs to install and activate hardware and software used in its Managed Security Services, primarily related to a portion of the compensation for the personnel who perform the installation activities. These fulfillment costs will be deferred and recognized over the economic life of the services, or approximately 4 years. Based on the Company’s historical experience, customers may change the security services and associated hardware and software that they purchase from the Company over the span of the overall relationship. Therefore, the average economic life of the services is shorter than the overall average life of the arrangement.
In addition, and with minimal impact starting in the fiscal year ended February 2, 2018, the Company’s adoption of the standard will result in the Company accelerating the recognition of revenue from its premium installation services, the impact of which will be partially offset by the deferral of revenue related to third-party appliances that will be accounted for as part of a single performance obligation upon adoption of the new standard.
Based on the Company’s assessment and best estimates to date, the Company expects a cumulative adjustment to decrease its January 30, 2016 opening accumulated deficit by approximately $43 million. The Company expects to record non-current contract cost assets related to the deferral of certain sales commission and fulfillment costs of approximately $63 million and $51 million as of February 2, 2018 and February 3, 2017, respectively.
Select consolidated statement of operations line items, which reflect the Company’s best estimate of the impact of the adoption of the standard, are as follows (in thousands):
Fiscal Year Ended | Fiscal Year Ended | |||||||||||||||||||||||
February 2, 2018 | February 3, 2017 | |||||||||||||||||||||||
As Reported ASC 605 | ASC 606 Adjustment (Estimated) | ASC 606 (Estimated) | As Reported ASC 605 | ASC 606 Adjustment (Estimated) | ASC 606 (Estimated) | |||||||||||||||||||
Net Revenue | $ | 467,904 | $ | — | $ | 467,904 | $ | 429,502 | $ | 3,200 | $ | 432,702 | ||||||||||||
Cost of revenue | 226,718 | (1,600 | ) | 225,118 | 212,599 | (110 | ) | 212,489 | ||||||||||||||||
Gross margin | 241,186 | 1,600 | 242,786 | 216,903 | 3,310 | 220,213 | ||||||||||||||||||
Research and development | 80,164 | — | 80,164 | 71,030 | — | 71,030 | ||||||||||||||||||
Sales and marketing | 151,341 | (10,700 | ) | 140,641 | 124,950 | (6,400 | ) | 118,550 | ||||||||||||||||
General and administrative | 92,726 | — | 92,726 | 86,876 | — | 86,876 | ||||||||||||||||||
Total operating expenses | 324,231 | (10,700 | ) | 313,531 | 282,856 | (6,400 | ) | 276,456 | ||||||||||||||||
Operating loss | $ | (83,045 | ) | $ | 12,300 | $ | (70,745 | ) | $ | (65,953 | ) | $ | 9,710 | $ | (56,243 | ) | ||||||||
These amounts include estimates and will remain subject to change as the Company completes its evaluation of the new standard and final calculations of the impact of adoption.
79
SECUREWORKS CORP.
Notes to Consolidated Financial Statements (Continued)
NOTE 3 — NET LOSS PER SHARE
Net loss per share is calculated by dividing net loss for the periods presented by the respective weighted-average number of common shares outstanding, and excludes any dilutive effects of share-based awards, as they would be anti-dilutive. Diluted net loss per common share is computed by giving effect to all potentially dilutive common shares, including common stock issuable upon the exercise of stock options and unvested restricted common stock and restricted stock units. The Company applies the two-class method to calculate earnings per share. Because both classes share the same rights in dividends and earnings, earnings per share (basic and diluted) are the same for both classes. Since losses were incurred in all periods presented, all potential common shares were determined to be anti-dilutive.
The following table sets forth the computation of net loss per common share (in thousands, except per share amounts):
Fiscal Years Ended | ||||||||||||
February 2, 2018 | February 3, 2017 | January 29, 2016 | ||||||||||
Numerator: | ||||||||||||
Net loss | $ | (28,077 | ) | $ | (38,213 | ) | $ | (72,381 | ) | |||
Denominator: | ||||||||||||
Weighted-average number of shares outstanding: | ||||||||||||
Basic and Diluted | 80,280 | 77,635 | 70,000 | |||||||||
Loss per common share: | ||||||||||||
Basic and Diluted | $ | (0.35 | ) | $ | (0.49 | ) | $ | (1.03 | ) | |||
Weighted-average anti-dilutive stock options, non-vested restricted stock and restricted stock units | 5,096 | 3.806 | — | |||||||||
NOTE 4 — GOODWILL AND INTANGIBLE ASSETS
Goodwill relates to the acquisition of Dell by Dell Technologies and represents the excess of the purchase price attributable to Secureworks over the fair value of the assets acquired and liabilities assumed. There were no additions, adjustments or impairments to goodwill during the periods presented. Accordingly, goodwill totaled $416.5 million as of February 2, 2018 and February 3, 2017.
Goodwill and indefinite-lived intangible assets are tested for impairment on an annual basis during the third fiscal quarter, or sooner if an indicator of impairment occurs. The Company completed its annual impairment test by performing a qualitative assessment of goodwill at its sole reporting unit level. In performing this qualitative assessment, the Company evaluated events and circumstances since the date of the last quantitative impairment test, including the results of that test, macroeconomic conditions, industry and market conditions, key financial metrics and overall financial performance of the Company. After assessing the totality of the events and circumstances, the Company determined that it was not more likely than not that the fair value of the Secureworks reporting unit was less than its carrying amount and, therefore, the first and second steps of the quantitative goodwill impairment test were deemed unnecessary. Further, no triggering events have subsequently occurred that would indicate a potential impairment as of February 2, 2018.
80
SECUREWORKS CORP.
Notes to Consolidated Financial Statements (Continued)
Intangible Assets
The Company's intangible assets at February 2, 2018 and February 3, 2017 were as follows:
February 2, 2018 | February 3, 2017 | |||||||||||||||||||||||
Gross | Accumulated Amortization | Net | Gross | Accumulated Amortization | Net | |||||||||||||||||||
(in thousands) | ||||||||||||||||||||||||
Customer relationships | $ | 189,518 | $ | (63,058 | ) | $ | 126,460 | $ | 189,518 | $ | (48,963 | ) | $ | 140,555 | ||||||||||
Technology | 135,584 | (57,978 | ) | 77,606 | 135,584 | (44,336 | ) | 91,248 | ||||||||||||||||
Finite-lived intangible assets | 325,102 | (121,036 | ) | 204,066 | 325,102 | (93,299 | ) | 231,803 | ||||||||||||||||
Trade name | 30,118 | — | 30,118 | 30,118 | — | 30,118 | ||||||||||||||||||
Total intangible assets | $ | 355,220 | $ | (121,036 | ) | $ | 234,184 | $ | 355,220 | $ | (93,299 | ) | $ | 261,921 | ||||||||||
Amortization expense related to finite-lived intangible assets was approximately $27.7 million, $27.7 million and $28.3 million for the fiscal years ended February 2, 2018, February 3, 2017, and January 29, 2016, respectively. Amortization expense is included within cost of revenue and general and administrative expenses in the Consolidated Statement of Operations. There were no impairment charges related to intangible assets during the fiscal years ended February 2, 2018, February 3, 2017 and January 29, 2016.
Estimated future pre-tax amortization expense of finite-lived intangible assets as of February 2, 2018 over the next five years and thereafter is as follows:
Fiscal Years | (in thousands) | ||
2019 | $ | 27,736 | |
2020 | 27,736 | ||
2021 | 27,736 | ||
2022 | 27,736 | ||
2023 | 27,736 | ||
Thereafter | 65,386 | ||
Total | $ | 204,066 | |
NOTE 5 — DEBT
Convertible Debt
On June 30, 2015, the Company entered into an agreement with investors to sell up to $25.0 million in aggregate principal amount of its convertible notes. These investors included members of the Company’s board of directors who were director nominees prior to the date of the IPO. The initial sale of convertible notes was completed on August 3, 2015 in the aggregate principal amount of $22.0 million. On September 14, 2015, the Company sold an additional convertible note in the principal amount of $0.5 million, resulting in an aggregate principal amount of convertible notes outstanding of $22.5 million. As of January 29, 2016, the fair value of the convertible notes was $28.0 million and the Company recorded a $5.5 million change in fair value during the fiscal year ended January 29, 2016. The convertible notes were valued using Level 3 inputs. This change in fair value was included in interest and other, net in the Statements of Operations. These notes remained outstanding until the completion of the IPO, on which date, according to their terms, the convertible notes automatically converted into 2,008,924 shares of the Class A common stock, with a total settlement of $28.1 million and a $0.1 million change in fair value being recorded in the fiscal year ended February 3, 2017 for the period prior to settlement. The converted shares equaled the $22.5 million face value of the convertible notes divided by the conversion price of $11.20 per share, which was equal to 80% of the IPO price of $14.00 per share.
81
SECUREWORKS CORP.
Notes to Consolidated Financial Statements (Continued)
Revolving Credit Facility
On November 2, 2015, SecureWorks, Inc., a wholly-owned subsidiary of SecureWorks Corp., entered into a revolving credit agreement with a wholly-owned subsidiary of Dell Inc. under which the Company obtained a $30 million senior unsecured revolving credit facility. This facility was initially available for a one-year term ending on April 21, 2017. Effective as of March 28, 2017, the term of the facility was extended on the same terms for an additional one-year term ending on April 21, 2018. Under the facility, up to $30 million principal amount of borrowings may be outstanding at any time. The maximum amount of borrowings may be increased by up to an additional $30 million by mutual agreement of the lender and borrower. The proceeds from loans made under the facility may be used for general corporate purposes. The facility is not guaranteed by SecureWorks Corp. or its subsidiaries. There was no outstanding balance under the credit facility as of February 2, 2018.
Each loan made under the revolving credit facility will accrue interest at an annual rate equal to the applicable London interbank offered rate plus 1.60%. Amounts under the facility may be borrowed, repaid and reborrowed from time to time during the term of the facility. The borrower will be required to repay in full all of the loans outstanding, including all accrued interest, and the facility will terminate, upon a change of control of SecureWorks Corp. or following a transaction in which SecureWorks, Inc. ceases to be a direct or indirect wholly-owned subsidiary of SecureWorks Corp. The credit agreement contains customary representations, warranties, covenants and events of default. The unused portion of the facility is subject to a commitment fee of 0.35%, which is due upon expiration of the facility. As of February 2, 2018, the Company had accrued $0.2 million for commitment fees due under the facility.
NOTE 6 — COMMITMENTS AND CONTINGENCIES
Purchase Obligations and Lease Commitments—The Company had various purchase obligations at February 2, 2018 over a period of approximately four years with vendors or contractors, subject to the Company’s operational needs. The Company also leases land, office buildings and equipment under various operating lease agreements. As of February 2, 2018, the purchase obligations and future minimum payments under the Company's operating leases (in thousands) are as follows:
Payments Due For | ||||||||||||||||
Operating | Purchase | Credit Facilities | ||||||||||||||
Fiscal Years Ending | Leases | Obligations | and Other (1) | Total | ||||||||||||
2019 | $ | 5,231 | $ | 3,446 | $ | 2,746 | $ | 11,423 | ||||||||
2020 | 4,727 | 1,397 | 500 | 6,624 | ||||||||||||
2021 | 3,644 | 611 | 500 | 4,755 | ||||||||||||
2022 | 5,349 | — | — | 5,349 | ||||||||||||
2023 | 4,576 | — | — | 4,576 | ||||||||||||
2024 and beyond | 16,117 | — | — | 16,117 | ||||||||||||
Total | $ | 39,644 | $ | 5,454 | $ | 3,746 | $ | 48,844 | ||||||||
(1) | Reflects purchase obligations of annual maintenance services for hardware systems for internal use from a related party. See also “Note 10—Related Party Transactions.” |
Rent expense under all leases totaled $4.7 million, $3.9 million, and $3.0 million during the fiscal years ended February 2, 2018, February 3, 2017, and January 29, 2016, respectively.
Legal Contingencies — From time to time, the Company is involved in claims and legal proceedings that arise in the ordinary course of business. The Company accrues a liability when it believes that it is both probable that a liability has been incurred and that it can reasonably estimate the amount of the loss. The Company reviews the status of legal cases at least quarterly and adjusts its liabilities as necessary to reflect ongoing negotiations, settlements, rulings, advice of legal counsel and other relevant information. Whether the outcome of any claim, suit, assessment, investigation or legal proceeding, individually or collectively, could have a material adverse effect on the Company’s business, financial condition, results of operations or cash flows will depend on a number of factors, including the nature, timing and amount of any associated expenses, amounts paid in settlement, damages or other remedies or consequences. To the extent new information is obtained and the Company’s views on the probable outcomes of claims, suits, assessments, investigations or legal proceedings change, changes in accrued liabilities would be recorded in the period in which such determination is made. As of February 2, 2018, the Company does not believe
82
SECUREWORKS CORP.
Notes to Consolidated Financial Statements (Continued)
that there were any such matters that, individually or in the aggregate, could have a material adverse effect on its business, financial condition, results of operations or cash flows.
Client-based Taxation Contingencies—Various government entities (“taxing authorities”) require the Company to bill its clients for the taxes they owe based on the services they purchase from the Company. The application of the rules of each taxing authority concerning which services are subject to each tax and how those services should be taxed involves the application of judgment. Taxing authorities periodically perform audits to verify compliance and include all periods that remain open under applicable statutes, which generally range from three to four years. These audits could result in significant assessments of past taxes, fines and interest if the Company were found to be non-compliant. During the course of an audit, a taxing authority may question the Company's application of its rules in a manner that, if the Company were not successful in substantiating its position, could result in a significant financial impact to the Company. In the course of preparing its financial statements and disclosures, the Company considers whether information exists that would warrant disclosure or an accrual with respect to such a contingency.
Indemnifications — In the ordinary course of business, the Company enters into contractual arrangements under which it agrees to indemnify its clients from certain losses incurred by the client as to third-party claims relating to the services performed on behalf of the Company or for certain losses incurred by the client as to third-party claims arising from certain events as defined within the particular contract. Such indemnification obligations may not be subject to maximum loss clauses. Historically, payments related to these indemnifications have been immaterial.
Concentrations — The Company sells solutions to clients of all sizes primarily through its direct sales organization, supplemented by sales through channel partners. During the fiscal years ended February 2, 2018, February 3, 2017, and January 29, 2016, the Company did not have any single client that represented 10% or more of its revenue during the fiscal period.
NOTE 7 — STOCK-BASED COMPENSATION AND EMPLOYEE BENEFIT PLAN
In connection with the IPO, the Company's board of directors adopted the SecureWorks Corp. 2016 Long-Term Incentive Plan (the “2016 Plan”). The 2016 Plan became effective on April 18, 2016, and will expire on the tenth anniversary of the effective date unless the 2016 Plan is terminated earlier by the board of directors or in connection with a change in control of SecureWorks Corp. The Company has reserved 8,500,000 shares of Class A common stock for issuance pursuant to awards under the 2016 Plan. The 2016 Plan provides for the grant of options, stock appreciation rights, restricted stock, restricted stock units, deferred stock units, unrestricted stock, dividend equivalent rights, other equity-based awards and cash bonus awards. Awards may be granted under the 2016 Plan to individuals who are employees, officers or non-employee directors of the Company or any of its affiliates, consultants and advisors who perform services for the Company or any of its affiliates, and any other individual whose participation in the 2016 Plan is determined to be in the best interests of the Company by the compensation committee of the board of directors. The Company utilizes both authorized and unissued shares to satisfy all shares issued under the 2016 Plan.
Stock Options
Under the 2016 Plan, the exercise price of each option will be determined by the compensation committee, except that the exercise price may not be less than 100% (or, for incentive stock options to any 10% stockholder, 110%) of the fair market value of a share of Class A common stock on the date on which the option is granted. The term of an option may not exceed ten years (or, for incentive stock options to any 10% stockholder, five years) from the date of grant. The compensation committee will determine the time or times at which each option may be exercised and the period of time, if any, after retirement, death, disability or termination of employment during which options may be exercised. Options may be made exercisable in installments, and the exercisability of options may be accelerated by the compensation committee.
During the fiscal year ended February 2, 2018, no stock options were granted to employees or directors. During the fiscal year ended February 3, 2017, 2,669,788 stock options were granted to employees and 240,715 stock options were granted to directors, in all cases at an exercise price of $14.00. The stock options will vest over an average service period of four years. In addition, during fiscal 2017, 49,916 stock options were granted to a director upon his appointment to the board of directors at an exercise price of $13.99 per share. The stock options subject to this award will vest over a period of three years in equal annual installments.
The Company recognized $3.7 million and $2.9 million in compensation expense for the fiscal years ended February 2, 2018 and February 3, 2017, respectively.
83
SECUREWORKS CORP.
Notes to Consolidated Financial Statements (Continued)
The fair value of stock options are estimated as of the date of the grant using the Black-Scholes option pricing model. This model requires the input of subjective assumptions that will usually have a significant impact on the fair value estimate. The expected term was estimated using the SEC simplified method. The risk-free interest rate is the continuously compounded, term-matching, zero-coupon rate from the valuation date. The volatility is the leverage-adjusted, term-matching, historical volatility of peer firms. The dividend yield assumption is consistent with management expectations of dividend distributions based upon the Company’s business plan at the date of grant.
The assumptions utilized for valuation of options under this model as well as the weighted-average grant date fair value of stock options granted during the fiscal year ended February 3, 2017 are summarized below.
Fiscal Year Ended | ||
February 3, 2017 | ||
Expected life | 6.3 years | |
Risk-free interest rate | 1.68% | |
Volatility | 44.74% | |
Dividend yield | —% | |
Weighted-average grant-date fair value | $6.15 | |
The following table summarizes stock option activity and options outstanding and exercisable for the fiscal year ended, and as of, February 2, 2018:
Number of Options | Weighted- Average Exercise Price Per Share | Weighted- Average Contractual Life (years) | Weighted-Average Grant date Fair Value Per Share | Aggregate Intrinsic Value | ||||||||||||
(in thousands) | ||||||||||||||||
Balance, January 29, 2016 | — | $ | — | |||||||||||||
Granted | 2,960,419 | $ | 14.00 | |||||||||||||
Exercised | — | $ | — | |||||||||||||
Canceled, expired or forfeited | (382,252 | ) | $ | 14.00 | ||||||||||||
Balance, February 3, 2017 | 2,578,167 | $ | 14.00 | |||||||||||||
Granted | — | $ | — | |||||||||||||
Exercised | — | $ | — | |||||||||||||
Canceled, expired or forfeited | (53,065 | ) | $ | 14.00 | ||||||||||||
Balance, February 2, 2018 | 2,525,102 | $ | 14.00 | 8.20 | $ | 6.11 | $ | — | ||||||||
Options expected to vest, February 2, 2018 | 1,827,574 | $ | 14.00 | 8.23 | $ | 6.10 | $ | — | ||||||||
Options exercisable, February 2, 2018 | 614,383 | $ | 14.00 | 8.10 | $ | 6.13 | $ | — | ||||||||
At February 2, 2018, unrecognized stock-based compensation expense related to stock options was $8.3 million, net of estimated forfeitures, which is expected to be recognized over the weighted-average remaining requisite period of 2.56 years.
In connection with the acquisition of Dell by Dell Technologies in 2013, the Company’s compensation programs included grants under the Denali Holding Inc. 2013 Stock Incentive Plan (the "2013 Plan"). Under the 2013 Plan, time-based and performance-based options to purchase shares of the Series C common stock of Dell Technologies were awarded to two of the Company's executive officers. Upon the closing of the Company’s IPO, all unvested time-based awards were forfeited and 32,000 vested time-based stock options remained outstanding and 400,001 performance-based options remained unvested and outstanding subject to award terms. During the fiscal year ended February 2, 2018, there was no vesting or exercise activity on these awards.
84
SECUREWORKS CORP.
Notes to Consolidated Financial Statements (Continued)
As of February 2, 2018, 32,000 time-based and 400,001 performance-based stock options remained outstanding, with 400,001 options unvested. The Company recognized compensation expense related to these awards of $0.3 million, $0.5 million and $0.8 million for the fiscal years ended February 2, 2018, February 3, 2017, and January 29, 2016, respectively.
Restricted Stock and Restricted Stock Units
Under the 2016 Plan, a restricted stock award is an award of shares of Class A common stock that may be subject to restrictions on transferability and other restrictions as the compensation committee determines in its sole discretion on the date of grant. The restrictions, if any, may lapse over a specified period of time or through the satisfaction of conditions, in installments or otherwise as the compensation committee may determine. Unless otherwise provided in an award agreement, a grantee who receives restricted stock will have all of the rights of a stockholder as to those shares, including, without limitation, the right to vote and the right to receive dividends or distributions on the shares of Class A common stock, except that the compensation committee may require any dividends to be withheld and accumulated contingent on vesting of the underlying shares or reinvested in shares of restricted stock.
Under the 2016 Plan, a restricted stock unit represents the grantee’s right to receive a compensation amount, based on the value of the shares of Class A common stock, if vesting criteria or other terms and conditions established by the compensation committee are met. If the vesting criteria or other terms and conditions are met, the Company may settle, subject to the terms and conditions of the applicable award agreement, restricted stock units in cash, shares of Class A common stock or a combination of the two. All award agreements currently outstanding require settlement in shares of Class A common stock.
In connection with the IPO, the Company granted shares of restricted stock and restricted stock units to employees and directors. The fair value of the restricted stock and restricted stock units was $14.00 per share and all will vest over an average service period of four years. During the fiscal years ended February 2, 2018 and February 3, 2017, the Company issued additional restricted stock units to employees at weighted-average fair values per share of $10.40 and $10.90, respectively. Additionally, during the fiscal year ended February 3, 2017, restricted stock units were granted to a director upon his appointment to the board of directors at a fair value of $13.99 per share. The restricted stock and restricted stock units issued during the fiscal year ended February 2, 2018 vest over an average service period of three years and approximately 50% of such awards are subject to performance conditions. Of the 2.3 million restricted stock and restricted stock units outstanding on February 2, 2018, approximately 0.4 million were performance-based awards and 1.9 million were service-based awards. For the fiscal year ended February 2, 2018, approximately 59,000 shares were canceled for the performance-based awards that were tied to fiscal year 2018 results.
The Company recognized compensation expense related to all outstanding restricted stock awards of $9.6 million and $5.4 million for the fiscal years ended February 2, 2018 and February 3, 2017, respectively. At February 2, 2018, unrecognized stock-based compensation expense related to restricted stock awards and restricted stock units was $18.4 million, which is expected to be recognized over the weighted-average remaining requisite period of 2.43 years.
85
SECUREWORKS CORP.
Notes to Consolidated Financial Statements (Continued)
The following table summarizes activity for restricted stock and restricted stock units for the fiscal year ended, and as of, February 2, 2018.
Number of Shares | Weighted- Average Grant Date Fair Value Per Share | Weighted- Average Contractual Life (years) | Aggregate Intrinsic Value | |||||||||
(in thousands) | ||||||||||||
Balance, January 29, 2016 | — | $ | — | |||||||||
Granted | 2,460,594 | $ | 13.28 | |||||||||
Vested | (2,143 | ) | $ | 14.00 | ||||||||
Forfeited | (215,965 | ) | $ | 14.00 | ||||||||
Balance, February 3, 2017 | 2,242,486 | $ | 13.21 | |||||||||
Granted | 1,134,966 | $ | 10.40 | |||||||||
Vested | (507,196 | ) | $ | 13.62 | ||||||||
Forfeited | (550,697 | ) | $ | 11.46 | ||||||||
Balance, February 2, 2018 | 2,319,559 | $ | 12.16 | 1.31 | $ | 21,897 | ||||||
Restricted stock and restricted stock units expected to vest, February 2, 2018 | 2,118,854 | $ | 12.21 | 1.43 | $ | 20,002 | ||||||
As of February 2, 2018, restricted stock and restricted stock units representing 2.3 million shares of Secureworks’ Class A common stock were outstanding, with an aggregate intrinsic value of $21.9 million based on Secureworks’ closing stock price as of February 2, 2018. The total fair value of Secureworks' restricted stock and restricted stock units that vested during year-ended February 2, 2018 was $6.9 million and the intrinsic value was $4.6 million.
Stock-based Compensation Expense
The following table summarizes the classification of stock-based compensation expense related to stock options, restricted stock and restricted stock units for the fiscal years ended February 2, 2018, February 3, 2017 and January 29, 2016. Stock-based compensation expense for the periods prior to the fiscal year ended February 3, 2017 related solely to grants under the Denali Holding Inc. 2013 Stock Incentive Plan awarded to two of the Company’s executive officers.
Fiscal Years Ended | ||||||||||||
February 2, 2018 | February 3, 2017 | January 29, 2016 | ||||||||||
(in thousands) | ||||||||||||
Cost of revenue | $ | 891 | $ | 462 | $ | — | ||||||
Research and development | 3,261 | 2,033 | 277 | |||||||||
Sales and marketing | 735 | 1,068 | — | |||||||||
General and administrative | 8,903 | 5,320 | 564 | |||||||||
Total stock-based compensation expense | $ | 13,790 | $ | 8,883 | $ | 841 | ||||||
The tax benefit related to stock-based compensation expense was $3.3 million, $3.4 million, and $0.3 million for the fiscal years ended February 2, 2018, February 3, 2017, and January 29, 2016 respectively.
Long-term Performance Cash Awards
In March 2017, the Company began granting long-term performance cash awards to certain employees. The employees who receive the performance cash awards do not receive equity awards as part of the long-term incentive program. The long-term performance cash awards are subject to various performance conditions and vest in equal annual installments over a three-year period. During the fiscal year ended February 2, 2018, the Company granted approximately $11.6 million of these awards and recognized $2.9 million of related compensation expense.
86
SECUREWORKS CORP.
Notes to Consolidated Financial Statements (Continued)
Employee Benefit Plan
Substantially all employees are eligible to participate in a defined contribution plan that complies with Section 401(k) of the Internal Revenue Code (“401(k) Plan”). The Company matches 100% of each participant’s voluntary contributions, subject to a maximum contribution of 5% of the participant’s compensation, and participants vest immediately in all contributions to the 401(k) Plan. For the fiscal years ended February 2, 2018, February 3, 2017, and January 29, 2016, total expense under this plan was $10.7 million, $9.4 million, and $6.7 million, respectively.
NOTE 8 — INCOME AND OTHER TAXES
The Company’s effective income tax rate for the fiscal years ended February 2, 2018, February 3, 2017, and January 29, 2016 was as follows:
Fiscal Years Ended | ||||||||||||
February 2, 2018 | February 3, 2017 | January 29, 2016 | ||||||||||
Loss before income taxes | $ | (85,780 | ) | $ | (63,477 | ) | $ | (112,577 | ) | |||
Income tax benefit | $ | (57,703 | ) | $ | (25,264 | ) | $ | (40,196 | ) | |||
Effective tax rate | 67.3 | % | 39.8 | % | 35.7 | % | ||||||
The change in the Company's effective income tax rate for the fiscal year ended February 2, 2018 over the effective income tax rate for the fiscal year ended February 3, 2017 was primarily driven by the one-time provisional impacts from the U.S. Tax Cuts and Jobs Act (“U.S. Tax Reform” or the “Act”) that was enacted in December 2017. Among other provisions, U.S. Tax Reform lowers the U.S. corporate income tax rate to 21% from 35%. GAAP requires the effect of a change in tax laws to be recognized in the period that includes the enactment date. Due to the complexities involved in accounting for the enactment of U.S. Tax Reform, SEC Staff Accounting Bulletin No. 118 (“SAB 118”) allows companies to record provisional amounts in earnings for the first year following the Act's enactment, with those provisional amounts required to be finalized by the end of that year. In accordance with GAAP, and SAB 118, the Company recognized a provisional tax benefit in the fourth quarter of the fiscal year ended February 2, 2018 of $27.0 million related to U.S. Tax Reform, primarily attributable to the remeasurement of deferred tax assets and liabilities. The Company’s provisional amounts are based on its initial analysis using available information and estimates, and may be adjusted in accordance with SAB 118. The change in the Company's effective income tax rate for the fiscal year ended February 3, 2017 over the effective income tax rate for the fiscal year ended January 29, 2016 was primarily attributable to the recognition of tax benefits relating to research and development tax credits during the fiscal year ended February 3, 2017.
During the periods presented in the accompanying Consolidated Financial Statements, Secureworks did not file separate federal tax returns, as the Company generally was included in the tax grouping of other Dell entities within the respective entity’s tax jurisdiction. The income tax benefit has been calculated using the separate return method modified to apply the benefits-for-loss approach. Under the benefits-for-loss approach, net operating losses or other tax attributes are characterized as realized by Secureworks when those attributes are utilized by other members of the Dell consolidated group.
87
SECUREWORKS CORP.
Notes to Consolidated Financial Statements (Continued)
A reconciliation of the Company's income tax provision to the statutory U.S. federal tax rate is as follows:
Fiscal Year Ended | ||||||||
February 2, 2018 | February 3, 2017 | January 29, 2016 | ||||||
U.S. federal statutory rate | 33.7 | % | 35.0 | % | 35.0 | % | ||
Foreign income taxed at different rates | 0.4 | (0.3 | ) | (0.9 | ) | |||
State income taxes, net of federal tax benefit | 2.2 | 3.2 | 1.9 | |||||
Research and development credits | 1.8 | 3.1 | 0.5 | |||||
Nondeductible/nontaxable items | (1.8 | ) | (1.2 | ) | (0.8 | ) | ||
U.S. Tax Reform | 31.5 | — | — | |||||
Stock-based compensation | (0.5 | ) | — | — | ||||
Total | 67.3 | % | 39.8 | % | 35.7 | % | ||
The benefit for income taxes consists of the following:
Fiscal Years Ended | |||||||||||
February 2, 2018 | February 3, 2017 | January 29, 2016 | |||||||||
(in thousands) | |||||||||||
Current: | |||||||||||
Federal | $ | (20,288 | ) | $ | (22,470 | ) | $ | (12,519 | ) | ||
State/Local | (886 | ) | 657 | (1,517 | ) | ||||||
Foreign | 80 | 1,379 | (1,366 | ) | |||||||
Current | (21,094 | ) | (20,434 | ) | (15,402 | ) | |||||
Deferred: | |||||||||||
Federal | (37,191 | ) | (3,620 | ) | (24,472 | ) | |||||
State/Local | (141 | ) | (471 | ) | 330 | ||||||
Foreign | 723 | (739 | ) | (652 | ) | ||||||
Deferred | (36,609 | ) | (4,830 | ) | (24,794 | ) | |||||
Income tax benefit | $ | (57,703 | ) | $ | (25,264 | ) | $ | (40,196 | ) | ||
Loss before provision for income taxes consists of the following:
Fiscal Years Ended | |||||||||||
February 2, 2018 | February 3, 2017 | January 29, 2016 | |||||||||
(in thousands) | |||||||||||
Domestic | $ | (88,546 | ) | $ | (64,542 | ) | $ | (103,061 | ) | ||
Foreign | 2,766 | 1,065 | (9,516 | ) | |||||||
Loss before income taxes | $ | (85,780 | ) | $ | (63,477 | ) | $ | (112,577 | ) | ||
88
SECUREWORKS CORP.
Notes to Consolidated Financial Statements (Continued)
The components of the Company's net deferred tax balances are as follows:
February 2, 2018 | February 3, 2017 | ||||||
(in thousands) | |||||||
Deferred tax assets: | |||||||
Deferred revenue | $ | 3,441 | $ | 6,232 | |||
Provision for doubtful accounts | 1,883 | 2,377 | |||||
Loss carryforwards | 3,966 | 2,806 | |||||
Stock-based and deferred compensation | 5,701 | 9,568 | |||||
Other | 2,803 | — | |||||
Deferred tax assets | 17,794 | 20,983 | |||||
Valuation allowance | (3,966 | ) | (2,806 | ) | |||
Deferred tax assets, net of valuation allowance | 13,828 | 18,177 | |||||
Deferred tax liabilities: | |||||||
Property and equipment | (1,347 | ) | (1,367 | ) | |||
Purchased intangible assets | (56,590 | ) | (97,836 | ) | |||
Operating and compensation related accruals | (3,777 | ) | (3,933 | ) | |||
Other | (14 | ) | (29 | ) | |||
Deferred tax liabilities | (61,728 | ) | (103,165 | ) | |||
Net deferred tax liabilities | $ | (47,900 | ) | $ | (84,988 | ) | |
Net deferred tax balances are included in other non-current assets and other non-current liabilities in the Consolidated Statements of Financial Position.
As of February 2, 2018 and February 3, 2017, Secureworks had $4.0 million and $2.8 million of deferred tax assets, respectively, related to net operating loss carryforwards for state tax returns that are not included with those of other Dell entities. These net operating loss carryforwards began expiring in the fiscal year ended February 2, 2018. Due to the uncertainty surrounding the realization of these net operating loss carryforwards, the Company has provided valuation allowances for the full amount as of February 2, 2018 and February 3, 2017. Because the Company is included in the tax filings of certain other Dell entities, management has determined that it will be able to realize the remainder of its deferred tax assets. If the Company’s tax provision had been prepared using the separate return method, the unaudited pro forma pre-tax loss, tax benefit and net loss for the fiscal year ended February 2, 2018 would have been $85.8 million, $42.4 million and $43.4 million, respectively, as a result of the recognition of a valuation allowance that would be recorded on certain deferred tax assets.
As of February 2, 2018, the Company has cumulative undistributed foreign earnings that would incur some amount of local withholding and state taxes if the earnings are distributed back to the United States. U.S. Tax Reform fundamentally changes the U.S. approach to taxation of foreign earnings and the Company is currently still evaluating its intentions with respect to the indefinite reinvestment of its foreign earnings. The Company had $0.8 million of unrecognized tax benefits as of February 2, 2018 and $0.6 million unrecognized tax benefits as of February 3, 2017. The Company is no longer subject to tax examinations for years prior to fiscal 2012.
89
SECUREWORKS CORP.
Notes to Consolidated Financial Statements (Continued)
NOTE 9 — SELECTED FINANCIAL INFORMATION
The following table provides information on amounts included in accounts receivable, net, other current assets, property and equipment, net, accrued and other current liabilities, and other non-current liabilities as of February 2, 2018 and February 3, 2017.
Consolidated | ||||||||||
February 2, 2018 | February 3, 2017 | |||||||||
(in thousands) | ||||||||||
Accounts receivable, net: | ||||||||||
Gross accounts receivable | $ | 166,010 | $ | 119,678 | ||||||
Allowance for doubtful accounts | (8,246 | ) | (6,132 | ) | ||||||
Total | $ | 157,764 | $ | 113,546 | ||||||
Other current assets: | ||||||||||
Income tax receivable | 21,380 | 25,091 | ||||||||
Prepaid maintenance and support agreements | 11,826 | 11,910 | ||||||||
Prepaid other | 8,957 | 10,749 | ||||||||
Total | $ | 42,163 | $ | 47,750 | ||||||
Property and equipment, net | ||||||||||
Computer equipment | $ | 59,754 | $ | 47,407 | ||||||
Leasehold improvements | 19,634 | 16,986 | ||||||||
Other equipment | 2,079 | 1,358 | ||||||||
Total property and equipment | 81,467 | 65,751 | ||||||||
Accumulated depreciation and amortization | $ | (48,010 | ) | $ | (34,598 | ) | ||||
Total | $ | 33,457 | $ | 31,153 | ||||||
Other noncurrent assets | ||||||||||
Prepaid maintenance agreements | 956 | 2,304 | ||||||||
Deferred tax asset | 832 | 1,503 | ||||||||
Other | 2,889 | 1,897 | ||||||||
Total | $ | 4,677 | $ | 5,704 | ||||||
Accrued and other current liabilities | ||||||||||
Compensation | $ | 46,046 | $ | 36,803 | ||||||
Intercompany payable, net | 19,580 | 9,052 | ||||||||
Other | 15,999 | 13,849 | ||||||||
Total | $ | 81,625 | $ | 59,704 | ||||||
Other non-current liabilities | ||||||||||
Deferred tax liabilities | $ | 48,732 | $ | 86,491 | ||||||
Intercompany payable, net | — | 1,100 | ||||||||
Other | 3,949 | 1,801 | ||||||||
Total | $ | 52,681 | $ | 89,392 | ||||||
The allocation between domestic and foreign net revenue is based on the location of the Company’s clients. Net revenue and long-lived assets from any single foreign country did not constitute 10% or more of the Company’s net revenue or long-lived assets, respectively, during any of the periods presented.
90
SECUREWORKS CORP.
Notes to Consolidated Financial Statements (Continued)
The following tables present net revenue and property, plant and equipment allocated between the United States and foreign countries:
Fiscal Year Ended | ||||||||||||||
February 2, 2018 | February 3, 2017 | January 29, 2016 | ||||||||||||
Net revenue | ||||||||||||||
United States | $ | 391,133 | $ | 374,254 | $ | 298,984 | ||||||||
Foreign Countries | 76,771 | 55,248 | 40,538 | |||||||||||
Total | $ | 467,904 | $ | 429,502 | $ | 339,522 | ||||||||
February 2, 2018 | February 3, 2017 | |||||||||
Property and equipment, net | ||||||||||
United States | $ | 28,587 | $ | 26,916 | ||||||
Foreign Countries | 4,870 | 4,237 | ||||||||
Total | $ | 33,457 | $ | 31,153 | ||||||
NOTE 10 — RELATED PARTY TRANSACTIONS
Allocated Expenses
For the periods presented, Dell has provided various corporate services to Secureworks in the ordinary course of business, including finance, tax, human resources, legal, insurance, IT, procurement and facilities-related services. Dell also has provided Secureworks with the services of a number of its executives and employees. For the first two quarters of the fiscal year ended January 29, 2016, the costs of such services were allocated of total net sales, relative percentage of headcount or specific identification. Beginning in the third quarter of the fiscal year ended January 29, 2016, the costs of services provided to Secureworks by Dell were governed by a shared services agreement between Secureworks and Dell Inc. or its wholly-owned subsidiaries. The total amount of the charges under the shared services agreement with Dell was $4.9 million and $4.4 million for the fiscal years ended February 2, 2018 and February 3, 2017, respectively. The total amount of the allocations from Dell and charges under the shared services agreement was $5.5 million and $3.0 million, respectively, in the fiscal year ended January 29, 2016. The amount for fiscal 2016 included $2.2 million of fees for professional services directly related to a prior legal proceeding that was settled during that fiscal year. These cost allocations are reflected primarily within general and administrative expenses in the Consolidated Statements of Operations. Management believes that the basis on which the expenses have been allocated to be a reasonable reflection of the utilization of services provided to or the benefit received by the Company during the periods presented.
The Company's historical financial statements do not purport to reflect what the Company's results of operations, financial position, equity or cash flows would have been if the Company had operated as a stand-alone public company during the periods presented.
Related Party Arrangements
For the periods presented, related party transactions and activities involving Dell Inc. and its wholly-owned subsidiaries were not always consummated on terms equivalent to those that would prevail in an arm’s-length transaction where conditions of competitive, free-market dealing may exist.
The Company purchases certain enterprise hardware systems from Dell Inc. and its wholly-owned subsidiaries in order to provide security solutions to the Company’s clients. For the first two quarters of the fiscal year ended January 29, 2016, the expenses associated with these transactions reflect Dell’s costs and are included in cost of revenue in the Consolidated Statements of Operations. Beginning in the third quarter of the fiscal year ended January 29, 2016, expenses associated with these transactions are intended to approximate arm’s-length pricing pursuant to the Company’s amended and restated master commercial customer agreement with a subsidiary of Dell Inc. that went into effect on August 1, 2015. The Company did not make any direct purchases of systems from Dell for the fiscal year ended February 2, 2018. Purchases of systems from Dell totaled $3.0 million and $11.6 million for the fiscal years ended February 3, 2017 and January 29, 2016, respectively.
91
SECUREWORKS CORP.
Notes to Consolidated Financial Statements (Continued)
The Company also purchases computer equipment for internal use from Dell that was capitalized within property and equipment in the Consolidated Statements of Financial Position. For the first two quarters of the fiscal year ended January 29, 2016, these purchases were made at Dell’s cost. Beginning in the third quarter of the fiscal year ended January 29, 2016, these purchases were made at pricing that is intended to approximate arm’s-length pricing. Purchases of computer equipment from Dell totaled $2.6 million, $3.6 million, and $3.7 million for the fiscal years ended February 2, 2018, February 3, 2017, and January 29, 2016, respectively.
On September 7, 2016, EMC Corporation (“EMC”), a company that provides enterprise software and storage, became a wholly-owned subsidiary of Dell Technologies. EMC maintains a majority ownership interest in a subsidiary, VMware, Inc. (“VMware”), a company that provides cloud and virtualization software and services. The Company's purchases of annual maintenance services, software licenses and hardware systems for internal use from EMC and VMware totaled $0.9 million for the fiscal year ended February 2, 2018 and $4.4 million for the fiscal year ended February 3, 2017. Approximately $3.0 million of these purchases from VMware was financed through Dell Financial Services and are included in intercompany liabilities as of February 3, 2017.
The Company recognized revenue related to security solutions provided to other subsidiaries of Dell Technologies, consisting of RSA Security LLC and Pivotal Software, Inc. The revenue recognized by the Company for security solutions provided to these entities totaled $0.2 million for the fiscal year ended February 2, 2018. The Company had no related party revenue from solutions provided to these entities for the fiscal years ended February 3, 2017 and January 29, 2016. Purchases by the Company from these other subsidiaries totaled $0.1 million during the fiscal year ended February 2, 2018. The Company had no purchases from these related parties during the fiscal years ended February 3, 2017 and January 29, 2016.
The Company recognized revenue related to solutions provided to principal stockholders of Dell Technologies consisting of Michael S. Dell, Chairman and Chief Executive Officer of Dell Technologies and Dell Inc., the Susan Lieberman Dell Separate Property Trust (a separate property trust for the benefit of Mr. Dell’s wife) and MSD Capital, L.P. (a firm founded for the purposes of managing investments of Mr. Dell and his family). The revenues recognized by the Company from solutions provided to Mr. Dell, the Susan Lieberman Dell Separate Property Trust and MSD Capital totaled $0.1 million, $0.1 million, and $0.3 million for the fiscal years ended February 2, 2018, February 3, 2017 and January 29, 2016, respectively.
The Company provides solutions to certain clients whose legal contractual relationship has historically been with Dell rather than Secureworks, although the Company is the primary obligor and carries credit and inventory risk in these arrangements. Effective on August 1, 2015, upon the creation of new subsidiaries to segregate some of the Company’s operations from Dell’s operations, as described in “Note 1—Description of the Business and Basis of Presentation,” many of such client contracts were transferred from Dell to the Company, forming a direct legal contractual relationship between the Company and the end client. For clients whose contracts have not yet been transferred, the Company recognized revenues of approximately $44.7 million and $39.0 million for the fiscal years ended February 2, 2018 and February 3, 2017, respectively. The Company recognized revenue of approximately $16.7 million for the period from August 1, 2015 to January 29, 2016 for clients whose contracts have not yet transferred from Dell to the Company.
As the Company’s client and on behalf of certain of its own clients, Dell also purchases solutions from the Company. Beginning in the third quarter of the fiscal year ended January 29, 2016, in connection with the effective date of the Company’s commercial agreements with Dell, the Company began charging Dell for these services at pricing that is intended to approximate arm’s-length pricing, in lieu of the prior cost recovery arrangement. Such revenues totaled approximately $21.1 million, $22.0 million and $7.5 million for the fiscal years ended February 2, 2018, February 3, 2017, and January 29, 2016 respectively.
As a result of the foregoing related party arrangements beginning in the third quarter of the fiscal year ended January 29, 2016, the Company has recorded the following related party balances in the Consolidated Statement of Financial Position as of February 2, 2018 and February 3, 2017. During the third quarter of the fiscal year ended February 3, 2017, the Company began settling in cash its related party balances with Dell, which resulted in a net intercompany payable.
92
SECUREWORKS CORP.
Notes to Consolidated Financial Statements (Continued)
February 2, 2018 | February 3, 2017 | ||||||
(in thousands) | |||||||
Intercompany receivable | $ | — | $ | 1,680 | |||
Intercompany payable | (19,580 | ) | (11,832 | ) | |||
Net intercompany payable (in accrued and other) | $ | (19,580 | ) | $ | (10,152 | ) | |
Accounts receivable from clients under reseller agreements with Dell (in accounts receivable, net) | $ | 25,229 | $ | 16,658 | |||
Net operating loss tax sharing receivable under agreement with Dell (in other current assets at February 2, 2018 and other non-current liabilities at February 3, 2017) | $ | 21,380 | $ | 25,091 | |||
Cash Management
Dell utilizes a centralized approach to cash management and financing of its operations. For the period presented prior to August 1, 2015, Dell funded the Company’s operating and investing activities as needed and transferred the Company’s excess cash at its discretion. This arrangement is not reflective of the manner in which the Company would have been able to finance the Company’s operations had the Company been a stand-alone business separate from Dell prior to August 1, 2015. Cash transfers to and from Dell’s cash management accounts prior to August 1, 2015 are reflected within additional paid in capital in the Consolidated Statements of Financial Position and the Consolidated Statements of Cash Flows as a financing activity.
NOTE 11 — UNAUDITED QUARTERLY RESULTS OF OPERATIONS
The following table presents selected unaudited Statements of Operations for each quarter of fiscal 2018 and fiscal 2017:
Fiscal Year 2018 | |||||||||||||||||
First | Second | Third | Fourth | ||||||||||||||
Quarter | Quarter | Quarter | Quarter | ||||||||||||||
Net revenue | $ | 113,593 | $ | 116,123 | $ | 117,534 | $ | 120,654 | |||||||||
Gross margin | $ | 59,651 | $ | 59,798 | $ | 61,808 | $ | 59,929 | |||||||||
Net (loss) income | $ | (14,236 | ) | $ | (12,118 | ) | $ | (11,601 | ) | $ | 9,878 | ||||||
Net (loss) income per common share (basic and diluted) (1) | $ | (0.18 | ) | $ | (0.15 | ) | $ | (0.14 | ) | $ | 0.12 | ||||||
Weighted-average common shares outstanding (basic) | 80,056 | 80,353 | 80,355 | 80,357 | |||||||||||||
Weighted-average common shares outstanding (diluted) | N/A | N/A | N/A | 80,528 | |||||||||||||
(1) Basic and diluted net loss per common share are computed independently for each of the quarters presented. Therefore, the sum of the quarterly basic and diluted net loss per common share amounts may not equal the annual basic and diluted net loss per common share amounts.
Fiscal Year 2017 | |||||||||||||||||
First | Second | Third | Fourth | ||||||||||||||
Quarter | Quarter | Quarter | Quarter | ||||||||||||||
Net revenue | $ | 99,793 | $ | 103,653 | $ | 107,108 | $ | 118,948 | |||||||||
Gross margin | $ | 49,944 | $ | 50,746 | $ | 53,471 | $ | 62,742 | |||||||||
Net loss | $ | (11,627 | ) | $ | (12,051 | ) | $ | (7,718 | ) | $ | (6,817 | ) | |||||
Net loss per common share (basic and diluted) (1) | $ | (0.17 | ) | $ | (0.15 | ) | $ | (0.10 | ) | $ | (0.09 | ) | |||||
Weighted-average common shares outstanding (basic and diluted) | 70,330 | 80,009 | 80,009 | 80,009 | |||||||||||||
(1) Basic and diluted net loss per common share are computed independently for each of the quarters presented. Therefore, the sum of the quarterly basic and diluted net loss per common share amounts may not equal the annual basic and diluted net loss per common share amounts.
93
SECUREWORKS CORP.
Notes to Consolidated Financial Statements (Continued)
NOTE 12 — SUBSEQUENT EVENTS
Effective as of March 28, 2017, SecureWorks, Inc., our wholly-owned subsidiary, extended a revolving credit agreement with a wholly-owned subsidiary of Dell Inc. under which we have a $30 million senior unsecured revolving credit facility. This facility was set to expire on April 21, 2018. Effective as of March 27, 2018, subsequent to the end of fiscal 2018, the revolving credit agreement was amended and restated to extend the maturity date to March 27, 2019 and to reduce the annual rate at which interest accrues from the applicable London interbank offered rate plus 1.60% to such rate plus 1.15%. The amended and restated revolving credit agreement otherwise has terms substantially similar to those of the facility before the amendment and restatement.
94
SCHEDULE II - VALUATION AND QUALIFYING ACCOUNTS
Valuation and Qualifying Accounts
Balance at | Charged to | Balance at | ||||||||||||||||
Beginning | Income | Charged to | End of | |||||||||||||||
Fiscal Year | Description | of Period | Statement | Allowance | Period | |||||||||||||
Trade Receivables: | ||||||||||||||||||
2018 | Allowance for doubtful accounts | $ | 6,132 | $ | 3,947 | $ | (1,833 | ) | $ | 8,246 | ||||||||
2017 | Allowance for doubtful accounts | $ | 4,484 | $ | 2,613 | $ | (965 | ) | $ | 6,132 | ||||||||
2016 | Allowance for doubtful accounts | $ | 1,059 | $ | 4,661 | $ | (1,236 | ) | $ | 4,484 | ||||||||
95
Item 9. Changes in and Disagreements With Accountants on Accounting and Financial Disclosure
None
Item 9A. Controls and Procedures
Evaluation of Disclosure Controls and Procedures
Disclosure controls and procedures (as defined in Rules 13a-15(e) and 15d-15(e) under the Exchange Act) are designed to ensure that information required to be disclosed in reports filed or submitted under the Exchange Act is recorded, processed, summarized and reported within the time periods specified in SEC rules and forms and that such information is accumulated and communicated to management, including the chief executive officer and the chief financial officer, to allow timely decisions regarding required disclosures.
In connection with the preparation of this report, our management, under the supervision and with the participation of our Chief Executive Officer and Chief Financial Officer, conducted an evaluation of the effectiveness of the design and operation of our disclosure controls and procedures as of February 2, 2018. Based on that evaluation, our management has concluded that our disclosure controls and procedures were effective as of February 2, 2018.
Management's Report on Internal Control Over Financial Reporting
Management, under the supervision of the Chief Executive Officer and the Chief Financial Officer, is responsible for establishing and maintaining adequate internal control over financial reporting. Internal control over financial reporting (as defined in Rules 13a-15(f) and 15d(f) under the Exchange Act) is a process designed to provide reasonable assurance regarding the reliability of financial reporting and the preparation of financial statements for external purposes in accordance with generally accepted accounting principles. Internal control over financial reporting includes those policies and procedures which (a) pertain to the maintenance of records that, in reasonable detail, accurately and fairly reflect the transactions and dispositions of assets, (b) provide reasonable assurance that transactions are recorded as necessary to permit preparation of financial statements in accordance with generally accepted accounting principles, (c) provide reasonable assurance that receipts and expenditures are being made only in accordance with appropriate authorization of management and the board of directors, and (d) provide reasonable assurance regarding prevention or timely detection of unauthorized acquisition, use, or disposition of assets that could have a material effect on the financial statements.
In connection with the preparation of this report, our management, under the supervision and with the participation of our Chief Executive Officer and Chief Financial Officer, conducted an evaluation of the effectiveness of our internal control over financial reporting as of February 2, 2018, based on the criteria established in Internal Control — Integrated Framework (2013) issued by the Committee of Sponsoring Organizations of the Treadway Commission. As a result of that evaluation, management has concluded that our internal control over financial reporting was effective as of February 2, 2018.
Changes in Internal Control Over Financial Reporting
During fiscal 2018, we completed the migration of our accounting and financial reporting systems to a new enterprise resource planning (or “ERP”) system. The ERP system implementation impacts various internal processes and controls for business activities within accounting and also impacts our financial reporting. While we believe that this new system and the related changes to internal controls ultimately will strengthen our internal control over financial reporting, there are inherent risks in implementing any ERP system.
Except for our implementation of the ERP system as described above, there were no changes in our internal control over financial reporting identified in connection with the evaluation required by Rules 13a 15(e) and 15d 15(e) under the Exchange Act that occurred during the quarter ended February 2, 2018 that have materially affected, or are reasonably likely to materially affect, our internal control over financial reporting. We have modified and will continue to modify our internal controls relating to our business and financial processes throughout the entire ERP system implementation period.
96
Item 9B. Other Information
Effective as of March 28, 2017, SecureWorks, Inc., our wholly-owned subsidiary, extended a revolving credit agreement with a wholly-owned subsidiary of Dell Inc. under which we have a $30 million senior unsecured revolving credit facility. This facility was set to expire on April 21, 2018. Effective as of March 27, 2018, subsequent to the end of fiscal 2018, the revolving credit agreement was amended and restated to extend the maturity date to March 27, 2019 and to reduce the annual rate at which interest accrues from the applicable London interbank offered rate plus 1.60% to such rate plus 1.15%. The amended and restated revolving credit agreement otherwise has terms substantially similar to those of the facility before the amendment and restatement. The credit facility and the recent amendment and restatement to the credit facility to extend the term are described under “Notes to Consolidated Financial Statements—Note 5—Debt” and “Notes to Consolidated Financial Statements—Note 12—Subsequent Event” in our consolidated financial statements included in this annual report on Form 10-K.
97
Part III
Item 10. Directors, Executive Officers and Corporate Governance
We have adopted a code of ethics applicable to our principal executive officer and other senior financial officers. The code of ethics, which we refer to as our Code of Ethics for Senior Financial Officers, is available on the Investors page of our website at www.secureworks.com. To the extent required by SEC rules, we intend to disclose any amendments to this code and any waiver of a provision of the code for the benefit of any senior financial officer on our website within any period that may be required under SEC rules from time to time.
See “Part I — Item 1 — Business — Executive Officers of Secureworks” for information about our executive officers, which is incorporated by reference in this Item 10. Other information required by this Item 10 is incorporated herein by reference to our definitive proxy statement for our 2018 annual meeting of stockholders, referred to as the “2018 proxy statement,” which we will file with the SEC on or before 120 days after our 2018 fiscal year end, and which will appear in the 2018 proxy statement under the captions “Proposal 1 — Election of Directors” and “Additional Information — Section 16(a) Beneficial Ownership Reporting Compliance.”
The following lists the members of our board of directors and the principal occupation of each director as of the date of this report.
Michael R. Cote President and Chief Executive Officer SecureWorks Corp. | Mark J. Hawkins President and Chief Financial Officer Salesforce.com, Inc. |
Michael S. Dell Chairman and Chief Executive Officer Dell Technologies Inc. | William R. McDermott Chief Executive Officer SAP SE |
Egon Durban Managing Partner Silver Lake Partners | Yagyensh C. (Buno) Pati Partner Centerview Capital Technology |
Pamela Daley Retired Senior Vice President and Senior Advisor to the Chairman of General Electric Company | James M. Whitehurst President and Chief Executive Officer Red Hat, Inc. |
Item 11. Executive Compensation
Information required by this Item 11 is incorporated herein by reference to the 2018 proxy statement, including the information in the 2018 proxy statement appearing under the captions “Proposal 1 — Election of Directors — Director Compensation” and “Executive Compensation.”
Item 12. Security Ownership of Certain Beneficial Owners and Management and Related Stockholder Matters
Information required by this Item 12 is incorporated herein by reference to the 2018 proxy statement, including the information in the 2018 proxy statement appearing under the captions “Stock Ownership” and “Executive Compensation — Equity Compensation Plans.”
98
Item 13. Certain Relationships and Related Transactions, and Director Independence
Information required by this Item 13 is incorporated herein by reference to the 2018 proxy statement, including the information in the 2018 proxy statement appearing under the captions “Proposal 1—Election of Directors” and “Additional Information— Certain Relationships and Related Transactions.”
Item 14. Principal Accounting Fees and Services
Information required by this Item 14 is incorporated herein by reference to the 2018 proxy statement, including the information in the 2018 proxy statement appearing under the caption “Proposal 3 — Ratification of Appointment of Independent Registered Public Accounting Firm.”
99
Part IV
Item 15. Exhibits, Financial Schedules
The following documents are filed as a part of this annual report on Form 10-K:
(1) | Financial Statements: The following financial statements are filed as a part of this report under “Part II — Item 8 Financial Statements and Supplementary Data”: |
Report of Independent Registered Public Accounting Firm | |
Consolidated Statements of Financial Position as of February 2, 2018 and February 3, 2017 | |
Consolidated Statements of Operations for the fiscal years ended February 2, 2018, February 3, 2017, and January 29, 2016 | |
Consolidated Statements of Comprehensive Loss for the fiscal years ended February 2, 2018, February 3, 2017, and January 29, 2016 | |
Consolidated Statements of Cash Flows for the fiscal years ended February 2, 2018, February 3, 2017, and January 29, 2016 | |
Consolidated Statements of Stockholder's Equity for the fiscal years ended February 2, 2018, February 3, 2017, and January 29, 2016 | |
Notes to Consolidated Financial Statements | |
Schedule II - Valuation and Qualifying Accounts | |
(2) | Financial Statement Schedules: The following financial statement schedule is included following the Notes to the Consolidated Financial Statements under “Part II — Item 8 — Financial Statements and Supplementary Data”: |
Schedule II — Valuation and Qualifying Accounts
(3) | Exhibits: |
EXHIBIT INDEX | ||
Exhibit No. | Description | |
3.1 | ||
3.2 | ||
4.1 | ||
10.1 | ||
10.1.1 | ||
10.1.2†† | ||
10.2 | ||
10.3 | ||
10.4 | ||
100
EXHIBIT INDEX - Continued | ||
Exhibit No. | Description | |
10.5 | ||
10.5.1 | ||
10.6 | ||
10.7† | ||
10.8 | ||
10.8.1††+ | ||
10.9† | ||
10.10† | ||
10.11 | ||
10.12 | ||
10.13.1 | ||
10.13.2 | ||
10.14 | ||
10.15 | ||
10.16 | ||
10.17 | ||
10.18 | ||
10.19* | ||
10.20* | ||
101
EXHIBIT INDEX - Continued | ||
Exhibit No. | Description | |
10.21* | ||
10.22* | ||
10.23* | ||
10.24* | ||
10.25* | ||
10.26* | ||
10.27* | ||
10.28* | ||
10.29* | ||
10.30* | ||
10.31* | ||
10.32* | ||
10.33* | ||
21.1†† | ||
23.1†† | ||
31.1†† | ||
31.2†† | ||
32.1††† | ||
101 .INS†† | ||
101 .SCH†† | ||
101 .CAL†† | ||
101 .DEF†† | ||
101 .LAB†† | ||
101 .PRE†† | ||
† | Certain portions of this exhibit have been omitted pursuant to a confidential treatment order. Omitted information has been filed separately with the SEC. | |
102
EXHIBIT INDEX - Continued | ||
Exhibit No. | Description | |
+ | Certain portions of this exhibit have been omitted pursuant to a confidential treatment request. Omitted information has been filed separately with the SEC. | |
†† | Filed with this report. | |
††† | Furnished with this report. | |
* | Management contracts or compensation plans or arrangements in which directors or executive officers participate. | |
Item 16. Form 10-K Summary
None.
103
SIGNATURES
Pursuant to the requirements of Section 13 or 15(d) of the Securities Exchange Act of 1934, the registrant has duly caused this report to be signed on its behalf by the undersigned, thereunto duly authorized.
SecureWorks Corp. | ||
By: | /s/ Michael R. Cote | |
Michael R. Cote | ||
President and Chief Executive Officer | ||
(Duly Authorized Officer) | ||
Date: March 28, 2018
Pursuant to the requirements of the Securities Exchange Act of 1934, this report has been signed below by the following persons on behalf of the registrant and in the capacities and on the dates indicated.
SIGNATURE | TITLE | DATE | ||
/s/ Michael R. Cote | President, Chief Executive Officer and Director | March 28, 2018 | ||
Michael R. Cote | (Principal Executive Officer) | |||
/s/ R. Wayne Jackson | Chief Financial Officer | March 28, 2018 | ||
R. Wayne Jackson | (Principal Financial Officer) | |||
/s/ Teri Miller | Vice President, Chief Accounting Officer | March 28, 2018 | ||
Teri Miller | (Principal Accounting Officer) | |||
/s/ Michael S. Dell | Chairman of the Board of Directors | March 28, 2018 | ||
Michael S. Dell | ||||
/s/ Egon Durban | Director | March 28, 2018 | ||
Egon Durban | ||||
/s/ Pamela Daley | Director | March 28, 2018 | ||
Pamela Daley | ||||
/s/ Yagyensh C. Pati | Director | March 28, 2018 | ||
Yagyensh C. Pati | ||||
/s/ Mark J. Hawkins | Director | March 28, 2018 | ||
Mark J. Hawkins | ||||
/s/ William R. McDermott | Director | March 28, 2018 | ||
William R. McDermott | ||||
/s/ James M. Whitehurst | Director | March 28, 2018 | ||
James M. Whitehurst | ||||
104