Attached files
| file | filename |
|---|---|
| EX-99.3 - EX-99.3 - CERES ORION L.P. | d511538dex993.htm |
| EX-99.2 - EX-99.2 - CERES ORION L.P. | d511538dex992.htm |
| EX-99.1 - EX-99.1 - CERES ORION L.P. | d511538dex991.htm |
| EX-32.2 - EX-32.2 - CERES ORION L.P. | d511538dex322.htm |
| EX-32.1 - EX-32.1 - CERES ORION L.P. | d511538dex321.htm |
| EX-31.2 - EX-31.2 - CERES ORION L.P. | d511538dex312.htm |
| EX-31.1 - EX-31.1 - CERES ORION L.P. | d511538dex311.htm |
| EX-10.3B - EX-10.3(B) - CERES ORION L.P. | d511538dex103b.htm |
UNITED STATES
SECURITIES AND EXCHANGE COMMISSION
WASHINGTON, D.C. 20549
FORM 10-K
(X) ANNUAL REPORT PURSUANT TO SECTION 13 OR 15(d)
OF THE SECURITIES EXCHANGE ACT OF 1934
For the fiscal year ended December 31, 2017
OR ( ) TRANSITION REPORT PURSUANT TO SECTION 13 OR 15(d)
OF THE SECURITIES EXCHANGE ACT OF 1934
For the Transition period from to
Commission File Number 0-50271
CERES ORION L.P.
(Exact name of registrant as specified in its charter)
| New York | 22-3644546 | |
| (State or other jurisdiction of incorporation or organization) |
(I.R.S. Employer Identification No.) |
c/o Ceres Managed Futures LLC
522 Fifth Avenue
New York, New York 10036
(Address and Zip Code of principal executive offices)
(855) 672-4468
(Registrant’s telephone number, including area code)
Securities registered pursuant to Section 12(b) of the Act: None
Securities registered pursuant to Section 12(g) of the Act: Redeemable Units of Limited Partnership Interest
(Title of Class)
Indicate by check mark if the registrant is a well-known seasoned issuer, as defined in Rule 405 of the Securities Act.
Yes No X
Indicate by check mark if the registrant is not required to file reports pursuant to Section 13 or Section 15(d) of the Act.
Yes No X
Indicate by check mark whether the registrant: (1) has filed all reports required to be filed by Section 13 or 15(d) of the Securities Exchange Act of 1934 during the preceding 12 months (or for such shorter period that the registrant was required to file such reports), and (2) has been subject to such filing requirements for the past 90 days.
Yes X No
Indicate by check mark whether the registrant has submitted electronically and posted on its corporate Web site, if any, every Interactive Data File required to be submitted and posted pursuant to Rule 405 of Regulation S-T (§232.405 of the chapter) during the preceding 12 months (or for such shorter period that the registrant was required to submit and post such files).
Yes X No
Indicate by check mark if disclosure of delinquent filers pursuant to Item 405 of Regulation S-K (§229.405 of this chapter) is not contained herein, and will not be contained, to the best of registrant’s knowledge, in definitive proxy or information statements
incorporated by reference in Part III of this Form 10-K or any amendment to this form 10-K X
Indicate by check mark whether the registrant is a large accelerated filer, an accelerated filer, a non-accelerated filer, a smaller reporting company or an emerging growth company. See the definitions of “large accelerated filer,” “accelerated filer,” “smaller reporting company” and “emerging growth company” in Rule 12b-2 of the Exchange Act.
| Large accelerated filer |
Accelerated filer | Non-accelerated filer X | ||
| Smaller reporting company |
Emerging growth company |
If an emerging growth company, indicate by check mark if the registrant has elected not to use the extended transition period for complying with any new or revised financial accounting standards provided pursuant to Section 13(a) of the Exchange Act.
Indicate by check mark whether the registrant is a shell company (as defined in Rule 12b-2 of the Exchange Act).
Yes No X
Limited Partnership Redeemable Units with an aggregate value of $847,473,993 of Class A and $3,198,441 of Class Z were outstanding and held by non-affiliates as of the last business day of the registrants most recently completed second fiscal quarter.
As of February 28, 2018, 266,795.7888 Limited Partnership Class A Redeemable Units were outstanding and 3,337.2412 Limited Partnership Class Z Redeemable Units were outstanding.
DOCUMENTS INCORPORATED BY REFERENCE
[None]
PART I
Item 1. Business.
(a) General development of business. Ceres Orion L.P. (formerly, Orion Futures Fund L.P.) (the “Partnership”) is a limited partnership organized on March 22, 1999, under the partnership laws of the State of New York, to engage, directly or indirectly, in the speculative trading of a diversified portfolio of commodity interests, including futures, option, swap and forward contracts. The sectors traded include currencies, energy, grains, livestock, indices, U.S. and non-U.S. interest rates, softs and metals. The commodity interests that are traded by the Partnership, directly and indirectly through its investments in the Funds (as defined below), are volatile and involve a high degree of market risk. The Partnership commenced trading on June 10, 1999. The Partnership privately and continuously offers redeemable units of limited partnership interest (“Redeemable Units”) to qualified investors. There is no maximum number of Redeemable Units that may be sold by the Partnership. The General Partner may also determine to invest up to all of the Partnership’s assets (directly or indirectly through its investment in the Funds’) in United States (“U.S.”) Treasury bills and/or money market mutual funds, including money market mutual funds managed by Morgan Stanley or its affiliates.
During the initial offering period (March 31, 1999 through June 10, 1999) the Partnership sold 10,499 Redeemable Units at $1,000 per Redeemable Unit. The Partnership commenced trading activities on June 10, 1999.
Subscriptions and redemptions of Redeemable Units and general partner contributions and redemptions for the years ended December 31, 2017, 2016 and 2015 are reported in the Statements of Changes in Partners’ Capital under “Item 8. Financial Statements and Supplementary Data.”
Ceres Managed Futures LLC, a Delaware limited liability company, acts as the general partner (the “General Partner”) and commodity pool operator of the Partnership and was the trading manager (the “Trading Manager”) of Transtrend Master (as defined below). As of January 1, 2017, the General Partner became a wholly-owned subsidiary of Morgan Stanley Domestic Holdings, Inc. (“MSD Holdings”). MSD Holdings is ultimately owned by Morgan Stanley. Morgan Stanley is a publicly held company whose shares are listed on the New York Stock Exchange. Morgan Stanley is engaged in various financial services and other businesses. Prior to January 1, 2017, the General Partner was a wholly-owned subsidiary of Morgan Stanley Smith Barney Holdings LLC (“MSSB Holdings”). Prior to June 28, 2013, Morgan Stanley indirectly owned a majority equity interest in MSSB Holdings and Citigroup Inc. indirectly owned a minority equity interest in MSSB Holdings.
During the years ended December 31, 2017, 2016 and 2015, the Partnership’s/Funds’ commodity broker was Morgan Stanley & Co. LLC (“MS&Co.”), a registered futures commission merchant. During prior periods included in this report, Citigroup Global Markets Inc. (“CGM”) also served as a commodity broker. JPMorgan Chase Bank, N.A. (“JPMorgan”) was also a foreign exchange forward counterparty for certain Funds. The Partnership/Funds also deposit a portion of their cash in a non-trading account at JPMorgan.
Effective February 28, 2018, the Partnership changed its name from Orion Futures Fund L.P. to Ceres Orion L.P.
All trading decisions are made for the Partnership by Winton Capital Management Limited (“Winton”), Transtrend B.V. (“Transtrend”), Willowbridge Associates Inc. (“Willowbridge”) and Systematica Investments Limited (“Systematica”) (each an “Advisor” and, collectively, the “Advisors”), each of which is a registered commodity trading advisor. Effective November 30, 2014, AAA Capital Management Advisors, Ltd. (“AAA”) ceased to act as a commodity trading advisor for the Partnership. The portion of the Partnership’s assets that were allocated to AAA were reallocated among Winton, Transtrend and Willowbridge. References herein to an “Advisor” or the “Advisors” may also include, as relevant, AAA. Each Advisor is allocated a portion of the Partnership’s assets to manage. The Partnership invests the portion of its assets allocated to each of the Advisors either directly, through an individually managed account, or indirectly, through investments in the Funds. In addition, the General Partner may allocate the Partnership’s assets to additional non-major trading advisors (i.e., commodity trading advisors intended to be allocated less than 10% of the Partnership’s assets). Information about advisors allocated less than 10% of the Partnership’s assets may not be disclosed.
On June 1, 2011, the Partnership began offering “Class A” Redeemable Units and “Class Z” Redeemable Units pursuant to the offering memorandum. All Redeemable Units issued prior to June 1, 2011 were deemed Class A Redeemable Units. The rights, powers, duties and obligations associated with investment in Class A Redeemable Units were not changed. Class A Redeemable Units are available to taxable U.S. individuals and institutions, U.S. tax exempt individuals and institutions and non-U.S. investors. Class Z Redeemable Units were first issued on August 1, 2011. Class Z Redeemable Units are offered to limited partners who receive advisory services from Morgan Stanley Smith Barney LLC (doing business as Morgan Stanley Wealth Management) (“Morgan Stanley Wealth Management”) and certain employees of Morgan Stanley and/or its subsidiaries (and their family members). Class A Redeemable Units and Class Z Redeemable Units will each be referred to as a “Class” and collectively referred to as the “Classes.” The Class of Redeemable Units that a limited partner receives upon a subscription will generally depend upon the status of the limited partner, although the General Partner may determine to offer a particular Class of Redeemable Units to investors at its discretion.
Systematica directly trades the Partnership’s assets allocated to it through a managed account in the name of the Partnership pursuant to Systematica’s BlueTrend Program.
The Partnership, CMF Winton Master L.P. (“Winton Master”), CMF TT II, LLC (formerly, Morgan Stanley Smith Barney TT II, LLC) (“Transtrend Master”) and CMF Willowbridge Master Fund L.P. (“Willowbridge Master”) have entered into futures brokerage account agreements and foreign exchange brokerage account agreements with MS&Co. Prior to its liquidation, AAA Master LLC (“AAA Master”) entered into a futures brokerage agreement with MS&Co. Winton Master, Transtrend Master, Willowbridge Master and AAA Master are collectively referred to as the “Funds.”
1
Effective July 12, 2017, Winton Master, Transtrend Master and Willowbridge Master each entered into certain agreements with JPMorgan in connection with trading in forward foreign currency contracts on behalf of the referenced Funds and indirectly, the Partnership. These agreements include a foreign exchange and bullion authorization agreement (“FX Agreement”), an International Swap Dealers Association, Inc. master agreement (“Master Agreement”), a schedule to the Master Agreement, a 2016 credit support annex for variation margin to the schedule and an institutional account agreement. In addition to Willowbridge Master, Willowbridge is party to the FX Agreement for Willowbridge Master. Under each FX Agreement, JPMorgan charges a fee on the aggregate foreign currency transactions entered into on behalf of the respective Fund during a month.
The Partnership, directly and through its investments in the Funds, pays MS&Co. trading fees for the clearing, and where applicable, the execution of transactions.
In May 2013, the General Partner discovered an overstatement of brokerage commissions for the Partnership occurring during the period from June 2011 to March 2013 (the “Time Period”). As a result, the General Partner contributed the amount of the overstatement, $14,069,403, to the Partnership. This contribution was applied to current limited partners of the Partnership as well as former limited partners whose redemption proceeds were impacted by the overstatement. The impact of the overstatement on the financial statements during the Time Period was not considered material.
The Partnership will be liquidated upon the first to occur of the following: December 31, 2019; the net asset value per Redeemable Unit of any Class decreases to less than $400 as of a close of any business day; or under certain other circumstances as set forth in the limited partnership agreement of the Partnership (the “Limited Partnership Agreement”). In addition, the General Partner may, in its sole discretion, cause the Partnership to dissolve if the aggregate net assets of the Partnership decline to less than $1,000,000.
On November 1, 2004, the assets allocated to Winton for trading were invested in Winton Master, a limited partnership organized under the partnership laws of the State of New York. Winton Master permits accounts managed by Winton using the Winton Futures Program (formerly, the Winton Diversified Program as applied without equities), a proprietary, systematic trading system, to invest together in one trading vehicle. The General Partner is also the general partner of Winton Master. Individual and pooled accounts currently managed by Winton, including the Partnership, are permitted to be limited partners of Winton Master. The General Partner and Winton believe that trading through this structure promotes efficiency and economy in the trading process. The General Partner and Winton have agreed that Winton will trade the Partnership’s assets allocated to Winton at a level that is up to 1.5 times the amount of assets allocated.
On June 1, 2011, the Partnership allocated a portion of its assets to Transtrend Master, a limited liability company organized under the limited liability company laws of the State of Delaware. Transtrend Master permits accounts managed by Transtrend using the Diversified Trend Program-Enhanced Risk Profile (US Dollar), a proprietary, systematic trading system, to invest together in one trading vehicle. Individual and pooled accounts managed by Transtrend, including the Partnership, are permitted to be non-managing members of Transtrend Master. The Trading Manager and Transtrend believe that trading through this structure promotes efficiency and economy in the trading process.
On August 1, 2014, the assets allocated to Willowbridge for trading were invested in Willowbridge Master, a limited partnership organized under the partnership laws of the State of New York. Willowbridge Master permits accounts managed by Willowbridge using its wPraxis Futures Trading Approach, a proprietary, discretionary trading system, to invest together in one trading vehicle. The General Partner is also the general partner of Willowbridge Master. Individual and pooled accounts currently managed by Willowbridge, including the Partnership, are permitted to be limited partners of Willowbridge Master. The General Partner and Willowbridge believe that trading through this structure promotes efficiency and economy in the trading process. The General Partner and Willowbridge have agreed that Willowbridge will trade the Partnership’s assets at a level that is up to three times the amount of the assets allocated.
On September 1, 2001, the assets allocated to AAA for trading were invested in AAA Master, a limited liability company formed under the New York Limited Liability Company Law. AAA Master permitted accounts managed by AAA using the Energy Program-Futures and Swaps, a proprietary, discretionary trading system, to invest together in one trading vehicle. The Partnership fully redeemed its investment in AAA Master on November 30, 2014. The General Partner was also the managing member of AAA Master.
The General Partner is not aware of any material changes to any of the trading programs discussed above during the year ended December 31, 2017.
The Funds’ and the Partnership’s trading of futures, forward, swap and option contracts, if applicable, on commodities is done primarily on U.S. and foreign commodity exchanges. The Funds and the Partnership engage in such trading through commodity brokerage accounts maintained with MS&Co. During a prior period included in this report, the Funds engaged in such trading through commodity brokerage accounts maintained with CGM.
Generally, a limited partner/member in the Funds withdraws all or part of its capital contribution and undistributed profits, if any, from the Funds as of the end of any month (the “Redemption Date”) after a request has been made to the General Partner/Trading Manager at least three days in advance of the Redemption Date. Such withdrawals are classified as a liability when the limited partner/member elects to redeem and informs the Funds. However, for all Funds other than Winton Master, a limited partner/member may request a withdrawal as of the end of any day if such request is received by the General Partner/Trading Manager at least three days in advance of the proposed withdrawal day.
2
Management fees, ongoing selling agent fees, General Partner fees and incentive fees are charged at the Partnership level, except for management and incentive fees payable to Transtrend which are charged at the Transtrend Master level. Clearing fees are borne by the Funds and allocated to the Funds’ limited partners/non-managing members, including the Partnership. Clearing fees are also borne by the Partnership directly. Professional fees are borne by the Funds and allocated to the Partnership, and also charged directly at the Partnership level.
The General Partner fees, management fees, incentive fees and professional fees of the Partnership are allocated proportionally to each Class based on the net asset value of the Class.
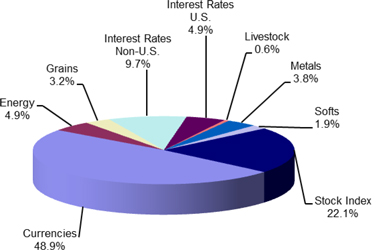
For the period January 1, 2017 through December 31, 2017, the approximate average market sector distribution for the Partnership was as follows:
Prior to the close of business on December 31, 2017, the Partnership owned approximately 45.8% of Winton Master, 95.8% of Transtrend Master and 82.5% of Willowbridge Master. As of December 31, 2016, the Partnership owned approximately 51.4% of Winton Master, 94.9% of Transtrend Master and 76.5% of Willowbridge Master. It is the Partnership’s intention to continue to invest in the Funds. The performance of the Partnership is directly affected by the performance of the Funds. Expenses to investors as a result of investment in the Funds are approximately the same as investing directly and the redemption rights are not affected.
The General Partner administers the business and affairs of the Partnership, including selecting one or more advisors to make trading decisions for the Partnership. The Partnership pays the General Partner a monthly fee (“General Partner fee”) equal to 1/12 of 0.75% (0.75% per year) of month-end net assets. Prior to October 1, 2014, the Partnership paid the General Partner a monthly fee equal to 1/24 of 1% (0.5% per year) of month-end net assets. Month-end net assets, for the purpose of calculating the General Partner fees are net assets, as defined in the Limited Partnership Agreement, prior to the reduction of the current month’s incentive fee accruals, the monthly management fees, the General Partner fee and any redemptions or distributions as of the end of such month.
The General Partner, on behalf of the Partnership, has entered into management agreements (each, a “Management Agreement”) with the Advisors. The Advisors are not affiliated with one another, the General Partner and MS&Co. or CGM, and are not responsible for the organization or operation of the Partnership.
The Partnership paid AAA a monthly management fee equal to 1.5% per year of month-end net assets allocated to AAA. Winton receives a monthly management fee equal to 1.5% per year of month-end net assets allocated to Winton. Willowbridge receives a monthly management fee equal to 1.5% per year of month-end net assets allocated to Willowbridge. Systematica receives a monthly management fee equal to 1.0% per year of month-end net assets allocated to Systematica. Month-end net assets, for the purpose of calculating management fees are net assets, as defined in the Limited Partnership Agreement, prior to the reduction of the current month’s incentive fee accruals, the monthly management fees, the General Partner fee and any redemptions or distributions as of the end of such month.
As of January 1, 2017, Transtrend Master pays Transtrend a monthly management fee of 0.85% per year on the aggregate net assets of Transtrend Master as of the first day of each month. For the period November 1, 2015 to December 31, 2016, Transtrend Master paid Transtrend a monthly management fee of 1.0% per year on the aggregate net assets of Transtrend Master as of the first day of
3
each month. For the period October 1, 2014 to October 31, 2015, Transtrend Master paid Transtrend a monthly management fee of 1.25% per year on the aggregate net assets of Transtrend Master as of the first day of each month. For the period from January 1, 2014 to September 30, 2014, Transtrend Master paid Transtrend a monthly management fee of either 1.25% per year or 1.5% per year depending on the aggregate net assets of Transtrend Master as of the first day of each month. Prior to January 1, 2014, Transtrend Master paid Transtrend a monthly management fee of either 1.75% per year or 2% per year depending on the aggregate net assets of Transtrend Master as of the first day of each month. The management fee paid by Transtrend Master is allocated to the Partnership based on its proportionate ownership interest of Transtrend Master.
In addition, the Partnership is obligated to pay Winton and Willowbridge an incentive fee, payable quarterly, equal to 20% of the New Trading Profits, as defined in each Management Agreement, earned by Winton and Willowbridge for the Partnership during each calendar quarter. The Partnership is obligated to pay Systematica an incentive fee, payable annually, equal to 20% of the New Trading Profits, as defined in its Management Agreement, earned by Systematica for the Partnership during each calendar year. Prior to January 1, 2016, Systematica received an incentive fee equal to 20% of the New Trading Profits earned by Systematica payable at the end of each calendar quarter. Transtrend receives an incentive fee equal to 20% of the New Trading Profits, as defined in its Management Agreement, earned by Transtrend Master payable at the end of each calendar half year. Prior to January 1, 2016, Transtrend received an incentive fee equal to 20% of the New Trading Profits earned by Transtrend Master payable at the end of each calendar quarter. To the extent an Advisor incurs a loss for the Partnership, the Advisor will not be paid incentive fees until the Advisor recovers the net loss incurred and earns additional new trading profits for the Partnership. The incentive fee paid by Transtrend Master is allocated to the Partnership based on its proportionate ownership interest of Transtrend Master.
Each Management Agreement may be terminated upon notice by either party.
In allocating the assets of the Partnership among the Advisors, the General Partner considers, among other factors, each Advisor’s past performance, trading style, volatility of markets traded and fee requirements. The General Partner may modify or terminate the allocation of assets to the Advisors and may allocate the assets to additional advisors at any time.
Prior to and during part of the fourth quarter of 2013, the Partnership was party to a Customer Agreement with CGM (the “CGM Customer Agreement”). During the fourth quarter of 2013, the Partnership entered into a Customer Agreement with MS&Co. (the “Prior MS&Co. Customer Agreement”) and a Selling Agent Agreement with Morgan Stanley Wealth Management (the “Prior Selling Agreement”). The Partnership has terminated the CGM Customer Agreement, the Prior MS&Co. Customer Agreement and the Prior Selling Agreement.
Effective March 1, 2014, the Partnership entered into a futures brokerage account agreement with MS&Co. (the “Partnership Customer Agreement”) and ceased paying brokerage commissions to MS&Co. Under the Partnership Customer Agreement, the Partnership pays MS&Co. (or will reimburse MS&Co. if previously paid) its allocable share of trading fees for the clearing and, where applicable, the execution of transactions, as well as its allocable share of exchange, clearing, user, give-up and National Futures Association (“NFA”) fees (collectively, the “clearing fees”) directly and through its investment in the Funds. MS&Co. clearing fees are allocated to the Partnership based on its proportionate ownership interest of the Funds. All of the Partnership’s assets available for trading commodity interests not held in the Funds’ brokerage accounts at MS&Co. and JPMorgan are deposited in the Partnership’s brokerage account at MS&Co. The Partnership/Funds also deposit a portion of their cash in a non-trading bank account at JPMorgan. The Partnership’s cash deposited with MS&Co. is held in segregated bank accounts to the extent required by Commodity Futures Trading Commission (“CFTC”) regulations. The Partnership’s restricted cash is equal to the cash portion of assets on deposit to meet margin requirements, as determined by the exchange or counterparty, and required by MS&Co. At December 31, 2017 and 2016, the amount of cash held by the Partnership for margin requirements was $42,619,216 and $48,766,785, respectively. Cash that is not classified as restricted cash is therefore classified as unrestricted cash. MS&Co. has agreed to pay the Partnership interest on 100% of the average daily equity maintained in cash in the Partnership’s (or the Partnership’s allocable portion of the Fund’s, except for Transtrend Master’s) brokerage account during each month at the rate equal to the monthly average of the 4-week U.S. Treasury bill discount rate. MS&Co. has agreed to pay Transtrend Master interest on 100% of the average daily equity maintained in cash in Transtrend Master’s brokerage account during each month at the rate equal to the monthly average of the 4-week U.S. Treasury bill discount rate less 0.15% during such month but in no event less than zero. When the effective rate is less than zero, no interest is earned. All other interest income will be retained by the Partnership and/or the Funds, as applicable. For purposes of these interest credits, daily funds do not include monies due to Transtrend Master on or with respect to futures, forwards, or options contracts that have not been received. The Partnership Customer Agreement may generally be terminated upon notice by either party.
Effective March 1, 2014, the Partnership entered into a new selling agreement with Morgan Stanley Wealth Management (as amended, the “Selling Agreement”). Pursuant to the Selling Agreement, Morgan Stanley Wealth Management receives a monthly ongoing selling agent fee. Prior to October 1, 2014, the amount of the ongoing selling agent fee was calculated by multiplying the Partnership’s (i) round-turn futures transactions by $18.00 each, swaps by up to an equivalent amount and options transactions by $9.00 each per side, with respect to Class A Redeemable Units and (ii) round-turn futures transactions by $3.00 each, swaps by up to an equivalent amount and options transactions by $1.50 each per side, with respect to Class Z Redeemable Units. Effective October 1, 2014, the ongoing selling agent fee was (i) reduced to $15.00 each for futures transactions and up to an equivalent amount for swaps and $7.50 each per side for options transactions, with respect to Class A Redeemable Units and (ii) eliminated with respect to Class Z Redeemable Units. The ongoing selling agent fee amount is reduced by applicable floor brokerage fees. The Partnership may pay an ongoing selling agent fee to other properly licensed and/or registered selling agents who sell Redeemable Units, and such additional selling agents may share all or a substantial portion of such fees with their properly registered or exempted financial advisors who
4
have sold Redeemable Units.
Under the prior futures brokerage account agreement (the “Prior Customer Agreement”), the Partnership paid MS&Co. a monthly brokerage commission equal to (i) $18.00 per round-turn on futures transactions, up to an equivalent amount for swaps and $9.00 per side on options transactions, with respect to Class A Redeemable Units and (ii) $3.00 per round-turn on futures transactions, up to an equivalent amount for swaps and $1.50 per side on options transactions, with respect to Class Z Redeemable Units. The brokerage commissions were inclusive of applicable floor brokerage fees. The Partnership also paid MS&Co. clearing fees through its investment in the Funds. MS&Co. clearing fees were also allocated to the Partnership based on its proportionate share of the Funds. During the term of the Prior Customer Agreement, all of the Partnership’s assets not held in the Funds’ brokerage accounts at MS&Co. were deposited in the Partnership’s brokerage account at MS&Co. The Partnership’s cash was also deposited by MS&Co. in segregated bank accounts to the extent required by CFTC regulations. MS&Co. also agreed to pay the Partnership interest on 100% of the average daily equity maintained in cash in the Partnership’s (or the Partnership’s allocable portion of the Fund’s, except for Transtrend Master’s) brokerage account at the rate equal to the monthly average of the 4-week U.S. Treasury bill discount rate. MS&Co. also agreed to pay Transtrend Master interest on 100% of the average daily equity maintained in cash in Transtrend Master’s brokerage account at the rate equal to the monthly average of the 4-week U.S. Treasury bill discount rate less 0.15% during such month but in no event less than zero. For purposes of these interest credits, daily funds also did not include monies due to Transtrend Master on or with respect to futures, forwards, or options contracts that have not been received. The Partnership has terminated the Prior Customer Agreement.
Under the CGM Customer Agreement, the Partnership paid CGM a monthly brokerage commission equal to (i) $18.00 per round- turn on futures transactions, up to an equivalent amount for swaps and $9.00 per side on options transactions for Class A Redeemable Units, and (ii) $3.00 per round-turn on futures transactions, up to an equivalent amount for swaps and $1.50 per side on options transactions for Class Z Redeemable Units. The brokerage commissions were inclusive of applicable floor brokerage fees. The Partnership paid for exchange, service, clearing, user, give-up and NFA fees (collectively, the “CGM clearing fees”) through its investments in the Funds cleared through CGM. CGM clearing fees were allocated to the Partnership based on its proportionate share of such Funds. During the term of the CGM Customer Agreement, all of the Partnership’s assets that were not held in the Funds’ brokerage accounts at CGM were deposited in the Partnership’s brokerage account at CGM, except for Transtrend Master whose assets were held in its brokerage account at MS&Co. The Partnership’s cash was deposited by CGM in segregated bank accounts to the extent required by CFTC regulations. CGM paid the Partnership interest on 100% of the average daily equity maintained in cash in the Partnership’s (or the Partnership’s allocable portion of a Fund’s (except for Transtrend Master’s)) brokerage account at a 30-day U.S. Treasury bill rate determined weekly by CGM based on the average non-competitive yield on 3-month U.S. Treasury bills maturing 30 days from the date on which such weekly rate is determined. The Partnership has terminated the CGM Customer Agreement.
In July 2015, the General Partner delegated certain administrative functions to SS&C Technologies, Inc., a Delaware corporation, currently doing business as SS&C GlobeOp (the “Administrator”). Pursuant to a master services agreement, the Administrator furnishes certain administrative, accounting, regulatory reporting, tax and other services as agreed from time to time. In addition, the Administrator maintains certain books and records of the Partnership. The cost of retaining the Administrator is allocated among the pools operated by the General Partner, including the Partnership.
(b) Financial Information about Segments. The Partnership’s business consists of only one segment, speculative trading of commodity interests. The Partnership does not engage in sales of goods or services. The Partnership’s net income (loss) from operations for the years ended December 31, 2017, 2016, 2015, 2014 and 2013 are set forth under “Item 6. Selected Financial Data.” The Partnership’s capital as of December 31, 2017 was $798,532,927.
(c) Narrative Description of Business. See Paragraphs (a) and (b) above.
(i) through (xii) — Not applicable.
(xiii) — The Partnership has no employees.
(d) Financial Information About Geographic Areas. The Partnership does not engage in sales of goods or services or own any long-lived assets, and therefore this item is not applicable.
(e) Available Information. The Partnership does not have an Internet address. The Partnership will provide paper copies of its annual report on Form 10-K, quarterly reports on Form 10-Q, current reports on Form 8-K and any amendments to these reports free of charge upon request.
(f) Reports to Security Holders. Not applicable.
(g) Enforceability of Civil Liabilities Against Foreign Persons. Not applicable.
(h) Smaller Reporting Companies. Not applicable.
5
Item 1A. Risk Factors
As a result of leverage, small changes in the price of the Partnership’s positions may result in major losses.
The trading of commodity interests is speculative, volatile and involves a high degree of leverage. A small change in the market price of a commodity interest contract can produce major losses for the Partnership. Market prices can be influenced by, among other things, changing supply and demand relationships, governmental, agricultural, commercial and trade programs and policies, national and international political and economic events, weather and climate conditions, insects and plant disease, purchases and sales by foreign countries and changing interest rates.
An investor may lose all of its investment.
Due to the speculative nature of trading commodity interests, an investor could lose all of its investment in the Partnership.
The Partnership will pay substantial fees and expenses regardless of profitability.
Regardless of its trading performance, the Partnership will incur fees and expenses, including but not limited to ongoing selling agent fees, clearing fees, management fees, and General Partner fees. Substantial incentive fees may be paid to one or more of the Advisors even if the Partnership experiences a net loss for the full year.
An investor’s ability to redeem or transfer Redeemable Units is limited.
An investor’s ability to redeem Redeemable Units is limited and no market exists for the Redeemable Units.
Conflicts of interest exist.
The Partnership is subject to numerous conflicts of interest including those that arise from the facts that:
| 1. | The General Partner/managing member/trading manager and the Partnership’s/Funds’ commodity broker are affiliates; |
| 2. | Each of the Advisors, the Partnership’s/Funds’ commodity broker, the General Partner, and their respective principals and affiliates may trade in commodity interests for their own accounts; |
| 3. | An investor’s financial advisor will receive ongoing compensation for providing services to the investor’s account with respect to Class A Redeemable Units; and |
| 4. | The General Partner, on behalf of the Partnership, may purchase money market mutual fund shares from mutual funds affiliated and/or unaffiliated with the General Partner. |
Investing in Redeemable Units might not provide the desired diversification of an investor’s overall portfolio.
One of the Partnership’s objectives is to add an element of diversification to a traditional stock and bond portfolio, but any benefit of portfolio diversification is dependent upon the Partnership/Funds achieving positive returns and such returns being independent of stock and bond market returns.
Past performance is no assurance of future results.
The Advisors’ trading strategies may not perform as they have performed in the past. The Advisors have from time to time incurred substantial losses in trading on behalf of clients.
An investor’s tax liability may exceed cash distributions.
Investors are taxed on their share of the Partnership’s income, even though the Partnership does not intend to make any distributions.
The General Partner may allocate the Partnership’s assets to undisclosed advisors.
The General Partner at any time may select and allocate the Partnership’s assets to undisclosed advisors. Investors may not be advised of such changes in advance, or at all. Investors must rely on the ability of the General Partner to select commodity trading advisors and allocate assets among them.
6
Regulatory changes could restrict the Partnership’s operations and increase its operational costs.
Regulatory changes could adversely affect the Partnership by restricting its markets or activities, limiting its trading and/or increasing the costs or taxes to which investors are subject. Pursuant to the mandate of the Dodd-Frank Wall Street Reform and Consumer Protection Act, signed into law on July 21, 2010, the CFTC and the Securities and Exchange Commission (the “SEC”) have promulgated rules to regulate swap dealers and to mandate additional reporting and disclosure requirements and continue to promulgate rules regarding capital and margin requirements, to require that certain swaps be traded on an exchange or a swap execution facility, and to require that derivatives (such as those traded by the Partnership) be moved into central clearinghouses. The CFTC and the prudential regulators that oversee swap dealers have adopted rules regarding margin requirements for certain derivatives. In addition, the CFTC and such prudential regulators have proposed or adopted, respectively, rules regarding capital requirements for swap dealers. These rules may negatively impact the manner in which swap contracts are traded and/or settled, increase the cost of such trading, and limit trading by speculators (such as the Partnership) in futures and over-the-counter (“OTC”) markets.
Speculative position and trading limits may reduce profitability.
The CFTC and U.S. exchanges have established speculative position limits on the maximum net long or net short positions which any person or a group of persons may hold or control in particular futures, options on futures and swaps that perform a significant price discovery function. Most exchanges also limit the amount of fluctuation in commodity futures contract prices on a single trading day. Each of the Advisors believes that established speculative position and trading limits will not materially adversely affect trading for the Partnership. The trading instructions of an Advisor, however, may have to be modified, and positions held by the Partnership may have to be liquidated, in order to avoid exceeding these limits. Such modification or liquidation could adversely affect the operations and profitability of the Partnership by increasing transaction costs to liquidate positions and limiting potential profits on the liquidated positions.
In December 2016, the CFTC re-proposed new rules regarding speculative position limits, replacing a prior proposal from November 2013. These rules, if adopted in substantially the same form, will impose position limits on certain futures and option contracts and physical commodity swaps that are “economically equivalent” to such contracts. If enacted, these rules could have an adverse effect on an Advisors’ trading for the Partnership.
The General Partner, the Partnership and its Service Providers and their Respective Operations Are Potentially Vulnerable to Cyber-Security Attacks or Incidents.
Like other business enterprises, the use of the internet and other electronic media and technology exposes the General Partner, the Partnership and its service providers, and their respective operations, to potential risks from cyber-security attacks or incidents (collectively, “cyber events”). Cyber events may include, for example, unauthorized access to systems, networks or devices, infection from computer viruses or other malicious software code, mishandling or misuse of information and attacks which shut down, disable, slow or otherwise disrupt operations, business processes or website access or functionality. In addition to intentional cyber events, unintentional cyber events can occur. Unintentional cyber events may include, for example, the inadvertent release of confidential information, the mishandling or misuse of information and/or technological limitations or hardware failures (in the markets or otherwise) that constrain the Partnership’s and/or the Funds’ ability to gather, process and communicate information efficiently and securely, without interruption.
Any cyber event could adversely affect the Partnership’s business, financial condition or results of operations and cause the Partnership to incur financial loss and expense, as well as face exposure to regulatory penalties or legal claims, reputational damage and additional costs associated with corrective measures. A cyber-security breach could also jeopardize a limited partner’s personal, confidential, proprietary or other information processed and stored in, and transmitted through, the General Partner’s or a service provider’s computer systems. A cyber event may cause the Partnership or its service providers to lose proprietary information, suffer data corruption, lose operational capacity (such as, for example, the loss of the ability to process transactions, calculate the Partnership’s net asset value, or allow investors to transact business) and/or fail to comply with applicable privacy and other laws. Among other potentially harmful effects, cyber events also may result in theft, unauthorized monitoring and failures in the physical infrastructure or operating systems that support the Partnership or its service providers.
The nature of malicious cyber-attacks is becoming increasingly sophisticated and neither the General Partner nor the Partnership can control the cyber systems and cyber-security systems of the Advisors or other third-party service providers.
Tax Laws Are Subject To Change at Any Time. Tax laws and court and IRS interpretations thereof are subject to change at any time, possibly with retroactive effect.
On December 22, 2017, the Tax Cuts and Jobs Act was signed into law and is generally effective after December 31, 2017. The Tax Cuts and Jobs Act makes significant changes to the U.S. federal income tax rules for taxation of individuals and corporations, including, in the case of individuals, reducing the top federal income rate to 37%, and eliminating or limiting various deductions, including capping the deduction for state and local taxes at $10,000 per year. Most of the changes applicable to individuals are
7
temporary and apply only to taxable years beginning after December 31, 2017 and before January 1, 2026. For corporations, the Tax Cuts and Jobs Act reduces the top corporate income tax rate to 21%.
The Partnership does not anticipate that a limited partner’s share of income from the Partnership will be eligible for the 20% deduction established by the Tax Cuts and Jobs Act for qualified business income. However, in certain limited circumstances unlikely to apply to the Partnership, a portion of a limited partner’s gain upon a taxable disposition of an interest in the Partnership or a complete withdrawal may be eligible for the deduction.
The Tax Cuts and Jobs Act makes numerous other large and small changes to the federal income tax rules that may affect the Partnership’s investors and may directly or indirectly affect the Partnership. Moreover, Congressional leaders have recognized that the process of adopting extensive tax legislation in a short amount of time without hearings and substantial time for review is likely to have led to drafting errors, issues needing clarification, and unintended consequences that will have to be reviewed in subsequent tax legislation. At this point, it is not clear when Congress will address these issues or when the Internal Revenue Service will issue administrative guidance on the changes made in the Tax Cuts and Jobs Act.
Prospective investors are urged to consult with their tax advisors with respect to the Tax Cuts and Jobs Act and any other regulatory or administrative developments and proposals, and their potential effects on them based on their unique circumstances.
Item 2. Properties.
The Partnership does not own or lease any properties. The General Partner operates out of facilities provided by Morgan Stanley and/or one of its subsidiaries.
8
Item 3. Legal Proceedings
This section describes the major pending legal proceedings, other than ordinary routine litigation incidental to the business, to which MS&Co. or its subsidiaries is a party or to which any of their property is subject. There are no material legal proceedings pending against the Partnership or the General Partner.
On June 1, 2011, Morgan Stanley & Co. Incorporated converted from a Delaware corporation to a Delaware limited liability company. As a result of that conversion, Morgan Stanley & Co. Incorporated is now named Morgan Stanley & Co. LLC (“MS&Co.”).
MS&Co. is a wholly-owned, indirect subsidiary of Morgan Stanley, a Delaware holding company. Morgan Stanley files periodic reports with the SEC as required by the Exchange Act, which include current descriptions of material litigation and material proceedings and investigations, if any, by governmental and/or regulatory agencies or self-regulatory organizations concerning Morgan Stanley and its subsidiaries, including MS&Co. As a consolidated subsidiary of Morgan Stanley, MS&Co. does not file its own periodic reports with the SEC that contain descriptions of material litigation, proceedings and investigations. As a result, please refer to the “Legal Proceedings” section of Morgan Stanley’s SEC 10-K filings for 2017, 2016, 2015, 2014, and 2013. In addition, MS&Co. annually prepares an Audited, Consolidated Statement of Financial Condition (“Audited Financial Statement”) that is publicly available on Morgan Stanley’s website at www.morganstanley.com. Please refer to the Commitments, Guarantees and Contingencies – Legal section of MS&Co.’s 2017 Audited Financial.
In addition to the matters described in those filings, in the normal course of business, each of Morgan Stanley and MS&Co. has been named, from time to time, as a defendant in various legal actions, including arbitrations, class actions, and other litigation, arising in connection with its activities as a global diversified financial services institution. Certain of the legal actions include claims for substantial compensatory and/or punitive damages or claims for indeterminate amounts of damages. Each of Morgan Stanley and MS&Co. is also involved, from time to time, in investigations and proceedings by governmental and/or regulatory agencies or self-regulatory organizations, certain of which may result in adverse judgments, fines or penalties. The number of these investigations and proceedings has increased in recent years with regard to many financial services institutions, including Morgan Stanley and MS&Co.
MS&Co. is a Delaware limited liability company with its main business office located at 1585 Broadway, New York, New York 10036. Among other registrations and memberships, MS&Co. is registered as a futures commission merchant and is a member of the National Futures Association.
Regulatory and Governmental Matters
On February 25, 2015, MS&Co. reached an agreement in principle with the United States Department of Justice, Civil Division and the United States Attorney’s Office for the Northern District of California, Civil Division (collectively, the “Civil Division”) to pay $2.6 billion to resolve certain claims that the Civil Division indicated it intended to bring against MS&Co. That settlement was finalized on February 10, 2016.
In October 2014, the Illinois Attorney General’s Office (“ILAG”) sent a letter to MS&Co. alleging that MS&Co. knowingly made misrepresentations related to RMBS purchased by certain pension funds affiliated with the State of Illinois and demanding that MS&Co. pay ILAG approximately $88 million. MS&Co. and ILAG reached an agreement to resolve the matter on February 10, 2016.
On January 13, 2015, the New York Attorney General’s Office (“NYAG”), which is also a member of the RMBS Working Group, indicated that it intended to file a lawsuit related to approximately 30 subprime securitizations sponsored by MS&Co. NYAG indicated that the lawsuit would allege that MS&Co. misrepresented or omitted material information related to the due diligence, underwriting and valuation of the loans in the securitizations and the properties securing them and indicated that its lawsuit would be brought under the Martin Act. MS&Co. and NYAG reached an agreement to resolve the matter on February 10, 2016.
9
On June 5, 2012, MS&Co. consented to and became the subject of an Order Instituting Proceedings Pursuant to Sections 6(c) and 6(d) of the Commodity Exchange Act, as amended, Making Findings and Imposing Remedial Sanctions by the Commodity Futures Trading Commission (“CFTC”) to resolve allegations related to the failure of a salesperson to comply with exchange rules that prohibit off-exchange futures transactions unless there is an Exchange for Related Position (“EFRP”). Specifically, the CFTC found that from April 2008 through October 2009, MS&Co. violated Section 4c(a) of the Commodity Exchange Act and CFTC Regulation 1.38 by executing, processing and reporting numerous off-exchange futures trades to the Chicago Mercantile Exchange (“CME”) and Chicago Board of Trade (“CBOT”) as EFRPs in violation of CME and CBOT rules because those trades lacked the corresponding and related cash, OTC swap, OTC option, or other OTC derivative position. In addition, the CFTC found that MS&Co. violated CFTC Regulation 166.3 by failing to supervise the handling of the trades at issue and failing to have adequate policies and procedures designed to detect and deter the violations of the Commodity Exchange Act and CFTC Regulations. Without admitting or denying the underlying allegations and without adjudication of any issue of law or fact, MS&Co. accepted and consented to entry of findings and the imposition of a cease and desist order, a fine of $5,000,000, and undertakings related to public statements, cooperation and payment of the fine. MS&Co. entered into corresponding and related settlements with the CME and CBOT in which the CME found that MS&Co. violated CME Rules 432.Q and 538 and fined MS&Co. $750,000 and CBOT found that MS&Co. violated CBOT Rules 432.Q and 538 and fined MS&Co. $1,000,000.
On July 23, 2014, the SEC approved a settlement by MS&Co. and certain affiliates to resolve an investigation related to certain subprime RMBS transactions sponsored and underwritten by those entities in 2007. Pursuant to the settlement, MS&Co. and certain affiliates were charged with violating Sections 17(a)(2) and 17(a)(3) of the Securities Act of 1933, as amended, agreed to pay disgorgement and penalties in an amount of $275 million and neither admitted nor denied the SEC’s findings.
On April 21, 2015, the Chicago Board Options Exchange, Incorporated (“CBOE”) and the CBOE Futures Exchange, LLC (“CFE”) filed statements of charges against MS&Co. in connection with trading by one of MS&Co.’s former traders of EEM options contracts that allegedly disrupted the final settlement price of the November 2012 VXEM futures. CBOE alleged that MS&Co. violated CBOE Rules 4.1, 4.2 and 4.7, Sections 9(a) and 10(b) of the Exchange Act, and Rule 10b-5 thereunder. CFE alleged that MS&Co. violated CFE Rules 608, 609 and 620. The matters were resolved on June 28, 2016 without any findings of fraud.
On June 18, 2015, MS&Co. entered into a settlement with the SEC and paid a fine of $500,000 as part of the Municipalities Continuing Disclosure Cooperation Initiative to resolve allegations that MS&Co. failed to form a reasonable basis through adequate due diligence for believing the truthfulness of the assertions by issuers and/or obligors regarding their compliance with previous continuing disclosure undertakings pursuant to Rule 15c2-12 under the Exchange Act in connection with offerings in which MS&Co. acted as senior or sole underwriter.
On August 6, 2015, MS&Co. consented to and became the subject of an order by the CFTC to resolve allegations that MS&Co. violated CFTC Regulation 22.9(a) by failing to hold sufficient U.S. dollars in cleared swap segregated accounts in the United States to meet all U.S. dollar obligations to cleared swaps customers. Specifically, the CFTC found that while MS&Co. at all times held sufficient funds in segregation to cover its obligations to its customers, on certain days during 2013 and 2014, it held currencies, such as euros, instead of U.S. dollars, to meet its U.S. dollar obligations. In addition, the CFTC found that MS&Co. violated CFTC Regulation 166.3 by failing to have in place adequate procedures to ensure that it complied with CFTC Regulation 22.9(a). Without admitting or denying the findings or conclusions and without adjudication of any issue of law or fact, MS&Co. accepted and consented to the entry of findings, the imposition of a cease and desist order, a civil monetary penalty of $300,000, and undertakings related to public statements, cooperation, and payment of the monetary penalty.
On December 20, 2016, MS&Co. consented to and became the subject of an order by the SEC in connection with allegations that MS&Co. willfully violated Sections 15(c)(3) and 17(a)(1) of the Exchange Act and Rules 15c3-3(e), 17a-5(a), and 17a-5(d) thereunder, by inaccurately calculating its Reserve Account requirement under Rule 15c3-3 by including margin loans to an affiliate in its calculations, which resulted in making inaccurate records and submitting inaccurate reports to the SEC. Without admitting or denying the underlying allegations and without adjudication of any issue of law or fact, MS&Co. consented to a cease and desist order, a censure, and a civil monetary penalty of $7,500,000.
On September 28, 2017, the CFTC issued an order filing and simultaneously settling charges against MS&Co. regarding violations of CFTC Rule 166.3 by failing to diligently supervise the reconciliation of exchange and clearing fees with the amounts it ultimately charged customers for certain transactions on multiple exchanges. The order and settlement required MS&Co. to pay a $500,000 penalty and cease and desist from violating Rule 166.3.
10
On November 2, 2017, the CFTC issued an order filing and simultaneously settling charges against MS&Co. for non-compliance with applicable rules governing Part 17 Large Trader reports to the CFTC. The order requires MS&Co. to pay a $350,000 penalty and cease and desist from further violations of the Commodity Exchange Act.
Civil Litigation
On July 15, 2010, China Development Industrial Bank (“CDIB”) filed a complaint against MS&Co., styled China Development Industrial Bank v. Morgan Stanley & Co. Incorporated et al., which is pending in the Supreme Court of the State of New York, New York County (“Supreme Court of NY”). The complaint relates to a $275 million credit default swap referencing the super senior portion of the STACK 2006-1 CDO. The complaint asserts claims for common law fraud, fraudulent inducement and fraudulent concealment and alleges that MS&Co. misrepresented the risks of the STACK 2006-1 CDO to CDIB, and that MS&Co. knew that the assets backing the CDO were of poor quality when it entered into the credit default swap with CDIB. The complaint seeks compensatory damages related to the approximately $228 million that CDIB alleges it has already lost under the credit default swap, rescission of CDIB’s obligation to pay an additional $12 million, punitive damages, equitable relief, fees and costs. On February 28, 2011, the court denied MS&Co.’s motion to dismiss the complaint. Based on currently available information, MS&Co. believes it could incur a loss of up to approximately $240 million plus pre- and post-judgment interest, fees and costs.
On October 15, 2010, the Federal Home Loan Bank of Chicago filed a complaint against MS&Co. and other defendants in the Circuit Court of the State of Illinois, styled Federal Home Loan Bank of Chicago v. Bank of America Funding Corporation et al. A corrected amended complaint was filed on April 8, 2011, which alleges that defendants made untrue statements and material omissions in the sale to plaintiff of a number of mortgage pass-through certificates backed by securitization trusts containing residential mortgage loans and asserts claims under Illinois law. The total amount of certificates allegedly sold to plaintiff by MS&Co. at issue in the action was approximately $203 million. The complaint seeks, among other things, to rescind the plaintiff’s purchase of such certificates. The defendants filed a motion to dismiss the corrected amended complaint on May 27, 2011, which was denied on September 19, 2012. On December 13, 2013, the court entered an order dismissing all claims related to one of the securitizations at issue. On January 18, 2017, the court entered an order dismissing all claims related to an additional securitization at issue. After those dismissals, the remaining amount of certificates allegedly issued by MS&Co. or sold to plaintiff by MS&Co. was approximately $65 million. At December 25, 2017, the current unpaid balance of the mortgage pass-through certificates at issue in this action was approximately $38 million, and the certificates had not yet incurred actual losses. Based on currently available information, MS&Co. believes it could incur a loss in this action up to the difference between the $38 million unpaid balance of these certificates (plus any losses incurred) and their fair market value at the time of a judgment against MS&Co., plus pre- and post-judgment interest, fees and costs. MS&Co. may be entitled to be indemnified for some of these losses and to an offset for interest received by the plaintiff prior to a judgment.
On April 20, 2011, the Federal Home Loan Bank of Boston filed a complaint against MS&Co. and other defendants in the Superior Court of the Commonwealth of Massachusetts styled Federal Home Loan Bank of Boston v. Ally Financial, Inc. F/K/A GMAC LLC et al. An amended complaint was filed on June 29, 2012 and alleges that defendants made untrue statements and material omissions in the sale to plaintiff of certain mortgage pass-through certificates backed by securitization trusts containing residential mortgage loans. The total amount of certificates allegedly issued by MS&Co. or sold to plaintiff by MS&Co. was approximately $385 million. The amended complaint raises claims under the Massachusetts Uniform Securities Act, the Massachusetts Consumer Protection Act and common law and seeks, among other things, to rescind the plaintiff’s purchase of such certificates. On May 26, 2011, defendants removed the case to the United States District Court for the District of Massachusetts. The defendants’ motions to dismiss the amended complaint were granted in part and denied in part on September 30, 2013. On November 25, 2013, July 16, 2014, and May 19, 2015, respectively, the plaintiff voluntarily dismissed its claims against MS&Co. with respect to three of the securitizations at issue. After these voluntary dismissals, the remaining amount of certificates allegedly issued by MS&Co. or sold to plaintiff by MS&Co. was approximately $332 million. On February 6, 2017, the action was remanded to the Superior Court of the Commonwealth of Massachusetts. At December 25, 2017, the current unpaid balance of the mortgage pass-through certificates at issue remaining in this action was approximately $46 million, and the certificates had not yet incurred actual losses. Based on currently available information, MS&Co. believes it could incur a loss in this action up to the difference between the $46 million unpaid balance of these certificates (plus any losses incurred) and their fair market value at the time of a judgment against MS&Co., or upon sale, plus pre- and post-judgment interest, fees and costs. MS&Co. may be entitled to be indemnified for some of these losses and to an offset for interest received by the plaintiff prior to a judgment.
11
On May 3, 2013, plaintiffs in Deutsche Zentral-Genossenschaftsbank AG et al. v. Morgan Stanley et al. filed a complaint against MS&Co., certain affiliates, and other defendants in the Supreme Court of NY. The complaint alleges that defendants made material misrepresentations and omissions in the sale to plaintiffs of certain mortgage pass-through certificates backed by securitization trusts containing residential mortgage loans. The total amount of certificates allegedly sponsored, underwritten and/or sold by MS&Co. to plaintiff was approximately $634 million. The complaint alleges causes of action against MS&Co. for common law fraud, fraudulent concealment, aiding and abetting fraud, negligent misrepresentation, and rescission and seeks, among other things, compensatory and punitive damages. On June 10, 2014, the court granted in part and denied in part MS&Co.’s motion to dismiss the complaint. On June 20, 2017 the Appellate Division, First Department, affirmed the lower court’s June 10, 2014 order. On July 28, 2017, MS&Co. filed a motion for leave to appeal that decision to the New York Court of Appeals. On October 3, 2017, the Appellate Division, First Department denied MS&Co.’s motion for leave to appeal. At December 25, 2017, the current unpaid balance of the mortgage pass-through certificates at issue in this action was approximately $215 million, and the certificates had incurred actual losses of approximately $88 million. Based on currently available information, MS&Co. believes it could incur a loss in this action up to the difference between the $215 million unpaid balance of these certificates (plus any losses incurred) and their fair market value at the time of a judgment against MS&Co., or upon sale, plus pre- and post-judgment interest, fees and costs. MS&Co. may be entitled to be indemnified for some of these losses.
On May 17, 2013, plaintiff in IKB International S.A. in Liquidation, et al. v. Morgan Stanley, et al. filed a complaint against MS&Co. and certain affiliates in the Supreme Court of NY. The complaint alleges that defendants made material misrepresentations and omissions in the sale to plaintiff of certain mortgage pass-through certificates backed by securitization trusts containing residential mortgage loans. The total amount of certificates allegedly sponsored, underwritten and/or sold by MS&Co. to plaintiff was approximately $133 million. The complaint alleges causes of action against MS&Co. for common law fraud, fraudulent concealment, aiding and abetting fraud, and negligent misrepresentation, and seeks, among other things, compensatory and punitive damages. On October 29, 2014, the court granted in part and denied in part MS&Co.’s motion to dismiss. All claims regarding four certificates were dismissed. After these dismissals, the remaining amount of certificates allegedly issued by MS&Co. or sold to plaintiff by MS&Co. was approximately $116 million. On August 11, 2016, the Appellate Division, First Department affirmed the trial court’s decision denying in part MS&Co.’s motion to dismiss the complaint. At December 25, 2017, the current unpaid balance of the mortgage pass-through certificates at issue in this action was approximately $24 million, and the certificates had incurred actual losses of $58 million. Based on currently available information, MS&Co. believes it could incur a loss in this action up to the difference between the $24 million unpaid balance of these certificates (plus any losses incurred) and their fair market value at the time of a judgment against MS&Co., or upon sale, plus pre- and post-judgment interest, fees and costs. MS&Co. may be entitled to be indemnified for some of these losses and to an offset for interest received by the plaintiff prior to a judgment.
On April 1, 2016, the California Attorney General’s Office filed an action against MS&Co. in California state court styled California v. Morgan Stanley, et al., on behalf of California investors, including the California Public Employees’ Retirement System and the California Teachers’ Retirement System. The complaint alleges that MS&Co. made misrepresentations and omissions regarding residential mortgage-backed securities and notes issued by the Cheyne SIV (defined below), and asserts violations of the California False Claims Act and other state laws and seeks treble damages, civil penalties, disgorgement, and injunctive relief. On September 30, 2016, the court granted MS&Co.’s demurrer, with leave to replead. On October 21, 2016, the California Attorney General filed an amended complaint. On January 25, 2017, the court denied MS&Co.’s demurrer with respect to the amended complaint.
Settled Civil Litigation
On August 25, 2008, MS&Co. and two ratings agencies were named as defendants in a purported class action related to securities issued by a structured investment vehicle called Cheyne Finance PLC and Cheyne Finance LLC (together, the “Cheyne SIV”). The case was styled Abu Dhabi Commercial Bank, et al. v. Morgan Stanley & Co. Inc., et al. The complaint alleged, among other things, that the ratings assigned to the securities issued by the Cheyne SIV were false and misleading, including because the ratings did not accurately reflect the risks associated with the subprime residential mortgage backed securities held by the Cheyne SIV. The plaintiffs asserted allegations of aiding and abetting fraud and negligent misrepresentation relating to approximately $852 million of securities issued by the Cheyne SIV. On April 24, 2013, the parties reached an agreement to settle the case, and on April 26, 2013, the court dismissed the action with prejudice.
12
On December 23, 2009, the Federal Home Loan Bank of Seattle filed a complaint against MS&Co. and another defendant in the Superior Court of the State of Washington, styled Federal Home Loan Bank of Seattle v. Morgan Stanley & Co. Inc., et al. The amended complaint, filed on September 28, 2010, alleges that defendants made untrue statements and material omissions in the sale to plaintiff of certain mortgage pass-through certificates backed by securitization trusts containing residential mortgage loans. The total amount of certificates allegedly sold to plaintiff by MS&Co. was approximately $233 million. The complaint raises claims under the Washington State Securities Act and seeks, among other things, to rescind the plaintiff’s purchase of such certificates. On January 23, 2017, the parties reached an agreement to settle the litigation.
On March 15, 2010, the Federal Home Loan Bank of San Francisco filed a complaint against MS&Co. and other defendants in the Superior Court of the State of California styled Federal Home Loan Bank of San Francisco v. Credit Suisse Securities (USA) LLC, et al. An amended complaint filed on June 10, 2010 alleged that defendants made untrue statements and material omissions in connection with the sale to plaintiff of a number of mortgage pass-through certificates backed by securitization trusts containing residential mortgage loans. The amount of certificates allegedly sold to plaintiff by MS&Co. was approximately $704 million. The complaint raised claims under both the federal securities laws and California law and sought, among other things, to rescind the plaintiff’s purchase of such certificates. On January 26, 2015, as a result of a settlement with certain other defendants, the plaintiff requested and the court subsequently entered a dismissal with prejudice of certain of the plaintiff’s claims, including all remaining claims against MS&Co.
On March 15, 2010, the Federal Home Loan Bank of San Francisco filed a complaint against MS&Co. and other defendants in the Superior Court of the State of California styled Federal Home Loan Bank of San Francisco v. Deutsche Bank Securities Inc. et al. An amended complaint, filed on June 10, 2010, alleges that defendants made untrue statements and material omissions in connection with the sale to plaintiff of certain mortgage pass-through certificates backed by securitization trusts containing residential mortgage loans. The amount of certificates allegedly sold to plaintiff by MS&Co. was approximately $276 million. The complaint raises claims under both the federal securities laws and California law and seeks, among other things, to rescind the plaintiff’s purchase of such certificates. On December 21, 2016, the parties reached an agreement to settle the litigation.
On July 9, 2010 and February 11, 2011, Cambridge Place Investment Management Inc. filed two separate complaints against MS&Co. and/or its affiliates and other defendants in the Superior Court of the Commonwealth of Massachusetts, both styled Cambridge Place Investment Management Inc. v. Morgan Stanley & Co., Inc., et al. The complaints asserted claims on behalf of certain clients of plaintiff’s affiliates and alleged that defendants made untrue statements and material omissions in the sale of a number of mortgage pass-through certificates backed by securitization trusts containing residential mortgage loans. The total amount of certificates allegedly issued by MS&Co. and/or its affiliates or sold to plaintiff’s affiliates’ clients by MS&Co. and/or its affiliates in the two matters was approximately $263 million. On February 11, 2014, the parties entered into an agreement to settle the litigation. On February 20, 2014, the court dismissed the action.
On October 25, 2010, MS&Co., certain affiliates and Pinnacle Performance Limited, a special purpose vehicle (“SPV”), were named as defendants in a purported class action in the United States District Court for the Southern District of New York (“SDNY”), styled Ge Dandong, et al. v. Pinnacle Performance Ltd., et al. On January 31, 2014, the plaintiffs in the action, which related to securities issued by the SPV in Singapore, filed a second amended complaint, which asserted common law claims of fraud, aiding and abetting fraud, fraudulent inducement, aiding and abetting fraudulent inducement, and breach of the implied covenant of good faith and fair dealing. On July 17, 2014, the parties reached an agreement to settle the litigation, which received final court approval on July 2, 2015.
On July 5, 2011, Allstate Insurance Company and certain of its affiliated entities filed a complaint against MS&Co. in the Supreme Court of NY, styled Allstate Insurance Company, et al. v. Morgan Stanley, et al. An amended complaint was filed on September 9, 2011, and alleged that the defendants made untrue statements and material omissions in the sale to the plaintiffs of certain mortgage pass-through certificates backed by securitization trusts containing residential mortgage loans. The total amount of certificates allegedly issued and/or sold to the plaintiffs by MS&Co. was approximately $104 million. The complaint raised common law claims of fraud, fraudulent inducement, aiding and abetting fraud, and negligent misrepresentation and seeks, among other things, compensatory and/or recessionary damages associated with the plaintiffs’ purchases of such certificates. On January 16, 2015, the parties reached an agreement to settle the litigation.
13
On July 18, 2011, the Western and Southern Life Insurance Company and certain affiliated companies filed a complaint against MS&Co. and other defendants in the Court of Common Pleas in Ohio, styled Western and Southern Life Insurance Company, et al. v. Morgan Stanley Mortgage Capital Inc., et al. An amended complaint was filed on April 2, 2012 and alleged that defendants made untrue statements and material omissions in the sale to plaintiffs of certain mortgage pass-through certificates backed by securitization trusts containing residential mortgage loans. The amount of the certificates allegedly sold to plaintiffs by MS&Co. was approximately $153 million. On June 8, 2015, the parties reached an agreement to settle the litigation.
On September 2, 2011, the Federal Housing Finance Agency, as conservator for Fannie Mae and Freddie Mac, filed 17 complaints against numerous financial services companies, including MS&Co. and certain affiliates. A complaint against MS&Co. and certain affiliates and other defendants was filed in the Supreme Court of NY, styled Federal Housing Finance Agency, as Conservator v. Morgan Stanley et al. The complaint alleged that defendants made untrue statements and material omissions in connection with the sale to Fannie Mae and Freddie Mac of residential mortgage pass-through certificates with an original unpaid balance of approximately $11 billion. The complaint raised claims under federal and state securities laws and common law and sought, among other things, rescission and compensatory and punitive damages. On February 7, 2014, the parties entered into an agreement to settle the litigation. On February 20, 2014, the court dismissed the action.
On April 25, 2012, Metropolitan Life Insurance Company and certain affiliates filed a complaint against MS&Co. and certain affiliates in the Supreme Court of NY, styled Metropolitan Life Insurance Company, et al. v. Morgan Stanley, et al. An amended complaint was filed on June 29, 2012, and alleged that the defendants made untrue statements and material omissions in the sale to the plaintiffs of certain mortgage pass-through certificates backed by securitization trusts containing residential mortgage loans. The total amount of certificates allegedly sponsored, underwritten, and/or sold by MS&Co. was approximately $758 million. The amended complaint raised common law claims of fraud, fraudulent inducement, and aiding and abetting fraud and sought, among other things, rescission, compensatory, and/or rescissionary damages, as well as punitive damages, associated with the plaintiffs’ purchases of such certificates. On April 11, 2014, the parties entered into a settlement agreement.
On April 25, 2012, The Prudential Insurance Company of America and certain affiliates filed a complaint against MS&Co. and certain affiliates in the Superior Court of the State of New Jersey, styled The Prudential Insurance Company of America, et al. v. Morgan Stanley, et al. On October 16, 2012, plaintiffs filed an amended complaint. The amended complaint alleged that defendants made untrue statements and material omissions in connection with the sale to plaintiffs of certain mortgage pass-through certificates backed by securitization trusts containing residential mortgage loans. The total amount of certificates allegedly sponsored, underwritten and/or sold by MS&Co. was approximately $1.073 billion. The amended complaint raised claims under the New Jersey Uniform Securities Law, as well as common law claims of negligent misrepresentation, fraud, fraudulent inducement, equitable fraud, aiding and abetting fraud, and violations of the New Jersey Racketeer Influenced and Corrupt Organizations Act, and included a claim for treble damages. On January 8, 2016, the parties reached an agreement to settle the litigation.
In re Morgan Stanley Mortgage Pass-Through Certificates Litigation, which had been pending in the SDNY, was a putative class action involving allegations that, among other things, the registration statements and offering documents related to the offerings of certain mortgage pass-through certificates in 2006 and 2007 contained false and misleading information concerning the pools of residential loans that backed these securitizations. On December 18, 2014, the parties’ agreement to settle the litigation received final court approval, and on December 19, 2014, the court entered an order dismissing the action.
On November 4, 2011, the Federal Deposit Insurance Corporation, as receiver for Franklin Bank S.S.B, filed two complaints against MS&Co. in the District Court of the State of Texas. Each was styled Federal Deposit Insurance Corporation as Receiver for Franklin Bank, S.S.B v. Morgan Stanley & Company LLC F/K/A Morgan Stanley & Co. Inc. and alleged that MS&Co. made untrue statements and material omissions in connection with the sale to plaintiff of mortgage pass-through certificates backed by securitization trusts containing residential mortgage loans. The amount of certificates allegedly underwritten and sold to plaintiff by MS&Co. in these cases was approximately $67 million and $35 million, respectively. On July 2, 2015, the parties reached an agreement to settle the litigation.
14
On February 14, 2013, Bank Hapoalim B.M. filed a complaint against MS&Co. and certain affiliates in the Supreme Court of NY, styled Bank Hapoalim B.M. v. Morgan Stanley et al. The complaint alleged that defendants made material misrepresentations and omissions in the sale to plaintiff of certain mortgage pass-through certificates backed by securitization trusts containing residential mortgage loans. The total amount of certificates allegedly sponsored, underwritten and/or sold by MS&Co. to plaintiff was approximately $141 million. On July 28, 2015, the parties reached an agreement to settle the litigation, and on August 12, 2015, the plaintiff filed a stipulation of discontinuance with prejudice.
On September 23, 2013, the plaintiff in National Credit Union Administration Board v. Morgan Stanley & Co. Inc., et al. filed a complaint against MS&Co. and certain affiliates in the SDNY. The complaint alleged that defendants made untrue statements of material fact or omitted to state material facts in the sale to the plaintiff of certain mortgage pass-through certificates issued by securitization trusts containing residential mortgage loans. The total amount of certificates allegedly sponsored, underwritten and/or sold by MS&Co. to plaintiffs in the matter was approximately $417 million. The complaint alleged violations of federal and various state securities laws and sought, among other things, rescissionary and compensatory damages. On November 23, 2015, the parties reached an agreement to settle the matter.
On September 16, 2014, the Virginia Attorney General’s Office filed a civil lawsuit, styled Commonwealth of Virginia ex rel. Integra REC LLC v. Barclays Capital Inc., et al., against MS&Co. and several other defendants in the Circuit Court of the City of Richmond related to RMBS. The lawsuit alleged that MS&Co. and the other defendants knowingly made misrepresentations and omissions related to the loans backing RMBS purchased by the Virginia Retirement System. The complaint asserted claims under the Virginia Fraud Against Taxpayers Act, as well as common law claims of actual and constructive fraud, and sought, among other things, treble damages and civil penalties. On January 6, 2016, the parties reached an agreement to settle the litigation. An order dismissing the action with prejudice was entered on January 28, 2016.
Additional lawsuits containing claims similar to those described above may be filed in the future. In the course of its business, MS&Co., as a major futures commission merchant, is party to various civil actions, claims and routine regulatory investigations and proceedings that the General Partner believes do not have a material effect on the business of MS&Co. MS&Co. may establish reserves from time to time in connections with such actions.
15
Item 4. Mine Safety Disclosures. Not Applicable.
16
PART II
Item 5. Market for Registrant’s Common Equity Related Stockholder Matters and Issuer Purchases of Equity Securities.
| (a) | Market Information. The Partnership has issued no stock. There is no public market for the Redeemable Units. |
| (b) | Holders. The number of holders of Redeemable Units as of February 28, 2018 was 7,681 for Class A Redeemable Units and 61 for Class Z Redeemable Units. |
| (c) | Dividends. The Partnership did not declare any distributions in 2017 or 2016. The Partnership does not intend to declare distributions in the foreseeable future. |
| (d) | Securities Authorized for Issuance Under Equity Compensation Plans. None. |
| (e) | Performance Graph. Not applicable. |
| (f) | Recent Sales of Unregistered Securities; Use of Proceeds from Registered Securities. For the twelve months ended December 31, 2017, there were subscriptions of 11,683.0890 Redeemable Units of Class A totaling $33,736,567 and 1,074.6210 Redeemable Units of Class Z totaling $1,180,838. For the twelve months ended December 31, 2016, there were subscriptions of 28,744.7430 Redeemable Units of Class A totaling $87,337,421 and 576.7720 Redeemable Units of Class Z totaling $663,409. For the twelve months ended December 31, 2015, there were subscriptions of 43,748.0220 Redeemable Units of Class A totaling $134,607,790 and 637.6420 Redeemable Units of Class Z totaling $745,805. The Redeemable Units were issued in reliance upon applicable exemptions from registration under Section 4(a)(2) of the Securities Act of 1933, as amended (the “Securities Act”), and Section 506 of Regulation D promulgated thereunder. The Redeemable Units were purchased by accredited investors as described in Regulation D. In determining the applicability of the exemption, the General Partner relied on the fact that the Redeemable Units were purchased by accredited investors in a private offering. |
| Proceeds of net offering were used for the trading of commodity interests including futures, option and forward contracts and any other interests pertaining thereto, including interests in commodity pools. |
| (g) | Purchases of Equity Securities by the Issuer and Affiliated Purchasers. |
The following chart sets forth the purchases of Redeemable Units for each Class by the Partnership.
| Period |
Class A Units Purchased* |
Class A (b) Average Price Paid per Redeemable Unit** |
Class Z (a) Total Number of Redeemable Units Purchased* |
Class Z (b) Average Price Paid per Redeemable Unit** |
(c) Total Number of Units Purchased as Part of Publicly Announced Plans or Programs |
(d) Maximum Number Dollar Value) of that May Yet Be |
||||||||||||||||||
| October 1, 2017 - October 31, 2017 |
5,218.5230 | $ | 2,832.70 | 43.8600 | $ | 1,098.21 | N/A | N/A | ||||||||||||||||
| November 1, 2017 - November 30, 2017 |
5,075.4690 | $ | 2,821.62 | - | $ | - | N/A | N/A | ||||||||||||||||
| December 1, 2017 - December 31, 2017 |
5,450.7660 | $ | 2,887.46 | 60.5460 | $ | 1,122.81 | N/A | N/A | ||||||||||||||||
| 15,744.7580 | $ | 2,848.09 | 104.4060 | $ | 1,112.48 | |||||||||||||||||||
| * | Generally, limited partners are permitted to redeem their Redeemable Units as of the end of each month on three business days’ notice to the General Partner. Under certain circumstances, the General Partner may compel redemption, although to date the General Partner has not exercised this right. Purchases of Redeemable Units by the Partnership reflected in the chart above were made in the ordinary course of the Partnership’s business in connection with effecting redemptions for limited partners. |
| ** | Redemptions of Redeemable Units are effected as of the end of each month at the net asset value per Redeemable Unit as of that day. No fee will be charged for redemptions. |
17
Item 6. Selected Financial Data.
Total investment income, total expenses, total trading results, net income (loss) and increase (decrease) in net asset value per Redeemable Unit for the years ended December 31, 2017, 2016, 2015, 2014 and 2013 and net asset value per Redeemable Unit and total assets at December 31, 2017, 2016, 2015, 2014 and 2013 were as follows:
| 2017 | 2016 | 2015 | 2014 | 2013 | ||||||||||||||||
| Total investment income |
$ | 6,686,384 | $ | 2,461,219 | $ | 207,603 | $ | 117,686 | $ | 289,693 | ||||||||||
| Total expenses |
(38,086,579) | (43,596,347) | (56,173,898) | (77,711,096) | (55,902,607) | |||||||||||||||
| Total trading results |
(1,840,380) | 35,131,599 | 30,010,980 | 234,777,294 | 47,905,662 | |||||||||||||||
|
|
|
|
|
|
|
|
|
|
|
|||||||||||
| Net income (loss) |
$ | (33,240,575) | $ | (6,003,529) | $ | (25,955,315) | $ | 157,183,884 | $ | (7,707,252) | ||||||||||
|
|
|
|
|
|
|
|
|
|
|
|||||||||||
| Increase (decrease) in net asset value per Redeemable Unit: |
||||||||||||||||||||
| Class A |
$ | (95.18) | $ | (22.20) | $ | (71.94) | $ | 424.55 | $ | (4.23) | ||||||||||
|
|
|
|
|
|
|
|
|
|
|
|||||||||||
| Class Z |
$ | (17.17) | $ | 6.50 | $ | (14.75) | $ | 170.88 | $ | 14.03 | ||||||||||
|
|
|
|
|
|
|
|
|
|
|
|||||||||||
| Net asset value per Redeemable Unit |
||||||||||||||||||||
| Class A |
$ | 2,887.46 | $ | 2,982.64 | $ | 3,004.84 | $ | 3,076.78 | $ | 2,652.23 | ||||||||||
|
|
|
|
|
|
|
|
|
|
|
|||||||||||
| Class Z |
$
|
1,122.81
|
|
$ | 1,139.98 | $
|
1,133.48
|
|
$
|
1,148.23
|
|
$
|
977.35
|
| ||||||
|
|
|
|
|
|
|
|
|
|
|
|||||||||||
| Total assets |
$ | 818,584,324 | $ | 1,021,476,101 | $ | 1,105,487,549 | $ | 1,154,055,168 | $ | 1,182,185,867 | ||||||||||
|
|
|
|
|
|
|
|
|
|
|
|||||||||||
Item 7. Management’s Discussion and Analysis of Financial Condition and Results of Operations.
Overview
The Partnership seeks to achieve substantial capital appreciation through speculative trading, directly or indirectly, through its investment in the Funds, in U.S. and international markets for currencies, interest rates, stock indices, agricultural and energy products and precious and base metals. The Partnership/Funds may employ futures, options on futures and forward contracts in those markets. The Funds may also engage in swap transactions and other derivative transactions with the approval of the General Partner.
The General Partner manages all business of the Partnership/Funds. The General Partner has delegated its responsibility for the investment of the Partnership’s capital to Winton, Transtrend, Willowbridge and Systematica. The General Partner engages a team of approximately 25 professionals whose primary emphasis is on attempting to maintain quality control among the Advisors to the funds operated or managed by the General Partner. A full-time staff of due diligence professionals use proprietary technology and on-site evaluations to monitor new and existing futures money managers. The accounting and operations staff provide processing of subscriptions and redemptions and reporting to limited partners and regulatory authorities. The General Partner also includes staff involved in marketing and sales support. In selecting the Advisors for the Partnership, the General Partner considered, among other factors, past performance, trading style, volatility of markets traded and fee requirements. The General Partner may modify or terminate the allocation of assets to the Advisors at any time and may allocate assets to additional advisors at any time.
Responsibilities of the General Partner include:
| • | due diligence examinations of the Advisors; |
| • | selection, appointment and termination of the Advisors; |
| • | negotiation of the Management Agreements; and |
| • | monitoring the activity of the Advisors. |
In addition, the General Partner will prepare, or will assist the Administrator in preparing, the books and records and will provide, or will assist the Administrator in providing, the administrative and compliance services that are required by law or regulation, from time to time, in connection with the operation of the Partnership/Funds.
18
While the Partnership and the Funds have the right to seek lower commission rates from other commodity brokers at any time, the General Partner believes that the customer agreements and other arrangements with the commodity broker are fair, reasonable, and competitive.
The programs traded by each Advisor on behalf of the Partnership are: Transtrend — Diversified Trend Program — Enhanced Risk Portfolio (US Dollar); Willowbridge — wPraxis Futures Trading Approach; Winton — the Winton Futures Program; and Systematica — BlueTrend Program. The General Partner may modify or terminate the allocation of assets among trading advisors at any time and may allocate assets to additional advisors at any time. As of December 31, 2017 and September 30, 2017, the Partnership’s assets were allocated among the trading Advisors in the following approximate percentages:
|
Advisor |
December 31, 2017 | December 31, 2017 (pecentage of net assets) |
September 30, 2017 | September 30, 2017 (pecentage of net assets) |
||||||||||||
| Winton |
$ | 186,704,820 | 23 | % | $ | 170,140,293 | 22 | % | ||||||||
| Transtrend |
$ | 201,170,410 | 25 | % | $ | 197,814,947 | 25 | % | ||||||||
| Willowbridge |
$ | 268,003,108 | 34 | % | $ | 271,132,789 | 34 | % | ||||||||
| Systematica |
$ | 142,654,589 | 18 | % | $ | 151,067,416 | 19 | % | ||||||||
Winton Capital Management Limited
The portion of the Partnership’s assets that are currently allocated to Winton for trading are not invested in commodity interests directly. Winton’s allocation of the Partnership’s assets is currently invested in Winton Master. Winton trades the Winton Futures Program on behalf of Winton Master, a proprietary, systematic trading program.
The investment objective of the Winton Futures Program is to achieve long-term investment growth.
The Winton Futures Program follows a disciplined investment process that is based on statistical analysis of historical data. The initial stage of the process involves collecting, cleaning and organizing large amounts of data. The Winton Futures Program uses a wide variety of data inputs including factors that are intrinsic to markets, such as price, volume and open interest; and those that are external to markets, such as economic statistics, industrial and commodity data and public company financial data. Winton conducts statistical research into the data in an attempt to quantify the probability of particular markets rising or falling, conditional on a variety of quantifiable factors. Winton’s research is used to develop mathematical models that attempt to forecast market returns, the variability or volatility associated with such returns (often described as “risk”), and the correlation between markets and transaction costs. These forecasts are used in investment strategies that determine what positions should be held to maximize profit within a certain range of risk. As a result of Winton’s research, Winton expects that the investments made in accordance with this process will have an improved chance of being successful, which is expected to lead to profits over the long-term.
Winton’s investment programs are operated as automated, computer-based investment systems. The programs are modified over time as Winton monitors their operation and undertakes further research. Changes to the programs occur as a result of, amongst other things, the discovery of new relationships, changes in market liquidity, the availability of new data or the reinterpretation of existing data.
Most of Winton’s investment decisions are made strictly in accordance with the output of the programs. However, Winton may, in exceptional circumstances (such as the occurrence of events that fall outside the input parameters of the programs), make investment decisions based on other factors and take action to override the output of the programs to seek to protect the interests of investors.
Winton does not take any responsibility for the accuracy or completeness of the contents of this document, any representations made herein, or the performance of the Partnership. Winton disclaims any liability for any direct, indirect, consequential or other losses or damages, including loss of profits incurred by limited partners or by any third party that may arise from any reliance on this document. Winton is neither responsible for, nor involved in, the marketing, distribution or sales of shares or interests in the Partnership and is not responsible for compliance with any marketing or promotion laws, rules or regulations; and no third party other than Winton is authorized to make any statement about any of Winton’s products or services in connection with any such marketing, distribution or sales. Past performance by any other fund advised by Winton is not indicative of any future performance by the Partnership.
Transtrend B.V. Inc.
The portion of the Partnership’s assets that are currently allocated to Transtrend for trading are not invested in commodity interests directly. Transtrend’s allocation of the Partnership’s assets is currently in Transtrend Master. Transtrend trades Transtrend Master’s assets, and thereby the Partnership’s assets, in accordance with its Diversified Trend Program-Enhanced Risk Profile (US Dollar), a proprietary, systematic trading system. Transtrend generally trades its Enhanced Risk Profile using 1.5 times the leverage employed by the Standard Risk Profile.
19
Transtrend Master currently trades Financial Instruments (i.e., futures, options, options on futures, swaps, swaps on futures, forward contracts on foreign exchange, interest rates, interest rates instruments, commodities and equity related indices and instruments and other indices) on U.S. and non-U.S. exchanges and OTC markets. One of the potential strengths of the program is the disciplined, systematic and dynamic nature of market participation. The overall performance is determined by the entirety of all markets and all trades. In a systematic market approach, the disciplined application by Transtrend and a consistent participation by the client are both essential to realize the pursued returns over the course of time, although profitability cannot be guaranteed and clients may incur substantial losses on their investment.
Transtrend’s market approach attempts to benefit from directional price moves in outright Financial Instruments and in combinations of Financial Instruments.
Under the Diversified Trend Program’s Standard Risk Profile, Transtrend generally commits an average of approximately 14% of the assets in a client’s account as margin or a premium for Financial Instruments positions. Such percentage has varied, however and is affected by various factors including, without limitation, nominal account size, market conditions, traded markets or the level of margins set by brokers or exchanges. The Diversified Trend Program’s Enhanced Risk Profile generally means 1.5 times the leverage, and as such the average margin commitments of the Standard Risk Profile.
Willowbridge Associates Inc.
The portion of the Partnership’s assets that are allocated to Willowbridge for trading are not invested in commodity interests directly. Willowbridge’s allocation of the Partnership’s assets is currently invested in Willowbridge Master. Willowbridge trades the Partnership’s assets allocated to it in accordance with the wPraxis Futures Trading Approach (“Praxis”), a proprietary, discretionary trading system. Praxis will utilize a fully discretionary trading strategy to build a portfolio consisting of futures on currency, fixed income, stock indices and commodities pursuant to its wPraxis approach. The approach may trade commodities, futures, forwards, options, swaps, spot contracts in the commodities, currencies and fixed income markets. All positions are closely monitored to evaluate risk parameter status. As markets move, positions are refined and expectations updated in response to current market conditions.
Systematica Investments Limited
Systematica directly trades a managed account in the name of the Partnership pursuant to Systematica’s BlueTrend Program. The BlueTrend Program has maximum flexibility to invest in a wide range of derivative instruments, including currencies, futures, options and, with prior written approval of the General Partner, swaps and other derivative instruments. Derivative instruments may be exchange-traded or OTC, as permitted by the Commodity Exchange Act and the rules promulgated thereunder. The BlueTrend Program may engage in short sales. The BlueTrend Program may also retain amounts in cash pending reinvestment or if this is considered appropriate to the investment objective.
The BlueTrend Program seeks to achieve its investment objective through the implementation of a systematic trading model or portfolio of systematic trading models. Such model(s) trade in a number of foreign exchange and commodity instruments, and derivatives relating to those instruments, including swaps, indices, forwards, futures and option contracts.
No assurance can be given that the Advisors’ strategies will be successful or that they will generate profits for the Partnership.
AAA Capital Management Advisors, Ltd.
The portion of the Partnership’s assets that were allocated to AAA for trading was not invested in commodity interests directly, prior to its full redemption effective November 30, 2014. AAA’s allocation of the Partnership’s assets was invested in AAA Master. AAA traded AAA Master’s, and thereby the Partnership’s, assets in accordance with its Energy Program — Futures and Swaps, a proprietary, discretionary trading system.
AAA Master traded energy futures contracts and options on energy futures contracts on domestic and international exchanges, as well as the Goldman Sachs Commodity Index (an index future comprised of energy and other products) traded on the Chicago Mercantile Exchange. AAA Master also engaged in swap transactions involving crude oil and other energy related products. References herein to energy and energy related products include all of the foregoing.
AAA generally based its trading decisions on “fundamental” factors, namely supply and demand for a particular group or type of commodity. AAA attempted to buy undervalued commodities and sell overvalued commodities, often but not always simultaneously. AAA used options to attempt either to reduce or to define risks.
AAA was aware of price trends but does not trade upon trends. AAA often took profits in positions with specific trends even though that trend may still be intact or perhaps even strong. AAA occasionally established positions that are countertrend.
Effective risk management was a crucial aspect of AAA’s trading program. Account size, expectation, volatility of the market traded and the nature of other positions taken are all factors in determining the amount of equity committed to each trade. AAA Master was AAA’s largest account.
20
Specific Fund level performance information is included in Note 6 to the Partnership’s financial statements included in “Item 8. Financial Statements and Supplementary Data.”
For the period January 1, 2017 through December 31, 2017, the average allocation by commodity market sector for each of the Funds was as follows:
| Winton Master | ||||
|
Currencies |
43.2 | % | ||
| Energy |
2.8 | % | ||
| Grains |
2.7 | % | ||
| Indices |
34.1 | % | ||
| Interest Rates U.S. |
3.2 | % | ||
| Interest Rates Non-U.S. |
5.1 | % | ||
| Livestock |
0.9 | % | ||
| Metals |
5.5 | % | ||
| Softs |
2.5 | % | ||
| Transtrend Master | ||||
|
Currencies |
34.1 | % | ||
| Energy |
6.8 | % | ||
| Grains |
5.1 | % | ||
| Indices |
26.5 | % | ||
| Interest Rates U.S. |
3.5 | % | ||
| Interest Rates Non-U.S. |
13.8 | % | ||
| Livestock |
1.1 | % | ||
| Metals |
5.3 | % | ||
| Softs |
3.8 | % | ||
| Willowbridge Master | ||||
|
Currencies |
62.2 | % | ||
| Energy |
4.9 | % | ||
| Indicies |
5.8 | % | ||
| Interest Rates U.S. |
14.2 | % | ||
| Interest Rates Non-U.S. |
11.8 | % | ||
| Metals |
1.1 | % | ||
21
(a) Liquidity.
The Partnership does not engage in sales of goods or services. Its assets are its (i) investment in the Funds, (ii) equity in its trading account, consisting of unrestricted and restricted cash, net unrealized appreciation on open futures contracts, net unrealized appreciation on open forward contracts, options purchased at fair value and investment in U.S. Treasury bills at fair value, if applicable, (iii) cash at bank and (iv) interest receivable. Because of the low margin deposits normally required in commodity futures trading, relatively small price movements may result in substantial losses to the Partnership, through its investments in the Funds and direct investments. While substantial losses could lead to a material decrease in liquidity, no such illiquidity occurred during the year ended December 31, 2017.
To minimize the risk relating to low margin deposits, the Partnership and Funds follow certain trading policies, including:
| (i) | The Partnership/Funds invest their assets only in commodity interests that an Advisor believes are traded in sufficient volume to permit ease of taking and liquidating positions. Sufficient volume, in this context, refers to a level of liquidity that an Advisor believes will permit it to enter and exit trades without noticeably moving the market. |
| (ii) | An Advisor will not initiate additional positions in any commodity if these positions would result in aggregate positions requiring a margin of more than 66 2/3% of the Partnership’s net assets allocated to that Advisor. |
| (iii) | The Partnership/Funds may occasionally accept delivery of a commodity. Unless such delivery is disposed of promptly by retendering the warehouse receipt representing the delivery to the appropriate clearinghouse, the physical commodity position is fully hedged. |
| (iv) | The Partnership/Funds do not employ the trading technique commonly known as “pyramiding,” in which the speculator uses unrealized profits on existing positions as margin for the purchases or sale of additional positions in the same or related commodities. |
| (v) | The Partnership/Funds do not utilize borrowings other than short-term borrowings if the Partnership/Funds take delivery of any cash commodities. |
| (vi) | The Advisors may, from time to time, employ trading strategies such as spreads or straddles on behalf of the Partnership/Funds. “Spreads” and “straddles” describe commodity futures trading strategies involving the simultaneous buying and selling of futures contracts on the same commodity but involving different delivery dates or markets. |
| (vii) | The Partnership/Funds will not permit the churning of their commodity trading accounts. The term “churning” refers to the practice of entering and exiting trades with a frequency unwarranted by legitimate efforts to profit from the trades, driven by the desire to generate commission income. |
From January 1, 2017 through December 31, 2017, the Partnership’s average margin to equity ratio (i.e., the percentage of assets on deposit required for margin) was approximately 21.7%. The foregoing margin to equity ratio takes into account cash held in the Partnership’s name, as well as the allocable value of the positions and cash held on behalf of the Partnership in the name of the Funds.
In the normal course of business, the Partnership and the Funds are party to financial instruments with off-balance sheet risk, including derivative financial instruments and derivative commodity instruments. These financial instruments may include forwards, futures, options, and swaps, whose values are based upon an underlying asset, index, or reference rate, and generally represent future commitments to exchange currencies or cash balances, or to purchase or sell other financial instruments at specific terms at specified future dates, or, in the case of derivative commodity instruments, to have a reasonable possibility to be settled in cash, through physical delivery or with another financial instrument. These instruments may be traded on an exchange, a swap execution facility or OTC. Exchange-traded instruments include futures and certain standardized forward, option and swap contracts. Certain swap contracts may also be traded on a swap execution facility or OTC. OTC contracts are negotiated between contracting parties and also include certain forward and option contracts. Specific market movements of commodities or futures contracts underlying an option cannot accurately be predicted. The purchaser of an option may lose the entire premium paid for the option. The writer or seller of an option has unlimited risk. Each of these instruments is subject to various risks similar to those relating to the underlying financial instruments, including market and credit risk. In general, the risks associated with OTC contracts are greater than those associated with exchange-traded instruments because of the greater risk of default by the counterparty to an OTC contract. The General Partner estimates that at any given time approximately 25.5% to 40.0% of the Partnership’s/Funds’ contracts are traded OTC.
22
As both a buyer and seller of options, the Partnership/Funds pay or receive a premium at the outset and then bear the risk of unfavorable changes in the price of the contract underlying the option. Written options expose the Partnership/Funds to potentially unlimited liability; for purchased options, the risk of loss is limited to the premiums paid. Certain written put options permit cash settlement and do not require the option holder to own the reference asset. The Partnership/Funds do not consider these contracts to be guarantees.
The Partnership and the Funds do not isolate the portion of the results of operations arising from the effect of changes in foreign exchange rates on investments from fluctuations due to changes in market prices of investments held. Such fluctuations are included in total trading results in the Partnership’s/Funds’ Statements of Income and Expenses.
Market risk is the potential for changes in the value of the financial instruments traded by the Partnership/Funds due to market changes, including interest and foreign exchange rate movements and fluctuations in commodity or security prices. Market risk is directly impacted by the volatility and liquidity in the markets in which the related underlying assets are traded. The Partnership/Funds are exposed to a market risk equal to the value of futures and forward contracts purchased and unlimited liability on such contracts sold short.
Credit risk is the possibility that a loss may occur due to the failure of a counterparty to perform according to the terms of a contract. The Partnership’s/Funds’ risk of loss in the event of counterparty default is typically limited to the amounts recognized in the Statements of Financial Condition and is not represented by the contract or notional amounts of the instruments. The Partnership’s/Funds’ risk of loss is reduced through the use of legally enforceable master netting agreements with counterparties that permit the Partnership/Funds to offset unrealized gains and losses and other assets and liabilities with such counterparties upon the occurrence of certain events. The Partnership/Funds had credit risk and concentration risk during the reporting period and prior periods, as MS&Co., an MS&Co. affiliate, JPMorgan and/or CGM are or were counterparties or brokers with respect to the Partnership’s/Funds’ assets. Credit risk with respect to exchange-traded instruments was reduced to the extent that, through MS&Co. and/or CGM, the Partnership’s/Funds’ counterparty was an exchange or clearing organization. The Partnership/Funds continues to be subject to such risks with respect to MS&Co and JPMorgan.
The risk to the limited partners that have purchased Redeemable Units is limited to the amount of their share of the Partnership’s net assets and undistributed profits. This limited liability is a result of the organization of the Partnership as a limited partnership under New York law.
The General Partner monitors and attempts to mitigate the Partnership’s/Funds’ risk exposure on a daily basis through financial, credit and risk management monitoring systems, and accordingly, believes that it has effective procedures for evaluating and limiting the credit and market risks to which the Partnership/Funds may be subject. These monitoring systems generally allow the General Partner to statistically analyze actual trading results with risk-adjusted performance indicators and correlation statistics. In addition, online monitoring systems provide account analysis of futures, exchange-cleared swaps, forward and option contracts by sector, margin requirements, gain and loss transactions and collateral positions. (See also “Item 8. Financial Statements and Supplementary Data” for further information on financial instrument risk included in the notes to financial statements.)
The majority of these financial instruments mature within one year of the inception date. However, due to the nature of the Partnership’s/Funds’ business, these instruments may not be held to maturity.
Other than the risks inherent in U.S. Treasury bills, money market mutual fund securities, commodity futures, forward, options and swaps and other derivatives trading, the Partnership knows of no trends, demands, commitments, events or uncertainties which will result in or which are reasonably likely to result in the Partnership’s liquidity increasing or decreasing in any material way. The Limited Partnership Agreement provides that the Partnership shall terminate under certain circumstances including a decrease in net asset value per Redeemable Unit to less than $400 as of the close of business on any business day. In addition, the General Partner may, in its sole discretion, cause the Partnership to dissolve if the Partnership’s aggregate net assets decline to less than $1,000,000.
(b) Capital Resources.
(i) The Partnership has made no material commitments for capital expenditures.
(ii) The Partnership’s capital consists of the capital contributions of the partners, as increased or decreased by net income or losses on trading and by expenses, interest income, redemptions of Redeemable Units and distributions of profits, if any. Gains or losses on trading cannot be predicted. Market movements in commodities are dependent upon fundamental and technical factors which the Advisors may or may not be able to identify, such as changing supply and demand relationships, weather, government, agricultural, commercial and trade programs and policies, national and international political and economic events and changes in interest rates. Partnership expenses consist of, among other things, clearing fees, ongoing selling agent fees, management and General Partner fees and expenses allocated from Funds. The level of these expenses is dependent upon trading performance and the level of net assets maintained. In addition, the amount of interest income earned by the Partnership’s/Fund’s is dependent upon (1) the average daily equity maintained in cash in the Partnership’s and/or the Funds’ accounts, (2) the amount of U.S. Treasury bills and/or money market mutual fund securities held by the Partnership and/or the Funds and (3) interest rates over which none of the Partnership, the Funds, MS&Co. or JPMorgan has control.
23
No forecast can be made as to the level of redemptions in any given period. A limited partner may require the Partnership to redeem some or all of their Redeemable Units at the net asset value per Redeemable Unit as of the end of each month on three business days notice to the General Partner. There is no fee charged to limited partners in connection with redemptions. Redemptions generally are funded out of the Partnership’s cash holdings and/or redemptions from the Funds. For the year ended December 31, 2017, 69,458.8670 limited partner Redeemable Units of Class A were redeemed totaling $198,980,126, 742.9280 limited partner Redeemable Units of Class Z were redeemed totaling $802,540 and 1,178.1120 General Partner Redeemable Units of Class Z were redeemed totaling $1,274,988. For the year ended December 31, 2016, 56,915.7560 limited partner Redeemable Units of Class A were redeemed totaling $173,180,117, 494.8170 limited partner Redeemable Units of Class Z were redeemed totaling $562,971 and 872.2020 General Partner Redeemable Units of Class Z were redeemed totaling $1,039,843. For the year ended December 31, 2015, 42,202.5340 limited partner Redeemable Units of Class A were redeemed totaling $129,863,543 and 242.4610 limited partner Redeemable Units of Class Z were redeemed totaling $275,546.
The Partnership continues to offer Redeemable Units at the net asset value per Redeemable Unit as of the end of each month. For the year ended December 31, 2017, there were subscriptions of 11,683.0890 limited partner Redeemable Units of Class A totaling $33,736,567 and 1,074.6210 limited partner Redeemable Units of Class Z totaling $1,180,838. For the year ended December 31, 2016, there were subscriptions of 28,744.7430 limited partner Redeemable Units of Class A totaling $87,337,421 and 576.7720 limited partner Redeemable Units of Class Z totaling $663,409. For the year ended December 31, 2015, there were subscriptions of 43,748.0220 limited partner Redeemable Units of Class A totaling $134,607,790 and 637.6420 limited partner Redeemable Units of Class Z totaling $745,805.
(c) Results of Operations.
For the year ended December 31, 2017, the net asset value per Redeemable Unit for Class A decreased 3.2% from $2,982.64 to $2,887.46. For the year ended December 31, 2017, the net asset value per Redeemable Unit for Class Z decreased 1.5% from $1,139.98 to $1,122.81. For the year ended December 31, 2016, the net asset value per Redeemable Unit for Class A decreased 0.7% from $3,004.84 to $2,982.64. For the year ended December 31, 2016, the net asset value per Redeemable Unit for Class Z increased 0.6% from $1,133.48 to $1,139.98. For the year ended December 31, 2015, the net asset value per Redeemable Unit for Class A decreased 2.3% from $3,076.78 to $3,004.84. For the year ended December 31, 2015, the net asset value per Redeemable Unit for Class Z decreased 1.3% from $1,148.23 to $1,133.48.
The Partnership experienced a net trading loss of $1,840,380 before fees and expenses in 2017. Losses were primarily attributable to the Partnership’s/Funds’ trading in currencies, energy, grains, metals, softs and U.S. and non-U.S interest rates and were partially offset by gains in livestock and indices.
During the first quarter, the most notable losses were recorded during January and March from long positions in European and U.S. fixed income as prices declined amid growing hawkish sentiment from central bank across the globe. Losses were also recorded during January and March from long positions in natural gas futures, as well as in currencies from short positions in the euro and Japanese yen. Additional losses were recorded within the metals markets during March and the agricultural sector during January. The Partnership’s first quarter losses were partially offset by gains achieved during February and March from long positions in global equity index futures as prices were buoyed by positive economic sentiment globally.
During the second quarter, the most meaningful losses were recorded in the currency markets during April and May from short positions in the euro versus the U.S. dollar as the dollar weakened amid the debate surrounding the Trump Administration’s alleged ties to Russia. Further losses during April and May were recorded in the energy markets from long positions in the crude oil complex as oil prices pushed lower, as well as in the metals sector. Losses were also recorded during June in global interest rate and agricultural futures. These losses were partially offset by gains recorded in the global equity index sector as long positions in the U.S., Europe, and Asia profited from prices climbing higher during April and May.
During the third quarter, losses were incurred within the global interest rate sector during September from long futures positions in U.S. and European fixed income as hawkish sentiment among the world’s major central banks remained. Additional losses were experienced in the agricultural markets during July from short positions in coffee, sugar, and cocoa and during both July and September from short positions in wheat and soybeans. Smaller losses were incurred in currencies during September and in the energy sector during July. A portion of the Partnership’s losses for the third quarter was offset by gains recorded during July and September from long positions in global equity index futures as stock prices continued to rise on growing confidence in the strength of the global economy. Additional gains were recorded in metals during August from long positions in copper futures.
During the fourth quarter, the Partnership recorded gains in global stock index futures from long positions as equity prices continued their rally on optimism for global economic growth. Gains were also recorded in the energy markets from long positions in crude oil and its refined products as prices rose throughout the quarter on expectations for further output cuts from OPEC and Russia. Additional trading gains were recorded in metals and grains during October and December. The Partnership’s gains for the fourth quarter were partially offset by currency losses experienced October from positions in the Turkish lira, Brazilian real, Mexican peso, and Australian dollar. Net trading results in the fixed income sector were relatively flat for the quarter.
The Partnership experienced a net trading gain of $35,131,599 before fees and expenses in 2016. Gains were primarily attributable to the Partnership’s/Funds’ trading in currencies and U.S. and non-U.S interest rates and were partially offset by losses in energy, livestock, metals, softs, grains and indices.
24
The most significant gains were achieved within the global interest rate sector during January and February from long positions in European and Asian fixed income futures as prices advanced after weakness in Chinese economic data revived concern about the stability of the global economy. Additional gains were recorded during June from long positions in European and U.S. fixed income futures as prices moved higher as uncertainty surrounding the economic and political fallout following the U.K.’s vote in late June to leave the European Union increased demand for the relative “safety” of government debt. Within the currency sector, gains were recorded during June from short positions in the British pound and euro versus the U.S. dollar as the relative value of the European currencies weakened, particularly the pound which dropped sharply, after the U.K. voted to leave the European Union. During October, gains within the currency markets were experienced from short positions in the British pound versus the U.S. dollar as the relative value of the British currency continued to struggle following the June referendum vote. Additional gains were achieved during December from short positions in the Japanese yen versus the U.S. dollar as the relative value of the dollar was spurred higher by positive sentiment following the U.S. presidential election and in anticipation of the Federal Reserve Bank maintaining an aggressive interest rate policy in 2017. The Partnership’s trading gains for the year were offset by trading losses incurred within the energy markets during August and September from short positions in crude oil and its related products as prices moved higher amid speculation of a potential agreement among the OPEC nations to curtail oil production. Losses within the energy sector were also recorded during April from short positions in crude oil and its related products as prices surged as data from the Energy Information Agency showed U.S. crude oil production continued to decline. Within the metals markets, losses were recorded during January and February from short positions in gold and silver futures as prices rose as a weakening U.S. dollar spurred investor demand for precious metals. Within the agricultural sector, losses were incurred during March from short positions in wheat futures as prices moved higher after rainy weather conditions threatened U.S. Midwest farmland. Additional losses in this sector were recorded during January and April from corn futures positions. Losses within the global stock index markets were experienced during June from long positions in U.S., European, and Asian equity index futures as prices declined amid uncertainty surrounding the economic situation in Europe. Additional losses within the global stock index sector were experienced during April from short positions in Asian and European equity index futures as prices rallied early in the month amid signs of optimism about the global economy.
Interest income is earned on 100% of the average daily equity maintained in cash in the Partnership’s (or the Partnership’s allocable portion of Willowbridge Master’s or Winton Master’s) brokerage account during each month at the rate equal to the monthly average of the 4-week U.S. Treasury bill discount rate. MS&Co. will pay monthly interest to Transtrend Master on 100% of the average daily equity maintained in cash in Transtrend Master’s brokerage account during each month at the rate equal to the monthly average of the 4-week U.S. Treasury bill discount rate less 0.15% during such month but in no event less than zero. When the effective rate is less than zero, no interest is earned. Any interest earned on the Partnership’s and/or each Fund’s cash account in excess of the amounts described above, if any, will be retained by MS&Co. and/or shared with the General Partner. All interest earned on U.S. Treasury bills and money market mutual fund securities will be retained by the Partnership and/or the Funds, as applicable. Any interest income earned on collateral or excess cash deposited by certain of the Funds and held by JPMorgan in its capacity as such Funds’ forward foreign currency counterparty will be retained by such Funds, and the Partnership will receive its allocable portion of such interest from the applicable Fund. Interest income earned by the Partnership for the three and twelve months ended December 31, 2017 increased by $1,418,423 and $4,225,165, respectively, as compared to the corresponding periods in 2016. The increase in interest income is primarily due to higher 4-week U.S. Treasury bill discount rates during the three and twelve months ended December 31, 2017 as compared to the corresponding periods in 2016. Interest earned by the Partnership will increase the net asset value of the Partnership. The amount of interest income earned by the Partnership depends on (1) the average daily equity maintained in cash in the Partnership’s and/or the Funds’ accounts, (2) the amount of U.S. Treasury bills and/or money market mutual fund securities held by the Partnership and/or the Funds and (3) interest rates over which none of the Partnership, the Fund, MS&Co. or JPMorgan has control.
Certain clearing fees are based on the number of trades executed by the Advisors for the Partnership/Funds. Accordingly, they must be compared in relation to the number of trades executed during the period. Clearing fees related to direct investments for the three months ended December 31, 2017 decreased by $16,710 as compared to the corresponding period in 2016. The decrease in these clearing fees is primarily due to a decrease in the number of direct trades made by the Partnership during the three months ended December 31, 2017 as compared to the corresponding period in 2016. Clearing fees related to direct investments for the twelve months ended December 31, 2017 increased by $116,022 as compared to the corresponding period in 2016. The increase in these clearing fees is primarily due to an increase in the number of direct trades made by the Partnership during the twelve months ended December 31, 2017 as compared to the corresponding period in 2016.
Ongoing selling agent fees are based on the number of trades executed by the Advisors. Accordingly, they must be compared in relation to the number of trades executed during the period. Ongoing selling agent fees for the three and twelve months ended December 31, 2017 increased by $329,985 and $983,242, respectively, as compared to the corresponding periods in 2016. The increase in ongoing selling agent fees is primarily due to an increase in the number of trades during the three and twelve months ended December 31, 2017 as compared to the corresponding periods in 2016.
Management fees, except fees payable to Transtrend, are calculated as a percentage of the Partnership’s adjusted net asset value as of the end of each month and are affected by trading performance, subscriptions and redemptions. Accordingly, they must be compared in relation to the fluctuations in the monthly net asset values. Management fees payable to Transtrend are charged at the Transtrend Master level and are affected by trading performance, subscriptions and redemptions of Transtrend Master. Management fees for the three and twelve months ended December 31, 2017 decreased by $722,072 and $2,753,401, respectively, as compared to the corresponding periods in 2016. The decrease in management fees is due to lower average adjusted net assets during the three and
25
twelve months ended December 31, 2017 as compared to the corresponding periods in 2016.
Fees are paid to the General Partner for administering the business and affairs of the Partnership including, among other things, (i) selecting, appointing and terminating the Partnership’s commodity trading advisors, (ii) allocating and reallocating the Partnership’s assets among the commodity trading advisors and (iii) monitoring the activities of the commodity trading advisors. These fees are calculated as a percentage of the Partnership’s adjusted net asset value as of the end of each month and are affected by trading performance, subscriptions and redemptions. Accordingly, they must be compared in relation to the fluctuations in the monthly net asset values. The General Partner fees for the three and twelve months ended December 31, 2017 decreased by $373,310 and $1,446,434, respectively, as compared to the corresponding periods in 2016. The decrease in the General Partner fees is due to lower average adjusted net assets during the three and twelve months ended December 31, 2017 as compared to the corresponding periods in 2016.
Incentive fees paid by the Partnership are based on the new trading profits, as defined in the respective management agreement among the Partnership, the General Partner and each Advisor, generated by each Advisor at the end of the quarter, calendar half year or annually, as applicable. Trading performance for the three and twelve months ended December 31, 2017 resulted in incentive fees of $0 and $25,157, respectively. Trading performance for the three and twelve months ended December 31, 2016 resulted in incentive fees of $0 and $2,088,183, respectively. To the extent an Advisor incurs a loss for the Partnership, the Advisor will not be paid an incentive fee until such Advisor recovers any net loss incurred by the Advisor and earns additional new trading profits for the Partnership.
The Partnership pays professional fees, which generally include legal, accounting expenses, administrative, filing, reporting and data processing fees. Professional fees for the years ended December 31, 2017 and 2016 were $1,713,581 and $2,271,832, respectively.
The Partnership experienced a net trading gain of $30,010,980 before fees and expenses in 2015. Gains were primarily attributable to the Partnership’s/Funds’ trading in energy, non-U.S interest rates, livestock, metals and softs and were partially offset by losses in currencies, grains, indices and U.S interest rates.
The most significant losses were incurred within the global stock index markets during August from long positions in U.S., European, and Asian equity index futures as prices fell amid concern a slowdown in Chinese economic growth would adversely affect the global economy. Losses within this sector were also recorded during December from long futures positions in European, U.S., and Asian equity index futures as prices retreated on a gloomy global economic outlook driven by weakness in China. Additional losses in this sector were incurred during June. Within the currency sector, losses were recorded during December from short positions in the euro and Swiss franc versus the U.S. dollar as the relative values of these European currencies reversed higher early in the month after the scale of the European Central Bank’s stimulus measures disappointed investors. Additional losses in the currency sector were experienced during April from short positions in the euro versus the U.S. dollar after the relative value of the dollar declined following the release of lower-than-expected first quarter Gross Domestic Product totals in the U.S. Smaller currency losses were experienced in August. Within the agricultural complex, losses were experienced during June from short positions in corn and wheat futures as prices rallied after heavy rainfall in the U.S. Midwest raised the potential for crop damage. Losses in the agricultural sector were also incurred during October from short positions in live cattle futures as prices rose following an increase in demand for beef exports. Within the global interest rate sector, losses were recorded during December from long positions in European fixed income futures after prices reversed sharply lower as European Central Bank (“ECB”) president Mario Draghi disappointed markets early in the month with an underwhelming ECB stimulus announcement. Additional losses during December were recorded from long positions in U.S. fixed income futures as the U.S. Federal Reserve indicated future interest rate increases were “imminent”. The Partnership’s losses for the year were offset by gains achieved within the energy markets primarily during July and September from short positions in crude oil and its related products as prices fell as increased oil production in the U.S. and Middle East added to a growing global supply glut. Gains were also recorded within the energy sector during November and December from short positions in the crude oil complex as the OPEC nations declined to cut production levels to maintain market share. Within the metals markets, gains were achieved during July from short positions in gold and silver futures as prices moved lower as a strengthening U.S. dollar curbed demand for precious metals as a store of value. Additional gains within the metals sector were achieved during July and November from short positions in copper futures as continued weakness in the Chinese economy threatened to diminish demand for industrial metals.
In the General Partner’s opinion, the Partnership’s Advisors continue to employ trading methods consistent with the objectives of the Partnership/Funds. The General Partner/managing member/trading manager monitors the Advisors’ performance on a daily, weekly, monthly and annual basis to assure these objectives are met.
26
Commodity futures markets are highly volatile. Broad price fluctuations and rapid inflation increase the risks involved in commodity trading, but also increase the possibility of profit. The profitability of the Partnership/Funds depends on the existence of major price trends and the ability of the Advisors to correctly identify those price trends. Price trends are influenced by, among other things, changing supply and demand relationships, weather, governmental, agricultural, commercial and trade programs and policies, national and international political and economic events and changes in interest rates. To the extent that market trends exist and Advisors are able to identify them, the Funds and the Partnership expect to increase capital through operations.
In allocating the assets of the Partnership among the Advisors, the General Partner considers, among other factors, each Advisor’s past performance, trading style, volatility of markets traded and fee requirements. The General Partner may modify or terminate the allocation of assets among the Advisors and may allocate assets to additional advisors at any time. Each Advisor’s percentage allocation and trading program is described in the “Overview” section of this Item 7.
(d) Off-balance Sheet Arrangements. None.
(e) Contractual Obligations. None.
(f) Operational Risk.
The Partnership, directly or indirectly through its investment in the Funds, is exposed to market risk and credit risk, which arise in the normal course of its business activities. Slightly less direct, but of critical importance, are risks pertaining to operational and back office support. This is particularly the case in a rapidly changing and increasingly global environment with increasing transaction volumes and an expansion in the number and complexity of products in the marketplace.
Such risks include:
Operational/Settlement Risk — the risk of financial and opportunity loss and legal liability attributable to operational problems, such as inaccurate pricing of transactions, untimely trade execution, clearance and/or settlement, or the inability to process large volumes of transactions. The Partnership/Funds are subject to increased risks with respect to their trading activities in emerging market instruments, where clearance, settlement, and/or custodial risks are often greater than in more established markets.
Technological Risk — the risk of loss attributable to technological limitations or hardware failure that constrain the Partnership’s/Funds’ ability to gather, process, and communicate information efficiently and securely, without interruption, to customers and in the markets where the Partnership/Funds participate. Additionally, the General Partner’s computer systems may be vulnerable to unauthorized access, mishandling or misuse, computer viruses or malware, cyber attacks and other events that could have a security impact on such systems. If one or more of such events occur, this potentially could jeopardize a limited partner’s personal, confidential, proprietary or other information processed and stored in, and transmitted through, the General Partner’s computer systems, and adversely affect the Partnership’s business, financial condition or results of operations.
Legal/Documentation Risk — the risk of loss attributable to deficiencies in the documentation of transactions (such as trade confirmations) and customer relationships (such as master netting agreements) or errors that result in non-compliance with applicable legal and regulatory requirements.
Financial Control Risk — the risk of loss attributable to limitations in financial systems and controls. Strong financial systems and controls ensure that assets are safeguarded, that transactions are executed in accordance with the General Partner’s authorization, and that financial information utilized by the General Partner and communicated to external parties, including the Partnership’s Redeemable Unit holders, creditors, and regulators, is free of material errors.
(g) Critical Accounting Policies.
The preparation of financial statements in conformity with generally accepted accounting principles (“GAAP”) requires the General Partner to make estimates and assumptions that affect the reported amounts of assets and liabilities and disclosures of contingent assets and liabilities at the date of the financial statements and the reported amounts of income and expenses during the reporting period. As a result, actual results could differ from these estimates. A summary of the Partnership’s significant accounting policies is described in Note 2 to the Partnership’s financial statements included in “Item 8. Financial Statements and Supplementary Data.”
The Partnership’s most significant accounting policy is the valuation of its investments in the Funds and in futures, option and forward contracts and U.S. Treasury bills, as applicable. The fair value of the investments in the Funds is determined based on the respective Fund’s net asset value per unit as calculated by the Fund or the Partnership’s (1) net contribution to the Funds and (2) its allocated share of the undistributed profits and losses, including realized gains (losses) and net change in unrealized gains (losses) of the Funds. The fair value of exchange-traded futures, option and forward contracts is determined by the various exchanges, and reflects the settlement price for each contract as of the close of business on the last business day of the reporting period. The fair value of foreign currency forward contracts is extrapolated on a forward basis from the spot prices quoted as of approximately 3:00 P.M. (E.T.) on the last business day of the reporting period from various exchanges. The fair value of non-exchange-traded foreign currency option contracts is calculated by applying an industry standard model application for options valuation of foreign currency options, using as inputs the spot prices, interest rates, and option implied volatilities quoted as of approximately 3:00 P.M. (E.T.) on the last business day of the reporting period. U.S. Treasury bills are valued at the last available bid price received from independent pricing services as of the close of the last business day of the reporting period.
27
Item 7A. Quantitative and Qualitative Disclosures About Market Risk
The Partnership/Funds are speculative commodity pools. The market sensitive instruments held by the Partnership/Funds are acquired for speculative trading purposes, and all or substantially all of the Partnership’s/Funds’ assets are subject to the risk of trading loss. Unlike an operating company, the risk of market sensitive instruments is integral, not incidental, to the Partnership’s/Funds’ main line of business.
The limited partners will not be liable for losses exceeding the current net asset value of their investment. This limited liability is a result of the organization of the Partnership as a limited Partnership under New York law.
Market movements result in frequent changes in the fair value of the Partnership’s/Funds’ open contracts and, consequently, in their earnings and cash balances. The Partnership’s/Funds’ market risk is influenced by a wide variety of factors. These primarily include factors which affect energy price levels, including supply factors and weather conditions, but could also include the level and volatility of interest rates, exchange rates, equity price levels, the market value of financial instruments and contracts, the diversification effects among the Partnership’s/Funds’ open contracts and the liquidity of the markets in which they trade.
The Partnership/Funds rapidly acquire and liquidate both long and short positions in a wide range of different markets. Consequently, it is not possible to predict how a particular future market scenario will affect performance, and the Partnership’s/Funds’ past performances are not necessarily indicative of their future results.
“Value at Risk” is a measure of the maximum amount which the Partnership/Funds could reasonably be expected to lose in a given market sector. However, the inherent uncertainty of the Partnership’s/Funds’ speculative trading and the recurrence in the markets traded by the Partnership/Funds of market movements far exceeding expectations could result in actual trading or non-trading losses far beyond the indicated Value at Risk or the Partnership’s/Funds’ experience to date (i.e., “risk of ruin”). In light of the foregoing, as well as the risks and uncertainties intrinsic to all future projections, the inclusion of the quantification in this section should not be considered to constitute any assurance or representation that the Partnership’s/Funds’ losses in any market sector will be limited to Value at Risk or by the Partnership’s/Funds’ attempts to manage their market risk.
Materiality as used in this section is based on an assessment of reasonably possible market movements and the potential losses caused by such movements, taking into account the leverage, optionality and multiplier features of the Partnership’s/Funds’ market sensitive instruments.
Quantifying the Partnership’s Trading Value at Risk
The following quantitative disclosures regarding the Partnership’s/Funds’ market risk exposures contain “forward-looking statements” within the meaning of the safe harbor from civil liability provided for such statements by the Private Securities Litigation Reform Act of 1995 (set forth in Section 27A of the Securities Act and Section 21E of the Securities Exchange Act of 1934 (the “Exchange Act”)). All quantitative disclosures in this section are deemed to be forward-looking statements for purposes of the safe harbor except for statements of historical fact (such as the terms of particular contracts and the number of market risk sensitive instruments held during or at the end of the reporting period).
The Partnership’s/Funds’ risk exposure in the various market sectors traded by the Advisors is quantified below in terms of Value at Risk. Due to the Partnership’s/Funds’ mark-to-market accounting, any loss in the fair value of the Partnership’s/Funds’ open positions including investments in the Funds, is directly reflected in the Partnership’s earnings (realized or unrealized) and cash balances.
Exchange margin requirements have been used by the Partnership/Funds as the measure of their Value at Risk. Margin requirements are set by exchanges to equal or exceed the maximum losses reasonably expected to be incurred in the fair value of any given contract in 95%-99% of any one-day interval. The margin levels are established by dealers and exchanges using historical price studies as well as an assessment of current market volatility (including the implied volatility of the options on a given futures contract) and economic fundamentals to provide a probabilistic estimate of the maximum expected near-term one-day price fluctuation.
In the case of market sensitive instruments which are not exchange-traded (almost exclusively currencies in the case of the Partnership/Funds), the margin requirements for the equivalent futures positions have been used as Value at Risk. In those rare cases in which a futures-equivalent margin is not available, dealers’ margins have been used.
The fair value of the Partnership’s/Funds’ futures and forward positions does not have any optionality component. However, the Advisors do trade commodity options. Where this instrument is a futures contract, the futures margin has been used, and where this instrument is a physical commodity, the futures-equivalent margin has been used. This calculation is conservative in that it assumes that the fair value of an option will decline by the same amount as the fair value of the underlying instrument, whereas, in fact, the fair values of the options traded by the Partnership/Funds in almost all cases fluctuate to a lesser extent than those of the underlying instruments.
In quantifying the Partnership’s/Funds’ Value at Risk, 100% positive correlation in the different positions held in each market risk category has been assumed. Consequently, the margin requirements applicable to the open contracts have simply been added to determine each trading category’s aggregate Value at Risk. The diversification effects resulting from the fact that the Partnership’s/Funds’ positions are rarely, if ever, 100% positively correlated have not been reflected.
28
The Partnership’s and the Fund’s Trading Value at Risk in Different Market Sectors
Value at Risk tables represent a probabilistic assessment of the risk of loss in market risk sensitive instruments. The Advisors, with exception to Systematica, currently trade the Partnership’s assets indirectly in master fund managed accounts established in the name of the master funds over which they have been granted limited authority to make trading decisions. Systematica directly trades a managed account in the name of the Partnership. The first two trading Value at Risk tables reflect the market sensitive instruments held by the Partnership directly and through its investments in the Funds. The remaining trading Value at Risk tables reflect the market sensitive instruments held by the Partnership directly (i.e. in the managed account in the Partnership’s name traded by Systematica) and indirectly by each Fund separately.
The following tables indicate the trading Value at Risk associated with the Partnership’s open positions by market category as of December 31, 2017 and 2016. As of December 31, 2017, the Partnership’s total capitalization was $798,532,927.
December 31, 2017
| Market Sector |
Value at Risk | % of Total Capitalization |
||||||
| Commodities |
$ | 31,695,545 | 3.97 | % | ||||
| Currencies |
67,295,666 | 8.43 | ||||||
| Interest Rates |
21,758,941 | 2.72 | ||||||
| Equities |
40,033,293 | 5.01 | ||||||
|
|
|
|
|
|||||
| Total |
$ | 160,783,445 | 20.13 | % | ||||
|
|
|
|
|
|||||
As of December 31, 2016, the Partnership’s total capitalization was $997,913,751.
December 31, 2016
| Market Sector |
Value at Risk | % of Total Capitalization |
||||||
| Commodities |
$ | 29,093,012 | 2.92 | % | ||||
| Currencies |
71,606,105 | 7.18 | ||||||
| Interest Rates |
18,574,346 | 1.86 | ||||||
| Equities |
51,332,277 | 5.14 | ||||||
|
|
|
|
|
|||||
| Total |
$ | 170,605,740 | 17.10 | % | ||||
|
|
|
|
|
|||||
29
The following tables indicate the trading Value at Risk associated with the Partnership’s direct investments and indirect investments in the Funds by market category as of December 31, 2017 and 2016, the highest and lowest and average value during the years. All open position trading risk exposures have been included in calculating the figures set forth below.
As of December 31, 2017 and 2016, the Partnership’s Value at Risk for the portion of its assets that are traded directly was as follows:
December 31, 2017
| Twelve Months Ended December 31, 2017 | ||||||||||||||||||||
| Market Sector |
Value at Risk | % of Total Capitalization |
High Value at Risk |
Low Value at Risk |
Average Value at Risk* |
|||||||||||||||
| Currencies |
$ | 16,587,445 | 2.08 | % | $ | 44,314,503 | $ | 16,281,723 | $ | 29,394,065 | ||||||||||
| Energy |
3,259,297 | 0.41 | 4,922,921 | 1,292,232 | 3,057,028 | |||||||||||||||
| Grains |
1,413,905 | 0.18 | 2,933,816 | 734,795 | 2,212,317 | |||||||||||||||
| Indices |
14,823,350 | 1.86 | 19,782,557 | 9,987,367 | 14,365,095 | |||||||||||||||
| Interest Rates U.S. |
849,657 | 0.11 | 3,122,851 | 849,657 | 2,039,105 | |||||||||||||||
| Interest Rates Non-U.S. |
2,728,281 | 0.34 | 6,750,624 | 1,672,930 | 3,702,845 | |||||||||||||||
| Livestock |
27,720 | 0.00 | ** | 534,628 | 27,720 | 250,623 | ||||||||||||||
| Metals |
2,081,248 | 0.26 | 3,289,718 | 1,068,033 | 2,113,256 | |||||||||||||||
| Softs |
831,695 | 0.10 | 1,073,556 | 258,210 | 696,301 | |||||||||||||||
|
|
|
|
|
|||||||||||||||||
| Total |
$ | 42,602,598 | 5.34 | % | ||||||||||||||||
|
|
|
|
|
|||||||||||||||||
| * | Annual average of month-end Values at Risk. |
| ** | Due to rounding. |
December 31, 2016
| Twelve Months Ended December 31, 2016 | ||||||||||||||||||||
| Market Sector |
Value at Risk | % of Total Capitalization |
High Value at Risk |
Low Value at Risk |
Average Value at Risk* |
|||||||||||||||
| Currencies |
$ | 20,728,371 | 2.08 | % | $ | 32,759,531 | $ | 7,282,770 | $ | 17,006,423 | ||||||||||
| Energy |
2,100,741 | 0.21 | 6,495,906 | 650,281 | 2,453,669 | |||||||||||||||
| Grains |
2,490,546 | 0.25 | 3,674,203 | 581,348 | 2,057,790 | |||||||||||||||
| Indices |
17,539,816 | 1.76 | 17,539,816 | 2,511,223 | 9,299,916 | |||||||||||||||
| Interest Rates U.S. |
1,616,930 | 0.16 | 3,769,117 | 1,113,311 | 2,098,884 | |||||||||||||||
| Interest Rates Non-U.S. |
2,015,332 | 0.20 | 6,788,511 | 1,595,866 | 3,581,237 | |||||||||||||||
| Livestock |
105,751 | 0.01 | 465,795 | 47,836 | 224,310 | |||||||||||||||
| Metals |
1,604,889 | 0.16 | 3,731,858 | 764,635 | 1,567,810 | |||||||||||||||
| Softs |
564,409 | 0.06 | 720,434 | 81,334 | 417,616 | |||||||||||||||
|
|
|
|
|
|||||||||||||||||
| Total |
$ | 48,766,785 | 4.89 | % | ||||||||||||||||
|
|
|
|
|
|||||||||||||||||
| * | Annual average of month-end Values at Risk. |
30
Prior to the close of business on December 31, 2017, Winton Master’s total capitalization was $408,679,588 and the Partnership owned approximately 45.8% of Winton Master. Prior to the close of business on December 31, 2017, Winton Master’s Value at Risk for its assets (including the portion of the Partnership’s assets allocated to Winton for trading) was as follows:
December 31, 2017
| Twelve Months Ended December 31,2017 | ||||||||||||||||||||
| Market Sector |
Value at Risk | % of Total Capitalization |
High Value atRisk |
Low Value at Risk |
Average Value at Risk* |
|||||||||||||||
| Currencies |
$ | 37,375,662 | 9.15 % | $ | 41,685,050 | $ | 6,859,203 | $ | 29,801,089 | |||||||||||
| Energy |
6,288,778 | 1.54 | 6,288,778 | 660,791 | 2,375,862 | |||||||||||||||
| Grains |
1,358,483 | 0.33 | 2,712,999 | 1,100,657 | 1,778,122 | |||||||||||||||
| Indices |
20,126,411 | 4.92 | 31,470,290 | 17,643,595 | 23,398,714 | |||||||||||||||
| Interest Rates U.S. |
1,109,639 | 0.27 | 5,362,330 | 514,996 | 2,048,055 | |||||||||||||||
| Interest Rates Non-U.S. |
2,562,664 | 0.63 | 5,374,331 | 1,520,731 | 3,434,888 | |||||||||||||||
| Livestock |
502,480 | 0.12 | 850,960 | 359,920 | 611,098 | |||||||||||||||
| Metals |
10,415,048 | 2.55 | 10,465,318 | 1,732,090 | 4,070,470 | |||||||||||||||
| Softs |
2,704,190 | 0.66 | 2,735,012 | 1,140,436 | 1,782,061 | |||||||||||||||
|
|
|
|
|
|||||||||||||||||
| Total |
$ | 82,443,355 | 20.17 % | |||||||||||||||||
|
|
|
|
|
|||||||||||||||||
| * | Annual average of month-end Values at Risk. |
As of December 31, 2016, Winton Master’s total capitalization was $494,292,978 and the Partnership owned approximately 51.4% of Winton Master. As of December 31, 2016, Winton Master’s Value at Risk for its assets (including the portion of the Partnership’s assets allocated to Winton for trading) was as follows:
December 31, 2016
| Twelve Months Ended December 31, 2016 | ||||||||||||||||||||
| Market Sector |
Value at Risk | % of Total Capitalization |
High Value at Risk |
Low Value at Risk |
Average Value at Risk* |
|||||||||||||||
| Currencies |
$ | 31,827,200 | 6.44 % | $ | 43,438,054 | $ | 22,212,213 | $ | 31,924,793 | |||||||||||
| Energy |
1,239,902 | 0.25 | 9,165,346 | 969,748 | 3,733,831 | |||||||||||||||
| Grains |
2,177,986 | 0.44 | 4,040,676 | 1,857,610 | 2,619,765 | |||||||||||||||
| Indices |
25,363,561 | 5.13 | 25,363,561 | 10,596,963 | 18,378,554 | |||||||||||||||
| Interest Rates U.S. |
4,286,586 | 0.87 | 9,700,222 | 271,474 | 6,398,481 | |||||||||||||||
| Interest Rates Non-U.S. |
2,683,933 | 0.54 | 11,539,823 | 1,385,562 | 8,303,443 | |||||||||||||||
| Livestock |
359,920 | 0.07 | 944,955 | 144,359 | 548,391 | |||||||||||||||
| Metals |
7,071,481 | 1.43 | 8,903,178 | 1,446,984 | 5,461,010 | |||||||||||||||
| Softs |
1,282,783 | 0.26 | 1,726,286 | 1,074,232 | 1,422,312 | |||||||||||||||
|
|
|
|
|
|||||||||||||||||
| Total |
$ | 76,293,352 | 15.43 % | |||||||||||||||||
|
|
|
|
|
|||||||||||||||||
| * | Annual average of month-end Values at Risk. |
31
Prior to the close of business on December 31, 2017, Transtrend Master total capitalization was $216,893,179 and the Partnership owned approximately 95.8% of Transtrend Master. Prior to the close of business on December 31, 2017, Transtrend Master’s Value at Risk for its assets (including the portion of the Partnerships’s assets allocated to Transtrend for trading) was as follows:
December 31, 2017
| Twelve Months Ended December 31, 2017 | ||||||||||||||||||||
| Market Sector |
Value at Risk | % of Total Capitalization |
High Value at Risk |
Low Value at Risk |
Average Value at Risk* |
|||||||||||||||
| Commodities |
$ | 14,981,202 | 6.91 | % | $ | 16,281,307 | $ | 8,420,726 | $ | 13,271,018 | ||||||||||
| Currencies |
19,248,396 | 8.87 | 32,480,250 | 11,349,411 | 20,816,692 | |||||||||||||||
| Interest Rates |
12,582,632 | 5.80 | 18,335,424 | 4,377,363 | 10,507,441 | |||||||||||||||
| Equities |
16,705,050 | 7.70 | 23,325,397 | 9,893,398 | 15,903,292 | |||||||||||||||
| Total |
$ | 63,517,280 | 29.28 | % | ||||||||||||||||
| * | Annual average of daily Values at Risk. |
As of December 31, 2016, Transtrend Master total capitalization was $295,760,029 and the Partnership owned approximately 94.9% of Transtrend Master. As of December 31, 2016, Transtrend Master’s Value at Risk for its assets (including the portion of the Partnerships’s assets allocated to Transtrend for trading) was as follows:
December 31, 2016
| Twelve Months Ended December 31, 2016 | ||||||||||||||||||||
| Market Sector |
Value at Risk | % of Total Capitalization |
High Value at Risk |
Low Value at Risk |
Average Value at Risk* |
|||||||||||||||
| Commodities |
$ | 12,800,558 | 4.33 | % | $ | 28,363,248 | $ | 6,504,258 | $ | 13,330,429 | ||||||||||
| Currencies |
30,344,497 | 10.26 | 50,104,729 | 17,023,450 | 28,229,714 | |||||||||||||||
| Interest Rates |
9,256,952 | 3.13 | 21,306,547 | 5,311,100 | 15,177,964 | |||||||||||||||
| Equities |
15,366,066 | 5.20 | 21,019,148 | 4,492,623 | 12,634,603 | |||||||||||||||
| Total
|
$ | 67,768,073 | 22.92 | % | ||||||||||||||||
| * | Annual average of daily Values at Risk. |
32
Prior to the close of business on December 31, 2017, Willowbridge Master’s total capitalization was $332,211,210 and the Partnership owned approximately 82.5% of Willowbridge Master. Prior to the close of business on December 31, 2017, Willowbridge Master’s Value at Risk for its assets (including the portion of the Partnership’s assets allocated to Willowbridge for trading) was as follows:
December 31, 2017
| Twelve Months Ended December 31, 2017 | ||||||||||||||||||||||
| % of Total | High | Low | Average | |||||||||||||||||||
| Market Sector |
Value at Risk | Capitalization | Value at Risk | Value at Risk | Value at Risk* | |||||||||||||||||
| Currencies |
$ | 18,377,762 | 5.53 | % | $ | 83,446,338 | $ | 3,531,563 | $ | 34,901,146 | ||||||||||||
| Interest Rates Non-U.S. |
5,390,008 | 1.62 | 21,928,085 | - | 6,693,730 | |||||||||||||||||
|
|
|
|
|
|||||||||||||||||||
| Total |
$ | 23,767,770 | 7.15 | % |
||||||||||||||||||
|
|
|
|
|
|||||||||||||||||||
| * | Annual average of month-end Values at Risk. |
As of December 31, 2016, Willowbridge Master’s total capitalization was $391,498,613 and the Partnership owned approximately 76.5% of Willowbridge Master. As of December 31, 2016, Willowbridge Master’s Value at Risk for its assets (including the portion of the Partnership’s assets allocated to Willowbridge for trading) was as follows:
December 31, 2016
| Twelve Months Ended December 31, 2016 | ||||||||||||||||||||
| % of Total | High | Low | Average | |||||||||||||||||
| Market Sector |
Value at Risk | Capitalization | Value at Risk | Value at Risk | Value at Risk* | |||||||||||||||
| Currencies |
7,479,249 | 1.91 | 79,559,952 | 147,470 | 26,078,802 | |||||||||||||||
| Energy |
4,703,756 | 1.20 | 12,259,443 | - | 2,270,260 | |||||||||||||||
| Indices |
8,069,535 | 2.06 | 11,808,296 | - | 2,983,129 | |||||||||||||||
| Interest Rates U.S. |
1,170,235 | 0.30 | 22,748,409 | - | 4,116,353 | |||||||||||||||
| Interest Rates Non-U.S. |
2,194,981 | 0.56 | 4,206,401 | - | 1,168,020 | |||||||||||||||
| Metals |
319,854 | 0.08 | 4,745,455 | - | 841,842 | |||||||||||||||
|
|
|
|
|
|||||||||||||||||
| Total |
$ | 23,937,610 | 6.11 | % | ||||||||||||||||
|
|
|
|
|
|||||||||||||||||
| * | Annual average of month-end Values at Risk. |
Material Limitations on Value at Risk as an Assessment of Market Risk
The face value of the market sector instruments held by the Partnership/Funds is typically many times the applicable maintenance margin requirement (margin requirements generally range between 1% and 15% of contract face value, although an exchange may increase margin requirements on short notice) as well as many times the capitalization of the Partnership/Funds. The magnitude of the Partnership’s/Funds’ open positions creates a “risk of ruin” not typically found in most other investment vehicles. Because of the size of its positions, certain market conditions—unusual, but historically recurring from time to time —could cause the Partnership/Funds to incur severe losses over a short period of time. The foregoing Value at Risk tables—as well as the past performance of the Partnership/Funds—give no indication of this “risk of ruin.”
33
Non-Trading Risk
The Partnership/Funds have non-trading market risk on their foreign cash balances not needed for margin. However, these balances (as well as any market risk they represent) are immaterial.
A decline in short-term interest rates would result in a decline in the Partnership’s cash management income. This cash flow risk is not considered to be material.
Materiality, as used throughout this section, is based on an assessment of reasonably possible market movements and any associated potential losses, taking into account the leverage, optionality and multiplier features of the Partnership’s market-sensitive instruments, in relation to the Partnership’s net assets.
Qualitative Disclosures Regarding Primary Trading Risk Exposures
The following qualitative disclosures regarding the Partnership’s/Funds’ market risk exposures — except for (i) those disclosures that are statements of historical fact and (ii) the descriptions of how the Partnership manages its primary market risk exposures— constitute forward-looking statements within the meaning of Section 27A of the Securities Act and Section 21E of the Exchange Act. The Partnership’s/Funds’ primary market risk exposures, as well as the strategies used and to be used by the General Partner and the Advisors for managing such exposures, are subject to numerous uncertainties, contingencies and risks, any one of which could cause the actual results of the Partnership’s/Funds’ risk control to differ materially from the objectives of such strategies. Government interventions, defaults and expropriations, illiquid markets, the emergence of dominant fundamental factors, political upheavals, changes in historical price relationships, an influx of new market participants, increased regulation and many other factors could result in material losses as well as in material changes to the risk exposures and the management strategies of the Partnership/Funds. There can be no assurance that the Partnership’s/Funds’ current market exposure and/or risk management strategies will not change materially or that any such strategies will be effective in either the short or long term. Investors must be prepared to lose all or substantially all of their investment in the Partnership.
The following were the primary trading risk exposures of the Partnership at December 31, 2017 by market sector. It may be anticipated, however, that these market exposures will vary materially over time.
Currencies. The Partnership’s currency exposure is to exchange rate fluctuations, primarily fluctuations that disrupt the historical pricing relationships between different currencies and currency pairs. These fluctuations are influenced by interest rate changes as well as political and general economic conditions. The General Partner does not anticipate that the risk profile of the Partnership’s currency sector will change significantly in the future.
Equities. The Partnership’s primary equity exposure is to equity price risk in the G8 countries. The stock index futures traded by the Partnership are limited to futures on broadly based indices. As of December 31, 2017, the Partnership’s primary exposures were in the CBOE VIX Market Volatility (U.S.), Dow Jones Euro STOXX 50 (European Union), SPI 200 (Australia), S&P 500 (U.S.), and FTSE 100 (United Kingdom) stock indices. The Partnership is primarily exposed to the risk of adverse price trends or static markets in the major European, U.S., and Pacific Rim indices. (Static markets would not cause major market changes but would make it difficult for the Partnership to avoid being “whipsawed” into numerous small losses.)
Interest Rates. Interest rate movements directly affect the price of the futures positions held by the Partnership and indirectly the value of its stock index and currency positions. Interest rate movements in one country as well as relative interest rate movements between countries materially affect the Partnership’s profitability. The Partnership’s primary interest rate exposure is to interest rate fluctuations in the United States and the other G8 countries. However, the Partnership may also take futures positions on the government debt of smaller nations — e.g., Australia and New Zealand.
Commodities:
Energy. The Partnership’s primary energy market exposure is to oil and natural gas price movements, often resulting from political developments in the Middle East and weather conditions. Energy prices can be volatile and substantial profits and losses, which have been experienced in the past, are expected to continue to be experienced in these markets in the future.
Metals. The Partnership’s primary metal market exposure as of December 31, 2017 was to fluctuations in the price of copper, zinc, aluminum, nickel, lead, palladium, and silver.
Grains. The Partnership’s trading risk exposure in the grains is primarily to agricultural price movements, which are often directly affected by severe or unexpected weather conditions. Wheat, corn, and the soybean complex accounted for the majority of the Partnership’s grain exposure as of December 31, 2017.
Softs. The Partnership’s trading risk exposure in the soft commodities is to agricultural-related price movements, which are often directly affected by severe or unexpected weather conditions. Sugar, coffee, cocoa, and cotton accounted for the majority of the Partnership’s soft commodities exposure as of December 31, 2017.
Livestock. The Partnership’s primary risk exposure in livestock is to fluctuations in hog and cattle prices.
34
Qualitative Disclosures Regarding Non-Trading Risk Exposure
The following was the only non-trading risk exposure of the Partnership/Funds as of December 31, 2017.
Foreign Currency Balances. The Partnership/Funds may hold various foreign currency balances. The Advisors regularly convert foreign currency balances to U.S. dollars in an attempt to control the Partnership’s/Funds’ non- trading risk.
Qualitative Disclosures Regarding Means of Managing Risk Exposure
The General Partner/managing member/trading manager monitors and attempts to mitigate the Partnership’s/Funds’ risk exposure on a daily basis through financial, credit and risk management monitoring systems and accordingly, believes that it has effective procedures for evaluating and limiting the credit and market risks to which the Partnership/Funds may be subject.
The General Partner/managing member/trading manager monitors the Partnership’s/Funds’ performance and the concentration of its open positions, and consults with the Advisors concerning the Partnership’s/Funds’ overall risk profile. If the General Partner/managing member/trading manager felt it necessary to do so, the General Partner/managing member/trading manager could require the Advisors to close out positions as well as enter positions traded on behalf of the Partnership/Funds. However, any such intervention would be a highly unusual event. The General Partner/managing member/trading manager primarily relies on the Advisors’ own risk control policies while maintaining a general supervisory overview of the Partnership’s/Funds’ market risk exposures.
The Advisors apply their own risk management policies to their trading. The Advisors often follow diversification guidelines, margin limits and stop loss points to exit a position. The Advisors’ research of risk management often suggests ongoing modifications to their trading programs.
As part of the General Partner’s/managing member’s/trading manager’s risk management, the General Partner/managing member/trading manager periodically meets with each Advisor to discuss its risk management and to look for any material changes to the Advisor’s portfolio balance and trading techniques. Each Advisor is required to notify the General Partner/managing member/trading manager of any material changes to its programs.
35
Item 8. Financial Statements and Supplementary Data.
CERES ORION L.P.
The following financial statements and related items of the Partnership are filed under this Item 8: Oath or Affirmation, Management’s Report on Internal Control over Financial Reporting, Report of Independent Registered Public Accounting Firm, for the years ended December 31, 2017, 2016, and 2015; Statements of Financial Condition at December 31, 2017 and 2016; Condensed Schedule of Investments at December 31, 2017 and 2016; Statements of Income and Expenses for the years ended December 31, 2017, 2016 and 2015; Statements of Changes in Partners’ Capital for the years ended December 31, 2017, 2016 and 2015; and Notes to Financial Statements. Additional financial information has been filed as Exhibits to this Form 10-K.
36
To the Limited Partners of
Ceres Orion L.P. (formerly, Orion Futures Fund
L.P.)
To the best of the knowledge and belief of the undersigned, the information contained herein is accurate and complete.
|
|
||||
| By: Patrick T. Egan |
||||
| President and Director |
||||
| Ceres Managed Futures LLC General Partner, |
||||
| Ceres Orion L.P. |
||||
| Ceres Managed Futures LLC |
||||
| 522 Fifth Avenue |
||||
| New York, NY 10036 |
||||
| (855) 672-4468 |
||||

37
Management’s Report on Internal Control Over Financial Reporting
The management of Ceres Orion L.P. (formerly, Orion Futures Fund L.P.) (the “Partnership”), Ceres Managed Futures LLC, is responsible for establishing and maintaining adequate internal control over financial reporting as defined in Rules 13a – 15(f) and 15d – 15(f) under the Securities Exchange Act of 1934 and for our assessment of internal control over financial reporting. The Partnership’s internal control over financial reporting is a process designed to provide reasonable assurance regarding the reliability of financial reporting and the preparation of financial statements for external purposes in accordance with accounting principles generally accepted in the United States of America. The Partnership’s internal control over financial reporting includes those policies and procedures that:
| (i) | pertain to the maintenance of records that, in reasonable detail, accurately and fairly reflect the transactions and dispositions of the assets of the Partnership; |
| (ii) | provide reasonable assurance that transactions are recorded as necessary to permit preparation of financial statements in accordance with accounting principles generally accepted in the United States of America, and that receipts and expenditures of the Partnership are being made only in accordance with authorizations of management and directors of the Partnership; and |
| (iii) | provide reasonable assurance regarding prevention or timely detection and correction of unauthorized acquisition, use or disposition of the Partnership’s assets that could have a material effect on the financial statements. |
Because of its inherent limitations, internal control over financial reporting may not prevent or detect misstatements. Also, projections of any evaluation of effectiveness to future periods are subject to the risk that controls may become inadequate because of changes in conditions, or that the degree of compliance with the policies or procedures may deteriorate.
The management of Ceres Orion L.P. has assessed the effectiveness of the Partnership’s internal control over financial reporting as of December 31, 2017. In making this assessment, management used the criteria set forth in the Internal Control-Integrated Framework (2013) issued by the Committee of Sponsoring Organizations of the Treadway Commission. Based on our assessment, management concluded that the Partnership maintained effective internal control over financial reporting as of December 31, 2017 based on the criteria referred to above.
|
|

| |||
| Patrick T. Egan |
Steven Ross | |||
| President and Director |
Chief Financial Officer and Director | |||
| Ceres Managed Futures LLC |
Ceres Managed Futures LLC | |||
| General Partner, |
General Partner, | |||
| Ceres Orion L.P. |
Ceres Orion L.P. |

38
Report of Independent Registered Public Accounting Firm
To the Partners of Ceres Orion L.P. (formerly, Orion Futures Fund L.P.),
Opinion on the Financial Statements
We have audited the accompanying statement of financial condition of Ceres Orion L.P. (formerly, Orion Futures Fund L.P.) (the “Partnership”), including the condensed schedule of investments, as of December 31, 2017, and the related statements of income and expenses and changes in partners’ capital for the year ended December 31, 2017, and the related notes (collectively referred to as the “financial statements”). In our opinion, the financial statements present fairly, in all material respects, the financial position of the Partnership at December 31, 2017, and the results of its operations and changes in its partners’ capital for the year ended December 31, 2017, in conformity with U.S. generally accepted accounting principles.
The statement of financial condition, including the condensed schedule of investments, as of December 31, 2016, and the related statements of income and expenses and changes in partners’ capital for the years ended December 31, 2016 and 2015 were audited by another independent registered public accounting firm whose report, dated March 24, 2017, expressed an unqualified opinion on those statements.
Basis for Opinion
These financial statements are the responsibility of the Partnership’s management. Our responsibility is to express an opinion on the Partnership’s financial statements based on our audit. We are a public accounting firm registered with the Public Company Accounting Oversight Board (United States) (“PCAOB”) and are required to be independent with respect to the Partnership in accordance with the U.S. federal securities laws and the applicable rules and regulations of the Securities and Exchange Commission and the PCAOB.
We conducted our audit in accordance with the standards of the PCAOB. Those standards require that we plan and perform the audit to obtain reasonable assurance about whether the financial statements are free of material misstatement, whether due to error or fraud. The Partnership is not required to have, nor were we engaged to perform, an audit of the Partnership’s internal control over financial reporting. As part of our audit we are required to obtain an understanding of internal control over financial reporting but not for the purpose of expressing an opinion on the effectiveness of the Partnership’s internal control over financial reporting. Accordingly, we express no such opinion.
Our audit included performing procedures to assess the risks of material misstatement of the financial statements, whether due to error or fraud, and performing procedures that respond to those risks. Such procedures included examining, on a test basis, evidence regarding the amounts and disclosures in the financial statements. Our procedures included confirmation of securities owned as of December 31, 2017, by correspondence with the custodian and brokers or by other appropriate auditing procedures where replies from brokers were not received. Our audit also included evaluating the accounting principles used and significant estimates made by management, as well as evaluating the overall presentation of the financial statements. We believe that our audit provides a reasonable basis for our opinion.
/s/ Ernst & Young LLP
We have served as the auditor of the Partnership since 2017.
Boston, MA
March 22, 2018
39
REPORT OF INDEPENDENT REGISTERED PUBLIC ACCOUNTING FIRM
To the Partners of Orion Futures Fund L.P.:
We have audited the accompanying statements of financial condition of Orion Futures Fund L.P. (the “Partnership”), including the condensed schedules of investments, as of December 31, 2016 and 2015, and the related statements of income and expenses and changes in partners’ capital for the years then ended. These financial statements are the responsibility of the Partnership’s management. Our responsibility is to express an opinion on these financial statements based on our audits.
We conducted our audits in accordance with the standards of the Public Company Accounting Oversight Board (United States). Those standards require that we plan and perform the audit to obtain reasonable assurance about whether the financial statements are free of material misstatement. The Partnership is not required to have, nor were we engaged to perform, an audit of its internal control over financial reporting. Our audits included consideration of internal control over financial reporting as a basis for designing audit procedures that are appropriate in the circumstances, but not for the purpose of expressing an opinion on the effectiveness of the Partnership’s internal control over financial reporting. Accordingly, we express no such opinion. An audit also includes examining, on a test basis, evidence supporting the amounts and disclosures in the financial statements, assessing the accounting principles used and significant estimates made by management, as well as evaluating the overall financial statement presentation. We believe that our audits provide a reasonable basis for our opinion.
In our opinion, such financial statements present fairly, in all material respects, the financial position of Orion Futures Fund L.P. as of December 31, 2016 and 2015, and the results of its operations and changes in its partners’ capital for the years then ended, in conformity with accounting principles generally accepted in the United States of America.
/s/ Deloitte & Touche LLP
New York, New York
March 24, 2017
40
Ceres Orion L.P. (formerly, Orion Futures Fund L.P.)
Statements of Financial Condition
December 31, 2017 and 2016
| December 31, | December 31, | |||||||
| 2017 | 2016 | |||||||
| Assets: |
||||||||
| Investment in the Funds(1), at fair value (Note 6) |
$ | 656,495,374 | $ | 834,103,057 | ||||
| Redemptions receivable from the Funds |
12,837,759 | - | ||||||
|
|
|
|
|
|||||
| Equity in trading account: |
||||||||
| Investment in U.S. Treasury bills, at fair value (amortized cost $0 and $110,913,731 at December 31, 2017 and 2016, respectively) |
- | 110,958,513 | ||||||
| Unrestricted cash (Note 3c) |
100,615,185 | 24,728,233 | ||||||
| Restricted cash (Note 3c) |
42,619,216 | 48,766,785 | ||||||
| Net unrealized appreciation on open futures contracts |
5,004,060 | 1,923,350 | ||||||
| Net unrealized appreciation on open forward contracts |
873,274 | 976,360 | ||||||
|
|
|
|
|
|||||
| Total equity in trading account |
149,111,735 | 187,353,241 | ||||||
|
|
|
|
|
|||||
| Cash at bank (Note 1) |
436 | 217 | ||||||
| Interest receivable (Note 3c) |
139,020 | 19,586 | ||||||
|
|
|
|
|
|||||
| Total assets |
$ | 818,584,324 | $ | 1,021,476,101 | ||||
|
|
|
|
|
|||||
| Liabilities and Partners’ Capital: |
||||||||
| Liabilities: |
||||||||
| Accrued expenses: |
||||||||
| Ongoing selling agent fees (Note 3d) |
$ | 2,622,825 | $ | 2,294,952 | ||||
| Management fees (Note 3b) |
699,501 | 846,374 | ||||||
| General Partner fees (Note 3a) |
509,718 | 636,635 | ||||||
| Professional fees |
412,503 | 564,651 | ||||||
| Redemptions payable to General Partner (Note 7) |
- | 249,862 | ||||||
| Redemptions payable to Limited Partners (Note 7) |
15,806,850 | 18,969,876 | ||||||
|
|
|
|
|
|||||
| Total liabilities |
20,051,397 | 23,562,350 | ||||||
|
|
|
|
|
|||||
| Partners’ Capital (Notes 1 and 7): |
||||||||
| General Partner, Class Z, 8,552.3863 and 9,730.4983 Redeemable Units outstanding at December 31, 2017 and 2016, respectively |
9,602,692 | 11,092,572 | ||||||
| Limited Partners, Class A, 272,051.1558 and 329,826.9338 Redeemable Units outstanding at December 31, 2017 and 2016, respectively |
785,537,773 | 983,754,958 | ||||||
| Limited Partners, Class Z, 3,021.4072 and 2,689.7142 Redeemable Units outstanding at December 31, 2017 and 2016, respectively |
3,392,462 | 3,066,221 | ||||||
|
|
|
|
|
|||||
| Total partners’ capital (net asset value) |
798,532,927 | 997,913,751 | ||||||
|
|
|
|
|
|||||
| Total liabilities and partners’ capital |
$ | 818,584,324 | $ | 1,021,476,101 | ||||
|
|
|
|
|
|||||
| Net asset value per Redeemable Unit: |
||||||||
| Class A |
$ | 2,887.46 | $ | 2,982.64 | ||||
|
|
|
|
|
|||||
| Class Z |
$ | 1,122.81 | $ | 1,139.98 | ||||
|
|
|
|
|
|||||
(1) Defined in Note 1.
See accompanying notes to financial statements.
41
Ceres Orion L.P. (formerly, Orion Futures Fund L.P.)
Condensed Schedule of Investments
December 31, 2017
| Notional($)/ Number of Contracts |
Fair Value | % of Partners’ Capital |
||||||||||
| Futures Contracts Purchased |
||||||||||||
| Energy |
842 | $ | 3,926,924 | 0.49 | % | |||||||
| Grains |
40 | (7,380) | (0.00) | * | ||||||||
| Indices |
2,560 | 248,920 | 0.03 | |||||||||
| Interest Rates U.S. |
2,389 | (673,740) | (0.08) | |||||||||
| Interest Rates Non-U.S. |
2,820 | (1,016,225) | (0.13) | |||||||||
| Metals |
135 | 664,797 | 0.08 | |||||||||
| Softs |
185 | 459,870 | 0.06 | |||||||||
|
|
|
|
|
|||||||||
| Total futures contracts purchased |
3,603,166 | 0.45 | ||||||||||
|
|
|
|
|
|||||||||
| Futures Contracts Sold |
||||||||||||
| Energy |
659 | (203,923) | (0.03) | |||||||||
| Grains |
1,662 | 607,241 | 0.08 | |||||||||
| Indices |
1,980 | 990,738 | 0.12 | |||||||||
| Interest Rates U.S. |
194 | (12,188) | (0.00) | * | ||||||||
| Interest Rates Non-U.S. |
3,696 | 335,531 | 0.04 | |||||||||
| Livestock |
19 | (27,290) | (0.00) | * | ||||||||
| Metals |
93 | (262,045) | (0.03) | |||||||||
| Softs |
304 | (27,170) | (0.00) | * | ||||||||
|
|
|
|
|
|||||||||
| Total futures contracts sold |
1,400,894 | 0.18 | ||||||||||
|
|
|
|
|
|||||||||
| Net unrealized appreciation on open futures contracts |
$ | 5,004,060 | 0.63 | % | ||||||||
|
|
|
|
|
|||||||||
| Unrealized Appreciation on Open Forward Contracts |
||||||||||||
| Currencies |
$ | 504,572,117 | $ | 8,187,150 | 1.03 | % | ||||||
| Metals |
873 | 3,586,972 | 0.45 | |||||||||
|
|
|
|
|
|||||||||
| Total unrealized appreciation on open forward contracts |
11,774,122 | 1.48 | ||||||||||
|
|
|
|
|
|||||||||
| Unrealized Depreciation on Open Forward Contracts |
||||||||||||
| Currencies |
$ | 547,763,469 | (7,330,639) | (0.92) | ||||||||
| Metals |
818 | (3,570,209) | (0.45) | |||||||||
|
|
|
|
|
|||||||||
| Total unrealized depreciation on open forward contracts |
(10,900,848) | (1.37) | ||||||||||
|
|
|
|
|
|||||||||
| Net unrealized appreciation on open forward contracts |
$ | 873,274 | 0.11 | |||||||||
|
|
|
|
|
|||||||||
| Investment in the Funds |
||||||||||||
| CMF Winton Master L.P. |
$ | 186,666,465 | 23.38 | % | ||||||||
| CMF TT II, LLC |
201,709,447 | 25.26 | ||||||||||
| CMF Willowbridge Master Fund L.P. |
268,119,462 | 33.58 | ||||||||||
|
|
|
|
|
|||||||||
| Total investment in the Funds |
$ | 656,495,374 | 82.22 | % | ||||||||
|
|
|
|
|
|||||||||
| * | Due to rounding. |
See accompanying notes to financial statements.
42
Ceres Orion L.P. (formerly, Orion Futures Fund L.P.)
Condensed Schedule of Investments
December 31, 2016
| Notional($)/ Number of Contracts |
Fair Value | % of Partners’ Capital |
||||||||||||||
| Futures Contracts Purchased |
||||||||||||||||
| Energy |
425 | $ | 988,804 | 0.10 | % | |||||||||||
| Grains |
1,066 | (639,780) | (0.06) | |||||||||||||
| Indices |
2,548 | 1,318,736 | 0.13 | |||||||||||||
| Interest Rates U.S. |
2,673 | (411,241) | (0.04) | |||||||||||||
| Interest Rates Non-U.S. |
1,501 | 143,274 | 0.01 | |||||||||||||
| Livestock |
55 | 11,828 | 0.00 | ** | ||||||||||||
| Metals |
96 | (370,655) | (0.04) | |||||||||||||
| Softs |
191 | (85,970) | (0.01) | |||||||||||||
|
|
|
|
|
|||||||||||||
| Total futures contracts purchased |
954,996 | 0.09 | ||||||||||||||
|
|
|
|
|
|||||||||||||
| Futures Contracts Sold |
||||||||||||||||
| Energy |
579 | (1,284,887) | (0.13) | |||||||||||||
| Grains |
1,630 | 533,800 | 0.05 | |||||||||||||
| Indices |
2,604 | 860,847 | 0.09 | |||||||||||||
| Interest Rates U.S. |
243 | (137,539) | (0.01) | |||||||||||||
| Interest Rates Non-U.S. |
4,260 | 114,343 | 0.01 | |||||||||||||
| Metals |
201 | 210,630 | 0.02 | |||||||||||||
| Softs |
163 | 671,160 | 0.07 | |||||||||||||
|
|
|
|
|
|||||||||||||
| Total futures contracts sold |
968,354 | 0.10 | ||||||||||||||
|
|
|
|
|
|||||||||||||
| Net unrealized appreciation on open futures contracts |
$ | 1,923,350 | 0.19 | % | ||||||||||||
|
|
|
|
|
|||||||||||||
| Unrealized Appreciation on Open Forward Contracts |
||||||||||||||||
| Currencies |
$ | 413,919,583 | $ | 5,033,201 | 0.51 | % | ||||||||||
| Metals |
902 | 3,292,660 | 0.33 | |||||||||||||
|
|
|
|
|
|||||||||||||
| Total unrealized appreciation on open forward contracts |
8,325,861 | 0.84 | ||||||||||||||
|
|
|
|
|
|||||||||||||
| Unrealized Depreciation on Open Forward Contracts |
||||||||||||||||
| Currencies |
$ | 327,069,053 | (3,562,811) | (0.36) | ||||||||||||
| Metals |
983 | (3,786,690) | (0.38) | |||||||||||||
|
|
|
|
|
|||||||||||||
| Total unrealized depreciation on open forward contracts |
(7,349,501) | (0.74) | ||||||||||||||
|
|
|
|
|
|||||||||||||
| Net unrealized appreciation on open forward contracts |
$ | 976,360 | 0.10 | % | ||||||||||||
|
|
|
|
|
|||||||||||||
| U.S. Government Securities |
||||||||||||||||
|
Face Amount |
Maturity Date |
Description |
Fair Value | % of Partners’ Capital |
||||||||||||
| $90,000,000 |
1/19/2017 | U.S. Treasury bills, 0.365%* (Amortized cost of $89,941,600) | $ | 89,980,125 | 9.02 | % | ||||||||||
| $21,000,000 |
3/16/2017 | U.S. Treasury bills, 0.525%* (Amortized cost of $20,972,131) | 20,978,388 | 2.10 | ||||||||||||
|
|
|
|
|
|||||||||||||
| Total U.S. Government Securities |
|
$ | 110,958,513 | 11.12 | % | |||||||||||
|
|
|
|
|
|||||||||||||
| Investment in the Funds |
|
|||||||||||||||
| CMF Winton Master L.P. |
|
$ | 253,912,486 | 25.44 | % | |||||||||||
| Morgan Stanley Smith Barney TT II, LLC |
|
280,645,616 | 28.12 | |||||||||||||
| CMF Willowbridge Master Fund L.P. |
|
299,544,955 | 30.02 | |||||||||||||
|
|
|
|
|
|||||||||||||
| Total investment in the Funds |
|
$ | 834,103,057 | 83.58 | % | |||||||||||
|
|
|
|
|
|||||||||||||
| * | Liquid non-cash held as collateral. |
| ** | Due to rounding. |
See accompanying notes to financial statements.
43
Ceres Orion L.P. (formerly, Orion Futures Fund L.P.)
Statements of Income and Expenses
For the Years Ended
December 31, 2017, 2016 and 2015
| 2017 | 2016 | 2015 | ||||||||||
| Investment Income: |
||||||||||||
| Interest income |
$ | 1,376,191 | $ | 447,040 | $ | 21,474 | ||||||
| Interest income allocated from the Funds |
5,310,193 | 2,014,179 | 186,129 | |||||||||
|
|
|
|
|
|
|
|||||||
| Total investment income |
6,686,384 | 2,461,219 | 207,603 | |||||||||
|
|
|
|
|
|
|
|||||||
| Expenses: |
||||||||||||
| Expenses allocated from Funds |
5,007,436 | 7,949,409 | 14,314,643 | |||||||||
| Clearing fees related to direct investments (Note 3c) |
798,567 | 682,545 | 84,444 | |||||||||
| Ongoing selling agent fees (Note 3d) |
14,906,992 | 13,923,750 | 11,955,184 | |||||||||
| Management fees (Note 3b) |
9,007,592 | 10,669,966 | 10,966,339 | |||||||||
| General Partner fees (Note 3a) |
6,652,411 | 8,098,845 | 8,503,172 | |||||||||
| Incentive fees (Note 3b) |
- | - | 8,799,365 | |||||||||
| Professional fees |
1,713,581 | 2,271,832 | 1,550,751 | |||||||||
|
|
|
|
|
|
|
|||||||
| Total expenses |
38,086,579 | 43,596,347 | 56,173,898 | |||||||||
|
|
|
|
|
|
|
|||||||
| Net investment loss |
(31,400,195 | ) | (41,135,128 | ) | (55,966,295 | ) | ||||||
|
|
|
|
|
|
|
|||||||
| Trading Results: |
||||||||||||
| Net gains (losses) on trading of commodity interests and investment in the Funds: |
||||||||||||
| Net realized gains (losses) on closed contracts |
923,428 | (25,004,534 | ) | (1,510,518 | ) | |||||||
| Net realized gains (losses) on closed contracts allocated from the Funds |
(5,736,352 | ) | 46,956,695 | 77,564,141 | ||||||||
| Net change in unrealized gains (losses) on open contracts |
2,963,870 | 2,202,920 | 605,927 | |||||||||
| Net change in unrealized gains (losses) on open contracts allocated from the Funds |
8,674 | 10,976,518 | (46,648,570 | ) | ||||||||
|
|
|
|
|
|
|
|||||||
| Total trading results |
(1,840,380 | ) | 35,131,599 | 30,010,980 | ||||||||
|
|
|
|
|
|
|
|||||||
| Net income (loss) |
$ | (33,240,575 | ) | $ | (6,003,529 | ) | $ | (25,955,315 | ) | |||
|
|
|
|
|
|
|
|||||||
| Net income (loss) per Redeemable Unit* (Note 8): |
||||||||||||
| Class A |
$ | (95.18 | ) | $ | (22.20 | ) | $ | (71.94 | ) | |||
|
|
|
|
|
|
|
|||||||
| Class Z |
$ | (17.17 | ) | $ | 6.50 | $ | (14.75 | ) | ||||
|
|
|
|
|
|
|
|||||||
| Weighted average Redeemable Units outstanding: |
||||||||||||
| Class A |
304,610.1982 | 348,898.7336 | 364,259.6266 | |||||||||
|
|
|
|
|
|
|
|||||||
| Class Z |
12,023.4060 | 12,872.7303 | 13,088.7533 | |||||||||
|
|
|
|
|
|
|
|||||||
* Represents the change in net asset value per Redeemable Unit.
See accompanying notes to financial statements.
44
Ceres Orion L.P. (formerly, Orion Futures Fund L.P.)
Statements of Changes in Partners’ Capital
For the Years Ended
December 31, 2017, 2016 and 2015
| Class A | Class Z | Total | ||||||||||||||||||||||
| Amount | Redeemable Units | Amount | Redeemable Units | Amount | Redeemable Units | |||||||||||||||||||
| Partners’ Capital, December 31, 2014 |
$ | 1,096,725,351 | 356,452.4588 | $ | 14,714,839 | 12,815.2785 | $ | 1,111,440,190 | 369,267.7373 | |||||||||||||||
| Subscriptions - Limited Partners |
134,607,790 | 43,748.0220 | 745,805 | 637.6420 | 135,353,595 | 44,385.6640 | ||||||||||||||||||
| Redemptions - Limited Partners |
(129,863,543) | (42,202.5340) | (275,546) | (242.4610) | (130,139,089) | (42,444.9950) | ||||||||||||||||||
| Net income (loss) |
(25,743,998) | - | (211,317) | - | (25,955,315) | - | ||||||||||||||||||
|
|
|
|
|
|
|
|
|
|
|
|
|
|||||||||||||
| Partners’ Capital, December 31, 2015 |
1,075,725,600 | 357,997.9468 | 14,973,781 | 13,210.4595 | 1,090,699,381 | 371,208.4063 | ||||||||||||||||||
| Subscriptions - Limited Partners |
87,337,421 | 28,744.7430 | 663,409 | 576.7720 | 88,000,830 | 29,321.5150 | ||||||||||||||||||
| Redemptions - General Partner |
- | - | (1,039,843) | (872.2020) | (1,039,843) | (872.2020) | ||||||||||||||||||
| Redemptions - Limited Partners |
(173,180,117) | (56,915.7560) | (562,971) | (494.8170) | (173,743,088) | (57,410.5730) | ||||||||||||||||||
| Net income (loss) |
(6,127,946) | - | 124,417 | - | (6,003,529) | - | ||||||||||||||||||
|
|
|
|
|
|
|
|
|
|
|
|
|
|||||||||||||
| Partners’ Capital, December 31, 2016 |
983,754,958 | 329,826.9338 | 14,158,793 | 12,420.2125 | 997,913,751 | 342,247.1463 | ||||||||||||||||||
| Subscriptions - Limited Partners |
33,736,567 | 11,683.0890 | 1,180,838 | 1,074.6210 | 34,917,405 | 12,757.7100 | ||||||||||||||||||
| Redemptions - General Partner |
- | - | (1,274,988) | (1,178.1120) | (1,274,988) | (1,178.1120) | ||||||||||||||||||
| Redemptions - Limited Partners |
(198,980,126) | (69,458.8670) | (802,540) | (742.9280) | (199,782,666) | (70,201.7950) | ||||||||||||||||||
| Net income (loss) |
(32,973,626) | - | (266,949) | - | (33,240,575) | - | ||||||||||||||||||
|
|
|
|
|
|
|
|
|
|
|
|
|
|||||||||||||
| Partners’ Capital, December 31, 2017 |
$ | 785,537,773 | 272,051.1558 | $ | 12,995,154 | 11,573.7935 | $ | 798,532,927 | 283,624.9493 | |||||||||||||||
|
|
|
|
|
|
|
|
|
|
|
|
|
|||||||||||||
| Net asset value per Redeemable Unit: |
||||||||||
| Class A | Class Z | |||||||||
| 2015 | $ | 3,004.84 | $ | 1,133.48 | ||||||
|
|
|
|
|
|||||||
| 2016 | $ | 2,982.64 | $ | 1,139.98 | ||||||
|
|
|
|
|
|||||||
| 2017 | $ | 2,887.46 | $ | 1,122.81 | ||||||
|
|
|
|
|
|||||||
See accompanying notes to financial statements.
45
Ceres Orion L.P. (formerly, Orion Futures Fund L.P.)
Notes to Financial Statements
1. Organization:
Ceres Orion L.P. (formerly, Orion Futures Fund L.P.) (the “Partnership”) is a limited partnership organized on March 22, 1999, under the partnership laws of the State of New York, to engage, directly or indirectly, in the speculative trading of a diversified portfolio of commodity interests, including futures, option, swap and forward contracts. The sectors traded include currencies, energy, grains, livestock, indices, U.S. and non-U.S. interest rates, softs and metals. The commodity interests that are traded by the Partnership, directly and indirectly through its investment in the Funds (as defined below), are volatile and involve a high degree of market risk. The Partnership commenced trading on June 10, 1999. The Partnership privately and continuously offers redeemable units of limited partnership interest (“Redeemable Units”) to qualified investors. There is no maximum number of Redeemable Units that may be sold by the Partnership. The General Partner may also determine to invest up to all of the Partnership’s assets (directly or indirectly through its investment in the Funds) in United States (“U.S.”) Treasury bills and/or money market mutual funds, including money market mutual funds managed by Morgan Stanley or its affiliates.
Ceres Managed Futures LLC, a Delaware limited liability company, acts as the general partner (the “General Partner”) and commodity pool operator of the Partnership and was the trading manager (the “Trading Manager”) of Transtrend Master (as defined below). As of January 1, 2017, the General Partner became a wholly-owned subsidiary of Morgan Stanley Domestic Holdings, Inc. (“MSD Holdings”). MSD Holdings is ultimately owned by Morgan Stanley. Morgan Stanley is a publicly held company whose shares are listed on the New York Stock Exchange. Morgan Stanley is engaged in various financial services and other businesses. Prior to January 1, 2017, the General Partner was a wholly-owned subsidiary of Morgan Stanley Smith Barney Holdings LLC.
All trading decisions are made for the Partnership by Winton Capital Management Limited (“Winton”), Transtrend B.V. (“Transtrend”), Willowbridge Associates Inc. (“Willowbridge”) and Systematica Investments Limited (“Systematica”) (each an “Advisor” and, collectively, the “Advisors”), each of which is a registered commodity trading advisor. Each Advisor is allocated a portion of the Partnership’s assets to manage. The Partnership invests the portion of its assets allocated to each of the Advisors either directly, through an individually managed account, or indirectly, through its investment in the Funds. In addition, the General Partner may allocate the Partnership’s assets to additional non-major trading advisors (i.e., commodity trading advisors intended to be allocated less than 10% of the Partnership’s assets). Information about advisors allocated less than 10% of the Partnership’s assets may not be disclosed.
On June 1, 2011, the Partnership began offering “Class A” Redeemable Units and “Class Z” Redeemable Units pursuant to the offering memorandum. All Redeemable Units issued prior to June 1, 2011 were deemed Class A Redeemable Units. The rights, powers, duties and obligations associated with investment in Class A Redeemable Units were not changed. Class A Redeemable Units are available to taxable U.S. individuals and institutions, U.S. tax exempt individuals and institutions and non-U.S. investors. Class Z Redeemable Units were first issued on August 1, 2011. Class Z Redeemable Units are offered to limited partners who receive advisory services from Morgan Stanley Smith Barney LLC (doing business as Morgan Stanley Wealth Management) (“Morgan Stanley Wealth Management”) and certain employees of Morgan Stanley and/or its subsidiaries (and their family members). Class A Redeemable Units and Class Z Redeemable Units will each be referred to as a “Class” and collectively referred to as the “Classes.” The Class of Redeemable Units that a limited partner receives upon a subscription will generally depend upon the status of the limited partner, although the General Partner may determine to offer a particular Class of Redeemable Units to investors at its discretion.
During the periods covered by this report, the Partnership’s/Funds’ commodity broker was Morgan Stanley & Co. LLC (“MS&Co.”) a registered futures commission merchant. JPMorgan Chase Bank, N.A. (“JPMorgan”) was also a foreign exchange forward counterparty for certain funds. The Partnership/Funds also deposit a portion of their cash in a non-trading bank account at JPMorgan.
Systematica directly trades the Partnership’s assets allocated to it through a managed account in the name of the Partnership pursuant to Systematica’s BlueTrend Program.
46
Ceres Orion L.P. (formerly, Orion Futures Fund L.P.)
Notes to Financial Statements
The Partnership, CMF Winton Master L.P. (“Winton Master”), CMF TT II, LLC (formerly, Morgan Stanley Smith Barney TT II, LLC) (“Transtrend Master”) and CMF Willowbridge Master Fund L.P. (“Willowbridge Master”) have entered into futures brokerage account agreements and foreign exchange brokerage account agreements with MS&Co. Winton Master, Transtrend Master and Willowbridge Master are collectively referred to as the “Funds.”
Effective July 12, 2017, Winton Master, Transtrend Master and Willowbridge Master each entered into certain agreements with JPMorgan in connection with trading in forward foreign currency contracts on behalf of the referenced Funds and indirectly, the Partnership. These agreements include a foreign exchange and bullion authorization agreement (“FX Agreement”), an International Swap Dealers Association, Inc. master agreement (“Master Agreement”), a schedule to the Master Agreement, a 2016 credit support annex for variation margin to the schedule and an institutional account agreement. In addition to Willowbridge Master, Willowbridge is party to the FX Agreement for Willowbridge Master. Under each FX Agreement, JPMorgan charges a fee on the aggregate foreign currency transactions entered into on behalf of the respective Fund during a month.
The Partnership, directly and through its investments in the Funds, pays MS&Co. trading fees for the clearing, and where applicable, the execution of transactions.
The Partnership will be liquidated upon the first to occur of the following: December 31, 2019; the net asset value per Redeemable Unit of any Class decreases to less than $400 as of a close of any business day; or under certain other circumstances as set forth in the limited partnership agreement of the Partnership (the “Limited Partnership Agreement”). In addition, the General Partner may, in its sole discretion, cause the Partnership to dissolve if the aggregate net assets of the Partnership decline to less than $1,000,000.
In July 2015, the General Partner delegated certain administrative functions to SS&C Technologies, Inc., a Delaware corporation, currently doing business as SS&C GlobeOp (the “Administrator”). Pursuant to a master services agreement, the Administrator furnishes certain administrative, accounting, regulatory reporting, tax and other services as agreed from time to time. In addition, the Administrator maintains certain books and records of the Partnership. The cost of retaining the Administrator is allocated among the pools operated by the General Partner, including the Partnership.
| 2. | Basis of Presentation and Summary of Significant Accounting Policies: |
| a. | Use of Estimates. The preparation of financial statements and accompanying notes in conformity with accounting principles generally accepted in the United States of America (“GAAP”) requires the General Partner to make estimates and assumptions that affect the reported amounts of assets and liabilities, income and expenses, and related disclosures of contingent assets and liabilities in the financial statements and accompanying notes. As a result, actual results could differ from these estimates, and those differences could be material. |
| b. | Profit Allocation. The General Partner and each limited partner of the Partnership share in the profits and losses of the Partnership in proportion to the amount of Partnership interest owned by each, except that no limited partner is liable for obligations of the Partnership in excess of its capital contribution and profits, if any, net of distributions, redemptions and losses, if any. |
| c. | Statement of Cash Flows. The Partnership has not provided a Statement of Cash Flows, as permitted by Accounting Standards Codification (“ASC”) 230, “Statement of Cash Flows.” The Statements of Changes in Partners’ Capital is included herein, and as of and for the years ended December 31, 2017, 2016 and 2015, the Partnership carried no debt and all of the Partnership’s and Fund’s investments were carried at fair value and classified as Level 1 or Level 2 measurements. |
| d. | Partnership’s Investment in the Funds. The Partnership carries its investment in the Funds, other than its investment in Transtrend Master, based on the Fund’s net asset value per unit as calculated by the Funds. The Partnership carries its investment in Transtrend Master based on the Partnership’s (1) net contribution to Transtrend Master and (2) its allocated share of the undistributed profits and losses, including realized gains (losses) and net change in unrealized gains (losses), of Transtrend Master. |
47
Ceres Orion L.P. (formerly, Orion Futures Fund L.P.)
Notes to Financial Statements
| e. | Partnership’s/Funds’ Derivative Investments. All commodity interests held by the Partnership/Funds, including derivative financial instruments and derivative commodity instruments, are held for trading purposes. The commodity interests are recorded on trade date and open contracts are recorded at fair value at the measurement date. Investments in commodity interests denominated in foreign currencies are translated into U.S. dollars at the exchange rates prevailing at the measurement date. Gains or losses are realized when contracts are liquidated and are determined using the first-in, first-out method. Unrealized gains or losses on open contracts are included as a component of equity in trading account in the Partnership’s/Funds’ Statements of Financial Condition. Net realized gains or losses and net change in unrealized gains or losses are included in the Partnership’s/Funds’ Statements of Income and Expenses. |
| The Partnership and the Funds do not isolate the portion of the results of operations arising from the effect of changes in foreign exchange rates on investments from fluctuations due to changes in market prices of investments held. Such fluctuations are included in total trading results in the Partnership’s/Funds’ Statements of Income and Expenses. |
| f. | Partnership’s Cash. The Partnership’s cash includes cash denominated in foreign currencies of $(4,275,539) (proceeds of $4,184,850) and $(7,112,896) (proceeds of $7,035,961) at December 31, 2017 and 2016, respectively. |
| g. | Income Taxes. Income taxes have not been recorded as each partner is individually liable for the taxes, if any, on its share of the Partnership’s income and expenses. The Partnership follows the guidance of ASC 740, “Income Taxes,” which prescribes a recognition threshold and measurement attribute for financial statement recognition and measurement of tax positions taken or expected to be taken in the course of preparing the Partnership’s tax returns to determine whether the tax positions are “more-likely-than-not” of being sustained “when challenged” or “when examined” by the applicable tax authority. Tax positions determined not to meet the more-likely-than-not threshold would be recorded as a tax benefit or liability in the Partnership’s Statements of Financial Condition for the current year. If a tax position does not meet the minimum statutory threshold to avoid the incurring of penalties, an expense for the amount of the statutory penalty and interest, if applicable, shall be recognized in the Statements of Income and Expenses in the years in which the position is claimed or expected to be claimed. The General Partner has concluded that there are no significant uncertain tax positions that would require recognition in the financial statements. The Partnership files U.S. federal and various state and local tax returns. No income tax returns are currently under examination. The 2014 through 2017 tax years remain subject to examination by U.S. federal and most state tax authorities. |
| h. | Investment Company Status. Effective January 1, 2014, the Partnership adopted Accounting Standards Update 2013-08 “Financial Services—Investment Companies (Topic 946): Amendments to the Scope, Measurement and Disclosure Requirements” and based on the General Partner’s assessment, the Partnership has been deemed to be an investment company since inception. Accordingly, the Partnership follows the investment company accounting and reporting guidance of Topic 946 and reflects its investments at fair value with unrealized gains and losses resulting from changes in fair value reflected in the Statements of Income and Expenses. |
| i. | Net Income (Loss) Per Redeemable Unit. Net income (loss) per Redeemable Unit is calculated in accordance with ASC 946, “Financial Services—Investment Companies.” See Note 8, “Financial Highlights.” |
48
Ceres Orion L.P. (formerly, Orion Futures Fund L.P.)
Notes to Financial Statements
| 3. | Agreements: |
| a. | Limited Partnership Agreement: |
The General Partner administers the business and affairs of the Partnership, including selecting one or more advisors to make trading decisions for the Partnership. The Partnership pays the General Partner a monthly fee equal to 1/12th of 0.75% (0.75% per year) of month-end net assets. Month-end net assets, for the purpose of calculating the General Partner fees are net assets, as defined in the Limited Partnership Agreement, prior to the reduction of the current month’s incentive fee accruals, the monthly management fees, the General Partner fee and any redemptions or distributions as of the end of such month.
| b. | Management Agreement: |
The General Partner, on behalf of the Partnership, has entered into management agreements (each, a “Management Agreement”) with the Advisors. The Advisors are not affiliated with one another, the General Partner and MS&Co., are not responsible for the organization or operation of the Partnership.
Winton receives a monthly management fee equal to 1.5% per year of month-end net assets allocated to Winton. Willowbridge receives a monthly management fee equal to 1.5% per year of month-end net assets allocated to Willowbridge. Systematica receives a monthly management fee equal to 1.0% per year of month-end net assets allocated to Systematica. Month-end net assets, for the purpose of calculating management fees are net assets, as defined in the Limited Partnership Agreement, prior to the reduction of the current month’s incentive fee accruals, the monthly management fees, the General Partner fee and any redemptions or distributions as of the end of such month.
As of January 1, 2017, Transtrend Master pays Transtrend a monthly management fee of 0.85% per year on the aggregate net assets of Transtrend Master as of the first day of each month. For the period November 1, 2015 to December 31, 2016, Transtrend Master paid Transtrend a monthly management fee of 1.0% per year on the aggregate net assets of Transtrend Master as of the first day of each month. Prior to October 31, 2015, Transtrend Master paid Transtrend a monthly management fee of 1.25% per year on the aggregate net assets of Transtrend Master as of the first day of each month. The management fee paid by Transtrend Master is allocated to the Partnership based on its proportionate ownership interest of Transtrend Master.
In addition, the Partnership is obligated to pay Winton and Willowbridge an incentive fee, payable quarterly, equal to 20% of the New Trading Profits, as defined in each Management Agreement, earned by Winton and Willowbridge for the Partnership during each calendar quarter. The Partnership is obligated to pay Systematica an incentive fee, payable annually, equal to 20% of the New Trading Profits, as defined in the Management Agreement, earned by Systematica for the Partnership during each calendar year. Prior to January 1, 2016, Systematica received an incentive fee equal to 20% of the New Trading Profits earned by Systematica payable at the end of each calendar quarter. Transtrend receives an incentive fee equal to 20% of the New Trading Profits earned by Transtrend Master payable at the end of each calendar half year. Prior to January 1, 2016, Transtrend received an incentive fee equal to 20% of the New Trading Profits earned by Transtrend Master payable at the end of each calendar quarter. To the extent an Advisor incurs a loss for the Partnership, the Advisor will not be paid incentive fees until the Advisor recovers the net loss incurred and earns additional new trading profits for the Partnership. The incentive fee paid by Transtrend Master is allocated to the Partnership based on its proportionate ownership interest of Transtrend Master.
Each Management Agreement may be terminated upon notice by either party.
In allocating the assets of the Partnership among the Advisors, the General Partner considers, among other factors, each Advisor’s past performance, trading style, volatility of markets traded and fee requirements. The General Partner may modify or terminate the allocation of assets to the Advisors and may allocate the assets to additional advisors at any time.
49
Ceres Orion L.P. (formerly, Orion Futures Fund L.P.)
Notes to Financial Statements
| c. | Customer Agreement: |
The Partnership has entered into a futures brokerage account agreement with MS&Co. (the “Partnership Customer Agreement”) and ceased paying brokerage commissions to MS&Co. Under the Partnership Customer Agreement, the Partnership pays MS&Co. (or will reimburse MS&Co. if previously paid) its allocable share of trading fees for the clearing and, where applicable, the execution of transactions, as well as its allocable share of exchange, clearing, user, give-up and National Futures Association (“NFA”) fees (collectively, the “clearing fees”) directly and through its investment in the Funds. MS&Co. clearing fees are allocated to the Partnership based on its proportionate ownership interest of the Funds. The Partnership’s assets available for trading in commodity interests not held in the Funds’ brokerage accounts at MS&Co. and JPMorgan are deposited in the Partnership’s brokerage account at MS&Co. The Partnership’s cash deposited with MS&Co. is held in segregated bank accounts to the extent required by Commodity Futures Trading Commission (“CFTC”) regulations. The Partnership’s restricted cash is equal to the cash portion of assets on deposit to meet margin requirements, as determined by the exchange or counterparty, and required by MS&Co. At December 31, 2017 and 2016, the amount of cash held by the Partnership for margin requirements was $42,619,216 and $48,766,785, respectively. Cash that is not classified as restricted cash is therefore classified as unrestricted cash. MS&Co. has agreed to pay the Partnership interest on 100% of the average daily equity maintained in cash in the Partnership’s (or the Partnership’s allocable portion of the Fund’s, except for Transtrend Master’s) brokerage account during each month at the rate equal to the monthly average of the 4-week U.S. Treasury bill discount rate. MS&Co. has agreed to pay Transtrend Master interest on 100% of the average daily equity maintained in cash in Transtrend Master’s brokerage account during each month at the rate equal to the monthly average of the 4-week U.S. Treasury bill discount rate less 0.15% during such month but in no event less than zero. When the effective rate is less than zero, no interest is earned. All other interest income will be retained by the Partnership and/or the Funds, as applicable. For purposes of these interest credits, daily funds do not include monies due to Transtrend Master on or with respect to futures, forwards, or options contracts that have not been received. The Partnership Customer Agreement may generally be terminated upon notice by either party.
| d. | Selling Agent Agreement: |
The Partnership has entered into a selling agent agreement with Morgan Stanley Wealth Management (as amended, the “Selling Agreement”). Pursuant to the Selling Agreement, Morgan Stanley Wealth Management receives a monthly ongoing selling agent fee. The ongoing selling agent fee is (i) $15.00 each for futures transactions and up to an equivalent amount for swaps and $7.50 each per side for options transactions, with respect to Class A Redeemable Units and (ii) eliminated with respect to Class Z Redeemable Units. The ongoing selling agent fee amount is reduced by applicable floor brokerage fees. The Partnership may pay an ongoing selling agent fee to other properly licensed and/or registered selling agents who sell Redeemable Units, and such additional selling agents may share all or a substantial portion of such fees with their properly registered or exempted financial advisors who have sold Redeemable Units.
The General Partner fees, management fees, incentive fees and professional fees of the Partnership are allocated proportionally to each Class based on the net asset value of the Class.
50
Ceres Orion L.P. (formerly, Orion Futures Fund L.P.)
Notes to Financial Statements
| 4. | Trading Activities: |
The Partnership was formed for the purpose of trading contracts in a variety of commodity interests, including derivative financial instruments and derivative commodity instruments. The results of the Partnership’s trading activities are shown in the Statements of Income and Expenses. The Partnership also invests certain of its assets through a “master/feeder” structure. The Partnership’s pro-rata share of the results of the Funds’ trading activities are shown in the Partnership’s Statements of Income and Expenses.
The Partnership Customer Agreement and the Funds’ futures brokerage account agreements with MS&Co. give the Partnership and the Funds, respectively, the legal right to net unrealized gains and losses on open futures, forward and option contracts in their respective Statements of Financial Condition. The Partnership and the Funds net, for financial reporting purposes, the unrealized gains and losses on open futures, forward and option contracts in their respective Statements of Financial Condition, as the criteria under ASC 210-20, “Balance Sheet,” have been met.
All of the commodity interests owned directly by the Partnership are held for trading purposes. All of the commodity interests owned by the Funds are held for trading purposes. The monthly average number of futures contracts traded directly by the Partnership during the years ended December 31, 2017 and 2016 were 20,043 and 13,687, respectively. The monthly average number of metals forward contracts traded directly by the Partnership during the years ended December 31, 2017 and 2016 were 2,202 and 1,984, respectively. The monthly average notional value of currency forward contracts traded directly by the Partnership during the years ended December 31, 2017 and 2016 were $1,253,145,597 and $1,169,597,972, respectively.
Ongoing selling agent fees and trading and transaction fees are based on the number of trades executed by the Advisors and the Partnership’s percentage ownership of each respective Fund.
All clearing fees paid to MS&Co. are borne by the Partnership for its direct trading. In addition, clearing fees are borne by the Funds and are allocated to the limited partners/members, including the Partnership.
51
Ceres Orion L.P. (formerly, Orion Futures Fund L.P.)
Notes to Financial Statements
The following tables summarize the gross and net amounts recognized relating to assets and liabilities of the Partnership’s derivatives and their offsetting subject to master netting or similar arrangements as of December 31, 2017 and 2016, respectively.
| Gross Amounts | Amounts | Gross Amounts Not Offset in the | ||||||||||||||||||||||
| Offset in the | Presented in the | Statements of Financial Condition | ||||||||||||||||||||||
| Gross | Statements of | Statements of | Cash Collateral | |||||||||||||||||||||
| Amounts | Financial | Financial | Financial | Received/ | ||||||||||||||||||||
| December 31, 2017 |
Recognized | Condition | Condition | Instruments | Pledged* | Net Amount | ||||||||||||||||||
| Assets |
||||||||||||||||||||||||
| Futures |
$ | 9,793,492 | $ | (4,789,432) | $ | 5,004,060 | $ | - | $ | - | $ | 5,004,060 | ||||||||||||
| Forwards |
11,774,122 | (10,900,848) | 873,274 | - | - | 873,274 | ||||||||||||||||||
|
|
|
|
|
|
|
|
|
|
|
|
|
|||||||||||||
| Total assets |
$ | 21,567,614 | $ | (15,690,280) | $ | 5,877,334 | $ | - | $ | - | $ | 5,877,334 | ||||||||||||
|
|
|
|
|
|
|
|
|
|
|
|
|
|||||||||||||
| Liabilities |
||||||||||||||||||||||||
| Futures |
$ | (4,789,432) | $ | 4,789,432 | $ | - | $ | - | $ | - | $ | - | ||||||||||||
| Forwards |
(10,900,848) | 10,900,848 | - | - | - | - | ||||||||||||||||||
|
|
|
|
|
|
|
|
|
|
|
|
|
|||||||||||||
| Total liabilities |
$ | (15,690,280) | $ | 15,690,280 | $ | - | $ | - | $ | - | $ | - | ||||||||||||
|
|
|
|
|
|
|
|
|
|
|
|
|
|||||||||||||
| Net fair value |
$ | 5,877,334 | * | |||||||||||||||||||||
|
|
|
|||||||||||||||||||||||
| Gross Amounts | Amounts | Gross Amounts Not Offset in the | ||||||||||||||||||||||
| Offset in the | Presented in the | Statements of Financial Condition | ||||||||||||||||||||||
| Gross | Statements of | Statements of | Cash Collateral | |||||||||||||||||||||
| Amounts | Financial | Financial | Financial | Received/ | ||||||||||||||||||||
| December 31, 2016 |
Recognized | Condition | Condition | Instruments | Pledged* | Net Amount | ||||||||||||||||||
| Assets |
||||||||||||||||||||||||
| Futures |
$ | 6,804,624 | $ | (4,881,274) | $ | 1,923,350 | $ | - | $ | - | $ | 1,923,350 | ||||||||||||
| Forwards |
8,325,861 | (7,349,501) | 976,360 | - | - | 976,360 | ||||||||||||||||||
|
|
|
|
|
|
|
|
|
|
|
|
|
|||||||||||||
| Total assets |
$ | 15,130,485 | $ | (12,230,775) | $ | 2,899,710 | $ | - | $ | - | $ | 2,899,710 | ||||||||||||
|
|
|
|
|
|
|
|
|
|
|
|
|
|||||||||||||
| Liabilities |
||||||||||||||||||||||||
| Futures |
$ | (4,881,274) | $ | 4,881,274 | $ | - | $ | - | $ | - | $ | - | ||||||||||||
| Forwards |
(7,349,501) | 7,349,501 | - | - | - | - | ||||||||||||||||||
|
|
|
|
|
|
|
|
|
|
|
|
|
|||||||||||||
| Total liabilities |
$ | (12,230,775) | $ | 12,230,775 | $ | - | $ | - | $ | - | $ | - | ||||||||||||
|
|
|
|
|
|
|
|
|
|
|
|
|
|||||||||||||
| Net fair value |
$ | 2,899,710 | * | |||||||||||||||||||||
|
|
|
|||||||||||||||||||||||
| • | In the event of default by the Partnership, MS&Co., the Partnership’s commodity futures brokers and the sole counterparty to the Partnership’s non-exchange-traded contracts, as applicable, has the right to offset the Partnership’s obligation with the Partnership’s cash and/or U.S. Treasury bills held by MS&Co., thereby minimizing MS&Co.’s risk of loss. In certain instances, MS&Co. may not post collateral and as such, in the event of default by MS&Co., the Partnership is exposed to the amount shown in the Statements of Financial Condition. In the case of exchange-traded contracts, the Partnership’s exposure to counterparty risk may be reduced since the exchange’s clearinghouse interposes its credit between buyer and seller and the clearinghouse’s guarantee funds may be available in the event of a default. |
52
Ceres Orion L.P. (formerly, Orion Futures Fund L.P.)
Notes to Financial Statements
The following tables indicate the gross fair values of derivative instruments of futures and forward contracts held directly by the Partnership as separate assets and liabilities as of December 31, 2017 and 2016, respectively.
| December 31, 2017 | ||||
| Assets |
||||
| Futures Contracts |
||||
| Energy |
$ | 4,510,786 | ||
| Grains |
629,298 | |||
| Indices |
2,719,041 | |||
| Interest Rates U.S. |
71,430 | |||
| Interest Rates Non-U.S. |
641,412 | |||
| Metals |
666,037 | |||
| Softs |
555,488 | |||
|
|
|
|||
| Total unrealized appreciation on open futures contracts |
9,793,492 | |||
|
|
|
|||
| Liabilities |
||||
| Futures Contracts |
||||
| Energy |
(787,785) | |||
| Grains |
(29,437) | |||
| Indices |
(1,479,383) | |||
| Interest Rates U.S. |
(757,358) | |||
| Interest Rates Non-U.S. |
(1,322,106) | |||
| Livestock |
(27,290) | |||
| Metals |
(263,285) | |||
| Softs |
(122,788) | |||
|
|
|
|||
| Total unrealized depreciation on open futures contracts |
(4,789,432) | |||
|
|
|
|||
| Net unrealized appreciation on open futures contracts |
$ | 5,004,060 | * | |
|
|
|
|||
| Assets |
||||
| Forward Contracts |
||||
| Currencies |
$ | 8,187,150 | ||
| Metals |
3,586,972 | |||
|
|
|
|||
| Total unrealized appreciation on open forward contracts |
11,774,122 | |||
|
|
|
|||
| Liabilities |
||||
| Forward Contracts |
||||
| Currencies |
(7,330,639) | |||
| Metals |
(3,570,209) | |||
|
|
|
|||
| Total unrealized depreciation on open forward contracts |
(10,900,848) | |||
|
|
|
|||
| Net unrealized appreciation on open forward contracts |
$ | 873,274 | ** | |
|
|
|
|||
| * | This amount is in “Net unrealized appreciation on open futures contracts” in the Statements of Financial Condition. |
| ** | This amount is in “Net unrealized appreciation on open forward contracts” in the Statements of Financial Condition. |
53
Ceres Orion L.P. (formerly, Orion Futures Fund L.P.)
Notes to Financial Statements
| December 31, 2016 | ||||
| Assets |
||||
| Futures Contracts |
||||
| Energy |
$ | 1,035,020 | ||
| Grains |
594,558 | |||
| Indices |
3,074,016 | |||
| Interest Rates U.S. |
219,907 | |||
| Interest Rates Non-U.S. |
926,918 | |||
| Livestock |
23,006 | |||
| Metals |
247,290 | |||
| Softs |
683,909 | |||
|
|
|
|||
| Total unrealized appreciation on open futures contracts |
6,804,624 | |||
|
|
|
|||
| Liabilities |
||||
| Futures Contracts |
||||
| Energy |
(1,331,103) | |||
| Grains |
(700,538) | |||
| Indices |
(894,433) | |||
| Interest Rates U.S. |
(768,687) | |||
| Interest Rates Non-U.S. |
(669,301) | |||
| Livestock |
(11,178) | |||
| Metals |
(407,315) | |||
| Softs |
(98,719) | |||
|
|
|
|||
| Total unrealized depreciation on open futures contracts |
(4,881,274) | |||
|
|
|
|||
| Net unrealized appreciation on open futures contracts |
$ | 1,923,350 | * | |
|
|
|
|||
| Assets |
||||
| Forward Contracts |
||||
| Currencies |
$ | 5,033,201 | ||
| Metals |
3,292,660 | |||
|
|
|
|||
| Total unrealized appreciation on open forward contracts |
8,325,861 | |||
|
|
|
|||
| Liabilities |
||||
| Forward Contracts |
||||
| Currencies |
(3,562,811) | |||
| Metals |
(3,786,690) | |||
|
|
|
|||
| Total unrealized depreciation on open forward contracts |
(7,349,501) | |||
|
|
|
|||
| Net unrealized appreciation on open forward contracts |
$ | 976,360 | ** | |
|
|
|
|||
| * | This amount is in “Net unrealized appreciation on open futures contracts” in the Statements of Financial Condition. |
| ** | This amount is in “Net unrealized appreciation on open forward contracts” in the Statements of Financial Condition. |
54
Ceres Orion L.P. (formerly, Orion Futures Fund L.P.)
Notes to Financial Statements
The following table indicates the trading gains and losses, by market sector, on derivative instruments traded directly by the Partnership for the years ended December 31, 2017, 2016 and 2015, respectively.
| Sector |
2017 |
2016 |
2015 | |||||||||
| Currencies |
$ | (7,867,522) | $ 3,080,007 | $ | 251,287 | |||||||
| Energy |
(106,263) | (12,279,027) | 5,220,997 | |||||||||
| Grains |
(4,270,109) | (210,422) | 566,024 | |||||||||
| Indices |
29,363,266 | (6,694,075) | (2,766,619) | |||||||||
| Interest Rates U.S. |
(4,548,710) | (4,607,629) | (1,850,339) | |||||||||
| Interest Rates Non-U.S. |
(7,142,822) | 4,717,308 | (2,871,784) | |||||||||
| Livestock |
(902,168) | (1,279,792) | 154,067 | |||||||||
| Metals |
(404,789) | (4,359,666) | 557,248 | |||||||||
| Softs |
(233,585) | (1,168,318) | (165,472) | |||||||||
|
|
|
|
|
|
||||||||
| Total |
$ | 3,887,298 | *** | $ (22,801,614) | *** | $ | (904,591) | *** | ||||
|
|
|
|
|
|
||||||||
| *** | This amount is included in “Total trading results” in the Statements of Income and Expenses. |
| 5. | Fair Value Measurements: |
Partnership’s and the Funds’ Fair Value Measurements. Fair value is defined as the value that would be received to sell an asset or paid to transfer a liability in an orderly transaction between market participants at the measurement date under current market conditions. The fair value hierarchy gives the highest priority to unadjusted quoted prices in active markets for identical assets or liabilities (Level 1) and the lowest priority to fair values derived from unobservable inputs (Level 3). The level in the fair value hierarchy within which the fair value measurement in its entirety falls shall be determined based on the lowest level input that is significant to the fair value measurement in its entirety.
The fair value of exchange-traded futures, option and forward contracts is determined by the various exchanges, and reflects the settlement price for each contract as of the close of business on the last business day of the reporting period. The fair value of foreign currency forward contracts is extrapolated on a forward basis from the spot prices quoted as of approximately 3:00 P.M. (E.T.) on the last business day of the reporting period from various exchanges. The fair value of non-exchange-traded foreign currency option contracts is calculated by applying an industry standard model application for options valuation of foreign currency options, using as inputs the spot prices, interest rates, and option implied volatilities quoted as of approximately 3:00 P.M. (E.T.) on the last business day of the reporting period. U.S. Treasury bills are valued at the last available bid price received from independent pricing services as of the close of the last business day of the reporting period.
The Partnership and the Funds consider prices for commodity futures, swap and option contracts to be based on unadjusted quoted prices in active markets for identical assets and liabilities (Level 1). The values of U.S. Treasury bills, non-exchange-traded forward, swap and certain option contracts for which market quotations are not readily available are priced by pricing services that derive fair values for those assets and liabilities from observable inputs (Level 2). As of and for the years ended December 31, 2017 and 2016, the Partnership and the Funds did not hold any derivative instruments that were priced at fair value using unobservable inputs through the application of the General Partner’s assumptions and internal valuation pricing models (Level 3). Transfers between levels are recognized at the beginning of the reporting period.
55
Ceres Orion L.P. (formerly, Orion Futures Fund L.P.)
Notes to Financial Statements
| December 31, 2017* |
Total | Level 1 | Level 2 | Level 3 | ||||||||||||
| Assets |
||||||||||||||||
| Futures |
$ | 9,793,492 | $ | 9,793,492 | $ | — | $ | — | ||||||||
| Forwards |
11,774,122 | — | 11,774,122 | — | ||||||||||||
|
|
|
|
|
|
|
|
|
|||||||||
| Total assets |
$ | 21,567,614 | $ | 9,793,492 | $ | 11,774,122 | $ | — | ||||||||
|
|
|
|
|
|
|
|
|
|||||||||
| Liabilities |
||||||||||||||||
| Futures |
$ | 4,789,432 | $ | 4,789,432 | $ | — | $ | — | ||||||||
| Forwards |
10,900,848 | — | 10,900,848 | — | ||||||||||||
|
|
|
|
|
|
|
|
|
|||||||||
| Total liabilities |
$ | 15,690,280 | $ | 4,789,432 | $ | 10,900,848 | $ | — | ||||||||
|
|
|
|
|
|
|
|
|
|||||||||
| December 31, 2016 |
Total | Level 1 | Level 2 | Level 3 | ||||||||||||
| Assets |
||||||||||||||||
| Futures |
$ | 6,804,624 | $ | 6,804,624 | $ | — | $ | — | ||||||||
| Forwards |
8,325,861 | 3,292,660 | 5,033,201 | — | ||||||||||||
| U.S. Treasury bills |
110,958,513 | — | 110,958,513 | — | ||||||||||||
|
|
|
|
|
|
|
|
|
|||||||||
| Total assets |
$ | 126,088,998 | $ | 10,097,284 | $ | 115,991,714 | $ | — | ||||||||
|
|
|
|
|
|
|
|
|
|||||||||
| Liabilities |
||||||||||||||||
| Futures |
$ | 4,881,274 | $ | 4,881,274 | $ | — | $ | — | ||||||||
| Forwards |
7,349,501 | 3,786,690 | 3,562,811 | — | ||||||||||||
|
|
|
|
|
|
|
|
|
|||||||||
| Total liabilities |
$ | 12,230,775 | $ | 8,667,964 | $ | 3,562,811 | $ | — | ||||||||
|
|
|
|
|
|
|
|
|
|||||||||
| * | $3,292,660 of assets and $3,786,690 of liabilities were transferred from Level 1 to Level 2 during the year ended December 31, 2017. The General Partner believes that for London Metal Exchange (“LME”) contracts, the inputs are derived from an exchange and not actively quoted prices, which is more representative of a Level 2 security. |
6. Investment in the Funds:
On November 1, 2004, the assets allocated to Winton for trading were invested in Winton Master, a limited partnership organized under the partnership laws of the State of New York. Winton Master permits accounts managed by Winton using the Winton Futures Program (formerly, the Winton Diversified Program as applied without equities), a proprietary, systematic trading system, to invest together in one trading vehicle. The General Partner is also the general partner of Winton Master. Individual and pooled accounts currently managed by Winton, including the Partnership, are permitted to be limited partners of Winton Master. The General Partner and Winton believe that trading through this structure promotes efficiency and economy in the trading process. The General Partner and Winton have agreed that Winton will trade the Partnership’s assets allocated to Winton at a level that is up to 1.5 times the amount of assets allocated.
On June 1, 2011, the Partnership allocated a portion of its assets to Transtrend Master, a limited liability company organized under the limited liability company laws of the State of Delaware. Transtrend Master permits accounts managed by Transtrend using the Diversified Trend Program-Enhanced Risk Profile (US Dollar), a proprietary, systematic trading system, to invest together in one trading vehicle. Individual and pooled accounts managed by Transtrend, including the Partnership, are permitted to be non-managing members of Transtrend Master. The Trading Manager and Transtrend believe that trading through this structure promotes efficiency and economy in the trading process.
On August 1, 2014, the assets allocated to Willowbridge for trading were invested in Willowbridge Master, a limited partnership organized under the partnership laws of the State of New York. Willowbridge Master permits accounts managed by Willowbridge using its wPraxis Futures Trading Approach, a proprietary, discretionary trading system, to invest together in one trading vehicle. The General Partner is also the general partner of Willowbridge Master. Individual and pooled accounts currently managed by Willowbridge, including the Partnership, are permitted to be limited partners of Willowbridge Master. The General Partner and Willowbridge believe that trading through this structure promotes efficiency and economy in the trading process. The General Partner and Willowbridge have agreed that Willowbridge will trade the Partnership’s assets at a level that is up to three times the amount of the assets allocated.
56
Ceres Orion L.P. (formerly, Orion Futures Fund L.P.)
Notes to Financial Statements
The General Partner is not aware of any material changes to any of the trading programs discussed above during the year ended December 31, 2017.
The Funds’ and the Partnership’s trading of futures, forward, swap, and option contracts, if applicable, on commodities is done primarily on U.S. and foreign commodity exchanges. The Funds and the Partnership engage in such trading through commodity brokerage accounts maintained with MS&Co.
Generally, a limited partner/member in the Funds withdraws all or part of its capital contribution and undistributed profits, if any, from the Funds as of the end of any month (the “Redemption Date”) after a request has been made to the General Partner/Trading Manager at least three days in advance of the Redemption Date. Such withdrawals are classified as a liability when the limited partner/member elects to redeem and informs the Funds. However, for all Funds other than Winton Master, a limited partner/member may request a withdrawal as of the end of any day if such request is received by the General Partner/Trading Manager at least three days in advance of the proposed withdrawal day.
Management fees, ongoing selling agent fees, General Partner fees and incentive fees are charged at the Partnership level, except for management and incentive fees payable to Transtrend which are charged at the Transtrend Master level. Clearing fees are borne by the Funds and allocated to the Funds’ limited partners/non-managing members, including the Partnership. Clearing fees are also borne by the Partnership directly. Professional fees are borne by the Funds and allocated to the Partnership, and also charged directly at the Partnership level.
Prior to the close of business on December 31, 2017, the Partnership owned approximately 45.8% of Winton Master, 95.8% of Transtrend Master and 82.5% of Willowbridge Master. At December 31, 2016, the Partnership owned approximately 51.4% of Winton Master, 94.9% of Transtrend Master and 76.5% of Willowbridge Master. It is the Partnership’s intention to continue to invest in the Funds. The performance of the Partnership is directly affected by the performance of the Funds. Expenses to investors as a result of investment in the Funds are approximately the same as they would be if the Partnership traded directly and redemption rights are not affected.
Summarized information reflecting the total assets, liabilities and partners’ capital/members’ capital of the Funds is shown in the following tables:
| December 31, 2017 | ||||||||||||
| Total Assets | Total Liabilities | Total Capital | ||||||||||
| Winton Master |
$ | 408,725,040 | $ | 11,076,733 | $ | 397,648,307 | ||||||
| Transtrend Master |
217,045,353 | 15,335,906 | 201,709,447 | |||||||||
| Willowbridge Master |
336,101,673 | 39,096,772 | 297,004,901 | |||||||||
| December 31, 2016 | ||||||||||||
| Total Assets | Total Liabilities | Total Capital | ||||||||||
| Winton Master |
$ | 495,983,925 | $ | 1,690,947 | $ | 494,292,978 | ||||||
| Transtrend Master |
296,071,844 | 311,815 | 295,760,029 | |||||||||
| Willowbridge Master |
396,846,845 | 5,348,232 | 391,498,613 | |||||||||
57
Ceres Orion L.P. (formerly, Orion Futures Fund L.P.)
Notes to Financial Statements
Summarized information reflecting the net investment income (loss), total trading results and net income (loss) of the Funds is shown in the following tables:
| For the year ended December 31, 2017 | ||||||||||||
| Net Investment | Total Trading | Net Income | ||||||||||
| Income (Loss) | Results | (Loss) | ||||||||||
| Winton Master |
$ | 2,498,543 | $ | 41,177,241 | $ | 43,675,784 | ||||||
| Transtrend Master |
(2,170,265) | (2,700,598) | (4,870,863) | |||||||||
| Willowbridge Master |
1,244,821 | (27,512,190) | (26,267,369) | |||||||||
| For the year ended December 31, 2016 | ||||||||||||
| Net Investment | Total Trading | Net Income | ||||||||||
| Income (Loss) | Results | (Loss) | ||||||||||
| Winton Master |
$ | 644,094 | $ | 12,105,450 | $ | 12,749,544 | ||||||
| Transtrend Master |
(6,714,929) | 42,872,388 | 36,157,459 | |||||||||
| Willowbridge Master |
(120,715) | 10,171,911 | 10,051,196 | |||||||||
Summarized information reflecting the Partnership’s investments in and the Partnership’s pro-rata share of the results of operations of the Funds are shown in the following tables:
| December 31, 2017 | For the year ended December 31, 2017 | |||||||||||||||||||||||||||||||||||||||
| % of | Expenses | Net | ||||||||||||||||||||||||||||||||||||||
| Partners’ |
Income | Clearing |
Professional |
Management |
Incentive |
Income | Investment | Redemptions |
||||||||||||||||||||||||||||||||
| Funds |
Capital | Fair Value | (Loss) | Fees | Fees | Fees | Fee | (Loss) | Objective | Permitted | ||||||||||||||||||||||||||||||
| Winton Master |
23.38 | % | $ | 186,666,465 | $ | 20,307,233 | $ | 235,397 | $ | 29,118 | $ | — | $ | — | $ | 20,042,718 | |
Commodity Portfolio |
|
Monthly | ||||||||||||||||||||
| Transtrend Master |
25.26 | % | 201,709,447 | (857,440 | ) | 1,529,471 | 839 | 1,961,681 | 25,157 | (4,374,588 | ) | |
Commodity Portfolio |
|
Monthly | |||||||||||||||||||||||||
| Willowbridge Master |
33.58 | % | 268,119,462 | (19,867,278 | ) | 1,170,473 | 55,300 | — | — | (21,093,051 | ) | |
Commodity Portfolio |
|
Monthly | |||||||||||||||||||||||||
|
|
|
|
|
|
|
|
|
|
|
|
|
|
|
|||||||||||||||||||||||||||
| Total |
$ | 656,495,374 | $ | (417,485 | ) | $ | 2,935,341 | $ | 85,257 | $ | 1,961,681 | $ | 25,157 | $ | (5,424,921 | ) | ||||||||||||||||||||||||
|
|
|
|
|
|
|
|
|
|
|
|
|
|
|
|||||||||||||||||||||||||||
| December 31, 2016 | For the year ended December 31, 2016 | |||||||||||||||||||||||||||||||||||||||
| % of | Expenses | Net | ||||||||||||||||||||||||||||||||||||||
| Partners’ |
Income | Clearing |
Professional |
Management |
Incentive |
Income | Investment |
Redemptions |
||||||||||||||||||||||||||||||||
| Funds |
Capital | Fair Value | (Loss) | Fees | Fees | Fees | Fee | (Loss) | Objective | Permitted | ||||||||||||||||||||||||||||||
| Winton Master |
25.44 | % | $ | 253,912,486 | $ | 8,936,078 | $ | 347,150 | $ | 40,085 | $ | — | $ | — | $ | 8,548,843 | |
Commodity Portfolio |
|
Monthly | ||||||||||||||||||||
| Transtrend Master |
28.12 | % | 280,645,616 | 41,945,544 | 1,669,127 | 745 | 3,052,708 | 2,088,183 | 35,134,781 | |
Commodity Portfolio |
|
Monthly | |||||||||||||||||||||||||||
| Willowbridge Master |
30.02 | % | 299,544,955 | 9,065,770 | 696,590 | 54,821 | — | — | 8,314,359 | |
Commodity Portfolio |
|
Monthly | |||||||||||||||||||||||||||
|
|
|
|
|
|
|
|
|
|
|
|
|
|
|
|||||||||||||||||||||||||||
| Total |
$ | 834,103,057 | $ | 59,947,392 | $ | 2,712,867 | $ | 95,651 | $ | 3,052,708 | $ | 2,088,183 | $ | 51,997,983 | ||||||||||||||||||||||||||
|
|
|
|
|
|
|
|
|
|
|
|
|
|
|
|||||||||||||||||||||||||||
58
Ceres Orion L.P. (formerly, Orion Futures Fund L.P.)
Notes to Financial Statements
| 7. | Subscriptions, Distributions and Redemptions: |
Subscriptions are accepted monthly from investors who become limited partners on the first day of the month after their subscriptions are processed. Distributions are made on a pro-rata basis at the sole discretion of the General Partner. No distributions have been made to date. The General Partner does not intend to make any distributions of the Partnership’s profits. A limited partner may require the Partnership to redeem its Redeemable Units at their net asset value as of the end of each month on three business days’ notice to the General Partner. There is no fee charged to limited partners in connection with redemptions.
| 8. | Financial Highlights: |
Financial highlights for the limited partner Classes as a whole for the years ended December 31, 2017, 2016 and 2015 were as follows:
| 2017 | 2016 | 2015 | ||||||||||||||||||||||
| Per Redeemable Unit Performance (for a unit |
Class A | Class Z | Class A | Class Z | Class A | Class Z | ||||||||||||||||||
| outstanding throughout the year):* |
||||||||||||||||||||||||
| Net realized and unrealized gains (losses) |
$ | 7.10 | $ | 3.30 | $ | 94.62 | $ | 35.78 | $ | 80.55 | $ | 30.05 | ||||||||||||
| Net investment loss |
(102.28 | ) | (20.47 | ) | (116.82 | ) | (29.28 | ) | (152.49 | ) | (44.80 | ) | ||||||||||||
|
|
|
|
|
|
|
|
|
|
|
|
|
|||||||||||||
| Increase (decrease) for the year |
(95.18 | ) | (17.17 | ) | (22.20 | ) | 6.50 | (71.94 | ) | (14.75 | ) | |||||||||||||
| Net asset value per Redeemable Unit, beginning of year |
2,982.64 | 1,139.98 | 3,004.84 | 1,133.48 | 3,076.78 | 1,148.23 | ||||||||||||||||||
|
|
|
|
|
|
|
|
|
|
|
|
|
|||||||||||||
| Net asset value per Redeemable Unit, end of year |
$ | 2,887.46 | $ | 1,122.81 | $ | 2,982.64 | $ | 1,139.98 | $ | 3,004.84 | $ | 1,133.48 | ||||||||||||
|
|
|
|
|
|
|
|
|
|
|
|
|
|||||||||||||
| 2017 | 2016 | 2015 | ||||||||||||||||||||||
| Class A | Class Z | Class A | Class Z | Class A | Class Z | |||||||||||||||||||
| Ratios to Average Limited Partners’ Capital: |
||||||||||||||||||||||||
| Net investment loss** |
(3.6 | )% | (1.9 | )% | (3.9 | )% | (2.6 | )% | (5.0 | )% | (4.1 | )% | ||||||||||||
| Operating expense |
4.4 | % | 2.7 | % | 3.9 | % | 2.6 | % | 3.7 | % | 2.7 | % | ||||||||||||
| Incentive fees |
0.0 | %*** | 0.0 | %*** | 0.2 | % | 0.2 | % | 1.4 | % | 1.4 | % | ||||||||||||
|
|
|
|
|
|
|
|
|
|
|
|
|
|||||||||||||
| Total expenses |
4.4 | % | 2.7 | % | 4.1 | % | 2.8 | % | 5.1 | % | 4.1 | % | ||||||||||||
|
|
|
|
|
|
|
|
|
|
|
|
|
|||||||||||||
| Total return: |
||||||||||||||||||||||||
| Total return before incentive fees |
(3.2 | )% | (1.5 | )% | (0.5 | )% | 0.8 | % | (0.9 | )% | 0.1 | % | ||||||||||||
| Incentive fees |
(0.0 | )%*** | (0.0 | )%*** | (0.2 | )% | (0.2 | )% | (1.4 | )% | (1.4 | )% | ||||||||||||
|
|
|
|
|
|
|
|
|
|
|
|
|
|||||||||||||
| Total return after incentive fees |
(3.2 | )% | (1.5 | )% | (0.7 | )% | 0.6 | % | (2.3 | )% | (1.3 | )% | ||||||||||||
|
|
|
|
|
|
|
|
|
|
|
|
|
|||||||||||||
| * | Net investment loss per Redeemable Unit is calculated by dividing the interest income less total expenses by the average number of Redeemable Units outstanding during the period. The net realized and unrealized gains (losses) per Redeemable Unit is a balancing amount necessary to reconcile the change in net asset value per Redeemable Unit with the other per unit information. |
| ** | Interest income less total expenses. |
| *** | Due to rounding. |
The above ratios and total return may vary for individual investors based on the timing of capital transactions during the period. Additionally, these ratios are calculated for the limited partner Classes using the limited partners’ share of income, expenses and average partners’ capital of the Partnership and include the income and expenses allocated from the Funds.
59
Ceres Orion L.P. (formerly, Orion Futures Fund L.P.)
Notes to Financial Statements
| 9. | Financial Instrument Risks: |
In the normal course of business, the Partnership and the Funds are parties to financial instruments with off-balance-sheet risk, including derivative financial instruments and derivative commodity instruments. These financial instruments may include forwards, futures, options, and swaps, whose values are based upon an underlying asset, index, or reference rate, and generally represent future commitments to exchange currencies or cash balances, or to purchase or sell other financial instruments at specific terms at specified future dates, or, in the case of derivative commodity instruments, to have a reasonable possibility to be settled in cash, through physical delivery or with another financial instrument. These instruments may be traded on an exchange, a swap execution facility or over-the-counter (“OTC”). Exchange-traded instruments include futures and certain standardized forward, option and swap contracts. Certain swap contracts may also be traded on a swap execution facility or OTC. OTC contracts are negotiated between contracting parties and also include certain forward and option contracts. Specific market movements of commodities or futures contracts underlying an option cannot accurately be predicted. The purchaser of an option may lose the entire premium paid for the option. The writer or seller of an option has unlimited risk. Each of these instruments is subject to various risks similar to those relating to the underlying financial instruments, including market and credit risk. In general, the risks associated with OTC contracts are greater than those associated with exchange-traded instruments because of the greater risk of default by the counterparty to an OTC contract. The General Partner estimates that at any given time approximately 25.5% to 51.7% of the Partnership’s/Funds’ contracts are traded OTC.
Futures Contracts. The Partnership and the Funds trade futures contracts. A futures contract is a firm commitment to buy or sell a specified quantity of investments, currency or a standardized amount of a deliverable grade commodity, at a specified price on a specified future date, unless the contract is closed before the delivery date or if the delivery quantity is something where physical delivery cannot occur (such as the S&P 500 Index), whereby such contract is settled in cash. Payments (“variation margin”) may be made or received by the Partnership and the Funds each business day, depending on the daily fluctuations in the value of the underlying contracts, and are recorded as unrealized gains or losses by the Partnership and the Funds. When the contract is closed, the Partnership and the Funds record a realized gain or loss equal to the difference between the value of the contract at the time it was opened and the value at the time it was closed. Transactions in futures contracts require participants to make both initial margin deposits of cash or other assets and variation margin deposits, through the futures broker, directly with the exchange on which the contracts are traded. Net realized gains (losses) and net change in unrealized gains (losses) on futures contracts are included in the Partnership’s/Funds’ Statements of Income and Expenses.
Forward Foreign Currency Contracts. Forward foreign currency contracts are those contracts where the Partnership and the Funds agree to receive or deliver a fixed quantity of foreign currency for an agreed-upon price on an agreed-upon future date. Forward foreign currency contracts are valued daily, and the Partnership’s and the Funds’ net equity therein, representing unrealized gain or loss on the contracts as measured by the difference between the forward foreign exchange rates at the dates of entry into the contracts and the forward foreign exchange rates at the reporting date, is included in the Partnership’s/Funds’ Statements of Financial Condition. Net realized gains (losses) and net change in unrealized gains (losses) on forward foreign currency contracts are recognized in the period in which the contract is closed or the changes occur and are included in the Partnership’s/Funds’ Statements of Income and Expenses.
London Metals Exchange Forward Contracts. Metal contracts traded on the LME represent a firm commitment to buy or sell a specified quantity of aluminum, copper, lead, nickel, tin or zinc. LME contracts traded by the Partnership and the Funds are cash-settled based on prompt dates published by the LME. Variation margin may be made or received by the Partnership and the Funds each business day, depending on the daily fluctuations in the value of the underlying contracts, and are recorded as unrealized gains or losses by the Partnership and the Funds. A contract is considered offset when all long positions have been matched with a like number of short positions settling on the same prompt date. When the contract is closed at the prompt date, the Partnership and the Funds record a realized gain or loss equal to the difference between the value of the contract at the time it was opened and the value at the time it was closed. Transactions in LME contracts require participants to make both initial margin deposits of cash or other assets and variation margin deposits, through the broker, directly with the LME. Net realized gains (losses) and net change in unrealized gains (losses) on metal contracts are included in the Partnership’s/Funds’ Statements of Income and Expenses.
Options. The Partnership/Funds may purchase and write (sell) both exchange-listed and OTC options on commodities or financial instruments. An option is a contract allowing, but not requiring, its holder to buy (call) or sell (put) a specific or standard commodity or financial instrument at a specified price during a specified time period. The option premium is the total price paid or received for the option contract. When the Partnership/Funds
60
Ceres Orion L.P. (formerly, Orion Futures Fund L.P.)
Notes to Financial Statements
write an option, the premium received is recorded as a liability in the Partnership’s/Funds’ Statements of Financial Condition and marked-to-market daily. When the Partnership/Funds purchase an option, the premium paid is recorded as an asset in the Partnership’s/Funds’ Statements of Financial Condition and marked-to-market daily. Net realized gains (losses) and net change in unrealized gains (losses) on option contracts are included in the Partnership’s/Funds’ Statements of Income and Expenses.
As both a buyer and seller of options, the Partnership/Funds pay or receive a premium at the outset and then bear the risk of unfavorable changes in the price of the contract underlying the option. Written options expose the Partnership/Funds to potentially unlimited liability; for purchased options, the risk of loss is limited to the premiums paid. Certain written put options permit cash settlement and do not require the option holder to own the reference asset. The Partnership/Funds do not consider these contracts to be guarantees.
Futures-Style Options. The Funds may trade futures-style option contracts. Unlike traditional option contracts, the premiums for futures-style option contracts are not received or paid upon the onset of the trade. The premiums are recognized and received or paid as part of the sales price when the contract is closed. Similar to a futures contract, variation margin for the futures-style option contract may be made or received by the Funds each business day, depending on the daily fluctuations in the value of the underlying contracts, and are recorded as unrealized gains or losses by the Funds. Transactions in futures-style option contracts require participants to make both initial margin deposits of cash or other assets and variation margin deposits, through the futures broker, directly with the exchange on which the contracts are traded. Futures-style option contracts are presented as part of “Net unrealized appreciation on open futures contracts” or “Net unrealized depreciation on open futures contracts,” as applicable, in the Funds’ Statements of Financial Condition. Net realized gains (losses) and net change in unrealized gains (losses) on futures-style option contracts are included in the Funds’ Statements of Income and Expenses.
Market risk is the potential for changes in the value of the financial instruments traded by the Partnership/Funds due to market changes, including interest and foreign exchange rate movements and fluctuations in commodity or security prices. Market risk is directly impacted by the volatility and liquidity in the markets in which the related underlying assets are traded. The Partnership and the Funds are exposed to market risk equal to the value of the futures and forward contracts held and unlimited liability on such contracts sold short.
Credit risk is the possibility that a loss may occur due to the failure of a counterparty to perform according to the terms of a contract. The Partnership’s/Funds’ risk of loss in the event of a counterparty default is typically limited to the amounts recognized in the Partnership’s/Funds’ Statements of Financial Condition and is not represented by the contract or notional amounts of the instruments. The Partnership’s/Funds’ risk of loss is reduced through the use of legally enforceable master netting agreements with counterparties that permit the Partnership/Funds to offset unrealized gains and losses and other assets and liabilities with such counterparties upon the occurrence of certain events. The Partnership/Funds have credit risk and concentration risk as MS&Co., an MS&Co. affiliate, or JPMorgan are counterparties or brokers with respect to the Partnership’s and the Funds’ assets. Credit risk with respect to exchange-traded instruments is reduced to the extent that, through MS&Co. or an MS&Co. affiliate, the Partnership’s/Funds’ counterparty is an exchange or clearing organization.
61
Ceres Orion L.P. (formerly, Orion Futures Fund L.P.)
Notes to Financial Statements
The General Partner monitors and attempts to mitigate the Partnership’s/Funds’ risk exposure on a daily basis through financial, credit and risk management monitoring systems, and accordingly, believes that it has effective procedures for evaluating and limiting the credit and market risks to which the Partnership/Funds may be subject. These monitoring systems generally allow the General Partner to statistically analyze actual trading results with risk-adjusted performance indicators and correlation statistics. In addition, online monitoring systems provide account analysis of futures, exchange-cleared swaps, forward and option contracts by sector, margin requirements, gain and loss transactions and collateral positions.
The majority of these financial instruments mature within one year of the inception date. However, due to the nature of the Partnership’s/Funds’ business, these instruments may not be held to maturity.
The risk to the limited partners that have purchased Redeemable Units is limited to the amount of their share of the Partnership’s net assets and undistributed profits. This limited liability is a result of the organization of the Partnership as a limited partnership under New York law.
In the ordinary course of business, the Partnership/Funds enter into contracts and agreements that contain various representations and warranties and which provide general indemnifications. The Partnership’s/Funds’ maximum exposure under these arrangements cannot be determined, as this could include future claims that have not yet been made against the Partnership/Funds. The Partnership/Funds consider the risk of any future obligation relating to these indemnifications to be remote.
| 10. | Subsequent Events: |
The General Partner evaluates events that occur after the balance sheet date but before and up until financial statements are available to be issued. The General Partner has assessed the subsequent events through the date the financial statements were issued and has determined that, other than disclosed below, there were no subsequent events requiring adjustment to or disclosure in the financial statements.
Effective February 1, 2018, the Partnership allocated a portion of its assets to FORT Contrarian Master Fund LLC, which will be managed and traded by FORT L.P. pursuant to its Global Contrarian Program.
Effective February 28, 2018, the Partnership changed its name from Orion Futures Fund L.P. to Ceres Orion L.P.
62
Selected unaudited quarterly financial data for the years ended December 31, 2017 and 2016 are summarized below:
| For the period from October 1, 2017 to December 31, 2017 |
For the period from July 1, 2017 to September 30, 2017 |
For the period from April 1, 2017 to June 30, 2017 |
For the period from January 1, 2017 to March 31, 2017 |
|||||||||||||
| Total investment income |
$ | 2,062,844 | $ | 1,856,705 | $ | 1,598,425 | $ | 1,168,410 | ||||||||
| Total expenses |
(9,032,943 | ) | (9,529,759 | ) | (9,620,049 | ) | (9,903,828 | ) | ||||||||
| Total trading results |
55,084,453 | (18,586,532 | ) | (34,706,587 | ) | (3,631,714 | ) | |||||||||
|
|
|
|
|
|
|
|
|
|||||||||
| Net income (loss) |
$ | 48,114,354 | $ | (26,259,586 | ) | $ | (42,728,211 | ) | $ | (12,367,132 | ) | |||||
|
|
|
|
|
|
|
|
|
|||||||||
| Increase (decrease) in Net Asset Value per |
||||||||||||||||
| Redeemable Unit of Class A |
$ | 167.01 | $ | (88.76 | ) | $ | (136.03 | ) | $ | (37.40 | ) | |||||
|
|
|
|
|
|
|
|
|
|||||||||
| Increase (decrease) in Net Asset Value per |
||||||||||||||||
| Redeemable Unit of Class Z |
$ | 69.64 | $ | (29.06 | ) | $ | (47.71 | ) | $ | (10.04 | ) | |||||
|
|
|
|
|
|
|
|
|
|||||||||
| For the period from October 1, 2016 to December 31, 2016 |
For the period from July 1, 2016 to September 30, 2016 |
For the period from April 1, 2016 to June 30, 2016 |
For the period from January 1, 2016 to March 31, 2016 |
|||||||||||||
| Total investment income |
$ | 644,421 | $ | 666,079 | $ | 536,268 | $ | 614,451 | ||||||||
| Total expenses |
(9,746,634 | ) | (10,553,358 | ) | (9,012,433 | ) | (14,283,922 | ) | ||||||||
| Total trading results |
8,554,705 | (23,760,670 | ) | (13,229,270 | ) | 63,566,834 | ||||||||||
|
|
|
|
|
|
|
|
|
|||||||||
| Net income (loss) |
$ | (547,508 | ) | $ | (33,647,949 | ) | $ | (21,705,435 | ) | $ | 49,897,363 | |||||
|
|
|
|
|
|
|
|
|
|||||||||
| Increase (decrease) in Net Asset Value per |
$ | (0.51 | ) | $ | (96.86 | ) | $ | (60.65 | ) | $ | 135.82 | |||||
|
|
|
|
|
|
|
|
|
|||||||||
| Increase (decrease) in Net Asset Value per |
$ | 3.49 | $ | (32.84 | ) | $ | (18.75 | ) | $ | 54.60 | ||||||
|
|
|
|
|
|
|
|
|
|||||||||
63
| Item 9. | Changes in and Disagreements with Accountants on Accounting and Financial Disclosure. |
Not applicable.
| Item 9A. | Controls and Procedures. |
The Partnership’s disclosure controls and procedures are designed to ensure that information required to be disclosed by the Partnership on the reports that it files or submits under the Exchange Act is recorded, processed, summarized and reported within the time periods expected in the SEC rules and forms. Disclosure controls and procedures include controls and procedures designed to ensure that information required to be disclosed by the Partnership in the reports it files is accumulated and communicated to management, including the President and Chief Financial Officer (“CFO”) of the General Partner, to allow for timely decisions regarding required disclosure and appropriate SEC filings.
The General Partner is responsible for ensuring that there is an adequate and effective process for establishing, maintaining and evaluating disclosure controls and procedures for the Partnership’s external disclosures.
The General Partner’s President and CFO have evaluated the effectiveness of the Partnership’s disclosure controls and procedures (as defined in Rules 13a-15(e) and 15d-15(e) under the Exchange Act) as of December 31, 2017 and, based on that evaluation, the General Partner’s President and CFO have concluded that at that date the Partnership’s disclosure controls and procedures were effective.
The Partnership’s internal control over financial reporting is a process under the supervision of the General Partner’s President and CFO to provide reasonable assurance regarding the reliability of financial reporting and the preparation of financial statements in accordance with GAAP. These controls include policies and procedures that:
| • | pertain to the maintenance of records that, in reasonable detail, accurately and fairly reflect the transactions and dispositions of the assets of the Partnership; |
| • | provide reasonable assurance that (i) transactions are recorded as necessary to permit preparation of financial statements in accordance with GAAP, and (ii) the Partnership’s receipts are handled and expenditures are made only pursuant to authorizations of the General Partner; and |
| • | provide reasonable assurance regarding prevention or timely detection and correction of unauthorized acquisition, use or disposition of the Partnership’s assets that could have a material effect on the financial statements. |
The report included in “Item 8. Financial Statements and Supplementary Data.” includes the General Partner’s report on internal control over financial reporting (“Management’s Report”).
There were no changes in the Partnership’s internal control over financial reporting during the fiscal quarter ended December 31, 2017, that materially affected, or are reasonably likely to materially affect, the Partnership’s internal control over financial reporting.
| Item 9B: | Other Information. |
Effective February 1, 2018, the Partnership allocated a portion of its assets to FORT Contrarian Master Fund LLC, which will be managed and traded by FORT L.P., pursuant to its Global Contrarian Program.
64
PART III
Item 10. Directors, Executive Officers and Corporate Governance.
The Partnership has no directors or executive officers and its affairs are managed by its General Partner. Investment decisions are made by the Advisors.
The directors and executive officers of the General Partner are Patrick T. Egan (President and Chairman of the Board of Directors of the General Partner), Steven Ross (Chief Financial Officer and Director), Maureen O’Toole (Director), M. Paul Martin (Director), Feta Zabeli (Director) and Matthew R. Graver (Director). Each director holds office until the earlier of his or her death, resignation or removal. Vacancies on the board of directors may be filled by either (i) the majority vote of the remaining directors or (ii) MSD Holdings, as the sole member of the General Partner. The officers of the General Partner are designated by the General Partner’s board of directors. Each officer will hold office until his or her successor is designated and qualified or until his or her death, resignation or removal.
Directors of the General Partner are responsible for overall corporate governance of the General Partner and meet periodically to consider strategic decisions regarding the General Partner’s activities. Under CFTC rules, each Director of the General Partner is deemed to be a principal of the General Partner and, as a result, is listed as such with NFA. Patrick T. Egan, Steven Ross, Maureen O’Toole and Feta Zabeli serve on the General Partner’s Investment Committee and are the trading principals responsible for allocation decisions (or supervising those responsible).
Patrick T. Egan, age 49, has been a Director of the General Partner since December 2010. Since December 2010, Mr. Egan has been a principal and registered as an associated person of the General Partner, and is an associate member of NFA. Since October 2014, Mr. Egan has served as President and Chairman of the Board of Directors of the General Partner. Since August 2013, Mr. Egan has been registered as a swap associated person of the General Partner. From September 2013 to May 2014, Mr. Egan served as a Vice President of Morgan Stanley Strategies LLC, formerly known as Morgan Stanley GWM Feeder Strategies LLC, which acts as a general partner to multiple alternative investment entities, and Morgan Stanley AI GP LLC, formerly known as Morgan Stanley HedgePremier GP LLC, which acts as a general partner and administrative agent to numerous hedge fund feeder funds. From September 2013 to May 2014, Mr. Egan was registered as an associated person and listed as a principal of each such entity. Since January 2013, each such entity has been registered as a commodity pool operator with the CFTC. Mr. Egan was responsible for overseeing the implementation of certain CFTC and NFA regulatory requirements applicable to such entities. From June 2009 to December 2014, Mr. Egan was employed by Morgan Stanley Smith Barney LLC, a financial services firm, where his responsibilities included serving as Executive Director and as Co-Chief Investment Officer for Morgan Stanley Managed Futures from June 2009 through June 2011 and as Chief Risk Officer for Morgan Stanley Managed Futures from June 2011 through October 2014. Since October 2014, Mr. Egan has been responsible for the day-to-day operations and management of Morgan Stanley Managed Futures. Since January 2015, Mr. Egan has been employed by the General Partner. From November 2010 to October 2014, Mr. Egan was registered as an associated person of Morgan Stanley Smith Barney LLC. From April 2007 through June 2009, Mr. Egan was employed by MS & Co., a financial services firm, where his responsibilities included serving as Head of Due Diligence and Manager Research for Morgan Stanley’s Managed Futures Department. From April 2007 through June 2009, Mr. Egan was registered as an associated person of MS & Co. From March 1993 through April 2007, Mr. Egan was employed by Morgan Stanley DW Inc., a financial services firm, where his initial responsibilities included serving as an analyst and manager within the Managed Futures Department (with primary responsibilities for product development, due diligence, investment analysis and risk management of the firm’s commodity pools) and later included serving as Head of Due Diligence and Manager Research for Morgan Stanley’s Managed Futures Department. From February 1998 through April 2007, Mr. Egan was registered as an associated person of Morgan Stanley DW Inc. From August 1991 through March 1993, Mr. Egan was employed by Dean Witter Intercapital, the asset management arm of Dean Witter Reynolds, Inc., where his responsibilities included serving as a mutual fund administration associate. Mr. Egan also served as a Director from November 2004 through October 2006, and from November 2006 through October 2008 of the Managed Funds Association’s Board of Directors, a position he was elected to by industry peers for two consecutive two-year terms. Mr. Egan earned his Bachelor of Business Administration degree with a concentration in Finance in May 1991 from the University of Notre Dame.
Steven Ross, age 46, has been Chief Financial Officer and a principal of the General Partner since July 2014 and a Director of the General Partner since February 2016. Mr. Ross has been employed by Morgan Stanley Investment Management, a financial services firm, since September 2005, where his responsibilities include serving as an Assistant Treasurer of Morgan Stanley with respect to certain investment vehicles publicly offered by Morgan Stanley. Mr. Ross is also an Executive Director of the Morgan Stanley Fund Administration Group where he is responsible for finance and accounting matters for certain private funds offered by Morgan Stanley. Before joining Morgan Stanley Investment Management, Mr. Ross was employed by JPMorgan Investor Services Co., a financial services firm, from December 1997 through September 2005, where his responsibilities included serving as a Vice President responsible for the accounting of certain funds sponsored by JPMorgan Chase & Co. and other large fund families serviced by JPMorgan Investor Services Co. From April 1997 to December 1997, Mr. Ross was employed by Investors Bank & Trust, a financial services firm, where his responsibilities included performing mutual fund accounting for financial services firms. Mr. Ross began his career at Putnam Investments LLC, a financial services firm, where he was responsible for providing broker services for certain funds sponsored by Putnam Investments LLC from August 1996 to April 1997. Mr. Ross received a B.S. in Accounting from Rhode Island College in May 1995.
65
Maureen O’Toole, age 60, has been a Director, listed as a principal and registered as an associated person of the General Partner since May 2016. She has also been the Head of Managed Futures at Morgan Stanley Investment Management, a financial services firm, since May 2016 where she is responsible for developing and managing the managed futures business strategy. She joined Morgan Stanley Investment Management in June 2012 as Managing Director in charge of the intermediary alternative investment sales team. In this capacity she was responsible for the management of a team responsible for business development in managed futures, hedge funds and private investments. She has been registered as an associated person of Morgan Stanley Investment Management since June 2012. From April 2010 until June 2012, Ms. O’Toole was a managing director at K2 Advisors, L.L.C., a hedge fund investment advisory firm, where she was responsible for development of the firm’s investment funds. Between March 1993 and April 2010, Ms. O’Toole was employed by a variety of divisions within what became Citigroup Global Markets Inc., a financial services firm. Between August 2009 and April 2010, she worked in product development within Citi Private Bank, where she assisted in sourcing new investment platforms for its alternatives business. Between January 2002 and August 2009, Ms. O’Toole was Managing Director and Head of Sales and Client Service within Citigroup Alternative Investments. In this role she managed the high net worth sales team for Citigroup Alternative Investments through the Global Wealth Management channel, overseeing education and marketing. Prior to that, between November 1996 and January 2002, Ms. O’Toole was Director of Sales and Marketing within the managed futures department of Smith Barney. Prior to being named Director of Sales and Marketing, Ms. O’Toole was involved in the international development of the managed futures business within the managed futures department from March 1993 until November 1996. In this role, Ms. O’Toole oversaw due diligence and portfolio construction for the managed futures department. Ms. O’Toole served as a Director of Citigroup Managed Futures LLC (the predecessor entity to the General Partner) from August 2001 until October 2006, was listed as a principal of such entity from August 1998 until October 2006 and was registered as an associated person of such entity from January 2004 until October 2006. She was also registered as an associated person of Citigroup Global Markets Inc. from April 1993 until June 2010. Prior to Citigroup Global Markets Inc., Ms. O’Toole was employed at Rodman & Renshaw Inc., an investment bank, as head of managed futures manager research and portfolio construction between March 1989 and March 1993 and was registered as an associated person from June 1991 until March 1993. She was registered as an associated person of Rosenthal Collins Futures Management, Inc., a commodity pool operator and wholly owned subsidiary of Rodman & Renshaw, from January 1992 until March 1993. She began her investment career at Drexel Burnham Lambert Inc., an investment bank, in January 1982 where she worked as a research analyst, performing modeling on financial futures hedging and trading strategies until February 1989 and was registered as an associated person from December 1988 until February 1989. Ms. O’Toole obtained her Bachelor of Arts in Speech Pathology and Audiology from California State University Chico, in June 1979, and her Masters in Management from Kellogg Graduate School of Management at Northwestern University, in June 1989.
M. Paul Martin, age 59, has been a Director of the General Partner since October 2014. Mr. Martin has also served as Managing Director – Global Operations of Morgan Stanley Investment Management, a financial services firm, since June 2006, where his responsibilities include managing all elements of in-sourced and out-sourced global operations, and serving as a senior member of Morgan Stanley Investment Management’s Management, Risk Management, & New Products Committees. Mr. Martin has been listed as a principal of the General Partner since October 2014. Mr. Martin previously served as the Managing Director and Chief Operating Officer of Morgan Stanley Fund Services, a financial services firm, where his responsibilities included launching the Hedge Fund Administration business and being responsible for operations, fund accounting and administration, technology and compliance, from May 2004 through May 2006. Previously, Mr. Martin served as Managing Director – Institutional Investment Operations of Morgan Stanley Investment Management from January 1995 until April 2004, where his responsibilities included trading room support, portfolio administration, service provider management, and derivatives processing and control. From April 1994 through January 1995, Mr. Martin served as Senior Vice President and Head of Custody Operations for Fidelity Investments, a financial services firm. From October 1989 through April 1994, Mr. Martin served as Executive Director and Head of Global Operations for Morgan Stanley Trust Company, a financial services firm. Mr. Martin also served as Vice President – Information Technology for MS & Co., a financial services firm, from June 1984 through October 1989, where his responsibilities included acting as Senior Developer and Programming Manager – Prime Brokerage and Securities Clearance Systems, and as Part-time Manager – IT Training Program. From February 1984 through May 1984, Mr. Martin served as a Senior Analyst in the Financial Control Group of Shearson Lehman Brothers, Inc., a financial services firm. From October 1980 through January 1984, Mr. Martin served as a Senior Consultant – Management Information Consulting Division at Arthur Andersen & Co., an accounting firm, where his responsibilities included programming and programming supervisory roles at large governmental agencies. Mr. Martin received a B.S. in Business Administration—Finance from Georgetown University in May 1980 and an M.B.A. in Finance from New York University in June 1993.
Feta Zabeli, age 58, has been a Director of the General Partner since October 2014. Mr. Zabeli has also served as a director on the Board of Directors of Morgan Stanley Investment Management, a financial services firm, since January 2015 and has been listed as a principal since February 2015. Since May 2016, Mr. Zabeli is the Chief Risk Officer for Morgan Stanley Investment Management, responsible for all investment and operational risk management globally. From January 2012 to May 2016, Mr. Zabeli was Global Head of Risk for Morgan Stanley Investment Management’s Traditional Asset Management business where he was responsible for investment risk of all equity, fixed income, money market, multi-asset class and alternatives portfolios. He was also responsible for counterparty and quantitative model risk for the traditional asset management business. He joined Morgan Stanley in January 2012. Mr. Zabeli has been listed as a principal of the General Partner since October 2014. Mr. Zabeli was on garden leave in December 2011. From February 2006 to November 2011, Mr. Zabeli was Senior Vice President, and most recently Global Co-Head of Risk, for AllianceBernstein L.P., a global investment firm, with various risk management assignments in Hong Kong, Tokyo, London and New
66
York. From August 2006 to April 2009, Mr. Zabeli was based in Hong Kong for AllianceBernstein as the Director of Risk Management for Asia Pacific. From April 2009 to July 2011, he was based in Tokyo for AllianceBernstein as both Director of Risk Management for Asia Pacific and Head of Risk Management for Japan. From July 2011 to November 2011, he was based in London for AllianceBernstein as Global Head of Operational & Credit/Counterparty Risk. In these roles at AllianceBernstein he was responsible for the full range of risk management functions including investment, operational and credit/counterparty risk. Prior to his Risk Management roles at Morgan Stanley and AllianceBernstein, Mr. Zabeli held positions as a managing director at Citigroup Asset Management, the asset management division of Citigroup, an international financial services company, from April 1998 to January 2006, where he worked as a quantitative research analyst and portfolio manager, and director at BARRA Inc., a global provider of risk analytic tools to investment institutions, from September 1993 to March 1998, where he developed risk models and applications. Mr. Zabeli received a B.S. in Aerospace Engineering from Rensselaer Polytechnic Institute in May 1982, an M.S. in Electrical Engineering from the University of Southern California in May 1988 and an M.B.A. from the University of California at Los Angeles in August 1992.
Matthew R. Graver, age 50, has been a Director of the General Partner and listed as a principal since November 2016. Since January 2008, Mr. Graver has served as Managing Director of Morgan Stanley Investment Management, a financial services firm, and Chief Operating Officer for Morgan Stanley AIP Fund of Hedge Funds, a business unit offering managed portfolios of hedge funds. Since November 2015, Mr. Graver has been listed as a principal and director of Morgan Stanley AIP Cayman GP Ltd., a commodity pool operator. From January 2005 to January 2008, Mr. Graver served as Executive Director of Morgan Stanley Investment Management and from August 2003 to January 2005, Mr. Graver served as Vice President of Morgan Stanley Investment Management. From August 2003 to January 2008, Mr. Graver’s primary responsibilities included serving as Head of Operational Due Diligence for Morgan Stanley AIP Fund of Hedge Funds in which role he oversaw due diligence into operational factors of alternative investment entities. From July 1997 to July 2003, Mr. Graver was employed by PricewaterhouseCoopers LLP, an international auditing and professional services firm, where he served as a senior audit manager and was responsible for managing independent audits of financial services firms. From June 1993 to June 1997, Mr. Graver was employed by PNC Bank, a bank offering consumer and corporate services, where he served as a mutual fund accounting manager and was responsible for managing an accounting team that performed daily accounting functions and valuation calculations for a group of mutual funds. From July 1989 through June 1993, Mr. Graver was employed by Coopers & Lybrand LLP, a predecessor accounting firm to PricewaterhouseCoopers LLP, where he was a senior audit associate and was responsible for performing audits of financial services firms. Mr. Graver earned his Bachelor of Science degree in Accounting in May 1989 from Pennsylvania State University and Masters of Business Administration from Villanova University in May 2002.
The Partnership has not adopted a code of ethics that applies to officers because it has no officers. In addition, the Partnership has not adopted any procedures by which investors may recommend nominees to the Partnership’s board of directors and has not established an audit committee because it has no board of directors.
67
Item 11. Executive Compensation.
The Partnership has no directors or executive officers. As a limited partnership, the business of the Partnership is managed by the General Partner, which is responsible for administration of the business affairs of the Partnership. The Partnership pays the General Partner a monthly fee equal to 1/12th of 0.75% (0.75%) of month-end net assets.
Item 12. Security Ownership of Certain Beneficial Owners and Management and Related Stockholder Matters.
(a) Security ownership of certain beneficial owners. As of February 28, 2018, the Partnership knows of no person who beneficially owns more than five percent (5%) of the Redeemable Units outstanding.
(b) Security ownership of management. Under the terms of the Limited Partnership Agreement, the Partnership’s affairs are managed by the General Partner.
The following table indicates securities owned by management as of December 31, 2017:
| (1) Title of Class |
(2) Name of Beneficial Owner |
(3) Amount and Nature of Beneficial Ownership |
(4) Percent of Class | |||
|
| ||||||
| Class Z Redeemable Units | General Partner | 8,552.3863 | 73.9% | |||
(c) Changes in control. None.
Principals of the General Partner who own Redeemable Units:*
*Maureen O’Toole 25.9400 Redeemable Units
* No one principal owns more than 1% of the Redeemable Units
Item 13. Certain Relationships and Related Transactions, and Director Independence.
(a) Transactions with related persons. None.
(b) Review, approval or ratification of transactions with related persons. Not applicable.
(c) Promoters and certain control persons. MS&Co., Morgan Stanley Wealth Management and the General Partner could be considered promoters for purposes of Item 404(c) of Regulation S-K. The nature and the amounts of compensation each promoter received or will receive, if any, from the Partnership are set forth under “Item 1. Business”, “Item 8. Financial Statements and Supplementary Data.” and “Item 11. Executive Compensation.”
Item 14. Principal Accountant Fees and Services.
(1) Audit Fees. The aggregate fees billed for each of the last two fiscal years for professional services rendered by Ernst & Young LLP (“EY”) for the year ended December 31, 2017 and Deloitte for the year ended December 31, 2016 for the audit of the Partnership’s annual financial statements, review of financial statements included in the Partnership’s Forms 10-Q and 10-K and other services normally provided in connection with regulatory filings or engagements were:
2017 $131,017
2016 $216,600
(2) Audit-Related Fees. None
(3) Tax Fees. The Partnership did not pay EY or Deloitte any amounts in 2017 and 2016, respectively, for professional services in connection with tax compliance, tax advice, and tax planning.
(4) All Other Fees. None.
(5) Not Applicable.
(6) Not Applicable.
68
PART IV
Item 15. Exhibits, Financial Statement Schedules.
| (a) | (1) Financial Statements: |
Statements of Financial Condition at December 31, 2017 and 2016. Condensed Schedules of Investments at December 31, 2017 and 2016.
Statements of Income and Expenses for the years ended December 31, 2017, 2016 and 2015.
Statements of Changes in Partners’ Capital for the years ended December 31, 2017, 2016 and 2015. Notes to Financial Statements
(2) Exhibits:
| 3.1(a) | ||
| (b) | ||
| (c) | ||
| 3.2(a) | ||
| (b) | ||
| (c) | ||
| (d) | ||
| (e) | ||
| (f) | ||
| (g) |
||
| (h) | ||
| (i) | ||
| (j) | ||
| (k) |
||
| 10.1 |
||
69
| 10.2(a) |
||
| (b) | ||
| 10.3(a) | ||
| (b) | ||
| 10.4(a) |
||
| (b) |
||
| 10.5 |
||
| 10.6(a) | ||
| (b) |
||
| (c) | ||
| 10.7 | ||
| 10.8 |
||
| 10.9(a) |
||
| (b) |
||
| 10.10 |
||
| 11.1 | ||
| 11.2 |
||
| 11.3 |
||
| 11.4 |
||
| 11.5 |
||
70
| 11.6 |
||
| 11.7 |
||
| 11.8 |
||
| 11.9 |
||
| 11.10 | ||
| 11.11 |
||
| 11.12 |
||
| 11.13 | ||
| 11.14 |
||
| 11.15 |
||
| 12.1 | ||
| 12.2 |
||
| 12.3 |
||
99.1 Financial Statements of CMF Winton Master L.P.
99.2 Financial Statements of CMF TT II, LLC.
99.3 Financial Statements of CMF Willowbridge Master Fund L.P.
The exhibits required to be filed by Item 601 of Regulations S-K are incorporated herein by reference.
31.1 — Rule 13a-14(a)/15d-14(a) Certification (Certification of President and Director) (filed herewith).
32.1 — Section 1350 Certification (Certification of President and Director) (filed herewith).
32.2 — Section 1350 Certification (Certification of Chief Financial Officer and Director) (filed herewith).
101.INS XBRL Instance Document.
101.SCH XBRL Taxonomy Extension Schema Document.
101.CAL XBRL Taxonomy Extension Calculation Linkbase Document.
101.LAB XBRL Taxonomy Extension Label Linkbase Document.
101.PRE XBRL Taxonomy Extension Presentation Linkbase Document.
101.DEF XBRL Taxonomy Extension Definition Document.
71
SIGNATURES
Pursuant to the requirements of Section 13 or 15(d) of the Securities Exchange Act of 1934, the registrant has duly caused this report to be signed on its behalf by the undersigned, thereunto duly authorized.
CERES ORION L.P. (formerly, Orion Futures Fund L.P.)
| By: |
Ceres Managed Futures LLC (General Partner) | |
| By: |
/s/ Patrick T. Egan | |
| Patrick T. Egan | ||
| President and Director | ||
| Date: March 28, 2018 | ||
Pursuant to the requirements of the Securities Exchange Act of 1934, this report has been signed below by the following persons on behalf of the Registrant and in the capacities and on the date indicated.
| /s/ Patrick T. Egan |
/s/ Feta Zabeli |
/s/ Maureen O’Toole | ||
| Patrick T. Egan |
Feta Zabeli |
Maureen O’Toole | ||
| President and Director |
Director |
Director | ||
| Ceres Managed Futures LLC |
Ceres Managed Futures LLC |
Ceres Managed Futures LLC | ||
| Date: March 28, 2018 |
Date: March 28, 2018 |
Date: March 28, 2018 | ||
| /s/ Steven Ross |
/s/ M. Paul Martin |
/s/ Matthew R. Graver | ||
| Steven Ross |
M. Paul Martin |
Matthew R. Graver | ||
| Chief Financial Officer and Director |
Director |
Director | ||
| (Principal Accounting Officer) |
Ceres Managed Futures LLC |
Ceres Managed Futures LLC | ||
| Ceres Managed Futures LLC |
Date: March 28, 2018 |
Date: March 28, 2018 | ||
| Date: March 28, 2018 |
||||
Supplemental Information to be Furnished With Reports Filed Pursuant to Section 15(d) of the Exchange Act by Registrants Which Have Not Registered Securities Pursuant to Section 12 of the Exchange Act.
Annual Report to limited partners
No proxy material has been sent to limited partners.
72