Attached files
| file | filename |
|---|---|
| EX-32.2 - EXHIBIT 32.2 - ProPetro Holding Corp. | exhibit322.htm |
| EX-32.1 - EXHIBIT 32.1 - ProPetro Holding Corp. | exhibit321.htm |
| EX-31.2 - EXHIBIT 31.2 - ProPetro Holding Corp. | exhibit312.htm |
| EX-31.1 - EXHIBIT 31.1 - ProPetro Holding Corp. | exhibit311.htm |
| EX-23 - EXHIBIT 23 - ProPetro Holding Corp. | exhibit23.htm |
| EX-21 - EXHIBIT 21 - ProPetro Holding Corp. | exhibit21.htm |
UNITED STATES
SECURITIES AND EXCHANGE COMMISSION
Washington, D.C. 20549
______________________________
FORM 10-K
______________________________
ý | ANNUAL REPORT PURSUANT TO SECTION 13 OR 15(d) OF THE SECURITIES EXCHANGE ACT OF 1934 |
For the fiscal year ended December 31, 2017
or
o | TRANSITION REPORT PURSUANT TO SECTION 13 OR 15(d) OF THE SECURITIES EXCHANGE ACT OF 1934 |
For the transition period from to
Commission File Number: 001-38035
______________________________
ProPetro Holding Corp.
(Exact name of registrant as specified in its charter)
______________________________
Delaware | 26-3685382 |
(State or other jurisdiction of incorporation or organization) | (I.R.S. Employer Identification No.) |
1706 South Midkiff, Bldg. B
Midland, Texas 79701
(Address of principal executive offices)
Registrant’s telephone number, including area code: (432) 688-0012
Securities registered pursuant to Section 12(b) of the Act:
Title of each class | Name of each exchange on which registered |
Common Stock ($0.001 par value) | New York Stock Exchange |
Securities registered pursuant to Section 12(g) of the Act:
None
______________________________________________________
Indicate by check mark if the registrant is a well-known seasoned issuer, as defined in Rule 405 of the Securities Act. Yes ¨ No ý
Indicate by check mark if the registrant is not required to file reports pursuant to Section 13 or Section 15(d) of the Act. Yes ¨ No ý
Indicate by check mark whether the registrant (1) has filed all reports required to be filed by Section 13 or 15(d) of the Securities Exchange Act of 1934 during the preceding 12 months (or for such shorter period that the registrant was required to file such reports), and (2) has been subject to such filing requirements for the past 90 days. Yes ý No ¨
Indicate by check mark whether the registrant has submitted electronically and posted on its corporate web site, if any, every Interactive Data File required to be submitted and posted pursuant to Rule 405 of Regulation S-T (§232.405 of this chapter) during the preceding 12 months (or for such shorter period that the registrant was required to submit and post such files). Yes ý No ¨
Indicate by check mark if disclosure of delinquent filers pursuant to Item 405 of Regulation S-K (§229.405 of this chapter) is not contained herein, and will not be contained, to the best of registrant’s knowledge, in definitive proxy or information statements incorporated by reference in Part III of this Form 10-K or any amendment to this Form 10-K. ý
Indicate by check mark whether the registrant is a large accelerated filer, an accelerated filer, a non-accelerated filer, smaller reporting company, or an emerging growth company. See the definitions of “large accelerated filer,” “accelerated filer,” “smaller reporting company” and "emerging growth company" in Rule 12b-2 of the Exchange Act.
Large accelerated filer | o | Accelerated filer | o | |||
Non-accelerated filer | ý (Do not check if a smaller reporting company) | Smaller reporting company | o | |||
Emerging growth company | ý | |||||
If an emerging growth company, indicate by check mark if the registrant has elected not to use the extended transition period for complying with any new or revised financial accounting standards provided pursuant to Section 13(a) of the Exchange Act. ý
Indicate by check mark whether the registrant is a shell company (as defined in Rule 12b-2 of the Exchange Act). Yes ¨ No ý
The aggregate market value of the Company’s Common Stock held by nonaffiliates on June 30, 2017, determined using the per share closing price on the New York Stock Exchange Composite tape of $13.96 on that date, was approximately $674.2 million.
The number of the registrant’s common shares, par value $0.001 per share, outstanding at March 16, 2018, was 83,039,854.
TABLE OF CONTENTS
FORWARD‑LOOKING STATEMENTS
This annual report on Form 10-K contains forward‑looking statements. Statements that are predictive in nature, that depend upon or refer to future events or conditions or that include the words “may,” “could,” “plan,” “project,” “budget,” “predict,” “pursue,” “target,” “seek,” “objective,” “believe,” “expect,” “anticipate,” “intend,” “estimate,” and other expressions that are predictions of, or indicate, future events and trends and that do not relate to historical matters identify forward‑looking statements. Our forward‑looking statements include statements about our business strategy, our industry, our future profitability, our expected capital expenditures and the impact of such expenditures on our performance and our capital programs.
A forward‑looking statement may include a statement of the assumptions or bases underlying the forward‑looking statement. We believe that we have chosen these assumptions or bases in good faith and that they are reasonable. You are cautioned not to place undue reliance on any forward‑looking statements. You should also understand that it is not possible to predict or identify all such factors and should not consider the following list to be a complete statement of all potential risks and uncertainties. Factors that could cause our actual results to differ materially from the results contemplated by such forward‑looking statements include:
• the level of production of crude oil, natural gas and other hydrocarbons and the resultant market prices of crude oil, natural gas, natural gas liquids and other hydrocarbons;
• changes in general economic and geopolitical conditions;
• competitive conditions in our industry;
• changes in the long‑term supply of and demand for oil and natural gas;
• actions taken by our customers, suppliers, competitors and third‑party operators;
• changes in the availability and cost of capital;
• our ability to successfully implement our business plan;
• large or multiple customer defaults, including defaults resulting from actual or potential insolvencies;
• the price and availability of debt and equity financing (including changes in interest rates);
• our ability to complete growth projects on time and on budget;
• changes in our tax status;
• technological changes;
• operating hazards, natural disasters, weather‑related delays, casualty losses and other matters beyond our control;
• the effects of existing and future laws and governmental regulations (or the interpretation thereof); and
• the effects of future litigation.
You should not place undue reliance on our forward‑looking statements. Although forward‑looking statements reflect our good faith beliefs at the time they are made, forward‑looking statements involve known and unknown risks, uncertainties and other factors, including the factors described under “Risk Factors,” which may cause our actual results, performance or achievements to differ materially from anticipated future results, performance or achievements expressed or implied by such forward‑looking statements. We undertake no obligation to publicly update or revise any forward‑looking statement, whether as a result of new information, future events, changed circumstances or otherwise, unless required by law.
Unless the context indicates otherwise, all references to “we,” “our” or “us” refer to ProPetro Holding Corp. and its consolidated subsidiary, ProPetro Services, Inc.
1
PART I
Item 1. Business.
Our Company
We are a growth‑oriented, Midland, Texas‑based oilfield services company providing hydraulic fracturing and other complementary services to leading upstream oil and gas companies engaged in the exploration and production, or E&P, of North American unconventional oil and natural gas resources. Our operations are primarily focused in the Permian Basin, where we have cultivated longstanding customer relationships with some of the region’s most active and well‑capitalized E&P companies. The Permian Basin is widely regarded as the most prolific oil‑producing area in the United States, and we believe we are one of the largest providers of hydraulic fracturing services in the region by hydraulic horsepower, or HHP, with an aggregate deployed capacity of 690,000 HHP, or 16 deployed units, at December 31, 2017. In addition, we deployed two new hydraulic fracturing units into service through March of 2018, bringing our current fleet to 18 deployed units, or 780,000 HHP.
Our modern hydraulic fracturing fleet has been designed to handle Permian Basin specific operating conditions and the region’s increasingly high‑intensity well completions, which are characterized by longer horizontal wellbores, more frac stages per lateral and increasing amounts of proppant per well. Over 92% of our fleet has been delivered over the past five years, and substantially all our fleet has been built by a single manufacturer since 2013.
In addition to our core hydraulic fracturing operations, we also offer a suite of complementary well completion and production services, including cementing, acidizing, coiled tubing, flowback services, surface air drilling and drilling. We believe these complementary services create operational efficiencies for our customers and allow us to capture a greater portion of their capital spending across the lifecycle of an unconventional well.
Our primary business objective is to serve as a strategic partner to our customers. We achieve this objective by providing reliable, high‑quality services that are tailored to our customers’ needs and synchronized with their well development programs. This alignment assists our customers in optimizing the long‑term development of their unconventional resources. Over the past three years, we have leveraged our strong Permian Basin relationships to significantly grow our installed HHP capacity and organically build our Permian Basin cementing and coiled tubing lines of business. Consistent with past performance, we believe our substantial market presence will continue to yield a variety of actionable growth opportunities allowing us to expand both our hydraulic fracturing and complementary services going forward. To this end, we intend to continue our past practice of opportunistically deploying new equipment on a long‑term, dedicated basis in response to specific customer demand.
Initial Public Offering
On March 22, 2017, we closed our initial public offering, or IPO, at which time we issued and sold 13,250,000 shares of common stock, and certain selling shareholders sold 11,750,000 shares of common stock, at a price to the public of $14.00 per share. We received cash proceeds of approximately $170.1 million from this transaction, net of underwriting discounts and commissions and offering expenses, which we used (i) to repay $71.8 million in outstanding borrowings and accrued interest under our term loan, (ii) $86.8 million to fund the purchase of additional hydraulic fracturing units and other equipment, and (iii) the remaining for general corporate purposes.
In connection with the IPO, the Company executed a stock split, such that each holder of common stock of the Company received 1.45 shares of common stock for every one share of previous common stock. Accordingly, any information related to, or dependent upon, the share or option counts in our comparative 2016 and 2015 consolidated financial statements have been updated to reflect the effect of the stock split.
Our Services
We conduct our business through six operating segments: hydraulic fracturing (inclusive of acidizing), cementing, coil tubing, flowback, surface drilling and drilling. For reporting purposes, the hydraulic fracturing (inclusive of acidizing) and cementing operating segments are aggregated into our one reportable segment: pressure
2
pumping. For additional financial information, please see Part II - Item 8. Financial Statements and Supplementary Data.
Pressure Pumping
Hydraulic Fracturing
We primarily provide hydraulic fracturing services to E&P companies in the Permian Basin. These services are intended to optimize hydrocarbon flow paths during the completion phase of horizontal shale wellbores. We have significant expertise in multi‑stage fracturing of horizontal oil‑producing wells in unconventional geological formations. As of December 31, 2017, we had grown our hydraulic fracturing business to a total of 16 hydraulic fracturing units with an aggregate of 690,000 HHP. In the fourth quarter of 2017, we took delivery of an additional 86 Tier 2 diesel engines, which will support our long-term plans for optimizing the total capacity and operational performance of our fleet. As of March of 2018, we deployed two new hydraulic fracturing units into service, utilizing 36 of the 86 Tier 2 engines, and bringing our current fleet total to 18 deployed units, or 780,000 HHP.
The fracturing process consists of pumping a fracturing fluid into a well at sufficient pressure to fracture the formation. Materials known as proppants, which in our business are comprised primarily of sand, are suspended in the fracturing fluid and are pumped into the fracture to prop it open. The fracturing fluid is designed to “break,” or loosen viscosity, and be forced out of the formation by its pressure, leaving the proppants suspended in the fractures created, thereby increasing the mobility of the hydrocarbons. As a result of the fracturing process, production rates are usually enhanced substantially, thus increasing the rate of return of hydrocarbons for the operator.
We own and operate a fleet of mobile hydraulic fracturing units and other auxiliary equipment to perform fracturing services. We refer to all of our fracturing units, other equipment and vehicles necessary to perform fracturing jobs as our “fleet” and the personnel assigned to each unit as a “crew.” Our hydraulic fracturing units consist primarily of a high pressure hydraulic pump, diesel engine, transmission and various hoses, valves, tanks and other supporting equipment that are typically mounted to a flat‑bed trailer.
We provide dedicated equipment, personnel and services that are tailored to meet each of our customer’s needs. Each unit in our fleet has a designated team of personnel, which allows us to provide responsive and customized services, such as project design, proppant and other consumables procurement, real‑time data provision and post‑completion analysis for each of our jobs. Many of our hydraulic fracturing units and associated personnel have continuously worked with the same customer for the past several years promoting deep relationships and a high degree of coordination and visibility into future customer activity levels. Furthermore, in light of our substantial market presence and historically high fleet utilization levels, we have established a variety of entrenched relationships with key equipment, sand and other downhole consumable suppliers, including over 30 sand suppliers utilized in 2017. These strategic relationships ensure ready access to equipment, parts and materials on a timely and economic basis and allow our dedicated procurement logistics team to ensure consistently safe and reliable operations.
Acidizing
As of December 31, 2017, we operated 10 acidizing pumps and four combination units in the Permian Basin, together totaling approximately 22,000 HHP, which perform procedures like toe preps, pump downs and foamed acid. Acidizing, which is consolidated into our hydraulic fracturing operating segment, is a stimulation technique where acid is injected under pressure into formations (typically carbonate reservoirs) which can form or expand fissures. We believe that our acidizing operations provide an organic growth opportunity for us to expand our service offerings within our existing customer base.
3
Cementing
We provide cementing services for completion of new wells and remedial work on existing wells. Cementing services use pressure pumping equipment to deliver a slurry of liquid cement that is pumped down a well between the casing and the borehole. Cementing provides isolation between fluid zones behind the casing to minimize potential damage to hydrocarbon bearing formations or the integrity of freshwater aquifers, and provides structural integrity for the casing by securing it to the earth. Cementing is also done when recompleting wells, where one zone is plugged and another is opened.
As of December 31, 2017, we operated a total of 16 cementing units, with ten units operating in the Permian Basin and six units operating in the Uinta‑Piceance Basin. We believe that our cementing segment provides an organic growth opportunity for us to expand our service offerings within our existing customer base.
Other Services
Coiled Tubing
Coiled tubing services involve injecting coiled tubing into wells to perform various completion well intervention operations. Coiled tubing is a flexible steel pipe with a diameter of typically less than three inches and manufactured in continuous lengths of thousands of feet. It is wound or coiled on a truck‑mounted reel for onshore applications. Due to its small diameter, coiled tubing can be inserted into existing production tubing and used to perform a variety of services to enhance the flow of oil or natural gas.
The principal advantages of using coiled tubing include the ability to (i) continue production from the well without interruption, thus reducing the risk of formation damage, (ii) move continuous coiled tubing in and out of a well significantly faster than conventional pipe used with a workover rig, which must be jointed and unjointed, (iii) direct fluids into a wellbore with more precision, allowing for improved stimulation fluid placement, (iv) provide a source of energy to power a downhole motor or manipulate down‑hole tools and (v) enhance access to remote fields due to the smaller size and mobility.
As of December 31, 2017, we had one 2”, one 23/8” and one 11/4” coiled tubing unit, all of which were operating in the Permian Basin. We believe these units are well suited for the performance requirements of the unconventional resource markets we serve. The average age of these units is less than four years old.
Flowback Services
Our flowback services consist of production testing, solids control, hydrostatic testing and torque services. Flowback involves the process of allowing fluids to flow from the well following a treatment, either in preparation for an impending phase of treatment or to return the well to production. Our flowback equipment consists of manifolds, accumulators, valves, flare stacks and other associated equipment that combine to form up to a total of five well‑testing spreads. We provide flowback services in the Permian Basin and mid‑continent markets.
Surface Air Drilling
We currently operate a surface air drilling operation in the Uinta‑Piceance Basin, which is capable of offering cost‑effective, pre‑set surface air drilling services to target depths of approximately 4,000 feet in areas of fragile geology. Air drilling is a technique in which oil, natural gas, or geothermal wells are drilled by creating a pressure within the well that is lower than the reservoir pressure, which results in increased rates of penetration, reduced formation damage and reduced drilling costs. This division is uniquely suited to the fragile geology of the Uinta‑Piceance Basin and is highly complementary to our cementing offering.
4
Competitive Strengths
Our primary business objective is to serve as a strategic partner for our customers. We achieve this objective by providing reliable, high‑quality services that are tailored to our customers’ needs and synchronized with their well development programs. This alignment assists our customers in optimizing the long‑term development of their unconventional resources. We believe that the following competitive strengths differentiate us from our peers and uniquely position us to achieve our primary business objective.
• | Strong market position in the Permian Basin. We believe we are one of the largest hydraulic fracturing providers by HHP in the Permian Basin, which is the most prolific oil producing area in the United States. Our longstanding customer relationships and substantial Permian Basin market presence uniquely position us to continue growing in tandem with the basin’s ongoing development. The Permian Basin is a mature, liquids‑rich basin with well known geology and a large, exploitable resource base that delivers attractive E&P producer economics at or below current commodity prices. As a result of its significant size, coupled with the presence of multiple prospective geologic benches and other favorable characteristics, the Permian Basin has become widely recognized as the most attractive and economic oil resource in North America. |
Our operational focus has historically been in the Permian Basin’s Midland sub‑basin in support of our customers’ core operations. More recently, however, many of our customers have made sizeable acquisitions in the Delaware Basin, and we have expanded our services into the Delaware Basin to help develop their acreage. Further, we believe that we are uniquely positioned to capture a large addressable growth opportunity as the basin develops. For the foreseeable future, we expect both the Midland Basin and the Delaware Basin to continue to command a disproportionate share of future North American E&P spending.
• | Hydraulic fracturing is highly levered to increasing drilling activity and completion intensity levels. The combination of an expanding Permian Basin horizontal rig count and more complex well completions has a compounding effect on HHP demand growth. Horizontal drilling has become the default method for E&P operators to most economically extract unconventional resources, and the number of horizontal rigs has increased from 22% of the total Permian Basin rig count in December 2011 to approximately 91% of the Permian Basin rig count at the end of December 2017. As the horizontal rig count has grown, well completion intensity levels have also increased as a result of longer wellbore lateral lengths, more fracturing stages per foot of lateral and increasing amounts of proppant per stage. Furthermore, the ongoing improvement in drilling and completion efficiencies, driven by innovations such as multi‑well pads and zipper fracs, have further increased the demand for HHP. Taken together, these demand drivers have helped contribute to the full utilization of our fleet and leave us well positioned to capture future organic growth opportunities and enhanced pricing for the services we offer. |
• | Deep relationships and operational alignment with high‑quality, Permian Basin‑focused customers. Our deep local roots, operational expertise and commitment to safe and reliable service have allowed us to cultivate longstanding customer relationships with the most active and well‑capitalized Permian Basin operators. Our diverse customer base is comprised of market leading exploration and production companies, with no single customer representing more than 20% of our revenue for the year ended December 31, 2017. Many of our current customers have worked with us since our inception and have integrated our fleet scheduling with their well development programs. This high degree of operational alignment and their continued support have allowed us to maintain relatively high utilization rates over time. As our customers increase activity levels, we expect to continue to leverage these strong relationships to keep our fleet fully utilized and selectively expand our platform in response to specific customer demand. |
• | Standardized fleet of modern, well‑maintained equipment. We have a large, homogenous fleet of modern equipment that is configured to handle the Permian Basin’s most complex, highest‑intensity, hydraulic fracturing jobs. We believe that our fleet design is a key advantage compared to many of our competitors who have fracturing units that are not optimized for Permian Basin conditions. Our fleet is largely standardized across units to facilitate efficient maintenance and repair, reducing equipment downtime and |
5
improving labor efficiency. Furthermore, our strong relationships with a variety of key suppliers and vendors provide us with the reliable access to the equipment necessary to support our continued organic growth strategy.
• | Proven cross‑cycle financial performance. Over the past several years, we have maintained relatively high cross‑cycle fleet utilization rates. Since September 2016, our fleet has been 100% utilized, and for each of the years ended December 31, 2015, 2016 and 2017, we operated in excess of 65% utilization. Our consistent track record of steady organic growth, coupled with our ability to quickly deploy new HHP on a dedicated and fully utilized basis, has resulted in revenue growth across industry cycles. We believe that we will be able to grow faster than our competitors while preserving attractive EBITDA margins as a result of our differentiated service offerings and a robust backlog of demand for our services. Furthermore, we believe that our philosophy of maintaining modest financial leverage and a healthy balance sheet has left us more conservatively capitalized than our peers. We expect that improving market fundamentals, our superior execution and our customer‑focused approach should result in strong financial performance. |
• | Seasoned management and operating team. We have a seasoned executive management team, with our three most senior members contributing more than 100 years of collective industry and financial experience. Members of our management team founded our business and seeded our company with a portion of our original investment capital. We believe their track record of successfully building premier oilfield service companies in the Permian Basin, as well as their deep roots and relationships throughout the West Texas community, provide a meaningful competitive advantage for our business. In addition, our management team has assembled a loyal group of highly‑motivated and talented managers and field personnel, and we have had virtually no manager‑level turnover in our core service divisions over the past three years. We employ a balanced decision‑making structure that empowers managerial and field personnel to work directly with customers to develop solutions while leveraging senior management’s oversight. This collaborative approach fosters strong customer links at all levels of the organization and effectively institutionalizes customer relationships beyond the executive suite. |
Strategy
Our strategy is to:
• | Capture an increasing share of rising demand for hydraulic fracturing services in the Permian Basin. We intend to continue to position ourselves as a Permian Basin‑focused hydraulic fracturing business, as we believe the Permian Basin hydraulic fracturing market offers supportive long‑term growth fundamentals. These fundamentals are characterized by increased demand for our HHP, driven by increasing drilling activity and well completion intensity levels. We are currently operating at 100% utilization, and we believe we are strategically positioned to deploy additional hydraulic fracturing equipment as our customers continue to develop their assets in the Midland Basin and Delaware Basin. We have deployed two new hydraulic fracturing units into service through March of 2018, bringing our current fleet total to 18 deployed units or 780,000 HHP. |
• | Capitalize on improving pricing and efficiency gains. The increase in demand for HHP coupled with expected competitor equipment attrition is expected to drive more favorable hydraulic fracturing supply and demand fundamentals. We believe this market tightening may lead to a general increase in prices for hydraulic fracturing services. Furthermore, our consistently high fleet utilization levels and 24 hours per day, seven days per week operating schedule (with approximately 78% of our fleet operating on such a schedule at December 31, 2017) should result in greater revenue opportunity and enhanced margins as fixed costs are spread over a broader revenue base. We believe that any incremental future fleet additions will benefit from these trends and associated economies of scale. |
• | Cross‑sell our complementary services. In addition to our hydraulic fracturing services, we offer a broad range of complementary services in support of our customers’ development activities, including cementing, acidizing, coiled tubing, flowback services, surface air drilling and drilling. These complementary services create operational efficiencies for our customers, and allow us to capture a greater percentage of their |
6
capital spending across the lifecycle of an unconventional well. We believe that, as our customers increase spending levels, we are well positioned to continue cross‑selling and growing our complementary service offerings.
• | Maintain financial stability and flexibility to pursue growth opportunities. Consistent with our historical practices, we plan to continue to maintain a conservative balance sheet, which will allow us to better react to potential changes in industry and market conditions and opportunistically grow our business. In the near term, we intend to continue our past practice of aligning our growth capital expenditures with visible customer demand, by strategically deploying new equipment on a long‑term, dedicated basis in response to inbound customer requests. We will also selectively evaluate potential strategic acquisitions that increase our scale and capabilities or diversify our operations. |
Our Customers
Our customers consist primarily of oil and natural gas producers in North America. Our top five customers accounted for approximately 66%, 58% and 53% of our revenue, for the years ended December 31, 2017, 2016 and 2015, respectively. For the year ended December 31, 2017, Surge Operating, LLC, XTO Energy, CrownQuest Operating, LLC, Diamondback E&P, LLC and Parsley Energy Operations, LLC accounted for 15.0%, 13.8%, 12.7%, 12.6% and 11.8%, respectively, of total revenue. No other customer accounted for more than 10% of total revenue for the year ended December 31, 2017.
Competition
The markets in which we operate are highly competitive. To be successful, an oilfield services company must provide services that meet the specific needs of oil and natural gas exploration and production companies at competitive prices. Competitive factors impacting sales of our services are price, reputation and technical expertise, service and equipment quality, and health and safety standards. Although we believe our customers consider all of these factors, we believe price is a key factor in E&P companies’ criteria in choosing a service provider. While we seek to price our services competitively, we believe many of our customers elect to work with us based on our deep local roots, operational expertise, equipment’s ability to handle the most complex Permian Basin well completions, and commitment to safety and reliability.
We provide our services primarily in the Permian Basin, and we compete against different companies in each service and product line we offer. Our competition includes many large and small oilfield service companies, including the largest integrated oilfield services companies. Our major competitors for hydraulic fracturing services, which make up the majority of our revenues, include C&J Energy Services, Halliburton, Patterson‑UTI Energy Inc., RPC, Inc., Schlumberger, Keane Group, Inc., Liberty Oilfield Services, Superior Energy Services and a number of locally oriented businesses.
Seasonality
Our results of operations have historically reflected seasonal tendencies, generally in the fourth quarter, relating to the conclusion of our customers’ annual capital expenditure budgets, the holidays and inclement winter weather during which we may experience declines in our operating results.
Operating Risks and Insurance
Our operations are subject to hazards inherent in the oilfield services industry, such as accidents, blowouts, explosions, fires and spills and releases that can cause personal injury or loss of life, damage or destruction of property, equipment, natural resources and the environment and suspension of operations.
In addition, claims for loss of oil and natural gas production and damage to formations can occur in the oilfield services industry. If a serious accident were to occur at a location where our equipment and services are being used, it could result in us being named as a defendant in lawsuits asserting large claims.
7
Because our business involves the transportation of heavy equipment and materials, we may also experience traffic accidents which may result in spills, property damage and personal injury.
Despite our efforts to maintain safety standards, we from time to time have suffered accidents in the past and anticipate that we could experience accidents in the future. In addition to the property damage, personal injury and other losses from these accidents, the frequency and severity of these incidents affect our operating costs and insurability and our relationships with customers, employees, regulatory agencies and other parties. Any significant increase in the frequency or severity of these incidents, or the general level of compensation awards, could adversely affect the cost of, or our ability to obtain, workers’ compensation and other forms of insurance, and could have other material adverse effects on our financial condition and results of operations.
We maintain commercial general liability, workers’ compensation, business auto, commercial property, umbrella liability, in certain instances, excess liability, and directors and officers insurance policies providing coverages of risks and amounts that we believe to be customary in our industry. Further, we have pollution legal liability coverage for our business entities, which would cover, among other things, third party liability and costs of clean up relating to environmental contamination on our premises while our equipment are in transit and while on our customers’ job site. With respect to our hydraulic fracturing operations, coverage would be available under our pollution legal liability policy for any surface or subsurface environmental clean‑up and liability to third parties arising from any surface or subsurface contamination. We also have certain specific coverages for some of our businesses, including for our hydraulic fracturing services.
Although we maintain insurance coverage of types and amounts that we believe to be customary in the industry, we are not fully insured against all risks, either because insurance is not available or because of the high premium costs relative to perceived risk. Further, insurance rates have in the past been subject to wide fluctuation and changes in coverage could result in less coverage, increases in cost or higher deductibles and retentions. Liabilities for which we are not insured, or which exceed the policy limits of our applicable insurance, could have a material adverse effect on us. See “Risk Factors” for a description of certain risks associated with our insurance policies.
Environmental and Occupational Health and Safety Regulations
Our operations are subject to stringent laws and regulations governing the discharge of materials into the environment or otherwise relating to environmental protection, and occupational health and safety. Numerous federal, state and local governmental agencies issue regulations that often require difficult and costly compliance measures that could carry substantial administrative, civil and criminal penalties and may result in injunctive obligations for non compliance. These laws and regulations may, for example, restrict the types, quantities and concentrations of various substances that can be released into the environment, limit or prohibit construction or drilling activities on certain lands lying within wilderness, wetlands, ecologically or seismically sensitive areas and other protected areas, or require action to prevent or remediate pollution from current or former operations. Moreover, it is not uncommon for neighboring landowners and other third parties to file claims for personal injury and property damage allegedly caused by the release of hazardous substances, hydrocarbons or other waste products into the environment. Changes in environmental, health and safety laws and regulations occur frequently, and any changes that result in more stringent and costly requirements could materially adversely affect our operations and financial position. We have not experienced any material adverse effect from compliance with these requirements. This trend, however, may not continue in the future.
Below is an overview of some of the more significant environmental, health and safety requirements with which we must comply. Our customers’ operations are subject to similar laws and regulations. Any material adverse effect of these laws and regulations on our customers’ operations and financial position may also have an indirect material adverse effect on our operations and financial position.
Waste Handling. We handle, transport, store and dispose of wastes that are subject to the Resource Conservation and Recovery Act (“RCRA”) and comparable state laws and regulations, which affect our activities by imposing requirements regarding the generation, transportation, treatment, storage, disposal and cleanup of hazardous and non hazardous wastes. With federal approval, the individual states administer some or all of the
8
provisions of RCRA, sometimes in conjunction with their own, more stringent requirements. Although certain petroleum production wastes are exempt from regulation as hazardous wastes under RCRA, such wastes may constitute “solid wastes” that are subject to the less stringent requirements of non hazardous waste provisions.
Administrative, civil and criminal penalties can be imposed for failure to comply with waste handling requirements. Moreover, the EPA or state or local governments may adopt more stringent requirements for the handling of non hazardous wastes or recategorize some non hazardous wastes as hazardous for future regulation. Indeed, legislation has been proposed from time to time in Congress to recategorize certain oil and natural gas exploration, development and production wastes as hazardous wastes. Several environmental organizations have also petitioned the EPA to modify existing regulations to recategorize certain oil and natural gas exploration, development and production wastes as hazardous. Any such changes in these laws and regulations could have a material adverse effect on our capital expenditures and operating expenses. Although we do not believe the current costs of managing our wastes, as presently classified, to be significant, any legislative or regulatory reclassification of oil and natural gas exploration and production wastes could increase our costs to manage and dispose of such wastes.
Remediation of Hazardous Substances. The Comprehensive Environmental Response, Compensation and Liability Act (“CERCLA” or “Superfund”) and analogous state laws generally impose liability without regard to fault or legality of the original conduct, on classes of persons who are considered to be responsible for the release of a hazardous substance into the environment. These persons include the current owner or operator of a contaminated facility, a former owner or operator of the facility at the time of contamination and those persons that disposed or arranged for the disposal of the hazardous substance at the facility. Liability for the costs of removing or remediating previously disposed wastes or contamination, damages to natural resources, the costs of conducting certain health studies, amongst other things, is strict and joint and several. In addition, it is not uncommon for neighboring landowners and other third parties to file claims for personal injury and property damage allegedly caused by the hazardous substances released into the environment. In the course of our operations, we use materials that, if released, would be subject to CERCLA and comparable state laws. Therefore, governmental agencies or third parties may seek to hold us responsible under CERCLA and comparable state statutes for all or part of the costs to clean up sites at which such hazardous substances have been released.
One of our facilities in Midland, Texas is located within the boundaries of the West County Road 112 federal Superfund site, which site and the associated investigation and cleanup is being managed by EPA Region 6. The site’s soil and groundwater is contaminated with chromium and hexavalent chromium as a result of historic site operations unaffiliated with the Company and unassociated with the Company’s operations. Toxic tort claims also have been asserted as a result of this groundwater contamination against various unaffiliated parties. In 2013, in order to reduce the Company’s risk of incurring any future liabilities in connection with this site, the Company negotiated and obtained a bona fide prospective purchaser (“BFPP”) letter from EPA Region 6 in connection with a reorganization of the facility site ownership and lease. The BFPP letter generally acknowledges and provides that the Company is unaffiliated with any potentially responsible parties or known contamination that is the subject of the Superfund action, the Company agrees to comply with any future land use restrictions that may be imposed in connection with a site remedy (none have been imposed to date), and the Company agrees to cooperate with and provide access and assistance to EPA Region 6 in connection with the remediation. In exchange for these undertakings, the Company will not be subject to any CERCLA action by the EPA. In addition, the Company separately obtained a 10‑year environmental pollution legal liability insurance policy, effective March 4, 2013, with an aggregate limit of $20 million to insure against potential third‑party claims and any known or unknown pre‑existing conditions at the site, including Superfund or toxic tort liabilities. Both prior to and since obtaining the BFPP letter and the insurance policy, no claims have been made or threatened against the Company or any of its affiliated persons or entities with regard to this Superfund site or any related liabilities, and the Company has not incurred any significant expenses in connection with this matter.
NORM. In the course of our operations, some of our equipment may be exposed to naturally occurring radioactive materials (“NORM”) associated with oil and gas deposits and, accordingly may result in the generation of wastes and other materials containing NORM. NORM exhibiting levels of naturally occurring radiation in excess
9
of established state standards are subject to special handling and disposal requirements, and any storage vessels, piping and work area affected by NORM may be subject to remediation or restoration requirements.
Water Discharges. The Clean Water Act, Safe Drinking Water Act, Oil Pollution Act and analogous state laws and regulations impose restrictions and strict controls regarding the unauthorized discharge of pollutants, including produced waters and other gas and oil wastes, into regulated waters. The discharge of pollutants into regulated waters is prohibited, except in accordance with the terms of a permit issued by the EPA or the state. Also, spill prevention, control and countermeasure plan requirements require appropriate containment berms and similar structures to help prevent the contamination of regulated waters.
Air Emissions. The Clean Air Act (“CAA”) and comparable state laws and regulations, regulate emissions of various air pollutants through the issuance of permits and the imposition of other emissions control requirements. The EPA has developed, and continues to develop, stringent regulations governing emissions of air pollutants from specified sources. New facilities may be required to obtain permits before work can begin, and existing facilities may be required to obtain additional permits and incur capital costs in order to remain in compliance. These and other laws and regulations may increase the costs of compliance for some facilities where we operate. Obtaining or renewing permits also has the potential to delay the development of oil and natural gas projects.
Climate Change. The EPA has determined that GHGs present an endangerment to public health and the environment because such gases contribute to warming of the earth’s atmosphere and other climatic changes. Based on these findings, the EPA has adopted and implemented, and continues to adopt and implement, regulations that restrict emissions of GHGs under existing provisions of the CAA. The EPA also requires the annual reporting of GHG emissions from certain large sources of GHG emissions in the United States, including certain oil and gas production facilities. The U.S. Congress has from time to time considered adopting legislation to reduce emissions of GHGs and almost one‑half of the states have already taken legal measures to reduce emissions of GHGs primarily through the planned development of GHG emission inventories and/or regional GHG cap and trade programs. And in December 2015, the United States joined the international community at the 21st Conference of the Parties of the United Nations Framework Convention on Climate Change in Paris, France. The resulting Paris Agreement calls for the parties to undertake “ambitious efforts” to limit the average global temperature, and to conserve and enhance sinks and reservoirs of greenhouse gases. The Paris Agreement entered into force in November 2016. On June 1, 2017, President Trump announced that the United States planned to withdraw from the Paris Agreement and to seek negotiations either to reenter the Paris Agreement on different terms or establish a new framework agreement. The Paris Agreement provides for a four‑year exit process beginning when it took effect in November 2016, which would result in an effective exit date of November 2020. The United States’ adherence to the exit process is uncertain and/or the terms on which the United States may reenter the Paris Agreement or a separately negotiated agreement are unclear at this time.
Moreover, climate change may cause more extreme weather conditions and increased volatility in seasonal temperatures. Extreme weather conditions can interfere with our operations and increase our costs, and damage resulting from extreme weather may not be fully insured.
Endangered and Threatened Species. Environmental laws such as the Endangered Species Act (“ESA”) and analogous state laws may impact exploration, development and production activities in areas where we operate. The ESA provides broad protection for species of fish, wildlife and plants that are listed as threatened or endangered. Similar protections are offered to migratory birds under the Migratory Bird Treaty Act and various state analogs. The U.S. Fish and Wildlife Service may identify previously unidentified endangered or threatened species or may designate critical habitat and suitable habitat areas that it believes are necessary for survival of a threatened or endangered species, which could cause us or our customers to incur additional costs or become subject to operating restrictions or operating bans in the affected areas.
Regulation of Hydraulic Fracturing and Related Activities. Our hydraulic fracturing operations are a significant component of our business. Hydraulic fracturing is an important and common practice that is used to stimulate production of hydrocarbons, particularly natural gas, from tight formations, including shales. The process, which involves the injection of water, sand and chemicals under pressure into formations to fracture the surrounding
10
rock and stimulate production, is typically regulated by state oil and natural gas commissions. However, federal agencies have asserted regulatory authority over certain aspects of the process. For example, in May 2014, the EPA issued an Advanced Notice of Proposed Rulemaking seeking comment on the development of regulations under the Toxic Substances Control Act to require companies to disclose information regarding the chemicals used in hydraulic fracturing. Beginning in August 2012, the EPA issued a series of rules under the CAA that establish new emission control requirements for certain oil and natural gas production and natural gas processing operations and associated equipment. And in March 2015, the Bureau of Land Management (“BLM”) finalized a rule governing hydraulic fracturing on federal lands. In June 2016, a federal district court judge in Wyoming struck down the final rule, finding that the BLM lacked congressional authority to promulgate the rule. The BLM appealed that ruling. However, in July 2017, the BLM initiated a rulemaking to rescind the final rule and reinstate the regulations that existed immediately before the published effective date of the rule. In light of the BLM’s proposed rulemaking, in September 2017, the U.S. Court of Appeals for the Tenth Circuit dismissed the appeal and remanded with directions to vacate the lower court’s opinion, leaving the final rule in place. BLM’s current rulemaking is subject to public notice and comment, as well as judicial challenges. Further, legislation to amend the Safe Drinking Water Act to repeal the exemption for hydraulic fracturing (except when diesel fuels are used) from the definition of “underground injection” and require federal permitting and regulatory control of hydraulic fracturing, as well as legislative proposals to require disclosure of the chemical constituents of the fluids used in the fracturing process, have been proposed in recent sessions of Congress. Several states and local jurisdictions in which we or our customers operate also have adopted or are considering adopting regulations that could restrict or prohibit hydraulic fracturing in certain circumstances, impose more stringent operating standards and/or require the disclosure of the composition of hydraulic fracturing fluids.
More recently, federal and state governments have begun investigating whether the disposal of produced water into underground injection wells has caused increased seismic activity in certain areas. In March 2016, the United States Geological Survey identified six states with the most significant hazards from induced seismicity, including Oklahoma, Kansas, Texas, Colorado, New Mexico and Arkansas. The United States Geological Survey also noted the potential for induced seismicity in Ohio and Alabama. In response to concerns regarding induced seismicity, regulators in some states have imposed, or are considering imposing, additional requirements in the permitting of produced water disposal wells or otherwise to assess any relationship between seismicity and the use of such wells. For example, Oklahoma issued new rules for wastewater disposal wells in 2014 that imposed certain permitting and operating restrictions and reporting requirements on disposal wells in proximity to faults and also, from time to time, has developed and implemented plans directing certain wells where seismic incidents have occurred to restrict or suspend disposal well operations. In particular, the Oklahoma Corporation Commission released well completion seismicity guidelines in December 2016 for operators in the SCOOP and STACK that call for hydraulic fracturing operations to be suspended following earthquakes of certain magnitudes in the vicinity. In addition, in February 2017, the Oklahoma Corporation Commission’s Oil and Gas Conservation Division issued an order limiting future increases in the volume of oil and natural gas wastewater injected into the ground in an effort to reduce the number of earthquakes in the state. The Texas Railroad Commission adopted similar rules in 2014. In addition, in December 2016, the EPA released its final report regarding the potential impacts of hydraulic fracturing on drinking water resources, concluding that “water cycle” activities associated with hydraulic fracturing may impact drinking water resources under certain circumstances such as water withdrawals for fracturing in times or areas of low water availability, surface spills during the management of fracturing fluids, chemicals or produced water, injection of fracturing fluids into wells with inadequate mechanical integrity, injection of fracturing fluids directly into groundwater resources, discharge of inadequately treated fracturing wastewater to surface waters, and disposal or storage of fracturing wastewater in unlined pits. The results of these studies could lead federal and state governments and agencies to develop and implement additional regulations.
Increased regulation of hydraulic fracturing and related activities (whether as a result of the EPA study results or resulting from other factors) could subject us and our customers to additional permitting and financial assurance requirements, more stringent construction specifications, increased monitoring, reporting and record keeping obligations, and plugging and abandonment requirements. New requirements could result in increased operational costs for us and our customers, and reduce the demand for our services.
11
OSHA Matters. The Occupational Safety and Health Act (“OSHA”) and comparable state statutes regulate the protection of the health and safety of workers. In addition, the OSHA hazard communication standard requires that information be maintained about hazardous materials used or produced in operations and that this information be provided to employees, state and local government authorities and the public.
Employees
As of December 31, 2017, we employed 986 people. None of our employees are represented by labor unions or subject to collective bargaining agreements.
We file annual, quarterly and current reports, proxy statements and other information with the SEC. Our SEC filings are available to the public over the Internet at the SEC’s web site at www.sec.gov. You may also read and copy any document we file at the SEC’s public reference room in Washington, D.C. Please call the SEC at 1-800-SEC-0330 for further information on their public reference room. Our SEC filings are also available to the public on our website at www.propetroservices.com. Please note that information contained on our website, whether currently posted or posted in the future, is not a part of this Annual Report on Form 10-K or the documents incorporated by reference in this Annual Report on Form 10-K. This Annual Report on Form 10-K also contains summaries of the terms of certain agreements that we have entered into that are filed as exhibits to this Annual Report on Form 10-K or other reports that we have filed with the SEC. The descriptions contained in this Annual Report on Form 10-K of those agreements do not purport to be complete and are subject to, and qualified in their entirety by reference to, the definitive agreements. You may request a copy of the agreements described herein at no cost by writing or telephoning us at the following address: ProPetro Holding Corp., Attention: Investor Relations, P.O. Box 873, Midland, Texas 79702, phone number (432) 688-0012.
12
Item 1A. Risk Factors.
The following is a description of significant factors that could cause actual results to differ materially from those contained in forward-looking statement made in this Annual Report on Form 10-K and presented elsewhere by management from time to time. Such factors may have a material adverse effect on our business, financial condition and results of operations. It is not possible to predict or identify all such factors. Consequently, you should not consider any such list to be a complete statement of all our potential risks or uncertainties. Due to these, and other factors, past performance should not be considered an indication of future performance.
Our business and financial performance depends on the oil and natural gas industry and particularly on the level of capital spending and exploration and production activity within the United States and in the Permian Basin, and a decline in prices for oil and natural gas may have an adverse effect on our revenue, cash flows, profitability and growth.
Demand for most of our services depends substantially on the level of capital expenditures in the Permian Basin by companies in the oil and natural gas industry. As a result, our operations are dependent on the levels of capital spending and activity in oil and gas exploration, development and production. A prolonged reduction in oil and gas prices would generally depress the level of oil and natural gas exploration, development, production, and well completion activity and would result in a corresponding decline in the demand for the hydraulic fracturing services that we provide. The significant decline in oil and natural gas prices beginning in late 2014 caused a reduction in our customers’ spending and associated drilling and completion activities, which had an adverse effect on our revenue. If prices were to decline, similar declines in our customers’ spending would have an adverse effect on our revenue. In addition, a worsening of these conditions may result in a material adverse impact on certain of our customers’ liquidity and financial position resulting in further spending reductions, delays in the collection of amounts owing to us and similar impacts.
Many factors over which we have no control affect the supply of and demand for, and our customers’ willingness to explore, develop and produce oil and natural gas, and therefore, influence prices for our services, including:
• | the domestic and foreign supply of, and demand for, oil and natural gas; |
• | the level of prices, and expectations about future prices, of oil and natural gas; |
• | the level of global oil and natural gas exploration and production; |
• | the cost of exploring for, developing, producing and delivering oil and natural gas; |
• | the supply of and demand for drilling and hydraulic fracturing equipment; |
• | the expected decline rates of current production; |
• | the price and quantity of foreign imports; |
• | political and economic conditions in oil and natural gas producing countries and regions, including the United States, the Middle East, Africa, South America and Russia; |
• | actions by the members of Organization of Petroleum Exporting Countries with respect to oil production levels and announcements of potential changes in such levels; |
• | speculative trading in crude oil and natural gas derivative contracts; |
• | the level of consumer product demand; |
• | the discovery rates of new oil and natural gas reserves; |
• | contractions in the credit market; |
13
• | the strength or weakness of the U.S. dollar; |
• | available pipeline and other transportation capacity; |
• | the levels of oil and natural gas storage; |
• | weather conditions and other natural disasters; |
• | domestic and foreign tax policy; |
• | domestic and foreign governmental approvals and regulatory requirements and conditions; |
• | the continued threat of terrorism and the impact of military and other action, including military action in the Middle East; |
• | technical advances affecting energy consumption; |
• | the proximity and capacity of oil and natural gas pipelines and other transportation facilities; |
• | the price and availability of alternative fuels; |
• | the ability of oil and natural gas producers to raise equity capital and debt financing; |
• | merger and divestiture activity among oil and natural gas producers; and |
• | overall domestic and global economic conditions. |
These factors and the volatility of the energy markets make it extremely difficult to predict future oil and natural gas price movements with any certainty. Such a decline would have a material adverse effect on our business, results of operation and financial condition.
The cyclical nature of the oil and natural gas industry may cause our operating results to fluctuate.
We derive our revenues from companies in the oil and natural gas exploration and production industry, a historically cyclical industry with levels of activity that are significantly affected by the levels and volatility of oil and natural gas prices. We have experienced, and may in the future experience, significant fluctuations in operating results as a result of the reactions of our customers to changes in oil and natural gas prices. For example, prolonged low commodity prices experienced by the oil and natural gas industry during 2015 and 2016, combined with adverse changes in the capital and credit markets, caused many exploration and production companies to reduce their capital budgets and drilling activity. This resulted in a significant decline in demand for oilfield services and adversely impacted the prices oilfield services companies could charge for their services. In addition, a majority of the service revenue we earn is based upon a charge for a relatively short period of time (for example, a day, a week or a month) for the actual period of time the service is provided to our customers. By contracting services on a short‑term basis, we are exposed to the risks of a rapid reduction in market prices and utilization and resulting volatility in our revenues.
The majority of our operations are located in the Permian Basin, making us vulnerable to risks associated with operating in one major geographic area.
Our operations are geographically concentrated in the Permian Basin. For each of the years ended December 31, 2017, 2016 and 2015, approximately 97% of our revenues were attributable to our operations in the Permian Basin. As a result of this concentration, we may be disproportionately exposed to the impact of regional supply and demand factors, delays or interruptions of production from wells in the Permian Basin caused by significant governmental regulation, processing or transportation capacity constraints, market limitations, curtailment of production or interruption of the processing or transportation of oil and natural gas produced from the wells in these areas. In addition, the effect of fluctuations on supply and demand may become more pronounced within specific geographic oil and natural gas producing areas such as the Permian Basin, which may cause these conditions to occur with
14
greater frequency or magnify the effects of these conditions. Due to the concentrated nature of our operations, we could experience any of the same conditions at the same time, resulting in a relatively greater impact on our revenue than they might have on other companies that have more geographically diverse operations.
We are exposed to the credit risk of our customers, and any material nonpayment or nonperformance by our customers could adversely affect our business, results of operations and financial condition.
We are subject to the risk of loss resulting from nonpayment or nonperformance by our customers. Our credit procedures and policies may not be adequate to fully eliminate customer credit risk. If we fail to adequately assess the creditworthiness of existing or future customers or unanticipated deterioration in their creditworthiness, any resulting increase in nonpayment or nonperformance by them and our inability to re‑market or otherwise use the production could have a material adverse effect on our business, results of operations and financial condition. The decline and volatility in oil and natural gas prices over the last two years has negatively impacted the financial condition of our customers and further declines, sustained lower prices, or continued volatility could impact their ability to meet their financial obligations to us.
We face significant competition that may cause us to lose market share.
The oilfield services industry is highly competitive and has relatively few barriers to entry. The principal competitive factors impacting sales of our services are price, reputation and technical expertise, equipment and service quality and health and safety standards. The market is also fragmented and includes numerous small companies capable of competing effectively in our markets on a local basis, as well as several large companies that possess substantially greater financial and other resources than we do. Our larger competitors’ greater resources could allow those competitors to compete more effectively than we can. For instance, our larger competitors may offer services at below‑market prices or bundle ancillary services at no additional cost our customers. We compete with large national and multi‑national companies that have longer operating histories, greater financial, technical and other resources and greater name recognition than we do. Several of our competitors provide a broader array of services and have a stronger presence in more geographic markets. In addition, we compete with several smaller companies capable of competing effectively on a regional or local basis.
Some jobs are awarded on a bid basis, which further increases competition based on price. Pricing is often the primary factor in determining which qualified contractor is awarded a job. The competitive environment may be further intensified by mergers and acquisitions among oil and natural gas companies or other events that have the effect of reducing the number of available customers. As a result of competition, we may lose market share or be unable to maintain or increase prices for our present services or to acquire additional business opportunities, which could have a material adverse effect on our business, financial condition, results of operations and cash flows.
Our competitors may be able to respond more quickly to new or emerging technologies and services and changes in customer requirements. The amount of equipment available may exceed demand, which could result in active price competition. In addition, depressed commodity prices lower demand for hydraulic fracturing equipment, which results in excess equipment and lower utilization rates. In addition, some exploration and production companies have commenced completing their wells using their own hydraulic fracturing equipment and personnel. Any increase in the development and utilization of in‑house fracturing capabilities by our customers could decrease the demand for our services and have a material adverse impact on our business.
In addition, competition among oilfield service and equipment providers is affected by each provider’s reputation for safety and quality. We cannot assure that we will be able to maintain our competitive position.
Our business depends upon our ability to obtain specialized equipment, parts and key raw materials, including frac sand and chemicals, from third‑party suppliers, and we may be vulnerable to delayed deliveries and future price increases.
We purchase specialized equipment, parts and raw materials (including, for example, frac sand, chemicals and fluid ends) from third party suppliers and affiliates. At times during the business cycle, there is a high demand for hydraulic fracturing and other oil field services and extended lead times to obtain equipment and raw materials
15
needed to provide these services. Should our current suppliers be unable or unwilling to provide the necessary equipment, parts or raw materials or otherwise fail to deliver the products timely and in the quantities required, any resulting delays in the provision of our services could have a material adverse effect on our business, financial condition, results of operations and cash flows. In addition, future price increases for this type of equipment, parts and raw materials could negatively impact our ability to purchase new equipment, to update or expand our existing fleet, to timely repair equipment in our existing fleet or meet the current demands of our customers.
Reliance upon a few large customers may adversely affect our revenue and operating results.
The majority of our revenue is generated from our hydraulic fracturing services. Due to the large percentage of our revenue historically derived from our hydraulic fracturing services with recurring customers and the limited availability of our fracturing units, we have had some degree of customer concentration. Our top ten customers represented approximately 87%, 83% and 70% of our consolidated revenue for the years ended December 31, 2017, 2016 and 2015, respectively. It is likely that we will depend on a relatively small number of customers for a significant portion of our revenue in the future. If a major customer fails to pay us, revenue would be impacted and our operating results and financial condition could be harmed. Additionally, if we were to lose any material customer, we may not be able to redeploy our equipment at similar utilization or pricing levels and such loss could have an adverse effect on our business until the equipment is redeployed at similar utilization or pricing levels.
Certain of our completion services, particularly our hydraulic fracturing services, are substantially dependent on the availability of water. Restrictions on our or our customers’ ability to obtain water may have an adverse effect on our financial condition, results of operations and cash flows.
Water is an essential component of unconventional shale oil and natural gas production during both the drilling and hydraulic fracturing processes. Over the past several years, certain of the areas in which we and our customers operate have experienced extreme drought conditions and competition for water in such areas is growing. In addition, some state and local governmental authorities have begun to monitor or restrict the use of water subject to their jurisdiction for hydraulic fracturing to ensure adequate local water supply. For instance, some states require E&P companies to report certain information regarding the water they use for hydraulic fracturing and to monitor the quality of groundwater surrounding some wells stimulated by hydraulic fracturing. Generally, our water requirements are met by our customers from sources on or near their sites, but there is no assurance that our customers will be able to obtain a sufficient supply of water from sources in these areas. Our or our customers’ inability to obtain water from local sources or to effectively utilize flowback water could have an adverse effect on our financial condition, results of operations and cash flows.
We rely on a few key employees whose absence or loss could adversely affect our business.
Many key responsibilities within our business have been assigned to a small number of employees. The loss of their services could adversely affect our business. In particular, the loss of the services of one or more members of our executive team, including our Chief Executive Officer, Chief Operating Officer and Chief Financial Officer, could disrupt our operations. We do not maintain “key person” life insurance policies on any of our employees. As a result, we are not insured against any losses resulting from the death of our key employees.
If we are unable to employ a sufficient number of skilled and qualified workers, our capacity and profitability could be diminished and our growth potential could be impaired.
The delivery of our services requires skilled and qualified workers with specialized skills and experience who can perform physically demanding work. As a result of the volatility of the oilfield services industry and the demanding nature of the work, workers may choose to pursue employment in fields that offer a more desirable work environment at wage rates that are competitive. Our ability to be productive and profitable will depend upon our ability to employ and retain skilled workers. In addition, our ability to expand our operations depends in part on our ability to increase the size of our skilled labor force. The demand for skilled workers is high, and the supply is limited. As a result, competition for experienced oilfield service personnel is intense, and we face significant challenges in competing for crews and management with large and well‑established competitors. A significant increase in the wages paid by competing employers could result in a reduction of our skilled labor force, increases in
16
the wage rates that we must pay, or both. If either of these events were to occur, our capacity and profitability could be diminished and our growth potential could be impaired.
Our operations require substantial capital and we may be unable to obtain needed capital or financing on satisfactory terms or at all, which could limit our ability to grow.
The oilfield services industry is capital intensive. In conducting our business and operations, we have made, and expect to continue to make, substantial capital expenditures. Our total capital expenditures incurred were approximately $305.3 million, $46.0 million and $71.7 million during the years ended December 31, 2017, 2016 and 2015. We have historically financed capital expenditures primarily with funding from cash on hand, cash flow from operations, equipment and vendor financing and borrowings under our credit facilities. We may be unable to generate sufficient cash from operations and other capital resources to maintain planned or future levels of capital expenditures which, among other things, may prevent us from acquiring new equipment or properly maintaining our existing equipment. Further, any disruptions or continuing volatility in the global financial markets may lead to an increase in interest rates or a contraction in credit availability impacting our ability to finance our operations. This could put us at a competitive disadvantage or interfere with our growth plans. Further, our actual capital expenditures could exceed our capital expenditure budget. In the event our capital expenditure requirements at any time are greater than the amount we have available, we could be required to seek additional sources of capital, which may include debt financing, joint venture partnerships, sales of assets, offerings of debt or equity securities or other means. We may not be able to obtain any such alternative source of capital. We may be required to curtail or eliminate contemplated activities. If we can obtain alternative sources of capital, the terms of such alternative may not be favorable to us. In particular, the terms of any debt financing may include covenants that significantly restrict our operations. Our inability to grow as planned may reduce our chances of maintaining and improving profitability.
Concerns over general economic, business or industry conditions may have a material adverse effect on our results of operations, liquidity and financial condition.
Concerns over global economic conditions, geopolitical issues, interest rates, inflation, the availability and cost of credit and the United States and foreign financial markets have contributed to increased economic uncertainty and diminished expectations for the global economy. These factors, combined with volatility in commodity prices, business and consumer confidence and unemployment rates, have precipitated an economic slowdown. Concerns about global economic growth have had a significant adverse impact on global financial markets and commodity prices. If the economic climate in the United States or abroad deteriorates, worldwide demand for petroleum products could diminish further, which could impact the price at which oil, natural gas and natural gas liquids can be sold, which could affect the ability of our customers to continue operations and adversely impact our results of operations, liquidity and financial condition.
Our indebtedness and liquidity needs could restrict our operations and make us more vulnerable to adverse economic conditions.
Our existing and future indebtedness, whether incurred in connection with acquisitions, operations or otherwise, may adversely affect our operations and limit our growth, and we may have difficulty making debt service payments on such indebtedness as payments become due. Our level of indebtedness may affect our operations in several ways, including the following:
• | increasing our vulnerability to general adverse economic and industry conditions; |
• | the covenants that are contained in the agreements governing our indebtedness could limit our ability to borrow funds, dispose of assets, pay dividends and make certain investments; |
• | our debt covenants could also affect our flexibility in planning for, and reacting to, changes in the economy and in our industry; |
17
• | any failure to comply with the financial or other debt covenants, including covenants that impose requirements to maintain certain financial ratios, could result in an event of default, which could result in some or all of our indebtedness becoming immediately due and payable; |
• | our level of debt could impair our ability to obtain additional financing, or obtain additional financing on favorable terms, in the future for working capital, capital expenditures, acquisitions or other general corporate purposes; and |
• | our business may not generate sufficient cash flow from operations to enable us to meet our obligations under our indebtedness. |
Restrictions in our ABL Credit Facility (as defined herein) and any future financing agreements may limit our ability to finance future operations or capital needs or capitalize on potential acquisitions and other business opportunities.
The operating and financial restrictions and covenants in our credit facility and any future financing agreements could restrict our ability to finance future operations or capital needs or to expand or pursue our business activities. For example, our ABL Credit Facility restricts or limits our ability to:
• | grant liens; |
• | incur additional indebtedness; |
• | engage in a merger, consolidation or dissolution; |
• | enter into transactions with affiliates; |
• | sell or otherwise dispose of assets, businesses and operations; |
• | materially alter the character of our business as currently conducted; and |
• | make acquisitions, investments and capital expenditures. |
Furthermore, our ABL Credit Facility contains certain other operating and financial covenants. Our ability to comply with the covenants and restrictions contained in the ABL Credit Facility may be affected by events beyond our control, including prevailing economic, financial and industry conditions. If market or other economic conditions deteriorate, our ability to comply with these covenants may be impaired. If we violate any of the restrictions, covenants, ratios or tests in our ABL Credit Facility, a significant portion of our indebtedness may become immediately due and payable, our lenders’ commitment to make further loans to us may terminate. We might not have, or be able to obtain, sufficient funds to make these accelerated payments. Any subsequent replacement of our ABL Credit Facility or any new indebtedness could have similar or greater restrictions. Please read “Management’s Discussion and Analysis of Financial Condition and Results of Operations — Liquidity and Capital Resources — Credit Facility and Other Financing Arrangements .”
Our operations are subject to unforeseen interruptions and hazards inherent in the oil and natural gas industry, for which we may not be adequately insured and which could cause us to lose customers and substantial revenue.
Our operations are exposed to the risks inherent to our industry, such as equipment defects, vehicle accidents, fires, explosions, blowouts, surface cratering, uncontrollable flows of gas or well fluids, pipe or pipeline failures, abnormally pressured formations and various environmental hazards, such as oil spills and releases of, and exposure to, hazardous substances. For example, our operations are subject to risks associated with hydraulic fracturing, including any mishandling, surface spillage or potential underground migration of fracturing fluids, including chemical additives. In addition, our operations are exposed to potential natural disasters, including blizzards, tornadoes, storms, floods, other adverse weather conditions and earthquakes. The occurrence of any of these events could result in substantial losses to us due to injury or loss of life, severe damage to or destruction of property, natural resources and equipment, pollution or other environmental damage, clean‑up responsibilities, regulatory
18
investigations and penalties or other damage resulting in curtailment or suspension of our operations. The cost of managing such risks may be significant. The frequency and severity of such incidents will affect operating costs, insurability and relationships with customers, employees and regulators. In particular, our customers may elect not to purchase our services if they view our environmental or safety record as unacceptable, which could cause us to lose customers and substantial revenues.
Our insurance may not be adequate to cover all losses or liabilities we may suffer. Furthermore, we may be unable to maintain or obtain insurance of the type and amount we desire at reasonable rates. As a result of market conditions, premiums and deductibles for certain of our insurance policies have increased and could escalate further. In addition, sub‑limits have been imposed for certain risks. In some instances, certain insurance could become unavailable or available only for reduced amounts of coverage. If we were to incur a significant liability for which we are not fully insured, it could have a material adverse effect on our business, results of operations and financial condition. In addition, we may not be able to secure additional insurance or bonding that might be required by new governmental regulations. This may cause us to restrict our operations, which might severely impact our financial position.
Since hydraulic fracturing activities are part of our operations, they are covered by our insurance against claims made for bodily injury, property damage and clean‑up costs stemming from a sudden and accidental pollution event. However, we may not have coverage if we are unaware of the pollution event and unable to report the “occurrence” to our insurance company within the time frame required under our insurance policy. In addition, these policies do not provide coverage for all liabilities, and the insurance coverage may not be adequate to cover claims that may arise, or we may not be able to maintain adequate insurance at rates we consider reasonable. A loss not fully covered by insurance could have a material adverse effect on our financial position, results of operations and cash flows.
A terrorist attack or armed conflict could harm our business.
Terrorist activities, anti‑terrorist efforts and other armed conflicts involving the United States could adversely affect the U.S. and global economies and could prevent us from meeting financial and other obligations. We could experience loss of business, delays or defaults in payments from payors or disruptions of fuel supplies and markets if pipelines, production facilities, processing plants, refineries or transportation facilities are direct targets or indirect casualties of an act of terror or war. Such activities could reduce the overall demand for oil and natural gas, which, in turn, could also reduce the demand for our services. Terrorist activities and the threat of potential terrorist activities and any resulting economic downturn could adversely affect our results of operations, impair our ability to raise capital or otherwise adversely impact our ability to realize certain business strategies.
Increasing trucking regulations may increase our costs and negatively impact our results of operations.
In connection with our business operations, including the transportation and relocation of our hydraulic fracking equipment and shipment of frac sand, we operate trucks and other heavy equipment. As such, we operate as a motor carrier in providing certain of our services and therefore are subject to regulation by the United States Department of Transportation and by various state agencies. These regulatory authorities exercise broad powers, governing activities such as the authorization to engage in motor carrier operations, driver licensing, insurance requirements, financial reporting and review of certain mergers, consolidations and acquisitions, and transportation of hazardous materials (HAZMAT). Our trucking operations are subject to possible regulatory and legislative changes that may increase our costs. Some of these possible changes include increasingly stringent environmental regulations, changes in the hours of service regulations which govern the amount of time a driver may drive or work in any specific period, onboard black box recorder device requirements or limits on vehicle weight and size.
Interstate motor carrier operations are subject to safety requirements prescribed by the United States Department of Transportation. To a large degree, intrastate motor carrier operations are subject to state safety regulations that mirror federal regulations. Matters such as the weight and dimensions of equipment are also subject to federal and state regulations. From time to time, various legislative proposals are introduced, including proposals to increase federal, state, or local taxes, including taxes on motor fuels, which may increase our costs or adversely impact the recruitment of drivers. We cannot predict whether, or in what form, any increase in such taxes applicable to us will be enacted.
19
Certain motor vehicle operators require registration with the Department of Transportation. This registration requires an acceptable operating record. The Department of Transportation periodically conducts compliance reviews and may revoke registration privileges based on certain safety performance criteria that could result in a suspension of operations.
We are subject to environmental laws and regulations, and future compliance, claims, and liabilities relating to such matters may have a material adverse effect on our results of operations, financial position or cash flows.
The nature of our operations, including the handling, transporting and disposing of a variety of fluids and substances, including hydraulic fracturing fluids and other regulated substances, air emissions, and wastewater discharges exposes us to some risks of environmental liability, including the release of pollutants from oil and natural gas wells and associated equipment to the environment. The cost of compliance with these laws can be significant. Failure to properly handle, transport or dispose of these materials or otherwise conduct our operations in accordance with these and other environmental laws could expose us to substantial liability for administrative, civil and criminal penalties, cleanup and site restoration costs and liability associated with releases of such materials, damages to natural resources and other damages, as well as potentially impair our ability to conduct our operations. Such liability is commonly on a strict, joint and several liability basis, without regard to fault. Liability may be imposed as a result of our conduct that was lawful at the time it occurred or the conduct of, or conditions caused by, prior operators or other third parties. Neighboring landowners and other third parties may file claims against us for personal injury or property damage allegedly caused by the release of pollutants into the environment. Environmental laws and regulations have changed in the past, and they may change in the future and become more stringent. Current and future claims and liabilities may have a material adverse effect on us because of potential adverse outcomes, defense costs, diversion of management resources, unavailability of insurance coverage and other factors. The ultimate costs of these liabilities are difficult to determine and may exceed any reserves we may have established. If existing environmental requirements or enforcement policies change, we may be required to make significant unanticipated capital and operating expenditures.
The adoption of climate change legislation or regulations restricting emissions of greenhouse gases could result in increased operating costs and reduced demand for oil and natural gas.
The EPA has determined that greenhouse gases (“GHGs”) present an endangerment to public health and the environment because such gases contribute to warming of the earth’s atmosphere and other climatic changes. Based on these findings, the EPA has adopted and implemented, and continues to adopt and implement, regulations that restrict emissions of GHGs under existing provisions of the Clean Air Act (“CAA”). The EPA also requires the annual reporting of GHG emissions from certain large sources of GHG emissions in the United States, including certain oil and gas production facilities. The EPA has also taken steps to limit methane emissions from oil and gas production facilities. In addition, the U.S. Congress has from time to time considered adopting legislation to reduce emissions of GHGs and almost one‑half of the states have already taken legal measures to reduce emissions of GHGs primarily through the planned development of GHG emission inventories and/or regional GHG cap and trade programs. And in December 2015, the United States joined the international community at the 21st Conference of the Parties of the United Nations Framework Convention on Climate Change in Paris, France. The resulting Paris Agreement calls for the parties to undertake “ambitious efforts” to limit the average global temperature, and to conserve and enhance sinks and reservoirs of greenhouse gases. The Paris Agreement entered into force in November 2016. On June 1, 2017, President Trump announced that the United States planned to withdraw from the Paris Agreement and to seek negotiations either to reenter the Paris Agreement on different terms or establish a new framework agreement. The Paris Agreement provides for a four‑year exit process beginning when it took effect in November 2016, which would resulting in an effective exit date of November 2020. The United States’ adherence to the exit process is uncertain and/or the terms on which the United States may reenter the Paris Agreement or a separately negotiated agreement are unclear at this time.
Moreover, climate change may cause more extreme weather conditions and increased volatility in seasonal temperatures. Extreme weather conditions can interfere with our operations and increase our costs, and damage resulting from extreme weather may not be fully insured.
20
Federal and state legislative and regulatory initiatives relating to hydraulic fracturing could result in increased costs and additional operating restrictions or delays.
Our hydraulic fracturing operations are a significant component of our business, and it is an important and common practice that is used to stimulate production of hydrocarbons, particularly oil and natural gas, from tight formations, including shales. The process, which involves the injection of water, sand and chemicals under pressure into formations to fracture the surrounding rock and stimulate production, is typically regulated by state oil and natural gas commissions. However, federal agencies have asserted regulatory authority over certain aspects of the process. For example, in May 2014, the EPA issued an Advanced Notice of Proposed Rulemaking seeking comment on the development of regulations under the Toxic Substances Control Act to require companies to disclose information regarding the chemicals used in hydraulic fracturing. Beginning in August 2012, the EPA issued a series of rules under the CAA that establish new emission control requirements for emissions of volatile organic compounds and methane from certain oil and natural gas production and natural gas processing operations and equipment. And in March 2015, the Bureau of Land Management (“BLM”) finalized a rule governing hydraulic fracturing on federal lands. In June 2016, a federal district court judge in Wyoming struck down the final rule, finding that the BLM lacked congressional authority to promulgate the rule. The BLM appealed that ruling. However, in July 2017, the BLM initiated a rulemaking to rescind the final rule and reinstate the regulations that existed immediately before the published effective date of the rule. In light of the BLM’s proposed rulemaking, in September 2017, the U.S. Court of Appeals for the Tenth Circuit dismissed the appeal and remanded with directions to vacate the lower court’s opinion, leaving the final rule in place. BLM’s current rulemaking is subject to public notice and comment, as well as judicial challenges. Further, legislation to amend the Safe Drinking Water Act to repeal the exemption for hydraulic fracturing (except when diesel fuels are used) from the definition of “underground injection” and require federal permitting and regulatory control of hydraulic fracturing, as well as legislative proposals to require disclosure of the chemical constituents of the fluids used in the fracturing process, have been proposed in recent sessions of Congress. Several states and local jurisdictions in which we or our customers operate also have adopted or are considering adopting regulations that could restrict or prohibit hydraulic fracturing in certain circumstances, impose more stringent operating standards and/or require the disclosure of the composition of hydraulic fracturing fluids.
More recently, federal and state governments have begun investigating whether the disposal of produced water into underground injection wells has caused increased seismic activity in certain areas. In March 2016, the United States Geological Survey identified six states with the most significant hazards from induced seismicity, including Oklahoma, Kansas, Texas, Colorado, New Mexico and Arkansas. The United States Geological Survey also noted the potential for induced seismicity in Ohio and Alabama. In response to concerns regarding induced seismicity, regulators in some states have imposed, or are considering imposing, additional requirements in the permitting of produced water disposal wells or otherwise to assess any relationship between seismicity and the use of such wells. For example, Oklahoma issued new rules for wastewater disposal wells in 2014 that imposed certain permitting and operating restrictions and reporting requirements on disposal wells in proximity to faults and also, from time to time, has developed and implemented plans directing certain wells where seismic incidents have occurred to restrict or suspend disposal well operations. In particular, the Oklahoma Corporation Commission released well completion seismicity guidelines in December 2016 for operators in the SCOOP and STACK that call for hydraulic fracturing operations to be suspended following earthquakes of certain magnitudes in the vicinity. In addition, in February 2017, the Oklahoma Corporation Commission’s Oil and Gas Conservation Division issued an order limiting future increases in the volume of oil and natural gas wastewater injected into the ground in an effort to reduce the number of earthquakes in the state. The Texas Railroad Commission adopted similar rules in 2014. In addition, in December 2016, the EPA released its final report regarding the potential impacts of hydraulic fracturing on drinking water resources, concluding that “water cycle” activities associated with hydraulic fracturing may impact drinking water resources under certain circumstances such as water withdrawals for fracturing in times or areas of low water availability, surface spills during the management of fracturing fluids, chemicals or produced water, injection of fracturing fluids into wells with inadequate mechanical integrity, injection of fracturing fluids directly into groundwater resources, discharge of inadequately treated fracturing wastewater to surface waters, and disposal or storage of fracturing wastewater in unlined pits. The results of these studies could lead federal and state governments and agencies to develop and implement additional regulations.
21
Increased regulation of hydraulic fracturing and related activities (whether as a result of the EPA study results or resulting from other factors) could subject us and our customers to additional permitting and financial assurance requirements, more stringent construction specifications, increased monitoring, reporting and recordkeeping obligations, and plugging and abandonment requirements. New requirements could result in increased operational costs for us and our customers, and reduce the demand for our services.
Conservation measures, commercial development and technological advances could reduce demand for oil and natural gas and our services.
Fuel conservation measures, alternative fuel requirements, increasing consumer demand for alternatives to oil and natural gas, technological advances in fuel economy and energy generation devices could reduce demand for oil and natural gas, resulting in reduced demand for oilfield services. The impact of the changing demand for oil and natural gas services and products may have a material adverse effect on our business, financial condition, results of operations and cash flows.
The commercial development of economically‑viable alternative energy sources and related products (such as electric vehicles, wind, solar, geothermal, tidal, fuel cells and biofuels) could have a similar effect. In addition, certain U.S. federal income tax deductions currently available with respect to oil and natural gas exploration and development, including the allowance of percentage depletion for oil and natural gas properties, may be eliminated as a result of proposed legislation. Any future decreases in the rate at which oil and natural gas reserves are discovered or developed, whether due to the passage of legislation, increased governmental regulation leading to limitations, or prohibitions on exploration and drilling activity, including hydraulic fracturing, or other factors, could have a material adverse effect on our business and financial condition, even in a stronger oil and natural gas price environment.
We may be subject to claims for personal injury and property damage, which could materially adversely affect our financial condition and results of operations.
We operate with most of our customers under master service agreements, or MSAs. We endeavor to allocate potential liabilities and risks between the parties in the MSAs. Generally, under our MSAs, including those relating to our hydraulic fracturing services, we assume responsibility for, including control and removal of, pollution or contamination which originates above surface and originates from our equipment or services. Our customer assumes responsibility for, including control and removal of, all other pollution or contamination which may occur during operations, including that which may result from seepage or any other uncontrolled flow of drilling fluids. We may have liability in such cases if we are negligent or commit willful acts. Generally, our customers also agree to indemnify us against claims arising from their employees’ personal injury or death to the extent that, in the case of our hydraulic fracturing operations, their employees are injured or their properties are damaged by such operations, unless resulting from our gross negligence or willful misconduct. Similarly, we generally agree to indemnify our customers for liabilities arising from personal injury to or death of any of our employees, unless resulting from gross negligence or willful misconduct of the customer. In addition, our customers generally agree to indemnify us for loss or destruction of customer‑owned property or equipment and in turn, we agree to indemnify our customers for loss or destruction of property or equipment we own. Losses due to catastrophic events, such as blowouts, are generally the responsibility of the customer. However, despite this general allocation of risk, we might not succeed in enforcing such contractual allocation, might incur an unforeseen liability falling outside the scope of such allocation or may be required to enter into an MSA with terms that vary from the above allocations of risk. Litigation arising from a catastrophic occurrence at a location where our equipment and services are being used may result in our being named as a defendant in lawsuits asserting large claims. As a result, we may incur substantial losses which could materially and adversely affect our financial condition and results of operation.
We are subject to cyber security risks. A cyber incident could occur and result in information theft, data corruption, operational disruption and/or financial loss.
The oil and natural gas industry has become increasingly dependent on digital technologies to conduct certain processing activities. For example, we depend on digital technologies to perform many of our services and process and record operational and accounting data. At the same time, cyber incidents, including deliberate attacks or
22
unintentional events, have increased. The U.S. government has issued public warnings that indicate that energy assets might be specific targets of cyber security threats. Our technologies, systems and networks, and those of our vendors, suppliers and other business partners, may become the target of cyberattacks or information security breaches that could result in the unauthorized release, gathering, monitoring, misuse, loss or destruction of proprietary information, personal information and other data, or other disruption of our business operations. In addition, certain cyber incidents, such as unauthorized surveillance, may remain undetected for an extended period. Our systems and insurance coverage for protecting against cyber security risks, including cyberattacks, may not be sufficient and may not protect against or cover all of the losses we may experience as a result of the realization of such risks. As cyber incidents continue to evolve, we may be required to expend additional resources to continue to modify or enhance our protective measures or to investigate and remediate the effects of cyber incidents.
The concentration of our capital stock ownership among our largest shareholders and their affiliates will limit your ability to influence corporate matters.
Energy Capital Partners owns approximately 25.0% of our outstanding common stock. Consequently, Energy Capital Partners has significant influence over all matters that require approval by our shareholders, including the election of directors and approval of significant corporate transactions. This concentration of ownership will limit your ability to influence corporate matters, and as a result, actions may be taken that you may not view as beneficial. Moreover, this concentration of stock ownership may also adversely affect the trading price of our common stock to the extent investors perceive a disadvantage in owning stock of a company with a significant shareholder.
Conflicts of interest could arise in the future between us, on the one hand, and Energy Capital Partners and its affiliates and affiliated funds, including its and their current and future portfolio companies, on the other hand, concerning among other things, potential competitive business activities or business opportunities.
Conflicts of interest could arise in the future between us, on the one hand, and Energy Capital Partners and its affiliates and affiliated funds, including its and their current and future portfolio companies, on the other hand, concerning among other things, potential competitive business activities or business opportunities. Energy Capital Partners and its affiliated funds are primarily North American investors in essential, long‑lived and capital intensive energy assets within a host of energy related industries. Energy Capital Partners and its affiliated funds currently have investments in companies that operate in the energy infrastructure and oilfield services industries. As a result, Energy Capital Partners and its affiliates’ and affiliated funds’ current and future portfolio companies which it controls may now, or in the future, directly or indirectly, compete with us for investment or business opportunities.
Our governing documents provide that Energy Capital Partners and its affiliates and affiliated funds (including portfolio investments of Energy Capital Partners and its affiliates and affiliated funds) are not restricted from owning assets or engaging in businesses that compete directly or indirectly with us and will not have any duty to refrain from engaging, directly or indirectly, in the same or similar business activities or lines of business as us, including those business activities or lines of business deemed to be competing with us, or doing business with any of our clients, customers or vendors. In particular, subject to the limitations of applicable law, our certificate of incorporation, among other things:
• | permits Energy Capital Partners and its affiliates and affiliated funds and our non‑employee directors to conduct business that competes with us and to make investments in any kind of property in which we may make investments; and |
• | provides that if Energy Capital Partners or any of its affiliates who is also one of our non‑employee directors becomes aware of a potential business opportunity, transaction or other matter, they will have no duty to communicate or offer that opportunity to us. |
Energy Capital Partners or its affiliates or affiliated funds may become aware, from time to time, of certain business opportunities (such as acquisition opportunities) and may direct such opportunities to other businesses in which they have invested, in which case we may not become aware of or otherwise have the ability to pursue such opportunity. Further, such businesses may choose to compete with us for these opportunities, possibly causing these opportunities to not be available to us or causing them to be more expensive for us to pursue. In addition, Energy
23
Capital Partners and its affiliates and affiliated funds may dispose of their interests in energy infrastructure or other oilfield services companies or other assets in the future, without any obligation to offer us the opportunity to purchase any of those assets. As a result, our renouncing our interest and expectancy in any business opportunity that may be from time to time presented to Energy Capital Partners and its affiliates and affiliated funds could adversely impact our business or prospects if attractive business opportunities are procured by such parties for their own benefit rather than for ours.
In any of these matters, the interests of Energy Capital Partners and its affiliates and affiliated funds may differ or conflict with the interests of our other shareholders. Any actual or perceived conflicts of interest with respect to the foregoing could have an adverse impact on the trading price of our common stock.
Our certificate of incorporation and bylaws, as well as Delaware law, contain provisions that could discourage acquisition bids or merger proposals, which may adversely affect the market price of our common stock.
Our certificate of incorporation authorizes our board of directors to issue preferred stock, in addition to the Series A Preferred Shares, without shareholder approval. If our board of directors elects to issue preferred stock, it could be more difficult for a third party to acquire us. In addition, some provisions of our certificate of incorporation and bylaws could make it more difficult for a third party to acquire control of us, even if the change of control would be beneficial to our shareholders, including:
• | limitations on the removal of directors; |
• | limitations on the ability of our shareholders to call special meetings; |
• | advance notice provisions for shareholder proposals and nominations for elections to the board of directors to be acted upon at meetings of shareholders; |
• | providing that the board of directors is expressly authorized to adopt, or to alter or repeal our bylaws; and |
• | establishing advance notice and certain information requirements for nominations for election to our board of directors or for proposing matters that can be acted upon by shareholders at shareholder meetings. |
A significant reduction by Energy Capital Partners of its ownership interests in us could adversely affect us.
We believe that Energy Capital Partners’ substantial ownership interest in us provides them with an economic incentive to assist us to be successful. However, Energy Capital Partners will not be subject to any obligation to maintain its ownership interest in us and may elect at any time to sell all or a substantial portion of, or otherwise reduce, its ownership interest in us. Energy Capital Partners currently owns approximately 25.0% of our outstanding common stock. If Energy Capital Partners sells all or a substantial portion of its ownership interest in us, it may have less incentive to assist in our success and its affiliate(s) that are expected to serve as members of our board of directors may resign. Such actions could adversely affect our ability to successfully implement our business strategies which could adversely affect our cash flows or results of operations.
We are an “emerging growth company” and we cannot be certain if the reduced disclosure requirements applicable to emerging growth companies will make our common stock less attractive to investors.
We are an “emerging growth company,” as defined in the JOBS Act, and we intend to take advantage of certain exemptions from various reporting requirements that are applicable to other public companies, including, but not limited to, not being required to comply with the auditor attestation requirements of Section 404 of the Sarbanes‑Oxley Act, reduced disclosure obligations regarding executive compensation in our periodic reports and proxy statements, and exemptions from the requirements of holding a nonbinding advisory vote on executive compensation and shareholder approval of any golden parachute payments not previously approved. We intend to take advantage of these reporting exemptions until we are no longer an emerging growth company. If some investors find our common stock less attractive because we rely on these exemptions, there may be a less active trading market for our common stock and our stock price may be more volatile.
24
We will remain an emerging growth company for up to five years, although we will lose that status sooner if we have more than $1.07 billion of revenues in a fiscal year, become a “large accelerated filer” or issue more than $1.0 billion of non‑convertible debt over a rolling three‑year period.
Under the JOBS Act, emerging growth companies can delay adopting new or revised accounting standards until such time as those standards apply to private companies. We have irrevocably elected not to avail ourselves of this exemption from new or revised accounting standards and, therefore, we are subject to the same new or revised accounting standards as other public companies that are not emerging growth companies.
To the extent that we rely on any of the exemptions available to emerging growth companies, you will receive less information about our executive compensation and internal control over financial reporting than issuers that are not emerging growth companies. If some investors find our common stock to be less attractive as a result, there may be a less active trading market for our common stock and our stock price may be more volatile.
Our ability to use our net operating loss carryforwards may be limited.
As of December 31, 2017, we had approximately $261.0 million of federal net operating loss carryforwards that will begin to expire in 2032 and state net operating losses of approximately $47.0 million that will begin to expire in 2024. Utilization of these net operating loss carryforwards (“NOLs”) depends on many factors, including our future income, which cannot be assured. In addition, Section 382 (“Section 382”) of the Internal Revenue Code of 1986, as amended (the “Code”), generally imposes an annual limitation on the amount of taxable income that may be offset by NOLs when a corporation has undergone an “ownership change” (as determined under Section 382). Generally, a change of more than 50% in the ownership of a corporation’s stock, by value, over a three‑year period constitutes an ownership change for U.S. federal income tax purposes. Any unused annual limitation may, subject to certain limitations, be carried over to later years. We have experienced ownership changes, which may result in annual limitation under Section 382 determined by multiplying the value of our stock at the time of the ownership change by the applicable long‑term tax‑exempt rate as defined in Section 382, increased under certain circumstances as a result of recognizing built‑in gains in our assets existing at the time of the ownership change. The limitations arising from ownership changes may prevent utilization of our NOLs prior to their expiration. Future ownership changes or regulatory changes could further limit our ability to utilize our NOLs. To the extent we are not able to offset our future income with our NOLs, this could adversely affect our operating results and cash flows if we attain profitability.
The recently passed comprehensive tax reform bill could adversely affect our business and financial condition.
On December 22, 2017, President Trump signed into law the Tax Cuts and Jobs Act (“Tax Act”), which significantly reforms the Code. The Tax Act, among other things, contains significant changes to corporate taxation, including a permanent reduction of the corporate income tax rate, a partial limitation on the deductibility of business interest expense, limitation of the deduction for certain net operating losses to 80% of current year taxable income, an indefinite carryforward of certain net operating losses, immediate deductions for certain new investments instead of deductions for depreciation expense over time and the modification or repeal of many business deductions and credits. We continue to examine the impact of this tax reform legislation, and as its overall impact is uncertain, we note that the Tax Act could adversely affect our business and financial condition. The impact of this tax reform legislation on holders of our common stock is also uncertain and could be adverse.
Our certificate of incorporation designates the Court of Chancery of the State of Delaware as the sole and exclusive forum for certain types of actions and proceedings that may be initiated by our shareholders, which could limit our shareholders’ ability to obtain a favorable judicial forum for disputes with us or our directors, officers, employees or agents.
Our certificate of incorporation provides that, unless we consent in writing to the selection of an alternative forum, the Court of Chancery of the State of Delaware will, to the fullest extent permitted by applicable law, be the sole and exclusive forum for (i) any derivative action or proceeding brought on our behalf, (ii) any action asserting a claim of breach of a fiduciary duty owed by any of our directors, officers, employees or agents to us or our shareholders, (iii) any action asserting a claim arising pursuant to any provision of the Delaware General
25
Corporation Law (the “DGCL”), our certificate of incorporation or our bylaws, or (iv) any action asserting a claim against us that is governed by the internal affairs doctrine, in each such case subject to such Court of Chancery having personal jurisdiction over the indispensable parties named as defendants therein. Any person or entity purchasing or otherwise acquiring any interest in shares of our capital stock will be deemed to have notice of, and consented to, the provisions of our certificate of incorporation described in the preceding sentence. This choice of forum provision may limit a shareholder’s ability to bring a claim in a judicial forum that it finds favorable for disputes with us or our directors, officers, employees or agents, which may discourage such lawsuits against us and such persons. Alternatively, if a court were to find these provisions of our certificate of incorporation inapplicable to, or unenforceable in respect of, one or more of the specified types of actions or proceedings, we may incur additional costs associated with resolving such matters in other jurisdictions, which could adversely affect our business, financial condition or results of operations.
26
Item 1B. Unresolved Staff Comments.
None.
Item 2. Properties
Our corporate headquarters are located at 1706 S. Midkiff, Bldg. B, Midland, Texas 79701. In addition to our headquarters, we also lease other properties that are used for field offices, yards or storage. We believe that our facilities are adequate for our current operations.
Item 3. Legal Proceedings.
From time to time we may be involved in litigation relating to claims arising out of our operations in the normal course of business. We are not currently a party to any legal proceedings that we believe would have a material adverse effect on our financial position, results of operations or cash flows and are not aware of any material legal proceedings contemplated by governmental authorities.
Item 4. Mine and Safety Disclosures
None.
Part II
Item 5. Market for Registrant’s Common Equity, Related Stockholder Matters and Issuer Purchases of
Equity Securities.
Market Information
On March 22, 2017, we consummated our initial public offering of our common stock at a price of $14.00 per share. Our common stock is traded on the New York Stock Exchange under the symbol “PUMP.” Prior to that time, there was no public market for our stock. As a result, we have only set forth in the table below the quarterly information with respect to the high and low prices for each quarter in 2017 and have excluded 2016 because there was no public market in 2016 for our stock.
Price Per Share of Common Stock | Dividends Per Share | ||||||
High | Low | ||||||
2017 | |||||||
Fourth quarter | 20.49 | 13.81 | N/A | ||||
Third quarter | 14.48 | 10.92 | N/A | ||||
Second quarter | 14.70 | 11.93 | N/A | ||||
First quarter | 14.50 | 12.47 | N/A | ||||
Holders
As of December 31, 2017, there were 83,039,854 shares of common stock outstanding, held of record by 18 holders. The number of record holders of our common stock does not include DTC participants or beneficial owners holding shares through nominee names.
27
Dividend
We do not anticipate declaring or paying any cash dividends to holders of our common stock in the foreseeable future. We currently intend to retain future earnings, if any, to finance the growth of our business. Our future dividend policy is within the discretion of our board of directors and will depend upon then‑existing conditions, including our results of operations, financial condition, capital requirements, investment opportunities, statutory restrictions on our ability to pay dividends and other factors our board of directors may deem relevant. In addition, our ABL Credit Facility places restrictions on our ability to pay cash dividends.
Use of Proceeds
On March 22, 2017, we consummated our IPO in which 25,000,000 shares of our common stock, par value $0.001 per share, were sold at a public offering price of $14.00 per share, with 13,250,000 shares issued and sold by the Company and 11,750,000 shares sold by existing stockholders. We received net proceeds of approximately $170.1 million after deducting $10.9 million of underwriting discounts and commissions, and $4.5 million of other offering expenses. At closing, we used the proceeds (i) to repay $71.8 million in outstanding borrowings under the term loan, (ii) $86.8 million to fund the purchase of additional hydraulic fracturing units and other equipment, and (iii) the remaining for general corporate purposes.
Equity Compensation Plan Information
The following table sets forth our issuance of awards under our 2013 Stock Option Plan and 2017 Incentive Award Plan as of December 31, 2017:
Plan Category | Number of securities to be issued upon exercise of outstanding options, warrants and rights (1) | Weighted average exercise price of outstanding options, warrants and rights | Number of securities remaining available for future issuance under equity compensation plans (excluding securities reflected in column (a)) | ||||||
(a) | (b) | (c) | |||||||
Equity compensation plans approved by security holders | 5,664,367 | 5.20 | 3,983,396 | ||||||
Equity compensation plans not approved by security holders | N/A | N/A | N/A | ||||||
Total | 5,664,367 | 5.20 | 3,983,396 | ||||||
(1) Includes 3,847,763 option awards under the 2013 Stock Option Plan, and 788,590 option awards, 688,744 restricted share unit awards and 339,270 performance stock unit awards (assuming achievement of maximum payout) that have been granted under the 2017 Incentive Award Plan. The weighted average exercise price in column (b) does not take the restricted share unit awards or performance stock unit awards into account.
Performance Graph
The quarterly changes for the periods shown in the following graph are based on the assumption that $100 had been invested in our common stock, the Russell 2000 Index (“Russell 2000”) and a self-constructed peer group Index of comparable companies (“Peer Group”) on March 17, 2017 (the first trading date of our common stock), and that all dividends were reinvested at the closing prices of the dividend payment dates. The relevant companies included in our Peer Group consists of Keane Group, Inc., RPC, Inc., C&J Energy Services, Inc., Basic Energy
28
Services, Inc., Calfrac Well Services Ltd., Patterson-UTI Energy, Inc. and Superior Energy Services, Inc. Subsequent measurement points are the last trading days of each quarter in 2017. We did not provide a five-year graph because we became a publicly traded company in March of 2017. The total cumulative dollar returns shown on the graph represent the value that such investments would have had on the last trading date of 2017. The calculations exclude trading commissions and taxes. The stock price performance on the following graph and table is not necessarily indicative of future stock price performance.
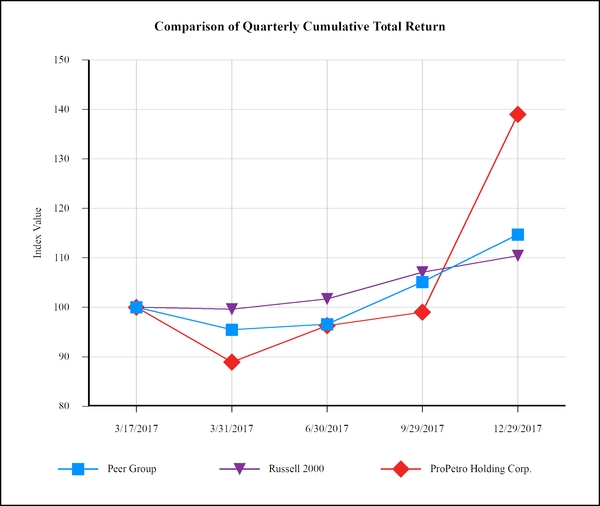
Date | Peer Group | Russell 2000 | ProPetro Holding Corp. | |||||||||
3/17/2017 | $ | 100.0 | $ | 100.0 | $ | 100.0 | ||||||
3/31/2017 | $ | 95.5 | $ | 99.6 | $ | 88.9 | ||||||
6/30/2017 | $ | 96.6 | $ | 101.7 | $ | 96.3 | ||||||
9/29/2017 | $ | 105.1 | $ | 107.1 | $ | 99.0 | ||||||
12/29/2017 | $ | 114.7 | $ | 110.4 | $ | 139.0 | ||||||
29
Item 6. Selected Historical Financial Data.
The following table presents selected historical financial and operating data of ProPetro Holding Corp. for the years indicated. The selected historical financial data as of December 31, 2017 and 2016 and for the years ended December 31, 2017, 2016 and 2015 are derived from the audited consolidated financial statements appearing elsewhere in this annual report. The 2015 balance sheet selected historical financial data was derived from the audited financial statements for the year ended December 31, 2015, not included in this Form 10-K. Historical results are not necessarily indicative of future results.
We conduct our business through six operating segments: hydraulic fracturing, cementing, coil tubing, flowback, surface drilling and drilling. For reporting purposes, the hydraulic fracturing and cementing operating segments are aggregated into our one reportable segment: pressure pumping. The selected historical consolidated financial and operating data presented below should be read in conjunction with “Risk Factors,” “Management’s Discussion and Analysis of Financial Condition and Results of Operations” and our consolidated financial statements and the related notes and other financial data included elsewhere in this annual report.
30
Year Ended December 31, | |||||||||||
(In thousands, except for per share data and percentages) | 2017 | 2016 | 2015 | ||||||||
Statement of Operations Data: | |||||||||||
Revenue | $ | 981,865 | $ | 436,920 | $ | 569,618 | |||||
Pressure pumping | 945,040 | 409,014 | 510,198 | ||||||||
All other | 36,825 | 27,906 | 59,420 | ||||||||
Costs and Expenses: | |||||||||||
Cost of services(1) | 813,823 | 404,140 | 483,338 | ||||||||
General and administrative(2) | 49,215 | 26,613 | 27,370 | ||||||||
Depreciation and amortization | 55,628 | 43,542 | 50,134 | ||||||||
Property and equipment impairment expense | — | 6,305 | 36,609 | ||||||||
Goodwill impairment expense | — | 1,177 | — | ||||||||
Loss on disposal of assets | 39,086 | 22,529 | 21,268 | ||||||||
Total costs and expenses | 957,752 | 504,306 | 618,719 | ||||||||
Operating Income (Loss) | 24,113 | (67,386 | ) | (49,101 | ) | ||||||
Other Income (Expense): | |||||||||||
Interest expense | (7,347 | ) | (20,387 | ) | (21,641 | ) | |||||
Gain on extinguishment of debt | — | 6,975 | — | ||||||||
Other expense | (1,025 | ) | (321 | ) | (499 | ) | |||||
Total other expense | (8,372 | ) | (13,733 | ) | (22,140 | ) | |||||
Income (loss) before income taxes | 15,741 | (81,119 | ) | (71,241 | ) | ||||||
Income tax (expense) benefit | (3,128 | ) | 27,972 | 25,388 | |||||||
Net income (loss) | $ | 12,613 | $ | (53,147 | ) | $ | (45,853 | ) | |||
Per Share Information | |||||||||||
Net income (loss) per common share: | |||||||||||
Basic | $ | 0.17 | $ | (1.19 | ) | $ | (1.31 | ) | |||
Diluted | $ | 0.16 | $ | (1.19 | ) | $ | (1.31 | ) | |||
Weighted average common shares outstanding: | |||||||||||
Basic | 76,371 | 44,787 | 34,993 | ||||||||
Diluted | 79,583 | 44,787 | 34,993 | ||||||||
Balance Sheet Data as of: | |||||||||||
Cash and cash equivalents | $ | 23,949 | $ | 133,596 | $ | 34,310 | |||||
Property and equipment — net of accumulated depreciation | $ | 470,910 | $ | 263,862 | $ | 291,838 | |||||
Total assets | $ | 719,032 | $ | 541,422 | $ | 446,454 | |||||
Long-term debt — net of deferred loan costs | $ | 57,178 | $ | 159,407 | $ | 236,876 | |||||
Total shareholders’ equity | $ | 413,252 | $ | 221,009 | $ | 69,571 | |||||
Cash Flow Statement Data: | |||||||||||
Net cash provided by operating activities | $ | 109,257 | $ | 10,659 | $ | 81,230 | |||||
Net cash used in investing activities | $ | (281,469 | ) | $ | (41,688 | ) | $ | (62,776 | ) | ||
Net cash provided by (used in) financing activities | $ | 62,565 | $ | 130,315 | $ | (15,216 | ) | ||||
Other Data: | |||||||||||
Adjusted EBITDA(3) | $ | 137,443 | $ | 7,816 | $ | 60,149 | |||||
Adjusted EBITDA margin(3) | 14.0 | % | 1.8 | % | 10.6 | % | |||||
Capital expenditures | $ | 305,299 | $ | 46,008 | $ | 71,676 | |||||
____________________
(1) | Exclusive of depreciation and amortization. |
(2) | Inclusive of stock‑based compensation. |
(3) | We view Adjusted EBITDA and Adjusted EBITDA margin as important indicators of performance. We define EBITDA as our net income (loss), before (i) interest expense, (ii) income taxes and (iii) depreciation and amortization. We define Adjusted EBITDA as EBITDA, plus (i) loss (gain) on disposal of assets, (ii) (gain) on extinguishment of debt, (iii) stock based compensation, and (iv) other unusual or non‑recurring (income)/expenses, such as impairment and costs related to our initial public offering. Adjusted EBITDA margin reflects our Adjusted EBITDA as a percentage of our revenues. |
31
Adjusted EBITDA and Adjusted EBITDA margin are supplemental measures utilized by our management and other users of our financial statements such as investors, commercial banks, research analysts and others, to assess our financial performance because it allows us to compare our operating performance on a consistent basis across periods by removing the effects of our capital structure (such as varying levels of interest expense), asset base (such as depreciation and amortization) and items outside the control of our management team (such as income tax rates). Adjusted EBITDA and Adjusted EBITDA margin have limitations as analytical tools and should not be considered as an alternative to net income, operating income, cash flow from operating activities or any other measure of financial performance presented in accordance with GAAP.
We believe that our presentation of Adjusted EBITDA and Adjusted EBITDA margin will provide useful information to investors in assessing our financial condition and results of operations. Net income (loss) is the GAAP measure most directly comparable to Adjusted EBITDA and Adjusted EBITDA margin. Adjusted EBITDA and Adjusted EBITDA margin should not be considered alternatives to net income (loss) presented in accordance with GAAP. Because Adjusted EBITDA and Adjusted EBITDA margin may be defined differently by other companies in our industry, our definition of Adjusted EBITDA and Adjusted EBITDA margin may not be comparable to similarly titled measures of other companies, thereby diminishing its utility. The following table presents a reconciliation of net income (loss) to Adjusted EBITDA and Adjusted EBITDA margin for each of the years indicated.
32
Reconciliation of net income (loss) to Adjusted EBITDA
($ in thousands) | Pressure Pumping | All Other | Total | ||||||||
Year ended December 31, 2017 | |||||||||||
Net income (loss) | $ | 50,417 | $ | (37,804 | ) | $ | 12,613 | ||||
Depreciation and amortization | 51,155 | 4,473 | 55,628 | ||||||||
Interest expense | — | 7,347 | 7,347 | ||||||||
Income tax expense | — | 3,128 | 3,128 | ||||||||
Loss on disposal of assets | 38,059 | 1,027 | 39,086 | ||||||||
Stock‑based compensation | — | 9,489 | 9,489 | ||||||||
Other expense | — | 1,025 | 1,025 | ||||||||
Other general and administrative expense (1) | — | 722 | 722 | ||||||||
Deferred IPO Bonus | 5,491 | 2,914 | 8,405 | ||||||||
Adjusted EBITDA | $ | 145,122 | $ | (7,679 | ) | $ | 137,443 | ||||
Year ended December 31, 2016 | Pressure Pumping | All Other | Total | ||||||||
Net loss | $ | (45,316 | ) | $ | (7,831 | ) | $ | (53,147 | ) | ||
Depreciation and amortization | 37,282 | 6,260 | 43,542 | ||||||||
Interest expense | — | 20,387 | 20,387 | ||||||||
Income tax benefit | — | (27,972 | ) | (27,972 | ) | ||||||
Loss on disposal of assets | 23,690 | (1,161 | ) | 22,529 | |||||||
Property and equipment impairment expense | — | 6,305 | 6,305 | ||||||||
Goodwill impairment expense | — | 1,177 | 1,177 | ||||||||
Gain on extinguishment of debt | — | (6,975 | ) | (6,975 | ) | ||||||
Stock‑based compensation | — | 1,649 | 1,649 | ||||||||
Other expense | — | 321 | 321 | ||||||||
Adjusted EBITDA | $ | 15,656 | $ | (7,840 | ) | $ | 7,816 | ||||
Pressure Pumping | All Other | Total | |||||||||
Year ended December 31, 2015 | |||||||||||
Net loss | $ | (5,022 | ) | $ | (40,831 | ) | $ | (45,853 | ) | ||
Depreciation and amortization | 38,369 | 11,765 | 50,134 | ||||||||
Interest expense | — | 21,641 | 21,641 | ||||||||
Income tax benefit | — | (25,388 | ) | (25,388 | ) | ||||||
Loss on disposal of assets | 21,213 | 55 | 21,268 | ||||||||
Property and equipment impairment expense | 7,980 | 28,629 | 36,609 | ||||||||
Stock‑based compensation | — | 1,239 | 1,239 | ||||||||
Other expense | — | 499 | 499 | ||||||||
Adjusted EBITDA | $ | 62,540 | $ | (2,391 | ) | $ | 60,149 | ||||
(1) | Other general and administrative expense relates to legal settlement expense. |
33
Item 7. Management’s Discussion and Analysis of Financial Condition and Results of Operations.
You should read the following discussion and analysis of our financial condition and results of operations together with our audited financial statements and the related notes appearing at the end of this Form 10-K. Some of the information contained in this discussion and analysis or set forth elsewhere in this Form 10-K, including information with respect to our plans and strategy for our business and related financing, includes forward‑looking statements that involve risks and uncertainties. You should read the “Risk Factors” section of this Form 10-K for a discussion of important factors that could cause actual results to differ materially from the results described in or implied by the forward‑looking statements contained in the following discussion and analysis.
Basis of Presentation
Unless otherwise indicated, references in this “Management’s Discussion and Analysis of Financial Condition and Results of Operations” to “ProPetro Holding Corp.,” “the Company,” “we,” “our,” “us” or like terms refer to ProPetro Holding Corp. and its subsidiary.
Overview
We are a growth‑oriented, Midland, Texas‑based oilfield services company providing hydraulic fracturing and other complementary services to leading upstream oil and gas companies engaged in the exploration and production, or E&P, of North American unconventional oil and natural gas resources. Our operations are primarily focused in the Permian Basin, where we have cultivated longstanding customer relationships with some of the region’s most active and well‑capitalized E&P companies. The Permian Basin is widely regarded as the most prolific oil‑producing area in the United States, and we believe we are currently one of the largest providers of hydraulic fracturing services in the region by hydraulic horsepower, or HHP, with an aggregate deployed capacity of 690,000 HHP at December 31, 2017. Our fleet has been designed to handle the highest intensity, most complex hydraulic fracturing jobs, and has been 100% utilized since September 2016. In the quarter ended December 31, 2017, we put one new hydraulic fracturing unit into service bringing our total fleet to 16 units as of December 31, 2017. During the year ended December 31, 2017, we put a total of six new hydraulic fracturing units into service. In addition, we have deployed two new hydraulic fracturing units into service through March of 2018, bringing our current fleet total to 18 deployed units, or 780,000 HHP.
Our Assets and Operations
Through our pressure pumping segment, which includes cementing operations, we primarily provide hydraulic fracturing services (inclusive of acidizing services) to E&P companies in the Permian Basin. Our modern hydraulic fracturing fleet has been designed to handle Permian Basin specific operating conditions and the region’s increasingly high‑intensity well completions, which are characterized by longer horizontal wellbores, more frac stages per lateral and increasing amounts of proppant per well. Over 92% of our fleet has been delivered over the past five years, and substantially all our fleet has been built by a single manufacturer since 2013. Further, we have fully maintained our equipment throughout the recent industry downturn to ensure optimal performance and reliability. Additionally, all of the hydraulic horsepower delivered over the last five years has been sourced from a single manufacturer, leading to a homogeneous fleet with streamlined maintenance programs and training for our personnel.
In addition to our core pressure pumping segment operations, we also offer a suite of complementary well completion and production services, including coiled tubing, flowback services and surface air drilling. We believe these complementary services create operational efficiencies for our customers and allow us to capture a greater portion of their capital spending across the lifecycle of a well. Additionally, we believe that these complementary services should benefit from a continued industry recovery and that we are well positioned to continue expanding these offerings in response to our customers increasing service needs and spending levels.
34
How We Generate Revenue
We generate revenue primarily through our pressure pumping segment, and more specifically, by providing hydraulic fracturing services to our customers. We own and operate a fleet of mobile hydraulic fracturing units and other auxiliary equipment to perform fracturing services. We also provide personnel and services that are tailored to meet each of our customers’ needs. We generally do not have long‑term written contractual arrangements with our customers other than standard master service agreements, which include general contractual terms between our customers and us. We charge our customers on a per‑job basis, in which we set pricing terms after receiving full specifications for the requested job, including the lateral length of the customer’s wellbore, the number of frac stages per well, the amount of proppant to be employed and other parameters of the job.
In addition to hydraulic fracturing services, we generate revenue through the complementary services that we provide to our customers, including cementing, acidizing, coiled tubing, flowback services and surface air drilling. These complementary services are provided through various contractual arrangements, including on a turnkey contract basis, in which we set a price to perform a particular job, a daywork contract basis, in which we are paid a set price per day for our services, or a footage contract basis, in which we are paid a set price per foot we drill. We are also sometimes paid by the hour for these complementary services.
Our revenue, profitability and cash flows are highly dependent upon prevailing crude oil prices and expectations about future prices. For many years, oil prices and markets have been extremely volatile. Prices are affected by many factors beyond our control. West Texas Intermediate (“WTI”) oil prices which declined significantly close to the end of the second half of 2014 have recently recovered. The average WTI oil prices per barrel was $50.8, $43.3 and $48.7 for the years ended December 31, 2017, 2016 and 2015, respectively, and is expected to continue to increase in 2018. As a result of the recent recovery in oil prices, our industry has experienced a significant increase in both drilling and pressure pumping activity levels. Looking forward, assuming oil prices remain at or above recent levels, we believe U.S. rig counts will continue to increase, which may result in an increase in demand for drilling and pressure pumping services. Higher oil and natural gas prices do not necessarily result in increased activity because demand for our services is generally driven by our customers’ expectations of future oil and natural gas prices, as well as rig count.
The historical average Permian Basin rig counts based on the weekly Baker Hughes Incorporated rig count information were as follows:
Year Ended December 31 | ||||||||
Drilling Type (Permian Basin) | 2017 | 2016 | 2015 | |||||
Directional | 6 | 2 | 5 | |||||
Horizontal | 311 | 154 | 203 | |||||
Vertical | 39 | 26 | 64 | |||||
Total | 356 | 182 | 272 | |||||
Costs of Conducting our Business
The principal direct costs involved in operating our business are expendables, other direct costs, and direct labor costs. Generally, we price each job to reflect a predetermined margin over our expendables and direct labor costs. Our fixed costs are relatively low and a large portion of the costs described below are only incurred as we perform jobs for our customers.
Expendables. Expendables are the largest expenses incurred, and include the product and freight costs associated with proppant, chemicals and other consumables used in our pressure pumping and other operations. These costs comprise a substantial variable component of our service costs, particularly with respect to the quantity and quality of sand and chemicals demanded when providing hydraulic fracturing services. Expendable product costs comprised approximately 61.3% , 61.0% and 58.9% of total costs of service for the years ended December 31, 2017, 2016 and 2015, respectively.
35
Other Direct Costs. We incur other direct expenses related to our service offerings, including the costs of fuel, repairs and maintenance, general supplies, equipment rental and other miscellaneous operating expenses. Fuel is consumed both in the operation and movement of our hydraulic fracturing fleet and other equipment. Repairs and maintenance costs are expenses directly related to upkeep of equipment, which have been amplified by the demand for higher horsepower jobs. Capital expenditures to upgrade or extend the useful life of equipment are not included in other direct costs. Other direct costs were 26.5%, 24.4% and 24.3% of total costs of service for the years ended December 31, 2017, 2016 and 2015, respectively.
Direct Labor Costs. Payroll and benefit expenses related to our crews and other employees that are directly attributable to the effective delivery of services are included in our operating costs. Direct labor costs amounted to 12.2%, 14.5% and 16.9% of total costs of service for the years ended December 31, 2017, 2016 and 2015, respectively.
How We Evaluate Our Operations
Our management uses a variety of financial and operating metrics to evaluate and analyze the performance of our business, including Adjusted EBITDA and Adjusted EBITDA margin.
EBITDA, Adjusted EBITDA and Adjusted EBITDA margin
We view Adjusted EBITDA and Adjusted EBITDA margin as important indicators of performance. We define EBITDA as our net income (loss), before (i) interest expense, (ii) income taxes and (iii) depreciation and amortization. We define Adjusted EBITDA as EBITDA, plus (i) loss/(gain) on disposal of assets, (ii) (gain) on extinguishment of debt, (iii) stock based compensation, and (iv) other unusual or non‑recurring (income)/expenses, such as impairment and costs related to our initial public offering. Adjusted EBITDA margin reflects our Adjusted EBITDA as a percentage of our revenues.
Adjusted EBITDA and Adjusted EBITDA margin are supplemental measures utilized by our management and other users of our financial statements such as investors, commercial banks, research analysts and others, to assess our financial performance because it allows us to compare our operating performance on a consistent basis across periods by removing the effects of our capital structure (such as varying levels of interest expense), asset base (such as depreciation and amortization), nonrecurring expenses (such as IPO bonus) and items outside the control of our management team (such as income tax rates). Adjusted EBITDA and Adjusted EBITDA margin have limitations as analytical tools and should not be considered as an alternative to net income (loss), operating income (loss), cash flow from operating activities or any other measure of financial performance presented in accordance with GAAP.
Note Regarding Non‑GAAP Financial Measures
Adjusted EBITDA and Adjusted EBITDA margin are not financial measures presented in accordance with GAAP. We believe that the presentation of these non‑GAAP financial measures will provide useful information to investors in assessing our financial condition and results of operations. Net income is the GAAP measure most directly comparable to Adjusted EBITDA. Our non‑GAAP financial measures should not be considered as alternatives to the most directly comparable GAAP financial measures. Each of these non‑GAAP financial measures has important limitations as analytical tools because they exclude some but not all items that affect the most directly comparable GAAP financial measures. You should not consider Adjusted EBITDA or Adjusted EBITDA margin in isolation or as a substitute for an analysis of our results as reported under GAAP. Because Adjusted EBITDA and Adjusted EBITDA margin may be defined differently by other companies in our industry, our definitions of these non‑GAAP financial measures may not be comparable to similarly titled measures of other companies, thereby diminishing their utility.
Factors Affecting the Comparability of Our Financial Results
Our future results of operations may not be comparable to our historical results of operations for the reasons described below:
36
Our strategic focus on our pressure pumping segment and other complementary services will reduce the relative financial contribution of the drilling operating segment in our results of operations. We expect revenues and costs of services related to our drilling operating segment to comprise a lower percentage of total revenues and total costs of service in future results of operations when compared to historic results due to our increased focus on pressure pumping and other complementary service offerings. We idled all seven of our Permian vertical drilling rigs during 2016. As a result, during the year ended December 31, 2017, no revenue was generated by our drilling segment as compared to $9.9 million of revenue (or 2.3% of revenues) for the year ended December 31, 2016, and $35.7 million (or 6.3% of revenues) for the year ended December 31, 2015. Likewise cost of services related to drilling was $0.4 million for the year ended December 31, 2017, as compared to $8.5 million (2.1% of all costs of services) for the year ended December 31, 2016, and $30.8 million (or 6.4% of cost of service) for the year ended December 31, 2015. We anticipate the financial significance of this service line relative to the financial results from pressure pumping and other service offerings to continue to decline.
Results of Operations
We conduct our business through six operating segments: hydraulic fracturing, cementing, coil tubing, flowback, surface drilling, and drilling. During the year, we consolidated our acidizing operations into our hydraulic fracturing segment bringing the number of our operating segment to six, from seven previously reported in prior years. The change in the number of our operating segments did not have any monetary impact on our reportable segment information in the current or prior years included in this Form 10-K. For reporting purposes, the hydraulic fracturing (which now includes our acidizing operations) and cementing operating segments are aggregated into our one reportable segment: pressure pumping. We expect revenues and costs of services related to our drilling operating segment to comprise a lower percentage of total revenues and total costs of service in future results of operations when compared to historic results due to our increased focus on pressure pumping and other complementary service offerings. We anticipate the financial significance of this service line relative to the financial results from pressure pumping and other service offerings to continue to decline.
37
Year Ended December 31, 2017 Compared to Year Ended December 31, 2016
($ in thousands, except percentages) | YEAR ENDED | CHANGE | |||||||||||||
2017 | 2016 | Variance | % | ||||||||||||
Revenue | $ | 981,865 | $ | 436,920 | $ | 544,945 | 124.7 | % | |||||||
Cost of services (1) | 813,823 | 404,140 | 409,683 | 101.4 | % | ||||||||||
General and administrative expense (2) | 49,215 | 26,613 | 22,602 | 84.9 | % | ||||||||||
Depreciation and amortization | 55,628 | 43,542 | 12,086 | 27.8 | % | ||||||||||
Property and equipment impairment | — | 6,305 | (6,305 | ) | (100.0 | )% | |||||||||
Goodwill impairment | — | 1,177 | (1,177 | ) | (100.0 | )% | |||||||||
Loss on disposal of assets | 39,086 | 22,529 | 16,557 | 73.5 | % | ||||||||||
Interest expense | 7,347 | 20,387 | (13,040 | ) | (64.0 | )% | |||||||||
Gain on extinguishment of debt | — | (6,975 | ) | (6,975 | ) | (100.0 | )% | ||||||||
Other expense | 1,025 | 321 | 704 | 219.3 | % | ||||||||||
Income tax expense/(benefit) | 3,128 | (27,972 | ) | (31,100 | ) | (111.2 | )% | ||||||||
Net income (loss) | $ | 12,613 | $ | (53,147 | ) | $ | 65,760 | 123.7 | % | ||||||
| | | |||||||||||||
Adjusted EBITDA (3) | $ | 137,443 | $ | 7,816 | $ | 129,627 | 1,658.5 | % | |||||||
Adjusted EBITDA Margin (3) | 14.0 | % | 1.8 | % | 12.2 | % | 677.8 | % | |||||||
Pressure pumping segment results of operations: | |||||||||||||||
Revenue | $ | 945,040 | $ | 409,014 | $ | 536,025 | 131.1 | % | |||||||
Cost of services | $ | 784,349 | $ | 379,815 | $ | 404,534 | 106.5 | % | |||||||
Adjusted EBITDA | $ | 145,122 | $ | 15,656 | $ | 129,466 | 826.9 | % | |||||||
Adjusted EBITDA Margin (4) | 15.4 | % | 3.8 | % | 11.6 | % | 305.3 | % | |||||||
(1) | Exclusive of depreciation and amortization. |
(2) | Inclusive of stock‑based compensation. |
(3) | For definitions of the non‑GAAP financial measures of Adjusted EBITDA and Adjusted EBITDA margin and reconciliation of Adjusted EBITDA and Adjusted EBITDA margin to our most directly comparable financial measures calculated in accordance with GAAP, please read “Selected Historical Financial Data”. |
(4) | The non‑GAAP financial measure of Adjusted EBITDA margin for the pressure pumping segment is calculated by taking Adjusted EBITDA for the pressure pumping segment as a percentage of our revenues for the pressure pumping segment. |
Revenues. Revenues increased 124.7%, or $544.9 million, to $981.9 million for the year ended December 31, 2017, as compared to $436.9 million for the year ended December 31, 2016. The increase was primarily attributable to the increase in customer activity, fleet size and demand for our services, which has led to an increase in pricing for our hydraulic fracturing and other services. Our pressure pumping segment revenues increased 131.1%, or $536.0 million for the year ended December 31, 2017 as compared to the year ended December 31, 2016. Revenues from services other than pressure pumping increased 32.0%, or $8.9 million, for the year ended December 31, 2017, as compared to the year ended December 31, 2016. The increase in revenues from services other than pressure pumping during the year ended December 31, 2017 was primarily attributable to the increase in revenues and customer demand for our flowback, coil tubing and surface drilling services, offset by the decrease in revenue from idling of our drilling rigs.
38
Cost of Services. Cost of services increased 101.4%, or $409.7 million, to $813.8 million for the year ended December 31, 2017, from $404.1 million during the year ended December 31, 2016. Cost of services in our pressure pumping segment increased $404.5 million during the year ended December 31, 2017, as compared to the year ended December 31, 2016. The increases were primarily attributable to higher activity levels, coupled with an increase in personnel headcount following the increased activity levels. As a percentage of pressure pumping segment revenues, pressure pumping cost of services decreased to 83.0% for the year ended December 31, 2017, as compared to 92.9% for the year ended December 31, 2016. The decrease in cost of services as a percentage of revenue for the pressure pumping segment resulted from greater pricing power as demand for our services increased, without a corresponding increase in certain costs, which resulted in significantly higher realized Adjusted EBITDA margins during the year ended December 31, 2017.
General and Administrative Expenses. General and administrative expenses increased 84.9%, or $22.6 million, to $49.2 million for the year ended December 31, 2017, as compared to $26.6 million for the year ended December 31, 2016. The net increase was primarily attributable to increases in payroll, insurance, advertising, communication, office expense, travel and legal costs, totaling $8.3 million, and an IPO bonus of $8.4 million to key employees, along with $7.8 million increase in stock compensation recorded during the year ended December 31, 2017, and offset by a decrease in property taxes of $1.6 million, and other remaining general and administrative expenses of $0.3 million. General and administrative expenses as a percentage of total revenues decreased to 5.0% for the year ended December 31, 2017, as compared to 6.1% for the year ended December 31, 2016, excluding non-recurring deferred IPO bonus of $8.4 million and stock compensation expense of $6.8 million, general and administrative expenses as a percentage of total revenues decreased to 3.5% for the year ended December 31, 2017, as compared to 6.1% for the year ended December 31, 2016. The decrease in general and administrative expenses as a percentage of total revenue is as a result of the higher revenue during the year ended December 31, 2017.
Depreciation and Amortization. Depreciation and amortization increased 27.8%, or $12.1 million, to $55.6 million for the year ended December 31, 2017, as compared to $43.5 million for the year ended December 31, 2016. The increase was primarily attributable to additional property and equipment purchased and put into service in the year ended December 31, 2017. We calculate depreciation of property and equipment using the straight-line method.
Property and Equipment Impairment Expense. There was no property and equipment impairment expense during the year ended December 31, 2017, compared to $6.3 million during the year ended December 31, 2016. The non‑cash impairment expense in 2016 was associated with our drilling rigs, and was recognized as a result of depressed commodity prices and a negative future near‑term outlook for these assets.
Goodwill Impairment Expense. There was no goodwill impairment expense during the year ended December 31, 2017, compared to $1.2 million during the year ended December 31, 2016. The non‑cash goodwill impairment expense in 2016 was as a result of the write‑down of goodwill related to our surface drilling reporting unit.
Loss on Disposal of Assets. Loss on the disposal of assets increased 73.5%, or $16.6 million, to $39.1 million for the year ended December 31, 2017, as compared to $22.5 million for the year ended December 31, 2016. The increase was primarily attributable to greater service intensity of jobs completed, coupled with higher fleet size, activity levels and utilization of our equipment.
Interest Expense. Interest expense decreased 64.0%, or $13.0 million, to $7.3 million for the year ended December 31, 2017, as compared to $20.4 million for the year ended December 31, 2016. The decrease in interest expense was primarily attributable to a reduction in our average debt balance during 2017 due to the early retirement of our term loan and revolving credit facility in the first quarter of 2017.
Gain on Extinguishment of Debt. There was no debt extinguishment gain or loss during the year ended December 31, 2017, compared to the gain on extinguishment of debt, net of cost, of $7.0 million during the year ended December 31, 2016. The gain on extinguishment of debt during 2016 was as a result of the auction process with our lenders to repurchase $37.5 million of our term loan at a 20% discount to par value.
39
Other Expense. Other expense was $1.0 million for the year ended December 31, 2017, as compared to $0.3 million for the year ended December 31, 2016. The increase was primarily attributable to an increase in lenders related expenses, non-recurring listing related expenses, and partially offset by an increase in the unrealized gain resulting from the change in the fair value of our interest rate swap liability at December 31, 2017 compared to December 31, 2016.
Income Tax Expense/(Benefit). Income tax expense was $3.1 million for the year ended December 31, 2017, compared to income tax benefit of $28.0 million, for the year ended December 31, 2016. The change from an income tax benefit to income tax expense is primarily due to the Company’s reporting income before taxes during the year ended December 31, 2017, compared to a loss before taxes recorded during the year ended December 31, 2016. The income before taxes generated is attributable to the increase in our revenue during the year ended December 31, 2017, compared to December 31, 2016. Additionally, the income tax expense during the year ended December 31, 2017, included a one-time deferred tax benefit offset of $3.4 million, resulting from the U.S. government enacted tax legislation commonly referred to as the Tax Cuts and Jobs Act (“Tax Act”).
40
Year Ended December 31, 2016 Compared to Year Ended December 31, 2015
YEAR ENDED | CHANGE | ||||||||||||||
($ in thousands, except percentages) | 2016 | 2015 | Variance | % | |||||||||||
Revenue | $ | 436,920 | $ | 569,618 | $ | (132,698 | ) | (23.3 | )% | ||||||
Cost of services (1) | 404,140 | 483,338 | (79,198 | ) | (16.4 | )% | |||||||||
General and administrative expense (2) | 26,613 | 27,370 | (757 | ) | (2.8 | )% | |||||||||
Depreciation and amortization | 43,542 | 50,134 | (6,592 | ) | (13.1 | )% | |||||||||
Property and equipment impairment | 6,305 | 36,609 | (30,304 | ) | (82.8 | )% | |||||||||
Goodwill impairment | 1,177 | — | 1,177 | 100.0 | % | ||||||||||
Loss on disposal of assets | 22,529 | 21,268 | 1,261 | 5.9 | % | ||||||||||
Interest expense | 20,387 | 21,641 | (1,254 | ) | (5.8 | )% | |||||||||
Gain on extinguishment of debt | (6,975 | ) | — | 6,975 | 100.0 | % | |||||||||
Other expense | 321 | 499 | (178 | ) | (35.7 | )% | |||||||||
Income tax benefit | (27,972 | ) | (25,388 | ) | 2,584 | 10.2 | % | ||||||||
Net income (loss) | $ | (53,147 | ) | $ | (45,853 | ) | $ | 7,294 | 15.9 | % | |||||
| | | |||||||||||||
Adjusted EBITDA (3) | $ | 7,816 | $ | 60,149 | $ | (52,333 | ) | (87.0 | )% | ||||||
Adjusted EBITDA Margin (3) | 1.8 | % | 10.6 | % | (8.8 | )% | (83.0 | )% | |||||||
Pressure pumping segment results of operations: | |||||||||||||||
Revenue | $ | 409,014 | $ | 510,198 | $ | (101,184 | ) | (19.8 | )% | ||||||
Cost of services | $ | 379,815 | $ | 432,372 | $ | (52,557 | ) | (12.2 | )% | ||||||
Adjusted EBITDA | $ | 15,656 | $ | 62,540 | $ | (46,884 | ) | (75.0 | )% | ||||||
Adjusted EBITDA Margin (4) | 3.8 | % | 12.3 | % | (8.5 | )% | (69.1 | )% | |||||||
(1) | Exclusive of depreciation and amortization. |
(2) | Inclusive of stock‑based compensation. |
(3) | For definitions of the non‑GAAP financial measures of Adjusted EBITDA and Adjusted EBITDA margin and reconciliation of Adjusted EBITDA and Adjusted EBITDA margin to our most directly comparable financial measures calculated in accordance with GAAP, please read “Selected Historical Financial Data”. |
(4) | The non‑GAAP financial measure of Adjusted EBITDA margin for the pressure pumping segment is calculated by taking Adjusted EBITDA for the pressure pumping segment as a percentage of our revenues for the pressure pumping segment. |
Revenues. Revenues decreased 23.3%, or $132.7 million, to $436.9 million for the year ended December 31, 2016 as compared to $569.6 million for the year ended December 31, 2015. The decrease was primarily attributable to a reduction in customer activity, a decline in pricing for our hydraulic fracturing services as a result of an over‑supply of HHP in our areas of operations, and the idling of our seven drilling rigs. Our pressure pumping segment revenues decreased 19.8%, or $101.2 million, for the year ended December 31, 2016 as compared to the year ended December 31, 2015. Revenues other than pressure pumping decreased 53.0%, or $31.5 million, for the year December 31, 2016 as compared to the year ended December 31, 2015. The decrease was primarily attributable to a decline in demand and pricing for these ancillary services. The overall decrease in revenues was attributable to a competitive market environment caused by the decrease in U.S. onshore drilling and completion activity as a result of decreased oil and natural gas commodity prices. Average oil and natural gas prices have decreased 11.0% and 3.8%, respectively, from the year ended December 31, 2015 as compared to the year ended December 31, 2016. The
41
Baker Hughes U.S. onshore rig count also decreased 48.3% during the year ended December 31, 2016 as compared to the year ended December 31, 2015.
Cost of Services. Cost of services decreased 16.4%, or $79.2 million, to $404.1 million for the year ended December 31, 2016 from $483.3 million as compared to the year ended December 31, 2015. Cost of services in our pressure pumping segment decreased $52.6 million for the year ended December 31, 2016 as compared to the year ended December 31, 2015. The decreases were primarily attributable to lower activity levels, coupled with reduced personnel headcount. As a percentage of pressure pumping segment revenues, pressure pumping cost of services increased to 92.9% for the year ended December 31, 2016 as compared to 84.7% for the year ended December 31, 2015. The increase in cost of services as a percentage of sales for the pressure pumping segment resulted from lower revenue generating activity levels without a corresponding reduction in costs as well as depressed pricing for our services, which resulted in significantly lower realized EBITDA margins.
General and Administrative Expenses. General and administrative expenses decreased 2.8%, or $0.8 million, to $26.6 million for the year ended December 31, 2016 as compared to $27.4 million for the year ended December 31, 2015. The decrease was primarily attributable to a $2.2 million reduction in insurance expense due to a reduction in personnel headcount and a $1.0 million reduction in property taxes, partially offset by an increase in bonus expense of $2.5 million as compared to 2015. General and administrative expenses as a percentage of total revenues was 6.1% for the year ended December 31, 2016 as compared to 4.8% for the year ended December 31, 2015. This increase was due partially to pricing pressures in a competitive operating environment, as well as our decision to maintain equipment and retain key personnel during times of lower equipment utilization levels.
Depreciation and Amortization. Depreciation and amortization decreased 13.1%, or $6.6 million, to $43.5 million for the year ended December 31, 2016 as compared to $50.1 million for the year ended December 31, 2015. The decrease was primarily attributable to a decrease in average depreciable assets partially offset by approximately $46.0 million in capital expenditures during the year ended December 31, 2016. We calculate depreciation of property and equipment using the straight‑line method.
Property and Equipment Impairment Expense. Property and equipment impairment expense was $36.6 million for the year ended December 31, 2015, as compared to $6.3 million for the year ended December 31, 2016. The non‑cash impairment expense in 2015 was associated with our drilling rigs and acidizing assets and was recognized as a result of depressed commodity prices and a negative future near‑term outlook for these assets. The non‑cash impairment expense in 2016 was a result of the continuous depressed demand for our drilling rigs.
Goodwill Impairment Expense. Goodwill impairment expense was $1.2 million for the year ended December 31, 2016, as compared to no goodwill impairment expense for the year ended December 31, 2015. The impairment expense in 2016 was attributable to the write‑down of goodwill related to our surface drilling reporting unit.
Loss on Disposal of Assets. Loss on the disposal of assets increased 5.9%, or $1.3 million, to $22.5 million for the year ended December 31, 2016 as compared to $21.3 million for the year ended December 31, 2015. The increase was primarily attributable to greater service intensity of jobs completed despite lower pressure pumping activity levels.
Interest Expense. Interest expense decreased 5.8%, or $1.3 million, to $20.4 million for the year ended December 31, 2016 as compared to $21.6 million for the year ended December 31, 2015. The decrease in interest expense was primarily attributable to a reduction in our average debt balance during 2016.
Gain on Extinguishment of Debt. Gain on extinguishment of debt was $7.0 million, net of cost, for the year ended December 31, 2016, as compared to no debt extinguishment gain or loss for the year ended December 31, 2015. In June 2016, we conducted an auction process with our lenders to repurchase $37.5 million of our term loan at a 20% discount to par value.
42
Other Expense. Other expense decreased to $0.3 million for the year ended December 31, 2016 as compared to $0.5 million for the year ended December 31, 2015. The decrease was primarily attributable to an unrealized gain resulting from the change in the fair value of our interest rate swap liability at December 31, 2016 compared to 2015, partially offset by restructuring expenses related to the first amendment to our existing credit agreement incurred in 2016 and the reduction of other income in 2016 as compared to 2015.
Income Tax Benefit. The increase of $2.6 million in income tax benefit for the year ended December 31, 2016 as compared to the year ended December 31, 2015 is primarily attributable to a higher loss before income taxes, partially offset by the valuation allowance of $0.9 million recorded in the year.
Liquidity and Capital Resources
Historically, our primary sources of liquidity and capital resources have been borrowings under our term loan and revolving credit facility, cash flows from our operations and capital contributions from our shareholders. Our primary uses of capital have been investing in and maintaining our property and equipment and repaying indebtedness. As of December 31, 2017, our cash and cash equivalents were $23.9 million, and as of December 31, 2016, were $133.6 million.
On March 22, 2017, we consummated our IPO in which 25,000,000 shares of our common stock, par value $0.001 per share, were sold at a public offering price of $14.00 per share, with 13,250,000 shares issued and sold by the Company and $11,750,000 shares sold by existing stockholders. We received net proceeds of approximately $170.1 million after deducting $10.9 million of underwriting discounts and commissions, and $4.5 million of other offering expenses. At closing, we used the proceeds (i) to repay $71.8 million in outstanding borrowings under our term loan, (ii) $86.8 million to fund the purchase of additional hydraulic fracturing units and other equipment, and (iii) the remaining for general corporate purposes.
Our liquidity is currently provided by (i) existing cash balances, (ii) operating cash flows and (iii) borrowings under our ABL Credit Facility. Our primary uses of cash will be to continue to fund our operations, support organic growth opportunities and satisfy debt payments. As of December 31, 2017, our total liquidity consists of cash and cash equivalent of $23.9 million, and $79.0 million of availability under our ABL Credit Facility.
There can be no assurance that operations and other capital resources will provide cash in sufficient amounts to maintain planned or future levels of capital expenditures. Future cash flows are subject to a number of variables, and are highly dependent on the drilling, completion, and production activity by our customers, which in turn is highly dependent on oil and gas prices. Depending upon market conditions and other factors, we may issue equity and debt securities or take other actions necessary to fund our business or meet our future long-term liquidity requirements.
Cash and Cash Flows
The following table sets forth our net cash provided by (used in) operating, investing and financing activities during the year at December 31, 2017, 2016 and 2015, respectively.
Year Ended December 31, | |||||||||||
($ in thousands) | 2017 | 2016 | 2015 | ||||||||
Net cash provided by operating activities | $ | 109,257 | $ | 10,659 | $ | 81,230 | |||||
Net cash used in investing activities | $ | (281,469 | ) | $ | (41,688 | ) | $ | (62,776 | ) | ||
Net cash provided by (used in) financing activities | $ | 62,565 | $ | 130,315 | $ | (15,216 | ) | ||||
Operating Activities
Net cash provided by operating activities was $109.3 million for the year ended December 31, 2017, compared to $10.7 million for the year ended December 31, 2016. The net increase of $98.6 million was primarily due to an increase in revenue and net income in the year, resulting from an increase in customer activity, fleet size and demand
43
for our services, and partially offset by the increase in our working capital needs resulting from higher fleet size and expanding activity levels.
Net cash provided by operating activities was $10.7 million for the year ended December 31, 2016 and $81.2 million for the year ended December 31, 2015. The decrease was primarily due to a decrease in operating margins when adjusted for non‑cash items. Operating income (loss), excluding depreciation, amortization and impairment expenses, decreased from income of $37.6 million in 2015 to a loss of $16.4 million in 2016. Additionally, the change in operating assets and liabilities decreased from a $38.3 million cash inflow in 2015 to a $19.8 million cash inflow in 2016 due to an increase in accounts receivable attributable to higher business activity levels in the fourth quarter of 2016 as compared to 2015, partially offset by the timing of payments of our accounts payable.
Investing Activities
Net cash used in investing activities increased to $281.5 million for the year ended December 31, 2017, from $41.7 million for the year ended December 31, 2016. The increase was primarily attributable to the additional hydraulic fracturing units and other ancillary equipment purchased and a marginal increase in maintenance capital expenditures, during the year ended December 31, 2017, compared to the year ended December 31, 2016.
Net cash used in investing activities was $41.7 million and $62.8 million for the years ended December 31, 2016 and 2015, respectively. The decrease was primarily due to the addition of one hydraulic fracturing unit in January 2015 and a decline in capital expenditures in response to lower activity levels in 2016.
Financing Activities
Net cash provided by financing activities was $62.6 million for the year ended December 31, 2017, compared to $130.3 million for the year ended December 31, 2016. The net decrease in cash provided from financing activities was primarily attributable to the repayment of borrowings $166.5 million, repayment of insurance financing of $3.8 million, debt issuance cost of $1.7 million, payment of IPO costs of $15.1 million and offset by the receipt of $185.5 million of IPO proceeds, insurance financing proceeds of $4.1 million and proceeds from borrowings of $60.0 million during the year ended December 31, 2017, compared to net cash used of $71.3 million for repayment of borrowings, repayment of insurance financing of $4.5 million, payment of preferred equity financing costs of $7.5 million debt extinguishment, debt issuance and IPO costs of $1.0 million, offset by insurance financing proceeds of $4.1 million, equity capitalization proceeds of $40.4 million and proceeds from preferred equity capitalization of $170.0 million during the year ended December 31, 2016.
Net cash provided by financing activities was $130.3 million for the year ended December 31, 2016, and net cash used in financing activities was $15.2 million for the year ended December 31, 2015. The change was primarily due to a $210.4 million increase in equity capitalization, $40.4 million common equity and $170.0 million preferred equity, partially offset by a $28.2 million increase in net repayments of borrowings, $7.5 million of transaction costs incurred related to the private placement and $30.0 million extinguishment of debt during 2016. In 2015, we entered into a new equipment financing arrangement relating to three hydraulic fracturing units, where we extended the amortization period from 13 to 36 months and reduced the amount of required monthly installment payments.
Credit Facility and Other Financing Arrangements
ABL Credit Facility
On March 22, 2017, we entered into a new revolving credit facility with a $150 million borrowing capacity, or the ABL Credit Facility. Borrowings under the ABL Credit Facility accrue interest based on a three-tier pricing grid tied to availability, and we may elect for loans to be based on either LIBOR or base rate, plus the applicable margin, which ranges from 1.75% to 2.25% for LIBOR loans and 0.75% to 1.25% for base rate loans, with no LIBOR floor. Borrowings under the ABL Credit Facility are secured by a first priority lien and security interest in substantially all assets of the Company. The ABL Credit Facility has a tenor of 5 years and a borrowing base of 85% of eligible accounts receivable less customary reserves. Under this facility we are required to comply, subject to certain exceptions and materiality qualifiers, with certain customary affirmative and negative covenants, including, but not limited to, covenants pertaining to our ability to incur liens, indebtedness, changes in the nature of our business,
44
mergers and other fundamental changes, disposal of assets, investments and restricted payments, amendments to our organizational documents or accounting policies, prepayments of certain debt, dividends, transactions with affiliates, and certain other activities. In addition, the ABL Credit Facility includes a Springing Fixed Charge Coverage Ratio of 1.0x when excess availability is less than the greater of (i) 10% of the lesser of the facility size and the Borrowing Base and (ii) $12 million. The ABL has a commitment fee of 0.375%, which reduces to 0.25% if utilization is greater than 50% of the borrowing base.
On February 22, 2018, we entered into an amendment with our lenders to increase the capacity of the ABL Credit Facility. The amendment increased total capacity under the facility from $150 million to $200 million.
Equipment Financing Arrangements
On November 24, 2015, we entered into a 36‑month equipment financing arrangement for three hydraulic fracturing units, and received proceeds of $25.0 million. A portion of the proceeds were used to pay off manufacturer notes, and the remainder was used for additional liquidity.
On June 30, 2017, we entered into a financing arrangement for the purchase of light vehicles. As of December 31, 2017, we purchased certain light vehicles under this financing arrangement in the amount of $4.7 million.
Off Balance Sheet Arrangements
We had no off balance sheet arrangements as of December 31, 2017.
Capital Requirements
Capital expenditures incurred were $305.3 million during the year ended December 31, 2017 as compared to $46.0 million during the year ended December 31, 2016. The increase was primarily attributable to additional property and equipment purchased.
Capital expenditures were $46.0 million and $71.7 million during the years ended December 31, 2016 and 2015, respectively.
Our capital expenditures, maintenance costs and other expenses, including labor, proppant and fuel costs have increased commensurately with our organic fleet growth and increase in overall hydraulic fracturing fleet utilization to 100% utilization since September 2016.
Contractual Obligations
The following table presents our contractual obligations and other commitments as of December 31, 2017.
($ in thousands) | Payment Due by Period | ||||||||||||||||||
Total | 1 year or less | 2 - 3 years | 4 - 5 years | More than 5 years | |||||||||||||||
ABL Credit Facility (1) | $ | 55,000 | $ | — | $ | — | $ | 55,000 | $ | — | |||||||||
Equipment financing(2) | 19,287 | 16,980 | 2,307 | — | — | ||||||||||||||
Operating leases(3) | 2,079 | 594 | 710 | 688 | 87 | ||||||||||||||
Total contractual obligations | $ | 76,366 | $ | 17,574 | $ | 3,017 | $ | 55,688 | $ | 87 | |||||||||
____________________
(1) The ABL Credit Facility balance outstanding is exclusive of future commitment fees, interest or other fees since our potential future obligations thereunder are based on future events and cannot be reasonably estimated.
(2) | Equipment financing includes ford credit and hydraulic fracturing fleet financing arrangements. We have included a total estimated interest costs of $1.3 million, based on signed contracts. |
(3) | Operating leases include agreements for various office locations. |
45
Recent Accounting Pronouncements
In May 2014, the Financial Accounting Standards Board (“FASB”) issued Accounting Standards Update (ASU) No. 2014‑09, Revenue from Contracts with Customers (Topic 606). ASU No. 2014‑09 requires entities to recognize revenue to depict transfer of promised goods or services to customers in an amount that reflects the consideration to which the entity expects to be entitled in exchange for those goods or services. ASU No. 2014‑09 requires entities to disclose both qualitative and quantitative information that enables users of the consolidated financial statements to understand the nature, amount, timing, and uncertainty of revenue and cash flows arising from contracts with customers, including disclosure of significant judgments affecting the recognition of revenue. ASU No. 2014‑09 was originally effective for annual periods beginning after December 15, 2016, using either the retrospective or cumulative effect transition method. On August 12, 2015, the FASB issued ASU No. 2015‑14, which defers the effective date of the revenue standard, ASU No. 2014‑09, by one year for all entities and permits early adoption on a limited basis. We have completed our evaluation of ASU No. 2014-09, and the adoption of this guidance will not materially affect our revenue recognition. However, there will be additional disclosures on our consolidated financial statements relating to the adoption of this standard.
In July 2015, the FASB issued ASU No. 2015‑11, Simplifying the Measurement of Inventory, which requires entities to measure most inventory “at the lower of cost and net realizable value,” thereby simplifying the current guidance under which an entity must measure inventory at the lower of cost or market. ASU No. 2015‑11 does not apply to inventories that are measured by using either the last‑in, first‑out method or the retail inventory method. The amendments in ASU No. 2015‑11 are effective for fiscal years beginning after December 15, 2016. The ASU became effective for us in 2017 and the adoption of this guidance did not materially affect our consolidated financial statements.
In February 2016, the FASB issued ASU No. 2016‑02, Leases, a new standard on accounting for leases. The ASU introduces a lessee model that brings most leases on the balance sheet. The new standard also aligns many of the underlying principles of the new lessor model with those in the current accounting guidance as well as the FASB’s new revenue recognition standard. However, the ASU eliminates the use of bright‑line tests in determining lease classification as required in the current guidance. The ASU also requires additional qualitative disclosures along with specific quantitative disclosures to better enable users of financial statements to assess the amount, timing, and uncertainty of cash flows arising from leases. The new standard is effective for annual reporting periods beginning after December 15, 2018, including periods within that reporting period, using a modified retrospective approach. Early adoption is permitted. We have not completed an evaluation of the impact the pronouncement will have on our consolidated financial statements and related disclosures.
In March 2016, the FASB issued ASU No. 2016‑09, Compensation‑ Stock Compensation (Topic 718): Improvements to Employee Share‑Based Payment Accounting, which modifies several aspects of the accounting for share‑based payment transactions including the income tax consequences, classification of awards as either equity or liabilities, and classification on the statement of cash flows. The new standard is effective for fiscal years and interim periods beginning after December 15, 2016, with early adoption permitted. The ASU became effective for us in 2017 and the adoption of this guidance did not materially affect our consolidated financial statements.
In January 2017, the FASB issued ASU No. 2017‑04, Simplifying the Test for Goodwill Impairment, which removes the requirement to compare the implied fair value of goodwill with its carrying amount as part of step two of the goodwill impairment test. As a result, under this ASU, an entity would recognize an impairment charge for the amount by which the carrying amount exceeds the reporting unit’s fair value; however, the loss recognized should not exceed the total amount of goodwill allocated to that reporting unit. This pronouncement is effective for impairment tests in fiscal years beginning after December 15, 2019, on a prospective basis. Early adoption is permitted for interim or annual goodwill impairment tests performed on testing dates after January 1, 2017. We believe that the adoption of this guidance will not materially affect our consolidated financial statements.
46
Critical Accounting Policies and Estimates
The discussion and analysis of our financial condition and results of operations is based on our consolidated financial statements, which have been prepared in accordance with accounting principles generally acceptable in the United States of America. The preparation of these financial statements requires us to make estimates and assumptions that affect the reported amounts of assets and liabilities and the disclosure of contingent assets and liabilities at the dates of the financial statements and the reported revenues and expenses during the years. We evaluate these estimates and assumptions on an ongoing basis and base our estimates on historical experience, current conditions and various other assumptions that we believe to be reasonable under the circumstances. The results of these estimates form the basis for making judgments about the carrying values of assets and liabilities as well as identifying and assessing the accounting treatment with respect to commitments and contingencies. Our actual results may materially differ from these estimates.
Listed below are the accounting policies that we believe are critical to our financial statements due to the degree of uncertainty regarding the estimates or assumptions involved, and that we believe are critical to the understanding of our operations.
Property and Equipment
Our property and equipment are recorded at cost, less accumulated depreciation.
Upon sale or retirement of property and equipment, the cost and related accumulated depreciation are removed from the balance sheet and the net amount, less proceeds from disposal, is recognized as a gain or loss in earnings.
We retired certain components of equipment rather than entire pieces of equipment, which resulted in a net loss on disposal of assets of $39.1 million and $22.5 million and $21.3 million for the years ended December 31, 2017, 2016 and 2015, respectively.
Depreciation of property and equipment is provided on the straight‑line method over estimated useful lives as shown in the table below. The estimated useful lives and salvage values of property and equipment is subject to key assumptions such as maintenance, utilization and job variation. Unanticipated future changes in these assumptions could negatively or positively impact our net income (loss). A 10% change in the useful lives of our property and equipment would have resulted in approximately $5.6 million impact on net income (loss) during the year ended December 31, 2017.
Vehicles | 1-5 years |
Equipment | 1-20 years |
Buildings and improvements | 5-20 years |
Impairment of Long-Lived Assets
In accordance with the Financial Accounting Standards Board Accounting Standards Codification (ASC) 360 regarding Accounting for the Impairment or Disposal of Long‑Lived Assets, we review the long‑lived assets to be held and used whenever events or circumstances indicate that the carrying value of those assets may not be recoverable. An impairment loss is indicated if the sum of the expected future undiscounted cash flows attributable to the assets is less than the carrying amount of such assets. In this circumstance, we recognize an impairment loss for the amount by which the carrying amount of the asset exceeds the estimated fair value of the asset. Our cash flow forecasts require us to make certain judgements regarding long‑term forecasts of future revenue and costs and cash flows related to the assets subject to review. The significant assumption in our cash flow forecasts is our future growth expectations. The significant assumption is uncertain in that it is driven by future demand for our services and utilization which could be impacted by crude oil market prices, future market conditions and technological
47
advancements. Our fair value estimates for certain long‑lived assets require us to use significant other observable inputs among others including significant assumptions related to market approach based on recent auction sales or selling prices of comparable equipment. The estimates of fair value are also subject to significant variability, are sensitive to changes in market conditions, and are reasonably likely to change in the future. No events or changes in circumstances occurred that would indicate an impairment of our property and equipment during the year ended December 31, 2017. We recorded an impairment loss of $6.3 million during the year ended December 31, 2016 related to our drilling asset group, as our cash flow forecasts were negatively impacted with the idling of these rigs during the fourth quarter. The fair value estimate also declined as observable market inputs, such as recent auction sales also decreased. During the year ended December 31, 2015, the impairment expense for drilling and acidizing was $28.6 million and $8.0 million, respectively.
If the crude oil market declines or the demand for vertical drilling does not recover, and if the equipment remains idle or under‑utilized, the estimated fair value of such equipment may decline, which could result in additional impairment charges. Though the impacts of variations in any of these factors can have compounding or off‑setting impacts, a 10% decline in the estimated fair value of our drilling assets at December 31, 2017 would result in additional impairment of $0.7 million, and a 10% decline in the estimated future cash flows for our other asset groups would not indicate an impairment.
Goodwill
Goodwill is the excess of the consideration transferred over the fair value of the tangible and identifiable intangible assets and liabilities recognized. Goodwill is not amortized. We perform an annual impairment test of goodwill as of December 31, or more frequently if circumstances indicate that impairment may exist.
There were no additions to, or disposal of, goodwill during the year ended December 31, 2017. We performed our annual goodwill impairment test in accordance with ASC 350, Intangibles—Goodwill and Other, on December 31, 2017, at which time, we determined that the fair value of our hydraulic fracturing reporting unit was substantially in excess of its carrying value. The hydraulic fracturing operating segment is the only segment which has goodwill at December 31, 2017. During the year ended December 31, 2016, we recorded goodwill impairment charge of $1.2 million relating to our surface drilling reporting unit. No goodwill impairment was recorded in 2015. The quantitative impairment test we perform for goodwill utilizes certain assumptions, including forecasted revenue and cost assumptions. If the crude oil market declines and remains at low levels for a sustained period of time, we could record an impairment of the carrying value of our goodwill in the future. If crude oil prices decline further or remain at low levels, to the extent appropriate we expect to perform our goodwill impairment assessment on a more frequent basis to determine whether an impairment is required. Our discounted cash flow analysis for each reporting unit includes significant assumptions regarding discount rates, revenue growth rates, expected profitability margin, forecasted capital expenditures, the timing of an anticipated market recovery, and the timing of expected cash flow. As such, these analyses incorporate inherent uncertainties that are difficult to predict in volatile economic environments and could result in impairment charges in future periods if actual results materially differ from the estimated assumptions utilized in our forecast.
Income Taxes
Income taxes are accounted for under the asset and liability method, which requires the recognition of deferred tax assets and liabilities for the expected future tax consequences of events that have been included in the consolidated financial statements. Under this method, deferred tax assets and liabilities are determined on the basis of differences between the consolidated financial statements and tax bases of assets and liabilities using enacted tax rates in effect for the year in which the differences are expected to reverse. The effect of a change in tax rates on deferred tax assets and liabilities is recognized in income in the period that includes the enactment date.
We recognize deferred tax assets to the extent that we believe these assets are more likely than not to be realized. In making such a determination, we consider all positive and negative evidence, including future reversals of existing taxable temporary differences, projected future taxable income, and the results of recent operations. If we determine that we would be able to realize our deferred tax assets in the future in excess of their net recorded
48
amount, we would make an adjustment to the deferred tax asset valuation allowance, which would reduce the provision for income taxes. In determining the valuation allowance of $1.2 million as of December 31, 2017, we have considered and made judgments and estimates regarding estimated future taxable income. These estimates and judgments include some degree of uncertainty and changes in these estimates and assumptions could require us to adjust the valuation allowances for our deferred tax assets and the ultimate realization of tax assets depends on the generation of sufficient taxable income.
On December 22, 2017, the U.S. government enacted comprehensive tax legislation commonly referred to as the Tax Cuts and Jobs Act (“Tax Act”). The Tax Act makes broad and complex changes to the U.S. tax code including, but not limited to (1) reducing the U.S. federal corporate tax rate from 35% to 21%, (2) eliminating the corporate alternative minimum tax (AMT) and changing how existing AMT credits can be realized, (3) creating a new limitation on deductible interest expense, (4) changes to bonus depreciation, and (5) changing rules related to use and limitations of net operating loss carryforwards for tax years beginning after December 31, 2017. The only material items that impacted the Company’s consolidated financial statements in 2017 were bonus depreciation and the corporate rate reduction. While the corporate rate reduction is effective January 1, 2018, we accounted for this anticipated rate change during the year ended December 31, 2017, the year of enactment. Consequently, we recorded a $3.4 million decrease to the net deferred tax liability, with a corresponding net adjustment to deferred tax benefit.
Our methodology for recording income taxes requires a significant amount of judgment in the use of assumptions and estimates. Additionally, we forecast certain tax elements, such as future taxable income, as well as evaluate the feasibility of implementing tax planning strategies. Given the inherent uncertainty involved with the use of such variables, there can be significant variation between anticipated and actual results. Unforeseen events may significantly impact these variables, and changes to these variables could have a material impact on our income tax accounts. The final determination of our income tax liabilities involves the interpretation of local tax laws and related authorities in each jurisdiction. Changes in the operating environments, including changes in tax law, could impact the determination of our income tax liabilities for a tax year.
49
Item 7A. Quantitative and Qualitative Disclosure of Market Risks
Market risk is the risk of loss arising from adverse changes in market rates and prices. Historically, our risks have been predominantly related to potential changes in the fair value of our long‑term debt due to fluctuations in applicable market interest rates. Going forward our market risk exposure generally will be limited to those risks that arise in the normal course of business, as we do not engage in speculative, non‑operating transactions, nor do we utilize financial instruments or derivative instruments for trading purposes.
Commodity Price Risk
Our material and fuel purchases expose us to commodity price risk. Our material costs primarily include the cost of inventory consumed while performing our pressure pumping services such as proppants, chemicals, guar, trucking and fluid supplies. Our fuel costs consist primarily of diesel fuel used by our various trucks and other motorized equipment. The prices for fuel and the raw materials in our inventory are volatile and are impacted by changes in supply and demand, as well as market uncertainty and regional shortages. Historically, we have generally been able to pass along price increases to our customers; however, we may be unable to do so in the future. We do not engage in commodity price hedging activities.
Interest Rate Risk
We may be subject to interest rate risk on variable rate debt under our credit facility. The impact of a 1% increase in interest rates on our variable rate debt as of December 31, 2017, 2016 and 2015 would have resulted in an increase in interest expense and corresponding decrease in pre‑tax income of approximately $0.2 million, $2.1 million and $2.3 million, for the years ended December 31, 2017, 2016 and 2015, respectively.
Credit Risk
Financial instruments that potentially subject us to concentrations of credit risk are trade receivables. We extend credit to customers and other parties in the normal course of business. We have established various procedures to manage our credit exposure, including credit evaluations and maintaining an allowance for doubtful accounts.
50
Item 8. Financial Statements and Supplementary Data.
51
REPORT OF INDEPENDENT REGISTERED PUBLIC ACCOUNTING FIRM
To the shareholders and Board of Directors of
ProPetro Holding Corp. and Subsidiary
Opinion on the Financial Statements
We have audited the accompanying consolidated balance sheets of ProPetro Holding Corp. and Subsidiary (the “Company”), as of December 31, 2017 and 2016, the related consolidated statements of income, shareholders’ equity, and cash flows for each of the three years in the period ended December 31, 2017 and the related notes (collectively referred to as the "financial statements"). In our opinion, the financial statements present fairly, in all material respects, the financial position of the Company as of December 31, 2017 and 2016, and the results of its operations and its cash flows for each of the three years in the period ended December 31, 2017, in conformity with accounting principles generally accepted in the United States of America.
Basis for Opinion
These financial statements are the responsibility of the Company's management. Our responsibility is to express an opinion on the Company's financial statements based on our audits. We are a public accounting firm registered with the Public Company Accounting Oversight Board (United States) (PCAOB) and are required to be independent with respect to the Company in accordance with the U.S. federal securities laws and the applicable rules and regulations of the Securities and Exchange Commission and the PCAOB.
We conducted our audits in accordance with the standards of the PCAOB. Those standards require that we plan and perform the audit to obtain reasonable assurance about whether the financial statements are free of material misstatement, whether due to error or fraud. The Company is not required to have, nor were we engaged to perform, an audit of its internal control over financial reporting. As part of our audits, we are required to obtain an understanding of internal control over financial reporting but not for the purpose of expressing an opinion on the effectiveness of the Company’s internal control over financial reporting. Accordingly, we express no such opinion.
Our audits included performing procedures to assess the risks of material misstatement of the financial statements, whether due to error or fraud, and performing procedures that respond to those risks. Such procedures included examining, on a test basis, evidence regarding the amounts and disclosures in the financial statements. Our audits also included evaluating the accounting principles used and significant estimates made by management, as well as evaluating the overall presentation of the financial statements. We believe that our audits provide a reasonable basis for our opinion.
/s/ DELOITTE & TOUCHE LLP
Houston, Texas
March 27, 2018
We have served as the Company's auditor since 2013.
52
PROPETRO HOLDING CORP. AND SUBSIDIARY
CONSOLIDATED BALANCE SHEETS
AS OF DECEMBER 31, 2017 AND 2016 (In thousands, except share data)
CONSOLIDATED BALANCE SHEETS
AS OF DECEMBER 31, 2017 AND 2016 (In thousands, except share data)
2017 | 2016 | ||||||
ASSETS | |||||||
CURRENT ASSETS: | |||||||
Cash and cash equivalents | $ | 23,949 | $ | 133,596 | |||
Accounts receivable - net of allowance for doubtful accounts of $443 and $552, respectively | 199,656 | 115,179 | |||||
Inventories | 6,184 | 4,713 | |||||
Prepaid expenses | 5,123 | 4,608 | |||||
Other current assets | 748 | 6,684 | |||||
Total current assets | 235,660 | 264,780 | |||||
PROPERTY AND EQUIPMENT - Net of accumulated depreciation | 470,910 | 263,862 | |||||
OTHER NONCURRENT ASSETS: | |||||||
Goodwill | 9,425 | 9,425 | |||||
Intangible assets - net of amortization | 301 | 589 | |||||
Deferred revenue rebate - net of amortization | 615 | 2,462 | |||||
Other noncurrent assets | 2,121 | 304 | |||||
Total other noncurrent assets | 12,462 | 12,780 | |||||
TOTAL ASSETS | $ | 719,032 | $ | 541,422 | |||
LIABILITIES AND SHAREHOLDERS’ EQUITY | |||||||
CURRENT LIABILITIES: | |||||||
Accounts payable | $ | 211,149 | $ | 129,093 | |||
Accrued liabilities | 16,607 | 13,619 | |||||
Current portion of long-term debt | 15,764 | 16,920 | |||||
Accrued interest payable | 76 | 109 | |||||
Total current liabilities | 243,596 | 159,741 | |||||
DEFERRED INCOME TAXES | 4,881 | 1,148 | |||||
LONG-TERM DEBT | 57,178 | 159,407 | |||||
OTHER LONG-TERM LIABILITIES | 125 | 117 | |||||
Total liabilities | 305,780 | 320,413 | |||||
COMMITMENTS AND CONTINGENCIES (Note 17) | |||||||
SHAREHOLDERS’ EQUITY: | |||||||
Preferred stock, $0.001 par value, 30,000,000 shares authorized, 0 and 16,999,990 shares issued, respectively | — | 17 | |||||
Preferred stock, additional paid-in capital | — | 162,494 | |||||
Common stock, $0.001 par value, 200,000,000 shares authorized, 83,039,854 and 52,627,652 shares issued, respectively | 83 | 53 | |||||
Additional paid-in capital | 607,466 | 265,355 | |||||
Accumulated deficit | (194,297 | ) | (206,910 | ) | |||
Total shareholders’ equity | 413,252 | 221,009 | |||||
TOTAL LIABILITIES AND SHAREHOLDERS’ EQUITY | $ | 719,032 | $ | 541,422 | |||
See notes to consolidated financial statements. 53
PROPETRO HOLDING CORP. AND SUBSIDIARY
CONSOLIDATED STATEMENTS OF OPERATIONS
FOR THE YEARS ENDED DECEMBER 31, 2017, 2016 AND 2015
CONSOLIDATED STATEMENTS OF OPERATIONS
FOR THE YEARS ENDED DECEMBER 31, 2017, 2016 AND 2015
(In thousands, except per share data)
2017 | 2016 | 2015 | |||||||||
REVENUE - Service revenue | $ | 981,865 | $ | 436,920 | $ | 569,618 | |||||
COSTS AND EXPENSES: | |||||||||||
Cost of services (exclusive of depreciation and amortization) | 813,823 | 404,140 | 483,338 | ||||||||
General and administrative (inclusive of stock‑based compensation) | 49,215 | 26,613 | 27,370 | ||||||||
Depreciation and amortization | 55,628 | 43,542 | 50,134 | ||||||||
Property and equipment impairment expense | — | 6,305 | 36,609 | ||||||||
Goodwill impairment expense | — | 1,177 | — | ||||||||
Loss on disposal of assets | 39,086 | 22,529 | 21,268 | ||||||||
Total costs and expenses | 957,752 | 504,306 | 618,719 | ||||||||
OPERATING INCOME (LOSS) | 24,113 | (67,386 | ) | (49,101 | ) | ||||||
OTHER INCOME (EXPENSE): | |||||||||||
Interest expense | (7,347 | ) | (20,387 | ) | (21,641 | ) | |||||
Gain on extinguishment of debt | — | 6,975 | — | ||||||||
Other expense | (1,025 | ) | (321 | ) | (499 | ) | |||||
Total other income (expense) | (8,372 | ) | (13,733 | ) | (22,140 | ) | |||||
INCOME (LOSS) BEFORE INCOME TAXES | 15,741 | (81,119 | ) | (71,241 | ) | ||||||
INCOME TAX (EXPENSE)/BENEFIT | (3,128 | ) | 27,972 | 25,388 | |||||||
NET INCOME (LOSS) | $ | 12,613 | $ | (53,147 | ) | $ | (45,853 | ) | |||
NET INCOME (LOSS) PER COMMON SHARE: | |||||||||||
Basic | $ | 0.17 | $ | (1.19 | ) | $ | (1.31 | ) | |||
Diluted | $ | 0.16 | $ | (1.19 | ) | $ | (1.31 | ) | |||
WEIGHTED AVERAGE COMMON SHARES OUTSTANDING: | |||||||||||
Basic | 76,371 | 44,787 | 34,993 | ||||||||
Diluted | 79,583 | 44,787 | 34,993 | ||||||||
See notes to consolidated financial statements. 54
PROPETRO HOLDING CORP. AND SUBSIDIARY
CONSOLIDATED STATEMENTS OF SHAREHOLDERS’ EQUITY
FOR THE YEARS ENDED DECEMBER 31, 2017, 2016 AND 2015 (In thousands)
CONSOLIDATED STATEMENTS OF SHAREHOLDERS’ EQUITY
FOR THE YEARS ENDED DECEMBER 31, 2017, 2016 AND 2015 (In thousands)
Preferred Stock | Common Stock | ||||||||||||||||||||||||||||
Shares | Amount | Preferred Additional Paid‑In Capital | Shares | Amount | Additional Paid‑In Capital | Accumulated Deficit | Total | ||||||||||||||||||||||
BALANCE - January 1, 2015 | — | $ | — | $ | — | 34,621 | $ | 35 | $ | 222,060 | $ | (107,910 | ) | $ | 114,185 | ||||||||||||||
Stock‑based compensation cost | — | — | — | — | — | 1,239 | — | 1,239 | |||||||||||||||||||||
Net loss | — | — | — | — | — | — | (45,853 | ) | (45,853 | ) | |||||||||||||||||||
BALANCE - December 31, 2015 | — | — | — | 34,621 | 35 | 223,299 | (153,763 | ) | 69,571 | ||||||||||||||||||||
Stock‑based compensation cost | — | — | — | — | — | 1,649 | — | 1,649 | |||||||||||||||||||||
Additional equity capitalization, net of costs | — | — | — | 18,007 | 18 | 40,407 | — | 40,425 | |||||||||||||||||||||
Preferred equity capitalization, net of costs | 17,000 | 17 | 162,494 | — | — | — | — | 162,511 | |||||||||||||||||||||
Net loss | — | — | — | — | — | — | (53,147 | ) | (53,147 | ) | |||||||||||||||||||
BALANCE - December 31, 2016 | 17,000 | 17 | 162,494 | 52,628 | 53 | 265,355 | (206,910 | ) | 221,009 | ||||||||||||||||||||
Stock‑based compensation cost | — | — | — | — | — | 9,489 | — | 9,489 | |||||||||||||||||||||
Initial Public Offering, net of costs | — | — | — | 13,250 | 13 | 170,128 | — | 170,141 | |||||||||||||||||||||
Conversion of preferred stock to common stock at Initial Public Offering | (17,000 | ) | (17 | ) | (162,494 | ) | 17,000 | 17 | 162,494 | — | — | ||||||||||||||||||
Exercise of stock options—net | — | — | — | 162 | — | — | — | — | |||||||||||||||||||||
Net income | — | — | — | — | — | — | 12,613 | 12,613 | |||||||||||||||||||||
BALANCE - December 31, 2017 | — | $ | — | $ | — | 83,040 | $ | 83 | $ | 607,466 | $ | (194,297 | ) | $ | 413,252 | ||||||||||||||
See notes to consolidated financial statements. 55
PROPETRO HOLDING CORP. AND SUBSIDIARY
CONSOLIDATED STATEMENTS OF CASH FLOWS
FOR THE YEARS ENDED DECEMBER 31, 2017, 2016 AND 2015 (In thousands)
CONSOLIDATED STATEMENTS OF CASH FLOWS
FOR THE YEARS ENDED DECEMBER 31, 2017, 2016 AND 2015 (In thousands)
2017 | 2016 | 2015 | |||||||||
CASH FLOWS FROM OPERATING ACTIVITIES: | |||||||||||
Net income (loss) | $ | 12,613 | $ | (53,147 | ) | $ | (45,853 | ) | |||
Adjustments to reconcile net income (loss) to net cash provided by operating activities: | |||||||||||
Depreciation and amortization | 55,628 | 43,542 | 50,134 | ||||||||
Gain on extinguishment of debt | — | (6,975 | ) | — | |||||||
Property and equipment impairment expense | — | 6,305 | 36,609 | ||||||||
Goodwill impairment expense | — | 1,177 | — | ||||||||
Deferred income tax expense (benefit) | 3,430 | (27,972 | ) | (23,945 | ) | ||||||
Amortization of deferred revenue rebate | 1,846 | 1,846 | 1,846 | ||||||||
Amortization of deferred debt issuance costs | 3,403 | 2,091 | 1,351 | ||||||||
Stock‑based compensation | 9,489 | 1,649 | 1,239 | ||||||||
Loss on disposal of assets | 39,086 | 22,529 | 21,268 | ||||||||
(Gain) loss on interest rate swap | (251 | ) | (205 | ) | 260 | ||||||
Changes in operating assets and liabilities: | |||||||||||
Accounts receivable | (84,477 | ) | (24,888 | ) | 67,348 | ||||||
Other current assets | 3,304 | (563 | ) | 9 | |||||||
Inventories | (1,472 | ) | 3,859 | (622 | ) | ||||||
Prepaid expenses | (468 | ) | (62 | ) | 2,082 | ||||||
Accounts payable | 64,228 | 37,049 | (23,889 | ) | |||||||
Accrued liabilities | 2,930 | 4,392 | (6,295 | ) | |||||||
Accrued interest | (32 | ) | 32 | (312 | ) | ||||||
Net cash provided by operating activities | 109,257 | 10,659 | 81,230 | ||||||||
CASH FLOWS FROM INVESTING ACTIVITIES: | |||||||||||
Capital expenditures | (285,891 | ) | (42,832 | ) | (62,855 | ) | |||||
Proceeds from sale of assets | 4,422 | 1,144 | 79 | ||||||||
Net cash used in investing activities | (281,469 | ) | (41,688 | ) | (62,776 | ) | |||||
CASH FLOWS FROM FINANCING ACTIVITIES: | |||||||||||
Proceeds from borrowings | 60,045 | — | 60,718 | ||||||||
Repayments of borrowings | (166,546 | ) | (41,295 | ) | (73,782 | ) | |||||
Proceeds from insurance financing | 4,125 | 4,126 | 4,105 | ||||||||
Repayments of insurance financing | (3,807 | ) | (4,527 | ) | (6,257 | ) | |||||
Extinguishment of debt | — | (30,000 | ) | — | |||||||
Payment of debt extinguishment costs | — | (525 | ) | — | |||||||
Payment of debt issuance costs | (1,653 | ) | (140 | ) | — | ||||||
Proceeds from additional common equity capitalization | — | 40,425 | — | ||||||||
Proceeds from preferred equity capitalization | — | 170,000 | — | ||||||||
Payment of preferred equity capitalization costs | — | (7,489 | ) | — | |||||||
Proceeds from IPO | 185,500 | — | — | ||||||||
Payment of deferred IPO costs | (15,099 | ) | (260 | ) | — | ||||||
Net cash provided by (used in) financing activities | 62,565 | 130,315 | (15,216 | ) | |||||||
NET (DECREASE) INCREASE IN CASH AND CASH EQUIVALENTS | (109,647 | ) | 99,286 | 3,238 | |||||||
CASH AND CASH EQUIVALENTS — Beginning of year | 133,596 | 34,310 | 31,072 | ||||||||
CASH AND CASH EQUIVALENTS — End of year | $ | 23,949 | $ | 133,596 | $ | 34,310 | |||||
See notes to consolidated financial statements. 56
PROPETRO HOLDING CORP. AND SUBSIDIARY
NOTES TO CONSOLIDATED FINANCIAL STATEMENTS AS OF AND FOR THE YEARS ENDED
DECEMBER 31, 2017, 2016 AND 2015
1. ORGANIZATION AND HISTORY
ProPetro Holding Corp. (“Holding”), a Texas corporation was formed on April 14, 2007, to serve as a holding company for its wholly owned subsidiary ProPetro Services, Inc. (“Services”), a Texas corporation. Services provide hydraulic fracturing (inclusive of acidizing), cementing, coil tubing, drilling, surface drilling and flowback services to oil and gas producers, located primarily in Texas, Oklahoma, New Mexico, Utah, Colorado, and Wyoming. Holding was converted and incorporated to a Delaware Corporation on March 8, 2017.
On March 4, 2013, a majority interest in the Company was purchased by Energy Capital Partners (“ECP”), an energy‑focused private equity firm (see Note 18).
On December 22, 2016, the Company restated and amended the Company’s Shareholders Agreement and certificate of formation in the state of Texas, approving a reverse stock split, such that each holder of common stock of the Company shall receive one share of common stock for every 170.4667 shares of previous common stock held. In conjunction, the Company amended the amount of authorized shares to 230,000,000, of which 200,000,000 are common and 30,000,000 are preferred.
On March 22, 2017, we consummated our initial public offering (“IPO”) in which 25,000,000 shares of our common stock, par value $0.001 per share, were sold at a public offering price of $14.00 per share, with 13,250,000 shares issued and sold by the Company and 11,750,000 shares sold by existing stockholders. We received net proceeds of approximately $170.1 million after deducting $10.9 million of underwriting discounts and commissions, and $4.5 million of other offering expenses. At closing, we used the proceeds (i) to repay $71.8 million in outstanding borrowings under the term loan, (ii) $86.8 million to fund the purchase of additional hydraulic fracturing units and other equipment, and (iii) the remaining for general corporate purposes. In connection with the IPO, the Company executed a stock split, such that each holder of common stock of the Company received 1.45 shares of common stock for every one share of previous common stock, and all 16,999,990 shares of our outstanding Series A preferred stock converted to common stock on a 1:1 basis.
Accordingly, any information related to or dependent upon the share or option counts in the 2017, 2016 and 2015 consolidated financial statements and Note 13 Net Income (loss) Per Share, Note 14 Stock‑Based Compensation, Note 18 Equity Capitalization and Note 19 Quarterly Financial Data (Unaudited) have been updated to reflect the effect of the reverse stock split in December 2016 and the stock split in March 2017.
Holding and Services are collectively referred to as the “Company” in the accompanying consolidated financial statements.
2. SIGNIFICANT ACCOUNTING POLICIES
A summary of the significant accounting policies consistently applied in the preparation of the accompanying consolidated financial statements are as follows:
Principles of Consolidation — The accompanying consolidated financial statements include the accounts of Holding and its wholly owned subsidiary, Services. All intercompany accounts and transactions have been eliminated in consolidation.
Basis of Presentation — The accompanying consolidated financial statements and related notes have been prepared pursuant to the rules and regulations of the Securities Exchange Commission (SEC) and in conformity with accounting principles generally accepted in the United States of America (“U.S. GAAP”).
Use of Estimates — Management is required to make estimates and assumptions that affect the reported amounts of assets and liabilities and the disclosure of contingent assets and liabilities at the date of the consolidated financial statements and revenues and expenses during the reporting period. Such estimates include, but are not
57
PROPETRO HOLDING CORP. AND SUBSIDIARY
NOTES TO CONSOLIDATED FINANCIAL STATEMENTS AS OF AND FOR THE YEARS ENDED
DECEMBER 31, 2017, 2016 AND 2015
2. SIGNIFICANT ACCOUNTING POLICIES (Continued)
limited to, allowance for doubtful accounts, depreciation of property and equipment, estimates of fair value of property and equipment, estimates related to fair value of reporting units for purposes of assessing goodwill, estimates related to deferred tax assets and liabilities, including any related valuation allowances, and estimates of fair value of stock‑based compensation. Actual results could differ from those estimates.
Revenue Recognition — The Company’s services are sold based upon contracts or other agreements with the customer that include fixed or determinable prices and do not include other post‑delivery obligations. Revenue for services is recognized as the services are rendered and when collectability is reasonably assured. Rates for services are typically determined per the contract or agreement with customers.
Pressure Pumping — Pressure pumping consists of downhole pumping services including hydraulic fracturing (inclusive of acidizing services) and cementing. The Company recognizes revenues when services are performed, collection of the receivables is probable, and a price is fixed or determinable. The Company prices services for its pressure pumping by the job, project or day depending on the type of service performed and request from the customer.
Drilling Services — Drilling services consists of surface air drilling and drilling, whereby we drill a well for a customer to a certain depth using a drilling rig and related equipment. The Company recognizes revenues either on a “turnkey” contract basis, in which a fixed and set price for the job is determinable, on a “daywork” contract basis, in which a stated rate per day is fixed and determinable, or on a “footage” contract basis, in which a rate per feet drilled is fixed and determinable.
Other Completion & Production Services — Other completion & production services consists of coil tubing and flowback services whereby the Company recognizes revenues when services are performed either on a per job or per day or hourly rate, collections of receivables are probable, and a price is fixed or determinable.
Cash and Cash Equivalents — The Company considers highly liquid investments with initial maturities of three months or less to be cash equivalents.
Accounts Receivable — Accounts receivables are stated at the amount billed and billable to customers. The Company’s allowance for doubtful accounts is based on management’s evaluations of the collectability of each accounts receivable based on the customer’s payment history and general economic conditions. At December 31, 2017, 2016 and 2015, the allowance for doubtful accounts was $0.4 million, $0.6 million and $0.8 million, respectively.
Inventories — Inventories, which consists only of raw materials, are stated at lower of average cost or net realizable value.
Property and Equipment — The Company’s property and equipment are recorded at cost, less accumulated depreciation.
Upon sale or retirement of property and equipment, the cost and related accumulated depreciation are removed from the balance sheet and the net amount, less proceeds from disposal, is recognized as a gain or loss in the statement of operations.
The Company recorded a loss on disposal of assets of $39.1 million, $22.5 million and $21.3 million for the years ended December 31, 2017, 2016 and 2015, respectively. The recorded loss on disposal is primarily attributed to the increased service intensity of pressure pumping activity which has resulted in a shorter useful life and faster replacement of certain components of the pressure pumping equipment.
58
PROPETRO HOLDING CORP. AND SUBSIDIARY
NOTES TO CONSOLIDATED FINANCIAL STATEMENTS AS OF AND FOR THE YEARS ENDED
DECEMBER 31, 2017, 2016 AND 2015
2. SIGNIFICANT ACCOUNTING POLICIES (Continued)
Depreciation — Depreciation of property and equipment is provided on the straight‑line method over the following estimated useful lives:
Vehicles | 1 ‑ 5 years |
Equipment | 1 ‑ 20 years |
Leasehold improvements | 5 ‑ 20 years |
Impairment of Long‑Lived Assets — In accordance with Financial Accounting Standards Board (FASB) Accounting Standards Codification (ASC) 360, Accounting for the Impairment or Disposal of Long‑Lived Assets, the Company reviews its long‑lived assets to be held and used whenever events or circumstances indicate that the carrying value of those assets may not be recoverable.
An impairment loss is indicated if the sum of the expected future undiscounted cash flows attributable to the asset group is less than the carrying amount of such asset group. In this circumstance, the Company recognizes an impairment loss for the amount by which the carrying amount of the asset group exceeds the fair value of the asset group. No impairment was recorded in 2017. The impairment recorded in 2016 was $6.3 million for property and equipment relating to the drilling asset group. The impairment recorded in 2015 was $36.6 million for property and equipment relating to the drilling and acidizing asset groups.
The Company accounts for long‑lived assets to be disposed of at the lower of their carrying amount or fair value, less cost to sell once management has committed to a plan to dispose of the assets.
Goodwill — Goodwill is the excess of the consideration transferred over the fair value of the tangible and identifiable intangible assets and liabilities recognized. Goodwill is not amortized. We perform an annual impairment test of goodwill as of December 31, or more frequently if circumstances indicate that impairment may exist. The determination of impairment is made by comparing the carrying amount of a reporting unit with its fair value, which is generally calculated using a combination of market and income approaches. If the fair value of the reporting unit exceeds the carrying value, no further testing is performed. If the fair value of the reporting unit is less than the carrying value, we consider goodwill to be impaired, and the amount of impairment loss is estimated and recorded in the statement of operations.
In 2014, we acquired Blackrock Drilling, Inc. (“Blackrock”) for $1.8 million. The assets acquired from Blackrock were recorded as $0.6 million of equipment with the excess of the purchase price over the fair value of the assets recorded as goodwill of $1.2 million. The acquisition complemented our existing drilling operations. The transaction has been accounted for using the acquisition method of accounting and, accordingly, assets and liabilities assumed were recorded at their fair values as of the acquisition date. Based on our goodwill impairment test as of December 31, 2016, the Company concluded that there was an impairment of goodwill of $1.2 million related to the Blackrock acquisition. Accordingly, a $1.2 million impairment expense was recorded during the year ended December 31, 2016, to fully write-down the goodwill related to Blackrock. Prior to the impairment write‑down, the goodwill related to the Blackrock acquisition of $1.2 million was recorded in the all other reportable segment. No impairment of Blackrock goodwill was recorded during the year ended December 31, 2015.
In 2011, we acquired Technology Stimulation Services, LLC (“TSS”) for $24.4 million. The assets acquired from TSS were recorded as $15 million of equipment with the excess of the purchase price over fair value of the assets recorded as goodwill of $9.4 million. The acquisition complemented our existing pressure pumping business. The transaction has been accounted for using the acquisition method of accounting and, accordingly, assets and liabilities assumed were recorded at their fair values as of the acquisition date. Based on our goodwill impairment tests as of December 31, 2017, 2016 and 2015, we concluded that the goodwill related to TSS acquisition was determined not to be impaired. The goodwill related to the TSS acquisition of $9.4 million is recorded in the pressure pumping reportable segment.
59
PROPETRO HOLDING CORP. AND SUBSIDIARY
NOTES TO CONSOLIDATED FINANCIAL STATEMENTS AS OF AND FOR THE YEARS ENDED
DECEMBER 31, 2017, 2016 AND 2015
2. SIGNIFICANT ACCOUNTING POLICIES (Continued)
Intangible Assets — Intangible assets with finite useful lives are amortized on a basis that reflects the pattern in which the economic benefits of the intangible assets are realized, which is generally on a straight‑line basis over the asset’s estimated useful life.
Income Taxes — Income taxes are accounted for under the asset and liability method, which requires the recognition of deferred tax assets and liabilities for the expected future tax consequences of events that have been included in the consolidated financial statements. Under this method, deferred tax assets and liabilities are determined on the basis of differences between the consolidated financial statements and tax bases of assets and liabilities using enacted tax rates in effect for the year in which the differences are expected to reverse. The effect of a change in tax rates on deferred tax assets and liabilities is recognized in income in the period that includes the enactment date.
We recognize deferred tax assets to the extent that we believe these assets are more likely than not to be realized. In making such a determination, we consider all positive and negative evidences, including future reversals of existing taxable temporary differences, projected future taxable income, and the results of recent operations. If we determine that we would be able to realize our deferred tax assets in the future in excess of their net recorded amount, we would make an adjustment to the deferred tax asset valuation allowance, which would reduce the provision for income taxes.
Advertising Expense — All advertising costs are expensed as incurred. For the years ended December 31, 2017, 2016 and 2015, advertising expense was $0.8 million, $0.4 million and $0.9 million, respectively.
Deferred Loan Costs — The Company capitalized certain costs in connection with obtaining its borrowings, including lender, legal, and accounting fees. These costs are being amortized over the term of the related loan using the straight‑line method (which approximates the interest method). Deferred loan costs amortization is included in interest expense. Unamortized deferred loan costs associated with loans paid off or refinanced with different lenders are charged off in the period in which such an event occurs. Deferred loan costs are classified as a reduction of long‑term debt or in certain instance as an asset in the consolidated balance sheet. Amortization of deferred loan costs is recorded as interest expense in the statement of operations, and during the years ended December 31, 2017, 2016 and 2015, the amount of expense recorded was $3.4 million, $2.1 million and $1.4 million, respectively.
Stock-Based Compensation — The Company recognizes the cost of stock‑based awards on a straight‑line basis over the requisite service period of the award, which is usually the vesting period under the fair value method. Total compensation cost is measured on the grant date using fair value estimates.
Insurance Financing — The Company annually renews their commercial insurance policies and records a prepaid insurance asset and amortizes it monthly over the coverage period. The Company may choose to finance a portion of the premiums and will make repayments monthly over ten months in equal installments.
Concentration of Credit Risk — The Company’s assets that are potentially subject to concentrations of credit risk are cash and cash equivalents and trade accounts receivable. Cash balances are maintained in financial institutions, which at times exceed federally insured limits. The Company monitors the financial condition of the financial institutions in which accounts are maintained and has not experienced any losses in such accounts. The receivables of the Company are spread over a number of customers, a majority of which are credible operators and suppliers to the oil and natural gas industries. The Company performs ongoing credit evaluations as to the financial condition of its customers with respect to trade receivables.
In May 2014, the Financial Accounting Standards Board ("FASB") issued Accounting Standards Update (ASU) No. 2014-09, Revenue from Contracts with Customers (Topic 606). ASU No. 2014-09 requires entities to recognize revenue to depict transfer of promised goods or services to customers in an amount that reflects the consideration to which the entity expects to be entitled in exchange for those goods or services. ASU No. 2014-09 requires entities to disclose both qualitative and quantitative information that enables users of the consolidated
60
PROPETRO HOLDING CORP. AND SUBSIDIARY
NOTES TO CONSOLIDATED FINANCIAL STATEMENTS AS OF AND FOR THE YEARS ENDED
DECEMBER 31, 2017, 2016 AND 2015
2. SIGNIFICANT ACCOUNTING POLICIES (Continued)
financial statements to understand the nature, amount, timing, and uncertainty of revenue and cash flows arising from contracts with customers, including disclosure of significant judgments affecting the recognition of revenue. ASU No. 2014-09 was originally effective for annual periods beginning after December 15, 2016, using either the retrospective or cumulative effect transition method. On August 12, 2015, the FASB issued ASU No. 2015-14, which defers the effective date of the revenue standard, ASU No. 2014-09, by one year for all entities and permits early adoption on a limited basis. We have completed our evaluation of ASU No. 2014-09, and the adoption of this guidance will not materially affect our revenue recognition. However, there will be additional disclosures on our consolidated financial statements relating to the adoption of this standard.
In July 2015, the FASB issued ASU No. 2015-11, Simplifying the Measurement of Inventory, which requires entities to measure most inventory "at the lower of cost and net realizable value," thereby simplifying the current guidance under which an entity must measure inventory at the lower of cost or market. ASU No. 2015-11 does not apply to inventories that are measured by using either the last-in, first-out method or the retail inventory method. The amendments in ASU No. 2015-11 are effective for fiscal years beginning after December 15, 2016. The ASU became effective for us in 2017 and the adoption of this guidance did not materially affect our consolidated financial statements.
In February 2016, the FASB issued ASU No. 2016-02, Leases, a new standard on accounting for leases. The ASU introduces a lessee model that brings most leases on the balance sheet. The new standard also aligns many of the underlying principles of the new lessor model with those in the current accounting guidance as well as the FASB’s new revenue recognition standard. However, the ASU eliminates the use of bright-line tests in determining lease classification as required in the current guidance. The ASU also requires additional qualitative disclosures along with specific quantitative disclosures to better enable users of financial statements to assess the amount, timing, and uncertainty of cash flows arising from leases. The new standard is effective for annual reporting periods beginning after December 15, 2018, including periods within that reporting period, using a modified retrospective approach. Early adoption is permitted. We have not completed an evaluation of the impact the pronouncement will have on our consolidated financial statements and related disclosures.
In March 2016, the FASB issued ASU No. 2016-09, Compensation- Stock Compensation (Topic 718): Improvements to Employee Share-Based Payment Accounting, which modifies several aspects of the accounting for share-based payment transactions including the income tax consequences, classification of awards as either equity or liabilities, and classification on the statement of cash flows. The new standard is effective for fiscal years and interim periods beginning after December 15, 2016, with early adoption permitted. The ASU became effective for us in 2017 and the adoption of this guidance did not materially affect our consolidated financial statements.
In January 2017, the FASB issued ASU No. 2017-04, Simplifying the Test for Goodwill Impairment, which removes the requirement to compare the implied fair value of goodwill with its carrying amount as part of step two of the goodwill impairment test. As a result, under this ASU, an entity would recognize an impairment charge for the amount by which the carrying amount exceeds the reporting unit's fair value; however, the loss recognized should not exceed the total amount of goodwill allocated to that reporting unit. This pronouncement is effective for impairment tests in fiscal years beginning after December 15, 2019, on a prospective basis. Early adoption is permitted for interim or annual goodwill impairment tests performed on testing dates after January 1, 2017. We believe that the adoption of this guidance will not materially affect our consolidated financial statements.
61
PROPETRO HOLDING CORP. AND SUBSIDIARY
NOTES TO CONSOLIDATED FINANCIAL STATEMENTS AS OF AND FOR THE YEARS ENDED
DECEMBER 31, 2017, 2016 AND 2015
3. SUPPLEMENTAL CASH FLOWS INFORMATION
December 31, | |||||||||||
($ in thousands) | 2017 | 2016 | 2015 | ||||||||
Supplemental cash flows disclosures | |||||||||||
Interest paid | $ | 3,966 | $ | 18,249 | $ | 20,531 | |||||
Income taxes paid | $ | — | $ | 3 | $ | 1,295 | |||||
Supplemental disclosure of non‑cash activities | |||||||||||
Capital expenditures included in accounts payable | $ | 33,850 | $ | 3,176 | $ | 8,821 | |||||
Conversion of preferred stock to common stock at Initial Public Offering | $ | 162,511 | $ | — | $ | — | |||||
4. FAIR VALUE MEASUREMENTS
Fair value is defined as the price that would be received to sell an asset or paid to transfer a liability (i.e., the “exit price”) in an orderly transaction between market participants at the measurement date.
In determining fair value, the Company uses various valuation approaches and establishes a hierarchy for inputs used in measuring fair value that maximizes the use of relevant observable inputs and minimizes the use of unobservable inputs by requiring that the most observable inputs be used, when available. Observable inputs are inputs that market participants would use in pricing the asset or liability developed based on market data obtained from sources independent of the Company. Unobservable inputs are inputs that reflect the Company’s assumptions about the assumptions other market participants would use in pricing the asset or liability developed based on the best information available in the circumstances. The hierarchy is broken down into three levels based on the observability of inputs as follows:
Level 1 — Valuations based on quoted prices in active markets for identical assets or liabilities that the Company has the ability to access. Valuation adjustments and block discounts are not applied to Level 1 instruments. Since valuations are based on quoted prices that are readily and regularly available in an active market, valuation of these instruments does not entail a significant degree of judgment.
Level 2 — Valuations based on one or more quoted prices in markets that are not active or for which all significant inputs are observable, either directly or indirectly.
Level 3 — Valuations based on inputs that are unobservable and significant to the overall fair value measurement.
A financial instrument’s categorization within the valuation hierarchy is based upon the lowest level of input that is significant to the fair value measurement. The Company’s assessment of the significance of a particular input to the fair value measurement in its entirety requires judgment and considers factors specific to the asset or liability.
Assets and Liabilities Measured at Fair Value on a Recurring Basis
Our financial instruments include cash and cash equivalents, accounts receivables, accounts payable, and a derivative financial instrument. The estimated fair value of our financial instruments — cash and cash equivalent, accounts receivable and accounts payable at December 31, 2017, 2016 and 2015 approximates their carrying value as reflected in our consolidated balance sheets because of their short‑term nature. We use a derivative financial instrument, an interest rate swap, to manage interest rate risk. Our policies do not permit the use of derivative financial instruments for speculative purposes. We did not designate the interest rate swap as a hedge for accounting
62
PROPETRO HOLDING CORP. AND SUBSIDIARY
NOTES TO CONSOLIDATED FINANCIAL STATEMENTS AS OF AND FOR THE YEARS ENDED
DECEMBER 31, 2017, 2016 AND 2015
4. FAIR VALUE MEASUREMENTS (Continued)
purposes. We record all derivatives as of the end of our reporting period in our consolidated balance sheet at fair value, which is based on quoted market prices, which represents a level 1 in the fair value measurement hierarchy. We may be exposed to credit losses in the event of nonperformance by counterparties to the interest rate swap. The counterparty of the interest rate swap is a lender under our term loan and a credible, large institution, and the Company does not believe there is significant or material credit risk upon settling the contract. The fair value of the interest rate swap liability at December 31, 2017, 2016 and 2015 was $0, $0.3 million and $0.5 million, respectively. Based on quoted market prices as of December 31, 2017, 2016 and 2015, for contracts with similar terms and maturity date, as provided by the counterparty, we recorded a gain of $0.3 million, $0.2 million and a loss of $0.3 million, respectively.
Assets Measured at Fair Value on a Nonrecurring Basis
Assets measured at fair value on a nonrecurring basis at December 31, 2017 and 2016, respectively, are set forth below:
Estimated fair value measurements | |||||||||||||||||||
Balance | Quoted prices in active market (Level 1) | Significant other observable inputs (Level 2) | Significant other unobservable inputs (Level 3) | Total gains (losses) | |||||||||||||||
($ in thousands): | |||||||||||||||||||
2017: | |||||||||||||||||||
Property and equipment, net | $ | — | $ | — | $ | — | $ | — | $ | — | |||||||||
Goodwill | $ | — | $ | — | $ | — | $ | — | $ | — | |||||||||
2016: | |||||||||||||||||||
Property and equipment, net | $ | 8,700 | $ | — | $ | 8,700 | $ | — | $ | (6,305 | ) | ||||||||
Goodwill | $ | 9,425 | $ | — | $ | — | $ | 9,425 | $ | (1,177 | ) | ||||||||
No impairment was recorded for our property and equipment during the year ended December 31, 2017. In 2016, the depressed cash flows and continued decline in utilization of our drilling assets were indicative of potential impairment, resulting in the Company comparing the carrying value of the drilling assets with its estimated fair value. We determined that the carrying value of the drilling assets was greater than its estimated fair value and accordingly, an impairment expense was recorded. In 2016, the non‑cash asset impairment charges for drilling was $6.3 million, which had a net carrying value of $15.0 million prior to the impairment write‑down. In 2015, the non‑cash asset impairment charges for drilling and acidizing was $28.6 million and $8 million, respectively, aggregating to a total of $36.6 million. In 2015, the drilling and acidizing assets groups had a net carrying value of $48.1 million and $15.6 million prior to the impairment write‑down. See Note 7, “Impairment of Long‑Lived Assets.”
We generally apply fair value techniques to our reporting units on a nonrecurring basis associated with valuing potential impairment loss related to goodwill. Our estimate of the reporting unit fair value is based on a combination of income and market approaches, Level 1 and 3, respectively, in the fair value hierarchy. The income approach involves the use of a discounted cash flow method, with the cash flow projections discounted at an appropriate discount rate. The market approach involves the use of comparable public companies market multiples in estimating the fair value. Significant assumptions include projected revenue growth, capital expenditures, utilization, gross margins, discount rates, terminal growth rates, and weight allocation between income and market approaches. If the reporting unit's carrying amount exceeds its fair value, we consider goodwill impaired, and the impairment loss is recorded in the period. There were no additions to, or disposal of, goodwill during the year ended December 31, 2017, 2016 and 2015. Based on our annual goodwill impairment test, no impairment of goodwill was recorded for the year ended December 31, 2017. At December 31, 2016, we estimated the fair value of our surface drilling
63
PROPETRO HOLDING CORP. AND SUBSIDIARY
NOTES TO CONSOLIDATED FINANCIAL STATEMENTS AS OF AND FOR THE YEARS ENDED
DECEMBER 31, 2017, 2016 AND 2015
4. FAIR VALUE MEASUREMENTS (Continued)
reporting unit to be $3.8 million and its carrying value was $4.2 million. As a result of the potential impairment with the carrying value exceeding the estimated fair value, we then further determined the implied fair value of the $1.2 million goodwill for the surface drilling reporting unit to be $0. Accordingly, we recorded an impairment expense of $1.2 million. The impairment expense was attributable to the challenging oil and gas market and slow recovery of crude oil prices, all of which adversely impacted on our expected future cash flows for the surface drilling reporting unit. There was no impairment of goodwill in 2015.
5. INTANGIBLE ASSETS
Intangible assets are composed of internally developed software. Intangible assets are amortized on a straight‑line basis with a useful life of five years. Amortization expense included in net income (loss) for the years ended December 31, 2017, 2016 and 2015 was $0.3 million, $0.3 million and $0.3 million, respectively. At December 31, 2017 and 2016, respectively, the company’s intangible assets subject to amortization are as follows:
($ in thousands) | 2017 | 2016 | |||||
Internally developed software | $ | 1,440 | $ | 1,440 | |||
Less accumulated amortization | 1,139 | 851 | |||||
Intangible assets — net | $ | 301 | $ | 589 | |||
Estimated remaining amortization expense for each of the subsequent fiscal years is expected to be as follows:
($ in thousands) | |||
Year | Estimated Future Amortization Expense | ||
2018 | $ | 288 | |
2019 | 13 | ||
Total | $ | 301 | |
The average amortization period remaining is approximately 1.05 years.
6. PROPERTY AND EQUIPMENT
Property and equipment consisted of the following at December 31, 2017 and 2016, respectively:
($ in thousands) | 2017 | 2016 | |||||
Equipment and vehicles | $ | 646,800 | $ | 402,641 | |||
Leasehold improvements | 4,987 | 4,500 | |||||
Subtotal | 651,787 | 407,141 | |||||
Less accumulated depreciation | 180,877 | 143,279 | |||||
Property and equipment — net | $ | 470,910 | $ | 263,862 | |||
7. IMPAIRMENT OF LONG‑LIVED ASSETS
Whenever events or circumstances indicate that the carrying value of long‑lived assets may not be recoverable, the Company reviews the carrying value of long‑lived assets, such as property and equipment and other assets to
64
PROPETRO HOLDING CORP. AND SUBSIDIARY
NOTES TO CONSOLIDATED FINANCIAL STATEMENTS AS OF AND FOR THE YEARS ENDED
DECEMBER 31, 2017, 2016 AND 2015
7. IMPAIRMENT OF LONG-LIVED ASSETS (Continued)
determine if they are recoverable. If any long‑lived assets are determined to be unrecoverable, an impairment expense is recorded in the period. Asset recoverability is estimated using undiscounted future net cash flows at the lowest identifiable level, excluding interest expense and one‑time other income and expense adjustments. The Company determined the lowest level of identifiable cash flows to be at the asset group level, which consists of hydraulic fracturing (inclusive of acidizing), cementing, coil tubing, flowback, drilling, and surface drilling.
During the year ended December 31, 2017, no impairment expense was recorded for any of our assets group. During the year ended December 31, 2016, the gradual shift from vertical to horizontal drilling rigs in the Permian Basin led to the deterioration in utilization of our drilling rigs, and we expected undiscounted future cash flows to be lower than the carrying value of the drilling assets. Given that the carrying value of the drilling assets may not be recoverable, the Company estimated the fair value of the asset group and compared it to its carrying value. Potential impairment exists if the estimated undiscounted future net cash flows for a given asset group is less than the carrying amount of the asset group. The impairment expense is determined by comparing the estimated fair value with the carrying value of the related asset, and any excess amount by which the carrying value exceeds the fair value is recorded as an impairment expense in the period. At December 31, 2016, the estimated fair value of the drilling asset group of $8.7 million was determined using the market approach, which represents a level 2 in the fair value measurement hierarchy. Our fair value estimates required us to use significant other observable inputs including assumptions related to replacement cost, among others. According an impairment expense of $6.3 million was recorded in 2016 as the carrying value of the drilling asset group of $15.0 million was greater than its then estimated fair value. All other assets groups were determined to be recoverable in 2016. During the year ended December 31, 2015, the asset groups identified to have impairment were drilling and acidizing, with estimated fair values of approximately $18.8 million and $6.3 million, respectively. The estimated fair values of the drilling and acidizing asset groups were determined using the cost approach, which represents a level 2 in the fair value measurement hierarchy. During the year ended December 31, 2015, the impairment expense for drilling and acidizing was $28.6 million and $8.0 million, respectively.
8. DEFERRED REVENUE REBATE
In November 2011, the Company acquired certain oilfield fracturing equipment from a customer and agreed to provide future fracturing services to the customer for a period of 78 months in exchange for a 12% $25 million note payable to the customer. The Company recorded the fracturing equipment at its estimated fair value of approximately $13 million and assigned the remaining value of approximately $12 million to a deferred revenue rebate account to be amortized over the customer’s 78‑month service period. In March 2013, the Company repaid the note payable to the customer. For each of the years ended December 31, 2017, 2016 and 2015 the Company recorded $1.8 million of amortization as a reduction of revenue.
9. LONG‑TERM DEBT
2013 Term Loan and Revolving Credit Facility
On September 30, 2013, we entered into a term loan in the amount of $220 million ("Term Loan") with a $40 million revolving credit line ("Revolving Credit Facility"). Borrowings under the Term Loan and Revolving Credit Facility accrued interest at LIBOR plus 6.25%, subject to a 1% LIBOR floor, and were secured by a first priority lien and security interest in all assets of the Company. Proceeds from the Term Loan were used to pay off 100% of our debt outstanding, including accrued interest, at September 30, 2013, with excess proceeds from the Term Loan and the Revolving Credit Facility used to fund growth and working capital needs. The Term Loan and Revolving Credit Facility were scheduled to mature on September 30, 2019 and September 30, 2018, respectively, with quarterly and monthly payments of principal and interest, respectively.
Under the Term Loan and Revolving Credit Facility we were required to comply, subject to certain exceptions and materiality qualifiers, with certain customary affirmative and negative covenants, including, but not limited to, covenants pertaining to reporting, insurance, collateral maintenance, change of control, transactions with affiliates, distributions, and limitations on additional indebtedness. In addition, the Term Loan and Revolving Credit
65
PROPETRO HOLDING CORP. AND SUBSIDIARY
NOTES TO CONSOLIDATED FINANCIAL STATEMENTS AS OF AND FOR THE YEARS ENDED
DECEMBER 31, 2017, 2016 AND 2015
9. LONG‑TERM DEBT (Continued)
Facility included a maximum leverage ratio of 3.5x EBITDA (earnings before interest, taxes, depreciation, and amortization) to total debt, which became effective March 31, 2014.
In 2015, given the then near-term economic uncertainty and volatility of commodity prices, we determined that we were likely to be out of compliance with the leverage ratio covenant under the Term Loan and Revolving Credit Facility at the March 31, 2016 test date. Accordingly, the Company and its equity sponsor, Energy Capital Partners ("ECP"), commenced negotiations with the lenders to amend the covenants and leverage ratio in the Term Loan and Revolving Credit Facility. The resulting amendment and waiver agreement was executed on June 8, 2016. Under the terms of the amendment, ECP infused $40.0 million of additional equity into the Company, $10.0 million of which was reserved for working capital, with up to $30.0 million available to repurchase debt. A minority shareholder also infused $0.4 million alongside ECP to prevent dilution. The amendment and waiver also suspended the leverage ratio test until June 30, 2017, and provided us with 30 days to deliver any past-due financial statements.
Gain on Extinguishment of Debt — in connection with the amendment to the Term Loan and Revolving Credit Facility, we initiated an auction process with the lenders to repurchase a portion of debt for a price of $0.80, a 20% discount to par value. The auction settled on June 16, 2016 as the Company repurchased a total amount of $37.5 million of debt for $30.0 million plus $0.5 million in debt extinguishment auction costs, leading to a gain on extinguishment of debt of $7.0 million.
On January 13, 2017, we repaid $75 million of the outstanding balance under the Term Loan and repaid the remaining balance of $13.5 million under the Revolving Credit Facility using a portion of the proceeds from the private placement offering. On March 22, 2017, we retired the $71.8 million remaining balance of the Term Loan, along with accrued interest, using a portion of the proceeds from our IPO. Each of the Term Loan and Revolving Credit Facility were terminated in accordance with their terms upon the repayment of outstanding borrowings.
Equipment Financing
On November 24, 2015, we entered into a 36 months financing arrangement for three hydraulic fracturing units in the amount of $25 million, and a portion of the proceeds were used to pay off the previous manufacturer notes, with the remainder being used for additional liquidity.
On June 30, 2017, we entered into a financing arrangement for the purchase of light vehicles. As of December 31, 2017, the outstanding balance for certain light vehicles purchased under this financing arrangement is $4.7 million.
ABL Credit Facility
On March 22, 2017, we entered into a new revolving credit facility with a $150 million borrowing capacity ("ABL Credit Facility"). Borrowings under the ABL Credit Facility accrue interest based on a three-tier pricing grid tied to availability, and we may elect for loans to be based on either LIBOR or base rate, plus the applicable margin, which ranges from 1.75% to 2.25% for LIBOR loans and 0.75% to 1.25% for base rate loans, with no LIBOR floor. Borrowings under the ABL Credit Facility are secured by a first priority lien and security interest in substantially all assets of the Company. The ABL Credit Facility has a tenor of 5 years and a borrowing base of 85% of eligible accounts receivable less customary reserves. Under this facility we are required to comply, subject to certain exceptions and materiality qualifiers, with certain customary affirmative and negative covenants, including, but not limited to, covenants pertaining to our ability to incur liens, indebtedness, changes in the nature of our business, mergers and other fundamental changes, disposal of assets, investments and restricted payments, amendments to our organizational documents or accounting policies, prepayments of certain debt, dividends, transactions with affiliates, and certain other activities. In addition, the ABL Credit Facility includes a Springing Fixed Charge Coverage Ratio of 1.0x when excess availability is less than the greater of (i) 10% of the lesser of the facility size and the Borrowing Base and (ii) $12.0 million. The ABL has a commitment fee of 0.38%, which reduces to 0.25% if utilization is greater than 50% of the borrowing base.
66
PROPETRO HOLDING CORP. AND SUBSIDIARY
NOTES TO CONSOLIDATED FINANCIAL STATEMENTS AS OF AND FOR THE YEARS ENDED
DECEMBER 31, 2017, 2016 AND 2015
9. LONG‑TERM DEBT (Continued)
On February 22, 2018, we entered into an amendment with our lenders to increase the capacity of the ABL Credit Facility. The amendment increased total capacity under the facility from $150 million to $200 million.
The fair values of the ABL Credit Facility, Revolving Credit Facility and equipment financing approximate their carrying values. Our Term Loan was completely retired at December 31, 2017. The estimated fair value of the Term Loan at December 31, 2016 was approximately 89% of its carrying value or $130.6 million compared to $146.8 million carrying value.
Total debt consisted of the following notes at December 31, 2017 and 2016, respectively:
($ in thousands) | 2017 | 2016 | |||||
ABL Credit Facility | $ | 55,000 | $ | — | |||
6.25% "Term loan" | — | 146,750 | |||||
Revolving Credit Facility | — | 13,500 | |||||
Equipment financing | 17,942 | 19,193 | |||||
Total debt | 72,942 | 179,443 | |||||
Less deferred loan costs, net of amortization | — | 3,116 | |||||
Subtotal | 72,942 | 176,327 | |||||
Less current portion of long-term debt | 15,764 | 16,920 | |||||
Total long-term debt, net of deferred loan costs | $ | 57,178 | $ | 159,407 | |||
The loan origination costs relating to the ABL Credit Facility are classified as an asset in the balance sheet.
Annual Maturities — Scheduled annual maturities of total debt are as follows at December 31, 2017:
($ in thousands) | |||
2018 | $ | 15,764 | |
2019 | 2,142 | ||
2020 | 36 | ||
2021 | — | ||
2022 and thereafter | 55,000 | ||
Total | $ | 72,942 | |
10. ACCRUED LIABILITIES
Accrued liabilities consisted of the following at December 31, 2017 and 2016, respectively:
($ in thousands) | 2017 | 2016 | |||||
Accrued insurance | $ | 2,762 | $ | 2,900 | |||
Accrued payroll and related expenses | 10,110 | 4,729 | |||||
Other | 3,735 | 5,990 | |||||
Total | $ | 16,607 | $ | 13,619 | |||
67
PROPETRO HOLDING CORP. AND SUBSIDIARY
NOTES TO CONSOLIDATED FINANCIAL STATEMENTS AS OF AND FOR THE YEARS ENDED
DECEMBER 31, 2017, 2016 AND 2015
11. EMPLOYEE BENEFIT PLAN
The Company has a 401(k) plan whereby all employees with six months of service may contribute up to $15,000 to the plan annually. The employees vest in the Company contributions to the 401(k) plan 25% per year, beginning in the employee’s second year of service, with full vesting occurring after five years of service. The employees are fully vested in their contributions when made. The Company matches employee contributions 20 cents on the dollar up to 10% of gross salary. During the years ended December 31, 2017, 2016 and 2015, the recorded expense under the plan was $0.2 million, $0.2 million and $0.2 million, respectively.
12. REPORTABLE SEGMENT INFORMATION
The Company has six operating segments for which discreet financial information is readily available: hydraulic fracturing, cementing, coil tubing, flowback, surface drilling, and drilling. During the fourth quarter of 2017, our acidizing operation was consolidated into our hydraulic fracturing operating segment, and we no longer maintain discreet financial information for acidizing, resulting in a reduction in the number of our operating segments from seven previously reported in 2016 to six operating segments. The change in the number of our operating segments did not impact our reportable segment information reported during the years ended December 31, 2017, 2016 and 2015. Our operating segments represent how the chief operating decision maker (CODM) evaluates performance and allocate resources.
In accordance with Accounting Standards Codification (ASC) 280 — Segment Reporting, the Company has one reportable segment (pressure pumping) comprised of the hydraulic fracturing and cementing operating segments. All other operating segments and corporate administrative expenses are included in the “all other” category in the table below. Inter‑segment revenues are not material and were not shown separately in the table below.
The Company manages and assesses the performance of the reportable segment by its adjusted EBITDA (earnings before other income (expense), interest, taxes, depreciation & amortization, stock-based compensation expense, impairment expense, (gain)/loss on disposal of assets, gain on extinguishment of debt and other unusual or nonrecurring expenses or income). A reconciliation from segment level financial information to the consolidated statement of operations is provided in the table below.
68
PROPETRO HOLDING CORP. AND SUBSIDIARY
NOTES TO CONSOLIDATED FINANCIAL STATEMENTS AS OF AND FOR THE YEARS ENDED
DECEMBER 31, 2017, 2016 AND 2015
12. REPORTABLE SEGMENT INFORMATION (Continued)
($ in thousands) | |||||||||||
Pressure Pumping | All Other | Total | |||||||||
Year ended December 31, 2017 | |||||||||||
Service revenue | $ | 945,040 | $ | 36,825 | $ | 981,865 | |||||
Adjusted EBITDA | $ | 145,122 | $ | (7,679 | ) | $ | 137,443 | ||||
Depreciation and amortization | $ | 51,155 | $ | 4,473 | $ | 55,628 | |||||
Capital expenditures | $ | 300,406 | $ | 4,893 | $ | 305,299 | |||||
Goodwill | $ | 9,425 | $ | — | $ | 9,425 | |||||
Total assets | $ | 688,279 | $ | 30,753 | $ | 719,032 | |||||
Pressure Pumping | All Other | Total | |||||||||
Year ended December 31, 2016 | |||||||||||
Service revenue | $ | 409,014 | $ | 27,906 | $ | 436,920 | |||||
Adjusted EBITDA | $ | 15,656 | $ | (7,840 | ) | $ | 7,816 | ||||
Depreciation and amortization | $ | 37,282 | $ | 6,260 | $ | 43,542 | |||||
Property and equipment impairment expense | $ | — | $ | 6,305 | $ | 6,305 | |||||
Goodwill impairment expense | $ | — | $ | 1,177 | $ | 1,177 | |||||
Capital expenditures | $ | 45,473 | $ | 535 | $ | 46,008 | |||||
Goodwill | $ | 9,425 | $ | — | $ | 9,425 | |||||
Total assets | $ | 501,906 | $ | 39,516 | $ | 541,422 | |||||
Pressure Pumping | All Other | Total | |||||||||
Year ended December 31, 2015 | |||||||||||
Service revenue | $ | 510,198 | $ | 59,420 | $ | 569,618 | |||||
Adjusted EBITDA | $ | 62,540 | $ | (2,391 | ) | $ | 60,149 | ||||
Depreciation and amortization | $ | 38,369 | $ | 11,765 | $ | 50,134 | |||||
Property and equipment impairment expense | $ | 7,980 | $ | 28,629 | $ | 36,609 | |||||
Capital expenditures | $ | 69,029 | $ | 2,647 | $ | 71,676 | |||||
Goodwill | $ | 9,425 | $ | 1,177 | $ | 10,602 | |||||
Total assets | $ | 398,449 | $ | 48,005 | $ | 446,454 | |||||
69
PROPETRO HOLDING CORP. AND SUBSIDIARY
NOTES TO CONSOLIDATED FINANCIAL STATEMENTS AS OF AND FOR THE YEARS ENDED
DECEMBER 31, 2017, 2016 AND 2015
12. REPORTABLE SEGMENT INFORMATION (Continued)
Reconciliation of net income (loss) to adjusted EBITDA:
($ in thousands) | Pressure Pumping | All Other | Total | ||||||||
Year ended December 31, 2017 | |||||||||||
Net income (loss) | $ | 50,417 | $ | (37,804 | ) | $ | 12,613 | ||||
Depreciation and amortization | 51,155 | 4,473 | 55,628 | ||||||||
Interest expense | — | 7,347 | 7,347 | ||||||||
Income tax expense | — | 3,128 | 3,128 | ||||||||
Loss on disposal of assets | 38,059 | 1,027 | 39,086 | ||||||||
Stock‑based compensation | — | 9,489 | 9,489 | ||||||||
Other expense | — | 1,025 | 1,025 | ||||||||
Other general and administrative expense (1) | — | 722 | 722 | ||||||||
Deferred IPO Bonus | 5,491 | 2,914 | 8,405 | ||||||||
Adjusted EBITDA | $ | 145,122 | $ | (7,679 | ) | $ | 137,443 | ||||
Year ended December 31, 2016 | Pressure Pumping | All Other | Total | ||||||||
Net loss | $ | (45,316 | ) | $ | (7,831 | ) | $ | (53,147 | ) | ||
Depreciation and amortization | 37,282 | 6,260 | 43,542 | ||||||||
Interest expense | — | 20,387 | 20,387 | ||||||||
Income tax benefit | — | (27,972 | ) | (27,972 | ) | ||||||
Loss on disposal of assets | 23,690 | (1,161 | ) | 22,529 | |||||||
Property and equipment impairment expense | — | 6,305 | 6,305 | ||||||||
Goodwill impairment expense | — | 1,177 | 1,177 | ||||||||
Gain on extinguishment of debt | — | (6,975 | ) | (6,975 | ) | ||||||
Stock‑based compensation | — | 1,649 | 1,649 | ||||||||
Other expense | — | 321 | 321 | ||||||||
Adjusted EBITDA | $ | 15,656 | $ | (7,840 | ) | $ | 7,816 | ||||
Pressure Pumping | All Other | Total | |||||||||
Year ended December 31, 2015 | |||||||||||
Net loss | $ | (5,022 | ) | $ | (40,831 | ) | $ | (45,853 | ) | ||
Depreciation and amortization | 38,369 | 11,765 | 50,134 | ||||||||
Interest expense | — | 21,641 | 21,641 | ||||||||
Income tax benefit | — | (25,388 | ) | (25,388 | ) | ||||||
Loss on disposal of assets | 21,213 | 55 | 21,268 | ||||||||
Property and equipment impairment expense | 7,980 | 28,629 | 36,609 | ||||||||
Stock‑based compensation | — | 1,239 | 1,239 | ||||||||
Other expense | — | 499 | 499 | ||||||||
Adjusted EBITDA | $ | 62,540 | $ | (2,391 | ) | $ | 60,149 | ||||
(1) Other general and administrative expense relates to legal settlement expense.
70
PROPETRO HOLDING CORP. AND SUBSIDIARY
NOTES TO CONSOLIDATED FINANCIAL STATEMENTS AS OF AND FOR THE YEARS ENDED
DECEMBER 31, 2017, 2016 AND 2015
12. REPORTABLE SEGMENT INFORMATION (Continued)
Major Customers
For the years ended December 31, 2017, 2016 and 2015, the Company had revenue from the following significant customers that accounted for the following percentages of the Company’s total revenue:
2017 | 2016 | 2015 | ||||||
Customer A | 15.0 | % | 18.0 | % | 12.5 | % | ||
Customer B | 13.8 | % | 12.5 | % | 8.8 | % | ||
Customer C | 12.7 | % | 8.7 | % | 14.2 | % | ||
Customer D | 12.6 | % | 7.0 | % | 11.1 | % | ||
Customer E | 11.8 | % | — | % | — | % | ||
For the year ended December 31, 2017, pressure pumping made up 99.9% of Customer A, 99.2% of Customer B, 99.9% of Customer C, 99.8% of Customer D and 95.5% of customer E. For the year ended December 31, 2016, pressure pumping made up 96% of Customer A, 99% of Customer B, 100% of Customer C and 99% of Customer D. For the year ended December 31, 2015, pressure pumping made up 99% of Customer A, 100% of Customer B, 88% of Customer C and 99% of Customer D.
13. NET INCOME (LOSS) PER SHARE
Basic net income (loss) per common share is computed by dividing the net income (loss) relevant to the common stockholders by the weighted-average number of shares outstanding during the year. Diluted net income (loss) per common share uses the same net income (loss) divided by the sum of the weighted-average number of shares of common stock outstanding during the period, plus dilutive effects of options, performance and restricted stocks units outstanding during the period calculated using the treasury method and the potential dilutive effects of preferred stocks (if any) calculated using the if-converted method. The table below shows the calculations for years ended December 31, 2017, 2016 and 2015.
(In thousands, except for per share data) | 2017 | 2016 | 2015 | ||||||||
Numerator (both basic and diluted) | |||||||||||
Net income (loss) relevant to common stockholders | $ | 12,613 | $ | (53,147 | ) | $ | (45,853 | ) | |||
Denominator | |||||||||||
Denominator for basic income (loss) per share | 76,371 | 44,787 | 34,993 | ||||||||
Dilutive effect of stock options | 2,903 | — | — | ||||||||
Dilutive effect of performance stock units | 59 | — | — | ||||||||
Dilutive effect of non-vested restricted stock units | 250 | — | — | ||||||||
Denominator for diluted income (loss) per share | 79,583 | 44,787 | 34,993 | ||||||||
Basic net income (loss) per common share | $ | 0.17 | $ | (1.19 | ) | $ | (1.31 | ) | |||
Diluted net income (loss) per common share | $ | 0.16 | $ | (1.19 | ) | $ | (1.31 | ) | |||
71
PROPETRO HOLDING CORP. AND SUBSIDIARY
NOTES TO CONSOLIDATED FINANCIAL STATEMENTS AS OF AND FOR THE YEARS ENDED
DECEMBER 31, 2017, 2016 AND 2015
13. NET INCOME (LOSS) PER SHARE (Continued)
As shown in the table below, the following non-vested restricted stock units, preferred stock, performance stock units, and stock options have not been included in the calculation of diluted income (loss) per share for years ended December 31, 2017, 2016 and 2015 as they would be anti-dilutive to the calculation above.
(Count in thousands) | 2017 | 2016 | 2015 | |||||
Stock options | — | 4,646 | 3,486 | |||||
Preferred stock | — | 17,000 | — | |||||
Performance stock units | — | — | — | |||||
Non-vested restricted stock units | — | 372 | 372 | |||||
— | 22,018 | 3,858 | ||||||
14. STOCK‑BASED COMPENSATION
Effective March 4, 2013, we adopted the ProPetro Stock Option Plan pursuant to which our Board of Directors may grant stock options or other stock-based awards to key employees, consultants, and directors. The Plan, as amended, is authorized to grant up to 4,645,884 shares of common stock to be issued upon exercise of the options. The Company’s share price used to estimate the fair value of the option at the grant date was based on a combination of income and market approaches, which are highly complex and sensitive. The income approach involves the use of a discounted cash flow method, with cash flow projections discounted at an appropriate discount rate. The market approach involves the use of comparable public companies market multiples in estimating the fair value of the Company’s stock. The expected term used to calculate the fair value of all options considers the vesting date and the grant’s expiration date. The expected volatility was estimated by considering comparable public companies, and the risk free rate is based on the U.S treasury yield curve as of the grant date. The dividend assumption is based on historical experience. After becoming a public company, the market price was used to determine the market value of our common stock. Prior to 2015, the Company had granted a total of 3,499,228 options with an exercise price of $3.96 per option, and all options expire 10 years from the date of grant.
On June 14, 2013, we granted 2,799,408 stock option awards to certain key employees and directors that shall vest and become exercisable based upon the achievement of a service requirement. The options vest in 25% increments for each year of continuous service and an option becomes fully vested upon the optionee’s completion of the fourth year of service. The contractual term for the options awarded is 10 years. For the years ended December 31, 2017, 2016 and 2015, the Company recognized $0.7 million, $1.2 million and $1.2 million, respectively, in compensation expense related to these stock options. The fair value of each option award granted is estimated on the date of grant using the Black-Scholes option-pricing model. The fair value of the options was estimated at the date of grant using the following assumptions:
Expected volatility | 45 | % | |
Expected dividends | $ | — | |
Expected term (in years) | 6.25 | ||
Risk free rate | 1.35 | % | |
On December 1, 2013, we granted 699,820 stock option awards to certain key employees which were scheduled to vest in four substantially equal annual installments, subject to service and performance requirements and acceleration upon a change in control. As of December 31, 2016 and 2015 the performance requirements were not considered to be probable of achievement for any of the outstanding option awards and 114,456 options were forfeited during the year ended December 31, 2016. Accordingly, we did not recognize any compensation expense related to these stock options during the years ended December 31, 2016 and 2015. Effective March 16, 2017, we
72
PROPETRO HOLDING CORP. AND SUBSIDIARY
NOTES TO CONSOLIDATED FINANCIAL STATEMENTS AS OF AND FOR THE YEARS ENDED
DECEMBER 31, 2017, 2016 AND 2015
14. STOCK‑BASED COMPENSATION (Continued)
terminated the options in connection with the IPO and approved a cash bonus totaling $5.1 million to the holders of the options.
The contractual term for the options awarded is 10 years. The fair value of each option award granted is estimated on the date of grant using the Black-Scholes option-pricing model. The fair value of the options was estimated at the date of grant using the following assumptions:
Expected volatility | 45 | % | |
Expected dividends | $ | — | |
Expected term (in years) | 6.25 | ||
Risk free rate | 1.83 | % | |
On July 19, 2016, we granted 1,274,549 stock option awards to certain key employees and directors which are scheduled to vest in five substantially equal semi-annual installments commencing in December 2016, subject to a continuing services requirement. The contractual term for the options awarded is 10 years. For the year ended December 31, 2017, we recognized the remaining $1.8 million in stock compensation expense related to these stock options, as the Company fully accelerated vesting of the options in connection with the IPO, and for the years ended December 31, 2016 and 2015, the Company recognized $0.4 million and $0, respectively, in compensation expense related to these stock options.
The fair value of each option award granted is estimated on the date of grant using the Black- Scholes option-pricing model. The fair value of the options was estimated at the date of grant using the following assumptions:
Expected volatility | 55 | % | |
Expected dividends | $ | — | |
Expected term (in years) | 5.8 | ||
Risk free rate | 1.22 | % | |
In March 2017, our shareholders approved the ProPetro 2017 Incentive Award Plan ("IAP") pursuant to which our Board of Directors may grant stock options, restricted stock units ("RSUs"), performance stock units ("PSUs"), or other stock-based awards to key employees, consultants, directors and employees. The IAP authorizes up to 5,800,000 shares of common stock to be issued under awards granted pursuant to the plan. On March 16, 2017, we granted 793,738 stock option awards to certain key employees and directors pursuant to the IAP which are scheduled to vest in four substantially equal annual installments, subject to a continuing service requirement. The contractual term for the options awarded is 10 years. For the years ended December 31, 2017, 2016 and 2015, the Company recognized $0.5 million, $0 and $0, respectively, in compensation expense related to these stock options.
The fair value of each stock option award granted is estimated on the date of grant using the Black- Scholes option-pricing model. The fair value of the options was estimated at the date of grant using the following assumptions:
Expected volatility | 18 | % | |
Expected dividends | $ | — | |
Expected term (in years) | 6.25 | ||
Risk free rate | 2.23 | % | |
73
PROPETRO HOLDING CORP. AND SUBSIDIARY
NOTES TO CONSOLIDATED FINANCIAL STATEMENTS AS OF AND FOR THE YEARS ENDED
DECEMBER 31, 2017, 2016 AND 2015
14. STOCK‑BASED COMPENSATION (Continued)
A summary of the stock option activity for the year ended December 31, 2017 is presented below.
Number of Shares | Weighted Average Exercise Price | |||||
Outstanding at January 1, 2017 | 4,645,884 | $ | 3.49 | |||
Granted | 793,738 | $ | 14.00 | |||
Exercised | (226,194 | ) | $ | 3.96 | ||
Forfeited | (5,148 | ) | $ | 14.00 | ||
Expired | — | $ | — | |||
Canceled | (571,927 | ) | $ | 3.96 | ||
Outstanding at December 31, 2017 | 4,636,353 | $ | 5.20 | |||
Exercisable at December 31, 2017 | 3,847,763 | $ | 3.39 | |||
The weighted average grant-date fair value of stock options granted during the years ended December 31, 2017, 2016 and 2015 was $3.35, $1.77 and $0, respectively. As of December 31, 2017, the aggregate intrinsic value for our outstanding stock options was $69.4 million, and the aggregate intrinsic value for our exercisable stock options was $64.5 million. The aggregate intrinsic value for the exercised stock options during the year was $2.3 million. The remaining contractual term for the outstanding and exercisable stock options as of December 31, 2017, were 6.9 years and 6.4 years, respectively.
Restricted Stock Units (Non-Vested Stock) and Performance Stock Units
On September 30, 2013, our Board of Directors authorized and granted 372,335 restricted stock units (RSUs) to a key executive. Each RSU represents the right to receive one share of common stock of the Company at par value $0.001 per share. Under the terms of the award, the shares of common stock subject to the RSUs were to be paid to the grantee upon change in control, regardless of whether the grantee was affiliated with the Company on the settlement date. The fair value of the RSUs is measured as the price of the Company’s shares on the grant date, which was estimated to be $3.89. The share price used to estimate the fair value of the RSU at the grant date was based on a combination of income and market approaches, which are highly complex and sensitive. The income approach involves the use of a discounted cash flow method, with the cash flow projections discounted at an appropriate discount rate. The market approach involves the use of comparable public companies market multiples in estimating the fair value of the Company’s stock. Effective March 22, 2017, the Board of Directors canceled these RSUs and issued 372,335 new RSUs to the grantee. These issued RSUs are effectively identical to the RSUs granted in 2013, provided, however, that the RSUs will now be payable in full on March 22, 2018. The fair value of the RSUs issued on March 22, 2017, was based on the Company's closing stock market price at the grant date. In connection with the IPO, we fully recognized the stock compensation expense related to the re-issued RSUs.
On June 5, 2017, our Board of Directors granted 319,250 RSUs to employees, directors and executives pursuant to the IAP. Each RSU represents the right to receive one share of common stock. The fair value of the RSUs is based on the closing share price of our common stock on the date of grant. For the years ended December 31, 2017, 2016 and 2015 the recorded stock compensation expense for all RSUs was $6.2 million, $0 and $0, respectively. As of December 31, 2017 the total unrecognized compensation expense for all RSUs was approximately $3.3 million, and is expected to be recognized over a weighted-average period of approximately 2.5 years.
74
PROPETRO HOLDING CORP. AND SUBSIDIARY
NOTES TO CONSOLIDATED FINANCIAL STATEMENTS AS OF AND FOR THE YEARS ENDED
DECEMBER 31, 2017, 2016 AND 2015
14. STOCK‑BASED COMPENSATION (Continued)
The following table summarizes RSUs activity for the year December 31, 2017:
Number of Shares | Weighted Average Grant Date Fair Value | ||||||
Outstanding at January 1, 2017 | 372,335 | $ | 3.89 | ||||
Granted | 691,585 | $ | 13.65 | ||||
Vested | — | $ | — | ||||
Exercised | — | $ | — | ||||
Forfeited | (2,841 | ) | $ | 13.25 | |||
Expired | — | $ | — | ||||
Canceled | (372,335 | ) | $ | 3.89 | |||
Outstanding at December 31, 2017 | 688,744 | $ | 13.66 | ||||
Effective June 5, 2017, our Board of Directors authorized and granted performance stock unit awards to certain key employees under the IAP. The actual number of shares that may be issued under the performance stock unit awards ranges from zero up to a maximum of twice the target number of performance stock unit awards granted to the participant, based on our total shareholder return relative to a designated peer group from the date of our IPO through December 31, 2019. Compensation expense is recorded ratably over the corresponding requisite service period. The fair value of performance stock unit awards is determined using a Monte Carlo probability model. Grant recipients do not have any shareholder rights until performance relative to the peer group has been determined following the completion of the performance period and shares have been issued. For the years ended December 31, 2017, 2016 and 2015 the recorded stock compensation expense for the performance stock units was $0.4 million, $0 and $0, respectively.
The following table summarizes information about the performance stock units that were outstanding at December 31, 2017:
Period Granted | Target Shares Outstanding at Beginning of Year | Target Shares Granted | Target Shares Vested | Target Shares Forfeited | Target Shares Outstanding at End of Year | Weighted Average Grant Date Fair Value per Share | |||||||||||||
2015 | — | — | — | — | — | — | |||||||||||||
2016 | — | — | — | — | — | — | |||||||||||||
2017 | — | 169,635 | — | — | 169,635 | $ | 10.73 | ||||||||||||
Total | — | 169,635 | — | — | 169,635 | ||||||||||||||
The total stock compensation expense for the years ended December 31, 2017, 2016 and 2015 for all stock awards was $9.5 million, $1.6 million and $1.2 million, respectively. The total unrecognized compensation expense as of December 31, 2017 is approximately $6.8 million, and is expected to be recognized over a weighted-average period of approximately 2.6 years.
75
PROPETRO HOLDING CORP. AND SUBSIDIARY
NOTES TO CONSOLIDATED FINANCIAL STATEMENTS AS OF AND FOR THE YEARS ENDED
DECEMBER 31, 2017, 2016 AND 2015
15. INCOME TAXES
The components of the provision for income taxes for the years ended December 31, 2017, 2016 and 2015 are as follows:
($ in thousands) | 2017 | 2016 | 2015 | ||||||||
Federal: | |||||||||||
Current | $ | (376 | ) | $ | — | $ | (1,092 | ) | |||
Deferred | 3,634 | (29,082 | ) | (22,177 | ) | ||||||
3,258 | (29,082 | ) | (23,269 | ) | |||||||
State: | |||||||||||
Current | 74 | — | (350 | ) | |||||||
Deferred | (204 | ) | 1,110 | (1,769 | ) | ||||||
(130 | ) | 1,110 | (2,119 | ) | |||||||
Total expense (benefit) | $ | 3,128 | $ | (27,972 | ) | $ | (25,388 | ) | |||
Reconciliation between the amounts determined by applying the federal statutory rate of 35% to income tax benefit is as follows:
($ in thousands) | 2017 | 2016 | 2015 | ||||||||
Tax at federal statutory rate | $ | 5,510 | $ | (28,392 | ) | $ | (24,935 | ) | |||
State taxes, net of federal benefit | 176 | (216 | ) | (885 | ) | ||||||
Permanent differences | 1,582 | 498 | 579 | ||||||||
Stock-based compensation | (655 | ) | — | — | |||||||
Valuation allowance | 273 | 879 | — | ||||||||
Effect of change in enacted Tax Act | (3,448 | ) | — | — | |||||||
Other | (310 | ) | (741 | ) | (147 | ) | |||||
Total provision | $ | 3,128 | $ | (27,972 | ) | $ | (25,388 | ) | |||
76
PROPETRO HOLDING CORP. AND SUBSIDIARY
NOTES TO CONSOLIDATED FINANCIAL STATEMENTS AS OF AND FOR THE YEARS ENDED
DECEMBER 31, 2017, 2016 AND 2015
15. INCOME TAXES (Continued)
Deferred tax assets and liabilities are recognized for estimated future tax effects of temporary differences between the tax basis of an asset or liability and its reported amount in the consolidated financial statements. The significant items giving rise to deferred tax assets (liabilities) at December 31, 2017 and 2016, respectively, are as follows:
($ in thousands) | 2017 | 2016 | |||||
Deferred Income Tax Assets | |||||||
Accrued liabilities | $ | 1,264 | $ | 334 | |||
Allowance for doubtful accounts | 94 | 195 | |||||
Goodwill and other intangible assets | 5,304 | 10,953 | |||||
Stock‑based compensation | 2,960 | 1,692 | |||||
Net operating losses | 56,788 | 49,267 | |||||
Other | 69 | 389 | |||||
Noncurrent deferred tax assets | 66,479 | 62,830 | |||||
Total deferred tax assets | 66,479 | 62,830 | |||||
Valuation allowance | (1,151 | ) | (879 | ) | |||
Total deferred tax assets — net | 65,328 | 61,951 | |||||
Deferred Income Tax Liabilities | |||||||
Property and equipment | (68,811 | ) | (60,958 | ) | |||
Prepaid expenses | (965 | ) | (1,506 | ) | |||
Other | (131 | ) | (635 | ) | |||
Noncurrent deferred tax liabilities | (69,907 | ) | (63,099 | ) | |||
Net deferred tax liability | $ | (4,579 | ) | $ | (1,148 | ) | |
At December 31, 2017, the Company had approximately $261.0 million of federal net operating loss carryforwards that will begin to expire in 2032 and state net operating losses of approximately $47.0 million that will begin to expire in 2024. Utilization of net operating loss carryforwards may be limited due to past or future ownership changes. As of December 31, 2017, we had a net valuation allowance of $1.2 million on the basis of management’s reassessment of the amount of its deferred tax assets that are more likely than not to be realized.
The Company’s U.S. federal income tax returns for the years ended December 31, 2014 through December 31, 2016 remain open to examination by the Internal Revenue Service under the applicable U.S. federal statute of limitations provisions. The various states in which the Company is subject to income tax are generally open to examination for the tax years ended after December 31, 2013.
On December 22, 2017, the U.S. government enacted comprehensive tax legislation commonly referred to as the Tax Cuts and Jobs Act (“Tax Act”). The Tax Act makes broad and complex changes to the U.S. tax code including, but not limited to (1) reducing the U.S. federal corporate tax rate from 35% to 21%, (2) eliminating the corporate alternative minimum tax (AMT) and changing how existing AMT credits can be realized, (3) creating a new limitation on deductible interest expense, (4) changes to bonus depreciation, and (5) changing rules related to use and limitations of net operating loss carryforwards for tax years beginning after December 31, 2017. The only material items that impacted the Company’s consolidated financial statements in 2017 were bonus depreciation and the corporate rate reduction. While the corporate rate reduction is effective January 1, 2018, we accounted for this anticipated rate change during the year ended December 31, 2017, the year of enactment. Consequently, we recorded a $3.4 million decrease to the net deferred tax liability, with a corresponding net adjustment to deferred tax benefit.
77
PROPETRO HOLDING CORP. AND SUBSIDIARY
NOTES TO CONSOLIDATED FINANCIAL STATEMENTS AS OF AND FOR THE YEARS ENDED
DECEMBER 31, 2017, 2016 AND 2015
15. INCOME TAXES (Continued)
In June 2006, the FASB issued FASB Interpretation (FIN) No. 48, Accounting for Uncertainty in Income Taxes — an interpretation of FASB Statement No. 109 (subsequently codified as ASC 740‑10, Income Taxes, Under FASB Statement No. 168, The FASB Accounting Standards Codification and the Hierarchy of Generally Accepted Accounting Principles — a replacement of FASB Statement No. 162). ASC 740‑10 prescribes a comprehensive model for recognizing, measuring, presenting, and disclosing in the consolidated financial statements tax positions taken or expected to be taken on a tax return, including a decision to file or not to file in a particular jurisdiction.
The Company evaluated all tax positions and determined that the aggregate exposure under ASC 740‑10 did not have a material effect on the consolidated financial statements during the year ended December 31, 2017, 2016 and 2015. Therefore, no adjustments have been made to the consolidated financial statements related to the implementation of ASC 740‑10. The Company will continue to evaluate its tax positions in accordance with ASC 740‑10 and will recognize any future effect as a charge to income in the applicable period.
Income tax penalties and interest assessments recognized under ASC 740‑10 are accrued as a tax expense in the period that the Company’s taxes are in an uncertain tax position. Any accrued tax penalties or interest assessments will remain until the uncertain tax position is resolved with the taxing authorities or until the applicable statute of limitations has expired.
16. RELATED‑PARTY TRANSACTIONS
The Company leases its corporate offices from a related party pursuant to a five‑year lease agreement with a five‑year extension option requiring a base rent of $0.1 million per year. The Company also leases five properties adjacent to the corporate office from related parties with annual base rents of $0.03 million, $0.03 million, $0.1 million, $0.1 million, and $0.2 million.
For the years ended December 31, 2017, 2016 and 2015, the Company paid approximately $0.3 million, $0.2 million and $0.2 million, respectively, for the use of transportation services from a related party.
The Company also rents equipment in Elk City, Oklahoma from a related party. For the years ended December 31, 2017, 2016 and 2015, the Company paid $0.2 million, $0.2 million and $0.2 million, respectively.
At December 31, 2017, 2016 and 2015, the Company had $0.02 million, $0 and $0 in payables, respectively, and approximately $0, $0.04 million and $0.02 million in receivables, respectively, for related parties for services provided.
All agreements pertaining to realty property and equipment were entered into during periods where the Company had limited liquidity and related parties secured them on behalf of the Company. All related party receivables and payables are immaterial and have not been separately shown on the face of the financial statements.
For related party disclosure related to equity transactions with Energy Capital Partners, see Note 18.
17. COMMITMENTS AND CONTINGENCIES
Operating Lease — The Company has various operating leases for office space and certain property and equipment. For the years ended December 31, 2017, 2016 and 2015, the Company recorded operating lease expense of $1.4 million, $1.4 million and $1.4 million, respectively. Required remaining lease payments for each fiscal year are as follows:
78
PROPETRO HOLDING CORP. AND SUBSIDIARY
NOTES TO CONSOLIDATED FINANCIAL STATEMENTS AS OF AND FOR THE YEARS ENDED
DECEMBER 31, 2017, 2016 AND 2015
17. COMMITMENTS AND CONTINGENCIES (Continued)
($ in thousands) | |||
2018 | $ | 594 | |
2019 | 366 | ||
2020 | 344 | ||
2021 | 344 | ||
2022 and thereafter | 431 | ||
Total | $ | 2,079 | |
Contingent Liabilities — The Company may be subject to various legal actions, claims, and liabilities arising in the ordinary course of business. In the opinion of management, the ultimate disposition of these matters will not have a materially adverse effect on the Company’s financial position, results of operations, or liquidity.
79
PROPETRO HOLDING CORP. AND SUBSIDIARY
NOTES TO CONSOLIDATED FINANCIAL STATEMENTS AS OF AND FOR THE YEARS ENDED
DECEMBER 31, 2017, 2016 AND 2015
18. EQUITY CAPITALIZATION
Credit Amendment Equity Infusion
In connection with the Term Loan and Revolving Credit Facility amendment dated June 8, 2016 (see Note 9), ECP and its related affiliates along with other shareholders infused $40.4 million of equity into the Company and we issued 18,007,328 additional shares of common stock.
On November 9, 2017, ECP sold 13,800,000 shares of its common stock holdings in a secondary offering at $15.07 per share.
Convertible Preferred Stock
On December 27, 2016, we completed a private placement offering of $170.0 million, issuing 16,999,990 shares of Series A nonparticipating convertible preferred stock, par value $0.001 per share. Costs associated with the offering were approximately $7.0 million, resulting in net proceeds to the Company of approximately $163.0 million.
As of December 31, 2016, 16,999,990 shares of Series A convertible preferred stock were issued and outstanding, convertible into common stock at the conversion price per the private placement agreement. Upon the consummation of the IPO, the Series A Preferred stock automatically converted into common stock.
Initial Public Offering
On March 22, 2017, we consummated our IPO in which 25,000,000 shares of our common stock, par value $0.001 per share, were sold at a public offering price of $14.00 per share, with 13,250,000 shares issued and sold by the Company and $11,750,000 shares sold by existing stockholders. We received net proceeds of approximately $170.1 million after deducting $10.9 million of underwriting discounts and commissions, and $4.5 million of other offering expenses. At closing, we used the proceeds (i) to repay $71.8 million in outstanding borrowings under the term loan, (ii) $86.8 million to fund the purchase of additional hydraulic fracturing units and other equipment, and (iii) the remaining for general corporate purposes. In connection with the IPO, all 16,999,990 shares of our outstanding Series A Preferred Stock converted to common stock on a 1:1 basis.
Additionally, on March 28, 2017, one executive and one director net settled a total of 226,194 of their exercisable stock options and received 162,212 shares of common stock.
At December 31, 2017 and 2016, the Company had 83,039,854 and 52,627,652 shares outstanding, respectively.
80
PROPETRO HOLDING CORP. AND SUBSIDIARY
NOTES TO CONSOLIDATED FINANCIAL STATEMENTS AS OF AND FOR THE YEARS ENDED
DECEMBER 31, 2017, 2016 AND 2015
19. QUARTERLY FINANCIAL DATA (UNAUDITED)
The following table sets forth our unaudited quarterly results for each of the last four quarters for the years ended December 31, 2017 and 2016. This unaudited quarterly information has been prepared on the same basis as our annual audited financial statements and includes all adjustments, consisting only of normal recurring adjustments that are necessary to present fairly the financial information for the fiscal quarters presented.
2017 | |||||||||||||||
(In thousands, except for per share data) | First Quarter | Second Quarter | Third Quarter | Fourth Quarter | |||||||||||
Service revenue | $ | 171,931 | $ | 213,492 | $ | 282,730 | $ | 313,712 | |||||||
Gross profit | $ | 22,366 | $ | 36,715 | $ | 57,297 | $ | 51,664 | |||||||
Net income (loss) | $ | (24,351 | ) | $ | 4,921 | $ | 21,965 | $ | 10,078 | ||||||
Net income (loss) per common share: | |||||||||||||||
Basic | $ | (0.43 | ) | $ | 0.06 | $ | 0.26 | $ | 0.12 | ||||||
Diluted | $ | (0.43 | ) | $ | 0.06 | $ | 0.25 | $ | 0.12 | ||||||
Weighted average common shares outstanding: | |||||||||||||||
Basic | 55,996 | 83,040 | 83,040 | 83,040 | |||||||||||
Diluted | 55,996 | 86,279 | 86,264 | 86,818 | |||||||||||
2016 | |||||||||||||||
(In thousands, except for per share data) | First Quarter | Second Quarter | Third Quarter | Fourth Quarter | |||||||||||
Service revenue | $ | 87,930 | $ | 68,165 | $ | 116,904 | $ | 163,921 | |||||||
Gross profit | $ | 7,641 | $ | 3,316 | $ | 6,681 | $ | 15,142 | |||||||
Net loss | $ | (12,940 | ) | $ | (9,294 | ) | $ | (13,598 | ) | $ | (17,315 | ) | |||
Net income (loss) per common share: | |||||||||||||||
Basic | $ | (0.37 | ) | $ | (0.24 | ) | $ | (0.26 | ) | $ | (0.33 | ) | |||
Diluted | $ | (0.37 | ) | $ | (0.24 | ) | $ | (0.26 | ) | $ | (0.33 | ) | |||
Weighted average common shares outstanding: | |||||||||||||||
Basic | 34,993 | 39,496 | 52,975 | 52,628 | |||||||||||
Diluted | 34,993 | 39,496 | 52,975 | 52,628 | |||||||||||
81
Item 9. Changes in and Disagreements with Accountants on Accounting and Financial Disclosure
None.
Item 9A. Controls and Procedures
Evaluation of Disclosure Controls and Procedures
We maintain disclosure controls and procedures that are designed to provide reasonable assurance that the information required to be disclosed by us in our reports that we file or submit under the Exchange Act is recorded, processed, summarized and reported within the time periods specified in the SEC’s rules and forms and that such information is accumulated and communicated to our management, including our principal executive officer and principal financial officer, as appropriate, to allow timely decisions regarding required disclosure.
As required by Rule 13a-15(b) under the Exchange Act, we have evaluated, under the supervision and with the participation of our management, including our principal executive officer, principal financial officer and principal accounting officer, the effectiveness of the design and operation of our disclosure controls and procedures (as defined in Rules 13a-15(e) and 15d-15(e) under the Exchange Act) as of the end of the period covered by this report. Based upon that evaluation, our principal executive officer, principal financial officer and principal accounting officer concluded that our disclosure controls and procedures were effective at the reasonable assurance level as of December 31, 2017.
Management’s Report on Internal Control over Financial Reporting
We are required to comply with the SEC’s rules implementing Section 302 of the Sarbanes‑Oxley Act of 2002, which requires our management to certify financial and other information in our quarterly and annual reports and provide an annual management report on the effectiveness of our internal control over financial reporting. We will not be required to make our first assessment of our internal control over financial reporting until the year of our second annual report required to be filed with the SEC.
Our independent registered public accounting firm is not yet required to formally attest to the effectiveness of our internal controls over financial reporting, and will not be required to do so for as long as we are an “emerging growth company” pursuant to the provisions of the JOBS Act.
Changes in Internal Control over Financial Reporting
No changes in our system of internal control over financial reporting (as defined in Rules 13a-15(f) and 15d-15(f) under the Exchange Act) occurred during the quarter ended December 31, 2017 that have materially affected, or are reasonably likely to materially affect, our internal control over financial reporting.
Item 9B. Other Information
None.
Part III
Item 10. Directors, Executive Officers and Corporate Governance
The information required by this Item concerning our Executive Officers, Directors and nominees for Director, Audit Committee members and financial expert(s) and concerning disclosure of delinquent filers under Section 16(a) of the Exchange Act and our Standards of Business Conduct is incorporated herein by reference from our definitive Proxy Statement for our 2018 Annual Meeting of Shareholders, which will be filed with the SEC pursuant to Regulation 14A within 120 days after the end of our last fiscal year.
82
Item 11. Executive Compensation
The information required by this Item concerning Executive Compensation, material transactions involving Executive Officers and Directors and Compensation Committee interlocks, as well as the Compensation Committee Report, are incorporated herein by reference from our definitive Proxy Statement for our 2018 Annual Meeting of Shareholders, which will be filed with the SEC pursuant to Regulation 14A within 120 days after the end of our last fiscal year.
83
Item 12. Security Ownership of Certain Beneficial Owners and Management and Related Stockholder Matters
The information required by this Item concerning the stock ownership of management and five percent beneficial owners and securities authorized for issuance under equity compensation plans is incorporated herein by reference from our definitive Proxy Statement for our 2018 Annual Meeting of Shareholders, which will be filed with the SEC pursuant to Regulation 14A within 120 days after the end of our last fiscal year.
84
Item 13. Certain Relationships and Related Party Transactions, and Director Independence.
The information required by this Item concerning certain relationships and related person transactions and director independence is incorporated herein by reference from our definitive Proxy Statement for our 2018 Annual Meeting of Shareholders, which will be filed with the SEC pursuant to Regulation 14A within 120 days after the end of our last fiscal year.
Item 14. Principal Accounting Fees and Services.
The information required by this Item concerning principal accounting fees and services is incorporated herein by reference from our definitive Proxy Statement for our 2018 Annual Meeting of Shareholders, which will be filed with the SEC pursuant to Regulation 14A within 120 days after the end of our last fiscal year.
Part IV
Item 15. Exhibits and Financial Statement Schedules.
(a)(1) Financial Statements
The Financial Statements listed in the Index to Financial Statements in Item 8 are filed as part of this Annual Report on Form 10-K.
(a)(2) Exhibits
The exhibit index attached hereto is incorporated herein by reference.
Item 16. Form 10-K Summary.
None.
SIGNATURES
Pursuant to the requirements of the Securities Exchange Act of 1934, the registrant has duly caused this Annual Report on Form 10-K to be signed on its behalf by the undersigned, thereunto duly authorized, on March 27, 2018.
ProPetro Holding Corp.
By: /s/ Dale Redman
Name: Dale Redman
Title: Chief Executive Officer
Name: Dale Redman
Title: Chief Executive Officer
Pursuant to the requirements of the Securities Exchange Act of 1934, as amended, this Annual Report on Form 10-K has been signed by the following persons in the capacities indicated on the date indicated.
85
Signature | Title | Date |
/s/ Dale Redman | Chief Executive Officer and Director (Principal Executive Officer) | March 27, 2018 |
Dale Redman | ||
/s/ Jeff Smith | Chief Financial Officer (Principal Financial Officer) | March 27, 2018 |
Jeff Smith | ||
/s/ Ian Denholm | Chief Accounting Officer (Principal Accounting Officer) | March 27, 2018 |
Ian Denholm | ||
/s/ Spencer D. Armour | Chairman | March 27, 2018 |
Spencer D. Armour, III | ||
/s/ Steve Beal | Director | March 27, 2018 |
Steve Beal | ||
/s/ Anthony Best | Director | March 27, 2018 |
Anthony Best | ||
/s/ Pryor Blackwell | Director | March 27, 2018 |
Pryor Blackwell | ||
/s/ Schuyler E. Coppedge | Director | March 27, 2018 |
Schuyler E. Coppedge | ||
/s/ Alan E. Douglas | Director | March 27, 2018 |
Alan E. Douglas | ||
/s/ Peter Labbat | Director | March 27, 2018 |
Peter Labbat | ||
/s/ Jack Moore | Director | March 27, 2018 |
Jack Moore | ||
86
EXHIBIT INDEX
Exhibit number | Description |
3.1 | |
3.2 | |
4.1 | |
4.2 | |
4.3 | |
4.4 | |
10.1 | |
10.2 | |
10.3# | |
10.4# | |
10.5# | |
10.6# | |
10.7# | |
10.8# | |
10.9# | |
87
10.10# | |
10.11# | |
10.12# | |
10.13# | |
10.14# | |
10.15# | |
10.16# | |
10.17# | |
10.18# | |
10.19# | |
10.20# | |
10.21# | |
10.22# | |
10.23# | |
10.24# | |
10.25# | |
88
10.26# | |
10.27# | |
10.28# | |
10.29 | |
21 | |
23 | |
31.1 | |
31.2 | |
32.1 | |
32.2 | |
# Compensatory plan, contract or arrangement.
89