Attached files
| file | filename |
|---|---|
| EX-32.1 - EXHIBIT 32.1 - Del Frisco's Restaurant Group, Inc. | dfrg-20171226xex32_1.htm |
| EX-31.2 - EXHIBIT 31.2 - Del Frisco's Restaurant Group, Inc. | dfrg-20171226xex31_2.htm |
| EX-31.1 - EXHIBIT 31.1 - Del Frisco's Restaurant Group, Inc. | dfrg-20171226xex31_1.htm |
| EX-23.1 - EXHIBIT 23.1 - Del Frisco's Restaurant Group, Inc. | dfrg-20171226xex23_1.htm |
| EX-21.1 - EXHIBIT 21.1 - Del Frisco's Restaurant Group, Inc. | dfrg-20171226xex21_1.htm |
| EX-10.1 - EXHIBIT 10.1 - Del Frisco's Restaurant Group, Inc. | dfrg-20171226xex10_1.htm |
SECURITIES AND EXCHANGE COMMISSION
Washington, D.C. 20549
FORM 10-K |
(Mark One)
☒ | ANNUAL REPORT PURSUANT TO SECTION 13 OR 15(d) OF THE SECURITIES EXCHANGE ACT OF 1934 |
For the fiscal year ended December 26, 2017
OR
☐ | TRANSITION REPORT PURSUANT TO SECTION 13 OR 15(d) OF THE SECURITIES EXCHANGE ACT OF 1934 |
For the transition period from to
Commission File Number 001-35611
 Del Frisco’s Restaurant Group, Inc. (Exact name of registrant as specified in its charter) |
Delaware | 20-8453116 | |
(State or other jurisdiction of incorporation or organization) | (I.R.S. Employer Identification No.) | |
| ||
2900 Ranch Trail, Irving, TX | 75063 | |
(Address of principal executive offices) | (Zip code) | |
(469) 913-1845 (Registrant’s telephone number, including area code) |
Securities registered pursuant to Section 12(b) of the Act: | ||
Title of each class | Name of each Exchange on which registered | |
Common Stock, $0.001 par value per share | The Nasdaq Global Select Market | |
Securities registered pursuant to Section 12(g) of the Act: None | ||
Indicate by check mark if the registrant is a well-known seasoned issuer, as defined in Rule 405 of the Securities Act. ☐ Yes ☒ No
Indicate by check mark if the registrant is not required to file reports pursuant to Section 13 or Section 15(d) of the Act. ☐ Yes ☒ No
Indicate by check mark whether the registrant (1) has filed all reports required to be filed by Section 13 or 15(d) of the Securities Exchange Act of 1934 during the preceding 12 months (or for such shorter period that the registrant was required to file such reports), and (2) has been subject to such filing requirements for the past 90 days. ☒ Yes ☐ No
Indicate by check mark whether the registrant has submitted electronically and posted on its corporate Web site, if any, every Interactive Data File required to be submitted and posted pursuant to Rule 405 of Regulation S-T during the preceding 12 months (or for such shorter period that the registrant was required to submit and post such files). ☒ Yes ☐ No
Indicate by check mark if disclosure of delinquent filers pursuant to Item 405 of Regulation S-K is not contained herein, and will not be contained, to the best of registrant’s knowledge, in definitive proxy or information statements incorporated by reference in Part III of this Form 10-K or any amendment to this Form 10-K. ☐
Indicate by check mark whether the registrant is a large accelerated filer, an accelerated filer, a non-accelerated filer, a smaller reporting company or an emerging growth Company (as defined in Rule 12b-2 of the Exchange Act). (Check one)
Large accelerated filer | ☐ | Accelerated filer | ☒ | |||
Non-accelerated filer | ☐ | Smaller reporting company | ☐ | |||
Emerging growth company | ☐ | |||||
If an emerging growth company, indicate by check mark if the registrant has elected not to use the extended transition period for complying with any new or revised financial accounting standards provided pursuant to Section 13(a) of the Exchange Act. ☐
Indicate by check mark whether the registrant is a shell company (as defined in Rule 12b-2 of the Exchange Act). ☐ Yes ☒ No
As of June 13, 2017, the last business day of the registrant’s most recently completed second fiscal quarter, the aggregate market value of the registrant’s common stock, $0.001 par value per share, held by non-affiliates was approximately $359.7 million.
As of March 23, 2018, 20,342,589 shares of the registrant’s common stock, $0.001 par value per share, were outstanding.
Documents Incorporated by Reference: Portions of the registrant’s Definitive Proxy Statement to be filed with the Securities and Exchange Commission no later than 120 days after the end of the registrant’s fiscal year ended December 26, 2017 are incorporated by reference in Part III of this Annual Report on Form 10-K.
TABLE OF CONTENTS
Page | |
| |
| |
| |
i
FORWARD LOOKING STATEMENTS
Certain statements made or incorporated by reference in this report and our other filings with the Securities and Exchange Commission, in our press releases and in statements made by or with the approval of authorized personnel constitute forward-looking statements within the meaning of Section 27A of the Securities Act of 1933, as amended, and Section 21E of the Securities Exchange Act of 1934, as amended, and are subject to the safe harbor created thereby. Forward looking statements reflect intent, belief, current expectations, estimates or projections about, among other things, our industry, management’s beliefs, and future events and financial trends affecting us. Words such as “anticipates,” “expects,” “intends,” “plans,” “believes,” “seeks,” “estimates,” “may,” “will” and variations of these words or similar expressions are intended to identify forward looking statements. In addition, any statements that refer to expectations, projections or other characterizations of future events or circumstances, including any underlying assumptions, are forward looking statements. Although we believe the expectations reflected in any forward looking statements are reasonable, such statements are not guarantees of future performance and are subject to certain risks, uncertainties and assumptions that are difficult to predict. Therefore, our actual results could differ materially and adversely from those expressed in any forward looking statements as a result of various factors. Additional important factors that could cause actual results to differ materially from those in the forward-looking statements include regional, national or global political, economic, business, competitive, market and regulatory conditions and include, but are not limited to, the following:
• | economic conditions (including customer spending patterns); |
• | our ability to compete; |
• | our ability to implement our growth strategy, including opening new restaurants, operating them profitably and accelerating development of our brands; |
• | customer experiences or negative publicity surrounding our restaurants; |
• | pricing and deliveries of food and other supplies; |
• | changes in consumer tastes and spending patterns; |
• | laws and regulations affecting labor and employee benefit costs, including increases in state and federally mandated minimum wages; |
• | labor shortages; |
• | general financial and credit market conditions; |
• | fixed rental payments and the terms of our indebtedness; and |
• | other factors described in "Item 1A. Risk Factors" included elsewhere in this Annual Report. |
All forward-looking statements in this report, or that are made on our behalf by our directors, officers or employees related to the information contained herein, apply only as of the date of this report or as of the date they were made. We undertake no obligation, except as required by applicable law, to publicly update any forward-looking statement, whether as a result of new information, future developments or otherwise.
ii
PART I
Item 1. Business
We were initially organized as a Delaware limited liability company on June 30, 2006 in connection with the acquisition by our former principal stockholder of Lone Star Steakhouse & Saloon, Inc., which owned the Del Frisco’s and Sullivan’s restaurant concepts. Following the acquisition, the company was restructured to separate certain other Lone Star Steakhouse & Saloon concepts by, among other things, spinning off the subsidiaries that owned and operated those concepts. We converted from a Delaware limited liability company to a Delaware corporation in July 2012 in connection with our initial public offering. Unless the context otherwise indicates, all references to “we,” “our,” “us,” or the “Company” refer to Del Frisco’s Restaurant Group, Inc. and its subsidiaries.
Our Company
We develop, own and operate three contemporary, high-end, complementary restaurants: Del Frisco’s Double Eagle Steakhouse, or the Double Eagle, Del Frisco’s Grille, or the Grille, and Sullivan’s Steakhouse, or Sullivan’s. We are a leader in the full-service steakhouse industry based on average unit volume ("AUV"), and EBITDA margin. We currently operate 53 restaurants in 23 states and the District of Columbia. Each of our three restaurant concepts offers steaks as well as other menu selections, such as chops and fresh seafood. These menu selections are complemented by an extensive, award-winning wine list. The Double Eagle, Grille and Sullivan’s are positioned within the fine dining segment and are designed to appeal to both business and local dining customers. Our Double Eagle restaurants are sited in urban locations to target customers seeking a “destination dining” experience while our Grille and Sullivan’s restaurants are intended to appeal to a broader demographic, allowing them to be located either in urban areas or in close proximity to affluent residential neighborhoods. We believe our success reflects consistent execution across all aspects of the dining experience, from the formulation of proprietary recipes to the procurement and presentation of high quality menu items and delivery of a positive customer experience.
Del Frisco’s Double Eagle Steakhouse
We believe the Del Frisco’s Double Eagle Steakhouse is one of the premier steakhouse concepts in the United States. The Del Frisco’s Double Eagle brand is defined by its menu, which includes USDA Prime grade, wet-aged and dry-aged steaks hand-cut at the time of order and a range of other high-quality offerings, including prime dry-aged lamb, fresh seafood, and signature side dishes and desserts. It is also distinguished by its “swarming service,” whereby customers are served simultaneously by multiple servers. Each restaurant has a sommelier to guide diners through an extensive, award-winning wine list and our bartenders specialize in hand-shaken martinis and crafted cocktails. Del Frisco’s Double Eagle restaurants target customers seeking a full-service, fine dining steakhouse experience. We believe the décor and ambiance, with both contemporary and classic designs, enhance our customers’ experience and differentiate Del Frisco’s Double Eagles from other upscale steakhouse concepts. We currently operate 13 Double Eagle steakhouses in nine states and the District of Columbia. These restaurants range in size from 11,000 to 24,000 square feet with seating capacity for at least 300 people. Additional Double Eagle openings are planned over the next year, and we anticipate they will range in size from 12,000 to 16,000 square feet. Annual AUVs per Double Eagle for locations open the entire year were $13.6 million for the fiscal year ended December 26, 2017. During the same period, the average check at these Double Eagle locations was $116.
Del Frisco’s Grille
We developed the Grille in 2011 to take advantage of the positioning of the Del Frisco’s brand and to provide greater potential for expansion due to its smaller size, lower build out cost and more diverse menu. The Grille is an upscale casual concept with a refreshing, modern menu that draws inspiration from bold flavors and fresh ingredients. It appeals broadly to both business and casual diners borrowing from the Del Frisco’s heritage with the same high quality Double Eagle prime aged steaks, top selling signature menu items and a broad selection of the same quality wines. In addition the Grille has an extensive menu creating new twists on American comfort classics including regional flavors and locally sourced ingredients. We believe the ambiance of the concept appeals to a wide range of customers seeking a less formal atmosphere for their dining occasions. Each Del Frisco’s Grille features a bar that is the centerpiece for a great night out. In 2017 we carried out an in depth Brand analysis with a leading third party consultant to assist us in better understanding growth opportunities and target guests. We currently operate 24 Grilles in 12 states and the District of Columbia. Additional Grille openings are planned over the next year, and we anticipate they will range in size from 6,500 to 8,000 square feet with seating capacity for at least 200 people. Annual AUVs per Grille restaurant for locations open the entire year were $4.9 million for the fiscal year ended December 26, 2017. During the same period, the average check at these Grille locations was $46.
1
Sullivan’s Steakhouse
Sullivan’s was created in the mid-1990’s as a complementary concept to Del Frisco’s. The Sullivan’s brand is defined by a fine dining experience at a more accessible price point, along with a vibrant atmosphere created by an open kitchen, live music and a bar area designed to be a center for social gathering and entertainment. Each Sullivan’s features fine hand-selected aged steaks, fresh seafood and a broad list of custom cocktails, along with an extensive selection of award-winning wines. We currently operate 16 Sullivan’s steakhouses in 13 states. These restaurants range in size from 7,000 to 11,000 square feet with seating capacity for at least 250 people. Annual AUVs per Sullivan’s restaurant were $3.8 million for the fiscal year ended December 26, 2017. During the same period, the average check at Sullivan’s was $65.
Site Selection and Development
We believe site selection is critical for the potential success of our restaurants. We have partnered with a third party master broker to source potential sites against a set of clear criteria for each Brand. We carefully consider growth opportunities for each of our restaurant concepts and utilize a customized approach for each concept when selecting and prioritizing markets for expansion. We perform comprehensive demographic and customer profile studies to evaluate and rationalize the trade areas and sites within each desired market. We leverage a significant number of sources to produce extensive research and analysis on the dynamics of the local area, the specific attributes of each site considered and the unit economics we believe we can realize. Our evaluation process also includes working with a third party spatial analytics company, which has developed a model to determine the most attractive locations for each of our Brands and a predictive sales model for specific sites. A Real Estate Committee, consisting of members of the Board and senior management visits, assesses and approves each site against a set of clear criteria.
For the Double Eagle brand, we focus primarily on sites in urban locations that allow us to easily access business clientele and customers seeking a premium dining experience. Many of our Double Eagle restaurants are in marquee locations, including waterfront property, popular shopping districts and active business centers. For our Grille and Sullivan’s concepts, we target sites in high traffic urban and suburban locations in close proximity to affluent residential areas. Our site assessment analysis includes three primary components: customer profiling (demographics, lifestyle segmentation, spend metrics, clustering/density analysis), trade area and site evaluation (physical inspection, competitive benchmarking, analysis of business generators/traffic patterns), and financial modeling (square footage and seat count analysis, predictive sales analytics, margin evaluations, investment cost and return metrics). Understanding our customers is an essential element of our market planning and site selection processes. We have developed a customer profile model for each of our concepts to help guide our development efforts and educate our development partners. We look for the following minimum criteria in our site trade areas:
Population(a) | Daytime Population(a) | Average HH Income | Median Age | Priority Age Blocks(b) | Traffic Counts(c) | |||
| ||||||||
 | 100,000+ | 150,000+ | $ | 100,000 | + | 40+ | 35-44; 45-54; 55-64 | 40,000+ |
| ||||||||
 | 75,000+ | 100,000+ | $ | 75,000 | + | 35+ | 25-34; 35-44; 45-54 | 25,000+ |
 | 75,000+ | 100,000+ | $ | 75,000 | + | 35+ | 35-44; 45-54 | 25,000+ |
| ||||||||
(a)Represents the population within a customized target area generally with less than a 20-minute drive time.
(b)Represents the targeted age demographics for a prospective site.
(c)Represents the targeted average daily vehicle traffic for a prospective site.
We expect the size of new Double Eagle restaurants to range from 12,000 to 16,000 square feet, new Grille restaurants to range from 6,500 to 8,000 square feet and new Sullivan’s restaurants to range from 8,000 to 9,000 square feet. For the opening of a new restaurant, we measure our cash investment costs net of landlord contributions and equipment financing, but including pre-opening costs. We target average cash investment costs of $7.0 million to $9.0 million for a new Double Eagle and $3.5 million to $4.5 million for a new Grille or Sullivan’s. We target a cash-on-cash return of at least 30% beginning in the third operating year across our concepts with target restaurant-level EBITDA margins of between 25% and 35% for each of our three concepts.
We believe there are opportunities to open four to seven new restaurants annually, generally composed of three to four Double Eagles and one to three Grilles, with new openings of our Double Eagle concept likely serving as the primary driver of new
2
unit growth in the near term. During the fiscal year ending on December 25, 2018, we expect to open three to four Double Eagles and two to three Grilles. It generally takes 9 to 12 months after the signing of a lease or the closing of a purchase to complete construction and open a new restaurant. Additional time is sometimes required to obtain certain government approvals, permits and licenses, such as liquor licenses.
Restaurant Operations and Management
Our restaurants have a distinctive combination of food, atmosphere and service in an upscale environment. We believe that our success reflects the consistency of our execution across all aspects of the dining experience, from the formulation of proprietary recipes, to the procurement and presentation of high quality menu items and the delivery of a positive customer experience. We strive to provide quality through a carefully controlled and established supply chain and proven preparation techniques.
Depending on the volume of each restaurant, our typical restaurant-level management team ranges from 4 to 10 people including one general manager, one executive chef and a team of assistant managers and sous chefs. We also have an experienced team of regional directors to oversee operations at multiple restaurants. To ensure that each restaurant and its employees meet our demanding performance requirements, we have developed a set of strict operational standards that are followed in all facets of our operations. For example, these standards are used to develop corporate recipes, many of which are proprietary, that are adhered to across all of our restaurants. These standards also mandate a quality control process for the menu items in each of our restaurants that our chefs and managers oversee before each shift. This quality control process includes the full preparation of each item on our menu, other than our steaks, and the testing of each of these items for presentation, taste, portion size and temperature before they are prepared for our customers. Items that do not meet our rigorous standards are re-made until they do. We believe this process of full preparation for testing differentiates us from our competition.
The consistent execution at our restaurants is a result of the extensive training and supervision of our employees. Our general managers are required to undergo eight to ten weeks of initial training in food quality, customer service, alcohol beverage service, liquor liability avoidance and employee retention programs. Each of our new hourly employees also typically participates in a training program during which the employee works under the close supervision of his or her general manager. Our chefs and their assistants receive extensive training in food quality, food supply management and kitchen maintenance. All of our employees are trained to uphold each concept’s distinct characteristics and our overall values and operating philosophy.
Our training programs are administered by the general manager at each restaurant and supervised by our chief people officer and a dedicated training director for each concept. This training team ensures that all new general managers have developed a comprehensive set of tools that they can use to manage their restaurant, including employee selection, performance management and wage and hourly compliance. We also require each general manager to obtain a mandatory internal certification in areas of the kitchen, dining room and bar area. Our training team also supports new restaurant openings. Each of our concepts have developed a streamlined training program that ensures employees opening a new restaurant function as a cohesive team and maintain our high operational and food preparation standards. As a result, our corporate and concept-level infrastructure supports our growth strategy, allowing us to successfully replicate our standards in new restaurants.
Sourcing and Supply Chain
Our ability to maintain the consistent quality of our restaurants depends in part on our ability to procure food and other supplies from reliable sources in accordance with the specifications for all food products established by our corporate executive chef. We continually research and evaluate products and supplies to ensure high quality meat, seafood and other menu ingredients. Our corporate executive chef and director of purchasing work with Stock Yards, a division of U.S. Foods, Inc., our primary beef supplier, as well as secondary beef suppliers, for all beef purchases on a national level. Our director of purchasing negotiates directly with suppliers of meat, seafood and certain other food and beverage products to ensure consistent quality and freshness and to obtain competitive prices for items purchased nationally for each concept. Our strong relationships with national and regional foodservice distributors ensure that our restaurants receive a constant supply of products. Products are shipped directly to the restaurants, and we do not maintain a central product warehouse or commissary.
Our corporate executive chef and our director of purchasing also establish strict product specifications for those items purchased at the local level. Purchasing at each restaurant is directed primarily by each restaurant’s chef, who is trained in our purchasing philosophy and specifications, and who works with regional and corporate managers to ensure consistent products. Each of our restaurants also has an in-house sommelier responsible for purchasing wines based on customer preferences, market availability and menu content.
We have not experienced any significant delays in receiving restaurant supplies and equipment. Although we currently do not engage in futures contracts or other financial risk management strategies with respect to potential price fluctuations, from time to time, we may opportunistically enter into fixed price beef supply contracts or contracts for other food products or consider
3
other risk management strategies with regard to our meat and other food costs to minimize the impact of potential price fluctuations. This practice could help stabilize our food costs during times of fluctuating prices, although there can be no assurances that this will occur.
Marketing and Advertising
We believe that our commitment to providing quality food, hospitality, service and a high level of value for each price point is an effective approach to attracting customers and maintaining their loyalty. We use a variety of national, regional and local marketing and public relations techniques intended to maintain and build our customer traffic, maintain and enhance our concepts’ images and continually improve and refine our upscale experience. In addition, local restaurant marketing is important to the success of our concepts. For example, each restaurant’s general manager cultivates relationships with local businesses and luxury hotels that drive the restaurant’s business, in particular its private dining business. We also work with a national public relations firm that coordinates local firms in connection with new restaurant openings. The Double Eagle, Grille and Sullivan’s each use specific marketing and advertising initiatives to position the concepts in the applicable segment of our industry, including advertisement placement in magazines, digital advertising and social media targeting the affluent segment of the population.
Competition
The full-service steak industry and general upscale restaurant businesses are highly competitive and fragmented, and the number, size and strength of competitors vary widely by region, especially within the general upscale restaurant segment. We believe restaurant competition is based on quality of food products, customer service, reputation, restaurant décor, location, name recognition and price. Depending on the specific concept, our restaurants compete with a number of restaurants within their markets, both locally-owned restaurants and restaurants that are part of regional or national chains. The principal competitors for our Double Eagle and Sullivan’s concepts are other upscale steakhouses including local independents and chains such as Fleming’s Prime Steakhouse and Wine Bar, The Capital Grille, Smith & Wollensky, The Palm, Ruth’s Chris Steak House and Morton’s The Steakhouse. The principal competitors for our Grille concept also include other upscale chains such as Hillstone, Paul Martin’s American Grill and Earl’s Kitchen + Bar. Our concepts also compete with additional restaurants in the broader upscale dining segment.
Seasonality
Our business is subject to seasonal fluctuations comparable to most restaurants. Historically, like other restaurants in our segment, the percentage of our annual revenues earned during the first and fourth fiscal quarters has been typically higher due to holiday traffic, increased gift card purchases and redemptions and increased private dining during the year-end holiday season. In addition, we operate on a 52- or 53-week fiscal year ending the last Tuesday of each December, and our first, second and third quarters each contain 12 operating weeks with the fourth quarter containing 16 or 17 operating weeks. Starting in fiscal 2018, we will begin to use 12 periods for our fiscal reporting calendar, meaning that our first, second and third quarters will each contain 13 operating weeks with the fourth quarter containing 13 or 14 operating weeks. The fiscal years ended December 26, 2017, December 27, 2016 and December 29, 2015, which we refer to as fiscal 2017, fiscal 2016 and fiscal 2015, respectively, had 52 weeks. The following fiscal year that will end on December 25, 2018, which we refer to as fiscal 2018, will also have 52 weeks.
Intellectual Property
We have registered the names Del Frisco’s, Double Eagle Steakhouse, Sullivan’s, and Del Frisco’s Grille and have applications pending to register certain other names and logos as trade names, trademarks or service marks with the United States Patent and Trademark Office and in certain foreign countries. We have the exclusive right for use of these trademarks throughout the United States, other than with respect to the following. A third party that operates a single restaurant in Louisville, Kentucky has an exclusive license to use Del Frisco’s name within a 50-mile radius of Louisville, Kentucky. We do not have any right to any future or recurring payments from or have any affirmative payment obligations to the third party and they are responsible for all costs associated with running their respective location, including all commodity and labor costs and any risks related thereto. In fiscal 2016, we entered into an agreement to obtain and clarify the naming rights in certain counties in Kentucky, Indiana and Ohio related to this unrelated third party for aggregate consideration of $0.6 million. We are also aware of names similar to those of our restaurants used by various third parties in certain limited geographical areas. We believe that our trade names, trademarks and service marks are valuable to the operation of our restaurants and are important to our marketing strategy.
4
Government Regulation
Our restaurants are subject to licensing and regulation by state and local health, safety, fire and other authorities, including licensing and regulation requirements for the sale of alcoholic beverages and food. We maintain the necessary restaurant, alcoholic beverage and retail licenses, permits and approvals. The development and construction of additional restaurants will also be subject to compliance with applicable zoning, land use and environmental regulations. Federal and state labor laws govern our relationship with our employees and affect operating costs. These laws regulate, among other things, minimum wage, overtime, tips, tip credits, unemployment tax rates, workers’ compensation rates, health insurance, citizenship requirements and other working conditions. Our restaurants are subject in each state in which we operate to “dram shop” laws, which allow, in general, a person to sue us if that person was injured by an intoxicated person who was wrongfully served alcoholic beverages at one of our restaurants. A judgment against us under a dram shop law could exceed our liability insurance coverage policy limits and could result in substantial liability for us and have a material adverse effect on our results of operations and financial condition. Our inability to continue to obtain such insurance coverage at reasonable costs also could have a material adverse effect on us. We are also subject to the federal Americans with Disabilities Act, which prohibits discrimination on the basis of disability in public accommodations and employment.
Employees
As of December 26, 2017, we had approximately 4,890 employees. Many of our hourly employees are employed on a part-time basis to provide services necessary during peak periods of restaurant operations. None of our employees are covered by a collective bargaining agreement. We believe that we have good relations with our employees.
Executive Officers and Key Employees
The following table sets forth certain information regarding our executive officers and certain of our key employees.
Name | Age | Position | ||
Norman J. Abdallah | 55 | Chief Executive Officer; Director | ||
Neil Thomson | 47 | Chief Financial Officer | ||
Brandon C. Coleman | 35 | President, Del Frisco's Grille | ||
Thomas G. Dritsas | 47 | Vice President of Culinary & Corporate Executive Chef | ||
William S. Martens | 45 | Executive Vice President, Chief Development Officer | ||
Ray D. Risley | 52 | President, Del Frisco’s Double Eagle | ||
April L. Scopa | 50 | Executive Vice President, Chief People Officer | ||
Scott C. Smith | 62 | President, Sullivan’s | ||
Norman J. Abdallah has served as Chief Executive Officer since November 2016. Mr. Abdallah has also served as a member of the Board since July 2012. Mr. Abdallah also served as a member of the Company’s Advisory Board from March 2011 to July 2012. Previously, Mr. Abdallah served as an Operating Partner for CIC Partners, a private equity firm, in the role of Chief Executive Officer of TM Restaurant Holdings LLC from September 2014 to September 2016 and Executive Chairman of Willies Grill & Icehouse Holdings LLC, a restaurant company, from September 2014 to October 2016. From December 2013 through September 2014, Mr. Abdallah served as Chief Executive Officer of Counter Concepts, LLC, a private equity firm. From May 2013 through December 2013, Mr. Abdallah served as interim Chief Executive Officer of Dinosaur Bar-B-Que, a restaurant operating company. Mr. Abdallah formerly served as the Chief Executive Officer of Romano’s Macaroni Grill, a restaurant operating company, from 2010 through April 2013. Prior to joining Romano’s Macaroni Grill, Mr. Abdallah served as Chief Executive Officer of Restaurants Unlimited Inc., a privately-held multi-concept restaurant company, from 2009 to 2010. Prior to joining Restaurants Unlimited, Mr. Abdallah served as the Chief Executive Officer and Co-Founder of Fired Up, Inc., the parent company of U.S.-based casual dining concept Carino’s Italian, from 1997 to 2008. Mr. Abdallah has also served as a member of the Board of Directors of California Pizza Kitchen, Inc., a restaurant operating company, from 2011 to April 2013.
Neil Thomson has served as Chief Financial Officer since May 2017. Prior to Del Frisco’s, he served as Chief Growth Officer of the Pizza Hut Asia Pacific region, a position he held from January 2017 to May 2017. Before that, Mr. Thomson served as the Chief Development Officer for Pizza Hut International from January 2014 to December 2016. Prior to that, he served for two years as the Vice President of Finance for Yum! Restaurants International, an international owner, operator and franchisor of restaurants, from January 2012 to December 2013. He also served as the CFO of Yum! Restaurants International India subcontinent business from 2007 to 2011 and at KFC UK from 2002 to 2007 he served initially as Controller and subsequently as Commercial Director. Prior to joining Yum!, Mr. Thomson held the role of Finance Director at an internet start-up company.
5
Mr. Thomson also served in a number of finance and supply chain roles for five years at McDonald’s UK after starting his career at KPMG in London.
Brandon C. Coleman has served as President of Del Frisco’s Grille since September 2017. Before this role, he served as Chief Marketing Officer from December 2016 until September 2017. Prior to joining our company, from 2013 to 2016, Mr. Coleman served as the Chief Executive Officer and lead management consultant for Brava Partners, a brand consulting firm, where he led engagements for over nineteen brands. Prior to Brava Partners, in 2013, Mr. Coleman served as the Chief Marketing Officer for Snapfinger, Inc., an online restaurant ordering and technology company, where he led sales, marketing and product development initiatives. Prior to Snapfinger, Inc., from 2010 to 2013, Mr. Coleman served as the Chief Marketing Officer for Romano’s Macaroni Grill, a restaurant operating company. Prior to Macaroni Grill, from 2009 to 2010, Mr. Coleman served as the Vice President of Marketing for Restaurants Unlimited, Inc. Mr. Coleman’s career began with global advertising leader McCann Erickson NY.
Thomas G. Dritsas has served as Vice President of Culinary & Corporate Executive Chef since December 2006 and oversees the day to day culinary operations of Del Frisco’s, Sullivan’s and the Grille. From 2003 to 2006, Mr. Dritsas served as Corporate Executive Chef for Lone Star Steakhouse & Saloon, Inc., during which time he oversaw the daily culinary operations for each of its concepts. Mr. Dritsas joined Lone Star Steakhouse & Saloon, Inc. in 1999 and served in various culinary capacities, including as part of new opening teams. Prior to joining Lone Star Steakhouse & Saloon, Mr. Dritsas assisted in the opening of numerous independent restaurants and operated his own restaurant.
William S. Martens was promoted to Executive Vice President and Chief Development Officer in October of 2017. Mr. Martens served as Chief Development Officer since November 2016, and previously as Vice President of Development & Construction since 2011, and is responsible for market planning, site selection, site acquisition and construction for our three concepts. Mr. Martens also oversees concept design, portfolio management and facilities operations. Mr. Martens has been with us since 2008, previously serving as our Director of Development where he managed all facets of new unit development and established the infrastructure to support our growth in new and existing markets. Before joining our company, Mr. Martens served as Vice President of Portfolio Management with Hudson Americas, LLC, from 2007 to 2008. Prior to Hudson Americas, Mr. Martens spent nine years with Yum! Brands, where he held multiple leadership roles in Finance and Development, including the position of Senior Manager of Development. In this role, he worked with senior brand leadership teams to develop market plans, define asset strategies and make capital appropriations decisions for approximately 350 new restaurants annually.
Ray D. Risley has served as President, Del Frisco’s Double Eagle since January 2017. From December 2015 to December 2016, Mr. Risley was Senior Vice President of Operations for the Grille. From October 2013 to December 2015, Mr. Risley was Vice President of Operations for Sullivan’s Steakhouse. Prior to becoming Vice President of Operations for Sullivan’s, Mr. Risley served as a Regional Manager for restaurants under all three of our brands, as well as overseeing the openings of a number of new restaurants. Prior to becoming a Regional Manager, Mr. Risley served as a Regional General Manager of Del Frisco's and Sullivan's from 2005 to the end of 2007, during which time he also assumed the role of General Manager of the Del Frisco's restaurant in New York. From 2003 to 2005, Mr. Risley served as Regional Manager for all 15 Sullivan's Steakhouse restaurants. From 2000 to 2003, Mr. Risley was District General Manager for four Sullivan's Steakhouse restaurants. Mr. Risley joined Del Frisco's Restaurant Group in 1998 as the General Manager of the Sullivan's Steakhouse restaurant in Dallas. Previously, Mr. Risley held various management positions with the Morton's chain of steakhouse restaurants, including General Manager of the Beverly Hills location and with the original Spago restaurant as the General Manager.
April L. Scopa was promoted to Executive Vice President and Chief People Officer in October 2017. Previously Ms. Scopa served as Chief People Officer, a position she held from November 2016 to October 2017, and as Vice President of People and Education from June 2011 to November 2016, and is responsible for recruiting, human resources, talent development and training strategy. Prior to joining our company, Ms. Scopa worked with Landmark Leisure Group, a national leader in entertainment development since June 2010 and served as VP of People & Development, beginning in January 2011, where she led the human resources, recruiting, new store opening development, employee relations, talent management and personnel development strategy. Prior to Landmark, Ms. Scopa spent eight years with The Capital Grille, an upscale steakhouse division of Darden Restaurants, as Director of Operations and Senior Director of Training, where her responsibilities most recently included quality of operations, people and P&L results for six locations. Prior to The Capital Grille, Ms. Scopa also worked for C.A. Muer Corporation and LongHorn Steakhouse, both in a training and operations capacity.
Scott C. Smith has served as President, Sullivan’s since January 2017. Prior to joining our company, from 2013 to 2016, Mr. Smith most recently served as the Chairman and CEO of Day Star Restaurant Group, which owns and operates Texas Land & Cattle and Lone Star Steak House restaurants. Prior to Day Star, from 2011 to 2013, Mr. Smith was Senior Vice President of Operations at Romano’s Macaroni Grill, a restaurant operating company. Prior to Romano’s Macaroni Grill, from 2009 to 2011, Mr. Smith served as Chief Operating Officer of Restaurants Unlimited and later as the President and CEO. Prior to Restaurants Unlimited, from 2008 to 2009, Mr. Smith served as the President and CEO of AMER Restaurant Group, which operated a
6
portfolio of restaurants in Cairo, Egypt. Prior to AMER Restaurant Group, Mr. Smith served in various leadership positions in various companies throughout the restaurant industry, including Brinker International, in addition to founding, owning and operating different restaurant concepts.
Financial Information
The financial information that is required to be included in this Item 1, Business is set forth in Item 6, Selected Financial Data and in note 12 in the notes to the consolidated financial statements.
Available Information
Our website address is www.dfrg.com, and we also host www.delfriscos.com, www.sullivanssteakhouse.com and www.delfriscosgrille.com. Information contained on our websites or connected thereto does not constitute a part of this Annual Report on Form 10-K or any other filing we make with the Securities and Exchange Commission, or the SEC. We make available free of charge on our website our Annual Reports on Form 10-K, Quarterly Reports on Form 10-Q, Current Reports on Form 8-K and amendments to those reports filed or furnished pursuant to Section 13(a) or 15(d) of the Securities Exchange Act of 1934, as amended, or the Exchange Act, as soon as reasonably practical after we file such material with, or furnish it to, the SEC. Certain of these documents may also be obtained by calling the SEC at 1-800-SEC-0330. The SEC also maintains an Internet website that contains reports, and other information regarding issuers that file electronically with the SEC at www.sec.gov. We also make available free of charge on our website our Corporate Governance Guidelines, our Code of Business Conduct and Ethics, and the Charters of our Audit Committee, Nominating and Corporate Governance Committee, and Compensation Committee of our Board of Directors.
7
Item 1A. Risk Factors
Changes in general economic conditions, including economic uncertainty, have adversely impacted our business and results of operations, may continue to do so and may do so in the future.
Purchases at our restaurants are discretionary for consumers, and we are therefore susceptible to economic slowdowns. We believe that consumers generally are more willing to make discretionary purchases, including high-end restaurant meals, during favorable economic conditions. Economic uncertainty, including high unemployment and financial market volatility and unpredictability, including as a result of events similar to the recent economic recession, and the related reduction in consumer confidence, can negatively affect customer traffic and sales throughout our industry, including our segment. If the economy experiences a new downturn or there are continued uncertainties regarding U.S. budgetary and fiscal policies, including recent tax legislation, our customers, including our business clientele, may reduce their level of discretionary spending, impacting the frequency with which they choose to dine out or the amount they spend on meals while dining out. We believe the majority of our weekday revenues in our Del Frisco’s Double Eagle and Sullivan’s concepts are derived from business customers using expense accounts, and our business therefore may be affected by reduced expense account or other business-related dining by our business clientele. If business clientele were to dine less frequently at our restaurants, our business and results of operations would be adversely affected as a result of a reduction in customer traffic or average revenues per customer.
There is also a risk that if uncertain or depressed economic conditions persist for an extended period of time, consumers might make long-lasting changes to their discretionary spending behavior, including dining out less frequently. Difficult economic conditions and recessionary periods may have an adverse impact on our business and our financial condition. Negative economic conditions, coupled with high volatility and uncertainty as to the future global economic landscape, have at times had a negative effect on consumers' discretionary income and consumer confidence and similar impacts can be expected should such conditions recur. A decrease in discretionary spending due to decreases in consumer confidence in the economy or us, or a continued economic slowdown or deterioration in the economy, could adversely affect our business and cause us to, among other things, reduce the number and frequency of new restaurant openings, close restaurants and delay our re-modeling of existing locations.
If our restaurants are not able to compete successfully with other restaurants, our business and results of operations may be adversely affected.
Our industry is intensely competitive with respect to price, quality of service, restaurant location, ambiance of facilities and type and quality of food. A substantial number of national and regional restaurant chains and independently owned restaurants compete with us for customers, restaurant locations and qualified management and other restaurant staff. Our concepts also compete with additional restaurants in the broader upscale dining segment. Some of our competitors have greater financial and other resources, have been in business longer, have greater name recognition and are better established in the markets where our restaurants are located or where we may expand. Our inability to compete successfully with other restaurants may harm our ability to maintain acceptable levels of revenue growth, limit or otherwise inhibit our ability to grow one or more of our concepts, or force us to close one or more of our restaurants. We may also need to evolve our concepts in order to compete with popular new restaurant formats or concepts that emerge from time to time, and we cannot provide any assurance that we will be successful in doing so or that any changes we make to any of our concepts in response will be successful or not adversely affect our profitability. In addition, with improving product offerings at fast casual restaurants and casual dining restaurants combined with the effects of uncertain economic conditions and other factors, consumers may choose less expensive alternatives, which could also negatively affect customer traffic at our restaurants. Any unanticipated slowdown in demand at any of our restaurants due to industry competition may adversely affect our business and results of operations.
Our future growth depends in part on our ability to open new restaurants and operate them profitably, and if we are unable to successfully execute this strategy, our results of operations could be adversely affected.
Our financial success depends in part on management’s ability to execute our growth strategy. One key element of our growth strategy is opening new restaurants. We believe there are opportunities to open four to seven new restaurants annually, in near term, generally composed of three to four Del Frisco’s Double Eagles and one to three Grilles, with new openings of our Double Eagle concept likely serving as the primary driver of new unit growth in the near term. In fiscal 2017, we opened one Del Frisco's Double Eagle in Plano, TX and one Grille at Brookfield Place in New York City, NY. In fiscal 2018, we expect to open three to four Double Eagles and two to three Grilles. For the opening of a new restaurant, we measure our cash investment costs net of landlord contributions and equipment financing, but including pre-opening costs. We target average cash investment costs of $7.0 million to $9.0 million for a new Double Eagle and $3.5 million to $4.5 million for a new Grille or Sullivan’s.
8
Our ability to open new restaurants and operate them profitably is dependent upon a number of factors, many of which are beyond our control, including:
• | finding quality site locations, competing effectively to obtain quality site locations and reaching acceptable agreements to lease or purchase sites; |
• | complying with applicable zoning, land use and environmental regulations and obtaining, for an acceptable cost, required permits and approvals; |
• | having adequate capital for construction and opening costs and efficiently managing the time and resources committed to building and opening each new restaurant; |
• | timely hiring, training and retaining the skilled management and other employees necessary to meet staffing needs; |
• | successfully promoting our new locations and competing in their markets; |
• | acquiring food and other supplies for new restaurants from local suppliers; and |
• | addressing unanticipated problems or risks that may arise during the development or opening of a new restaurant or entering a new market. |
A new restaurant typically experiences a “ramp-up” period of approximately 18 months before it achieves our targeted level of performance. This is due to the costs associated with opening a new restaurant, as well as higher operating costs caused by start-up and other temporary inefficiencies associated with opening new restaurants. For example, there are a number of factors which may impact the amount of time and money we commit to the construction and development of new restaurants, including landlord delays, shortages of skilled labor, labor disputes, shortages of materials, delays in obtaining necessary permits, local government regulations and weather interference. Once the restaurant is open, how quickly it achieves a desired level of profitability is impacted by many factors, including the level of market familiarity and acceptance when we enter new markets, as well as the availability of experienced staff and the time required to negotiate reasonable prices for services and other supplies from local suppliers. Our business and profitability may be adversely affected if the “ramp-up” period for a new restaurant lasts longer than we expect.
If we are unable to increase our sales or maintain our margins at existing restaurants, our profitability and overall results of operations may be adversely affected.
Another key aspect of our growth strategy is increasing comparable restaurant sales and maintaining restaurant-level margins. Improving comparable restaurant sales and maintaining restaurant-level margins depends in part on whether we achieve revenue growth through increases in the average check and further expand our private dining business at each restaurant. We believe there are opportunities to increase the average check at our restaurants through, for example, selective introduction of higher priced items and increases in menu pricing. We also believe that expanding and enhancing our private dining capacity will also increase our restaurant sales, as our private dining business typically has a higher average check and higher overall margins than regular dining room business. However, these strategies may prove unsuccessful, especially in times of economic hardship, as customers may not order or enjoy higher priced items and discretionary spending on private dining events may decrease. Select price increases have not historically adversely impacted customer traffic; however, we expect that there is a price level at which point customer traffic would be adversely affected. It is also possible that these changes could cause our sales volume to decrease. If we are not able to increase our sales at existing restaurants for any reason, our profitability and results of operations could be adversely affected.
The failure to successfully accelerate development of our Del Frisco's Double Eagle Steakhouse concept could have a material adverse effect on our financial condition and results of operations.
We operated 13 Del Frisco's Double Eagle Steakhouse locations as of the end of fiscal 2017. During fiscal 2017, we began accelerating development of the Del Frisco's Double Eagle concept, and plan to annually open three to four restaurants, with new openings of our Double Eagle concept likely serving as the primary driver of new unit growth in the near term. Our ability to execute this initiative will require significant capital expenditures and management attention. If the “ramp-up” period for one or more of the new Del Frisco's Double Eagle restaurants does not meet our expectations, our operating results may be adversely affected. In addition, we are targeting restaurant-level EBITDA margins of between 25% and 35% for the Del Frisco's Double Eagle concept. However, because we face new challenges at the Del Frisco's Double Eagle restaurants as we enter new markets, our operating margins may not reach these levels, requiring us to take action, including possible changes to our pricing and menu offering strategies, and we may not be successful in recouping our increased investments in the concept. We may not be able to attract enough customers to meet targeted levels of performance at new restaurants because potential customers may be unfamiliar with our concept or the atmosphere or menu might not appeal to them. In addition, opening a new
9
Del Frisco's Double Eagle restaurant in one of our existing markets could reduce the revenue of our existing restaurants in that market. If we cannot successfully execute our growth strategies for the Del Frisco's Double Eagle concept, or if customer traffic generated by a Del Frisco's Double Eagle restaurant results in a decline in customer traffic at one of our other restaurants in the same market, our business and results of operations may be adversely affected..
The failure to continue to successfully develop our Grille concept could have a material adverse effect on our financial condition and results of operations.
We launched our newest concept, the Grille, in the third quarter of fiscal 2011 with the opening of our New York City location, and have grown the concept to 24 locations as of the end of fiscal 2017. Our ability to continue to succeed with this new concept will require significant capital expenditures and management attention and is subject to certain risks in addition to those of opening a new restaurant under one of our existing concepts, including customer acceptance of and competition to that concept. If the “ramp-up” period for our Grille restaurants and for our development of concepts in general does not meet our expectations, our operating results may be adversely affected. In addition, we are targeting restaurant-level EBITDA margins of between 25% and 35% for the Grille. However, because we face new challenges at the Grille as we enter new markets, we cannot provide any assurance that our operating margins will achieve these levels. As a result, we may need to adjust our pricing and menu offering strategies. We may not be successful enough to recoup our investments in the concept. There can be no assurance that we will be successful in further developing and growing the Grille or in developing and growing any other new concept to a point where it will become profitable or generate positive cash flow or that it will prove to be a platform for future expansion. We may not be able to attract enough customers to meet targeted levels of performance at new restaurants because potential customers may be unfamiliar with our concept or the atmosphere or menu might not appeal to them. Some Grille locations may even operate at a loss, which could have a material adverse effect on our overall operating results. In addition, opening a new restaurant concept such as a Grille in an existing market could reduce the revenue of our existing restaurants in that market. If we cannot successfully execute our growth strategies for the Grille, or if customer traffic generated by the Grille results in a decline in customer traffic at one of our other restaurants in the same market, our business and results of operations may be adversely affected.
Our growth, including the continued development of the Del Frisco's Double Eagle and Grille concepts, may strain our infrastructure and resources, which could delay the opening of new restaurants and adversely affect our ability to manage our existing restaurants.
We plan to continue new restaurant growth, including the continued development and promotion of the Del Frisco's Double Eagle concept. We believe there are opportunities to open four to seven restaurants annually, generally composed of three to four Double Eagles and one to three Grilles, with new openings of our Double Eagle concept likely serving as the primary driver of new unit growth in the near term. During fiscal 2018, we expect to open three to four Double Eagles and two to three Grilles. We typically target an average cash investment of approximately $7.0 million to $9.0 million per restaurant for a Double Eagle restaurant and $3.5 million to $4.5 million for a Grille or Sullivan’s, in each case net of landlord contributions and equipment financing and including pre-opening costs. In addition, we are currently “refreshing” a number of our Del Frisco’s Double Eagles and Sullivan’s to, among other things, add additional seating, a new champagne lounge, private dining space and patio seating. During fiscal 2017, we completed remodels of two Double Eagles and three Sullivan’s. We expect to complete two to four refreshes each year at an approximate cost of $0.5 million to $2.0 million per location. This growth and these investments will increase our operating complexity and place increased demands on our management as well as our human resources, purchasing and site management teams. While we have committed significant resources to expanding our current restaurant management systems, financial and management controls and information systems in connection with our recent growth, if this infrastructure is insufficient to support this expansion, our ability to open new restaurants, including the continued development and promotion of the Double Eagle and the Grille, and to manage our existing restaurants, including the expansion of our private dining business, would be adversely affected. If we fail to continue to improve our infrastructure or if our improved infrastructure fails, we may be unable to implement our growth strategies or maintain current levels of operating performance in our existing restaurants.
Our New York Del Frisco’s Double Eagle location represents a significant portion of our revenues, and any significant downturn in its business or disruption in the operation of this location could harm our business, financial condition and results of operations.
Our New York Del Frisco’s Double Eagle location represented approximately 11%, 11% and 12% of our revenues in fiscal 2017, 2016 and 2015, respectively. Accordingly, we are susceptible to any fluctuations in the business at our New York Double Eagle location, whether as a result of adverse economic conditions, negative publicity, changes in customer preferences or for other reasons. In addition, any natural disaster, prolonged inclement weather, act of terrorism or national emergency, accident, system failure or other unforeseen event in or around New York City could result in a temporary or permanent closing of this location, could influence potential customers to avoid this geographic region or this location in particular or otherwise lead to a
10
decrease in revenues. Any significant interruption in the operation of this location or other reduction in sales could adversely affect our business and results of operations.
Negative customer experiences or negative publicity surrounding our restaurants or other restaurants could adversely affect sales in one or more of our restaurants and make our brands less valuable.
The quality of our food and our restaurant facilities are two of our competitive strengths. Therefore, adverse publicity, whether or not accurate, relating to food quality, public health concerns, illness, safety, injury or government or industry findings concerning our restaurants, restaurants operated by other foodservice providers or others across the food industry supply chain could affect us more than it would other restaurants that compete primarily on price or other factors. An unrelated restaurant in Louisville, Kentucky has the right to use, and uses, a specific registration of the Del Frisco’s name pursuant to a concurrent use agreement, as described in greater detail in “Item 1. Business”. We do not own or control the Louisville restaurant, but any adverse publicity relating to those operations could negatively affect us. In addition, although we would not be legally liable for any such failure, because the Louisville restaurant operates under one of our brand names, we may be subject to litigation as a result of the restaurant’s failure to comply with food quality, preparation or other applicable rules and regulations. If customers perceive or experience a reduction in our food quality, service or ambiance or in any way believe we have failed to deliver a consistently positive experience, the value and popularity of one or more of our concepts could suffer.
Negative publicity relating to the consumption of beef, including in connection with food-borne illness, could result in reduced consumer demand for our menu offerings, which could reduce sales.
Instances of food-borne illness, including Bovine Spongiform Encephalopathy, which is also known as BSE or mad cow disease, aphthous fever, which is also known as hoof and mouth disease, as well as hepatitis A, lysteria, salmonella and e-coli, whether or not found in the United States or traced directly to one of our suppliers or our restaurants, could reduce demand for our menu offerings. Any negative publicity relating to these and other health-related matters, such as the confirmation of a case of mad cow disease in a dairy cow in California in April 2012, may affect consumers’ perceptions of our restaurants and the food that we offer, reduce customer visits to our restaurants and negatively impact demand for our menu offerings. Adverse publicity relating to any of these matters, beef in general or other similar concerns could adversely affect our business and results of operations.
Increases in the prices of, and/or reductions in the availability of commodities, primarily beef, could adversely affect our business and results of operations.
Our profitability depends in part on our ability to anticipate and react to changes in commodity costs, which have a substantial effect on our total costs. For example, we purchase large quantities of beef, particularly USDA prime beef and premium choice beef. Our beef costs represented approximately 33%, 32% and 34% of our food and beverage costs during fiscal 2017, 2016 and 2015, respectively, and we currently do not purchase beef pursuant to any long-term contractual arrangements with fixed pricing or use futures contracts or other financial risk management strategies to reduce our exposure to potential price fluctuations. The market for USDA prime beef and premium choice beef is particularly volatile and is subject to extreme price fluctuations due to seasonal shifts, climate conditions, the price of feed, industry demand, energy demand and other factors. Although we currently do not engage in futures contracts or other financial risk management strategies with respect to potential price fluctuations, from time to time, we may opportunistically enter into fixed price beef supply contracts or contracts for other food products or consider other risk management strategies with regard to our meat and other food costs to minimize the impact of potential price fluctuations. This practice could help stabilize our food costs during times of fluctuating prices, although there can be no assurances that this will occur. However, because our restaurants feature USDA prime beef and premium choice beef, we generally expect to purchase these types of beef even if we have not entered into any such arrangements and the price increased significantly. The prices of other commodities can affect our costs as well, including corn and other grains, which are ingredients we use regularly and are also used as cattle feed and therefore affect the price of beef. Energy prices can also affect our bottom line, as increased energy prices may cause increased transportation costs for beef and other supplies, as well as increased costs for the utilities required to run each restaurant. Historically we have passed increased commodity and other costs on to our customers by increasing the prices of our menu items. While we believe these price increases did not historically affect our customer traffic, there can be no assurance additional price increases would not affect future customer traffic. If prices increase in the future and we are unable to anticipate or mitigate these increases, or if there are shortages for USDA Prime beef and premium choice beef, our business and results of operations would be adversely affected.
We depend upon frequent deliveries of food and other supplies, in most cases from a limited number of suppliers, which subjects us to the possible risks of shortages, interruptions and price fluctuations.
Our ability to maintain consistent quality throughout our restaurants depends in part upon our ability to acquire fresh products, including USDA prime beef and premium choice beef, fresh seafood, quality produce and related items from reliable sources in accordance with our specifications. In addition, we rely on one or a limited number of suppliers for certain ingredients. For
11
example, Stock Yards, a division of U.S. Foods, Inc., is the primary supplier of the beef for all of our restaurants and has been since June 2009. This dependence on one or a limited number of suppliers, as well as the limited number of alternative suppliers of USDA prime beef and premium choice beef and quality seafood, subjects us to the possible risks of shortages, interruptions and price fluctuations in beef and seafood. If any of our suppliers is unable to obtain financing necessary to operate its business or its business is otherwise adversely affected, does not perform adequately or otherwise fails to distribute products or supplies to our restaurants, or terminates or refuses to renew any contract with us, particularly with respect to one of the suppliers on which we rely heavily for specific ingredients, we may be unable to find an alternative supplier in a short period of time or if we can, it may not be on acceptable terms. Our inability to replace our suppliers in a short period of time on acceptable terms could increase our costs or cause shortages at our restaurants that may cause us to remove certain items from a menu, increase the price of certain offerings or temporarily close a restaurant, which could adversely affect our business and results of operations.
We depend on the services of key executives, and our business and growth strategy could be materially harmed if we were to lose these executives and were unable to replace them with and successfully transition to executives of equal experience and capabilities.
Some of our senior executives, such as Norman J. Abdallah, our Chief Executive Officer, are particularly important to our success. Senior executives are important to our business because they have been instrumental in setting our strategic direction, operating our business, identifying, recruiting and training key personnel, identifying expansion opportunities and arranging necessary financing. We have employment agreements with all members of senior management; however, we cannot prevent our executives from terminating their employment with us. Losing the services of any of these individuals could adversely affect our business until a suitable replacement could be found. We also believe that they could not quickly be replaced with executives of equal experience and capabilities and their successors may not be as effective. We do not maintain key person life insurance policies on any of our executives.
Changes in consumer preferences and discretionary spending patterns could adversely impact our business and results of operations.
The restaurant industry is characterized by the continual introduction of new concepts and is subject to rapidly changing consumer preferences, tastes and eating and purchasing habits. Our success depends in part on our ability to anticipate and respond quickly to changing consumer preferences, as well as other factors affecting the restaurant industry, including new market entrants and demographic changes. Shifts in consumer preferences away from upscale steakhouses or beef, which is a significant component of our Del Frisco’s Double Eagle and Sullivan’s concepts’ menus and appeal, whether as a result of economic, competitive or other factors, could adversely affect our business and results of operations.
Restaurant companies, including ours, have been the target of class action lawsuits and other proceedings alleging, among other things, violations of federal and state workplace and employment laws. Proceedings of this nature, if successful, could result in our payment of substantial damages.
In recent years, we and other restaurant companies have been subject to lawsuits, including class action lawsuits, alleging violations of federal and state laws regarding workplace and employment matters, discrimination and similar matters. A number of these lawsuits have resulted in the payment of substantial damages by the defendants. Similar lawsuits have been instituted from time to time alleging violations of various federal and state wage and hour laws regarding, among other things, employee meal deductions, the sharing of tips amongst certain employees, overtime eligibility of assistant managers and failure to pay for all hours worked.
Occasionally, our customers file complaints or lawsuits against us alleging that we are responsible for some illness or injury they suffered at or after a visit to one of our restaurants, including actions seeking damages resulting from food-borne illness and relating to notices with respect to chemicals contained in food products required under state law. We are also subject to a variety of other claims from third parties arising in the ordinary course of our business, including personal injury claims, contract claims and claims alleging violations of federal and state laws. In addition, our restaurants are subject to state “dram shop” or similar laws which generally allow a person to sue us if that person was injured by a legally intoxicated person who was wrongfully served alcoholic beverages at one of our restaurants. The restaurant industry has also been subject to a growing number of claims that the menus and actions of restaurant chains have led to the obesity of certain of their customers.
Regardless of whether any claims against us are valid or whether we are liable, claims may be expensive to defend and may divert time and money away from our operations. In addition, they may generate negative publicity, which could reduce customer traffic and sales. Although we maintain what we believe to be adequate levels of insurance, insurance may not be available at all or in sufficient amounts to cover any liabilities with respect to these or other matters. A judgment or other liability in excess of our insurance coverage for any claims or any adverse publicity resulting from claims could adversely affect our business and results of operations.
12
Our business is subject to substantial government regulation.
Our business is subject to extensive federal, state and local government regulation, including regulations related to the preparation and sale of food, the sale of alcoholic beverages, the sale and use of tobacco, zoning and building codes, land use and employee, health, sanitation and safety matters. For example, the preparation, storing and serving of food and the use of certain ingredients is subject to heavy regulation. Alcoholic beverage control regulations govern various aspects of our restaurants’ daily operations, including the minimum age of patrons and employees, hours of operation, advertising, wholesale purchasing and inventory control, handling and storage. Typically, our restaurants’ licenses to sell alcoholic beverages must be renewed annually and may be suspended or revoked at any time for cause. In addition, because we operate in a number of different states, we are also required to comply with a number of different laws covering the same topics. The failure of any of our restaurants to timely obtain and maintain necessary governmental approvals, including liquor or other licenses, permits or approvals required to serve alcoholic beverages or food could delay or prevent the opening of a new restaurant or prevent regular day-to-day operations, including the sale of alcoholic beverages, at a restaurant that is already operating, any of which would adversely affect our business and results of operations.
In addition, the costs of operating our restaurants may increase if there are changes in laws governing minimum hourly wages, working conditions, overtime and tip credits, health care, workers’ compensation insurance rates, unemployment tax rates, sales taxes or other laws and regulations such as those governing access for the disabled, including the Americans with Disabilities Act. For example, the Federal Patient Protection and Affordable Care Act, or PPACA, which was enacted on March 23, 2010, among other things, includes guaranteed coverage requirements and imposes new taxes on health insurers and health care benefits that could increase the costs of providing health benefits to employees. In addition, because we have a significant number of restaurants located in certain states, regulatory changes in these states could have a disproportionate impact on our business. If any of the foregoing increased costs and we were unable to offset the change by increasing our menu prices or by other means, our business and results of operations could be adversely affected.
Government regulation can also affect customer traffic at our restaurants. A number of states, counties and cities have enacted menu labeling laws requiring multi-unit restaurant operators to disclose certain nutritional information. For example, the PPACA establishes a uniform, federal requirement for restaurant chains with 20 or more locations operating under the same trade name and offering substantially the same menus to post nutritional information on their menus, including the total number of calories. The law also requires such restaurants to provide to consumers, upon request, a written summary of detailed nutritional information, including total calories and calories from fat, total fat, saturated fat, cholesterol, sodium, total carbohydrates, complex carbohydrates, sugars, dietary fiber, and total protein in each serving size or other unit of measure, for each standard menu item. The FDA is also permitted to require additional nutrient disclosures, such as trans-fat content. In 2015, our Grille concept became subject to the requirements to post nutritional information on our menus and, based on current strategic outlook, our Double Eagle concept may become subject to these requirements in the near future. The FDA compliance deadline was postponed until May 7, 2018. We intend to comply with these requirements to the extent required for all concepts. Our compliance with the PPACA or other similar laws to which we may become subject could reduce demand for our menu offerings, reduce customer traffic and/or reduce average revenue per customer, which would have an adverse effect on our revenue. Any reduction in customer traffic related to these or other government regulations could affect revenues and adversely affect our business and results of operations.
To the extent that governmental regulations impose new or additional obligations on our suppliers, including, without limitation, regulations relating to the inspection or preparation of meat, food and other products used in our business, product availability could be limited and the prices that our suppliers charge us could increase. We may not be able to offset these costs through increased menu prices, which could have a material adverse effect on our business. If any of our restaurants were unable to serve particular food products, even for a short period of time, or if we are unable to offset increased costs, our business and results of operations could be adversely affected.
Labor shortages or changes to wage laws could harm our business.
Our success depends in part upon our ability to attract, motivate and retain a sufficient number of qualified employees, including restaurant managers, kitchen staff and servers, necessary to keep pace with our anticipated expansion schedule and meet the needs of our existing restaurants. A sufficient number of qualified individuals of the requisite caliber to fill these positions may be in short supply in some communities. Competition in these communities for qualified staff could require us to pay higher wages and provide greater benefits. Any inability to recruit and retain qualified individuals may also delay the planned openings of new restaurants and could adversely impact our existing restaurants. Any such inability to retain or recruit qualified employees, increased costs of attracting qualified employees or delays in restaurant openings could adversely affect our business and results of operations.
13
In addition, we have a substantial number of hourly employees who are paid wage rates at or based on the federal or state minimum wage and who rely on tips as a large portion of their income. Any changes in the city, state, or federal laws affecting the wages we pay our employees, including an increase in the minimum wage, such as the 15% increase in the minimum wage on January 1, 2017 in Seattle, Washington to $15.00 per hour or the 17% increase in minimum wage in California to $10.50, could increase our costs and have a material adverse impact on our results of operations. Certain other states in which we operate restaurants have adopted or are considering adopting minimum wage statutes that exceed the federal minimum wage as well. We may be unable or unwilling to increase our prices in order to pass these increased labor costs on to our customers, in which case, our business and results of operations could be adversely affected.
We occupy most of our restaurants under long-term non-cancelable leases for which we may remain obligated to perform under even after a restaurant closes, and we may be unable to renew leases at the end of their terms.
All of our restaurants are located in leased premises. Many of our current leases are non-cancelable and typically have initial terms ranging from 5 to 15 years with two to four 5-year extension options. We believe that leases that we enter into in the future will be on substantially similar terms. If we were to close or fail to open a restaurant at a location we lease, we would generally remain committed to perform our obligations under the applicable lease, which could include, among other things, payment of the base rent for the balance of the lease term. For example, in fiscal year 2017, we paid $0.5 million to exit two Sullivan's leases, in fiscal 2016, we paid $0.9 million to exit one Sullivan’s lease, and in fiscal 2015, we paid $1.4 million to exit two Grille leases. Our obligation to continue making rental payments and fulfilling other lease obligations in respect of leases for closed or unopened restaurants could have a material adverse effect on our business and results of operations. Alternatively, at the end of the lease term and any renewal period for a restaurant, we may be unable to renew the lease without substantial additional cost, if at all. If we cannot renew such a lease we may be forced to close or relocate a restaurant, which could subject us to construction and other costs and risks. If we are required to make payments or otherwise perform under one of our leases after a restaurant closes or if we are unable to renew our restaurant leases, our business and results of operations could be adversely affected.
The impact of negative economic factors, including the availability of credit, on our landlords and other retail center tenants could negatively affect our financial results.
Negative effects on our existing and potential landlords due to any inaccessibility of credit and other unfavorable economic factors may, in turn, adversely affect our business and results of operations. If our landlords are unable to obtain financing or remain in good standing under their existing financing arrangements, they may be unable to provide construction contributions or satisfy other lease covenants to us. If any landlord files for bankruptcy protection, the landlord may be able to reject our lease in the bankruptcy proceedings. While we would have the option to retain our rights under the lease, we could not compel the landlord to perform any of its obligations and would be left with damages as our sole recourse. In addition, if our landlords are unable to obtain sufficient credit to continue to properly manage their retail sites, we may experience a drop in the level of quality of such retail centers. Our development of new restaurants may also be adversely affected by the negative financial situations of developers and potential landlords. In recent years, many landlords have delayed or cancelled development projects (as well as renovations of existing projects) due to the instability in the credit markets and declines in consumer spending, which has reduced the number of high-quality locations available that we would consider for our new restaurants. In addition, several other tenants at retail centers in which we are located or where we have executed leases have ceased operations or, in some cases, have deferred openings or failed to open after committing to do so. These failures may lead to reduced customer traffic and a general deterioration in the surrounding retail centers in which our restaurants are located and may contribute to lower customer traffic at our restaurants. If any of the foregoing affect any of our landlords or their other retail tenants our business and results of operations may be adversely affected.
Fixed rental payments account for a significant portion of our operating expenses, which increases our vulnerability to general adverse economic and industry conditions and could limit our operating and financing flexibility.
Payments under our operating leases account for a significant portion of our operating expenses, and we expect the new restaurants we open in the future will similarly be leased by us. Specifically, payments under our operating leases accounted for 13.7%, 13.3% and 13.2% of our restaurant operating expenses in fiscal 2017, 2016 and 2015, respectively. Our substantial operating lease obligations could have significant negative consequences, including:
• | increasing our vulnerability to general adverse economic and industry conditions; |
• | limiting our ability to obtain additional financing; |
• | requiring a substantial portion of our available cash flow to be applied to our rental obligations, thus reducing cash available for other purposes; |
• | limiting our flexibility in planning for or reacting to changes in our business or the industry in which we compete; and |
14
• | placing us at a disadvantage with respect to some of our competitors. |
We depend on cash flow from operations to pay our lease obligations and to fulfill our other cash needs. If our business does not generate sufficient cash flow from operating activities and sufficient funds are not otherwise available to us from borrowings under our credit facility or other sources, we may not be able to meet our operating lease obligations, grow our business, respond to competitive challenges or fund our other liquidity and capital needs, which could adversely affect our business and results of operations.
Any future indebtedness we may incur may limit our operational and financing flexibility and negatively impact our business.
We currently have a credit facility that provides for a revolving loan of up to $50.0 million. There were $21.5 million outstanding borrowings under this facility at December 26, 2017. We may incur substantial additional indebtedness in the future. Our credit facility, and other debt instruments we may enter into in the future, may have important consequences to us, including the following:
• | our ability to obtain additional financing for working capital, capital expenditures, acquisitions or general corporate purposes may be impaired; |
• | the requirement that we use a significant portion of our cash flows from operations to pay interest on any outstanding indebtedness, which would reduce the funds available to us for operations and other purposes; and |
• | our flexibility in planning for, or reacting to, changes in our business and the industry in which we operate may be limited. |
We expect that we will depend primarily on cash generated by our operations for funds to pay our expenses and any amounts due under our credit facility and any other indebtedness we may incur. Our ability to make these payments depends on our future performance, which will be affected by financial, business, economic and other factors, many of which we cannot control. Our business may not generate sufficient cash flows from operations in the future, and our currently anticipated growth in revenues and cash flows may not be realized, either or both of which could result in our being unable to repay indebtedness or to fund other liquidity needs. If we do not have enough money, we may be required to refinance all or part of our then existing debt, sell assets or borrow more money, in each case on terms that are not acceptable to us. In addition, the terms of existing or future debt agreements, including our existing credit facility, may restrict us from adopting any of these alternatives. Our ability to recapitalize and incur additional debt in the future could also delay or prevent a change in control of our company, make some transactions more difficult and impose additional financial or other covenants on us. In addition, any significant levels of indebtedness in the future could place us at a competitive disadvantage compared to our competitors that may have proportionately less debt and could make us more vulnerable to economic downturns and adverse developments in our business. Our indebtedness and any inability to pay our debt obligations as they come due or inability to incur additional debt could adversely affect our business and results of operations.
The terms of our credit facility impose operating and financial restrictions on us.
Our credit facility contains a number of significant restrictions and covenants that generally limit our ability to, among other things:
• | pay dividends or purchase stock or make other restricted payments to our stockholders; |
• | incur additional indebtedness; |
• | issue guarantees; |
• | make investments; |
• | use assets as security in other transactions; |
• | sell assets or merge with or into other companies; |
• | make capital expenditures; |
• | enter into transactions with affiliates; |
• | sell equity or other ownership interests in our subsidiaries; and |
• | create or permit restrictions on our subsidiaries’ ability to make payments to us. |
Our credit facility limits our ability to engage in these types of transactions even if we believed that a specific transaction would contribute to our future growth or improve our operating results. Our credit facility also requires us to achieve specified
15
financial and operating results and maintain compliance with specified financial ratios. Specifically, these financial covenants require that we have a fixed charge coverage ratio of greater than 1.25 and a leverage ratio of less than 1.25. As of December 26, 2017, we were in compliance with these tests. See Item 7, Management’s Discussion and Analysis of Financial Condition and Results of Operations. Our ability to comply with these provisions may be affected by events beyond our control. A breach of any of these provisions or our inability to comply with required financial ratios in our credit facility could result in a default under the credit facility in which case the lenders will have the right to declare all borrowings to be immediately due and payable. If we are unable to repay all borrowings when due, whether at maturity or if declared due and payable following a default, the lenders would have the right to proceed against the collateral granted to secure the indebtedness. If we breach these covenants or fail to comply with the terms of the credit facility and the lenders accelerate the amounts outstanding under the credit facility our business and results of operations would be adversely affected.
Our credit facility carries floating interest rates, thereby exposing us to market risk related to changes in interest rates to the extent there are borrowings outstanding thereunder. Accordingly, our business and results of operations may be adversely affected by changes in interest rates. Assuming a one percentage point increase on our base interest rate on our credit facility and a full drawdown on the credit facility, our interest expense would increase by approximately $0.5 million over the course of 12 months.
The failure to enforce and maintain our intellectual property rights could enable others to use names confusingly similar to the names and marks used by our restaurants, which could adversely affect the value of our brands.
We have registered the names Del Frisco’s, Double Eagle Steakhouse, Sullivan’s, Del Frisco’s Grille and have applications pending to register certain other names and logos used by our restaurants as trade names, trademarks or service marks with the United States Patent and Trademark Office and in certain foreign countries. We have the exclusive right to use these trademarks throughout the United States, other than with respect to one restaurant in Louisville, Kentucky, and the 50 mile surrounding area, where an unrelated third party has the right to use a specific registration of the Del Frisco’s name in Jefferson County in Kentucky. See Item 1, Business. The success of our business depends in part on our continued ability to utilize our existing trade names, trademarks and service marks as currently used in order to increase our brand awareness. In that regard, we believe that our trade names, trademarks and service marks are valuable assets that are critical to our success. The unauthorized use or other misappropriation of our trade names, trademarks or service marks could diminish the value of our brands and restaurant concepts and may cause a decline in our revenues and force us to incur costs related to enforcing our rights. In addition, the use of trade names, trademarks or service marks similar to ours in some markets may keep us from entering those markets. While we may take protective actions with respect to our intellectual property, these actions may not be sufficient to prevent, and we may not be aware of all incidents of, unauthorized usage or imitation by others. Any such unauthorized usage or imitation of our intellectual property, including the costs related to enforcing our rights, could adversely affect our business and results of operations.
Information technology system failures or breaches of our network security, including with respect to confidential information, could interrupt our operations and adversely affect our business.
We and our third party providers rely on our computer systems and network infrastructure across our operations, including point-of-sale processing at our restaurants. Our operations depend upon our ability to protect our computer equipment and systems against damage and disruption from physical theft, fire, power loss, computer and telecommunications failure, workplace wrongdoing, or other natural disasters and catastrophic events, as well as from internal and external security breaches, viruses, worms, malware and other disruptive software and problems. Any damage or failure of our computer systems or network infrastructure or that of our third party providers that causes an interruption in our operations or theirs could have a material adverse effect on our business and results of operations and subject us to damages, loses, litigation or actions by regulatory authorities.
In addition, because the majority of our restaurant sales are by credit or debit cards, our possession of confidential information may also put us at a greater risk of being targeted by hackers. In the normal course of our business, we have been the target of malicious cyber-attack attempts, and other restaurants and retailers have experienced security breaches in which credit and debit card information of their customers has been stolen. We may also be impacted by breaches of our third-party processors. If this or another type of breach occurs at one of our restaurants, we may become subject to negative publicity as well as lawsuits or other proceedings for purportedly fraudulent transactions arising out of the actual or alleged theft of our customers’ credit or debit card information. Although no breaches have had a direct, material impact on us, we are unable to predict the direct or indirect impact of any future attacks to our business or that of our third party providers.
In addition, numerous and evolving cybersecurity threats, including advanced and persistent cyber-attacks, phishing and social engineering schemes, particularly on internet applications, could compromise the confidentiality, availability, and integrity of data in our systems. Although we employ both internal resources and external consultants to conduct auditing and testing for
16
weaknesses in our systems, controls, firewalls and encryption and intend to maintain and upgrade our security technology and operational procedures to prevent such damage, breaches or other disruptive problems, there can be no assurance that these security measures and procedures will be successful to prevent, counter or otherwise minimize these threats. Any such claim, proceeding or action by a regulatory authority, or any adverse publicity resulting from these allegations, could adversely affect our business and results of operations.
Because the techniques used to obtain unauthorized access, or to disable or degrade systems change frequently, have become increasingly more complex and sophisticated, and may be difficult to detect for periods of time, we may not anticipate these acts or respond adequately or timely. As these threats continue to evolve and increase, we may be required to devote significant additional resources in order to modify and enhance our security controls and to identify and remediate any security vulnerabilities.
We expect to offer restricted stock and other forms of stock-based compensation in the future, which have the potential to dilute stockholder value and cause the price of our common stock to decline.
As of December 26, 2017, we had awards of stock options, restricted stock and performance stock units outstanding under our equity compensation plan. In addition, we expect to offer restricted stock and performance stock units and other forms of stock-based compensation to our directors, officers and employees in the future. If the options that we issue are exercised, or any restricted stock or other awards that we may issue vests, and those shares are sold into the public market, the market price of our common stock may decline. In addition, the availability of shares of common stock for award under our equity incentive plan, or the grant of restricted stock or other forms of stock-based compensation, may adversely affect the market price of our common stock.
We are a holding company and depend on the cash flow of our subsidiaries.
We are a holding company with no material assets other than the equity interests of our subsidiaries. Our subsidiaries conduct substantially all of our operations and own substantially all of our assets and intellectual property. Consequently, our cash flow and our ability to meet our obligations and pay any future dividends to our stockholders depends upon the cash flow of our subsidiaries and the payment of funds by our subsidiaries directly or indirectly to us in the form of dividends, distributions and other payments. Any inability on the part of our subsidiaries to make payments to us could have a material adverse effect on our business, financial condition and results of operations.
Provisions of our charter documents, Delaware law and other documents could discourage, delay or prevent a merger or acquisition at a premium price.
Provisions in our certificate of incorporation and bylaws may have the effect of delaying or preventing a change of control or changes in our management. For example, our certificate of incorporation and bylaws include provisions that:
• | permit us to issue without stockholder approval preferred stock in one or more series and, with respect to each series, fix the number of shares constituting the series and the designation of the series, the voting powers, if any, of the shares of the series and the preferences and other special rights, if any, and any qualifications, limitations or restrictions, of the shares of the series; |
• | prevent stockholders from calling special meetings; |
• | prevent the ability of stockholders to act by written consent; |
• | limit the ability of stockholders to amend our certificate of incorporation and bylaws; |
• | require advance notice for nominations for election to the board of directors and for stockholder proposals; and |
• | establish a classified board of directors with staggered three-year terms. |
These provisions may discourage, delay or prevent a merger or acquisition of our company, including a transaction in which the acquiror may offer a premium price for our common stock.
We are also subject to Section 203 of the Delaware General Corporation Law, or the DGCL, which, subject to certain exceptions, prohibits us from engaging in any business combination with any interested stockholder, as defined in that section, for a period of three years following the date on which that stockholder became an interested stockholder. In addition, our equity incentive plan permits vesting of stock options, restricted stock and performance stock units, and payments to be made to the employees thereunder in certain circumstances, in connection with a change of control of our company, which could discourage, delay or prevent a merger or acquisition at a premium price.
17
We are no longer an “emerging growth company” and, as a result, we are subject to increased disclosure and governance requirements.
We qualified as an “emerging growth company,” as defined in the Jumpstart Our Business Startups Act of 2012, through the part of fiscal 2017. We are now an accelerated filer and, as such, we are subject to certain public company requirements that did not previously apply to us. These requirements include:
• | compliance with the auditor attestation requirements in the assessment of our internal control over financial reporting; |
• | full disclosure obligations regarding executive compensation; and |
• | compliance with the requirements of holding a nonbinding advisory vote on executive compensation and stockholder approval of any golden parachute payments not previously approved. |
We expect that the loss of “emerging growth company” status and compliance with these additional requirements may substantially increase our legal and financial compliance costs and make some activities more time consuming and costly. In particular, we expect to incur significant expenses and devote substantial management effort toward ensuring compliance with the auditor attestation requirements of Section 404 of the Sarbanes-Oxley Act. Failure to comply with these requirements could also subject us to enforcement actions by the SEC, further increase costs and divert management’s attention, damage our reputation and adversely affect our business, operating results or financial condition.
We have a material weakness in our internal control over financial reporting and our inability to remediate this weakness or otherwise implement and maintain the effectiveness of our internal control over financial reporting, or the inability of our independent registered public accounting firm to provide an unqualified report thereon could have a material adverse effect on us.
Pursuant to Section 404 of the Sarbanes-Oxley Act and the related rules adopted by the SEC and the Public Company Accounting Oversight Board, our management is required to report on the effectiveness of our internal control over financial reporting. In addition, because we no longer qualify as an “emerging growth company” under the JOBS Act, beginning with the audit of our consolidated financial statements for fiscal 2017 included in this Annual Report on Form 10-K, our independent registered public accounting firm is required, as part of an integrated audit, to attest to the effectiveness of our internal control over financial reporting under Section 404. An independent assessment of the effectiveness of our internal control over financial reporting could detect problems that our management’s assessment might not detect. Further, if our independent registered public accounting firm concludes that our internal control over financial reporting is not effective, investor confidence and our stock price could decline.
In connection with our fiscal 2017 assessment of internal control over financial reporting under Section 404, we identified a material weakness in our internal control over financial reporting as a result of a control deficiency relating to management’s review and accounting treatment of the sale leaseback transaction of our Double Eagle restaurant located in Orlando, Florida completed in December 2017. A material weakness is a deficiency, or combination of deficiencies, in internal control over financial reporting such that there is a reasonable possibility that a material misstatement of our annual or interim consolidated financial statements will not be prevented or detected on a timely basis. For a discussion of our internal control over financial reporting and a description of the identified material weakness in our internal controls over financial reporting, see Item 9A. Controls and Procedures.
Although this control deficiency did not result in an adjustment to the annual consolidated financial statements as of and for the year ending December 26, 2017, if we are unable to successfully remediate the identified control deficiency, our ability to record, process and report financial information accurately could be impacted, and it may cause us to be unable to report our financial information accurately or on a timely basis. Any of the foregoing could subject us to adverse regulatory consequences, including an investigation and enforcement action by the SEC or violations of Nasdaq listing rules, result in a breach of the covenants under our financing arrangements or have other adverse effects. There also could be a negative reaction in the financial markets, whether as a result of a loss of investor confidence in us, in the accuracy, completeness and reliability of our consolidated financial statements, or otherwise, and could materially adversely affect us and lead to a decline in the price of our common stock.
Our reported financial results may be adversely affected by changes in accounting principles applicable to us.
Generally accepted accounting principles in the U.S. are subject to interpretation by the Financial Accounting Standards Board, or FASB, the American Institute of Certified Public Accountants, the SEC and various bodies formed to promulgate and interpret appropriate accounting principles. A change in these principles or interpretations could have a significant effect on our reported financial results and could affect the reporting of transactions completed before the announcement of a change. For example, the FASB, together with the International Accounting Standards Board, has issued a comprehensive set of changes in accounting for leases. The lease accounting model is a “right of use” model that assumes that each lease creates an asset (the
18
lessee’s right to use the leased asset) and a liability (the future rent payment obligations), which should be reflected on a lessee’s balance sheet to fairly represent the lease transaction and the lessee’s related financial obligations. All of our restaurant leases are accounted for as operating leases, with no related assets and liabilities on our balance sheet. However, changes in lease accounting rules or their interpretation, or changes in underlying assumptions, estimates or judgments by us could significantly change our reported or expected financial performance. Any such change could have a significant effect on our reported financial results.
19
Item 1B. Unresolved Staff Comments
None.
20
Item 2. Properties
We currently operate 53 restaurants across 23 states and the District of Columbia. We currently lease all of our restaurants, of which the majority provide for minimum annual rents with some containing percentage-of-sales rent provisions, against which the minimum rent may be applied. Typically, our lease terms are 5 to 15 years at initiation, with two to four 5-year extension options. None of our restaurant leases can be terminated early by the landlord other than as is customary in the context of a breach or default under the applicable lease.
Opening Date | City | State | Lease/Own | |||
Del Frisco’s Double Eagle Steakhouse | ||||||
April 1996 | Fort Worth | Texas | Lease | |||
January 1997 | Denver | Colorado | Lease | |||
March 2000 | New York | New York | Lease | |||
July 2000 | Las Vegas | Nevada | Lease | |||
May 2007 | Charlotte | North Carolina | Lease | |||
November 2007 | Houston | Texas | Lease | |||
November 2008 | Philadelphia | Pennsylvania | Lease | |||
April 2011 | Boston | Massachusetts | Lease | |||
December 2012 | Chicago | Illinois | Lease | |||
September 2014 | Washington D.C. | Lease | ||||
August 2015 | Orlando | Florida | Lease(1) | |||
September 2016 | Dallas | Texas | Lease | |||
May 2017 | Plano | Texas | Lease | |||
| ||||||
Del Frisco’s Grille | ||||||
August 2011 | New York | New York | Lease | |||
November 2011 | Dallas | Texas | Lease | |||
July 2012 | Washington D.C. | Lease | ||||
October 2012 | Atlanta | Georgia | Lease | |||
March 2013 | Houston | Texas | Lease | |||
July 2013 | Santa Monica | California | Lease | |||
October 2013 | Fort Worth | Texas | Lease | |||
December 2013 | Chestnut Hill | Massachusetts | Lease | |||
December 2013 | Southlake | Texas | Lease | |||
June 2014 | Burlington | Massachusetts | Lease | |||
August 2014 | Irvine | California | Lease | |||
September 2014 | North Bethesda | Maryland | Lease | |||
November 2014 | Tampa | Florida | Lease | |||
December 2014 | Pasadena | California | Lease | |||
May 2015 | The Woodlands | Texas | Lease | |||
June 2015 | Plano | Texas | Lease | |||
August 2015 | Stamford | Connecticut | Lease | |||
September 2015 | Little Rock | Arkansas | Lease | |||
September 2015 | Hoboken | New Jersey | Lease | |||
November 2015 | Cherry Creek | Colorado | Lease | |||
June 2016 | Huntington | New York | Lease | |||
October 2016 | Nashville | Tennessee | Lease | |||
November 2016 | Brentwood | Tennessee | Lease | |||
June 2017 | New York | New York | Lease | |||
| ||||||
Sullivan’s Steakhouse | ||||||
May 1996 | Austin | Texas | Lease | |||
November 1996 | Indianapolis | Indiana | Lease | |||
October 1997 | Baton Rouge | Louisiana | Lease | |||
December 1997 | Wilmington | Delaware | Lease | |||
January 1998 | Charlotte | North Carolina | Lease | |||
September 1998 | Anchorage | Alaska | Lease | |||
21
Opening Date | City | State | Lease/Own | |||
Sullivan’s Steakhouse (cont.) | ||||||
September 1998 | King of Prussia | Pennsylvania | Lease | |||
December 1998 | Naperville | Illinois | Lease | |||
January 1999 | Palm Desert | California | Lease(2) | |||
June 1999 | Chicago | Illinois | Lease | |||
August 1999 | Raleigh | North Carolina | Lease | |||
December 2000 | Tucson | Arizona | Lease | |||
July 2007 | Omaha | Nebraska | Lease | |||
July 2008 | Leawood | Kansas | Lease | |||
November 2008 | Lincolnshire | Illinois | Lease(3) | |||
February 2009 | Baltimore | Maryland | Lease | |||
(1) | During the fourth quarter of fiscal 2017, we executed sale leaseback transaction for our Del Frisco's Double Eagle restaurant, located in Orlando, Florida. See note 4 in the notes to our consolidated financial statements. |
(2) | Current lease term expires on November 30, 2018. We have two remaining five-year option periods available that have not yet been exercised. |
(3) | Current lease term expires on November 30, 2018. We have four remaining five-year option periods available that have not yet been exercised. |
Our corporate headquarters is located in Irving, Texas. We lease the property for our corporate headquarters.
22
Item 3. Legal Proceedings
We are subject to various claims and legal actions, including class actions, arising in the ordinary course of business from time to time, including claims related to food quality, personal injury, contract matters, health, wage and employment matters and other issues. While it is impossible at this time to determine with certainty the ultimate outcome of these proceedings, lawsuits and claims, management believes that adequate provisions have been made and that the ultimate outcomes will not have a material adverse effect on our financial position and results of operations.
23
Item 4. Mine Safety Disclosure
Not applicable.
24
PART II
Item 5. Market for Registrant’s Common Equity, Related Stockholder matters and Issuer Purchases of Equity Securities
Information Regarding our Common Stock
Our common stock is listed on the Nasdaq Global Select Market under the symbol “DFRG”. The following table sets forth, for the periods indicated, the high and low sales prices per share for our common stock as quoted by the Nasdaq Global Select Market.
Sales Price Per Share | ||||||||
| High | Low | ||||||
2017 | ||||||||
| First Quarter (December 28, 2016 - March 21, 2017) | $ | 18.10 | $ | 15.80 | |||
| Second Quarter (March 22, 2017 - June 13, 2017) | $ | 18.80 | $ | 16.35 | |||
| Third Quarter (June 14, 2017 - September 5, 2017) | $ | 16.75 | $ | 13.75 | |||
| Fourth Quarter (September 6, 2017 - December 26, 2017) | $ | 15.95 | $ | 11.70 | |||
2016 | ||||||||
| First Quarter (December 30, 2015 - March 22, 2016) | $ | 17.15 | $ | 14.10 | |||
| Second Quarter (March 23, 2016 - June 14, 2016) | $ | 16.86 | $ | 14.42 | |||
| Third Quarter (June 15, 2016 - September 6, 2016) | $ | 16.10 | $ | 14.05 | |||
| Fourth Quarter (September 7, 2016 - December 27, 2016) | $ | 18.50 | $ | 13.01 | |||
The market price of our common stock is subject to fluctuations in response to variations in our quarterly operating results, general trends in the restaurant industry as well as other factors, many of which are not within our control. In addition, broad market fluctuations, as well as general economic, business and political conditions may adversely affect the market for our common stock, regardless of our actual or projected performance.
The closing sale price of a share of our common stock, as reported by the Nasdaq Global Select Market, on March 23, 2018, was $14.40. As of March 23, 2018, there were three holders of record of our common stock, not including beneficial owners of shares registered in nominee or street name.
Issuer Purchases of Equity Securities
On October 14, 2014, our Board of Directors approved a stock repurchase program authorizing us to repurchase up to $25 million of our common stock over the next three years. On February 15, 2017, our Board of Directors increased the authorized capacity under our existing stock repurchase program to $50 million of our common stock from that date forward and is not part of the defined term. Under this program, we can from time to time purchase outstanding common stock in the open market at management’s discretion, subject to share price, market conditions and other factors. The common stock repurchase program does not obligate us to repurchase any dollar amount or number of shares. The Company fully utilized the availability under the repurchase program in November 2017. Over the life of the program, we repurchased 3,630,390 shares of our common stock at an aggregate cost of approximately $57.8 million and an average price per share of $15.93.
The following table provides information with respect to our purchases of shares of our common stock during the fourth quarter of fiscal 2017:
Fiscal Period | Total Number of Shares Purchased | Average Price Paid Per Share | Total Number of Shares Purchased as Part of Publicly Announced Plans or Programs | Maximum Dollar Value of Shares That May Yet Be Purchased Under the Plans or Programs | ||||||||||
September 6 - October 3, 2017 | — | $ | — | — | $ | 11,312,927 | ||||||||
October 7 - October 31, 2017 | 540,349 | 13.29 | 540,349 | 4,131,150 | ||||||||||
November 1 - November 28, 2017 | 296,026 | 13.96 | 296,026 | — | ||||||||||
November 29 - December 26, 2017 | — | — | — | — | ||||||||||
Total | 836,375 | $ | 13.53 | 836,375 | ||||||||||
25
On February 27, 2018, our Board of Directors provided authority for up to $50 million to be utilized for the repurchase of our common stock. Under this program, we can from time to time purchase outstanding common stock in the open market at management’s discretion, subject to share price, market conditions and other factors.
Performance Graph
The following table and graph shows the cumulative total stockholder return on our Common Stock with the S&P 500 Stock Index, the S&P Small Cap 600 Index and the Dow Jones U.S. Restaurants & Bars Index, in each case assuming an initial investment of $100 on December 24, 2012 and full dividend reinvestment.
CUMULATIVE TOTAL RETURN
Assuming an investment of $100 and reinvestment of dividends
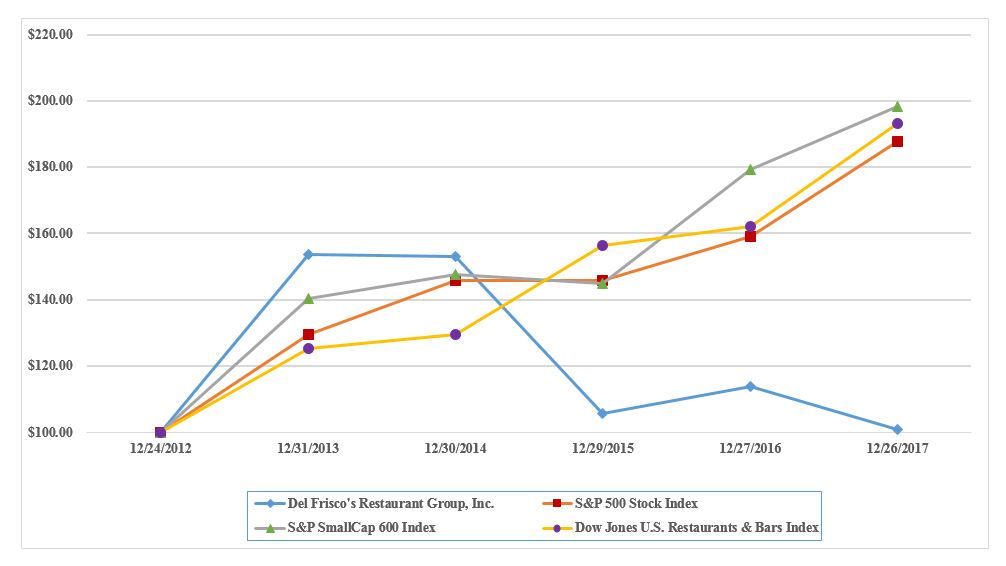
| 12/24/2012 | 12/31/2013 | 12/30/2014 | 12/29/2015 | 12/27/2016 | 12/26/2017 | |||||||||||||||||
Del Frisco's Restaurant Group, Inc. | $ | 100.00 | $ | 153.75 | $ | 152.97 | $ | 105.61 | $ | 113.83 | $ | 100.78 | |||||||||||
S&P 500 Stock Index | $ | 100.00 | $ | 129.56 | $ | 145.82 | $ | 145.68 | $ | 159.03 | $ | 187.89 | |||||||||||
S&P SmallCap 600 Index | $ | 100.00 | $ | 140.36 | $ | 147.64 | $ | 144.98 | $ | 179.22 | $ | 198.30 | |||||||||||
Dow Jones U.S. Restaurants & Bars Index | $ | 100.00 | $ | 125.21 | $ | 129.61 | $ | 156.33 | $ | 162.12 | $ | 193.04 | |||||||||||
The stock performance graph should not be deemed filed or incorporated by reference into any other filing made by us under the Securities Act of 1933 or the Exchange Act, except to the extent that we specifically incorporate the stock performance graph by reference in another filing.
Information Regarding Dividends
We have never declared or paid any cash dividends on our common stock and do not anticipate paying cash dividends on our common stock for the foreseeable future. We anticipate that we will retain all of our future earnings, if any, for use in the development and expansion of our business and for general corporate purposes. Any determination to pay dividends in the future will be at the discretion of our Board of Directors and will depend upon our financial condition, operating results and other factors our Board of Directors deems relevant.
Our credit facility contains, and debt instruments that we enter into in the future may contain, covenants that place limitations on the amount of dividends we may pay. In addition, under Delaware law, our Board of Directors may declare dividends only to the extent of our surplus, which is defined as total assets at fair market value minus total liabilities, minus statutory capital, or, if there is no surplus, out of our net profits for the then current and immediately preceding year.
26
Item 6. Selected Financial Data
The following table sets forth certain of our historical financial data. Other than with respect to the Operating Data, we have derived the selected historical consolidated financial data set forth below for fiscal years 2013 through 2017 from our audited consolidated financial statements and the related notes. Not all periods shown below are discussed in this Annual Report on Form 10-K. You should read this information together with Item 7, Management’s Discussion and Analysis of Financial Condition and Results of Operations and our consolidated financial statements and the related notes to those statements included elsewhere in this Annual Report on Form 10-K. Historical results are not necessarily indicative of future performance.
| Fiscal Year Ended(1) | ||||||||||||||||||
(Amounts in thousands, except per share data) | December 26, 2017 | December 27, 2016 | December 29, 2015 | December 30, 2014 | December 31, 2013 | ||||||||||||||
Income Statement Data: | |||||||||||||||||||
Revenues | $ | 361,431 | $ | 351,681 | $ | 331,612 | $ | 301,805 | $ | 271,806 | |||||||||
Costs and expenses: | |||||||||||||||||||
Costs of sales | 103,976 | 99,181 | 95,963 | 90,990 | 82,209 | ||||||||||||||
Restaurant operating expenses (excluding depreciation and amortization shown separately below) | 177,170 | 169,300 | 156,337 | 137,695 | 121,825 | ||||||||||||||
Insurance recovery(2) | (1,073 | ) | — | — | — | — | |||||||||||||
Marketing and advertising costs | 8,393 | 8,260 | 7,745 | 6,169 | 5,663 | ||||||||||||||
Pre-opening costs | 2,182 | 3,446 | 5,228 | 4,735 | 3,758 | ||||||||||||||
General and administrative costs | 28,421 | 25,131 | 23,111 | 20,537 | 17,421 | ||||||||||||||
Donations | 836 | — | — | — | — | ||||||||||||||
Consulting project costs | 2,786 | — | — | — | — | ||||||||||||||
Reorganization severance | 1,072 | 793 | — | — | — | ||||||||||||||
Lease termination and closing costs | 538 | 1,031 | 1,386 | — | — | ||||||||||||||
Secondary public offering costs | — | — | — | 5 | 1,024 | ||||||||||||||
Public offering transaction bonuses | — | — | — | — | 8,355 | ||||||||||||||
Impairment charges(3) | 37,053 | 598 | 3,248 | 3,536 | 2,360 | ||||||||||||||
Depreciation and amortization | 23,399 | 18,865 | 16,776 | 13,598 | 11,300 | ||||||||||||||
Total costs and expenses | 384,753 | 326,605 | 309,794 | 277,265 | 253,915 | ||||||||||||||
Insurance settlements | 1,153 | — | — | — | — | ||||||||||||||
Operating (loss) income | (22,169 | ) | 25,076 | 21,818 | 24,540 | 17,891 | |||||||||||||
Other income (expense), net: | |||||||||||||||||||
Interest, net of capitalized interest | (783 | ) | (70 | ) | (77 | ) | (113 | ) | (72 | ) | |||||||||
Other | (1,439 | ) | (432 | ) | (236 | ) | (107 | ) | (51 | ) | |||||||||
(Loss) income before income taxes | (24,391 | ) | 24,574 | 21,505 | 24,320 | 17,768 | |||||||||||||
Income tax (benefit) expense(4) | (12,934 | ) | 6,808 | 5,507 | 7,723 | 5,556 | |||||||||||||
Net (loss) income | $ | (11,457 | ) | $ | 17,766 | $ | 15,998 | $ | 16,597 | $ | 12,212 | ||||||||
Net (loss) income per average common share: | |||||||||||||||||||
Basic: | $ | (0.53 | ) | $ | 0.76 | $ | 0.68 | $ | 0.71 | $ | 0.51 | ||||||||
Diluted: | $ | (0.53 | ) | $ | 0.76 | $ | 0.68 | $ | 0.70 | $ | 0.51 | ||||||||
| |||||||||||||||||||
Weighted-average number of common shares outstanding: | |||||||||||||||||||
Basic: | 21,570 | 23,322 | 23,380 | 23,518 | 23,780 | ||||||||||||||
Diluted: | 21,570 | 23,435 | 23,517 | 23,740 | 23,852 | ||||||||||||||
27
(Amounts in thousands) | December 26, 2017 | December 27, 2016 | December 29, 2015 | December 30, 2014 | December 31, 2013 | ||||||||||||||
Balance Sheet Data (at end of period): | |||||||||||||||||||
Cash and cash equivalents | $ | 4,594 | $ | 14,622 | $ | 5,176 | $ | 3,520 | $ | 13,674 | |||||||||
Working capital (deficit)(4) | $ | (14,829 | ) | $ | (4,396 | ) | $ | (10,390 | ) | $ | (2,106 | ) | $ | 8,048 | |||||
Total assets | $ | 326,787 | $ | 370,782 | $ | 346,655 | $ | 319,666 | $ | 288,651 | |||||||||
Long-term debt | $ | 24,477 | $ | — | $ | 4,500 | $ | — | $ | — | |||||||||
Total stockholders' equity | $ | 189,087 | $ | 246,366 | $ | 227,699 | $ | 210,983 | $ | 196,783 | |||||||||
| Fiscal Year Ended(1) | ||||||||||||||||||
(Amounts in thousands) | December 26, 2017 | December 27, 2016 | December 29, 2015 | December 30, 2014 | December 31, 2013 | ||||||||||||||
Other Financial Data: | |||||||||||||||||||
Net cash provided by operating activities | $ | 38,065 | $ | 49,815 | $ | 45,868 | $ | 42,766 | $ | 29,392 | |||||||||
Net cash used in investing activities | $ | (23,929 | ) | $ | (34,168 | ) | $ | (46,530 | ) | $ | (47,956 | ) | $ | (31,462 | ) | ||||
Net cash (used in) provided by financing activities | $ | (24,164 | ) | $ | (6,201 | ) | $ | 2,318 | $ | (4,964 | ) | $ | 4,981 | ||||||
Capital Expenditures | $ | 39,426 | $ | 36,698 | $ | 46,150 | $ | 47,491 | $ | 31,326 | |||||||||
| |||||||||||||||||||
Operating Data: | |||||||||||||||||||
Total Restaurants (at end of period) | 53 | 53 | 50 | 46 | 40 | ||||||||||||||
Total comparable restaurants (at end of period(5)) | 46 | 41 | 37 | 35 | 30 | ||||||||||||||
Average sales per comparable restaurant | $ | 6,630 | $ | 7,229 | $ | 7,396 | $ | 7,563 | $ | 7,622 | |||||||||
Percentage change in comparable restaurant sales(3) | (2 | )% | (0.8 | )% | (0.6 | )% | 1.9 | % | 1.3 | % | |||||||||
(1) | We utilize a 52- or 53-week accounting period which ends on the last Tuesday of December. The fiscal years ended December 26, 2017, December 27, 2016, December 29, 2015 and December 30, 2014 each had 52 weeks. The fiscal year ended December 31, 2013 had 53 weeks. |
(2) | Insurance recovery represent amounts recovered from property damage in the fiscal year ended December 26, 2017 at two Sullivan's locations. |
(3) | We incurred $13.4 million in impairment charges related to the goodwill and indefinite-lived intangible assets of our Sullivan’s reporting unit, $23.6 million in impairment charges related to one Double Eagle, four Grille and one Sullivan's locations in connection with our decision to close the Grille and Sullivan’s locations. See note 2 in the notes to our consolidated financial statements. |
(4) | The $12.9 million income tax benefit was primarily attributable to permanent differences as a result of goodwill impairment and The Tax Cuts and Jobs Act, which permanently reduced the maximum federal corporate income tax rate from 35% to 21%. See note 5 in the notes to our consolidated financial statements. |
(5) | Defined as total current assets minus total current liabilities. |
(6) | We consider a restaurant to be comparable in the first full fiscal quarter following the eighteenth month of operations. Changes in comparable restaurant sales reflect changes in sales for the comparable group of restaurants over a specified period of time. |
28
Item 7. Management’s Discussion and Analysis of Financial Condition and Results of Operations
Overview
Del Frisco’s Restaurant Group, Inc. develops, owns and operates three contemporary, high-end, complementary restaurants: Del Frisco’s Double Eagle Steakhouse, Del Frisco’s Grille and Sullivan’s Steakhouse. We currently operate 53 restaurants in 23 states and the District of Columbia. Of the 53 restaurants we operated as of the end of the period covered by this report, there are 13 Double Eagle restaurants, 24 Grille restaurants and 16 Sullivan’s restaurants. During fiscal 2017, we opened one Double Eagle in Plano, TX and one Grille at Brookfield Place in New York City, NY.
Our Growth Strategies and Outlook. Our growth model is comprised of the following three primary drivers:
• | Pursue Disciplined Restaurant Growth. We believe that there are significant opportunities to grow our concepts on a national and international basis in both existing and new markets, where we believe we can generate attractive unit-level economics, which we view as the most significant driver of future growth. Given the importance of this growth driver, we have invested in and made improvements to our site selection and approval processes in 2017, including through the use of third party advisors. We have partnered with a third party master broker to source potential sites against a set of clear criteria for each Brand. Our evaluation process now includes working with a third party spatial analytics company, who have developed a model to determine the most attractive locations for each of our Brands and a predictive sales model for specific sites. We have also formed a Real Estate Committee, consisting of members of the Board and the senior management, which visits, assesses and approves each site. While we do not believe it is possible to guarantee every site will meet its expected returns, we expect these process improvements to increase the probability of a site meeting its financial return on investment hurdles. We believe our concepts’ complementary market positioning and ability to coexist in the same markets, coupled with our flexible unit models and robust site assessment and approval processes, will allow us to expand each of our three concepts into a greater number of locations. |
• | Grow Existing Revenue. We will continue to pursue opportunities to increase the sales at our existing restaurants. In 2017 we engaged third party consultants to assist us in better understanding our Brands' growth opportunities and our target guests. We believe that this analysis will enable us to make menu, marketing and operational improvements to increase restaurant unit volumes. |
• | Maintain Margins Throughout Our Growth. We will continue to aggressively protect our margins using economies of scale, including marketing and purchasing synergies between our concepts and leveraging our corporate infrastructure as we continue to open new restaurants. |
We believe there are opportunities to open four to seven new restaurants annually, generally composed of three to four Double Eagles and one to three Grilles, with new openings of our Double Eagle concept likely serving as the primary driver of new unit growth in the near term. During fiscal 2018, we expect to open three to four Double Eagles and two to three Grilles. See Item 1, Business for a discussion of our targeted average cash investment for each concept and other information regarding the opening of a new location.
Performance Indicators. We use the following key metrics in evaluating the performance of our restaurants:
• | Comparable Restaurant Sales Growth. We consider a restaurant to be comparable during the first full fiscal quarter following the eighteenth month of operations. Changes in comparable restaurant sales reflect changes in sales for the comparable group of restaurants over a specified period of time. Changes in comparable sales reflect changes in customer count trends as well as changes in average check. Our comparable restaurant base consisted of 46 and 41 restaurants at December 26, 2017 and December 27, 2016, respectively. |
• | Average Check. Average check is calculated by dividing total restaurant sales by customer counts for a given time period. Average check is influenced by menu prices and menu mix. Management uses this indicator to analyze trends in customers’ preferences, the effectiveness of menu changes and price increases and per customer expenditures. |
• | Average Unit Volume. Average unit volume, or AUV, consists of the average sales of our restaurants over a certain period of time. This measure is calculated by dividing total restaurant sales within a period by the number of restaurants operating during the relevant period. This indicator assists management in measuring changes in customer traffic, pricing and development of our concepts. |
• | Customer Counts. Customer counts are measured by the number of entrées ordered at our restaurants over a given time period. |
29
• | Adjusted EBITDA Margin. Adjusted EBITDA margin represents net (loss) income before interest, income taxes and depreciation and amortization plus the sum of certain non-operating expenses, including pre-opening costs, impairment charges, lease termination and closing costs, third-party lease guarantee payments, donations and insurance settlements, as a percentage of our revenues. This non-GAAP operating measures is useful to both management and investors, where by monitoring and controlling our adjusted EBITDA margins, we can gauge the overall profitability of our Company. |
• | Restaurant-Level EBITDA and Restaurant-Level EBITDA Margin. Restaurant-level EBITDA represents operating income (loss) before pre-opening costs, general and administrative costs, donations, consulting project costs, reorganization severance costs, lease termination and closing costs, depreciation and amortization, impairment charges and insurance settlements. Restaurant-level EBITDA margin represents Restaurant-level EBITDA as a percentage of our revenues. These non-GAAP operating measures are useful to both management and investors because they represent one means of gauging the overall profitability of our recurring and controllable core restaurant operations for each segment, and all segments at a consolidated level. These measures are not however indicative of our overall results, nor does restaurant-level profit accrue directly to the benefit of stockholders, primarily due to the exclusion of corporate-level expenses. See note 12 in the notes to our consolidated financial statements for a reconciliation of restaurant-level EBITDA to operating income at a consolidated level. |
Our business is subject to seasonal fluctuations. Historically, the percentage of our annual revenues earned during the first and fourth fiscal quarters has been higher due, in part, to increased gift card redemptions and increased private dining during the year-end holiday season, respectively. In addition, we operate on a 52- or 53-week fiscal year ending the last Tuesday of each December, and our first, second and third quarters each contain 12 operating weeks with the fourth quarter containing 16 or 17 operating weeks. Starting in fiscal 2018, we will begin to use 12 periods for our fiscal reporting calendar, meaning that our first, second and third quarters will each contain 13 operating weeks with the fourth quarter containing 13 or 14 operating weeks. As many of our operating expenses have a fixed component, our operating income and operating income margin have historically varied significantly from quarter to quarter. Accordingly, results for any one quarter are not necessarily indicative of results to be expected for any other quarter or for any year.
Key Financial Definitions
Revenues. Revenues consist primarily of food and beverage sales at our restaurants, net of any discounts, such as management meals and employee meals, associated with each sale. Additionally, revenues are net of the cost of loyalty points earned associated with sales made to customers in our loyalty program. Revenues also include breakage income associated with gift cards. In fiscal 2017 and 2016, food comprised 70% and 68% of food and beverage sales with beverage comprising the remaining 30% and 32%, respectively. Revenues are directly influenced by the number of operating weeks in the relevant period and comparable restaurant sales growth. Comparable restaurant sales growth reflects the change in year-over-year sales for the comparable restaurant base. Comparable restaurant sales growth is primarily influenced by the number of customers eating in our restaurants, which is influenced by the popularity of our menu items, competition with other restaurants in each market, our customer mix and our ability to deliver a high quality dining experience, and the average check, which is driven by menu mix and pricing.
Cost of Sales. Cost of sales is comprised primarily of food and beverage expenses. We measure food and beverage expenses by tracking cost of sales as a percentage of revenues. Food and beverage expenses are generally influenced by the cost of food and beverage items, distribution costs and menu mix. The components of cost of sales are variable in nature, increase with revenues, are subject to increases or decreases based on fluctuations in commodity costs, including beef prices, and depend in part on the controls we have in place to manage costs of sales at our restaurants.
Restaurant Operating Expenses. We measure restaurant operating expenses as a percentage of revenues. Restaurant operating expenses include the following:
• | Labor expenses, which comprise restaurant management salaries, hourly staff payroll and other payroll-related expenses, including management bonus expenses, vacation pay, payroll taxes, fringe benefits and health insurance expenses and are measured by tracking hourly and total labor as a percentage of revenues; |
• | Occupancy expenses, which comprise all occupancy costs other than pre-opening rent expense, consisting of both fixed and variable portions of rent, common area maintenance charges, real estate property taxes and other related occupancy costs and are measured by tracking occupancy as a percentage of revenues; and |
• | Other operating expenses, which comprise repairs and maintenance, utilities, operating supplies and other restaurant-level related operating expenses and are measured by tracking other operating expenses as a percentage of revenues. |
30
Marketing and Advertising Costs. Marketing and advertising costs include all media, production and related costs for both local restaurant advertising and national marketing. We measure the efficiency of our marketing and advertising expenditures by tracking these costs as a percentage of total revenues. We have historically spent approximately 1.5% to 2.5% of total revenues on marketing and advertising and expect to maintain this level in the near term.
Pre-opening Costs. Pre-opening costs are costs incurred prior to opening a restaurant, and primarily consist of manager salaries, relocation costs, recruiting expenses, employee payroll and related training costs for new employees, including rehearsal of service activities, as well as non-cash lease costs incurred prior to opening. In addition, pre-opening expenses include marketing costs incurred prior to opening as well as meal expenses for entertaining local dignitaries, families and friends. Pre-opening costs can vary significantly from site to site, primarily due to the variability in non-cash lease costs at different restaurant locations. Excluding non-cash lease costs, we currently target pre-opening costs of $1.0 million for Double Eagle openings and $0.7 million for Grille and Sullivan’s openings.
General and Administrative Expenses. General and administrative expenses are comprised of costs related to certain corporate and administrative functions that support development and restaurant operations and provide an infrastructure to support future company growth. These expenses reflect management, supervisory and staff salaries and employee benefits, travel, information systems, training, corporate rent, professional and consulting fees, technology and market research. We measure general and administrative costs by tracking general and administrative expenses as a percentage of revenues. These expenses are expected to increase as a result of costs related to our anticipated growth, including substantial training costs and significant investments in infrastructure. As we are able to leverage these investments made in our people and systems, we expect these expenses to decrease as a percentage of total revenues over time.
Depreciation and Amortization. Depreciation and amortization includes depreciation of fixed assets and certain definite-life intangible assets. We depreciate capitalized leasehold improvements over the shorter of the total expected lease term or their estimated useful life. As we accelerate our restaurant openings, depreciation and amortization is expected to increase as a result of our increased capital expenditures.
Results of Operations
The following table sets forth certain statements of income data for the periods indicated:
| Fiscal Year Ended | |||||||||||||||||||
(Amounts in thousands) | December 26, 2017 | December 27, 2016 | December 29, 2015 | |||||||||||||||||
Revenues | $ | 361,431 | 100.0 | % | $ | 351,681 | 100.0 | % | $ | 331,612 | 100.0 | % | ||||||||
Costs and expenses: | ||||||||||||||||||||
Costs of sales | 103,976 | 28.8 | % | 99,181 | 28.2 | % | 95,963 | 28.9 | % | |||||||||||
Restaurant operating expenses | 177,170 | 49.0 | % | 169,300 | 48.1 | % | 156,337 | 47.1 | % | |||||||||||
Insurance recovery | (1,073 | ) | -0.3 | % | — | 0.0 | % | — | 0.0 | % | ||||||||||
Marketing and advertising costs | 8,393 | 2.3 | % | 8,260 | 2.3 | % | 7,745 | 2.3 | % | |||||||||||
Pre-opening costs | 2,182 | 0.6 | % | 3,446 | 1.0 | % | 5,228 | 1.6 | % | |||||||||||
General and administrative costs | 28,421 | 7.9 | % | 25,131 | 7.1 | % | 23,111 | 7.0 | % | |||||||||||
Donations | 836 | 0.2 | % | — | 0.0 | % | — | 0.0 | % | |||||||||||
Consulting project costs | 2,786 | 0.8 | % | — | 0.0 | % | — | 0.0 | % | |||||||||||
Reorganization severance | 1,072 | 0.3 | % | 793 | 0.2 | % | — | 0.0 | % | |||||||||||
Lease termination and closing costs | 538 | 0.1 | % | 1,031 | 0.3 | % | 1,386 | 0.4 | % | |||||||||||
Impairment charges | 37,053 | 10.3 | % | 598 | 0.2 | % | 3,248 | 1.0 | % | |||||||||||
Depreciation and amortization | 23,399 | 6.5 | % | 18,865 | 5.4 | % | 16,776 | 5.1 | % | |||||||||||
Total costs and expenses | 384,753 | 106.5 | % | 326,605 | 92.9 | % | 309,794 | 93.4 | % | |||||||||||
Insurance settlements | 1,153 | 0.3 | % | — | 0.0 | % | — | 0.0 | % | |||||||||||
Operating (loss) income | (22,169 | ) | -6.1 | % | 25,076 | 7.1 | % | 21,818 | 6.6 | % | ||||||||||
Other income (expense), net: | ||||||||||||||||||||
Interest, net of capitalized interest | (783 | ) | -0.2 | % | (70 | ) | 0.0 | % | (77 | ) | 0.0 | % | ||||||||
Other | (1,439 | ) | -0.4 | % | (432 | ) | -0.1 | % | (236 | ) | -0.1 | % | ||||||||
(Loss) income before income taxes | (24,391 | ) | -6.7 | % | 24,574 | 7.0 | % | 21,505 | 6.5 | % | ||||||||||
Income tax (benefit) expense | (12,934 | ) | -3.6 | % | 6,808 | 1.9 | % | 5,507 | 1.7 | % | ||||||||||
Net (loss) income | $ | (11,457 | ) | -3.2 | % | $ | 17,766 | 5.1 | % | $ | 15,998 | 4.8 | % | |||||||
31
Fiscal Year Ended December 26, 2017 (52 weeks) Compared to Fiscal Year Ended December 27, 2016 (52 weeks)
The following tables show our operating results by operating segment, as well as our operating results as a percentage of revenues, for the fiscal years ended December 26, 2017 and December 27, 2016.
| Fiscal Year Ended December 26, 2017 | ||||||||||||||||||||||||||
(Amounts in thousands except operating weeks) | Del Frisco's | Grille | Sullivan's | Consolidated | |||||||||||||||||||||||
Revenues | $ | 176,713 | 100.0 | % | $ | 117,114 | 100.0 | % | $ | 67,604 | 100.0 | % | $ | 361,431 | 100.0 | % | |||||||||||
Costs and expenses: | |||||||||||||||||||||||||||
Cost of sales | 52,944 | 30.0 | % | 30,673 | 26.2 | % | 20,359 | 30.1 | % | 103,976 | 28.8 | % | |||||||||||||||
Restaurant operating expenses: | |||||||||||||||||||||||||||
Labor | 41,935 | 23.7 | % | 39,163 | 33.4 | % | 19,800 | 29.3 | % | 100,898 | 27.9 | % | |||||||||||||||
Operating expenses | 18,846 | 10.7 | % | 15,849 | 13.5 | % | 9,929 | 14.7 | % | 44,624 | 12.3 | % | |||||||||||||||
Occupancy | 12,511 | 7.1 | % | 13,216 | 11.3 | % | 4,848 | 7.2 | % | 30,575 | 8.5 | % | |||||||||||||||
Restaurant operating expenses | 73,292 | 41.5 | % | 68,228 | 58.3 | % | 34,577 | 51.1 | % | 176,097 | 48.7 | % | |||||||||||||||
Marketing and advertising costs | 3,568 | 2.0 | % | 2,750 | 2.3 | % | 2,075 | 3.1 | % | 8,393 | 2.3 | % | |||||||||||||||
Restaurant-level EBITDA | $ | 46,909 | 26.5 | % | $ | 15,463 | 13.2 | % | $ | 10,593 | 15.7 | % | $ | 72,965 | 20.2 | % | |||||||||||
| |||||||||||||||||||||||||||
Restaurant operating weeks | 655 | 1,221 | 858 | 2,734 | |||||||||||||||||||||||
Average weekly volume | $ | 270 | $ | 96 | $ | 79 | $ | 132 | |||||||||||||||||||
| Fiscal Year Ended December 27, 2016 | ||||||||||||||||||||||||||
(Amounts in thousands except operating weeks) | Del Frisco's | Grille | Sullivan's | Consolidated | |||||||||||||||||||||||
Revenues | $ | 166,885 | 100.0 | % | $ | 106,999 | 100.0 | % | $ | 77,797 | 100.0 | % | $ | 351,681 | 100.0 | % | |||||||||||
Costs and expenses: | |||||||||||||||||||||||||||
Cost of sales | 48,968 | 29.3 | % | 27,351 | 25.6 | % | 22,862 | 29.4 | % | 99,181 | 28.2 | % | |||||||||||||||
Restaurant operating expenses: | |||||||||||||||||||||||||||
Labor | 38,253 | 22.9 | % | 35,146 | 32.8 | % | 23,033 | 29.6 | % | 96,432 | 27.4 | % | |||||||||||||||
Operating expenses | 18,366 | 11.0 | % | 14,618 | 13.7 | % | 11,641 | 15.0 | % | 44,625 | 12.7 | % | |||||||||||||||
Occupancy | 11,080 | 6.6 | % | 11,555 | 10.8 | % | 5,608 | 7.2 | % | 28,243 | 8.0 | % | |||||||||||||||
Restaurant operating expenses | 67,699 | 40.6 | % | 61,319 | 57.3 | % | 40,282 | 51.8 | % | 169,300 | 48.1 | % | |||||||||||||||
Marketing and advertising costs | 3,341 | 2.0 | % | 2,448 | 2.3 | % | 2,471 | 3.2 | % | 8,260 | 2.3 | % | |||||||||||||||
Restaurant-level EBITDA | $ | 46,877 | 28.1 | % | $ | 15,881 | 14.8 | % | $ | 12,182 | 15.7 | % | $ | 74,940 | 21.3 | % | |||||||||||
| |||||||||||||||||||||||||||
Restaurant operating weeks | 620 | 1,079 | 936 | 2,635 | |||||||||||||||||||||||
Average weekly volume | $ | 269 | $ | 99 | $ | 83 | $ | 133 | |||||||||||||||||||
Revenues. Consolidated revenues increased $9.8 million, or 2.8%, to $361.4 million in fiscal 2017 from $351.7 million in fiscal 2016. This increase was due to 99 net additional operating weeks in fiscal 2017 resulting from two new restaurant openings. This increase was partially offset by decreased revenue at our comparable restaurants, and the closure of the Seattle, Washington and Houston, Texas Sullivan's restaurants. Comparable restaurant sales decreased 2.0%, comprised of 1.8% decrease in customer counts and 0.2% decrease in average check.
Del Frisco’s Double Eagle revenues increased $9.8 million, or 5.9%, to $176.7 million in fiscal 2017 from $166.9 million in fiscal 2016. This increase was primarily due to 35 additional operating weeks resulting from one new restaurant opening in Plano, Texas, partially offset by 0.1% decrease in comparable restaurant sales, comprised of a 0.2% decrease in customer counts, partially offset by a 0.1% increase in average check.
The Grille’s revenues increased $10.1 million, or 9.5%, to $117.1 million in fiscal 2017 from $107.0 million in fiscal 2016. This increase was driven by 142 net additional operating weeks resulting from one new restaurant opening at Brookfield Place in New York City, NY and the full year impact of three restaurants opened in fiscal 2016. This increase was partially offset by a 1.9% decrease in total comparable restaurant sales, comprised of a 1.8% decrease in average check and by a 0.1% decrease in customer counts.
32
Sullivan’s revenues decreased $10.2 million, or 13.1%, to $67.6 million in fiscal 2017 from $77.8 million in fiscal 2016.The decrease in revenues was primarily due to the loss of 78 operating weeks due to the closure of the Seattle, Washington and Houston, Texas Sullivan’s restaurants during the second quarter of 2017, and a decrease in comparable restaurant sales. Comparable restaurant sales decreased by 6.3%, comprised of a 7.0% decrease in customer counts, partially offset by a 0.7% increase in average check. The decrease in comparable restaurant sales was primarily due to eliminating lunch at selected Sullivan's restaurants, beginning during the second quarter of 2017.
Cost of Sales. Consolidated cost of sales increased $4.8 million, or 4.8%, to $104.0 million in fiscal 2017 from 99.2 million in fiscal 2016. This increase was primarily due to an additional 99 net operating weeks in fiscal 2017, as discussed above. As a percentage of consolidated revenues, consolidated cost of sales increased to 28.8% in fiscal 2017 from 28.2% in fiscal 2016.
As a percentage of revenues, Del Frisco’s Double Eagle cost of sales increased to 30.0% during fiscal 2017 from 29.3% in fiscal 2016. This increase in cost of sales, as a percentage of revenues, was primarily due to higher beef, seafood, and wine costs.
As a percentage of revenues, the Grille’s cost of sales increased to 26.2% during fiscal 2017 from 25.6% in fiscal 2016. This increase in cost of sales, as a percentage of revenues, was primarily due to higher beef costs partially offset by lower seafood and wine costs.
As a percentage of revenues, Sullivan’s cost of sales increased to 30.1% during fiscal 2017 from 29.4% in fiscal 2016. This increase in cost of sales, as a percentage of revenues, was primarily due to higher beef and seafood costs, partially offset by lower wine costs.
Restaurant Operating Expenses. Consolidated restaurant operating expenses increased $6.8 million, or 4.0%, to $176.1 million in fiscal 2017 from $169.3 million in fiscal 2016. This increase was primarily due to an additional 99 net operating weeks in fiscal 2017, as discussed above. As a percentage of consolidated revenues, consolidated restaurant operating expenses increased to 49.0% in fiscal 2017 from 48.1% in fiscal 2016.
As a percentage of revenues, Del Frisco’s Double Eagle restaurant operating expenses increased to 41.5% during fiscal 2017 from 40.6% in fiscal 2016. This increase in restaurant operating expenses, as a percentage of revenues, was due to higher occupancy, labor costs and other restaurant operating costs.
As a percentage of revenues, the Grille’s restaurant operating expenses increased to 58.3% during fiscal 2017 from 57.3% in fiscal 2016. This increase in restaurant operating expenses, as a percentage of revenues, was due to higher labor, occupancy and other restaurant operating costs.
As a percentage of revenues, Sullivan’s restaurant operating expenses decreased to 51.1% during fiscal 2017 from 51.8% in fiscal 2016. This decrease in restaurant operating expenses, as a percentage of revenues, was due to lower labor and occupancy and other restaurant operating costs.
Marketing and Advertising Costs. Consolidated marketing and advertising costs increased by $0.1 million, or 1.6%, to $8.4 million in fiscal 2017 from $8.3 million in fiscal 2016. As a percentage of consolidated revenues, consolidated marketing and advertising costs remained at 2.3% in fiscal 2017 compared to fiscal 2016.
As a percentage of revenues, Del Frisco’s Double Eagle marketing and advertising costs remained at 2.0% in fiscal 2017 compared to fiscal 2016.
As a percentage of revenues, the Grille’s marketing and advertising costs remained at 2.3% in fiscal 2017 compared to fiscal 2016.
As a percentage of revenues, Sullivan’s marketing and advertising costs decreased to 3.1% in fiscal 2017 from 3.2% in fiscal 2016. The decrease in marketing and advertising costs, as a percentage of revenues, was primarily due to lower print and other advertising costs, partially offset by higher outdoor media and local advertising costs.
Pre-opening Costs. Pre-opening costs decreased $1.3 million to $2.2 million in fiscal 2017 from $3.4 million in fiscal 2016. We opened one Double Eagle and one Grille in fiscal 2017 compared to one Double Eagle and three new Grilles which were opened in fiscal 2016. The relocated Dallas Del Frisco’s Double Eagle was treated as a new restaurant opening and incurred customary pre-opening expenses in preparation for the opening of the restaurant.
General and Administrative Expenses. General and administrative expenses increased $3.3 million, or 13.1%, to $28.4 million in fiscal 2017 from $25.1 million in fiscal 2016. This increase was primarily related to additional compensation costs related to growth in the number of restaurant support center and regional management-level personnel to support recent and anticipated
33
growth and marketing efforts, and professional fees primarily driven by increased fees associated with the year-end integrated audit of our consolidated financial statements in connection with losing our “emerging growth company status. As a percentage of revenues, general and administrative expenses increased to 7.9% in fiscal 2017 from 7.1% in fiscal 2016. General and administrative costs are expected to continue to increase as a result of costs related to our anticipated growth, including further investments in our infrastructure. As we are able to leverage these investments made in our people and systems, we expect these expenses to decrease as a percentage of total revenues over time.
Donations. Donations were $0.8 million in fiscal 2017 and were primarily related to donations to the Houston area food bank to support victims affected by Hurricane Harvey in the third quarter of 2017. Donations were minimal in fiscal 2016.
Consulting Project Costs. Consulting project costs were $2.8 million in fiscal 2017. These costs are primarily related to consumer insight research supporting the Grille restaurants, and to a lesser extent supporting the Double Eagle and Sullivan's restaurants, and we expect minimal such costs after fiscal 2017. No such costs were incurred in fiscal 2016.
Reorganization Severance. Reorganization severance costs were $1.1 million and in fiscal 2017 and $0.8 million in fiscal 2016. These costs are primarily related to the costs associated with replacing certain employees in leadership positions as a part of strategic initiatives effected by our executive leadership team, we expect minimal such costs after fiscal 2017.
Lease termination and closing costs. In conjunction with closing two Sullivan's restaurants, in fiscal 2017, we incurred $0.5 million in lease termination costs. During the fourth quarter of fiscal 2016, we decided to close the Seattle Sullivan’s location by March 31, 2017. In conjunction with this anticipated closing, in fiscal 2016, we incurred $0.9 million in lease termination costs, and additional $0.1 million in closing costs related to prior year closures.
Impairment Charges. During fiscal 2017, we determined that the carrying values of our goodwill and indefinite-lived intangible assets related to Sullivan’s concept exceeded their fair values based on estimated future cash flows that would be generated by Sullivan's restaurants. Therefore, we recorded a non-cash impairment charge of $13.4 million, of which $0.3 million is related to trade name, which primarily represents the difference between the carrying value of the goodwill for Sullivan's concept and its estimated fair value. This amount is included in impairment charges in the consolidated statements of operations and comprehensive (loss) income.
During the fourth quarter of fiscal 2017, we determined that the carrying values of one Double Eagle, four Grille and one Sullivan's locations exceeded their estimated future cash flows, due in part by our determination to close the Grille and Sullivan's locations, and recognized a combined, $23.6 million impairment charge. This charge was based on the difference between the carrying values of the restaurant assets and the estimated fair values of leasehold improvements, furniture and restaurant equipment that may be transferred to other restaurant locations. During the fourth quarter of fiscal 2016, we determined that the carrying values of two Sullivan's locations exceeded their estimated future cash flows, due in part by our determination to close these locations, and recognized a combined $0.6 million impairment charge. This charge was based on the difference between the carrying values of the restaurant assets and the estimated fair values of leasehold improvements, furniture and restaurant equipment that may be transferred to other restaurant locations. See notes 1 and 3 to our consolidated financial statements.
Depreciation and Amortization. Depreciation and amortization increased $4.5 million, or 24%, to $23.4 million in fiscal 2017 from $18.9 million in fiscal 2016. The increase in depreciation and amortization expense primarily resulted from new assets related to two restaurants opened in fiscal 2017 and four restaurants opened in fiscal 2016, as well as for existing restaurants that were remodeled during fiscal 2017 and fiscal 2016.
Interest Expense. Interest expense increased to $0.8 million in 2017, net of nominal capitalized interest from $0.1 million in 2016. The increase in interest expense primarily resulted from increased borrowings from our revolving credit facility during fiscal 2017.
Provision (Benefit) for Income Taxes. The effective income tax rate had a negative rate of 53.0% in fiscal 2017 and 27.7% in fiscal 2016. The change in the effective tax rate resulted in income tax benefit of $12.9 million in fiscal 2017 compared to income tax expense of $6.8 million in fiscal 2016. The decrease in the effective tax rate was primarily attributable to permanent differences as a result of goodwill impairment and The Tax Cuts and Jobs Act or the (TCJA) which permanently reduced the maximum federal corporate income tax rate from 35% to 21% effective for tax years beginning after December 31, 2017. The change in the tax rate required deferred tax assets and liabilities to be measured at the enacted tax rate expected to apply when temporary differences are to be realized or settled. The impact of the rate reduction on our 2017 income tax provision is a $4.6 million tax benefit due to the remeasurement of deferred tax assets and liabilities.
We completed our accounting for the TCJA under ASC 740 and reported provisional amounts for the income tax effects of the TCJA for which the accounting is incomplete but a reasonable estimate could be determined. There were no specific impacts of
34
the TCJA that could not be reasonably estimated. Based on a continued analysis of the estimates and further guidance on the application of the law, it is anticipated that additional revisions may occur throughout the allowable measurement period. See note 5 to our consolidated financial statements.
Fiscal Year Ended December 27, 2016 (52 weeks) Compared to Fiscal Year Ended December 29, 2015 (52 weeks)
The following tables show our operating results by operating segment, as well as our operating results as a percentage of revenues, for the fiscal years ended December 27, 2016 and December 29, 2015.
| Fiscal Year Ended December 27, 2016 | ||||||||||||||||||||||||||
(Amounts in thousands except operating weeks) | Del Frisco's | Grille | Sullivan's | Consolidated | |||||||||||||||||||||||
Revenues | $ | 166,885 | 100.0 | % | $ | 106,999 | 100.0 | % | $ | 77,797 | 100.0 | % | $ | 351,681 | 100.0 | % | |||||||||||
Costs and expenses: | |||||||||||||||||||||||||||
Cost of sales | 48,968 | 29.3 | % | 27,351 | 25.6 | % | 22,862 | 29.4 | % | 99,181 | 28.2 | % | |||||||||||||||
Restaurant operating expenses: | |||||||||||||||||||||||||||
Labor | 38,253 | 22.9 | % | 35,146 | 32.8 | % | 23,033 | 29.6 | % | 96,432 | 27.4 | % | |||||||||||||||
Operating expenses | 18,366 | 11.0 | % | 14,618 | 13.7 | % | 11,641 | 15.0 | % | 44,625 | 12.7 | % | |||||||||||||||
Occupancy | 11,080 | 6.6 | % | 11,555 | 10.8 | % | 5,608 | 7.2 | % | 28,243 | 8.0 | % | |||||||||||||||
Restaurant operating expenses | 67,699 | 40.6 | % | 61,319 | 57.3 | % | 40,282 | 51.8 | % | 169,300 | 48.1 | % | |||||||||||||||
Marketing and advertising costs | 3,341 | 2.0 | % | 2,448 | 2.3 | % | 2,471 | 3.2 | % | 8,260 | 2.3 | % | |||||||||||||||
Restaurant-level EBITDA | $ | 46,877 | 28.1 | % | $ | 15,881 | 14.8 | % | $ | 12,182 | 15.7 | % | $ | 74,940 | 21.3 | % | |||||||||||
| |||||||||||||||||||||||||||
Restaurant operating weeks | 620 | 1,079 | 936 | 2,635 | |||||||||||||||||||||||
Average weekly volume | $ | 269 | $ | 99 | $ | 83 | $ | 133 | |||||||||||||||||||
| Fiscal Year Ended December 29, 2015 | ||||||||||||||||||||||||||
(Amounts in thousands) | Del Frisco's | Grille | Sullivan's | Consolidated | |||||||||||||||||||||||
Revenues | $ | 161,809 | 100.0 | % | $ | 90,820 | 100.0 | % | $ | 78,983 | 100.0 | % | $ | 331,612 | 100.0 | % | |||||||||||
Costs and expenses: | |||||||||||||||||||||||||||
Cost of sales | 48,479 | 30.0 | % | 23,781 | 26.2 | % | 23,703 | 30.0 | % | 95,963 | 28.9 | % | |||||||||||||||
Restaurant operating expenses: | |||||||||||||||||||||||||||
Labor | 37,110 | 22.9 | % | 29,299 | 32.3 | % | 23,107 | 29.3 | % | 89,516 | 27.0 | % | |||||||||||||||
Operating expenses | 17,130 | 10.6 | % | 12,546 | 13.8 | % | 11,646 | 14.7 | % | 41,322 | 12.5 | % | |||||||||||||||
Occupancy | 10,447 | 6.5 | % | 9,939 | 10.9 | % | 5,113 | 6.5 | % | 25,499 | 7.7 | % | |||||||||||||||
Restaurant operating expenses | 64,687 | 40.0 | % | 51,784 | 57.0 | % | 39,866 | 50.5 | % | 156,337 | 47.1 | % | |||||||||||||||
Marketing and advertising costs | 2,806 | 1.7 | % | 2,595 | 2.9 | % | 2,344 | 3.0 | % | 7,745 | 2.3 | % | |||||||||||||||
Restaurant-level EBITDA | $ | 45,837 | 28.3 | % | $ | 12,660 | 13.9 | % | $ | 13,070 | 16.5 | % | $ | 71,567 | 21.6 | % | |||||||||||
| |||||||||||||||||||||||||||
Restaurant operating weeks | 591 | 936 | 957 | 2,484 | |||||||||||||||||||||||
Average weekly volume | $ | 274 | $ | 97 | $ | 83 | $ | 133 | |||||||||||||||||||
Revenues. Consolidated revenues increased $20.1 million, or 6.1%, to $351.7 million in fiscal 2016 from $331.6 million in fiscal 2015. This increase was due to 151 net additional operating weeks in fiscal 2016 resulting from three Grille openings in fiscal 2016 and the full year impact of one Double Eagle and six Grille openings in fiscal 2015. This increase was partially offset by the closing of one Sullivan’s location and two Grille locations in fiscal 2015, the temporary closing of the Dallas Del Frisco’s Double Eagle in Dallas, Texas during its relocation in fiscal 2016 and by a 0.8% decrease in total comparable restaurant sales, comprised of a 0.8% decrease in customer counts.
Double Eagle revenues increased $5.1 million, or 3.1%, to $166.9 million in fiscal 2016 from $161.8 million in fiscal 2015. This increase was primarily due to 33 additional operating weeks resulting from the full year impact of the Orlando, Florida Double Eagle, which opened in August 2015. This increase was partially offset by the temporary closing of the Dallas, Texas Double Eagle during its relocation in fiscal 2016 and a 1.2% decrease in total comparable restaurant sales, comprised of a 1.6% decrease in customer counts, partially offset by a 0.4% increase in average check.
The Grille’s revenues increased $16.2 million, or 17.8%, to $107.0 million in fiscal 2016 from $90.8 million in fiscal 2015. This increase was driven by 143 net additional operating weeks resulting from three Grille openings during fiscal 2016 and the
35
full year impact of six Grille openings during fiscal 2015. This increase was partially offset by a 0.7% decrease in total comparable restaurant sales, comprised of a 0.8% decrease in average check, partially offset by a 0.1% increase in customer counts, as well as the closure of two Grille locations in fiscal 2015.
Sullivan’s revenues decreased $1.2 million, or 1.5%, to $77.8 million in fiscal 2016 from $79.0 million in fiscal 2015. This decrease was primarily due to the closing of one Sullivan’s location in May 2015, as well as a 0.2% decrease in total comparable restaurant sales, comprised of a 0.8% decrease in customer counts, partially offset by a 0.6% increase in average check.
Cost of Sales. Consolidated cost of sales increased $3.2 million, or 3.4%, to $99.2 million in fiscal 2016 from $96.0 million in fiscal 2015. This increase was primarily due to an additional 151 net operating weeks in fiscal 2016, as discussed above. As a percentage of consolidated revenues, consolidated cost of sales decreased to 28.2% in fiscal 2016 from 28.9% in fiscal 2015.
As a percentage of revenues, Del Frisco’s Double Eagle cost of sales decreased to 29.3% during fiscal 2016 from 30.0% in fiscal 2015. This decrease in cost of sales, as a percentage of revenues, was primarily due to lower beef costs, partially offset by higher seafood and wine costs.
As a percentage of revenues, the Grille’s cost of sales decreased to 25.6% during fiscal 2016 from 26.2% in fiscal 2015. This decrease in cost of sales, as a percentage of revenues, was primarily due to lower beef, seafood and wine costs.
As a percentage of revenues, Sullivan’s cost of sales decreased to 29.4% during fiscal 2016 from 30.0% in fiscal 2015. This decrease in cost of sales, as a percentage of revenues, was primarily due to lower beef and seafood costs.
Restaurant Operating Expenses. Consolidated restaurant operating expenses increased $13.0 million, or 8.3%, to $169.3 million in fiscal 2016 from $156.3 million in fiscal 2015. This increase was primarily due to an additional 151 net operating weeks in fiscal 2016, as discussed above. As a percentage of consolidated revenues, consolidated restaurant operating expenses increased to 48.1% in fiscal 2016 from 47.1% in fiscal 2015.
As a percentage of revenues, Del Frisco’s Double Eagle restaurant operating expenses increased to 40.6% during fiscal 2016 from 40.0% in fiscal 2015. This increase in restaurant operating expenses, as a percentage of revenues, was due to higher occupancy costs and other restaurant operating costs.
As a percentage of revenues, the Grille’s restaurant operating expenses increased to 57.3% during fiscal 2016 from 57.0% in fiscal 2015. This increase in restaurant operating expenses, as a percentage of revenues, was due to higher labor costs, partially offset by lower occupancy costs and other restaurant operating expenses.
As a percentage of revenues, Sullivan’s restaurant operating expenses increased to 51.8% during fiscal 2016 from 50.5% in fiscal 2015. This increase in restaurant operating expenses, as a percentage of revenues, was due to higher labor costs, other restaurant operating costs and occupancy costs.
Marketing and Advertising Costs. Consolidated marketing and advertising costs increased $0.5 million, or 6.6%, to $8.3 million in fiscal 2016 from $7.7 million in fiscal 2015. As a percentage of consolidated revenues, consolidated marketing and advertising costs remained flat at 2.3% in fiscal 2016 compared to fiscal 2015.
As a percentage of revenues, Del Frisco’s Double Eagle marketing and advertising costs increased to 2.0% in fiscal 2016 from 1.7% in fiscal 2015. The increase in marketing and advertising costs, as a percentage of revenues, was primarily due to higher digital and print advertising, partially offset by lower broadcast media costs.
As a percentage of revenues, the Grille’s marketing and advertising costs decreased to 2.3% in fiscal 2016 from 2.9% in fiscal 2015. This decrease in marketing and advertising costs, as a percentage of revenues, was due to lower broadcast media and other advertising, partially offset by higher digital advertising and print production costs.
As a percentage of revenues, Sullivan’s marketing and advertising costs increased to 3.2% in fiscal 2016 from 3.0% in fiscal 2015. The increase in marketing and advertising costs, as a percentage of revenues, was primarily due to higher digital and print advertising, partially offset by lower broadcast media costs.
Pre-opening Costs. Pre-opening costs decreased by $1.8 million to $3.4 million in fiscal 2016 from $5.2 million in fiscal 2015. One new Double Eagle and three new Grilles were opened in fiscal 2016 compared to one new Double Eagle and six new Grilles in fiscal 2015. The relocated Dallas Del Frisco’s Double Eagle was treated as a new restaurant opening and incurred customary pre-opening expenses in preparation for the opening of the restaurant.
36
General and Administrative Expenses. General and administrative expenses increased $2.0 million, or 8.7%, to $25.1 million in fiscal 2016 from $23.1 million in fiscal 2015. This increase was primarily related to additional compensation costs related to growth in the number of restaurant support center and regional management-level personnel to support recent and anticipated growth, as well as increased legal expenses and $0.8 million in reorganization severance expenses. As a percentage of revenues, general and administrative expenses increased to 7.4% in fiscal 2016 from 7.0% in fiscal 2015. General and administrative costs are expected to continue to increase as a result of costs related to our anticipated growth, including further investments in our infrastructure. As we are able to leverage these investments made in our people and systems, we expect these expenses to decrease as a percentage of total revenues over time.
Lease termination and closing costs. During the fourth quarter of fiscal 2016, we decided to close the Seattle Sullivan’s location by March 31, 2017. In conjunction with this anticipated closing, we incurred $0.9 million in lease termination costs, as well as $0.1 million in closing costs from prior year closures. In fiscal 2015, we incurred $1.4 million in lease termination and closing costs due to the closing of two Grille locations in the fourth quarter of fiscal 2015.
Impairment Charges. During the fourth quarter of fiscal 2016, we determined that the carrying values of two Sullivan’s locations exceeded their estimated future cash flows, due in part by our determination to close these locations, and recognized a combined $0.6 million impairment charge. This charge was based on the difference between the carrying values of the restaurant assets and the estimated fair values of leasehold improvements, furniture and restaurant equipment that may be transferred to other restaurant locations. During the third quarter of fiscal 2015, we determined that the carrying value of one Grille location exceeded its estimated future cash flows and recognized a $3.2 million impairment charge. This charge was based on the difference between the carrying value of the restaurant assets and the estimated fair value of furniture and restaurant equipment that may be transferred to future Grille locations.
Depreciation and Amortization. Depreciation and amortization increased $2.1 million, or 12.5%, to $18.9 million in fiscal 2016 from $16.8 million in fiscal 2015. The increase in depreciation and amortization expense primarily resulted from new assets related to seven restaurants opened in fiscal 2015 and four restaurants opened in fiscal 2016, as well as for existing restaurants that were remodeled during fiscal 2015 and fiscal 2016.
Interest Expense. Interest expense decreased to $70,000 in 2016, net of capitalized interest of $19,000, from $77,000 in 2015.
Provision for Income Taxes. The effective income tax rate was 27.7% and 25.6% in fiscal 2016 and fiscal 2015, respectively. The factors that cause the effective tax rates to vary from the federal statutory rate of 35% include the impact of FICA tip and other credits, state income taxes and certain non-deductible or non-taxable expenses. The increase in the effective tax rate was primarily attributable to increased state tax expense, and a higher taxable income without a corresponding increase in tax credits.
Liquidity and Capital Resources
We believe that net cash provided by operating activities and available borrowings under our credit facility will be sufficient to fund currently anticipated working capital, planned capital expenditures and debt service requirements for the next 24 months. We regularly review acquisitions and other strategic opportunities, which may require additional debt or equity financing.
Our principal liquidity requirements are our lease obligations and our working capital and capital expenditure needs and any principal and interest obligations on our debt. Subject to our operating performance, which, if significantly adversely affected, would adversely affect the availability of funds, we expect to finance our operations for at least the next several years, including costs of opening currently planned new restaurants, through cash provided by operations and existing borrowings available under our credit facility discussed below. We cannot be sure that these sources will be sufficient to finance our operations, however, and we may seek additional financing in the future. As of December 26, 2017, we had cash and cash equivalents of approximately $4.6 million.
Our operations have not required significant working capital and, like many restaurant companies, we may at times have negative working capital. Revenues are received primarily in cash or by credit card, and restaurant operations do not require significant receivables or inventories, other than our wine inventory. In addition, we receive trade credit for the purchase of food, beverages and supplies, thereby reducing the need for incremental working capital to support growth.
37
Cash Flows
The following table summarizes the consolidated statement of cash flows for the fiscal years ended December 26, 2017, December 27, 2016 and December 29, 2015:
| Fiscal Year Ended | |||||||||||
(Amounts in thousands) | December 26, 2017 | December 27, 2016 | December 29, 2015 | |||||||||
Net cash provided by operating activities | $ | 38,065 | $ | 49,815 | $ | 45,868 | ||||||
Net cash used in investing activities | (23,929 | ) | (34,168 | ) | (46,530 | ) | ||||||
Net cash (used in) provided by financing activities | (24,164 | ) | (6,201 | ) | 2,318 | |||||||
Net change in cash and cash equivalents | $ | (10,028 | ) | $ | 9,446 | $ | 1,656 | |||||
Operating Activities. Net cash flows provided by operating activities decreased $11.8 million during fiscal 2017 as compared to fiscal 2016, primarily due to a $7.3 million net decrease in cash related to other liabilities, a $2.2 million net decrease in cash related to prepaid and other asset and a $2.5 million net decrease in cash related to inventory, a $2.2 million net decrease in cash related to deferred revenue and $1.7 million net decrease in cash related to income taxes, partially offset by a $5.4 million net increase in cash related to lease incentives receivable, a $1.2 million net increase in cash related to insurance settlement and other net changes in certain operating assets and liabilities. Net cash flows provided by operating activities increased $3.9 million during fiscal 2016 as compared to fiscal 2015 primarily due to a $6.2 million net increase in cash related to income taxes and a $3.4 million net increase in cash related to deferred rent obligations, partially offset by a $5.5 million net decrease in cash related to accounts payable and other net changes in certain operating assets and liabilities (as noted in the consolidated statement of cash flows). Cash flows from operating activities was 45.9 million in fiscal 2015, consisting primarily of net income of $16 million, adjustments for depreciation, amortization, deferred income taxes and other non-cash charges totaling $25.8 million, a net increase in cash of $5.8 million resulting from a decrease in lease incentives receivable and $6.7 million from an increase in other liabilities and restricted cash. These cash inflows were partially offset by increases in inventories, other current assets, deferred rent obligations and income taxes receivable of $8.4 million.
Investing Activities. Net cash used in investing activities in fiscal 2017 was $23.9 million, consisting primarily of purchases of leasehold improvements, property and equipment in amount of $39.4 million, These purchases were primarily related to construction of one Grilles and one Del Frisco’s during fiscal 2017, as well as remodel activity at existing restaurants, partially offset by proceeds in the amount of 14.7 million from the sale leaseback transaction of our restaurant located in Orlando, Florida. Net cash used in investing activities in fiscal 2016 was $34.2 million, consisting primarily of purchases of leasehold improvements, property and equipment, as well as a trade name acquisition (see note 3 to the consolidated financial statements for information related to the trade name acquisition). These purchases were primarily related to construction of three Grilles and one Double Eagle during fiscal 2016, as well as remodel activity at existing restaurants. Net cash used in investing activities in fiscal 2015 was $46.5 million, consisting primarily of purchases of leasehold improvements, property and equipment. These purchases were primarily related to construction of six Grilles and one Double Eagle during fiscal 2015, as well as remodel activity at existing restaurants.
Financing Activities. Net cash used in financing activities in fiscal 2017 was $24.2 million, which was comprised of $50.0 million in payments toward share repurchases, $37.3 million in payments under credit facility, partially offset by $58.8 million in proceeds from borrowings under our credit facility, and $3.5 million in proceeds from a loan against deferred compensation investments. Net cash used by financing activities in fiscal 2016 was $6.2 million, which was comprised of $16.5 million in payments toward the outstanding balance under our credit facility and $4.8 million in share repurchases, offset by $12.0 million in proceeds from borrowings under our credit facility and $3.2 million in proceeds from the exercise of stock options. Net cash provided by financing activities in fiscal 2015 was $2.3 million, which was comprised of $37.0 million in proceeds from borrowings on the credit facility and $0.8 million in proceeds from the exercise of stock options, partially offset by $32.5 million in payments under credit facility and $3.0 million in share repurchases.
Capital Expenditures
We typically target an average cash investment of approximately $7.0 million to $9.0 million per restaurant for a new Double Eagle and $3.5 million to $4.5 million for a Grille or Sullivan’s, in each case net of landlord contributions and equipment financing and including pre-opening costs. In addition, we are currently “refreshing” a number of our Sullivan’s and Double Eagle locations to, among other things, add additional seating, private dining space, a new champagne lounge and patio seating. During fiscal 2017, we completed remodels of two Double Eagles and three Sullivan’s. Looking forward, we expect to complete two to four refreshes each year at an approximate cost of $0.5 million to $2 million per location. These capital expenditures will primarily be funded by cash flows from operations and, if necessary, by the use of our credit facility, depending upon the timing of expenditures.
38
Credit Facility
On October 15, 2012, we entered into a credit facility that provides for a three-year unsecured revolving credit facility of up to $25 million. Borrowings under the credit facility bear interest at LIBOR plus 1.50%. We are required to pay a commitment fee equal to 0.25% per annum on the available but unused revolving loan facility. The credit facility is guaranteed by certain of our subsidiaries.
On June 30, 2015, we entered into a Second Amendment to the credit facility. The amendment, among other things, extended the termination date of the credit facility to October 15, 2017 and modified the revolving credit commitment to $15 million, with such amount subject to increases in increments of $5 million at our request, up to a maximum amount of $30 million.
On December 21, 2016, we entered into a Third Amendment to the credit facility. The amendment, among other things, extended the termination date of the credit facility to October 15, 2019 and modified the revolving credit commitment to $10 million, with such amount subject to increases in increments of $5 million at our request, up to a maximum amount of $30 million.
On April 21, 2017, we entered into a Fourth Amendment to our credit facility with JP Morgan Chase Bank that lowered the minimum fixed charge coverage ratio, as defined in the agreement, from 2.00 to 1.25, effective January 1, 2017.
On May 24, 2017, we entered into a Fifth Amendment to our credit facility with JP Morgan Chase Bank. The Amendment, among other things, increased the capacity by which the Revolving Credit Commitment can be increased by $20 million. Such commitment increases can be made in increments of $5 million at the Company’s request, up to a maximum amount of $50 million. Additionally, the Amendment modified the definition of Adjusted EBITDA to provide for the exclusion of certain one-time expenses.
On July 12, 2017, we executed an agreement to borrow against the investments in our deferred compensation plan to pay out funds due to plan participants instead of using operating cash flows. The loan does not have an expiration date or defined payment terms, and accrues interest at a rate of 1%, which is net of the 3% that is earned by the investments being loaned against. As of December 26, 2017, there was approximately $3.0 million of outstanding borrowings on this loan.
On October 20, 2017, we entered into a Sixth Amendment to our credit facility with JP Morgan Chase Bank. The Amendment, among other things, consented to the Company's sale leaseback of its Orlando, Florida Del Frisco's Double Eagle Steakhouse location. Additionally, the Amendment modified the definition of the Operating Leverage Ratio under the Loan Agreement.
The credit facility contains various financial covenants, including a maximum leverage ratio of total indebtedness to EBITDA (as defined in the credit facility), and minimum fixed charge coverage ratio. Specifically, we are required to have a leverage ratio of less than 1.25 and a fixed charge coverage ratio of greater than 1.25. As of December 26, 2017, we were in compliance with each of these financial covenants. The credit facility also contains covenants restricting certain corporate actions, including asset dispositions, acquisitions, the payment of dividends, the incurrence of indebtedness and providing financing or other transactions with affiliates.
As of December 26, 2017, there was $21.5 million outstanding balance on our revolving credit facility. Under the revolving loan commitment, we had approximately $27 million of borrowings available, net of $1.5 million in letter of credit commitments.
Common Stock Repurchases
On October 14, 2014, our Board of Directors approved a stock repurchase program authorizing us to repurchase up to $25 million of our common stock over the next three years. On February 15, 2017, our Board of Directors increased the authorized capacity under our existing stock repurchase program to $50 million of our common stock from that date forward and is not part of the defined term. The Company fully utilized the availability under the repurchase program in November 2017. Over the life of the program, we repurchased 3,630,390 shares of our common stock at an aggregate cost of approximately $57.8 million and an average price per share of $15.93.
39
Contractual Obligations
The following table summarizes our contractual obligations as of December 26, 2017:
(Amounts in thousands) | Total | Less than 1 year | 1 - 3 years | 3 - 5 years | More than 5 years | |||||||||||||||
Operating leases | $ | 405,752 | $ | 24,203 | $ | 50,285 | $ | 50,154 | $ | 281,110 | ||||||||||
Revolving credit facility | $ | 21,500 | $ | — | $ | 21,500 | $ | — | $ | — | ||||||||||
Interest on revolving credit facility(1) | $ | 1,269 | $ | 667 | $ | 602 | $ | — | $ | — | ||||||||||
Loan against the investments in deferred compensation plan | $ | 2,977 | $ | — | $ | 2,977 | $ | — | $ | — | ||||||||||
Interest on loan against the investments in deferred compensation plan(2) | $ | 555 | $ | 307 | $ | 248 | $ | — | $ | — | ||||||||||
Total | $ | 432,053 | $ | 25,177 | $ | 75,612 | $ | 50,154 | $ | 281,110 | ||||||||||
(1) | Interest consists of remaining interest payments on the revolver. The interest rate on the revolver is variable. See note 6 to our consolidated financial statements. |
(2) | Interest consists of remaining interest payments on loan against the investments in deferred compensation plan. See note 6 to our consolidated financial statements for the interest rate on the loan against the investments in deferred compensation plan. |
Off-Balance Sheet Liabilities
As of December 26, 2017 we had no material off-balance sheet arrangements as defined in Item 303(a)(4)(ii) of Regulation S-K.
Inflation
Over the past five years, inflation has not significantly affected our operations. However, the impact of inflation on labor, food and occupancy costs could, in the future, significantly affect our operations. We pay many of our employees hourly rates related to the applicable federal or state minimum wage. We have been impacted by recent increases in minimum wage laws, such as the 15% increase in the minimum wage on January 1, 2017 in Seattle, Washington to $15.00 per hour or the 17% increase in minimum wage in California to $10.50. Food costs as a percentage of revenues have been somewhat stable due to procurement efficiencies and menu price adjustments, although no assurance can be made that our procurement will continue to be efficient or that we will be able to raise menu prices in the future. Costs for construction, taxes, repairs, maintenance and insurance all impact our occupancy costs. We believe that our current strategy, which is to seek to maintain operating margins through a combination of menu price increases, cost controls, careful evaluation of property and equipment needs, and efficient purchasing practices, has been an effective tool for dealing with inflation. There can be no assurance, however, that future inflationary or other cost pressure will be effectively offset by this strategy.
Critical Accounting Policies and Estimates
Our discussion and analysis of results of operations and financial condition are based upon our audited consolidated financial statements, which have been prepared in accordance with accounting principles generally accepted in the United States. The preparation of these consolidated financial statements is based on our critical accounting policies that require us to make estimates and judgments that affect the amounts reported in those consolidated financial statements. Our significant accounting policies, which may be affected by our estimates and assumptions, are more fully described in the notes to the consolidated financial statements included elsewhere in this Annual Report on Form 10-K. Critical accounting policies are those that we believe are most important to portraying our financial condition and results of operations and also require the greatest amount of subjective or complex judgments by management. Judgments or uncertainties regarding the application of these policies may result in materially different amounts being reported under different conditions or using different assumptions. We consider the following policies to be the most critical in understanding the judgments that are involved in preparing the consolidated financial statements.
Goodwill and Other Intangible Assets. We account for our goodwill and intangible assets with indefinite lives in accordance with Accounting Standards Codification, or ASC, Topic 350, Intangibles—Goodwill and Other. In accordance with ASC Topic 350, goodwill and intangible assets, primarily trade names, which have indefinite useful lives, are not being amortized. However, both goodwill and trade names are subject to annual impairment testing in accordance with ASC Topic 350. Currently, we define our reporting units as the Del Frisco’s Double Eagle and Sullivan’s concepts.
40
The impairment evaluation for goodwill is conducted annually. The fair value of each reporting unit is compared with the carrying value of the reporting unit, including goodwill. The estimated fair value of the reporting unit is generally determined on the basis of discounted future cash flows and a market-based approach. If the estimated fair value of the reporting unit is less than the carrying amount of the reporting unit, an impairment charge is recorded for the difference.
The evaluation of the carrying amount of other intangible assets with indefinite lives is made annually by comparing the carrying amount of these assets to their estimated fair value. The estimated fair value is determined on the basis of existing market-based conditions as well as discounted future cash flows or the royalty-relief method for trade names. If the estimated fair value is less than the carrying amount, an impairment charge is recorded to reduce the asset to its estimated fair value.
The valuation approaches used to determine fair value of each reporting unit and other intangible assets are subject to key judgments and assumptions about revenue growth rates, operating margins, weighted average cost of capital and comparable company and acquisition market multiples. When developing these key judgments and assumptions, which are sensitive to change, management considers economic, operational and market conditions that could impact the fair value. The judgments and assumptions used are consistent with what management believes hypothetical market participants would use. However, estimates are inherently uncertain and represent only reasonable expectations regarding future developments.
The fair values of our Sullivan’s goodwill and trade name were less than the carrying values as of our fiscal 2017 impairment tests that were performed at year-end. Accordingly, we recorded $13.4 million, of which $0.3 million is related to trade name, for Sullivan’s reporting unit and additional impairment is possible in the future. Valuation result for our Double Eagle reporting unit showed that the fair value was significantly in excess of carrying value.
Property and Equipment. We assess recoverability of property and equipment in accordance with ASC Topic 360, Property, Plant and Equipment. Our assessment of recoverability of property and equipment is performed on a restaurant-by-restaurant basis. Certain events or changes in circumstances may indicate that the recoverability of the carrying amount of property and equipment should be assessed. These events or changes may include a significant decrease in market value, a significant change in the business climate in a particular market, or a current-period operating or cash flow loss combined with historical losses or projected future losses. If an event occurs or changes in circumstances are present, we estimate the future cash flows expected to result from the use of the asset and its eventual disposition. If the sum of the expected future cash flows (undiscounted and without interest charges) is less than the carrying amount, we recognize an impairment loss. The impairment loss recognized is the amount by which the carrying amount exceeds the fair value. Additionally, we periodically review assets for changes in circumstances which may impact their useful lives.
Our assessments of undiscounted cash flows represent our best estimate as of the time of the impairment review and are consistent with our internal planning. If different cash flows had been estimated in the current period, the property and equipment balances could have been materially impacted. Furthermore, our accounting estimates may change from period to period as conditions change, and this could materially impact our results in future periods. Factors that we must estimate when performing impairment tests include sales volume, prices, inflation, marketing expense, and capital expenses.
In fiscal 2017, we recognized impairment charges of long-lived assets of $23.6 million. This impairment charge was related to our determination that the carrying amount of long-lived assets at one Double Eagle, four Grille and one Sullivan’s locations exceeded their estimated undiscounted future cash flows. The estimated fair values was based on an estimated sales price of leasehold improvements, furniture and restaurant equipment for these locations.
In fiscal 2016, we recognized impairment charges of long-lived assets of $0.6 million. This impairment charge was related to our determination that the carrying amount of long-lived assets at two Sullivan’s locations exceeded their estimated undiscounted future cash flows, due in part by our determination to close these locations. The estimated fair values was based on an estimated sales price of leasehold improvements, furniture and restaurant equipment for this location.
In fiscal 2015, we recognized impairment charges of long-lived assets of $3.2 million. This impairment charge was related to our determination that the carrying amount of long-lived assets at one Grille location exceeded its estimated undiscounted future cash flows. The estimated fair value was based on an estimated value of the furniture and equipment that we may transfer to future Grille locations.
Leases. We currently lease all of our restaurant locations. We evaluate each lease to determine its appropriate classification as an operating or capital lease for financial reporting purposes. All of our leases are classified as operating leases. We record the minimum lease payments for our operating leases on a straight-line basis over the lease term, including option periods which in the judgment of management are reasonably assured of renewal. The lease term commences on the date that the lessee obtains control of the property, which is normally when the property is ready for tenant improvements. Contingent rent expense is recognized as incurred and is usually based on either a percentage of restaurant sales or as a percentage of restaurant sales in
41
excess of a defined amount. Our lease costs will change based on the lease terms of our lease renewals as well as leases that we enter into with respect to our new restaurants.
Leasehold improvements financed by the landlord through tenant improvement allowances are capitalized as leasehold improvements with the tenant improvement allowances recorded as deferred lease incentives. Deferred lease incentives are amortized on a straight-line basis over the lease term, including option periods which in the judgment of management are reasonably assured of renewal (same term that is used for related leasehold improvements) and are recorded as a reduction of occupancy expense. As part of the initial lease terms, we negotiate with our landlords to secure these tenant improvement allowances. There is no guarantee that we will receive tenant improvement allowances for any of our future locations, which would result in additional occupancy expenses.
In February 2016, the FASB issued ASU No. 2016-02, Leases (Topic 842) which provides for a comprehensive set of changes in accounting for leases. The lease accounting model is a “right of use” model that assumes that each lease creates an asset (the lessee’s right to use the leased asset) and a liability (the future rent payment obligations) which should be reflected on a lessee’s balance sheet to fairly represent the lease transaction and the lessee’s related financial obligations. All of our leases are accounted for as operating leases, with no related assets and liabilities on our balance sheet. However, with the adoption of the amendments in ASU 2016-02, operating leases related to our restaurant leases will require recognition in our consolidated balance sheet under ASU 2016-02, and we expect the adoption will have a material effect on our consolidated statement of financial position. We anticipate implementing the standard by taking advantage of the practical expedient option. The discounted minimum remaining rental payments will be the starting point for determining the right-of-use asset and lease liability. We had operating leases with remaining rental payments of approximately $405.8 million at the end of fiscal 2017. We expect that adoption of the new guidance will have a material impact on our consolidated balance sheets due to recognition of the right-of-use asset and lease liability related to our current operating leases.
Income Taxes. We have accounted for, and currently account for, income taxes in accordance with ASC Topic 740, Accounting for Income Taxes. This statement requires an asset and liability approach for financial accounting and reporting of income taxes. Under ASC Topic 740, income taxes are accounted for based upon the future tax consequences attributable to differences between the financial statement carrying amounts of existing assets and liabilities and their respective tax basis and operating loss and tax credit carry-forwards. Income taxes are one of our critical accounting policies and estimates and therefore involve a certain degree of judgment. We use an estimate of our annual effective tax rate at each interim period based on the facts and circumstances available at that time while the actual effective tax rate is calculated at year-end. See note 2 and note 5 to the consolidated financial statements.
The realization of tax benefits of deductible temporary differences will depend on whether we will have sufficient taxable income of an appropriate character to allow for utilization of the deductible amounts.
We record a liability for unrecognized tax benefits resulting from tax positions taken, or expected to be taken, in an income tax return. We recognize any interest and penalties related to unrecognized tax benefits in income tax expense. Significant judgment is required in assessing, among other things, the timing and amounts of deductible and taxable items. Tax reserves are evaluated and adjusted as appropriate, while taking into account the progress of audits of various taxing jurisdictions.
We have reported provisional amounts for the income tax effects of the TCJA for which the accounting is incomplete but a reasonable estimate could be determined. In response to the TCJA, on December 22, 2017 the SEC staff issued Staff Accounting Bulletin No. 118 ("SAB 118"), to provide guidance for companies that are not able to complete their accounting for the income tax effects of the Act in the period of enactment. The SEC Staff noted in SAB 118 that in these cases a company should continue to apply Topic 740, Income Taxes based on the provisions of the tax laws that were in effect immediately prior to the Act being enacted. SAB 118 provides a measurement period that should not extend beyond one year from the TCJA enactment date for companies to complete the accounting under Topic 740. There were no specific impacts of the TCJA that could not be reasonably estimated, however the final impact of the TCJA may differ from these estimates, due to, among other things, changes in our interpretations and assumptions of the TCJS, and additional guidance that may be issued by the Internal Revenue Service. See note 5 to our consolidated financial statements.
Self-Insurance Reserves. We maintain various insurance policies including workers’ compensation and general liability. Pursuant to those policies, we are responsible for losses up to certain limits and are required to estimate a liability that represents our ultimate exposure for aggregate losses below those limits. This liability is based on management’s estimates of the ultimate costs to be incurred to settle known claims and claims not reported as of the balance sheet date. Our estimated liability is not discounted and is based on a number of assumptions and factors, including historical trends, actuarial assumptions, and economic conditions. If actual trends, including the severity or frequency of claims, differ from our estimates, our financial results could be impacted.
42
Recent Events
On February 27, 2018, our Board of Directors provided authority for up to $50 million to be utilized for the repurchase of our common stock. Under this program, we can from time to time purchase outstanding common stock in the open market at management’s discretion, subject to share price, market conditions and other factors. Repurchases are intended to protect existing shareholders and will be made exclusively through the use of excess cash flow. They will have no impact on our ongoing development and growth plans.
Recent Accounting Pronouncements
In May 2014, the FASB issued ASU No. 2014-09, Revenue from Contracts with Customers which will supersede ASC Topic 605, Revenue Recognition. In August 2015, the FASB deferred the effective date of this new standard by one year. The FASB later issued ASU No. 2016-08, Revenue from Contracts with Customers (Topic 606) – Principal versus Agent Considerations, in March 2016, ASU No. 2016-10, Revenue from Contracts with Customers (Topic 606) – Identifying Performance Obligations and Licensing, in April 2016, ASU 2016-12, Revenue from Contracts with Customers (Topic 606) – Narrow-Scope Improvements and Practical Expedients, in May 2016, and ASU 2016-20, Technical Corrections and Improvements to Topic 606, Revenue from Contracts with Customers, in December 2016, all of which further clarified aspects of Topic 606. A core principle of the new guidance is that an entity should measure revenue in connection with its sale of goods and services to a customer based on an amount that depicts the consideration to which the entity expects to be entitled in exchange for each of those goods and services. For a contract that involves more than one performance obligation, the entity must (a) determine or, if necessary, estimate the standalone selling price at inception of the contract for the distinct goods or services underlying each performance obligation and (b) allocate the transaction price to each performance obligation on the basis of the relative standalone selling prices. In addition, under the new guidance, an entity should recognize revenue when (or as) it satisfies each performance obligation under the contract by transferring the promised good or service to the customer. A good or service is deemed transferred when (or as) the customer obtains control of that good or service. For public companies, this amendment is effective for fiscal years, and interim periods within those fiscal years, beginning after December 15, 2017. It permits the use of either a retrospective or cumulative effect transition method and early adoption is permitted only as of annual reporting periods beginning after December 15, 2016, including interim reporting periods within that reporting period. The Company has adopted these ASUs as of December 27, 2017 by applying the cumulative effect transition method. Based on our evaluation of our revenue streams, the Company has determined that there will not be a material impact as of the date of adoption between the new revenue standard and how we previously recognized revenue, and therefore the adoption will not have a material effect on our consolidated results of operations, balance sheets, cash flows, or disclosures. The primary item affected by these ASUs is the deferred revenue from our loyalty program, although we do not anticipate changes to this revenue stream to be material, as stated above, we do expect to recognize income from this revenue stream earlier than it is currently recognized, by bifurcating the performance obligations associated with our loyalty program. As a result from adopting these ASUs, the cumulative effect to our retained earning will be approximately $0.4 million. For other revenue streams, we do not expect material changes in the timing of revenue recognition as our current accounting policies are materially consistent with these ASUs.
In February 2016, the FASB issued ASU No. 2016-02, Leases (Topic 842) (ASU 2016-02). ASU 2016-02 is intended to improve the reporting of leasing transactions to provide users of financial statements with more decision-useful information. The main amendments in ASU 2016-02 require recognition on the balance sheet of lease assets and lease liabilities by lessees for those leases classified as operating leases. ASU 2016-02 is effective for annual periods beginning after December 15, 2018, including interim periods within those fiscal years, with early application permitted. This update will be applied on a modified retrospective basis. We anticipate implementing the standard by taking advantage of the practical expedient option. The discounted minimum remaining rental payments will be the starting point for determining the right-of-use asset and lease liability. We had operating leases with remaining rental payments of approximately $405.8 million at the end of fiscal 2017. We expect that adoption of the new guidance will have a material impact on our consolidated balance sheets due to recognition of the right-of-use asset and lease liability related to our current operating leases. The process of evaluating the full impact of the new guidance on our consolidated financial statements and disclosures is ongoing, but we anticipate the initial evaluation of the impact will be completed in fiscal 2018.
In March 2016, the FASB issued ASU No. 2016-09, Compensation – Stock Compensation (Topic 718) – Improvements to Employee Share-Based Payment Accounting. The FASB issued this ASU as part of its Simplification Initiative. The amendments in this ASU affect all entities that issue share-based payment awards to their employees. The areas for simplification in this ASU involve several aspects of the accounting for share-based payment transactions, including the income tax consequences, classification of awards as either equity or liability and classification on the statement of cash flows. Specifically, all excess tax benefits and tax deficiencies should be recognized as income tax expense or benefit in the income statement. The tax effects of exercised or vested awards should be treated as discrete items in the reporting period in which they occur. An entity also should recognize excess tax benefits regardless of whether the benefit reduces taxes payable in the current
43
period. Excess tax benefits should be classified along with other income tax cash flows as an operating activity. An entity can make an entity-wide accounting policy election to either estimate the number of awards that are expected to vest or account for forfeitures when they occur. The threshold to qualify for equity classifications permits withholding up to the maximum statutory tax rates in the applicable jurisdiction. Cash paid by an employer when directly withholding shares for tax-withholding purposes should be classified as a financing activity. For public business entities, the amendments in this ASU are effective for annual periods beginning after December 15, 2016, and interim periods within those annual periods. Early adoption is permitted for any entity in any interim or annual period. Amendments related to the timing of when excess tax benefits are recognized, minimum statutory withholding requirements, forfeitures and intrinsic value should be applied using a modified retrospective transition method by means of a cumulative-effect adjustment to equity as of the beginning of the period in which the guidance is adopted. Amendments related to the presentation of employee taxes paid on the statement of cash flows when an employer withholds shares to meet the minimum statutory withholding requirement should be applied retrospectively. Amendments requiring recognition of excess tax benefits and tax deficiencies in the income statement and the practical expedient for estimating expected term should be applied prospectively. An entity may elect to apply the amendments related to the presentation of excess tax benefits on the statement of cash flows using either a prospective transition method or a retrospective transition method. Under ASU 2016-09, to the extent that the related compensation ultimately recognized for tax purposes exceeds the book expense, a permanent benefit will be recorded to income tax expense and through the effective tax rate for the excess benefit. Where the tax expense recognized is less than book, the shortfall is charged to income tax expense. Under the new guidance, entities can estimate forfeitures or recognize forfeitures when they occur. We have historically estimated forfeitures at the grant date and trued them up when vesting events occur. In addition, the simplification of ASU 2016-09 allows us to withhold an amount up to the employees’ maximum individual tax rate in the relevant jurisdiction. We adopted ASU 2016-09 on December 28, 2016, and the adoption thereof did not have a material impact on our consolidated financial statements in fiscal 2017.
In August 2016, the FASB issued ASU No. 2016-15, Statement of Cash Flows (Topic 230) – Classification of Certain Cash Receipts and Cash Payments. This ASU is intended to clarify the presentation of cash receipts and payments in specific situations. The amendments in this update are effective for financial statements issued for annual periods beginning after December 15, 2017, including interim periods within those annual periods, and early application is permitted. An entity should apply ASU 2016-15 using a retrospective transition method to each period presented. We do not anticipate that the adoption of this pronouncement will have a material impact on our consolidated financial statements.
In November 2016, the FASB issued ASU 2016-18, Statement of Cash Flows (Topic 230) - Restricted Cash, which outlines that a statement of cash flows explains the change during the period in total cash, cash equivalents, and amounts generally described as restricted cash or restricted cash equivalents. ASU 2016-18 is effective for public business entities for annual periods, including interim periods within those annual periods, beginning after December 15, 2017, and early application is permitted. An entity should apply ASU 2016-18 using a retrospective transition method to each period presented. We are currently assessing the impact of the adoption of this ASU on our consolidated financial statements. We do not anticipate that the adoption of this pronouncement will have a material impact on our consolidated financial statements.
In January 2017, the FASB issued ASU 2017-04, Simplifying the Test for Goodwill Impairment, which removes the second step of the goodwill impairment test and requires an entity to perform its annual or interim goodwill impairment test by comparing the fair value of a reporting unit with its carrying amount, and recognize an impairment charge for the amount by which the carrying value exceeds the fair value, not to exceed the total amount of goodwill allocated to that reporting unit. ASU 2017-04 is effective for public business entities for annual periods, including interim periods within those annual periods, beginning after December 15, 2019, and early application is permitted for interim or annual goodwill impairment tests performed on testing dates after January 1, 2017. An entity should apply ASU 2017-04 using a prospective transition method. We elected to early adopt this ASU beginning in fiscal 2017. The adoption of this pronouncement did not have a material impact on our consolidated financial statements.
In May 2017, the FASB issued ASU 2017-09, Compensation - Stock Compensation (Topic 718): Scope of Modification Accounting, which provides clarity and reduces complexity when an entity has changes to the terms or conditions of a share-based payment award, and when an entity should apply modification accounting. The amendments in this update are effective for financial statements issued for annual periods beginning after December 15, 2017, including interim periods within those annual periods, and early adoption is permitted for interim or annual periods. The amendments in ASU 2017-09 should be applied prospectively to an award modified on or after the adoption date. We do not anticipate that the adoption of this pronouncement will have a material impact on our consolidated financial statements.
44
Item 7A. Quantitative and Qualitative Disclosures About Market Risk
Interest Rate Risk
The inherent risk in market risk sensitive instruments and positions primarily relates to potential losses arising from adverse changes in interest rates.
We are exposed to market risk from fluctuations in interest rates. For fixed rate debt, interest rate changes affect the fair market value of the debt but do not impact earnings or cash flows. Conversely for variable rate debt, including borrowings under our credit facility, interest rate changes generally do not affect the fair market value of the debt, but do impact future earnings and cash flows, assuming other factors are held constant. At December 26, 2017, we had $21.5 million outstanding on our revolving credit facility. Assuming a full drawdown on the revolving credit facility, and holding other variables constant, such as foreign exchange rates and debt levels, a hypothetical immediate one percentage point change in interest rates would be expected to have an impact on pre-tax earnings and cash flows of approximately $0.5 million over the course of 12 months.
Commodity Price Risk
We are exposed to market price fluctuations in beef, seafood, produce and other food product prices. Given the historical volatility of beef, seafood, produce and other food product prices, these fluctuations can materially impact our food and beverage costs. While we have taken steps to qualify multiple suppliers who meet our standards as suppliers for our restaurants and enter into agreements with suppliers for some of the commodities used in our restaurant operations, there can be no assurance that future supplies and costs for such commodities will not fluctuate due to weather and other market conditions outside of our control. We currently do not contract for some of our commodities, such as fresh seafood and certain produce, for periods longer than one week. Consequently, such commodities can be subject to unforeseen supply and cost fluctuations. Dairy costs can also fluctuate due to government regulation. Because we typically set our menu prices in advance of our food product prices, our menu prices cannot immediately take into account changing costs of food items. To the extent that we are unable to pass the increased costs on to our customers through price increases, our results of operations would be adversely affected. We do not use financial instruments to hedge our risk to market price fluctuations in beef, seafood, produce and other food product prices at this time.
Item 8. Financial Statements and Supplementary Data
Our consolidated financial statements and notes thereto and the reports of KPMG LLP, our independent registered public accounting firm, are included elsewhere in this Annual Report on Form 10-K, and are incorporated herein by reference.
Item 9. Changes in and Disagreements with Accountants on Accounting and Financial Disclosure
None.
Item 9A. Controls and Procedures
Disclosure Controls and Procedures
We carried out an evaluation, under the supervision and with the participation of our Chief Executive Officer and Chief Financial Officer, of the effectiveness of the design and operation of our disclosure controls and procedures (as defined in Rules 13a-15(e) and 15d-15(e) of the Exchange Act) as of the end of the period covered by this report. Based on this evaluation, our Chief Executive Officer and Chief Financial Officer concluded that due to the material weakness in our internal control over financial reporting described below under Management's Report on Internal Control over Financial Reporting, our disclosure controls and procedures were not effective as of the end of the period covered by this report.
The design of any system of disclosure controls and procedures is based upon certain assumptions about the likelihood of future events, and there can be no assurance that any design will succeed in achieving its stated objectives under all future events, no matter how remote, or that the degree of compliance with the policies or procedures may not deteriorate. Because of its inherent limitations, disclosure controls and procedures may not prevent or detect all misstatements. Accordingly, even effective disclosure controls and procedures can only provide reasonable assurance of achieving their control objectives.
Notwithstanding a material weakness in internal control over financial reporting, our management concluded that our consolidated financial statements in this annual report on Form 10-K present fairly, in all material respects, the Company’s consolidated financial position, results of operations and cash flows as of the dates, and for the periods presented, in conformity with generally accepted accounting principles.
45
Management’s Report on Internal Control over Financial Reporting
Management is responsible for establishing and maintaining adequate internal control over financial reporting, as defined in Rule 13a-15(f) under the Exchange Act. Our internal control over financial reporting is a process designed to provide reasonable assurance regarding the reliability of financial reporting and the preparation of consolidated financial statements for external purposes in accordance with accounting principles generally accepted in the United States of America includes those policies and procedures that (1) pertain to the maintenance of records that, in reasonable detail, accurately and fairly reflect the transactions and dispositions of assets of the company, (2) provide reasonable assurance that transactions are recorded as necessary to permit preparation of consolidated financial statements for external purposes in accordance with U.S. generally accepted accounting principles and that receipts and expenditures of the company are being made only in accordance with authorizations of management and directors of the company, and (3) provide reasonable assurance regarding prevention or timely detection of unauthorized acquisition, use or disposition of assets that could have a material effect on the consolidated financial statements. Because of its inherent limitations, internal control over financial reporting may not prevent or detect all misstatements. In addition, projections of any evaluation of effectiveness to future periods are subject to the risks that controls may become inadequate because of changes in conditions, or that the degree of compliance with the policies or procedures may deteriorate.
A material weakness is a deficiency, or a combination of deficiencies, in internal control over financial reporting such that there is a reasonable possibility that a material misstatement of the annual or interim financial statements will not be prevented or detected on a timely basis.
Management, with the participation of our Chief Executive Officer and Chief Financial Officer, has assessed the effectiveness of our internal control over financial reporting as of December 26, 2017 based on the framework established in “Internal Control-Integrated Framework (2013),” issued by the Committee of Sponsoring Organizations of the Treadway Commission. Based on our evaluation of our internal control over financial reporting, management has identified a control deficiency in our internal control over financial reporting related to the operating effectiveness of our control over the accounting for a non-routine transaction. Specifically, our risk assessment process failed to identify the need to supplement our internal accounting resources to properly evaluate and document the accounting for a sale leaseback transaction related to property and equipment.
This control deficiency did not result in a material misstatement within the balance sheet in the consolidated financial statements. This control deficiency creates a reasonable possibility that a material misstatement to the consolidated financial statements will not be prevented or detected on a timely basis, and therefore, we concluded that the control deficiency represents a material weakness in the Company’s internal control over financial reporting and our internal control over financial reporting was not effective as of December 26, 2017.
Our independent registered public accounting firm, KPMG LLP, has expressed an adverse report on the operating effectiveness of our internal control over financial reporting. KPMG LLP’s report appears on page F-3 of this Form 10-K.
Remediation
This sale leaseback transaction was a non-routine transaction and, because we no longer own any real property as a result of this sale leaseback transaction, nor do we plan on acquiring ownership of additional properties, we do not expect to engage in additional sale leaseback transactions in the future. To remediate the material weakness, we plan to formalize our processes and internal control documentation and strengthen the supervisory reviews by management of any future non-routine transactions, and other complex accounting transactions that we may encounter in the future, including engaging a nationally recognized accounting or advisory firm to supplement our internal resources related to the review of the accounting for such transactions.
We believe these actions will be sufficient to remediate the identified material weakness and strengthen our internal control over financial reporting, but there can be no assurance that we will not conclude that additional measures are required to remediate the material weakness as we test and evaluate the effectiveness of our remediation, which may necessitate additional implementation and evaluation time.
Changes in Internal Control Over Financial Reporting
Other than the identification, assessment and development of a remediation plan of the material weakness described above, there have been no changes in our internal control over financial reporting identified in connection with the evaluation required by Rules 13a-15(d) and 15d-15(d) of the Exchange Act that occurred during our fourth fiscal quarter ended December 26, 2017 that have materially affected, or are reasonably likely to materially affect, our internal control over financial reporting.
46
Item 9B. Other Information
None.
47
PART III
Item 10. Directors, Executive Officers and Corporate Governance
The information required by this Item regarding our executive officers is provided in "Item 1. Business - Executive Officers and Key Employees" of this Annual Report. All other information required by this item is incorporated herein by reference to our definitive proxy statement to be filed with the SEC no later than 120 days after the close of our fiscal year ended December 26, 2017.
Item 11. Executive Compensation
The information required under this Item is incorporated herein by reference to our definitive proxy statement to be filed with the SEC no later than 120 days after the close of our fiscal year ended December 26, 2017.
Item 12. Security Ownership of Certain Beneficial Owners and Management and Related Stockholder Matters
All information, except the equity compensation plans table below, required under this Item is incorporated herein by reference to our definitive proxy statement to be filed with the SEC no later than 120 days after the close of our fiscal year ended December 26, 2017.
Equity Compensation Plans
The following table sets forth information as of December 26, 2017, with respect to our equity compensation plans under which our equity securities are authorized for issuance:
| Number of securities to be issued upon exercise of outstanding options and rights | Weighted average exercise price of outstanding options and rights | Number of securities remaining available for future issuance under equity compensation plans (excluding securities reflected in the first column) | |||||||
Plan Category | ||||||||||
Equity compensation plans approved by security holders | 1,086,995 | $ | 18.53 | 928,293 | ||||||
Equity compensation plans not approved by security holders | — | — | — | |||||||
Total | 1,086,995 | $ | 18.53 | 928,293 | ||||||
Item 13. Certain Relationships and Related Transactions, and Director Independence
The information required under this Item is incorporated herein by reference to our definitive proxy statement to be filed with the SEC no later than 120 days after the close of our fiscal year ended December 26, 2017.
Item 14. Principal Accountant Fees and Services
The information required under this item is incorporated herein by reference to our definitive proxy statement to be filed with the SEC no later than 120 days after the close of our fiscal year ended December 26, 2017.
48
PART IV
Item 15. Exhibits and Financial Statement Schedules
(a) | Financial Statements and Financial Statement Schedules |
See Index to Consolidated Financial Statements appearing on page F-1. All schedules have been omitted because they are not required or applicable or the information is included in the consolidated financial statements or notes thereto.
(b) | Exhibits |
See Exhibit Index appearing on the next page for a list of exhibits filed with or incorporated by reference as part of this Annual Report on Form 10-K.
49
Exhibit Index
Exhibit No. | Description | Reference | ||
| ||||
| ||||
| ||||
* | ||||
| ||||
| ||||
| ||||
| ||||
| ||||
| ||||
| ||||
| ||||
| ||||
50
| ||||
* | ||||
| ||||
* | ||||
| ||||
* | ||||
| ||||
51
* | ||||
| ||||
* | ||||
| ||||
101.INS | XBRL Document. | ** | ||
| ||||
101.SCH | XBRL Taxonomy Extension Schema Document. | ** | ||
| ||||
101.CAL | XBRL Taxonomy Extension Calculation Linkbase Document. | ** | ||
| ||||
101.DEF | XBRL Taxonomy Definition Linkbase Document. | ** | ||
| ||||
101.LAB | XBRL Taxonomy Extension Label Linkbase Document. | ** | ||
| ||||
101.PRE | XBRL Taxonomy Extension Presentation Linkbase Document. | ** | ||
* | Filed herewith. |
** | Furnished herewith. |
# | Denotes management compensatory plan or arrangement. |
52
Item 16. Form 10-K Summary
None.
53
SIGNATURES
Pursuant to the requirements of Section 13 or 15(d) of the Securities Exchange Act of 1934, the registrant has duly caused report to be signed on its behalf by the undersigned, thereunto duly authorized.
Del Frisco’s Restaurant Group, Inc. | |||
| |||
By: | /s/ Neil H. Thomson | ||
Name: | Neil H. Thomson | ||
Title: | Chief Financial Officer | ||
| |||
Date: March 27, 2018 | |||
Pursuant to the requirements of the Securities Exchange Act of 1934, this report has been signed below by the following persons on behalf of the Registrant and in the capacities and on the date indicated.
| ||||
| ||||
/s/ Norman J. Abdallah | Chief Executive Officer and Director | March 27, 2018 | ||
Norman J. Abdallah | (Principal Executive Officer) | |||
| ||||
/s/ Neil H. Thomson | Chief Financial Officer | March 27, 2018 | ||
Neil H. Thomson | (Principal Financial and Accounting Officer) | |||
| ||||
/s/ Ian R. Carter | Chairman of the Board, Director | March 27, 2018 | ||
Ian R. Carter | ||||
| ||||
/s/ Mark S. Mednansky | Director | March 27, 2018 | ||
Mark S. Mednansky | ||||
| ||||
/s/ David B. Barr | Director | March 27, 2018 | ||
David B. Barr | ||||
| ||||
/s/ Richard L. Davis | Director | March 27, 2018 | ||
Richard L. Davis | ||||
| ||||
/s/ William Lamar, Jr. | Director | March 27, 2018 | ||
William Lamar, Jr. | ||||
/s/ Pauline J. Brown | Director | March 27, 2018 | ||
Pauline J. Brown | ||||
54
INDEX TO CONSOLIDATED FINANCIAL STATEMENTS
F- 1
REPORT OF INDEPENDENT REGISTERED PUBLIC ACCOUNTING FIRM
To the Stockholders and Board of Directors
Del Frisco’s Restaurant Group, Inc.:
Opinion on the Consolidated Financial Statements
We have audited the accompanying consolidated balance sheets of Del Frisco’s Restaurant Group, Inc. and subsidiaries (the Company) as of December 26, 2017 and December 27, 2016, the related consolidated statements of operations and comprehensive (loss) income, changes in stockholders’ equity, and cash flows for each of the years in the three‑year period ended December 26, 2017, and the related notes (collectively, the consolidated financial statements). In our opinion, the consolidated financial statements present fairly, in all material respects, the financial position of the Company as of December 26, 2017 and December 27, 2016, and the results of its operations and its cash flows for each of the years in the three‑year period ended December 26, 2017, in conformity with U.S. generally accepted accounting principles.
We also have audited, in accordance with the standards of the Public Company Accounting Oversight Board (United States) (PCAOB), the Company’s internal control over financial reporting as of December 26, 2017, based on criteria established in Internal Control - Integrated Framework (2013) issued by the Committee of Sponsoring Organizations of the Treadway Commission, and our report dated March 27, 2018 expressed an adverse opinion on the effectiveness of the Company’s internal control over financial reporting.
Basis for Opinion
These consolidated financial statements are the responsibility of the Company’s management. Our responsibility is to express an opinion on these consolidated financial statements based on our audits. We are a public accounting firm registered with the PCAOB and are required to be independent with respect to the Company in accordance with the U.S. federal securities laws and the applicable rules and regulations of the Securities and Exchange Commission and the PCAOB.
We conducted our audits in accordance with the standards of the PCAOB. Those standards require that we plan and perform the audit to obtain reasonable assurance about whether the consolidated financial statements are free of material misstatement, whether due to error or fraud. Our audits included performing procedures to assess the risks of material misstatement of the consolidated financial statements, whether due to error or fraud, and performing procedures that respond to those risks. Such procedures included examining, on a test basis, evidence regarding the amounts and disclosures in the consolidated financial statements. Our audits also included evaluating the accounting principles used and significant estimates made by management, as well as evaluating the overall presentation of the consolidated financial statements. We believe that our audits provide a reasonable basis for our opinion.
/s/ KPMG LLP
We have served as the Company’s auditor since 2014.
Dallas, Texas
March 27, 2018
F- 2
REPORT OF INDEPENDENT REGISTERED PUBLIC ACCOUNTING FIRM
To the Stockholders and Board of Directors
Del Frisco’s Restaurant Group, Inc.:
Opinion on Internal Control Over Financial Reporting
We have audited Del Frisco’s Restaurant Group, Inc. and subsidiaries’ (the Company) internal control over financial reporting as of December 26, 2017, based on criteria established in Internal Control - Integrated Framework (2013) issued by the Committee of Sponsoring Organizations of the Treadway Commission. In our opinion, because of the effect of the material weakness, described below, on the achievement of the objectives of the control criteria, the Company has not maintained effective internal control over financial reporting as of December 26, 2017, based on criteria established in Internal Control - Integrated Framework (2013) issued by the Committee of Sponsoring Organizations of the Treadway Commission.
We also have audited, in accordance with the standards of the Public Company Accounting Oversight Board (United States) (PCAOB), the consolidated balance sheets of the Company as of December 26, 2017 and December 27, 2016, the related consolidated statements of operations and comprehensive (loss) income, changes in stockholders’ equity, and cash flows for each of the years in the three-year period ended December 26, 2017, and the related notes (collectively, the consolidated financial statements), and our report dated March 27, 2018 expressed an unqualified opinion on those consolidated financial statements.
A material weakness is a deficiency, or a combination of deficiencies, in internal control over financial reporting, such that there is a reasonable possibility that a material misstatement of the company’s annual or interim financial statements will not be prevented or detected on a timely basis. A material weakness related the operating effectiveness of a control over a non-routine transaction, specifically for a sale leaseback transaction related to property and equipment, has been identified and included in management’s assessment. The material weakness was considered in determining the nature, timing, and extent of audit tests applied in our audit of the 2017 consolidated financial statements, and this report does not affect our report on those consolidated financial statements.
Basis for Opinion
The Company’s management is responsible for maintaining effective internal control over financial reporting and for its assessment of the effectiveness of internal control over financial reporting, included in the accompanying Management’s Report on Internal Control over Financial Reporting. Our responsibility is to express an opinion on the Company’s internal control over financial reporting based on our audit. We are a public accounting firm registered with the PCAOB and are required to be independent with respect to the Company in accordance with the U.S. federal securities laws and the applicable rules and regulations of the Securities and Exchange Commission and the PCAOB.
We conducted our audit in accordance with the standards of the PCAOB. Those standards require that we plan and perform the audit to obtain reasonable assurance about whether effective internal control over financial reporting was maintained in all material respects. Our audit of internal control over financial reporting included obtaining an understanding of internal control over financial reporting, assessing the risk that a material weakness exists, and testing and evaluating the design and operating effectiveness of internal control based on the assessed risk. Our audit also included performing such other procedures as we considered necessary in the circumstances. We believe that our audit provides a reasonable basis for our opinion.
Definition and Limitations of Internal Control Over Financial Reporting
A company’s internal control over financial reporting is a process designed to provide reasonable assurance regarding the reliability of financial reporting and the preparation of financial statements for external purposes in accordance with generally accepted accounting principles. A company’s internal control over financial reporting includes those policies and procedures that (1) pertain to the maintenance of records that, in reasonable detail, accurately and fairly reflect the transactions and dispositions of the assets of the company; (2) provide reasonable assurance that transactions are recorded as necessary to permit preparation of financial statements in accordance with generally accepted accounting principles, and that receipts and expenditures of the company are being made only in accordance with authorizations of management and directors of the company; and (3) provide reasonable assurance regarding prevention or timely detection of unauthorized acquisition, use, or disposition of the company’s assets that could have a material effect on the financial statements.
F- 3
Because of its inherent limitations, internal control over financial reporting may not prevent or detect misstatements. Also, projections of any evaluation of effectiveness to future periods are subject to the risk that controls may become inadequate because of changes in conditions, or that the degree of compliance with the policies or procedures may deteriorate.
Disclaimer on Additional Information in Management’s Report
We do not express an opinion or any other form of assurance on management’s statements, included in the accompanying Management’s Report on Internal Control over Financial Reporting, referring to corrective actions taken after December 26, 2017, relative to the aforementioned material weakness in internal control over financial reporting.
/s/ KPMG LLP
Dallas, Texas
March 27, 2018
F- 4
DEL FRISCO’S RESTAURANT GROUP, INC. AND SUBSIDIARIES
Consolidated Balance Sheets
(Amounts in thousands, except share data) | December 26, 2017 | December 27, 2016 | |||||
ASSETS | |||||||
Current assets: | |||||||
Cash and cash equivalents | $ | 4,594 | $ | 14,622 | |||
Inventory | 18,029 | 16,400 | |||||
Income taxes receivable | 3,369 | 3,599 | |||||
Lease incentives receivable | 1,739 | 4,025 | |||||
Prepaid expenses | 5,880 | 5,199 | |||||
Other current assets | 3,392 | 2,835 | |||||
Total current assets | 37,003 | 46,680 | |||||
Property and equipment: | |||||||
Land | — | 6,477 | |||||
Buildings | — | 9,460 | |||||
Leasehold improvements | 203,818 | 200,122 | |||||
Furniture, fixtures, and equipment | 76,369 | 68,123 | |||||
Property and equipment, gross | 280,187 | 284,182 | |||||
Less accumulated depreciation | (104,832 | ) | (88,190 | ) | |||
Property and equipment, net | 175,355 | 195,992 | |||||
Deferred compensation plan investments | 14,644 | 15,054 | |||||
Goodwill | 62,241 | 75,365 | |||||
Intangible assets, net | 37,000 | 37,409 | |||||
Other assets | 544 | 282 | |||||
Total assets | $ | 326,787 | $ | 370,782 | |||
| |||||||
LIABILITIES AND EQUITY | |||||||
Current liabilities: | |||||||
Accounts payable | $ | 13,941 | $ | 12,791 | |||
Sales tax payable | 3,314 | 2,531 | |||||
Accrued payroll | 7,415 | 7,359 | |||||
Deferred revenue | 17,646 | 18,735 | |||||
Other current liabilities | 9,516 | 9,660 | |||||
Total current liabilities | 51,832 | 51,076 | |||||
Noncurrent liabilities: | |||||||
Long-term debt | 24,477 | — | |||||
Deferred compensation plan liabilities | 11,326 | 15,212 | |||||
Deferred rent obligations | 44,830 | 37,697 | |||||
Deferred income taxes, net | 3,238 | 18,189 | |||||
Other noncurrent liabilities | 1,997 | 2,242 | |||||
Total liabilities | 137,700 | 124,416 | |||||
Commitments and contingencies (Note 10) | |||||||
Stockholders' equity: | |||||||
Preferred stock, $0.001 par value, 10,000,000 shares authorized, no shares outstanding at December 26, 2017 and December 27, 2016, respectively. | — | — | |||||
Common stock, $0.001 par value, 190,000,000 shares authorized, 24,420,490 issued and 20,309,341 outstanding and 24,234,909 shares issued and 23,272,274 shares outstanding at December 26, 2017 and December 27, 2016, respectively. | 24 | 24 | |||||
Treasury stock at cost: 4,111,149 shares and 962,635 shares at December 26, 2017 and December 27, 2016, respectively. | (67,823 | ) | (17,823 | ) | |||
Additional paid in capital | 147,503 | 143,325 | |||||
Retained earnings | 109,383 | 120,840 | |||||
Total stockholders' equity | 189,087 | 246,366 | |||||
Total liabilities and stockholders' equity | $ | 326,787 | $ | 370,782 | |||
See accompanying notes.
F- 5
DEL FRISCO’S RESTAURANT GROUP, INC. AND SUBSIDIARIES
Consolidated Statements of Operations and Comprehensive (Loss) Income
| Fiscal Year Ended | ||||||||||
(Amounts in thousands, except per share data) | December 26, 2017 | December 27, 2016 | December 29, 2015 | ||||||||
Revenues | $ | 361,431 | $ | 351,681 | $ | 331,612 | |||||
Costs and expenses: | |||||||||||
Costs of sales | 103,976 | 99,181 | 95,963 | ||||||||
Restaurant operating expenses (excluding depreciation and amortization shown separately below) | 177,170 | 169,300 | 156,337 | ||||||||
Insurance recovery | (1,073 | ) | — | — | |||||||
Marketing and advertising costs | 8,393 | 8,260 | 7,745 | ||||||||
Pre-opening costs | 2,182 | 3,446 | 5,228 | ||||||||
General and administrative costs | 28,421 | 25,131 | 23,111 | ||||||||
Donations | 836 | — | — | ||||||||
Consulting project costs | 2,786 | — | — | ||||||||
Reorganization severance costs | 1,072 | 793 | — | ||||||||
Lease termination and closing costs | 538 | 1,031 | 1,386 | ||||||||
Impairment charges | 37,053 | 598 | 3,248 | ||||||||
Depreciation and amortization | 23,399 | 18,865 | 16,776 | ||||||||
Total costs and expenses | 384,753 | 326,605 | 309,794 | ||||||||
Insurance settlements | 1,153 | — | — | ||||||||
Operating (loss) income | (22,169 | ) | 25,076 | 21,818 | |||||||
Other income (expense), net: | |||||||||||
Interest, net of capitalized interest | (783 | ) | (70 | ) | (77 | ) | |||||
Other | (1,439 | ) | (432 | ) | (236 | ) | |||||
(Loss) income before income taxes | (24,391 | ) | 24,574 | 21,505 | |||||||
Income tax (benefit) expense | (12,934 | ) | 6,808 | 5,507 | |||||||
Net (loss) income | $ | (11,457 | ) | $ | 17,766 | $ | 15,998 | ||||
| |||||||||||
Net (loss) income per average common share: | |||||||||||
Basic: | $ | (0.53 | ) | $ | 0.76 | $ | 0.68 | ||||
Diluted: | $ | (0.53 | ) | $ | 0.76 | $ | 0.68 | ||||
| |||||||||||
Weighted-average number of common shares outstanding: | |||||||||||
Basic: | 21,570 | 23,322 | 23,380 | ||||||||
Diluted: | 21,570 | 23,435 | 23,517 | ||||||||
| |||||||||||
Comprehensive (loss) income | $ | (11,457 | ) | $ | 17,766 | $ | 15,998 | ||||
See accompanying notes.
F- 6
DEL FRISCO’S RESTAURANT GROUP, INC. AND SUBSIDIARIES
Consolidated Statements of Changes in Stockholders’ Equity
| Common Stock | ||||||||||||||||||||||
(Amounts in thousands, except share data) | Shares | Par Value | Additional Paid In Capital | Treasury Stock | Retained Earnings | Total | |||||||||||||||||
Balance at December 30, 2014 | 23,443,046 | $ | 24 | $ | 133,883 | $ | (10,000 | ) | $ | 87,076 | $ | 210,983 | |||||||||||
Net income | — | — | — | — | 15,998 | 15,998 | |||||||||||||||||
Share-based compensation costs | — | — | 2,900 | — | — | 2,900 | |||||||||||||||||
Stock option exercises, including tax effects | 59,150 | — | 818 | — | — | 818 | |||||||||||||||||
Treasury stock purchases | (189,027 | ) | — | — | (3,000 | ) | — | (3,000 | ) | ||||||||||||||
Balance at December 29, 2015 | 23,313,169 | $ | 24 | $ | 137,601 | $ | (13,000 | ) | $ | 103,074 | $ | 227,699 | |||||||||||
Net income | — | — | — | — | 17,766 | 17,766 | |||||||||||||||||
Share-based compensation costs | — | — | 2,602 | — | — | 2,602 | |||||||||||||||||
Stock option exercises, including tax effects | 228,800 | — | 3,207 | — | — | 3,207 | |||||||||||||||||
Shares issued under stock compensation plan, net of shares withheld for tax effects | 33,492 | — | (85 | ) | — | — | (85 | ) | |||||||||||||||
Treasury stock purchases | (303,187 | ) | — | — | (4,823 | ) | — | (4,823 | ) | ||||||||||||||
Balance at December 27, 2016 | 23,272,274 | $ | 24 | $ | 143,325 | $ | (17,823 | ) | $ | 120,840 | $ | 246,366 | |||||||||||
Net (loss) | — | — | — | — | (11,457 | ) | (11,457 | ) | |||||||||||||||
Share-based compensation costs | — | — | 2,819 | — | — | 2,819 | |||||||||||||||||
Stock option exercises | 136,500 | — | 1,542 | — | — | 1,542 | |||||||||||||||||
Shares issued under stock compensation plan, net of shares withheld for tax effects | 38,743 | — | (183 | ) | — | — | (183 | ) | |||||||||||||||
Treasury stock purchases, net of tax effects related to vested restricted stock and restricted stock units | (3,138,176 | ) | — | — | (50,000 | ) | — | (50,000 | ) | ||||||||||||||
Balance at December 26, 2017 | 20,309,341 | $ | 24 | $ | 147,503 | $ | (67,823 | ) | $ | 109,383 | $ | 189,087 | |||||||||||
See accompanying notes.
F- 7
DEL FRISCO’S RESTAURANT GROUP, INC. AND SUBSIDIARIES
Consolidated Statements of Cash Flows
| Fiscal Year Ended | |||||||||||
(Amounts in thousands) | December 26, 2017 | December 27, 2016 | December 29, 2015 | |||||||||
Cash flows from operating activities: | ||||||||||||
Net (loss) income | $ | (11,457 | ) | $ | 17,766 | $ | 15,998 | |||||
Adjustments to reconcile net (loss) income to net cash provided by operating activities: | ||||||||||||
Depreciation and amortization | 23,399 | 18,865 | 16,776 | |||||||||
Loss on disposal of restaurant property | 1,413 | 429 | 27 | |||||||||
Loan cost amortization | 3 | 2 | 8 | |||||||||
Equity based compensation | 2,819 | 2,666 | 2,900 | |||||||||
Impairment charges | 37,053 | 598 | 3,248 | |||||||||
Deferred income taxes | (14,951 | ) | 1,575 | 3,495 | ||||||||
Amortization of deferred lease incentives | (1,055 | ) | (1,140 | ) | (666 | ) | ||||||
Changes in operating assets and liabilities: | ||||||||||||
Restricted cash | — | — | 215 | |||||||||
Inventory | (1,629 | ) | 908 | (716 | ) | |||||||
Lease incentives receivable | 8,065 | 2,692 | 5,760 | |||||||||
Prepaid expenses and other assets | (3,716 | ) | (1,497 | ) | (2,282 | ) | ||||||
Insurance settlement | 1,153 | — | — | |||||||||
Accounts payable | (1,808 | ) | (2,666 | ) | 2,801 | |||||||
Income taxes | 230 | 1,888 | (4,287 | ) | ||||||||
Deferred rent obligations | 2,624 | 2,307 | (1,094 | ) | ||||||||
Deferred revenue | (1,089 | ) | 1,100 | 1,919 | ||||||||
Other liabilities | (2,989 | ) | 4,322 | 1,766 | ||||||||
Net cash provided by operating activities | 38,065 | 49,815 | 45,868 | |||||||||
Cash flows from investing activities: | ||||||||||||
Proceeds from sale of property and equipment | 14,692 | 3,078 | 1 | |||||||||
Purchase of trade name | — | (546 | ) | — | ||||||||
Insurance settlement for property and equipment | 1,073 | — | — | |||||||||
Purchases of property and equipment | (39,426 | ) | (36,698 | ) | (46,150 | ) | ||||||
Other investing activities | (268 | ) | (2 | ) | (381 | ) | ||||||
Net cash used in investing activities | (23,929 | ) | (34,168 | ) | (46,530 | ) | ||||||
Cash flows from financing activities: | ||||||||||||
Payments on revolving credit facility | (37,250 | ) | (16,500 | ) | (32,450 | ) | ||||||
Proceeds from revolving credit facility | 58,750 | 12,000 | 36,950 | |||||||||
Purchases of treasury stock | (50,000 | ) | (4,823 | ) | (3,000 | ) | ||||||
Proceeds from loan against deferred compensation investments | 3,546 | — | — | |||||||||
Payments on loan against deferred compensation investments | (569 | ) | — | — | ||||||||
Cash settlement for share-based awards | (183 | ) | (85 | ) | — | |||||||
Proceeds from exercise of stock options | 1,542 | 3,207 | 818 | |||||||||
Net cash (used in) provided by financing activities | (24,164 | ) | (6,201 | ) | 2,318 | |||||||
Net change in cash and cash equivalents | (10,028 | ) | 9,446 | 1,656 | ||||||||
Cash and cash equivalents at beginning of period | 14,622 | 5,176 | 3,520 | |||||||||
Cash and cash equivalents at end of period | $ | 4,594 | $ | 14,622 | $ | 5,176 | ||||||
Supplemental disclosures of cash flow information: | ||||||||||||
Cash paid during the year for: | ||||||||||||
Interest | $ | 665 | $ | 87 | $ | 175 | ||||||
Income taxes | $ | 2,271 | $ | 3,756 | $ | 6,626 | ||||||
Non cash investing and financing activities: | ||||||||||||
Capital expenditures included in accounts payable at end of period | $ | 3,927 | $ | 968 | $ | 1,998 | ||||||
Acquisition of trade name financed by current liabilities | $ | — | $ | 100 | $ | — | ||||||
See accompanying notes.
F- 8
DEL FRISCO’S RESTAURANT GROUP, INC. AND SUBSIDIARIES
Notes to Consolidated Financial Statements
1. Organization, Business and Basis of Presentation
Description of Business
Del Frisco’s Restaurant Group, Inc. is incorporated in Delaware as a corporation. We own and operate restaurants under the brand names of Del Frisco’s Double Eagle Steakhouse, Del Frisco’s Grille and Sullivan’s Steakhouse. As of December 26, 2017, we owned and operated 13 Double Eagles, 24 Grille and 16 Sullivan’s restaurants. During fiscal 2017, we opened one Double Eagle in Plano, TX and one Grille at Brookfield Place in New York City, NY.
2. Summary of Significant Accounting Policies
Principles of Consolidation
The consolidated financial statements include the accounts of Del Frisco's Restaurant Group, Inc. and its wholly owned subsidiaries (we, us, our or the Company). All significant intercompany accounts and transactions have been eliminated.
Fiscal Year
We operate on a 52- or 53-week fiscal year ending the last Tuesday in December. Fiscal 2017, 2016 and 2015 included 52 weeks of operations. Starting in fiscal 2018, we will begin to use 12 periods for our fiscal reporting calendar, meaning that our first, second and third quarters will each contain 13 operating weeks with the fourth quarter containing 13 or 14 operating weeks.
Concentrations
We have certain financial instruments exposed to a concentration of credit risk, which consist primarily of cash and cash equivalents. We place cash with high-credit-quality financial institutions, and, at times, such cash may be in excess of the federal depository insurance limit.
Additionally, we purchased a significant amount of total beef purchases from one supplier during fiscal 2017, 2016 and 2015. Due to the nature of the beef purchases, there are alternative sources of supply available; however, a change in suppliers could potentially cause increased costs.
Use of Estimates
The preparation of the consolidated financial statements in conformity with accounting principles generally accepted in the United States requires management to make estimates and assumptions that affect the amounts reported in the consolidated financial statements and accompanying notes. Actual results could differ from those estimates.
Change in Accounting Estimates
Gift Card Breakage - During the fourth quarter of 2017, we re-evaluated the estimated redemption patterns related to gift cards and aligned the recognition of gift card breakage revenue to the updated estimated redemption patterns. As a result, the Company recognized $0.7 million of additional gift card breakage revenue, partially offset by $0.2 million of expense related to gift card discount in 2017 that it would not have recognized using the previous estimated redemption pattern. This change in accounting estimate reduced net loss by $0.6 million or $0.03 per diluted share, based on the current effective tax rate, for the 52 weeks ended December 26, 2017.
Cash and Cash Equivalents
Cash and cash equivalents include currency on hand, demand deposits with banks or other financial institutions, credit card receivables, and short-term investments with maturities of three months or less when purchased.
Financial Instruments
We consider the carrying amounts of cash and cash equivalents, short-term investments, receivables and accounts payable to approximate fair value based on the short-term nature of these items. Borrowings available under the credit facility at December 26, 2017 have variable interest rates that reflect currently available terms and conditions for similar debt. See note 11.
F- 9
Inventories
Inventories, which primarily consist of food and beverages, are valued at the lower of cost, using the first-in, first-out (FIFO) method, or net realizable value.
Property and Equipment
Property and equipment are stated at cost. Maintenance, repairs, and renewals that do not enhance the value or increase the lives of the assets are expensed as incurred. Leasehold improvements are amortized using the straight-line method over the lesser of the estimated useful lives of the assets of 20 years or the expected term of the lease, including optional renewal periods when failure to exercise such renewal options would result in an economic penalty to us. Furniture, fixtures, and equipment are depreciated using the straight-line method over three to seven years, which are the estimated useful lives of the assets.
Interest is capitalized in connection with the construction of restaurant facilities. The capitalized interest is recorded as part of the asset to which it relates and is amortized over the asset’s estimated useful life. Capitalized interest was $0.1 million for the fiscal year ended December 26, 2017, a nominal amount for the fiscal year ended December 27, 2016 and, $0.1 million for the fiscal year ended December 29, 2015.
Operating Leases
We currently lease all of our restaurants. The majority of our leases provide for minimum annual rents with some containing percentage-of-sales rent provisions, against which the minimum rent may be applied. The majority of our leases also provide for rent escalation clauses, contingent rental expense, and/or tenant improvement allowances.
Rent expense is recognized on a straight-line basis over the expected term of the lease, which includes optional renewal periods that are reasonably assured to be exercised and where failure to exercise such renewal options would result in an economic penalty to us.
Certain of our operating leases contain clauses that provide additional contingent rent based on a percentage of sales greater than certain specified target amounts. We recognize contingent rent expense prior to the achievement of the specified target that triggers the contingent rent, provided achievement of that target is considered probable.
We record tenant improvement allowances and other landlord incentives as a component of deferred rent which is amortized on a straight-line basis over the expected term of the lease.
Pre-opening Costs
Pre-opening costs, including rent, labor costs, costs of hiring and training personnel, and certain other costs related to opening new restaurants, are expensed when the costs are incurred.
Goodwill and Other Intangible Assets
Our intangible assets primarily include goodwill, trade names and licensing agreements. Our trade names include “Del Frisco’s Double Eagle Steakhouse” and “Sullivan’s Steakhouse,” both of which have indefinite lives and, accordingly, are not subject to amortization. Goodwill represents the excess of costs over the fair value of the net assets acquired.
Goodwill and intangible assets that have indefinite useful lives are not amortized. However, both goodwill and trade names are subject to annual impairment testing, or more frequently if an event or other circumstance indicates that goodwill or the trade names may be impaired. We amortize our finite-lived intangible assets on a straight-line basis over the estimated period of benefit, generally 7 to 17 years. See Note 3 for additional information.
The impairment evaluation for goodwill is conducted annually. The fair value of each reporting unit is compared with the carrying amount of the reporting unit, including goodwill. The estimated fair value of the reporting unit is generally determined on the basis of discounted future cash flows and a market-based approach. We make assumptions regarding future profits and cash flows, expected growth rates, terminal value, and other factors which could significantly impact the fair value calculations. If the estimated fair value of the reporting unit is less than the carrying amount of the reporting unit, an impairment charge is recorded for the difference not to exceed the carrying value of the goodwill. Currently, our reporting units are the Del Frisco’s Double Eagle and Sullivan’s reporting units. We perform our annual impairment test as of year-end.
The evaluation of the carrying amount of other intangible assets with indefinite lives is made annually by comparing the carrying amount of these assets to their estimated fair value. The estimated fair value is determined on the basis of existing
F- 10
market-based conditions as well as discounted future cash flows or the royalty-relief method for trade names. If the estimated fair value is less than the carrying amount, an impairment charge is recorded to reduce the asset to its estimated fair value.
The valuation approaches used to determine the fair value of each reporting unit and other intangible assets are subject to key judgments and assumptions about revenue growth rates, operating margins, weighted average cost of capital and comparable company and acquisition market multiples. When developing these key judgments and assumptions, which are sensitive to change, management considers economic, operational and market conditions that could impact the fair value. The judgments and assumptions used are consistent with what management believes hypothetical market participants would use. However, estimates are inherently uncertain and represent only reasonable expectations regarding future developments.
During fiscal 2017, we determined that the carrying values of our goodwill and indefinite-lived intangible assets related to Sullivan’s concept was greater than their fair values. Therefore, we recorded a non-cash impairment charge of $13.4 million, of which $0.3 million is related to trade name, which represents the difference between the carrying values of the goodwill and trade name for Sullivan's concept and their estimated fair values. This amount is included in impairment charges in the consolidated statements of operations and comprehensive (loss) income.
In January 2017, the FASB issued ASU 2017-04, Simplifying the Test for Goodwill Impairment, which removes the second step of the goodwill impairment test and requires an entity to perform its annual or interim goodwill impairment test by comparing the fair value of a reporting unit with its carrying amount, and recognize an impairment charge for the amount by which the carrying value exceeds the fair value, not to exceed the total amount of goodwill allocated to that reporting unit. ASU 2017-04 is effective for public business entities for annual periods, including interim periods within those annual periods, beginning after December 15, 2019, and early adoption is permitted for interim or annual goodwill impairment tests performed on testing dates after January 1, 2017. An entity should apply ASU 2017-04 using a prospective transition method. We elected to early adopt this ASU beginning in fiscal 2017.
Loan Costs
Loan costs are stated at cost and amortized using the effective interest method over the life of the related loan.
Deferred Compensation Plan
In connection with our deferred-compensation plan, we have created a grantor trust to which we contribute amounts equal to employee participants’ qualified deferrals and our matching portion. The plan is informally funded using life insurance policies and mutual funds held by the grantor trust. All assets held by the grantor trust remain the property of us; however, we do not currently intend to use such assets for any purpose other than to fund payments to the participants, pursuant to the terms of the deferred-compensation plan. The assets of the plan consist principally of cash surrender values of the life insurance policies. Because the investment assets of the deferred-compensation plan are our assets and would be subject to general claims by creditors in the event of our insolvency, the accompanying consolidated balance sheets reflect such investments as assets, with a liability for deferred compensation reflected in long-term liabilities for amounts owed to employees.
Impairment of Long-Lived Assets
Property and equipment and finite-life intangibles are reviewed for impairment whenever events or changes in circumstances indicate the carrying amount of an asset may not be recoverable. We review applicable finite-lived intangible assets and long-lived assets related to each restaurant on a periodic basis. Our assessment of recoverability of property and equipment and finite-lived intangible assets is performed at the component level, which is generally an individual restaurant. When events or changes in circumstances indicate an asset may not be recoverable, we estimate the future cash flows expected to result from the use of the asset. If the sum of the expected discounted future cash flows is less than the carrying value of the asset, an impairment loss is recognized. The impairment loss is recognized by measuring the difference between the carrying value of the assets and the estimated fair value of the assets. Our estimates of fair values are based on the best information available and require the use of estimates, judgments, and projections. The actual results may vary significantly from the estimates.
During the fourth quarter of fiscal 2017, we determined that the carrying values of one Double Eagle, four Grille and one Sullivan’s restaurants were most likely not recoverable. Therefore, we recorded a non-cash impairment charge of $23.6 million, which represents the difference between the carrying values of the restaurant assets and the estimated fair values of leasehold improvements, furniture and restaurant equipment that may be transferred to other restaurant locations.These amounts are included in impairment charges in the consolidated statements of operations and comprehensive (loss) income.
During fiscal 2016, we determined that the carrying amount of two of our Sullivan’s restaurants were most likely not recoverable. Therefore, we recorded a non-cash impairment charge of $0.6 million, which represents the difference between the carrying values of the restaurant assets and the estimated values of leasehold improvements, furniture and restaurant equipment
F- 11
that may be transferred to other restaurant locations. This amount is included in impairment charges in the consolidated statements of operations and comprehensive (loss) income.
During fiscal 2015, we determined that the carrying amount of one of our Grille restaurants was most likely not recoverable. Therefore, we recorded a non-cash impairment charge of $3.2 million, which represents the difference between the carrying value of the restaurant assets and the estimated value of furniture and restaurant equipment that may be transferred to future Grille locations. This amount is included in impairment charges in the consolidated statements of operations and comprehensive (loss) income.
Self-Insurance Reserves
We maintain self-insurance programs for our workers’ compensation and general liability insurance programs. In order to minimize the exposure under the self-insurance programs, we have purchased stop-loss coverage both on a per-occurrence and on an aggregate basis. The self-insured losses under the programs are accrued based on our estimate of the expected liability for both claims incurred and incurred but not reported basis. The establishment of such accruals for self-insurance involves certain management judgments and assumptions regarding the frequency or severity of claims, the historical patterns of claim development, and our experience with claim-reserve management and settlement practices. To the extent actual results differ from the assumptions used to develop the accruals, such unanticipated changes may produce significantly different amounts of expense than those estimated under the self-insurance programs.
Income Taxes
We use the asset and liability method of accounting for income taxes. Under this method, deferred tax assets and liabilities are determined based on differences between financial reporting and tax basis of assets and liabilities and are measured using the enacted tax rates and laws that will be in effect when the differences are expected to reverse. We regularly evaluate the likelihood of realization of tax benefits derived from positions we have taken in various federal and state filings after consideration of all relevant facts, circumstances, and available information. For those tax benefits deemed more likely than not that will be sustained, we recognize the benefit we believe is cumulatively greater than 50% likely to be realized. To the extent we were to prevail in matters for which accruals have been established or be required to pay amounts in excess of recorded reserves, the effective tax rate in a given financial statement period could be materially impacted.
On December 22, 2017, the Tax Cuts and Jobs Act (H.R. 1) (TCJA) was enacted. The TCJA contains significant changes to corporate taxation, including reduction of the federal corporate tax rate from 35% to 21% effective for tax years beginning after December 31, 2017, limitation of the tax deduction for interest expense, limitation of the deduction for net operating losses and elimination of net operating loss carrybacks, and modifying or repealing many business deductions and credits including the limitation on deductions for certain executive compensation arrangements under Section 162(m) of the Internal Revenue Code. We completed our accounting for the TCJA under ASC 740 and reported provisional amounts for the income tax effects of the TCJA for which the accounting is incomplete but a reasonable estimate could be determined, for all aspects of the TCJA, which are included in our year ended December 26, 2017 consolidated financial statements. See note 5.
Advertising Costs
Advertising costs are expensed as incurred. Advertising expense for the fiscal years ended December 26, 2017, December 27, 2016 and December 29, 2015 was $8.4 million, $8.3 million, and $7.7 million, respectively.
Revenue Recognition
Revenue from restaurant sales is recognized when food and beverage products are sold. Proceeds from the sale of gift cards are recorded as deferred revenue at the time of sale and recognized as revenue when the gift card is redeemed by the holder or the likelihood of redemption becomes remote (gift card breakage) and we determine there is no legal obligation to remit the value of the unredeemed gift cards to governmental agencies. We determine the gift card breakage rate based upon historical redemption patterns. Certain of our gift cards are sold at a discount and the net value (face value to be redeemed less the proceeds received) is deferred until redeemed or breakage is deemed appropriate. During the fourth quarter of 2017, we re-evaluated the estimated redemption patterns related to gift cards and aligned the recognition of gift card breakage revenue to the updated estimated redemption patterns. As a result, the Company recognized $0.7 million of additional gift card breakage revenue, partially offset by $0.2 million of expense related to gift card discount in 2017 that it would not have recognized using the previous estimated redemption pattern.We have deemed gift card breakage income not material for fiscal years 2016 and 2015, and it is included in revenues in the consolidated statements of operations and comprehensive (loss) income. Additionally, revenues are net of the cost of loyalty points earned associated with sales made to customers in our loyalty program. We exclude from revenue any taxes assessed by governmental agencies that are directly imposed on revenue-producing transactions between us and a customer.
F- 12
Stock-Based Compensation
In 2012, we adopted the Del Frisco’s Restaurant Group, Inc. 2012 Long-Term Equity Incentive Plan (2012 Plan), which allows our Board of Directors or a committee thereof to grant stock options, restricted stock, restricted stock units, deferred stock units and other equity-based awards to directors, officers, key employees and other key individuals performing services for us. We recognize stock-based compensation in accordance with Compensation—Stock Compensation (ASC Topic 718). Stock-based compensation cost includes compensation cost for all share-based payments granted based on the grant date fair value estimated in accordance with the provisions of Topic 718. Compensation cost is recognized on a straight-line basis, net of estimated forfeitures, over the requisite service period of each award.
Reclassifications
Certain amounts from the prior years have been reclassified to conform with the fiscal 2017 presentation.
Recently Issued Standards
In February 2016, the FASB issued ASU No. 2016-02, Leases (Topic 842) (ASU 2016-02). ASU 2016-02 is intended to improve the reporting of leasing transactions to provide users of financial statements with more decision-useful information. The main amendments in ASU 2016-02 require recognition on the balance sheet of lease assets and lease liabilities by lessees for those leases classified as operating leases. ASU 2016-02 is effective for annual periods beginning after December 15, 2018, including interim periods within those fiscal years, with early application permitted. This update will be applied on a modified retrospective basis. We anticipate implementing the standard by taking advantage of the practical expedient option. The discounted minimum remaining rental payments will be the starting point for determining the right-of-use asset and lease liability. We had operating leases with remaining rental payments of approximately $405.8 million at the end of fiscal 2017. We expect that adoption of the new guidance will have a material impact on our consolidated balance sheets due to recognition of the right-of-use asset and lease liability related to our current operating leases. The process of evaluating the full impact of the new guidance on our consolidated financial statements and disclosures is ongoing, but we anticipate the initial evaluation of the impact will be completed in fiscal 2018.
In August 2016, the FASB issued ASU No. 2016-15, Statement of Cash Flows (Topic 230) – Classification of Certain Cash Receipts and Cash Payments. This ASU is intended to clarify the presentation of cash receipts and payments in specific situations. The amendments in this update are effective for financial statements issued for annual periods beginning after December 15, 2017, including interim periods within those annual periods, and early application is permitted. An entity should apply ASU 2016-15 using a retrospective transition method to each period presented. We do not anticipate that the adoption of this pronouncement will have a material impact on our consolidated financial statements.
In November 2016, the FASB issued ASU 2016-18, Statement of Cash Flows (Topic 230) - Restricted Cash, which outlines that a statement of cash flows explains the change during the period in total cash, cash equivalents, and amounts generally described as restricted cash or restricted cash equivalents. ASU 2016-18 is effective for public business entities for annual periods, including interim periods within those annual periods, beginning after December 15, 2017, and early application is permitted. An entity should apply ASU 2016-18 using a retrospective transition method to each period presented. We are currently assessing the impact of the adoption of this ASU on our consolidated financial statements. We do not anticipate that the adoption of this pronouncement will have a material impact on our consolidated financial statements.
In May 2017, the FASB issued ASU 2017-09, Compensation - Stock Compensation (Topic 718): Scope of Modification Accounting, which provides clarity and reduces complexity when an entity has changes to the terms or conditions of a share-based payment award, and when an entity should apply modification accounting. The amendments in this update are effective for financial statements issued for annual periods beginning after December 15, 2017, including interim periods within those annual periods, and early adoption is permitted for interim or annual periods. The amendments in ASU 2017-09 should be applied prospectively to an award modified on or after the adoption date. We do not anticipate that the adoption of this pronouncement will have a material impact on our consolidated financial statements.
F- 13
3. Intangible Assets and Goodwill
The components of intangible assets and goodwill consist of the following:
(Amounts in thousands) | December 26, 2017 | December 27, 2016 | ||||||
Amortized intangible assets: | ||||||||
Gross carrying amount: | ||||||||
Favorable leasehold interests | $ | — | $ | 848 | ||||
Licensing and development rights | 1,077 | 1,077 | ||||||
Other | 543 | 540 | ||||||
| 1,620 | 2,465 | ||||||
Accumulated amortization: | ||||||||
Favorable leasehold interests | — | (848 | ) | |||||
Licensing and development rights | (729 | ) | (663 | ) | ||||
Other | (163 | ) | (133 | ) | ||||
| (892 | ) | (1,644 | ) | ||||
Net amortized intangible assets | 728 | 821 | ||||||
Unamortized intangible assets: | ||||||||
Goodwill | 62,241 | 75,365 | ||||||
Trade names | 35,177 | 35,493 | ||||||
Liquor license permits | 1,095 | 1,095 | ||||||
| $ | 98,513 | $ | 111,953 | ||||
Licensing contract rights and favorable lease rights are being amortized using the straight-line method over the estimated lives of the related contracts and agreements, which are seven to nine years for favorable leasehold interest and 17 years for licensing contract rights. Liquor licenses that are transferable are carried at cost. Such licenses are reviewed for impairment on an annual basis.
Goodwill is allocated to the Del Frisco’s Double Eagle and Sullivan’s reporting units, as follows: $43.9 million and $18.3 million at December 26, 2017, and $43.9 million and $31.4 million at December 27, 2016.
We have estimated that annual amortization expense will amount to approximately $0.1 million for 2018 to 2022.
Amortization expense was $0.1 million, $0.1 million, and $0.2 million for the years ended December 26, 2017, December 27, 2016 and December 29, 2015, respectively.
We performed the annual test for impairment of goodwill and indefinite-lived intangible assets and concluded that $13.4 million impairment, of which $0.3 million is related to trade name, existed as of December 26, 2017 related to the Sullivan’s reporting unit, which represents the difference between the carrying values of the goodwill and trade name for the Sullivan's reporting unit and their estimated fair values, and no impairment existed as of December 27, 2016 or December 29, 2015.
During fiscal 2017, we adopted ASU 2017-04, Simplifying the Test for Goodwill Impairment, which removes the second step of the goodwill impairment test and requires an entity to perform its annual or interim goodwill impairment test by comparing the fair value of a reporting unit with its carrying amount, and recognize an impairment charge for the amount by which the carrying value exceeds the fair value, not to exceed the total amount of goodwill allocated to that reporting unit. The adoption did not have an impact on our consolidated financial statements; however, this standard did change our policy for our annual goodwill impairment assessment by eliminating the requirement to calculate the implied fair value of goodwill.
On February 1, 2012, we entered into an agreement to terminate a license agreement with the licensee operating a Del Frisco’s Double Eagle in Orlando, Florida effective June 1, 2013. The original licensing agreement has been amortized over the expected term of the agreement, and has a remaining book value of $0.3 million as of December 26, 2017. Under the agreement, in exchange for us surrendering our right to receive licensing fees from January 1, 2012 through June 1, 2013 and making a one-time $0.03 million payment to the licensee, we received the rights to open and operate any of our restaurants in the three counties that make up the Orlando metropolitan area no earlier than January 1, 2015. We accounted for this as an exchange of non-monetary assets, for which we have concluded that the fair value of the asset surrendered approximates its book value and therefore no gain or loss was recorded on the exchange. To determine the fair value of the asset surrendered, we utilized a discounted cash flow method that applied a discount rate of 11.5%, our weighted-average cost of capital, to the future estimated cash flows to be received over the remaining term, including expected renewal, of the license agreement.
F- 14
On March 17, 2016, we entered into an agreement to obtain and clarify ownership of all naming rights for Del Frisco’s in certain counties of Kentucky, Indiana and Ohio for aggregate consideration of $0.6 million. Under the terms of the agreement, we made a payment totaling $0.5 million in 2016, with the remaining $0.1 million paid on August 1, 2017. This intangible asset has been recorded as a trade name with an indefinite life.
4. Leases
We lease certain facilities under noncancelable operating leases with terms expiring between 2018 and 2038. The leases have renewal options ranging from 5 to 20 years, which are exercisable at our option. In addition, certain leases contain escalation clauses based on a fixed percentage increase and provisions for contingent rentals based on a percentage of gross revenues, as defined. Total rental expense amounted to $24.6 million, $22.9 million, and $21.1 million, including contingent rentals of approximately $3.9 million, $3.6 million, and $3.6 million for the fiscal years ended December 26, 2017, December 27, 2016 and December 29, 2015, respectively.
On December 22, 2017, we closed on a Sale-Leaseback transaction for $15.1 million, in which the land, the building and related furniture, fixtures, and equipment for the Del Frisco’s Double Eagle Steakhouse, located in Orlando, Florida were sold. In connection with the sale, we entered into noncancelable lease agreement with the buyer to lease back the real property assets sold, in which the leased property will continue to operate as Del Frisco’s Double Eagle Steakhouse throughout the lease term. The lease provides for a 15 year term with four separate renewal terms of 5 years each if we choose to exercise our right to extend the lease term.
Proceeds for this transaction, net of $0.4 million transaction costs, were $14.7 million and as the result of the transaction, we recorded a net loss of $1.4 million.
Future minimum lease payments under noncancelable operating leases include renewal option periods for certain leases when such option periods are included for purposes of calculating straight-line rents. At December 26, 2017, future minimum rentals for each of the next five years and thereafter, and in total, are as follows:
(Amounts in thousands) | |||
2018 | $ | 24,203 | |
2019 | 25,379 | ||
2020 | 24,906 | ||
2021 | 24,880 | ||
2022 | 25,274 | ||
Thereafter | 281,110 | ||
Total minimum lease payments | $ | 405,752 | |
5. Income Taxes
The components of income tax expense consist of the following:
| Fiscal Year Ended | |||||||||||
(Amounts in thousands) | December 26, 2017 | December 27, 2016 | December 29, 2015 | |||||||||
Current tax expense: | ||||||||||||
Federal | $ | 516 | $ | 2,768 | $ | 894 | ||||||
State | 1,501 | 2,465 | 1,117 | |||||||||
Total current tax expense | 2,017 | 5,233 | 2,011 | |||||||||
Deferred tax (benefit) expense: | ||||||||||||
Federal | (13,664 | ) | 1,381 | 1,722 | ||||||||
State | (1,287 | ) | 194 | 1,774 | ||||||||
Total deferred tax (benefit) expense | (14,951 | ) | 1,575 | 3,496 | ||||||||
Total income tax (benefit) expense | $ | (12,934 | ) | $ | 6,808 | $ | 5,507 | |||||
On December 22, 2017, the TCJA was signed into law. The TCJA contains significant changes to corporate taxation, including a reduction of the federal corporate tax rate from 35% to 21%, creating a territorial tax system, allowing for immediate expensing of certain qualified property, modifying or repealing many business deductions and credits, and providing other incentives.
F- 15
SAB 118, to provide guidance for companies that are not able to complete their accounting for the income tax effects of the Act in the period of enactment. The SEC Staff noted in SAB 118 that in these cases a company should continue to apply Topic 740, Income Taxes based on the provisions of the tax laws that were in effect immediately prior to the TCJA being enacted. SAB 118 provides a measurement period that should not extend beyond one year from the TCJA enactment date for companies to complete the accounting under Topic 740. We completed our accounting for the TCJA under ASC 740 and reported provisional amounts for the income tax effects of the TCJA for which the accounting is incomplete but a reasonable estimate could be determined, for all aspects of the TCJA, which are included in our year ended December 26, 2017 consolidated financial statements. There were no specific impacts of the TCJA that could not be reasonably estimated, however the final impact of the TCJA may differ from these estimates, due to, among other things, changes in our interpretations and assumptions of the TCJS, and additional guidance that may be issued by the Internal Revenue Service.
The $12.9 million income tax benefit was primarily attributable to permanent differences as a result of goodwill impairment and TCJA, which permanently reduced the maximum federal corporate income tax rate from 35% to 21%. A change in the tax rate requires deferred tax assets and liabilities to be measured at the enacted tax rate expected to apply when temporary differences are to be realized or settled. Thus, at the date of enactment, the corporate income tax rate reduction lowered the expected future cost of existing deferred tax liabilities resulting in the income tax benefit for 2017.
The difference between the reported income tax (benefit) expense and taxes determined by applying the applicable U.S. federal statutory income tax rate to (loss) income before taxes is reconciled as follows:
| Fiscal Year Ended | ||||||||||||||||||||
(Amounts in thousands) | December 26, 2017 | December 27, 2016 | December 29, 2015 | ||||||||||||||||||
Income tax (benefit) expense at federal statutory rate | $ | (8,537 | ) | 35 | % | $ | 8,602 | 35 | % | $ | 7,527 | 35 | % | ||||||||
State tax (benefit) expense, net | (1,028 | ) | 4 | % | 1,835 | 7 | % | 1,215 | 6 | % | |||||||||||
FICA tip and work opportunity credits | (3,654 | ) | 15 | % | (3,519 | ) | (14 | )% | (3,428 | ) | (16 | )% | |||||||||
Impacts related to the TCJA | (4,620 | ) | 19 | % | — | — | % | — | — | % | |||||||||||
Goodwill impairment | 4,594 | (19 | )% | — | — | % | — | — | % | ||||||||||||
Other items, net | 311 | (1 | )% | (110 | ) | — | % | 193 | 1 | % | |||||||||||
Total income tax (benefit) expense | $ | (12,934 | ) | 53 | % | $ | 6,808 | 28 | % | $ | 5,507 | 26 | % | ||||||||
Deferred income taxes reflect the net effects of temporary differences between the carrying amounts of assets and liabilities for financial reporting purposes and amounts used for income tax purposes. Significant components of deferred tax assets and liabilities are presented below:
(Amounts in thousands) | December 26, 2017 | December 27, 2016 | ||||||
Deferred tax assets: | ||||||||
Equity-based compensation | $ | 1,292 | $ | 1,507 | ||||
Accrued liabilities | 3,472 | 5,212 | ||||||
Deferred compensation | 3,165 | 5,620 | ||||||
Deferred rent liabilities | 12,057 | 14,480 | ||||||
Tax credits carryover | 4,632 | — | ||||||
Intangible Assets – Pre-opening Costs | 1,807 | 3,073 | ||||||
Other | 246 | 172 | ||||||
Total deferred tax assets | 26,671 | 30,064 | ||||||
Deferred tax liabilities: | ||||||||
Property and equipment | 18,524 | 32,001 | ||||||
Intangible assets | 11,073 | 15,968 | ||||||
Other | 312 | 284 | ||||||
Total deferred tax liabilities | 29,909 | 48,253 | ||||||
Net deferred tax liabilities | $ | (3,238 | ) | $ | (18,189 | ) | ||
We may, from time to time, be assessed interest or penalties by major tax jurisdictions, although any such assessments historically have been minimal and immaterial to our financial results. In the event we receive an assessment for interest and penalties, it has been classified in the consolidated financial statements as income tax expense. Generally, our federal, state, and local tax returns for years subsequent to 2013 remain open to examination by the major taxing jurisdictions to which we are subject.
F- 16
A reconciliation of the beginning and ending amount of unrecognized tax position is as follows:
| Fiscal Year Ended | |||||||||||
(Amounts in thousands) | December 26, 2017 | December 27, 2016 | December 29, 2015 | |||||||||
Balance at beginning of year | $ | 16 | $ | 40 | $ | 1,386 | ||||||
Additions resulting from current year positions | — | — | — | |||||||||
Additions for positions taken in prior years | — | — | — | |||||||||
Payments made for settlements | — | — | (944 | ) | ||||||||
Expiration of statute of limitations | (16 | ) | (24 | ) | (402 | ) | ||||||
Balance at end of year | $ | — | $ | 16 | $ | 40 | ||||||
We do not believe our uncertain tax positions will change materially during the next 12 months. As of December 26, 2017 and December 27, 2016, accrued interest and penalties included in the consolidated balance sheets totaled $0.1 million and $0.3 million, respectively. The change in interest and penalties associated with our unrecognized tax benefits is included as a component of the Other, net line of the effective tax rate reconciliation.
6. Long-Term Debt
On October 15, 2012, we entered into a credit facility that provided for a three years unsecured revolving credit facility of up to $25 million. Borrowings under the credit facility bear interest at LIBOR plus 1.50%. We are required to pay a commitment fee equal to 0.25% per annum on the available but unused revolving loan facility. The credit facility is guaranteed by certain of our subsidiaries. The credit facility contains various financial covenants, including a maximum leverage ratio of total indebtedness to EBITDA, as defined in the credit agreement, and minimum fixed charge coverage ratio, as defined in the credit agreement. The credit facility also contains covenants restricting certain corporate actions, including asset dispositions, acquisitions, the payment of dividends, changes of control, the incurrence of indebtedness and providing financing or other transactions with affiliates.
On June 30, 2015, we entered into a Second Amendment to the credit facility. The amendment, among other things, extended the termination date of the credit facility to October 15, 2017 and modified the revolving credit commitment to $15 million, with such amount subject to increases in increments of $5 million at our request, up to a maximum amount of $30 million. All other major terms remain unchanged.
On December 21, 2016, we entered into a Third Amendment to the credit facility. The amendment, among other things, extended the termination date of the credit facility to October 15, 2019 and modified the revolving credit commitment to $10 million, with such amount subject to increases in increments of $5 million at our request, up to a maximum amount of $30 million.
On April 21, 2017, we entered into a Fourth Amendment to our credit facility that lowered the minimum fixed charge coverage ratio, as defined in the agreement, from 2.00 to 1.25, effective January 1, 2017.
On May 24, 2017, we entered into the Fifth Amendment to our credit facility with JP Morgan Chase Bank. This amendment, among other things, increased the capacity by which the revolving credit commitment can be increased by $20 million. Such commitment increases can be made in increments of $5 million at our request, up to a maximum amount of $50 million. Additionally, this amendment modified the definition of Adjusted EBITDA to provide for the exclusion of certain one-time expenses.
On July 12, 2017, we executed an agreement to borrow against the investments in our deferred compensation plan to pay out funds due to plan participants instead of using operating cash flows. The loan does not have an expiration date or defined payment terms, and accrues interest at a rate of 1%, which is net of the 3% that is earned by the investments being loaned against. As of December 26, 2017, there was $3.0 million of outstanding borrowings on this loan.
On October 20, 2017, we entered into a Sixth Amendment to our credit facility with JP Morgan Chase Bank. The Amendment, among other things, consented to the Company's sale leaseback of its Orlando, Florida Del Frisco's Double Eagle Steakhouse location. Additionally, this amendment modified the definition of the Operating Leverage Ratio under the Loan Agreement.
We were in compliance with the financial debt covenants as of December 26, 2017. As of December 26, 2017, there was $21.5 million outstanding on our revolving credit facility. Under the revolving loan commitment, we had approximately $27.0 million of availability, net of $1.5 million in letter of credit commitments.
F- 17
7. Retirement Plans
We provide two retirement benefit plans to participants. The salary-reduction plans are provided through a qualified 401(k) plan and a nonqualified deferred compensation plan. Under these plans, employees who meet minimum service requirements and elect to participate may make contributions of up to 15% of their annual salaries under the 401(k) plan subject to IRS limitations, and up to 80% under the deferred-compensation plan. We may make additional contributions at the discretion of the Board of Directors. Expenses related to the plans for the fiscal years ended December 26, 2017, December 27, 2016 and December 29, 2015 totaled $1.0 million, $1.3 million, and $2.2 million, respectively.
8. Litigation
We are involved, from time to time, in litigation arising in the ordinary course of business. We believe the outcome of such matters will not have a material adverse effect on our consolidated financial position or results of operations.
9. Stockholders’ Equity
On October 14, 2014, our Board of Directors approved a stock repurchase program authorizing us to repurchase up to $25 million of our common stock over the next three years. On February 15, 2017, our Board of Directors increased the authorized capacity under our existing stock repurchase program to $50 million of our common stock from that date forward and is not part of the defined term. Under this program, management was authorized to purchase outstanding common stock in the open market from time to time at its discretion, subject to share price, market conditions and other factors. The common stock repurchase program did not obligate us to repurchase any dollar amount or number of shares. The Company fully utilized the availability under the repurchase program in November 2017. Over the life of the program, we repurchased 3,630,390 shares of our common stock at an aggregate cost of approximately $57.8 million and an average price per share of $15.93 under this program.
10. Commitments and Contingencies
At December 26, 2017, we had outstanding letters of credit of $1.5 million on our revolving credit facility. The letters of credit typically act as guarantee of payment to certain third parties in accordance with specified terms and conditions.
11. Fair Value Measurement
Under generally accepted accounting principles in the United States, we are required to measure certain assets and liabilities at fair value, or to disclose the fair value of certain assets and liabilities recorded at cost. Pursuant to these fair value measurement and disclosure requirements, fair value is defined as the price that would be received upon sale of an asset or paid upon transfer of a liability in an orderly transaction between market participants at the measurement date and in the principal or most advantageous market for that asset or liability. The fair value is calculated based on assumptions that market participants would use in pricing the asset or liability, not on assumptions specific to the entity. In addition, the fair value of liabilities includes consideration of non-performance risk, including our own credit risk. Each fair value measurement is reported in one of the following three levels:
• | Level 1—valuation inputs are based upon unadjusted quoted prices for identical instruments traded in active markets. |
• | Level 2—valuation inputs are based upon quoted prices for similar instruments in active markets, quoted prices for identical or similar instruments in markets that are not active, and model-based valuation techniques for which all significant assumptions are observable in the market or can be corroborated by observable market data for substantially the full term of the assets or liabilities. |
• | Level 3—valuation inputs are unobservable and typically reflect management’s estimates of assumptions that market participants would use in pricing the asset or liability. The fair values are therefore determined using model-based techniques that include option pricing models, discounted cash flow models, and similar techniques. |
F- 18
The following tables present our financial assets and liabilities measured at fair value on a recurring basis at December 26, 2017 and December 27, 2016:
| Fair Value Measurements | |||||||||
(Amounts in thousands) | Level | December 26, 2017 | December 27, 2016 | |||||||
Deferred compensation plan investments | 2 | $ | 14,643 | $ | 15,054 | |||||
Deferred compensation plan liabilities | 2 | $ | (11,326 | ) | $ | (15,212 | ) | |||
During the fourth fiscal quarter of 2017, we incurred $13.4 million of impairment charges for the goodwill and indefinite-lived intangible assets of which $0.3 million is related to trade name, for our Sullivan’s reporting unit and $23.6 million in impairment charges related to one Double Eagle, four Grille and one Sullivan's locations.
The following table presents our financial assets and liabilities measured at fair value on a non-recurring basis at December 26, 2017 and December 27, 2016:
Fair Value Measurements | ||||||||||
(Amounts in thousands) | Level | December 26, 2017 | December 27, 2016 | |||||||
Long-lived assets | 3 | $ | 2,374 | $ | 235 | |||||
Goodwill | 3 | $ | 18,276 | $ | — | |||||
Trade name | 3 | $ | 16,534 | $ | — | |||||
The trade name fair value is determined by utilizing royalty-relief method for trade name, and by utilizing the best information available, which includes use of estimates, judgments, and projections for long-lived assets.
There were no transfers among levels within the fair value hierarchy during the years ended December 26, 2017 or December 27, 2016. The fair value of the credit facility at December 26, 2017 approximated its carrying value since it is a variable rate credit facility (Level 2).
We had no derivative instruments at December 26, 2017 or December 27, 2016.
12. Segment Reporting
We operate the Double Eagle, Grille and Sullivan’s brands as operating segments. The restaurant concepts operate solely in the U.S. within the full-service dining industry, providing similar products to similar customers. Sales from external customers are derived principally from food and beverage sales, and we do not rely on any major customers as a source of sales. The restaurant concepts also possess similar economic characteristics, resulting in similar long-term expected financial performance characteristics. However, as Double Eagle restaurants typically have higher revenues, driven by their larger physical presence and higher average check, the Double Eagle, Grille and Sullivan’s operating segments have varying operating income and restaurant-level EBITDA margins due to the leveraging of higher revenues on certain fixed operating costs such as management labor, rent, utilities, and building maintenance.
F- 19
The following table presents information about reportable segments for fiscal years 2017, 2016, and 2015:
| Fiscal Year Ended December 26, 2017 | |||||||||||||||||||
(Amounts in thousands) | Double Eagle | Grille | Sullivan's | Corporate | Consolidated | |||||||||||||||
Revenues | $ | 176,713 | $ | 117,114 | $ | 67,604 | $ | — | $ | 361,431 | ||||||||||
Restaurant-level EBITDA | $ | 46,909 | $ | 15,463 | $ | 10,593 | $ | — | $ | 72,965 | ||||||||||
Capital expenditures | $ | 17,810 | $ | 12,658 | $ | 8,448 | $ | 2,418 | $ | 41,334 | ||||||||||
Property and equipment | $ | 106,514 | $ | 116,878 | $ | 51,222 | $ | 5,573 | $ | 280,187 | ||||||||||
| ||||||||||||||||||||
| Fiscal Year Ended December 27, 2016 | |||||||||||||||||||
(Amounts in thousands) | Double Eagle | Grille | Sullivan's | Corporate | Consolidated | |||||||||||||||
Revenues | $ | 166,885 | $ | 106,999 | $ | 77,797 | $ | — | $ | 351,681 | ||||||||||
Restaurant-level EBITDA | $ | 46,877 | $ | 15,881 | $ | 12,182 | $ | — | $ | 74,940 | ||||||||||
Capital expenditures | $ | 17,284 | $ | 17,080 | $ | 2,489 | $ | 97 | $ | 36,950 | ||||||||||
Property and equipment | $ | 115,889 | $ | 116,451 | $ | 49,416 | $ | 2,426 | $ | 284,182 | ||||||||||
| ||||||||||||||||||||
| Fiscal Year Ended December 29, 2015 | |||||||||||||||||||
(Amounts in thousands) | Double Eagle | Grille | Sullivan's | Corporate | Consolidated | |||||||||||||||
Revenues | $ | 161,809 | $ | 90,820 | $ | 78,983 | $ | — | $ | 331,612 | ||||||||||
Restaurant-level EBITDA | $ | 45,837 | $ | 12,660 | $ | 13,070 | $ | — | $ | 71,567 | ||||||||||
Capital expenditures | $ | 11,646 | $ | 32,717 | $ | 3,644 | $ | 102 | $ | 48,109 | ||||||||||
Property and equipment | $ | 104,508 | $ | 99,371 | $ | 47,578 | $ | 2,493 | $ | 253,950 | ||||||||||
In addition to using consolidated results in evaluating our performance and allocating our resources, our chief operating decision maker uses restaurant-level EBITDA, which is not a measure defined by GAAP at both the segment and consolidated level. At the consolidated level, this non-GAAP operating measure is useful to both management and investors because it represents one means of gauging the overall profitability of our recurring and controllable core restaurant operations at a consolidated level. This measure is not, however, indicative of our overall results, nor does restaurant-level profit accrue directly to the benefit of stockholders, primarily due to the exclusion of corporate-level expenses. Restaurant-level EBITDA on a consolidated basis should not be considered a substitute for, or superior to, operating income (loss), which is calculated in accordance with GAAP, and the reconciliations to operating income (loss) set forth below should be carefully evaluated.
We define restaurant-level EBITDA as operating income (loss) before pre-opening costs, general and administrative costs, donations, consulting project costs, reorganization severance costs, lease termination and closing costs, depreciation and amortization, impairment charges and insurance settlements. Pre-opening costs are excluded because they vary in timing and magnitude and are not related to the health of ongoing operations. General and administrative costs are only included in our consolidated financial results as they are generally not specifically identifiable to individual operating segments as these costs relate to supporting all of our restaurant operations and the extension of our concepts into new markets. Donations, consulting project costs and reorganization severance costs are excluded because they are not related to the health of ongoing operations. Lease termination and closing costs, depreciation and amortization, impairment charges, and insurance settlements are excluded because they are not ongoing controllable cash expenses, and they are not related to the health of ongoing operations. Property and equipment is the only balance sheet measure used by our chief operating decision maker in allocating resources.
F- 20
The following table reconciles operating (loss) income to restaurant-level EBITDA (in thousands):
| Fiscal Year Ended | |||||||||||
(Amounts in thousands) | December 26, 2017 | December 27, 2016 | December 29, 2015 | |||||||||
Operating (loss) income | (22,169 | ) | 25,076 | 21,818 | ||||||||
Pre-opening costs | 2,182 | 3,446 | 5,228 | |||||||||
General and administrative costs | 28,421 | 25,131 | 23,111 | |||||||||
Donations | 836 | — | — | |||||||||
Consulting project costs | 2,786 | — | — | |||||||||
Reorganization severance | 1,072 | 793 | — | |||||||||
Lease termination and closing costs | 538 | 1,031 | 1,386 | |||||||||
Depreciation and amortization | 23,399 | 18,865 | 16,776 | |||||||||
Impairment charges | 37,053 | 598 | 3,248 | |||||||||
Insurance settlements | (1,153 | ) | — | — | ||||||||
Restaurant-level EBITDA | $ | 72,965 | $ | 74,940 | $ | 71,567 | ||||||
13. Earnings (Loss) Per Share
Basic earnings (loss) per share (EPS) data is computed based on the weighted average number of shares of common stock outstanding during the period. Diluted EPS data is computed based on the weighted average number of shares of common stock outstanding, including all potentially issuable shares of common stock. We incurred a net loss for fiscal 2017, and therefore, diluted shares outstanding equaled basic shares outstanding. Diluted earnings per share for fiscal 2016 and 2015 exclude stock options of 0.6 million and 0.7 million, respectively, which were outstanding during the period, but were anti-dilutive. Diluted earnings per share for fiscal 2016 and 2015 exclude 0.1 million and 0.1 million of shares restricted stock, which were outstanding during the period, but were anti-dilutive.
| Fiscal Year Ended | |||||||||||
(Amounts in thousands, except per share data) | December 26, 2017 | December 27, 2016 | December 29, 2015 | |||||||||
Net (loss) income | $ | (11,457 | ) | $ | 17,766 | $ | 15,998 | |||||
Shares: | ||||||||||||
Weighted-average common shares outstanding—basic | 21,570 | 23,322 | 23,380 | |||||||||
Effect of dilutive shares | — | 113 | 137 | |||||||||
Weighted-average common shares outstanding—diluted | 21,570 | 23,435 | 23,517 | |||||||||
| ||||||||||||
Earnings (loss) per share—basic | $ | (0.53 | ) | $ | 0.76 | $ | 0.68 | |||||
Earnings (loss) per share—diluted | $ | (0.53 | ) | $ | 0.76 | $ | 0.68 | |||||
14. Stock-Based Employee Compensation
2012 Long-Term Equity Incentive Plan
In connection with our initial public offering, we adopted the 2012 Plan, which allows our Board of Directors or a committee thereof to grant stock options, restricted stock, restricted stock units, deferred stock units and other equity-based awards to directors, officers, key employees and other key individuals performing services for us. The 2012 Plan provides for granting of options to purchase shares of common stock at an exercise price not less than the fair value of the stock on the date of grant. Outstanding stock options vest at various periods ranging from one to four years from date of grant. Outstanding shares of restricted stock vest over periods ranging from one to four years. The 2012 Plan has 2,232,800 shares authorized for issuance under the plan. There are 589,300 shares of common stock issuable upon exercise of currently outstanding options, 497,695 outstanding shares of restricted stock, restricted stock units and performance stock units, which includes 200,000 performance stock units related to the CEO 2016 grant, at December 26, 2017. There are 928,293 shares available for future grants.
F- 21
The following table details our total stock based compensation costs during the fiscal years ended December 26, 2017, December 27, 2016 and December 29, 2015, as well as where the costs were expensed:
| Fiscal Year Ended | |||||||||||
(Amounts in thousands) | December 26, 2017 | December 27, 2016 | December 29, 2015 | |||||||||
Restaurant operating expenses | $ | 226 | $ | 361 | $ | 468 | ||||||
General and administrative costs | 2,593 | 2,305 | 2,432 | |||||||||
Total stock compensation cost | $ | 2,819 | $ | 2,666 | $ | 2,900 | ||||||
Stock Options, Restricted Stock, Restricted Stock Units, and Performance Stock Units
The following table summarizes restricted stock, restricted stock unit, and performance stock unit activity during fiscal 2017:
| Fiscal Year Ended December 26, 2017 | ||||||||||
(Amounts in thousands, except per share amounts) | Shares | Weighted average grant date fair value per share ($) | Aggregate intrinsic value ($) | ||||||||
Outstanding at beginning of period | 346 | $ | 12.57 | ||||||||
Granted | 299 | 17.19 | |||||||||
Vested | (49 | ) | 17.41 | ||||||||
Forfeited | (98 | ) | 17.50 | ||||||||
Outstanding at end of period | 498 | $ | 13.90 | $ | 7,689 | ||||||
As of December 26, 2017, there was $4.3 million of total unrecognized compensation cost related to non-vested restricted stock, restricted stock units and performance stock units. This cost is expected to be recognized over a period of approximately 1.9 years.
The following table summarizes stock option activity during fiscal 2017:
| Fiscal Year Ended December 26, 2017 | ||||||||||||
(Amounts in thousands, except per share amounts) | Shares | Weighted average exercise price ($) | Weighted average remaining contractual term | Aggregate intrinsic value ($000's) | |||||||||
Outstanding at beginning of period | 928 | $ | 18.33 | ||||||||||
Exercised | (137 | ) | 13.00 | ||||||||||
Forfeited | (202 | ) | 21.34 | ||||||||||
Outstanding at end of period | 589 | $ | 18.53 | 5.3 years | $ | 450 | |||||||
Options exercisable at end of period | 582 | $ | 18.48 | 5.3 years | $ | 450 | |||||||
The intrinsic value of options exercised during fiscal 2017 was $0.3 million. A summary of the status of non-vested stock options as of December 26, 2017 and changes during fiscal 2017 is presented below:
| Fiscal Year Ended | ||||||
| December 26, 2017 | ||||||
(Amounts in thousands, except per share amounts) | Shares | Weighted average grant-date fair value per share ($) | |||||
Non-vested stock options at beginning of period | 152 | $ | 8.44 | ||||
Vested | (41 | ) | 8.50 | ||||
Forfeited | (104 | ) | 8.39 | ||||
Non-vested stock options at end of period | 7 | $ | 8.93 | ||||
As of December 26, 2017, there was a nominal amount of unrecognized compensation cost related to non-vested stock options. This cost is expected to be recognized over a period of approximately 0.6 years. The total fair value of stock options vested during fiscal 2017 was $0.9 million.
F- 22
We issue performance share units, or PSUs, to certain employees that represent shares potentially issuable in the future. During fiscal 2016, we granted 200,000 PSUs to our CEO. The issuance of these shares is based upon our stock price reaching $28.00 per share for five days consecutively no later than December 31, 2022 and is subject to post vesting holding periods. The fair value of performance share units was calculated using a Monte Carlo simulation model, which requires the use of highly subjective and complex assumptions, including the expected life of the award, the price volatility of the underlying stock and a blended illiquidity discount of 16.9%. The weighted average grant date fair value was $8.98 for the years ended December 26, 2017 and December 27, 2016. The aggregate intrinsic value was $3.5 million for the year ended December 26, 2017.
The expense recognized each period is dependent on our estimate of the number of shares that will ultimately be issued. As of December 26, 2017 there was $0.9 million of total unrecognized compensation cost related to non-vested PSUs. This cost is expected to be recognized over a period of approximately 1.1 years.
The following table details the values from and assumptions for the Monte Carlo PSU pricing model for PSUs granted during the fiscal 2016.
| 2016 | |
Weighted average grant date fair value | $8.98 | |
Weighted average risk-free interest rate | 1.98% | |
Derived service period in years | 2.2 | |
Weighted average volatility | 34.41% | |
Expected dividend | — | |
15. Quarterly Financial Information (Unaudited)
The following tables set forth certain unaudited consolidated financial information for each of the four quarters in fiscal 2017 and fiscal 2016.
| Fiscal Year Ended December 26, 2017 | |||||||||||||||||||
| First | Second | Third | Fourth | ||||||||||||||||
(Amounts in thousands, except per share data) | Quarter | Quarter | Quarter | Quarter | Total Year | |||||||||||||||
Revenues | $ | 83,890 | $ | 82,301 | $ | 73,343 | $ | 121,897 | $ | 361,431 | ||||||||||
Operating income (loss) | $ | 4,408 | $ | 2,933 | $ | (2,179 | ) | $ | (27,331 | ) | $ | (22,169 | ) | |||||||
Net income (loss) | $ | 3,310 | $ | 2,090 | $ | (1,776 | ) | $ | (15,081 | ) | $ | (11,457 | ) | |||||||
Basic income (loss) per common share | $ | 0.14 | $ | 0.10 | $ | (0.08 | ) | $ | (0.73 | ) | $ | (0.53 | ) | |||||||
Basic weighted average shares outstanding | 23,059 | 21,722 | 21,103 | 20,690 | 21,570 | |||||||||||||||
| ||||||||||||||||||||
Diluted income (loss) per common share | $ | 0.14 | $ | 0.09 | $ | (0.08 | ) | $ | (0.73 | ) | $ | (0.53 | ) | |||||||
Diluted weighted average shares outstanding | 23,276 | 22,061 | 21,103 | 20,690 | 21,570 | |||||||||||||||
| Fiscal Year Ended December 27, 2016 | |||||||||||||||||||
| First | Second | Third | Fourth | ||||||||||||||||
(Amounts in thousands, except per share data) | Quarter | Quarter | Quarter | Quarter | Total Year | |||||||||||||||
Revenues | $ | 81,194 | $ | 79,916 | $ | 71,407 | $ | 119,164 | $ | 351,681 | ||||||||||
Operating income | $ | 7,879 | $ | 6,325 | $ | 1,118 | $ | 9,754 | $ | 25,076 | ||||||||||
Net income | $ | 5,411 | $ | 4,444 | $ | 786 | $ | 7,125 | $ | 17,766 | ||||||||||
Basic income per common share | $ | 0.23 | $ | 0.19 | $ | 0.03 | $ | 0.31 | $ | 0.76 | ||||||||||
Basic weighted average shares outstanding | 23,315 | 23,350 | 23,354 | 23,282 | 23,322 | |||||||||||||||
| ||||||||||||||||||||
Diluted income per common share | $ | 0.23 | $ | 0.19 | $ | 0.03 | $ | 0.30 | $ | 0.76 | ||||||||||
Diluted weighted average shares outstanding | 23,398 | 23,437 | 23,431 | 23,415 | 23,435 | |||||||||||||||
F- 23
During the fourth fiscal quarter of 2017, we incurred $13.4 million of impairment charges for the goodwill and indefinite-lived intangible assets of which $0.3 million is related to trade name, for our Sullivan’s reporting unit and $23.6 million in impairment charges related to one Double Eagle, four Grille and one Sullivan's locations. The decrease in the effective tax rate was primarily attributable to permanent differences as a result of goodwill impairment and TCJA which permanently reduced the maximum federal corporate income tax rate from 35% to 21% effective for tax years beginning after December 31, 2017. During the second quarter of 2017, we incurred approximately $0.5 million in lease termination costs associated with two Sullivan's locations and $1.1 million in reorganization severance costs.
During the fourth fiscal quarter of 2016, we incurred $0.6 million in impairment charges related to two Sullivan’s locations, $0.9 million in lease termination costs associated with one Sullivan’s location and $0.8 million in reorganization severance costs. In the third fiscal quarter of 2016, we incurred $0.4 million in expenses to settle an easement claim related to the sale of the previous Dallas, Texas Del Frisco’s location.
In management’s opinion, the unaudited quarterly information shown above has been prepared on the same basis as the audited consolidated financial statements and includes all necessary adjustments that management considers necessary for a fair presentation of the unaudited quarterly results when read in conjunction with the consolidated financial statements and the accompanying notes. We believe that quarter-to-quarter comparisons of our financial results are not necessarily indicative of future performance.
F- 24