Attached files
| file | filename |
|---|---|
| EX-99.3 - EX-99.3 - GRAFTECH INTERNATIONAL LTD | a2235002zex-99_3.htm |
| EX-99.2 - EX-99.2 - GRAFTECH INTERNATIONAL LTD | a2235002zex-99_2.htm |
| EX-99.1 - EX-99.1 - GRAFTECH INTERNATIONAL LTD | a2235002zex-99_1.htm |
| EX-23.1 - EX-23.1 - GRAFTECH INTERNATIONAL LTD | a2235002zex-23_1.htm |
| EX-10.15 - EX-10.15 - GRAFTECH INTERNATIONAL LTD | a2235002zex-10_15.htm |
| EX-4.2 - EX-4.2 - GRAFTECH INTERNATIONAL LTD | a2235002zex-4_2.htm |
| EX-4.1 - EX-4.1 - GRAFTECH INTERNATIONAL LTD | a2235002zex-4_1.htm |
| EX-3.4 - EX-3.4 - GRAFTECH INTERNATIONAL LTD | a2235002zex-3_4.htm |
| EX-3.2 - EX-3.2 - GRAFTECH INTERNATIONAL LTD | a2235002zex-3_2.htm |
| EX-1.0 - EX-1.0 - GRAFTECH INTERNATIONAL LTD | a2235002zex-1_0.htm |
Use these links to rapidly review the document
Table of contents
Index to financial statements
As filed with the Securities and Exchange Commission on March 23, 2018.
Registration No. 333-223791
UNITED STATES
SECURITIES AND EXCHANGE COMMISSION
Washington, D.C. 20549
Amendment No. 1 to
FORM S-1
REGISTRATION STATEMENT
UNDER
THE SECURITIES ACT OF 1933
GRAFTECH INTERNATIONAL LTD.
(Exact name of registrant as specified in its charter)
| Delaware (State or other jurisdiction of incorporation or organization) |
3620 (Primary Standard Industrial Classification Code Number) |
27-2496053 (I.R.S. Employer Identification No.) |
982 Keynote Circle
Brooklyn Heights, OH 44131
(216) 676-2000
(Address, including zip code, and telephone number,
including area code, of registrant's principal executive offices)
David J. Rintoul
Chief Executive Officer
GrafTech International Ltd.
982 Keynote Circle
Brooklyn Heights, OH 44131
(216) 676-2000
(Name, address, including zip code, and telephone number,
including area code, of agent for service)
| (Copies of all communications, including communications sent to agent for service) | ||
Sandra L. Flow, Esq. Adam Fleisher, Esq. Cleary Gottlieb Steen & Hamilton LLP One Liberty Plaza New York, New York 10006 (212) 225-2000 |
William V. Fogg, Esq. D. Scott Bennett, Esq. Cravath, Swaine & Moore LLP 825 Eighth Avenue New York, New York 10019 (212) 474-1000 |
|
Approximate date of commencement of proposed sale to the public: As soon as practicable after this registration statement becomes effective.
If any of the securities being registered on this Form are to be offered on a delayed or continuous basis pursuant to Rule 415 under the Securities Act of 1933 check the following box: o
If this Form is filed to register additional securities for an offering pursuant to Rule 462(b) under the Securities Act, check the following box and list the Securities Act registration statement number of the earlier effective registration statement for the same offering. o
If this Form is a post-effective amendment filed pursuant to Rule 462(c) under the Securities Act, check the following box and list the Securities Act registration statement number of the earlier effective registration statement for the same offering. o
If this Form is a post-effective amendment filed pursuant to Rule 462(d) under the Securities Act, check the following box and list the Securities Act registration statement number of the earlier effective registration statement for the same offering. o
Indicate by check mark whether the registrant is a large accelerated filer, an accelerated filer, a non-accelerated filer, a smaller reporting company or an emerging growth company. See the definitions of "large accelerated filer," "accelerated filer," "smaller reporting company" and "emerging growth company" in Rule 12b-2 of the Exchange Act. (Check one):
| Large accelerated filer o | Accelerated filer o | Non-accelerated filer ý (Do not check if a smaller reporting company) |
Smaller reporting company o Emerging growth company ý |
If an emerging growth company, indicate by check mark if the registrant has elected not to use the extended transition period for complying with any new or revised financial accounting standards provided pursuant to Section 7(a)(2)(B) of the Securities Act. ý
CALCULATION OF REGISTRATION FEE
|
||||
| Title of each class of securities to be registered |
Proposed maximum aggregate offering price(1)(2) |
Amount of registration fee(2)(3) |
||
|---|---|---|---|---|
Common stock, $0.01 par value per share |
$100,000,000 | $12,450 | ||
|
||||
(1) Includes shares of common stock to be sold by the selling stockholder and shares to be sold upon exercise of the underwriters' overallotment option.
(2) Estimated solely for the purpose of calculating the registration fee pursuant to Rule 457(o) under the Securities Act of 1933, as amended (or the Securities Act).
(3) Previously paid.
The registrant hereby amends this registration statement on such date or dates as may be necessary to delay its effective date until the registrant shall file a further amendment which specifically states that this registration statement shall thereafter become effective in accordance with Section 8(a) of the Securities Act or until the registration statement shall become effective on such date as the Securities and Exchange Commission, acting pursuant to said Section 8(a), may determine.
Subject to completion, dated , 2018
The information in this prospectus is not complete and may be changed. We may not sell these securities until the registration statement filed with the Securities and Exchange Commission is effective. This prospectus is not an offer to sell these securities and it is not soliciting an offer to buy these securities in any jurisdiction where the offer or sale is not permitted.
Preliminary Prospectus
shares

Common stock
This is an initial public offering of common stock of GrafTech International Ltd. The selling stockholder identified in this prospectus is selling share s of our common stock. We will not receive any of the proceeds from the sale of shares of our common stock by the selling stockholder.
This is our initial public offering and no public market currently exists for our common stock. The estimated initial public offering price is between $ and $ per share. We have applied to list our common stock on the New York Stock Exchange (NYSE) under the symbol "EAF."
We are an "emerging growth company" as defined in Section 2(a) of the Securities Act of 1933, as amended (or the Securities Act) and will be subject to reduced public company reporting requirements. See "Prospectus Summary—Implications of Being an Emerging Growth Company."
Investing in our common stock involves risks. See "Risk Factors" beginning on page 26.
| | | | | | | | |
| |
Per share |
Total |
|||||
|---|---|---|---|---|---|---|---|
| | | | | | | | |
Public offering price |
$ | $ | |||||
Underwriting discount(1) |
$ |
$ |
|||||
Proceeds to the selling stockholder |
$ |
$ |
|||||
| | | | | | | | |
(1) See "Underwriting" beginning on page 167 of the prospectus for additional information regarding total underwriting compensation. The underwriters will not receive an underwriting discount or commission on the sale of our common stock to certain independent director nominees, which allocation will be made at our direction. The selling stockholder will receive the full public offering price for such shares. See "Certain relationships and related party transactions—Participation in our Initial Public Offering" for additional information regarding the sale of our common stock to certain independent director nominees.
The selling stockholder has granted the underwriters the right to purchase up to add itional shares of common stock at the public offering price less underwriting discounts and commissions, for the purpose of covering overallotments.
The underwriters expect to deliver the shares of common stock to investors on or about , 2018.
Neither the Securities and Exchange Commission (or SEC) nor any state securities commission has approved or disapproved of these securities or determined if this prospectus is truthful or complete. Any representation to the contrary is a criminal offense.
| J.P. Morgan | Credit Suisse |
| Citigroup | RBC Capital Markets | HSBC |
BMO Capital Markets
The date of this prospectus is , 2018.
We are responsible for the information contained in this prospectus and in any related free-writing prospectus we may prepare or authorize to be delivered to you. We have not authorized anyone to give you any other information, and we take no responsibility for any other information that others may give you. We and the selling stockholder are not, and the underwriters are not, making an offer of these securities in any jurisdiction where the offer is not permitted. You should not assume that the information contained in this prospectus is accurate as of any date other than the date on the front of this prospectus.
i
Market and industry data and forecasts
Certain market and industry data included in this prospectus has been obtained from third party sources that we believe to be reliable. Market estimates are calculated by using independent industry publications, government publications and third party forecasts in conjunction with our assumptions about our markets. We have not independently verified such third party information. While we are not aware of any misstatements regarding any market, industry or similar data presented herein, such data involves risks and uncertainties and is subject to change based on various factors, including those discussed under the headings "Special Note Regarding Forward-Looking Statements" and "Risk Factors" in this prospectus.
Trademarks
We own or otherwise have rights to the trademarks, service marks, copyrights and trade names, including those mentioned in this prospectus, used in conjunction with the marketing and sale of our products and services. This prospectus includes trademarks, which are protected under applicable intellectual property laws and are our property and/or the property of our subsidiaries. This prospectus may also contain trademarks, service marks, copyrights and trade names of other companies, which are the property of their respective owners. We do not intend our use or display of other companies' trademarks, service marks, copyrights or trade names to imply a relationship with, or endorsement or sponsorship of us by, any other companies. Solely for convenience, our trademarks, service marks and trade names referred to in this prospectus may appear without the ®, ™, or SM symbols, but such references are not intended to indicate, in any way, that we will not assert, to the fullest extent under applicable law, our rights to these trademarks, service marks and trade names.
ii
This summary highlights information contained elsewhere in this prospectus. It may not contain all the information that may be important to you. You should read the entire prospectus carefully, including the section entitled "Risk Factors" and our financial statements and the related notes included elsewhere in this prospectus, before making an investment decision to purchase shares of our common stock.
Unless the context suggests otherwise, references in this prospectus to "GrafTech," the "Company," "we," "us," and "our" refer to GrafTech International Ltd., a Delaware corporation, and its consolidated subsidiaries. See "Our company" below for more information. References in this prospectus to the "selling stockholder" refer to BCP IV GrafTech Holdings LP, an affiliate of Brookfield Asset Management Inc. and Brookfield Business Partners L.P., and the direct owner of GrafTech. References in this prospectus to "Brookfield" refer to Brookfield Asset Management Inc. and its affiliates. All dollar amounts in this prospectus are in U.S. dollars and are expressed in thousands unless specified otherwise. The financial statements have been prepared in accordance with generally accepted accounting principles in the United States (or GAAP).
Our company
We are a leading manufacturer of high quality graphite electrode products essential to the production of electric arc furnace (or EAF) steel and other ferrous and non-ferrous metals. We believe that we have the most competitive portfolio of low-cost graphite electrode manufacturing facilities in the industry, including three of the five highest capacity facilities in the world (excluding China). We are the only large scale graphite electrode producer that is substantially vertically integrated into petroleum needle coke, the primary raw material for graphite electrode manufacturing, which is currently in limited supply. This unique position provides us with competitive advantages in product quality and cost. Founded in 1886, we have over 125 years of experience in the research and development (or R&D) of graphite- and carbon-based solutions, and our intellectual property portfolio is extensive. We currently have graphite electrode manufacturing facilities in Calais, France, Pamplona, Spain, Monterrey, Mexico and St. Marys, Pennsylvania. Our customers include major steel producers and other ferrous and non-ferrous metal producers in Europe, the Middle East and Africa (or EMEA), the Americas and Asia-Pacific (or APAC), which sell their products into the automotive, construction, appliance, machinery, equipment and transportation industries. Our vision is to be the lowest cost, highest quality producer of graphite electrodes while providing the best customer service. Based on the high quality of our graphite electrodes, reliability of our petroleum needle coke supply and our excellent customer service, we believe that we are viewed as the preferred supplier to the global EAF steel producer market.
Graphite electrodes are an industrial consumable product used primarily in EAF steel production, one of the two primary methods of steel production and the steelmaking technology used by all "mini-mills." Electrodes act as conductors of electricity in the furnace, generating sufficient heat to melt scrap metal, iron ore or other raw materials used to produce steel or other metals. We estimate that, on average, the cost of graphite electrodes represents only approximately 1% to 5% of the total production cost of steel in a typical EAF, but they are essential to EAF steel production. Graphite electrodes are currently the only known commercially available products that have the high levels of electrical conductivity and the capability to sustain the high levels of heat generated in EAF steel production. As a result, EAF steel manufacturers have been willing to pay a premium for a reliable supply of high quality graphite electrodes, and, in some cases, to pass on this premium to their customers in the form of surcharges. Graphite
1
electrodes are also used in steel refining in ladle furnaces and in other processes, such as the production of titanium dioxide, stainless steel, aluminum, silicon metals and other ferrous and non-ferrous metals.
Petroleum needle coke, a crystalline form of carbon derived from decant oil, is the primary raw material used in the production of graphite electrodes. We achieved substantial vertical integration with this critical raw material source through our acquisition of Seadrift Coke LP (or Seadrift) in November 2010, significantly reducing our reliance on other suppliers. The petroleum needle coke industry is highly concentrated, with what we believe to be the largest producer, Phillips 66, controlling approximately 50% of capacity. We believe Seadrift is the second largest petroleum needle coke producer in the world. We also believe that the quality of Seadrift's petroleum needle coke is superior for graphite electrode production compared to most of the petroleum needle coke available to our peers on the open market, allowing us to produce higher quality electrodes in a cost-efficient manner. Additionally, we believe that this vertical integration provides a significant cost advantage relative to our competitors in periods of tight petroleum needle coke supply, such as the current market environment. We believe this cost advantage will grow as demand for petroleum needle coke increases for use in lithium-ion batteries in electric vehicles. The demand for petroleum needle coke in lithium-ion batteries is growing rapidly, with usage going from approximately 1,000 MT in 2014 to 60,000 MT in 2017 (representing approximately 9% of 2017 petroleum needle coke demand). This rapidly growing alternative source of demand is a significant development for the petroleum needle coke industry and is contributing to the global shortage in petroleum needle coke.
According to the World Steel Association (or WSA), EAFs accounted for 45%, or 367 million metric tons (or MT), of global crude steel production (excluding China) in 2016. Between 1984 and 2011, EAF steelmaking was the fastest-growing segment of the steel sector, with production increasing at an average rate of 3.5% per year, based on WSA data. Historically, EAF steel production has grown faster than the overall steel market due to the greater resilience, more variable cost structure, lower capital intensity and more environmentally friendly nature of EAF steelmaking. This trend was partially reversed between 2011 and 2015 due to global steel production overcapacity driven largely by Chinese blast furnace (or BOF) steel production. Beginning in 2016, efforts by the Chinese government to restructure China's domestic steel industry have led to limits on Chinese BOF steel production and lower export levels. In addition, developed economies, which typically have much larger EAF steel industries, have instituted a number of trade policies in support of domestic steel producers. As a result, since 2016, the EAF steel market has rebounded strongly and resumed its long-term growth trajectory. This revival in EAF steel production has resulted in increased demand for our graphite electrodes.
At the same time, two supply-side structural changes have contributed to recent record high prices of graphite electrodes. First, ongoing consolidation and rationalization of graphite electrode production capacity have limited the ability of graphite electrode producers to meet demand. We estimate that approximately 20% of graphite electrode industry production capacity (excluding China) has been closed or repurposed since the beginning of 2014, and we believe the majority of these closures represent permanent reductions. Second, demand for petroleum needle coke has outpaced supply due to increasing demand for petroleum needle coke for lithium-ion batteries used in electric vehicles. As a result, graphite electrode prices have recently reached record high prices. Historically, between 2006 and 2016, our weighted average realized price of graphite electrodes was approximately $4,500 per MT (on an inflation-adjusted basis using constant 2017 dollars) and fell to a historic low of approximately $2,500 per MT in 2016. With the renewed demand for, and constrained supply of, graphite electrodes, industry spot prices reached record levels of as high as $15,000 to $30,000 per MT in the first quarter of 2018. In light of improved market conditions, the long lead time required to produce our products, our position as one of the market's largest producers and our ability, through our substantial vertical integration with Seadrift, to
2
provide customers with a reliable long-term supply of graphite electrodes despite the market shortage of petroleum needle coke, we have implemented a new commercial strategy to sell 60% to 65% of our production capacity to our strategic customers through three- to five-year take-or-pay contracts.
GrafTech historical weighted average realized prices and signed three- to five-year weighted average contract prices for graphite electrodes
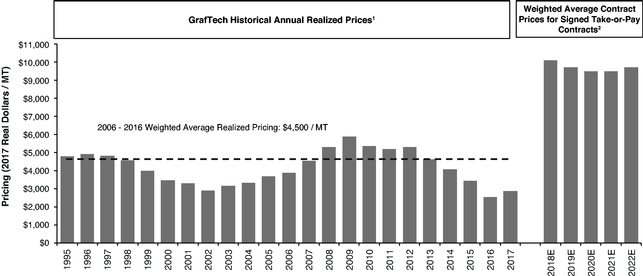
(1) Weighted average realized price for a period reflects the total revenues from sales of graphite electrodes for the period divided by the graphite electrode sales volume for that period. The weighted average realized prices in this chart are shown in constant 2017 dollars for comparability. See "Management's Discussion and Analysis of Financial Condition and Results of Operations—Key Operating Metrics."
(2) Weighted average contract price for a period reflects the volume-weighted average price for graphite electrodes to be delivered under the three- to five-year take-or-pay contracts we have entered into as of March 1, 2018. All of these contracts have fixed prices and either fixed volumes (85% of the portfolio) or a specified volume range (15% of the portfolio). For those contracts with a specified volume range, weighted average contract prices are computed using the volume midpoint. The aggregate difference between the volume midpoint and the minimum and maximum volumes across our cumulative portfolio of take-or-pay contracts with specified volume ranges is approximately 5,000 MT per year in 2019-2022. See "Business—Contracts and Customers."
As a leading producer of graphite electrodes, we believe we are well-positioned to benefit from this industry transformation. In 2017, based on our three currently operating facilities, we had the capability, depending on product demand and mix, to manufacture approximately 167,000 MT of graphite electrodes per year. We are also in the process of an operational improvement and debottlenecking initiative and are on target to grow our production capacity at these facilities by approximately 21% to approximately 202,000 MT of production capacity by the end of 2018. If we were then to restart our currently idled St. Marys facility, our overall production capacity would increase by another approximately 14% to 230,000 MT per year. This total production capacity would be comparable to our largest competitor, which we estimate currently has a total of approximately 230,000 MT of production capacity (excluding China). We believe the total worldwide graphite electrode production capacity was approximately 800,000 MT (excluding China), with a capacity utilization of approximately 90% (excluding China), in 2017. Electrode production globally (excluding China) is focused on the manufacture of ultra-high power (or UHP) electrodes for EAFs, while the majority of Chinese production is of ladle electrodes for BOFs. The production of UHP electrodes requires an extensive proprietary manufacturing process and material science knowledge, including the use of superior needle coke blends. As a result, graphite electrode producers inside and outside of China are generally not in direct competition with each other for major product lines.
On August 15, 2015, we became an indirect wholly owned subsidiary of Brookfield through a tender offer to shareholders and subsequent merger transaction. Brookfield is an experienced operator of industrial,
3
natural resource and other tangible asset businesses. This transaction has provided us with a stable equity partner with experience in industrial sectors.
Our executive offices are located at 982 Keynote Circle, Brooklyn Heights, Ohio 44131 and our telephone number is (216) 676-2000. Our Internet website address is www.graftech.com. Information on, or accessible through, our website is not part of this prospectus. We have included our website address only as an inactive textual reference and do not intend it to be an active link to our website.
Key developments
Three major developments have repositioned GrafTech and the graphite electrode industry for long-term growth and significantly improved our financial and operating results:
- •
- the restructuring and repositioning of GrafTech;
- •
- the return of the EAF steel industry to long-term growth, leading to improved demand for graphite electrodes; and
- •
- structural changes in the graphite electrode and petroleum needle coke industries.
We have restructured and repositioned GrafTech for a sustainable leadership position in the graphite electrode industry
Since 2012, we have executed a three-part transformation plan to improve our competitive position and allow us to better serve our customers.
We have achieved annual fixed manufacturing cost improvements and capital expenditure reductions of approximately $190 million since 2012, while also improving the productivity of our plant network
We have strategically shifted production from our lowest to our highest production capacity facilities to increase fixed cost absorption. In 2018, we expect to produce a greater quantity of graphite electrodes from our three operating facilities in Calais, France, Pamplona, Spain and Monterrey, Mexico, than we did from our six operating facilities in 2012. As a result, we have achieved significant operating leverage at higher capacity utilizations. In our experience, high capacity manufacturing facilities can have operating costs of more than $1,000 per MT lower than low capacity manufacturing facilities. In addition, we have streamlined fixed costs across our plant network, including a 50% headcount reduction at Seadrift since 2014 and an optimization of Seadrift's systems and manufacturing process to reduce capital expenditure requirements. As a result of these actions, by the end of 2016, we had reduced our annual fixed manufacturing costs by approximately $80 million and our maintenance capital expenditure requirements by approximately $45 million since 2012.
By the end of 2016, we had also reduced our annual overhead expenses by approximately $65 million since 2012 by simplifying our corporate structure from a conglomerate model to a centralized business focused exclusively on the production of graphite electrodes and petroleum needle coke. In addition, we have streamlined and combined our workforce and various administrative functions for efficiency, and eliminated R&D functions unrelated to graphite electrodes.
In addition to our fixed cost reductions, we have been able to achieve significant productivity improvements and variable cost reductions across our plants since 2014. We have improved our manufacturing processes and made strategic investments across our plant network, which have improved productivity, including improvements of approximately 20% at both our Seadrift and Monterrey plants,
4
while also reducing our energy and raw material consumption. Our more efficient graphite electrode plants produced at record breaking levels in 2017. In 2017, the Calais and Pamplona plants exceeded previous annual record production levels by 15% and 12%, respectively, and production at the Monterrey plant was 12% higher than the highest annual production level during the past 10 years. We have achieved these production increases by exploiting latent capacity in our plants, which historically have had uneven levels of capacity across each manufacturing process step, by removing artificial constraints on cycle times and improving scheduling processes. The next stage of our operational improvement and debottlenecking initiative is a small capital program concentrated on the graphitizing stage of production at our plants, which we expect will increase our current operating capacity by approximately 21%, or 35,000 MT, by the end of 2018, allowing us to achieve further improvements in our cost structure. As a result of our prior operational improvement activities, we are able to achieve this large capacity increase with specific, highly targeted capital investments. We expect the capital investment for this initiative to be $37 million. We believe that the optimization of our plant network will continue to drive improved fixed cost absorption and meaningfully lower variable costs.
We have reoriented our commercial strategy
In light of improved market conditions, the long lead time required to produce our products, our position as one of the market's largest producers and our ability, through our substantial vertical integration with Seadrift, to provide customers with a reliable long-term supply of graphite electrodes despite the market shortage of petroleum needle coke, we have implemented a new commercial strategy to sell approximately 60% to 65% of our production capacity to our strategic customers through three- to five-year take-or-pay contracts. These contracts define volumes and prices, along with price-escalation mechanisms for inflation, and include significant termination payments (typically, 50% to 70% of remaining contracted revenue) and, in certain cases, parent guarantees and collateral arrangements to manage our customer credit risk. These new commercial initiatives have led to approximately 636,000 MT, or 60% to 65% of our cumulative production capacity from 2018 to 2022, being contracted as of March 1, 2018. Approximately 132,000 MT of this contracted volume is for 2018. Together with sales volume committed by purchase orders, approximately 96% of our 2018 production capacity is contracted or committed by purchase orders. For future years, our strategy is to retain approximately 35% to 40% of our production capacity for sales on a shorter term or spot basis. Prices in the spot market have currently reached a level three to six times higher than our historical weighted average realized price of $4,500 per MT (on an inflation-adjusted basis using constant 2017 dollars) between 2006 and 2016. We expect the incremental volume from our operational improvement and debottlenecking initiative to be available to customers on a spot basis, further increasing our exposure to spot prices. Seadrift produces sufficient needle coke to supply 100% of the graphite electrode production that we have contracted under our new take-or-pay contracts. In the first quarter of 2018, the estimated cost of goods sold (excluding depreciation) for electrodes produced with Seadrift needle coke is approximately $2,600/MT and the estimated variable cost (excluding needle coke and decant oil) is approximately $1,150/MT. To align with our three- to five-year contract profile, we have hedged the decant oil required to produce all of the graphite electrodes sold under these contracts, providing us with substantial visibility into our future raw material costs. We intend to match the volume and term of our shorter term and spot sales with our third party needle coke purchases. As our currently operating facilities are now operating at or near full production capacity, we also have reviewed our product portfolio and restructured our sales force incentives to maximize the profitability of our product mix.
5
We are focused on being the industry's leading producer of the highest performing electrodes
The divestiture of our non-core legacy Engineered Solutions businesses in 2016 and 2017 has allowed our management team to focus on our core competency of graphite electrode production and generated approximately $60 million in cash proceeds and release of working capital. By focusing our management's attention and R&D spending exclusively on the graphite electrode business, we have been able to meaningfully improve the quality of our graphite electrodes, repositioning ourselves as an industry quality leader and improving our relationships with strategic customers. Our focus on improving the quality of petroleum needle coke through R&D has led to our petroleum needle coke production at Seadrift now being best-in-class for use in the manufacturing of highly durable UHP electrodes. Our customers have responded favorably to the increased quality of our graphite electrodes, and we have increased our market share with leading EAF steel manufacturers as a result.
The EAF steel industry has strengthened, improving demand for our graphite electrodes
Historically, EAF steel production has grown faster than the overall steel market due to the greater resilience, more variable cost structure, lower capital intensity and more environmentally friendly nature of EAF steelmaking. This trend was partially reversed between 2011 and 2015 due to global steel production overcapacity driven largely by Chinese BOF steel production. Beginning in 2016, efforts by the Chinese government to eliminate excess steelmaking production capacity and improve environmental and health conditions have led to limits on Chinese BOF steel production, including the closure of over 200 million MT of its steel production capacity, based on data from S&P Global Platts and the Ministry of Commerce of the People's Republic of China. In 2017, Chinese steel exports fell by more than 30% from 2016, including 17 consecutive months of year-over-year declines, according to the National Bureau of Statistics of China. Reflecting the reduction in steelmaking production capacity, as of October 2017, Chinese steel imports had increased significantly year-over-year, including a 64% year-over-year increase in semi-finished steel billet imports. Further, developed economies, which typically have much larger EAF steel industries, have instituted a number of trade policies in support of domestic steel producers. Declining Chinese steel exports and increasing steel imports should provide additional opportunity for EAF producers outside of China to increase production, thereby increasing demand for graphite electrodes.
We estimate that in 2017, EAF steel production grew at an annual pace of at least 8% to 10% compared with 5% for steelmaking overall. We believe EAF steel producers will continue to take market share from BOF steel producers. As of 2016, according to the WSA, EAF steel production had grown to 67% of total U.S. steel production from 47% in 2000, 44% of total EMEA steel production from 33% in 2000 and 40% of total APAC (excluding China) steel production from 36% in 2000. Over the same period, global EAF production increased from 287 million MT in 2000 to 418 million MT in 2016, while non-EAF steel production (excluding China) was flat at 453 million MT in both 2000 and 2016.
We estimate that at least 105 new EAFs, reflecting 66 million MT of new annual steelmaking production capacity, have been installed or have commenced construction in China in 2017, compared to only 52 million MT of Chinese EAF steel production in 2016. As a result of significantly increased steel production since 2000, the supply of Chinese scrap has increased substantially, providing the Chinese EAF steel manufacturing industry with local scrap feedstock that was not historically available. We believe continued Chinese government environmental actions and an increasing domestic scrap supply will support the ongoing global shift towards EAF steelmaking. Assuming completion of new EAF construction and full EAF capacity utilization, we estimate total graphite electrode demand in China could increase in 2018 by over 100,000 MT from 2017.
6
The recent restructuring of the graphite electrode industry and changes in the petroleum needle coke industry have reduced supply as demand is recovering
Significant amounts of graphite electrode industry production capacity have recently been removed from the market globally. We estimate that approximately 20% of industry production capacity (excluding China) has been closed or repurposed since the beginning of 2014. Some of these closed manufacturing facilities have sold off equipment, been demolished, undertaken long-term environmental remediation or been repurposed for other manufacturing uses. Accordingly, we believe the majority of these closures represent permanent reductions. As part of this overall industry rationalization, we permanently shut down two plants and temporarily idled our St. Marys plant, reducing our electrode manufacturing from six operating facilities in 2012 to three operating facilities in 2017. Also, in October 2017, the third largest graphite electrode producer acquired the second largest producer.
Further affecting the availability of graphite electrodes, supplies of petroleum needle coke and coal tar (or pitch) needle coke, a less favorable substitute for petroleum needle coke, have been limited starting in the second half of 2017. Demand for petroleum needle coke has outpaced supply due to increasing demand for petroleum needle coke in the production of lithium-ion batteries used in electric vehicles. Supply of pitch for pitch needle coke production has fallen as a result of decreasing coke production for the BOF steel industry. These graphite electrode supply constraints have coincided with the recovery in EAF demand for graphite electrodes, resulting in stronger market conditions for our products.
7
The table below summarizes these key changes in the industry.
| |
|
|
|
|||
|---|---|---|---|---|---|---|
| | | | | | | |
| |
2011 - 2015 |
2017 |
|
|||
| | | | | | | |
EAF Steel Industry |
EAF steel production declined approximately 10% from 2011 to 2015 after growing faster than the overall steel market for more than 25 years. • China net exports of BOF steel displaced EAF production worldwide. |
EAFs regained market share and resumed faster growth than the overall steel market. • China steel exports are down more than 30% in 2017 from 2016 and are continuing to fall, according to the National Bureau of Statistics of China. |
||||
Graphite Electrodes |
Oversupply driven by historic trough in demand and production capacity additions. • We estimate global production capacity (excluding China) was approximately 1,000,000 MT at 30 plants in 2013. |
We estimate that approximately 20% of graphite electrode production capacity (excluding China) has been closed or repurposed since the beginning of 2014. • We estimate current global graphite electrode production capacity (excluding China) is 800,000 MT at 21 plants. |
|
|||
Petroleum Needle Coke |
Excess production capacity and cost disadvantage versus pitch needle coke. • Reduced demand from graphite electrodes. |
Tight supply due to new demand from lithium-ion batteries for electric vehicles and improving graphite electrode demand. • Increased demand has led to pricing increases of four to six times for petroleum needle coke in the current market compared to one year ago. |
|
During the most recent demand trough, the combination of decreased demand from the EAF steel industry and overcapacity in the graphite electrode industry had an adverse effect on the profitability of our operations, including a net loss of $235.8 million for the year ended December 31, 2016. We also experienced a net loss from continuing operations of $108.9 million for the year ended December 31, 2016. However, as a result of the recent developments in the industry summarized above, we expect to experience significant improvement in our 2018 financial results relative to these prior results. We also expect a high degree of stability in our future operating results due to our recent three- to five-year contracting initiative. As of March 1, 2018, we have entered into three- to five-year take-or-pay contracts to sell approximately 132,406, 138,446, 134,831, 117,600 and 112,883 MT in 2018, 2019, 2020, 2021 and 2022, respectively.
Set forth below are selected preliminary estimated unaudited financial results for the two months ended February 28, 2018 and the three months ended March 31, 2018. These financial results are unaudited and should be considered preliminary and subject to change. We have provided ranges, rather than specific
8
amounts, for the preliminary results described below as our final results remain subject to the completion of our closing procedures, final adjustments, developments that may arise between now and the time the financial results are finalized, and management's and the audit committee's final reviews. Accordingly, you should not place undue reliance on this preliminary data, which may differ materially from our final results. Please see "Risk Factors," "Special Note Regarding Forward-Looking Statements" and "Management's Discussion and Analysis of Financial Condition and Results of Operations" for a discussion of certain factors that could result in differences between the preliminary financial data reported below and the final results. These preliminary estimates should not be viewed as a substitute for our full unaudited condensed consolidated financial statements prepared in accordance with U.S. GAAP. In addition, they are not necessarily indicative of the results to be achieved in any future period.
These estimates have been prepared by and are the responsibility of management. Our independent registered public accounting firm has not audited, compiled, performed any procedures on or reviewed the preliminary financial data, and accordingly does not express an opinion or any other form of assurance with respect to the preliminary financial data.
For the two months ended February 28, 2018, management estimates:
- •
- Sales volume in the range of approximately 27,800 to 28,600 MT
- •
- Weighted average realized price in the range of approximately $9,925 to $9,975 per MT
- •
- Net sales in the range of approximately $285 to $294 million
- •
- Cost of sales in the range of approximately $92.5 to $97 million
- •
- Selling and administrative expenses in the range of approximately $10 to $11 million including approximately $1.9 to $2.4 million of expenses related to this offering and $0.3 to $0.5 million of pension and other post-employment benefit (or OPEB) plan expenses
- •
- Research and development expenses in the range of approximately $0.2 to $0.4 million
- •
- Depreciation and amortization in the range of approximately $10.5 to $11.5 million (included in cost of sales, selling and administrative expenses, and research and development expenses above)
- •
- Other expense in the range of approximately $1 to $1.5 million including a non-cash loss on foreign currency remeasurement of $1 to $1.5 million
For the three months ended March 31, 2018, management estimates:
- •
- Sales volume in the range of approximately to
- •
- Weighted average realized price in the range of approximately to
- •
- Net sales in the range of approximately to
- •
- Cost of sales in the range of approximately to
- •
- Selling and administrative expenses in the range of approximately to
- •
- Research and development expenses in the range of approximately to
- •
- Depreciation and amortization in the range of approximately to (included in cost of sales, selling and administrative expenses, and research and development expenses above)
- •
- Other expense in the range of approximately to including a non-cash loss on foreign currency remeasurement of to
Weighted average realized price for the two months ended February 28, 2018 benefited from a small portion of our electrode sales being sold on a spot basis. Industry spot prices are at record levels of as high as $15,000 to $30,000 per MT. However, as a result of our recent three- to five-year contracting initiative and other sales commitments, approximately 96% of our 2018 production capacity is now contracted or committed by purchase orders and will not be available for spot sales. The weighted average
9
selling price of our currently contracted and committed orders for the remaining quarters of 2018 is expected to be approximately $9,650 per MT. This represents a combination of our three-to five-year take-or-pay contracts as well as other committed business for 2018, which was mostly negotiated in 2017 at lower prices.
We have made the strategic decision to service our long-term strategic customers through our contracted and committed purchase order volume in the second and third quarters of 2018, and as a result, expect to have only minimal production volume available for sales into the spot market during those quarters.
We expect the results of our operational improvement and debottlenecking initiative to increase our production capacity by approximately 21% beginning in the fourth quarter of 2018. We expect the majority of the incremental volume from our capacity expansion to be available for sale to customers on a spot basis going forward.
We expect that the quarter ended March 31, 2018 will benefit from lower cost of goods sold than future quarters of 2018 due to higher input raw material purchase costs in 2018, which will be reflected in cost of goods sold in future quarters.
Competitive strengths
We are one of the two largest producers of graphite electrodes outside of China, accounting for approximately 21% of global production capacity (excluding China), and we believe our strategically positioned global footprint provides us with competitive advantages
We believe our facilities are among the most strategically located and lowest cost large-scale graphite electrode manufacturing plants in the world. Of the 21 graphite electrode manufacturing facilities currently operating outside of China, we estimate that our three operating manufacturing facilities represent approximately 21% of estimated production capacity for graphite electrodes, making us a critical supplier to global EAF steel manufacturers. Our manufacturing facilities are located in the Americas and EMEA, providing us with access to low-cost and reliable energy sources, logistical and freight advantages in sourcing raw materials and shipping our graphite electrodes to our customers compared to our competitors, and excellent visibility into the large North American and European EAF steelmaking markets. Our experience in producing graphite electrodes for a varied global customer base positions us to meet customer requirements across a range of product types and quality levels, including support and technical services, further distinguishing us from our competitors.
We are a pure-play provider of an essential consumable for EAF steel producers, the fastest-growing sector of the steel industry
We estimate that EAF steelmaking grew at an annual pace of at least 8% to 10% in 2017, compared with 5% for steelmaking overall. As a result of the increasing global availability of steel scrap and the more resilient, high-variable cost and environmentally friendly EAF model, we expect EAF producers to continue to grow at a faster rate than BOF producers globally. Additionally, EAF producers are increasingly able to utilize higher quality scrap and iron units, their two primary raw materials, to produce higher quality steel grades and capture market share from BOF producers, while maintaining a favorable cost structure. According to the WSA, in EMEA and the Americas, which together made up 92% of our 2017 net sales, EAF producers have increased market share from approximately 37% in 2000 to 48% in 2016, reflecting growth from 190 million MT to 237 million MT. In APAC, which made up approximately 9% of our 2017 net
10
sales, government initiatives in China are expected to result in a greater use of the EAF method in steelmaking despite the historical dominance of BOF producers. These initiatives are the result of efforts to eliminate excess steelmaking production capacity and to improve environmental conditions. The EAF method produces approximately 25% of the carbon dioxide (or CO2) emissions of a BOF facility and does not require the smelting of virgin iron ore or the burning of coal. Additionally, as a result of significantly increased steel production in China since 2000, the supply of Chinese scrap is expected to increase substantially, which may result in lower scrap prices and provide the Chinese steel manufacturing industry with local scrap feedstock that was not historically available. We believe these trends will allow EAF steel producers to increase their market share and grow at a faster rate than BOF steel producers, resulting in increasing demand for graphite electrodes.
We have capital-efficient growth opportunities available to us
The graphite electrode industry responded to oversupplied markets from 2011 to 2015 with production capacity rationalization and consolidation, and after the normalization of the market for EAF steel in 2017, we expect the resulting graphite electrode supply deficit could last for some time. Additionally, we believe the lead time from initial permitting to full production of a greenfield graphite electrode manufacturing facility would be approximately five to ten years and cost approximately $10,000 per MT. Similarly, brownfield development is complicated by significant capital costs and space and process constraints. Only one new greenfield graphite electrode facility outside of China has been built since the 1980s and only one significant brownfield expansion has occurred, reflecting the historical difficulty of adding further graphite electrode production capacity. As a result of this long and uncertain time horizon to build new plants, we believe only a few companies have the necessary technology and expertise to meet the rising demand for graphite electrodes.
Our current facilities are modern, strategically located and well-maintained, providing us with ample operational optimization capabilities. We are in the process of expanding our current production capacity of 167,000 MT by approximately 21%, or 35,000 MT, by the end of 2018 through strategic capital investments and operational improvements in baking cycles and the graphitization process. We estimate that the capital cost to achieve this production capacity expansion is approximately $37 million, or approximately $1,000 per MT. As a result of our prior operational improvement activities, we are able to achieve this large capacity increase with specific, highly targeted capital investments. We expect these expansions to provide additional fixed cost absorption and drive further efficiencies of scale across our manufacturing base. We also can increase production by resuming production at our currently idled St. Marys facility, depending on market conditions, which would add 28,000 MT, or an increase of approximately 14%, to our expected production capacity at the end of 2018. We believe that resuming production at our St. Marys facility, which we believe is cost-competitive with facilities currently operated by our competitors, would cost approximately $5 million to $11 million in capital expenditures and start-up staffing requirements, depending on our targeted production capacity.
We believe we have the industry's most efficient production platform of high production capacity assets with substantial vertical integration
Based on our experience, high capacity manufacturing facilities can have operating costs of more than $1,000 per MT lower than low capacity manufacturing facilities. Our recent restructuring activities have included the closures of our lower capacity manufacturing facilities in South Africa and Brazil and the idling of our St. Marys facility, which together accounted for approximately 35% of our previous production capacity. Our restructuring actions have eliminated approximately $125 million of annual fixed
11
manufacturing costs and maintenance capital expenditure requirements since 2012. These actions allow us to run our Calais, Pamplona and Monterrey plants at or near 100% capacity utilization. Since 2014, we have also improved our manufacturing processes and made strategic investments across our plant network, which have improved productivity while also reducing our energy and raw material consumption. Following our footprint optimization, we expect to produce a greater quantity of graphite electrodes in 2018 from our three operating facilities than we did from our six operating facilities in 2012. In 2017, the Calais and Pamplona plants exceeded previous annual record production levels by 15% and 12%, respectively, and production at the Monterrey plant was 12% higher than the highest annual production level during the past 10 years. We believe that the optimization of our plant network will continue to drive improved fixed cost absorption and meaningfully lower variable costs.
Moreover, our Seadrift, Calais, Pamplona, Monterrey and St. Marys facilities each provide unique advantages for us. On average, petroleum needle coke represents 25% to 45% of our graphite electrode manufacturing costs, with labor representing only 5% to 10%. Seadrift provides a substantial portion of our petroleum needle coke supply needs internally and at a competitive cost and allows us to maximize capacity utilization more efficiently than competitors, who may be more constrained by petroleum needle coke supply. Seadrift is one of only five petroleum needle coke facilities in the world, excluding a small facility in China, and we believe it is the second largest petroleum needle coke producer in the world. We also believe that Calais, Pamplona and Monterrey are three of the five highest capacity graphite electrode facilities in the world (excluding China), allowing for significant operating leverage. We believe our facilities have significant cost advantages given their scale and access to low cost, reliable energy sources. While much of the production capacity rationalized during the downturn was permanently shut down, we temporarily idled our St. Marys facility and retain the option to restart it. We believe that our St. Marys facility could be cost-competitive with facilities currently operated by our competitors, and we continue to monitor petroleum needle coke availability to assess restarting the plant.
We are the only petroleum needle coke producer in the world specifically focused on the production of graphite electrodes
Our production of petroleum needle coke specifically for graphite electrodes provides us the opportunity to produce super premium petroleum needle coke of the highest quality and allows us to tailor graphite electrodes for customer requirements. Seadrift has 140,000 MT of petroleum needle coke production capacity, which we believe makes it the second largest petroleum needle coke producer in the world. We believe that no petroleum needle coke production capacity has been added outside of China for at least 10 years, given high capital costs and technological barriers. Additionally, the growing petroleum needle coke demand from manufacturers of lithium-ion batteries for electric vehicles has created a shortage of petroleum needle coke available to graphite electrode manufacturers. Sourcing the majority of our petroleum needle coke internally allows us to offer our customers certainty of supply, further enhancing our competitive position and supporting our new three- to five-year, take-or-pay contracts strategy. To align with our three- to five-year contract profile, we have hedged the decant oil required to produce all of the graphite electrodes sold under these contracts, providing us with substantial visibility into our future raw material costs. We believe our use of petroleum needle coke is a further competitive advantage, as the use of pitch needle coke, an alternative raw material, results in longer bake times during graphite electrode production, significantly affecting graphite electrode production rates and cost. Finally, the decline in the price of oil and increase in the price of coal tar pitch in recent years has further improved the competitive advantage of using petroleum needle coke relative to pitch needle coke.
12
Our graphite electrodes and petroleum needle coke are among the highest quality in the industry
After the divestiture of our non-core legacy Engineered Solutions businesses in 2016 and 2017, we focused on our core competency of graphite electrode production and generated approximately $60 million in cash proceeds and release of working capital from these divestitures. Our restructured and simplified business model has reduced our annual overhead expenses by approximately $65 million since 2012, allowing us to redeploy the savings into our graphite electrode business. We have identified and implemented mechanical and chemical improvements to our electrodes, invested in the capability to produce super premium petroleum needle coke needed for high-margin UHP graphite electrodes, and optimized our production of pins at our Monterrey plant, which are a critical component used to connect and fasten graphite electrodes together in a furnace. By producing pins at our Monterrey plant, we are able to realize meaningful fixed-cost synergies with our graphite electrode production on site. As a result, we believe the quality and the consistency of our electrodes is unrivaled in North America and EMEA and on par with that of any producer globally. We have seen customer satisfaction rise to ten-year highs at a time when the industry has been focused on production capacity rationalization rather than quality. We believe the durability and infrequent breakage of our graphite electrodes create operating efficiencies and value opportunities for our customers. We also believe we have a competitive advantage in offering customers our ArchiTech Furnace Productivity System (or ArchiTech), which we believe is the most advanced support and technical service platform in the graphite electrode industry. ArchiTech, which has been installed in 145 customer furnaces, enables our engineers to work with our customers seamlessly to maximize the performance of their furnaces and provide real-time diagnostics and troubleshooting. We believe our customers value our high quality products and customer service, and have provided us with opportunities to expand our business with them as a result.
Our experienced executive leadership and general managers and flexible workforce have positioned us for future earnings growth
Our seasoned leadership is committed to earnings growth. We have undertaken strategic investments to increase our production capacity in a capital-efficient manner while reducing our cost position. Our executive and manufacturing leadership have led manufacturing companies through many cycles and are focused on positioning us for profitable growth in any environment. We expect to grow our production capacity by approximately 21%, or 35,000 MT, in 2018 as a result of our operational improvement and debottlenecking initiative and a further 14%, or 28,000 MT, if we restart production at our currently idled St. Marys facility.
Additionally, since our acquisition by Brookfield, we have reorganized our manufacturing facilities as profit centers. We use LEAN manufacturing techniques, which focus on the constant elimination of waste from the manufacturing process. We also rely on Six Sigma methods, a set of management techniques intended to improve quality by significantly reducing the probability that an error or defect will occur. We believe the LEAN and Six Sigma initiatives have increased overall utilization by optimizing our plant production capacity and controlled costs while also improving quality. We also redesigned general manager incentive plans to reward efficiency gains. Similarly, our labor force is incentivized to drive efficiencies through country-specific labor incentive plans. Further, we believe our positive relations with our labor force allow for increased flexibility.
13
Business strategies
Implement our new commercial strategy
We believe our customers value certainty of supply of high quality graphite electrodes due to their mission-critical nature in the EAF steelmaking process and relatively low cost compared to the total cost of steelmaking. In light of improved market conditions, the long lead time required to produce our products, our position as one of the market's largest producers and our ability, through our substantial vertical integration with Seadrift, to provide customers with a reliable long-term supply of graphite electrodes despite the market shortage of petroleum needle coke, we have implemented a new commercial strategy to sell 60% to 65% of our production capacity to our strategic customers through three- to five-year take-or-pay contracts. In the new supply-constrained market environment, as of March 1, 2018, we have secured minimum sales volume under three- to five-year take-or-pay contracts for approximately 636,000 MT, or approximately 60% to 65% of our cumulative production capacity from 2018 through 2022. As of March 1, 2018, 13% of these contracts are three- and four-year contracts and 87% are five-year contracts. Furthermore, many of our customers have sought to purchase greater volumes from us than they have historically because of our reliable source of petroleum needle coke and the high quality of our graphite electrodes. This new commercial strategy reflects a shift from our historic approach to sales, which were negotiated annually and on a non-binding basis.
Grow production capacity through capital-efficient operational improvements and the restart of our St. Marys facility
We believe our well-maintained facilities provide us with opportunities to improve our production capacity by approximately 21% from current production capacity levels with relatively low capital investments. We have improved our manufacturing processes and made strategic investments across our plant network, which have improved productivity, including improvements of approximately 20% at both our Seadrift and Monterrey facilities, while also reducing our energy and raw material consumption. We have achieved these production increases by exploiting latent capacity in our plants, which historically have had uneven levels of capacity across each manufacturing process step, by removing artificial constraints on cycle times and improving scheduling processes. These improvements have had the additional advantage of reducing the capital expenditures required to achieve further production capacity increases through debottlenecking. We plan to invest approximately $37 million to optimize our bake schedules and graphitization processes as part of our operational improvement and debottlenecking initiative. We expect these upgrades at our three operational facilities to include:
- •
- Calais: adding graphitizing furnaces and increasing graphitizing production capacity are expected to increase annual production capacity from
46,000 MT to 65,000 MT.
- •
- Pamplona: optimizing graphitization cycles, adding a new extrusion press to unlock graphitizing production capacity and adding a new
impregnation facility are expected to increase annual production capacity from 66,000 MT to 76,000 MT.
- •
- Monterrey: adding a new bake car, bigger furnace, second crane and additional longitudinal furnaces are expected to increase annual production capacity from 55,000 MT to 61,000 MT.
As a result of our prior operational improvement activities, we are able to achieve this large capacity increase with specific, highly targeted capital investments. We also continue to evaluate restarting production at our St. Marys facility. Restarting our St. Marys facility would provide an additional 28,000
14
MT of production capacity, or an incremental 14%. Our St. Marys facility has access to low-cost natural gas and electricity, providing what we believe to be a significant cost advantage relative to our competitors. Additionally, its greater proximity to U.S. EAF and non-ferrous metals producers provides it with a further freight cost advantage.
Utilize our production efficiency program to support our focus on cost efficiency
As part of our corporate restructuring, we have reduced corporate overhead expenses by approximately 60% from 2012 levels through a strategic realignment of our corporate structure and the elimination of the legacy Engineered Solutions R&D expenses and overhead. We temporarily idled our St. Marys facility and reconfigured our production footprint by closing our Brazil and South Africa manufacturing facilities to drive higher capacity utilizations at our three largest, most strategically located and lowest-cost manufacturing facilities. Additionally, we continue to optimize our capital investment opportunities through rigorous quantitative analysis and deploy simultaneous work process improvements at our manufacturing facilities through LEAN and Six Sigma techniques.
Continue to be a reliable, preferred supplier for mission-critical graphite electrodes
We believe that improvements in overall quality create significant operating efficiencies and value opportunities for our customers, and provide us with the opportunity to increase sales volumes and market share. We continue to work closely with key customers to enhance the durability of our graphite electrodes, reducing the frequency of graphite electrode breaks and enhancing the usable life of our graphite electrodes, to make us their preferred supplier. We will continue to use our petroleum needle coke facility to help secure customer orders of mission-critical graphite electrodes. We believe that at a time of supply uncertainty for many competitors, we will continue to see high demand from our customers.
Maintain balance sheet discipline and strong liquidity to provide strategic flexibility
We plan to maintain a solid balance sheet in order to provide flexibility to grow and invest in our business in all market environments. As of December 31, 2017, after giving pro forma effect to our entrance into the 2018 Credit Agreement, the borrowing of $1,500 million of 2018 Term Loans under the 2018 Credit Agreement on February 12, 2018 and our use of proceeds therefrom, we would have had $1,500 million in Term Loans outstanding under the 2018 Credit Agreement and total liquidity of approximately $253.7 million, consisting of $241.8 million in availability under the 2018 Revolving Credit Facility (taking into account approximately $8.2 million of outstanding letters of credit issued thereunder) and cash and cash equivalents of approximately $11.9 million. See "—Recent Developments—2018 Credit Agreement."
Risk factors
Our business is subject to numerous risks. See "Risk Factors" beginning on page 26. In particular, our business may be adversely affected by, among other factors:
- •
- our history of net losses and the possibility that we may not achieve or maintain profitability in the future;
- •
- our inability to implement our business strategies, including our initiative to secure and maintain long-term, take-or-pay customer contracts,
in an effective manner;
- •
- the fact that pricing for graphite electrodes has historically been cyclical and, in the future, the price of graphite electrodes will likely
decline from recent record highs;
- •
- the sensitivity of our business and operating results to economic conditions;
15
- •
- our dependence on the global steel industry generally and the EAF steel industry in particular;
- •
- the possibility that global graphite electrode overcapacity may adversely affect graphite electrode prices;
- •
- the competitiveness of the graphite electrode industry;
- •
- our dependence on the supply of petroleum needle coke;
- •
- our dependence on supplies of raw materials (in addition to petroleum needle coke) and energy; and
- •
- the legal, economic, social and political risks associated with our substantial operations in multiple countries.
Implications of being an emerging growth company
We qualify as an "emerging growth company" as defined in Section 2(a) of the Securities Act of 1933 (or the Securities Act), as modified by the Jumpstart Our Business Startups Act of 2012 (or the JOBS Act). As an emerging growth company, we may take advantage of specified reduced disclosure and other requirements that are otherwise applicable generally to public companies, which are not emerging growth companies.
We may take advantage of these exemptions until such time that we are no longer an emerging growth company. We will remain an "emerging growth company" until the earliest of (1) the last day of the fiscal year following the fifth anniversary of the completion of this offering, (2) the last day of the fiscal year in which we have total annual gross revenue of at least $1.07 billion, (3) the date on which we are deemed to be a large accelerated filer under the Securities Exchange Act of 1934 (or the Exchange Act), which means the market value of our common stock that is held by non-affiliates exceeds $700.0 million as of the prior June 30, and (4) the date on which we have issued more than $1.0 billion in non-convertible debt during the prior three-year period. We have taken advantage of reduced disclosure regarding executive compensation arrangements in this prospectus, and we may choose to take advantage of some but not all of these reduced disclosure obligations in future filings. If we do, the information that we provide to stockholders may be different than you might get from other public companies in which you hold stock.
Under the JOBS Act, emerging growth companies can also delay adopting new or revised accounting standards until such time as those standards apply to private companies. We have irrevocably elected not to avail ourselves of this exemption from new or revised accounting standards and, therefore, will be subject to the same new or revised accounting standards as other public companies that are not emerging growth companies.
Recent developments
Tax Act
The Tax Cuts and Jobs Act (or the Tax Act), enacted on December 22, 2017, caused us to write down the carrying value of our deferred tax assets as of December 31, 2017, primarily due to the reduction in the U.S. federal corporate tax rate from 35% to 21%. We recognized an estimated net write down to the value of our net deferred tax assets of approximately $52.2 million. This write down was offset by a corresponding reduction in the valuation allowance against our deferred tax assets. See "Risk Factors—Risk related to our business and industry—New tax legislation could adversely affect us or our shareholders."
16
2018 Credit Agreement
On February 12, 2018, we entered into a credit agreement (or the 2018 Credit Agreement), which provides for (i) a $1,500 million senior secured term loan facility (or the 2018 Term Loan Facility) and (ii) a $250 million senior secured revolving credit facility (or the 2018 Revolving Credit Facility and, together with the 2018 Term Loan Facility, the Senior Secured Credit Facilities), which may be used from time to time for revolving credit borrowings denominated in dollars or Euro, the issuance of one or more letters of credit denominated in dollars, Euro, Pounds Sterling or Swiss Francs and one or more swing line loans denominated in dollars. On February 12, 2018, GrafTech Finance Inc. (or GrafTech Finance), a Delaware corporation and our wholly owned subsidiary, borrowed $1,500 million under the 2018 Term Loan Facility (or the 2018 Term Loans). The 2018 Term Loans mature on February 12, 2025. The maturity date for the 2018 Revolving Credit Facility is February 12, 2023. Funds received were used to pay off our outstanding debt, including borrowings under our existing credit agreement and the $300 million principal amount of senior notes due 2020 (or the Senior Notes) and accrued interest relating to such borrowings and the Senior Notes, declare and pay a dividend to Brookfield and pay fees and expenses incurred in connection therewith and for other general corporate purposes. See "Management's Discussion and Analysis of Financial Condition and Results of Operations—Financing Transactions—2018 Credit Agreement."
17
The offering
| Common stock offered by the selling stockholder | shares, assuming no exercise by the underwriters of their options to purchase an additional shares of common stock from the selling stockholder to cover overallotments. | |
Common stock to be issued and outstanding after this offering |
shares. |
|
Underwriters' option to purchase additional shares of our common stock |
The selling stockholder has granted the underwriters an option, for a period of 30 days, to purchase up to additional shares of our common stock held by it on the same terms and conditions as set forth on the front cover of this prospectus. |
|
Use of proceeds |
We will not receive any proceeds from the sale of our common stock by the selling stockholder named in this prospectus. |
|
Proposed purchase by certain director nominees |
Certain of our independent director nominees may purchase up to an aggregate of shares of common stock in this offering at the public offering price. The allocation of shares in this offering to our independent director nominees will be made at our direction. The underwriters will not receive any underwriting discount or commission from the shares of our common stock purchased by these director nominees in this offering. Any shares sold to these director nominees will be subject to the lock-up agreements described under the sections entitled "Shares Eligible for Future Sale" and "Underwriting." |
|
Dividend policy |
Following this offering, we expect to pay cash dividends on our common stock from time to time. |
|
Any future determination to pay dividends on our common stock will be subject to the approval of our board of directors and will depend upon many factors, including our financial position and liquidity, results of operations, legal requirements and restrictions that may be imposed by the terms of our current and future financing instruments. See "Dividend Policy." |
||
Risk factors |
Please read the section entitled "Risk Factors" beginning on page 26 for a discussion of some of the factors you should carefully consider before deciding to invest in our common stock. |
|
NYSE listing and symbol |
We have applied to have our common stock listed on the NYSE under the symbol "EAF." |
The number of shares of common stock to be issued and outstanding after the completion of this offering is based on shares common stock issued and outstanding as of , 2018 and
18
excludes an additional shares reserved for issuance under our long term incentive plan, of which remain available for grant.
Except as otherwise indicated, all information in this prospectus:
- •
- gives effect to
a -for- stock split on our common
stock to be effected prior to the completion of
this offering.
- •
- assumes an initial public offering price of $ per share, the midpoint of the estimated initial
public offering price range set
forth on the cover page of this prospectus; and
- •
- assumes no exercise by the underwriters of their options to purchase an additional shares of common stock from the selling stockholder to cover overallotments.
19
Summary historical consolidated financial and other data
The following tables present selected consolidated financial information of the Company. You should read these tables along with "Management's Discussion and Analysis of Financial Condition and Results of Operations," "Business" and our audited consolidated financial statements and the related notes included elsewhere in this prospectus.
The summary consolidated statement of operations data for the years ended December 31, 2017, 2016 and 2015 (January 1, 2015 to August 14, 2015, Predecessor Period, and August 15, 2015 to December 31, 2015, Successor Period) and the summary consolidated balance sheet data at December 31, 2017 and 2016 have been derived from our audited consolidated financial statements included elsewhere in this prospectus. Our historical results are not necessarily indicative of the results to be expected in the future.
As a result of business combination accounting resulting from our acquisition by Brookfield (see Note 2, Preferred Share Issuance and Merger, of the Notes to the Consolidated Financial Statements included elsewhere in this prospectus), our financial statements are separated into two distinct periods, the period before the consummation of our acquisition by Brookfield (labeled "Predecessor") and the period after that date (labeled "Successor"), to indicate the application of the different basis of accounting between the periods presented. There were no operational activities that changed as a result of our acquisition by Brookfield.
20
| |
| |
| |
| |
| |
| |
| ||||
|---|---|---|---|---|---|---|---|---|---|---|---|---|---|---|---|
| | | | | | | | | | | | | ||||
| |
| |
| Successor |
|
|
| Predecessor |
| ||||||
| | | | | | | | | | | | | ||||
| |
| For the year ended December 31 |
| For the period August 15 through December 31, |
|
|
| For the period January 1 through August 14, |
| ||||||
| | | | | | | | | | | | | ||||
| |
| 2017 |
| 2016 |
| 2015 |
|
|
| 2015 |
| ||||
| | | | | | | | | | | | | ||||
|
| (in thousands, except share and per share data) | | ||||||||||||
Statement of Operations Data: |
| | | | | | |||||||||
Net sales |
| $ | 550,771 | | $ | 437,963 | | $ | 193,133 | | | $ | 339,907 | | |
Income (loss) from continuing operations |
| 14,212 | | (108,869 | ) | (28,625 | ) | | (101,970 | ) | |||||
Net income (loss) |
| 7,983 | | (235,843 | ) | (33,551 | ) | | (120,649 | ) | |||||
Basic income (loss) per common share(a): |
| | | | | | |||||||||
| | | | | | | | | | | | | ||||
Income (loss) from continuing operations per share |
| $ | 142,120 | | $ | (1,088,690 | ) | $ | (286,250 | ) | | $ | (0.74 | ) | |
| | | | | | | | | | | | | ||||
Weighted average common shares outstanding |
| 100 | | 100 | | 100 | | | 137,152,430 | | |||||
Balance Sheet Data (at period end): |
| | | | | | |||||||||
Total assets |
| $ | 1,199,103 | | $ | 1,172,276 | | $ | 1,422,015 | | | | |||
Other long-term obligations(b) |
| 68,907 | | 82,148 | | 94,318 | | | | ||||||
Total long-term debt |
| 322,900 | | 356,580 | | 362,455 | | | | ||||||
Other Financial Data: |
| | | | | | |||||||||
Net cash provided by operating activities |
| $ | 36,573 | | $ | 22,815 | | $ | 23,115 | | | $ | 28,323 | | |
Net cash (used in) provided by investing activities |
| (2,199 | ) | (10,471 | ) | (17,484 | ) | | (39,918 | ) | |||||
Net cash (used in) provided by financing activities |
| (32,995 | ) | (8,317 | ) | (23,072 | ) | | 20,824 | | |||||
| | | | | | | | | | | | | ||||
(a) Per share data does not give effect to the -for- stock split on our common stock to be effected prior to the completion of this offering.
(b) Represents pension and OPEB and related costs and miscellaneous other long-term obligations.
| |
| |
| |
| |
| |
| |
| ||||
|---|---|---|---|---|---|---|---|---|---|---|---|---|---|---|---|
| | | | | | | | | | | | | ||||
| |
| |
| Successor |
|
|
| Predecessor |
| ||||||
| | | | | | | | | | | | | ||||
| |
| For the year ended December 31 |
| For the period August 15 through December 31, |
|
|
| For the period January 1 through August 14, |
| ||||||
| | | | | | | | | | | | | ||||
| |
| 2017 |
| 2016 |
| 2015 |
|
|
| 2015 |
| ||||
| | | | | | | | | | | | | ||||
|
| (in thousands) | | ||||||||||||
Other Financial Information: |
| | | | | | |||||||||
EBITDA from continuing operations(1) |
| $ | 97,884 | | $ | (12,251 | ) | $ | 12,674 | | | $ | (32,197 | ) | |
Adjusted EBITDA from continuing operations(1) |
| $ | 95,806 | | $ | (2,898 | ) | $ | 14,396 | | | $ | 31,628 | | |
| | | | | | | | | | | | | ||||
21
| |
|
|
|
|||||||
|---|---|---|---|---|---|---|---|---|---|---|
| | | | | | | | | | | |
| |
For the year ended December 31, |
|||||||||
| | | | | | | | | | | |
| (in thousands, except price data) |
2017 |
2016 |
2015 |
|||||||
| | | | | | | | | | | |
Sales volume (MT)(2) |
172 | 163 | 145 | |||||||
Weighted average realized price(3) |
$ | 2,945 | $ | 2,459 | $ | 3,344 | ||||
Production volume (MT)(4) |
166 | 151 | 137 | |||||||
Production capacity (MT)(5) |
195 | 195 | 195 | |||||||
Production capacity excluding St. Marys during idle period (MT)(6) |
167 | 176 | 195 | |||||||
Capacity utilization(7) |
85% | 77% | 70% | |||||||
Capacity utilization excluding St. Marys during idle period(6) |
99% | 85% | 70% | |||||||
| | | | | | | | | | | |
(1) See below for more information and a reconciliation of EBITDA and adjusted EBITDA to net income (loss), the most directly comparable financial measure calculated and presented in accordance with GAAP.
(2) Sales volume reflects the total volume of graphite electrodes sold for which revenue has been recognized during the period. See below for more information on our key operating metrics.
(3) Weighted average realized price reflects the total revenues from sales of graphite electrodes for the period divided by the graphite electrode sales volume for that period. See below for more information on our key operating metrics.
(4) Production volume reflects graphite electrodes produced during the period. See below for more information on our key operating metrics.
(5) Production capacity reflects expected maximum production volume during the period under normal operating conditions, standard product mix and expected maintenance downtime. Actual production may vary. See below for more information on our key operating metrics.
(6) The St. Marys, Pennsylvania facility was temporarily idled effective the second quarter of 2016, except for the machining of semi-finished products sourced from other plants.
(7) Capacity utilization reflects production volume as a percentage of production capacity. See below for more information on our key operating metrics.
Non-GAAP financial measures
In addition to providing results that are determined in accordance with GAAP, we have provided certain financial measures that are not in accordance with GAAP. EBITDA from continuing operations and adjusted EBITDA from continuing operations are non-GAAP financial measures. We define EBITDA from continuing operations, a non-GAAP financial measure, as net income or loss plus interest expense, minus interest income, plus income taxes, discontinued operations and depreciation and amortization. We define adjusted EBITDA from continuing operations as EBITDA from continuing operations plus any pension and OPEB plan expenses, impairments, rationalization-related charges, acquisition costs and costs related to the change in control as well as proxy contests costs, non-cash gains or losses from foreign currency remeasurement of non-operating liabilities in our foreign subsidiaries where the functional currency is the U.S. dollar and non-cash fixed asset write-offs. Adjusted EBITDA from continuing operations is the primary metric used by our management and our board of directors to establish budgets and operational goals for managing our business and evaluating our performance.
We monitor adjusted EBITDA from continuing operations as a supplement to our GAAP measures, and believe it is useful to present to investors, because we believe that it facilitates evaluation of our period-to-period operating performance by eliminating items that are not operational in nature, allowing comparison of our recurring core business operating results over multiple periods unaffected by differences in capital structure, capital investment cycles and fixed asset base. In addition, we believe adjusted EBITDA from continuing operations and similar measures are widely used by investors, securities analysts, ratings agencies, and other parties in evaluating companies in our industry as a measure of financial performance and debt-service capabilities.
22
Our use of adjusted EBITDA from continuing operations has limitations as an analytical tool, and you should not consider it in isolation or as a substitute for analysis of our results as reported under GAAP. Some of these limitations are:
- •
- adjusted EBITDA from continuing operations does not reflect changes in, or cash requirements for, our working capital needs;
- •
- adjusted EBITDA from continuing operations does not reflect our cash expenditures for capital equipment or other contractual commitments,
including any capital expenditures for future capital expenditure requirements to augment or replace our capital assets;
- •
- adjusted EBITDA from continuing operations does not reflect the interest expense or the cash requirements necessary to service interest or
principal payments on our indebtedness;
- •
- adjusted EBITDA from continuing operations does not reflect tax payments that may represent a reduction in cash available to us;
- •
- adjusted EBITDA from continuing operations does not reflect expenses relating to our pension and OPEB plans;
- •
- adjusted EBITDA from continuing operations does not reflect impairment of long-lived assets and goodwill;
- •
- adjusted EBITDA from continuing operations does not reflect the non-cash gains or losses from foreign currency remeasurement of non-operating
liabilities in our foreign subsidiaries where the functional currency is the U.S. dollar;
- •
- adjusted EBITDA from continuing operations does not reflect rationalization-related charges, acquisition costs, costs related to the change in
control and proxy contests costs or the non-cash write-off of fixed assets; and
- •
- other companies, including companies in our industry, may calculate EBITDA from continuing operations and adjusted EBITDA from continuing operations differently, which reduces its usefulness as a comparative measure.
In evaluating EBITDA from continuing operations and adjusted EBITDA from continuing operations, you should be aware that in the future, we will incur expenses similar to the adjustments in this presentation. Our presentations of EBITDA from continuing operations and adjusted EBITDA from continuing operations should not be construed as suggesting that our future results will be unaffected by these expenses or any unusual or non-recurring items. When evaluating our performance, you should consider EBITDA from continuing operations and adjusted EBITDA from continuing operations alongside other financial performance measures, including our net income (loss) and other GAAP measures.
23
The following table reconciles our non-GAAP key financial measures to the most directly comparable GAAP measures:
| |
| |
| |
| |
| |
| ||||
|---|---|---|---|---|---|---|---|---|---|---|---|---|---|
| | | | | | | | | | | ||||
| |
| Successor |
| Predecessor |
| ||||||||
| | | | | | | | | | | ||||
| |
| For the year ended December 31, |
| For the period August 15 through December 31, |
| For the period January 1 through August 14, |
| ||||||
| | | | | | | | | | | ||||
| |
| 2017 |
| 2016 |
| 2015 |
| 2015 |
| ||||
| | | | | | | | | | | ||||
|
| | | | | ||||||||
| |
| (in thousands) |
| ||||||||||
Net income (loss) |
| $ | 7,983 | | $ | (235,843 | ) | $ | (33,551 | ) | $ | (120,649 | ) |
Add: |
| | | | | ||||||||
Discontinued operations |
| 6,229 | | 126,974 | | 4,926 | | 18,679 | | ||||
Depreciation and amortization |
| 64,025 | | 77,614 | | 24,424 | | 37,473 | | ||||
Interest expense |
| 30,823 | | 26,914 | | 9,999 | | 26,211 | | ||||
Interest income |
| (395 | ) | (358 | ) | (6 | ) | (363 | ) | ||||
Income taxes |
| (10,781 | ) | (7,552 | ) | 6,882 | | 6,452 | | ||||
| | | | | | | | | | | ||||
EBITDA from continuing operations |
| 97,884 | | (12,251 | ) | 12,674 | | (32,197 | ) | ||||
Adjustments: |
| | | | | ||||||||
Pension and OPEB plan (gain) expenses(1) |
| (1,611 | ) | (626 | ) | 2,397 | | 2,973 | | ||||
Impairments(2) |
| — | | 2,843 | | — | | 35,381 | | ||||
Rationalization-related (gains)/charges(3) |
| (3,970 | ) | 2,366 | | 387 | | 3,049 | | ||||
Acquisition and proxy contests costs(4) |
| 886 | | 8,036 | | 961 | | 22,618 | | ||||
Non-cash loss (gain) on foreign currency remeasurement(5) |
| 1,731 | | (5,465 | ) | (2,023 | ) | (196 | ) | ||||
Non-cash fixed asset write-off(6) |
| 886 | | 2,199 | | — | | — | | ||||
| | | | | | | | | | | ||||
Adjusted EBITDA from continuing operations |
| $ | 95,806 | | $ | (2,898 | ) | $ | 14,396 | | $ | 31,628 | |
| | | | | | | | | | | ||||
(1) Service and interest cost of our OPEB plans. Also includes a mark-to-market loss (gain) for plan assets as of December of each year. See "Management's Discussion and Analysis of Financial Condition and Results of Operations-Components of Results of Operations-Selling and Administrative Expenses" for more information.
(2) Goodwill impairment in the first quarter of 2015 for the needle coke reporting unit.
(3) Costs associated with rationalizations in our graphite electrode manufacturing operations and in the corporate structure. They include severance charges, contract termination charges, write-off of equipment and (gain)/loss on sale of manufacturing sites.
(4) Legal costs associated with the proxy contests in early 2015; transaction costs associated with the merger transaction with Brookfield in August 2015, resulting in change in control compensation expenses, including the acceleration of stock-based compensation in the period January 1 through August 14, 2015.
(5) Non-cash (gain) loss from foreign currency remeasurement of non-operating liabilities of our non-U.S. subsidiaries where the functional currency is the U.S. dollar.
(6) Non-cash fixed asset write-off recorded for obsolete manufacturing equipment in the fourth quarter of 2016 and the third quarter of 2017.
Key Operating Metrics
Key operating metrics consist of sales volume, weighted average realized price, production volume, production capacity and capacity utilization. Sales volume reflects the total volume of graphite electrodes sold for which revenue has been recognized during the period. For a discussion of our revenue recognition policy, see "Management's Discussion and Analysis of Financial Condition and Results of Operations—Critical Accounting Policies—Revenue Recognition." Under our policy, volume discounts and rebates are recorded as
24
a reduction of revenue in conjunction with the sale of the graphite electrodes, and shipping and handling revenues relating to graphite electrodes sold are included as an increase to revenue. Weighted average realized price reflects the total revenues from sales of graphite electrodes for the period divided by the graphite electrode sales volume for that period. Production volume reflects graphite electrodes produced during the period. Production capacity reflects expected maximum production volume during the period under normal operating conditions, standard product mix and expected maintenance downtime. Capacity utilization reflects production volume as a percentage of production capacity.
25
Investing in our common stock involves a high degree of risk. You should carefully consider the following risk factors, as well as other information contained in this prospectus, before deciding to invest in our common stock. The occurrence of any of the following risks could materially and adversely affect our business, financial condition, results of operations and cash flow, in which case the trading price of our common stock could decline and you could lose all or part of your investment.
Risks related to our business and industry
We have a history of net losses and may not achieve or maintain profitability in the future.
We have a history of significant net operating losses, including a net loss of $235.8 million for the year ended December 31, 2016. We may not be able to achieve or maintain profitability for the current or any future fiscal year. Our ability to achieve and maintain profitability depends on a number of factors, including the growth rate of the graphite electrode industry, the price of our products, the cost to produce our products, the competitiveness of our products and the production capacity at our existing plants. We may incur significant losses in the future for a number of reasons, including due to the other risks described in this prospectus, and we may encounter unforeseen expenses, difficulties, complications and delays and other unknown events. In addition, as a public company, we will incur significant legal, accounting and other expenses that we did not incur as a private company. As a result, our operations may not achieve profitability in the future and, even if we do achieve profitability, we may not be able to maintain or increase it.
We may be unable to implement our business strategies, including our initiative to secure and maintain three- to five-year take-or-pay customer contracts, in an effective manner.
Our future financial performance and success largely depend on our ability to implement our business strategies for growth successfully. We have undertaken, and will continue to undertake, various business strategies to sell a significant portion of our production capacity through three- to five-year, take-or-pay contracts, grow our production capacity, and improve operating efficiencies and generate cost savings. We cannot assure you that we will successfully implement our business strategies or that implementing these strategies will sustain or improve and not harm our results of operations. In particular, our ability to implement our new strategy to enter into three- to five-year take-or-pay contracts successfully is subject to certain risks, including customers seeking to renegotiate key terms of their contracts, such as pricing and specified volume commitments, in the event market conditions change during the contract term; our inability to extend contracts when they expire; and a disruption in our access to Seadrift-produced petroleum needle coke, which we will rely on to deliver the contracted volumes under the contracts. As a result, we cannot assure you that we will successfully implement this strategy or realize the anticipated benefits of these contracts. In addition, the costs involved in implementing our strategies may be significantly greater than we currently anticipate. For example, our ability to complete production capacity expansions or make other operational improvements as planned may be delayed or interrupted by the need to obtain environmental and other regulatory approvals, the availability of labor and materials, unforeseen hazards, such as weather conditions, and other risks customarily associated with construction projects. Moreover, the cost of expanding production capacity could have a negative impact on our financial results until capacity utilization is sufficient to absorb the incremental costs associated with the expansion.
Our business strategies are based on our assumptions about future demand for our products and on our continuing ability to produce our products profitably. Each of these factors depends, among other things,
26
on our ability to finance our operations, maintain high-quality and efficient manufacturing operations, respond to competitive and regulatory changes, access quality raw materials in a cost-effective and timely manner, and retain and attract highly skilled technical, managerial, marketing and finance personnel. Any failure to develop, revise or implement our business strategies in a timely and effective manner may adversely affect our business, financial condition, results of operations or cash flows.
Pricing for graphite electrodes has historically been cyclical and, in the future, the price of graphite electrodes will likely decline from recent record highs.
Pricing for graphite electrodes has historically been cyclical, reflecting the demand trends of the global EAF steelmaking industry and the supply of graphite electrodes. In addition, as petroleum needle coke reflects a significant percentage of the raw material cost of graphite electrodes, graphite electrodes have historically been priced at a spread to petroleum needle coke, which in the past has increased in tight demand markets. Historically, between 2006 and 2016, our weighted average realized price of graphite electrodes was approximately $4,500 per MT (on an inflation-adjusted basis using constant 2017 dollars).
During the most recent demand trough, our weighted average realized price of graphite electrodes fell to approximately $2,500 per MT in 2016, on an inflation-adjusted basis using constant 2017 dollars. Following the significant rationalization of graphite electrode production globally, the resumption of growth in EAF steel production, falling scrap prices, reductions in Chinese steel production and constrained supply of needle coke, graphite electrode prices have recently reached record highs. For example, graphite electrode industry spot prices reached record levels of as high as $15,000 to $30,000 per MT in the first quarter of 2018. As of March 1, 2018, we have executed three- to five-year take-or-pay contracts, representing approximately 60% to 65% of our production capacity from 2018 through 2022. The weighted average contract price for the contracted volumes over the next five years is approximately $9,700 per MT. If spot prices remain above our contract prices, our profitability may be negatively impacted compared to what it would have been if we had sold the contracted volume in the spot market. However, due to the cyclical nature of graphite electrode pricing, this recent upward pricing trend is likely not sustainable and, as a result, the price for graphite electrodes will likely decline in the future. Our business, financial condition and operating results could be materially and adversely affected to the extent prices for graphite electrodes decline in the future to or below our historical weighted average realized price levels.
Our business and operating results have been and will continue to be sensitive to economic conditions and a downturn in economic conditions may materially adversely affect our business.
Our operations and performance are materially affected by global and regional economic conditions. As described further below, we are dependent on the steel industry, which historically has been highly cyclical and is affected by general economic conditions. An economic downturn may reduce customer demand, reduce prices for our products or inhibit our ability to produce our products, which would negatively affect our operating results. Our business and operating results have also been and will continue to be sensitive to declining consumer and business confidence; fluctuating commodity prices; volatile exchange rates and other challenges that can affect the economy. Our customers may experience deterioration of their businesses, cash flow shortages and difficulty obtaining financing, leading them to delay or cancel plans to purchase our products or seek to renegotiate terms of their supply contracts, and they may not be able to fulfill their obligations to us in a timely fashion. Further, suppliers and other business partners may experience similar conditions, which could impact their ability to fulfill their obligations to us. Also, it could be difficult to find replacements for business partners without incurring significant delays or cost increases. These events would negatively impact our revenues and results of operations.
27
We are dependent on the global steel industry generally and the EAF steel industry in particular, and a downturn in these industries may materially adversely affect our business.
We sell our products primarily to the EAF steel production industry. The steel industry historically has been highly cyclical and is affected significantly by general economic conditions. Significant customers for the steel industry include companies in the automotive, construction, appliance, machinery, equipment and transportation industries, which are industries that were negatively affected by the general economic downturn and the deterioration in financial markets, including severely restricted liquidity and credit availability, in the recent past. In particular, EAF steel production declined approximately 17% from 2008 to 2009 as a result of that general economic downturn and deterioration in financial markets.
In addition, EAF steel production declined approximately 10% from 2011 to 2015 due to global steel production overcapacity driven largely by Chinese BOF steel production. Since 2016, however, the EAF steel market has rebounded strongly and resumed its long-term growth trajectory. Our customers, including major steel producers, have in the past experienced and may again experience downturns or financial distress that could adversely impact our ability to collect our accounts receivable on a timely basis or at all.
Global graphite electrode overcapacity has adversely affected graphite electrode prices in the past, and may adversely affect them again in the future, which could negatively impact our sales, margins and profitability.
Overcapacity in the graphite electrode industry has adversely affected pricing and may do so again. The rapid growth of Chinese steel production after 2010, which was primarily produced from BOF steelmaking, created a significant global oversupply of steel. Chinese steel exports gained market share from EAF producers, creating graphite electrode industry oversupply and inventory de-stocking in this period. Historically, between 2006 and 2016, our weighted average realized price of graphite electrodes was approximately $4,500 per MT (on an inflation-adjusted basis using constant 2017 dollars). During the most recent demand trough, our weighted average realized price fell to approximately $2,500 per MT in 2016. Although Chinese steel production has decreased since 2016 as a result of the enactment of certain Chinese governmental initiatives, any significant future growth in Chinese BOF steel production could once again lead to an oversupply of steel, which would adversely affect the price of graphite electrodes.
An increase in global graphite electrode production capacity that outpaces an increase in demand for graphite electrodes could adversely affect the price of graphite electrodes. Excess production capacity may result in manufacturers producing and exporting electrodes at prices that are lower than prevailing domestic prices, and sometimes at or below their cost of production. Excessive imports into the Americas and EMEA, which collectively make up 90% of our market, can also exert downward pressure on graphite electrode prices, which negatively affects our sales, margins and profitability.
The graphite industry is highly competitive. Our market share, net sales or net income could decline due to vigorous price and other competition.
Competition in the graphite industry (other than, generally, with respect to new products) is based primarily on price, product differentiation and quality, delivery reliability and customer service. Graphite electrodes, in particular, are subject to rigorous price competition. Competition with respect to new products is, and is expected to continue to be, based primarily on price, performance and cost effectiveness, customer service as well as product innovation. Competition could prevent implementation of price increases, require price reductions or require increased spending on research and development, marketing and sales that could adversely affect us. In such a competitive market, changes in market
28
conditions, including customer demand and technological development, could adversely affect our competitiveness, sales and/or profitability.
We are dependent on the supply of petroleum needle coke. Our results of operations could deteriorate if recent disruptions in the supply of petroleum needle coke continue or worsen for an extended period.
Petroleum needle coke is the primary raw material used in the production of graphite electrodes. The supply of petroleum needle coke has been limited starting in the second half of 2017 as the demand for petroleum needle coke has outpaced supply due to increasing demand for petroleum needle coke for use in the production of lithium-ion batteries used in electric vehicles. Seadrift currently provides approximately 75% of our current petroleum needle coke requirements, and we purchase the remaining 25% from a variety of external sources. We plan to rely on Seadrift-produced petroleum needle coke to support the production of the contracted volumes of graphite electrodes under our three- to five-year take-or-pay contracts. As a result, a disruption in Seadrift's production of petroleum needle coke could adversely affect our ability to achieve the anticipated benefits of these contracts if we are forced to purchase petroleum needle coke from external sources at a higher cost to support the production of these contracted volumes. Moreover, although estimates vary as to the duration of this period of tight petroleum needle coke supply, if the current market shortage of petroleum needle coke continues or worsens, we may be unable to acquire sufficient amounts of petroleum needle coke from external sources to support the 25% of our needle coke requirements currently used in the production of graphite electrodes for sale in the spot market. As a result, a continued or worsening disruption in the supply of petroleum needle coke could have a material adverse effect on our business, financial condition, results of operations and cash flows.
We are dependent on supplies of raw materials (in addition to petroleum needle coke) and energy. Our results of operations could deteriorate if those supplies increase in cost or are substantially disrupted for an extended period.
We purchase raw materials and energy from a variety of sources. In many cases, we purchase them under short-term contracts or on the spot market, in each case at fluctuating prices. The availability and price of raw materials and energy may be subject to curtailment or change due to:
- •
- limitations, which may be imposed under new legislation or regulation;
- •
- suppliers' allocations to meet demand from other purchasers during periods of shortage (or, in the case of energy suppliers, extended hot or
cold weather);
- •
- interruptions or cessations in production by suppliers; and
- •
- market and other events and conditions.
Petroleum and coal products, including decant oil and pitch, which are our principal raw materials other than petroleum needle coke, and energy, particularly natural gas, have been subject to significant price fluctuations. For example, Seadrift may not always be able to obtain an adequate quantity of suitable low-sulfur decant oil for the manufacture of petroleum needle coke, and capital may not be available to install equipment to allow use of higher sulfur decant oil (which is more readily available in the United States) if supplies of low-sulfur decant oil become more limited in the future.
We have in the past entered into, and may continue in the future to enter into, derivative contracts and short-duration fixed rate purchase contracts to effectively fix a portion of our exposure to certain products. These strategies may not be available or successful in eliminating our exposure. A substantial increase in
29
raw material or energy prices that cannot be mitigated or passed on to customers or a continued interruption in supply, particularly in the supply of decant oil or energy, would have a material adverse effect on our business, financial condition, results of operations or cash flows.
We are subject to a variety of legal, economic, social and political risks associated with our substantial operations in multiple countries, which could have a material adverse effect on our financial and business operations.
A substantial majority of our net sales are derived from sales outside the United States, and a majority of our operations and our total property, plant and equipment and other long-lived assets are located outside the United States. As a result, we are subject to risks associated with operating in multiple countries, including:
- •
- currency fluctuations and devaluations in currency exchange rates, including impacts of transactions in various currencies, translation of
various currencies into dollars for U.S. reporting and financial covenant compliance purposes, and impacts on results of operations due to the fact that the costs of our non-U.S. operations are
primarily incurred in local currencies while their products are primarily sold in dollars and euros;
- •
- imposition of or increases in customs duties and other tariffs;
- •
- imposition of or increases in currency exchange controls, including imposition of or increases in limitations on conversion of various
currencies into dollars, euros, or other currencies, making of intercompany loans by subsidiaries or remittance of dividends, interest or principal payments or other payments by subsidiaries;
- •
- imposition of or increases in revenue, income or earnings taxes and withholding and other taxes on remittances and other payments by
subsidiaries;
- •
- inflation, deflation and stagflation in any country in which we have a manufacturing facility;
- •
- imposition of or increases in investment or trade restrictions by the United States or other jurisdictions or trade sanctions adopted by the
United States;
- •
- inability to determine or satisfy legal requirements, effectively enforce contract or legal rights, including our rights under our three- to
five-year take-or-pay contracts, and obtain complete financial or other information under local legal, judicial, regulatory, disclosure and other systems; and
- •
- nationalization or expropriation of assets, and other risks that could result from a change in government or government policy, or from other political, social or economic instability.
Any of these risks could have a material adverse effect on our business, financial condition, results of operations or cash flows, and we may not be able to mitigate these effects.
The fluctuation of foreign currency exchange rates could materially harm our financial results.
Changes in foreign currency exchange rates have in the past resulted, and may in the future result, in significant gains or losses. When the currencies of non-U.S. countries in which we have a manufacturing facility decline (or increase) in value relative to the U.S. dollar, this has the effect of reducing (or increasing) the U.S. dollar equivalent cost of sales and other expenses with respect to those facilities. In certain countries in which we have manufacturing facilities, and in certain instances where we price our products for sale in export markets, we sell in currencies other than the dollar. Accordingly, increases (or
30
declines) in value in these currencies relative to the U.S. dollar have the effect of increasing (or reducing) our net sales. The result of these effects is to increase (or decrease) operating profit and net income. Additionally, as part of our cash management, we have non-U.S. dollar-denominated intercompany loans between our subsidiaries. These loans are deemed to be temporary and, as a result, remeasurement gains and losses on these loans are recorded as currency gains and losses in other income (expense), net, on the Consolidated Statements of Income. We have in the past entered into, and may in the future enter into, foreign currency derivatives to attempt to manage exposure to changes in currency exchange rates. These hedges may be insufficient or ineffective in protecting against the impact of these fluctuations. We also may purchase or sell these financial instruments, and open and close hedges or other positions, at any time. Fluctuations in foreign currency exchange rates could materially harm our financial results.
Our results of operations could deteriorate if our manufacturing operations were substantially disrupted for an extended period for any reason, including equipment failure, climate change, natural disasters, public health crises, political crises or other catastrophic events.
Our manufacturing operations are subject to disruption due to equipment failure, extreme weather conditions, floods, hurricanes and tropical storms and similar events, major industrial accidents, including fires or explosions, cybersecurity attacks, strikes and lockouts, adoption of new laws or regulations, changes in interpretations of existing laws or regulations or changes in governmental enforcement policies, civil disruption, riots, terrorist attacks, war, public health crises and other events. These events may also impact the operations of one or more of our suppliers. For example, the potential physical impacts of climate change on our operations are uncertain and will likely be particular to the geographic circumstances. These physical impacts may include changes in rainfall and storm patterns, shortages of water or other natural resources, changing sea levels, and changing global average temperatures. For instance, our Seadrift facility in Texas and our Calais facility in France are located in geographic areas less than 50 feet above sea level. As a result, any future rising sea levels could have an adverse impact on their operations and on their suppliers. In addition, our three operating manufacturing facilities are currently operating at or near full production capacity. As a result, in the event manufacturing operations are substantially disrupted at one of our operating facilities, we will not have the ability to increase production at our remaining operating facilities in order to compensate. To the extent any of these events occur, our business, financial condition and operating results could be materially and adversely affected.
Plant production capacity expansions may be delayed or may not achieve the expected benefits.
Our ability to complete currently planned or future production capacity expansions, including our operational improvement and debottlenecking initiative and the potential restart of our St. Marys plant, may be delayed, interrupted or otherwise limited by the need to obtain environmental and other regulatory approvals, unexpected cost increases, availability of labor and materials, unforeseen hazards such as weather conditions, and other risks customarily associated with construction projects. For example, the potential restart of our St. Marys plant will be substantially dependent on the availability of external sources of petroleum needle coke. Moreover, the costs of these activities could have a negative impact on our results of operations, particularly until capacity utilization at the facility is sufficient to absorb the incremental costs of expansion. In addition, completed capacity expansions may not achieve the expected benefits as a result of changes in market conditions, raw material shortages or other unforeseen contingencies.
31
We depend on third parties for certain construction, maintenance, engineering, transportation, warehousing and logistics services.
We contract with third parties for certain services relating to the design, construction and maintenance of various components of our production facilities and other systems. If these third parties fail to comply with their obligations, we may experience delays in the completion of expansions of existing facilities or the facilities may not operate as intended, which may result in delays in the production of our products and materially adversely affect our ability to meet our production targets and satisfy customer requirements or we may be required to recognize impairment charges. In addition, production delays could cause us to miss deliveries and breach our contracts, which could damage our relationships with our customers and subject us to claims for damages under our contracts. Any of these events could have a material adverse effect on our business, financial condition, results of operations or cash flows.
We also rely primarily on third parties for the transportation of the products we manufacture. In particular, a significant portion of the goods we manufacture are transported to different countries, which requires sophisticated warehousing, logistics and other resources. If any of the third parties that we use to transport products are unable to deliver the goods we manufacture in a timely manner, we may be unable to sell these products at full value or at all, which could cause us to miss deliveries and breach our contracts, which could damage our relationships with our customers and subject us to claims for damages under our contracts. Any of these events could have a material adverse effect on our business, financial condition, results of operations or cash flows.
We may not be able to recruit or retain key management and plant operating personnel.
Our success is dependent on the management and leadership skills of our key management and plant operating personnel. Following the completion of our acquisition by Brookfield, our management team has been reorganized, including the establishment of new positions reporting directly to the chief executive officer, and significant competencies have been added to the management team to further strengthen our business. The loss of any member of our reorganized key management team and personnel or an inability to attract, retain, develop and maintain additional personnel could prevent us from implementing our business strategy. In addition, our future growth and success also depend on our ability to attract, train, retain and motivate skilled managerial, sales, administration, operating and technical personnel. The loss of one or more members of our key management or plant operating personnel, or the failure to attract, retain and develop additional key personnel, could have a material adverse effect on our business, financial condition, results of operations or cash flows.
If we are unable to successfully negotiate with the representatives of our employees, including labor unions, we may experience strikes and work stoppages.
We are party to collective bargaining agreements and similar agreements with our employees. As of December 31, 2017, approximately 718 employees, or 55%, of our worldwide employees, are covered by collective bargaining or similar agreements. As of December 31, 2017, approximately 716 employees, or 55% of our worldwide employees, were covered by agreements that expire, or are subject to renegotiation, at various times through December 31, 2018. Although we believe that, in general, our relationships with our employees are good, we cannot predict the outcome of current and future negotiations and consultations with employee representatives, which could have a material adverse effect on our business. We may not succeed in renewing or extending these agreements on terms satisfactory to us. Although we have not had any material work stoppages or strikes during the past decade, they may occur in the future during renewal or extension negotiations or otherwise. A material work stoppage, strike or other union dispute could adversely affect our business, financial condition, results of operations and cash flows.
32
We may divest or acquire businesses, which could require significant management attention or disrupt our business.
We may divest or acquire businesses to rationalize or expand our businesses and enhance our cash flows. For example, on February 26, 2016, we announced a strategic review of our Engineered Solutions businesses to better direct its resources and simplify its operations. The disposition of those businesses was substantially complete by the end of the third quarter of 2017.
Any acquisitions that we are able to identify and complete may involve a number of risks, including:
- •
- our inability to successfully or profitably integrate, operate, maintain and manage our newly acquired operations or employees;
- •
- the diversion of our management's attention from our existing business;
- •
- possible material adverse effects on our results of operations during the integration process;
- •
- becoming subject to contingent or other liabilities, including liabilities arising from events or conduct predating the acquisition that were
not known to us at the time of the acquisition; and
- •
- our possible inability to achieve the intended objectives of the transaction, including the inability to achieve cost savings and synergies.
Any divestitures may also involve a number of risks, including the diversion of management's attention, significant costs and expenses, the loss of customer relationships and cash flow, and the disruption of the affected business or business operations. Failure to timely complete or to consummate an acquisition or a divestiture may negatively affect the valuation of the affected business or business operations or result in restructuring charges.
We have significant goodwill on our balance sheet that is sensitive to changes in the market, which could result in impairment charges.
We have $171.1 million of goodwill on our balance sheet as of December 31, 2017. Our annual impairment test of goodwill was performed in the fourth quarter of 2017. The estimated fair values of our reporting units were based on discounted cash flow models derived from internal earnings forecasts and assumptions. The assumptions and estimates used in these valuations incorporated the current and expected economic environment. In that annual impairment test, our graphite electrode reporting unit's fair value exceeded its carrying value. During the first quarter of 2015, as a result of our ongoing monitoring of triggering events, we recorded a goodwill impairment charge in our petroleum needle coke reporting unit totaling $35.4 million. A deterioration in the global economic environment or in any of the input assumptions in our calculation could adversely affect the fair value of our reporting units and result in further impairment of some or all of the goodwill on the balance sheet.
We may be subject to information technology systems failures, cybersecurity attacks, network disruptions and breaches of data security, which could compromise our information and expose us to liability.
Our information technology systems are an important element for effectively operating our business. Information technology systems failures, including risks associated with any failure to maintain or upgrade our systems, network disruptions and breaches of data security could disrupt our operations by impeding our processing of transactions, our ability to protect customer or company information or our financial reporting, leading to increased costs. It is possible that future technological developments could adversely
33
affect the functionality of our computer systems and require further action and substantial funds to prevent or repair computer malfunctions. Our computer systems, including our back-up systems, could be damaged or interrupted by power outages, computer and telecommunications failures, computer viruses, cybercrimes, internal or external security breaches, events such as fires, earthquakes, floods, tornadoes and hurricanes, or errors by our employees. Although we have taken steps to address these concerns by implementing network security, back-up systems and internal control measures, these steps may be insufficient or ineffective and a system failure or data security breach could have a material adverse effect on our business, financial condition, results of operations or cash flows.
Further, we collect data, including personally identifiable information of our employees, in the course of our business activities and transfer such data between our affiliated entities, to and from our business partners and to third-party service providers, which may be subject to global data privacy laws and cross-border transfer restrictions. While we take steps to comply with these legal requirements, any changes to such laws may impact our ability to effectively transfer data across borders in support of our business operations and any breach of such laws may lead to administrative, civil or criminal liability, as well as reputational harm to the Company and its employees. For example, the European Union's General Data Protection Regulation (GDPR), which is enforceable as of May 25, 2018, introduces a number of new obligations for subject companies, including obligations relating to data transfers and the security of personal data they process. We take steps to protect the security and integrity of the information we collect, but there is no guarantee that the steps we have taken will prevent inadvertent or unauthorized use or disclosure of such information, or prevent third parties from gaining unauthorized access to this information despite our efforts. Any such incident could result in legal claims or proceedings, liability under laws that protect the privacy of personally identifiable information (including the GDPR) and damage to our reputation.
The cost of ongoing compliance with global data protection and privacy laws and the potential fines and penalties levied in the event of a breach of such laws may have an adverse effect on our business and operations. For example, the GDPR currently provides that supervisory authorities in the European Union may impose administrative fines for non-compliance of up to €20,000,000 or 4% of the subject company's annual, group-wide turnover (whichever is higher) and individuals who have suffered damage as a result of a subject company's non-compliance with the GDPR also have the right to seek compensation from such company. We will need to continue dedicating financial resources and management time to compliance efforts with respect to global data protection and privacy laws, including the GDPR.
Our ability to grow and compete effectively depends on protecting our intellectual property. Failure to protect our intellectual property could adversely affect our business.
We believe that our intellectual property, consisting primarily of patents and proprietary know-how and information, is important to our growth. Failure to protect our intellectual property may result in the loss of the exclusive right to use our technologies. We rely on patent, trademark, copyright and trade secret laws and confidentiality and restricted use agreements to protect our intellectual property. However, some of our intellectual property is not covered by any patent or patent application or any such agreement. Intellectual property protection does not protect against technological obsolescence due to developments by others or changes in customer needs.
Patents are subject to complex factual and legal considerations. Accordingly, the validity, scope and enforceability of any particular patent can be uncertain. Therefore, we cannot assure you that:
- •
- any of the U.S. or non-U.S. patents now or hereafter owned by us, or that third parties have licensed to us or may in the future license to us, will not be circumvented, challenged or invalidated;
34
- •
- any of the U.S. or non-U.S. patents that third parties have non-exclusively licensed to us, or may non-exclusively license to us in the future,
will not be licensed to others; or
- •
- any of the patents for which we have applied or may in the future apply will be issued at all or with the breadth of claim coverage we seek.
Moreover, patents, even if valid, only provide protection for a specified limited duration. In addition, effective patent, trademark and trade secret protection may be limited or unavailable or we may not apply for it in the United States or in any of the other countries in which we operate.
The protection of our intellectual property rights may be achieved, in part, by prosecuting claims against others who we believe have misappropriated our technology or have infringed upon our intellectual property rights, as well as by defending against misappropriation or infringement claims brought by others against us. Our involvement in litigation to protect or defend our rights in these areas could result in a significant expense to us, adversely affect the development of sales of the related products, and divert the efforts of our technical and management personnel, regardless of the outcome of such litigation.
We cannot assure you that agreements designed to protect our proprietary know-how and information will not be breached, that we will have adequate remedies for any such breach, or that our strategic alliance suppliers and customers, consultants, employees or others will not assert rights against us with respect to intellectual property arising out of our relationships with them.
Third parties may claim that our products or processes infringe their intellectual property rights, which may cause us to pay unexpected litigation costs or damages or prevent us from selling our products or services.
From time to time, we may become subject to legal proceedings, including allegations and claims of alleged infringement or misappropriation by us of the patents and other intellectual property rights of third parties. We cannot assure you that the use of our patented technology or proprietary know-how or information does not infringe the intellectual property rights of others. In addition, attempts to enforce our own intellectual property claims may subject us to counterclaims that our intellectual property rights are invalid, unenforceable or are licensed to the party against whom we are asserting the claim or that we are infringing that party's alleged intellectual property rights. We may also be obligated to indemnify affiliates or other partners who are accused of violating third parties' intellectual property rights by virtue of those affiliates or partners' agreements with us, and this could increase our costs in defending such claims and our damages.
Legal proceedings involving intellectual property rights, regardless of merit, are highly uncertain and can involve complex legal and scientific analyses, can be time consuming, expensive to litigate or settle and can significantly divert resources, even if resolved in our favor. Our failure to prevail in such matters could result in loss of intellectual property rights or judgments awarding substantial damages and injunctive or other equitable relief against us. If we were to be held liable or discover or be notified that our products or processes potentially infringe or otherwise violate the intellectual property rights of others, we may face a loss of reputation and may not be able to exploit some or all of our intellectual property rights or technology. If necessary, we may seek licenses to intellectual property of others. However, we may not be able to obtain the necessary licenses on terms acceptable to us or at all. Our failure to obtain a license from a third party for that intellectual property necessary for the production or sale of any of our products could cause us to incur substantial liabilities and/or suspend the production or shipment of products or the use of processes requiring the use of that intellectual property. We may be required to substantially re-engineer our products or processes to avoid infringement.
35
Any of the foregoing may require considerable effort and expense, result in substantial increases in operating costs, delay or inhibit sales or preclude us from effectively competing in the marketplace, which in turn could have a material adverse effect on our business and financial results.
Our operations are subject to hazards which could result in significant liability to us.
Our operations are subject to hazards associated with manufacturing and the related use, storage, transportation and disposal of raw materials, products and wastes. These hazards include explosions, fires, severe weather (including but not limited to hurricanes or other adverse weather that may be increasing as a result of climate change) and natural disasters, industrial accidents, mechanical failures, discharges or releases of toxic or hazardous substances or gases, transportation interruptions, human error and terrorist activities. These hazards can cause personal injury and loss of life, severe damage to or destruction of property and equipment as well as environmental damage, and may result in suspension of operations and the imposition of civil and criminal liabilities, including penalties and damage awards. While we believe our insurance policies are in accordance with customary industry practices, such insurance may not cover all risks associated with the hazards of our business and is subject to limitations, including deductibles and maximum liabilities covered. We may incur losses beyond the limits, or outside the coverage, of our insurance policies. In the future, we may not be able to obtain coverage at current levels, and our premiums may increase significantly on coverage that we maintain. Costs associated with unanticipated events in excess of our insurance coverage could have a material adverse effect on our business, competitive or financial position or our ongoing results of operations.
Stringent health, safety and environmental regulations applicable to our manufacturing operations and facilities could result in substantial costs related to compliance, sanctions or material liabilities and may affect the availability of raw materials.
We are subject to stringent environmental, health and safety laws and regulations relating to our current and former properties (including former onsite landfills over which we have retained ownership), other properties that neighbor ours or to which we sent wastes for treatment or disposal, as well as our current raw materials, products, and operations. Some of our products (including our raw materials) are subject to extensive environmental and industrial hygiene regulations governing the registration and safety analysis of their component substances. Coal tar pitch, which is classified as a substance of very high concern under REACH, is used in certain of our processes but in a manner that does not currently require us to obtain a specific authorization from the European Chemicals Agency (or ECHA). Violations of these laws and regulations, or of the terms and conditions of permits required for our operations, can result in damage claims, in the imposition of substantial fines and criminal sanctions and sometimes require the installation of costly pollution control or safety equipment or costly changes in operations to limit pollution or decrease the likelihood of injuries. In addition, we are currently conducting remediation and/or monitoring at certain current and former properties and may become subject to material liabilities in the future for the investigation and cleanup of contaminated properties, including properties on which we have ceased operations. We have been in the past, and could be in the future, subject to claims alleging personal injury, death or property damage resulting from exposure to hazardous substances, accidents or otherwise for conditions creating an unsafe workplace. Further, alleged noncompliance with or stricter enforcement of, or changes in interpretations of, existing laws and regulations, adoption of more stringent new laws and regulations, discovery of previously unknown contamination or imposition of new or increased requirements could require us to incur costs or become the basis of new or increased liabilities that have a material adverse impact on our operations, costs or results of operations. It is also possible that the impact of safety and environmental regulations on our suppliers could affect the availability and cost of our raw materials.
36
For example, legislators, regulators and others, as well as many companies, are considering ways to reduce emissions of greenhouse gases (or GHGs) due to scientific, political and public concern that GHG emissions are altering the atmosphere in ways that are affecting, and are expected to continue to affect, the global climate. The EU has established GHG regulations and is revising its emission trading system for the period after 2020 in a manner that may require us to incur additional costs. The United States required reporting of greenhouse gas emissions from certain large sources beginning in 2011. Further measures, in the EU and many other countries, may be enacted in the future. In particular, in December 2015, more than 190 countries participating in the United National Framework Convention on Climate Change reached an international agreement related to curbing GHG emissions (or Paris Agreement). Further GHG regulations under the Paris Agreement or otherwise may take the form of a national or international cap-and-trade emissions permit system, a carbon tax, emissions controls, reporting requirements, or other regulatory initiatives. For more information, see the section entitled "Business—Environment."
It is possible that some form of regulation of GHG emissions will also be introduced in the future in other countries in which we operate or market our products. Regulation of GHG emissions could impose additional costs, both direct and indirect, on our business, and on the businesses of our customers and suppliers, such as increased energy and insurance rates, higher taxes, new environmental compliance program expenses, including capital improvements, environmental monitoring and the purchase of emission credits, and other administrative costs necessary to comply with current and potential future requirements or limitations that may be imposed, as well as other unforeseen or unknown costs. To the extent that similar requirements and limitations are not imposed globally, this regulation may impact our ability to compete with companies located in countries that do not have these requirements or limitations. We may also experience a change in competitive position relative to industry peers, changes in prices received for products sold and changes to profit or loss arising from increased or decreased demand for our products. The impact of any future GHG regulatory requirements on our global business will be dependent upon the design of the regulatory schemes that are ultimately adopted and, as a result, we are unable to predict their significance to our operations at this time.
Significant changes in our jurisdictional earnings mix or in the tax laws of those jurisdictions could adversely affect our business, financial condition, results or operations and cash flows.
Our future tax rates may be adversely affected by a number of factors, including the enactment of new tax legislation, other changes in tax laws or the interpretation of tax laws, changes in the estimated realization of our net deferred tax assets (arising, among other things, from tax loss carry forwards and our acquisition by Brookfield), changes to the jurisdictions in which profits are determined to be earned and taxed, adjustments to estimated taxes upon finalization of various tax returns, increases in expenses that are not deductible for tax purposes, including write-offs of acquired in-process R&D and impairment of goodwill in connection with acquisitions, changes in available tax credits and additional tax or interest payments resulting from tax audits with various tax authorities. Losses for which no tax benefits can be recorded could materially impact our tax rate and its volatility from period to period. Any significant change in our jurisdictional earnings mix or in the tax laws in those jurisdictions could increase our tax rates and adversely impact our financial results in those periods.
New tax legislation could adversely affect us or our shareholders
New tax legislation, the Tax Act, was enacted on December 22, 2017. The Tax Act significantly revises the U.S. corporate income tax regime by, among other things:
- •
- lowering corporate income tax rates;
37
- •
- temporarily allowing for immediate expensing of expenditures for certain tangible property;
- •
- repealing the corporate alternative minimum tax;
- •
- implementing a 100% dividends-received deduction on certain dividends from 10% or greater owned foreign subsidiaries;
- •
- imposing an income tax on deemed repatriated earnings of foreign subsidiaries generally as of December 31, 2017 (payable at reduced
rates and potentially over an eight year period);
- •
- imposing tax at a reduced rate on certain income derived by foreign corporate subsidiaries in excess of a deemed return on tangible assets
(i.e., tax on "global intangible low-taxed income" or GILTI);
- •
- imposing limitations on the ability to deduct interest expense and utilize net operating losses (or NOLs), and
- •
- instituting certain proposals to limit base erosion (including the "base erosion anti-abuse tax" or BEAT, and limitations on the deductibility of certain related-party payments).
Although we currently anticipate that the Tax Act and the accompanying changes in the corporate tax rate and calculation of taxable income will have a favorable effect on our financial condition, profitability and cash flows, the overall implications of the Tax Act at this time are uncertain, and it is not possible to predict the full effect of the Tax Act on our business and operations. Thus, the Tax Act and future implementing regulations, administrative guidance or interpretations of the legislation may have unanticipated adverse effects on us or our shareholders.
We will be required to make payments under a tax receivable agreement for certain tax benefits we may claim in the future, and the amounts we may pay could be significant.
Immediately prior to the completion of this offering, we will enter into a tax receivable agreement (or the TRA) that provides the right to receive future payments from us to certain of our stockholders prior to the completion of this offering (or the Existing Stockholders) of 85% of the amount of cash savings, if any, in U.S. federal income tax and Swiss tax that we and our subsidiaries realize as a result of the utilization of certain tax assets attributable to periods prior to our initial public offering, including certain federal net operating losses (or NOLs), previously taxed income under Section 959 of the Internal Revenue Code of 1986, as amended from time to time (or the Code), foreign tax credits, and certain NOLs in GrafTech Switzerland S.A. (or, collectively, the Pre-IPO Tax Assets). In addition, we will pay interest on the payments we will make to the Existing Stockholders with respect to the amount of this cash savings from the due date (without extensions) of our tax return where we realize this savings to the payment date at a rate equal to LIBOR plus 1.00% per annum. The term of the TRA will commence upon consummation of this offering and will continue until there is no potential for any future tax benefit payments.
We expect that, based on current tax laws and taking into account recent changes under the Tax Act, no material payments will be made to our counterparties during the term of the TRA. However, there is still uncertainty surrounding the Tax Act, and it is possible that a change in law or additional implementing regulations, administrative guidance or interpretations of the Tax Act could enable us to utilize our Pre-IPO Tax Assets to reduce future U.S. federal income tax and Swiss tax realized by us and our subsidiaries. If such future events were to occur, and assuming that we and our subsidiaries earn sufficient taxable income to realize the full tax benefits subject to the TRA, we expect that payments under the TRA relating to the Pre-IPO Tax Assets could aggregate to a maximum amount of approximately $100 million. This figure does not account for our Pre-IPO Tax Assets attributable to previously taxed income under
38
Section 959 of the Code, the value of which is highly speculative, and certain NOLs in GrafTech Switzerland S.A., which we expect to have nominal value at the time of this offering. Any payments made by us to our counterparties under the TRA will generally reduce the amount of overall cash flow that might have otherwise been available to us.
For more information about the TRA, see "Certain relationships and related party transactions—Tax Receivable Agreement."
There are material limitations with making estimates of our results for current or prior periods prior to the completion of our normal review procedures for those periods.
The preliminary financial data contained in "Summary" is not a comprehensive statement of our financial data for the two months ended February 28, 2018 or the quarter ended March 31, 2018 and has not been reviewed or audited by our independent registered public accounting firm or any other independent auditors. The actual data for the two months ended February 28, 2018 and the quarter ended March 31, 2018 may vary from our expectations and may be materially different from the preliminary financial estimates we have provided due to completion of monthly or quarterly close procedures, as applicable, final adjustments and other developments that may arise between now and the time the financial data for this period are finalized. In addition, these preliminary results are not necessarily indicative of what our results will be in the year ended December 31, 2018. See "Management Discussion and Analysis of Financial Condition and Results of Operations."
Accordingly, investors should not place undue reliance on this preliminary financial information. If any of these risks were to materialize, our business, results of operations, cash flows and financial condition could be materially adversely affected. The risks referred to above are not the only ones that may exist. Additional risks not currently known by us or that we deem immaterial may also impair our business operations.
Risks related to our indebtedness
Our indebtedness could limit our financial and operating activities and adversely affect our ability to incur additional debt to fund future needs.
On February 12, 2018, we entered into the 2018 Credit Agreement among us, various of our subsidiaries, the lenders and issuing banks party thereto and JPMorgan Chase Bank, N.A. as administrative agent and as collateral agent, which provides for the Senior Secured Credit Facilities. The 2018 Revolving Credit Facility may be used from time to time for revolving credit borrowings denominated in dollars or Euro, the issuance of one or more letters of credit denominated in dollars, Euro, Pounds Sterling or Swiss Francs and one or more swing line loans denominated in dollars. On February 12, 2018, our wholly owned subsidiary, GrafTech Finance, borrowed $1,500 million aggregate principal of the 2018 Term Loans. The 2018 Term Loans mature on February 12, 2025. The maturity date for the 2018 Revolving Credit Facility is February 12, 2023. Funds received were used to pay off our outstanding debt, including borrowings under our existing credit agreement and the Senior Notes and accrued interest relating to such borrowings and the Senior Notes, declare and pay a dividend to Brookfield and pay fees and expenses incurred in connection therewith and for other general corporate purposes. As of February 12, 2018, we had $1,500 million of indebtedness outstanding, with $250 million available for borrowing under the 2018 Revolving Credit Facility (of which approximately $8.2 million was used as of such date for outstanding letters of credit).
39
Applying an interest rate of one month LIBOR as of February 28, 2018, our interest expense for the borrowings under the 2018 Term Loans, had the 2018 Term Loans been in place since January 1, 2017, would have totaled approximately $77.6 million for the year ended December 31, 2017. Actual interest expense for the year ended December 31, 2017 was approximately $30.8 million.
This substantial amount of indebtedness could:
- •
- require us to dedicate a substantial portion of our cash flow to the payment of principal and interest, thereby reducing the funds available
for operations and future business opportunities;
- •
- make it more difficult for us to satisfy our obligations;
- •
- limit our ability to borrow additional money if needed for other purposes, including working capital, capital expenditures, debt service
requirements, acquisitions and general corporate or other purposes, on satisfactory terms or at all;
- •
- limit our ability to adjust to changing economic, business and competitive conditions;
- •
- place us at a competitive disadvantage with competitors who may have less indebtedness or greater access to financing;
- •
- make us more vulnerable to an increase in interest rates, a downturn in our operating performance or a decline in general economic conditions;
and
- •
- make us more susceptible to changes in credit ratings, which could impact our ability to obtain financing in the future and increase the cost of such financing.
Compliance with our debt obligations under the Senior Secured Credit Facilities could materially limit our financial or operating activities, or hinder our ability to adapt to changing industry conditions, which could result in our losing market share, a decline in our revenue or a negative impact on our operating results.
The 2018 Credit Agreement includes covenants that could restrict or limit our financial and business operations.
The 2018 Credit Agreement contains a number of restrictive covenants that, subject to certain exceptions and qualifications, restrict or limit our ability and the ability of our subsidiaries to, among other things:
- •
- incur, repay or refinance indebtedness;
- •
- create liens on or sell our assets;
- •
- engage in certain fundamental corporate changes or changes to our business activities;
- •
- make investments or engage in mergers or acquisitions;
- •
- pay dividends or repurchase stock;
- •
- engage in certain affiliate transactions;
- •
- enter into agreements or otherwise restrict our subsidiaries from making distributions or paying dividends to the borrowers under the Senior
Secured Credit Facilities; and
- •
- repay intercompany indebtedness or make intercompany distributions or pay intercompany dividends.
40
The 2018 Credit Agreement also contains certain affirmative covenants and contains a financial covenant that requires us to maintain a senior secured first lien net leverage ratio not greater than 4.00:1.00 when the aggregate principal amount of borrowings under the 2018 Revolving Credit Facility and outstanding letters of credit issued under the 2018 Revolving Credit Facility (except for undrawn letters of credit in an aggregate amount equal to or less than $35 million), taken together, exceed 35% of the total amount of commitments under the 2018 Revolving Credit Facility.
These covenants and restrictions could affect our ability to operate our business, and may limit our ability to react to market conditions or take advantage of potential business opportunities as they arise. Additionally, our ability to comply with these covenants may be affected by events beyond our control, including general economic and credit conditions and industry downturns.
If we fail to comply with the covenants in the 2018 Credit Agreement and are unable to obtain a waiver or amendment, an event of default would result, and the lenders and noteholders could, among other things, declare outstanding amounts due and payable or refuse to lend additional amounts to us, or require deposit of cash collateral in respect of outstanding letters of credit. If we were unable to repay or pay the amounts due, the lenders could, among other things, proceed against the collateral granted to them to secure the indebtedness, which includes substantially all of our and our U.S. subsidiaries' assets and certain assets of certain of our non-U.S. subsidiaries.
Our cash flows may not be sufficient to service our indebtedness, and if we are unable to satisfy our obligations under our indebtedness, we may be required to seek other financing alternatives, which may not be successful.
Our ability to make timely payments of principal and interest on our debt obligations, including our obligations under the Senior Secured Credit Facilities, depends on our ability to generate positive cash flows from operations, which is subject to general economic conditions, competitive pressures and certain financial, business and other factors beyond our control. If our cash flows and capital resources are insufficient to make these payments, we may be required to seek additional financing sources, reduce or delay capital expenditures, sell assets or operations or refinance our indebtedness. These actions could have a material adverse effect on our business, financial conditions and results of operations. In addition, we may not be able to take any of these actions, and, even if successful, these actions may not permit us to meet our scheduled debt service obligations. Our ability to restructure or refinance the debt under the Senior Secured Credit Facilities will depend on, among other things, the condition of the capital markets and our financial condition at the time. We may not be able to restructure or refinance any of our indebtedness on commercially reasonable terms or at all. If we cannot make scheduled payments on our debt, we will be in default and the outstanding principal and interest on our debt could be declared to be due and payable, in which case we could be forced into bankruptcy or liquidation or required to substantially restructure or alter our business operations or debt obligations.
Borrowings under the Senior Secured Credit Facilities bear interest at a variable rate, which subjects us to interest rate risk, which could cause our debt service obligations to increase significantly.
All of our borrowings under the Senior Secured Credit Facilities are at variable rates of interest and expose us to interest rate risk. If interest rates increase, our debt service obligations on this variable rate indebtedness would increase even if the amount borrowed remains the same.
Additionally, we have in the past entered into, and may in the future enter into, interest rate swaps and caps to attempt to manage interest rate expense. We may purchase or sell these financial instruments, and open and close hedges or other positions, at any time. Changes in interest rates have in the past resulted,
41
and may in the future result, in significant gains or losses. These instruments are marked-to-market monthly and related gains and losses are recorded in Other Comprehensive Income on the Consolidated Balance Sheets.
A lowering or withdrawal of the ratings assigned to our debt by rating agencies may increase our future borrowing costs and reduce our access to capital.
Any rating assigned to our debt could be lowered or withdrawn entirely by a rating agency if, in that rating agency's judgment, future circumstances relating to the basis of the rating, such as adverse changes, so warrant. Any future lowering of our ratings likely would make it more difficult or more expensive for us to obtain additional debt financing. Additionally, we enter into various forms of hedging arrangements against currency, interest rate or decant oil price fluctuations. Financial strength and credit ratings are also important to the availability and pricing of these hedging activities, and a downgrade of our credit ratings may make it more costly for us to engage in these activities.
Disruptions in the capital and credit markets, which may occur at any time, could adversely affect our results of operations, cash flows and financial condition, or those of our customers and suppliers.
Disruptions in the capital and credit markets as a result of uncertainty, changing or increased regulation, reduced alternatives or failures of significant financial institutions could adversely affect our access to liquidity needed to conduct or expand our businesses or conduct acquisitions or make other discretionary investments, as well as our ability to effectively hedge our currency or interest rate risks and exposures, which could adversely impact our business, results of operations, financial condition and cash flows. These disruptions may also adversely impact the financial position of our customers and suppliers, which, in turn, could adversely affect our results of operations, financial condition and cash flows.
Risks related to our common stock
If the ownership of our common stock continues to be highly concentrated, it may prevent minority stockholders from influencing significant corporate decisions and may result in conflicts of interest.
Following the completion of this offering, Brookfield will own approximately % of our outstanding common stock, or % if the underwriters' overallotment option is fully exercised. As a result, Brookfield will own shares sufficient for the majority vote over all matters requiring a stockholder vote, including the election of directors; mergers, consolidations and acquisitions; the sale of all or substantially all of our assets and other decisions affecting our capital structure; the amendment of our existing Amended and Restated Certificate of Incorporation (or Certificate of Incorporation) and our existing Amended and Restated By-Laws (or By-Laws); and our winding up and dissolution. This concentration of ownership may delay, deter or prevent acts that would be favored by our other stockholders. The interests of Brookfield may not always coincide with our interests or the interests of our other stockholders. This concentration of ownership may also have the effect of delaying, preventing or deterring a change in control. Also, Brookfield may seek to cause us to take courses of action that, in its judgment, could enhance its investment in us, but that might involve risks to our other stockholders or adversely affect us or our other stockholders, including investors in this offering. As a result, the market price of our common stock could decline or stockholders might not receive a premium over the then-current market price of our common stock upon a change in control. In addition, this concentration of share ownership may adversely affect the trading price of our common stock because investors may perceive disadvantages in owning shares in a company with significant stockholders.
42
Certain of our stockholders have the right to engage or invest in the same or similar businesses as us.
Brookfield has other investments and business activities in addition to their ownership of us. Brookfield has the right, and has no duty to abstain from exercising such right, to engage or invest in the same or similar businesses as us, do business with any of our clients, customers or vendors or employ or otherwise engage any of our officers, directors or employees. If Brookfield or any of its officers, directors or employees acquire knowledge of a potential transaction that could be a corporate opportunity, they have no duty, to the fullest extent permitted by law, to offer such corporate opportunity to us, our stockholders or our affiliates.
In the event that any of our directors and officers who is also a director, officer or employee of Brookfield acquires knowledge of a corporate opportunity or is offered a corporate opportunity, provided that this knowledge was not acquired solely in such person's capacity as our director or officer and such person acts in good faith, then to the fullest extent permitted by law such person is deemed to have fully satisfied such person's fiduciary duties owed to us and is not liable to us, if Brookfield pursues or acquires the corporate opportunity or if Brookfield does not present the corporate opportunity to us.
We may not pay cash dividends on our common stock.
Following this offering, we expect to pay cash dividends on our common stock in accordance with our dividend policy. However, our board of directors may, in its sole discretion, change the amount or frequency of dividends or discontinue the payment of dividends entirely. Any future determination to pay dividends on our common stock will be subject to the approval of our board of directors and will depend upon many factors, including our financial position and liquidity, results of operations, legal requirements, restrictions that may be imposed by the terms of our current and future credit facilities and other debt obligations and other factors deemed relevant by our board of directors. As a result, we cannot assure you that we will pay dividends at any rate or at all. Our ability to pay dividends on our common stock is limited by the terms of the 2018 Credit Agreement. In the future, we may also enter into other credit agreements or other borrowing arrangements or issue debt securities that, in each case, restrict or limit our ability to pay cash dividends on our common stock. In addition, since we are a holding company with no operations of our own, our ability to pay dividends is dependent on the ability of our subsidiaries to make distributions to us. Their ability to make such distributions will be subject to their operating results, cash requirements and financial condition. Any change in the level of our dividends or the suspension of the payment thereof could adversely affect the market price of our common stock. See "Dividend Policy."
Certain provisions, including in the Amended and Restated Certificate of Incorporation and the Amended and Restated By-Laws that we intend to adopt in connection with this offering, could hinder, delay or prevent a change in control, which could adversely affect the price of our common stock.
Our Amended and Restated Certificate of Incorporation (or Amended Certificate of Incorporation) and Amended and Restated By-Laws (or Amended By-Laws) will contain provisions that could make it more difficult for a third party to acquire us without the consent of our board of directors or Brookfield, including:
- •
- provisions in our Amended Certificate of Incorporation and Amended By-Laws that prevent stockholders from calling special meetings of our
stockholders, except where the Delaware General Corporation Law (or the DGCL) confers the right to fix the date of such meetings upon shareholders;
- •
- advance notice requirements by stockholders with respect to director nominations and actions to be taken at annual meetings;
43
- •
- certain rights of Brookfield with respect to the designation of directors for nomination and election to our board of directors;
- •
- no provision in our Amended Certificate of Incorporation or Amended By-Laws will provide for cumulative voting in the election of directors,
which means that the holders of a majority of the outstanding shares of our common stock can elect all the directors standing for election;
- •
- under our Amended Certificate of Incorporation, our board of directors will have authority to cause the issuance of preferred stock from time
to time in one or more series and to establish the terms, preferences and rights of any such series of preferred stock, all without approval of our stockholders; and
- •
- nothing in our Amended Certificate of Incorporation will preclude future issuances without stockholder approval of the authorized but unissued shares of our common stock.
These provisions may make it difficult and expensive for a third party to pursue a tender offer, change in control or takeover attempt that is opposed by Brookfield, our management or our board of directors. Public shareholders who might desire to participate in these types of transactions may not have an opportunity to do so, even if the transaction is favorable to shareholders. These anti-takeover provisions could substantially impede the ability of public shareholders to benefit from a change in control or to change our management and board of directors and, as a result, may adversely affect the market price of our common stock and your ability to realize any potential change of control premium.
In addition, in the event of certain changes in control, including if Brookfield's ownership of our outstanding common stock were to fall below 30%, payments to certain of our senior management may be triggered under certain of our compensation arrangements, which could have an adverse impact on us.
Our Amended Certificate of Incorporation will provide that the Court of Chancery of the State of Delaware will be the exclusive forum for substantially all disputes between us and our stockholders, which could limit our stockholders' ability to obtain a favorable judicial forum for disputes with us or our directors, officers, or employees.
Our Amended Certificate of Incorporation will provide that the Court of Chancery of the State of Delaware is the exclusive forum for:
- •
- any derivative action or proceeding brought on our behalf;
- •
- any action asserting a breach of fiduciary duty;
- •
- any action asserting a claim against us arising under the DGCL, our Amended Certificate of Incorporation, or our Amended By-Laws; and
- •
- any action asserting a claim against us that is governed by the internal-affairs doctrine.
This exclusive forum provision may limit a stockholder's ability to bring a claim in a judicial forum that it finds favorable for disputes with us or our directors, officers, or other employees, which may discourage lawsuits against us and our directors, officers, and other employees. If a court were to find the exclusive forum provision in our Amended Certificate of Incorporation to be inapplicable or unenforceable in an action, we may incur additional costs associated with resolving the dispute in other jurisdictions, which could harm our business.
44
We expect to be a "controlled company" within the meaning of the NYSE corporate governance standards and would qualify for exemptions from certain corporate governance requirements.
Because Brookfield will own a majority of our outstanding common stock following the completion of this offering, we expect to be a "controlled company" as that term is set forth in the NYSE corporate governance standards. Under these rules, a company of which more than 50% of the voting power is held by another person or group of persons acting together is a "controlled company" and may elect not to comply with certain corporate governance requirements, including:
- •
- the requirement that a majority of our board of directors consist of independent directors;
- •
- the requirement that our governance committee be composed entirely of independent directors with a written charter addressing the committee's
purpose and responsibilities; and
- •
- the requirement that our compensation committee be composed entirely of independent directors with a written charter addressing the committee's purpose and responsibilities.
These requirements will not apply to us as long as we remain a "controlled company." Following this offering, we may utilize some or all of these exemptions. Accordingly, you may not have the same protections afforded to stockholders of companies that are subject to all of the NYSE corporate governance requirements. Brookfield's significant ownership interest could adversely affect investors' perceptions of our corporate governance.
The reduced disclosure requirements applicable to us as an "emerging growth company" under the JOBS Act may make our common stock less attractive to investors.
We are an "emerging growth company" under the JOBS Act until the earliest of:
- •
- the last day of the fiscal year during which we had total annual gross revenues of $1.07 billion or more;
- •
- the last day of the fiscal year following the fifth anniversary of the completion of this offering;
- •
- the date on which we have issued more than $1.0 billion in non-convertible debt during the previous three-year period; or
- •
- the date on which we are deemed a "large accelerated filer" as defined under the federal securities laws.
For so long as we remain an "emerging growth company," we may take advantage of certain exemptions from various reporting requirements that are applicable to other public companies, including, but not limited to, not being required to comply with the auditor attestation requirements of Section 404 of the Sarbanes-Oxley Act of 2002, reduced disclosure obligations regarding executive compensation in our periodic reports and proxy statements and exemptions from the requirements of holding a nonbinding advisory vote on certain executive compensation matters, such as "say on pay" and "say on frequency." As a result, our stockholders may not have access to certain information that they may deem important.
We cannot predict if investors will find our common stock less attractive as a result of our taking advantage of these exemptions. If they do, there may be a less active trading market for our common stock and our stock price may be more volatile.
45
There is no current trading market for our common stock and an active and liquid market for our common stock may never develop or be sustained.
Although we have applied to have our common stock approved for listing on the NYSE, an active trading market for our common stock may not develop on that exchange or elsewhere or, if it does develop, that market may not be sustained. In that case, the liquidity of our common stock, your ability to sell your shares of common stock when desired and the prices that you may obtain for your shares of common stock would be adversely affected.
The market price and trading volume of our common stock may be volatile, which could result in rapid and substantial losses for our stockholders.
Even if an active trading market develops, the market price of our common stock may be highly volatile and could be subject to wide fluctuations. In addition, the trading volume in our common stock may fluctuate and cause significant price variations to occur. The initial public offering price of our common stock has been determined by negotiation between us and the representatives of the underwriters based on a number of factors and may not be indicative of prices that will prevail in the open market following completion of this offering. If the market price of our common stock declines significantly, you may be unable to resell your shares at or above your purchase price, if at all. The market price of our common stock may fluctuate or decline significantly in the future. Some of the factors that could negatively affect our share price or result in fluctuations in the price or trading volume of our common stock include:
- •
- variations in our quarterly or annual operating results;
- •
- changes in our earnings estimates (if provided) or differences between our actual financial and operating results and those expected by
investors and analysts;
- •
- the contents of published research reports about us or our industry or the failure of securities analysts to cover our common stock after this
offering;
- •
- additions or departures of key management personnel;
- •
- any increased indebtedness we may incur in the future;
- •
- announcements by us or others and developments affecting us;
- •
- actions by institutional stockholders;
- •
- litigation and governmental investigations;
- •
- changes in market valuations of similar companies;
- •
- speculation or reports by the press or investment community with respect to us or our industry in general;
- •
- increases in market interest rates that may lead purchasers of our shares to demand a higher yield;
- •
- announcements by us or our competitors of significant contracts, acquisitions, dispositions, strategic relationships, joint ventures or capital
commitments; and
- •
- general market, political and economic conditions, including any such conditions and local conditions in the markets in which our customers are located.
46
These broad market and industry factors may decrease the market price of our common stock, regardless of our actual operating performance. The stock market in general has from time to time experienced extreme price and volume fluctuations, including in recent months. In addition, in the past, following periods of volatility in the overall market and the market price of a company's securities, securities class action litigation has often been instituted against these companies. This litigation, if instituted against us, could result in substantial costs and a diversion of our management's attention and resources.
Future offerings of debt or equity securities by us may adversely affect the market price of our common stock.
In the future, we may attempt to obtain financing or to further increase our capital resources by issuing additional shares of our common stock or offering debt or other equity securities, including commercial paper, medium-term notes, senior or subordinated notes, debt securities convertible into equity or shares of preferred stock. Future acquisitions could require substantial additional capital in excess of cash from operations. We would expect to finance any future acquisitions through a combination of additional issuances of equity, corporate indebtedness, asset-backed acquisition financing and/or cash from operations.
Issuing additional shares of our common stock or other equity securities or securities convertible into equity may dilute the economic and voting rights of our existing stockholders or reduce the market price of our common stock or both. Upon liquidation, holders of such debt securities and preferred shares, if issued, and lenders with respect to other borrowings would receive a distribution of our available assets prior to the holders of our common stock. Debt securities convertible into equity could be subject to adjustments in the conversion ratio pursuant to which certain events may increase the number of equity securities issuable upon conversion. Preferred shares, if issued, could have a preference with respect to liquidating distributions or a preference with respect to dividend payments that could limit our ability to pay dividends to the holders of our common stock. Our decision to issue securities in any future offering will depend on market conditions and other factors beyond our control, which may adversely affect the amount, timing or nature of our future offerings. Thus, holders of our common stock bear the risk that our future offerings may reduce the market price of our common stock and dilute their stockholdings in us.
The market price of our common stock could be negatively affected by sales of substantial amounts of our common stock in the public markets.
After this offering, there will be shares of common stock outstanding. This number includes the shares that Brookfield is selling in this offering (or shares if the underwriters exercise their overallotment option in full), which will be freely transferable. Following completion of the offering, approximately % of our outstanding common stock (or % if the underwriters exercise their overallotment option in full) will be held by Brookfield and can be resold into the public markets in the future in accordance with the requirements of Rule 144. See "Shares Eligible For Future Sale."
We and our executive officers, directors and Brookfield (who will hold in the aggregate approximately % of our outstanding common stock immediately after the completion of this offering, or % if the underwriters exercise their overallotment option in full) have agreed with the underwriters that, subject to certain exceptions, for a period of 180 days after the date of this prospectus, we and they will not directly or indirectly offer, pledge, sell, contract to sell, sell any option or contract to purchase or otherwise dispose of any common stock or any securities convertible into or exercisable or exchangeable for common stock, or in any manner transfer all or a portion of the economic consequences associated with the ownership of common stock, or cause a registration statement covering any common stock to be filed, without the prior written consent of J.P. Morgan Securities LLC and Credit Suisse Securities
47
(USA) LLC. See "Underwriting." J.P. Morgan Securities LLC and Credit Suisse Securities (USA) LLC may waive these restrictions at their discretion.
The market price of our common stock may decline significantly when the restrictions on resale by our existing stockholders lapse. A decline in the price of our common stock might impede our ability to raise capital through the issuance of additional common stock or other equity securities.
The future issuance of additional common stock in connection with our incentive plans, acquisitions or otherwise will dilute all other stockholdings.
After this offering, we will have an aggregate of shares of common stock authorized but unissued and not reserved for issuance under our incentive plans. We may issue all of these shares of common stock without any action or approval by our stockholders, subject to certain exceptions. We also intend to continue to evaluate acquisition opportunities and may issue common stock in connection with these acquisitions. Any common stock issued in connection with our incentive plans, acquisitions, the exercise of outstanding stock options or otherwise would dilute the percentage ownership held by the investors who purchase common stock in this offering.
As a public company, we will incur additional costs and face increased demands on our management.
Since our acquisition by Brookfield in 2015, we have continued to comply with certain provisions of the Sarbanes-Oxley Act and regulations of the SEC. However, as a public company with shares listed on a U.S. exchange, we will need to comply with additional rules and regulations that have not applied to us since 2015. We expect these rules and regulations to increase our legal and financial compliance costs and to make some activities more time-consuming and costly. For example, as a result of becoming a public company, we intend to add independent directors and create additional board committees. In addition, we will incur additional costs associated with our public company reporting requirements and maintaining directors' and officers' liability insurance. We are currently evaluating and monitoring developments with respect to these rules, which may impose additional costs on us and materially affect our business, financial condition and results of operations.
If securities or industry analysts do not publish research or publish inaccurate or unfavorable research about our business, our stock price and trading volume could decline.
The trading market for our common stock will depend in part on the research and reports that securities or industry analysts publish about us or our business. We do not currently have and may never obtain research coverage by securities and industry analysts. If no securities or industry analysts commence coverage of our Company, the trading price for our common stock would be negatively impacted. If we obtain securities or industry analyst coverage and if one or more of the analysts who covers us downgrades our common stock or publishes inaccurate or unfavorable research about our business, our stock price would likely decline. If one or more of these analysts ceases coverage of us or fails to publish reports on us regularly, demand for our common stock could decrease, which could cause our stock price and trading volume to decline.
48
Special note regarding forward-looking statements
Some of the statements under "Prospectus Summary," "Risk Factors," "Management's Discussion and Analysis of Financial Condition and Results of Operations," "Business," "Industry" and elsewhere in this prospectus may contain forward-looking statements that reflect our current views with respect to, among other things, future events and financial performance. You can identify these forward-looking statements by the use of forward-looking words such as "will," "may," "plan," "estimate," "project," "believe," "anticipate," "expect," "intend," "should," "would," "could," "target," "goal," "continue to," "positioned to" or the negative version of those words or other comparable words. Any forward-looking statements contained in this prospectus are based upon our historical performance and on our current plans, estimates and expectations in light of information currently available to us. The inclusion of this forward-looking information should not be regarded as a representation by us, the selling stockholder, the underwriters or any other person that the future plans, estimates or expectations contemplated by us will be achieved. These forward-looking statements are subject to various risks and uncertainties and assumptions relating to our operations, financial results, financial condition, business, prospects, growth strategy and liquidity. Accordingly, there are or will be important factors that could cause our actual results to differ materially from those indicated in these statements. We believe that these factors include, but are not limited to:
- •
- our history of net losses and the possibility that we may not achieve or maintain profitability in the future;
- •
- the possibility that we are unable to implement our business strategies, including our initiative to secure and maintain three- to five-year
take-or-pay customer contracts, in an effective manner;
- •
- the possibility that new tax legislation could adversely affect us or our shareholders;
- •
- the fact that pricing for graphite electrodes has historically been cyclical and, in the future, the price of graphite electrodes will likely
decline from recent record highs;
- •
- the sensitivity of our business and operating results to economic conditions;
- •
- our dependence on the global steel industry generally and the EAF steel industry in particular;
- •
- the possibility that global graphite electrode overcapacity may adversely affect graphite electrode prices;
- •
- the competitiveness of the graphite electrode industry;
- •
- our dependence on the supply of petroleum needle coke;
- •
- our dependence on supplies of raw materials (in addition to petroleum needle coke) and energy;
- •
- the legal, economic, social and political risks associated with our substantial operations in multiple countries;
- •
- the possibility that fluctuation of foreign currency exchange rates could materially harm our financial results;
- •
- the possibility that our results of operations could deteriorate if our manufacturing operations were substantially disrupted for an extended period, including as a result of equipment failure, climate change, natural disasters, public health crises, political crises or other catastrophic events;
49
- •
- the possibility that plant capacity expansions may be delayed or may not achieve the expected benefits;
- •
- our dependence on third parties for certain construction, maintenance, engineering, transportation, warehousing and logistics services;
- •
- the possibility that we are unable to recruit or retain key management and plant operating personnel or successfully negotiate with the
representatives of our employees, including labor unions;
- •
- the possibility that we may divest or acquire businesses, which could require significant management attention or disrupt our business;
- •
- the sensitivity of goodwill on our balance sheet to changes in the market;
- •
- the possibility that we are subject to information technology systems failures, cybersecurity attacks, network disruptions and breaches of data
security;
- •
- our dependence on protecting our intellectual property;
- •
- the possibility that third parties may claim that our products or processes infringe their intellectual property rights;
- •
- the possibility that our manufacturing operations are subject to hazards;
- •
- changes in, or more stringent enforcement of, health, safety and environmental regulations applicable to our manufacturing operations and
facilities;
- •
- the possibility that significant changes in our jurisdictional earnings mix or in the tax laws of those jurisdictions could adversely affect
our business;
- •
- the fact that there are material limitations with making estimates of our results for current or prior periods prior to the completion of our
normal review procedures;
- •
- the possibility that our indebtedness could limit our financial and operating activities or that our cash flows may not be sufficient to
service our indebtedness;
- •
- the possibility that restrictive covenants in our financing agreements could restrict or limit our operations;
- •
- the possibility that our cash flows are insufficient to service our indebtedness;
- •
- the fact that borrowings under certain of our existing financing agreements subjects us to interest rate risk;
- •
- the possibility of a lowering or withdrawal of the ratings assigned to our debt;
- •
- the possibility that disruptions in the capital and credit markets adversely affect our results of operations, cash flows and financial
condition, or those of our customers and suppliers;
- •
- the possibility that highly concentrated ownership of our common stock may prevent minority stockholders from influencing significant corporate
decisions;
- •
- the fact that certain of our stockholders have the right to engage or invest in the same or similar businesses as us;
- •
- the fact that we do not currently anticipate paying any dividends in the foreseeable future;
50
- •
- the fact that certain provisions of our Amended Certificate of Incorporation and our Amended By-Laws could hinder, delay or prevent a change of
control;
- •
- the fact that the Court of Chancery of the State of Delaware will be the exclusive forum for substantially all disputes between us and our
stockholders;
- •
- our expectation to be a "controlled company" within the meaning of the NYSE corporate governance standards, which would allow us to qualify for
exemptions from certain corporate governance requirements; and
- •
- other risks described in the "Risk Factors" section of this prospectus beginning on page 26.
These factors should not be construed as exhaustive and should be read in conjunction with the other cautionary statements that are included in this prospectus. The forward-looking statements made in this prospectus relate only to events as of the date on which the statements are made. We do not undertake any obligation to publicly update or review any forward-looking statement except as required by law, whether as a result of new information, future developments or otherwise.
If one or more of these or other risks or uncertainties materialize, or if our underlying assumptions prove to be incorrect, our actual results may vary materially from what we may have expressed or implied by these forward-looking statements. We caution that you should not place undue reliance on any of our forward-looking statements. You should specifically consider the factors identified in this prospectus that could cause actual results to differ before making an investment decision to purchase our common stock. Furthermore, new risks and uncertainties arise from time to time, and it is impossible for us to predict those events or how they may affect us.
51
The selling stockholder will receive all of the net proceeds from the sale of shares of our common stock it is offering pursuant to this prospectus. The aggregate proceeds to the selling stockholder from the sale of shares of common stock will be the purchase price of the shares of common stock less discounts and commissions, if any. We will not receive any proceeds from the sale of these shares of common stock, including from any exercise by the underwriters of their option to purchase additional shares. We will bear all costs, fees and expenses in connection with this offering, which are estimated to be $ million, except that the selling stockholder will pay all underwriting discounts. See "Principal Stockholders and Selling Stockholder."
Following this offering, we expect to pay cash dividends on our common stock from time to time, at the sole discretion of our board of directors. We cannot assure you, however, that we will pay any dividends that our board of directors may determine to pay.
Any future determination to pay dividends on our common stock will depend upon many factors, including our financial position and liquidity, results of operations, legal requirements, restrictions that may be imposed by the terms of our current and future credit facilities and other debt obligations and other factors deemed relevant by our board of directors. The timing and amount any future dividend payments will be at the sole discretion of our board of directors.
Our ability to pay dividends on our common stock is limited as a practical matter by the terms of the 2018 Credit Agreement. In the future, we may also enter into other credit agreements or other borrowing arrangements or issue debt securities that, in each case, restrict or limit our ability to pay cash dividends on our common stock. In addition, since we are a holding company with no operations of our own, our ability to pay dividends is dependent on the ability of our subsidiaries to make distributions to us. Their ability to make such distributions will be subject to their operating results, cash requirements and financial condition.
52
Because all of the shares of our common stock to be sold in this offering, including those subject to the underwriters' option to purchase additional shares, will be sold by the selling stockholder, our capitalization will not change as a result of this offering. The following sets forth our cash and cash equivalents and capitalization as of December 31, 2017 on:
- •
- an actual basis; and
- •
- a pro forma basis to give effect (i) to our entrance into the 2018 Credit Agreement and the borrowing of $1,500 million of 2018 Term Loans thereunder in February 2018; and (ii) the use of proceeds therefrom to (x) repay in full all outstanding indebtedness under the Old Credit Agreement, (y) redeem in full the Senior Notes at a redemption price of 101.594% of the principal amount thereof plus accrued and unpaid interest to the date of redemption and (z) declare and pay a dividend to Brookfield of $1,112 million.
You should read this table in conjunction with "Use of Proceeds," "Selected Consolidated Historical Financial Data" and "Management's Discussion and Analysis of Financial Condition and Results of Operations" and our audited consolidated financial statements and related notes and other financial information included elsewhere in this prospectus.
| |
| |
| |
| ||
|---|---|---|---|---|---|---|---|
| | | | | | | ||
| |
| December 31, 2017 |
| Pro Forma |
| ||
| | | | | | | ||
| |
| (thousands) |
| ||||
Cash and cash equivalents |
| $ | 13,365 | | $ | 11,898 | |
| | | | | | | ||
Debt: |
| | | ||||
Credit Facility (Old Revolving Credit Facility and Old Term Loan Facility)(1) |
| 58,192 | | — | | ||
Senior Notes(1) |
| 280,586 | | — | | ||
2018 Credit Agreement(1) |
| — | | 1,476,653 | | ||
Other debt |
| 596 | | 596 | | ||
| | | | | | | ||
Total debt |
| 339,374 | | 1,477,249 | | ||
| | | | | | | ||
Stockholders' equity: |
| | | ||||
Common stock, par value $0.01 per share, 1,000 shares authorized, 100 shares issued(2) |
| — | | — | | ||
Additional paid-in capital |
| 854,337 | | 854,337 | | ||
Accumulated other comprehensive (loss) income |
| 20,289 | | 20,289 | | ||
Accumulated deficit(1) |
| (261,411 | ) | (1,397,607 | ) | ||
| | | | | | | ||
Total stockholders' equity |
| 613,215 | | (522,981 | ) | ||
| | | | | | | ||
Total capitalization |
| $ | 952,589 | | $ | 954,268 | |
| | | | | | | ||
(1) In February 2018, we entered into the 2018 Credit Agreement, which provides for the 2018 Revolving Credit Facility and the 2018 Term Loan Facility. At that time, we also borrowed $1,500 million of 2018 Term Loans under the 2018 Term Loan Facility, the proceeds of which were used, among other things, to repay all outstanding borrowings under the Old Revolving Credit Facility and Old Term Loan Facility (which were then terminated), redeem in full the Senior Notes at a redemption price of 101.594% of the principal amount thereof plus accrued and unpaid interest to the date of redemption and declare and pay a dividend of $1,112 million to Brookfield. In addition, as of December 31, 2017, after giving pro forma effect to the foregoing transactions, we would have also had $241.8 million in availability under the 2018 Revolving Credit Facility (taking into account approximately $8.2 million of outstanding letters of credit issued thereunder). See "Management's Discussion and Analysis of Financial Condition and Results of Operations—Financing Transactions—2018 Credit Agreement."
(2) Does not give effect to the -for- stock split on our common stock to be effected prior to the completion of this offering.
53
If you invest in our common stock, your ownership interest will be diluted to the extent of the difference between the initial public offering price in this offering per share of our common stock and the pro forma as adjusted net tangible book value per share of our common stock upon consummation of this offering. Net tangible book value per share represents the book value of our total tangible assets less the book value of our total liabilities divided by the number of shares of common stock then issued and outstanding.
Our net tangible book value as of , 2018 was approximately $ million, or approximately $ per share based on the shares of common stock issued and outstanding as of such date. Because all of the shares of our common stock to be sold in this offering, including those subject to the underwriters' option to purchase additional shares, will be sold by the selling stockholder, there will be no increase in the number of shares of our common stock outstanding as a result of this offering. After giving effect to our payment of the estimated offering expenses in connection with this offering, our pro forma as adjusted net tangible book value as of , 2018 would have been $ million, or $ per share. This represents an immediate dilution of $ per share to new investors purchasing common stock in this offering. The following table illustrates this dilution per share:
| | | | | | | | |
Assumed initial public offering price per share |
$ | ||||||
Net tangible book value per share as of , 2018 |
$ | ||||||
Decrease in net tangible book value per share attributable to this offering |
|||||||
Pro forma as adjusted net tangible book value per share after giving effect to this offering |
|||||||
Dilution per share to new investors in this offering |
$ | ||||||
| | | | | | | | |
A $1.00 increase (decrease) in the assumed initial public offering price of $ per share (the midpoint of the estimated initial public offering price range set forth on the cover page of this prospectus) would not affect our pro forma as adjusted net tangible book value per share, but would increase or decrease, as applicable, dilution per share to new investors in the offering by $ per share.
The following table summarizes, on a pro forma basis as of , 2018, the differences between the number of shares of common stock purchased, the total price paid and the average price per share paid by existing stockholders and by the new investors in this offering, at an assumed initial public offering price of $ per share (the midpoint of the estimated initial public offering price range set forth on the cover page of this prospectus).
| |
| |
| |
| |
| |
| |
| |||||
|---|---|---|---|---|---|---|---|---|---|---|---|---|---|---|---|---|
| | | | | | | | | | | | | |||||
| |
| Shares purchased | | Total consideration | | Average price per share |
| |||||||||
| |
| Number |
| Percent |
| Amount |
| Percent |
| |||||||
| | | | | | | | | | | | | |||||
| |
| (in thousands) |
| (in thousands) |
| |
| |||||||||
Existing stockholders |
| | % | | $ | | % | | $ | | ||||||
New investors |
| | | | | | ||||||||||
Total |
| | % | | $ | | % | | | |||||||
| | | | | | | | | | | | | |||||
A $1.00 increase (decrease) in the assumed initial offering price would increase (decrease) total consideration paid by new investors and average price per share paid by new investors by $ million and $1.00 per share, respectively. An increase (decrease) of 1.0 million in the number of shares offered by the selling stockholder would increase (decrease) total consideration paid by new investors and average price per share paid by new investors by $ million and $ per share, respectively.
54
Selected historical consolidated financial and other data
The following tables present selected consolidated financial information of the Company. You should read these tables along with "Management's Discussion and Analysis of Financial Condition and Results of Operations," "Business" and our audited consolidated financial statements and the related notes included elsewhere in this prospectus.
The summary consolidated statement of operations data for the years ended December 31, 2017, 2016 and 2015 (January 1, 2015 to August 14, 2015, Predecessor Period, and August 15, 2015 to December 31, 2015, Successor Period) and the summary consolidated balance sheet data at December 31, 2017 and 2016 have been derived from our audited consolidated financial statements included elsewhere in this prospectus. Our historical results are not necessarily indicative of the results to be expected in the future.
As a result of business combination accounting resulting from our acquisition by Brookfield (see Note 2, Preferred Share Issuance and Merger, of the Notes to the Consolidated Financial Statements included elsewhere in this prospectus), our financial statements are separated into two distinct periods, the period before the consummation of our acquisition by Brookfield (labeled "Predecessor") and the period after that date (labeled "Successor"), to indicate the application of the different basis of accounting between the periods presented. There were no operational activities that changed as a result of our acquisition by Brookfield.
55
| |
| |
| |
| |
| |
| |
| ||||
|---|---|---|---|---|---|---|---|---|---|---|---|---|---|---|---|
| | | | | | | | | | | | | ||||
| |
| |
| Successor |
|
|
| Predecessor |
| ||||||
| | | | | | | | | | | | | ||||
| |
| For the year ended December 31, |
| For the period August 15 through December 31, |
|
|
| For the period January 1 through August 14, |
| ||||||
| | | | | | | | | | | | | ||||
| |
| 2017 |
| 2016 |
| 2015 |
|
|
| 2015 |
| ||||
| | | | | | | | | | | | | ||||
|
| (in thousands, except share and per share data) | | ||||||||||||
Statement of Operations Data: |
| | | | | | |||||||||
Net sales |
| $ | 550,771 | | $ | 437,963 | | $ | 193,133 | | | $ | 339,907 | | |
Income (loss) from continuing operations |
| 14,212 | | (108,869 | ) | (28,625 | ) | | (101,970 | ) | |||||
Net income (loss) |
| 7,983 | | (235,843 | ) | (33,551 | ) | | (120,649 | ) | |||||
Basic income (loss) per common share(a): |
| | | | | | |||||||||
| | | | | | | | | | | | | ||||
Income (loss) from continuing operations per share |
| $ | 142,120 | | $ | (1,088,690 | ) | $ | (286,250 | ) | | $ | (0.74 | ) | |
| | | | | | | | | | | | | ||||
Weighted average common shares outstanding |
| 100 | | 100 | | 100 | | | 137,152,430 | | |||||
Balance Sheet Data (at period end): |
| | | | | | |||||||||
Total assets |
| $ | 1,199,103 | | $ | 1,172,276 | | $ | 1,422,015 | | | | |||
Other long-term obligations(b) |
| 68,907 | | 82,148 | | 94,318 | | | | ||||||
Total long-term debt |
| 322,900 | | 356,580 | | 362,455 | | | | ||||||
Other Financial Data: |
| | | | | | |||||||||
Net cash provided by operating activities |
| $ | 36,573 | | $ | 22,815 | | $ | 23,115 | | | $ | 28,323 | | |
Net cash (used in) provided by investing activities |
| (2,199 | ) | (10,471 | ) | (17,484 | ) | | (39,918 | ) | |||||
Net cash (used in) provided by financing activities |
| (32,995 | ) | (8,317 | ) | (23,072 | ) | | 20,824 | | |||||
| | | | | | | | | | | | | ||||
(a) Per share data does not give effect to the -for- stock split on our common stock to be effected prior to the completion of this offering.
(b) Represents pension and OPEB and related costs and miscellaneous other long-term obligations.
| |
| |
| |
| |
| |
| |
| ||||
|---|---|---|---|---|---|---|---|---|---|---|---|---|---|---|---|
| | | | | | | | | | | | | ||||
| |
| |
| Successor |
|
|
| Predecessor |
| ||||||
| | | | | | | | | | | | | ||||
| |
| For the year ended December 31, |
| For the period August 15 through December 31, |
|
|
| For the period January 1 through August 14, |
| ||||||
| | | | | | | | | | | | | ||||
| |
| 2017 |
| 2016 |
| 2015 |
|
|
| 2015 |
| ||||
| | | | | | | | | | | | | ||||
|
| (in thousands) | | ||||||||||||
Other Financial Information: |
| | | | | | |||||||||
EBITDA from continuing operations(1) |
| $ | 97,884 | | $ | (12,251 | ) | $ | 12,674 | | | $ | (32,197 | ) | |
Adjusted EBITDA from continuing operations(1) |
| $ | 95,806 | | $ | (2,898 | ) | $ | 14,396 | | | $ | 31,628 | | |
| | | | | | | | | | | | | ||||
56
| |
|
|
|
|||||||
|---|---|---|---|---|---|---|---|---|---|---|
| | | | | | | | | | | |
|
For the year ended December 31, |
|||||||||
| | | | | | | | | | | |
| (in thousands, except price data) |
2017 |
2016 |
2015 |
|||||||
| | | | | | | | | | | |
Sales volume (MT)(2) |
172 | 163 | 145 | |||||||
Weighted average realized price(3) |
$ | 2,945 | $ | 2,459 | $ | 3,344 | ||||
Production volume (MT)(4) |
166 | 151 | 137 | |||||||
Production capacity (MT)(5) |
195 | 195 | 195 | |||||||
Production capacity excluding St. Marys during idle period (MT)(6) |
167 | 176 | 195 | |||||||
Capacity utilization(7) |
85% | 77% | 70% | |||||||
Capacity utilization excluding St. Marys during idle period(6) |
99% | 85% | 70% | |||||||
| | | | | | | | | | | |
(1) See below for more information and a reconciliation of EBITDA and adjusted EBITDA to net income (loss), the most directly comparable financial measure calculated and presented in accordance with GAAP.
(2) Sales volume reflects the total volume of graphite electrodes sold for which revenue has been recognized during the period. See below for more information on our key operating metrics.
(3) Weighted average realized price reflects the total revenues from sales of graphite electrodes for the period divided by the graphite electrode sales volume for that period. See below for more information on our key operating metrics.
(4) Production volume reflects graphite electrodes produced during the period. See below for more information on our key operating metrics.
(5) Production capacity reflects expected maximum production volume during the period under normal operating conditions, standard product mix and expected maintenance downtime. Actual production may vary. See below for more information on our key operating metrics.
(6) The St. Marys, Pennsylvania facility was temporarily idled effective the second quarter of 2016, except for the machining of semi-finished products sourced from other plants.
(7) Capacity utilization reflects production volume as a percentage of production capacity. See below for more information on our key operating metrics.
Non-GAAP financial measures
In addition to providing results that are determined in accordance with GAAP, we have provided certain financial measures that are not in accordance with GAAP. EBITDA from continuing operations and adjusted EBITDA from continuing operations are non-GAAP financial measures. We define EBITDA from continuing operations, a non-GAAP financial measure, as net income or loss plus interest expense, minus interest income, plus income taxes, discontinued operations and depreciation and amortization. We define adjusted EBITDA from continuing operations as EBITDA from continuing operations plus any pension and OPEB plan expenses, impairments, rationalization-related charges, acquisition costs and costs related to the change in control as well as proxy contests costs, non-cash gains or losses from foreign currency remeasurement of non-operating liabilities in our foreign subsidiaries where the functional currency is the U.S. dollar and non-cash fixed asset write-offs. Adjusted EBITDA from continuing operations is the primary metric used by our management and our board of directors to establish budgets and operational goals for managing our business and evaluating our performance.
We monitor adjusted EBITDA from continuing operations as a supplement to our GAAP measures, and believe it is useful to present to investors, because we believe that it facilitates evaluation of our period-to-period operating performance by eliminating items that are not operational in nature, allowing comparison of our recurring core business operating results over multiple periods unaffected by differences in capital structure, capital investment cycles and fixed asset base. In addition, we believe adjusted EBITDA from continuing operations and similar measures are widely used by investors, securities analysts, ratings agencies, and other parties in evaluating companies in our industry as a measure of financial performance and debt-service capabilities.
57
Our use of adjusted EBITDA from continuing operations has limitations as an analytical tool, and you should not consider it in isolation or as a substitute for analysis of our results as reported under GAAP. Some of these limitations are:
- •
- adjusted EBITDA from continuing operations does not reflect changes in, or cash requirements for, our working capital needs;
- •
- adjusted EBITDA from continuing operations does not reflect our cash expenditures for capital equipment or other contractual commitments,
including any capital expenditures for future capital expenditure requirements to augment or replace our capital assets;
- •
- adjusted EBITDA from continuing operations does not reflect the interest expense or the cash requirements necessary to service interest or
principal payments on our indebtedness;
- •
- adjusted EBITDA from continuing operations does not reflect tax payments that may represent a reduction in cash available to us;
- •
- adjusted EBITDA from continuing operations does not reflect expenses relating to our pension and OPEB plans;
- •
- adjusted EBITDA from continuing operations does not reflect impairment of long-lived assets and goodwill;
- •
- adjusted EBITDA from continuing operations does not reflect the non-cash gains or losses from foreign currency remeasurement of non-operating
liabilities in our foreign subsidiaries where the functional currency is the U.S. dollar;
- •
- adjusted EBITDA from continuing operations does not reflect rationalization-related charges, acquisition costs, costs related to the change in
control and proxy contests costs or the non-cash write-off of fixed assets; and
- •
- other companies, including companies in our industry, may calculate EBITDA from continuing operations and adjusted EBITDA from continuing operations differently, which reduces its usefulness as a comparative measure.
In evaluating EBITDA from continuing operations and adjusted EBITDA from continuing operations, you should be aware that in the future, we will incur expenses similar to the adjustments in this presentation. Our presentations of EBITDA from continuing operations and adjusted EBITDA from continuing operations should not be construed as suggesting that our future results will be unaffected by these expenses or any unusual or non-recurring items. When evaluating our performance, you should consider EBITDA from continuing operations and adjusted EBITDA from continuing operations alongside other financial performance measures, including our net income (loss) and other GAAP measures.
For a reconciliation of these measures to the most directly comparable GAAP measures, see "Management's Discussion and Analysis of Financial Condition and Results of Operation—Non-GAAP Financial Measures."
Key Operating Metrics
Key operating metrics consist of sales volume, weighted average realized price, production volume, production capacity and capacity utilization. Sales volume reflects the total volume of graphite electrodes sold for which revenue has been recognized during the period. For a discussion of our revenue recognition
58
policy, see "Management's Discussion and Analysis of Financial Condition and Results of Operations—Critical Accounting Policies—Revenue Recognition." Under our policy, volume discounts and rebates are recorded as a reduction of revenue in conjunction with the sale of the graphite electrodes, and shipping and handling revenues relating to graphite electrodes sold are included as an increase to revenue. Weighted average realized price reflects the total revenues from sales of graphite electrodes for the period divided by the graphite electrode sales volume for that period. Production volume reflects graphite electrodes produced during the period. Production capacity reflects expected maximum production volume during the period under normal operating conditions, standard product mix and expected maintenance downtime. Capacity utilization reflects production volume as a percentage of production capacity.
59
Management's discussion and analysis of financial condition
and results of operations
The following discussion and analysis of our financial condition and results of operations should be read together with our Consolidated Financial Statements and the accompanying notes and other financial information appearing elsewhere in this prospectus. Information in this section is intended to assist the reader in obtaining an understanding of our Consolidated Financial Statements, the changes in certain key items in those financial statements from year-to-year, the primary factors that accounted for those changes, any known trends or uncertainties that we are aware of that may have a material effect on our future performance, as well as how certain accounting principles affect our Consolidated Financial Statements. This discussion and analysis contains forward-looking statements that involve risks, uncertainties and assumptions. See "Special Note Regarding Forward-Looking Statements." Our actual results could differ materially from those forward-looking statements as a result of many factors, including those discussed in "Risk Factors" and elsewhere in this prospectus.
Overview
We are a leading manufacturer of high quality graphite electrode products essential to the production of EAF steel and other ferrous and non-ferrous metals. We believe that we have the most competitive portfolio of low-cost graphite electrode manufacturing facilities in the industry, including three of the five highest capacity facilities in the world (excluding China). We are the only large scale graphite electrode producer that is substantially vertically integrated into petroleum needle coke, the primary raw material for graphite electrode manufacturing, which is currently in limited supply. Between 1984 and 2011, EAF steelmaking was the fastest-growing segment of the steel sector, with production increasing at an average rate of 3.5% per year, based on WSA data. Historically, EAF steel production has grown faster than the overall steel market due to the greater resilience, more variable cost structure, lower capital intensity and more environmentally friendly nature of EAF steelmaking. This trend was partially reversed between 2011 and 2015 due to global steel production overcapacity driven largely by Chinese BOF steel production. Beginning in 2016, efforts by the Chinese government to restructure China's domestic steel industry have led to limits on Chinese BOF steel production and lower export levels, and developed economies, which typically have much larger EAF steel industries, have instituted a number of trade policies in support of domestic steel producers. As a result, since 2016, the EAF steel market has rebounded strongly and resumed its long-term growth trajectory. This revival in EAF steel production has resulted in increased demand for our graphite electrodes.
At the same time, two supply-side structural changes have contributed to recent record high prices of graphite electrodes. First, ongoing consolidation and rationalization of graphite electrode production capacity have limited the ability of graphite electrode producers to meet demand. We estimate that approximately 20% of graphite electrode industry production capacity (excluding China) has been closed or repurposed since the beginning of 2014, and we believe the majority of these closures represent permanent reductions. Second, demand for petroleum needle coke has outpaced supply due to increasing demand for petroleum needle coke for lithium-ion batteries used in electric vehicles. As a result, graphite electrode prices have recently reached record high prices. We have implemented a new commercial strategy to sell 60% to 65% of our production capacity through three- to five-year take-or-pay contracts. These contracts define volumes and prices, along with price-escalation mechanisms for inflation, and include significant termination payments (typically, 50% to 70% of remaining contracted revenue) and, in certain cases, parent guarantees and collateral arrangements to manage our customer credit risk. We
60
expect a high degree of stability in our future operating results due to these contracts. As of March 1, 2018, we have entered into three-to-five-year take-or-pay contracts to sell approximately 132,406, 138,446, 134,831, 117,600 and 112,883 MT in 2018, 2019, 2020, 2021 and 2022, respectively. See "Business—Our company—We have reoriented our commercial strategy" and "Business—Contracts and customers."
GrafTech's transformation
Since 2012, we have executed a three-part transformation plan to improve our competitive position and allow us to better serve our customers. Since 2012, we have achieved annual fixed manufacturing cost improvements of $80 million, annual capital expenditure requirement reductions of $45 million and annual overhead expense reductions of approximately $65 million, all while also improving the productivity of our plant network. We have strategically shifted production from our lowest to our highest production capacity facilities to increase fixed cost absorption. This, coupled with a recovery in customer demand, resulted in a steady increase in our capacity utilization, reaching 99% in 2017 (excluding the temporarily idled St. Marys facility). We have also reduced our annual overhead expenses by approximately $65 million since 2012 by simplifying our corporate structure from a conglomerate model to a centralized business focused exclusively on the production of graphite electrodes and petroleum needle coke, and we have streamlined and combined our workforce and various administrative functions for efficiency, and eliminated R&D functions unrelated to graphite electrodes. In 2018, we expect to have maintenance capital expenditures of approximately $35 million. In addition to our fixed cost reductions, we have been able to achieve significant productivity improvements and variable cost reductions across our plants since 2014. Finally, we are currently implementing an operational improvement and debottlenecking initiative, which we expect will increase our currently operating production capacity by approximately 21%, or 35,000 MT, by the end of 2018, allowing us to achieve further improvements in our cost structure. As a result of our prior operational improvement activities, we are able to achieve this large capacity increase with specific, highly targeted capital investments.
In light of improved market conditions, the long lead time required to produce our products, our position as one of the market's largest producers and our ability, through our substantial vertical integration with Seadrift, to provide customers with a reliable long-term supply of graphite electrodes despite the market shortage of petroleum needle coke, we have implemented a new commercial strategy to sell 60% to 65% of our production capacity through three- to five-year take-or-pay contracts. For more information on our new commercial strategy, see "Business—Contracts and Customers." Additionally, the divestiture of our non-core legacy Engineered Solutions businesses in 2016 and 2017 has allowed our management team to focus on our core competency of graphite electrode production and generated approximately $60 million in cash proceeds and release of working capital. By focusing our management's attention and R&D spending exclusively on the graphite electrode business, we have been able to meaningfully improve the quality of our graphite electrodes, repositioning ourselves as an industry quality leader and improving our relationships with strategic customers.
Global economic conditions and outlook
The graphite electrode industry has historically followed the growth of the EAF steel industry and, to a lesser extent, the steel industry as a whole, which has been highly cyclical and affected significantly by general economic conditions. Historically, EAF steel production has grown faster than the overall steel market due to the greater resilience, more variable cost structure, lower capital intensity and more environmentally friendly nature of EAF steelmaking.
61
This growth trend has resumed after a decline in EAF steelmaking between 2011 and 2015, as Chinese steel production, which is predominantly BOF-based, grew significantly, taking market share from EAF steel producers. Throughout 2015 and 2016, our business faced significant headwinds in the major industries that we served, including slow economic growth and stagnation in steel production year-over-year. These factors exerted continued downward pressure on prices for our products, which negatively impacted our recent historical profitability. Additionally, in 2015, steel producers utilized BOFs over EAFs at rates higher than we had historically seen, pressuring the prices of and demand for graphite electrodes, as steel consumers in the United States and Europe, our largest markets, increased imports of low-cost steel products, primarily from China. Additionally, prices for iron ore, the key raw material for BOFs, declined faster than scrap steel, the key raw material in EAF production. While a decline in the price of oil benefited our cost structure overall, it contributed to lower prices for petroleum needle coke and, indirectly, graphite electrodes.
Graphite electrodes saw further pricing pressure in the first half of 2016, but EAF production started to recover during the second half of 2016, which indicated a potential bottoming out in prices. Costs of the key raw materials used to run BOFs increased, and the price of scrap steel decreased, re-balancing the economics of EAF mills relative to BOFs. These developments resulted in an increase in our sales volume over the prior year; however, the decline in prices more than offset the volume increase. Because customers historically negotiated annual agreements in the third and fourth quarters of each calendar year for graphite electrodes to be delivered the following year, increases in price often lag behind increases in volume. Nonetheless, a decline in the price of oil and our rationalization initiatives significantly improved our cost structure and positioned us to benefit from a potential recovery.
The outlook for general economic and industry-specific growth brightened in 2017. In its January 2018 report, the IMF increased its October 2017 estimated global growth rate by 0.1% to 3.7% for 2017 and revised upwards both its 2018 and 2019 estimates by 0.2% to 3.9%, respectively. The WSA estimated global steel production outside of China would grow by 2.6% over 2016 levels to 856 million MT in 2017 and by 3.0% to 882 million MT in 2018. The WSA noted that both advanced and developing economies exhibited stronger economic momentum in 2017. Confidence and investor sentiments are improving in a large part of the world despite some financial market volatility and growing concerns about stock market overvaluation.
Other recent macroeconomic and industry trends have created significant increases in demand for graphite electrodes. Beginning in 2016, efforts by the Chinese government to eliminate excess steelmaking production capacity and improve environmental and health conditions have led to limits on Chinese BOF steel production, including the closure of over 200 million MT of its steel production capacity, based on data from S&P Global Platts and the Ministry of Commerce of the People's Republic of China. In 2017, Chinese steel exports fell by more than 30% from 2016, including 17 consecutive months of year-over-year declines, according to the National Bureau of Statistics of China. Reflecting the reduction in steel production capacity, as a result, the historical growth trend of EAF steelmaking relative to the overall steel market resumed and has led to increased demand for our graphite electrodes. At the same time, ongoing consolidation and rationalization of graphite electrode production capacity has limited the ability of graphite electrode producers to meet this demand. Prior to this improvement in demand, the electrode industry experienced an extended, five-year downturn, resulting in a reduction of production capacity outside of China of approximately 200,000 MT (or approximately 20%) since the beginning of 2014.
Petroleum needle coke, which is the primary raw material for graphite electrode manufacturing, and coal tar pitch, which is a raw material used in our manufacturing processes, are currently in limited supply. Demand for petroleum needle coke has outpaced supply due to increasing demand for petroleum needle
62
coke in the production of lithium-ion batteries used in electric vehicles. Increased demand has led to pricing increases of four to six times for petroleum needle coke in the current market compared to one year ago. While we believe that our substantial vertical integration into petroleum needle coke through our ownership of Seadrift provides a significant cost advantage relative to our competitors in periods of tight petroleum needle coke supply, such as the current market environment, we currently purchase approximately 25% of our petroleum needle coke requirements from external sources. As a result, we expect to incur increased costs purchasing that portion of our petroleum needle coke supply. Additionally, supply of coal tar pitch, a byproduct of coking metallurgical coal used in BOF steelmaking, has fallen as a result of the reduced demand for metallurgical coke for BOF steel furnaces. Consequently, prices for coal tar pitch have increased starting in the second half of 2017. The higher raw material purchase costs for both petroleum needle coke and coal tar pitch are expected to contribute to an increase in our costs of goods sold in future quarters of 2018.
These factors have led to supply constraints for our products. There are indications that this demand and supply imbalance could persist for some time. As a result, graphite electrode prices have reached record high prices.
Tax Cuts and Jobs Act
On December 22, 2017, the U.S. government enacted the Tax Act, which significantly revises the U.S. corporate income tax system. These changes include a federal statutory rate reduction from 35% to 21%, the elimination or reduction of certain domestic deductions and credits and limitations on the deductibility of interest expense and executive compensation. The Tax Act also transitions international taxation from a worldwide system to a modified territorial system and includes base erosion prevention measures which have the effect of subjecting certain earnings of our foreign subsidiaries to U.S. taxation as global intangible low-taxed income (or GILTI). In general, these changes will be effective beginning in 2018. The Tax Act also includes a one-time mandatory deemed repatriation or transition tax on the accumulated previously untaxed foreign earnings of our foreign subsidiaries.
As a result of the Tax Act, we recorded a charge in 2017 totaling $54.1 million, reflecting our current estimate of the impact of the Tax Act. This charge included a $52.2 million charge related to the revaluation of our deferred tax assets and liabilities due to the reduction of the U.S. corporate tax rate and $39.6 million of transition tax, partially offset by $37.7 million of additional foreign tax credit related to the transition tax. However, this $54.1 million charge was offset by a release of valuation allowance reserve on the deferred tax assets. Our accounting for the impacts of the Tax Act is provisional and amounts may be revised in future periods as described in SEC Staff Accounting Bulletin No. 118, which was issued on December 22, 2017 to provide guidance on the accounting for the effects of the Tax Act.
Preliminary estimated financial results for the first quarter of 2018
Set forth below are selected preliminary estimated unaudited financial results for the two months ended February 28, 2018 and the three months ended March 31, 2018. These financial results are unaudited and should be considered preliminary and subject to change. We have provided ranges, rather than specific amounts, for the preliminary results described below as our final results remain subject to the completion of our closing procedures, final adjustments, developments that may arise between now and the time the financial results are finalized, and management's and the audit committee's final reviews. Accordingly, you should not place undue reliance on this preliminary data, which may differ materially from our final results. Please see "Risk Factors," "Special Note Regarding Forward-Looking Statements" and "Management's Discussion and Analysis of Financial Condition and Results of Operations" for a discussion
63
of certain factors that could result in differences between the preliminary financial data reported below and the final results. These preliminary estimates should not be viewed as a substitute for our full unaudited condensed consolidated financial statements prepared in accordance with U.S. GAAP. In addition, they are not necessarily indicative of the results to be achieved in any future period.
These estimates have been prepared by and are the responsibility of management. Our independent registered public accounting firm has not audited, compiled, performed any procedures on or reviewed the preliminary financial data, and accordingly does not express an opinion or any other form of assurance with respect to the preliminary financial data.
For the two months ended February 28, 2018, management estimates:
- •
- Sales volume in the range of approximately 27,800 to 28,600 MT
- •
- Weighted average realized price in the range of approximately $9,925 to $9,975 per MT
- •
- Net sales in the range of approximately $285 to $294 million
- •
- Cost of sales in the range of approximately $92.5 to $97 million
- •
- Selling and administrative expenses in the range of approximately $10 to $11 million including approximately $1.9 to $2.4 million of expenses related to this offering and $0.3 to $0.5 million of pension and OPEB plan expenses
- •
- Research and development expenses in the range of approximately $0.2 to $0.4 million
- •
- Depreciation and amortization in the range of approximately $10.5 to $11.5 million (included in cost of sales, selling and administrative expenses, and research and development expenses above)
- •
- Other expense in the range of approximately $1 to $1.5 million including a non-cash loss on foreign currency remeasurement of $1 to $1.5 million
For the three months ended March 31, 2018, management estimates:
- •
- Sales volume in the range of approximately to
- •
- Weighted average realized price in the range of approximately to
- •
- Net sales in the range of approximately to
- •
- Cost of sales in the range of approximately to
- •
- Selling and administrative expenses in the range of approximately to
- •
- Research and development expenses in the range of approximately to
- •
- Depreciation and amortization in the range of approximately to (included in cost of sales, selling and administrative expenses, and research and development expenses above)
- •
- Other expense in the range of approximately to including a non-cash loss on foreign currency remeasurement of to
Weighted average realized price for the two months ended February 28, 2018 benefited from a small portion of our electrode sales being sold on a spot basis. Industry spot prices are at record levels of as high as $15,000 to $30,000 per MT. However, as a result of our recent three- to five-year contracting initiative and other sales commitments, approximately 96% of our 2018 production capacity is now contracted or committed by purchase orders and will not be available for spot sales. The weighted average selling price of our currently contracted and committed orders for the remaining quarters of 2018 is expected to be approximately $9,650 per MT. This represents a combination of our three-to five-year take-or-pay contracts as well as other committed business for 2018, which was mostly negotiated in 2017 at lower prices.
64
We have made the strategic decision to service our long-term strategic customers through our contracted and committed purchase order volume in the second and third quarters of 2018, and as a result, expect to have only minimal production volume available for sales into the spot market during these quarters.
We expect the results of our operational improvement and debottlenecking initiative to increase our production capacity by approximately 21% beginning in the fourth quarter of 2018. We expect the majority of the incremental volume from our capacity expansion to be available for sale to customers on a spot basis going forward.
We expect that the quarter ended March 31, 2018 will benefit from lower cost of goods sold than future quarters of 2018 due to higher input raw material purchase costs in 2018, which will be reflected in cost of goods sold in future quarters.
Components of results of operations
Net sales
Net sales reflect sales of our products, including graphite electrodes and associated by-products. Several factors affect net sales in any period, including general economic conditions, competitive conditions, scheduled plant shutdowns by customers, national vacation practices, changes in customer production schedules in response to seasonal changes in energy costs, weather conditions, strikes and work stoppages at customer plants and changes in customer order patterns including those in response to the announcement of price increases or price adjustments.
Revenue from sales of our commercial products is recognized when persuasive evidence of an arrangement exists, delivery has occurred, title has passed, the amount is determinable and collection is reasonably assured. Sales are recognized when both title and the risks and rewards of ownership are transferred to the customer or services have been rendered and fees have been earned in accordance with the contract.
Volume discounts, rebates, and returns are recorded as a reduction of revenue in conjunction with the sale of the related products. Returns are highly infrequent as graphite electrodes are consumed upon their use in the steel production process. Changes to estimates are recorded when they become probable.
Cost of sales
Cost of sales includes the costs associated with products invoiced during the period as well as non-inventoried manufacturing overhead costs and outbound transportation costs. Cost of sales includes all costs incurred at our production facilities to make products saleable, such as raw materials, energy costs, direct labor and indirect labor and facilities costs, including purchasing and receiving costs, plant management, inspection costs, product engineering and internal transfer costs. In addition, all depreciation associated with assets used to produce products and make them saleable is included in cost of sales. Direct labor costs consist of salaries, benefits and other personnel-related costs for employees engaged in the manufacturing of our products.
Inventory valuation
Inventories are stated at the lower of cost or market. Cost is principally determined using the "first-in first-out" (or FIFO) and average cost, which approximates FIFO, methods. Elements of cost in inventory include raw materials, energy costs, direct labor, manufacturing overhead and depreciation of the manufacturing fixed assets. We allocate fixed production overheads to the costs of conversion based on normal capacity of the production facilities. We recognize abnormal amounts of idle facility expense, freight, handling costs, and wasted materials (spoilage) as current period charges. Market, or net realizable
65
value, is the estimated selling price in the ordinary course of business, less reasonably predictable costs of completion, disposal and transportation.
Research and development
We conduct our research and development both independently and in conjunction with our strategic suppliers, customers and others. Expenditures relating to the development of new products and processes, including significant improvements to existing products, are expensed as incurred.
Selling and administrative expenses
Selling and administrative expenses include salaries, benefits and other personnel related costs for employees engaged in sales and marketing, customer technical services, engineering, finance, information technology, human resources and executive management. Other costs include outside legal and accounting fees, risk management (insurance), global operational excellence, global supply chain, in-house legal, share-based compensation and certain other administrative and global resources costs. Our "mark-to-market adjustment" refers to our accounting policy regarding pension and OPEB plans, where we immediately recognize the change in the fair value of plan assets and net actuarial gains and losses annually in the fourth quarter of each year.
Other expense (income)
Other expense (income) consists primarily of foreign currency impacts on non-operating assets and liabilities and miscellaneous income and expense.
Interest expense
Interest expense consists primarily of interest expense on our Old Revolving Credit Facility and the Senior Notes, accretion of the fair value adjustment on the Senior Notes and amortization of debt issuance costs.
Income (loss) from discontinued operations
As of June 30, 2016, the Engineered Solutions segment qualified for reporting as discontinued operations, and the disposition of the segment was substantially complete by the end of the third quarter of 2017. All results are reported as gain or loss from discontinued operations, net of tax.
Business combination accounting
As a result of business combination accounting resulting from our acquisition by Brookfield (see Note 2, Preferred Share Issuance and Merger, of the Notes to the Consolidated Financial Statements included elsewhere in this prospectus), our financial statements are separated into two distinct periods, the period before the consummation of our acquisition by Brookfield (labeled "Predecessor") and the period after that date (labeled "Successor"), to indicate the application of the different basis of accounting between the periods presented. There were no operational activities that changed as a result of our acquisition by Brookfield. Our consolidated statements of operations subsequent to our acquisition by Brookfield include amortization expense relating to the fair value adjustment of intangibles and depreciation expense based on the fair value of our property, plant and equipment that had previously been carried at historical cost less accumulated depreciation.
Effects of changes in currency exchange rates
When the currencies of non-U.S. countries in which we have a manufacturing facility decline (or increase) in value relative to the U.S. dollar, this has the effect of reducing (or increasing) the U.S. dollar equivalent
66
cost of sales and other expenses with respect to those facilities. In certain countries in which we have manufacturing facilities, and in certain export markets, we sell in currencies other than the U.S. dollar. Accordingly, when these currencies increase (or decline) in value relative to the U.S. dollar, this has the effect of increasing (or reducing) net sales. The result of these effects is to increase (or decrease) operating profit and net income.
Some of the non-U.S. countries in which we have a manufacturing facility have been subject to significant economic and political changes, which have significantly impacted currency exchange rates. We cannot predict changes in currency exchange rates in the future or whether those changes will have net positive or negative impacts on our net sales, cost of sales or net income.
The impact of these changes in the average exchange rates of other currencies against the U.S. dollar on our net sales was an increase of $4.5 million, $0.4 million and a decrease of $37.8 million for the years ended December 31, 2017, 2016 and 2015, respectively.
The impact of these changes in the average exchange rates of other currencies against the U.S. dollar on our cost of sales was an increase of $4.2 million and decreases of $10.1 million and $37.5 million for the nine months ended September 30, 2017 and the years ended December 31, 2017, 2016 and 2015, respectively.
As part of our cash management, we also have intercompany loans between our subsidiaries. These loans are deemed to be temporary and, as a result, remeasurement gains and losses on these loans are recorded as currency gains or losses in other income (expense), net, on the Consolidated Statements of Operations.
We have in the past and may in the future use various financial instruments to manage certain exposures to risks caused by currency exchange rate changes, as described under "Quantitative and Qualitative Disclosures about Market Risks."
Key metrics used by management to measure performance
In addition to measures of financial performance presented in our Consolidated Financial Statements in accordance with GAAP, we use certain other financial measures and operating metrics to analyze the performance of our company. The "non-GAAP" financial measures consist of EBITDA from continuing operations and adjusted EBITDA from continuing operations, which help us evaluate growth trends, establish budgets, assess operational efficiencies and evaluate our overall financial performance. The key operating metrics consist of sales volume, weighted average realized price, production volume, production capacity and capacity utilization.
Key financial measures
| |
| |
| |
| |
| |
| |
| ||||
|---|---|---|---|---|---|---|---|---|---|---|---|---|---|---|---|
| | | | | | | | | | | | | ||||
| |
| Successor |
|
|
| Predecessor |
| ||||||||
| | | | | | | | | | | | | ||||
| |
| For the year ended December 31, |
| For the period August 15 through December 31, |
|
|
| For the period January 1 through August 14, |
| ||||||
| | | | | | | | | | | | | ||||
| (in thousands) |
| 2017 |
| 2016 |
| 2015 |
|
|
| 2015 |
| ||||
| | | | | | | | | | | | | ||||
Net sales |
| $ | 550,771 | | $ | 437,963 | | $ | 193,133 | | | $ | 339,907 | | |
Net income (loss) |
| $ | 7,983 | | $ | (235,843 | ) | $ | (33,551 | ) | | $ | (120,649 | ) | |
EBITDA from continuing operations(1) |
| $ | 97,884 | | $ | (12,251 | ) | $ | 12,674 | | | $ | (32,197 | ) | |
Adjusted EBITDA from continuing operations(1) |
| $ | 95,806 | | $ | (2,898 | ) | $ | 14,396 | | | $ | 31,628 | | |
| | | | | | | | | | | | | ||||
67
Key operating metrics
| |
|
|
|
|||||||
|---|---|---|---|---|---|---|---|---|---|---|
| | | | | | | | | | | |
|
For the year ended December 31, |
|||||||||
| | | | | | | | | | | |
| (in thousands, except price data) |
2017 |
2016 |
2015 |
|||||||
| | | | | | | | | | | |
Sales volume (MT)(2) |
172 | 163 | 145 | |||||||
Weighted average realized price(3) |
$ | 2,945 | $ | 2,459 | $ | 3,344 | ||||
Production volume (MT)(4) |
166 | 151 | 137 | |||||||
Production capacity (MT)(5) |
195 | 195 | 195 | |||||||
Production capacity excluding St. Marys during idle period (MT)(6) |
167 | 176 | 195 | |||||||
Capacity utilization(7) |
85% | 77% | 70% | |||||||
Capacity utilization excluding St. Marys during idle period(6) |
99% | 85% | 70% | |||||||
| | | | | | | | | | | |
(1) See below for more information and a reconciliation of EBITDA and adjusted EBITDA to net income (loss), the most directly comparable financial measure calculated and presented in accordance with GAAP.
(2) Sales volume reflects the total volume of graphite electrodes sold for which revenue has been recognized during the period. See below for more information on our key operating metrics.
(3) Weighted average realized price reflects the total revenues from sales of graphite electrodes for the period divided by the graphite electrode sales volume for that period. See below for more information on our key operating metrics.
(4) Production volume reflects graphite electrodes produced during the period. See below for more information on our key operating metrics.
(5) Production capacity reflects expected maximum production volume during the period under normal operating conditions, standard product mix and expected maintenance downtime. Actual production may vary. See below for more information on our key operating metrics.
(6) The St. Marys, Pennsylvania facility was temporarily idled effective the second quarter of 2016, except for the machining of semi-finished products sourced from other plants.
(7) Capacity utilization reflects production volume as a percentage of production capacity. See below for more information on our key operating metrics.
Non-GAAP financial measures
In addition to providing results that are determined in accordance with GAAP, we have provided certain financial measures that are not in accordance with GAAP. EBITDA from continuing operations and adjusted EBITDA from continuing operations are non-GAAP financial measures. We define EBITDA from continuing operations, a non-GAAP financial measure, as net income or loss plus interest expense, minus interest income, plus income taxes, discontinued operations and depreciation and amortization from continuing operations. We define adjusted EBITDA from continuing operations as EBITDA from continuing operations plus any pension and OPEB plan expenses, impairments, rationalization-related charges, acquisition costs and costs related to the change in control as well as proxy contests costs, non-cash gains or losses from foreign currency remeasurement of non-operating liabilities in our foreign subsidiaries where the functional currency is the U.S. dollar and non-cash fixed asset write-offs. Adjusted EBITDA from continuing operations is the primary metric used by our management and our board of directors to establish budgets and operational goals for managing our business and evaluating our performance.
We monitor adjusted EBITDA from continuing operations as a supplement to our GAAP measures, and believe it is useful to present to investors, because we believe that it facilitates evaluation of our period-to-period operating performance by eliminating items that are not operational in nature, allowing comparison of our recurring core business operating results over multiple periods unaffected by differences in capital structure, capital investment cycles and fixed asset base. In addition, we believe adjusted EBITDA from continuing operations and similar measures are widely used by investors, securities analysts, ratings agencies, and other parties in evaluating companies in our industry as a measure of financial performance and debt-service capabilities.
68
Our use of adjusted EBITDA from continuing operations has limitations as an analytical tool, and you should not consider it in isolation or as a substitute for analysis of our results as reported under GAAP. Some of these limitations are:
- •
- adjusted EBITDA from continuing operations does not reflect changes in, or cash requirements for, our working capital needs;
- •
- adjusted EBITDA from continuing operations does not reflect our cash expenditures for capital equipment or other contractual commitments,
including any capital expenditures for future capital expenditure requirements to augment or replace our capital assets;
- •
- adjusted EBITDA from continuing operations does not reflect the interest expense or the cash requirements necessary to service interest or
principal payments on our indebtedness;
- •
- adjusted EBITDA from continuing operations does not reflect tax payments that may represent a reduction in cash available to us;
- •
- adjusted EBITDA from continuing operations does not reflect expenses relating to our pension and OPEB plans;
- •
- adjusted EBITDA from continuing operations does not reflect impairment of long-lived assets and goodwill;
- •
- adjusted EBITDA from continuing operations does not reflect the non-cash gains or losses from foreign currency remeasurement of non-operating
liabilities in our foreign subsidiaries where the functional currency is the U.S. dollar;
- •
- adjusted EBITDA from continuing operations does not reflect rationalization-related charges, acquisition costs, costs related to the change in
control and proxy contests costs or the non-cash write-off of fixed assets; and
- •
- other companies, including companies in our industry, may calculate EBITDA from continuing operations and adjusted EBITDA from continuing operations differently, which reduces its usefulness as a comparative measure.
In evaluating EBITDA from continuing operations and adjusted EBITDA from continuing operations, you should be aware that in the future, we will incur expenses similar to the adjustments in this presentation. Our presentations of EBITDA from continuing operations and adjusted EBITDA from continuing operations should not be construed as suggesting that our future results will be unaffected by these expenses or any unusual or non-recurring items. When evaluating our performance, you should consider EBITDA from continuing operations and adjusted EBITDA from continuing operations alongside other financial performance measures, including our net income (loss) and other GAAP measures.
69
The following table reconciles our non-GAAP key financial measures to the most directly comparable GAAP measures:
| |
| |
| |
| |
| |
| |
| ||||
|---|---|---|---|---|---|---|---|---|---|---|---|---|---|---|---|
| | | | | | | | | | | | | ||||
| |
| Successor |
|
|
| Predecessor |
| ||||||||
| | | | | | | | | | | | | ||||
| |
| For the year ended December 31, |
| For the period August 15 through December 31, |
|
|
| For the period January 1 through August 14, |
| ||||||
| | | | | | | | | | | | | ||||
| |
| 2017 |
| 2016 |
| 2015 |
|
|
| 2015 |
| ||||
| | | | | | | | | | | | | ||||
|
| | | | | | |||||||||
| |
| (in thousands) |
| ||||||||||||
Net income (loss) |
| $ | 7,983 | | $ | (235,843 | ) | $ | (33,551 | ) | | $ | (120,649 | ) | |
Add: |
| | | | | | |||||||||
Discontinued operations |
| 6,229 | | 126,974 | | 4,926 | | | 18,679 | | |||||
Depreciation and amortization |
| 64,025 | | 77,614 | | 24,424 | | | 37,473 | | |||||
Interest expense |
| 30,823 | | 26,914 | | 9,999 | | | 26,211 | | |||||
Interest income |
| (395 | ) | (358 | ) | (6 | ) | | (363 | ) | |||||
Income taxes |
| (10,781 | ) | (7,552 | ) | 6,882 | | | 6,452 | | |||||
| | | | | | | | | | | | | ||||
EBITDA from continuing operations |
| 97,884 | | (12,251 | ) | 12,674 | | | (32,197 | ) | |||||
Adjustments: |
| | | | | | |||||||||
Pension and OPEB plan (gain) expenses(1) |
| (1,611 | ) | (626 | ) | 2,397 | | | 2,973 | | |||||
Impairments(2) |
| — | | 2,843 | | — | | | 35,381 | | |||||
Rationalization-related (gains)/charges(3) |
| (3,970 | ) | 2,366 | | 387 | | | 3,049 | | |||||
Acquisition and proxy contests costs(4) |
| 886 | | 8,036 | | 961 | | | 22,618 | | |||||
Non-cash loss (gain) on foreign currency remeasurement(5) |
| 1,731 | | (5,465 | ) | (2,023 | ) | | (196 | ) | |||||
Non-cash fixed asset write-off(6) |
| 886 | | 2,199 | | — | | | — | | |||||
| | | | | | | | | | | | | ||||
Adjusted EBITDA from continuing operations |
| $ | 95,806 | | $ | (2,898 | ) | $ | 14,396 | | | $ | 31,628 | | |
| | | | | | | | | | | | | ||||
(1) Service and interest cost of our OPEB plans. Also includes a mark-to-market loss (gain) for plan assets as of December of each year. See "Management's Discussion and Analysis of Financial Condition and Results of Operations—Components of Results of Operations—Selling and Administrative Expenses" for more information.
(2) Goodwill impairment in the first quarter of 2015 for the needle coke reporting unit.
(3) Costs associated with rationalizations in our graphite electrode manufacturing operations and in the corporate structure. They include severance charges, contract termination charges, write-off of equipment and (gain)/loss on sale of manufacturing sites.
(4) Legal costs associated with the proxy contests in early 2015; transaction costs associated with the merger transaction with Brookfield in August 2015, resulting in change in control compensation expenses, including the acceleration of stock-based compensation in the period January 1 through August 14, 2015.
(5) Non-cash (gain) loss from foreign currency remeasurement of non-operating liabilities of our non-U.S. subsidiaries where the functional currency is the U.S. dollar.
(6) Non-cash fixed asset write-off recorded for obsolete manufacturing equipment in the fourth quarter of 2016 and the third quarter of 2017.
70
Key Operating Metrics
Key operating metrics consist of sales volume, weighted average realized price, production volume, production capacity and capacity utilization.
Sales volume reflects the total volume of graphite electrodes sold for which revenue has been recognized during the period. For a discussion of our revenue recognition policy, see "Management's Discussion and Analysis of Financial Condition and Results of Operations—Critical Accounting Policies—Revenue Recognition." Under our policy, volume discounts and rebates are recorded as a reduction of revenue in conjunction with the sale of the graphite electrodes, and shipping and handling revenues relating to graphite electrodes sold are included as an increase to revenue. Weighted average realized price reflects the total revenues from sales of graphite electrodes for the period divided by the graphite electrode sales volume for that period. Sales volume and price help investors understand the factors that drive our net sales.
Production volume reflects graphite electrodes produced during the period. Production capacity reflects expected maximum production volume during the period under normal operating conditions, standard product mix and expected maintenance downtime. Capacity utilization reflects production volume as a percentage of production capacity. Production volume, production capacity and capacity utilization help us understand the efficiency of our production, evaluate cost of sales and consider how to approach our contract initiative.
Customer base
We are a global company and sell our products in every major geographic market. Sales of these products to buyers outside the United States accounted for approximately 81% in 2017 and 83% in 2016 of our net sales.
In 2017, five of our ten largest customers were based in Europe, two in the United States and one each in Brazil, Russia and Mexico. However, all of these customers are multi-national operators.
The following table summarizes information as to our operations in different geographical areas:
| | | | | | | | |
| |
For the year ended December 31, |
||||||
|---|---|---|---|---|---|---|---|
| (in thousands) |
2017 |
2016 |
|||||
| | | | | | | | |
Net sales: |
|||||||
United States |
$ | 103,890 | $ | 74,526 | |||
Americas (excluding the United States) |
129,103 | 116,944 | |||||
Asia Pacific |
46,329 | 41,302 | |||||
Europe, Middle East, Africa |
271,449 | 205,191 | |||||
| | | | | | | | |
Total |
$ | 550,771 | $ | 437,963 | |||
| | | | | | | | |
In 2017, one customer accounted for more than 10% of our net sales. Due to the increased demand for our products, we believe this customer does not pose a significant risk, as sales to this customer could be replaced by demand from other customers.
71
Results of operations
Results of operations for 2017 as compared to 2016
| | | | | | | ||
| |
| For the Year Ended December 31, |
| ||||
|---|---|---|---|---|---|---|---|
| (in thousands) |
| 2017 |
| 2016 |
| ||
| | | | | | | ||
Net sales |
| $ | 550,771 | | $ | 437,963 | |
Cost of sales |
| 461,339 | | 448,016 | | ||
Additions to lower of cost or market inventory reserve |
| 1,509 | | 18,974 | | ||
| | | | | | | ||
Gross profit (loss) |
| 87,923 | | (29,027 | ) | ||
Research and development |
| 2,951 | | 2,399 | | ||
Selling and administrative expenses |
| 49,479 | | 57,784 | | ||
Impairment of long-lived assets and goodwill |
| — | | 2,843 | | ||
| | | | | | | ||
Operating income (loss) |
| 35,493 | | (92,053 | ) | ||
Other expense (income), net |
| 1,634 | | (2,188 | ) | ||
Interest expense |
| 30,823 | | 26,914 | | ||
Interest income |
| (395 | ) | (358 | ) | ||
| | | | | | | ||
Income (loss) from continuing operations before provision for income taxes |
| 3,431 | | (116,421 | ) | ||
(Benefit) provision for income taxes |
| (10,781 | ) | (7,552 | ) | ||
| | | | | | | ||
Net income (loss) from continuing operations |
| $ | 14,212 | | $ | (108,869 | ) |
Loss from discontinued operations, net of tax |
| (6,229 | ) | (126,974 | ) | ||
| | | | | | | ||
Net income (loss) |
| $ | 7,983 | | $ | (235,843 | ) |
| | | | | | | ||
Net sales. Net sales increased by $112.8 million, or 26%, from $438.0 million in 2016 to $550.8 million in 2017. This increase was driven by a 19% increase in weighted average realized price for graphite electrodes and a 6.5% increase in sales volume in 2017 compared to 2016. The increases in weighted average sales price and sales volume were driven by increased demand for graphite electrodes due to recent general economic and industry conditions. In particular, prices decreased throughout 2016 and into the first quarter of 2017, but began to increase in the third quarter of 2017. The weighted average sales price increased an additional 42% from the third quarter to the fourth quarter of 2017.
Cost of sales. Cost of sales increased by $13.3 million, or 3%, from $448.0 million in 2016 to $461.3 million in 2017. Increased sales volume of graphite electrodes was the primary driver of this increase resulting in additional cost of sales of $15.1 million.
Lower of cost or market inventory adjustment. We incurred an inventory adjustment to reduce inventory to the lower of cost or market of $19.0 million in 2016 for certain product lines within our graphite electrode business. Improved pricing and lower costs in 2017 lessened the need for these charges.
Research and development. Research and development expenses increased by $0.6 million, or 23% from $2.4 million in 2016 to $3.0 million in 2017, primarily due to the write-off of certain research and development fixed assets in connection with our decision to stop research on a project. These charges were partially offset by an increased benefit of $0.3 million in 2017 from our annual mark-to-market adjustment for pension and OPEB plans.
72
Selling and administrative expenses. Selling and administrative expenses decreased by $8.3 million, or 14%, from $57.8 million in 2016 to $49.5 million in 2017. This decrease was driven primarily by continued cost reduction efforts, which were achieved by simplifying our corporate structure. We also experienced an increased benefit of $1.9 million in 2017 compared to 2016 from our annual mark-to-market adjustment for pension and OPEB plans.
Other (income) expense. Other expense increased by $3.8 million, or 175%, from income of $2.2 million in 2016 to expense of $1.6 million in 2017. This increase was primarily due to non-cash foreign currency impacts on non-operating assets and liabilities and was partially offset by interest income received as part of the resolution of a value added tax (or VAT) dispute in a foreign jurisdiction.
Interest expense. Interest expense increased by $3.9 million, or 15%, from $26.9 million in 2016 to $30.8 million in 2017, primarily due to the increased effective interest rate on our Old Revolving Credit Facility.
Loss from discontinued operations. Loss from our discontinued operations decreased by $120.7 million, or 95%, from $127.0 million in 2016 to $6.2 million in 2017. The decrease in loss was primarily due to a $119.9 million impairment charge to align the carrying value of assets held for sale to their estimated fair value in 2016.
Benefit from income taxes. The following table summarizes the benefit for income taxes in 2017 and 2016:
| | | | | | | ||
| |
| Successor | | ||||
|---|---|---|---|---|---|---|---|
| |
| For the Year Ended December 31, |
| ||||
| |
| 2017 |
| 2016 |
| ||
| | | | | | | ||
Tax benefit |
| $ | (10,781 | ) | $ | (7,552 | ) |
Income (loss) from continuing operations before provision for income taxes |
| 3,431 | | $ | (116,421 | ) | |
| | | | | | | ||
Effective tax rates |
| (314)% | | 6.5% | | ||
| | | | | | | ||
The effective tax rate for fiscal 2017 was (314)%. It reflects the release of $16 million of valuation allowance reserve established against our GrafTech Switzerland net deferred tax assets. A $54.1 million charge related to the impact of the Tax Act was recorded in the fourth quarter of 2017 but was offset by a release of a valuation allowance reserve on the deferred tax assets. The $54.1 million charge includes a $52.2 million charge related to the revaluation of our deferred tax assets and liabilities due to the reduction of the U.S. corporate tax rate and $39.6 million of transition tax, partially offset by $37.7 million of additional foreign tax credit related to the transition tax on unrepatriated earnings.
During 2016 and 2017 the effective tax rates differed from the U.S. statutory rate of 35% primarily due to the losses incurred in the United States (and in Switzerland in 2016), where we receive no tax benefit due to a full valuation allowance, as well as taxes on worldwide earnings from various countries. The recognition of the valuation allowance does not result in or limit our ability to utilize these tax assets in the future.
The tax expense changed from a benefit of $7.6 million, for an effective tax rate of 6.5% for the year ended December 31, 2016 to a tax benefit of $10.8 million for a (314)% effective rate for the year ended December 31, 2017. This change in the effective tax rate is primarily related to a shift in the jurisdictional mix of earnings and losses from year to year. Certain foreign jurisdictions shifted from pre-tax losses in
73
2016 to pre-tax earnings in 2017 (including Switzerland, where a tax benefit was reflected in the 2017 effective tax rate) while the contribution of U.S. pre-tax losses, for which we receive no tax benefit, decreased from 2016 to 2017.
We are still evaluating the impact of the Tax Act on our future U.S. tax liability, but at this time, we expect that the overall impact of the Tax Act on our effective tax rate will be a decrease over more normalized levels from 2016. This decrease is expected due to certain new provisions included in the Tax Act, specifically the reduction in the U.S. income tax rate offset by the new GILTI rules.
Production Capacity
Our graphite electrode plant production capacity in 2017 was 195,000 MT including our St. Marys facility, which has been temporarily idled since the second quarter of 2016. Due to the idling of St. Marys, our production capacity declined to 176,000 MT in 2016 and 167,000 MT in 2017. This production capacity reduction concentrated our manufacturing capabilities at our lowest cost, highest efficiency facilities. This, coupled with a recovery in customer demand, resulted in an increase to our capacity utilization, excluding the St. Marys facility, from 85% in 2016 to 99% in 2017.
Results of operations for 2016 as compared to 2015
| |
| |
| |
| |
| |
| |||
|---|---|---|---|---|---|---|---|---|---|---|---|---|
| | | | | | | | | | | |||
| |
| Successor |
|
|
| Predecessor |
| |||||
| | | | | | | | | | | |||
| (in thousands) |
| For the year ended December 31, 2016 |
| For the period August 15 through December 31, 2015 |
|
|
| For the period January 1 through August 14, 2015 |
| |||
| | | | | | | | | | | |||
Net sales |
| $ | 437,963 | | $ | 193,133 | | | $ | 339,907 | | |
Cost of sales |
| 448,016 | | 180,845 | | | 305,001 | | ||||
Additions to lower of cost or market inventory reserve |
| 18,974 | | — | | | — | | ||||
| | | | | | | | | | | |||
Gross profit (loss) |
| (29,027 | ) | 12,288 | | | 34,906 | | ||||
Research and development |
| 2,399 | | 1,083 | | | 3,377 | | ||||
Selling and administrative expenses |
| 57,784 | | 23,768 | | | 64,397 | | ||||
Impairment of long-lived assets and goodwill |
| 2,843 | | — | | | 35,381 | | ||||
| | | | | | | | | | | |||
Operating loss |
| (92,053 | ) | (12,563 | ) | | (68,249 | ) | ||||
Other expense (income), net |
| (2,188 | ) | (813 | ) | | 1,421 | | ||||
Interest expense |
| 26,914 | | 9,999 | | | 26,211 | | ||||
Interest income |
| (358 | ) | (6 | ) | | (363 | ) | ||||
| | | | | | | | | | | |||
Loss from continuing operations before provision for income taxes |
| (116,421 | ) | (21,743 | ) | | (95,518 | ) | ||||
(Benefit) provision for income taxes |
| (7,552 | ) | 6,882 | | | 6,452 | | ||||
| | | | | | | | | | | |||
Net loss from continuing operations |
| $ | (108,869 | ) | $ | (28,625 | ) | | $ | (101,970 | ) | |
Loss from discontinued operations, net of tax |
| (126,974 | ) | (4,926 | ) | | (18,679 | ) | ||||
| | | | | | | | | | | |||
Net loss |
| $ | (235,843 | ) | $ | (33,551 | ) | | $ | (120,649 | ) | |
| | | | | | | | | | | |||
Net sales. Net sales decreased from $339.9 million in the period January 1 through August 14, 2015 and $193.1 million in the period August 15 through December 31, 2015 to $438.0 million in 2016. This decrease was driven by a 27% decrease in the weighted average realized price for graphite electrodes, which was largely due to overcapacity within the graphite electrode industry. The decrease in price was partially
74
offset by a 12% increase in sales volume due to our customers restocking on electrodes as EAF industry production levels began to recover.
Cost of sales. We experienced a decrease in cost of sales from $305.0 million in the period January 1 through August 14, 2015 and $180.8 million in the period August 15 through December 31, 2015 to $448.0 million in 2016. We achieved this reduction despite the 12% increase in sales volumes and increased depreciation expense resulting from the increase in fixed asset carrying value due to the step-up in value after our acquisition by Brookfield. Decreased oil prices during 2016 drove down the price of decant oil, the key raw material in our petroleum needle coke production platform, which decreased our cost of sales. Cost savings resulting from our rationalization initiatives over the previous three years generated the remainder of the favorable impact to cost of sales, as we shifted production from our smaller production facilities to our largest production facilities to increase fixed cost absorption, resulting in an increase to our capacity utilization, excluding the St. Marys facility, from 70% for the year ended December 31, 2015 to 85% for the year ended December 31, 2016.
Lower of cost or market inventory adjustment. In 2016, we incurred an inventory adjustment of $19.0 million to reduce inventory to the lower of cost or market in certain product lines within our graphite electrode business reflecting the decreased prices for graphite electrodes.
Research and development. Research and development expenses decreased from $3.4 million in the period January 1 through August 14, 2015 and $1.1 million in the period August 15 through December 31, 2015 to $2.4 million in 2016. This decrease was primarily driven by headcount reductions and cost-cutting measures.
Selling and administrative expenses. Selling and administrative expenses decreased from $64.4 million in the period January 1 through August 14, 2015 and $23.8 million in the period August 15 through December 31, 2015 to $57.8 million in 2016. This decrease was primarily driven by a reduction in non-recurring charges. Fees associated with our proxy contests and acquisition-related costs represented $23.6 million in 2015, while they were approximately $8.0 million in 2016. Additionally, we incurred a $2.9 million decrease in our 2016 mark-to-market adjustment as compared to 2015. The remainder of the decrease was the result of headcount reductions and cost-cutting measures, which were achieved by simplifying our corporate structure.
Impairments. As a result of the margin contraction for petroleum needle coke due to the price decreases, we recorded a goodwill impairment charge in our petroleum needle coke reporting unit totaling $35.4 million during the first quarter of 2015. During the fourth quarter of 2016, we recorded an impairment in the value of assets held for sale at our facility in Brazil totaling $2.8 million to align its fair value to offers at lower prices than previously estimated.
Other expense (income). Other expense (income) decreased from $1.4 million of expense in the period January 1 through August 14, 2015 and $0.8 million of income in the period August 15 through December 31, 2015 to $2.2 million of income in 2016. The decrease was due to advantageous foreign currency impacts on non-operating assets and liabilities.
Interest expense. Interest expense decreased from $26.2 million in the period January 1 through August 14, 2015 and $10.0 million in the period August 15 through December 31, 2015 to $26.9 million in 2016. The decrease was due to prepayment of our senior subordinated notes issued for an aggregate total face amount of $200 million (or the Senior Subordinated Notes) in 2015.
75
Loss from discontinued operations. Loss from discontinued operations increased from $18.7 million in the period January 1 through August 14, 2015 and $4.9 million in the period August 15 through December 31, 2015 to $127.0 million in 2016. This increase was primarily due to a $119.9 million impairment charge to align the carrying value of assets held for sale to their estimated fair value.
Provision for income taxes. The following table summarizes the expense for income taxes in 2016 and 2015:
| |
| |
| |
| |
| |
| |||
|---|---|---|---|---|---|---|---|---|---|---|---|---|
| | | | | | | | | | | |||
| |
| Successor |
|
|
| Predecessor |
| |||||
| | | | | | | | | | | |||
| |
| For the year ended December 31, 2016 |
| For the period August 15 through December 31, 2015 |
|
|
| For the period January 1 through August 14, 2015 |
| |||
| | | | | | | | | | | |||
|
| | | | | |||||||
| |
| |
| (Dollars in thousands) |
| |||||||
Tax (benefit) expense |
| $ | (7,552 | ) | $ | 6,882 | | | $ | 6,452 | | |
Loss from continuing operations before provision for income taxes |
| (116,421 | ) | (21,743 | ) | | (95,518 | ) | ||||
Effective tax rates |
| 6.5% | | (31.7 | )% | | (6.8 | )% | ||||
| | | | | | | | | | | |||
During 2015 and 2016, the effective tax rate differed from the U.S. statutory rate of 35% primarily due to losses incurred in the United States (and in Switzerland in 2016), where we receive no tax benefit due to a full valuation allowance, and taxes on worldwide earnings from various other countries. The recognition of the valuation allowance does not result in or limit our ability to utilize these tax assets in the future.
The tax expense decreased from a $6.5 million expense, for a (6.8)% effective tax rate, in the period January 1 to August 14, 2015 and a $6.9 million expense, for a (31.7)% effective tax rate, in the period August 15 to December 31, 2015 to a benefit of $7.5 million, for an effective tax rate of 6.5%, in 2016. The change in the effective tax rate from the year 2015 to the year 2016 is primarily related to a shift in the jurisdictional mix of earnings and losses from year to year. Certain foreign jurisdictions shifted from a pre-tax earnings basis in 2015 to a pre-tax loss basis in 2016 while the contribution of the U.S. and Switzerland pre-tax losses, for which we receive no tax benefit, decreased from 2015 to 2016.
Production capacity
Our graphite electrode plant production capacity in 2015 was 195,000 MT including our St. Marys facility, which has been temporarily idled since the second quarter of 2016. Due to the wind down and ultimate idling of St. Marys, our production capacity, excluding the St. Marys facility, declined to 176,000 MT in 2016. This production capacity reduction concentrated our manufacturing capabilities at our lowest cost, highest efficiency facilities. This, coupled with a recovery in customer demand, resulted in an increase to our capacity utilization, excluding the St. Marys facility, from 70% in 2015 to 85% in 2016.
Effects of inflation
We incur costs in the United States and each of the non-U.S. countries in which we have a manufacturing facility. In general, our results of operations, cash flows and financial condition are affected by the effects of inflation on our costs incurred in each of these countries.
Currency translation and transactions
We translate the assets and liabilities of our non-U.S. subsidiaries into U.S. dollars for consolidation and reporting purposes in accordance with the Financial Accounting Standards Board (FASB) Accounting Standards Codification (ASC) 830, Foreign Currency Matters. Foreign currency translation adjustments are generally recorded as part of stockholders' equity and identified as part of accumulated other comprehensive loss on the Consolidated Balance Sheets until such time as their operations are sold or substantially or completely liquidated.
76
We account for our Russian, Swiss, Luxembourg and Mexican subsidiaries using the dollar as the functional currency, as sales and purchases are predominantly dollar-denominated. Our remaining subsidiaries use their local currency as their functional currency.
We also record foreign currency transaction gains and losses from non-permanent intercompany balances as part of other (income) expense, net.
Significant changes in currency exchange rates impacting us are described under "Effects of Changes in Currency Exchange Rates" and "Results of Operations."
Liquidity and capital resources
Our sources of funds have consisted principally of cash flow from operations and debt, including the Old Revolving Credit Facility (subject to continued compliance with the financial covenants and representations under the Old Revolving Credit Facility). Our uses of those funds (other than for operations) have consisted principally of capital expenditures, cash paid for acquisitions and associated expenses, debt reduction payments and other obligations. Disruptions in the U.S. and international financial markets could adversely affect our liquidity and the cost and availability of financing to us in the future.
We believe that we have adequate liquidity to meet our needs. As of December 31, 2017, we had cash and cash equivalents of $13.4 million, long-term debt of $322.9 million, short-term debt of $16.5 million and stockholder's equity of $613.2 million. As of December 31, 2016, we had cash and cash equivalents of $11.6 million, long-term debt of $356.6 million, short-term debt of $8.9 million and stockholders' equity of $577.4 million.
As of December 31, 2017 and 2016, $12.6 million and $11.0 million, respectively, of our cash and cash equivalents were located outside of the United States. The December 31, 2017 balances outside of the United States included $2.5 million in Brazil, $0.6 million in Russia, $2.4 million in Switzerland, $1.8 million in South Africa and $0.3 million in China. The December 31, 2016 balances outside of the United States included $3.1 million in Brazil, $0.5 million in Russia, $1.0 million in Switzerland, $0.9 million in China and $1.1 million in South Africa. We repatriate funds from our foreign subsidiaries through dividends. All of our subsidiaries face the customary statutory limitation that distributed dividends do not exceed the amount of retained and current earnings. In addition, for our subsidiary in South Africa, the South Africa Central Bank imposes that certain solvency and liquidity ratios remain above defined levels after the dividend distribution, which historically has not materially affected our ability to repatriate cash from this jurisdiction. Upon repatriation to the United States, the foreign source portion of dividends we receive from our foreign subsidiaries is no longer subject to U.S. federal income tax as a result of the Tax Act.
Cash flow and plans to manage liquidity. Our cash flow typically fluctuates significantly between quarters due to various factors. These factors include customer order patterns, fluctuations in working capital requirements, timing of capital expenditures, acquisitions, divestitures and other factors.
As of December 31, 2017, we had access to a $225 million revolving facility (subject to a $25 million minimum liquidity requirement) (the Old Revolving Credit Facility). We had $39.5 million of borrowings and $8.7 million of letters of credit, for a total of $48.2 million drawn against the Old Revolving Credit Facility as of December 31, 2017 and $61.2 million of borrowings and $12.3 million of letters of credit, for a total of $73.5 million drawn against the Old Revolving Credit Facility as of December 31, 2016. We also had $0.5 million and $5.7 million of surety bonds outstanding as of December 31, 2017 and 2016, respectively. Surety bonds are renewed annually. If surety bond rates became unfavorable, the letters of credit under our Old Revolving Credit Facility would be utilized instead.
77
On February 12, 2018, we entered into the 2018 Credit Agreement, which provides for the 2018 Revolving Facility and the 2018 Term Loan Facility. On February 12, 2018, our wholly owned subsidiary, GrafTech Finance, borrowed $1,500 million under the 2018 Term Loan Facility. The funds received were used to pay off our outstanding debt, including borrowings under our Old Credit Agreement and the Senior Notes and accrued interest relating to such borrowings and the Senior Notes, declare and pay a dividend to Brookfield, pay fees and expenses incurred in connection therewith and for other general corporate purposes. See "—Financing Transactions—2018 Credit Agreement" below for more information.
Potential uses of our liquidity include capital expenditures, acquisitions, debt repayments and other general purposes, including cash outflows related to rationalization activities. Continued volatility in the global economy may require additional borrowings under the 2018 Revolving Facility. An improving economy, while resulting in improved results of operations, could increase our cash requirements to purchase inventories, make capital expenditures and fund payables and other obligations until increased accounts receivable are converted into cash. A downturn could significantly and negatively impact our results of operations and cash flows, which, coupled with increased borrowings, could negatively impact our credit ratings, our ability to comply with debt covenants, our ability to secure additional financing and the cost of such financing, if available.
In the event that operating cash flows fail to provide sufficient liquidity to meet our business needs, including capital expenditures, any such shortfall would need to be made up by increased borrowings under our 2018 Revolving Facility, to the extent available. We have sold all of our Engineered Solutions businesses in accordance with our plan to divest businesses that are not core to our graphite electrode business. The cash proceeds from the sales were used to repay borrowings outstanding under the Old Revolving Credit Facility and Old Term Loan Facility in accordance with the Second Amended and Restated Credit Agreement dated as of February 27, 2015 (or the Old Credit Agreement).
In order to seek to minimize our credit risks, we may reduce our sales of, or refuse to sell (except for cash on delivery or under letters of credit or parent guarantees), our products to some customers and potential customers. In the current economic environment, our customers may experience liquidity shortages or difficulties in obtaining credit, including letters of credit. Our unrecovered trade receivables worldwide have not been material during the last two years individually or in the aggregate.
We manage our capital expenditures by taking into account quality, plant reliability, safety, environmental and regulatory requirements, prudent or essential maintenance requirements, global economic conditions, available capital resources, liquidity, long-term business strategy and return on invested capital for the relevant expenditures, cost of capital and return on invested capital of the Company as a whole and other factors.
We had positive cash flow from operating activities during 2017, 2016 and 2015. Although the global economic environment experienced significant swings in these periods, our working capital management and cost-control initiatives allowed us to remain operating cash-flow positive in both times of declining and improving operating results.
Cash flows
Cash flows include cash flows from both continuing and discontinued operations.
78
The following table summarizes our cash flow activities:
| |
| |
| |
| |
| |
| |
| ||||
|---|---|---|---|---|---|---|---|---|---|---|---|---|---|---|---|
| | | | | | | | | | | | | ||||
| |
| Successor |
|
|
| Predecessor |
| ||||||||
| | | | | | | | | | | | | ||||
| |
| For the year ended December 31, |
| For the period August 15 through December 31, |
|
|
| For the period January 1 through August 14, |
| ||||||
| | | | | | | | | | | | | ||||
| |
| 2017 |
| 2016 |
| 2015 |
|
|
| 2015 |
| ||||
| | | | | | | | | | | | | ||||
|
| (Dollars in millions) | | ||||||||||||
Cash flow provided by (used in): |
| | | | | | |||||||||
Operating activities |
| $ | 36.6 | | $ | 22.8 | | $ | 23.1 | | | $ | 28.3 | | |
Investing activities |
| (2.2 | ) | (10.5 | ) | (17.5 | ) | | (39.9 | ) | |||||
Financing activities |
| (33.0 | ) | (8.3 | ) | (23.1 | ) | | 20.8 | | |||||
| | | | | | | | | | | | | ||||
Operating activities
Cash flow provided by (used in) operating activities represents cash receipts and cash disbursements related to all of our activities other than investing and financing activities. Operating cash flow is derived by adjusting net income (loss) for:
- •
- Non-cash items such as depreciation and amortization; impairment, post-retirement obligations and pension plan changes;
- •
- Gains and losses attributed to investing and financing activities such as gains and losses on the sale of assets and unrealized currency
transaction gains and losses; and
- •
- Changes in operating assets and liabilities which reflect timing differences between the receipt and payment of cash associated with transactions and when they are recognized in results of operations.
The net impact of the changes in working capital (operating assets and liabilities) include the impact of changes in: receivables, inventories, prepaid expenses, accounts payable, accrued liabilities, accrued taxes, interest payable and payments of other current liabilities.
In the year ended December 31, 2017, changes in working capital resulted in a net use of funds of $20.0 million which was impacted by:
- •
- use of funds of $29.8 million from the increase in accounts receivable, which was due primarily to increased sales driven by higher
sales prices;
- •
- use of funds from increases in inventory of $15.6 million primarily due to the increased price of raw materials;
- •
- use of funds of $10.6 million from increased prepaid and other current assets resulting from increased value-added tax receivables in
foreign jurisdictions; and
- •
- source of funds of $36.4 million from increases in accounts payable and other accruals primarily driven by customer deposits associated with our new three-to five-year take-or-pay contracts and the timing of payments for other liabilities.
79
Other uses of cash in the year ended December 31, 2017 included contributions to pension and other benefit plans of $8.8 million, cash paid for interest of $25.3 million and $3.5 million of cash paid for taxes.
In the year ended December 31, 2016, changes in working capital resulted in a net source of funds of $68.6 million which was impacted by:
- •
- source of funds of $3.4 million from the decrease in accounts receivable, which was due primarily to the timing of sales and payment
collections during the year;
- •
- source of funds from inventory reductions of $53.5 million primarily due to the planned reduction of inventory levels built up in prior
years;
- •
- source of funds of $15.8 million from increases in accounts payable; and
- •
- use of funds of $2.8 million for the settlement of rationalization related liabilities.
Other uses of cash in the year ended December 31, 2016 included contributions to pension and other benefit plans of $11.0 million, cash paid for interest of $23.6 million and $3.3 million of cash paid for taxes.
In the period August 15 through December 31, 2015, changes in working capital resulted in a net source of funds of $26.8 million which was impacted by:
- •
- use of funds of $9.5 million from the increase in accounts receivable, which was due primarily to the timing of sales and payment
collections during the year;
- •
- source of funds from prepaid and other asset reductions of $14.2 million primarily related to VAT receivable collections;
- •
- source of funds from inventory reductions of $47.9 million primarily due to the planned reduction of inventory levels built up in prior
years; and
- •
- use of funds of $19.8 million from a decreases in accounts payable.
Other uses of cash in the period August 15 through December 31, 2015 included contributions to pension and other benefit plans of $3.4 million, cash paid for interest of $10.9 million and $1.6 million of cash paid for taxes.
In the period January 1 through August 14, 2015, changes in working capital resulted in a net source of funds of $45.6 million which was impacted by:
- •
- net cash inflows in accounts receivable of $61.0 million from the decrease in accounts receivable due to the timing and collection of
customer sales payments;
- •
- net cash outflows from decreases in accounts payable and accruals of $18.7 million, due primarily to changes in tax accruals and
payables; and
- •
- an increase in interest payable of $2.3 million.
Other uses of cash in the period January 1 through August 14, 2015 included contributions to pension and other benefit plans of $11.2 million, cash paid for interest of $10.7 million and $5.0 million of cash paid for taxes.
80
Investing activities
Net cash used in investing activities was $2.2 million in the year ended December 31, 2017 and included capital expenditures of $34.7 million, of which $0.5 million were maintenance capital expenditures for discontinued operations. This use of cash was partially offset by cash proceeds from the sale of our Engineered Solutions businesses of $27.3 million and proceeds from the sale of fixed assets of $5.2 million.
Net cash used in investing activities was $10.5 million in the year ended December 31, 2016 and included capital expenditures of $27.9 million, of which $4.7 million were maintenance capital expenditures for discontinued operations, proceeds from the sale of fixed assets of $1.1 million and cash inflows of $15.9 million from the divestiture of our Fiber Materials Inc. business.
Net cash used in investing activities was $17.5 million in the period of August 15 through December 31, 2015 and included capital expenditures of $18.4 million, of which $4.4 million were maintenance capital expenditures for discontinued operations, and cash inflows of $0.6 million related to the sale of fixed assets.
Net cash used in investing activities was $39.9 million in the period of January 1 through August 14, 2015 and included capital expenditures of $32.3 million, of which $10.1 million were maintenance capital expenditures for discontinued operations, payments for derivative instruments of $8.3 million and cash inflows of $0.6 million related to the sale of fixed assets.
Financing activities
Net cash used in financing activities was $33.0 million for the year ended December 31, 2017, resulting from net payments on our Old Revolving Credit Facility.
Net cash used in financing activities was $8.3 million in the year ended December 31, 2016 and included net payments on our Old Revolving Credit Facility of $7.1 million and net payments of $0.9 million for refinancing fees.
Net cash used in financing activities was $23.1 million for the period August 15 through December 31, 2015 and included net payments on our Old Revolving Credit Facility of $21.5 million and cash outflows of $1.4 million for issuance costs related to our preferred share issuance.
Net cash provided by financing activities was $20.8 million in the period January 1 through August 14, 2015 and included cash proceeds of $150.0 million from our issuance of preferred shares, cash inflows for net borrowings on our Old Revolving Credit Facility of $79.5 million, $200 million cash outflow for the prepayment of our Senior Subordinated Notes, cash outflows of $5.1 million for refinancing fees and cash outflows of $3.4 million for issuance costs related to our preferred share issuance.
As a part of our cash management activities, we manage accounts receivable credit risk, collections, and accounts payable vendor terms to maximize our free cash at any given time and minimize accounts receivable losses.
Financing transactions
Senior Notes
On November 20, 2012, we issued $300 million principal amount of the Senior Notes. These Senior Notes were our senior unsecured obligations and ranked pari passu with all of our existing and future senior unsecured indebtedness. The Senior Notes were guaranteed on a senior unsecured basis by each of our existing and future subsidiaries that guarantee certain of our or another guarantor's other indebtedness. The Senior Notes bore interest at a rate of 6.375% per year, payable semi-annually in arrears on May 15 and November 15 of each year. The Senior Notes were scheduled to mature on November 15, 2020.
81
We were entitled to redeem some or all of the Senior Notes at any time at the redemption prices set forth in the related indenture.
If, prior to maturity, a change in control (as defined in the indenture) of us occurred and thereafter certain downgrades of the ratings of the Senior Notes as specified in the indenture occurred, we would have been required to offer to repurchase any or all of the Senior Notes at a repurchase price equal to 101% of the aggregate principal amount of the Senior Notes, plus any accrued and unpaid interest.
The indenture also contained covenants that, among other things, limited our ability and that of certain of our subsidiaries to: (i) create liens or use assets as security in other transactions; (ii) engage in certain sale/leaseback transactions; and (iii) merge, consolidate or sell, transfer, lease or dispose of substantially all of their assets.
The indenture also contained customary events of default, including (i) failure to pay principal or interest on the Senior Notes when due and payable, (ii) failure to comply with covenants or agreements in the indenture or the Senior Notes if not cured or waived as provided in the indenture, (iii) failure to pay our indebtedness or indebtedness of any Subsidiary Guarantor or Significant Subsidiary (as each term is defined in the indenture) in excess of $50.0 million within any applicable grace period after maturity or acceleration, (iv) certain events of bankruptcy, insolvency, or reorganization, (v) failure to pay any judgment or decree for an amount in excess of $50.0 million against us, any Subsidiary Guarantor or any Significant Subsidiary that was not discharged, waived or stayed as provided in the indenture, and (vi) cessation of any subsidiary guarantee to be in full force and effect or denial or disaffirmance by any Subsidiary Guarantor of its obligations under its subsidiary guarantee. In the case of an event of default, the principal amount of the Senior Notes plus accrued and unpaid interest could have been accelerated. The Senior Notes were redeemed on February 12, 2018, as described below under "Long-Term Contractual, Commercial and Other Obligations and Commitments."
Old Revolving Credit Facility and Old Term Loan Facility
On April 23, 2014, we and certain of our subsidiaries entered into the Old Credit Agreement with a borrowing capacity of $400 million and a maturity date of April 2019. On February 27, 2015, we and certain of our subsidiaries entered into a further amended and restated credit agreement that provided for, among other things, greater financial flexibility and a $40 million senior secured delayed draw term loan facility (the Old Term Loan Facility). The Old Revolving Credit Facility and the Old Term Loan Facility both had maturity dates of April 2019.
On July 28, 2015, we and certain of our subsidiaries entered into an amendment to the Old Credit Agreement to change the terms regarding the occurrence of a default upon a change in control (which is defined thereunder to include the acquisition by any person of more than 25% of our outstanding shares) to exclude the acquisition of shares by Brookfield (see Note 2, Preferred Share Issuance and Merger, of the Notes to the Consolidated Financial Statements included elsewhere in this prospectus). In addition, effective upon such acquisition, the financial covenants were eased, resulting in increased availability under the Old Revolving Credit Facility. The size of the Old Revolving Credit Facility was also reduced from $400 million to $375 million. The size of the Old Term Loan Facility remained at $40 million.
On April 27, 2016, we and certain of our subsidiaries entered into an amendment to the Old Revolving Credit Facility. The size of the Old Revolving Credit Facility was permanently reduced from $375 million to $225 million. New covenants were also added to the Old Revolving Credit Facility, including a requirement to make mandatory repayments of outstanding amounts under the Old Revolving Credit Facility and the Old Term Loan Facility with the proceeds of any sale of all or any substantial part of the assets included in the
82
Engineered Solutions segment and a requirement to maintain minimum liquidity (consisting of domestic cash, cash equivalents and availability under the Old Revolving Credit Facility) in excess of $25 million. The covenants were also modified to provide for: the elimination of certain exceptions to our negative covenants limiting our ability to make certain investments, sell assets, make restricted payments, incur liens and incur debt; a restriction on the amount of cash and cash equivalents permitted to be held on the balance sheet at any one time without paying down the Old Revolving Credit Facility and the Old Term Loan Facility; and changes to our financial covenants so that until the earlier of March 31, 2019 or we had $75 million in trailing twelve month EBITDA (as defined in the Old Credit Agreement), we were required to maintain trailing twelve month EBITDA from continuing operations above certain minimums ranging from ($40 million) to $35 million after which our existing financial covenants under the Old Revolving Credit Facility would apply.
With this amendment, we had full access to the $225 million Old Revolving Credit Facility, subject to the $25 million minimum liquidity requirement. As of December 31, 2017, we had $39.5 million of borrowings on the Old Revolving Credit Facility and $8.7 million of letters of credit drawn against the Old Revolving Credit Facility. As of December 31, 2016, we had $61.2 million of borrowings and $12.3 million of letters of credit, for a total of $73.5 million drawn against the Old Revolving Credit Facility.
The $40 million Old Term Loan Facility was fully drawn on August 11, 2015, in connection with the repayment of the Senior Subordinated Notes. We had $18.7 million outstanding on its Old Term Loan Facility as of December 31, 2017.
The interest rate applicable to the Old Revolving Credit Facility and Old Term Loan Facility was LIBOR plus a margin ranging from 2.25% to 4.75% (depending on our total senior secured leverage ratio). The borrowers were required to pay a per annum fee ranging from 0.35% to 0.70% (depending on our senior secured leverage ratio) on the undrawn portion of the commitments under the Old Revolving Credit Facility.
As of December 31, 2017, we were in compliance with all financial and other covenants contained in the Old Revolving Credit Facility, as applicable. As described below, the outstanding indebtedness under the Old Revolving Credit Facility has since been repaid and all commitments thereunder have been terminated.
2018 Credit Agreement
On February 12, 2018, we entered into the 2018 Credit Agreement among us, GrafTech Finance, GrafTech Switzerland SA, a Swiss corporation and an indirect wholly owned subsidiary of GrafTech (or Swissco), GrafTech Luxembourg II S.à.r.l., a Luxembourg société à responsabilité limitée and an indirect wholly owned subsidiary of GrafTech (or Luxembourg Holdco) and, together with GrafTech Finance and Swissco, the Co-Borrowers), the lenders and issuing banks party thereto and JPMorgan Chase Bank, N.A. as administrative agent and as collateral agent, which provides for (i) the 2018 Term Loan Facility and (ii) the 2018 Revolving Credit Facility, which may be used from time to time for revolving credit borrowings denominated in dollars or Euro, the issuance of one or more letters of credit denominated in dollars, Euro, Pounds Sterling or Swiss Francs and one or more swing line loans denominated in dollars. GrafTech Finance is the sole borrower under the 2018 Term Loan Facility while GrafTech Finance, Swissco and Lux Holdco are Co-Borrowers under the 2018 Revolving Credit Facility. On February 12, 2018, GrafTech Finance borrowed $1,500 million under the 2018 Term Loans. The 2018 Term Loans mature on February 12, 2025. The maturity date for the 2018 Revolving Credit Facility is February 12, 2023.
The proceeds of the 2018 Term Loans were used to (i) repay in full all outstanding indebtedness of the Co-Borrowers under the Old Credit Agreement and terminate all commitments thereunder, (ii) redeem in
83
full the Senior Notes at a redemption price of 101.594% of the principal amount thereof plus accrued and unpaid interest to the date of redemption, (iii) pay fees and expenses incurred in connection with (i) and (ii) above and the Senior Secured Credit Facilities and related expenses, and (iv) declare and pay a dividend to Brookfield of $1,112 million, with any remainder to be used for general corporate purposes. In connection with the repayment of the Old Credit Agreement and redemption of the Senior Notes, all guarantees of obligations under the Old Credit Agreement, the indenture and the Senior Notes were terminated, all mortgages and other security interests securing obligations under the Old Credit Agreement were released and the Old Credit Agreement and the indenture were terminated.
Borrowings under the 2018 Term Loan Facility bear interest, at GrafTech Finance's option, at a rate equal to either (i) the Adjusted LIBO Rate (as defined in the 2018 Credit Agreement), plus an applicable margin initially equal to 3.50% per annum or (ii) the ABR Rate (as defined in the 2018 Credit Agreement), plus an applicable margin initially equal to 2.50% per annum, in each case with one step down of 25 basis points based on achievement of certain public ratings of the 2018 Term Loans.
Borrowings under the 2018 Revolving Credit Facility bear interest, at the applicable Co-Borrower's option, at a rate equal to either (i) the Adjusted LIBO Rate, plus an applicable margin initially equal to 3.75% per annum or (ii) the ABR Rate, plus an applicable margin initially equal to 2.75% per annum, in each case with two 25 basis point step downs based on achievement of certain senior secured first lien net leverage ratios. In addition, the Co-Borrowers will be required to pay a quarterly commitment fee on the unused commitments under the 2018 Revolving Credit Facility in an amount equal to 0.25% per annum.
All obligations under the 2018 Credit Agreement are guaranteed by GrafTech, GrafTech Finance and each domestic subsidiary of GrafTech, subject to certain customary exceptions, and all obligations under the 2018 Credit Agreement of each foreign subsidiary of GrafTech that is a Controlled Foreign Corporation are guaranteed by GrafTech Luxembourg I S.à.r.l., a Luxembourg société à responsabilité limitée and an indirect wholly owned subsidiary of GrafTech (or Luxembourg Parent), Luxembourg Holdco, and Swissco (collectively, the Guarantors).
All obligations under the 2018 Credit Agreement are secured, subject to certain exceptions and Excluded Assets (as defined in the 2018 Credit Agreement), by: (i) a pledge of all of the equity securities of GrafTech Finance and each domestic Guarantor (other than GrafTech) and of each other direct, wholly owned domestic subsidiary of GrafTech and any Guarantor, (ii) a pledge on no more than 65% of the equity interests of each subsidiary that is a Controlled Foreign Corporation (within the meaning of Section 956 of the Internal Revenue Code of 1986, as amended from time to time), and (iii) security interests in, and mortgages on, personal property and material real property of GrafTech Finance and each domestic Guarantor, subject to permitted liens and certain exceptions specified in the 2018 Credit Agreement. The obligations of each foreign subsidiary of GrafTech that is a Controlled Foreign Corporation under the 2018 Revolving Credit Facility are secured by (i) a pledge of all of the equity securities of each Guarantor that is a Controlled Foreign Corporation and of each direct, wholly owned subsidiary of any Guarantor that is a Controlled Foreign Corporation, and (ii) security interests in certain receivables and personal property of each Guarantor that is a Controlled Foreign Corporation, subject to permitted liens and certain exceptions specified in the 2018 Credit Agreement.
The 2018 Term Loans amortize at a rate equal to 5% per annum of the original principal amount of the 2018 Term Loans payable in equal quarterly installments, with the remainder due at maturity. The Co-Borrowers are permitted to make voluntary prepayments at any time without premium or penalty, except in the case of prepayments made in connection with certain repricing transactions with respect to the 2018 Term Loans effected within twelve months of the closing date of the 2018 Credit Agreement, to
84
which a 1.00% prepayment premium applies. GrafTech Finance is required to make prepayments under the 2018 Term Loans (without payment of a premium) with (i) net cash proceeds from non-ordinary course asset sales (subject to customary reinvestment rights and other customary exceptions and exclusions), and (ii) commencing with the Company's fiscal year ending December 31, 2019, 75% of Excess Cash Flow (as defined in the 2018 Credit Agreement), subject to step-downs to 50% and 0% of Excess Cash Flow based on achievement of a senior secured first lien net leverage ratio greater than 1.25 to 1.00 but less or equal or 1.75 to 1.00 and less than or equal to 1.25 to 1.00, respectively. Scheduled quarterly amortization payments of the 2018 Term Loans during any calendar year reduce, on a dollar-for-dollar basis, the amount of the required Excess Cash Flow prepayment for such calendar year, and the aggregate amount of Excess Cash Flow prepayments for any calendar year reduce subsequent quarterly amortization payments of the 2018 Term Loans as directed by GrafTech Finance.
The 2018 Credit Agreement contains customary representations and warranties and customary affirmative and negative covenants applicable to GrafTech and restricted subsidiaries, including, among other things, restrictions on indebtedness, liens, investments, fundamental changes, dispositions, and dividends and other distributions. The 2018 Credit Agreement contains a financial covenant that requires GrafTech to maintain a senior secured first lien net leverage ratio not greater than 4.00:1.00 when the aggregate principal amount of borrowings under the 2018 Revolving Credit Facility and outstanding letters of credit issued under the 2018 Revolving Credit Facility (except for undrawn letters of credit in an aggregate amount equal to or less than $35 million), taken together, exceed 35% of the total amount of commitments under the 2018 Revolving Credit Facility. The 2018 Credit Agreement also contains customary events of default.
Fixed rate obligations
As of December 31, 2017 and December 31, 2016, approximately 83% and 75% of our debt, respectively, consisted of fixed rate or zero interest rate obligations.
Long-Term contractual, commercial and other obligations and commitments. The following tables summarize our long-term contractual obligations and other commercial commitments as of December 31, 2017 on:
- •
- an actual basis; and
- •
- a pro forma basis to give effect to (i) our entrance into the 2018 Credit Agreement and the borrowing of $1,500 million of 2018 Term Loans thereunder in February 2018; and (ii) the use of proceeds therefrom to, among other things, repay in full all outstanding indebtedness under the Old Credit Agreement and redeem in full the Senior Notes at a redemption price of 101.594% of the principal amount thereof plus accrued and unpaid interest to the date of redemption.
85
| | | | | | | | | | | | | |||||
| |
| Payments Due by Year Ending December 31, | | |||||||||||||
|---|---|---|---|---|---|---|---|---|---|---|---|---|---|---|---|---|
| |
| Total |
| 2018 |
| 2019-2020 |
| 2021-2022 |
| 2023+ |
| |||||
| | | | | | | | | | | | | |||||
|
| (Dollars in thousands) | | |||||||||||||
Contractual and Other Obligations |
| | | | | | ||||||||||
Long-term debt(a) |
| $ | 359,364 | | $ | 16,784 | | $ | 341,950 | | $ | 280 | | $ | 350 | |
Interest on long-term debt(b) |
| 56,578 | | 19,125 | | 37,453 | | — | | — | | |||||
Leases |
| 6,188 | | 2,180 | | 2,646 | | 713 | | 649 | | |||||
| | | | | | | | | | | | | |||||
Total contractual obligations |
| 422,130 | | 38,089 | | 382,049 | | 993 | | 999 | | |||||
Postretirement, pension and related benefits(c) |
| 115,557 | | 11,717 | | 22,986 | | 22,853 | | 58,001 | | |||||
Committed purchase obligations(d) |
| 17,935 | | 17,935 | | — | | — | | — | | |||||
Other long-term obligations |
| 8,463 | | 6,721 | | 723 | | 392 | | 627 | | |||||
Uncertain income tax provisions |
| 2,492 | | 379 | | 1,990 | | 123 | | — | | |||||
| | | | | | | | | | | | | |||||
Total contractual and other obligations(e) |
| $ | 566,577 | | $ | 74,841 | | $ | 407,748 | | $ | 24,361 | | $ | 59,627 | |
| | | | | | | | | | | | | |||||
Other Commercial Commitments |
| | | | | | ||||||||||
Guarantees(f) |
| 525 | | 525 | | — | | — | | — | | |||||
| | | | | | | | | | | | | |||||
Total other commercial commitments |
| $ | 525 | | $ | 525 | | $ | — | | $ | — | | $ | — | |
| | | | | | | | | | | | | |||||
| | | | | | | | | | | | | |||||
| |
| Pro Forma Contractual Obligations | | |||||||||||||
|---|---|---|---|---|---|---|---|---|---|---|---|---|---|---|---|---|
| |
| Payments Due by Year Ending December 31, | | |||||||||||||
| |
| Total |
| 2018 |
| 2019-2020 |
| 2021-2022 |
| 2023+ |
| |||||
| | | | | | | | | | | | | |||||
Contractual and Other Obligations |
| | | | | | ||||||||||
Pro forma long-term debt(g) |
| $ | 1,500,000 | | $ | 37,500 | | $ | 150,000 | | $ | 150,000 | | $ | 1,162,500 | |
Pro forma interest on long-term debt(g) |
| $ | 547,348 | | $ | 72,056 | | $ | 171,094 | | $ | 157,025 | | $ | 147,173 | |
Leases |
| 6,188 | | 2,180 | | 2,646 | | 713 | | 649 | | |||||
| | | | | | | | | | | | | |||||
Total contractual obligations |
| 2,053,536 | | 111,736 | | 323,740 | | 307,738 | | 1,310,322 | | |||||
Postretirement, pension and related benefits(c) |
| 115,557 | | 11,717 | | 22,986 | | 22,853 | | 58,001 | | |||||
Committed purchase obligations(d) |
| 39,085 | | 39,085 | | — | | — | | — | | |||||
Other long-term obligations |
| 8,463 | | 6,721 | | 723 | | 392 | | 627 | | |||||
Uncertain income tax provisions |
| 2,492 | | 379 | | 1,990 | | 123 | | — | | |||||
| | | | | | | | | | | | | |||||
Total contractual and other obligations(e) |
| $ | 2,219,133 | | $ | 169,638 | | $ | 349,439 | | $ | 331,106 | | $ | 1,368,950 | |
| | | | | | | | | | | | | |||||
Other Commercial Commitments |
| | | | | | ||||||||||
Guarantees(f) |
| 525 | | 525 | | — | | — | | — | | |||||
| | | | | | | | | | | | | |||||
Total other commercial commitments |
| $ | 525 | | $ | 525 | | $ | — | | $ | — | | $ | — | |
| | | | | | | | | | | | | |||||
(a) The Senior Notes were redeemed on February 12, 2018 (see note (g) below).
(b) Represented interest payments required on Senior Notes.
(c) Represents estimated postretirement, pension and related benefits obligations based on actuarial calculations.
(d) Represents commitments made for purchases related to our ongoing plant expansion projects and commitments for the purchase of raw materials.
(e) In addition, letters of credit of $8.7 million were issued under the Old Revolving Credit Facility as of December 31, 2017. These letters of credit were rolled over to the 2018 Revolving Facility in February 2018.
(f) Represents surety bonds which are renewed annually. If rates were unfavorable, we would use letters of credit under our revolving facility.
86
(g) On February 12, 2018, the Company entered into the 2018 Credit Agreement, which provided for the 2018 Term Loan Facility and 2018 Revolving Credit Facility. On February 12, 2018, GrafTech Finance borrowed $1,500 million of 2018 Term Loans under the 2018 Term Loan Facility. The proceeds of the 2018 Term Loans were used, among other things, to pay off our outstanding debt, including borrowings under the Old Credit Agreement and the Senior Notes and related interest. The 2018 Term Loans mature on February 12, 2025 and bear interest at a rate equal to either the Adjusted LIBO Rate, plus an applicable margin initially equal to 3.50% per annum, or the ABR Rate, plus an applicable margin initially equal to 2.50% per annum, in each case with one step down of 25 basis points based on achievement of certain public ratings of the 2018 Term Loans (see "Liquidity and Capital Resources" for details). The pro forma interest on long-term debt was estimated using a monthly LIBOR yield curve through February 2025.
Off-Balance sheet arrangements and commitments. We have not undertaken or been a party to any material off-balance-sheet financing arrangements or other commitments (including non-exchange traded contracts), other than:
- •
- The notional amount of foreign exchange and commodity contracts;
- •
- Commitments under non-cancelable operating leases that, as of December 31, 2017, totaled no more than $2.2 million in each year
and $6.2 million in the aggregate and as of December 31, 2017;
- •
- Letters of credit outstanding under the Old Revolving Credit Facility of $8.7 million as of December 31, 2017 and
$12.3 million as of December 31, 2016 (these letters of credit were rolled over to the 2018 Revolving Facility in February 2018); and
- •
- Surety bonds and letters of credit with other banks totaling $0.5 million.
We are not affiliated with or related to any special purpose entity other than GrafTech Finance.
Costs relating to protection of the environment
We have been and are subject to increasingly stringent environmental protection laws and regulations. In addition, we have an on-going commitment to rigorous internal environmental protection standards. Environmental considerations are part of all significant capital expenditure decisions. The following table sets forth certain information regarding environmental expenses and capital expenditures.
| | | | | | | | | |||
| |
| For the year ended December 31, |
| |||||||
|---|---|---|---|---|---|---|---|---|---|---|
| |
| 2017 |
| 2016 |
| 2015 |
| |||
| | | | | | | | | |||
(Dollars in thousands) |
| |||||||||
Expenses relating to environmental protection |
| $ | 7,973 | | $ | 8,255 | | $ | 6,507 | |
Capital expenditures related to environmental protection |
| 2,080 | | 1,693 | | 2,082 | | |||
| | | | | | | | | |||
Critical accounting policies
Critical accounting policies are those that require difficult, subjective or complex judgments by management, often as a result of the need to make estimates about the effect of matters that are inherently uncertain and may change in subsequent periods. We use and rely on estimates in determining the economic useful lives of our assets, obligations under our employee benefit plans, provisions for doubtful accounts, provisions for restructuring charges and contingencies, tax valuation allowances, evaluation of goodwill, other intangible assets, pension and postretirement benefit obligations and various other recorded or disclosed amounts, including inventory valuations. Estimates require us to use our judgment. While we believe that our estimates for these matters are reasonable, if the actual amount is significantly different than the estimated amount, our assets, liabilities or results of operations may be overstated or understated. The following accounting policies are deemed to be critical.
87
Business combinations and goodwill. The application of the purchase method of accounting for business combinations requires the use of significant estimates and assumptions in the determination of the fair value of assets acquired and liabilities assumed in order to properly allocate purchase price consideration between goodwill and assets that are depreciated and amortized. Our estimates of the fair values of assets and liabilities acquired are based on assumptions believed to be reasonable and, when appropriate, include assistance from independent third-party appraisal firms.
As a result of our acquisition by Brookfield, we have a significant amount of goodwill. Goodwill is tested for impairment annually or more frequently if an event or circumstance indicates that an impairment loss may have been incurred. Application of the goodwill impairment test requires judgment, including the identification of reporting units, assignment of assets and liabilities to reporting units, assignment of goodwill to reporting units and determination of the fair value of each reporting unit. We estimate the fair value of each reporting unit using a discounted cash flow methodology. This requires us to use significant judgment including estimation of future cash flows, which is based upon relevant market data, internal forecasts, estimation of the long-term growth for our business, the useful life over which cash flows will occur and determination of the weighted average cost of capital for purposes of establishing a discount rate.
As a result of our ongoing monitoring of triggering events, we recorded a goodwill impairment charge in our petroleum needle coke reporting unit totaling $35.4 million during the first quarter of 2015.
Refer to Note 1, Business and Summary of Significant Accounting Policies, of the Notes to the Consolidated Financial Statements included elsewhere in this prospectus for information regarding our goodwill impairment testing.
Employee benefit plans. We sponsor various retirement and pension plans, including defined benefit and defined contribution plans and postretirement benefit plans that cover most employees worldwide. Excluding the defined contribution plans, accounting for these plans requires assumptions as to the discount rate, expected return on plan assets, expected salary increases and health care cost trend rate. See Note 12, Retirement Plans and Postretirement Benefits, of the Notes to the Consolidated Financial Statements included elsewhere in this prospectus for further details.
Impairments of long-lived assets. We record impairment losses on long-lived assets used in operations when events and circumstances indicate that the assets might be impaired and the future undiscounted cash flows estimated to be generated by those assets are less than the carrying amount of those assets. Assets to be disposed are reported at the lower of the carrying amount or fair value less estimated costs to sell. Estimates of the future cash flows are subject to significant uncertainties and assumptions. If the actual value is significantly less than the estimated fair value, our assets may be overstated. Future events and circumstances, some of which are described below, may result in an impairment charge:
- •
- new technological developments that provide significantly enhanced benefits over our current technology;
- •
- significant negative economic or industry trends;
- •
- changes in our business strategy that alter the expected usage of the related assets; and
- •
- future economic results that are below our expectations used in the current assessments.
88
Accounting for income taxes. When we prepare the Consolidated Financial Statements, we are required to estimate our income taxes in each of the jurisdictions in which we operate. This process requires us to make the following assessments:
- •
- estimate our actual current tax liability in each jurisdiction;
- •
- estimate our temporary differences resulting from differing treatment of items for tax and accounting purposes (which result in deferred tax
assets and liabilities that we include within the Consolidated Balance Sheets); and
- •
- assess the likelihood that our deferred tax assets will be recovered from future taxable income and, if we believe that recovery is not more likely than not, a valuation allowance is established.
If our estimates are incorrect, our deferred tax assets or liabilities may be overstated or understated.
As of December 31, 2017, we had a valuation allowance of $150.8 million against certain deferred tax assets. Our losses in certain tax jurisdictions in recent periods represented sufficient negative evidence to require a full valuation allowance. Until we determine that we will generate sufficient jurisdictional taxable income to realize our net operating losses and deferred tax assets, we continue to maintain a valuation allowance.
Revenue recognition. Revenue from sales of our commercial products is recognized when persuasive evidence of an arrangement exists, delivery has occurred, title has passed, the amount is determinable and collection is reasonably assured. Sales are recognized when both title and the risks and rewards of ownership are transferred to the customer or services have been rendered and fees have been earned in accordance with the contract.
Volume discounts and rebates are recorded as a reduction of revenue in conjunction with the sale of the related products. Changes to estimates are recorded when they become probable. Shipping and handling revenues relating to products sold are included as an increase to revenue. Shipping and handling costs related to products sold are included as an increase to cost of sales.
We are adopting FASB ASC 606 effective January 1, 2018 and have elected the modified retrospective transition method. Under this method, any cumulative effect of applying the new revenue standard for contracts not yet complete is recorded as an adjustment to the opening balance of retained earnings as of the beginning of 2018. The comparative information for prior years will not be revised and will continue to be reported under the accounting standards in effect for the period presented. See "—Recent Accounting Pronouncements."
Under ASC 606, an entity recognizes revenue when its customer obtains control of promised goods or services, in an amount that reflects the consideration which the entity expects to receive in exchange for those goods or services.
To determine revenue recognition for arrangements that we determine are within the scope of ASC 606, the following five steps are performed: (i) identify the contract(s) with a customer; (ii) identify the performance obligations in the contract; (iii) determine the transaction price; (iv) allocate the transaction price to the performance obligations in the contract; and (v) recognize revenue when (or as) we satisfy a performance obligation. We only apply the five-step model to contracts when it is probable that we will collect the consideration we are entitled to in exchange for the goods or services we transfer to the customer. At contract inception, once the contract is determined to be within the scope of ASC 606, we assess the goods or services promised within each contract and determine those that are performance
89
obligations, and assess whether each promised good or service is distinct. We then recognize as revenue the amount of the transaction price that is allocated to the respective performance obligation when (or as) the performance obligation is satisfied.
In 2018, our revenue streams are expected to consist of three- to five-year take-or-pay supply contracts and short-term binding and non-binding purchase orders (deliveries within the year) directly with steel manufacturers. In 2017, our revenue streams consisted primarily of annual non-binding purchase orders The promises of delivery of graphite electrodes represent the distinct performance obligations to which the contract consideration is allocated, based upon the electrode stand-alone selling prices for the class of customers at the time the agreements are entered into. The performance obligations are considered to be satisfied at a point in time when control of the electrodes has been transferred to the customer. The company has elected to treat the transportation of the electrodes from our premises to the customer's facilities as a fulfilment activity, and outbound freight cost is accrued when the graphite electrode performance obligation is satisfied. Any variable consideration is recognized up to its unconstrained amount, i.e., up to the amount for which it is probable that a significant reversal of the variable revenue will not happen.
Discontinued operations and assets held for sale. When management commits to a plan to sell assets or asset groups and a sale is probable, we reclassify those assets or asset groups into "Assets Held for Sale." Upon reclassification to assets held for sale, we evaluate the book value of the disposal groups against their fair value, less costs to sell, and as a result may impair the assets or asset groups. As and if new information becomes available on the fair value of the assets or asset groups, we may adjust the impairment accordingly. For example, during 2016, we evaluated the fair value of the Engineered Solutions business segment utilizing the market approach (Level 3 measure). As a result, we incurred an impairment charge to our Engineered Solutions business segment of $119.9 million to align the carrying value with estimated fair value. We continued to update this estimate and during 2017, we further reduced the estimated fair value by $5.3 million based upon current information.
Once the assets of a business have been classified as held for sale, we evaluate if the divestiture represents a strategic shift in operations and if so, we exclude the results of this business from continuing operations. All results are reported as gain or loss from discontinued operations, net of tax. During the second quarter of 2016, our Engineered Solutions segment qualified as discontinued operations and as such, all results from that segment have been excluded from operations. See Note 3, Discontinued Operations and Related Assets Held for Sale, of the Notes to the Consolidated Financial Statements included elsewhere in this prospectus.
Recent accounting pronouncements
In August 2017, the FASB issued Accounting Standards Update (ASU) No. 2017-12, Derivatives and Hedging (Topic 815): Targeted Improvements to Accounting for Hedging Activities. The new standard simplifies hedge accounting through changes to both designation and measurement requirements. For hedges that qualify as highly effective, the new standard eliminates the requirement to separately measure and record hedge ineffectiveness resulting in better alignment between the presentation of the effects of the hedging instrument and the hedged item in the financial statements. We elected to early adopt ASU No. 2017-12 for the year ended December 31, 2017. The adoption of this standard required retrospective adoption, but did not impact prior-period financial results.
In May 2014, the FASB issued ASU No. 2014-09, Revenue from Contracts with Customers (Topic 606). This ASU supersedes the revenue recognition requirements in Accounting Standards Codification 605—Revenue
90
Recognition and most industry-specific guidance throughout the Codification. This ASU requires that an entity recognize revenue to depict the transfer of promised goods or services to customers in an amount that reflects the consideration to which the entity expects to be entitled in exchange for those goods or services. This ASU was expected to be effective for fiscal years beginning after December 15, 2016, and for interim periods within those fiscal years. On July 9, 2015, the FASB deferred the effective date to fiscal years beginning after December 15, 2017. During the fourth quarter of 2017, we substantially completed our evaluation of the new standard and the related assessment and review of a representative sample of existing revenue contracts with our customers including our new three-to-five year take-or-pay agreements. We determined that this standard will not have a material impact on our consolidated financial statements. We adopted this standard effective as of January 1, 2018 using the modified retrospective method.
In February 2016, the FASB issued ASU No. 2016-02, Leases (Topic 842). Under this new guidance, a company will now recognize most leases on its balance sheet as lease liabilities with corresponding right-of-use assets. This ASU is effective for fiscal years beginning after December 15, 2018. The Company has compiled its lease inventory and is currently evaluating the contracts and the impact of the adoption of this standard on its financial position, results of operations or cash flows.
In August 2016 the FASB issued ASU 2016-15, "Statement of Cash Flows (Topic 230), Classification of Certain Cash Receipts and Payments" (ASU 2016-15), clarifying guidance on the classification of certain cash receipts and payments in the statement of cash flows. The adoption of ASU 2016-15 on January 1, 2018 is not expected to have a material impact on our consolidated financial statements.
In January 2017, the FASB issued ASU No. 2017-04 Intangibles—Goodwill and Other (Topic 350). This guidance was issued to simplify the accounting for goodwill impairment. The guidance removes the second step of the goodwill impairment test, which requires that a hypothetical purchase price allocation be performed to determine the amount of impairment, if any. Under this new guidance, a goodwill impairment charge will be based on the amount by which a reporting unit's carrying value exceeds its fair value, not to exceed the carrying amount of goodwill. The guidance will become effective on a prospective basis for the Company on January 1, 2020 with early adoption permitted for interim or annual goodwill impairment tests performed on testing dates after January 1, 2017. The Company is currently evaluating the impact of the adoption of this standard on its results of operations.
In March 2017, the FASB issued ASU No. 2017-07, Compensation-Retirement Benefits (Topic 715). This standard requires an entity to report the service cost component in the same line item as other compensation costs. The other components of net (benefit) cost including our annual mark-to-market re-measurement will be presented in the income statement separately from the service cost component and outside a subtotal of income from operations. The adoption of ASU No. 2017-07 on January 1, 2018 will change the presentation of, but is not expected to have a material impact on our consolidated financial statements. The components of the net (benefit) cost are shown in Note 12, "Retirement Plans and Postretirement Benefits."
Quantitative and qualitative disclosures about market risk
We are exposed to market risks, primarily from changes in interest rates, currency exchange rates, energy commodity prices and commercial energy rates. From time to time we enter into transactions that have been authorized according to documented policies and procedures in order to manage these risks. These transactions relate primarily to financial instruments described below. Since the counterparties to these financial instruments are large commercial banks and similar financial institutions, we do not believe that
91
we are exposed to material counterparty credit risk. We do not use financial instruments for trading purposes.
Our exposure to changes in interest rates results primarily from floating rate long-term debt tied to LIBOR or Euro LIBOR. Our exposure to changes in currency exchange rates results primarily from:
- •
- sales made by our subsidiaries in currencies other than local currencies;
- •
- raw material purchases made by our foreign subsidiaries in currencies other than local currencies; and
- •
- investments in and intercompany loans to our foreign subsidiaries and our share of the earnings of those subsidiaries, to the extent denominated in currencies other than the U.S. dollar.
Our exposure to changes in energy commodity prices and commercial energy rates results primarily from the purchase or sale of refined oil products and the purchase of natural gas and electricity for use in our manufacturing operations.
Currency rate management. We enter into foreign currency derivatives from time to time to attempt to manage exposure to changes in currency exchange rates. These foreign currency derivatives, which include, but are not limited to, forward exchange contracts and purchased currency options, attempt to hedge global currency exposures. Forward exchange contracts are agreements to exchange different currencies at a specified future date and at a specified rate. Purchased currency options are instruments which give the holder the right, but not the obligation, to exchange different currencies at a specified rate at a specified date or over a range of specified dates. Forward exchange contracts and purchased currency options are carried at market value.
The outstanding foreign currency derivatives as of December 31, 2017 represented a net unrealized loss of $0.1 million and a loss of $0.2 million as of December 31, 2016.
Energy commodity management. We have entered into commodity derivative contracts to effectively fix some or all of our exposure to refined oil products. The outstanding commodity derivative contracts represented a net unrealized gain of $4.7 million as of December 31, 2017.
Interest rate risk management. We periodically implement interest rate management initiatives to seek to minimize our interest expense and the risk in our portfolio of fixed and variable interest rate obligations.
We periodically enter into agreements with financial institutions that are intended to limit our exposure to additional interest expense due to increases in variable interest rates. These instruments effectively cap our interest rate exposure. We currently do not have any such instruments outstanding.
Sensitivity analysis. We use sensitivity analysis to quantify potential impacts that market rate changes may have on the underlying exposures as well as on the fair values of our derivatives.
The sensitivity analysis for the derivatives represents the hypothetical changes in value of the hedge position and does not reflect the related gain or loss on the forecasted underlying transaction. As of December 31, 2017, a 10% appreciation or depreciation in the value of the U.S. dollar against foreign currencies from the prevailing market rates would result in a corresponding decrease of $0.7 million or a corresponding increase of $0.7 million, respectively, in the fair value of the foreign currency hedge portfolio. A 10% increase or decrease in the value of the underlying commodity prices that we hedge would result in a corresponding increase or decrease of $14.4 million in the fair value of the commodity hedge portfolio as of December 31, 2017. Because of the high correlation between the hedging instrument
92
and the underlying exposure, fluctuations in the value of the instruments are generally offset by reciprocal changes in the value of the underlying exposure.
We had no interest rate derivative instruments outstanding as of December 31, 2017. A hypothetical increase in interest rates of 100 basis points (1%) would have increased our interest expense by $0.9 million for the year ended December 31, 2017.
Jumpstart Our Business Startups Act of 2012
We qualify as an "emerging growth company" as defined in Section 2(a) of the Securities Act, as modified by the JOBS Act. As an emerging growth company, we may take advantage of specified reduced disclosure and other requirements that are otherwise applicable generally to public companies, which are not emerging growth companies.
We may take advantage of these exemptions until such time that we are no longer an emerging growth company. We will remain an "emerging growth company" until the earliest of (1) the last day of the fiscal year following the fifth anniversary of the completion of this offering, (2) the last day of the fiscal year in which we have total annual gross revenue of at least $1.07 billion, (3) the date on which we are deemed to be a large accelerated filer under the Securities Exchange Act of 1934, which means the market value of our common stock that is held by non-affiliates exceeds $700.0 million as of the prior June 30, and (4) the date on which we have issued more than $1.0 billion in non-convertible debt during the prior three-year period. We have taken advantage of reduced disclosure regarding executive compensation arrangements in this prospectus, and we may choose to take advantage of some but not all of these reduced disclosure obligations in future filings. If we do, the information that we provide to stockholders may be different than you might get from other public companies in which you hold stock.
Under the JOBS Act, emerging growth companies can also delay adopting new or revised accounting standards until such time as those standards apply to private companies. We have irrevocably elected not to avail ourselves of this exemption from new or revised accounting standards and, therefore, will be subject to the same new or revised accounting standards as other public companies that are not emerging growth companies.
93
Our company
We are a leading manufacturer of high quality graphite electrode products essential to the production of EAF steel and other ferrous and non-ferrous metals. We believe that we have the most competitive portfolio of low-cost graphite electrode manufacturing facilities in the industry, including three of the five highest capacity facilities in the world (excluding China). We are the only large scale graphite electrode producer that is substantially vertically integrated into petroleum needle coke, the primary raw material for graphite electrode manufacturing, which is currently in limited supply. This unique position provides us with competitive advantages in product quality and cost. Founded in 1886, we have over 125 years of experience in the R&D of graphite- and carbon-based solutions, and our intellectual property portfolio is extensive. We currently have graphite electrode manufacturing facilities in Calais, France, Pamplona, Spain, Monterrey, Mexico and St. Marys, Pennsylvania. Our customers include major steel producers and other ferrous and non-ferrous metal producers in EMEA, the Americas and APAC, which sell their products into the automotive, construction, appliance, machinery, equipment and transportation industries. Our vision is to be the lowest cost, highest quality producer of graphite electrodes while providing the best customer service. Based on the high quality of our graphite electrodes, reliability of our petroleum needle coke supply and our excellent customer service, we believe that we are viewed as the preferred supplier to the global EAF steel producer market.
Graphite electrodes are an industrial consumable product used primarily in EAF steel production, one of the two primary methods of steel production and the steelmaking technology used by all "mini-mills." Electrodes act as conductors of electricity in the furnace, generating sufficient heat to melt scrap metal, iron ore or other raw materials used to produce steel or other metals. We estimate that, on average, the cost of graphite electrodes represents only approximately 1% to 5% of the total production cost of steel in a typical EAF, but they are essential to EAF steel production. Graphite electrodes are currently the only known commercially available products that have the high levels of electrical conductivity and the capability to sustain the high levels of heat generated in EAF steel production. As a result, EAF steel manufacturers have been willing to pay a premium for a reliable supply of high quality graphite electrodes, and, in some cases, to pass on this premium to their customers in the form of surcharges. Graphite electrodes are also used in steel refining in ladle furnaces and in other processes, such as the production of titanium dioxide, stainless steel, aluminum, silicon metals and other ferrous and non-ferrous metals.
Petroleum needle coke, a crystalline form of carbon derived from decant oil, is the primary raw material used in the production of graphite electrodes. We achieved substantial vertical integration with this critical raw material source through our acquisition of Seadrift in November 2010, significantly reducing our reliance on other suppliers. The petroleum needle coke industry is highly concentrated, with what we believe to be the largest producer, Phillips 66, controlling approximately 50% of capacity. We believe Seadrift is the second largest petroleum needle coke producer in the world. We also believe that the quality of Seadrift's petroleum needle coke is superior for graphite electrode production compared to most of the petroleum needle coke available to our peers on the open market, allowing us to produce higher quality electrodes in a cost-efficient manner. Additionally, we believe that this vertical integration provides a significant cost advantage relative to our competitors in periods of tight petroleum needle coke supply, such as the current market environment. We believe this cost advantage will grow as demand for petroleum needle coke increases for use in lithium-ion batteries in electric vehicles. The demand for petroleum needle coke in lithium-ion batteries is growing rapidly, with usage going from approximately 1,000 MT in 2014 to 60,000 MT in 2017 (representing approximately 9% of 2017 petroleum
94
needle coke demand). This rapidly growing alternative source of demand is a significant development for the petroleum needle coke industry and is contributing to the global shortage in petroleum needle coke.
According to the WSA, EAFs accounted for 45%, or 367 million MT, of global crude steel production (excluding China) in 2016. Between 1984 and 2011, EAF steelmaking was the fastest-growing segment of the steel sector, with production increasing at an average rate of 3.5% per year, based on WSA data. Historically, EAF steel production has grown faster than the overall steel market due to the greater resilience, more variable cost structure, lower capital intensity and more environmentally friendly nature of EAF steelmaking. This trend was partially reversed between 2011 and 2015 due to global steel production overcapacity driven largely by Chinese BOF steel production. Beginning in 2016, efforts by the Chinese government to restructure China's domestic steel industry have led to limits on Chinese BOF steel production and lower export levels. In addition, developed economies, which typically have much larger EAF steel industries, have instituted a number of trade policies in support of domestic steel producers. As a result, since 2016, the EAF steel market has rebounded strongly and resumed its long-term growth trajectory. This revival in EAF steel production has resulted in increased demand for our graphite electrodes.
At the same time, two supply-side structural changes have contributed to recent record high prices of graphite electrodes. First, ongoing consolidation and rationalization of graphite electrode production capacity have limited the ability of graphite electrode producers to meet demand. We estimate that approximately 20% of graphite electrode industry production capacity (excluding China) has been closed or repurposed since the beginning of 2014, and we believe the majority of these closures represent permanent reductions. Second, demand for petroleum needle coke has outpaced supply due to increasing demand for petroleum needle coke for lithium-ion batteries used in electric vehicles. As a result, graphite electrode prices have recently reached record high prices. Historically, between 2006 and 2016, our weighted average realized price of graphite electrodes was approximately $4,500 per MT (on an inflation-adjusted basis using constant 2017 dollars) and fell to a historic low of approximately $2,500 per MT in 2016. With the renewed demand for, and constrained supply of, graphite electrodes, industry spot prices reached record levels of as high as $15,000 to $30,000 per MT in the first quarter of 2018. In light of improved market conditions, the long lead time required to produce our products, our position as one of the market's largest producers and our ability, through our substantial vertical integration with Seadrift, to provide customers with a reliable long-term supply of graphite electrodes despite the market shortage of petroleum needle coke, we have implemented a new commercial strategy to sell 60% to 65% of our production capacity to our strategic customers through three- to five-year take-or-pay contracts.
95
GrafTech historical weighted average realized prices and signed three- to five-year weighted average contract prices for graphite electrodes
(1) Weighted average realized price for a period reflects the total revenues from sales of graphite electrodes for the period divided by the graphite electrode sales volume for that period. The weighted average realized prices in this chart are shown in constant 2017 dollars for comparability. See "Management's Discussion and Analysis of Financial Condition and Results of Operations—Key Operating Metrics."
(2) Weighted average contract price for a period reflects the volume-weighted average price for graphite electrodes to be delivered under the three- to five-year take-or-pay contracts we have entered into as of March 1, 2018. All of these contracts have fixed prices and either fixed volumes (85% of the portfolio) or a specified volume range (15% of the portfolio). For those contracts with a specified volume range, weighted average contract prices are computed using the volume midpoint. The aggregate difference between the volume midpoint and the minimum and maximum volumes across our cumulative portfolio of take-or-pay contracts with specified volume ranges is approximately 5,000 MT per year in 2019-2022. See "Business—Contracts and Customers."
As a leading producer of graphite electrodes, we believe we are well-positioned to benefit from this industry transformation. In 2017, based on our three currently operating facilities, we had the capability, depending on product demand and mix, to manufacture approximately 167,000 MT of graphite electrodes per year. We are also in the process of an operational improvement and debottlenecking initiative and are on target to grow our production capacity at these facilities by approximately 21% to approximately 202,000 MT of production capacity by the end of 2018. If we were then to restart our currently idled St. Marys facility, our overall production capacity would increase by another approximately 14% to 230,000 MT per year. This total production capacity would be comparable to our largest competitor, which we estimate currently has a total of approximately 230,000 MT of production capacity (excluding China). We believe the total worldwide graphite electrode production capacity was approximately 800,000 MT (excluding China), with a capacity utilization of approximately 90% (excluding China), in 2017. Electrode production globally (excluding China) is focused on the manufacture of UHP electrodes for EAFs, while the majority of Chinese production is of ladle electrodes for BOFs. The production of UHP electrodes requires an extensive proprietary manufacturing process and material science knowledge, including the use of superior needle coke blends. As a result, graphite electrode producers inside and outside of China are generally not in direct competition with each other for major product lines.
On August 15, 2015, we became an indirect wholly owned subsidiary of Brookfield through a tender offer to shareholders and subsequent merger transaction. Brookfield is an experienced operator of industrial, natural resource and other tangible asset businesses. This transaction has provided us with a stable equity partner with experience in industrial sectors.
96
Our executive offices are located at 982 Keynote Circle, Brooklyn Heights, Ohio 44131 and our telephone number is (216) 676-2000. Our Internet website address is www.graftech.com. Information on, or accessible through, our website is not part of this prospectus. We have included our website address only as an inactive textual reference and do not intend it to be an active link to our website.
Key developments
Three major developments have repositioned GrafTech and the graphite electrode industry for long-term growth and significantly improved our financial and operating results:
- •
- the restructuring and repositioning of GrafTech;
- •
- the return of the EAF steel industry to long-term growth, leading to improved demand for graphite electrodes; and
- •
- structural changes in the graphite electrode and petroleum needle coke industries.
We have restructured and repositioned GrafTech for a sustainable leadership position in the graphite electrode industry
Since 2012, we have executed a three-part transformation plan to improve our competitive position and allow us to better serve our customers.
We have achieved annual fixed manufacturing cost improvements and capital expenditure reductions of approximately $190 million since 2012, while also improving the productivity of our plant network
We have strategically shifted production from our lowest to our highest production capacity facilities to increase fixed cost absorption. In 2018, we expect to produce a greater quantity of graphite electrodes from our three operating facilities in Calais, France, Pamplona, Spain and Monterrey, Mexico, than we did from our six operating facilities in 2012. As a result, we have achieved significant operating leverage at higher capacity utilizations. In our experience, high capacity manufacturing facilities can have operating costs of more than $1,000 per MT lower than low capacity manufacturing facilities. In addition, we have streamlined fixed costs across our plant network, including a 50% headcount reduction at Seadrift since 2014 and an optimization of Seadrift's systems and manufacturing process to reduce capital expenditure requirements. As a result of these actions, by the end of 2016, we had reduced our annual fixed manufacturing costs by approximately $80 million and our maintenance capital expenditure requirements by approximately $45 million since 2012.
By the end of 2016, we had also reduced our annual overhead expenses by approximately $65 million since 2012 by simplifying our corporate structure from a conglomerate model to a centralized business focused exclusively on the production of graphite electrodes and petroleum needle coke. In addition, we have streamlined and combined our workforce and various administrative functions for efficiency, and eliminated R&D functions unrelated to graphite electrodes.
In addition to our fixed cost reductions, we have been able to achieve significant productivity improvements and variable cost reductions across our plants since 2014. We have improved our manufacturing processes and made strategic investments across our plant network, which have improved productivity, including improvements of approximately 20% at both our Seadrift and Monterrey plants, while also reducing our energy and raw material consumption. Our more efficient graphite electrode plants produced at record breaking levels in 2017. In 2017, the Calais and Pamplona plants exceeded previous annual record production levels by 15% and 12%, respectively, and production at the Monterrey plant was
97
12% higher than the highest annual production level during the past 10 years. We have achieved these production increases by exploiting latent capacity in our plants, which historically have had uneven levels of capacity across each manufacturing process step, by removing artificial constraints on cycle times and improving scheduling processes. The next stage of our operational improvement and debottlenecking initiative is a small capital program concentrated on the graphitizing stage of production at our plants, which we expect will increase our current operating capacity by approximately 21%, or 35,000 MT, by the end of 2018, allowing us to achieve further improvements in our cost structure. As a result of our prior operational improvement activities, we are able to achieve this large capacity increase with specific, highly targeted capital investments. We expect the capital investment for this initiative to be $37 million. We believe that the optimization of our plant network will continue to drive improved fixed cost absorption and meaningfully lower variable costs.
We have reoriented our commercial strategy
In light of improved market conditions, the long lead time required to produce our products, our position as one of the market's largest producers and our ability, through our substantial vertical integration with Seadrift, to provide customers with a reliable long-term supply of graphite electrodes despite the market shortage of petroleum needle coke, we have implemented a new commercial strategy to sell approximately 60% to 65% of our production capacity to our strategic customers through three- to five-year take-or-pay contracts. These contracts define volumes and prices, along with price-escalation mechanisms for inflation, and include significant termination payments (typically, 50% to 70% of remaining contracted revenue) and, in certain cases, parent guarantees and collateral arrangements to manage our customer credit risk. These new commercial initiatives have led to approximately 636,000 MT, or 60% to 65% of our cumulative production capacity from 2018 to 2022, being contracted as of March 1, 2018. Approximately 132,000 MT of this contracted volume is for 2018. Together with sales volume committed by purchase orders, approximately 96% of our 2018 production capacity is contracted or committed by purchase orders. For future years, our strategy is to retain approximately 35% to 40% of our production capacity for sales on a shorter term or spot basis. Prices in the spot market have currently reached a level three to six times higher than our historical weighted average realized price of $4,500 per MT (on an inflation-adjusted basis using constant 2017 dollars) between 2006 and 2016. We expect the incremental volume from our operational improvement and debottlenecking initiative to be available to customers on a spot basis, further increasing our exposure to spot prices. Seadrift produces sufficient needle coke to supply 100% of the graphite electrode production that we have contracted under our new take-or-pay contracts. In the first quarter of 2018, the estimated cost of goods sold (excluding depreciation) for electrodes produced with Seadrift needle coke is approximately $2,600/MT and the estimated variable cost (excluding needle coke and decant oil) is approximately $1,150/MT. To align with our three- to five-year contract profile, we have hedged the decant oil required to produce all of the graphite electrodes sold under these contracts, providing us with substantial visibility into our future raw material costs. We intend to match the volume and term of our shorter term and spot sales with our third party needle coke purchases. As our currently operating facilities are now operating at or near full production capacity, we also have reviewed our product portfolio and restructured our sales force incentives to maximize the profitability of our product mix.
98
Management estimates of Q1 2018 graphite electrode all-in cost of goods sold (COGS) using petroleum needle coke produced at Seadrift compared to the market price of one MT of petroleum needle coke
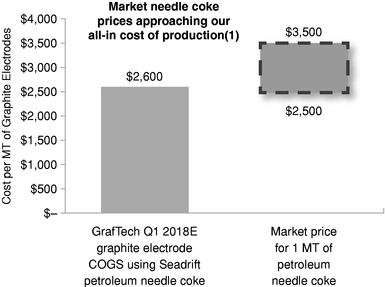
(1) COGS excludes depreciation and amortization
We are focused on being the industry's leading producer of the highest performing electrodes
The divestiture of our non-core legacy Engineered Solutions businesses in 2016 and 2017 has allowed our management team to focus on our core competency of graphite electrode production and generated approximately $60 million in cash proceeds and release of working capital. By focusing our management's attention and R&D spending exclusively on the graphite electrode business, we have been able to meaningfully improve the quality of our graphite electrodes, repositioning ourselves as an industry quality leader and improving our relationships with strategic customers. Our focus on improving the quality of petroleum needle coke through R&D has led to our petroleum needle coke production at Seadrift now being best-in-class for use in the manufacturing of highly durable UHP electrodes. Our customers have responded favorably to the increased quality of our graphite electrodes, and we have increased our market share with leading EAF steel manufacturers as a result.
The EAF steel industry has strengthened, improving demand for our graphite electrodes
Historically, EAF steel production has grown faster than the overall steel market due to the greater resilience, more variable cost structure, lower capital intensity and more environmentally friendly nature of EAF steelmaking. This trend was partially reversed between 2011 and 2015 due to global steel production overcapacity driven largely by Chinese BOF steel production. Beginning in 2016, efforts by the Chinese government to eliminate excess steelmaking production capacity and improve environmental and health conditions have led to limits on Chinese BOF steel production, including the closure of over 200 million MT of its steel production capacity, based on data from S&P Global Platts and the Ministry of Commerce of the People's Republic of China. In 2017, Chinese steel exports fell by more than 30% from 2016, including 17 consecutive months of year-over-year declines, according to the National Bureau of Statistics of China. Reflecting the reduction in steelmaking production capacity, as of October 2017, Chinese steel imports had
99
increased significantly year-over-year, including a 64% year-over-year increase in semi-finished steel billet imports. Further, developed economies, which typically have much larger EAF steel industries, have instituted a number of trade policies in support of domestic steel producers. Declining Chinese steel exports and increasing steel imports should provide additional opportunity for EAF producers outside of China to increase production, thereby increasing demand for graphite electrodes.
We estimate that in 2017, EAF steel production grew at an annual pace of at least 8% to 10%, compared with 5% for steelmaking overall. We believe EAF steel producers will continue to take market share from BOF steel producers. As of 2016, according to the WSA, EAF steel production had grown to 67% of total U.S. steel production from 47% in 2000, 44% of total EMEA steel production from 33% in 2000 and 40% of total APAC (excluding China) steel production from 36% in 2000. Over the same period, global EAF production increased from 287 million MT in 2000 to 418 million MT in 2016, while non-EAF steel production (excluding China) was flat at 453 million MT in both 2000 and 2016.
We estimate that at least 105 new EAFs, reflecting 66 million MT of new annual steelmaking production capacity, have been installed or have commenced construction in China in 2017, compared to only 52 million MT of Chinese EAF steel production in 2016. As a result of significantly increased steel production since 2000, the supply of Chinese scrap has increased substantially, providing the Chinese EAF steel manufacturing industry with local scrap feedstock that was not historically available. We believe continued Chinese government environmental actions and an increasing domestic scrap supply will support the ongoing global shift towards EAF steelmaking. Assuming completion of new EAF construction and full EAF capacity utilization, we estimate total graphite electrode demand in China could increase in 2018 by over 100,000 MT from 2017.
The recent restructuring of the graphite electrode industry and changes in the petroleum needle coke industry have reduced supply as demand is recovering
Significant amounts of graphite electrode industry production capacity have recently been removed from the market globally. We estimate that approximately 20% of industry production capacity (excluding China) has been closed or repurposed since the beginning of 2014. Some of these closed manufacturing facilities have sold off equipment, been demolished, undertaken long-term environmental remediation or been repurposed for other manufacturing uses. Accordingly, we believe the majority of these closures represent permanent reductions. As part of this overall industry rationalization, we permanently shut down two plants and temporarily idled our St. Marys plant, reducing our electrode manufacturing from six operating facilities in 2012 to three operating facilities in 2017. Also, in October 2017, the third largest graphite electrode producer acquired the second largest producer.
Further affecting the availability of graphite electrodes, supplies of petroleum needle coke and pitch needle coke, a less favorable substitute for petroleum needle coke, have been limited starting in the second half of 2017. Demand for petroleum needle coke has outpaced supply due to increasing demand for petroleum needle coke in the production of lithium-ion batteries used in electric vehicles. Supply of pitch for pitch needle coke production has fallen as a result of decreasing coke production for the BOF steel industry. These graphite electrode supply constraints have coincided with the recovery in EAF demand for graphite electrodes, resulting in stronger market conditions for our products.
100
The table below summarizes these key changes in the industry.
| |
|
|
||
|---|---|---|---|---|
| | | | | |
| |
2011 - 2015 |
2017 |
||
| | | | | |
EAF Steel Industry |
EAF steel production declined approximately 10% from 2011 to 2015 after growing faster than the overall steel market for more than 25 years.
• China net exports of BOF steel displaced EAF production worldwide. |
EAFs regained market share and resumed faster growth than the overall steel market.
• China steel exports are down more than 30% in 2017 from 2016 and are continuing to fall, according to the National Bureau of Statistics of China. |
||
Graphite Electrodes |
Oversupply driven by historic trough in demand and production capacity additions.
• We estimate global production capacity (excluding China) was approximately 1,000,000 MT at 30 plants in 2013. |
We estimate that approximately 20% of graphite electrode production capacity (excluding China) has been closed or repurposed since the beginning of 2014.
• We estimate current global graphite electrode production capacity (excluding China) is 800,000 MT at 21 plants. |
||
Petroleum Needle Coke |
Excess production capacity and cost disadvantage versus pitch needle coke.
• Reduced demand from graphite electrodes. |
Tight supply due to new demand from lithium-ion batteries for electric vehicles and improving graphite electrode demand.
• Increased demand has led to pricing increases of four to six times for petroleum needle coke in the current market compared to one year ago. |
||
| | | | | |
During the most recent demand trough, the combination of decreased demand from the EAF steel industry and overcapacity in the graphite electrode industry had an adverse effect on the profitability of our operations, including a net loss of $235.8 million for the year ended December 31, 2016. We also experienced a net loss from continuing operations of $108.9 million for the year ended December 31, 2016. However, as a result of the recent developments in the industry summarized above, we expect to experience significant improvement in our 2018 financial results relative to these prior results. We also expect a high degree of stability in our future operating results due to our recent three- to five-year contracting initiative. As of March 1, 2018, we have entered into three- to five-year take-or-pay contracts to sell approximately 132,406, 138,446, 134,831, 117,600 and 112,883 MT in 2018, 2019, 2020, 2021 and 2022, respectively.
101
Competitive strengths
We are one of the two largest producers of graphite electrodes outside of China, accounting for approximately 21% of global production capacity (excluding China), and we believe our strategically positioned global footprint provides us with competitive advantages
We believe our facilities are among the most strategically located and lowest cost large-scale graphite electrode manufacturing plants in the world. Of the 21 graphite electrode manufacturing facilities currently operating outside of China, we estimate that our three operating manufacturing facilities represent approximately 21% of estimated production capacity for graphite electrodes, making us a critical supplier to global EAF steel manufacturers. Our manufacturing facilities are located in the Americas and EMEA, providing us with access to low-cost and reliable energy sources, logistical and freight advantages in sourcing raw materials and shipping our graphite electrodes to our customers compared to our competitors, and excellent visibility into the large North American and European EAF steelmaking markets. Our experience in producing graphite electrodes for a varied global customer base positions us to meet customer requirements across a range of product types and quality levels, including support and technical services, further distinguishing us from our competitors.
We are a pure-play provider of an essential consumable for EAF steel producers, the fastest-growing sector of the steel industry
We estimate that EAF steelmaking grew at an annual pace of at least 8% to 10% in 2017, compared with 5% for steelmaking overall. As a result of the increasing global availability of steel scrap and the more resilient, high-variable cost and environmentally friendly EAF model, we expect EAF producers to continue to grow at a faster rate than BOF producers globally. Additionally, EAF producers are increasingly able to utilize higher quality scrap and iron units, their two primary raw materials, to produce higher quality steel grades and capture market share from BOF producers, while maintaining a favorable cost structure. According to the WSA, in EMEA and the Americas, which together made up 92% of our 2017 net sales, EAF producers have increased market share from approximately 37% in 2000 to 48% in 2016, reflecting growth from 190 million MT to 237 million MT. In APAC, which made up approximately 9% of our 2017 net sales, government initiatives in China are expected to result in a greater use of the EAF method in steelmaking despite the historical dominance of BOF producers. These initiatives are the result of efforts to eliminate excess steelmaking production capacity and to improve environmental conditions. The EAF method produces approximately 25% of the CO2 emissions of a BOF facility and does not require the smelting of virgin iron ore or the burning of coal. Additionally, as a result of significantly increased steel production in China since 2000, the supply of Chinese scrap is expected to increase substantially, which may result in lower scrap prices and provide the Chinese steel manufacturing industry with local scrap feedstock that was not historically available. We believe these trends will allow EAF steel producers to increase their market share and grow at a faster rate than BOF steel producers, resulting in increasing demand for graphite electrodes.
We have capital-efficient growth opportunities available to us
The graphite electrode industry responded to oversupplied markets from 2011 to 2015 with production capacity rationalization and consolidation, and after the normalization of the market for EAF steel in 2017, we expect the resulting graphite electrode supply deficit could last for some time. Additionally, we believe the lead time from initial permitting to full production of a greenfield graphite electrode manufacturing
102
facility would be approximately five to ten years and cost approximately $10,000 per MT. Similarly, brownfield development is complicated by significant capital costs and space and process constraints. Only one new greenfield graphite electrode facility outside of China has been built since the 1980s and only one significant brownfield expansion has occurred, reflecting the historical difficulty of adding further graphite electrode production capacity. As a result of this long and uncertain time horizon to build new plants, we believe only a few companies have the necessary technology and expertise to meet the rising demand for graphite electrodes.
Our current facilities are modern, strategically located and well-maintained, providing us with ample operational optimization capabilities. We are in the process of expanding our current production capacity of 167,000 MT by approximately 21%, or 35,000 MT, by the end of 2018 through strategic capital investments and operational improvements in baking cycles and the graphitization process. We estimate that the capital cost to achieve this production capacity expansion is approximately $37 million, or approximately $1,000 per MT. As a result of our prior operational improvement activities, we are able to achieve this large capacity increase with specific, highly targeted capital investments. We expect these expansions to provide additional fixed cost absorption and drive further efficiencies of scale across our manufacturing base. We also can increase production by resuming production at our currently idled St. Marys facility, depending on market conditions, which would add 28,000 MT, or an increase of approximately 14%, to our expected production capacity at the end of 2018. We believe that resuming production at our St. Marys facility, which we believe is cost-competitive with facilities currently operated by our competitors, would cost approximately $5 million to $11 million in capital expenditures and start-up staffing requirements, depending on our targeted production capacity.
We believe we have the industry's most efficient production platform of high production capacity assets with substantial vertical integration
Based on our experience, high capacity manufacturing facilities can have operating costs of more than $1,000 per MT lower than low capacity manufacturing facilities. Our recent restructuring activities have included the closures of our lower capacity manufacturing facilities in South Africa and Brazil and the idling of our St. Marys facility, which together accounted for approximately 35% of our previous production capacity. Our restructuring actions have eliminated approximately $125 million of annual fixed manufacturing costs and maintenance capital expenditure requirements since 2012. These actions allow us to run our Calais, Pamplona and Monterrey plants at or near 100% capacity utilization. Since 2014, we have also improved our manufacturing processes and made strategic investments across our plant network, which have improved productivity while also reducing our energy and raw material consumption. Following our footprint optimization, we expect to produce a greater quantity of graphite electrodes in 2018 from our three operating facilities than we did from our six operating facilities in 2012. In 2017, the Calais and Pamplona plants exceeded previous annual record production levels by 15% and 12%, respectively, and production at the Monterrey plant was 12% higher than the highest annual production level during the past 10 years. We believe that the optimization of our plant network will continue to drive improved fixed cost absorption and meaningfully lower variable costs.
Moreover, our Seadrift, Calais, Pamplona, Monterrey and St. Marys facilities each provide unique advantages for us. On average, petroleum needle coke represents 25% to 45% of our graphite electrode manufacturing costs, with labor representing only 5% to 10%. Seadrift provides a substantial portion of our petroleum needle coke supply needs internally and at a competitive cost and allows us to maximize capacity utilization more efficiently than competitors, who may be more constrained by petroleum needle coke supply. Seadrift is one of only five petroleum needle coke facilities in the world, excluding a small
103
facility in China, and we believe it is the second largest petroleum needle coke producer in the world. We also believe that Calais, Pamplona and Monterrey are three of the five highest capacity graphite electrode facilities in the world (excluding China), allowing for significant operating leverage. We believe our facilities have significant cost advantages given their scale and access to low cost, reliable energy sources. While much of the production capacity rationalized during the downturn was permanently shut down, we temporarily idled our St. Marys facility and retain the option to restart it. We believe that our St. Marys facility could be cost-competitive with facilities currently operated by our competitors, and we continue to monitor petroleum needle coke availability to assess restarting the plant.
We are the only petroleum needle coke producer in the world specifically focused on the production of graphite electrodes
Our production of petroleum needle coke specifically for graphite electrodes provides us the opportunity to produce super premium petroleum needle coke of the highest quality and allows us to tailor graphite electrodes for customer requirements. Seadrift has 140,000 MT of petroleum needle coke production capacity, which we believe makes it the second largest petroleum needle coke producer in the world. We believe that no petroleum needle coke production capacity has been added outside of China for at least 10 years, given high capital costs and technological barriers. Additionally, the growing petroleum needle coke demand from manufacturers of lithium-ion batteries for electric vehicles has created a shortage of petroleum needle coke available to graphite electrode manufacturers. Sourcing the majority of our petroleum needle coke internally allows us to offer our customers certainty of supply, further enhancing our competitive position and supporting our new three- to five-year, take-or-pay contracts strategy. To align with our three- to five-year contract profile, we have hedged the decant oil required to produce all of the graphite electrodes sold under these contracts, providing us with substantial visibility into our future raw material costs. We believe our use of petroleum needle coke is a further competitive advantage, as the use of pitch needle coke, an alternative raw material, results in longer bake times during graphite electrode production, significantly affecting graphite electrode production rates and cost. Finally, the decline in the price of oil and increase in the price of coal tar pitch in recent years has further improved the competitive advantage of using petroleum needle coke relative to pitch needle coke.
Our graphite electrodes and petroleum needle coke are among the highest quality in the industry
After the divestiture of our non-core legacy Engineered Solutions businesses in 2016 and 2017, we focused on our core competency of graphite electrode production and generated approximately $60 million in cash proceeds and release of working capital from these divestitures. Our restructured and simplified business model has reduced our annual overhead expenses by approximately $65 million since 2012, allowing us to redeploy the savings into our graphite electrode business. We have identified and implemented mechanical and chemical improvements to our electrodes, invested in the capability to produce super premium petroleum needle coke needed for high-margin UHP graphite electrodes, and optimized our production of pins at our Monterrey plant, which are a critical component used to connect and fasten graphite electrodes together in a furnace. By producing pins at our Monterrey plant, we are able to realize meaningful fixed-cost synergies with our graphite electrode production on site. As a result, we believe the quality and the consistency of our electrodes is unrivaled in North America and EMEA and on par with that of any producer globally. We have seen customer satisfaction rise to ten-year highs at a time when the industry has been focused on production capacity rationalization rather than quality. We believe the durability and infrequent breakage of our graphite electrodes create operating efficiencies and value opportunities for our customers. We also believe we have a competitive advantage in offering customers ArchiTech, which we
104
believe is the most advanced support and technical service platform in the graphite electrode industry. ArchiTech, which has been installed in 145 customer furnaces, enables our engineers to work with our customers seamlessly to maximize the performance of their furnaces and provide real-time diagnostics and troubleshooting. We believe our customers value our high quality products and customer service, and have provided us with opportunities to expand our business with them as a result.
Our experienced executive leadership and general managers and flexible workforce have positioned us for future earnings growth
Our seasoned leadership is committed to earnings growth. We have undertaken strategic investments to increase our production capacity in a capital-efficient manner while reducing our cost position. Our executive and manufacturing leadership have led manufacturing companies through many cycles and are focused on positioning us for profitable growth in any environment. We expect to grow our production capacity by approximately 21%, or 35,000 MT, in 2018 as a result of our operational improvement and debottlenecking initiative and a further 14%, or 28,000 MT, if we restart production at our currently idled St. Marys facility.
Additionally, since our acquisition by Brookfield, we have reorganized our manufacturing facilities as profit centers. We use LEAN manufacturing techniques, which focus on the constant elimination of waste from the manufacturing process. We also rely on Six Sigma methods, a set of management techniques intended to improve quality by significantly reducing the probability that an error or defect will occur. We believe the LEAN and Six Sigma initiatives have increased overall utilization by optimizing our plant production capacity and controlled costs while also improving quality. We also redesigned general manager incentive plans to reward efficiency gains. Similarly, our labor force is incentivized to drive efficiencies through country-specific labor incentive plans. Further, we believe our positive relations with our labor force allow for increased flexibility.
Business strategies
Implement our new commercial strategy
We believe our customers value certainty of supply of high quality graphite electrodes due to their mission-critical nature in the EAF steelmaking process and relatively low cost compared to the total cost of steelmaking. In light of improved market conditions, the long lead time required to produce our products, our position as one of the market's largest producers and our ability, through our substantial vertical integration with Seadrift, to provide customers with a reliable long-term supply of graphite electrodes despite the market shortage of petroleum needle coke, we have implemented a new commercial strategy to sell 60% to 65% of our production capacity to our strategic customers through three- to five-year take-or-pay contracts. In the new supply-constrained market environment, as of March 1, 2018, we have secured minimum sales volume under three- to five-year take-or-pay contracts for approximately 636,000 MT or approximately 60% to 65% of our cumulative production capacity from 2018 through 2022. As of March 1, 2018, 13% of these contracts are three- and four-year contracts and 87% are five-year contracts. Furthermore, many of our customers have sought to purchase greater volumes from us than they have historically because of our reliable source of petroleum needle coke and the high quality of our graphite electrodes. This new commercial strategy reflects a shift from our historic approach to sales, which were negotiated annually and on a non-binding basis.
105
Grow production capacity through capital-efficient operational improvements and the restart of our St. Marys facility
We believe our well-maintained facilities provide us with opportunities to improve our production capacity by approximately 21% from current production capacity levels with relatively low capital investments. We have improved our manufacturing processes and made strategic investments across our plant network, which have improved productivity, including improvements of approximately 20% at both our Seadrift and Monterrey facilities, while also reducing our energy and raw material consumption. We have achieved these production increases by exploiting latent capacity in our plants, which historically have had uneven levels of capacity across each manufacturing process step, by removing artificial constraints on cycle times and improving scheduling processes. These improvements have had the additional advantage of reducing the capital expenditures required to achieve further production capacity increases through debottlenecking. We plan to invest approximately $37 million to optimize our bake schedules and graphitization processes as part of our operational improvement and debottlenecking initiative. We expect these upgrades at our three operational facilities to include:
- •
- Calais: adding graphitizing furnaces and increasing graphitizing production capacity are expected to increase annual production capacity from
46,000 MT to 65,000 MT.
- •
- Pamplona: optimizing graphitization cycles, adding a new extrusion press to unlock graphitizing production capacity and adding a new
impregnation facility are expected to increase annual production capacity from 66,000 MT to 76,000 MT.
- •
- Monterrey: adding a new bake car, bigger furnace, second crane and additional longitudinal furnaces are expected to increase annual production capacity from 55,000 MT to 61,000 MT.
As a result of our prior operational improvement activities, we are able to achieve this large capacity increase with specific, highly targeted capital investments. We also continue to evaluate restarting production at our St. Marys facility. Restarting our St. Marys facility would provide an additional 28,000 MT of production capacity, or an incremental 14%. Our St. Marys facility has access to low-cost natural gas and electricity, providing what we believe to be a significant cost advantage relative to our competitors. Additionally, its greater proximity to U.S. EAF and non-ferrous metals producers provides it with a further freight cost advantage.
Utilize our production efficiency program to support our focus on cost efficiency
As part of our corporate restructuring, we have reduced corporate overhead expenses by approximately 60% from 2012 levels through a strategic realignment of our corporate structure and the elimination of the legacy Engineered Solutions R&D expenses and overhead. We temporarily idled our St. Marys facility and reconfigured our production footprint by closing our Brazil and South Africa manufacturing facilities to drive higher capacity utilizations at our three largest, most strategically located and lowest-cost manufacturing facilities. Additionally, we continue to optimize our capital investment opportunities through rigorous quantitative analysis and deploy simultaneous work process improvements at our manufacturing facilities through LEAN and Six Sigma techniques.
Continue to be a reliable, preferred supplier for mission-critical graphite electrodes
We believe that improvements in overall quality create significant operating efficiencies and value opportunities for our customers, and provide us with the opportunity to increase sales volumes and market share. We continue to work closely with key customers to enhance the durability of our graphite
106
electrodes, reducing the frequency of graphite electrode breaks and enhancing the usable life of our graphite electrodes, to make us their preferred supplier. We will continue to use our petroleum needle coke facility to help secure customer orders of mission-critical graphite electrodes. We believe that at a time of supply uncertainty for many competitors, we will continue to see high demand from our customers.
Maintain balance sheet discipline and strong liquidity to provide strategic flexibility
We plan to maintain a solid balance sheet in order to provide flexibility to grow and invest in our business in all market environments. As of December 31, 2017, after giving pro forma effect to our entrance into the 2018 Credit Agreement, the borrowing of $1,500 million of 2018 Term Loans under the 2018 Credit Agreement on February 12, 2018 and our use of proceeds therefrom, we would have had $1,500 million in Term Loans outstanding under the 2018 Credit Agreement and total liquidity of approximately $253.7 million, consisting of $241.8 million in availability under the 2018 Revolving Credit Facility (taking into account approximately $8.2 million of outstanding letters of credit issued thereunder) and cash and cash equivalents of approximately $11.9 million. See "Management's Discussion and Analysis of Financial Condition and Results of Operations—Financing Transactions—2018 Credit Agreement."
Facilities and manufacturing
Facilities. Below is a summary of our material facilities:
| |
|
|
||
|---|---|---|---|---|
| | | | | |
| Location of facility |
Primary use |
Owned or leased |
||
| | | | | |
| Americas | ||||
Brooklyn Heights, Ohio |
Corporate Headquarters, Innovation and Technology Center | Leased | ||
Monterrey, Mexico |
Graphite Electrode Manufacturing Facility and Sales Office | Owned | ||
St. Marys, Pennsylvania |
Graphite Electrode Manufacturing Facility (currently idled) | Owned | ||
Port Lavaca, Texas |
Petroleum Needle Coke Manufacturing Facility (Seadrift) | Owned | ||
Europe |
||||
Bussigny, Switzerland |
Sales Office | Leased | ||
Calais, France |
Graphite Electrode Manufacturing Facility | Owned | ||
Moscow, Russia |
Sales Office | Leased | ||
Pamplona, Spain |
Graphite Electrode Manufacturing Facility and Sales Office | Owned | ||
Other International |
||||
Beijing, China |
Sales Office | Leased | ||
Hong Kong, China |
Sales Office | Leased | ||
| | | | | |
We currently manufacture our graphite electrodes in three manufacturing facilities strategically located in the Americas and EMEA, two of the largest EAF steelmaking markets. Our locations allow us to serve our customers in the Americas and EMEA efficiently and are located near low-cost and reliable energy sources with essential logistical infrastructure in place. In addition to these three facilities, we have a fourth graphite electrode manufacturing site in St. Marys, Pennsylvania that is currently idled. We estimate that the 167,000 MT of graphite electrode production capacity at our three currently operating sites represents approximately 21% of estimated global graphite electrode production capacity (excluding China). Due to our productivity improvement efforts, and because of the increased demand for graphite electrodes, we have achieved near 100% capacity utilization at our Calais, France, Pamplona, Spain and Monterrey, Mexico plants in 2017. In 2017, the Calais and Pamplona plants exceeded previous annual record production levels
107
by 15% and 12%, respectively, and production at the Monterrey plant was 12% higher than the highest annual production level during the past 10 years. We believe our business has the lowest manufacturing cost structure of all of our major competitors, primarily due to the large scale of our manufacturing facilities.
Our manufacturing facilities significantly benefit from their size and scale, work force flexibility, access to attractively-priced sources of power and other key raw materials, and our substantial vertical integration with Seadrift. By operating three of the five highest capacity graphite electrode production facilities in the world, we are able to achieve meaningful operating leverage relative to our competitors. Because of the attractive cost of labor available to our Monterrey facility, we believe we have a significant cost advantage in the production of pins, which are used to connect and fasten graphite electrodes together in a furnace and are more labor-intensive to produce than other graphite electrodes. Our Calais, Pamplona and Monterrey facilities have access to low-cost sources of electricity, a significant element of our manufacturing costs. Our Seadrift facility currently produces approximately 75% of our petroleum needle coke requirements for our graphite electrode production, allowing us to source our primary raw material internally and at cost, a significant advantage relative to our peers. Seadrift also produces sufficient needle coke to supply 100% of the graphite electrode production that we have contracted under our new take-or-pay contracts.
The table below summarizes the location and production capacity of our plants.
| |
|
|
|
|
|
|
|||||||||||||
|---|---|---|---|---|---|---|---|---|---|---|---|---|---|---|---|---|---|---|---|
| | | | | | | | | | | | | | | | | | | | |
| |
Graphite electrode manufacturing | Needle coke (Seadrift) |
|||||||||||||||||
| Plant |
Calais, France |
Pamplona, Spain |
Monterrey, Mexico |
St. Marys, USA(1) |
Total electrode |
Port Lavaca, USA |
|||||||||||||
| | | | | | | | | | | | | | | | | | | | |
2017 Production Capacity (MT) |
46,000 | 66,000 | 55,000 | 28,000 | 195,000 | 140,000 | |||||||||||||
2018 YE Production Capacity (MT) |
65,000 | 76,000 | 61,000 | 28,000 | 230,000 | 140,000 | |||||||||||||
Year Built |
1975 | 1969 | 1957 | 1930 | 1983 | ||||||||||||||
| | | | | | | | | | | | | | | | | | | | |
(1) The St. Marys, Pennsylvania facility is currently idled.
We are currently in the process of increasing our production capacity by approximately 21%, or 35,000 MT, by the end of 2018 through an operational improvement and debottlenecking initiative we commenced in 2017. We are installing a new bake car, a larger furnace, a second crane, and additional longitudinal furnaces in our Monterrey facility, which will increase graphite electrode production capacity to 61,000 MT. Our Pamplona facility will benefit from a new extrusion press to unlock graphitizing production capacity and a new impregnation facility which will increase graphite electrode production capacity to 76,000 MT. We are also adding graphitizing furnaces in our Calais facility, which will increase graphite electrode capacity at that facility to 65,000 MT.
The recent transformation in the industry was driven in part by substantial production capacity rationalization and consolidation. We estimate that, at the beginning of 2014, the graphite electrode industry globally (excluding China) had capacity to produce approximately 1.0 million MT of graphite electrodes across 30 graphite electrode manufacturing facilities. Since then, we estimate that the industry outside of China has closed or repurposed approximately 20% of production capacity, reducing production capacity to approximately 800,000 MT of electrodes at 21 plants. Moreover, the third-largest producer has acquired the second-largest producer. As part of this overall industry rationalization, we permanently shut down two plants and temporarily idled our St. Marys plant, reducing our electrode manufacturing from six operating facilities in 2012 to three operating facilities in 2017. Despite this, we expect to produce a greater quantity of graphite electrodes in 2018 from our three operating facilities than we did in 2012 from
108
our six facilities. By the end of 2018, we believe the five largest plants in the industry—including our facilities in Calais, Pamplona and Monterrey—will represent approximately 43% of the graphite electrode industry's installed production capacity (excluding China), representing a significant cost advantage over the remaining 16 plants.
Manufacturing. We manufacture graphite electrodes ranging in size up to 30 inches in diameter, over 11 feet in length, and weighing as much as 5,900 pounds (2.6 MT). The manufacturing process includes six main processes: screening of raw materials (needle coke) and blending with coal tar pitch followed by forming, or extrusion, of the electrode, baking the electrode, impregnating the electrode with a special pitch that improves strength, re-baking the electrode, graphitizing the electrode using electric resistance furnaces, and machining. The first baking process converts the pitch into hard coke. During the baking process, the electrode pitch volatiles are removed, leaving porosities inside. To improve graphite electrode quality, the electrode is then impregnated with additional coal tar pitch to fill the porosities and baked a second time. After impregnation and re-baking, the manufacturing process continues with graphitization as the electrodes are heated at 5000°F in a special longitudinal furnace to convert the carbon into graphite. The graphitization cycle removes additional impurities and improves the electrodes' key qualities: thermal and electrical conductivity, thermal shock resistance performance, lubricity, and abrasion resistance. Graphitization is energy intensive, and, according to CRU International Ltd (or CRU), requires around 3200 to 4800 kWh electricity per MT, representing 20% to 35% of the total electrode costs.
High quality graphite electrodes have low electrical resistivity and strong durability. Resistivity is enhanced by removing impurities during the production process, while durability is determined by the coefficient of thermal expansion (or CTE) of the raw material used to produce the graphite electrode. Lower CTE needle coke produces higher quality electrodes. UHP electrodes used in harsh EAF melter applications have low resistivity and low CTE to maximize efficient use of electricity in the EAF and minimize electrode consumption. The total manufacturing time of a graphite electrode and its associated connecting pin is on average approximately six months from needle coke production to customer delivery. We believe that the period of time required to produce a graphite electrode meaningfully constrains the ability of graphite electrode producers to react to real-time changes in steel market environments and acts as a barrier to entry.
Production of a graphite electrode begins with the production of either petroleum needle coke, our primary raw material, or pitch needle coke, a less favorable substitute for petroleum needle coke. Petroleum needle coke is produced through a manufacturing process very similar to a refinery. The production process converts decant oil, a byproduct of the gasoline refining process, into petroleum needle coke and generally takes two months to produce. Needle coke takes its name from the needle-like shape of the coke particles. We produce calcined petroleum needle coke at Seadrift. Seadrift is not dependent on any single refinery for decant oil. While Seadrift has purchased a substantial majority of its raw material inventory from a limited number of suppliers in recent years, we believe that there is a large supply of suitable decant oil in the United States available from a variety of sources. In addition, we have hedged the decant oil required to produce all of the graphite electrodes sold under our three- to five-year take or pay contracts, providing us with substantial visibility into our future raw material costs. Seadrift is one of only five petroleum needle coke facilities in the world, excluding a small facility in China, and we believe it is the second largest petroleum needle coke producer in the world.
We purchase the electric power used in our manufacturing processes from local suppliers under contracts with pricing based on rate schedules or price indices. Our electricity costs can vary significantly depending on these rates and usage. Natural gas used in the baking and re-baking processes is purchased from local suppliers primarily under annual volume contracts with pricing based on various natural gas price indices.
109
Sales and customer service
We differentiate and sell the value of our graphite electrodes primarily based on price, product quality and performance, delivery reliability and customer technical service.
We have a large customer technical service organization, with supporting application engineering and scientific groups and more than 60 engineers and specialists around the world. We believe that we are one of the industry leaders in providing value added technical services to our customers.
Our direct sales force currently operates from 10 sales offices located around the world. We sell our graphite electrodes primarily through our direct sales force, independent sales representatives and distributors, all of whom are trained and experienced with our products.
We have customer technical service personnel based around the world to assist customers to maximize their production and minimize their costs. A portion of our engineers and technicians provide technical service and advice to key steel and other metals customers. These services relate to furnace applications and operation, as well as furnace upgrades to reduce energy consumption, improve raw material costs and increase output.
We believe we have a competitive advantage in offering customers ArchiTech, which we believe is the most advanced support and technical service platform in the graphite electrode industry. ArchiTech, which has been installed in 145 customer furnaces, enables our engineers to work with our customers seamlessly to maximize the performance of their furnaces and provide real-time diagnostics and troubleshooting.
Distribution
We deploy various demand management and inventory management techniques to seek to ensure that we can meet our customers' delivery requirements while still maximizing the capacity utilization of our production capacity. We can experience significant variation in our customers' delivery requirements as their specific needs vary and change through the year. We generally seek to maintain appropriate inventory levels, taking into account these factors as well as the significant differences in manufacturing cycle times for graphite electrode products and our customers' products.
Finished products are usually stored at our manufacturing facilities. Limited quantities of some finished products are also stored at local warehouses around the world to meet customer needs.
Contracts and Customers
In 2017, we reoriented our commercial strategy around a three- to five-year take-or-pay contract framework and restructured our sales force incentives. As graphite electrodes are an essential consumable in the EAF steel production process and require a long lead time to manufacture, our strategic customers are highly focused on securing certainty of supply of reliable, high quality graphite electrodes. Prior to our three- to five-year take-or-pay contract initiative, our sales of graphite electrodes were generally negotiated annually through purchase orders on an uncontracted, nonbinding basis. The majority of our customers sought to secure orders for a supply of their anticipated volume requirements each upcoming year. The remaining, small balance of our graphite electrode customers purchased their electrodes as needed throughout the year at industry spot prices.
We believe we are uniquely capable among graphite electrode producers to pursue our three- to five-year take-or-pay contracting strategy due to our substantial vertical integration into petroleum needle coke production. Substantially all of our petroleum needle coke production is used internally and is not sold to
110
external customers. Demand for petroleum needle coke is increasing due to the use of needle coke in lithium-ion batteries for electric vehicles, as well as the recovering demand for graphite electrodes, and we expect demand to exceed global production capacity in 2018. Consequently, this limited availability of petroleum needle coke will restrict new graphite electrode production. Seadrift, our wholly owned subsidiary acquired in 2010, currently provides approximately 75% of our petroleum needle coke requirements and produces sufficient needle coke to supply 100% of the graphite electrode production that we have contracted under our take-or-pay contracts. We have hedged the decant oil required to produce all of the graphite electrodes sold under these contracts, providing us substantial visibility into our future raw material costs.
Because the market price of graphite electrodes may be based, in part, on the current or forecasted costs of key raw materials, periods of raw material price volatility may have an impact on the market price. In particular, as petroleum needle coke represents a significant percentage of the raw material cost of graphite electrodes, the price of graphite electrodes has historically been influenced by the price of petroleum needle coke. See "Risk Factors—Risks Related to Our Business and Industry—Pricing for graphite electrodes has historically been cyclical and, in the future, the price of graphite electrodes will likely decline from recent record highs." The fixed prices under our contracts prevent us from passing along changes related to our costs of raw materials to our customers. See "Risk Factors—Risks Related to Our Business and Industry—We are dependent on the supply of petroleum needle coke. Our results of operations could deteriorate if recent disruptions in the supply of petroleum needle coke continue or worsen for an extended period." However, as described above, we believe our ability to source all of our petroleum needle coke requirements for these contracts from our Seadrift facility and our hedging of our purchases of decant oil mitigates the impact of periodic shortages and price fluctuations of raw materials.
As of March 1, 2018, we have executed three- to five-year take-or-pay contracts, representing approximately 636,000 MT, or approximately 60% to 65% of our cumulative expected production capacity from 2018 through 2022. Approximately 87% of the contracted volumes have five year terms and approximately 13% of the contracted volumes have three and four year terms. As of March 1, 2018, we have contracted to sell approximately 132,406, 138,446, 134,831, 117,600 and 112,883 MT in 2018, 2019, 2020, 2021 and 2022, respectively. Approximately 85% of these volumes are under pre-determined fixed annual volume contracts, while approximately 15% of the volumes are under contracts with a specified volume range. The aggregate difference between the minimum and maximum volumes across our cumulative portfolio of take-or-pay contracts with specified volume ranges is approximately 5,000 MT per year in 2019, 2020, 2021 and 2022. We have also retained significant upside by reserving the remaining approximately 35% to 40% of our production capacity from 2019 to 2022 for sales on a shorter term or spot basis.
111
Management estimates of annual production capacity
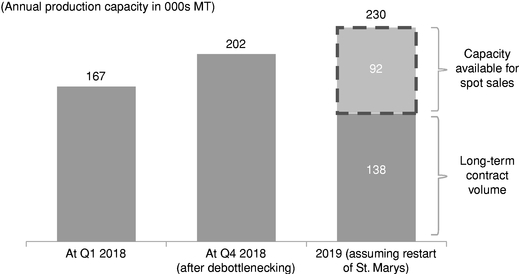
All of our take-or-pay contracts have fixed prices. The weighted average contract price for the contracted volumes over the next five years is approximately $9,700 per MT, with the weighted average contract prices for contracts with a specified volume range computed using the volume midpoint. Weighted average contract prices for our contracted volume will differ from the weighted average realized prices that we will actually realize for all MT of graphite electrodes we sell in these years because contracted volumes represent only a portion of our production capacity.
Three-to Five-Year Take-or-Pay Contract Volume and Price Profile
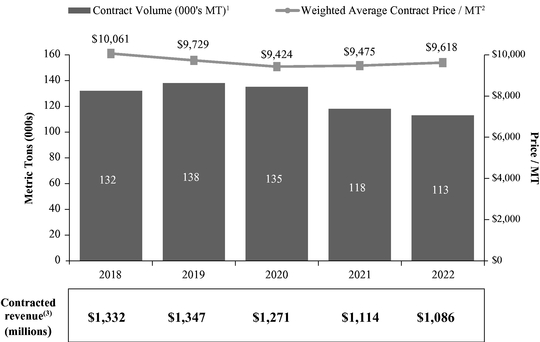
|
||
(1) Contract volume reflects volumes contracted under three- to five-year take-or-pay contracts. Contract volume in the above graph reflects the midpoint of the contracts with a specified volume range.
112
(2) Weighted average contract price reflects the volume-weighted average price for graphite electrodes at which we have entered into three- to five-year take-or-pay contracts as of March 1, 2018. For those contracts with a specified volume range, weighted average contract prices are computed using the volume midpoint.
(3) Contracted revenue reflects the product of the weighted average contract price and the contracted volume for the period.
Within this contract framework, our customers agree to purchase a specified volume of product at the price under the contract. Contract customers are unable to renegotiate or adjust the price under the contract and order. These fixed prices under the contracts also prevent us from passing along any changes related to the costs of raw materials to contract customers. As a result of the take-or-pay obligation of the contracts, the customer must purchase the annual contracted volume (or annual volume within the specified range). In the event the customer does not take delivery of the annual volume specified in the contract, our contracts provide for a capacity payment equal to the product of the number of MTs short of the annual volume specified in the contract multiplied by the price under the contract for that contract year.
In addition to defining annual volumes and prices, these three- to five-year take-or-pay contracts include significant termination payments (typically, 50% to 70% of remaining contracted revenue) and, in certain cases, parent guarantees and collateral arrangements to manage our customer credit risk. In most cases, the customer can only terminate the contract unilaterally: (i) upon certain bankruptcy events; (ii) if we materially breach certain anti-corruption legislation; (iii) if we are affected by a force majeure event that precludes the delivery of the agreed-to graphite electrodes for more than a six-month period; or (iv) if we fail to ship certain minimum levels during a specified period of time. The customer will also be able to temporarily suspend obligations under the contract due to a force majeure event, as will we, with the contract term being extended by a period equal to the duration of such suspension.
Our contracts provide our customers with certain remedies in the event that we are unable to deliver the contracted volumes of graphite electrodes on a quarterly basis. Our substantially vertically integrated Seadrift plant is particularly important to our ability to provide our customers with a reliable supply of graphite electrodes. Therefore, the likelihood that we will fail to deliver the contracted volume is significantly reduced due to our substantial vertical integration. For a discussion of certain risks related to our take-or-pay contracting initiative, see "Risk Factors—Risks related to our business and industry—We may be unable to implement our business strategies, including our initiative to secure and maintain three- to five-year take-or-pay customer contracts, in an effective manner."
We aim to be the leading producer of the highest performing graphite electrodes in order to enhance customer production efficiency. Our global manufacturing network, vertical integration with needle coke and R&D team provide us with competitive advantages in product quality, product costs, and operational flexibility. We continuously work to improve the consistent overall quality of our products and services, including the performance characteristics of each product, and the uniformity of the products manufactured at different facilities. We believe our efforts have succeeded, as in 2017 we improved our quality and performance metrics to the highest levels in ten years and added new, leading steelmakers as customers.
Approximately 89% of our graphite electrodes were purchased by EAF steel producers in 2017. The remaining portion is primarily used in various other ferrous and non-ferrous melting applications, BOF production, fused materials, chemical processing, and alloy metals. In 2017, only one customer accounted for more than 10% of our net sales. We sell our products in every major geographic region globally. Sales of our products to buyers outside the United States accounted for approximately 80% of net sales in 2015, approximately 83% of net sales in 2016 and approximately 81% of net sales in 2017. Overall, in 2017, we generated more than 92% of our net sales from EMEA and the Americas.
113
2017 Revenue and production by region and end market
| 2017 Revenue by region | 2017 Production by end market | |
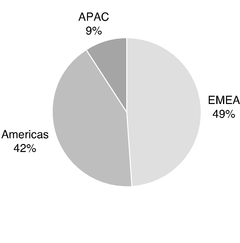
|
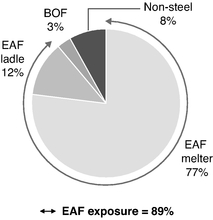
|
We believe our three- to five-year take-or-pay contracting strategy provides cash flow visibility and stability to our customers and, as a result, has secured a high quality customer base. We perform financial and credit reviews of all eligible potential customers prior to entering into these contracts. Less creditworthy customers are required to post a bank guarantee, letter of credit or significant cash prepayment. As a result, our contracted customers as of March 1, 2018 have strong balance sheets, with a weighted average cost of debt of 4.2%. Based on total revenues over the life of the contracts, our ten largest customers as of March 1, 2018 represent 41% of total revenue, while the next ten customers and all other customers represent 18% and 41% of total revenue, respectively, and approximately 85% of contracted revenue from EMEA and the Americas. As of March 1, 2018, approximately 92% of contracted production has been placed with long-time recurring strategic customers, representing approximately 95% of their 2017 electrode purchases from us.
Research and development
We have over 125 years of experience in the R&D of graphite- and carbon-based solutions. By focusing our management's attention and R&D spending exclusively on the graphite electrode business, we have been able to meaningfully improve the quality of our graphite electrodes, repositioning ourselves as an industry quality leader and improving our relationships with strategic customers. Our focus on improving the quality of petroleum needle coke through R&D has led to our petroleum needle coke production at Seadrift now being best-in-class for use in the manufacturing of highly durable UHP electrodes.
R&D expenses amounted to $2.4 million in 2016 and $3.0 million in 2017. We believe that our technological and manufacturing strengths and capabilities provide us with a significant growth opportunity as well as a competitive advantage.
Intellectual property
We believe that our intellectual property, consisting primarily of patents and proprietary know-how, provides us with competitive advantages and is important to our growth opportunities. Our intellectual property portfolio is extensive, with approximately 173 carbon and graphite U.S. and foreign patents and published patent applications, which we believe is more than any of our major competitors in the businesses in which we operate.
114
We own or have obtained licenses for various trade names and trademarks used in our businesses. For example, the trade name and trademark UCAR are owned by Union Carbide Corporation (which was acquired by Dow Chemical Company) and are licensed to us on a worldwide, exclusive and royalty-free basis until 2025. This particular license automatically renews for successive ten-year periods. It permits non-renewal by Union Carbide at the end of any renewal period upon five years' notice of non-renewal.
We rely on patent, trademark, copyright and trade secret laws, as well as appropriate agreements to protect our intellectual property. Among other things, we seek to protect our proprietary know-how and information, by requiring employees, consultants, strategic partners and others who have access to such proprietary information and know-how to enter into confidentiality or restricted use agreements.
Insurance
We maintain insurance against civil liabilities relating to personal injuries to third parties, for loss of or damage to property, for business interruptions and for certain environmental matters, that provides coverage, subject to the applicable coverage limits, deductibles and retentions, and exclusions, that we believe are appropriate upon terms and conditions and for premiums that we consider fair and reasonable in the circumstances. We cannot assure you, however, that we will not incur losses beyond the limits of or outside the coverage of our insurance.
Environment
Our facilities and operations are subject to a wide variety of federal, state, local and foreign environmental laws and regulations. These laws and regulations relate to air emissions, water discharges and solid and hazardous waste generation, treatment, storage, handling, transportation and disposal; the presence of wastes and other substances; the reporting of, responses to and liability for, releases of hazardous substances into the environment; and the import, production, packaging, labeling and transportation of products that are defined as hazardous or toxic or otherwise believed to have potential to harm the environment or human health. These laws and regulations (and the enforcement thereof) are periodically changed and are becoming increasingly stringent. We have incurred substantial costs in the past, and will continue to incur additional costs in the future, to comply with these legal requirements.
We believe that we are currently in compliance in all material respects with the federal, state, local and foreign environmental laws and regulations to which we are subject. We have experienced some level of regulatory scrutiny at most of our current and former facilities and, in some cases, have been required to take or are continuing to take corrective or remedial actions and incur related costs, and may experience further regulatory scrutiny, and may be required to take further corrective or remedial actions and incur additional costs, in the future. Although it has not been the case in the past, these costs could have a material adverse effect on us in the future.
Further, laws and regulations in various jurisdictions impose or may impose, as the case may be, environmental monitoring, reporting and/or remediation requirements if operations cease or property is transferred or sold. We have sold or closed a number of facilities that had operated solid waste management units on-site. In most cases where we divested the properties, we have retained ownership of on-site landfills. When our landfills were or are to be sold, we negotiate for contractual provisions providing for financial assurance to be maintained, which we believe will be adequate to protect us from any potential future liability associated with these landfills. When we have closed landfills, we believe that we have done so in material compliance with applicable laws and regulations. We continue to monitor these landfills and observe any reporting obligations we may have with respect to them pursuant to
115
applicable laws and regulations. To date, the costs associated with the retained landfills have not had, and we do not anticipate that future costs will have, a material adverse effect on us.
We have received and may in the future receive notices from the U.S. Environmental Protection Agency (or U.S. EPA) or state environmental protection agencies, as well as claims from other parties, alleging that we are a potentially responsible party (or PRP) under the Superfund Act and similar state laws for past and future remediation costs at waste disposal sites and other contaminated properties. Although Superfund Act liability is joint and several, in general, final allocation of responsibility at sites where there are multiple PRPs is made based on each PRP's relative contribution of hazardous substances to the site. Based on information currently available to us, we believe that any potential liability we may have as a PRP will not have a material adverse effect on us.
Certain of our U.S. facilities have been or will be required to comply with reporting requirements under the Federal Clean Air Act and standards for air emissions that have been or may be adopted by the U.S. EPA and state environmental protection agencies pursuant to new and revised regulations, including the possible promulgation of future maximum achievable control technology standards that apply specifically to our manufacturing sector(s), or more generally to our operation(s) or equipment. Achieving compliance with the regulations that have been promulgated to date has resulted in the need for additional administrative and engineered controls, changes to certain manufacturing processes, and increased monitoring and reporting obligations. Similar foreign laws and regulations have been or may also be adopted to establish new standards for air emissions, which may also require best available control technology on our manufacturing operations outside the United States. Based on information currently available to us, we believe that compliance with these regulations will not have a material adverse effect on us.
International accords, foreign laws and regulations, and U.S. federal, state and local laws and regulations have been enacted to address concerns about the effects that CO2 emissions and other identified GHGs may have on the environment and climate worldwide. These effects are widely referred to as Climate Change. The international community has taken actions to address Climate Change issues on a global basis. In particular, in December 2015, the 21st Conference of Parties for the UNFCC concluded with more than 190 countries adopting the Paris Agreement, which then came into force and was legally binding on the parties in November 2016. The Paris Agreement sets a goal of limiting the increase in global average temperature and consists of two elements: a legally binding commitment by each participating country to set an emissions reduction target, referred to as "nationally determined contributions" (or NDCs), with a review of the NDCs that could lead to updates and enhancements every five years beginning in 2023, and a transparency commitment requiring participating countries to disclose in full their progress. Our activities in the EU are subject to the EU Emissions Trading Scheme (or ETS), and it is likely that requirements relating to GHG emissions will become more stringent and will continue to expand to other jurisdictions in the future as NDCs under the Paris Agreement are implemented. In the United States, although the current Administration has announced its intent to withdraw from the Paris Agreement, the EPA currently requires reporting of GHG emissions from certain sources and, in the future, the EPA or states may impose permitting obligations on new sources or existing sources that seek to modify their operations that would otherwise result in an increase in certain GHG emissions.
In the EU, the ETS, which was initially enacted under the provisions of the 1997 Kyoto Protocol, requires certain listed energy-intensive industries to participate in an international "cap and trade" system of GHG emission allowances. A third phase of the EU ETS under Directive 2009/29/EC, covers the period 2013 to 2020 and instituted a number of program changes. EU Member States brought into force the necessary laws, regulations and administrative provisions to comply with this EU Directive. Carbon and graphite
116
manufacturing is still not a covered industry sector in the revised Annex 1 of this Directive. However, one of our European manufacturing operations was required to comply with these provisions under a more general fuel combustion category, because its combustion units met the applicability levels. The operations subject to these provisions was eligible to receive free CO2 emission allowances under the member state allocation program. On November 9, 2017, to implement the EU's NDC under the Paris Agreement and other GHG commitments, the European Parliament and Council announced a provisional agreement to revise and make more stringent the ETS during the Phase 4 period of 2021 to 2030. Among other changes, the Phase 4 provisions would further accelerate reduction in the current oversupply of allowances in the ETS market and establish further protections against the risks of carbon leakage. Final agreement is expected to be approved and a new EU Directive published during 2018. The EU's current target for 2030 is to achieve a GHG reduction of at least 40% compared to 1990 levels. Implementation of Phase 4 could increase the cost of our current GHG allowances and require us to obtain additional allowances. Based on information currently available to us, we believe that compliance with international accords, U.S. and foreign laws and regulations concerning Climate Change which have been promulgated, or that could be promulgated in the future, including Phase 4 of the ETS, will not have a material adverse effect on us.
Some of our products (including our raw materials) are subject to extensive environmental and industrial hygiene regulations governing the registration and safety analysis of their component substances. For example, in connecting with the REACH or the EU's Classification, Labelling and Packaging Regulation, any key raw material, chemical or substance, including our products, could be classified as having a toxicological or health-related impact on the environment, users of our products, or our employees. We process and use coal tar pitch, which is classified as a substance of very high concern under REACH, is used in certain of our processes but in a manner that does not currently require us to obtain a specific authorization from ECHA.
Estimates of future costs for compliance with U.S. and foreign environmental protection laws and regulations, and for environmental liabilities, are necessarily imprecise due to numerous uncertainties, including the impact of potential new laws and regulations, the availability and application of new and diverse technologies, the extent of insurance coverage, the potential discovery of contaminated properties, or the identification of new hazardous substance disposal sites at which we may be a PRP and, in the case of sites subject to the Superfund Act and similar state and foreign laws, the final determination of remedial requirements and the ultimate allocation of costs among the PRPs. Subject to the inherent imprecision in estimating such future costs, but taking into consideration our experience to date regarding environmental matters of a similar nature and facts currently known, we estimate that our costs and capital expenditures (in each case, before adjustment for inflation) for environmental protection regulatory compliance programs and for remedial response actions will not be material over the next several years. Furthermore, we establish accruals for environmental liabilities when it is probable that a liability has been or will be incurred, and the amount of the liability can be reasonably estimated. We adjust the accrual as new remedial actions or other commitments are made, as well as when new information becomes available that changes the prior estimates previously made and we believe our existing accruals are reasonable.
Employee relations
As of December 31, 2017, we had 1,310 employees (excluding contractors). A total of 431 employees were in Europe (including Russia), 678 were in Mexico and Brazil, 11 were in South Africa, 180 were in the United States and 10 were in the Asia Pacific region. As of December 31, 2017, 783 of our employees were hourly employees.
117
As of December 31, 2017, approximately 718 employees, or 55%, of our worldwide employees, are covered by collective bargaining or similar agreements. As of December 31, 2017, approximately 716 employees, or 55% of our worldwide employees, were covered by agreements that expire, or are subject to renegotiation, at various times through December 31, 2017. We believe that, in general, our relationships with our unions are satisfactory and that we will be able to renew or extend our collective bargaining or similar agreements on reasonable terms as they expire. We cannot assure, however, that renewed or extended agreements will be reached without a work stoppage or strike or will be reached on terms satisfactory to us.
We have not had any material work stoppages or strikes during the past decade.
Legal proceedings
We are involved in various investigations, lawsuits, claims, demands, labor disputes and other legal proceedings, including with respect to environmental and human exposure or other personal injury matters, arising out of or incidental to the conduct of our business. While it is not possible to determine the ultimate disposition of each of these matters and proceedings, we do not believe that their ultimate disposition will have a material adverse effect on our financial position, results of operations or cash flows.
Litigation has been pending in Brazil brought by employees seeking to recover additional amounts and interest thereon under certain wage increase provisions applicable in 1989 and 1990 under collective bargaining agreements to which employers in the Bahia region of Brazil were a party (including our subsidiary in Brazil). Prior to October 1, 2015, we were not party to such litigation. Companies in Brazil have recently settled claims arising out of these provisions and, in May 2015, the litigation was remanded, in favor of the employees, by the Brazil Supreme Court to the lower courts for further proceedings which included procedural aspects of the case, such as admissibility of instruments filed by the parties. On October 1, 2015, an action was filed by current and former employees against our subsidiary in Brazil to recover amounts under such provisions, plus interest thereon, which amounts together with interest could be material to us. In the first quarter of 2017, the state court ruled in favor of the employees. We have appealed this ruling and intend to vigorously defend it. As of the date of this prospectus we are unable to assess the potential loss associated with these proceedings as the claims do not currently specify the number of employees seeking damages or the amount of damages being sought.
118
Graphite electrode industry
Graphite electrodes are an industrial consumable product used primarily in EAF steel production. EAFs and BOFs are the two primary technologies for steel production. In the EAF method, steel scrap is melted and recycled to produce liquid steel, while in the BOF method, virgin iron ore is smelted with metallurgical coke, a carbon product derived from metallurgical coal. According to the WSA, in 2016, EAF steel producers accounted for 45%, or 367 million MT, of global crude steel production (excluding China, which almost exclusively uses the BOF method), an increase of 37% since 2000. EAFs have historically been the fastest-growing segment of the global steel industry due to their greater resilience, more variable cost structure, lower capital intensity and more environmentally friendly nature.
EAF steel producers are the primary consumers of graphite electrodes, and use them to conduct electricity in a furnace, generating an electric arc of sufficient heat to melt scrap metal, iron ore or other raw materials used to produce steel or other metals. EAFs operate using either alternating electric current or direct electric current. The vast majority of EAFs use alternating electric current and typically use nine electrodes (in three columns of three electrodes each) at one time. Direct electric current EAFs typically use one column of three electrodes. Graphite electrodes are the only known commercially available products that have both the capacity to handle high levels of electrical current and the capability to sustain the high levels of heat generated in EAF steel production, making graphite electrodes essential to the EAF process.
The size of the electrodes varies depending on the size of the furnace, the size of the furnace's electric transformer and the planned productivity of the furnace. In a typical furnace using alternating electric current and operating at a typical number of production cycles per day, three electrodes are fully consumed (requiring the addition of new electrodes), on average, every 8 to 10 operating hours. Graphite electrodes are consumed at a rate of approximately 1.7 kilograms per MT of steel production.
The actual rate of consumption and addition of electrodes for a particular furnace depends primarily on the efficiency and productivity of the furnace. Therefore, demand for graphite electrodes is directly related to the amount and efficiency of EAF steel production. EAF steel production requires significant heat (as high as 5,000° F) to melt the raw materials, primarily scrap metal, in the furnace. Heat is generated as electricity (as much as 150,000 amps) passes through the electrodes and creates an electric arc between the electrodes and the raw materials.
Market size and major producers
Electrode production globally (excluding China) is focused on the manufacture of UHP electrodes for EAFs, while the majority of Chinese production is of ladle electrodes for BOFs. UHP electrodes must be able to endure more harsh operating environments than ladle electrodes, as EAFs melt solid scrap steel to a liquid state whereas BOF ladle electrodes are used to maintain the temperature of steel already in a liquid state. UHP electrodes are more difficult to make and are sold at a premium relative to ladle electrodes because their production requires an extensive proprietary manufacturing process and material science knowledge, including the use of superior needle coke blends. As a result, graphite electrode producers outside of China and electrode producers in China are generally not in direct competition for major product lines.
We believe the worldwide graphite electrode production capacity (excluding China) was approximately 800,000 MT in 2016. We estimate the graphite electrode industry (excluding China) produced
119
approximately 730,000 MT of electrodes in 2017, resulting in a capacity utilization of approximately 90%. However, we believe that plants are currently running at or near full effective capacity, with the industry further constrained by a limited supply of petroleum needle coke. The industry is fairly consolidated with the top five players producing approximately 83% of the total volume according to management estimates. The five largest producers in the industry are Showa Denko K.K., GrafTech, Graphite India Limited, Tokai Carbon Co., Ltd. and HEG Ltd.
The charts below shows management estimates for expected GrafTech and industry production capacity in the fourth quarter of 2018, following our operational improvement and debottlenecking initiative.
Management estimates of 2017 graphite electrode industry production capacity and recent closures (excluding China), including estimated GrafTech capacity expansions to be achieved by Q4 2018
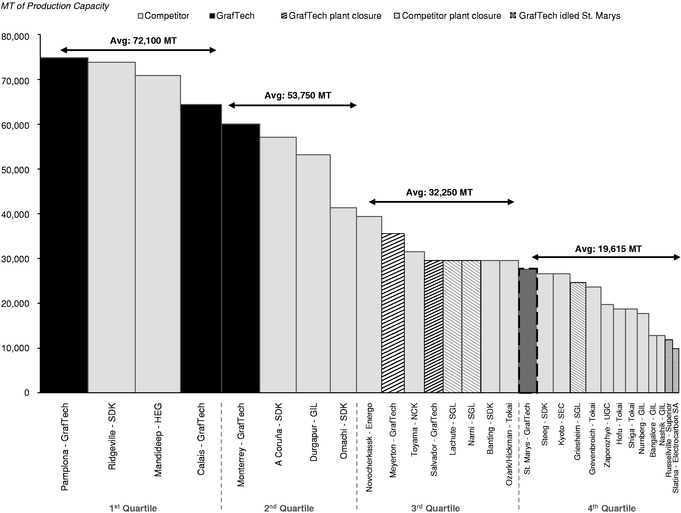
120
Management estimates of graphite electrode industry production capacity (excluding China) by Company at 2018 YE
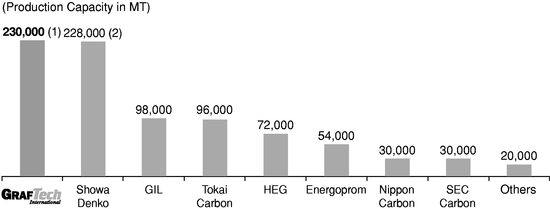
(1) GrafTech production capacity of 230,000 MT assumes restart of currently idled St. Marys facility
(2) Excludes production capacity figures related to Chinese operations
Source: Public filings of competitors and management estimates
Customers of UHP graphite electrode producers primarily include EAF steel producers across the Americas and EMEA. As the capacity utilization and production levels for EAF steel producers have increased over the course of 2017, demand for graphite electrodes has exceeded current production capacity. Customers have historically procured graphite electrodes through annual agreements negotiated in the third and fourth quarters of each calendar year for graphite electrodes to be delivered the following year. In light of recent market trends described below, certainty of supply of graphite electrodes has become a critical concern for EAF steelmakers.
We believe that greenfield graphite electrode manufacturing projects have been difficult to develop due to significant capital costs, long lead times, technical know-how, and cumbersome permitting and regulatory regimes. We believe the lead time from initial permitting to full production of a greenfield graphite electrode manufacturing facility would be approximately five to ten years and potentially cost as much as approximately $10,000 per MT. Similarly, brownfield graphite electrode manufacturing development is complicated by significant capital costs. Only one greenfield project and one brownfield expansion have been completed since the 1980s outside of China. Therefore, we believe that the industry does not currently have the ability to increase production capacity easily to meet rising demand, resulting in a shortage of graphite electrodes. Additionally, graphite electrodes require petroleum needle coke, which is an essential raw material for production. Needle coke is in short supply due to demand constraints explained below.
Restructuring of industry production capacity
Supply trends
According to the WSA, between 1984 and 2011, EAF steel production has grown at 3.5% per year, encouraging the growth of the graphite electrode industry. The rapid growth of Chinese steel production, primarily by the BOF method, created an oversupply in steel which led graphite electrode producers to rationalize production capacity and consolidate between 2014 and 2016, a phase which we believe has concluded with renewed EAF steel demand. In 2013, the graphite electrode industry (excluding China) had capacity to produce approximately 1.0 million MT of graphite electrodes across 30 graphite electrode
121
plants. We estimate that, since the beginning of 2014, the industry has closed or repurposed approximately 20% of global production capacity outside of China, consisting of smaller, higher cost facilities. Based on our experience, high capacity manufacturing facilities can have operating costs of more than $1,000 per MT lower than low capacity manufacturing facilities, encouraging producers to consolidate facilities in order to reduce costs.
Following this rationalization, we estimate that as of November 2017, global production capacity (outside of China) has fallen to approximately 800,000 MT across 21 graphite electrode plants operating at or near full capacity. We believe the majority of this production capacity reduction is permanent due to the demolition, long-term environmental remediation and repurposing of most of these lower capacity facilities. Additionally, in October 2017, Showa Denko, the industry's third largest producer, acquired SGL Carbon, the second largest producer. The consolidation and production capacity reductions in the graphite electrode industry, along with the EAF industry's recovery since 2016, lead us to believe that the graphite electrode industry has recovered from the downturn and will resume its long-term growth trajectory.
Demand trends
Our graphite electrodes are primarily used in the EAF steelmaking process, and global growth in that market has driven increasing demand for graphite electrodes. EAF steelmaking has historically been the fastest-growing segment of the global steel market. According to the WSA, EAF steelmaking grew at an average annual rate of 3.5% from 1984, the first year for which data is available for all relevant countries, until 2011, while overall steel production (using all methods) grew at an average annual rate of 2.9%. After average annual declines in EAF steel production of 2.7% from 2011 through 2015, EAF steel production grew by 2.8% in 2016. We estimate EAF steel production will grow at least 8% to 10% in 2017. CRU forecasts that EAF steel production will grow at a compound annual growth rate of 4.9% from 2017 to 2019, which should provide additional support for graphite electrode demand.
GrafTech is a market leader in a consolidated supply chain with a fragmented customer base: the top 10 EAF steel producers globally accounted for 19% of global production capacity in 2017
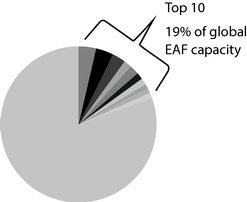
Source: Wood MacKenzie
This growth has resulted from the development by EAF steelmakers of diversified raw material sources, including non-scrap materials rich in iron content, such as direct reduced iron and hot briquetted iron. These high quality sources of iron, in addition to technological advances in the EAF process, have enabled EAF steel producers to produce higher quality grades of steel traditionally produced by BOF steelmakers and to enter new markets as a result. EAF steelmakers have therefore been able to increase both market share and overall production. According to the WSA, as of 2016, EAF steel production has grown to 67% of
122
total U.S. steel production from 47% in 2000, 44% of total EMEA steel production from 33% in 2000, and 40% of total APAC (excluding China) steel production from 36% in 2000. Over the same period, global EAF production increased from 287 million MT in 2000 to 418 million MT in 2016, while non-EAF steel production (excluding China) was flat at 453 million MT in both 2000 and 2016. This ongoing shift toward EAF steelmaking has resulted in increasing demand globally for graphite electrodes.
We believe there is a particular opportunity for EAF steelmaking to take further market share in China as well. China's 12th Five-Year Plan, released in 2011, called for EAFs to constitute 20% of overall steel production by 2020. According to the WSA, in 2016, Chinese EAF production was approximately 52 million MT, or approximately 6% of China's total steel production of 808 million MT. If Chinese EAF steelmaking production capacity were to reach 20%, based on 2016 production levels, that would add approximately 110 million MT of additional EAF production, compared to 2016 EAF production in the next largest regions of approximately 64 million MT in the EU, 55 million MT in India and 53 million MT in the United States.
While China's 13th Five-Year Plan, released in March 2016, did not explicitly address the EAF target, it did emphasize the importance of environmental efforts, such that 10 of 25 targets in the plan were related to the environment. The Chinese government's increasing focus on the environment may eventually incentivize steelmakers to convert from BOFs to EAFs in order to continue operating. Significant BOF capacity in the country has been shuttered since 2016 given increasing government-mandated environmental efforts. We estimate that at least 105 new EAFs, reflecting 66 million MT of annual steelmaking production capacity, have been installed or have commenced construction in China in 2017, compared to only 52 million MT of Chinese EAF steel production in 2016. Assuming completion of new EAF construction and full EAF capacity utilization, we estimate total graphite electrode demand in China could increase in 2018 by over 100,000 MT from 2017. China's rapid increase in BOF steel production between 2000 and 2016 has created a significant new source of scrap, and China may become an exporter of steel scrap if it cannot develop its own EAF industry. Chinese exports of scrap would introduce a new source of the key raw material for EAF steelmakers, further benefiting EAF steelmakers' cost advantage relative to BOF producers, both in China and globally. Additional EAF production would increase demand for graphite electrodes.
123
Management estimates of electrode industry capacity utilization (excluding China)
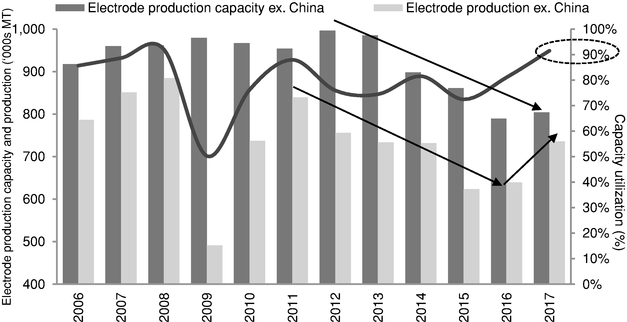
Pricing trends
Pricing for graphite electrodes is determined through contract negotiations and spot transactions between producers and consumers. Pricing has historically been cyclical, reflecting the demand trends of the global EAF steelmaking industry and supply of graphite electrodes. Moreover, as petroleum needle coke reflects a significant percentage of the raw material cost of graphite electrodes, graphite electrodes have typically been priced at a spread to petroleum needle coke. Over the period from 2006 to 2016, the average graphite electrode spread over petroleum needle coke was approximately $3,000 per MT, on an inflation-adjusted basis using constant 2017 dollars. In tight demand markets, this spread has increased, resulting in higher graphite electrode prices. We believe that the new source of demand for petroleum needle coke presented by lithium-ion battery producers for electric vehicles will place upward pressure on petroleum needle coke pricing compared to historical levels. While there is no widely accepted graphite electrode reference price, we believe that our weighted average realized prices are indicative of prices in the overall industry. Historically, between 2006 and 2016, our weighted average realized price of graphite electrodes was approximately $4,500 per MT (on an inflation-adjusted basis using constant 2017 dollars).
During the most recent demand trough, our weighted average realized price of graphite electrodes fell to approximately $2,500 per MT in 2016. Following the significant rationalization of graphite electrode production globally, the resumption of growth in EAF steel production, falling scrap prices, reductions in Chinese steel, and constrained supply of needle coke, graphite electrode spot prices increased to $15,000 to $30,000 per MT in the first quarter of 2018. Looking beyond 2017, CRU expects graphite electrode prices to remain at elevated levels due to supply constraints and the market to remain tighter for longer as forecasts suggest that inventories will not be fully restocked until 2023. Nevertheless, because of the critical role of graphite electrodes to our customers' operations and the relatively low cost of graphite electrodes to EAF producers (typically approximately 1% to 5% of the cost of steel production), our customers have been willing to pay a premium for a reliable supply of high quality graphite electrodes, and, in some cases, to pass on the price of this premium to their customers in the form of surcharges, particularly in markets where EAF steelmakers have significant market share.
124
GrafTech historical weighted average realized prices and signed three- to five-year weighted average contract prices for graphite electrodes
(1) Weighted average realized price for a period reflects the total revenues from sales of graphite electrodes for the period divided by the graphite electrode sales volume for that period. The weighted average realized prices in this chart are shown in constant 2017 dollars for comparability. See "Management's Discussion and Analysis of Financial Condition and Results of Operations—Key Operating Metrics."
(2) Weighted average contract price for a period reflects the volume-weighted average price for graphite electrodes to be delivered under the three- to five-year take-or-pay contracts we have entered into as of March 1, 2018. All of these contracts have fixed prices and either fixed volumes (85% of the portfolio) or a specified volume range (15% of the portfolio). For those contracts with a specified volume range, weighted average contract prices are computed using the volume midpoint. The aggregate difference between the volume midpoint and the minimum and maximum volumes across our cumulative portfolio of take-or-pay contracts with specified volume ranges is approximately 5,000 MT per year in 2019-2022. See "Business—Contracts and Customers."
Needle coke industry
Introduction
Needle coke is the primary raw material for the production of graphite electrodes used by EAF steelmakers and producers of aluminum, stainless steel, silicon metals and other ferrous and non-ferrous metals, and is also a key raw material in the production of lithium-ion batteries used to power electric vehicles. Needle coke is derived from two carbon sources. Petroleum needle coke is produced through a manufacturing process very similar to a refinery. The production process converts decant oil, a byproduct of the gasoline refining process, into petroleum needle coke and generally takes two months to produce. Pitch needle coke, used principally by Asian graphite electrode manufacturers, is made from coal tar pitch, a byproduct of coking metallurgical coal used in BOF steelmaking.
Graphite electrode producers combine petroleum and pitch needle coke with binders and other ingredients to form graphite electrodes. Petroleum and pitch needle coke, relative to other varieties of coke, are distinguished by their needle-like structure and their quality, which is measured by the presence of impurities, principally sulfur, nitrogen and ash. Petroleum and pitch needle coke are typically low in these impurities. Additionally, the needle-like structure of petroleum and pitch needle coke creates expansion along the length of the electrode, rather than the width, which reduces the likelihood of fractures. In order to minimize fractures caused by disproportionate expansion over the width of an electrode, and minimize the effect of impurities, large-diameter graphite electrodes (18 inches to 32 inches) employed in high-intensity EAF applications are comprised almost exclusively of petroleum and pitch needle coke.
125
The process map below shows the raw materials required to make graphite electrodes, the various consumers of these raw materials, as well as the consumers of graphite electrodes.
Graphite electrode industry production process
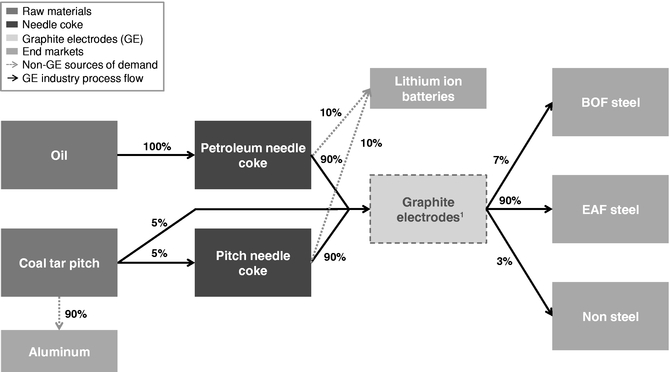
(1) Graphite electrode sales represent sales outside of China
Source: Management estimates as of November 30, 2017
Needle coke has historically accounted for 25% to 45% of our graphite electrode production cost and is the key input for graphite electrode production, with roughly 1 MT of needle coke required for 1 MT of graphite electrode production. Previously, producers of petroleum needle coke typically agreed to supply petroleum needle coke in twelve-month contracts; however, in 2017, producers of petroleum needle coke only agreed to six-month contracts, and we have received indications that in 2018, suppliers may offer only three-month contracts. As a result, our competitors must continually renegotiate supply agreements in response to changing market conditions. We are substantially vertically integrated through our ownership of our Seadrift facility, which provides approximately 75% of our needle coke requirements and insulates us from rapid changes in the needle coke market.
Market size and major producers
We believe that the global market production for needle coke is approximately 820,000 MT annually. Petroleum needle coke contributes approximately 80% to 85% of the production (or approximately 700,000 MT) and pitch needle coke provides the remaining 15% to 20% of production (approximately 120,000 MT). Petroleum needle coke is generally preferred by graphite electrode producers and manufacturers of lithium-ion batteries for electric vehicles in North America and Western Europe. Graphite electrode manufacturers prefer petroleum needle coke because of the meaningfully longer bake and graphitizing time required for pitch needle coke and the subsequent impact on graphite electrode production throughput. Electric vehicle manufacturers prefer petroleum needle coke in lithium-ion batteries
126
because of its greater energy density, providing batteries with longer driving ranges and longevity. As a result of this preference by both graphite electrode and electric vehicle manufacturers, demand for petroleum needle coke is expected to exceed supply beginning in 2018 and result in increased prices for both petroleum needle coke and graphite electrodes, as well as constrain manufacturing capacity of graphite electrodes.
The needle coke industry is highly concentrated with approximately ten major producers of needle coke and only four major producers of petroleum needle coke (excluding one small facility in China). These firms include Phillips 66 (U.S.), Seadrift (GrafTech), Petrocokes Japan Limited (Japan), JX Nippon Oil & Energy Co., Ltd. (Japan) and Petrochina International Jinzhou Co., Ltd. (China), which produce petroleum needle coke, and Mitsubishi Chemical Company, Baosteel Group (China), C-Chem Co., Ltd. (Japan), Indian Oil Company Limited (India), JX Holdings Inc. (Japan), Petrochina International Jinzhou Co., Ltd. (China) and Anshan Kaitan Thermo-Energy New Materials Co. Ltd (China), which produce pitch needle coke. We believe that Phillips 66 and Seadrift are the largest and second largest needle coke producers in the world, respectively. We estimate that Seadrift has approximately 19% global market share for petroleum needle coke.
Petroleum needle coke industry production capacity (excluding China) in 2017 by company
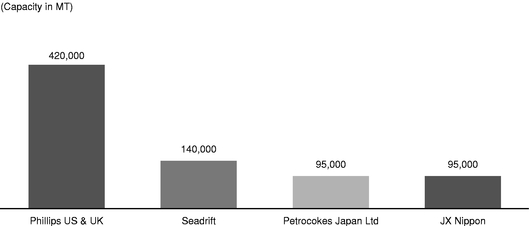
Source: Management estimates
Industry trends
Petroleum needle coke production capacity, excluding China, has remained unchanged for at least the last 10 years due to the capital intensity, technical know-how and long lead times required to build greenfield needle coke production facilities and the stringent regulatory process associated with building new needle coke production capacity. Furthermore, we believe that brownfield expansion opportunities are generally not available as petroleum needle coke manufacturing is a continuous process with significant costs associated with shutting down and restarting facilities for maintenance or capital investment.
Supply of pitch needle coke is also becoming constrained as coke batteries shut down. In the Americas, reduced operations or closures of BOF steel furnaces have reduced demand for metallurgical coke, impacting the availability of supplies of coal tar pitch, used to produce pitch needle coke. Additionally, some producers of pitch needle coke for other metals industries, like aluminum, have chosen to reduce their operations or exit the market. The remaining supply in North America has been inadequate to meet demand from the aluminum, graphite and other coal tar pitch end use sectors. We believe similar trends
127
are taking place in China, where rationalization of excess BOF steelmaking production capacity has reduced demand for coking coal, resulting in less coal tar pitch produced as a byproduct. These closures have constrained supply within China and in countries that are dependent on Chinese exports of pitch needle coke.
While supply has become constrained, demand for petroleum needle coke is increasing due to the use of needle coke in lithium-ion batteries used in electric vehicles. The International Energy Agency (or IEA) estimates that the global electric car stock exceeded two million vehicles in 2016, doubling from 2015 levels. The IEA further projects that the global electric car stock may range between 9 million and 20 million by 2020, and between 40 million and 70 million by 2025. Most electric vehicles rely on lithium-ion batteries as their key performance component. In the last two years, manufacturers of lithium-ion batteries for electric vehicles have begun using needle coke instead of other forms of graphite as a raw material for carbon anodes in their batteries due to technological advances and the consistent quality that needle coke provides. We expect that lithium-ion battery manufacturers will continue to prefer petroleum needle coke instead of pitch needle coke for the majority of their supply, due to petroleum needle coke's better energy density and superior energy storage. These qualities provide lithium-ion batteries made with petroleum needle coke with longer potential driving ranges and battery lives. Currently, we estimate that electric vehicles comprised approximately 60,000 MT or 9% of the total demand for petroleum needle coke in 2017, and we expect this percentage to increase to approximately 34% by 2020. Electric car sales increased 40% in 2017 and total needle coke demand is expected to reach approximately 340,000 MT by 2020. Of the approximately 80,000 MT of needle coke used in electric cars in 2017, approximately 60,000 MT was petroleum needle coke. As a result of the increased use of petroleum needle coke in lithium-ion batteries for electric vehicles, as well as the recovering demand for graphite electrodes, we expect demand to exceed production capacity beginning in 2018. Based on IEA's estimates of growth in electric vehicle stock to 2025, requirements for petroleum needle coke to fulfill demand would grow exponentially. Given the constraint of approximately 700,000 MT of petroleum needle coke production capacity in 2017, we expect the dynamic of demand outpacing production capacity to continue well beyond 2018.
128
Illustrative electrical vehicle global annual deliveries
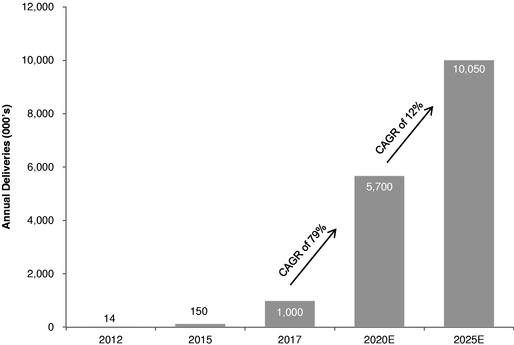
Management estimates of petroleum needle coke industry demand and production capacity
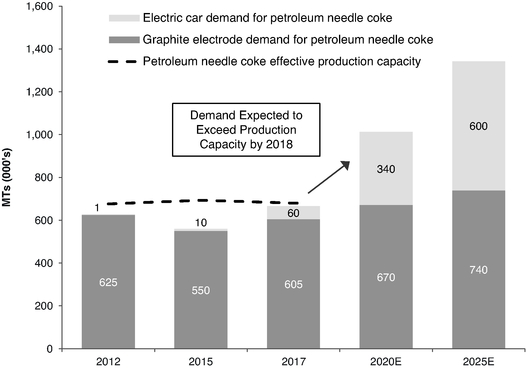
Source: Electric vehicle forecast based on IEA data (Global EV Outlook 2017); petroleum needle coke demand reflects management estimates.
Note: Estimates of electric vehicle deliveries are based on the midpoint of IEA's estimate of electric vehicle stock range of 9 million and 20 million in 2020, 40 million and 70 million in 2025, and 56 million and 160 million in 2030; petroleum needle coke demand for lithium ion batteries in electric vehicles is based on management estimates of 40 kilograms of anode powder per electric vehicle (anode powder consumes 2 MT of needle coke per MT, with at least 75% of needle coke supply provided by petroleum needle coke).
129
As demand for both petroleum needle coke and pitch needle coke is outpacing supply in the intermediate term, needle coke prices have risen substantially. Contracted petroleum needle coke prices increased significantly over the past two years and are reported to be four to six times higher in the current market compared to one year ago. Pitch needle coke prices have increased at a faster rate relative to petroleum needle coke prices over the last year, however, as pitch needle coke suppliers have reduced or scaled back operations as reduced supply of coal tar pitch has driven pitch needle coke raw material costs higher, while lower oil prices have made petroleum needle coke less expensive. In light of the constrained market and new growth in demand from lithium-ion batteries, CRU estimates that 2017 needle coke prices have risen above $3,000 per MT in 2017 and will remain above $2,000 per MT through 2027, compared to an average needle coke price of approximately $500 per MT in 2016.
EAF steel industry
Emergence and initial period of growth
According to the WSA, global EAF production grew at a 3.5% compound annual growth rate from 1984 to 2011, while taking share from other methods of steelmaking in most regions of the world, outside of China. From 1984 to 2016, EAF production increased from 178 million MT to 418 million MT while, during the same period, steel produced by all other methods outside of China declined from 498 million MT to 453 million MT. EAFs benefit from their flexibility in sourcing iron units, being able to make steel from either scrap or alternative sources of iron like direct reduced iron and hot briquetted iron, both made directly from iron ore. Most of the growth in EAF steelmaking has taken place in Western Europe and North America, two regions with substantial amounts of scrap available for use in EAFs.
Global EAF steel production
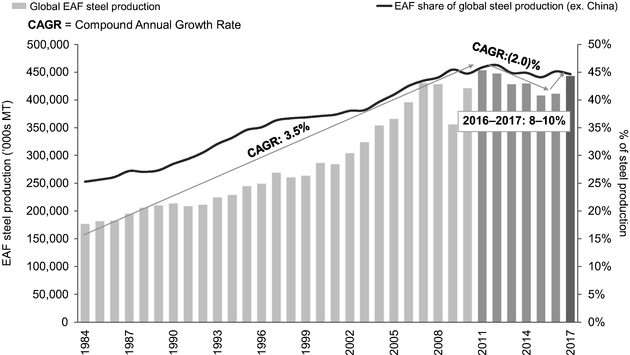
Source: World Steel Association
130
Industry disruption 2011 to 2015
According to the WSA, EAF steel production declined approximately 10% from 2011 to 2015, reversing a trend of annual growth from 1984 to 2011, largely due to substantial increases in Chinese steel production. In 1984, China produced 21 million MT of BOF steel, which by 2016 had grown to 757 million MT, representing approximately 94% of its total steel production. Growth in production capacity surpassed growth in demand, resulting in significant excess capacity within China and increased exports into global markets. China net steel exports peaked at 112 million MT in 2015. These exports negatively affected steel prices and led EAF producers to reduce production. In 2011, EAF production globally was 454 million MT representing 30% of global steel production, but by 2015, EAF production had declined to 407 million MT, representing 25% of global steel production respectively. Declining EAF production significantly impacted demand for our graphite electrode products.
EAFs recovering and positioned for long-term growth
The EAF steel industry has recovered since the downturn from 2011 to 2015. EAF production started to recover in 2016 with growth of 2.8%, according to the WSA. EAF production is now rebounding very strongly and we estimate that 2017 growth will be at least 8% to 10%. This recovery has taken place since China began in 2015 to restructure its steel industry by encouraging consolidation and shutting down excess capacity. China has also begun to implement increased environmental regulations to improve air quality, which has been impacted by CO2 emissions associated with the burning of coal in BOF steelmaking. Additionally, developed economies such as North America and Western Europe have implemented trade decisions against BOF steel-producing countries to protect their domestic steel industries against imports.
Since 2015, Chinese steel producers, which predominately use BOFs, have significantly reduced steel production due to government-mandated consolidation and elimination of excess steel production capacity and increased environmental regulations. In September 2016, China's State Council called for 60% of steelmaking production capacity to be concentrated in the top 10 producers by 2020. The first step in consolidation was the formation of China Baowu Steel Group Corp., Ltd., a merger of BaoSteel Group Corp. and Wuhan Iron & Steel (Group) Corp. (WISCO) in 2016. Since the steps taken by China's State Council, it is estimated that China has decreased its official production capacity, primarily BOFs, by over 100 million MT, and eliminated illegal induction furnace capacity of 120 million MT, based on data from S&P Global Platts and the Ministry of Commerce of the People's Republic of China. These two steps together represent closure of approximately 20% of Chinese steelmaking production capacity. As a result of Chinese regulatory reform and trade actions taken by developed markets (discussed below), in 2017, Chinese steel exports had declined by more than 30% from 2016 levels. According to the U.S. International Trade Administration, Chinese steel exports have also fallen as a percentage of overall Chinese steel production for the year-to-date 2017 (as of June), as exports as a share of Chinese production fell from 14.0% to 9.5% year over year. As of October 2017, Chinese steel imports had increased significantly year-over-year, including a 64% year-over-year increase in semi-finished steel billet imports. Declining Chinese steel exports and
131
increasing steel imports may provide additional opportunity for EAF producers outside of China to increase production.
| Chinese steel capacity rationalization | Chinese monthly steel exports | |
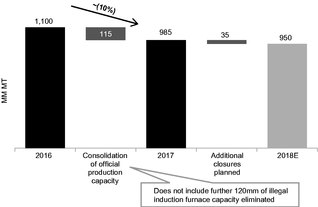
|
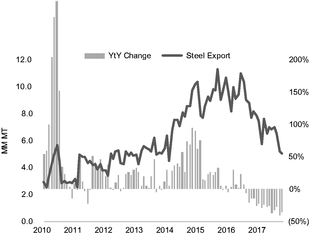
|
Sources: Reuters; S&P Global Platts; GrafTech estimates
Global anti-dumping actions taken by developed markets against BOF producing countries, such as China, Japan, Brazil and Korea, have also reduced exports of BOF steel from these markets into North America and Western Europe. According to the U.S. Department of Commerce, through June 1, 2017, more than 94 anti-dumping duties, 23 countervailing duties, and four suspension agreements and undertakings, have been imposed against Chinese steel mill products by 17 countries and economic zones. Similarly, there have been 53 similar actions applied to Korean steel mill products, 30 actions applied to Japanese steel mill products, and 12 actions applied to Brazilian steel mill products. These anti-dumping and countervailing duty investigations and decisions have increased the cost of imported steel, benefiting domestic steel producers. As the steel-exporting countries primarily rely on the BOF method, and North America and Western Europe are regions with the greatest share of EAF steel production, these trade decisions have supported demand for EAF steel and graphite electrodes.
As a result of policy and structure changes in China and trade policy actions globally, EAFs are regaining market share. We estimate that EAF steelmaking grew at an annual pace of at least 8% to 10% in 2017, compared with 5% for steelmaking overall.
132
Outlook
We expect EAF steel production to continue to grow globally. In 2000, according to the WSA, EAF steel production represented 47% of total U.S. steel production, increasing to 67% of total U.S. steel production by 2016. In absolute terms, total EAF production in the United States increased from 48 million MT in 2000 to 53 million MT in 2016. In 2000, EAF steel production reflected 33% of total EMEA steel production, increasing to 44% of total EMEA steel production by 2016. This represented an increase in total EAF production in EMEA from 111 million MT in 2000 to 152 million MT in 2016. In 2000, 36% of total APAC (excluding China) steel production was by the EAF method, representing 77 million MT of EAF production. This share of production increased only to 40% of total APAC (excluding China) steel production by 2016; however, this represents 129 million MT of EAF production, or an incremental increase of 52 million MT. As a result, we believe there is substantial opportunity for trends in the U.S. and EMEA steel markets to replicate elsewhere.
China also represents a significant opportunity for EAF growth and market share expansion. Chinese steel production today is substantially through the BOF method, but increasing focus on environmental protection within China may encourage conversion from BOFs to EAFs. In its 12th Five-Year Plan, the Chinese government set a goal of achieving 20% EAF market share by 2020. While China's 13th Five-Year Plan, released in March 2016, did not explicitly address the EAF target, it did emphasize the importance of environmental efforts, such that 10 of 25 targets in the plan were related to the environment. The government's increasing focus on the environment may eventually incentivize steelmakers to convert from BOFs to EAFs in order to continue operating. Additionally, the rapid historical increase in Chinese steel production has resulted in increasing supplies of scrap, making EAFs more cost attractive relative to BOFs. According to McKinsey, so much scrap is expected to become available that EAF production capacity in China would need to triple by 2020 to keep pace. Steel producers may conclude that lower-capital intensity mini-mills are more attractive investment opportunities than rebuilding blast furnaces as they age, further supporting demand for graphite electrodes. This conversion may already be underway. We estimate that at least 105 new EAFs, reflecting 66 million MT of annual steelmaking production capacity, have been installed or have commenced construction in China in 2017, compared to only 52 million MT of Chinese EAF steel production in 2016. Assuming completion of new EAF construction and full EAF capacity utilization, we estimate total graphite electrode demand in China could increase in 2018 by over 100,000 MT from 2017.
| Chinese steel production 2000-2016 | Chinese scrap availability 2000-2030E | |

|
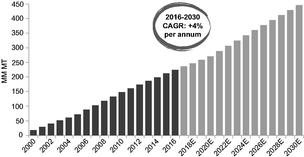
|
Sources: World Steel Association; McKinsey; GrafTech estimates
133
Directors and executive officers
The following table sets forth the name, age and position of our directors, director nominees, and executive officers. The following also includes certain information regarding our directors', director nominees' and executive officers' individual experience, qualifications, attributes and skills, and brief statements of those aspects of our directors' and director nominees' backgrounds that led us to conclude that they should serve as directors.
| | | | | | |
| Name |
Age |
Position |
|||
|---|---|---|---|---|---|
| | | | | | |
| Denis A. Turcotte | 56 | Chairman and Director | |||
| David J. Rintoul | 60 | Director, President and Chief Executive Officer (or CEO) | |||
| Jeffrey C. Dutton | 55 | Director | |||
| Ron A. Bloom | 62 | Director | |||
| Quinn J. Coburn | 54 | Vice President, Chief Financial Officer (or CFO) and Treasurer | |||
| Brian L. Acton | 66 | Director Nominee | |||
| Michel J. Dumas | Director Nominee | ||||
| Anthony R. Taccone | 57 | Director Nominee | |||
| | | | | | |
Denis A. Turcotte was elected to the board of directors in August 2015 and became Chairman of the Company's board of directors in March 2018. Mr. Turcotte is currently a Managing Partner at Brookfield. Prior to joining Brookfield in 2017, Mr. Turcotte was president and chief executive officer of North Channel Management and North Channel Capital Partners, business consulting and private investing firms, from 2008 to 2017. He was also a member of the board of directors of the general partner of Brookfield Business Partners L.P., an affiliate of Brookfield, from 2016 until he joined Brookfield in 2017. From 2002 to 2008, Mr. Turcotte was the president and CEO and a director of Algoma Steel Inc., a publicly listed North American steel company, and from 1992 to 2002 held a number of senior executive positions with companies in the pulp and paper industry, including president of the paper group and executive vice-president of corporate development and strategy of Tembec Inc., a leading integrated forest products company with operations in North America and France. Since 2012 and 2007, Mr. Turcotte has been a member of the board of directors for Norbord Inc. and Domtar Corporation, respectively. He was previously a member of the board of directors for Coalspur Mines, Ltd. from 2010 to 2015 and Algoma Steel Inc. from 2002 to 2008.
David J. Rintoul became President and CEO and was elected to the board of directors in March 2018. Prior to joining the Company, Mr. Rintoul served as President of U.S. Steel Tubular Products and as a Senior Vice President of United States Steel Corporation (or U.S. Steel). Before that, Mr. Rintoul has served in various roles at U.S. Steel since 2007, including oversight of U.S. Steel's Slovak and Serbian operations. Mr. Rintoul's career in the steel industry spans 38 years with positions at both integrated and mini mill producers in the United States, Europe and Canada, including extensive mini-mill operational experience at North Star Bluescope Steel in Delta, Ohio from 2001 to 2005 and from construction through full operations at Acme Steel Company in Riverdale, Illinois from 1995 to 2001. Mr. Rintoul holds an Associate's degree in Mechanical Engineering Technology from Sault College of Applied Arts and Technology, a Bachelor's degree in Business Administration from Lake Superior State University and a Master's degree in Business Administration from the University of Notre Dame.
134
Jeffrey C. Dutton was elected to the board of directors in 2017. Previously, Mr. Dutton served as President and CEO of the Company from January 2017 until March 2017 and Vice President & Chief Operating Officer of the Company from August 2015 until January 2017. In these roles, Mr. Dutton oversaw all aspects of both the Industrial Materials and Engineered Solutions businesses. Mr. Dutton has served as Senior Vice President of Brookfield since 2013. Brookfield became GrafTech's indirect parent company in August 2015. Mr. Dutton served as the CEO and President of Twin Rivers Paper Company, from 2010 to 2013. Mr. Dutton served in various executive capacities at Fraser Papers Inc. from 2008 to 2010 and as General Manager of East Papers operations at Fraser Papers Inc. from 2006 to 2008. He served as President of Republic Paperboard Company of Eagle Materials Inc. from 2004 to 2006. Mr. Dutton served as a director of Twin Rivers Paper Company in 2013 and has served as a director of the Hammerstone Corporation since 2014. Mr. Dutton received his Bachelor of Science in Mechanical Engineering Technology from the University of Maine.
Ron A. Bloom was elected to the board of directors in February 2017. Since 2016, Mr. Bloom has been a Managing Partner and Vice Chairman at Brookfield, where he focuses on managing the firm's private equity investments. Prior to joining Brookfield in 2016, from 2012 to 2016, Mr. Bloom was Vice Chairman, U.S. Investment Banking, at Lazard, focused on restructurings, and mergers and acquisitions. Prior to joining Lazard, Mr. Bloom served as Assistant to the President for Manufacturing Policy from February 2011 to August 2011 where he provided leadership on policy development and strategic planning for the Administration's agenda to revitalize the manufacturing sector. He led the discussions with the auto industry which resulted in the industry's support for new fuel economy standards. Prior to joining the White House, Mr. Bloom served as Senior Advisor to the Secretary of the Treasury from 2009 to 2011 where he helped lead the restructuring of General Motors and Chrysler LLC, and then led the Treasury's oversight of the companies thereafter, including General Motors' initial public offering. Mr. Bloom received his undergraduate degree from Wesleyan University and graduated with distinction from the Harvard Graduate School of Business Administration.
Quinn J. Coburn became CFO in September 2015. Mr. Coburn served as interim CFO beginning in May 2015 after previously serving as Vice President of Finance and Treasurer. He joined the Company in August 2010 after working at NCR Corporation from December 1992 until August 2010, including service as that company's Vice President and Treasurer. Mr. Coburn graduated with a B.S. in Accounting from Utah State University in 1988. He received an MBA from University of Pennsylvania's The Wharton School in 1992.
Brian L. Acton is expected to be elected to the board of directors immediately following this offering. Mr. Acton has more than 25 years' experience in the mining and bulk materials distribution industry, primarily devoted to marketing coal, petroleum coke and other raw materials. Mr. Acton has extensive experience as a distribution and logistics provider to the coal industry throughout Canada and South America, Asia and Europe. Since August 2013, Mr. Acton has served as President at Pac Basin Resources LLC, a mining and metals company. From July 2010 to June 2013, Mr. Acton served as a consultant to Oxbow Carbon & Minerals Holdings, Inc. From 1996 to 2009, Mr. Acton served as President and COO of Oxbow Carbon and Minerals Holdings, Inc. and as President and Chief Operating Officer at Oxbow Energy Solutions, LLC from 1985 until 2010. Mr. Acton has more than 25 years' experience in the mining and bulk materials distribution industry, primarily devoted to marketing coal, petroleum coke and other raw materials. Mr. Acton has extensive experience as a distribution and logistics provider to the coal industry throughout Canada and South America, Asia and Europe. Mr. Acton served on the board of directors of Adriana Resources Inc. from March 2012 to February 2017. While on the board of directors, Mr. Acton served as Chair of the Compensation Committee from 2012 to 2017 and as a member of the
135
Audit Committee from 2014 to 2017. Mr. Acton is a graduate of Queen's University with both a Bachelors of Science in Mining Engineering and Applied Science and a Masters in Business Administration.
Michel J. Dumas is expected to be elected to the board of directors immediately following this offering. Mr. Dumas has over thirty years of experience in the lumber, pulp and paper industries. From 1997 until 2017, Mr. Dumas served as the Executive Vice President, Finance and Chief Financial Officer of Tembec, Inc., based in Quebec. Mr. Dumas also served on the board of directors of Tembec, Inc. from January 2011 to February 2017 and from July 2001 to September 2008. Mr. Dumas served as a director of Marathon Pulp Inc. from February 2000 to February 2009 and of Jager Building Systems from August 2001 to September 2008. From 1991 to 1997, Mr. Dumas was Vice President, Finance and Chief Financial Officer at Spruce Falls Inc., a newsprint mill. Prior to joining Spruce Falls Inc., from 1985 to 1991, Mr. Dumas served as Controller at Tembec, Inc. Mr. Dumas received his undergraduate degree in Commerce from University of Ottawa.
Anthony R. Taccone is expected to be elected to the board of directors immediately following this offering. Mr. Taccone has over thirty years of experience consulting to companies in the global steel industry and companies with interests in the steel industry, including suppliers, customers and investors. Since March 1998, Mr. Taccone has served as a Founding Partner and co-owner of First River LLC, a boutique strategy consulting firm. While at First River, Mr. Taccone has worked with senior management teams, boards of directors, investors and government agencies on challenging and complex issues facing companies in the steel industry, including financial restructurings, capacity rationalizations, mergers and acquisitions, major capital investment decisions, raw material integration strategies, and investments in downstream businesses. Prior to joining First River, Mr. Taccone was a strategy consultant at Beddows & Company from 1988 to 1998. From 1994 until 1998, Mr. Taccone was the North American practice leader and served on Beddows and Company's Board of Directors. Prior to his career as a steel industry consultant, Mr. Taccone worked as a Country Risk Economist from 1985 to 1987 and an Industry Economist from 1987 to 1988 at Mellon Bank. Mr. Taccone received his undergraduate degree in economics from Washington & Jefferson College and a Masters degree in economics from Duke University.
Board of directors
Our business and affairs are managed under the direction of our board of directors. Under our By-Laws, the number of directors constituting the entire board of directors shall be three, or such other number as may be fixed from time to time by action of the board of directors. Currently, the directors are elected at the annual meeting of the stockholders for one-year terms until their successors are duly elected and qualified. The board of directors currently consists of four members.
In connection with this offering, we intend to adopt the Amended Certificate of Incorporation and the Amended By-Laws. Under our Amended Certificate of Incorporation, the number of directors will be fixed by our board of directors but will not be fewer than three directors. Within one year of the consummation of this offering, our board of directors will consist of eight members.
Our Amended Certificate of Incorporation will provide that our board of directors be divided into three classes of directors, with the classes to be as nearly equal in number as possible, and with the directors serving three-year terms. Only one class of directors will be elected at each annual meeting of our
136
stockholders, with the other classes continuing for the remainder of their respective three-year terms. Our directors will be divided among the three classes as follows:
- •
- the Class I directors will be Denis A. Turcotte and Michel J. Dumas, and their terms will expire at the annual meeting of stockholders
to be held in 2019;
- •
- the Class II directors will be Ron A. Bloom, Brian L. Acton and David J. Rintoul, and their terms will expire at the annual meeting of
stockholders to be held in 2020;
- •
- the Class III directors will be Jeffrey C. Dutton and Anthony R. Taccone and their terms will expire at the annual meeting of stockholders to be held in 2021;
Any increase or decrease in the number of directors will be distributed among the three classes so that, as nearly as possible, each class will consist of one-third of the directors. While Brookfield owns more than 50% of our outstanding common stock, the classification of the board of directors and the other provisions of the Amended Certificate of Incorporation may be amended by the affirmative vote of the holders of a majority of the voting power of our outstanding common stock. After the selling stockholder ceases to own more than 50% of our outstanding common stock, these provisions may be amended only by the affirmative vote of the holders of 662/3% or more of the voting power of our outstanding common stock.
If the total number of shares voted in favor of a director nominee in an uncontested election represents less than a majority of the total shares voted or withheld for such director nominee, the director nominee will tender his or her resignation immediately after the shareholder meeting and our board will determine whether to accept the resignation within 90 days of the shareholder meeting.
We and the selling stockholder intend to enter into a stockholder rights agreement (or the Stockholder Rights Agreement) in connection with this offering. Under the Stockholder Rights Agreement, for so long as the selling stockholder owns or controls at least 25% of our outstanding common stock, the selling stockholder will have the right to nominate the higher of 37.5% of the members of the board of directors and three members of the board of directors (which we refer to as the Brookfield directors), and one Brookfield director will be in each class. The selling stockholder will also have the right to select the chairman of the board of directors. In the event the selling stockholder owns or controls less than 25% of our outstanding common stock, the Brookfield directors will promptly tender their resignations. The board of directors (excluding the Brookfield directors) will have the option, but not the obligation, to accept the Brookfield directors' resignations. If the board of directors (excluding the Brookfield directors) votes to accept these resignations, the Brookfield directors will cease to be members of the board of directors. If the board of directors (excluding the Brookfield directors) votes not to accept these resignations, the Brookfield directors will continue to serve as members of the board of directors until the next annual meeting of our stockholders, regardless of the time remaining in their respective terms of office. The Stockholder Rights Agreement provides that the initial board members designated by the selling stockholder shall be Denis A. Turcotte, Ron A. Bloom and Jeffrey C. Dutton. For more information regarding the Stockholder Rights Agreement, see "Certain Relationships and Related Party Transactions."
Our Amended Certificate of Incorporation will provide that while the selling shareholder owns more than 50% of our outstanding common stock, at any meeting of our board of directors, the presence of (i) a majority of the total number of directors and (ii) one Brookfield director will be required to constitute a quorum. After the selling shareholder ceases to own more than 50% of our outstanding common stock, the presence of a majority of the total number of directors will be required to constitute a quorum.
137
Director independence
Because the selling stockholder will own a majority of our outstanding common stock following the completion of this offering, we will be a "controlled company" as that term is set forth in the NYSE corporate governance standards. Under these rules, a "controlled company" may elect not to comply with certain corporate governance requirements, including: (i) the requirement that a majority of our board of directors consist of independent directors, (ii) the requirement that our governance committee be composed entirely of independent directors with a written charter addressing the committee's purpose and responsibilities, and (iii) the requirement that our compensation committee be composed entirely of independent directors with a written charter addressing the committee's purpose and responsibilities.
However, as a "controlled company," we must comply with the rules applicable to audit committees set forth in the NYSE corporate governance standards. We intend for all three members of our audit committee to be independent upon the consummation of this offering.
Within one year of the consummation of this offering, our board will consist of eight members, four of whom will qualify as "independent" under the NYSE listing standards. At the time of the consummation of this offering, three members of the board of directors will qualify as "independent" under the NYSE listing standards. Our board of directors has undertaken a review of the independence of each director. Based on information provided by each director concerning his or her background, employment and affiliations, our board of directors has determined that Michel J. Dumas, Brian L. Acton and Anthony R. Taccone do not have a relationship that would interfere with the exercise of independent judgment in carrying out the responsibilities of a director and that each of these directors is "independent" as that term is defined under the listing standards of the NYSE. In making these determinations, our board of directors considered the current and prior relationships that each director has with our Company and all other facts and circumstances our board of directors deemed relevant in determining their independence, including the beneficial ownership of our capital stock by each director, and the transactions involving them described in "—Director Compensation" and "Certain Relationships and Related Party Transactions."
Committees of the board of directors
The board of directors intends to establish two standing committees to assist it in carrying out its responsibilities: the audit committee and the governance and compensation committee. In the event the Company ceases to be a "controlled company" pursuant to the NYSE corporate governance standards, the board of directors will establish a separate nominating and governance committee and a compensation committee. Each of the committees will operate under its own written charter adopted by the board of directors. The membership and the function of each of the committees are described below.
Audit committee
The audit committee:
- •
- appoints the independent auditor annually; monitors the quality of the work of the independent auditor, monitors their independence and replaces them as necessary in the sole judgment of the committee; pre-approves the audit plan (including services relating to internal controls over financial reporting), any proposed audit-related, tax and other services and pre-approves all related compensation; reviews with the auditor the results of the annual audit; reviews with the auditor any review of the quarterly financial statements that the committee may direct the auditor to perform;
138
- •
- approves the annual corporate audit services plan and budget; reviews with the senior corporate audit services executive the results of the
audit work at least annually and more frequently as provided in the policy for reporting financial accounting and auditing concerns, as approved by the committee; at least annually reviews the
performance of the corporate audit services team;
- •
- reviews and discusses with management and the independent auditor the annual audited financial statements and the adequacy of the internal
controls over financial reporting;
- •
- discusses with management and the independent auditor significant financial reporting issues and judgments made in connection with the
preparation of our financial statements, including any significant changes in our selection or application of accounting principles, any significant issues (material weaknesses or significant
deficiencies as such terms are defined in the Sarbanes-Oxley Act) as to the adequacy of our accounting controls and any remediation used in connection with any such issues;
- •
- oversees company policies and practices with respect to financial risk assessment and risk management; and
- •
- regularly reports its work to the board.
Immediately following the consummation of this offering, the members of the audit committee will be Michel J. Dumas (Chair), Brian L. Acton and Anthony R. Taccone. Our board of directors has determined that (i) Michel J. Dumas, Brian L. Acton and Anthony R. Taccone will be independent directors, (ii) each director appointed to the audit committee is financially literate and (iii) Michel J. Dumas is our audit committee financial expert. Our audit committee will operate under a written charter, to be effective prior to the consummation of this offering, that satisfies the applicable rules of the SEC and the NYSE listing standards.
Governance and compensation committee
The governance and compensation committee:
- •
- recommends to the board principles of corporate governance applicable to us;
- •
- oversees the processes established by management regarding compliance with legal and regulatory requirements and ethical programs and policies
as established by management and the board, including without limitation, our Code of Conduct and Ethics, our compliance program and our regulatory and quality compliance initiatives; and oversees
management's establishment of a process for reporting these matters to the audit committee, other board committees or the full board as appropriate;
- •
- receives regular reports from our general counsel regarding material legal disputes and matters in litigation;
- •
- reviews and makes recommendations to the board regarding the size and structure of the board and the committees of the board;
- •
- determines the process for the annual self-assessments of the board and its committees and oversees the implementation and reporting back of
the results;
- •
- reviews and makes recommendations to the board regarding leadership and membership of committees of the board;
- •
- develops and administers the process and criteria for selecting new directors and nominees for vacancies on the board and candidates for board membership;
139
- •
- with advice of outside counsel, (a) establishes a process for overseeing potential conflicts of interest between the company and
directors and the company and members of management, and (b) considers at least annually the independence of directors;
- •
- regularly reports its activities to the board;
- •
- recommends to the board of directors remuneration of the chief executive officer and determines remuneration of our other officers elected by
the board of directors;
- •
- conducts evaluation of the chief executive officer for submission to the board of directors;
- •
- grants options under and otherwise administers our stock incentive plans and approves and administers any other compensation plan in which our
officers participate;
- •
- reviews succession planning for the chief executive officer and senior executives, and reports on such matters to the board of directors;
- •
- retains compensation consultants and obtains advice from internal or external advisors, as necessary;
- •
- presents the annual Compensation Committee Report on Executive Compensation for our proxy statement; and
- •
- reviews its own performance annually.
The governance and compensation committee will consist of three directors, two of whom will qualify as "independent" under the NYSE listing standards and one of whom will be appointed by Brookfield. In the event the Company ceases to be a "controlled company" pursuant to the NYSE corporate governance standards, the board of directors will establish a separate nominating and governance committee and a compensation committee. Each such committee will consist of three directors, each of whom will qualify as "independent" under the NYSE listing standards.
The members of the governance and compensation committee will be Denis A. Turcotte (chair), Brian L. Acton and Anthony R. Taccone. Our board of directors has determined that Brian L. Acton and Anthony R. Taccone will be independent directors. Our governance and compensation committee will operate under a written charter, to be effective upon the consummation of this offering, that satisfies the applicable rules of the SEC and the NYSE listing standards.
Governance and compensation committee interlocks and insider participation
None.
Code of conduct and ethics
Our board of directors has adopted a code of conduct and ethics applicable to our employees, directors and officers, in accordance with applicable U.S. federal securities laws and the corporate governance rules of the. Any waiver of this code may be made only by our board of directors and will be promptly disclosed as required by applicable U.S. federal securities laws and the corporate governance rules of the NYSE.
140
Leadership Changes
On January 31, 2018, the Company announced that David J. Rintoul will join the Company as President and CEO of the Company, effective March 1, 2018, replacing Jeffrey C. Dutton. Mr. Dutton continues to serve as a director on the Company's Board of Directors and Mr. Rintoul was elected a director, effective March 1, 2018.
On March 1, 2018, the Company and Mr. Rintoul entered into an employment agreement that governs the terms and conditions of his employment as President and CEO of the Company (or the Agreement). The Agreement provides that Mr. Rintoul is entitled to an annual base salary of $625,000 and will participate in the Company's short-term incentive plan (with a target bonus of 100% of base salary). The Agreement also provides that Mr. Rintoul will receive a one-time grant of stock options (or the Options) to purchase shares pursuant to an equity plan to be adopted by the Company (as described below), with a value on the date of grant equal to ten times his annual base salary. The Agreement provides that the Options will vest ratably over the five year period following the date of grant, subject to acceleration under certain circumstances. In addition, Mr. Rintoul will be eligible to participate in Company-sponsored benefits, including health benefits, a 401(k) plan (including a 4% Company cash match on eligible employee contributions and a defined contribution retirement plan (with a 1% contribution on eligible earnings). The Company will reimburse Mr. Rintoul for reasonable expenses relating to his relocation, as well as up to $75,000 for losses associated with the sale of his home.
In the event that Mr. Rintoul's employment is terminated by Mr. Rintoul for "Good Reason" (as defined in the Agreement) or by the Company for a reason other than "Cause" (as defined in the Agreement) or Mr. Rintoul's death or disability, the Company will pay Mr. Rintoul his base salary for one year plus annual bonus, subject to his execution of a release agreement. The Agreement provides that Mr. Rintoul is subject to non-compete and non-solicitation covenants during his employment and for a period of two years following termination of his employment, as well as a non-disparagement covenant.
Named executive officers
We are currently considered an emerging growth company for purposes of the SEC's executive compensation disclosure rules. Accordingly, our compensation disclosure obligations are more limited and extend only to any individual serving as our chief executive officer, our two other most highly compensated executive officers at the end of the 2017 fiscal year and two additional individuals for whom disclosure would have been provided but for the fact that the individuals were not serving as executive officers as of the end of the 2017 fiscal year. During 2017, our named executive officers were:
- •
- Joel L. Hawthorne, former President and Chief Executive Officer;
- •
- Jeffrey C. Dutton, former President and Chief Executive Officer;
- •
- Quinn J. Coburn, Vice President, CFO and Treasurer;
- •
- Darrell A. Blair, former President—Industrial Materials; and
- •
- Lionel D. Batty, former President—Engineered Solutions
141
Summary compensation table
| |
| |
| |
| |
| |
| |
| |||||
|---|---|---|---|---|---|---|---|---|---|---|---|---|---|---|---|---|
| | | | | | | | | | | | | |||||
| Name and principal position |
| Year |
|
Salary($) |
|
Bonus($) |
| All other compensation(6)($) |
|
Total($) |
| |||||
| | | | | | | | | | | | | |||||
Joel L. Hawthorne |
| 2017 | | 138,204 | | — | | 2,973,534 | | 3,111,738 | | |||||
Former President and CEO(1) |
| 2016 | | 700,000 | | — | | 14,443 | | 714,443 | | |||||
Jeffrey C. Dutton |
| 2017 |
| 425,000 |
| — |
| 44,680 |
| 469,680 |
| |||||
Former President and CEO(2) |
| 2016 | | 410,000 | | — | | 41,574 | | 451,574 | | |||||
Quinn Coburn |
| 2017 |
| 360,000 |
| 402,480 |
| 16,451 |
| 778,931 |
| |||||
Vice President, CFO and Treasurer |
| 2016 | | 360,000 | | 73,710 | | 14,548 | | 448,528 | | |||||
Darrell A. Blair |
| 2017 |
| 67,002 |
| — |
| 1,458,860 |
| 1,525,862 |
| |||||
Former President, Industrial Materials(3)(4) |
| 2016 | | 394,400 | | 73,061 | | 61,504 | | 528,965 | | |||||
Lionel D. Batty |
| 2017 |
| 37,500 |
| — |
| 1,039,786 |
| 1,077,286 |
| |||||
Former President, Engineered Solutions(5) |
| 2016 | | 300,000 | | 57,050 | | 11,543 | | 368,593 | | |||||
| | | | | | | | | | | | | |||||
(1) Mr. Hawthorne submitted his resignation on January 11, 2017, effective as of March 12, 2017.
(2) Mr. Dutton served as the Company's Vice President and Chief Operating Officer until January 11, 2017. On January 11, 2017, our board of directors appointed Mr. Dutton as Mr. Hawthorne's successor as President and CEO, effective that same date. Mr. Dutton served as President and CEO until March 1, 2018. He was employed by an affiliate of GrafTech's parent company, BAM. GrafTech reimbursed BAM for his salary, housing and transportation expenses and 401(k) savings plan matching contributions.
(3) Mr. Blair submitted his resignation in January 2017, which was effective as of February 28, 2017.
(4) The exchange rate for Swiss Franc:USD for Mr. Blair = 1:1.
(5) Mr. Batty submitted his resignation in January 2017, which was effective as of February 15, 2017.
(6) For 2017, all other compensation for Mr. Hawthorne includes $5,528 in matching contributions and a $1,382 contribution to the Company's retirement savings plan (or the Savings Plan); $136 in disability insurance premiums under the Company's long term disability insurance plan; a $250 employer contribution to his Health Savings Account; and the following amounts pursuant to his Severance Agreement (as defined below): $136,220 in accrued ICP award for 2017, $2,800,000 in severance, $10,768 in unused vacation and $19,248 for benefit continuation. For 2016, all other compensation for Mr. Hawthorne includes $10,000 in matching contributions and a $2,650 contribution to the Savings Plan and $1,793 in life insurance premiums under the Company's group life insurance plan.
For 2017, all other compensation for Mr. Dutton includes $13,500 in matching contributions to a Brookfield 401(k) savings plan and $31,180 for housing and transportation expenses. For 2016, all other compensation for Mr. Dutton, includes $13,250 in matching contributions to a Brookfield 401k savings plan and $28,324 for housing and transportation expenses.
For 2017, all other compensation for Mr. Coburn includes $10,800 in matching contributions and a $2,700 contribution to the Savings Plan; $664 in disability insurance premiums under the Company's long term disability insurance plan; a $1,430 employer contribution to his Health Savings Account; and $855 in life insurance premiums under the Company's group life insurance plan. For 2016, all other compensation for Mr. Coburn includes $10,600 in matching contributions and a $3,093 contribution to the Savings Plan and $855 in life insurance premiums under the Company's group life insurance plan.
For 2017, all other compensation for Mr. Blair includes $9,239 in matching contributions to the Swiss Pension Plan (as defined below); $3,507 in Company contributions to the GrafTech Switzerland medical plan; $2,336 in insurance premiums under the GrafTech Switzerland group life insurance plan; $23,262 for third party income tax preparation and relocation including gross-up; and the following amounts pursuant to his Severance Agreement (as defined below): $42,237 in accrued ICP award for 2017, $1,326,600 in severance, $15,155 in unused vacation, and $36,524 for benefit continuation. For 2016, all other compensation for Mr. Blair includes $43,949 in relocation benefits and associated gross-up, $8,856 for non-resident taxes and associated gross-up, $5,638 in payments to third parties and associated gross-up and $3,061 in contributions in Company contributions to the GrafTech Switzerland medical plan.
For 2017, all other compensation for Mr. Batty includes $2,670 in matching contributions and a $667 contribution to the Savings Plan; $81 in disability insurance premiums under the Company's long term disability insurance plan; a $340 employer contribution to his Health Savings Account; and the following amounts pursuant to his Severance Agreement (as defined below): $24,589 in accrued ICP award for 2017, $990,000 in severance, $3,461 in unused vacation and $17,975 for benefit continuation. For 2016, all other compensation for Mr. Batty, includes $6,500 in matching contributions and a $3,053 contribution to the Savings Plan and $1,828 in life insurance premiums under the Company's group life insurance plan and $162 for a gift card and associated gross-up.
Outstanding equity awards at fiscal year-end
No equity awards were outstanding as of the end of the fiscal year.
142
Narrative disclosure to summary compensation table and other compensation arrangements
We have designed an annual compensation program for our named executive officers that is driven by our strategic goals with the primary emphasis on paying for performance. Our 2017 executive compensation program consisted of two elements: competitive base salary and pay for performance through an annual cash incentive program. Certain of our executives also receive retirement and other customary welfare benefits and participate in certain severance and change in control arrangements.
Base salary
Base salaries for our named executive officers during 2017 were generally set at levels to value the competencies, skills, experiences and performance of individual executives and are intended to attract and retain executive talent by providing a fixed level of compensation that is financially stable and not "at risk."
Executive incentive compensation (or ICP)
The ICP provides competitive incentives to executive officers by having a portion of their annual cash compensation dependent upon annual performance and "at risk" and motivates and rewards executives for the achievement of targeted financial and individual performance. For 2017, the financial measure was EBITDA of the total Company (70%) and 30% was based on individual performance.
Retirement plan
We previously froze our defined benefit plans, including the GrafTech International Holdings Inc. Retirement Plan (or the Retirement Plan), and no additional benefits are accruing under the plans, although benefits previously accrued under the Retirement Plan will still be payable from the Retirement Plan when due. Messrs. Hawthorne, Blair and Batty are participants in the Retirement Plan. Mr. Hawthorne has two years of credited service with us through December 31, 2001, which is the date on which non-grandfathered participants ceased accruing benefits and had their benefit accruals frozen. Mr. Blair and Mr. Batty have 22 years and 20 years, respectively, of credited service with us through March 31, 2003, which is the date on which grandfathered participants ceased accruing benefits and had their benefit accruals frozen.
Savings plan
All of our regular, full-time U.S. employees, including eligible named executive officers, are eligible to participate in our Savings Plan. Assets in the Savings Plan are held in five types of accounts: an after-tax account to which participants may make contributions on an after-tax basis; a before-tax account to which participants may make contributions on a pre-tax basis; a Company contribution account to which matching contributions are allocated; an employer contribution account to which certain additional Company contributions are allocated; and a Roth 401(k) after-tax account to which participants may make contributions on an after-tax basis. The maximum employee contribution (pre-tax and after-tax combined) for any year for any participant is 50.0% of such participant's compensation (subject to statutory limits).
We make a matching contribution to the Savings Plan for each participant who elects to contribute to the Savings Plan. The matching contribution is 100% of the first 3% of compensation and 50% of the next 2% of compensation that a participant contributes. Matching contributions under the Savings Plan are fully vested at all times. In addition to matching contributions, we make employer contributions to the Savings Plan each year equal to 1% of a participant's eligible compensation. A participant becomes vested in these employer contributions to the Savings Plan once he or she has completed three years of service.
143
Contributions to the Savings Plan are invested, as the employee directs, in various funds offered under the Savings Plan from time to time. Amounts invested under the Savings Plan may be switched into another investment option at any time. The account balances of participants reflect both their contributions and our contributions as well as the investment performance of the investments in which those amounts are invested. Distributions of account balances from the Savings Plan are generally made upon retirement or other termination of employment, unless deferred by the participant.
Swiss pension plan
GrafTech Switzerland S.A offers a cash balance pension plan (or the Swiss Pension Plan) into which employees and the Company contribute for retirement purposes according to an age-based contribution scale. Standard employee contributions range from 4.0% to 5.8% of salary and company contributions range from 6.0% to 8.7% of salary. Employees have the option to make an annual election of 2.0% to 2.9% to the Swiss Pension Plan and additional employee contribution rates are also age-based. Administration and investment management is the responsibility of Banque Cantonale Vaudoise (or BCV). At retirement, employees may transfer their Swiss Pension Plan balance to a qualified individual retirement account.
Non-qualified deferred compensation
The named executive officers, with the exception of Mr. Dutton, all participate in our non-qualified deferred compensation plan (or the Compensation Deferral Plan). Under the Compensation Deferral Plan, participants are able to defer up to 85% of their ICP compensation and up to 50% of their base salary. The Company ceased making contributions to the Compensation Deferral Plan as of October 16, 2014.
Deferrals and contributions to our Compensation Deferral Plan are credited with a rate of return based on the performance of various funds selected by the participants from indices which are designated by the Plan Administrator. An employee may prospectively change the funds for crediting rates of return at any time. The account balances of participants are credited with both their deferrals, as well as the rate of return on the funds selected by the participants for those amounts. Frozen Lump Sums and their earnings are held in notional investment accounts selected by the employee.
Distributions of account balances from the Compensation Deferral Plan are generally made in January following retirement or other termination of employment or, if elected by the participant, upon a future date specified by the participant, except that Frozen Lump Sums and GrafTech allocations may not be distributed prior to age 50. Participants may also elect to have their account balances distributed upon a change in control of GrafTech. The Compensation Deferral Plan is intended to comply with Section 409A of the Code governing deferred compensation arrangements except that amounts that were contributed to the Compensation Deferral Plan and fully vested by December 31, 2004, including all of the Frozen Lump Sums, are not subject to the restrictions of Section 409A. Amounts under the Compensation Deferral Plan are generally payable in a lump sum, although participants may elect to have their accounts payable in annual installments instead.
Double-trigger change in control agreements
Each named executive officer, other than Mr. Dutton, entered into a double-trigger Severance Agreement (or the Severance Agreement) with us that applies only when there is (i) a change in control of the Company and (ii) the executive's employment is terminated in connection with or within two years (for Messrs. Hawthorne and Batty) or three years (for Messrs. Blair and Coburn) following such change in control. Both a change in control of the Company and corresponding executive termination must occur to
144
trigger payment of the benefits under the Severance Agreement. A change in control occurred under the Severance Agreements on August 11, 2015.
On January 11, 2017, Mr. Hawthorne submitted his Good Reason for Resignation, as defined in his July 13, 2000 Severance Agreement, as amended, to our board of directors. Mr. Hawthorne's resignation was accepted and March 12, 2017 was agreed upon as the date of termination of his GrafTech employment. Settlement of Mr. Hawthorne's accrued compensation, severance and benefit continuation was made in accordance with his Severance Agreement.
In January, 2017, Mr. Blair submitted his Good Reason for Resignation, as defined in his March 16, 2015 Severance Agreement, as amended, to our board of directors. Mr. Blair's resignation was accepted and February 28, 2017 was agreed upon as the date of termination of his GrafTech employment. Settlement of Mr. Blair's accrued compensation, severance and benefit continuation was made in accordance with his Severance Agreement.
In January, 2017, Mr. Batty submitted his Good Reason for Resignation, as defined in his July 13, 2000 Severance Agreement, as amended, to our board of directors. Mr. Batty's resignation was accepted and February 15, 2017 was agreed upon as the date of termination of his GrafTech employment. Settlement of Mr. Batty's accrued compensation, severance and benefit continuation will be made in accordance with his Severance Agreement.
Under the Severance Agreements, upon termination by the executive for Good Reason for Resignation (as such term is defined in each Severance Agreement), each of Messrs. Hawthorne, Blair and Batty was entitled to the following benefits: accrued salary and vacation pay through the date of termination; accrued ICP compensation at target for the prior year if not previously paid plus a prorated portion of the targeted ICP compensation for the year of termination; a severance payment equal to 2.0 multiplied by the sum of the following amounts: (X) the greater of his annual base salary immediately prior to the date of termination or immediately prior to the change in control; plus (Y) the greater of the amount of his target ICP for the year in which the date of termination occurs or for the year in which the change in control occurs; extended health, life and disability coverage; and with respect to Mr. Hawthorne and Mr. Batty, reimbursement for certain excise tax liabilities (and income tax liabilities attributable to the excise tax reimbursement) if the total severance equals or exceeds three times the executive's "base amount" (as determined pursuant to Section 280G of the Code) by more than $50,000.
Under Mr. Coburn's Severance Agreement, if his employment is terminated due to a Termination for Cause or by him other than with Good Reason for Resignation, upon death or due to Disability or Retirement (as such terms are defined in his Severance Agreement), he will be paid his full base salary and accrued vacation pay through the date of termination, plus any benefits or awards which have been earned or become payable but which have not yet been paid. If his employment is terminated due to Retirement (as such term is defined in his Severance Agreement) or death, his benefits will be determined in accordance with GrafTech's retirement and insurance programs then in effect.
Under Mr. Coburn's Severance Agreement, upon termination following a change in control, he is entitled to certain benefits. If his employment is terminated within the three-year period following a change in control (a) by GrafTech other than for Retirement, death, Disability or Termination for Cause or (b) by him for Good Reason for Resignation, then Mr. Coburn is entitled to the following benefits: accrued salary and vacation pay through the date of termination; accrued ICP compensation at target for the prior year if not previously paid plus a prorated portion of the targeted ICP compensation for the year of termination; a severance payment equal to 2.0 multiplied by the sum of the following amounts: (X) the greater of his
145
annual base salary immediately prior to the date of termination or immediately prior to the change in control; plus (Y) the greater of the amount of his target ICP for the year in which the date of termination occurs or for the year in which the change in control occurs; and extended health, life and disability coverage; minus (Z) the amount of any severance payment or the value of any severance benefit received by the executive from the Company pursuant to a Company plan or policy or agreement with the Company.
During any period prior to the date of termination that Mr. Coburn becomes Disabled, he will continue to receive his base salary at the rate in effect at the commencement of the Disability period, together with all other compensation and benefits that are payable or provided under GrafTech's benefit plans, including its disability plans. After the date of termination for Disability, his benefits shall be determined in accordance with the Retirement Plan and the disability, benefit, insurance and other applicable plans of GrafTech. The compensation and benefits, other than salary and payments under the Retirement Plan, payable or provided under his Severance Agreement by reason of a Disability will be the greater of (x) the amounts computed under the disability, benefit, insurance and other applicable plans in effect immediately prior to a change in control and (y) the amounts computed under the disability, benefit, insurance and other applicable plans in effect at the time the compensation and benefits are paid.
Under Mr. Coburn's Severance Agreement, "Good Reason for Resignation" includes certain changes in his status or position, reductions in the level of reporting responsibility, diminution of duties or responsibilities, reductions in compensation or benefits, relocation, failure of a successor to assume the severance agreement, and failure to pay certain earned compensation.
LTIP
Mr. Coburn is the only named executive officer who participates in the GrafTech International Ltd. Long Term Incentive Plan (or the LTIP). The LTIP provides incentives by awarding certain executive officers up to a maximum of 30,000 profits units (or Profits Units). Awards of Profits Units generally vest in equal increments over a five-year period beginning on the first anniversary of the grant date and subject to continued employment with the Company through each vesting date. Any unvested Profit Units that have not been previously forfeited will accelerate and become fully vested upon a "Change in Control" (as defined below).
Profit Units will generally be settled in a lump sum payment within 30 days following a Change in Control based on the "Sales Proceeds" (as defined below) received by Brookfield Capital Partners IV, L.P. (or, together with its affiliates, Brookfield Capital IV) in connection with the Change in Control. The LTIP defines "Change in Control" as any transaction or series of transactions (including, without limitation, the consummation of a combination, share purchases, recapitalization, redemption, issuance of capital stock, consolidation, reorganization or otherwise) pursuant to which (a) a Person not affiliated with Brookfield Capital IV acquires securities representing more than seventy percent (70%) of the combined voting power of the outstanding voting securities of the Company or the entity surviving or resulting from such transaction, (b) following a public offering of the Company's stock, Brookfield Capital IV has ceased to have a beneficial ownership interest in at least 30% of the Company's outstanding voting securities (effective on the first of such date), or (c) the Company sells all or substantially all of the assets of the Company and its subsidiaries on a consolidated basis. It is intended that the occurrence of a Change in Control in which Sales Proceeds exceed the Threshold Value would constitute a "substantial risk of forfeiture" within the meaning of Section 409A of the Code. The LTIP defines "Threshold Value" as of any date of determination, an amount equal to $855,000,000, (which represents the amount of the total invested capital of Brookfield Capital IV as of August 17, 2015), plus the dollar value of any cash or other consideration contributed to or invested in the Company by Brookfield Capital IV after August 17, 2015. The Threshold Value shall be
146
determined by the board in its sole discretion. The LTIP defines "Sales Proceeds" as, as of any date of determination, the sum of all proceeds actually received by the Brookfield Capital IV, net of all Sales Costs (as defined below), (i) as consideration (whether cash or equity) upon the Change in Control and (ii) as distributions, dividends, repurchases, redemptions or otherwise as a holder of such equity interests in the Company. Proceeds that are not paid upon or prior to or in connection with the Change in Control, including earn-outs, escrows and other contingent or deferred consideration shall become "Sale Proceeds" only as and when such proceeds are received by Brookfield Capital IV. "Sales Costs" means any costs or expenses (including legal or other advisor costs), fees (including investment banking fees), commissions or discounts payable directly by Brookfield Capital IV in connection with, arising out of or relating to a Change in Control, as determined by the board in its sole discretion. The IPO does not constitute a Change in Control as defined in the LTIP.
Equity Incentive Plan
Our board of directors intends to adopt an Omnibus Equity Incentive Plan (or the Equity Plan) pursuant to which eligible employees, non-employee directors, consultants, and other selected service providers of the Company may receive options (both incentive stock options and nonqualified options) or other stock-based awards. The board believes that equity awards will allow us to attract and retain the key talent needed to effectively compete in our industry, incentivize superior results and long-term value creation, and align the interests of our employees with those of our shareholders. A committee of directors appointed by the board shall have full discretionary authority to administer the Equity Plan, including discretionary authority to interpret and construe any and all provisions of the Equity Plan and any award agreement thereunder, and all decisions of the committee shall be final, binding, and conclusive on all parties.
The committee may set vesting terms of awards, accelerate the vesting, exercisability, or transferability of any awards, as applicable, extend the term of any awards, waive any conditions to vesting, exercisability, or transferability of any awards, as applicable, or provide for the payment of dividends or dividend equivalents with respect to any such award; provided however, that no stock options will be repriced without the approval of the shareholders of the Company. Options shall be granted at a price equal to at least one-hundred percent of fair market value of a share of common stock on the date on which such option is granted (other than in the case of certain corporate transactions). The committee may grant other equity-based or equity-related awards pursuant to the Equity Plan that may (i) involve the transfer of actual shares of common stock to participants, either at the time of grant or thereafter, or payment in cash or otherwise of amounts based on the value of shares of common stock, (ii) be subject to performance-based and/or service-based conditions, (iii) be in the form of stock appreciation rights, phantom stock, restricted stock, restricted stock units, performance shares, deferred share units, or share-denominated units, (iv) provide for dividends or dividend equivalents, and (v) be designed to comply with applicable laws of jurisdictions other than the United States; provided, that each such other equity-based or equity-related award shall be denominated in, or shall have a value determined by reference to, a number of shares of common stock that is specified at the time of the grant of such award.
The Equity Plan will reserve shares of the Company's common stock for issuance of awards. Shares withheld in satisfaction of tax withholding obligations or the exercise of an award and shares underlying such awards that are cash-settled will not return to the share reserve. If shares of common stock are issued which may result in forfeiture, cancellation, or return of such shares of the Company, any portion of the shares forfeited, cancelled, or returned shall be treated as not issued pursuant to the Equity Plan. The terms of the awards (including vesting) shall be approved by the committee as evidenced in award agreements. The consequences of a change in control, if any, and of a participant's termination of employment will be set forth in such participant's applicable award agreement.
147
The Equity Plan will include provisions for adjustment of shares reserved under the plan and of outstanding awards in the event of certain corporate changes. The term of the Equity Plan will be ten years from its effective date. The Equity Plan and any award agreements may be amended, suspended or terminated at any time by the board, provided that if such revisions or amendments require shareholder approval, such revisions or amendments will not be effective without such approval, and provided further, no such revision or amendment may adversely affect a participant's rights under any previously granted and outstanding award without such participant's consent.
Restrictive covenants
In 2014, the Company granted each of the named executive officers, other than Mr. Dutton, certain equity awards pursuant to the Company's Equity Incentive Plan Award Agreement (or the Award Agreement). Pursuant to the Award Agreements, each such named executive officer is subject to non-competition and non-solicitation covenants set forth in his Award Agreement beginning on the effective date of the Award Agreement and continuing for a period of two years following his voluntary termination of employment with the Company or certain events of involuntary termination of employment. GrafTech subsequently waived the second year of the restrictive covenant period for Mr. Blair; therefore, his non-competition and non-solicitation covenants expire on the first anniversary of the date of his termination of employment. The non-competition covenant provides that he will not, without the Company's prior written consent, engage in (a) the business of manufacturing, distributing, selling or providing needle coke and/or carbon or graphite products, services, material or equipment of the kind or type which are the same as or similar to those manufactured, distributed, sold or provided by GrafTech as of the date of termination or at any time while he was an employee of GrafTech, or (b) any other business in which GrafTech directly or indirectly engaged as of the date of termination or at any time while he was an employee of GrafTech. The non-competition covenant applies in any state, country, possession, or territory in which GrafTech directly or indirectly has offices, operations, customers or otherwise conducts business or planned to conduct business during his employment.
Release Agreements
The Company entered into a Settlement Agreement and Release with each of Mr. Hawthorne and Mr. Blair on January 8, 2018 and January 25, 2018, respectively, (each of which we refer to as a Release Agreement), pursuant to which the Company agreed to pay each of Messrs. Hawthorne and Blair cash consideration in exchange for a mutual release of all claims relating to their employment with the Company and termination of such employment, as well as a covenant not to sue. In addition, pursuant to the Release Agreements, Mr. Hawthorne and certain individuals employed by the Company are subject to a mutual non-disparagement covenant and Mr. Blair is subject to a non-disparagement covenant.
Director compensation
Non-employee director J. Peter Gordon did not receive any compensation from GrafTech for his services in 2017.
Non-employee director Denis Turcotte received $56,250 in meeting fees, plus reimbursement for travel expenses and incidentals, for his service in 2017.
Following the IPO, the Company intends to compensate its non-employee directors with an annual retainer of $125,000, payable in equal installments at the end of each quarter. All out-of-pocket business travel and accommodation expenses will be reimbursed. The audit committee chair will also receive an additional retainer of $15,000. Independent directors will be required, within five years of joining the board, to
148
acquire shares or share equivalents in the Company having a value equal to at least three times the then annual retainer ($375,000 initially), in the aggregate. Prior to achieving this, independent directors will receive fifty percent of their annual retainer in deferred share units (or DSUs), which will be fully vested upon grant. DSUs will count towards the minimum holding requirement. After achieving the threshold, there will not be any further requirement for independent directors to receive their compensation in the form of additional DSUs; however, the share ownership threshold test will be calculated each year in December and in the event that an independent director who previously met the threshold no longer does, that director will need to acquire more common shares or to elect to receive a portion of his or her annual retainer in DSUs for the following year in order to satisfy the minimum share ownership test by the following December.
149
Certain relationships and related party transactions
Under SEC rules, a related person is an officer, director, nominee for director or beneficial holder of more than 5% of any class of our voting securities since the beginning of the last fiscal year or an immediate family member of any of the foregoing. Our board of directors will approve a written related party transaction policy that will take effect prior to completion of this offering. Pursuant to this policy, directors (including director nominees), executive officers and employees are required to report to any transactions or circumstances that may create or appear to create a conflict between the personal interests of the individual and our interests, regardless of the amount involved. reports these transactions to the committee of the board of directors, which is responsible for evaluating each related party transaction and making a recommendation to the disinterested members of the board of directors as to whether the transaction at issue is fair, reasonable and within our policy and whether it should be ratified and approved. The committee, in making its recommendation, considers various factors, including the benefit of the transaction to us, the terms of the transaction and whether they are at arm's-length and in the ordinary course of our business, the direct or indirect nature of the related person's interest in the transaction, the size and expected term of the transaction, and other facts and circumstances that bear on the materiality of the related party transaction under applicable law and listing standards.
Other than compensation agreements and other arrangements which are described under "Executive Compensation" and the transactions described below, since January 1, 2014, there has not been, and there is not currently proposed, any transaction or series of similar transactions to which we were or will be a party in which the amount involved exceeded or will exceed $120,000 and in which any related person had or will have a direct or indirect material interest.
During 2016, an affiliate of Brookfield purchased on the open market in aggregate approximately $53 million of our traded Senior Notes.
During 2016, an affiliate of Brookfield provided relocation services to us, totaling $394,275. During 2017, that same affiliate has provided additional relocation services, totaling $275,197.
Registration Rights Agreement
We and the selling stockholder intend to enter into a new registration rights agreement (or the Registration Rights Agreement) in connection with this offering. The Registration Rights Agreement will provide the selling stockholder with certain demand registration rights, including shelf registration rights, in respect of any shares of our common stock or any of our debt securities held by it, subject to certain conditions and limitations. The selling stockholder will be entitled to a limited number of demand registrations. In addition, in the event that we register additional shares of common stock or debt securities for sale to the public following the completion of this offering, we will be required to give notice of such registration to the selling stockholder of our intention to effect such a registration, and, subject to certain limitations, include any shares of common stock or debt securities requested to be included in such registration held by it. We will be required to bear the registration expenses, other than underwriting discounts and commissions, associated with any registration of shares of common stock or debt securities pursuant to the Registration Rights Agreement. The agreement will include customary indemnification provisions in favor of the selling stockholder, its affiliates, directors and officers against certain losses and liabilities (including reasonable legal expenses) resulting from any untrue statement or omission of material fact in any registration statement or prospectus pursuant to which the selling stockholder sells shares of our common stock or our debt securities, unless such liability arose from the selling stockholder's
150
misstatement or omission and the selling stockholder has agreed to indemnify us against losses caused by its misstatements or omissions, subject to certain limitations.
Stockholder Rights Agreement
We and the selling stockholder intend to enter into the Stockholder Rights Agreement in connection with this offering. Under the Stockholder Rights Agreement, for so long as the selling stockholder owns or controls at least 25% of our outstanding common stock, the selling stockholder will have the right to nominate the higher of 37.5% of the members of the board of directors and three members of the board of directors. The selling stockholder will also have the right to select the chairman of the board of directors. In the event the selling stockholder owns or controls less than 25% of the Company, the Brookfield directors will promptly tender their resignations. The board of directors (excluding the Brookfield directors) will have the option, but not the obligation, to accept the Brookfield directors' resignations. If the board of directors (excluding the Brookfield directors) votes to accept these resignations, the Brookfield directors will cease to be members of the board of directors. If the board of directors (excluding the Brookfield directors) votes not to accept these resignations, the directors will continue to serve as members of the board of directors until the next annual meeting of our stockholders, regardless of the time remaining in their respective terms of office. The Stockholder Rights Agreement provides that the initial board members designated by the selling stockholder shall be Denis A. Turcotte, Ron A. Bloom and Jeffrey C. Dutton.
Tax Receivable Agreement
We and the selling stockholder intend to enter into the TRA in connection with this offering. The TRA will provide the right to receive future payments from us to the Existing Stockholders of 85% of the amount of cash savings, if any, in U.S. federal income tax and Swiss tax that we and our subsidiaries realize as a result of the utilization of certain tax assets attributable to periods prior to our initial public offering, including the Pre-IPO Tax Assets. In addition, we will pay interest on the payments we will make to the Existing Stockholders with respect to the amount of this cash savings from the due date (without extensions) of our tax return where we realize this savings to the payment date at a rate equal to LIBOR plus 1.00% per annum. It is expected that the new tax on GILTI under Section 951A of the Code will significantly reduce the value of our Pre-IPO Tax Assets. Accordingly, it is unclear at this time whether any future payments will be made under the TRA, and we expect that any payments we make under the TRA will not be material.
For purposes of the TRA, cash savings in income tax are computed by reference to the reduction in the liability for income taxes resulting from the utilization of the tax benefits subject to the TRA. The term of the TRA will commence upon consummation of our initial public offering and will continue until there is no potential for any future tax benefit payments.
Our counterparties under the TRA will not reimburse us for any payments previously made if such tax benefits are subsequently disallowed (although future payments would be adjusted to the extent possible to reflect the result of such disallowance). As a result, in such circumstances we could make payments under the TRA that are greater than our actual cash tax savings.
While the actual amount and timing of any payments under the TRA will vary depending upon a number of factors, including the amount and timing of the taxable income we and our subsidiaries generate in the future, and our and our subsidiaries' use of Pre-IPO Tax Assets, we expect that, based on current tax laws (taking into account recent changes under the Tax Act), no material payments will be made to our
151
counterparties during the term of the TRA. However, there is still uncertainty surrounding the Tax Act, and it is possible that a change in law or additional implementing regulations, administrative guidance or interpretations of the Tax Act could enable us to utilize our Pre-IPO Tax Assets to reduce future U.S. federal income tax and Swiss tax realized by us and our subsidiaries. If such future events were to occur, and assuming that we and our subsidiaries earn sufficient taxable income to realize the full tax benefits subject to the TRA, we expect that payments under the TRA relating to the Pre-IPO Tax Assets could aggregate to a maximum amount of approximately $100 million. This figure does not account for our Pre-IPO Tax Assets attributable to previously taxed income under Section 959 of the Code, the value of which is highly speculative, and certain NOLs in GrafTech Switzerland S.A., which we expect to have nominal value at the time of this offering.
Upon the effective date of the TRA, we do not expect to recognize a liability for payments to be made under the TRA. However, any future changes in the utility of the Pre-IPO Tax Assets will impact the amount of the liability that will be paid to our Existing Stockholders. Changes in the utility of these Pre-IPO Tax Assets will be recorded in income tax expense (benefit) and any changes in the obligation under the TRA will be recorded in other income (expense). We plan to use cash flow from operations and availability under our credit facilities to fund this obligation.
If we undergo a Change of Control, the TRA will terminate and we will be required to make a payment equal to the present value of future payments under the TRA, which payment would be based on certain assumptions, including those relating to our and our subsidiaries' future taxable income. Additionally, if we sell or otherwise dispose of any of our subsidiaries in a transaction that is not a Change of Control, we will be required to make a payment equal to the present value of future payments under the TRA attributable to the Pre-IPO Tax Assets of such subsidiary that is sold or disposed of, applying the assumptions described above.
The TRA provides that in the event that we breach any of our material obligations under it, whether as a result of our failure to make any payment when due (subject to a specified cure period), failure to honor any other material obligation under it or by operation of law as a result of the rejection of it in a case commenced under the United States Bankruptcy Code or otherwise, then all our payment and other obligations under the TRA will be accelerated and will become due and payable applying the same assumptions described above. Such payments could be substantial and could exceed our actual cash tax savings under the TRA.
Certain transactions by the company could cause it to recognize taxable income (possibly material amounts of income) without a current receipt of cash. Payments under the TRA with respect to such taxable income would cause a net reduction in our available cash. For example, transactions giving rise to cancellation of debt income, the accrual of income from original issue discount or deferred payments, a "triggering event" requiring the recapture of dual consolidated losses, or "Subpart F" income would each produce income with no corresponding increase in cash. In these cases, we may use some of the Pre-IPO Tax Assets to offset income from these transactions and, under the TRA, would be required to make a payment to our Existing Stockholders even though we receive no cash from such income.
Because we are a holding company with no operations of our own, our ability to make payments under the TRA is dependent on the ability of our subsidiaries to make distributions to us. To the extent that we are unable to make payments under the TRA for specified reasons, such payments will be deferred and will accrue interest at a rate of LIBOR plus 1.00% per annum until paid.
152
In the event that any determinations must be made under or any dispute arises involving the TRA, the Existing Stockholders will be represented by Brookfield Capital Partners IV GP, Ltd. In any such instance, should any representatives of Brookfield Capital Partners IV GP then be serving on our board of directors, such directors will be excluded from decisions of the board related to the relevant determination or dispute.
The TRA is filed as an exhibit to the registration statement of which this prospectus forms a part, and the foregoing description of the TRA is qualified by a reference thereto.
Participation in our Initial Public Offering
Certain of our independent director nominees may purchase up to an aggregate of shares of common stock in this offering at the public offering price. The allocation of shares in this offering to our independent director nominees was made at our direction. The underwriters will not receive any underwriting discount or commission from the shares of our common stock purchased by these director nominees in this offering. Any shares sold to these director nominees will be subject to the lock-up agreements described under the sections entitled "Shares Eligible for Future Sale" and "Underwriting." We do not know if these director nominees will purchase all or any portion of these allocated shares, but any purchases they make will reduce the number of shares available to the general public. Any allocated shares not so purchased will be offered by the underwriters to the general public on the same terms as the other shares of common stock.
153
Principal stockholders and selling stockholder
The following table sets forth information as of , 2018 regarding the beneficial ownership of our common stock by:
- •
- each person or group who beneficially owns more than 5% of our outstanding shares of common stock;
- •
- the selling stockholder;
- •
- each of our named executive officers;
- •
- each of our directors;
- •
- each of our director nominees; and
- •
- all of our executive officers, directors and director nominees as a group.
Beneficial ownership for the purposes of the following table is determined in accordance with the rules and regulations of the SEC. These rules generally provide that a person is the beneficial owner of securities if such person has or shares the power to vote or direct the voting of securities, or to dispose or direct the disposition of securities or has the right to acquire such powers within 60 days. For purposes of calculating each person's percentage ownership, common stock issuable pursuant to options exercisable within 60 days are included as outstanding and beneficially owned for that person or group, but are not deemed outstanding for the purposes of computing the percentage ownership of any other person. Except as disclosed in the footnotes to this table and subject to applicable community property laws, we believe that each beneficial owner identified in the table possesses sole voting and investment power over all common stock shown as beneficially owned by the beneficial owner.
The percentage of beneficial ownership is based on shares of common stock outstanding (as adjusted to reflect the -for- stock split to be effected prior to the completion of this
154
offering). Unless otherwise indicated in the table or footnotes below, the address for each beneficial owner is c/o GrafTech International Ltd., 982 Keynote Circle, Brooklyn Heights, OH 44131.
| |
|
|
|
|
|
|
|
|
|||||||||||||||||
|---|---|---|---|---|---|---|---|---|---|---|---|---|---|---|---|---|---|---|---|---|---|---|---|---|---|
| | | | | | | | | | | | | | | | | | | | | | | | | | |
| |
|
|
|
|
After the offering | ||||||||||||||||||||
| |
|
|
|
|
Assuming underwriters' option to purchase additional shares is not exercised |
Assuming underwriters' option to purchase additional shares is exercised in full |
|||||||||||||||||||
| |
|
|
Shares offered | ||||||||||||||||||||||
| |
Prior to the offering | ||||||||||||||||||||||||
| |
Assuming underwriters' option to purchase additional shares is not exercised |
Assuming underwriters' option to purchase additional shares is exercised in full |
|||||||||||||||||||||||
| |
Number of shares beneficially owned |
Number of shares beneficially owned |
Number of shares beneficially owned |
||||||||||||||||||||||
| Name |
Number of shares |
Percentage of shares |
Number of shares |
Percentage of shares |
Number of shares |
Percentage of shares |
|||||||||||||||||||
| | | | | | | | | | | | | | | | | | | | | | | | | | |
5% Stockholders and Selling stockholder |
|||||||||||||||||||||||||
BCP IV GrafTech Holdings LP(1) |
|||||||||||||||||||||||||
Named Executive Officers, Directors and Director Nominees |
|||||||||||||||||||||||||
David J. Rintoul |
|||||||||||||||||||||||||
Quinn J. Coburn |
|||||||||||||||||||||||||
Jeffrey C. Dutton |
|||||||||||||||||||||||||
Denis A. Turcotte |
|||||||||||||||||||||||||
Ron A. Bloom |
|||||||||||||||||||||||||
Brian L. Acton |
|||||||||||||||||||||||||
Michel J. Dumas |
|||||||||||||||||||||||||
Anthony R. Taccone |
|||||||||||||||||||||||||
Joel L. Hawthorne |
|||||||||||||||||||||||||
Darrell A. Blair |
|||||||||||||||||||||||||
Lionel D. Batty |
|||||||||||||||||||||||||
All Current Executive Officers, Directors and Director Nominees as a Group (11 Persons) |
|||||||||||||||||||||||||
| | | | | | | | | | | | | | | | | | | | | | | | | | |
* Less than 1%
(1) BCP IV GrafTech Holdings LP beneficially owns an aggregate of 100 shares of common stock. The general partner of BCP IV GrafTech Holdings LP is BPE IV (Non-Cdn) GP LP, and the general partner of BPE IV (Non-Cdn) GP LP is Brookfield Capital Partners Ltd. Brian Chew, Jaspreet Dehl, Ronald Fisher-Dayn, Joseph Freedman, David Gregory, David Grosman, Cyrus Madon, David Nowak, Jim Reid, A.J. Silber and Ryan Szainwald are officers of, and BCP GP Limited is the sole shareholder of, Brookfield Capital Partners Ltd. and may therefore be deemed to be the beneficial owners of the shares. Ms. Dehl, Messrs. Chew, Fisher-Dayn, Freedman, Gregory, Grosman, Madon, Nowak, Reid, Silber and Szainwald and Brookfield Capital Partners Ltd. disclaim beneficial ownership of the shares except to the extent of their pecuniary interest therein. The address of each of Brookfield Capital Partners Ltd., Ms. Dehl, and Messrs. Chew, Fisher-Dayn, Freedman, Gregory, Grosman, Madon, Nowak, Reid, Silber and Szainwald is c/o Brookfield Asset Management Inc., 181 Bay Street, Suite 300, Bay Wellington Tower, Toronto, ON M5J 2T3.
155
The following descriptions are summaries of the material terms of our Amended Certificate of Incorporation and Amended By-Laws as they will be in effect upon completion of this offering. These descriptions contain all information which we consider to be material, but may not contain all of the information that is important to you. To understand them fully, you should read our Amended Certificate of Incorporation and Amended By-Laws, copies of which are filed with the SEC as exhibits to the registration statement of which this prospectus is a part. The summary below is qualified in its entirety by reference to our Amended Certificate of Incorporation and Amended By-Laws. The terms of these securities may also be affected by the DGCL.
Authorized capitalization
Our capital structure consists of authorized shares of common stock, par value $0.01 per share, and shares of preferred stock, par value $0.01 per share. Upon completion of this offering, there will be outstanding shares of common stock and (as adjusted to reflect the -for- stock split to be effected prior to the completion of this offering) no outstanding shares of preferred stock.
Common stock
The holders of our common stock are entitled to such dividends as our board of directors may declare from time to time from legally available funds subject to the preferential rights of the holders of any shares of our preferred stock that we may issue in the future. The holders of our common stock are entitled to one vote per share on any matter to be voted upon by stockholders, subject to the restrictions described below under the caption "Anti-Takeover Effects of Provisions of Our Certificate of Incorporation, Our By-Laws and Delaware Law."
Our Amended Certificate of Incorporation will not provide for cumulative voting in connection with the election of directors. Accordingly, directors will be elected by a majority of the shares voting once a quorum is present. No holder of our common stock has any preemptive rights, conversion rights or other subscription rights, and there are no redemption or sinking fund provisions applicable to our common stock.
Upon any voluntary or involuntary liquidation, dissolution or winding up of our affairs, the holders of our common stock are entitled to share, on a pro rata basis, all assets remaining after payment to creditors and subject to prior distribution rights of any shares of preferred stock that we may issue in the future. All of the outstanding shares of common stock are, and the shares offered by the selling stockholder in this offering will be, fully paid and non-assessable.
As of , 2018, we had 100 shares of common stock outstanding and one holder of record of common stock. The number of shares has not yet been adjusted to reflect our anticipated stock split prior to the settlement of this offering.
Preferred stock
No shares of our preferred stock are currently outstanding. Our Amended Certificate of Incorporation will authorize our board of directors, without further action by our stockholders, to issue shares of preferred stock in one or more classes or series. The board may fix or alter the rights, preferences and privileges of
156
the preferred stock, along with any limitations or restrictions, including voting rights, dividend rights, conversion rights, redemption privileges and liquidation preferences of each class or series of preferred stock. The preferred stock could have voting or conversion rights that could adversely affect the voting power or other rights of holders of our common stock. The issuance of preferred stock could also have the effect, under certain circumstances, of delaying, deferring or preventing a change of control of our company. We currently have no plans to issue any shares of preferred stock.
Stockholder Rights Agreement
For a description of the Stockholder Rights Agreement that we have entered into with the selling stockholder, see "Certain Relationships and Related Party Transactions—Stockholder Rights Agreement."
Anti-Takeover effects of provisions of our Certificate of Incorporation, our By-Laws and Delaware law
Our Amended Certificate of Incorporation and Amended By-Laws will contain a number of provisions relating to corporate governance and to the rights of stockholders. Certain of these provisions may be deemed to have a potential "anti-takeover" effect in that such provisions may delay, defer or prevent a change of control or an unsolicited acquisition proposal that a stockholder might consider favorable, including a proposal that might result in the payment of a premium over the market price for the shares held by the stockholders. These provisions include:
Classified board of directors
Our Amended Certificate of Incorporation will provide that our board of directors will be divided into three classes of directors, with the classes to be as nearly equal in number as possible, and with the directors serving three-year terms. As a result, approximately one-third of our board of directors will be elected each year. The Amended Certificate of Incorporation will provide that while the selling stockholder owns more than 50% of our outstanding common stock, the classification of the board of directors and the other provisions of the Amended Certificate of Incorporation may be amended by the affirmative vote of the holders of a majority of the voting power of our outstanding common stock. The Amended Certificate of Incorporation will also provide that after the selling stockholder ceases to own more than 50% of our outstanding common stock, these provisions may be amended only by the affirmative vote of the holders of 662/3% of the voting power of our outstanding common stock. The classification of directors will have the effect of making it more difficult for stockholders to change the composition of our board of directors. Our Amended Certificate of Incorporation and Amended By-Laws will provide that, subject to any rights of holders of preferred stock to elect additional directors under specified circumstances, the number of directors are fixed from time to time exclusively pursuant to a resolution adopted by the board of directors. Our board of directors will initially have seven members. Within one year of the consummation of this offering, our board will consist of eight members.
Removal of directors; vacancies
Our Amended Certificate of Incorporation will provide that while the selling stockholder owns more than 50% of our outstanding common stock, directors may be removed at any time, with or without cause, by the affirmative vote of the holders of a majority of the voting power of our outstanding common stock. Our Amended Certificate of Incorporation will also provide that after the selling stockholder ceases to own more than 50% of our outstanding common stock, directors may be removed only for cause and then only by the affirmative vote of the holders of 662/3% or more of the voting power of our outstanding common stock. Furthermore, any vacancy on our board of directors, however occurring, including a vacancy
157
resulting from an increase in the size of our board of directors, may only be filled by the affirmative vote of a majority of our directors then in office even if less than a quorum. These provisions may deter a stockholder from removing incumbent directors and simultaneously gaining control of the board of directors by filling the vacancies created by such removal with its own nominees.
Business combinations
We have opted out of Section 203 of the DGCL, which regulates corporate takeovers; however, our Amended Certificate of Incorporation will contain similar provisions providing that we may not engage in certain "business combinations" with any "interested stockholder" for a three-year period following the time that the stockholder became an interested stockholder, unless:
- •
- the business combination or the transaction which resulted in the stockholder becoming an interested stockholder was approved by the board of
directors;
- •
- upon consummation of the transaction that resulted in the stockholder becoming an interested stockholder, the interested stockholder owned at
least 85% of our outstanding shares entitled to vote generally in the election of directors at the time the transaction commenced; or
- •
- on or after such time, the business combination is approved by the board of directors and authorized at a meeting of stockholders, and not by written consent, by the affirmative vote of at least 662/3% of the outstanding shares entitled to vote generally in the election of directors that are not owned by the interested stockholder.
Generally, a "business combination" includes a merger, asset or stock sale or other transaction resulting in a financial benefit to the interested stockholder. Subject to certain exceptions, an "interested stockholder" is any entity or person beneficially owning 15% or more of our outstanding shares entitled to vote generally in the election of directors or any entity or person affiliated with or controlling or controlled by any of these entities or persons and who beneficially owned 15% or more of our outstanding shares entitled to vote generally in the election of directors at any time within the three-year period immediately prior to the date on which it is sought to be determined whether such person is an interested stockholder or an entity or person affiliated with or controlling or controlled by any of these entities or persons.
Under certain circumstances, this provision will make it more difficult for a person who would be an "interested stockholder" to effect various business combinations with a corporation for a three-year period. This provision may encourage companies interested in acquiring our Company to negotiate in advance with our board of directors because the stockholder approval requirement would be avoided if our board of directors approves either the business combination or the transaction which results in the stockholder becoming an interested stockholder. These provisions also may have the effect of preventing changes in our board of directors and may make it more difficult to accomplish transactions which stockholders may otherwise deem to be in their best interests.
Our Amended Certificate of Incorporation will provide that Brookfield and its affiliates and any of their respective direct or indirect transferees and any group as to which such persons are a party do not constitute "interested stockholders" for purposes of this provision.
Special stockholder meetings
Our Amended Certificate of Incorporation will provide that special meetings of our stockholders may be called at any time only by or at the direction of the board of directors or the chairman of the board of directors; provided, however, so long as Brookfield and its affiliates own more than 50% of our
158
outstanding common stock, special meetings of our stockholders may also be called by the board of directors or the chairman of the board of directors at the request of Brookfield and its affiliates. Our Amended By-Laws will prohibit the conduct of any business at a special meeting other than as specified in the notice for such meeting. These provisions may have the effect of deferring, delaying or discouraging hostile takeovers, or changes in control or management of our Company.
Requirements for advance notification of director nominations and stockholder proposals
Our Amended By-Laws will establish advance notice procedures with respect to stockholder proposals and the nomination of candidates for election as directors, other than nominations made by or at the direction of the board of directors. In order for any matter to be "properly brought" before a meeting, a stockholder will have to comply with advance notice requirements and provide us with certain information. Generally, to be timely, a stockholder's notice must be received at our principal executive offices not earlier than the opening of business 120 days prior, and not later than the close of business 90 days before, the first anniversary date of the immediately preceding annual meeting of stockholders. Our Amended By-Laws will also specify requirements as to the form and content of a stockholder's notice. Our Amended By-Laws will provide that the board of directors may adopt by resolution the rules and regulations for the conduct of meetings. Our Amended By-Laws will allow the chairman of the meeting at a meeting of the stockholders to adopt rules and regulations for the conduct of meetings which may have the effect of precluding the conduct of certain business at a meeting if the rules and regulations are not followed. These provisions will not apply to Brookfield and its affiliates so long for as long as they hold more than 50% of our outstanding common stock. These provisions may also defer, delay or discourage a potential acquirer from conducting a solicitation of proxies to elect the acquirer's own slate of directors or otherwise attempting to influence or obtain control of our Company.
Stockholder action by written consent
Our Amended Certificate of Incorporation will provide that stockholder action can be taken by written consent in lieu of a meeting while the selling stockholder owns more than 50% of our outstanding common stock. After the selling stockholder ceases to own more than 50% of our outstanding common stock, stockholder action can be taken only at an annual meeting or special meeting of stockholders and cannot be taken by written consent in lieu of a meeting.
Supermajority provisions
Our Amended Certificate of Incorporation and Amended By-Laws will provide that the board of directors is expressly authorized to adopt, make, alter, amend or repeal our Amended By-Laws without a stockholder vote in any matter not inconsistent with the laws of the state of Delaware. After the selling stockholder ceases to own more than 50% of our outstanding common stock, any adoption, alteration, amendment or repeal of our Amended By-Laws by our stockholders will require the affirmative vote of holders of at least 662/3% of the voting power of our outstanding common stock.
The DGCL provides generally that the affirmative vote of a majority of the outstanding shares then entitled to vote is required to amend a corporation's certificate of incorporation, unless the certificate of incorporation requires a greater percentage. Our Amended Certificate of Incorporation will provide that after the selling stockholder ceases to own more than 50% of our outstanding common stock, it may be amended only by a vote of at least 662/3% of the voting power of our outstanding common stock.
The combination of the classification of our board of directors, the lack of cumulative voting and the supermajority voting requirements will make it more difficult for our existing stockholders to replace our board of directors as well as for another party to obtain control of us by replacing our board of directors.
159
Because our board of directors has the power to retain and discharge our officers, these provisions could also make it more difficult for existing stockholders or another party to effect a change in management.
These provisions may have the effect of deterring hostile takeovers or delaying or preventing changes in control of our management or our Company, such as a merger, reorganization or tender offer. These provisions are intended to enhance the likelihood of continued stability in the composition of our board of directors and its policies and to discourage certain types of transactions that may involve an actual or threatened acquisition of us. These provisions are designed to reduce our vulnerability to an unsolicited acquisition proposal. The provisions are also intended to discourage certain tactics that may be used in proxy fights. However, such provisions could have the effect of discouraging others from making tender offers for our shares and, as a consequence, they may also inhibit fluctuations in the market price of our shares of common stock that could result from actual or rumored takeover attempts.
Authorized but unissued or undesignated capital stock
Our authorized capital stock will consist of shares of common stock. A large quantity of authorized but unissued shares may deter potential takeover attempts because of the ability of our board of directors to authorize the issuance of some or all of these shares to a friendly party, or to the public, which would make it more difficult for a potential acquirer to obtain control of us. This possibility may encourage persons seeking to acquire control of us to negotiate first with our board of directors. The authorized but unissued stock may be issued by the board of directors in one or more transactions. In this regard, our Amended Certificate of Incorporation will grant the board of directors broad power to establish the rights and preferences of authorized and unissued preferred stock. The issuance of shares of preferred stock pursuant to the board of directors' authority described above could decrease the amount of earnings and assets available for distribution to holders of common stock and adversely affect the rights and powers, including voting rights, of such holders and may have the effect of delaying, deferring or preventing a change of control. The board of directors does not currently intend to seek stockholder approval prior to any issuance of preferred stock, unless otherwise required by law.
Dissenters' rights of appraisal and payment
Under the DGCL, with certain exceptions, our stockholders have appraisal rights in connection with a merger or consolidation of us. Pursuant to the DGCL, stockholders who properly request and perfect appraisal rights in connection with such merger or consolidation will have the right to receive payment of the fair value of their shares as determined by the Court of Chancery in the State of Delaware.
Stockholders' derivative actions
Under the DGCL, any of our stockholders may bring an action in our name to procure a judgment in our favor, also known as a derivative action, provided that the stockholder bringing the action is a holder of our shares at the time of the transaction to which the action relates or such stockholder's stock thereafter devolved by operation of law.
Choice of forum
Our Amended Certificate of Incorporation will provide that unless we consent to the selection of an alternative forum, the Court of Chancery of the State of Delaware is the sole and exclusive forum for any derivative action or proceeding brought on our behalf; any action asserting a breach of fiduciary duty; any action asserting a claim against us arising pursuant to the DGCL, our Amended Certificate of Incorporation or Amended By-Laws; or any action asserting a claim against us that is governed by the internal affairs
160
doctrine. Any person or entity purchasing or otherwise acquiring any interest in our shares of common stock shall be deemed to have notice of and consented to the forum provisions in our Amended Certificate of Incorporation.
Conflicts of interest
Delaware law permits corporations to adopt provisions renouncing any interest or expectancy in certain opportunities that are presented to the corporation or its officers, directors or stockholders. Our Amended Certificate of Incorporation will, to the maximum extent permitted from time to time by Delaware law, renounce any interest or expectancy that we have in, or right to be offered an opportunity to participate in, specified business opportunities that are from time to time presented to certain entities and individuals associated with us. Our Amended Certificate of Incorporation will provide that, to the fullest extent permitted by law, Brookfield or any person affiliated with Brookfield (including any non-employee director affiliated with Brookfield who serves as one of our officers in both his director and officer capacities) or his or her affiliates will not have any duty to refrain from (i) engaging in a corporate opportunity in the same or similar lines of business in which we or our affiliates now engage or propose to engage or (ii) otherwise competing with us or our affiliates. In addition, to the fullest extent permitted by law, in the event that Brookfield or any person affiliated with Brookfield acquires knowledge of a potential transaction or other business opportunity which may be a corporate opportunity for itself or himself or its or his affiliates or for us or our affiliates, such person will have no duty to communicate or offer such transaction or business opportunity to us or any of our affiliates, may take any such opportunity for themselves or offer it to another person or entity and shall not be liable to us or any of our affiliates, subsidiaries or stockholders for breach of any duty as a stockholder, director or officer or otherwise for pursuing or acquiring such opportunity.
Limitation of liability and indemnification of officers and directors
Our Amended Certificate of Incorporation will provide that no director shall be personally liable to us or any of our stockholders for monetary damages for breach of fiduciary duty as a director, except to the extent such exemption from liability or limitation thereof is not permitted under the DGCL. Our Amended Certificate of Incorporation and Amended By-Laws will provide that we will indemnify, hold harmless and advance expenses to the fullest extent permitted by the DGCL, any person made or threatened to be made a party to any action or is involved in a proceeding by reason of the fact that the person is or was our director or officer, or our director or officer who, while a director or officer, is or was serving at the request of the company as a director, officer, employee, agent or manager of another corporation, partnership, limited liability company, joint venture, trust or other enterprise or non-profit entity, including service with respect to an employee benefit plan. Our Amended By-Laws will also provide that, subject to applicable law, the company may, by action of its board of directors, grant rights to indemnification and advancement of expenses to persons other than its directors and officers with such scope and effect as the board of directors may then determine. We intend to enter into customary indemnification agreements with each of our executive officers and directors that provide them, in general, with customary indemnification in connection with their service to us or on our behalf.
Transfer agent and registrar
The transfer agent and registrar for our common stock is Computershare Trust Company, N.A.
Listing
We have applied to have our common stock listed on the NYSE under the symbol "EAF."
161
Shares eligible for future sale
Prior to this offering, there has been no public market for our common stock, and we cannot predict the effect, if any, that sales of shares or availability of any shares for sale will have on the market price of our common stock prevailing from time to time. Sales of substantial amounts of common stock (including shares issued on the exercise of options, warrants or convertible securities, if any) or the perception that such sales could occur, could adversely affect the market price of our common stock and our ability to raise additional capital through a future sale of securities.
Upon completion of this offering, we will have shares of common stock issued and outstanding. All of the shares of our common stock sold in this offering (or shares if the underwriters exercise their overallotment option in full) will be freely tradable without restriction or further registration under the Securities Act unless such shares are purchased by "affiliates" as that term is defined in Rule 144 under the Securities Act. Upon completion of this offering, approximately % of our outstanding common stock will be held by the selling stockholder. These shares will be "restricted securities" as that phrase is defined in Rule 144. Subject to certain contractual restrictions, including the lock-up agreements described below, holders of restricted shares will be entitled to sell those shares in the public market if they qualify for an exemption from registration under Rule 144 or any other applicable exemption under the Securities Act. Subject to the lock-up agreements described below and the provisions of Rules 144 and 701, additional shares will be available for sale as set forth below.
Lock-Up agreements
In connection with this offering, we, our directors, our executive officers and the selling stockholder have agreed with the underwriters, subject to certain exceptions, not to dispose of or hedge any of our common stock or securities convertible into or exercisable or exchangeable for shares of our common stock, file or cause to be filed a registration statement covering shares of common stock or any securities that are convertible into, exercisable or exchangeable for any shares of our common stock, or publicly disclose the intention to do any of the foregoing, during the period from the date of this prospectus continuing through the date 180 days after the date of this prospectus, except with the prior written consent of J.P. Morgan Securities LLC and Credit Suisse Securities (USA) LLC. For additional information, including regarding certain exceptions to which this agreement is subject, see "Underwriting."
Rule 144
In general, under Rule 144 under the Securities Act, a person (or persons whose shares are aggregated) who is not deemed to have been an affiliate of ours at any time during the three months preceding a sale, and who has beneficially owned restricted securities within the meaning of Rule 144 for at least six months (including any period of consecutive ownership of preceding non-affiliated holders) would be entitled to sell those shares, subject only to the availability of current public information about us. A non-affiliated person who has beneficially owned restricted securities within the meaning of Rule 144 for at least one year would be entitled to sell those shares without regard to the provisions of Rule 144.
A person (or persons whose shares are aggregated) who is deemed to be an affiliate of ours and who has beneficially owned restricted securities within the meaning of Rule 144 for at least six months would be entitled to sell within any three-month period a number of shares that does not exceed the greater of one percent of the then outstanding shares of our common stock or the average weekly trading volume of our common stock during the four calendar weeks preceding such sale. Such sales are also subject to certain manner of sale provisions, notice requirements and the availability of current public information about us.
162
Rule 701
In general, under Rule 701 of the Securities Act, most of our employees, consultants or advisors who purchased shares from us in connection with a qualified compensatory stock plan or other written agreement are eligible to resell those shares 90 days after the date of this prospectus in reliance on Rule 144, but without compliance with the holding period or certain other restrictions contained in Rule 144.
Equity Plan
Following the date of this prospectus, we may file one or more registration statements on Form S-8 under the Securities Act to register the issuance of additional shares of common stock under any stock plans approved in the future. These registration statements will become effective upon filing. All of the shares issued or to be issued upon the exercise of stock options or settlement of other awards under our stock plans are or will be eligible for resale in the public market without restrictions, subject to Rule 144 limitations applicable to affiliates and the lock-up agreements described elsewhere in this prospectus.
163
Material U.S. federal income tax considerations to non-U.S. holders
The following discussion is a summary of material U.S. federal income tax considerations generally applicable to the purchase, ownership and disposition of our common stock by Non-U.S. Holders. A "Non-U.S. Holder" means a beneficial owner of our common stock that is (for U.S. federal income tax purposes):
- •
- a nonresident alien individual,
- •
- a foreign corporation,
- •
- a foreign estate or foreign trust, or
- •
- a person that is otherwise not subject to U.S. federal income tax on a net income basis in respect of such common stock.
A "Non-U.S. Holder" does not include an individual who is present in the United States for 183 days or more in the taxable year of disposition and is not otherwise a resident of the United States for U.S. federal income tax purposes. If you are such an individual, you should consult your own tax advisors regarding the U.S. federal income tax consequences of the sale, exchange or other disposition of our common stock.
This discussion deals only with common stock held as a capital asset by Non-U.S. Holders who purchased common stock in this offering. This discussion does not cover all aspects of U.S. federal income taxation that may be relevant to the purchase, ownership or disposition of our common stock by prospective investors in light of their specific facts and circumstances. In particular, this discussion does not address all of the tax considerations that may be relevant to persons in special tax situations, including, but not limited to: a foreign government or governmental entity, a dealer in securities or currencies, a financial institution, a regulated investment company, a real estate investment trust, a tax-exempt organization, an insurance company, a person holding common stock as part of a hedging, integrated, conversion or straddle transaction or a person deemed to sell common stock under the constructive sale provisions of the Code, a trader in securities that has elected the mark-to-market method of accounting, an entity or arrangement that is treated as a partnership for U.S. federal income tax purposes or owners of such entity or arrangement, a person that received such common stock in connection with the performance of services, a pension fund or retirement account, a "controlled foreign corporation," a "passive foreign investment company," a corporation that accumulates earnings to avoid U.S. federal income tax, a person that will hold shares of our common stock in connection with a U.S. trade or business or a U.S. permanent establishment, or a former citizen or long-term resident of the United States.
This section does not address any other U.S. federal tax considerations (such as Medicare, estate or gift tax) or any state, local or non-U.S. tax considerations. You should consult your own tax advisors about the tax consequences of the purchase, ownership and disposition of our common stock in light of your own particular circumstances, including the tax consequences under state, local, foreign and other tax laws and the possible effects of any changes in applicable tax laws.
Furthermore, this summary is based on the tax laws of the United States, including the Code, existing and proposed regulations, and administrative and judicial interpretations, all as currently in effect. Such authorities may be repealed, revoked, modified or subject to differing interpretations, possibly on a retroactive basis, so as to result in U.S. federal income tax consequences different from those discussed below.
164
Dividends
If we make a distribution of cash or property with respect to our common stock, such distributions generally will constitute dividends for U.S. federal income tax purposes to the extent of our current or accumulated earnings and profits, as determined under U.S. federal income tax principles. If a distribution exceeds our current and accumulated earnings and profits, the excess will be treated as a tax-free return of your investment, up to your tax basis in the common stock. Any remaining excess will be treated as capital gain, subject to the tax treatment described below in "—Sale, Exchange or Other Taxable Disposition of Common Stock." Any distributions will also be subject to the discussions below under the headings "—Foreign Account Tax Compliance Act" and "—Information Reporting and Backup Withholding."
Dividends paid to you generally will be subject to U.S. federal withholding tax at a 30% rate, or such lower rate as may be specified by an applicable tax treaty. Even if you are eligible for a lower treaty rate, we and other payers will generally be required to withhold at a 30% rate (rather than the lower treaty rate) on dividend payments to you, unless you have furnished to us or such other payer a valid Internal Revenue Service (or IRS) Form W-8BEN or IRS Form W-8BEN-E, as applicable, or other documentary evidence establishing your entitlement to the lower treaty rate with respect to such payments and neither we nor our paying agent (or other payer) have actual knowledge or reason to know to the contrary.
If you are eligible for a reduced rate of U.S. federal withholding tax pursuant to an applicable income tax treaty or otherwise, you may obtain a refund of any excess amounts withheld by timely filing an appropriate claim for refund with the IRS. Investors are encouraged to consult with their own tax advisors regarding the possible implications of these withholding requirements on their investment in the common stock.
Sale, exchange or other taxable disposition of common stock
You generally will not be subject to U.S. federal income tax with respect to gain recognized on a sale, exchange or other taxable disposition of shares of our common stock unless we are or have been a United States real property holding corporation for U.S. federal income tax purposes and you held, directly or indirectly, at any time during the five-year period ending on the date of the disposition, more than 5% of our common stock.
We are not and do not anticipate becoming a United States real property holding corporation for U.S. federal income tax purposes.
Investors are encouraged to consult with their own tax advisors regarding the possible implications of these withholding requirements on their investment in the common stock and the potential for a refund or credit in the case of any withholding tax.
Foreign Account Tax Compliance Act
The Foreign Account Tax Compliance Act (or FATCA) imposes withholding taxes on certain types of payments made to "foreign financial institutions" (as specially defined under these rules to include many entities that may not typically be thought of as financial institutions) and certain other non-U.S. entities if certification, information reporting and other specified requirements are not met. FATCA imposes a 30% withholding tax on "withholdable payments" if they are paid to a foreign financial institution or to a foreign non-financial entity unless (i) the foreign financial institution undertakes certain diligence and reporting obligations and other specified requirements are satisfied or (ii) the foreign non-financial entity either certifies it does not have any substantial U.S. owners or furnishes identifying information regarding
165
each substantial U.S. owner and other specified requirements are satisfied. "Withholdable payments" will include dividends on our common stock and any gross proceeds from the sale or other disposition of our common stock. If the payee is a foreign financial institution, it must enter into an agreement with the U.S. Treasury requiring, among other things, that it undertake to identify accounts held by certain U.S. persons or U.S.-owned foreign entities, annually report certain information about such accounts and withhold 30% on payments to account holders whose actions prevent it from complying with these reporting and other requirements. Under final U.S. Treasury Regulations and current IRS guidance, any withholding on payments of gross proceeds from the sale or disposition of our common stock will only apply to payments made on or after January 1, 2019. An intergovernmental agreement between the United States and an applicable foreign country may modify the requirements described in this paragraph. Prospective investors should consult their own tax advisors regarding this legislation.
Information reporting and backup withholding
We must report annually to the IRS and to each Non-U.S. Holder the amount of dividends paid to such holder and the tax withheld with respect to such dividends, regardless of whether withholding was required. Copies of the information returns reporting such dividends and withholding may also be made available to the tax authorities in the country in which you reside under the provisions of an applicable income tax treaty. You may be subject to backup withholding for dividends paid to you unless you certify under penalty of perjury that you are not a U.S. person or otherwise establish an exemption.
Proceeds from the sale, exchange or other disposition of our common stock by a Non-U.S. Holder effected outside the United States through a non-U.S. office of a non-U.S. broker generally will not be subject to information reporting and backup withholding, provided that the proceeds are paid to the Non-U.S. Holder outside the United States. However, proceeds from the sale, exchange or other disposition of our common stock by a Non-U.S. Holder effected through a non-U.S. office of a non-U.S. broker with certain specified U.S. connections or a U.S. broker generally will be subject to information reporting (but generally not to backup withholding), even if the proceeds are paid to such Non-U.S. Holder outside the United States, unless such Non-U.S. Holder certifies under penalty of perjury that it is not a U.S. person (for instance, by providing an IRS Form W-8BEN or W-8BEN-E to the applicable withholding agent) or otherwise establishes an exemption. Proceeds from the sale, exchange or other disposition of our common stock by a Non-U.S. Holder effected through a U.S. office of a broker generally will be subject to information reporting and backup withholding unless such Non-U.S. Holder certifies under penalty of perjury that it is not a U.S. person (for instance, by providing an IRS Form W-8BEN or W-8BEN-E to the applicable withholding agent) or otherwise establishes an exemption.
Any amounts withheld under the backup withholding rules may be allowed as a refund or a credit against your U.S. federal income tax liability provided the required information is timely furnished to the IRS.
166
The selling stockholder is offering the shares of common stock described in this prospectus through a number of underwriters. J.P. Morgan Securities LLC and Credit Suisse Securities (USA) LLC are acting as joint book running managers of the offering and as representatives of the underwriters. We and the selling stockholder have entered into an underwriting agreement with the underwriters. Subject to the terms and conditions of the underwriting agreement, the selling stockholder has agreed to sell to the underwriters, and each underwriter has severally agreed to purchase, at the public offering price less the underwriting discounts and commissions set forth on the cover page of this prospectus, the number of shares of common stock listed next to its name in the following table:
| |
| |
| |
|---|---|---|---|---|
| | | | | |
| Name |
| Number of shares |
| |
| | | | | |
J.P. Morgan Securities LLC |
| | ||
Credit Suisse Securities (USA) LLC |
| | ||
Citigroup Global Markets Inc. |
| | ||
RBC Capital Markets, LLC |
| | ||
HSBC Securities (USA) Inc. |
| | ||
BMO Capital Markets Corp. |
| | ||
| | | | | |
Total |
| | ||
| | | | | |
The underwriters are committed to purchase all the common shares offered by the selling stockholder if they purchase any shares. The underwriting agreement also provides that if an underwriter defaults, the purchase commitments of non-defaulting underwriters may also be increased or the offering may be terminated.
The underwriters propose to offer the common shares directly to the public at the initial public offering price set forth on the cover page of this prospectus and to certain dealers at that price less a concession not in excess of $ per share. Any such dealers may resell shares to certain other brokers or dealers at a discount of up to $ per share from the initial public offering price. After the closing of the initial offering of the shares to the public, if all the common shares are not sold at the initial public offering price, the underwriters may change the offering price and the other selling terms. Sales of shares made outside of the United States may be made by affiliates of the underwriters.
The underwriters have an option to buy up to additional shares of common stock from the selling stockholder to cover sales of shares by the underwriters which exceed the number of shares specified in the table above. The underwriters have 30 days from the date of this prospectus to exercise this option to purchase additional shares. If any shares are purchased with this option to purchase additional shares, the underwriters will purchase shares in approximately the same proportion as shown in the table above. If any additional shares of common stock are purchased, the underwriters will offer the additional shares on the same terms as those on which the shares are being offered.
Certain of our independent director nominees may purchase up to an aggregate of shares of common stock in this offering at the public offering price. The allocation of shares in this offering to our independent director nominees was made at our direction. The underwriters will not receive any underwriting discount or commission from the shares of our common stock purchased by these director nominees in this offering. Any shares sold to these director nominees will be subject to the lock-up agreements described below. We do not know if these director nominees will purchase all or any portion of
167
these allocated shares, but any purchases they make will reduce the number of shares available to the general public. Any allocated shares not so purchased will be offered by the underwriters to the general public on the same terms as the other shares of common stock.
The underwriting fee is equal to the public offering price per share of common stock less the amount paid by the underwriters to the selling stockholder per share of common stock. The underwriting fee is $ per share. The following table shows the per share and total underwriting discounts and commissions to be paid to the underwriters assuming both no exercise and full exercise of the underwriters' option to purchase additional shares.
| |
| |
| |
| ||
|---|---|---|---|---|---|---|---|
| | | | | | | ||
| |
| Without option to purchase additional shares exercise |
| With full option to purchase additional shares exercise |
| ||
| | | | | | | ||
Per Share(1) |
| $ | | $ | | ||
Total(1) |
| $ | | $ | | ||
| | | | | | | ||
(1) The underwriters will not receive an underwriting discount or commission on the sale of our common stock to certain independent director nominees. The selling stockholder will receive the full public offering price for such shares.
We estimate that the total expenses of this offering, including registration, filing and listing fees, printing fees and legal and accounting expenses, but excluding the underwriting discounts and commissions, will be approximately $ .
A prospectus in electronic format may be made available on the web sites maintained by one or more underwriters, or selling group members, if any, participating in the offering. The underwriters may agree to allocate a number of shares to underwriters and selling group members for sale to their online brokerage account holders. Internet distributions will be allocated by the representatives to underwriters and selling group members that may make Internet distributions on the same basis as other allocations.
We, our directors, our executive officers and the selling stockholder have agreed with the underwriters, subject to certain exceptions, not to dispose of or hedge any of our common stock or securities convertible into or exercisable or exchangeable for shares of our common stock, file or cause to be filed a registration statement covering shares of common stock or any securities that are convertible into, exercisable or exchangeable for any shares of our common stock, or publicly disclose the intention to do any of the foregoing, during the period from the date of this prospectus continuing through the date 180 days after the date of this prospectus, except with the prior written consent of J.P. Morgan Securities LLC and Credit Suisse Securities (USA) LLC, subject to certain exceptions, including:
- (A)
- the
shares of our common stock to be sold in this offering;
- (B)
- the
issuance of shares of our common stock or other securities (including securities convertible into shares of our common stock) in connection with the acquisition
by us or any of our subsidiaries of the securities, businesses, properties or other assets of another person or entity or pursuant to any employee benefit plan assumed by us in connection with such
acquisition; or
- (C)
- the issuance of shares of our common stock or other securities (including securities convertible into shares of our common stock) in connection with joint ventures, commercial relationships or other strategic transactions;
168
provided that, in the case of clauses (B) and (C), the aggregate number of shares of our common stock issued in all such acquisitions and transactions will not exceed 5% of our issued and outstanding common stock on the closing date of this offering and any recipients of such shares of our common stock will deliver a lock-up agreement to the underwriters.
We and the selling stockholder have agreed to indemnify the underwriters against certain liabilities, including liabilities under the Securities Act.
We have applied to have our common stock approved for listing/quotation on the NYSE under the symbol "EAF."
In connection with this offering, the underwriters may engage in stabilizing transactions, which involves making bids for, purchasing and selling shares of common stock in the open market for the purpose of preventing or retarding a decline in the market price of the common stock while this offering is in progress. These stabilizing transactions may include making short sales of the common stock, which involves the sale by the underwriters of a greater number of shares of common stock than they are required to purchase in this offering, and purchasing shares of common stock on the open market to cover positions created by short sales. Short sales may be "covered" shorts, which are short positions in an amount not greater than the underwriters' option to purchase additional shares referred to above, or may be "naked" shorts, which are short positions in excess of that amount. The underwriters may close out any covered short position either by exercising their option to purchase additional shares, in whole or in part, or by purchasing shares in the open market. In making this determination, the underwriters will consider, among other things, the price of shares available for purchase in the open market compared to the price at which the underwriters may purchase shares through the option to purchase additional shares. A naked short position is more likely to be created if the underwriters are concerned that there may be downward pressure on the price of the common stock in the open market that could adversely affect investors who purchase in this offering. To the extent that the underwriters create a naked short position, they will purchase shares in the open market to cover the position.
The underwriters have advised us that, pursuant to Regulation M of the Securities Act of 1933, they may also engage in other activities that stabilize, maintain or otherwise affect the price of the common stock, including the imposition of penalty bids. This means that if the representatives of the underwriters purchase common stock in the open market in stabilizing transactions or to cover short sales, the representatives can require the underwriters that sold those shares as part of this offering to repay the underwriting discount received by them.
These activities may have the effect of raising or maintaining the market price of the common stock or preventing or retarding a decline in the market price of the common stock, and, as a result, the price of the common stock may be higher than the price that otherwise might exist in the open market. If the underwriters commence these activities, they may discontinue them at any time. The underwriters may carry out these transactions on the NYSE, in the over the counter market or otherwise.
Prior to this offering, there has been no public market for our common stock. The initial public offering price will be determined by negotiations between us, the selling stockholder and the representatives of the underwriters. In determining the initial public offering price, we, the selling stockholder and the representatives of the underwriters expect to consider a number of factors including:
- •
- the information set forth in this prospectus and otherwise available to the representatives;
- •
- our prospects and the history and prospects for the industry in which we compete;
169
- •
- an assessment of our management;
- •
- our prospects for future earnings;
- •
- the general condition of the securities markets at the time of this offering;
- •
- the recent market prices of, and demand for, publicly traded common stock of generally comparable companies; and
- •
- other factors deemed relevant by the underwriters, us and the selling stockholder.
Neither we, the selling stockholder nor the underwriters can assure investors that an active trading market will develop for our common shares, or that the shares will trade in the public market at or above the initial public offering price.
Selling restrictions
Other than in the United States, no action has been taken by us, the selling stockholder or the underwriters that would permit a public offering of the securities offered by this prospectus in any jurisdiction where action for that purpose is required. The securities offered by this prospectus may not be offered or sold, directly or indirectly, nor may this prospectus or any other offering material or advertisements in connection with the offer and sale of any such securities be distributed or published in any jurisdiction, except under circumstances that will result in compliance with the applicable rules and regulations of that jurisdiction. Persons into whose possession this prospectus comes are advised to inform themselves about and to observe any restrictions relating to the offering and the distribution of this prospectus. This prospectus does not constitute an offer to sell or a solicitation of an offer to buy any securities offered by this prospectus in any jurisdiction in which such an offer or a solicitation is unlawful.
Notice to prospective investors in the European Economic Area
In relation to each Member State of the European Economic Area which has implemented the Prospectus Directive (each, a Relevant Member State) with effect from and including the date on which the Prospectus Directive is implemented in that Relevant Member State, no offer of shares may be made to the public in that Relevant Member State other than:
A. to any legal entity which is a qualified investor as defined in the Prospectus Directive;
B. to fewer than 150 natural or legal persons (other than qualified investors as defined in the Prospectus Directive), subject to obtaining the prior consent of the representatives; or
C. in any other circumstances falling within Article 3(2) of the Prospectus Directive;
provided that no such offer of shares shall require us or the representatives to publish a prospectus pursuant to Article 3 of the Prospectus Directive or supplement a prospectus pursuant to Article 16 of the Prospectus Directive and each person who initially acquires any shares or to whom any offer is made will be deemed to have represented, acknowledged and agreed to and with each of the underwriters and the Company that it is a "qualified investor" within the meaning of the law in that Relevant Member State implementing Article 2(1)(e) of the Prospectus Directive. In the case of any shares being offered to a financial intermediary as that term is used in Article 3(2) of the Prospectus Directive, each such financial intermediary will be deemed to have represented, acknowledged and agreed that the shares acquired by it in the offer have not been acquired on a non-discretionary basis on behalf of, nor have they been acquired with a view to their offer or resale to, persons in circumstances which may give rise to an offer of any
170
shares to the public other than their offer or resale in a Relevant Member State to qualified investors as so defined or in circumstances in which the prior consent of the representatives has been obtained to each such proposed offer or resale.
For the purposes of this provision, the expression "an offer of shares to the public" in relation to any shares in any Relevant Member State means the communication in any form and by means of sufficient information on the terms of the offer and the shares to be offered so as to enable an investor to decide to purchase shares, as the same may be varied in that Member State by any measure implementing the Prospectus Directive in that Member State, and the expression "Prospectus Directive" means Directive 2003/71/EC (as amended, including by Directive 2010/73/EU) and includes any relevant implementing measure in the Relevant Member State.
Notice to prospective investors in the United Kingdom
In addition, in the United Kingdom, this document is being distributed only to, and is directed only at, and any offer subsequently made may only be directed at persons who are "qualified investors" (as defined in the Prospectus Directive) (i) who have professional experience in matters relating to investments falling within Article 19 (5) of the Financial Services and Markets Act 2000 (Financial Promotion) Order 2005, as amended (or the Order) and/or (ii) who are high net worth companies (or persons to whom it may otherwise be lawfully communicated) falling within Article 49(2)(a) to (d) of the Order (all such persons together being referred to as "relevant persons") or otherwise in circumstances which have not resulted and will not result in an offer to the public of shares in the United Kingdom within the meaning of the Financial Services and Markets Act 2000.
Any person in the United Kingdom that is not a relevant person should not act or rely on the information included in this document or use it as basis for taking any action. In the United Kingdom, any investment or investment activity that this document relates to may be made or taken exclusively by relevant persons.
Notice to prospective investors in Canada
The shares may be sold only to purchasers purchasing, or deemed to be purchasing, as principal that are accredited investors, as defined in National Instrument 45-106 Prospectus Exemptions or subsection 73.3(1) of the Securities Act (Ontario), and are permitted clients, as defined in National Instrument 31-103 Registration Requirements, Exemptions and Ongoing Registrant Obligations. Any resale of the shares must be made in accordance with an exemption from, or in a transaction not subject to, the prospectus requirements of applicable securities laws.
Securities legislation in certain provinces or territories of Canada may provide a purchaser with remedies for rescission or damages if this prospectus (including any amendment thereto) contains a misrepresentation, provided that the remedies for rescission or damages are exercised by the purchaser within the time limit prescribed by the securities legislation of the purchaser's province or territory. The purchaser should refer to any applicable provisions of the securities legislation of the purchaser's province or territory for particulars of these rights or consult with a legal advisor.
Pursuant to section 3A.3 of National Instrument 33-105 Underwriting Conflicts (NI 33-105), the underwriters are not required to comply with the disclosure requirements of NI 33-105 regarding underwriter conflicts of interest in connection with this offering.
171
Notice to prospective investors in Switzerland
The shares may not be publicly offered in Switzerland and will not be listed on the SIX Swiss Exchange (or SIX) or on any other stock exchange or regulated trading facility in Switzerland. This document does not constitute a prospectus within the meaning of, and has been prepared without regard to the disclosure standards for issuance prospectuses under art. 652a or art. 1156 of the Swiss Code of Obligations or the disclosure standards for listing prospectuses under art. 27 ff. of the SIX Listing Rules or the listing rules of any other stock exchange or regulated trading facility in Switzerland. Neither this document nor any other offering or marketing material relating to the shares or the offering may be publicly distributed or otherwise made publicly available in Switzerland.
Neither this document nor any other offering or marketing material relating to the offering, the Company, or the shares has been or will be filed with or approved by any Swiss regulatory authority. In particular, this document will not be filed with, and the offer of shares will not be supervised by, the Swiss Financial Market Supervisory Authority FINMA (or FINMA), and the offer of shares has not been and will not be authorized under the Swiss Federal Act on Collective Investment Schemes (or CISA). The investor protection afforded to acquirers of interests in collective investment schemes under the CISA does not extend to acquirers of shares.
Notice to prospective investors in the Dubai International Financial Centre (or DIFC)
This prospectus relates to an Exempt Offer in accordance with the Markets Rules 2012 of the Dubai Financial Services Authority (or DFSA). This document is intended for distribution only to persons of a type specified in the Markets Rules 2012 of the DFSA. It must not be delivered to, or relied on by, any other person. The DFSA has no responsibility for reviewing or verifying any documents in connection with Exempt Offers. The DFSA has not approved this prospectus supplement nor taken steps to verify the information set forth herein and has no responsibility for this document. The securities to which this document relates may be illiquid and/or subject to restrictions on their resale. Prospective purchasers of the securities offered should conduct their own due diligence on the securities. If you do not understand the contents of this document you should consult an authorized financial advisor.
In relation to its use in the DIFC, this document is strictly private and confidential and is being distributed to a limited number of investors and must not be provided to any person other than the original recipient, and may not be reproduced or used for any other purpose. The interests in the securities may not be offered or sold directly or indirectly to the public in the DIFC.
Notice to prospective investors in the United Arab Emirates
The shares have not been, and are not being, publicly offered, sold, promoted or advertised in the United Arab Emirates (including the Dubai International Financial Centre) other than in compliance with the laws of the United Arab Emirates (and the Dubai International Financial Centre) governing the issue, offering and sale of securities. Further, this prospectus does not constitute a public offer of securities in the United Arab Emirates (including the Dubai International Financial Centre) and is not intended to be a public offer. This prospectus has not been approved by or filed with the Central Bank of the United Arab Emirates, the Securities and Commodities Authority or the Dubai Financial Services Authority.
Notice to prospective investors in Australia
This prospectus:
- •
- does not constitute a product disclosure document or a prospectus under Chapter 6D.2 of the Corporations Act 2001 (Cth) (or the
Corporations Act);
- •
- has not been, and will not be, lodged with the Australian Securities and Investments Commission (or ASIC), as a disclosure document for the purposes of the Corporations Act and does not purport to include the information required of a disclosure document under Chapter 6D.2 of the Corporations Act;
172
- •
- does not constitute or involve a recommendation to acquire, an offer or invitation for issue or sale, an offer or invitation to arrange the
issue or sale, or an issue or sale, of interests to a "retail client" (as defined in section 761G of the Corporations Act and applicable regulations) in Australia; and
- •
- may only be provided in Australia to select investors who are able to demonstrate that they fall within one or more of the categories of investors, or Exempt Investors, available under section 708 of the Corporations Act.
The shares may not be directly or indirectly offered for subscription or purchased or sold, and no invitations to subscribe for or buy the shares may be issued, and no draft or definitive offering memorandum, advertisement or other offering material relating to any shares may be distributed in Australia, except where disclosure to investors is not required under Chapter 6D of the Corporations Act or is otherwise in compliance with all applicable Australian laws and regulations. By submitting an application for the shares, you represent and warrant to us that you are an Exempt Investor.
As any offer of shares under this document will be made without disclosure in Australia under Chapter 6D.2 of the Corporations Act, the offer of those securities for resale in Australia within 12 months may, under section 707 of the Corporations Act, require disclosure to investors under Chapter 6D.2 if none of the exemptions in section 708 applies to that resale. By applying for the shares you undertake to us that you will not, for a period of 12 months from the date of issue of the shares, offer, transfer, assign or otherwise alienate those securities to investors in Australia except in circumstances where disclosure to investors is not required under Chapter 6D.2 of the Corporations Act or where a compliant disclosure document is prepared and lodged with ASIC.
Notice to prospective investors in Japan
The shares have not been and will not be registered pursuant to Article 4, Paragraph 1 of the Financial Instruments and Exchange Act. Accordingly, none of the shares nor any interest therein may be offered or sold, directly or indirectly, in Japan or to, or for the benefit of, any "resident" of Japan (which term as used herein means any person resident in Japan, including any corporation or other entity organized under the laws of Japan), or to others for re-offering or resale, directly or indirectly, in Japan or to or for the benefit of a resident of Japan, except pursuant to an exemption from the registration requirements of, and otherwise in compliance with, the Financial Instruments and Exchange Act and any other applicable laws, regulations and ministerial guidelines of Japan in effect at the relevant time.
Notice to prospective investors in Hong Kong
The shares have not been offered or sold and will not be offered or sold in Hong Kong, by means of any document, other than (a) to "professional investors" as defined in the Securities and Futures Ordinance (Cap. 571) of Hong Kong and any rules made under that Ordinance; or (b) in other circumstances which do not result in the document being a "prospectus" as defined in the Companies (Winding Up and Miscellaneous Provisions) Ordinance (Cap. 32) of Hong Kong or which do not constitute an offer to the public within the meaning of that Ordinance. No advertisement, invitation or document relating to the shares has been or may be issued or has been or may be in the possession of any person for the purposes of issue, whether in Hong Kong or elsewhere, which is directed at, or the contents of which are likely to be accessed or read by, the public of Hong Kong (except if permitted to do so under the securities laws of Hong Kong) other than with respect to shares which are or are intended to be disposed of only to persons outside Hong Kong or only to "professional investors" as defined in the Securities and Futures Ordinance and any rules made under that Ordinance.
173
Notice to prospective investors in Singapore
This prospectus has not been registered as a prospectus with the Monetary Authority of Singapore. Accordingly, this prospectus and any other document or material in connection with the offer or sale, or invitation for subscription or purchase, of shares may not be circulated or distributed, nor may the shares be offered or sold, or be made the subject of an invitation for subscription or purchase, whether directly or indirectly, to persons in Singapore other than (i) to an institutional investor under Section 274 of the Securities and Futures Act, Chapter 289 of Singapore (or the SFA), (ii) to a relevant person pursuant to Section 275(1), or any person pursuant to Section 275(1A), and in accordance with the conditions specified in Section 275 of the SFA, or (iii) otherwise pursuant to, and in accordance with the conditions of, any other applicable provision of the SFA.
Where the shares are subscribed or purchased under Section 275 of the SFA by a relevant person which is:
(a) a corporation (which is not an accredited investor (as defined in Section 4A of the SFA)) the sole business of which is to hold investments and the entire share capital of which is owned by one or more individuals, each of whom is an accredited investor; or
(b) a trust (where the trustee is not an accredited investor) whose sole purpose is to hold investments and each beneficiary of the trust is an individual who is an accredited investor,
securities (as defined in Section 239(1) of the SFA) of that corporation or the beneficiaries' rights and interest (howsoever described) in that trust shall not be transferred within six months after that corporation or that trust has acquired the shares pursuant to an offer made under Section 275 of the SFA except:
(a) to an institutional investor or to a relevant person defined in Section 275(2) of the SFA, or to any person arising from an offer referred to in Section 275(1A) or Section 276(4)(i)(B) of the SFA;
(b) where no consideration is or will be given for the transfer;
(c) where the transfer is by operation of law;
(d) as specified in Section 276(7) of the SFA; or
(e) as specified in Regulation 32 of the Securities and Futures (Offers of Investments) (Shares and Debentures) Regulations 2005 of Singapore
Notice to prospective investors in Bermuda
Shares may be offered or sold in Bermuda only in compliance with the provisions of the Investment Business Act of 2003 of Bermuda which regulates the sale of securities in Bermuda.
Additionally, non-Bermudian persons (including companies) may not carry on or engage in any trade or business in Bermuda unless such persons are permitted to do so under applicable Bermuda legislation.
Notice to prospective investors in Saudi Arabia
This prospectus may not be distributed in the Kingdom of Saudi Arabia except to such persons as are permitted under the Offers of Securities Regulations as issued by the board of the Saudi Arabian Capital Market Authority (or CMA) pursuant to resolution number 2-11-2004 dated 4 October 2004 as amended by resolution number 1-28-2008, as amended (or the CMA Regulations). The CMA does not make any representation as to the accuracy or completeness of this document and expressly disclaims any liability whatsoever for any loss arising from, or incurred in reliance upon, any part of this document. Prospective
174
purchasers of the securities offered hereby should conduct their own due diligence on the accuracy of the information relating to the securities. If you do not understand the contents of this document, you should consult an authorized financial adviser.
Notice to prospective investors in the British Virgin Islands
The shares are not being, and may not be offered to the public or to any person in the British Virgin Islands for purchase or subscription by or on behalf of the Company. The shares may be offered to companies incorporated under the BVI Business Companies Act, 2004 (British Virgin Islands),or BVI Companies), but only where the offer will be made to, and received by, the relevant BVI Company entirely outside of the British Virgin Islands. This prospectus has not been, and will not be, registered with the Financial Services Commission of the British Virgin Islands. No registered prospectus has been or will be prepared in respect of the shares for the purposes of the Securities and Investment Business Act, 2010 (or SIBA) or the Public Issuers Code of the British Virgin Islands.
Notice to prospective investors in China
This prospectus does not constitute a public offer of shares, whether by sale or subscription, in the People's Republic of China (or the PRC). The shares are not being offered or sold directly or indirectly in the PRC to or for the benefit of, legal or natural persons of the PRC.
Further, no legal or natural persons of the PRC may directly or indirectly purchase any of the shares or any beneficial interest therein without obtaining all prior PRC's governmental approvals that are required, whether statutorily or otherwise. Persons who come into possession of this document are required by the issuer and its representatives to observe these restrictions.
Notice to prospective investors in Korea
The shares have not been and will not be registered under the Financial Investments Services and Capital Markets Act of Korea and the decrees and regulations thereunder (or the FSCMA), and the shares have been and will be offered in Korea as a private placement under the FSCMA. None of the shares may be offered, sold or delivered directly or indirectly, or offered or sold to any person for re-offering or resale, directly or indirectly, in Korea or to any resident of Korea except pursuant to the applicable laws and regulations of Korea, including the FSCMA and the Foreign Exchange Transaction Law of Korea and the decrees and regulations thereunder (or the FETL). The shares have not been listed on any of the securities exchanges in the world including, without limitation, the Korea Exchange in Korea. Furthermore, the purchaser of the shares shall comply with all applicable regulatory requirements (including but not limited to requirements under the FETL) in connection with the purchase of the shares. By the purchase of the shares, the relevant holder thereof will be deemed to represent and warrant that if it is in Korea or is a resident of Korea, it purchased the shares pursuant to the applicable laws and regulations of Korea.
Notice to prospective investors in Malaysia
No prospectus or other offering material or document in connection with the offer and sale of the shares has been or will be registered with the Securities Commission of Malaysia (or Commission) for the Commission's approval pursuant to the Capital Markets and Services Act 2007. Accordingly, this prospectus and any other document or material in connection with the offer or sale, or invitation for subscription or purchase, of the shares may not be circulated or distributed, nor may the shares be offered or sold, or be made the subject of an invitation for subscription or purchase, whether directly or indirectly, to persons in Malaysia other than (i) a closed end fund approved by the Commission; (ii) a holder of a Capital Markets Services Licence; (iii) a person who acquires the shares, as principal, if the offer is on terms that the
175
shares may only be acquired at a consideration of not less than RM250,000 (or its equivalent in foreign currencies) for each transaction; (iv) an individual whose total net personal assets or total net joint assets with his or her spouse exceeds RM3 million (or its equivalent in foreign currencies), excluding the value of the primary residence of the individual; (v) an individual who has a gross annual income exceeding RM300,000 (or its equivalent in foreign currencies) per annum in the preceding twelve months; (vi) an individual who, jointly with his or her spouse, has a gross annual income of RM400,000 (or its equivalent in foreign currencies), per annum in the preceding twelve months; (vii) a corporation with total net assets exceeding RM10 million (or its equivalent in a foreign currencies) based on the last audited accounts; (viii) a partnership with total net assets exceeding RM10 million (or its equivalent in foreign currencies); (ix) a bank licensee or insurance licensee as defined in the Labuan Financial Services and Securities Act 2010; (x) an Islamic bank licensee or takaful licensee as defined in the Labuan Financial Services and Securities Act 2010; and (xi) any other person as may be specified by the Commission; provided that, in the each of the preceding categories (i) to (xi), the distribution of the shares is made by a holder of a Capital Markets Services Licence who carries on the business of dealing in securities. The distribution in Malaysia of this prospectus is subject to Malaysian laws. This prospectus does not constitute and may not be used for the purpose of public offering or an issue, offer for subscription or purchase, invitation to subscribe for or purchase any securities requiring the registration of a prospectus with the Commission under the Capital Markets and Services Act 2007.
Notice to prospective investors in Taiwan
The shares have not been and will not be registered with the Financial Supervisory Commission of Taiwan pursuant to relevant securities laws and regulations and may not be sold, issued or offered within Taiwan through a public offering or in circumstances which constitutes an offer within the meaning of the Securities and Exchange Act of Taiwan that requires a registration or approval of the Financial Supervisory Commission of Taiwan. No person or entity in Taiwan has been authorised to offer, sell, give advice regarding or otherwise intermediate the offering and sale of the shares in Taiwan.
Other relationships
Certain of the underwriters and their respective affiliates have provided in the past to us and our affiliates and may provide from time to time in the future certain commercial banking, financial advisory, investment banking and other services for us and our affiliates in the ordinary course of their business, for which they have received and may continue to receive customary fees and commissions. In addition, from time to time, certain of the underwriters and their respective affiliates may effect transactions for their own account or the account of customers, and hold on behalf of themselves or their customers, long or short positions in our debt or equity securities or loans, and may do so in the future. An affiliate of J.P. Morgan Securities LLC is the administrative agent and the collateral agent, as well as a lender, an issuing bank and the swingline lender under the 2018 Credit Agreement. J.P. Morgan Securities LLC, Credit Suisse Securities (USA) LLC, Citigroup Global Markets Inc., HSBC Securities (USA) Inc. and RBC Capital Markets, LLC, or affiliates of such institutions, are joint-lead arrangers and joint bookrunners under the 2018 Credit Agreement. In addition, Credit Suisse Securities (USA) LLC, Citigroup Global Markets Inc., HSBC Securities (USA) Inc. and RBC Capital Markets, LLC, or affiliates thereof, are lenders and issuing banks under the 2018 Credit Agreement.
176
Certain legal matters relating to this offering will be passed upon for us by Cleary Gottlieb Steen & Hamilton LLP, New York, New York. The underwriters have been represented by Cravath, Swaine & Moore LLP, New York, New York. The validity of the shares of common stock to be sold in this offering will be passed upon by Richards, Layton & Finger, P.A., Wilmington, Delaware.
The consolidated financial statements as of December 31, 2017 and 2016, and for each of the years ended December 31, 2017, December 31, 2016 and December 31, 2015 (January 1, 2015 to August 14, 2015, Predecessor Period, and August 15, 2015 to December 31, 2015, Successor Period), included in this prospectus have been audited by Deloitte & Touche LLP, an independent registered public accounting firm, as stated in their report appearing herein. Such financial statements have been so included in reliance upon the report of such firm given upon their authority as experts in accounting and auditing.
177
Where you can find more information
We have filed a registration statement, of which this prospectus is a part, on Form S-1 with the SEC relating to this offering. This prospectus does not contain all of the information in the registration statement and the exhibits included with the registration statement. References in this prospectus to any of our contracts, agreements or other documents are not necessarily complete, and you should refer to the exhibits attached to the registration statement for copies of the actual contracts, agreements or documents. You may read and copy the registration statement, the related exhibits and other material we file with the SEC at the SEC's public reference room in Washington, D.C. at 100 F Street, Room 1580, N.E., Washington, D.C. 20549. You can also request copies of those documents, upon payment of a duplicating fee, by writing to the SEC. Please call the Commission at 1-800-SEC-0330 for further information on the operation of the public reference rooms. The SEC also maintains an internet site that contains reports, proxy and information statements and other information regarding issuers that file with the SEC. The website address is http://www.sec.gov.
Upon the effectiveness of the registration statement, we will be subject to the informational requirements of the Exchange Act, and, in accordance with the Exchange Act, will file reports, proxy and information statements and other information with the SEC. Such annual, quarterly and special reports, proxy and information statements and other information can be inspected and copied at the locations set forth above. We intend to make this information available on the investors relations section of our website, www.graftech.com. Information on, or accessible through, our website is not part of this prospectus. We have included our website address only as an inactive textual reference and do not intend it to be an active link to our website. We have in the past voluntarily elected to file annual and quarterly reports and other information with the SEC. Unless otherwise specified in this prospectus, information in these reports is not part of this prospectus.
178
F-1
Report of independent registered public accounting firm
To
the Board of Directors and Stockholders of
GrafTech International Ltd. and subsidiaries:
Opinion on the financial statements
We have audited the accompanying consolidated balance sheets of GrafTech International Ltd. and its subsidiaries (the "Company") as of December 31, 2017 and 2016, the related consolidated statements of operations and comprehensive income (loss), stockholders' equity, and cash flows for the years ended December 31, 2017 and 2016, the period August 15, 2015 through December 31, 2015 (Successor Period), and the period January 1, 2015 through August 14, 2015 (Predecessor Period), and the related notes (collectively referred to as the "financial statements"). In our opinion, the financial statements present fairly, in all material respects, the financial position of the Company as of December 31, 2017 and 2016, and the results of its operations and its cash flows for the years ended December 31, 2017 and 2016, the period August 15, 2015 through December 31, 2015 (Successor Period), and the period January 1, 2015 through August 14, 2015 (Predecessor Period), in conformity with accounting principles generally accepted in the United States of America.
Basis for opinion
These financial statements are the responsibility of the Company's management. Our responsibility is to express an opinion on the Company's financial statements based on our audits. We are a public accounting firm registered with the Public Company Accounting Oversight Board (United States) (PCAOB) and are required to be independent with respect to the Company in accordance with the U.S. federal securities laws and the applicable rules and regulations of the Securities and Exchange Commission and the PCAOB.
We conducted our audits in accordance with the standards of the PCAOB. Those standards require that we plan and perform the audit to obtain reasonable assurance about whether the financial statements are free of material misstatement, whether due to error or fraud. The Company is not required to have, nor were we engaged to perform, an audit of its internal control over financial reporting. As part of our audits, we are required to obtain an understanding of internal control over financial reporting but not for the purpose of expressing an opinion on the effectiveness of the Company's internal control over financial reporting. Accordingly, we express no such opinion.
Our audits included performing procedures to assess the risks of material misstatement of the financial statements, whether due to error or fraud, and performing procedures that respond to those risks. Such procedures included examining, on a test basis, evidence regarding the amounts and disclosures in the financial statements. Our audits also included evaluating the accounting principles used and significant estimates made by management, as well as evaluating the overall presentation of the financial statements. We believe that our audits provide a reasonable basis for our opinion.
/s/ DELOITTE & TOUCHE LLP
Cleveland, Ohio
March 5, 2018
We have served as the Company's auditor since 2015.
F-2
GrafTech International Ltd. and Subsidiaries
Consolidated balance sheets
(Dollars in thousands, except share data)
| |
|
|
|
|||||||
|---|---|---|---|---|---|---|---|---|---|---|
| | | | | | | | | | | |
| |
As of December 31, 2017 |
Unaudited Pro forma* |
As of December 31, 2016 |
|||||||
| | | | | | | | | | | |
ASSETS |
||||||||||
Current assets: |
||||||||||
Cash and cash equivalents |
$ | 13,365 | $ | 13,365 | $ | 11,610 | ||||
Accounts and notes receivable, net of allowance for doubtful accounts of $1,097 as of December 31, 2017 and $326 as of December 31, 2016 |
116,841 | 116,841 | 80,568 | |||||||
Inventories |
174,151 | 174,151 | 156,111 | |||||||
Prepaid expenses and other current assets |
44,872 | 44,872 | 21,665 | |||||||
Current assets of discontinued operations |
5,313 | 5,313 | 60,979 | |||||||
| | | | | | | | | | | |
Total current assets |
354,542 | 354,542 | 330,933 | |||||||
| | | | | | | | | | | |
Property, plant and equipment |
642,651 | 642,651 | 585,704 | |||||||
Less: accumulated depreciation |
129,810 | 129,810 | 76,849 | |||||||
| | | | | | | | | | | |
Net property, plant and equipment |
512,841 | 512,841 | 508,855 | |||||||
Deferred income taxes |
30,768 | 30,768 | 19,803 | |||||||
Goodwill |
171,117 | 171,117 | 171,117 | |||||||
Other assets |
129,835 | 129,835 | 141,568 | |||||||
| | | | | | | | | | | |
Total assets |
$ | 1,199,103 | $ | 1,199,103 | $ | 1,172,276 | ||||
| | | | | | | | | | | |
LIABILITIES AND STOCKHOLDERS' EQUITY |
||||||||||
Current liabilities: |
||||||||||
Accounts payable |
$ | 69,110 | $ | 69,110 | $ | 47,663 | ||||
Short-term debt |
16,474 | 16,474 | 8,852 | |||||||
Dividend payable |
— | 1,112,000 | — | |||||||
Accrued income and other taxes |
9,737 | 9,737 | 5,256 | |||||||
Other accrued liabilities |
53,226 | 53,226 | 30,594 | |||||||
Current liabilities of discontinued operations |
3,412 | 3,412 | 20,042 | |||||||
| | | | | | | | | | | |
Total current liabilities |
151,959 | 1,263,959 | 112,407 | |||||||
| | | | | | | | | | | |
Long-term debt |
322,900 | 322,900 | 356,580 | |||||||
Other long-term obligations |
68,907 | 68,907 | 82,148 | |||||||
Deferred income taxes |
41,746 | 41,746 | 42,906 | |||||||
Long-term liabilities of discontinued operations |
376 | 376 | 850 | |||||||
Commitments and Contingencies—Notes 11 and 13 |
||||||||||
Stockholders' equity: |
||||||||||
Common stock, par value $.01, 1,000 shares authorized, 100 shares authorized and issued as of December 31, 2017 and 2016 |
— | — | — | |||||||
Additional paid - in capital |
854,337 | 854,337 | 854,337 | |||||||
Accumulated other comprehensive income (loss) |
20,289 | 20,289 | (7,558 | ) | ||||||
Accumulated deficit |
(261,411 | ) | (1,373,411 | ) | (269,394 | ) | ||||
| | | | | | | | | | | |
Total stockholders' equity |
613,215 | (498,785 | ) | 577,385 | ||||||
| | | | | | | | | | | |
Total liabilities and stockholders' equity |
$ | 1,199,103 | $ | 1,199,103 | $ | 1,172,276 | ||||
| | | | | | | | | | | |
* See Notes 1 and 16
See accompanying Notes to the Consolidated Financial Statements
F-3
GrafTech International Ltd. and Subsidiaries
Consolidated statements of operations and comprehensive income (loss)
(Dollars in thousands, except per share data)
| |
|
|
|
|
|||||||||
|---|---|---|---|---|---|---|---|---|---|---|---|---|---|
| | | | | | | | | | | | | | |
| |
Successor | Predecessor | |||||||||||
| |
For the year ended December 31, 2017 |
For the year ended December 31, 2016 |
For the period August 15 through December 31, 2015 |
For the period January 1 through August 14, 2015 |
|||||||||
| | | | | | | | | | | | | | |
Net sales |
$ | 550,771 | $ | 437,963 | $ | 193,133 | $ | 339,907 | |||||
Cost of sales |
461,339 | 448,016 | 180,845 | 305,001 | |||||||||
Additions to lower of cost or market inventory reserve |
1,509 | 18,974 | — | — | |||||||||
| | | | | | | | | | | | | | |
Gross profit (loss) |
87,923 | (29,027 | ) | 12,288 | 34,906 | ||||||||
Research and development |
2,951 | 2,399 | 1,083 | 3,377 | |||||||||
Selling and administrative expenses |
49,479 | 57,784 | 23,768 | 64,397 | |||||||||
Impairment of long-lived assets and goodwill |
— | 2,843 | — | 35,381 | |||||||||
| | | | | | | | | | | | | | |
Operating income (loss) |
35,493 | (92,053 | ) | (12,563 | ) | (68,249 | ) | ||||||
Other expense (income), net |
1,634 | (2,188 | ) | (813 | ) | 1,421 | |||||||
Interest expense |
30,823 | 26,914 | 9,999 | 26,211 | |||||||||
Interest income |
(395 | ) | (358 | ) | (6 | ) | (363 | ) | |||||
| | | | | | | | | | | | | | |
Income (loss) from continuing operations before provision (benefit) for income taxes |
3,431 | (116,421 | ) | (21,743 | ) | (95,518 | ) | ||||||
(Benefit) provision for income taxes |
(10,781 | ) | (7,552 | ) | 6,882 | 6,452 | |||||||
| | | | | | | | | | | | | | |
Net income (loss) from continuing operations |
14,212 | (108,869 | ) | (28,625 | ) | (101,970 | ) | ||||||
Loss from discontinued operations, net of tax* |
(6,229 | ) | (126,974 | ) | (4,926 | ) | (18,679 | ) | |||||
| | | | | | | | | | | | | | |
Net income (loss) |
$ | 7,983 | $ | (235,843 | ) | $ | (33,551 | ) | $ | (120,649 | ) | ||
| | | | | | | | | | | | | | |
Basic and diluted income (loss) per common share: |
|||||||||||||
Net income (loss) per share |
$ | 79,830 | $ | (2,358,430 | ) | $ | (335,510 | ) | $ | (0.88 | ) | ||
Income (loss) from continuing operations per common share |
142,120 | (1,088,690 | ) | (286,250 | ) | (0.74 | ) | ||||||
Weighted average common shares outstanding |
100 | 100 | 100 | 137,152,430 | |||||||||
STATEMENTS OF COMPREHENSIVE INCOME (LOSS) |
|||||||||||||
Net income (loss) |
$ | 7,983 | $ | (235,843 | ) | $ | (33,551 | ) | $ | (120,649 | ) | ||
Other comprehensive income (loss): |
|||||||||||||
Foreign currency translation adjustments |
23,028 | 2,574 | (10,133 | ) | (27,936 | ) | |||||||
Commodities and foreign currency derivatives and other, net of tax of $0, ($20), $21 and ($68), respectively |
4,819 | 125 | (124 | ) | 1,262 | ||||||||
| | | | | | | | | | | | | | |
Other comprehensive income (loss), net of tax: |
27,847 | 2,699 | (10,257 | ) | (26,674 | ) | |||||||
| | | | | | | | | | | | | | |
Comprehensive income (loss) |
$ | 35,830 | $ | (233,144 | ) | $ | (43,808 | ) | $ | (147,323 | ) | ||
| | | | | | | | | | | | | | |
* Loss on discontinued operations includes a pretax impairment charge of $119,907 in the year ended December 31, 2016. See Note 3 "Discontinued Operations and Related Assets Held for Sale"
See accompanying Notes to the Consolidated Financial Statements
F-4
GrafTech International Ltd. and Subsidiaries
Consolidated statements of cash flows
(Dollars in thousands)
| |
|
|
|
|
|||||||||
|---|---|---|---|---|---|---|---|---|---|---|---|---|---|
| | | | | | | | | | | | | | |
| |
Successor |
Predecessor |
|||||||||||
| | | | | | | | | | | | | | |
| |
For the year ended December 31, 2017 |
For the year ended December 31, 2016 |
For the period August 15 through December 31, 2015 |
For the period January 1 through August 14, 2015 |
|||||||||
| | | | | | | | | | | | | | |
Cash flow from operating activities: |
|||||||||||||
Net income (loss) |
$ | 7,983 | $ | (235,843 | ) | $ | (33,551 | ) | $ | (120,649 | ) | ||
Adjustments to reconcile net income (loss) to cash provided by operations: |
|||||||||||||
Depreciation and amortization |
66,443 | 82,891 | 28,618 | 45,461 | |||||||||
Impairment of long-lived assets and goodwill |
5,300 | 122,750 | — | 35,381 | |||||||||
Deferred income tax provision |
(15,695 | ) | (12,062 | ) | 5,368 | 924 | |||||||
Post-retirement and pension plan (gains) charges |
(1,733 | ) | (698 | ) | 2,638 | 2,998 | |||||||
Stock-based compensation |
— | — | — | 15,357 | |||||||||
Non-cash interest expense |
6,805 | 6,551 | 2,351 | 14,180 | |||||||||
(Gain) loss on sale of assets |
(9,108 | ) | 198 | — | — | ||||||||
Other charges, net |
1,234 | (235 | ) | (1,934 | ) | 102 | |||||||
Net change in working capital* |
(20,004 | ) | 68,630 | 26,763 | 45,594 | ||||||||
Change in long-term assets and liabilities |
(4,652 | ) | (9,367 | ) | (7,138 | ) | (11,025 | ) | |||||
| | | | | | | | | | | | | | |
Net cash provided by operating activities |
36,573 | 22,815 | 23,115 | 28,323 | |||||||||
Cash flow from investing activities: |
|||||||||||||
Capital expenditures |
(34,664 | ) | (27,858 | ) | (18,442 | ) | (32,301 | ) | |||||
Cash received from divestitures |
27,254 | 15,889 | — | — | |||||||||
Derivative instrument settlements, net |
— | 377 | 326 | (8,263 | ) | ||||||||
Proceeds from the sale of fixed assets |
5,211 | 1,121 | 632 | 646 | |||||||||
| | | | | | | | | | | | | | |
Net cash used in investing activities |
(2,199 | ) | (10,471 | ) | (17,484 | ) | (39,918 | ) | |||||
Cash flow from financing activities: |
|||||||||||||
Short-term debt borrowings (reductions), net |
5,110 | 7,363 | (15,504 | ) | 18,511 | ||||||||
Credit Facility borrowings |
77,000 | 56,000 | 62,000 | 160,000 | |||||||||
Credit Facility reductions |
(114,839 | ) | (70,469 | ) | (68,000 | ) | (99,000 | ) | |||||
Repayment of Senior Subordinated Notes |
— | — | — | (200,000 | ) | ||||||||
Issuance of preferred shares |
— | — | — | 150,000 | |||||||||
Principal payments on long-term debt |
(266 | ) | (289 | ) | (183 | ) | (89 | ) | |||||
Refinancing fees and debt issuance costs |
— | (922 | ) | — | (5,068 | ) | |||||||
Other |
— | — | (1,385 | ) | (3,530 | ) | |||||||
| | | | | | | | | | | | | | |
Net cash (used in) provided by financing activities |
(32,995 | ) | (8,317 | ) | (23,072 | ) | 20,824 | ||||||
Net change in cash and cash equivalents |
1,379 | 4,027 | (17,441 | ) | 9,229 | ||||||||
Effect of exchange rate changes on cash and cash equivalents |
376 | 656 | (665 | ) | (1,746 | ) | |||||||
Cash and cash equivalents at beginning of period |
11,610 | 6,927 | 25,033 | 17,550 | |||||||||
| | | | | | | | | | | | | | |
Cash and cash equivalents at end of period |
$ | 13,365 | $ | 11,610 | $ | 6,927 | $ | 25,033 | |||||
| | | | | | | | | | | | | | |
Supplemental disclosures of cash flow information: |
|||||||||||||
Net cash paid during the periods for: |
|||||||||||||
Interest |
$ | 25,277 | $ | 23,578 | $ | 10,880 | $ | 10,661 | |||||
Income taxes |
3,467 | 3,329 | 1,646 | 5,016 | |||||||||
Non-cash operating, investing and financing activities: |
|||||||||||||
Common stock issued to savings and pension plan trusts |
— | — | — | 1,874 | |||||||||
* Net change in working capital due to the following components: |
|||||||||||||
Decrease (increase) in current assets: |
|||||||||||||
Accounts and notes receivable, net |
$ | (29,755 | ) | $ | 3,432 | $ | (9,524 | ) | $ | 61,008 | |||
Inventories |
(15,649 | ) | 53,548 | 47,853 | 1,164 | ||||||||
Prepaid expenses and other current assets |
(10,565 | ) | (1,424 | ) | 15,935 | 2,551 | |||||||
Change in accounts payables and accruals |
36,350 | 15,757 | (21,503 | ) | (18,728 | ) | |||||||
Rationalizations |
(271 | ) | (2,758 | ) | (3,756 | ) | (2,677 | ) | |||||
Increase in interest payable |
(114 | ) | 75 | (2,242 | ) | 2,276 | |||||||
| | | | | | | | | | | | | | |
(Increase) decrease in working capital |
$ | (20,004 | ) | $ | 68,630 | $ | 26,763 | $ | 45,594 | ||||
| | | | | | | | | | | | | | |
See accompanying Notes to the Consolidated Financial Statements
F-5
GrafTech International Ltd. and Subsidiaries
Consolidated statements of stockholders' equity
(Dollars in thousands, except share data)
| |
|
|
|
|
|
|
|
|
|||||||||||||||||
|---|---|---|---|---|---|---|---|---|---|---|---|---|---|---|---|---|---|---|---|---|---|---|---|---|---|
| | | | | | | | | | | | | | | | | | | | | | | | | | |
| |
Predecessor | ||||||||||||||||||||||||
| |
Issued shares of common stock |
Common stock |
Additional paid-in capital |
Accumulated other comprehensive loss |
Retained earnings (accumulated deficit) |
Treasury stock |
Common stock held in employee benefit & compensation trust |
Total stockholders' equity |
|||||||||||||||||
| | | | | | | | | | | | | | | | | | | | | | | | | | |
Balance as of December 31, 2014 |
152,821,011 | $ | 1,528 | $ | 1,825,880 | $ | (336,524 | ) | $ | (245,751 | ) | $ | (239,811 | ) | $ | (796 | ) | $ | 1,004,526 | ||||||
| | | | | | | | | | | | | | | | | | | | | | | | | | |
Comprehensive income (loss): |
|||||||||||||||||||||||||
Net loss |
— | — | — | — | (120,649 | ) | — | — | (120,649 | ) | |||||||||||||||
Other comprehensive income (loss): |
|||||||||||||||||||||||||
Commodity and foreign currency derivatives and other, net of tax of ($68) |
— | — | — | 1,262 | — | — | — | 1,262 | |||||||||||||||||
Foreign currency translation adjustments |
— | — | — | (27,936 | ) | — | — | — | (27,936 | ) | |||||||||||||||
| | | | | | | | | | | | | | | | | | | | | | | | | | |
Total other comprehensive income (loss) |
— | — | — | (26,674 | ) | — | — | — | (26,674 | ) | |||||||||||||||
Brookfield preferred share issuance |
— | — | 145,205 | — | — | — | — | 145,205 | |||||||||||||||||
Stock-based compensation |
(2,331 | ) | — | (16,530 | ) | — | — | 31,826 | — | 15,296 | |||||||||||||||
Common stock issued to savings and pension plan trusts |
423,273 | 4 | 1,874 | — | — | — | 796 | 2,674 | |||||||||||||||||
Sale of common stock under stock options |
7,450 | — | 32 | — | — | — | — | 32 | |||||||||||||||||
| | | | | | | | | | | | | | | | | | | | | | | | | | |
Balance as of August 14, 2015 |
153,249,403 | $ | 1,532 | $ | 1,956,461 | $ | (363,198 | ) | $ | (366,400 | ) | $ | (207,985 | ) | $ | — | $ | 1,020,410 | |||||||
| | | | | | | | | | | | | | | | | | | | | | | | | | |
|
Successor |
||||||||||||||||||||||||
| | | | | | | | | | | | | | | | | | | | | | | | | | |
Balance as of August 15, 2015 |
— | $ | — | $ | — | $ | — | $ | — | $ | — | $ | — | — | |||||||||||
Brookfield capital contribution |
100 | — | 854,337 | — | — | — | — | 854,337 | |||||||||||||||||
Other comprehensive income (loss): |
|||||||||||||||||||||||||
Net loss |
— | — | — | — | (33,551 | ) | — | — | (33,551 | ) | |||||||||||||||
Other comprehensive income (loss): |
|||||||||||||||||||||||||
Commodity and foreign currency derivatives and other, net of tax of $21 |
— | — | — | (124 | ) | — | — | — | (124 | ) | |||||||||||||||
Foreign currency translation adjustments |
— | — | — | (10,133 | ) | — | — | — | (10,133 | ) | |||||||||||||||
| | | | | | | | | | | | | | | | | | | | | | | | | | |
Total other comprehensive income (loss) |
— | — | — | (10,257 | ) | — | — | — | (10,257 | ) | |||||||||||||||
Balance as of December 31, 2015 |
100 | — | 854,337 | (10,257 | ) | (33,551 | ) | — | — | 810,529 | |||||||||||||||
| | | | | | | | | | | | | | | | | | | | | | | | | | |
| |
|
|
|
|
|
|
|
|
|||||||||||||||||
|---|---|---|---|---|---|---|---|---|---|---|---|---|---|---|---|---|---|---|---|---|---|---|---|---|---|
| | | | | | | | | | | | | | | | | | | | | | | | | | |
| |
Successor | ||||||||||||||||||||||||
| |
Issued shares of common stock |
Common stock |
Additional paid-in capital |
Accumulated other comprehensive income (loss) |
Retained earnings (accumulated deficit) |
Treasury stock |
Common stock held in employee benefit & compensation trust |
Total stockholders' equity |
|||||||||||||||||
| | | | | | | | | | | | | | | | | | | | | | | | | | |
Balance as of December 31, 2015 |
100 | $ | — | $ | 854,337 | $ | (10,257 | ) | $ | (33,551 | ) | $ | — | $ | — | 810,529 | |||||||||
Net loss |
— | — | — | — | (235,843 | ) | — | — | (235,843 | ) | |||||||||||||||
Other comprehensive income (loss): |
|||||||||||||||||||||||||
Commodity and foreign currency derivatives and other, net of tax of ($20) |
— | $ | — | $ | — | $ | 125 | $ | — | $ | — | $ | — | $ | 125 | ||||||||||
Foreign currency translation adjustments |
— | — | — | 2,574 | — | — | — | 2,574 | |||||||||||||||||
| | | | | | | | | | | | | | | | | | | | | | | | | | |
Total other comprehensive (loss) income |
— | — | — | 2,699 | — | — | — | 2,699 | |||||||||||||||||
Balance as of December 31, 2016 |
100 | — | 854,337 | (7,558 | ) | (269,394 | ) | — | — | 577,385 | |||||||||||||||
| | | | | | | | | | | | | | | | | | | | | | | | | | |
Net income |
— | — | — | — | 7,983 | — | — | 7,983 | |||||||||||||||||
Other comprehensive income (loss): |
|||||||||||||||||||||||||
Commodity and foreign currency derivatives and other, no tax impact |
— | — | — | 4,819 | — | — | — | 4,819 | |||||||||||||||||
Foreign currency translation adjustments |
— | — | — | 23,028 | — | — | — | 23,028 | |||||||||||||||||
| | | | | | | | | | | | | | | | | | | | | | | | | | |
Total other comprehensive (loss) income |
— | — | — | 27,847 | — | — | — | 27,847 | |||||||||||||||||
Balance as of December 31, 2017 |
100 | $ | — | $ | 854,337 | $ | 20,289 | $ | (261,411 | ) | $ | — | $ | — | $ | 613,215 | |||||||||
| | | | | | | | | | | | | | | | | | | | | | | | | | |
See accompanying Notes to the Consolidated Financial Statements
F-6
GrafTech International Ltd. and Subsidiaries
Notes to the consolidated financial statements
(Dollars in thousands, except as otherwise noted)
(1) Business and summary of significant accounting policies
Discussion of business and structure
GrafTech International Ltd. (the "Company") is a leading manufacturer of high quality graphite electrode products essential to the production of electric arc furnace steel and other ferrous and non-ferrous metals. References herein to "GTI," "we," "our," or "us" refer collectively to GrafTech International Ltd. and its subsidiaries. On August 15, 2015, GTI became an indirect wholly owned subsidiary of Brookfield Asset Management Inc. ("Brookfield") through a tender offer to our former shareholders and subsequent merger transaction.
The Company's only reportable segment, Industrial Materials, is comprised of our two major product categories: graphite electrodes and needle coke products. Needle coke is the key raw material to producing graphite electrodes. The Company's vision is to provide the highest quality graphite electrodes at the lowest cost while providing the best customer service all while striving to be the lowest cost producer.
We previously operated an Engineered Solutions business segment. See Note 3 "Discontinued Operations and Assets Held for Sale" for further information. All results from the Engineered Solutions business have been excluded from continuing operations, unless otherwise indicated.
Summary of significant accounting policies
The Consolidated Financial Statements include the financial statements of GrafTech International Ltd. and its wholly owned subsidiaries. All intercompany transactions have been eliminated in consolidation.
Cash equivalents
We consider all highly liquid financial instruments with original maturities of three months or less to be cash equivalents. Cash equivalents consist of certificates of deposit, money market funds and commercial paper.
Revenue recognition
Revenue from sales of our commercial products is recognized when they meet four basic criteria (1) persuasive evidence of an arrangement exists, (2) delivery has occurred, (3) the amount is determinable and (4) collection is reasonably assured. Sales are recognized when both title and the risks and rewards of ownership are transferred to the customer or services have been rendered and fees have been earned in accordance with the contract.
Volume discounts and rebates are estimated and are recorded as a reduction of revenue in conjunction with the sale of the related products. Changes to estimates are recorded when they become probable. Shipping and handling revenues billed to our customers are included in net sales and the related shipping and handling costs are included as an increase to cost of sales.
Inventories
Inventories are stated at the lower of cost or market. Cost is principally determined using the "first-in first-out" ("FIFO") and average cost, which approximates FIFO, methods. Elements of cost in inventory include raw materials, direct labor and manufacturing overhead.
F-7
We allocate fixed production overheads to the costs of conversion based on normal capacity of the production facilities. We recognize abnormal amounts of idle facility expense, freight, handling costs, and wasted materials (spoilage) as current period charges.
Property, plant and equipment
Expenditures for property, plant and equipment are recorded at cost. Maintenance and repairs of property and equipment are expensed as incurred. Expenditures for replacements and betterments are capitalized and the replaced assets are retired. Gains and losses from the sale of property are included in cost of goods sold or other (income) expense, net. We depreciate our assets using the straight-line method over the estimated useful lives of the assets. The ranges of estimated useful lives are as follows:
| |
|
|||
|---|---|---|---|---|
| | | | | |
| |
Years |
|||
| | | | | |
Buildings |
25 - 40 | |||
Land improvements |
20 | |||
Machinery and equipment |
5 - 20 | |||
Furniture and fixtures |
5 - 10 | |||
| | | | | |
The carrying value of fixed assets is assessed when events and circumstances indicating impairment are present. Recoverability of assets to be held and used is measured by a comparison of the carrying amount of the assets to future undiscounted net cash flows expected to be generated by the assets. If the assets are considered to be impaired, the impairment to be recognized is measured by the amount by which the carrying amount of the assets exceeds the fair value of the assets. Assets to be disposed of are reported at the lower of the carrying amount or fair value less costs to sell.
Depreciation expense was $50.4 million for 2017 and $63.4 million in 2016. Depreciation expense was $18.8 million for the period August 15 through December 31, 2015 and $26.7 million for the period January 1 through August 14, 2015. Capital expenditures within accounts payable totaled $13.6 million as of December 31, 2017.
Accounts receivable
Trade accounts receivable primarily arise from sales of goods to customers and distributors in the normal course of business.
Allowance for doubtful accounts
Judgment is required in assessing the likelihood of collection of receivables, including the current creditworthiness of each customer, related aging of the past due balances and the facts and circumstances surrounding any non-payment. We evaluate specific accounts when we become aware of a situation where a customer may not be able to meet its financial obligations. The reserve requirements are based on the best facts available to us and are reevaluated and adjusted as additional information is received. Receivables are charged off when amounts are determined to be uncollectible.
Capitalized bank fees
We capitalize bank fees upon the incurrence of debt and record them as a contra-liability against our debt. We had capitalized bank fees of $0.4 million and $0.7 million as of December 31, 2017 and 2016, respectively. We amortize such amounts over the life of the respective debt instrument using the effective interest method. The estimated life may be adjusted upon the occurrence of a triggering event. Amortization of capitalized bank fees amounted to $0.3 million and $0.2 million in 2017 and 2016,
F-8
respectively. We had no amortization of capitalized bank fees in the period August 15 through December 31, 2015, and $2.1 million in the period January 1 through August 14, 2015. Capitalized bank fee amortization is included in interest expense.
Derivative financial instruments
We do not use derivative financial instruments for trading purposes. They are used to manage well-defined commercial risks associated with commodity contracts and currency exchange rate risks.
Foreign currency derivatives
We enter into foreign currency derivatives from time to time to manage exposure to changes in currency exchange rates. These instruments, which include, but are not limited to, forward exchange contracts and purchased currency options, attempt to hedge global currency exposures, relating to non-dollar denominated debt and identifiable foreign currency receivables, payables and commitments held by our foreign and domestic subsidiaries. Forward exchange contracts are agreements to exchange different currencies at a specified future date and at a specified rate. Purchased foreign currency options are instruments which give the holder the right, but not the obligation, to exchange different currencies at a specified rate at a specified date or over a range of specified dates. The result is the creation of a range in which a best and worst price is defined, while minimizing option cost. Forward exchange contracts and purchased currency options are carried at fair value. These contracts are treated as hedges to the extent they are effective. Changes in fair values related to these contracts are recognized in other comprehensive income in the Consolidated Balance Sheets until settlement. At the time of settlement, realized gains and losses are recognized in revenue or cost of goods sold on the Consolidated Statements of Operations. For derivatives that are not designated as a hedge, any gain or loss is immediately recognized in Cost of Goods Sold or Other (Income) Expense on the Consolidated Statements of Operations. Derivatives used in this manner relate to risks resulting from assets or liabilities denominated in a foreign currency.
Commodity derivative contracts
We have entered into derivative contracts for refined oil products. These contracts are entered into to protect against the risk that eventual cash flows related to these products will be adversely affected by future changes in prices. All commodity contracts are carried at fair value and are treated as hedges to the extent they are effective. Changes in their fair values are included in accumulated other comprehensive loss in the Consolidated Balance Sheets until settlement. Realized gains and losses are recognized in cost of goods sold on the Consolidated Statements of Operations with the same timing as the underlying hedged item.
Research and development
Expenditures relating to the development of new products and processes, including significant improvements to existing products, are expensed as incurred.
Income taxes
We file a consolidated United States ("U.S.") federal income tax return for GTI and its eligible domestic subsidiaries. Our non-U.S. subsidiaries file income tax returns in their respective local jurisdictions. We account for income taxes under the asset and liability method. Deferred tax assets and liabilities are recognized for the future tax consequences attributable to temporary differences between the financial statement carrying amounts of existing assets and liabilities and their respective tax bases and tax benefit carry forwards. Deferred tax assets and liabilities at the end of each period are determined using enacted tax rates. A valuation allowance is established or maintained, when, based on currently available
F-9
information and other factors, it is more likely than not that all or a portion of a deferred tax asset will not be realized.
Under the guidance on accounting for uncertainty in income taxes, we recognize the benefit from an uncertain tax position only if it is more likely than not that the tax position will be sustained on examination by taxing authorities, based on the technical merits of the position. The tax benefits recognized in the financial statements from such a position are measured based on the largest benefit that has a greater than fifty percent likelihood of being realized upon ultimate settlement. The guidance on accounting for uncertainty in income taxes also provides guidance on derecognition, classification, interest and penalties on income taxes, and accounting in interim periods.
Retirement plans and postretirement benefits
We use actuarial methods and assumptions to account for our defined benefit pension plans and our postretirement benefits. We immediately recognize the change in the fair value of plan assets and net actuarial gains and losses annually in the fourth quarter of each year (MTM Adjustment) and whenever a plan is remeasured (e.g. due to a significant curtailment, settlement, etc.). Pension and postretirement benefits expense includes the MTM adjustment, actuarially computed cost of benefits earned during the current service period, the interest cost on accrued obligations, the expected return on plan assets based on fair market values, and adjustments due to plan settlements and curtailments. Contributions to the qualified U.S. retirement plan are made in accordance with the requirements of the Employee Retirement Income Security Act of 1974.
Postretirement benefits and benefits under the non-qualified retirement plan have been accrued, but not funded. The estimated cost of future postretirement life insurance benefits is determined by the Company with assistance from independent actuarial firms using the "projected unit credit" actuarial cost method. Such costs are recognized as employees render the service necessary to earn the postretirement benefits. We record our balance sheet position based on the funded status of the plan.
We exclude the inactive participant portion of our pension and other postretirement benefit costs when calculating inventoriable costs. Additional information with respect to benefits plans is set forth in Note 12, "Retirement Plans and Postretirement Benefits."
Environmental, health and safety matters
Our operations are governed by laws addressing protection of the environment and worker safety and health. These laws provide for civil and criminal penalties and fines, as well as injunctive and remedial relief, for noncompliance and require remediation at sites where hazardous substances have been released into the environment.
We have been in the past, and may become in the future, the subject of formal or informal enforcement actions or proceedings regarding noncompliance with these laws or the remediation of company-related substances released into the environment. Historically, such matters have been resolved by negotiation with regulatory authorities resulting in commitments to compliance, abatement or remediation programs and in some cases payment of penalties. Historically, neither the commitments undertaken nor the penalties imposed on us have been material.
Environmental considerations are part of all significant capital expenditure decisions. Environmental remediation, compliance and management expenses were approximately $8.0 million, $8.3 million and $6.5 million in 2017, 2016 and 2015, respectively. A charge to income is recorded when it is probable that a liability has been incurred and the cost can be reasonably estimated. When payments are fixed or
F-10
determinable, the liability is discounted using a rate at which the payments could be effectively settled. The accrued liability relating to environmental remediation was $2.1 million as of December 31, 2017 and $5.2 million as of December 31, 2016. The decrease in the liability was the result of the sale of a landfill in Canada that occurred in 2017.
Our environmental liabilities do not take into consideration possible recoveries of insurance proceeds. Because of the uncertainties associated with environmental remediation activities at sites where we may be potentially liable, future expenses to remediate sites could be considerably higher than the accrued liability.
Foreign currency translation
We translate the financial statements of foreign subsidiaries, whose local currency is their functional currency, to U.S. dollars using period-end exchange rates for assets and liabilities and weighted average exchange rates for each period for revenues, expenses, gains and losses. Differences arising from exchange rate changes are included in accumulated other comprehensive loss on the Consolidated Balance Sheets until such time as the operations of such non-U.S. subsidiaries are sold or substantially or completely liquidated.
For our Mexican, Swiss and Russian subsidiaries, whose functional currency is the U.S. dollar, we remeasure non-monetary balance sheet accounts and the related income statement accounts at historical exchange rates. Resulting gains and losses arising from the fluctuations in currency for monetary accounts are recognized in other (income) expense, net, in the Consolidated Statements of Operations. Gains and losses arising from fluctuations in currency exchange rates on transactions denominated in currencies other than the functional currency are recognized in earnings as incurred.
We have non-dollar denominated intercompany loans between some of our foreign subsidiaries. These loans are subject to remeasurement gains and losses due to changes in currency exchange rates. Certain of these loans had been deemed to be essentially permanent prior to settlement and, as a result, remeasurement gains and losses on these loans were recorded as a component of accumulated other comprehensive income (loss) in the stockholders' equity section of the Consolidated Balance Sheets. The remaining loans are deemed to be temporary and, as a result, remeasurement gains and losses on these loans are recorded as currency (gains/losses) in other (income) expense, net, on the Consolidated Statements of Operations.
Rationalizations
We record costs for rationalization actions implemented to reduce excess and high-cost manufacturing capacity and operating and administrative costs. For ongoing post-employment benefit arrangements, a liability is recognized when it is probable that employees will be entitled to benefits and the amount can be reasonably estimated. These conditions are generally met when the rationalization plan is approved by management. For one-time benefit arrangements, a liability is incurred and must be accrued at the date the plan is communicated to employees, unless they will be retained beyond a minimum retention period. In this case, the liability is calculated at the date the plan is communicated to employees and is accrued ratably over the future service period. Other costs reported under Rationalization include contract termination costs.
In connection with rationalization initiatives, the company incurs additional costs such as inventory losses, fixed assets write-offs, impairment and accelerated depreciation as well as various non-recurring costs for dismantling, transferring or disposing of equipment and inventory. These rationalization related costs are
F-11
measured and recorded based on the appropriate accounting guidance. Inventory losses are recorded in cost of sales. Fixed assets write-offs and accelerated depreciation are recorded in cost of sales, R&D and SG&A based upon the asset utilization. Other non-recurring costs are recorded in cost of sales and SG&A.
Goodwill and other intangible assets
Goodwill is the excess of the acquisition cost of businesses over the fair value of the identifiable net assets acquired. We do not recognize deferred income taxes for the difference between the assigned value and the tax basis related to nondeductible goodwill. Goodwill is not amortized; however, impairment testing is performed annually or more frequently if circumstances indicate that impairment may have occurred. We perform the goodwill impairment test annually at December 31.
The impairment test for goodwill uses a two-step approach, which is performed at the reporting unit level. Step one compares the fair value of the reporting unit to its carrying value. The fair value for each reporting unit with goodwill is determined in accordance with accounting guidance on determining fair value, which requires consideration of the income, market, and cost approaches as applicable. If the carrying value exceeds the fair value, there is potential impairment and step two must be performed. Step two compares the carrying value of the reporting unit's goodwill to its implied fair value (i.e., fair value of the reporting unit less the fair value of the unit's assets and liabilities, including identifiable intangible assets). If the implied fair value of goodwill is less than the carrying amount of goodwill, an impairment is recognized.
Other amortizable intangible assets, which consist primarily of trademarks and trade names, customer-related intangibles and technological know-how, are amortized over their estimated useful lives using the straight line or sum-of-the-years digits method. The estimated useful lives for each major category of amortizable intangible assets are:
| |
|
|||
|---|---|---|---|---|
| | | | | |
| |
Years |
|||
| | | | | |
Trade name |
5 - 10 | |||
Technology and know-how |
5 - 9 | |||
Customer related intangible |
5 - 14 | |||
| | | | | |
Additional information about goodwill and other intangibles is set forth in Note 6 "Goodwill and Other Intangible Assets."
Major maintenance and repair costs
We perform scheduled major maintenance of the storage and processing units at our Seadrift plant (referred to as "overhaul"). Time periods between overhauls vary by unit. We also perform an annual scheduled significant maintenance and repair shutdown of the plant (referred to as "turnaround").
Costs of overhauls and turnarounds include plant personnel, contract services, materials, and rental equipment. We defer these costs when incurred and use the straight-line method to amortize them over the period of time estimated to lapse until the next scheduled overhaul of the applicable storage or processing unit. Under this policy no costs were deferred in 2017 or 2016. Amortization of deferred maintenance costs totaled $3.3 million and $7.0 million in 2017 or 2016, respectively. Amortization of deferred maintenance costs totaled $2.1 million in the period August 15 through December 31, 2015 and $4.3 million in the period January 1 through August 14, 2015.
F-12
Use of estimates
The preparation of financial statements in conformity with U.S. generally accepted accounting principles ("GAAP") requires us to make estimates and assumptions that affect the reported amounts of assets and liabilities and disclosure of contingent liabilities at the date of the Consolidated Financial Statements and the reported amounts of revenue and expenses. Significant estimates and assumptions are used for, but are not limited to inventory valuation, pension and other post-retirement benefits, allowance for doubtful accounts, accruals and valuation allowances, asset impairment, and environmental-related accruals. Actual results could differ from our estimates.
Discontinued operations and assets held for sale
When Management commits to a plan to sell assets or asset groups and a sale is probable, we reclassify those assets or asset groups into "Assets Held for Sale". Upon reclassification to assets held for sale, we evaluate the book value of the disposal groups against their fair value less costs to sell and as a result may impair the assets / asset groups. As and if new information becomes available on the fair value of the assets/asset groups, we may adjust accordingly the impairment.
Once the assets of a business have been classified as held for sale, we evaluate if the divestiture represents a strategic shift in operations and if so, we exclude the results of this business from continuing operations. All results are reported as gain or loss from discontinued operations, net of tax. During the second quarter of 2016, our Engineered Solutions business qualified as discontinued operations and as such, all its results have been excluded from continuing operations. See Note 3 "Discontinued Operations and Related Assets Held for Sale".
Subsequent events
We evaluate events that occur after the balance sheet date but before financial statements are issued to determine if a material event requires our amending the financial statements or disclosing the event. See Note 16 "Subsequent Events" for further details.
Predecessor and successor reporting
On August 17, 2015, the Company was acquired by affiliates of Brookfield Asset Management Inc. (see Note 2 "Preferred Share Issuance and Merger"). We elected to account for the acquisition under the acquisition method of accounting. Under the acquisition method of accounting, the assets and liabilities of GTI were adjusted to their fair market value as of August 15, 2015, the day on which Brookfield effectively took control of the Company.
Our consolidated statements of operations subsequent to the Merger include amortization expense relating to the fair value adjustment of intangibles and depreciation expense based on the fair value of the Company's property, plant and equipment that had previously been carried at historical cost less accumulated depreciation. Therefore, the Company's financial information prior to the Merger is not comparable to the financial information subsequent to the Merger. As a result, the financial statements and certain note presentations are separated into two distinct periods, the period before the consummation of the Merger (labeled "Predecessor") and the period after the date of merger (labeled "Successor"), to indicate the application of the different basis of accounting between the periods presented.
F-13
Unaudited pro forma balance sheet presentation
On February 12, 2018 the Company paid a dividend of $1,112.0 million ("2018 Dividend") to Brookfield following the closing of a refinancing transaction. The pro forma balance sheet gives effect to the 2018 Dividend as of December 31, 2017. This pro forma adjustment has been reflected as a dividend payable and an increase to our retained deficit. See Note 16 "Subsequent Events" for further details and additional required disclosure resulting from this transaction.
Recent accounting standards
Recently adopted accounting standards
In August 2017, the FASB issued ASU No. 2017-12, Derivatives and Hedging (Topic 815): Targeted Improvements to Accounting for Hedging Activities. The new standard simplifies hedge accounting through changes to both designation and measurement requirements. For hedges that qualify as highly effective, the new standard eliminates the requirement to separately measure and record hedge ineffectiveness resulting in better alignment between the presentation of the effects of the hedging instrument and the hedged item in the financial statements. We elected to early adopt ASU No. 2017-12 for the year ended December 31, 2017. The adoption of this standard required retrospective adoption, but did not impact prior-period financial results.
Accounting standards not yet adopted
In May 2014, the FASB issued ASU No. 2014-09, Revenue from Contracts with Customers (Topic 606). This ASU supersedes the revenue recognition requirements in Accounting Standards Codification 605—Revenue Recognition and most industry-specific guidance throughout the Codification. This ASU requires that an entity recognize revenue to depict the transfer of promised goods or services to customers in an amount that reflects the consideration to which the entity expects to be entitled in exchange for those goods or services. This ASU was expected to be effective for fiscal years beginning after December 15, 2016, and for interim periods within those fiscal years. On July 9, 2015, the FASB deferred the effective date to fiscal years beginning after December 15, 2017. During the fourth quarter of 2017, we substantially completed our evaluation of the new standard and the related assessment and review of a representative sample of existing revenue contracts with our customers, including our new three-to-five year take-or-pay agreements. We determined that this standard will not have a material impact on our consolidated financial statements. We are adopting this standard effective as of January 1, 2018 using the modified retrospective method.
In February 2016, the FASB issued ASU No. 2016-02, Leases (Topic 842). Under this new guidance, a company will now recognize most leases on its balance sheet as lease liabilities with corresponding right-of-use assets. This ASU is effective for fiscal years beginning after December 15, 2018. The Company has compiled its lease inventory and is currently evaluating the contracts and the impact of the adoption of this standard on its financial position, results of operations or cash flows.
In August 2016 the FASB issued ASU 2016-15, "Statement of Cash Flows (Topic 230), Classification of Certain Cash Receipts and Payments" (ASU 2016-15), clarifying guidance on the classification of certain cash receipts and payments in the statement of cash flows. The adoption of ASU 2016-15 on January 1, 2018 is not expected to have a material impact on our consolidated financial statements.
In January 2017, the FASB issued ASU No. 2017-04 Intangibles—Goodwill and Other (Topic 350). This guidance was issued to simplify the accounting for goodwill impairment. The guidance removes the second step of the goodwill impairment test, which requires that a hypothetical purchase price allocation be performed to determine the amount of impairment, if any. Under this new guidance, a goodwill impairment
F-14
charge will be based on the amount by which a reporting unit's carrying value exceeds its fair value, not to exceed the carrying amount of goodwill. The guidance will become effective on a prospective basis for the Company on January 1, 2020 with early adoption permitted for interim or annual goodwill impairment tests performed on testing dates after January 1, 2017. The Company is currently evaluating the impact of the adoption of this standard on its results of operations.
In March 2017, the FASB issued ASU No. 2017-07, Compensation—Retirement Benefits (Topic 715). This standard requires an entity to report the service cost component in the same line item as other compensation costs. The other components of net (benefit) cost including our annual mark-to-market re-measurement, will be presented in the income statement separately from the service cost component and outside a subtotal of income from operations. The adoption of ASU No. 2017-07 on January 1, 2018 will change the presentation of, but is not expected to have a material impact on our consolidated financial statements . The components of the net (benefit) cost are shown in Note 12, "Retirement Plans and Postretirement Benefits."
(2) Preferred share issuance and merger
Preferred stock
On August 11, 2015, the Company issued and sold to BCP IV GrafTech Holdings LP, an affiliate of Brookfield (i) 136,616 shares of a new Series A Convertible Preferred Stock, par value $0.01 per share (the "Series A Preferred Stock"), convertible into 19.9% of the shares of Common Stock of the Company outstanding immediately prior to such issuance and (ii) 13,384 shares of a new Series B Convertible Preferred Stock, par value $0.01 per share (the "Series B Preferred Stock," and, together with the Series A Preferred Stock, the "Preferred Stock"), convertible into 2% of the shares of Common Stock of the Company outstanding immediately prior to such issuance for an aggregate purchase price of $150,000,000 in cash (the "Purchase Price"), under the Investment Agreement dated May 4, 2015 (the "Investment Agreement") between the Company and Brookfield.
The closing of such issuance and sale occurred after the satisfaction of the closing conditions set forth in the Investment Agreement.
Pursuant to the Investment Agreement, the Company reimbursed Brookfield for $500,000 in out-of-pocket fees and expenses (including fees and expenses of legal counsel) incurred by Brookfield in connection with the transaction.
The proceeds from the issuance and sale were used by the Company, along with funds available under the Company's $40 million delayed draw term loan facility, revolving facility and cash on hand, to prepay the Company's $200 million Senior Subordinated Notes due November 30, 2015.
Merger agreement
On May 18, 2015, the Company entered into an Agreement and Plan of Merger (the "Merger Agreement"), dated May 17, 2015, with Brookfield (called "Parent" therein) and Athena Acquisition Subsidiary Inc. a wholly owned subsidiary of Parent ("Acquisition Sub"). Pursuant to the Merger Agreement, on May 26, 2015, Parent commenced a cash tender offer to purchase any and all of the outstanding shares of Common Stock, par value $0.01 per share (the "Shares"), of the Company, at a purchase price of $5.05 per Share in cash (the "Offer Price"), on the terms and subject to the conditions set forth in the Offer to Purchase, dated May 26, 2015 (together with any amendments and supplements thereto, the "Offer to Purchase") and in the related Letter of Transmittal (the "Letter of Transmittal" and, together with the Offer to Purchase, the "Offer").
F-15
On August 14, 2015, Acquisition Sub accepted for payment all Shares validly tendered in the Offer and not withdrawn prior to the expiration of the Offer, and payment of the Offer Price for such Shares was made promptly. On August 17, 2015, Acquisition Sub merged with and into the Company, with the Company surviving as a wholly owned subsidiary of Parent (the "Merger").
Pursuant to the Merger Agreement, upon consummation of the Merger, each Share that was not tendered and accepted pursuant to the Offer (other than canceled Shares, dissenting Shares and Shares held by the Company's subsidiaries or Parent's subsidiaries (other than Acquisition Sub)) was canceled and converted into cash consideration in an amount equal to the Offer Price.
Business combination
The computation of the fair value of the total consideration at the date of acquisition follows:
Purchase consideration
(In thousands except share price)
| |
|
|
|
|||||||
|---|---|---|---|---|---|---|---|---|---|---|
| | | | | | | | | | | |
| |
# Shares |
Unit price |
Amount |
|||||||
| | | | | | | | | | | |
Convertible Preferred Equity |
||||||||||
Series A and B |
150 | $ | 1,000.00 | $ | 150,000 | |||||
Common Equity |
||||||||||
Common Shares |
139,397 | $ | 5.05 | $ | 703,955 | |||||
Net value of options |
$ | 382 | ||||||||
| | | | | | | | | | | |
Total |
$ | 854,337 | ||||||||
| | | | | | | | | | | |
Recording of assets acquired and liabilities assumed: The acquisition was accounted for using the acquisition method of accounting. Under the acquisition method, the identifiable assets acquired and the liabilities assumed are assigned a new basis of accounting reflecting their estimated fair values. The information included herein has been prepared based on the allocation of purchase price using estimates of the fair values and useful lives of assets acquired and liabilities assumed based on the best available information determined with the assistance of independent valuations, quoted market prices and management estimates.
F-16
The following table summarizes the fair values of the identifiable assets acquired and liabilities assumed at the acquisition date:
| |
|
|||
|---|---|---|---|---|
| | | | | |
Net identifiable assets acquired |
||||
Cash |
$ | 25,032 | ||
Accounts receivable |
94,298 | |||
Inventories |
344,765 | |||
Property, plant and equipment |
650,405 | |||
Intangible assets |
155,700 | |||
Deferred tax assets |
41,606 | |||
Prepaid and other current assets |
49,716 | |||
Other non-current assets |
8,428 | |||
Accounts payable |
(68,005 | ) | ||
Short-term debt |
(18,779 | ) | ||
Other accrued liabilities |
(53,252 | ) | ||
Long-term debt |
(367,811 | ) | ||
Other long-term liabilities |
(101,648 | ) | ||
Deferred tax liabilities |
(79,235 | ) | ||
| | | | | |
Net identifiable assets acquired |
$ | 681,220 | ||
| | | | | |
Goodwill |
$ | 173,117 | ||
| | | | | |
Net assets acquired |
$ | 854,337 | ||
| | | | | |
Goodwill: Goodwill of approximately $173.1 million was recognized for the acquisition and is calculated as the excess of the consideration transferred over the net assets acquired and represents the future economic benefits arising from other assets acquired that could not be individually identified and separately recognized. This amount reflects an increase of $1.1 million recorded in March 2016.
(3) Discontinued operations and related assets held for sale
On February 26, 2016, the Company announced that it had initiated a strategic review of its Engineered Solutions business segment to better direct its resources and simplify its operations. Any potential sale of assets was prohibited by its revolving facility without approval of the requisite lenders thereunder. On April 27, 2016, GrafTech and certain of its subsidiaries entered into an amendment to the revolving facility (see Note 6 "Debt and Liquidity") which, among other things, permits the sale of assets with the restriction that the proceeds be utilized to pay down revolver borrowings. As of June 30, 2016, the Engineered Solutions segment qualified for reporting as discontinued operations as its divestiture represented a strategic shift for the Company.
During 2016, we evaluated the fair value of the Engineered Solutions business segment utilizing the market approach (Level 3 measure). As a result, we incurred an impairment charge to our Engineered Solutions business segment of $120 million to align the carrying value with estimated fair value. We continued to update this estimate and during 2017, we further reduced the estimated fair value by $5.3 million based upon current information at that time.
On November 30, 2016, we completed the sale of our Fiber Materials Inc. business, which was a business line within our former Engineered Solutions business. The sale resulted in cash proceeds of $15.9 million and a loss of $0.2 million. We have the ability to realize up to $8.5 million of additional proceeds based on
F-17
the earnings of the Fiber Materials business over the 24 months following the transaction. We have elected to record this contingent consideration as it is realized and accordingly, it has not been recognized to date.
On July 3, 2017, we completed the sale of our Advanced Energy Technologies (AET) business. AET was a product line within our Engineered Solutions business that had been classified as held for sale since the second quarter of 2016. The sale resulted in cash proceeds of $28.5 million.
On September 30, 2017, we completed the sale of the majority of the U.S. assets of our GrafTech Advanced Graphite Materials (GAGM) business, which was a component of our Engineered Solutions business. The sale of the Italian GAGM assets closed on October 5, 2017. In the jurisdictions where the GAGM assets were not acquired, we initiated the wind-down of the business. The sale was structured as a non-cash transaction with the buyer assuming certain liabilities associated with the assets acquired. In addition, GrafTech retained certain current assets of GAGM, mostly receivables, which have been substantially realized in the fourth quarter of 2017.
As a result of the sales described above, we recorded a gain of $6.1 million in 2017. The disposition of the Engineered Solutions business is now substantially complete.
In accordance with our Credit Facility, all cash proceeds from these sales were used to pay down our revolving facility and term loan.
The following tables summarize the results of the Engineered Solutions business segment, reclassified as discontinued operations:
| |
| |
| |
| |
| |
| ||||
|---|---|---|---|---|---|---|---|---|---|---|---|---|---|
| | | | | | | | | | | ||||
| |
| For the year ended December 31, 2017 |
| For the year ended December 31, 2016 |
| For the period August 15 through December 31, 2015 |
| For the period January 1 through August 14, 2015 |
| ||||
| | | | | | | | | | | ||||
|
| (Dollars in thousands) | | ||||||||||
Net sales |
| $ | 82,299 | | $ | 115,336 | | $ | 55,608 | | $ | 98,024 | |
Cost of sales |
| 74,723 | | 98,440 | | 49,068 | | 94,817 | | ||||
| | | | | | | | | | | ||||
Gross profit |
| 7,576 | | 16,896 | | 6,540 | | 3,207 | | ||||
Research and development |
| 1,429 | | 3,145 | | 1,265 | | 2,179 | | ||||
Selling and administrative expenses |
| 12,239 | | 19,220 | | 8,627 | | 16,764 | | ||||
Gain on sale of assets |
| (6,091 | ) | — | | — | | — | | ||||
Rationalizations |
| (35 | ) | (405 | ) | 791 | | 4,492 | | ||||
Impairment |
| 5,300 | | 119,907 | | — | | — | | ||||
| | | | | | | | | | | ||||
|
| (5,266 | ) | (124,971 | ) | (4,143 | ) | (20,228 | ) | ||||
Other expense (income) |
| (115 | ) | (66 | ) | (135 | ) | (90 | ) | ||||
Interest expense |
| 1,133 | | 3,258 | | 918 | | 907 | | ||||
| | | | | | | | | | | ||||
Loss from discontinued operations before income taxes |
| (6,284 | ) | (128,163 | ) | (4,926 | ) | (21,045 | ) | ||||
Benefit for income taxes on discontinued operations |
| (55 | ) | (1,189 | ) | — | | (2,366 | ) | ||||
| | | | | | | | | | | ||||
Loss from discontinued operations |
| $ | (6,229 | ) | $ | (126,974 | ) | $ | (4,926 | ) | $ | (18,679 | ) |
| | | | | | | | | | | ||||
F-18
The significant components of our Statements of Cash Flows for discontinued operations are as follows:
| |
| |
| |
| |
| |
| ||||
|---|---|---|---|---|---|---|---|---|---|---|---|---|---|
| | | | | | | | | | | ||||
| |
| Successor | | Predecessor | | ||||||||
| |
| For the year ended December 31, 2017 |
| For the year ended December 31, 2016 |
| For the period August 15 through December 31, 2015 |
| For the period January 1 through August 14, 2015 |
| ||||
| | | | | | | | | | | ||||
|
| (Dollars in thousands) | | ||||||||||
Depreciation and amortization |
| $ | 2,418 | | $ | 5,277 | | $ | 4,194 | | $ | 7,988 | |
Impairment |
| 5,300 | | 119,907 | | — | | — | | ||||
(Gain) loss on sale of assets |
| (6,091 | ) | 198 | | — | | — | | ||||
Net change in inventory |
| 15,217 | | (917 | ) | 3,514 | | (2,481 | ) | ||||
Cash received from divestitures |
| 27,254 | | 15,889 | | — | | — | | ||||
Credit facility reductions |
| (27,254 | ) | (15,889 | ) | — | | — | | ||||
Deferred income taxes |
| (55 | ) | (1,189 | ) | — | | (2,366 | ) | ||||
Capital expenditures |
| 558 | | 4,713 | | 4,447 | | 10,104 | | ||||
| | | | | | | | | | | ||||
The following table summarizes the carrying value of the assets and liabilities of discontinued operations as of December 31, 2017 and 2016.
| |
| |
| |
| ||
|---|---|---|---|---|---|---|---|
| | | | | | | ||
| |
| As of December 31, 2017 |
| As of December 31, 2016 |
| ||
| | | | | | | ||
|
| (Dollars in thousands) | | ||||
Assets of discontinued operations: |
| | | ||||
Accounts receivable |
| $ | 3,351 | | $ | 17,094 | |
Inventories |
| 502 | | 71,816 | | ||
Prepaid expenses and other current assets |
| 1,137 | | 320 | | ||
Net property, plant and equipment |
| 226 | | 79,048 | | ||
Other assets |
| 97 | | 12,608 | | ||
| | | | | | | ||
Total assets of discontinued operations |
| 5,313 | | 180,886 | | ||
| | | | | | | ||
Impairment of assets held for sale |
| — | | (119,907 | ) | ||
Total assets of discontinued operations |
| $ | 5,313 | | $ | 60,979 | |
| | | | | | | ||
Liabilities of discontinued operations: |
| | | ||||
Accounts payable |
| $ | 512 | | $ | 7,253 | |
Accrued income and other taxes |
| 158 | | 2,326 | | ||
Other accrued liabilities |
| 2,742 | | 10,463 | | ||
| | | | | | | ||
Total current liabilities of discontinued operations |
| 3,412 | | 20,042 | | ||
| | | | | | | ||
Other long-term obligations |
| 376 | | 850 | | ||
Total liabilities of discontinued operations |
| $ | 3,788 | | $ | 20,892 | |
| | | | | | | ||
(4) Rationalizations
Throughout 2013, 2014 and 2015 the Company undertook rationalization plans in order to streamline its organization and lower its production costs. On October 31, 2013, we announced a global initiative to
F-19
reduce our Industrial Materials segment's cost base and improve our competitive position. As part of this initiative, we ceased production at our two highest cost graphite electrode plants, located in Brazil and South Africa, as well as a machine shop in Russia. On July 29, 2014, we announced additional rationalization initiatives to increase profitability, reduce cost and improve global competitiveness in our former Engineered Solutions segment, which impacted our Corporate, R&D and other. During the third quarter of 2014, we announced the conclusion of another phase of our on-going company-wide cost savings assessment. This resulted in changes to the Company's operating and management structure in order to streamline, simplify and decentralize the organization. These actions were designed to reduce costs by a combination of reduced contractor costs, attrition, early retirements and layoffs. Additionally, the Company downsized its corporate functions by approximately 25 percent and relocated to a smaller, more cost effective corporate headquarters.
These initiatives were substantially complete as of December 31, 2016. We had no rationalization liability as of December 31, 2017 and a liability of $0.1 million as of December 31, 2016. We incurred $0.7 million rationalization and related charges during 2017 primarily related to the decision to discontinue a research and development project. We incurred rationalization and related charges of $2.4 million in 2016, charges of $0.4 million in the period August 15 through December 31, 2015 and $4.4 million in the period January 1 through August 14, 2015.
(5) Segment reporting
We previously operated two reportable business segments, Industrial Materials and Engineered Solutions. During the second quarter of 2016 the Company decided to sell the businesses that comprised our Engineered Solutions segment to focus on our Industrial Materials segment. Accordingly, the Engineered Solutions business qualified as held for sale status and the related results have been excluded from continuing operations. See Note 3 "Discontinued Operations and Assets Held for Sale" for significant components of the results of our Engineered Solutions segment.
Our Industrial Materials segment manufactures high quality graphite electrodes essential to the production of electric arc furnace steel and other ferrous and non-ferrous metals. Petroleum needle coke, a crystalline form of carbon derived from decant oil, is the primary raw material used in the production of graphite electrodes. We utilize substantially all the needle coke that we produce internally to manufacture our graphite electrodes and as a result more than 90% of our revenues from external customers are derived from the sale of graphite electrodes and graphite electrode by-products from our manufacturing processes.
Assets are managed based on geographic location because certain continuing and discontinued operations share certain facilities.
F-20
The following tables summarize information as to our continuing operations in different geographic areas.
| |
| |
| |
| |
| |||
|---|---|---|---|---|---|---|---|---|---|---|
| | | | | | | | | |||
| |
| 2017 |
| 2016 |
| 2015 |
| |||
| | | | | | | | | |||
|
| (Dollars in thousands) | | |||||||
Net sales:* |
| | | | ||||||
U.S. |
| $ | 103,890 | | $ | 74,526 | | $ | 107,517 | |
Americas |
| 129,103 | | 116,944 | | 132,917 | | |||
Asia Pacific |
| 46,329 | | 41,302 | | 37,509 | | |||
Europe, Middle East, Africa |
| 271,449 | | 205,191 | | 255,097 | | |||
| | | | | | | | | |||
Total |
| $ | 550,771 | | $ | 437,963 | | $ | 533,040 | |
| | | | | | | | | |||
* Net sales were not impacted by purchase price accounting adjustments.
| |
|
|
|||||
|---|---|---|---|---|---|---|---|
| | | | | | | | |
| |
At December 31, | ||||||
| |
2017 |
2016 |
|||||
| | | | | | | | |
|
(Dollars in thousands) | ||||||
Long-lived assets(a): |
|||||||
U.S. and Canada |
$ | 177,298 | $ | 191,502 | |||
Mexico |
147,959 | 151,288 | |||||
Brazil |
3,547 | 6,100 | |||||
France |
80,035 | 69,558 | |||||
Spain |
103,819 | 87,614 | |||||
South Africa |
20 | 2,547 | |||||
Other countries |
163 | 246 | |||||
| | | | | | | | |
Total |
$ | 512,841 | $ | 508,855 | |||
| | | | | | | | |
(a) Long-lived assets represent fixed assets, net of accumulated depreciation.
(6) Goodwill and other intangible assets
We are required to review goodwill and indefinite-lived intangible assets annually for impairment. Goodwill impairment is tested at the reporting unit level on an annual basis and between annual tests if an event occurs or circumstances change that would more likely than not reduce the fair value of a reporting unit below its carrying value. For the years ended December 31, 2017 and 2016, an assessment for potential impairment was performed and an impairment adjustment was not required.
We received notice, in March 2015, that the market prices for needle coke were decreasing 18%, effective for the second quarter of 2015. This decline compressed our margins for needle coke products versus our annual plan assumptions. We determined that this change, which was driven by overcapacity in the market, indicated that the needle coke industry was facing a deeper and longer trough than previously expected. As such, we considered the additional price change as a triggering event for our Needle coke reporting unit and tested its goodwill for impairment as of March 31, 2015. In the first step of the analysis, we compared the estimated fair value of the reporting unit to its carrying value, including goodwill. The fair value of the reporting unit was determined based on an income approach, using a discounted cash-flow ("DCF") model from a market participant's perspective. The estimated future cash-flows were updated versus the year-end analysis to reflect the expectation of a longer trough. A discount rate of 10.5% was applied to the forecasted cash-flows and is based on a weighted average cost of capital ("WACC"). Company specific beta and mix of debt to equity are inputs into the determination of the WACC, which is then qualitatively assessed from the standpoint of potential market participants. Based on the step one analysis described earlier, the fair value of the needle coke reporting unit was below its carrying value, resulting in a step two analysis and consequently the full impairment of the needle coke goodwill, resulting in a charge of $35.4 million.
F-21
As a result of our acquisition by Brookfield, our goodwill and intangibles were revalued as of August 15, 2015. See Note 2 "Preferred Share Issuance and Merger" for description of the Merger and the results of purchase price accounting. The following table represents the changes in the carrying value of goodwill and intangibles from December 31, 2015 through December 31, 2017:
| |
| |
| |
|---|---|---|---|---|
| | | | | |
| |
| Total |
| |
| | | | | |
|
| (Dollars in thousands) | | |
Balance as of December 31, 2015 |
| $ | 172,059 | |
Adjustments (See Note 2) |
| 1,058 | | |
Goodwill transferred to discontinued operations |
| (2,000 | ) | |
| | | | | |
Balance as of December 31, 2016 |
| $ | 171,117 | |
Adjustments |
| — | | |
| | | | | |
Balance as of December 31, 2017 |
| $ | 171,117 | |
| | | | | |
The following table summarizes acquired intangible assets with determinable useful lives by major category which are included in "Other Assets" on our consolidated balance sheets:
| |
| |
| |
| |
| |
| |
| |
| ||||||
|---|---|---|---|---|---|---|---|---|---|---|---|---|---|---|---|---|---|---|---|
| | | | | | | | | | | | | | | ||||||
| |
| As of December 31, 2017 |
| As of December 31, 2016 |
| ||||||||||||||
| | | | | | | | | | | | | | | ||||||
| |
| Gross carrying amount |
| Accumulated amortization |
| Net carrying amount |
| Gross carrying amount |
| Accumulated amortization |
| Net carrying amount |
| ||||||
| | | | | | | | | | | | | | | ||||||
|
| (Dollars in thousands) | | ||||||||||||||||
Trade name |
| $ | 22,500 | | $ | (5,512 | ) | $ | 16,988 | | $ | 22,500 | | $ | (3,235 | ) | $ | 19,265 | |
Technology and know-how |
| 55,300 | | (17,265 | ) | 38,035 | | 55,300 | | (10,397 | ) | 44,903 | | ||||||
Customer related intangible |
| 64,500 | | (10,637 | ) | 53,863 | | 64,500 | | (6,177 | ) | 58,323 | | ||||||
| | | | | | | | | | | | | | | ||||||
Total finite-lived intangible assets |
| $ | 142,300 | | $ | (33,414 | ) | $ | 108,886 | | $ | 142,300 | | $ | (19,809 | ) | $ | 122,491 | |
| | | | | | | | | | | | | | | ||||||
Amortization expense of intangible assets was $13.6 million and $14.3 million in 2017 and 2016, respectively. Amortization expense of intangible assets was $5.5 million in the period August 15 through December 31, 2015 and $10.5 million in the period January 1 through August 14, 2015. Estimated annual amortization expense for the next five years will approximate $12.9 million in 2018, $12.2 million in 2019, $11.4 million in 2020, $10.7 million in 2021 and $10.1 million in 2022.
F-22
(7) Debt and liquidity
The following table presents our long-term debt:
| |
| |
| |
| ||
|---|---|---|---|---|---|---|---|
| | | | | | | ||
| |
| As of December 31, 2017 |
| As of December 31, 2016 |
| ||
| | | | | | | ||
|
| (Dollars in thousands) | | ||||
Credit Facility (revolving facility and term loan facility) |
| $ | 58,192 | | $ | 90,731 | |
Senior Notes |
| 280,586 | | 274,132 | | ||
Other Debt |
| 596 | | 569 | | ||
| | | | | | | ||
Total Debt |
| 339,374 | | 365,432 | | ||
Less: Short-term Debt |
| (16,474 | ) | (8,852 | ) | ||
| | | | | | | ||
Long-term Debt |
| $ | 322,900 | | $ | 356,580 | |
| | | | | | | ||
Old revolving credit facility and term loan facility
On April 23, 2014, the Company and certain of its subsidiaries entered into an amended and restated credit agreement governing a revolving facility with a borrowing capacity of $400 million and a maturity date of April 2019. On February 27, 2015, GrafTech and certain of its subsidiaries entered into a further amended and restated credit agreement that provided for, among other things, greater financial flexibility and a $40 million senior secured delayed draw term loan facility.
On July 28, 2015, GrafTech and certain of its subsidiaries entered into an amendment to the mended and restated credit agreement to change the terms regarding the occurrence of a default upon a change in control (which is defined thereunder to include the acquisition by any person of more than 25% of GrafTech's outstanding shares) to exclude the acquisition of shares by Brookfield (see Note 2). In addition, effective upon such acquisition, the financial covenants were eased, resulting in increased availability under the revolving facility. The size of the revolving facility was also reduced from $400 million to $375 million. The size of the term loan facility remained at $40 million.
On April 27, 2016, GrafTech and certain of its subsidiaries entered into an amendment to the revolving facility. The size of the revolving facility was permanently reduced from $375 million to $225 million. New covenants were also added to the revolving facility, including a requirement to make mandatory repayments of outstanding amounts under the revolving facility and the term loan facility with the proceeds of any sale of all or any substantial part of the assets included in the Engineered Solutions segment and a requirement to maintain minimum liquidity (consisting of domestic cash, cash equivalents and availability under the revolving facility) in excess of $25 million. The covenants were also modified to provide for: the elimination of certain exceptions to the Company's negative covenants limiting the Company's ability to make certain investments, sell assets, make restricted payments, incur liens and incur debt; a restriction on the amount of cash and cash equivalents permitted to be held on the balance sheet at any one time without paying down the revolving facility and the term loan facility; and changes to the Company's financial covenants so that until the earlier of March 31, 2019 or the Company has $75 million in trailing twelve month EBITDA (as defined in the revolving facility), the Company is required to maintain trailing twelve month EBITDA above certain minimums ranging from ($40 million) to $35 million after which the Company's existing financial covenants under the revolving facility will apply.
With this amendment, the Company has full access to the $225 million revolving facility, subject to the $25 million minimum liquidity requirement. As of December 31, 2017, the Company had $39.5 million of
F-23
borrowings on the revolving facility and $8.7 million of letters of credit drawn against the revolving facility. As of December 31, 2016, the Company had $61.2 million of borrowings and $12.3 million of letters of credit, for a total of $73.5 million drawn agains the revolving facility.
The $40 million term loan facility was fully drawn on August 11, 2015, in connection with the repayment of the Senior Subordinated Notes. The balance of the term loan facility was $18.7 million as of December 31, 2017.
The interest rate applicable to the revolving facility and term loan facility was LIBOR plus a margin ranging from 2.25% to 4.75% (depending on our total senior secured leverage ratio). The borrowers were required to pay a per annum fee ranging from 0.35% to 0.70% (depending on our senior secured leverage ratio) on the undrawn portion of the commitments under the Revolving Facility.
In the event that operating cash flows fail to provide sufficient liquidity to meet our business needs, including capital expenditures, any such shortfall would need to be made up by increased borrowings under our revolving facility, to the extent available. In accordance with our credit facility, we used cash proceeds from the sale of our Engineered Solutions businesses to repay borrowings outstanding under the revolving facility and the term loan.
As of December 31, 2017, we were in compliance with all financial and other covenants contained in the revolving facility, as applicable.
Senior notes
On November 20, 2012, the Company issued $300 million principal amount of 6.375% Senior Notes due 2020 (the "Senior Notes"). The Senior Notes are the Company's senior unsecured obligations and rank pari passu with all of the Company's existing and future senior unsecured indebtedness. The Senior Notes are guaranteed on a senior unsecured basis by each of the Company's existing and future subsidiaries that guarantee certain other indebtedness of the Company or another guarantor.
The Senior Notes bear interest at a rate of 6.375% per year, payable semi-annually in arrears on May 15 and November 15 of each year. The Senior Notes mature on November 15, 2020.
The Company is entitled to redeem some or all of the Senior Notes at any time on or after November 15, 2016, at the redemption prices set forth in the indenture. In addition, prior to November 15, 2016, the Company may redeem some or all of the Senior Notes at a price equal to 100% of the principal amount thereof, plus accrued and unpaid interest, if any, plus a "make whole" premium determined as set forth in the indenture.
If, prior to maturity, a change in control (as defined in the indenture) of the Company occurs and thereafter certain downgrades of the ratings of the Senior Notes as specified in the indenture occur, the Company will be required to offer to repurchase any or all of the Senior Notes at a repurchase price equal to 101% of the aggregate principal amount of the Senior Notes, plus any accrued and unpaid interest. On August 17, 2015 a change in control occurred due to the merger (see Note 2 to the Financial Statements). However, the downgrade of the ratings of the Senior Notes, as specified in the indenture, did not occur. Therefore, the company was not and will not be required to offer to repurchase the Senior Notes as a result of the merger.
The indenture for the Senior Notes also contains covenants that, among other things, limit the ability of the Company and certain of its subsidiaries to: (i) create liens or use assets as security in other
F-24
transactions; (ii) engage in certain sale/leaseback transactions; and (iii) merge, consolidate or sell, transfer, lease or dispose of substantially all of their assets.
The indenture for the Senior Notes also contains customary events of default, including (i) failure to pay principal or interest on the Senior Notes when due and payable, (ii) failure to comply with covenants or agreements in the indenture or the Senior Notes which failures are not cured or waived as provided in the indenture, (iii) failure to pay indebtedness of the Company, any Subsidiary Guarantor or Significant Subsidiary (each, as defined in the indenture) within any applicable grace period after maturity or acceleration and the total amount of such indebtedness unpaid or accelerated exceeds $50.0 million, (iv) certain events of bankruptcy, insolvency, or reorganization, (v) failure to pay any judgment or decree for an amount in excess of $50.0 million against the Company, any Subsidiary Guarantor or any Significant Subsidiary that is not discharged, waived or stayed as provided in the indenture, (vi) cessation of any Subsidiary Guarantee (as defined in the indenture) to be in full force and effect or denial or disaffirmance by any subsidiary guarantor of its obligations under its subsidiary guarantee, and (vii) a default under the Company's Senior Subordinated Notes. In the case of an event of default, the principal amount of the Senior Notes plus accrued and unpaid interest may be accelerated.
Senior subordinated notes
On November 30, 2010, in connection with the acquisitions of Seadrift Coke LP and C/G Electrodes, LLC, the Company issued Senior Subordinated Notes in an aggregate total face amount of $200 million. These Senior Subordinated Notes were non-interest bearing and matured in 2015. Because the Senior Subordinated Notes were non-interest bearing, the Company was required to record them at their present value (determined using an interest rate of 7%). The difference between the face amount of the Senior Subordinated Notes and their present value is recorded as debt discount. The debt discount was amortized to income using the interest method, over the life of the Senior Subordinated Notes.
On July 9, 2015, the Company provided notice to all holders of the Senior Subordinated Notes that, as permitted under the Senior Subordinated Notes, the Company intended to prepay in full the entire $200 million aggregate principal amount of the Senior Subordinated Notes after the Company's receipt of the proceeds of the issuance of Preferred Stock to Brookfield. See Note 2 for further discussion of the Preferred Stock issuance. This prepayment was consummated on August 11, 2015.
Refinancing
On February 12, 2018, the Company entered into a new credit agreement replacing the Senior Notes and the debt outstanding under the revolving facility. See Note 16 "Subsequent Events" for a full description of the transaction.
F-25
(8) Interest expense
The following table presents an analysis of interest expense:
| |
| |
| |
| |
| |
| ||||
|---|---|---|---|---|---|---|---|---|---|---|---|---|---|
| | | | | | | | | | | ||||
| |
| Successor | | Predecessor | | ||||||||
| |
| For the year ended December 31, 2017 |
| For the year ended December 31, 2016 |
| For the period August 15 through December 31, 2015 |
| For the period January 1 through August 14, 2015 |
| ||||
| | | | | | | | | | | ||||
| |
| (Dollars in thousands) |
| ||||||||||
Interest incurred on debt |
| $ | 24,060 | | $ | 20,408 | | $ | 7,694 | | $ | 12,066 | |
Amortization of discount on Senior Subordinated Notes |
| — | | — | | — | | 12,027 | | ||||
Accretion of fair value adjustment on Senior Notes |
| 6,454 | | 6,305 | | 2,305 | | — | | ||||
Amortization of debt issuance costs |
| 309 | | 201 | | — | | 2,118 | | ||||
| | | | | | | | | | | ||||
Total interest expense |
| $ | 30,823 | | $ | 26,914 | | $ | 9,999 | | $ | 26,211 | |
| | | | | | | | | | | ||||
Interest rates
The revolving facility had an effective interest rate of 4.57% and 5.52% as of December 31, 2017 and 2016, respectively. The Senior Notes carried an interest rate of 6.375%. The Senior Subordinated Notes had an implied rate of 7.00%.
On August 11, 2015, we prepaid our Senior Subordinated Notes (see Note 7 "Debt and Liquidity"). This prepayment resulted in accelerated amortization of $4.5 million as the Senior Subordinated Notes were prepaid at the face value. The accelerated expense was recorded in the predecessor period.
(9) Fair value measurements and derivative instruments
Fair market value measurements
Depending on the inputs, we classify each fair value measurement as follows:
- •
- Level 1—based upon quoted prices for identical instruments in active
markets,
- •
- Level 2—based upon quoted prices for similar instruments, prices for
identical or similar instruments in markets that are not active, or model-derived valuations of all of whose significant inputs are observable, and
- •
- Level 3—based upon one or more significant unobservable inputs.
The following section describes key inputs and assumptions used in valuation methodologies of our assets and liabilities measured at fair value on a recurring basis:
Cash and cash equivalents, short-term notes and accounts receivable, accounts payable and other current payables—The carrying amount approximates fair value because of the short maturity of these instruments.
Debt—The fair value of our debt as of December 31, 2017 was $359.2 million versus a book value of $339.4 million.The fair value of our debt as of December 31, 2016 was $342.1 million versus a book value
F-26
of $365.4 million. The fair values of the Senior Notes and the revolving facility were determined using level 2 and level 3 inputs, respectively.
Assets held for sale—Assets held for sale values are determined using Level 3 fair value inputs. These represent management's estimate of fair value based upon current quotes from participants in the sales process.
Foreign currency derivatives—Foreign currency derivatives are carried at market value using Level 2 inputs. We had outstanding losses of $0.1 million and $0.2 million as of December 31, 2017 and 2016, respectively.
Commodity derivative contracts—Commodity derivative contracts are carried at fair value. We determine the fair value using observable, quoted natural gas and refined oil product prices that are determined by active markets and therefore classify the commodity derivative contracts as Level 2. We had outstanding gains of $5.3 million and outstanding losses of $0.6 million as of December 31, 2017. There were no outstanding gains or losses as of December 31, 2016.
Additional fair value information related to our Pension funds' assets can be found in Note 12 "Retirement Plans and Postretirement Benefits".
Derivative instruments
We use derivative instruments as part of our overall foreign currency and commodity risk management strategies to manage the risk of exchange rate movements that would reduce the value of our foreign cash flows and to minimize commodity price volatility. Foreign currency exchange rate movements create a degree of risk by affecting the value of sales made and costs incurred in currencies other than the US dollar.
Certain of our derivative contracts contain provisions that require us to provide collateral. Since the counterparties to these financial instruments are large commercial banks and similar financial institutions, we do not believe that we are exposed to material counterparty credit risk. We do not anticipate nonperformance by any of the counter-parties to our instruments.
Foreign currency derivatives
We enter into foreign currency derivatives from time to time to attempt to manage exposure to changes in currency exchange rates. These foreign currency instruments, which include, but are not limited to, forward exchange contracts and purchased currency options, attempt to hedge global currency exposures such as foreign currency denominated debt, sales, receivables, payables, and purchases. Forward exchange contracts are agreements to exchange different currencies at a specified future date and at a specified rate. There was no ineffectiveness on these contracts during the twelve months ended December 31, 2016 or 2017.
In 2016 and 2017, we entered into foreign forward currency derivatives as hedges of anticipated cash flows denominated in the Mexican peso, South African rand, euro and Japanese yen. These derivatives were entered into to protect the risk that the eventual cash flows resulting from such transactions will be adversely affected by changes in exchange rates between the US dollar and the Mexican peso, South African rand, euro, Swiss franc and Japanese yen. As of December 31, 2017, we had outstanding Mexican peso, South African rand, euro, Swiss franc and Japanese yen currency contracts, with aggregate notional amounts of $18.9 million. As of December 31, 2016, we had outstanding Mexican peso, euro and Japanese yen currency contracts, with aggregate notional amounts of $22.6 million. The foreign currency derivatives outstanding as of December 31, 2017 have maturity dates in January 2018.
F-27
Commodity derivative contracts
We have entered into commodity derivative contracts for refined oil products. These contracts are entered into to protect against the risk that eventual cash flows related to these products will be adversely affected by future changes in prices. In the fourth quarter of 2017, we began to enter into three-to five-year take-or-pay contracts with many of our customers. We had outstanding commodity derivative contracts as of December 31, 2017 with notional amount of $143.9 million with maturities from January 2018 to June 2022. The outstanding commodity derivative contracts represented a net unrealized gain of $4.7 million as of December 31, 2017.
Net investment hedges
We use certain intercompany debt to hedge a portion of our net investment in our foreign operations against currency exposure (net investment hedge). Intercompany debt designated in foreign currency and designated as a non-derivative net investment hedging instrument was $14.8 million and $13.3 million as of December 31, 2017 and 2016, respectively. Within our currency translation adjustment portion of other comprehensive income, we recorded a gain of $1.4 million in 2017, and a loss of $1.5 million in 2016, resulting from these net investment hedges.
The fair value of all derivatives is recorded as assets or liabilities on a gross basis in our Consolidated Balance Sheets. At December 31, 2017 and 2016, the fair value of our derivatives and their respective balance sheet locations are presented in the following table:
| |
| |
| |
| |
| |
| ||
|---|---|---|---|---|---|---|---|---|---|---|---|
| | | | | | | | | | | ||
| |
| Asset derivatives | | Liability derivatives | | ||||||
| |
| Location |
| Fair value |
| Location |
| Fair value |
| ||
| | | | | | | | | | | ||
| |
| (Dollars in thousands) |
| ||||||||
As of December 31, 2017 |
| | | | | ||||||
Derivatives designated as cash flow hedges: |
| | | | | ||||||
Commodity derivative contracts |
| Prepaid and other current assets | | $ | 2,518 | | Other accrued liabilities | | $ | — | |
|
| Other long-term assets | | 2,808 | | Other long-term obligations | | 581 | | ||
| | | | | | | | | | | ||
Total fair value |
| | $ | 5,326 | | | $ | 581 | | ||
| | | | | | | | | | | ||
| |
| |
| |
| |
| |
| ||
|---|---|---|---|---|---|---|---|---|---|---|---|
| | | | | | | | | | | ||
| |
| Asset derivatives | | Liability derivatives | | ||||||
| |
| Location |
| Fair value |
| Location |
| Fair value |
| ||
| | | | | | | | | | | ||
| |
| (Dollars in thousands) |
| ||||||||
As of December 31, 2017 |
| | | | | ||||||
Derivatives not designated as hedges: |
| | | | | ||||||
Foreign currency derivatives |
| Prepaid and other current assets | | $ | 9 | | Other current liabilities | | $ | 90 | |
As of December 31, 2016 |
| | | | | ||||||
Derivatives not designated as hedges: |
| | | | | ||||||
Foreign currency derivatives |
| Prepaid and other current assets | | $ | 10 | | Other current liabilities | | $ | 188 | |
| | | | | | | | | | | ||
F-28
The location and amount of realized (gains) losses on derivatives are recognized in the Statements of Operations when the hedged item impacts earnings and are as follows for the years ended 2017 and 2016:
| |
| |
| |
| |
| |
| |
| ||||
|---|---|---|---|---|---|---|---|---|---|---|---|---|---|---|---|
| | | | | | | | | | | | | ||||
| |
| |
| Amount of (gain)/loss recognized | | ||||||||||
| |
| Location of (gain)/loss recognized in the consolidated statement of income |
| 2017 |
| 2016 |
| For the period August 15 through December 31, 2015 |
| For the period January 1 through December August 14, 2015 |
| ||||
| | | | | | | | | | | | | ||||
| |
| |
| (Dollars in thousands) |
| ||||||||||
Derivatives designated as cash flow hedges: |
| | | | | | |||||||||
Foreign currency derivatives, excluding tax of $0, $32, $17 and $106, respectively |
| Revenue/Cost of goods sold /Other expense /(income) | | $ | — | | $ | (322 | ) | $ | (172 | ) | $ | (1,062 | ) |
Commodity forward derivatives, excluding tax of ($424) |
| Cost of goods sold | | $ | — | | $ | — | | $ | — | | $ | 1,161 | |
| | | | | | | | | | | | | ||||
| |
| |
| |
| |
| |
| |
| ||||
|---|---|---|---|---|---|---|---|---|---|---|---|---|---|---|---|
| | | | | | | | | | | | | ||||
| |
| |
| Amount of (gain)/loss recognized | | ||||||||||
| |
| Location of (gain)/loss recognized in the consolidated statement of income |
| 2017 |
| 2016 |
| For the period August 15 through December 31, 2015 |
| For the period January 1 through December August 14, 2015 |
| ||||
| | | | | | | | | | | | | ||||
| |
| |
| (Dollars in thousands) |
| ||||||||||
Derivatives not designated as hedges: |
| | | | | | |||||||||
Foreign currency derivatives |
| Cost of goods sold, Other expense/(income) | | $ | (1,565 | ) | $ | 549 | | $ | (560 | ) | $ | 1,060 | |
| | | | | | | | | | | | | ||||
Our commodity derivatives are treated as hedges and are required to be measured at fair value on a recurring basis. With respect to the inputs used to determine the fair value, we use observable, quoted rates that are determined by active markets and, therefore, classify the contracts as "Level 2".
F-29
(10) Supplementary balance sheet detail
The following tables present supplementary balance sheet details:
| |
| |
| |
| ||
|---|---|---|---|---|---|---|---|
| | | | | | | ||
| |
| As of December 31, 2017 |
| As of December 31, 2016 |
| ||
| | | | | | | ||
(Dollars in thousands) |
| ||||||
Inventories: |
| | | ||||
Raw materials and supplies |
| $ | 39,434 | | $ | 54,469 | |
Work in process |
| 85,852 | | 52,379 | | ||
Finished goods |
| 48,865 | | 49,263 | | ||
| | | | | | | ||
|
| 174,151 | | 156,111 | | ||
| | | | | | | ||
Prepaid expenses and other current assets: |
| | | ||||
Prepaid expenses |
| $ | 9,505 | | $ | 6,096 | |
Value added tax and other indirect taxes receivable |
| 18,627 | | 12,984 | | ||
Spare parts inventory |
| 11,010 | | — | | ||
Other current assets |
| 5,730 | | 2,585 | | ||
| | | | | | | ||
|
| $ | 44,872 | | $ | 21,665 | |
| | | | | | | ||
Property, plant and equipment: |
| | | ||||
Land and improvements |
| $ | 46,599 | | $ | 43,737 | |
Buildings |
| 59,608 | | 55,440 | | ||
Machinery and equipment and other |
| 495,069 | | 460,892 | | ||
Construction in progress |
| 41,375 | | 25,635 | | ||
| | | | | | | ||
|
| $ | 642,651 | | $ | 585,704 | |
| | | | | | | ||
Other accrued liabilities: |
| | | ||||
Payrolls (including incentive programs) |
| $ | 14,196 | | $ | 4,802 | |
Employee benefits |
| 4,684 | | 11,439 | | ||
Customer prepayments |
| 20,784 | | — | | ||
Other |
| 13,562 | | 14,278 | | ||
| | | | | | | ||
|
| $ | 53,226 | | $ | 30,519 | |
| | | | | | | ||
Other long term obligations: |
| | | ||||
Postretirement benefits |
| $ | 20,508 | | $ | 19,002 | |
Pension and related benefits |
| 36,116 | | 45,876 | | ||
Other |
| 12,283 | | 17,270 | | ||
| | | | | | | ||
|
| $ | 68,907 | | $ | 82,148 | |
| | | | | | | ||
F-30
The following table presents an analysis of the allowance for doubtful accounts:
| |
| |
| |
| |
| |
| ||||
|---|---|---|---|---|---|---|---|---|---|---|---|---|---|
| | | | | | | | | | | ||||
| |
| 2017 |
| 2016 |
| For the period August 15 through December 31, 2015 |
| For the period January 1 through August 14, 2015 |
| ||||
| | | | | | | | | | | ||||
|
| (Dollars in thousands) | | ||||||||||
Balance at beginning of year |
| $ | 326 | | $ | 244 | | $ | — | | $ | 6,969 | |
Additions |
| 771 | | 129 | | 244 | | 85 | | ||||
Deductions |
| — | | (47 | ) | — | | (1,177 | ) | ||||
| | | | | | | | | | | ||||
Balance at end of year |
| $ | 1,097 | | $ | 326 | | $ | 244 | | $ | 5,877 | |
| | | | | | | | | | | ||||
(11) Commitments
Lease commitments under non-cancelable operating leases extending for one year or more will require the following future payments:
| |
| |
| |
|---|---|---|---|---|
| | | | | |
| |
| (Dollars in thousands) |
| |
| | | | | |
2018 |
| $ | 2,180 | |
2019 |
| 1,873 | | |
2020 |
| 773 | | |
2021 |
| 399 | | |
2022 |
| 314 | | |
After 2022 |
| 649 | | |
| | | | | |
Total lease and rental expenses under non-cancelable operating leases extending one year or more approximated $5.3 million in 2017, $3.6 million in 2016 and $6.2 million in 2015.
(12) Retirement plans and postretirement benefits
Retirement plans
On February 26, 1991, we formed our own retirement plan covering substantially all our U.S. employees. Under our plan, covered employees earned benefit payments based primarily on their service credits and wages subsequent to February 26, 1991.
Prior to that date, substantially all our U.S. employees were participants in the U.S. retirement plan of Union Carbide Corporation ("Union Carbide"). While service credit was frozen, covered employees continued to earn benefits under the Union Carbide plan based on their final average wages through February 26, 1991, adjusted for salary increases (not to exceed six percent per annum) through January 26, 1995, the date Union Carbide ceased to own a minimum 50% of the equity of GTI. The Union Carbide plan is responsible for paying retirement and death benefits earned as of February 26, 1991.
Effective January 1, 2002, we established a defined contribution plan for U.S. employees. Certain employees had the option to remain in our defined benefit plan for an additional period of up to five years. Employees not covered by this option had their benefits under our defined benefit plan frozen as of December 31, 2001, and began participating in the defined contribution plan.
F-31
Effective March 31, 2003, we curtailed our qualified benefit plan and the benefits were frozen as of that date for the U.S. employees who had the option to remain in our defined benefit plan. We also closed our non-qualified U.S. defined benefit plan for the participating salaried workforce. The employees began participating in the defined contribution plan as of April 1, 2003.
Pension coverage for employees of foreign subsidiaries is provided, to the extent deemed appropriate, through separate plans. Obligations under such plans are systematically provided for by depositing funds with trustees, under insurance policies or by book reserves.
The components of our consolidated net pension costs are set forth in the following table:
| |
| |
| |
| |
| |
| |
| |
| ||||||
|---|---|---|---|---|---|---|---|---|---|---|---|---|---|---|---|---|---|---|---|
| | | | | | | | | | | | | | | ||||||
| |
| Successor | | ||||||||||||||||
| |
| 2017 | | 2016 | | For the period August 15 through December 31, 2015 |
| ||||||||||||
| |
| U.S. |
| Foreign |
| U.S. |
| Foreign |
| U.S. |
| Foreign |
| ||||||
| | | | | | | | | | | | | | | ||||||
|
| | | (Dollars in thousands) | | ||||||||||||||
Service cost |
| $ | 1,305 | | $ | 710 | | $ | 1,325 | | $ | 698 | | $ | 386 | | $ | 281 | |
Interest cost |
| 5,352 | | 199 | | 5,744 | | 243 | | 2,200 | | 94 | | ||||||
Expected return on assets |
| (5,268 | ) | (299 | ) | (4,940 | ) | (298 | ) | (1,885 | ) | (59 | ) | ||||||
Curtailment gain |
| — | | — | | — | | — | | — | | (675 | ) | ||||||
Mark-to-market loss (gain) |
| (4,140 | ) | (53 | ) | (2,322 | ) | (220 | ) | 716 | | 1,843 | | ||||||
| | | | | | | | | | | | | | | ||||||
Pension costs |
| $ | (2,751 | ) | $ | 557 | | $ | (193 | ) | $ | 423 | | $ | 1,417 | | $ | 1,484 | |
| | | | | | | | | | | | | | | ||||||
| |
| |
| |
| ||
|---|---|---|---|---|---|---|---|
| | | | | | | ||
| |
| Predecessor | | ||||
| |
| For the period January 1 through August 14, 2015 |
| ||||
| |
| U.S. |
| Foreign |
| ||
| | | | | | | ||
Service cost |
| $ | 151 | | $ | 98 | |
Interest cost |
| 854 | | 554 | | ||
Amortization of prior service cost |
| — | | (12 | ) | ||
| | | | | | | ||
Pension costs |
| $ | 1,005 | | $ | 640 | |
| | | | | | | ||
The mark-to-market gain in 2017 was the result of better than expected returns on assets, partially offset by an unfavorable change to the discount rate. The mark-to-market gain in 2016 was the result of better than expected returns on plan assets and favorable changes to the mortality tables, partially offset by unfavorable changes to the discount rate. The mark-to-market loss in 2015 was caused by unfavorable changes to the discount rate.
Amounts recognized in other comprehensive income did not represent a significant portion of our total post-retirement cost. As a result of our acquisition by Brookfield (see Note 2 "Preferred Share Issuance and Merger"), our pension and post-retirement obligations were revalued as of August 15, 2015. The result of this valuation eliminated historical components of Other Comprehensive Income.
F-32
The reconciliation of the beginning and ending balances of our pension plans' benefit obligations, fair value of assets, and funded status at December 31, 2017 and 2016 are:
| |
| |
| |
| |
| |
| ||||
|---|---|---|---|---|---|---|---|---|---|---|---|---|---|
| | | | | | | | | | | ||||
| |
| As of December 31, 2017 | | As of December 31, 2016 | | ||||||||
| |
| U.S. |
| Foreign |
| U.S. |
| Foreign |
| ||||
| | | | | | | | | | | ||||
|
| (Dollars in thousands) | | ||||||||||
Changes in Benefit Obligation: |
| | | | | ||||||||
Net Benefit Obligation at beginning of period |
| $ | 140,230 | | $ | 18,237 | | $ | 142,126 | | $ | 18,271 | |
Service cost |
| 1,305 | | 710 | | 1,325 | | 698 | | ||||
Interest cost |
| 5,352 | | 199 | | 5,744 | | 243 | | ||||
Participant contributions |
| — | | 252 | | — | | 256 | | ||||
Plan amendments / curtailments |
| — | | — | | — | | (122 | ) | ||||
Foreign currency exchange changes |
| — | | 1,069 | | — | | (527 | ) | ||||
Actuarial loss (gain) |
| 3,212 | | 63 | | 1,293 | | (18 | ) | ||||
Benefits paid |
| (10,353 | ) | (123 | ) | (10,258 | ) | (564 | ) | ||||
| | | | | | | | | | | ||||
Net benefit obligation at end of period |
| $ | 139,746 | | $ | 20,407 | | $ | 140,230 | | $ | 18,237 | |
| | | | | | | | | | | ||||
Changes in Plan Assets: |
| | | | | ||||||||
Fair value of plan assets at beginning of period |
| $ | 100,905 | | $ | 11,871 | | $ | 93,897 | | $ | 11,293 | |
Actual return on plan assets |
| 12,620 | | 415 | | 8,556 | | 378 | | ||||
Foreign currency exchange rate changes |
| — | | 545 | | — | | (346 | ) | ||||
Employer contributions |
| 6,673 | | 658 | | 8,710 | | 854 | | ||||
Participant contributions |
| — | | 252 | | — | | 256 | | ||||
Benefits paid |
| (10,353 | ) | (123 | ) | (10,258 | ) | (564 | ) | ||||
| | | | | | | | | | | ||||
Fair value of plan assets at end of period |
| $ | 109,845 | | $ | 13,618 | | $ | 100,905 | | $ | 11,871 | |
| | | | | | | | | | | ||||
Funded status (underfunded): |
| $ | (29,901 | ) | $ | (6,789 | ) | $ | (39,325 | ) | $ | (6,366 | ) |
| | | | | | | | | | | ||||
Amounts recognized in accumulated other comprehensive loss: |
| | | | | ||||||||
Prior service credit |
| $ | — | | $ | — | | $ | — | | $ | — | |
| | | | | | | | | | | ||||
Amounts recognized in the statement of financial position: |
| | | | | ||||||||
Non-current assets |
| $ | — | | $ | — | | $ | — | | $ | — | |
Current liabilities |
| (433 | ) | (146 | ) | (435 | ) | (128 | ) | ||||
Non-current liabilities |
| (29,468 | ) | (6,643 | ) | (38,890 | ) | (6,238 | ) | ||||
| | | | | | | | | | | ||||
Net amount recognized |
| $ | (29,901 | ) | $ | (6,789 | ) | $ | (39,325 | ) | $ | (6,366 | ) |
| | | | | | | | | | | ||||
The accumulated benefit obligation for all defined benefit pension plans was $158.6 million and $157.0 million as of December 31, 2017 and 2016, respectively.
Plan assets
The accounting guidance on fair value measurements specifies a hierarchy based on the observability of inputs used in valuation techniques (Level 1, 2 and 3). See Note 9, "Fair Value Measurements and Derivative Instruments," for a discussion of the fair value hierarchy.
F-33
The following describes the methods and significant assumptions used to estimate the fair value of the investments:
Cash and cash equivalents—Valued at cost. Cash equivalents are valued at net asset value as provided by the administrator of the fund.
Foreign government bonds—Valued by the trustees using various pricing services of financial institutions.
Debt securities—Valued by the trustee at year-end using various pricing services of financial institutions, including Interactive Data Corporation, Standard & Poor's and Telekurs.
Equity securities—Valued at the closing price reported on the active market on which the security is traded.
Fixed insurance contract—Valued at the present value of the guaranteed payment streams.
Investment contracts—Valued at the total cost of annuity contracts purchased, adjusted for market differences from the date of purchase to year-end.
Collective trusts—Valued at the net asset value provided by the administrator of the fund. The net asset value is based on the value of the underlying assets owned by the fund, minus its liabilities, divided by the number of units outstanding.
The fair value of the plan assets by category is summarized below (dollars in thousands):
| |
|
|
|
|
|||||||||
|---|---|---|---|---|---|---|---|---|---|---|---|---|---|
| | | | | | | | | | | | | | |
| |
As of December 31, 2017 |
||||||||||||
| | | | | | | | | | | | | | |
| |
Level 1 |
Level 2 |
Level 3 |
Total |
|||||||||
| | | | | | | | | | | | | | |
U.S. Plan Assets |
|||||||||||||
Cash and cash equivalents |
$ | 2,094 | $ | — | $ | — | $ | 2,094 | |||||
Collective trusts |
— | 107,751 | — | 107,751 | |||||||||
| | | | | | | | | | | | | | |
Total |
$ | 2,094 | $ | 107,751 | $ | — | $ | 109,845 | |||||
International Plan Assets |
|||||||||||||
Foreign government bonds |
$ | — | $ | 831 | $ | — | $ | 831 | |||||
Fixed insurance contracts |
— | — | 12,787 | 12,787 | |||||||||
| | | | | | | | | | | | | | |
Total |
$ | — | $ | 831 | $ | 12,787 | $ | 13,618 | |||||
| | | | | | | | | | | | | | |
| |
|
|
|
|
|||||||||
|---|---|---|---|---|---|---|---|---|---|---|---|---|---|
| | | | | | | | | | | | | | |
| |
As of December 31, 2016 |
||||||||||||
| | | | | | | | | | | | | | |
| |
Level 1 |
Level 2 |
Level 3 |
Total |
|||||||||
| | | | | | | | | | | | | | |
U.S. Plan Assets |
|||||||||||||
Cash and cash equivalents |
$ | 1,502 | $ | — | $ | — | $ | 1,502 | |||||
Collective trusts |
— | 99,403 | — | 99,403 | |||||||||
| | | | | | | | | | | | | | |
Total |
$ | 1,502 | $ | 99,403 | $ | — | $ | 100,905 | |||||
International Plan Assets |
|||||||||||||
Foreign government bonds |
$ | — | $ | 729 | $ | — | $ | 729 | |||||
Fixed insurance contracts |
— | — | 11,142 | 11,142 | |||||||||
| | | | | | | | | | | | | | |
Total |
$ | — | $ | 729 | $ | 11,142 | $ | 11,871 | |||||
| | | | | | | | | | | | | | |
F-34
The following table presents the changes for those financial instruments classified within Level 3 of the valuation hierarchy for international plan pension assets for the years ended December 31, 2016 and 2017 (dollars in thousands):
| |
|
|||
|---|---|---|---|---|
| | | | | |
| |
Fixed insurance contracts |
|||
| | | | | |
Balance at December 31, 2015 |
$ | 10,453 | ||
Gain / contributions / currency impact |
707 | |||
Distributions |
(18 | ) | ||
| | | | | |
Balance at December 31, 2016 |
11,142 | |||
Gain / contributions / currency impact |
1,651 | |||
Distributions |
(6 | ) | ||
| | | | | |
Balance at December 31, 2017 |
$ | 12,787 | ||
| | | | | |
We annually re-evaluate assumptions and estimates used in projecting pension assets, liabilities and expenses. These assumptions and estimates may affect the carrying value of pension assets, liabilities and expenses in our Consolidated Financial Statements. Assumptions used to determine net pension costs and projected benefit obligations are:
| |
|
|
|||||
|---|---|---|---|---|---|---|---|
| | | | | | | | |
| |
As of December 31, |
||||||
| | | | | | | | |
| |
2017 |
2016 |
|||||
| | | | | | | | |
Pension Benefit Obligations Key Assumptions |
|||||||
Weighted average assumptions to determine benefit obligations: |
|||||||
Discount rate |
3.20% | 3.61% | |||||
Rate of compensation increase |
1.57% | 1.57% | |||||
Pension Cost Key Assumptions |
|||||||
Weighted average assumptions to determine net cost: |
|||||||
Discount rate |
3.61% | 3.86% | |||||
Expected return on plan assets |
4.95% | 4.97% | |||||
Rate of compensation increase |
1.57% | 1.84% | |||||
| | | | | | | | |
We adjust our discount rate annually in relation to the rate at which the benefits could be effectively settled. Discount rates are set for each plan in reference to the yields available on AA-rated corporate bonds of appropriate currency and duration. The appropriate discount rate is derived by developing an AA-rated corporate bond yield curve in each currency. The discount rate for a given plan is the rate implied by the yield curve for the duration of that plan's liabilities. In certain countries, where little public information is available on which to base discount rate assumptions, the discount rate is based on government bond yields or other indices and approximate adjustments to allow for the differences in weighted durations for the specific plans and/or allowance for assumed credit spreads between government and AA rated corporate bonds.
The expected return on assets assumption represents our best estimate of the long-term return on plan assets and generally was estimated by computing a weighted average return of the underlying long-term expected returns on the different asset classes, based on the target asset allocations. The expected return
F-35
on assets assumption is a long-term assumption that is expected to remain the same from one year to the next unless there is a significant change in the target asset allocation, the fees and expenses paid by the plan or market conditions.
The rate of compensation increase assumption is generally based on salary increases.
Plan Assets. The following table presents our retirement plan weighted average asset allocations at December 31, 2017, by asset category:
| |
|
|
|||||
|---|---|---|---|---|---|---|---|
| | | | | | | | |
| |
Percentage of plan assets as of December 31, 2017 |
||||||
| | | | | | | | |
| |
US |
Foreign |
|||||
| | | | | | | | |
Equity securities and return seeking assets |
20% | —% | |||||
Fixed income, debt securities, or cash |
80% | 100% | |||||
| | | | | | | | |
Total |
100% | 100% | |||||
| | | | | | | | |
Investment Policy and Strategy. The investment policy and strategy of the U.S. plan is to invest approximately 20% in equities and return seeking assets and approximately 80% in fixed income securities. Rebalancing is undertaken monthly. To the extent we maintain plans in other countries, target asset allocation is 100% fixed income investments. For each plan, the investment policy is set within both asset return and local statutory requirements.
Information for our pension plans with an accumulated benefit obligation in excess of plan assets at December 31, 2016 and 2017 follows:
| |
|
|
|
|
|||||||||
|---|---|---|---|---|---|---|---|---|---|---|---|---|---|
| | | | | | | | | | | | | | |
| |
2017 |
2016 |
|||||||||||
| | | | | | | | | | | | | | |
| |
U.S. |
Foreign |
U.S. |
Foreign |
|||||||||
| | | | | | | | | | | | | | |
|
(Dollars in thousands) | ||||||||||||
Accumulated benefit obligation |
$ | 139,746 | $ | 18,843 | $ | 140,230 | $ | 16,057 | |||||
Fair value of plan assets |
109,845 | 13,618 | 100,905 | 11,142 | |||||||||
| | | | | | | | | | | | | | |
Information for our pension plans with a projected benefit obligation in excess of plan assets at December 31, 2016 and 2017 follows:
| |
|
|
|
|
|||||||||
|---|---|---|---|---|---|---|---|---|---|---|---|---|---|
| | | | | | | | | | | | | | |
| |
2017 |
2016 |
|||||||||||
| | | | | | | | | | | | | | |
| |
U.S. |
Foreign |
U.S. |
Foreign |
|||||||||
| | | | | | | | | | | | | | |
|
(Dollars in thousands) | ||||||||||||
Projected benefit obligation |
$ | 139,746 | $ | 20,407 | $ | 140,230 | $ | 17,415 | |||||
Fair value of plan assets |
109,845 | 13,618 | 100,905 | 11,142 | |||||||||
| | | | | | | | | | | | | | |
F-36
Following is our projected future pension plan cash flow by year:
| |
|
|
|||||
|---|---|---|---|---|---|---|---|
| | | | | | | | |
| |
U.S. |
Foreign |
|||||
| | | | | | | | |
|
(Dollars in thousands) | ||||||
Expected contributions in 2018: |
|||||||
Expected employer contributions |
$ | 4,542 | $ | 558 | |||
Expected employee contributions |
— | — | |||||
Estimated future benefit payments reflecting expected future service for the years ending December 31: |
|||||||
2018 |
9,086 | 864 | |||||
2019 |
9,053 | 751 | |||||
2020 |
9,083 | 743 | |||||
2021 |
9,116 | 778 | |||||
2022 |
9,103 | 771 | |||||
2023 - 2027 |
44,783 | 6,285 | |||||
| | | | | | | | |
Post-employment benefit plans
We provide life insurance benefits for eligible retired employees. These benefits are provided through various insurance companies. We accrue the estimated net postretirement benefit costs during the employees' credited service periods.
In July 2002, we amended our U.S. postretirement medical coverage. In 2003 and 2004, we discontinued the Medicare Supplement Plan (for retirees 65 years or older or those eligible for Medicare benefits). This change applied to all U.S. active employees and retirees. In June 2003, we announced the termination of the existing early retiree medical plan for retirees under age 65, effective December 31, 2005. In addition, we limited the amount of retiree's life insurance after December 31, 2004. These modifications are accounted for prospectively. The impact of these changes is being amortized over the average remaining period to full eligibility of the related postretirement benefits.
During 2009, we amended one of our U.S. plans to eliminate the life insurance benefit for certain non-pooled participants.
The components of our consolidated net postretirement costs are set forth in the following table:
| |
|
|
|
|
|
|
|||||||||||||
|---|---|---|---|---|---|---|---|---|---|---|---|---|---|---|---|---|---|---|---|
| | | | | | | | | | | | | | | | | | | | |
|
Successor | ||||||||||||||||||
| | | | | | | | | | | | | | | | | | | | |
|
For the period August 15 through |
||||||||||||||||||
|
2017 | 2016 | December 31, 2015 | ||||||||||||||||
| | | | | | | | | | | | | | | | | | | | |
| |
U.S. |
Foreign |
U.S. |
Foreign |
U.S. |
Foreign |
|||||||||||||
| | | | | | | | | | | | | | | | | | | | |
|
(Dollars in thousands) | ||||||||||||||||||
Service cost |
$ | — | $ | 2 | $ | — | $ | 4 | — | $ | 5 | ||||||||
Interest cost |
333 | 653 | 360 | 764 | 142 | 289 | |||||||||||||
Plan amendment / curtailment |
— | — | — | (993 | ) | — | — | ||||||||||||
Mark-to-market (gain) loss |
(1,257 | ) | 742 | (191 | ) | (225 | ) | (100 | ) | (621 | ) | ||||||||
| | | | | | | | | | | | | | | | | | | | |
Post-employment benefits cost (benefit) |
$ | (924 | ) | $ | 1,397 | $ | 169 | $ | (450 | ) | $ | 42 | $ | (327 | ) | ||||
| | | | | | | | | | | | | | | | | | | | |
F-37
| |
| |
| |
| ||
|---|---|---|---|---|---|---|---|
| | | | | | | ||
| |
| Successor |
| ||||
| | | | | | | ||
| |
| For the period January 1 through August 14, 2015 |
| ||||
| | | | | | | ||
| |
| U.S. |
| Foreign |
| ||
| | | | | | | ||
| |
| (Dollars in thousands) |
| ||||
Service cost |
| $ | — | | $ | 9 | |
Interest cost |
| 223 | | 433 | | ||
Plan amendment / curtailment |
| — | | — | | ||
Mark-to-market (gain) loss |
| — | | — | | ||
| | | | | | | ||
Post-employment benefits cost (benefit) |
| $ | 223 | | $ | 442 | |
| | | | | | | ||
Amounts recognized in other comprehensive income did not represent a significant portion of our total post-retirement cost. As a result of our acquisition by Brookfield (see Note 2 "Preferred Share Issuance and Merger"), our pension and post-retirement obligations were revalued as of August 15, 2015. The result of this valuation eliminated historical components of Other Comprehensive Income.
The reconciliation of beginning and ending balances of benefit obligations under, fair value of assets of, and the funded status of, our postretirement plans is set forth in the following table:
| |
|
|
|
|
|||||||||
|---|---|---|---|---|---|---|---|---|---|---|---|---|---|
| | | | | | | | | | | | | | |
| |
As of December 31, 2017 |
As of December 31, 2016 |
|||||||||||
| Postretirement benefits |
U.S. |
Foreign |
U.S. |
Foreign |
|||||||||
| | | | | | | | | | | | | | |
| |
(Dollars in thousands) |
||||||||||||
Changes in Benefit Obligation: |
|||||||||||||
Net benefit obligation at beginning of period |
$ | 10,175 | $ | 10,700 | $ | 10,859 | $ | 11,296 | |||||
Service cost |
— | 2 | — | 4 | |||||||||
Interest cost |
333 | 653 | 360 | 764 | |||||||||
Foreign currency exchange rates |
— | 931 | — | 709 | |||||||||
Actuarial loss (gain) |
(1,257 | ) | 742 | (191 | ) | (225 | ) | ||||||
Gross benefits paid |
(790 | ) | (856 | ) | (853 | ) | (855 | ) | |||||
Plan amendment |
— | — | — | (993 | ) | ||||||||
| | | | | | | | | | | | | | |
Net benefit obligation at end of period |
$ | 8,461 | $ | 12,172 | $ | 10,175 | $ | 10,700 | |||||
| | | | | | | | | | | | | | |
Changes in Plan Assets: |
|||||||||||||
Fair value of plan assets at beginning of period |
$ | — | $ | — | $ | — | $ | — | |||||
Employer contributions |
790 | 856 | 853 | 855 | |||||||||
Gross benefits paid |
(790 | ) | (856 | ) | (853 | ) | (855 | ) | |||||
| | | | | | | | | | | | | | |
Fair value of plan assets at end of period |
$ | — | $ | — | $ | — | $ | — | |||||
| | | | | | | | | | | | | | |
Funded status: |
$ | (8,461 | ) | $ | (12,172 | ) | $ | (10,175 | ) | $ | (10,700 | ) | |
| | | | | | | | | | | | | | |
Amounts recognized in accumulated other comprehensive loss: |
|||||||||||||
Prior service credit |
$ | — | $ | — | $ | — | $ | — | |||||
| | | | | | | | | | | | | | |
Amounts recognized in the statement of financial position: |
|||||||||||||
Current liabilities |
$ | (855 | ) | $ | (912 | ) | $ | (1,134 | ) | $ | (738 | ) | |
Non-current liabilities |
(7,606 | ) | (11,260 | ) | (9,041 | ) | (9,962 | ) | |||||
| | | | | | | | | | | | | | |
Net amount recognized |
$ | (8,461 | ) | $ | (12,172 | ) | $ | (10,175 | ) | $ | (10,700 | ) | |
| | | | | | | | | | | | | | |
F-38
We annually re-evaluate assumptions and estimates used in projecting the postretirement liabilities and expenses. These assumptions and estimates may affect the carrying value of postretirement plan liabilities and expenses in our Consolidated Financial Statements. Assumptions used to determine net postretirement benefit costs and postretirement projected benefit obligation are set forth in the following table:
Postretirement benefit obligations
| |
|
|
|||||
|---|---|---|---|---|---|---|---|
| | | | | | | | |
| |
2017 |
2016 |
|||||
| | | | | | | | |
Weighted average assumptions to determine benefit obligations: |
|||||||
Discount rate |
5.07% | 4.80% | |||||
Health care cost trend on covered charges: |
|||||||
Initial |
6.86% | 6.80% | |||||
Ultimate |
6.23% | 5.96% | |||||
Years to ultimate |
8 | 8 | |||||
| | | | | | | | |
Postretirement benefit costs
| |
|
|
|||||
|---|---|---|---|---|---|---|---|
| | | | | | | | |
| |
2017 |
2016 |
|||||
| | | | | | | | |
Weighted average assumptions to determine net cost: |
|||||||
Discount rate |
4.80% | 5.10% | |||||
Health care cost trend on covered charges: |
|||||||
Initial |
6.80% | 6.67% | |||||
Ultimate |
5.96% | 6.48% | |||||
Years to ultimate |
7 | 1 | |||||
| | | | | | | | |
Assumed health care cost trend rates have a significant effect on the amounts reported for our postretirement benefits. A one-percentage point change in assumed health care cost trend rates would have the following effects at December 31, 2017:
| |
|
|
|
|
|||||||||
|---|---|---|---|---|---|---|---|---|---|---|---|---|---|
| | | | | | | | | | | | | | |
| |
One percentage point increase |
One percentage point decrease |
|||||||||||
| |
U.S. |
Foreign |
U.S. |
Foreign |
|||||||||
| | | | | | | | | | | | | | |
| |
(Dollars in thousands) |
||||||||||||
Effect on total service cost and interest cost components |
$ | 2 | $ | 60 | $ | (2 | ) | $ | (50 | ) | |||
Effect on benefit obligations |
$ | 28 | $ | 639 | $ | (27 | ) | $ | (546 | ) | |||
| | | | | | | | | | | | | | |
Discount rates are set for each plan in reference to the yields available on AA-rated corporate bonds of appropriate currency and duration. The appropriate discount rate is derived by developing an AA-rated corporate bond yield curve in each currency. The discount rate for a given plan is the rate implied by the yield curve for the duration of that plan's liabilities. In certain countries, where little public information is available on which to base discount rate assumptions, the discount rate is based on government bond yields or other indices and approximate adjustments to allow for the differences in weighted durations for the specific plans and/or allowance for assumed credit spreads between government and AA-rated corporate bonds.
F-39
The following table represents projected future postretirement cash flow by year:
| |
|
|
|||||
|---|---|---|---|---|---|---|---|
| | | | | | | | |
| |
U.S. |
Foreign |
|||||
| | | | | | | | |
| |
(Dollars in thousands) |
||||||
Expected contributions in 2018: |
|||||||
Expected employer contributions |
$ | 855 | $ | 912 | |||
Expected employee contributions |
— | — | |||||
Estimated future benefit payments reflecting expected future service for the years ending December 31: |
|||||||
2018 |
855 | 912 | |||||
2019 |
800 | 907 | |||||
2020 |
740 | 909 | |||||
2021 |
678 | 900 | |||||
2022 |
622 | 885 | |||||
2020 - 2024 |
2,415 | 4,518 | |||||
| | | | | | | | |
Savings plan
Our employee savings plan provides eligible employees the opportunity for long-term savings and investment. The plan allows employees to contribute up to 5% of pay as a basic contribution and an additional 45% of pay as supplemental contribution. We contributed $1.6 million to our Savings Plan in 2017 and $2.5 million in 2016.
(13) Contingencies
Legal proceedings
We are involved in various investigations, lawsuits, claims, demands, environmental compliance programs and other legal proceedings arising out of or incidental to the conduct of our business. While it is not possible to determine the ultimate disposition of each of these matters, we do not believe that their ultimate disposition will have a material adverse effect on our financial position, results of operations or cash flows.
Litigation has been pending in Brazil brought by employees seeking to recover additional amounts and interest thereon under certain wage increase provisions applicable in 1989 and 1990 under collective bargaining agreements to which employers in the Bahia region of Brazil were a party (including our subsidiary in Brazil). Prior to October 1, 2015, we were not party to such litigation. Companies in Brazil have recently settled claims arising out of these provisions and, in May 2015, the litigation was remanded, in favor of the employees, by the Brazil Supreme Court to the lower courts for further proceedings which included procedural aspects of the case, such as admissibility of instruments filed by the parties. On October 1, 2015, an action was filed by current and former employees against our subsidiary in Brazil to recover amounts under such provisions, plus interest thereon, which amounts together with interest could be material to us. In the first quarter of 2017, the state court ruled in favor of the employees. We have appealed this ruling and intend to vigorously defend it. As of December 31, 2017, we are unable to assess the potential loss associated with these proceedings as the claims do not currently specify the number of employees seeking damages or the amount of damages being sought.
F-40
Product warranties
We generally sell products with a limited warranty. We accrue for known warranty claims if a loss is probable and can be reasonably estimated. We also accrue for estimated warranty claims incurred based on a historical claims charge analysis. Product warranties were not impacted by purchase price accounting adjustments. Claims accrued but not yet paid and the related activity within the reserve for 2016 and 2017 are as follows:
| |
| |
| |
|---|---|---|---|---|
| | | | | |
| |
| (Dollars in thousands) |
| |
| | | | | |
Balance as of December 31, 2015 |
| $ | 388 | |
Product warranty charges/adjustments |
| 1,285 | | |
Payments and settlements |
| (704 | ) | |
| | | | | |
Balance as of December 31, 2016 |
| $ | 969 | |
Product warranty charges/adjustments |
| (149 | ) | |
Payments and settlements |
| (471 | ) | |
| | | | | |
Balance as of December 31, 2017 |
| $ | 349 | |
| | | | | |
(14) Income taxes
The following table summarizes the U.S. and non-U.S. components of income (loss) from continuing operations before provision for income taxes:
| |
| |
| |
| |
| |
| ||||
|---|---|---|---|---|---|---|---|---|---|---|---|---|---|
| | | | | | | | | | | ||||
| |
| Successor | | Predecessor | | ||||||||
| |
| For the year ended December 31, 2017 |
| For the year ended December 31, 2016 |
| For the period August 15 through December 31, 2015 |
| For the period January 1 through August 14, 2015 |
| ||||
| | | | | | | | | | | ||||
| |
| (Dollars in thousands) |
| ||||||||||
U.S. |
| $ | (26,981 | ) | $ | (44,971 | ) | $ | (16,827 | ) | $ | (84,599 | ) |
Non-U.S. |
| 30,412 | | (71,450 | ) | (4,916 | ) | (10,919 | ) | ||||
| | | | | | | | | | | ||||
|
| $ | 3,431 | | $ | (116,421 | ) | $ | (21,743 | ) | $ | (95,518 | ) |
| | | | | | | | | | | ||||
F-41
Income tax expense (benefit) consists of the following:
| |
| |
| |
| |
| |
| ||||
|---|---|---|---|---|---|---|---|---|---|---|---|---|---|
| | | | | | | | | | | ||||
| |
| Successor | | Predecessor | | ||||||||
| |
| For the year ended December 31, 2017 |
| For the year ended December 31, 2016 |
| For the period August 15 through December 31, 2015 |
| For the period January 1 through August 14, 2015 |
| ||||
| | | | | | | | | | | ||||
| |
| (Dollars in thousands) |
| ||||||||||
U.S income taxes: |
| | | | | ||||||||
Current |
| $ | (1,066 | ) | $ | (878 | ) | $ | (52 | ) | $ | (20 | ) |
Deferred |
| 38 | | 1,152 | | 686 | | 403 | | ||||
| | | | | | | | | | | ||||
|
| (1,028 | ) | 274 | | 634 | | 383 | | ||||
| | | | | | | | | | | ||||
Non-U.S. income taxes: |
| | | | | ||||||||
Current |
| 5,924 | | 5,389 | | 1,566 | | 5,547 | | ||||
Deferred |
| (15,677 | ) | (13,215 | ) | 4,682 | | 522 | | ||||
| | | | | | | | | | | ||||
|
| (9,753 | ) | (7,826 | ) | 6,248 | | 6,069 | | ||||
| | | | | | | | | | | ||||
Total income tax (benefit) expense |
| $ | (10,781 | ) | $ | (7,552 | ) | $ | 6,882 | | $ | 6,452 | |
| | | | | | | | | | | ||||
The 2017 tax benefit was primarily the result of the release of a valuation allowance reserve set up against GrafTech Switzerland deferred tax assets.
The Tax Cuts and Jobs Act (the "2017 Tax Act"), which was signed into law on December 22, 2017, has resulted in significant changes to the U.S. corporate income tax system. These changes include a federal statutory rate reduction from 35% to 21%, the elimination or reduction of certain domestic deductions and credits and limitations on the deductibility of interest expense and executive compensation. The 2017 Tax Act also transitions international taxation from a worldwide system to a modified territorial system and includes base erosion prevention measures on non-U.S. earnings, which has the effect of subjecting certain earnings of GrafTech's foreign subsidiaries to U.S. taxation as global intangible low-taxed income (GILTI). These changes are effective beginning in 2018. The 2017 Tax Act also includes a one-time mandatory deemed repatriation tax on the accumulated, previously untaxed foreign earnings of GrafTech's foreign subsidiaries. Changes in tax rates and tax laws are accounted for in the period of enactment. Therefore, during the year ended December 31, 2017, GrafTech recorded a charge totaling $54.1 million (including a $52.2 million charge for tax rate reduction, $39.6 million of transition tax, partially offset by $37.7 million of additional foreign tax credit related to the transition tax) related to its current estimate of the impact of the 2017 Tax Act. This increase in the tax charge was predominately offset by a partial release of our valuation allowance established on its U.S. deferred tax assets as a result of current utilization of U.S. net operating loss carryforwards. Therefore, the Tax Act had minimal impact on our 2017 income tax provision.
The net charge recorded as a provisional amount as of December 31, 2017 represents GrafTech's best estimate using information available as of March 1, 2018. GrafTech anticipates U.S. regulatory agencies will issue further regulations during 2018, which may alter this estimate. GrafTech is still evaluating amongst other things, its position with respect to permanent reinvestment of foreign earnings overseas and other related outside basis difference considerations and the amount of tax owed on unremitted earnings by subsidiaries. GrafTech believes its remeasurement of the U.S. deferred tax assets and liabilities is complete, except for changes in estimates that can result from finalizing the filing of our 2017 U.S. income tax return, which are not anticipated to be material, and changes that may be a direct impact of other
F-42
provisional amounts recorded due to the enactment of the Act. GrafTech will refine its estimates to incorporate new or better information as it becomes available through the filing date of its 2017 U.S income tax returns in the fourth quarter of 2018.
Income tax expense (benefit) differed from the amounts computed by applying the U.S. federal income tax rate of 35% to income before (benefit) expense for income taxes as set forth in the following table:
| |
| |
| |
| |
| |
| ||||
|---|---|---|---|---|---|---|---|---|---|---|---|---|---|
| | | | | | | | | | | ||||
| |
| Successor | | Predecessor | | ||||||||
| |
| For the year ended December 31, 2017 |
| For the year ended December 31, 2016 |
| For the period August 15 through December 31, 2015 |
| For the period January 1 through August 14, 2015 |
| ||||
| | | | | | | | | | | ||||
| |
| (Dollars in thousands) |
| ||||||||||
Tax at statutory U.S. federal rate |
| $ | 1,201 | | $ | (40,747 | ) | $ | (7,610 | ) | $ | (33,431 | ) |
Valuation allowance, net |
| (89,269 | ) | 35,091 | | 7,355 | | 21,532 | | ||||
State taxes, net of federal tax benefit |
| 3,437 | | (2,324 | ) | (697 | ) | (2,005 | ) | ||||
Impact of the 2017 Tax Act—transition tax |
| 39,628 | | — | | — | | — | | ||||
Impact of the 2017 Tax Act—tax rate change |
| 52,228 | | — | | — | | — | | ||||
U.S. tax impact of foreign earnings (net foreign tax credits) |
| 1,151 | | 51 | | 139 | | — | | ||||
Establishment/resolution of uncertain tax positions |
| (840 | ) | (513 | ) | 64 | | 71 | | ||||
Adjustment for foreign income taxed at different rates |
| (2,359 | ) | 12,738 | | 7,120 | | 11,136 | | ||||
Foreign tax credits |
| (18,244 | ) | — | | — | | — | | ||||
Non-U.S. tax exemptions, holidays and credits |
| 288 | | (175 | ) | 228 | | (691 | ) | ||||
Goodwill impairment/disposal |
| 700 | | — | | — | | 8,026 | | ||||
Investment in subsidiary impairment deduction |
| — | | (10,114 | ) | — | | — | | ||||
Other |
| 1,299 | | (1,562 | ) | 283 | | 1,814 | | ||||
| | | | | | | | | | | ||||
(Benefit) provision for income taxes |
| $ | (10,781 | ) | $ | (7,552 | ) | $ | 6,882 | | $ | 6,452 | |
| | | | | | | | | | | ||||
The Company has been granted a tax holiday in Brazil, which expires in 2024. The availability of the tax holiday in Brazil did not have a significant impact on the current tax year.
F-43
The tax effects of temporary differences that give rise to significant components of the deferred tax assets and deferred tax liabilities at December 31, 2017, and December 31, 2016 are set forth in the following table:
| |
|
|
|||||
|---|---|---|---|---|---|---|---|
| | | | | | | | |
| |
As of December 31, |
||||||
| | | | | | | | |
| |
2017 |
2016 |
|||||
| | | | | | | | |
| |
(Dollars in thousands) |
||||||
Deferred tax assets: |
|||||||
Fixed assets |
$ | — | $ | 41,677 | |||
Postretirement and other employee benefits |
19,392 | 32,275 | |||||
Foreign tax credit and other carryforwards |
175,229 | 153,169 | |||||
Capitalized research and experimental costs |
9,417 | 18,146 | |||||
Environmental reserves |
493 | 4,237 | |||||
Inventory |
7,933 | 15,227 | |||||
Original issue discount |
2,603 | 6,461 | |||||
Long-term contract option amortization |
1,204 | 2,074 | |||||
Provision for rationalization charges |
502 | 7,498 | |||||
Other |
1,536 | 3,391 | |||||
| | | | | | | | |
Total gross deferred tax assets |
218,309 | 284,155 | |||||
Less: valuation allowance |
(150,839 | ) | (244,841 | ) | |||
| | | | | | | | |
Total deferred tax assets |
67,470 | 39,314 | |||||
| | | | | | | | |
Deferred tax liabilities: |
|||||||
Fixed assets |
$ | 68,098 | $ | 47,346 | |||
Debt discount amortization / Deferred financing fees |
3,191 | 6,544 | |||||
Inventory |
5,128 | 3,482 | |||||
Goodwill and acquired intangibles |
— | 2,295 | |||||
Other |
2,031 | 2,751 | |||||
| | | | | | | | |
Total deferred tax liabilities |
78,448 | 62,418 | |||||
| | | | | | | | |
Net deferred tax liability |
$ | (10,978 | ) | $ | (23,104 | ) | |
| | | | | | | | |
During 2016, an affiliate of Brookfield purchased on the open market in aggregate approximately $53 million of GrafTech's traded senior notes. This related party transaction generated a gain due to the discount at which the senior note was trading. This gain was taxable to GrafTech in 2016 and generated a deferred tax asset for an original issuance discount of approximately $6.5 million. This deferred tax asset was $2.6 million at December 31, 2017.
In November 2015, the FASB issued ASU No. 2015-17, "Income Taxes (Topic 740): Balance Sheet Classification of Deferred Taxes," which requires deferred tax assets and liabilities, as well as any related valuation allowance, be classified as noncurrent on the balance sheet. As a result, each jurisdiction will only have one net noncurrent deferred tax asset or liability. This ASU did not change the previous requirement that only permits offsetting within a jurisdiction. The new guidance was effective for annual periods beginning after December 15, 2016, and interim periods within those annual periods, with early adoption permitted. We adopted the amendments as of December 31, 2015 on a prospective basis. Adoption resulted in the presentation of all deferred income tax assets as noncurrent deferred income tax assets in our Consolidated Balance Sheet as of December 31, 2015. No prior periods were retrospectively adjusted and the adoption of the amendments had no impact on our consolidated results of operations or
F-44
cash flows. Net non-current deferred tax assets are separately stated as deferred income taxes in the amount of $19.8 million as of December 31, 2016 and $30.8 million as of December 31, 2017. Net non-current deferred tax liabilities are separately stated as deferred income taxes in the amount of $42.9 million at December 31, 2016 and $41.8 million at December 31, 2017.
We continue to assess the need for valuation allowances against deferred tax assets based on determinations of whether it is more likely than not that deferred tax benefits will be realized through the generation of future taxable income. Appropriate consideration is given to all available evidence, both positive and negative, in assessing the need for a valuation allowance. Examples of positive evidence would include a strong earnings history, an event or events that would increase our taxable income through a continued reduction of expenses, and tax planning strategies that would indicate an ability to realize deferred tax assets. Examples of negative evidence would include cumulative losses in recent years and history of tax attributes expiring unused.
Valuation allowance activity for the years ended December 31, 2015, 2016 and 2017 is as follows:
| |
| |
| |
|---|---|---|---|---|
| | | | | |
| |
| (Dollars in thousands) |
| |
| | | | | |
Balance as of December 31, 2015 |
| $ | 165,539 | |
(Credited) / charged to income |
| 78,469 | | |
Translation adjustment |
| 583 | | |
Changes attributable to movement in underlying assets |
| 250 | | |
| | | | | |
Balance as of December 31, 2016 |
| $ | 244,841 | |
(Credited) / charged to income |
| (87,194 | ) | |
Translation adjustment |
| 207 | | |
Changes attributable to movement in underlying assets |
| (7,015 | ) | |
| | | | | |
Balance as of December 31, 2017 |
| $ | 150,839 | |
| | | | | |
GrafTech impaired the fixed assets and announced exiting of certain product lines in our Advanced Graphite Material ("AGM") product group in the Company's second quarter of 2014. During the third quarter of 2014, we announced the conclusion of another phase of our on-going companywide cost savings assessment. This resulted in changes to the Company's operating and management structure in order to streamline, simplify and decentralize the organization. The impairment charges and other rationalization related charges were incurred primarily in the U.S. jurisdiction. As a result, we determined that it was no longer "more likely than not" that we would generate sufficient future U.S. taxable income to realize our deferred tax assets related to U.S. foreign tax credits and state net operating loss carryforwards, as well as our net U.S. deferred tax assets. With the additional significant negative evidence of those losses, the Company recognized a $73.4 million non-cash charge to the Statement of Operations in 2014 to reflect a full valuation allowance against these U.S. deferred income tax assets. Additional non-cash charges were recognized during 2015 and 2016 as a result of no benefit being recorded for U.S. and Switzerland deferred tax assets in 2015 and 2016. The recognition of the valuation allowance does not result in or limit the Company's ability to utilize these tax assets in the future. In the fourth quarter of 2017, with the enactment of the 2017 Tax Act, additional taxable income resulted from un-remitted earnings and profits of foreign subsidiaries. This additional taxable income lead to the current year utilization of the U.S. net operating loss carryforward and a partial release of the valuation allowance against the U.S. deferred tax assets. The valuation allowance was further reduced by the U.S. tax rate decrease from 35% to 21% as a result of the newly enacted 2017 Tax Act. The recognition of the valuation allowance does not result in or limit the Company's ability to utilize these tax assets in the future.
F-45
In March of 2017, $19.5 million of foreign tax credit expired. During the fourth quarter of 2017, we increased our foreign tax credit carryforward by $37.7 million, as a result of additional foreign taxable income derived in connections with the new U.S. tax legislation that was enacted on December 22, 2017. Thus, we have a total foreign tax credit carryforward of $37.9 million as of December 31, 2017, for which a full valuation allowance is recorded. These tax credit carryforwards begin to expire as of March 15, 2025. In addition, we have a federal net operating loss carryforward of $388.8 million and state net operating losses carryforwards of $263.1 million, which can be carried forward from 5 to 20 years. These net operating losses carryforwards generate a deferred tax asset of $101.9 million as of December 31, 2017. We also have U.S. non-net operating loss related deferred tax assets of $3.7 million as of December 31, 2017. The federal net operating loss carryforward and foreign tax credit utilization will be limited by IRC §382 and §383, respectively.
We have assessed the need for valuation allowances against these deferred tax assets based on determinations of whether it is more likely than not that deferred tax benefits will be realized through the generation of future taxable income. Appropriate consideration is given to all available evidence, both positive and negative, in assessing the need for a valuation allowance, including existing level of profitability and recently available projections of future taxable income, which are comparable with current year results. During the fourth quarter of 2017, GrafTech Switzerland moved from a cumulative loss position to a cumulative profit position, as well as a current year utilization of its net operating loss carryforward. This positive evidence and utilization has led to a full release of the valuation allowance against the GrafTech Switzerland deferred tax asset.
Based upon the levels of historical federal and state taxable income and projections of future federal and state taxable income over the periods during which the carryforwards can be utilized, we do not believe it is more likely than not that we will realize the tax benefits of the U.S. deferred tax assets. Until we determine that we will generate sufficient jurisdictional taxable income to realize our net operating losses and deferred tax assets, these assets will continue to be fully reserved.
We have non-U.S. loss and tax credit carryforwards on a gross tax effected basis of $34.5 million, which can be carried forward from 7 years to indefinitely.
As of December 31, 2017, we had unrecognized tax benefits of $2.5 million, $2.2 million of which, if recognized, would have a favorable impact on our effective tax rate. We have elected to report interest and penalties related to uncertain tax positions as income tax expense. Accrued interest and penalties were $0.7 million as of December 31, 2015 (an increase of $0.2 million), $0.8 million as of December 31, 2016 (an increase of $0.1 million) and $0.8 million as of December 31, 2017 (an increase of $0.0 million). A reconciliation of the beginning and ending amount of unrecognized tax benefits is as follows:
| |
| |
| |
|---|---|---|---|---|
| | | | | |
| |
| (Dollars in thousands) |
| |
| | | | | |
Balance as of December 31, 2015 |
| $ | 3,921 | |
Lapse of statutes of limitations |
| (603 | ) | |
Foreign currency impact |
| 20 | | |
| | | | | |
Balance as of December 31, 2016 |
| $ | 3,338 | |
Additions for tax positions of prior years |
| 114 | | |
Lapse of statutes of limitations |
| (989 | ) | |
Foreign currency impact |
| 29 | | |
| | | | | |
Balance as of December 31, 2017 |
| $ | 2,492 | |
| | | | | |
F-46
It is reasonably possible that a reduction of unrecognized tax benefits of up to $0.4 million may occur within 12 months due to settlements and the expiration of statutes of limitation.
We file income tax returns in the U.S. federal jurisdiction, and various state and foreign jurisdictions. All U.S. federal tax years prior to 2014 are generally closed by statute or have been audited and settled with the applicable domestic tax authorities. All other jurisdictions are still open to examination beginning after 2011.
The Company has not provided for U.S. income taxes or foreign withholding taxes on the differences between the financial reporting basis in our foreign investments, and the tax basis in such investments, estimated to be $283.7 million, which are considered to be permanently reinvested as of December 31, 2017. Any outside basis difference would be taxable upon the sale or liquidation of the foreign subsidiaries, or upon the remittance of dividends. The measurement of the unrecognized U.S. income taxes, if any, that may be associated with these outside basis differences, is not practicable.
(15) Accumulated other comprehensive income (loss)
The balance in our accumulated other comprehensive income (loss) is set forth in the following table:
| |
| |
| |
| ||
|---|---|---|---|---|---|---|---|
| | | | | | | ||
| |
| As of December 31, 2017 |
| As of December 31, 2016 |
| ||
| | | | | | | ||
|
| (Dollars in thousands) | | ||||
Foreign currency translation adjustments |
| $ | 15,468 | | $ | (7,560 | ) |
Commodities and foreign currency derivatives |
| 4,821 | | 2 | | ||
| | | | | | | ||
Total accumulated comprehensive income (loss) |
| $ | 20,289 | | $ | (7,558 | ) |
| | | | | | | ||
As a result of our acquisition by Brookfield and the subsequent purchase price accounting adjustments, accumulated comprehensive losses in equity were reset on August 15, 2015.
(16) Subsequent events
Refinancing
On February 12, 2018, GrafTech entered into a credit agreement (the "2018 Credit Agreement") among GrafTech, GrafTech Finance Inc., a Delaware corporation and a wholly owned subsidiary of GrafTech ("Finance"), GrafTech Switzerland SA, a Swiss corporation and a wholly owned subsidiary of GrafTech ("Swissco"), GrafTech Luxembourg II S.à.r.l., a Luxembourg société à responsabilité limitée and a wholly owned subsidiary of GrafTech ("Luxembourg Holdco" and, together with Finance and Swissco, the "Co-Borrowers"), the lenders and issuing banks party thereto and JPMorgan Chase Bank, N.A. as administrative agent and as collateral agent, which provides for (i) a $1,500 million senior secured term facility (the "2018 Term Loan Facility") and (ii) a $250 million senior secured revolving credit facility (the "2018 Revolving Credit Facility" and, together with the Term Loan Facility, the "Senior Secured Credit Facilities"), which may be used from time to time for revolving credit borrowings denominated in dollars or Euro, the issuance of one or more letters of credit denominated in dollars, Euro, Pounds Sterling or Swiss Francs and one or more swing line loans denominated in dollars. Finance is the sole borrower under the 2018 Term Loan Facility while Finance, Swissco and Lux Holdco are Co-Borrowers under the 2018 Revolving Credit Facility. On February 12, 2018, Finance borrowed $1,500 million under the 2018 Term Loan Facility
F-47
(or the 2018 Term Loans). The 2018 Term Loans mature on February 12, 2025. The maturity date for the 2018 Revolving Credit Facility is February 12, 2023.
The proceeds of the 2018 Term Loans were used to (i) repay in full all outstanding indebtedness of the Co-Borrowers under the amended and restated credit agreement dated as of February 27, 2015 and terminate all commitments thereunder, (ii) redeem in full the Senior Notes at a redemption price of 101.594% of the principal amount thereof plus accrued and unpaid interest to the date of redemption, (iii) pay fees and expenses incurred in connection with (i) and (ii) above and the Senior Secured Credit Facilities and related expenses, and (iv) pay a dividend, with any remainder to be used for general corporate purposes. In connection with the repayment of the amended and restated credit agreement dated as of February 27, 2015 and redemption of the Senior Notes, all guarantees of obligations under the amended and restated credit agreement dated as of February 27, 2015, the Indenture and the Senior Notes were terminated, all mortgages and other security interests securing obligations under the amended and restated credit agreement dated as of February 27, 2015 were released and the amended and restated credit agreement dated as of February 27, 2015 and the Indenture were terminated.
Borrowings under the 2018 Term Loan Facility bear interest, at Finance's option, at a rate equal to either (i) the Adjusted LIBO Rate (as defined in the 2018 Credit Agreement), plus an applicable margin initially equal to 3.50% per annum or (ii) the ABR Rate (as defined in the 2018 Credit Agreement), plus an applicable margin initially equal to 2.50% per annum, in each case with one step down of 25 basis points based on achievement of certain public ratings of the 2018 Term Loans.
Borrowings under the 2018 Revolving Credit Facility bear interest, at the applicable Co-Borrower's option, at a rate equal to either (i) the Adjusted LIBO Rate, plus an applicable margin initially equal to 3.75% per annum or (ii) the ABR Rate, plus an applicable margin initially equal to 2.75% per annum, in each case with one step down based on achievement of certain senior secured first lien net leverage ratios. In addition, the Co-Borrowers will be required to pay a quarterly commitment fee on the unused commitments under the 2018 Revolving Credit Facility in an amount equal to 0.25% per annum.
All obligations under the 2018 Credit Agreement are guaranteed by GrafTech, Finance and each domestic subsidiary of GrafTech, subject to certain customary exceptions, and all obligations under the 2018 Credit Agreement of each foreign subsidiary of GrafTech that is a Controlled Foreign Corporation are guaranteed by GrafTech Luxembourg I S.à.r.l., a Luxembourg société à responsabilité limitée and an indirect wholly owned subsidiary of GrafTech (or Luxembourg Parent), Luxembourg Holdco, Swissco (collectively, the Guarantors).
All obligations under the 2018 Credit Agreement are secured, subject to certain exceptions and Excluded Assets (as defined in the 2018 Credit Agreement), by: (i) a pledge of all of the equity securities of Finance and each domestic Guarantor (other than GrafTech) and of each other direct, wholly owned domestic subsidiary of GrafTech and any Guarantor, (ii) a pledge on no more than 65% of the equity interests of each subsidiary that is a Controlled Foreign Corporation (within the meaning of Section 956 of the Internal Revenue Code of 1986, as amended from time to time), and (iii) security interests in, and mortgages on, personal property and material real property of Finance and each domestic Guarantor, subject to permitted liens and certain exceptions specified in the 2018 Credit Agreement. The obligations of each foreign subsidiary of GrafTech that is a Controlled Foreign Corporation under the Revolving Credit Facility are secured by (i) a pledge of all of the equity securities of each Guarantor that is a Controlled Foreign Corporation and of each direct, wholly owned subsidiary of any Guarantor that is a Controlled Foreign Corporation, and (ii) security interests in certain receivables and personal property of each Guarantor that is a Controlled Foreign Corporation, subject to permitted liens.
F-48
The 2018 Term Loans amortize at a rate equal to 5% per annum of the original principal amount of the 2018 Term Loans payable in equal quarterly installments, with the remainder due at maturity. The Co-Borrowers are permitted to make voluntary prepayments at any time without premium or penalty, except in the case of prepayments made in connection with certain repricing transactions with respect to the 2018 Term Loans effected within twelve months of the closing date of the 2018 Credit Agreement, to which a 1.00% prepayment premium applies. Finance is required to make prepayments under the 2018 Term Loans (without payment of a premium) with (i) net cash proceeds from non-ordinary course asset sales (subject to customary reinvestment rights and other customary exceptions and exclusions), and (ii) commencing with the Company's fiscal year ending December 31, 2019, 75% of Excess Cash Flow (as defined in the 2018 Credit Agreement), subject to step-downs to 50% and 0% of Excess Cash Flow based on achievement of a senior secured first lien net leverage ratio greater than 1.25 to 1.00 but less or equal or 1.75 to 1.00 and less than or equal to 1.25 to 1.00, respectively. Scheduled quarterly amortization payments of the 2018 Term Loans during any calendar year reduce, on a dollar-for-dollar basis, the amount of the required Excess Cash Flow prepayment for such calendar year, and the aggregate amount of Excess Cash Flow prepayments for any calendar year reduce subsequent quarterly amortization payments of the 2018 Term Loans as directed by Finance.
The 2018 Credit Agreement contains customary representations and warranties and customary affirmative and negative covenants applicable to GrafTech and restricted subsidiaries, including, among other things, restrictions on indebtedness, liens, investments, fundamental changes, dispositions, and dividends and other distributions. The 2018 Credit Agreement contains a financial covenant that requires GrafTech to maintain a senior secured first lien net leverage ratio note greater than 4.00:1.00 when the aggregate principal amount of borrowings under the 2018 Revolving Credit Facility and outstanding letters of credit issued under the 2018 Revolving Credit Facility (except for undrawn letters of credit in an aggregate amount equal to or less than $35 million), taken together, exceed 35% of the total amount of commitments under the 2018 Revolving Credit Facility. The 2018 Credit Agreement also contains customary events of default.
Dividend
On February 12, 2018, GrafTech declared and paid a dividend to our owner, Brookfield, in the amount of $1,112.0 million. This dividend was funded by the debt assumed in the aforementioned refinancing.
F-49
Shares
Common Stock
Prospectus
| J.P. Morgan | Credit Suisse |
| Citigroup | RBC Capital Markets | HSBC |
BMO Capital Markets
, 2018
Through and including , 2018 (the 25th day after the date of this prospectus), all dealers effecting transactions in these securities, whether or not participating in this offering, may be required to deliver a prospectus. This is in addition to each dealer's obligation to deliver a prospectus when acting as underwriter, and with respect to its unsold allotments or subscriptions.
Part II
Information not required in prospectus
Item 13. Other expenses of issuance and distribution.
The following table sets forth the estimated fees and expenses (except for the SEC registration fee, the Financial Industry Regulatory Authority, Inc. (or FINRA), filing fee and the NYSE listing fee) payable by the registrant in connection with the distribution of our common stock:
| | | | | |
SEC registration fee |
$ | * | ||
FINRA filing fee |
* | |||
NYSE listing fee |
* | |||
Printing and engraving expenses |
* | |||
Legal fees and expenses |
* | |||
Accounting fees and expenses |
* | |||
Transfer agent and registrar fees and expenses |
* | |||
Blue Sky fees and expenses |
* | |||
Miscellaneous |
* | |||
| | | | | |
Total |
$ | * | ||
| | | | | |
* To be completed by amendment.
We will bear all of the expenses shown above.
Item 14. Indemnification of directors and officers.
Section 145 of the DGCL provides that a corporation may indemnify directors and officers as well as other employees and individuals against expenses, including attorneys' fees, judgments, fines and amounts paid in settlement in connection with specified actions, suits and proceedings whether civil, criminal, administrative, or investigative, other than a derivative action by or in the right of the corporation, if they acted in good faith and in a manner they reasonably believed to be in or not opposed to the best interests of the corporation and, with respect to any criminal action or proceeding, had no reasonable cause to believe their conduct was unlawful. A similar standard is applicable in the case of derivative actions, except that indemnification extends only to expenses, including attorneys' fees, incurred in connection with the defense or settlement of such action and the statute requires court approval before there can be any indemnification where the person seeking indemnification has been found liable to the corporation. The statute provides that it is not exclusive of other indemnification that may be granted by a corporation's certificate of incorporation, bylaws, disinterested director vote, stockholder vote, agreement or otherwise.
Our Amended Certificate of Incorporation and Amended By-Laws will provide for indemnification of directors and officers to the fullest extent permitted by law, including payment of expenses in advance of resolution of any such matter. Our Amended Certificate of Incorporation will eliminate the potential personal monetary liability of our directors to the Company or its shareholders for breaches of their duties as directors except as otherwise required under the DGCL.
We intend to enter into separate indemnification agreements with our directors and officers. Each indemnification agreement will provide, among other things, for indemnification to the fullest extent permitted by law and our Amended Certificate of Incorporation and Amended By-Laws against any and all expenses, judgments, fines, penalties and amounts paid in settlement of any claim. The indemnification agreements will provide for the advancement or payment of all expenses to the indemnitee and for reimbursement to us if it is found that such indemnitee is not entitled to such indemnification under applicable law and our Amended Certificate of Incorporation and Amended By-Laws.
II-1
We maintain standard policies of insurance under which coverage is provided (a) to our directors and officers against loss rising from claims made by reason of breach of duty or other wrongful act, and (b) to us with respect to payments which we may make to such officers and directors pursuant to the above indemnification provision or otherwise as a matter of law.
The underwriting agreement, to be filed as Exhibit 1.1 to this registration statement, will provide for indemnification, under certain circumstances, by the underwriters of us and our officers and directors for certain liabilities arising under the Securities Act or otherwise.
Item 15. Recent sales of unregistered securities.
In the last three years, we have not issued or sold any unregistered securities.
Item 16. Exhibits and financial statement schedules.
(a) Exhibits: The list of exhibits is set forth in beginning on page II-5 of this Registration Statement and is incorporated herein by reference.
(b) Financial Statement Schedules: No financial statement schedules are provided because the information called for is not applicable or is shown in the financial statements or notes thereto.
*(f) The undersigned registrant hereby undertakes to provide to the underwriters at the closing specified in the underwriting agreement, certificates in such denominations and registered in such names as required by the underwriters to permit prompt delivery to each purchaser.
*(h) Insofar as indemnification for liabilities arising under the Securities Act may be permitted to directors, officers, and controlling persons of the registrant pursuant to the foregoing provisions, or otherwise, the registrant has been advised that in the opinion of the SEC such indemnification is against public policy as expressed in the Act and is, therefore, unenforceable. In the event that a claim for indemnification against such liabilities (other than the payment by the registrant of expenses incurred or paid by a director, officer, or controlling person of the registrant in the successful defense of any action, suit or proceeding) is asserted by such director, officer, or controlling person in connection with the securities being registered, the registrant will, unless in the opinion of its counsel the matter has been settled by controlling precedent, submit to a court of appropriate jurisdiction the question whether such indemnification by it is against public policy as expressed in the Act and will be governed by the final adjudication of such issue.
*(i) The undersigned registrant hereby undertakes that:
- •
- For purposes of determining any liability under the Securities Act, the information omitted from the form of prospectus filed as part of this
registration statement in reliance upon Rule 430A and contained in a form of prospectus filed by us pursuant to Rule 424(b)(1) or (4) or 497(h) under the Securities Act
shall be deemed to be part of this registration statement as of the time it was declared effective.
- •
- For the purpose of determining any liability under the Securities Act, each post-effective amendment that contains a form of prospectus shall be deemed to be a new registration statement relating to the securities offered therein, and the offering of such securities at that time shall be deemed to be the initial bona fide offering thereof.
* Paragraph references correspond to those of Regulation S-K, Item 512.
II-2
II-3
- *
- To
be filed by amendment.
- **
- Previously filed.
II-4
Pursuant to the requirements of the Securities Act of 1933, as amended, the registrant has duly caused this registration statement to be signed on its behalf by the undersigned, thereunto duly authorized, in the Village of Brooklyn Heights, State of Ohio on March 23, 2018.
|
GrafTech International Ltd. | |||||
|
By: |
/s/ DAVID J. RINTOUL |
||||
|
David J. Rintoul | |||||
|
Title: | President and Chief Executive Officer | ||||
Pursuant to the requirements of the Securities Act of 1933, as amended, this registration statement has been signed below by the following persons in the capacities and on the dates indicated.
Name
|
Title
|
Date
|
||||
|---|---|---|---|---|---|---|
| /s/ DAVID J. RINTOUL David J. Rintoul |
President, Chief Executive Officer and Director (Principal Executive Officer) | March 23, 2018 | ||||
/s/ QUINN J. COBURN Quinn J. Coburn |
Chief Financial Officer, Vice President Finance and Treasurer (Principal Financial and Accounting Officer) |
March 23, 2018 |
||||
* Denis A. Turcotte |
Chairman and Director |
March 23, 2018 |
||||
* Jeffrey C. Dutton |
Director |
March 23, 2018 |
||||
* Ron A. Bloom |
Director |
March 23, 2018 |
||||
*By: |
/s/ QUINN J. COBURN Quinn J. Coburn as Attorney-in-Fact |
|||||
II-5