Attached files
| file | filename |
|---|---|
| EX-32.2 - EXHIBIT 32.2 - Support.com, Inc. | ex32_2.htm |
| EX-32.1 - EXHIBIT 32.1 - Support.com, Inc. | ex32_1.htm |
| EX-31.2 - EXHIBIT 31.2 - Support.com, Inc. | ex31_2.htm |
| EX-31.1 - EXHIBIT 31.1 - Support.com, Inc. | ex31_1.htm |
| EX-23.1 - EXHIBIT 23.1 - Support.com, Inc. | ex23_1.htm |
| EX-21.1 - EXHIBIT 21.1 - Support.com, Inc. | ex21_1.htm |
UNITED STATES
SECURITIES AND EXCHANGE COMMISSION
Washington, D.C. 20549
FORM 10-K
(Mark One)
| ☒ |
ANNUAL REPORT PURSUANT TO SECTION 13 OR 15(d) OF THE SECURITIES EXCHANGE ACT OF 1934
|
For the Fiscal Year Ended December 31, 2017
OR
| ☐ |
TRANSITION REPORT PURSUANT TO SECTION 13 OR 15(d) OF THE SECURITIES EXCHANGE ACT OF 1934
|
For the Transition Period from to
Commission File No. 000-30901
SUPPORT.COM, INC.
(Exact Name of Registrant as Specified in Its Charter)
|
Delaware
|
94-3282005
|
|
|
(State or Other Jurisdiction of Incorporation or Organization)
|
(I.R.S. Employer Identification No.)
|
|
1200 Crossman Avenue, Suite 210, Sunnyvale, CA
|
94089
|
|
|
(Address of Registrant’s Principal Executive Offices)
|
(Zip Code)
|
Registrant’s telephone number including area code: (650) 556-9440
Securities registered pursuant to Section 12(b) of the Act:
|
Title of each class
|
Name of each exchange on which registered
|
|
|
Common Stock, $.0001 par value
|
The NASDAQ Global Select Market
|
|
|
Preferred Stock Purchase Rights
|
The NASDAQ Global Select Market
|
Securities registered pursuant to Section 12(g) of the Act: NONE
Indicate by check mark if registrant is a well-known seasoned issuer, as defined in Rule 405 of the Securities Act. Yes ☐ No ☒
Indicate by check mark if the registrant is not required to file reports pursuant to Section 13 or Sction 15(d) of the Act. Yes ☐ No ☒
Indicate by check mark whether the registrant: (1) has filed all reports required to be filed by Section 13 or 15(d) of the Securities Exchange Act of 1934 during the preceding 12 months (or for such shorter period that the registrant was required to file such reports), and (2) has been subject to such filing requirements for the past 90 days. Yes ☒ No ☐
Indicate by check mark if disclosure of delinquent filers pursuant to Item 405 of Regulation S-K is not contained herein, and will not be contained, to the best of registrant’s knowledge, in definitive proxy or information statements incorporated by reference in Part III of this Form 10-K or any amendment to this Form 10-K. ☒
Indicate by check mark whether the registrant is a large accelerated filer, an accelerated filer, a non-accelerated filer, a smaller reporting company, or an emerging growth company. See the definitions of "large accelerated filer," "accelerated filer," "smaller reporting company," and "emerging growth company" in Rule 12b-2 of the Exchange Act.
|
Large accelerated filer ☐
|
Accelerated filer ☐
|
Non-accelerated filer ☐
|
Smaller reporting company ☒
|
|
Emerging growth company ☐
|
|||
|
(Do not check if a smaller reporting company)
|
If an emerging growth company, indicate by check mark if the registrant has elected not to use the extended transition period for complying with any new or revised financial accounting standards provided pursuant to Section 13(a) of the Exchange Act. ☐
Indicate by check mark whether the registrant is a shell company (as defined in Rule 12b-2 of the Exchange Act). Yes ☐ No ☒
Indicate by check mark whether the registrant has submitted electronically and posted on its corporate Web site, if any, every Interactive Data File required to be submitted and posted pursuant to Rule 405 of Regulation S-T (§232.405 of this chapter) during the preceding 12 months (or for such shorter period that the registrant was required to submit and post such files).Yes ☒ No ☐
The aggregate market value of the registrant’s common stock held by non-affiliates was $43,362,215 as of June 30, 2017. Shares of common stock held by each executive officer, director, and stockholder known by the registrant to own 10% or more of the outstanding stock based on Schedule 13G filings and other information known to us, have been excluded since such persons may be deemed affiliates. This determination of affiliate status is not necessarily a conclusive determination for other purposes.
As of February 28, 2018, there were 18,728,912 shares of the registrant’s common stock outstanding.
DOCUMENTS INCORPORATED BY REFERENCE
Part III, Items 10 (as to directors, section 16(a) beneficial ownership and audit committee and audit committee financial expert), 11, 12 (as to beneficial ownership), 13 and 14 incorporate by reference information from the registrant’s definitive proxy statement (the “Proxy Statement”) to be mailed to stockholders in connection with the solicitations of proxies for its 2018 annual meeting of stockholders. Except as expressly incorporated by reference, the registrant’s Proxy Statement shall not be deemed to be part of this report.
SUPPORT.COM, INC.
FORM 10-K
FOR FISCAL YEAR ENDED DECEMBER 31, 2017
|
Page
|
||
|
PART I
|
||
|
ITEM 1.
|
3
|
|
|
ITEM 1A.
|
7
|
|
|
ITEM 1B.
|
14
|
|
|
ITEM 2.
|
14
|
|
|
ITEM 3.
|
14
|
|
|
ITEM 4.
|
15
|
|
|
PART II
|
15
|
|
|
ITEM 5.
|
15
|
|
|
ITEM 6.
|
17
|
|
|
ITEM 7.
|
19
|
|
|
ITEM 7A.
|
26
|
|
|
ITEM 8.
|
28
|
|
|
29-30
|
||
|
ITEM 9.
|
56
|
|
|
ITEM 9A.
|
56
|
|
|
56
|
||
|
ITEM 9B.
|
58
|
|
|
PART III
|
58
|
|
|
ITEM 10.
|
58
|
|
|
ITEM 11.
|
58
|
|
|
ITEM 12.
|
58
|
|
|
ITEM 13.
|
58
|
|
|
ITEM 14.
|
59
|
|
|
PART IV
|
60
|
|
|
ITEM 15.
|
60
|
|
|
64
|
||
| 65 | ||
FORWARD LOOKING STATEMENTS AND PRESENTATION OF FINANCIAL AND OTHER INFORMATION
This Annual Report on Form 10-K (the “Form 10-K”) contains forward-looking statements that involve risks and uncertainties. Please see the section entitled “Risk Factors” in Item 1A of this Report for important information to consider when evaluating these statements.
In this Form 10-K, unless the context indicates otherwise, the terms “we,” “us,” “Support.com,” “the Company” and “our” refer to Support.com, Inc., a Delaware corporation, and its subsidiaries. References to “$” are to United States dollars.
We have compiled the market size and growth data in this Form 10-K using statistics and other data obtained from several third-party sources. Some market and statistical data are also based on our good faith estimates, which are derived from our review of internal surveys, as well as the third-party sources referred to. This information may prove to be inaccurate because of the method by which the data is obtained or because this information cannot be verified with complete certainty due to the limits on the availability and reliability of raw data, the voluntary nature of the data gathering process and other limitations and uncertainties. As a result, although we believe this information is reliable, we have not independently verified the third-party data and cannot guarantee the accuracy and completeness of this information.
Various amounts and percentages used in this Form 10-K have been rounded and, accordingly, they may not total 100%.
We own or otherwise have rights to the trademarks and trade names, including those mentioned in this Form 10-K, used in conjunction with the marketing and sale of our products.
PART I
Overview
Technology has become an essential feature of the modern life. Personal computers, printers, tablets, smartphones, digital cameras, connected entertainment systems, home automation and other smart home appliances have become ubiquitous. Each year, these products become more feature-rich, offering many new capabilities. Consumers and small and medium-sized businesses (“SMBs”) now depend on such technology for “must-have” information, communication and entertainment as well as for tasks and activities of their daily lives.
Technology has also become increasingly connected, with networks now commonplace in the home as well as the office, and with the Internet of Things (“IoT”) adding a diverse array of devices that monitor, track and automate the physical world. At the same time, technology has become increasingly mobile, with anytime/anywhere access to voice, data, video and applications becoming commonplace.
The complexity of this environment creates challenges. For customer support organizations it results in more difficult problems to solve, often including the need to support third-party products. The growth in the number and range of electronic devices, the increasingly connected nature of these devices, and the related complex ecosystem compels customer support organizations to use modern tools and analytics to fundamentally transform how interactive support is delivered.
Support.com, Inc. provides turnkey customer support programs and cloud based software for technology support organizations. Support.com is the choice of leading communications providers, top retailers, and other important brands in software, consumer and business electronics, and connected technology to provide outsourced support services to their customers or software-as-a-service (“SaaS”) solutions to their internal support organizations.
Support.com is the leading technology support company offering a full “Spectrum of Support,” ranging from intuitive self-help diagnostic and solution tools known as “Guided Paths®”, to chats or calls with live, professionally trained U.S. based technology support agents. Guided Paths® help consumers solve the most common technology issues on their own, and are ideal for consumers that prefer accessing curated self-help before contacting a support agent. For problems requiring additional assistance, our platform enables consumers to immediately reach an agent via chat or phone call. By including robust and effective self-help in our turnkey support programs, we are able to offer our customers a lower-cost solution to customer support than models based entirely off of personal agent interaction while simultaneously improving the consumer support experience.
Our objective is to become the leading technology support provider utilizing innovative self-help through the ongoing creation and refinement of our Guided Paths®, the software included in our Support.com Cloud offering and the service of professionally trained U.S.-based agents. We offer our turnkey, outsourced support services for service providers, retailers, consumer electronics brands and warranty providers, Internet of Things (“IoT”) solution providers and other technology companies. Our customer support services programs are designed for both the consumer and SMB markets, and include pre-purchased concierge advice, device set-up, trouble shooting, security and support, virus and malware removal, wireless network set-up, and home security and automation system support. Most of our customer support specialists work from their homes rather than in brick-and-mortar facilities. We are compensated for our services on a per-incident, per-subscription or labor rate basis.
Our Support.com Cloud offering is a software-as-a-service (“SaaS”) solution for companies to optimize support interactions with their customers using their own or third party support personnel. The solution enables companies to quickly resolve complex technology issues for their customers, boosting support agent productivity, providing ease of use for customer self-service, and dramatically improving the customer support experience.
Our Support Service Programs
Support.com® support services are distributed through partners, using the partner’s brand or in referral programs using the Support.com® brand. Partners include broadband providers, retailers, original equipment manufacturers (“OEMs”), software providers, internet services providers and warranty providers. The services programs include access to our library of Guided Paths®; one-time services (“incidents”), subscriptions, and bundled components of broader offerings.
For connected home technology and automation systems, we offer a complete range of services to help customers select, set up, configure and use new systems, including helping consumers personalize system settings to meet specific lifestyle needs.
We offer a variety of troubleshooting, installation, set-up and enablement services for computers, peripherals, mobile devices and gaming systems and their connectivity. We identify, diagnose and repair technical problems, including issues associated with viruses, spyware, and other forms of malware, connectivity issues, and issues with software applications. We create new user accounts, configure automatic system updates, remove unnecessary trial software, connect devices to the cloud, find and install applications, and synchronize data among devices. These services cover a wide variety of devices, regardless of manufacturer. Support is provided for devices including personal computer, laptops, tablets, mobile devices, gaming systems and other connected devices. Our smartphone and tablet services include configuring mobile devices for wireless network (WiFi) access, setting up email, and educating customers on how to browse the Internet and install apps. We secure and repair problems with wireless networks. We configure, connect and establish secure connections among computers, the wireless network and supported devices. We provide outsourced IT services to SMBs including technology assessments, equipment and service selection, procurement, installation, monitoring and ongoing support for customer’s networking, backup, mobile, telephony, server, software, license management and other technology needs.
We deliver our services using our proprietary agent facing and consumer self-help diagnostic tools known as Guided Paths® and technology support specialists who work from their homes rather than in brick and mortar facilities. Our library of Guided Paths® is constantly growing and under refinement as new devices and systems enter the market or receive software updates. Our technology specialists are recruited, tested, hired and trained on a virtual basis using proprietary methods and remote technology. We also utilize contract labor in our service programs.
Our Support.com Cloud Offering
Our cloud-based software is the Company’s offering in the Support Interaction Optimization (SIO) space. Support.com Cloud is a SaaS offering that provides significant levels of automation and analytics that enable companies to deliver superior customer support issue resolution while improving both the customer experience and operational performance. Based on insights from supporting millions of connected technology transactions annually, our software architecture is designed to enable resolving problems in a consistent manner by using proprietary, automated workflow while capturing rich data for service delivery optimization. Flexible architecture means that companies can take advantage of additional functionality as their business requirements change, and can add richer analytics, marketing and subscription management, and third-party applications to resolve issues.
Key features of our Support.com Cloud offering include:
Smart Guidance. Guided Paths® codify the organization’s best practices and ensures that agents and customers get the right guidance at the right time to help resolve customer problems. Guided Paths go beyond knowledge articles and decision trees to gather contextual information and pertinent device data and to automate time-consuming, multi-step activities in ways that lead to effective and consistent problem resolution and satisfied customers.
Blended Support Capability. A context engine tracks and analyzes information about what the end-customer is trying to achieve and about what activities they have already taken to help themselves. This context is maintained across support channels – for instance, if the customer escalates from self-service to assisted support - and leads to a seamless blended support experience and reduced customer effort, overcoming one of the most frequent customer complaints about customer support experiences.
Remote Support Tools. A set of advanced tools including remote access, screen co-browsing, on-screen assistance, and SeeSupport - remote video support using the customer’s smart phone as a camera - is available to support representatives enabling them to quickly and effectively troubleshoot technical problems.
Data and Analytics. Our cloud-based data architecture can bring “Big Data” benefits to technology support, delivering business insights from rich data captured during service delivery and enabling organizations to track program performance and identify potential issues and inefficiencies.
Web-based Application Programming Interfaces (APIs). Open APIs enable integration with other contact center applications (such as ticketing systems, CRM platforms or knowledge bases) so that our Support.com Cloud applications can be fully integrated into the agent-customer interaction. The open API’s allow for data transfer and sharing between applications.
Our End-User Software Products
Our end-user software products are designed to maintain, optimize and secure computers and mobile devices. Certain software products are licensed on a perpetual basis while others are offered on a subscription basis.
Our principal software products include products designed for malware protection and removal (SUPERAntiSpyware®) and personal computer, smartphone and tablet maintenance and optimization (Cosmos®).
Sales and Marketing
Technology Support Services. We sell our services principally through partners. Our partners include leading communication providers, retailers, warranty providers and technology companies. We acquire partners through our business development organization, and we support partners through our account management organization. Our partnerships typically begin with a pilot phase and can take several weeks to more than a year to progress to a broader roll-out. We typically wholesale services to our partners on a per-incident, per-subscription or labor rate basis and our partners bundle our services with their own to their customers – consumers and SMBs. In these partnerships, the services are generally sold under the partner’s brand.
Support.com Cloud Offering. We license Support.com Cloud applications separately from support services provided by our customer support specialists. In such an arrangement, customers receive the right to use our cloud-based software in their own support organization, using a SaaS model under which customers pay us on a per-user or a per-session basis during the term of the arrangement. We also provide implementation services to customers, typically covering integration of our software with other customer’s systems. We charge for these services on a time-and-materials basis or as part of a fixed-fee package.
We acquire Support.com Cloud customers through our direct sales channel, which uses a variety of Internet-based lead generation strategies and industry presence marketing to drive demand. We also acquire customers through our partner channels.
End-User Software Products. We license our end-user software products directly to customers and through partners. To date, a majority of our end-user software revenue has come through direct sales to customers. Online advertising allows customers to click through to our software offerings where they can order and download our products on demand. In addition to fully featured software products available for a license fee, a substantial percentage of our end-user software revenue arises from customers who download free trial versions of our software or free versions of our software with limited functionality before making a purchase decision.
Research and Development
We maintain dedicated research and development teams in Sunnyvale, California, and Eugene, Oregon. Research and development expense was $3.0 million in 2017 and $5.6 million in 2016.
We have developed, maintain, and continue to improve proprietary, market-leading, cloud-based technologies that are essential to our business. We focus our investment in research and development across the following major areas: the creation and refinement of our Guided Paths® library; solutions for support interaction optimization; endpoint applications and other extensions to gather data to assist support interactions and allow remote support when necessary; business analytics and reporting; open application interfaces; and internal service delivery management tools.
Our SaaS technology includes Guided Paths® automated workflows, remote control of customer devices, automated device and systems data collection, and business analytics.
The service delivery management tools used by our agents for technology support services include our own Support.com cloud-based software capabilities and other contact center applications such as customer relationship management (“CRM”), ticketing, ordering, methods of payment, and telephony, which are all integrated into highly effective and efficient application for our technology specialists.
For business analytics and reporting, we build and maintain a data warehouse that securely aggregates and restructures data from all of our applications to create a comprehensive view of the service delivery lifecycle, as well as data about the disposition of support interactions. This rich data set provides visibility into sales conversion effectiveness, service delivery efficiency, service level performance, subscription utilization, partner program performance and many other aspects of running and optimizing our business. Our partners also receive reports and analytic information from the warehouse for their programs on a regular basis via secure data feeds.
Open application interfaces of our Support.com Cloud enable integration with CRM, ticketing systems, and other contact center applications.
Intellectual Property
We own the registered trademarks SUPPORT.COM, GUIDED PATHS, PERSONAL TECHNOLOGY EXPERTS, BUSINESS TECHNOLOGY EXPERTS and NEXUS in the United States for specified support services and software, and we have registrations and common law rights for several related trademarks in the U.S. and certain other countries. We own the domain name support.com and other domain names. We have exclusive rights to our proprietary services technology, and our end user software products. We also have non-exclusive rights to distribute certain other software products.
We own three U.S. patents related to our business and have a number of pending patent applications covering certain advanced technology. Our issued patents include U.S. Patent No. 8,020,190 (“Enhanced Browser Security”), U.S. Patent No. 6,754,707 (“Secure Computer Support System”) and U.S. Patent No. 6,167,358 (“System and Method for Remotely Monitoring a Plurality of Computer-Based Systems”). We do not know if our current patent applications or any future patent application will result in a patent being issued with the scope of the claims we seek, if at all. Also, we do not know whether any patents we have or may receive will be challenged or invalidated. It is difficult to monitor unauthorized use of technology, particularly in foreign countries where the laws may not protect our proprietary rights as fully as they do in the United States, and our competitors may develop technology that competes with ours but nevertheless does not infringe our intellectual property rights.
We rely on a combination of copyright, trade secret, trademark and contractual protection to establish and protect our proprietary rights that are not protected by patents. We also enter into confidentiality agreements with our employees and consultants involved in product development. We generally require our employees, customers and potential business partners to enter into confidentiality agreements before we will disclose any sensitive aspects of our business. Also, we generally require employees and contractors to agree to assign and surrender to us any proprietary information, inventions or other intellectual property they generate while working for us in the scope of employment. These precautions, and our efforts to register and protect our intellectual property, may not prevent misappropriation or infringement of our intellectual property.
Competition
We are active in markets that are highly competitive and subject to rapid change. Although we do not believe there is one principal competitor for all aspects of our offerings, we do compete with a number of other vendors.
With respect to partnerships for our technology support services, our competitors include privately-held companies focused on premium technology services, providers of electronics warranties, emerging IoT technology support providers, global business process outsourcing providers or contact centers focused on technical support and other companies who offer technical support through partners. We believe the principal competitive factors in our services market include: pricing; breadth and depth of service offerings; quality of the customer experience; proprietary technology; time to market; account management; vendor reputation; scale; and financial resources.
With respect to licenses of our Support.com Cloud offering, our competitors include companies focused on service desk, knowledge management, remote support and IT process automation. We believe the principal competitive factors in the Support Interaction Optimization (“SIO”) space include breadth and depth of functionality; ease of implementation; performance; scalability; pricing; vendor reputation; financial resources; and customer support. We believe that our Support.com Cloud offering can compete favorably because it provides an integrated solution for SIO that covers different areas of functionality required by customers.
In the market for our end-user software products, we face direct competition from software vendors, application providers, operating system providers, network equipment manufacturers, and other original equipment manufacturers (“OEMs”) that may provide similar solutions and function in their products, and from individuals and groups who offer “free” and open source utilities online.
The competitors in our markets for services and software can have some or all of the following competitive advantages: longer operating histories, greater economies of scale, greater financial resources, greater engineering and technical resources, greater sales and marketing resources, stronger strategic alliances and distribution channels, larger user bases, products with different functions and feature sets and greater brand recognition than we have. We expect new competitors to continue to enter the markets in which we operate.
For additional information related to competition, see Item 1A, Risk Factors.
Employees
As of December 31, 2017, we had 1,776 employees, of whom 1,688 were work-from-home agents and 88 were corporate employees. In addition to our work-from-home employees, we also use contract labor. None of our employees are covered by collective bargaining agreements.
Securities and Exchange Commission (“SEC”) Filings and Other Available Information
We were incorporated in Delaware in December 1997. We file reports with the SEC, including without limitation annual reports on Form 10-K, quarterly reports on Form 10-Q and current reports on Form 8-K filed or furnished pursuant to Section 13(a) or 15(d) of the Securities Exchange Act of 1934 (the “Exchange Act”). The public may read and copy any materials we file with the SEC at the SEC’s Public Reference Room at 100 F Street, N.E., Washington, DC 20549. The public may obtain information on the operation of the Public Reference Room by calling the SEC at (202) 551-8090. In addition, we are an electronic filer. The SEC maintains an Internet site that contains reports, proxy and information statements, and other information regarding issuers, including us, that file electronically with the SEC at the website address located at www.sec.gov.
Our telephone number is 650-556-9440 and our website address is www.support.com. The information contained on our website does not form any part of this Annual Report on Form 10-K. However, we make available, free of charge through our website, our annual reports on Form 10-K, our quarterly reports on Form 10-Q and our current reports on Form 8-K filed or furnished pursuant to Section 13(a) or 15(d) of the Securities Exchange Act of 1934 as soon as reasonably practicable after we electronically file this material with, or furnish it to, the SEC. In addition, we also make available on https://www.support.com/about-us/investor-relations/corporate-governance/our Code of Ethics and Business Conduct for Employees, Officers and Directors. This Code is also available in print without charge to any person who requests it by writing to:
Support.com, Inc.
Investor Relations
1200 Crossman Ave, Ste 210
Sunnyvale, CA 94089
This report contains forward-looking statements regarding our business and expected future performance as well as assumptions underlying or relating to such statements of expectation, all of which are “forward looking statements” within the meaning of Section 27A of the Securities Act of 1933 and Section 21E of the Securities Exchange Act of 1934. We are subject to many risks and uncertainties that may materially affect our business and future performance and cause those forward-looking statements to be inaccurate. Words such as “expects,” “anticipates,” “intends,” “plans,” “believes,” “forecasts,” “estimates,” “seeks,” “may result in,” “focused on,” “continue to,” “on-going” and similar expressions often identify forward-looking statements. In this report, forward-looking statements include, without limitation, statements regarding the following:
| ● |
Our expectations regarding revenues, cash flows, expenses, including cost of revenue, sales and marketing, research and development efforts, and administrative expenses, and profits;
|
| ● |
Our expectations regarding partners, renewal of contracts with these partners and the anticipated timing and magnitude of revenue from programs with these partners;
|
| ● |
Our ability to successfully license, implement and support our Support.com Cloud offering;
|
| ● |
Our expectations regarding sales of our end-user software products, and our ability to source, develop and distribute enhanced versions of these products;
|
| ● |
The market appeal and efficacy of our Guided Paths® self-help solution and diagnostic tools;
|
| ● |
Our ability to expand and diversify our customer base;
|
| ● |
Our ability to attract and retain qualified management and employees;
|
| ● |
Our ability to hire, train, manage and retain customer support specialists in a home-based model in quantities sufficient to meet forecast requirements and in a cost-effective manner, and our ability to continue to enhance the flexibility of our staffing model;
|
| ● |
Our ability to adapt to changes in the market for customer support services;
|
| ● |
Our expectations regarding unit volumes, pricing and other factors in the market for computers and other technology devices, and the effects of such factors on our business;
|
| ● |
Our expectations regarding the results of pending, threatened or future litigation;
|
| ● |
Our expectations regarding the results of pending, threatened or future government investigations and audits, including, without limitation, those investigations and audits described in Item 3 Legal Proceedings of this report;
|
An investment in our stock involves risk, and we caution investors that forward-looking statements are only predictions based on our current expectations about future events and are not guarantees of future performance. We encourage you to read carefully all information provided in this report and in our other filings with the SEC before deciding to invest in our stock or to maintain or change your investment. Forward-looking statements are based on information as of the filing date of this report, and we undertake no obligation to publicly revise or update any forward-looking statement for any reason.
Because forward-looking statements involve risks and uncertainties, there are important factors that may cause actual results to differ materially from our stated expectations. While a number of these factors are described below, this list does not include all risks that could affect our business. If these or any other risks or uncertainties materialize, or if our underlying assumptions prove to be inaccurate, actual results could differ materially from past results and from our expected future results.
Because a small number of partners have historically accounted for, and for the foreseeable future will account for, the substantial majority of our revenue, under-performance of specific programs or loss of certain partners or programs could continue to reduce our revenue substantially.
For the three months and twelve months ended December 31, 2017, Comcast accounted for 69% and 65% of our total revenue, respectively. The loss of this or other significant relationships, the change of the terms or terminations of our arrangements with any of these firms, the reduction or discontinuance of programs with any of these firms, or the failure of any of these firms to achieve their targets has in the past adversely affected, and could in the future adversely affect our business. Generally, the agreements with our partners do not require them to conduct any minimum amount of business with us, and therefore they have decided in the past and could decide at any time in the future to reduce or eliminate their programs or the use of our services in such programs. They may also enter into multi-sourcing arrangements with other vendors for services previously provided exclusively by us. Further, we may not successfully obtain new partners or customers. There is also the risk that, once established, our programs with these and other partners may take longer than we expect to produce revenue or may not produce revenue at all, and the revenue produced may not be profitable if the costs of performing under the program are greater than anticipated or the program terminates before up-front investments can be recouped. One or more of our key partners may also choose not to renew their relationship with us, discontinue certain programs, offer them only on a limited basis or devote insufficient time and attention to promoting them to their customers. Some of our key partners may prefer not to work with us if we also partner with their competitors. If any of these key partners merge with one of their competitors, all of these risks could be exacerbated.
Each of these risks could reduce our sales and have a material adverse effect on our operating results.
Our business is based on a relatively new and evolving business model.
We are executing a plan to grow our business by providing customer support services, creating a robust, timely and innovative library of Guided Path® self-support tools, licensing our Support.com Cloud application, and providing end-user consumer software products. We may not be able to offer these services and software products successfully. Our customer support specialists are generally home-based, which requires a high degree of coordination and quality control of employees working from diverse and remote locations. We expect to invest cash generated from our existing business to support our growth initiatives. Our investments, which typically are made in advance of revenue, may not yield increased revenue to offset these expenses. As a result of these factors, the future revenue and income potential of our business is uncertain. Any evaluation of our business and our prospects must be considered in light of these factors and the risks and uncertainties often encountered by companies in our stage of development. Some of these risks and uncertainties relate to our ability to do the following:
| ● |
Maintain our current relationships and service programs, and develop new relationships, with service partners and licensees of our Support.com Cloud offering on acceptable terms or at all;
|
| ● |
Reach prospective customers for our software products in a cost-effective fashion;
|
| ● |
Reduce our dependence on a limited number of partners for a substantial majority of our revenue;
|
| ● |
Successfully license and grow our revenue related to our Support.com Cloud offering;
|
| ● |
Manage our employees and contract labor efficiently and effectively;
|
| ● |
Maintain gross and operating margins;
|
| ● |
Match staffing levels with demand for services and forecast requirements;
|
| ● |
Obtain bonuses and avoid penalties in contractual arrangements;
|
| ● |
Operate successfully in a time-based pricing model;
|
| ● |
Operate effectively in the SMB market;
|
| ● |
Successfully introduce new, and adapt our existing, services and products for consumers and businesses;
|
| ● |
Respond effectively to changes in the market for customer support services;
|
| ● |
Realize benefits of any acquisitions we make;
|
| ● |
Adapt to changes in the markets we serve;
|
| ● |
Adapt to changes in our industry, including consolidation;
|
| ● |
Respond to government regulations relating to our current and future business;
|
| ● |
Manage and respond to present, threatened, and future litigation; and
|
| ● |
Manage and respond to present, threatened or future government investigations and audits, including, without limitation, those audits and investigations described in Item 3 Legal Proceedings of this report.
|
If we are unable to address these risks, our business, results of operations and prospects could suffer.
Our quarterly results have in the past, and may in the future, fluctuate significantly.
Our quarterly revenue and operating results have in the past and may in the future fluctuate significantly from quarter to quarter. As a result, we believe that quarter-to-quarter and year-to-year comparisons of our revenue and operating results may not be accurate indicators of future performance.
Several factors that have contributed or may in the future contribute to fluctuations in our operating results include:
| ● |
The performance of our partners;
|
| ● |
Change, or reduction in or discontinuance of our principal programs with partners;
|
| ● |
Our reliance on a small number of partners for a substantial majority of our revenue;
|
| ● |
Our ability to successfully license and grow revenue related to our
|
| ● |
Guided Paths®, Support.com Cloud and our service offerings;
|
| ● |
The timing and ability to sell;
|
| ● |
The availability and cost-effectiveness of advertising placements for our software products and our ability to respond to changes in the advertising markets in which we participate;
|
| ● |
The efficiency and effectiveness of our technology specialists;
|
| ● |
Our ability to effectively match staffing levels with service volumes on a cost-effective basis;
|
| ● |
Our ability to manage contract labor;
|
| ● |
Our ability to hire, train, manage and retain our home-based customer support specialists and enhance the flexibility of our staffing model in a cost-effective fashion and in quantities sufficient to meet forecast requirements;
|
| ● |
Our ability to manage costs under our self-funded health insurance program;
|
| ● |
Usage rates on the subscriptions we offer;
|
| ● |
The rate of expansion of our offerings and our investments therein;
|
| ● |
Changes in the markets for computers and other technology devices relating to unit volume, pricing and other factors, including changes driven by declines in sales of personal computers and the growing popularity of tablets, and other mobile devices and the introduction of new devices into the connected home;
|
| ● |
Our ability to adapt to our customers’ needs in a market space defined by frequent technological change;
|
| ● |
The amount and timing of operating costs and capital expenditures in our business;
|
| ● |
Diversion of management’s attention from other business concerns, incurrence of costs and disruption of our ongoing business activities as a result of acquisitions or divestitures by us;
|
| ● |
Costs related to the defense and settlement of litigation which can also have an additional adverse impact on us because of negative publicity, diversion of management resources and other factors;
|
| ● |
Costs related to the defense and settlement of government investigations and audits which can also have an additional adverse impact on us because of negative publicity, diversion of management resources and other factors, including, without limitation, those audits and investigations described in Item 3 Legal Proceedings of this report; and
|
| ● |
Potential losses on investments, or other losses from financial instruments we may hold that are exposed to market risk.
|
Our Support.com Cloud offering is in its early stages and failure to market, sell and develop the offering effectively and competitively could result in a lack of growth.
A number of competitive offerings exist in the market, providing various feature sets that may overlap with our Support.com Cloud offering today or in the future. Some competitors in this market far exceed our spending on sales and marketing activities and benefit from greater existing brand awareness, channel relationships and existing customer relationships. We may not be able to reach the market effectively and adequately or convey our differentiation as needed to grow our customer base. To reach our target market effectively, we may be required to continue to invest substantial resources in sales and marketing and research and development activities, which could have a material adverse effect on our financial results. In addition, if we fail to develop and maintain competitive features, deliver high-quality products and satisfy existing customers, our Support.com Cloud offering could fail to grow. Growth in Support.com Cloud license revenue also depends on scaling our multi-tenant technology flexibly and cost-effectively to meet changing customer demand. Disruptions in infrastructure operations as described below could impair our ability to deliver Support.com Cloud offering to customers, thereby affecting our reputation with existing and prospective customers and possibly resulting in monetary penalties or financial losses.
Our end-user software revenues are dependent on online traffic patterns and the availability and cost of online advertising in certain key placements.
Some of our consumer end-user software revenue stream is obtained through advertising placements in certain key online media placements. From time to time a trend or a change in a key advertising placement will impact us, decreasing traffic or significantly increasing the cost or effectiveness of online advertising and therefore compromising our ability to purchase a desired volume and placement of advertisements at profitable rates. If such a change were to continue to occur, as it did in 2013 and on several occasions in the past, we may be unable to attract desired amounts of traffic, our costs for advertising may further increase beyond our forecasts and our software revenues may further decrease. As a result, our operating results would be negatively impacted.
Our business depends on our ability to attract and retain talented employees.
Our business is based on successfully attracting and retaining talented employees. The market for highly skilled workers and leaders in our industry is extremely competitive. If we are not successful in our recruiting efforts, or if we are unable to retain key employees and executive management, our ability to develop and deliver successful products and services may be adversely affected. Effective succession planning is also important to our long-term success. Failure to ensure effective transfer of knowledge and smooth transitions involving key employees and executive management could hinder our strategic planning and execution.
If we fail to attract, train and manage our consumer support specialists in a manner that meets forecast requirements and provides an adequate level of support for our customers, our reputation and financial performance could be harmed.
Our business depends in part on our ability to attract, manage and retain our customer support specialists and other support personnel. If we are unable to attract, train and manage in a cost-effective manner adequate numbers of competent specialists and other support personnel to be available as service volumes vary, particularly as we seek to expand the breadth and flexibility of our staffing model, our service levels could decline, which could harm our reputation, result in financial losses under contract terms, cause us to lose customers and partners, and otherwise adversely affect our financial performance. Our ability to meet our need for support personnel while controlling our labor costs is subject to numerous external factors, including the level of demand for our products and services, the availability of a sufficient number of qualified persons in the workforce, unemployment levels, prevailing wage rates, changing demographics, health and other insurance costs, including managing costs under our self-funded health insurance program which can vary substantially each reporting period, and the cost of compliance with labor and wage laws and regulations. In the case of programs with time-based pricing models, the impact of failing to attract, train and manage such personnel could directly and adversely affect our revenue and profitability. Although our service delivery and communications infrastructure enables us to monitor and manage customer support specialists remotely, because they are typically home-based and geographically dispersed, we could experience difficulties meeting services levels and effectively managing the costs, performance and compliance of these customer support specialists and other support personnel. Any problems we encounter in effectively attracting, managing and retaining our customer support specialists and other support personnel could seriously jeopardize our service delivery operations and our financial results.
Changes in the market for computers and other consumer electronics and in the technology support services market could adversely affect our business.
Reductions in unit volumes of sales for computers and other devices we support, or in the prices of such equipment, could adversely affect our business. We offer both services that are attached to the sales of new computers and other devices, and services designed to fix existing computers and other devices. Declines in the unit volumes sold of these devices or declines in the pricing of such devices could adversely affect demand for our services or our revenue mix, either of which would harm our operating results. Further, we do not support all types of computers and devices, meaning that we must select and focus on certain operating systems and technology standards for computers, tablets, smart phones, and other devices. We may not be successful in supporting new devices in the connected home and “Internet of Things,” and consumers and SMBs may prefer equipment we do not support, which may decrease the market for our services and products if customers migrate away from platforms we support. In addition, the structures and pricing models for programs in the technology support services market may change in ways that reduce our revenues and our margins.
Disruptions in our information technology and service delivery infrastructure and operations could impair the delivery of our services and harm our business.
We depend on the continuing operation of our information technology and communication systems and those of our third-party service providers. Any interruption or failure of our internal or external systems could prevent us or our service providers from accepting orders and delivering services, or cause company and consumer data to be unintentionally disclosed. Our continuing efforts to upgrade and enhance the security and reliability of our information technology and communications infrastructure could be very costly, and we may have to expend significant resources to remedy problems such as a security breach or service interruption. Interruptions in our services resulting from labor disputes, telephone or Internet failures, power or service outages, natural disasters or other events, or a security breach could reduce our revenue, increase our costs, cause customers and partners and licensees to fail to renew or to terminate their use of our offerings, and harm our reputation and our ability to attract new customers.
We may make acquisitions that deplete our resources and do not prove successful.
We have made acquisitions in the past and may make additional acquisitions in the future. Our management may not be able to effectively implement our acquisition program and internal growth strategy simultaneously. The integration of acquisitions involves a number of risks and presents financial, managerial and operational challenges. We may have difficulty, and may incur unanticipated expenses related to, integrating management and personnel from these acquired entities with our management and personnel. Our failure to identify, consummate or integrate suitable acquisitions could adversely affect our business and results of operations. We cannot readily predict the timing, size or success of our future acquisitions. Even successful acquisitions could have the effect of reducing our cash balances.
Our systems collect, access, use, and store personal customer information and enable customer transactions, which poses security risks, requires us to invest significant resources to prevent or correct problems caused by security breaches, and may harm our business.
A fundamental requirement for online communications, transactions and support is the secure collection, storage and transmission of confidential information. Our systems collect and store confidential and personal information of our individual customers as well as our partners and their customers’ users, including personally identifiable information and payment card information, and our employees and contractors may access and use that information in the course of providing services. In addition, we collect and retain personal information of our employees in the ordinary course of our business. We and our third-party contractors use commercially available technologies to secure this information. Despite these measures, parties may attempt to breach the security of our data or that of our customers. In addition, errors in the storage or transmission of data could breach the security of that information. We may be liable to our customers for any breach in security and any breach could subject us to governmental or administrative proceedings or monetary penalties, damage our relationships with partners and harm our business and reputation. Also, computers are vulnerable to computer viruses, physical or electronic break-ins and similar disruptions, which could lead to interruptions, delays or loss of data. We may be required to expend significant capital and other resources to comply with mandatory privacy and security standards required by law, industry standard, or contract, and to further protect against security breaches or to correct problems caused by any security breach.
We are exposed to risks associated with payment card and payment fraud and with payment card processing.
Certain of our customers use payment cards to pay for our services and products. We may suffer losses as a result of orders placed with fraudulent payment cards or other payment data. Our failure to detect or control payment fraud could have an adverse effect on our results of operations. We are also subject to payment card association operating standards and requirements, as in effect from time to time. Compliance with those standards requires us to invest in network and systems infrastructure and processes. Failure to comply with these rules or requirements may subject us to fines, potential contractual liabilities, and other costs, resulting in harm to our business and results of operations.
Privacy concerns and laws or other domestic or foreign regulations may require us to incur significant costs and may reduce the effectiveness of our solutions, and our failure to comply with those laws or regulations may harm our business and cause us to lose customers.
Our software and services contain features that allow our technology specialists and other personnel to access, control, monitor, and collect information from computers and other devices. Federal, state and foreign government bodies and agencies, however, have adopted or are considering adopting laws and regulations restricting or otherwise regulating the collection, use and disclosure of personal information obtained from consumers and individuals. Those regulations could require costly compliance measures, could reduce the efficiency of our operations, or could require us to modify or cease to provide our systems or services. Liability for violation of, costs of compliance with, and other burdens imposed by such laws and regulations may limit the use and adoption of our services and reduce overall demand for them. Even the perception of privacy concerns, whether or not valid, may harm our reputation and inhibit adoption of our solutions by current and future customers. In addition, we may face claims about invasion of privacy or inappropriate disclosure, use, storage, or loss of information obtained from our customers. Any imposition of liability could harm our reputation, cause us to lose customers and cause our operating results to suffer.
We rely on third-party technologies in providing certain of our software and services. Our inability to use, retain or integrate third-party technologies and relationships could delay service or software development and could harm our business.
We license technologies from third parties, which are integrated into our services, technology and end user software. Our use of commercial technologies licensed on a non-exclusive basis from third parties poses certain risks. Some of the third-party technologies we license may be provided under “open source” licenses, which may have terms that require us to make generally available our modifications or derivative works based on such open source code. Our inability to obtain or integrate third-party technologies with our own technology could delay service development until equivalent compatible technology can be identified, licensed and integrated. These third-party technologies may not continue to be available to us on commercially reasonable terms or at all. If our relationship with third parties were to deteriorate, or if such third parties were unable to develop innovative and saleable products, or component features of our products, we could be forced to identify a new developer and our future revenue could suffer. We may fail to successfully integrate any licensed technology into our services or software, or maintain it through our own development work, which would harm our business and operating results.
Our business operates in regulated industries.
Our current and anticipated service offerings operate in industries, such as home security, that are subject to various federal, state, provincial and local laws and regulations in the markets in which we operate. In certain jurisdictions, we may be required to obtain licenses or permits in order to comply with standards governing employee selection and training and to meet certain standards or licensing requirements in the conduct of our business. The loss of such licenses or permits or the imposition of conditions to the granting or retention of such licenses or permits could have a material adverse effect on us.
Changes in laws or regulations could require us to change the way we operate or to utilize resources to maintain compliance, which could increase costs or otherwise disrupt operations. In addition, failure to comply with any applicable laws or regulations could result in substantial fines or revocation of our operating permits and licenses for us or our partners. If laws and regulations were to change, or if we or our products and services were deemed not to comply with them, our business, financial condition, results of operations and cash flows could be materially and adversely affected.
If our services are used to commit fraud or other similar intentional or illegal acts, we may incur significant liabilities, our services may be perceived as not secure and customers may curtail or stop using our services.
Certain software and services we provide, including our Support.com Cloud applications, enable remote access to and control of third-party computer systems and devices. We generally are not able to control how such access may be used or misused by licensees of our SaaS offerings. If our software is used by others to commit fraud or other illegal acts, including, but not limited to, violating data privacy laws, proliferating computer files that contain a virus or other harmful elements, interfering or disrupting third-party networks, infringing any third party’s copyright, patent, trademark, trade secret or other rights, transmitting any unlawful, harassing, libelous, abusive, threatening, vulgar, obscene or otherwise objectionable material, or committing unauthorized access to computers, devices, or protected information, third parties may seek to hold us legally liable. As a result, defending such claims could be expensive and time-consuming regardless of the merits, and we could incur significant liability or be required to undertake expensive preventive or remedial actions. As a result, our operating results may suffer and our reputation may be damaged.
We may face intellectual property infringement claims that could be costly to defend and result in our loss of significant rights.
Our business relies on the use and licensing of technology. Other parties may assert intellectual property infringement claims against us or our customers, and our products may infringe the intellectual property rights of third parties. For example, our products may infringe patents issued to third parties. In addition, as is increasingly common in the technology sector, we may be confronted with the aggressive enforcement of patents by companies whose primary business activity is to acquire patents for the purpose of offensively asserting them against other companies. From time to time, we have received allegations or claims of intellectual property infringement, and we may receive more claims in the future. We may also be required to pursue litigation to protect our intellectual property rights or defend against allegations of infringement. Intellectual property litigation is expensive and time-consuming and could divert management’s attention from our business. The outcome of any litigation is uncertain and could significantly impact our financial results. If there is a successful claim of infringement, we may be required to develop non-infringing technology or enter into royalty or license agreements which may not be available on acceptable terms, if at all. Our failure to develop non-infringing technologies or license proprietary rights on a timely basis would harm our business.
We may face class actions and similar claims that could be costly to defend or settle and result in negative publicity and diversion of management resources.
Our business involves direct sale and licensing of services and software to consumers and SMBs, and we typically include customary indemnification provisions in favor of our partners in our agreements for the distribution of our services and software. As a result, we can be subject to consumer litigation and legal proceedings related to our services and software, including putative class action claims and similar legal actions, including, but not limited to, consumer litigation and legal proceedings that may arise related to the FTC and DOL investigations described in Note 3 Legal Proceedings in this report. We can also be subject to employee litigation and legal proceedings related to our employment practices attempted on a class or representative basis. Such litigation can be expensive and time-consuming regardless of the merits of any action, and could divert management’s attention from our business. The cost of defense can be large as can any settlement or judgment in an action. The outcome of any litigation is uncertain and could significantly impact our financial results. Regardless of outcome, litigation can have an adverse impact on us because of defense costs, negative publicity, diversion of management resources and other factors.
Delaware law and our certificate of incorporation and bylaws contain anti-takeover provisions, and our Board adopted a Section 382 Tax Benefits Preservation Plan, any of which could delay or discourage takeover attempts that some stockholders may consider favorable.
Delaware law and our certificate of incorporation and amended and restated bylaws contain certain provisions, any of which could render more difficult, or discourage a merger, tender offer, or assumption of control of the Company that is not approved by our Board of Directors that some stockholders may consider favorable. In addition, on April 20, 2016, our Board acted to preserve the potential benefits of our NOLs from being limited pursuant to Section 382 of the Code by adopting a Section 382 Tax Benefits Preservation Plan (the “Section 382 Tax Benefits Preservation Plan”). The principal reason our Board adopted the Section 382 Tax Benefits Preservation Plan is that we believe that the NOLs are a potentially valuable asset and the Board believes it is in the Company’s best interests to attempt to protect this asset by preventing the imposition of limitations on their use. While the Section 382 Tax Benefits Preservation Plan is not principally intended to prevent a takeover, it does have a potential anti-takeover effect because an “acquiring person” thereunder may be diluted upon the occurrence of a triggering event. Accordingly, the overall effects of the Section 382 Tax Benefits Preservation Plan may be to render more difficult, or discourage a merger, tender offer, or assumption of control by a substantial holder of our securities. The Section 382 Tax Benefits Preservation Plan, however, should not interfere with any merger or other business combination approved by the Board.
Not applicable.
Our corporate headquarters is located in Sunnyvale, California, where we sublease an office facility of approximately 6,283 square feet. The sublease agreement will expire on March 31, 2018. We are in the process of renewing the new lease and evaluating an expansion of our corporate headquarters to support the growth of the business. We also lease office facilities in Eugene, Oregon (for which the lease agreement was expired on December 31, 2017 and we have renewed the 3-year terms from January 1, 2018 to December 31, 2020. We also leased an office in Louisville, Colorado for which the lease agreement expired on January 31, 2017 and is being renewed with a maximum 90 day commitment. In addition, we lease office space in Manila, Philippines for which the lease will expire on May 15, 2018.
On October 11, 2016 the Wage and Hour Division of the U.S. Department of Labor (“DOL”) notified the Company that it would be conducting an audit of the Company relating to compliance with the Fair Labor Standards Act (“FLSA”). The DOL indicated that the focus of the audit is directed to compliance with overtime requirements related to our customer support specialists who work from home providing customer support services. The audit commenced on October 20, 2016 and was resolved by settlement agreement on January 18, 2018. Pursuant to the settlement agreement, as of December 31, 2017, the Company accrued $30,000 in back wages and related liquidated damages to some of our current and former employees.
On December 20, 2016 the Federal Trade Commission (“FTC”) issued a Civil Investigative Demand, or CID, to the Company requiring the Company to produce certain documents and materials and to answer certain interrogatories relating to PC Healthcheck, a software program provided by the Company to certain third parties prior to December 31, 2016. Since issuing the CID, the FTC has sought additional written and testimonial evidence from the Company. The Company has cooperated with the investigation from its inception and provided all of the requested information. On March 9, 2018, the FTC notified the Company that the FTC was willing to engage in settlement discussions. At this time it is difficult to predict the timing, and the likely outcome, of these matters. The possible range of outcomes include the filing by the FTC of a contested civil complaint and further discussions leading to a settlement which would likely include a monetary payment and injunctive and other relief. If discussions with the FTC do not progress to a mutually agreeable outcome, it is likely that litigation will ensue. Although we are confident in our legal position, litigation outcomes by their very nature are difficult to predict and there can be no assurance of a particular outcome. The outcome of these matters with the FTC, whether by mutual resolution or through litigation, could have a material adverse impact on the Company’s business operations, its results of operations or its financial condition. The Company is currently unable to estimate a range of potential loss, if any, and has not accrued any amounts with respect to any potential monetary payments relating to this matter. Legal costs associated with this action may be material and will be expensed as incurred.
On January 17, 2017 the Consumer Protection Division of the Office of Attorney General, State of Washington (“Washington AG”), issued a Civil Investigative Demand to the Company requiring the Company to produce certain documents and materials and to answer certain interrogatories relating to PC Healthcheck. The Washington AG has not alleged a factual basis underlying the issuance of the Civil Investigative Demand. On May 30, 2017, the Consumer Protection Division of the Office of Attorney General, State of Texas (“Texas AG”), issued a Civil Investigative Demand to the Company requiring the Company to produce certain documents and materials and to answer certain interrogatories relating to PC Healthcheck. The Texas AG has not alleged a factual basis underlying the issuance of the Civil Investigative Demand. The Company is in the process of responding to these Civil Investigative Demands and cooperating with the FTC, Washington AG and Texas AG with respect to these matters.
We are also subject to other routine legal proceedings, as well as demands, claims and threatened litigation, that arise in the normal course of our business, potentially including assertions that we may be infringing patents or other intellectual property rights of others. We currently do not believe that the ultimate amount of liability, if any, for such routine legal proceedings (alone or combined) will materially affect our financial position, results of operations or cash flows. The ultimate outcome of any litigation is uncertain, however, and unfavorable outcomes could have a material negative impact on our financial condition and operating results. Regardless of outcome, litigation can have an adverse impact on us because of defense costs, negative publicity, diversion of management resources and other factors.
Guarantees
We have identified guarantees in accordance with ASC 450, Contingencies. This guidance stipulates that an entity must recognize an initial liability for the fair value, or market value, of the obligation it assumes under the guarantee at the time it issues such a guarantee, and must disclose that information in its interim and annual financial statements. We have entered into various service level agreements with our partners, in which we may guarantee the maintenance of certain service level thresholds. Under some circumstances, if we do not meet these thresholds, we may be liable for certain financial costs. We evaluate costs for such guarantees under the provisions of ASC 450. We consider such factors as the degree of probability that we would be required to satisfy the liability associated with the guarantee and the ability to make a reasonable estimate of the resulting cost. We incurred zero costs as a result of such obligations during the years ended December 31, 2017 and 2016. We have not accrued any liabilities related to such obligations in the consolidated financial statements as of December 31, 2017 and 2016.
Not applicable.
PART II
| ITEM 5. |
MARKET FOR THE REGISTRANT’S COMMON EQUITY, RELATED STOCKHOLDER MATTERS AND ISSUER PURCHASES OF EQUITY SECURITIES.
|
Market of Common Stock
Our common stock has been traded publicly on the Nasdaq Global Select Market (“Nasdaq”) under the symbol “SPRT” since July 19, 2000. Before July 19, 2000, there was no public market for our common stock. The following table sets forth the highest and lowest sale price of our common stock for the quarters indicated:
|
Low
|
High
|
|||||||
|
Fiscal Year 2017:
|
||||||||
|
First Quarter
|
$
|
1.89
|
$
|
2.64
|
||||
|
Second Quarter
|
$
|
2.07
|
$
|
2.63
|
||||
|
Third Quarter
|
$
|
2.01
|
$
|
2.48
|
||||
|
Fourth Quarter
|
$
|
2.22
|
$
|
2.61
|
||||
|
Fiscal Year 2016:
|
||||||||
|
First Quarter
|
$
|
2.10
|
$
|
3.18
|
||||
|
Second Quarter
|
$
|
2.16
|
$
|
3.00
|
||||
|
Third Quarter
|
$
|
2.37
|
$
|
2.94
|
||||
|
Fourth Quarter
|
$
|
1.98
|
$
|
2.61
|
||||
Holders of Record
As of February 28, 2018, there were approximately 88 holders of record of our common stock (not including beneficial holders of stock held in street name).
Dividend Policy
We have not declared or paid any cash dividends on our capital stock since our inception and do not expect to do so in the foreseeable future. We currently anticipate that all future earnings, if any, generated from operations will be retained by us to develop and expand our business. Any future determination with respect to the payment of dividends will be at the discretion of the Board of Directors and will depend on, among other things, our operating results, financial condition and capital requirements, the terms of then-existing indebtedness, general business conditions and such other factors as the Board of Directors deems relevant.
Securities Authorized for Issuance Under Equity Compensation Plans
Information regarding the securities authorized for issuance under our equity compensation plans can be found under Item 12 of Part III of this Report.
Stock Price Performance Graph
The following graph illustrates a comparison of the cumulative total stockholder return (change in stock price plus reinvested dividends) of the Company’s Common Stock and the CRSP Total Return Index for the Nasdaq U.S. Stocks (the “Nasdaq Composite Index”) and Nasdaq Computer and Data Processing Services Index from December 31, 2011 through December 31, 2017. The graph assumes that $100 was invested on December 31, 2011 in us, the Nasdaq Composite Index and the Nasdaq Computer and Data Processing Services Index and that all dividends were reinvested. No cash dividends have been declared or paid on our common stock. Our common stock has been traded on the Nasdaq since July 19, 2000. The comparisons in the table are required by the SEC and are not intended to forecast or be indicative of possible future performance of our common stock.
COMPARISON OF CUMULATIVE TOTAL RETURN AMONG
SUPPORT.COM, INC.,
THE NASDAQ COMPOSITE INDEX, AND
THE NASDAQ COMPUTER INDEX
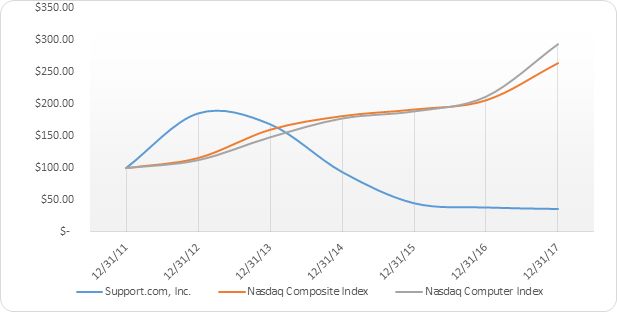
CUMULATIVE TOTAL RETURN AT PERIOD END
|
12/30/11
|
12/31/12
|
12/31/13
|
12/31/14
|
12/31/15
|
12/31/16
|
12/31/17
|
||||||||||||||||||||||
|
Support.com, Inc.
|
$
|
100.00
|
$
|
185.33
|
$
|
168.44
|
$
|
93.78
|
$
|
44.89
|
$
|
38.22
|
$
|
35.85
|
||||||||||||||
|
Nasdaq Composite Index
|
$
|
100.00
|
$
|
115.91
|
$
|
160.32
|
$
|
181.80
|
$
|
192.21
|
$
|
206.63
|
$
|
264.99
|
||||||||||||||
|
Nasdaq Computer Index
|
$
|
100.00
|
$
|
112.48
|
$
|
148.41
|
$
|
177.91
|
$
|
189.02
|
$
|
212.21
|
$
|
294.48
|
||||||||||||||
The information presented above in the stock performance graph shall not be deemed to be “soliciting material” or to be “filed” with the Securities and Exchange Commission or subject to Regulation 14A or 14C, except to the extent that we subsequently specifically request that such information be treated as soliciting material or specifically incorporate it by reference into a filing under the Securities Act of 1933 or Exchange Act.
Support.com is a leading provider of customer support services, end user software, and cloud-based software. In June 2009, we sold our legacy Enterprise software business to Consona Corporation and focused our efforts purely on the consumer and SMB markets for technology services, and our Support.com Cloud offering. Therefore, our audited consolidated financial statements, accompanying notes and other information provided in this Form 10-K reflect the Enterprise business as a discontinued operation for all periods presented in accordance with ASC 360, Accounting for the Impairment or Disposal of Long-Lived Assets. The Company currently reports its operations as a single operating segment.
The information set forth below is not necessarily indicative of results of future operations and should be read in conjunction with “Management’s Discussion and Analysis of Financial Condition and Results of Operations” and the consolidated financial statements and related notes included in Items 7 and 8 of Part II of this Report.
|
Year Ended December 31,
|
||||||||||||
|
2017
|
2016
|
2015
|
||||||||||
|
Consolidated Statements of Operations Data:
|
||||||||||||
|
Revenue:
|
||||||||||||
|
Services
|
$
|
54,670
|
$
|
56,311
|
$
|
72,151
|
||||||
|
Software and other
|
5,451
|
5,349
|
5,182
|
|||||||||
|
Total revenue
|
60,121
|
61,660
|
77,333
|
|||||||||
|
Cost of revenue:
|
||||||||||||
|
Cost of services
|
47,101
|
50,245
|
61,439
|
|||||||||
|
Cost of software and other
|
287
|
486
|
536
|
|||||||||
|
Total cost of revenue
|
47,388
|
50,731
|
61,975
|
|||||||||
|
Gross profit
|
12,733
|
10,929
|
15,358
|
|||||||||
|
Operating expenses:
|
||||||||||||
|
Research and development
|
3,033
|
5,577
|
6,957
|
|||||||||
|
Sales and marketing
|
2,425
|
6,671
|
8,545
|
|||||||||
|
General and administrative
|
8,696
|
12,958
|
13,011
|
|||||||||
|
Amortization of intangible assets and other
|
16
|
1,028
|
1,069
|
|||||||||
|
Goodwill impairment
|
—
|
—
|
14,240
|
|||||||||
|
Restructuring
|
128
|
1,146
|
—
|
|||||||||
|
Total operating expenses
|
14,298
|
27,380
|
43,822
|
|||||||||
|
Income (loss) from operations
|
(1,565
|
)
|
(16,451
|
)
|
(28,464
|
)
|
||||||
|
Interest income and other, net
|
643
|
518
|
430
|
|||||||||
|
Income (loss) from continuing operations, before income taxes
|
(922
|
)
|
(15,933
|
)
|
(28,034
|
)
|
||||||
|
Income tax provision (benefit)
|
604
|
307
|
(965
|
)
|
||||||||
|
Income (loss) from continuing operations, after income taxes
|
(1,526
|
)
|
(16,240
|
)
|
(27,069
|
)
|
||||||
|
Income from discontinued operations, after income taxes
|
—
|
284
|
28
|
|||||||||
|
Net income (loss)
|
$
|
(1,526
|
)
|
$
|
(15,956
|
)
|
$
|
(27,041
|
)
|
|||
|
Basic earnings (loss) per share:
|
||||||||||||
|
Continuing operations, after income taxes
|
$
|
(0.08
|
)
|
$
|
(0.88
|
)
|
$
|
(1.49
|
)
|
|||
|
Discontinued operations, after income taxes
|
0.00
|
0.01
|
0.00
|
|||||||||
|
Basic net earnings (loss) per share
|
$
|
(0.08
|
)
|
$
|
(0.87
|
)
|
$
|
(1.49
|
)
|
|||
|
Diluted earnings (loss) per share:
|
||||||||||||
|
Continuing operations, after income taxes
|
$
|
(0.08
|
)
|
$
|
(0.88
|
)
|
$
|
(1.49
|
)
|
|||
|
Discontinued operations, after income taxes
|
0.00
|
0.01
|
0.00
|
|||||||||
|
Diluted net earnings (loss) per share
|
$
|
(0.08
|
)
|
$
|
(0.87
|
)
|
$
|
(1.49
|
)
|
|||
|
Shares used in computing per share amounts:
|
||||||||||||
|
Basic
|
18,644
|
18,409
|
18,182
|
|||||||||
|
Diluted
|
18,644
|
18,409
|
18,182
|
|||||||||
|
December 31,
|
||||||||||||
|
2017
|
2016
|
2015
|
||||||||||
|
Consolidated Balance Sheet Data:
|
||||||||||||
|
Cash, cash equivalents and investments
|
$
|
49,233
|
$
|
53,409
|
$
|
65,734
|
||||||
|
Working capital
|
$
|
54,989
|
$
|
54,873
|
$
|
67,873
|
||||||
|
Total assets
|
$
|
64,353
|
$
|
67,229
|
$
|
81,492
|
||||||
|
Long-term obligations
|
$
|
898
|
$
|
607
|
$
|
792
|
||||||
|
Accumulated deficit
|
$
|
(203,996
|
)
|
$
|
(202,470
|
)
|
$
|
(186,514
|
)
|
|||
|
Total stockholders’ equity
|
$
|
56,458
|
$
|
57,308
|
$
|
71,346
|
||||||
The following discussion of our financial condition and results of operations should be read in conjunction with our consolidated financial statements and the related notes included elsewhere in this Form 10-K. The following discussion includes forward-looking statements. Please see the section entitled “Risk Factors” in Item 1A of this Report for important information to consider when evaluating these statements.
Overview
Support.com is a leading provider of tech support and turnkey support center services, producer of SUPERAntiSpyware® anti-malware products, and the maker of Support.com® software. Our technology support services programs help leading brands create new revenue streams and deepen customer relationships. We offer turnkey, outsourced support services for service providers, retailers and technology companies. Our technology support services programs are designed for both the consumer and small and medium business (“SMB”) markets, and include computer and mobile device set-up, security and support, virus and malware removal, wireless network set-up, and home security and automation system support. Our Support.com Cloud offering is a SaaS solution for companies to optimize support interactions with their customers using their own or third party support personnel. The solution enables companies to quickly resolve complex technology issues for their customers, boosting agent productivity and dramatically improving the customer experience.
Total revenue for the year ended December 31, 2017 decreased by $1.5 million, or 2%, from 2016. Revenue from services for the year ended 2016 decreased by $15.8 million, or 22%, from 2015. The decrease in service revenue was primarily due to an increase in the billable hours of Comcast offset by the significant decrease in revenue from Office Depot due to the termination of Professional Service Agreement between us and Office Depot in September, 2017. Revenue from software and other increased by $0.1 million, or 2%, from 2016 primarily due to new subscriptions exceeding expiring subscriptions.
Cost of services for the year ended December 31, 2017 decreased by $3.1 million or 6% from 2016 and was mainly driven by lower compensation and benefit cost and consulting and technology charges for 2017. Cost of software and other for the year ended December 31, 2017 decreased by $0.2 million or 41% year-over-year principally due to reduction in credit card processing fees related to our Call Center Services. Total gross margin increased from 18% to 21% year-over-year which was primarily attributable to lower employee benefit costs associated with our self-insured medical insurance plan and consulting and technology related charges.
Operating expenses for the year ended December 31, 2017 decreased by $13.1 million or 48% from 2016. The decrease is primarily related to lower research and development costs of $2.5 million, lower sales and marketing costs of $4.2 million, a decrease in general and administration costs of $4.3 million, all of which are due lower headcount in connection with cost reduction efforts during 2017, which decreased compensation and benefits related expenses, stock compensation, travel, and consulting expenses and a decrease in amortization of intangibles assets and other of $1.0 million attributable to the Company’s intangible assets being fully amortized at the end of 2016 and early 2017. Also contributing to the year-over-year decrease were restructuring costs of $1.1 million in 2016 as compared with $0.1 million in 2017.
We intend the following discussion of our financial condition and results of operations to provide information that will assist in understanding our consolidated financial statements, the changes in certain key items in those consolidated financial statements from year to year, and the primary factors that accounted for those changes, as well as how certain accounting principles, policies and estimates affect our consolidated financial statements.
Critical Accounting Policies and Estimates
In preparing our consolidated financial statements in conformity with generally accepted accounting principles in the United States, we make assumptions, judgments and estimates that can have a significant impact on our revenue and operating results, as well as on the value of certain assets and liabilities on our consolidated balance sheet. We base our assumptions, judgments and estimates on historical experience and various other factors that we believe to be reasonable under the circumstances. Actual results could differ materially from these estimates under different assumptions or conditions. On a regular basis we evaluate our assumptions, judgments and estimates and make changes accordingly. We believe that the assumptions, judgments and estimates involved in the accounting for revenue recognition, fair value measurements, purchase accounting in business combinations, self-insurance accruals, accounting for intangible assets, stock-based compensation and accounting for income taxes have the greatest potential impact on our consolidated financial statements, so we consider these to be our critical accounting policies. We discuss below the critical accounting estimates associated with these policies. For further information on the critical accounting policies, see Note 1 of our Notes to Consolidated Financial Statements.
Revenue Recognition
Our revenue recognition policy is one of our critical accounting policies because revenue is a key component of our results of operations, and revenue recognition is based on complex rules which require us to make judgments. In accordance with the provisions of ASC 605, Revenue Recognition, we recognize revenue only when all of the following criteria are met: (i) persuasive evidence of an arrangement exists, (ii) delivery has occurred, (iii) collection is considered probable, and (iv) the fees are fixed or determinable. We do not record revenue on sales transactions when the collection of cash is in doubt at the time of sale, and we use management judgment in determining collectability. From time to time, we may enter into agreements which involve us making payments to our partners. We use judgment in evaluating the treatment of such payments and in determining which portions of the consideration paid to customers should be recorded as contra-revenue and which should be recorded as an expense. We generally provide a refund period on services and end-user software products, and we employ judgment in determining whether a customer is eligible for a refund based on that customer’s specific facts and circumstances. Our Support.com Cloud (Nexus) agreements usually include service level thresholds under which we may be liable for certain financial costs. If our estimates and judgments on any of the foregoing are incorrect, our revenue for one or more periods may be incorrectly recorded. Please see Note 1 in Notes to the Consolidated Financial Statements for further discussion of our revenue recognition policies.
Fair Value Measurements
ASC 820, Fair Value Measurements and Disclosures, defines fair value, establishes a framework for measuring fair value under generally accepted accounting principles and enhances disclosures about fair value measurements. Fair value is defined as the exchange price that would be received for an asset or paid to transfer a liability in the principal or most advantageous market for the asset or liability in an orderly transaction between market participants on the measurement date. Valuation techniques used to measure fair value must maximize the use of observable inputs and minimize the use of unobservable inputs. The standard describes a fair value hierarchy based on three levels of inputs, of which the first two are considered observable and the last unobservable, that may be used to measure fair value, which are the following:
| ● |
Level 1 - Quoted prices in active markets for identical assets or liabilities. Therefore, determining fair value for Level 1 instruments generally does not require significant management judgment, and the estimation is not difficult.
|
| ● |
Level 2 - Inputs other than Level 1 that are observable, either directly or indirectly, such as quoted prices for similar assets or liabilities; quoted prices in markets that are not active; or other inputs that are observable or can be corroborated by observable market data for substantially the full term of the assets or liabilities. Level 2 instruments require limited management judgment.
|
| ● |
Level 3 - Unobservable inputs that are supported by little or no market activity and that are significant to the fair value of the assets or liabilities. The determination of fair value for Level 3 instruments requires the most management judgment and subjectivity.
|
Our Level 2 securities are priced using quoted market prices for similar instruments, nonbinding market prices that are corroborated by observable market data, or discounted cash flow techniques. Marketable securities, measured at fair value using Level 2 inputs, are primarily comprised of commercial paper, corporate bonds, corporate notes and U.S. government agencies securities. We review trading activity and pricing for these investments as of the measurement date. When sufficient quoted pricing for identical securities is not available, we use market pricing and other observable market inputs for similar securities obtained from various third-party data providers. These inputs either represent quoted prices for similar assets in active markets or have been derived from observable market data.
Purchase Accounting in Business Combinations
Under the purchase method of accounting, we allocate the purchase price of acquired companies to the tangible and identifiable intangible assets acquired and liabilities assumed based on their estimated fair values. We record the excess of purchase price over the aggregate fair values of the tangible and identifiable intangible assets as goodwill. We determine the fair values of assets acquired and liabilities assumed. These valuations require us to make significant estimates and assumptions, especially with respect to intangible assets. Such estimates include assumptions regarding future revenue streams, market performance, customer base, and various vendor relationships. We estimate the economic lives of certain acquired assets and these lives are used to calculate depreciation and amortization expenses. We estimate the future cash flows to be derived from such assets, and these estimates are used to determine the fair value of the assets. If any of these estimates change, depreciation or amortization expenses could be changed and/or the value of our intangible assets could be impaired.
Accounting for Intangible Assets
We test goodwill for impairment annually on September 30 and whenever events or changes in circumstances indicate that the carrying value of the asset may not be recoverable. Consistent with our assessment that we have only one reporting segment, we test goodwill for impairment at the entity level. We test goodwill using the two-step process. In the first step, we compare the carrying value of the reporting unit to the fair value based on quoted market prices of our common stock. If the fair value of the reporting unit exceeds the carrying value, goodwill is not considered impaired and no further testing is required. If the carrying value exceeds the fair value, goodwill is potentially impaired and the second step of the impairment test must be performed. In the second step, we compare the implied fair value of the goodwill, to the carrying value to determine the impairment loss, if any.
We assess the impairment of identifiable intangible assets whenever events or changes in circumstances indicate that the carrying value may not be recoverable. An impairment loss would be recognized when the sum of the future net cash flows expected to result from the use of the asset and its eventual disposition is less than its carrying value. As of December 31, 2017, we determined that there was no triggering event which caused the impairment of identifiable intangible assets.
If our estimates regarding future cash flows derived from such assets were to change, we may record an impairment charge to the value of these assets. Such impairment loss would be measured as the difference between the carrying value of the asset and its fair value.
Stock-Based Compensation
We account for stock-based compensation in accordance with the provisions of ASC 718, Compensation - Stock Compensation. Under the fair value recognition provisions of ASC 718, stock-based compensation cost is estimated at the grant date based on the fair value of the award and is recognized as expense ratably over the requisite service period of the award. We estimate the fair value of stock-based awards on the grant date using (i) the Black-Scholes-Merton option-pricing model for service-based stock options and (ii) the quoted prices of the Company’s common stock for restricted stock units. Determining the appropriate fair value model and calculating the fair value of stock-based awards requires judgment, including estimating stock price volatility, forfeiture rates and expected life. If any of these assumptions used in the option-pricing models change, our stock-based compensation expense could change on our consolidated financial statements.
Accounting for Income Taxes
We are required to estimate our income taxes in each of the tax jurisdictions in which we operate. This process involves management’s estimation of our current tax exposures together with an assessment of temporary differences determined based on the difference between the financial statement and tax basis of certain items. These differences result in net deferred tax assets and liabilities, which are included in our consolidated balance sheet. We must assess the likelihood that we will be able to recover our deferred tax assets. If recovery is not likely, we must increase our provision for taxes by recording a valuation allowance against the deferred tax assets that we estimate will not ultimately be recoverable. We currently have provided a full valuation allowance on our U.S. deferred tax assets that management determined are not likely to be realized due to cumulative net losses since inception and the difficulty in accurately forecasting the Company’s results. In addition, we currently have provided a partial valuation allowance on certain foreign deferred tax assets. If any of our estimates change, we may change the likelihood of recovery and our tax expense as well as the value of our deferred tax assets would change.
Our income tax calculations are based on the application of the respective U.S. Federal, state or foreign tax law. The Company’s tax filings, however, are subject to audit by the respective tax authorities. Accordingly, we recognize tax liabilities based on our estimate of whether, and the extent to which, additional taxes will be due when such estimates are more-likely-than-not to be sustained. An uncertain income tax position will not be recognized if it has less than a 50% likelihood of being sustained. Our policy is to include interest and penalties related to unrecognized tax benefits as a component of income tax expense. To the extent the final tax liabilities are different than the amounts originally accrued, the increases or decreases are recorded as income tax expense or benefit in the consolidated statements of operations.
Results of Operations
The following table presents certain Consolidated Statements of Operations data for the periods indicated as a percentage of total revenue:
|
Year Ended December 31,
|
||||||||
|
2017
|
2016
|
|||||||
|
Revenue:
|
||||||||
|
Services
|
91
|
%
|
91
|
%
|
||||
|
Software and other
|
9
|
9
|
||||||
|
Total revenue
|
100
|
100
|
||||||
|
Cost of revenue:
|
||||||||
|
Cost of services
|
78
|
81
|
||||||
|
Cost of software and other
|
1
|
1
|
||||||
|
Total cost of revenue
|
79
|
82
|
||||||
|
Gross profit
|
21
|
18
|
||||||
|
Operating expenses:
|
||||||||
|
Research and development
|
5
|
9
|
||||||
|
Sales and marketing
|
4
|
11
|
||||||
|
General and administrative
|
14
|
21
|
||||||
|
Amortization of intangible assets and other
|
0
|
2
|
||||||
|
Impairment of goodwill
|
—
|
—
|
||||||
|
Restructuring
|
1
|
2
|
||||||
|
Total operating expenses
|
24
|
45
|
||||||
|
Income (loss) from operations
|
(3
|
)
|
(27
|
)
|
||||
|
Interest income and other, net
|
1
|
1
|
||||||
|
Income (loss) from continuing operations, before income taxes
|
(2
|
)
|
(26
|
)
|
||||
|
Income tax provision
|
(1
|
)
|
—
|
|||||
|
Income (loss) from continuing operations, after income taxes
|
(3
|
)
|
(26
|
)
|
||||
|
Income from discontinued operations, after income taxes
|
—
|
—
|
||||||
|
Net income (loss)
|
(3
|
)%
|
(26
|
)%
|
||||
Years Ended December 31, 2017 and 2016:
Revenue
|
($ in thousands)
|
2017
|
% Change
2016 to 2017
|
2016
|
|||||||||
|
Services
|
$
|
54,670
|
(3
|
)%
|
$
|
56,311
|
||||||
|
Software and other
|
5,451
|
1
|
%
|
5,349
|
||||||||
|
Total revenue
|
$
|
60,121
|
(2
|
)%
|
$
|
61,660
|
||||||
Services. Services revenue consists primarily of fees for customer support services generated from our partners. We provide these services remotely, generally using service delivery personnel who utilize our proprietary technology to deliver the services. Services revenue is also comprised of licensing of our Support.com Cloud applications. Services revenue for the year ended December 31, 2017 decreased by $1.6 million from 2016. The decrease in service revenue was primarily due to the significant decrease in revenue from Office Depot due to Office Depot reducing some of the service programs that we offer to their in-store customers, which reduced call volumes and service incidents. This decrease was somewhat offset by an increase in the billable hours of Comcast. For the year ended December 31, 2017, services revenue generated from our partnerships was $50.3 million compared to $52.2 million for 2016. For the year ended December 31, 2017, direct services revenue was $4.4 million compared to $4.1 million for 2016.
On July 28, 2017, Office Depot provided written notice of its intent not to renew the Professional Services Agreement between the Company and Office Depot dated July 26. 2007, and such Agreement terminated on September 30, 2017. Revenue attributed to Office Depot for the year ended December 31, 2017 was $3.1 million compared to $8.9 million for the year ended December 31, 2016. As with any market that is undergoing shifts, timing of downward pressures and growth opportunities in our services programs are difficult to predict. We are experiencing downward pressure with some of our services programs as PC and certain retail markets are seeing some seasonal or other sector specific softness. However, we still see opportunity in the market for growth with our service partners as a result of the evolving support market trends.
Software and other. Software and other revenue is comprised primarily of fees for end-user software products provided through direct customer downloads, and, to a lesser extent, through the sale of these software products via partners.
Software and other revenue for the year ended December 31, 2017 was relatively flat as compared with the year ended 2016. For the year ended December 31, 2017, direct software and other revenue was $2.7 million compared to $3.0 million for 2016. For the year ended December 31, 2017, software and other revenue generated from our partnerships was $2.7 million compared to $2.4 million for 2016.
Revenue Mix
The components of revenue, expressed as a percentage of total revenue were:
|
Year Ended December 31
|
||||||||
|
2017
|
2016
|
|||||||
|
Services
|
91
|
%
|
91
|
%
|
||||
|
Software and other
|
9
|
%
|
9
|
%
|
||||
|
Total revenue
|
100
|
%
|
100
|
%
|
||||
For the year ended December 31, 2017, Comcast accounted for 65% of our total revenue. For the year ended December 31, 2016, Comcast and Office Depot accounted for 60% and 15%, respectively, of our total revenue. No other customers accounted for 10% or more of our total revenue in any year presented. Revenue from customers outside the United States accounted for less than 1% of our total revenue in 2017 and 2016.
Cost of Revenue
|
($ in thousands)
|
2017
|
% Change
2016 to 2017
|
2016
|
|||||||||
|
Cost of services
|
$
|
47,101
|
(6
|
)%
|
$
|
50,245
|
||||||
|
Cost of software and other
|
287
|
(41
|
)%
|
486
|
||||||||
|
Total cost of revenues
|
$
|
47,388
|
(7
|
)%
|
$
|
50,731
|
||||||
Cost of services. Cost of services consists primarily of compensation costs and contractor expenses for people providing services, technology and telecommunication expenses related to the delivery of services and other personnel-related expenses in service delivery. The decrease of $3.1 million in cost of services for the year ended December 31, 2017 compared to 2016 includes a decrease in compensation and benefits charges of $2.9 million and lower consulting and technology related charges of $1.7 million, offset by a $1.4 million increase of outside consulting from partners located in the Philippines.
Cost of software and other. Cost of software and other fees consists primarily of third-party royalty fees for our end-user software products, wages, and processing fees. Certain of these products were developed using third-party research and development resources, and the third party receives royalty payments on sales of products it developed. The decrease of $0.2 million in cost of software and other for the year ended December 31, 2017 compared to 2016 was primarily due to the reduction in credit card processing fees related to our Call Center Services.
Operating expenses
|
($ in thousands)
|
2017
|
% Change
2016 to 2017
|
2016
|
|||||||||
|
Research and development
|
$
|
3,033
|
(46
|
)%
|
$
|
5,577
|
||||||
|
Sales and marketing
|
2,425
|
(64
|
)%
|
6,671
|
||||||||
|
General and administrative
|
8,696
|
(33
|
)%
|
12,958
|
||||||||
|
Amortization of intangible assets and other
|
16
|
(98
|
)%
|
1,028
|
||||||||
|
Goodwill impairment
|
—
|
(0
|
)%
|
—
|
||||||||
|
Restructuring
|
128
|
(89
|
)%
|
1,146
|
||||||||
|
Total operating expenses
|
$
|
14,298
|
(48
|
)%
|
$
|
27,380
|
||||||
Research and development. Research and development expense consists primarily of compensation costs, third-party consulting expenses and related overhead costs for research and development personnel. Research and development costs are expensed as they are incurred. The decrease of $2.5 million in research and development expense for the year ended December 31, 2017 compared to 2016 resulted primarily from a decrease in salary and employee related expenses including employee benefit due to cost reduction efforts mainly related to the development of Support.com Cloud applications which also impacted travel, consulting and related stock compensation charges.
Sales and marketing. Sales and marketing expense consists primarily of compensation costs of business development, program management and marketing personnel, as well as expenses for lead generation and promotional activities, including public relations, advertising and marketing. The decrease of $4.2 million in sales and marketing expense for the year ended December 31, 2017 compared to 2016 resulted primarily from decreased salary and employee related expenses, including employee benefit and stock-based compensation, from reduced headcount in connection with cost reduction efforts.
General and administrative. General and administrative expense consists primarily of compensation costs and related overhead costs for administrative personnel and professional fees for legal, accounting and other professional services. The decrease of $4.3 million in general and administrative expense for the year ended December 31, 2017 compared to 2016 was attributable to lower salary and employee related expenses including employee benefit and stock-based compensation from reduced headcount in connection with cost reduction efforts, lower professional services and reimbursement of stockholder expenses as a result of the proxy contest that were incurred in the prior year, and lower consulting fees as the Company was no longer required to obtain a 404(b) audit.
Amortization of intangible assets and other. The decrease in amortization of intangibles assets and other of $1.0 million for the year ended December 31, 2017 compared to 2016 was primarily attributable to the Company’s intangible assets being fully amortized at the end of 2016 and early 2017.
Restructuring. During the third quarter of 2017, the Company incurred restructuring charges of approximately $0.1 million associated with the down-sizing of its Bangalore, India facilities. These cost reductions were primarily headcount related and, to a lesser degree, attributable to property, plant and equipment.
During the second quarter and fourth quarter of 2016, the Company implemented cost reduction plans. In connection with implementing the plans, we incurred one-time restructuring costs of $423,000 in the second quarter and $723,000 in the fourth quarter of 2016. The restructuring costs consisted of severance costs for terminated employees and contract termination costs. All except for $0.1 million of costs associated with the plans were paid during 2016.
Interest income and other, net
|
($ in thousands)
|
2017
|
% Change
2016 to 2017
|
2016
|
|||||||||
|
Interest income and other, net
|
$
|
643
|
24
|
%
|
$
|
518
|
||||||
Interest income and other, net. Interest income and other, net consists primarily of interest income on our cash, cash equivalents and short-term investments. The increase in interest income and other, net of $0.1 million for the year ended December 31, 2017 compared to 2016 was primarily due to increased interest on our investments.
Income tax provision (benefit)
|
($ in thousands)
|
2017
|
% Change
2016 to 2017
|
2016
|
|||||||||
|
Income tax provision (benefit)
|
$
|
604
|
97
|
%
|
$
|
307
|
||||||
Income tax provision (benefit). The income tax provision (benefit) is comprised of estimates of current taxes due in domestic and foreign jurisdictions and changes in deferred tax balances. For the year ended December 31, 2017, the income tax provision primarily consisted of federal income tax, state income tax and foreign taxes. For the year ended December 31, 2017, the income tax provision consisted of a $670 provision for foreign taxes, $13 provision for state income tax and a ($78) provision / (benefit) for federal income tax. For the year ended December 31, 2016, the income tax provision primarily consisted of state income tax and foreign taxes. For the year ended December 31, 2016, the income tax provision consisted of a $304,000 provision for foreign taxes and a $3,000 provision for state income tax.
Liquidity and Capital Resources
Total cash, cash equivalents and short-term investments at December 31, 2017 and 2016 was $49.2 million and $53.4 million, respectively. Cash equivalents and short-term investments are comprised of money market funds, certificates of deposit, corporate notes and bonds, and U.S. government agency securities. The decrease in cash, cash equivalents and short-term investments in fiscal year 2017 was primarily due to cash used by operating activities.
Operating Activities
Net cash used in operating activities was ($4.2) million for the year ended December 31, 2017, and ($11.5) million for the year ended December 31, 2016. Net cash used in operating activities primarily reflects the loss for the period, adjusted for non-cash items such as stock-based compensation expense, amortization of intangible assets and other, amortization of premiums and discounts on investments, depreciation, and changes in operating assets and liabilities.
Net cash used in operating activities during 2017 was the result of a net loss for the period of ($1.5) million, adjusted for non-cash items totaling $2.7 million and changes in operating assets and liabilities of $4.4 million. Adjustments for non-cash items primarily consisted of stock-based compensation expense of $430,000, depreciation on fixed assets of $628,000 and deferred income taxes of $585,000. Changes in operating assets and liabilities primarily consisted of an increase in accounts receivable, net, of $2.4 million due to increased revenue as well as timing of collections with a larger amount of accounts receivable shifting to customers with slightly longer payment terms, a $846,000 decrease in deferred revenue due to a shift in our customer mix and the termination of the Professional Services Agreement with Office Depot, in 2017, a $581,000 decrease in accounts payable attributable in part to lower spending coupled with the timing of payments to vendors, and a $1.2 million decrease in other accrued liabilities also due to the implementation of cost reduction plan in the fourth quarter of 2016. These decreases were offset by a $417,000 increase in prepaid expenses, a $191,000 increase in accrued compensation due to the timing of payroll, and a $132,000 increase in other long-term assets.
Net cash used in operating activities during 2016 was the result of a net loss for the period of $16.0 million, adjusted for non-cash items totaling $4.2 million and changes in operating assets and liabilities of $346,000. Adjustments for non-cash items primarily consisted of stock-based compensation expense of $2.0 million, amortization of intangible assets and other of $1.0 million, and depreciation on fixed assets of $720,000. Changes in operating assets and liabilities primarily consisted of a decrease in accounts receivable, net, of $452,000 due to decreased revenues and increased collection efforts, an $818,000 increase in accounts payable, and a $579,000 increase in deferred revenue offset by decreases of $1.1 million in other accrued liabilities and $305,000 in accrued compensation due to the timing of payments and invoices received.
Investing Activities
Net cash provided by investing activities was $5.2 million for the year ended December 31, 2017 and $822,000 for the year ended December 31, 2016. Net cash provided/(used) by investing activities in 2017 was primarily due to purchases of investments of ($25.8) million and purchases of property and equipment of ($63,000) offset by sales and maturities of investments of $31.0 million. Net cash provided/(used) by investing activities in 2016 was primarily due to purchases of investments of ($28.6) million and purchases of property and equipment of ($561,000) offset by sales and maturities of investments of $30.0 million.
Financing Activities
Net cash provided by/(used in) financing activities was $25,000 for the year ended December 31, 2017 and ($42,000) for the year ended December 31, 2016. In 2017, cash provided by financing activities was primarily attributable to the $28,000 in proceeds from the issuance of common stock under employee stock purchase plans offset by a reduction of ($2,000) from the repurchase of common stock and ($1,000) from the cash settlement from our stock split. In 2016, cash used in financing activities was primarily attributable to the use of ($128,000) for the repurchase of common stock offset by proceeds from the issuance of common stock under employee stock plans of $86,000.
Working Capital and Capital Expenditure Requirements
At December 31, 2017, we had stockholders’ equity of $56.5 million and working capital of $55.0 million. We believe that our existing cash balances will be sufficient to meet our working capital requirements for at least the next 12 months.
If we require additional capital resources to grow our business internally or to acquire complementary technologies and businesses at any time in the future, we may seek to sell additional equity or debt securities. The sale of additional equity could result in more dilution to our stockholders.
Contractual Obligations
The following table summarizes our contractual obligations at December 31, 2017 and the effect these contractual obligations are expected to have on our liquidity and cash flows in future periods (in thousands):
|
Payments Due By Period
|
||||||||||||||||
|
Total
|
Less than
1 year
|
1 ‑ 3
Years
|
More
than 3
Years
|
|||||||||||||
|
Operating leases
|
$
|
116
|
$
|
86
|
$
|
30
|
$
|
—
|
||||||||
|
Uncertain tax positions, including interest and penalties
|
403
|
133
|
—
|
270
|
||||||||||||
|
$
|
519
|
$
|
219
|
$
|
30
|
$
|
270
|
|||||||||
These obligations are for non-cancelable operating leases including our headquarters office and offices to carry out research and development and operations globally.
Off-Balance Sheet Arrangements
At December 31, 2017, we did not have any significant off-balance sheet arrangements, as defined in Item 303(a) (4) (ii) of Regulation S-K.
Recent Accounting Pronouncements
See Note 1 – Organization and Summary of Significant Accounting Policies to the Consolidated Financial Statements included in Part II, Item 8 of this Annual Report on Form 10-K for a summary of new accounting standards.
Interest Rate and Market Risk
The value and liquidity of the securities in which we invest could deteriorate rapidly and the issuers of such securities could be subject to credit rating downgrades. We actively monitor market conditions and developments specific to the securities and security classes in which we invest. While we believe we take prudent measures to mitigate investment related risks, such risks cannot be fully eliminated, as there are circumstances outside of our control.
The primary objective of our investment activities is to preserve principal while at the same time maximizing the income we receive from our investments without significantly increasing risk. To achieve this objective, we invest our excess cash in a variety of securities, including U.S. government agency securities, corporate notes and bonds, commercial paper and money market funds. These securities are classified as available-for-sale. Consequently, our available-for-sale securities are recorded on the consolidated balance sheets at fair value with unrealized gains or losses reported as a separate component of accumulated other comprehensive loss within stockholder’s equity. Our holdings of the securities of any one issuer, except government agencies, do not exceed 10% of our portfolio. We do not utilize derivative financial instruments to manage our interest rate risks.
As of December 31, 2017, we held $31.2 million in short-term investments (excluding cash and cash equivalents), which consisted primarily of government debt securities, corporate notes and bonds, and commercial paper. The weighted average interest rate of our portfolio was approximately 1.33% at December 31, 2017. A decline in interest rates over time would reduce our interest income from our investments. We have limited exposure to market risks from instruments that may impact our balance sheets, statement of comprehensive loss, and statement of cash flows. Such exposure is primarily due to changing interest rates.
Impact of Foreign Currency Rate Changes
The functional currencies of our international operating subsidiaries are the local currencies. We translate the assets and liabilities of our foreign subsidiaries at the exchange rates in effect on the balance sheet date. We translate their income and expenses at the average rates of exchange in effect during the period. We include translation gains and losses in the stockholders’ equity section of our consolidated balance sheets. We include net gains and losses resulting from foreign exchange transactions in interest income and other in our consolidated statements of operations. Since we translate foreign currencies (primarily Canadian dollars and Indian rupees) into U.S. dollars for a small portion of our operations, currency fluctuations have had an immaterial impact on our consolidated statements of operations. We have both revenue and expenses that are denominated in foreign currencies. Neither a weaker or stronger U.S. dollar environment would have a material impact on our consolidated statement of operations. The historical impact of currency fluctuations on our consolidated statements of operations has generally been immaterial. As of December 31, 2017, we did not engage in foreign currency hedging activities.
SUPPORT.COM, INC.
INDEX TO CONSOLIDATED FINANCIAL STATEMENTS
|
Page
|
|
|
Report of EKS&H LLP, Independent Registered Public Accounting Firm
|
29
|
|
Report of BDO LLP, Independent Registered Public Accounting Firm
|
30
|
|
Consolidated Statements of Operations
|
32
|
|
Consolidated Statements of Comprehensive Loss
|
33
|
|
Consolidated Statements of Stockholders’ Equity
|
34
|
|
Consolidated Statements of Cash Flows
|
35
|
|
Notes to Consolidated Financial Statements
|
36
|
Board of Directors and Stockholders
Support.com, Inc.
Sunnyvale, California
OPINION ON THE FINANCIAL STATEMENTS
We have audited the accompanying consolidated balance sheet of Support.com, Inc. (the "Company") as of December 31, 2017, and the related consolidated statements of operations, comprehensive loss, stockholders' equity, and cash flows, for the year ended December 31, 2017, and the related notes (collectively referred to as the "financial statements"). In our opinion, the financial statements present fairly, in all material respects, the financial position of the Company as of December 31, 2017, and the results of their operations and their cash flows for the year ended December 31, 2017, in conformity with accounting principles generally accepted in the United States of America.
BASIS FOR OPINION
These financial statements are the responsibility of the Company's management. Our responsibility is to express an opinion on the Company's financial statements based on our audit. We are a public accounting firm registered with the Public Company Accounting Oversight Board (United States) ("PCAOB") and are required to be independent with respect to the Company in accordance with the U.S. federal securities laws and the applicable rules and regulations of the Securities and Exchange Commission and the PCAOB.
We conducted our audit in accordance with the standards of the PCAOB. Those standards require that we plan and perform the audit to obtain reasonable assurance about whether the financial statements are free of material misstatement, whether due to error or fraud. The Company is not required to have, nor were we engaged to perform, an audit of its internal control over financial reporting. As part of our audit we are required to obtain an understanding of internal control over financial reporting but not for the purpose of expressing an opinion on the effectiveness of the Company's internal control over financial reporting. Accordingly, we express no such opinion.
Our audit included performing procedures to assess the risks of material misstatement of the financial statements, whether due to error or fraud, and performing procedures that respond to those risks. Such procedures included examining, on a test basis, evidence regarding the amounts and disclosures in the financial statements. Our audit also included evaluating the accounting principles used and significant estimates made by management, as well as evaluating the overall presentation of the financial statements. We believe that our audit provides a reasonable basis for our opinion.
/s/ EKS&H LLLP
San Francisco, California
March 22, 2018
We have served as the Company's auditor since 2017.
REPORT OF BDO USA, LLP, INDEPENDENT REGISTERED PUBLIC ACCOUNTING FIRM
Board of Directors and Stockholders
Support.com, Inc.
Redwood City, California
We have audited the accompanying consolidated balance sheet of Support.com, Inc. as of December 31, 2016 and the related consolidated statements of operations, comprehensive loss, stockholders’ equity, and cash flows for the year ended December 31, 2016. These financial statements are the responsibility of the Company’s management. Our responsibility is to express an opinion on these financial statements based on our audit.
We conducted our audit in accordance with the standards of the Public Company Accounting Oversight Board (United States). Those standards require that we plan and perform the audit to obtain reasonable assurance about whether the financial statements are free of material misstatement. The Company is not required to have, nor were we engaged to perform, an audit of its internal control over financial reporting. Our audit included consideration of internal control over financial reporting as a basis for designing audit procedures that are appropriate in the circumstances, but not for the purpose of expressing an opinion on the effectiveness of the Company’s internal control over financial reporting. Accordingly, we express no such opinion. An audit also includes examining, on a test basis, evidence supporting the amounts and disclosures in the financial statements, assessing the accounting principles used and significant estimates made by management, as well as evaluating the overall financial statement presentation. We believe that our audit provides a reasonable basis for our opinion.
In our opinion, the consolidated financial statements referred to above present fairly, in all material respects, the financial position of Support.com, Inc. at December 31, 2016, and the results of its operations and its cash flows for the year ended December 31, 2016, in conformity with accounting principles generally accepted in the United States of America.
/s/ BDO USA, LLP
San Jose, California
March 6, 2017
SUPPORT.COM, INC.
CONSOLIDATED BALANCE SHEETS
(in thousands except share and per share data)
|
December 31,
|
||||||||
|
2017
|
2016
|
|||||||
|
ASSETS
|
||||||||
|
Current assets:
|
||||||||
|
Cash and cash equivalents
|
$
|
18,050
|
$
|
16,890
|
||||
|
Short-term investments
|
31,183
|
36,519
|
||||||
|
Accounts receivable, less allowance of $9 and $19 at December 31, 2017 and 2016, respectively
|
11,951
|
9,567
|
||||||
|
Prepaid expenses and other current assets
|
802
|
1,211
|
||||||
|
Total current assets
|
61,986
|
64,187
|
||||||
|
Property and equipment, net
|
1,133
|
1,706
|
||||||
|
Intangible assets, net
|
250
|
266
|
||||||
|
Other assets
|
984
|
1,070
|
||||||
|
Total assets
|
$
|
64,353
|
$
|
67,229
|
||||
|
LIABILITIES AND STOCKHOLDERS’ EQUITY
|
||||||||
|
Current liabilities:
|
||||||||
|
Accounts payable
|
$
|
504
|
$
|
1,085
|
||||
|
Accrued compensation
|
3,157
|
2,974
|
||||||
|
Other accrued liabilities
|
1,330
|
2,496
|
||||||
|
Short-term deferred revenue
|
2,006
|
2,759
|
||||||
|
Total current liabilities
|
6,997
|
9,314
|
||||||
|
Long-term deferred revenue
|
13
|
106
|
||||||
|
Other long-term liabilities
|
885
|
501
|
||||||
|
Total liabilities
|
7,895
|
9,921
|
||||||
|
Commitments and contingencies (Note 5)
|
||||||||
|
Stockholders’ equity:
|
||||||||
|
Common stock; par value $0.0001, 50,000,000 shares authorized; 19,211,826 issued and 18,728,912 outstanding at December 31, 2017; 19,030,024 issued and 18,548,180 outstanding at December 31, 2016
|
2
|
2
|
||||||
|
Additional paid-in capital
|
267,857
|
267,400
|
||||||
|
Treasury stock, at cost (482,914 shares at December 31, 2017 and 481,844 shares at December 31, 2016)
|
(5,297
|
)
|
(5,295
|
)
|
||||
|
Accumulated other comprehensive loss
|
(2,108
|
)
|
(2,329
|
)
|
||||
|
Accumulated deficit
|
(203,996
|
)
|
(202,470
|
)
|
||||
|
Total stockholders’ equity
|
56,458
|
57,308
|
||||||
|
Total liabilities and stockholders’ equity
|
$
|
64,353
|
$
|
67,229
|
||||
See accompanying notes.
SUPPORT.COM, INC.
CONSOLIDATED STATEMENTS OF OPERATIONS
(in thousands except per share data)
|
Year Ended December 31,
|
||||||||
|
2017
|
2016
|
|||||||
|
Revenue:
|
||||||||
|
Services
|
$
|
54,670
|
$
|
56,311
|
||||
|
Software and other
|
5,451
|
5,349
|
||||||
|
Total revenue
|
60,121
|
61,660
|
||||||
|
Costs of revenue:
|
||||||||
|
Cost of services
|
47,101
|
50,245
|
||||||
|
Cost of software and other
|
287
|
486
|
||||||
|
Total cost of revenue
|
47,388
|
50,731
|
||||||
|
Gross profit
|
12,733
|
10,929
|
||||||
|
Operating expenses:
|
||||||||
|
Research and development
|
3,033
|
5,577
|
||||||
|
Sales and marketing
|
2,425
|
6,671
|
||||||
|
General and administrative
|
8,696
|
12,958
|
||||||
|
Amortization of intangible assets and other
|
16
|
1,028
|
||||||
|
Goodwill impairment
|
—
|
—
|
||||||
|
Restructuring
|
128
|
1,146
|
||||||
|
Total operating expenses
|
14,298
|
27,380
|
||||||
|
Loss from operations
|
(1,565
|
)
|
(16,451
|
)
|
||||
|
Interest income and other, net
|
643
|
518
|
||||||
|
Loss from continuing operations, before income taxes
|
(922
|
)
|
(15,933
|
)
|
||||
|
Income tax provision
|
604
|
307
|
||||||
|
Loss from continuing operations, after income taxes
|
(1,526
|
)
|
(16,240
|
)
|
||||
|
Income from discontinued operations, after income taxes
|
—
|
284
|
||||||
|
Net loss
|
$
|
(1,526
|
)
|
$
|
(15,956
|
)
|
||
|
Basic earnings (loss) per share:
|
||||||||
|
Continuing operations, after income taxes
|
$
|
(0.08
|
)
|
$
|
(0.88
|
)
|
||
|
Discontinued operations, after income taxes
|
0.00
|
0.01
|
||||||
|
Basic net loss per share
|
$
|
(0.08
|
)
|
$
|
(0.87
|
)
|
||
|
Diluted earnings (loss) per share:
|
||||||||
|
Continuing operations, after income taxes
|
$
|
(0.08
|
)
|
$
|
(0.88
|
)
|
||
|
Discontinued operations, after income taxes
|
0.00
|
0.01
|
||||||
|
Diluted net loss per share
|
$
|
(0.08
|
)
|
$
|
(0.87
|
)
|
||
|
Shares used in computing basic net loss per share
|
18,644
|
18,409
|
||||||
|
Shares used in computing diluted net loss per share
|
18,644
|
18,409
|
||||||
See accompanying notes.
SUPPORT.COM, INC.
CONSOLIDATED STATEMENTS OF COMPREHENSIVE LOSS
(in thousands)
|
Year Ended December 31,
|
||||||||
|
2017
|
2016
|
|||||||
|
Net loss
|
$
|
(1,526
|
)
|
$
|
(15,956
|
)
|
||
|
Other comprehensive loss:
|
||||||||
|
Change in foreign currency translation adjustment
|
264
|
(77
|
)
|
|||||
|
Change in net unrealized gain (loss) on investments
|
(43
|
)
|
50
|
|||||
|
Other comprehensive gain (loss)
|
221
|
(27
|
)
|
|||||
|
Comprehensive loss
|
$
|
(1,305
|
)
|
$
|
(15,983
|
)
|
||
See accompanying notes.
SUPPORT.COM, INC.
CONSOLIDATED STATEMENTS OF STOCKHOLDERS’ EQUITY
(in thousands, except share data)
|
Common Stock
|
||||||||||||||||||||||||||||
|
Shares(1)
|
Amount(1)
|
Additional
Paid-In
Capital(1)
|
Treasury
Stock
|
Accumulated
Other
Comprehensive
Loss
|
Accumulated
Deficit
|
Total
Stockholders’
Shares(1)
|
||||||||||||||||||||||
|
Balances at December 31, 2015
|
18,286,961
|
$
|
2
|
$
|
265,327
|
$
|
(5,167
|
)
|
$
|
(2,302
|
)
|
$
|
(186,514
|
)
|
$
|
71,346
|
||||||||||||
|
Net loss
|
—
|
—
|
—
|
—
|
—
|
(15,956
|
)
|
(15,956
|
)
|
|||||||||||||||||||
|
Other comprehensive loss
|
—
|
—
|
—
|
—
|
(27
|
)
|
—
|
(27
|
)
|
|||||||||||||||||||
|
Stock-based compensation expense
|
—
|
—
|
1,987
|
—
|
—
|
—
|
1,987
|
|||||||||||||||||||||
|
Issuance of common stock upon exercise of stock options for cash and releases of RSUs
|
270,317
|
—
|
1
|
—
|
—
|
—
|
1
|
|||||||||||||||||||||
|
Issuance of common stock under employee stock purchase plan
|
42,268
|
—
|
85
|
—
|
—
|
—
|
85
|
|||||||||||||||||||||
|
Repurchase of common stock
|
(51,366
|
)
|
—
|
—
|
(128
|
)
|
—
|
—
|
(128
|
)
|
||||||||||||||||||
|
Balances at December 31, 2016
|
18,548,180
|
$
|
2
|
$
|
267,400
|
$
|
(5,295
|
)
|
$
|
(2,329
|
)
|
$
|
(202,470
|
)
|
$
|
57,308
|
||||||||||||
|
Net loss
|
—
|
—
|
—
|
—
|
—
|
(1,526
|
)
|
(1,526
|
)
|
|||||||||||||||||||
|
Partial shares in reverse split
|
(40
|
)
|
(1
|
)
|
(1
|
)
|
||||||||||||||||||||||
|
Other comprehensive income
|
—
|
—
|
—
|
—
|
221
|
—
|
221
|
|||||||||||||||||||||
|
Stock-based compensation expense
|
—
|
—
|
430
|
—
|
—
|
—
|
430
|
|||||||||||||||||||||
|
Issuance of common stock upon exercise of stock options for cash and releases of RSUs
|
153,824
|
—
|
—
|
—
|
—
|
—
|
||||||||||||||||||||||
|
Issuance of common stock under employee stock purchase plan
|
28,018
|
—
|
28
|
—
|
—
|
—
|
28
|
|||||||||||||||||||||
|
Repurchase of common stock
|
(1,070
|
)
|
—
|
—
|
(2
|
)
|
—
|
—
|
(2
|
)
|
||||||||||||||||||
|
Balances at December 31, 2017
|
18,728,912
|
$
|
2
|
$
|
267,857
|
$
|
(5,297
|
)
|
$
|
(2,108
|
)
|
$
|
(203,996
|
)
|
$
|
56,458
|
||||||||||||
| (1) |
Prior periods adjusted to reflect the impact of the one-for-three reverse stock split that became effective on January 20, 2017, as discussed in Note 1.
|
SUPPORT.COM, INC.
CONSOLIDATED STATEMENTS OF CASH FLOWS
(in thousands)
|
Year Ended December 31,
|
||||||||
|
2017
|
2016
|
|||||||
|
Operating activities:
|
||||||||
|
Net loss
|
$
|
(1,526
|
)
|
$
|
(15,956
|
)
|
||
|
Adjustments to reconcile net loss to net cash provided by (used in) operating activities:
|
||||||||
|
Stock-based compensation expense
|
430
|
1,987
|
||||||
|
Amortization of intangible assets and other
|
16
|
1,028
|
||||||
|
Amortization of premiums and discounts on investments
|
65
|
284
|
||||||
|
Depreciation
|
628
|
720
|
||||||
|
Deferred income taxes
|
585
|
17
|
||||||
|
Loss on disposal of fixed assets
|
8
|
124
|
||||||
|
Changes in operating assets and liabilities:
|
||||||||
|
Accounts receivable, net
|
(2,384
|
)
|
452
|
|||||
|
Prepaid expenses and other current assets
|
417
|
264
|
||||||
|
Other assets
|
132
|
(83
|
)
|
|||||
|
Accounts payable
|
(581
|
)
|
818
|
|||||
|
Accrued compensation
|
191
|
(305
|
)
|
|||||
|
Other accrued liabilities
|
(1,159
|
)
|
(1,126
|
)
|
||||
|
Other long-term liabilities
|
(179
|
)
|
(253
|
)
|
||||
|
Deferred revenue
|
(846
|
)
|
579
|
|||||
|
Net cash used in operating activities
|
(4,203
|
)
|
(11,450
|
)
|
||||
|
Investing activities:
|
||||||||
|
Purchases of property and equipment
|
(63
|
)
|
(561
|
)
|
||||
|
Purchases of investments
|
(25,795
|
)
|
(28,610
|
)
|
||||
|
Maturities of investments
|
31,023
|
29,993
|
||||||
|
Net cash provided by investing activities
|
5,165
|
822
|
||||||
|
Financing activities:
|
||||||||
|
Cash settlement in stock split
|
(1
|
)
|
—
|
|||||
|
Proceeds from issuance of common stock
|
28
|
86
|
||||||
|
Repurchase of common stock
|
(2
|
)
|
(128
|
)
|
||||
|
Net cash provided by (used in) financing activities
|
25
|
(42
|
)
|
|||||
|
Net increase (decrease) in cash and cash equivalents
|
987
|
(10,670
|
)
|
|||||
|
Effect of exchange rate changes on cash and cash equivalents
|
173
|
(38
|
)
|
|||||
|
Cash and cash equivalents at beginning of year
|
16,890
|
27,598
|
||||||
|
Cash and cash equivalents at end of year
|
$
|
18,050
|
$
|
16,890
|
||||
|
Supplemental schedule of cash flow information:
|
||||||||
|
Cash paid for income taxes
|
$
|
323
|
$
|
170
|
||||
See accompanying notes.
SUPPORT.COM, INC
NOTES TO CONSOLIDATED FINANCIAL STATEMENTS
Note 1. Organization and Summary of Significant Accounting Policies
Nature of Operations
Support.com, Inc. (“Support.com”, “the Company”, “We” or “Our”), was incorporated in the state of Delaware on December 3, 1997. Our common stock trades on the Nasdaq Capital Market under the symbol “SPRT.”
Support.com is a leading provider of tech support and turnkey support center services, producer of SUPERAntiSpyware® anti-malware products, and the maker of Support.com® software. Our technology support services programs help leading brands create new revenue streams and deepen customer relationships. We offer turnkey, outsourced support services for service providers, retailers and technology companies. Our technology support services programs are designed for both the consumer and small and medium business (“SMB”) markets, and include computer and mobile device set-up, security and support, virus and malware removal, wireless network set-up, and home security and automation system support. Our Support.com Cloud offering is a SaaS solution for companies to optimize support interactions with their customers using their own or third party support personnel. The solution enables companies to quickly resolve complex technology issues for their customers, boosting agent productivity and dramatically improving the customer experience.
Basis of Presentation
On January 20, 2017, the Company implemented a one-for-three reverse split of the Corporation’s issued and outstanding common stock. As of the effective date, every three shares of issued and outstanding common stock was combined into one newly issued share of common stock with no fractional shares being issued. Total cash payments made by the Company to stockholders in lieu of fractional shares were not material.
All references in these financial statements to number of common shares, earnings per share, and weighted average shares of common stock have been adjusted to reflect the Reverse Stock Split on a retroactive basis for all prior periods presented, unless otherwise noted, including reclassifying an amount equal to the reduction in par value of common stock to additional paid-in-capital.
The consolidated financial statements include the accounts of Support.com and its wholly-owned foreign subsidiaries. All intercompany transactions and balances have been eliminated.
Foreign Currency Translation
The functional currency of our foreign subsidiaries is generally the local currency. Assets and liabilities of our wholly owned foreign subsidiaries are translated from their respective functional currencies at exchange rates in effect at the balance sheet date, and revenues and expenses are translated at average exchange rates prevailing during the year. Any material resulting translation adjustments are reflected as a separate component of stockholders’ equity in accumulated other comprehensive income (loss). Realized foreign currency transaction gains (losses) were not material during the years ended December 31, 2017 and 2016.
Use of Estimates
The preparation of financial statements in conformity with accounting principles generally accepted in the United States requires management to make estimates and assumptions that affect the amounts reported in the consolidated financial statements and accompanying notes. The accounting estimates that require management’s most significant, difficult and subjective judgments include revenue recognition, assumptions used to estimate self-insurance accruals, the valuation of investments, the assessment of recoverability of intangible assets, the assessment of recoverability of goodwill and indefinite-lived intangible assets, the valuation of stock-based compensation expense and the recognition and measurement of current and deferred income tax assets and liabilities. Actual results could differ materially from these estimates.
Concentrations of Credit Risk
Financial instruments that potentially subject us to concentrations of credit risk consist principally of cash equivalents, investments and trade accounts receivable. Periodically throughout the year, the Company has maintained balances in various operating accounts in excess of federally insured limits. Our investment portfolio consists of investment grade securities. Except for obligations of the United States government and securities issued by agencies of the United States government, we diversify our investments by limiting our holdings with any individual issuer. We are exposed to credit risks in the event of default by the issuers to the extent of the amount recorded on the balance sheet. The credit risk in our trade accounts receivable is substantially mitigated by our evaluation of the customers’ financial conditions at the time we enter into business and reasonably short payment terms.
Trade Accounts Receivable and Allowance for Doubtful Accounts
Trade accounts receivable are recorded at the invoiced amount. We perform evaluations of our customers’ financial condition and generally do not require collateral. We make judgments as to our ability to collect outstanding receivables and provide allowances for a portion of receivables when collection becomes doubtful. Our allowances are made based on a specific review of all significant outstanding invoices. For those invoices not specifically provided for, allowances are recorded at differing rates, based on the age of the receivable. In determining these rates, we analyze our historical collection experience and current payment trends. The determination of past-due accounts is based on contractual terms.
The following table summarizes the allowance for doubtful accounts as of December 31, 2017 and 2016 (in thousands):
|
Balance at
Beginning of
Period
|
Adjustments to
Costs and
Expenses
|
Write-
offs
|
Balance at
End of
Period
|
|||||||||||||
|
Allowance for doubtful accounts:
|
||||||||||||||||
|
Year ended December 31, 2016
|
$
|
6
|
$
|
37
|
$
|
(24
|
)
|
$
|
19
|
|||||||
|
Year ended December 31, 2017
|
$
|
19
|
$
|
34
|
$
|
(44
|
)
|
$
|
9
|
|||||||
As of December 31, 2017, Comcast and CoxCom accounted for approximately 71% and 12% of our total accounts receivable, respectively. As of December 31, 2016, Comcast accounted for approximately 70% of our total accounts receivable. No other customers accounted for 10% or more of our total accounts receivable as of December 31, 2017 and 2016.
Cash, Cash Equivalents and Investments
All liquid instruments with an original maturity at the date of purchase of 90 days or less are classified as cash equivalents. Cash equivalents and short-term investments consist primarily of money market funds, certificates of deposit, commercial paper, corporate and municipal bonds. Our interest income on cash, cash equivalents and investments is recorded monthly and reported as interest income and other in our consolidated statements of operations.
Our cash equivalents and short-term investments are classified as available-for-sale, and are reported at fair value with unrealized gains/losses included in accumulated other comprehensive loss within stockholders’ equity on the consolidated balance sheets and in the consolidated statements of comprehensive loss. We view our available-for-sale portfolio as available for use in our current operations, and therefore we present our marketable securities as short-term assets.
We monitor our investments for impairment on a quarterly basis and determine whether a decline in fair value is other-than-temporary by considering factors such as current economic and market conditions, the credit rating of the security’s issuer, the length of time an investment’s fair value has been below our carrying value, the Company’s intent to sell the security and the Company’s belief that it will not be required to sell the security before the recovery of its amortized cost. If an investment’s decline in fair value is deemed to be other-than-temporary, we reduce its carrying value to its estimated fair value, as determined based on quoted market prices or liquidation values. Declines in value judged to be other-than-temporary, if any, are recorded in operations as incurred. At December 31, 2017, the Company evaluated its unrealized losses on available-for-sale securities and determined them to be temporary. We currently do not intend to sell securities with unrealized losses and we concluded that we will not be required to sell these securities before the recovery of their amortized cost basis.
At December 31, 2017 and 2016, the estimated fair value of cash, cash equivalents and investments was $49.2 million and $53.4 million, respectively. The following is a summary of cash, cash equivalents and investments at December 31, 2017 and 2016 (in thousands):
|
For the Year Ended December 31, 2017
|
||||||||||||||||
|
Amortized
Cost
|
Gross
Unrealized
Gains
|
Gross
Unrealized
Losses
|
Fair Value
|
|||||||||||||
|
Cash
|
$
|
7,408
|
$
|
—
|
$
|
—
|
$
|
7,408
|
||||||||
|
Money market fund
|
10,643
|
$
|
—
|
(1
|
)
|
10,642
|
||||||||||
|
Certificates of deposit
|
1,207
|
—
|
(2
|
)
|
1,205
|
|||||||||||
|
Commercial paper
|
2,494
|
—
|
(1
|
)
|
2,493
|
|||||||||||
|
Corporate notes and bonds
|
22,846
|
—
|
(76
|
)
|
22,770
|
|||||||||||
|
U.S. government agency securities
|
4,719
|
—
|
(4
|
)
|
4,715
|
|||||||||||
|
$
|
49,317
|
$
|
—
|
$
|
(84
|
)
|
$
|
49,233
|
||||||||
|
Classified as:
|
||||||||||||||||
|
Cash and cash equivalents
|
$
|
18,051
|
$
|
—
|
$
|
(1
|
)
|
$
|
18,050
|
|||||||
|
Short-term investments
|
31,266
|
—
|
(83
|
)
|
31,183
|
|||||||||||
|
$
|
49,317
|
$
|
—
|
$
|
(84
|
)
|
$
|
49,233
|
||||||||
|
For the Year Ended December 31, 2016
|
||||||||||||||||
|
Amortized
Cost
|
Gross
Unrealized
Gains
|
Gross
Unrealized
Losses
|
Fair Value
|
|||||||||||||
|
Cash
|
$
|
7,593
|
$
|
—
|
$
|
—
|
$
|
7,593
|
||||||||
|
Money market fund
|
9,297
|
—
|
—
|
9,297
|
||||||||||||
|
Certificates of deposit
|
1,273
|
—
|
—
|
1,273
|
||||||||||||
|
Commercial paper
|
4,989
|
—
|
—
|
4,989
|
||||||||||||
|
Corporate notes and bonds
|
19,357
|
—
|
(40
|
)
|
19,317
|
|||||||||||
|
U.S. government agency securities
|
10,941
|
1
|
(2
|
)
|
10,940
|
|||||||||||
|
$
|
53,450
|
$
|
1
|
$
|
(42
|
)
|
$
|
53,409
|
||||||||
|
Classified as:
|
||||||||||||||||
|
Cash and cash equivalents
|
$
|
16,890
|
$
|
—
|
$
|
—
|
$
|
16,890
|
||||||||
|
Short-term investments
|
36,560
|
1
|
(42
|
)
|
36,519
|
|||||||||||
|
$
|
53,450
|
$
|
1
|
$
|
(42
|
)
|
$
|
53,409
|
||||||||
The following table summarizes the estimated fair value of our available-for-sale securities classified by the stated maturity date of the security (in thousands):
|
December 31,
|
||||||||
|
2017
|
2016
|
|||||||
|
Due within one year
|
$
|
22,228
|
$
|
27,730
|
||||
|
Due within two years
|
8,955
|
8,789
|
||||||
|
$
|
31,183
|
$
|
36,519
|
|||||
We determined that the gross unrealized losses on our available-for-sale investments as of December 31, 2017 are temporary in nature. The fair value of our available-for-sale securities at December 31, 2017 and 2016 reflects a net unrealized loss of $84,000 and $41,000, respectively. There were no net realized gains (losses) on available-for-sale securities in the years ended December 31, 2017 and 2016. The cost of securities sold is based on the specific identification method.
The following table sets forth the unrealized losses for the Company’s available-for-sale investments as of December 31, 2017 and 2016 (in thousands):
|
As of December 31, 2017
|
In Loss Position
Less Than 12 Months
|
In Loss Position
More Than 12 Months
|
Total In Loss Position
|
|||||||||||||||||||||
|
Description
|
Fair Value
|
Unrealized Losses
|
Fair Value
|
Unrealized Losses
|
Fair Value
|
Unrealized Losses
|
||||||||||||||||||
|
Certificates of deposit
|
$
|
718
|
$
|
(2
|
)
|
$
|
—
|
$
|
—
|
$
|
718
|
$
|
(2
|
)
|
||||||||||
|
Corporate notes and bonds
|
16,530
|
(32
|
)
|
6,947
|
(47
|
)
|
23,477
|
(79
|
)
|
|||||||||||||||
|
U.S. government agency securities
|
3,720
|
(3
|
)
|
998
|
—
|
4,718
|
(3
|
)
|
||||||||||||||||
|
Total
|
$
|
20,968
|
$
|
(37
|
)
|
$
|
7,945
|
$
|
(47
|
)
|
$
|
28,913
|
$
|
(84
|
)
|
|||||||||
|
As of December 31, 2016
|
In Loss Position
Less Than 12 Months
|
In Loss Position
More Than 12 Months
|
Total In Loss Position
|
|||||||||||||||||||||
|
Description
|
Fair Value
|
Unrealized Losses
|
Fair Value
|
Unrealized Losses
|
Fair Value
|
Unrealized Losses
|
||||||||||||||||||
|
Certificates of deposit
|
$
|
480
|
$
|
—
|
$
|
—
|
$
|
—
|
$
|
480
|
$
|
—
|
||||||||||||
|
Corporate notes and bonds
|
12,450
|
(15
|
)
|
5,767
|
(25
|
)
|
18,217
|
(40
|
)
|
|||||||||||||||
|
U.S. government agency securities
|
3,422
|
(1
|
)
|
998
|
—
|
4,420
|
(1
|
)
|
||||||||||||||||
|
Total
|
$
|
16,352
|
$
|
(16
|
)
|
$
|
6,765
|
$
|
(25
|
)
|
$
|
23,117
|
$
|
(41
|
)
|
|||||||||
Property and Equipment
Property and equipment are stated at cost, less accumulated depreciation and amortization which is determined using the straight-line method over the estimated useful lives of two to five years for computer equipment and software, three years for furniture and fixtures, and the shorter of the estimated useful lives or the lease term for leasehold improvements. Repairs and maintenance costs are expensed as they are incurred.
Long-Lived Assets
We record purchased identifiable intangible assets at fair value as part of a business combination. Useful life is estimated as the period over which the identifiable intangible assets are expected to contribute directly or indirectly to the future cash flows of the Company. As we do not believe that we can reliably determine a pattern by which the economic benefits of these identifiable intangible assets will be consumed, management adopted straight-line amortization. The original cost is amortized on a straight-line basis over the estimated useful life of each identifiable intangible asset.
The Company assesses its long-lived assets, which includes property and equipment and identifiable intangible assets, for impairment whenever events or changes in circumstances indicate that the carrying amount of an asset may not be recoverable. An impairment loss would be recognized when the sum of the future net cash flows expected to result from the use of the asset and its eventual disposition is less than its carrying amount. If our estimates regarding future cash flows derived from such assets were to change, we may record an impairment charge to the value of these assets. Such impairment loss would be measured as the difference between the carrying amount of the asset and its fair value.
Revenue Recognition
For all transactions, we recognize revenue only when all of the following criteria are met:
| ● |
Persuasive evidence of an arrangement exists;
|
| ● |
Delivery has occurred;
|
| ● |
Collection is considered probable; and
|
| ● |
The fees are fixed or determinable.
|
We consider all arrangements with payment terms longer than 90 days not to be fixed or determinable. If the fee is considered not to be fixed or determinable, revenue is recognized as payment becomes due from the customer provided all other revenue recognition criteria have been met.
Services Revenue
Services revenue is comprised primarily of fees for technology support services. Our service programs are designed for both the consumer and SMB markets, and include computer and mobile device set-up, security and support, virus and malware removal and wireless network set-up, and automation system onboarding and support.
We offer technology services to consumers and SMBs, primarily through our partners (which include communications providers, retailers, technology companies and others) and to a lesser degree directly through our website at www.support.com. We transact with customers via reseller programs, referral programs and direct transactions. In reseller programs, the partner generally executes the financial transactions with the customer and pays a fee to us which we recognize as revenue when the service is delivered. In referral programs, we transact with the customer directly and pay a referral fee to the referring party. Referral fees are generally expensed in the period in which revenues are recognized. In such referral programs, since we are the primary obligor and bear substantially all risks associated with the transaction, we record the gross amount of revenue. In direct transactions, we sell directly to the customer at the retail price.
The technology services described above include four types of offerings:
| ● |
Hourly-Based Services - In connection with the provisions of certain services programs, fees are calculated based on contracted hourly rates with partners. For these programs, we recognize revenue as services are performed, based on billable hours of work delivered by our technology specialists. These services programs also include performance standards, which may result in incentives or penalties, which are recognized as earned or incurred.
|
| ● |
Subscriptions - Customers purchase subscriptions or “service plans” under which certain services are provided over a fixed subscription period. Revenues for subscriptions are recognized ratably over the respective subscription periods.
|
| ● |
Incident-Based Services - Customers purchase a discrete, one-time service. Revenue recognition occurs at the time of service delivery. Fees paid for services sold but not yet delivered are recorded as deferred revenue and recognized at the time of service delivery.
|
In certain cases, we are paid for services that are sold but not yet delivered. We initially record such balances as deferred revenue, and recognize revenue when the service has been provided or, on the non-subscription portion of these balances, when the likelihood of the service being redeemed by the customer is remote (“services breakage”). Based on our historical redemption patterns for these relationships, we believe that the likelihood of a service being delivered more than 90 days after sale is remote. We therefore recognize non-subscription deferred revenue balances older than 90 days as services revenue. For the years ended December 31, 2017and 2016, services breakage revenue accounted for less than 1% of total services revenue.
Partners are generally invoiced monthly. Fees from customers via referral programs and direct transactions are generally paid with a credit card at the time of sale. Revenue is recognized net of any applicable sales tax.
We generally provide a refund period on services, during which refunds may be granted to customers under certain circumstances, including inability to resolve certain support issues. For our partnerships, the refund period varies by partner, but is generally between 5 and 14 days. For referral programs and direct transactions, the refund period is generally 5 days. For all channels, we recognize revenue net of refunds and cancellations during the period. Refunds and cancellations have not been material.
Services revenue also includes fees from licensing of our Support.com cloud-based software. In such arrangements, customers receive a right to use our Support.com Cloud in their own technology support organizations. We license our cloud-based software using a SaaS model under which customers cannot take possession of the technology and pay us on a per-user basis during the term of the arrangement. In addition, services revenue includes fees from implementation services of our cloud-based software. Currently, revenues from implementation services are recognized ratably over the customer life which is estimated as the term of the arrangement once the Support.com Cloud services are made available to customers. We generally charge for these services on a time and material basis.
Software and Other Revenue
Software and other revenue is comprised primarily of fees for end-user software products provided through direct customer downloads and through the sale of these end-user software products via partners. Our software is sold to customers as a perpetual license or as a fixed period subscription. We act as the primary obligor and generally control fulfillment, pricing, product requirements, and collection risk and therefore we record the gross amount of revenue. We provide a 30-day money back guarantee for the majority of our end-user software products.
For certain end-user software products, we sell perpetual licenses. We provide a limited amount of free technical support to customers. Since the cost of providing this free technical support is insignificant and free product enhancements are minimal and infrequent, we do not defer the recognition of revenue associated with sales of these products.
For certain of our end-user software products (principally SUPERAntiSpyware), we sell licenses for a fixed subscription period. We provide regular, significant updates over the subscription period and therefore recognize revenue for these products ratably over the subscription period.
Other revenue consists primarily of revenue generated through partners advertising to our customer base in various forms, including toolbar advertising, email marketing, and free trial offers. We recognize other revenue in the period in which our partners notify us that the revenue has been earned.
Research and Development
Research and development expenditures are charged to operations as they are incurred.
Software Development Costs
Based on our product development process, technological feasibility is established on the completion of a working model. The Company determined that technological feasibility is reached shortly before the product is ready for general release and therefore development costs incurred have been insignificant. Accordingly, we have charged all such costs to research and development expense in the period in which they were incurred.
Purchased Technology for Internal Use
We capitalize costs related to software that we license and incorporate into our product and service offerings or develop for internal use.
Advertising Costs
Advertising costs are recorded as sales and marketing expense in the period in which they are incurred. Advertising expense was $0.1 million and $0.8 million for the years ended December 31, 2017 and 2016, respectively.
Earnings (Loss) Per Share
Basic earnings (loss) per share is computed using our net income (loss) and the weighted average number of common shares outstanding during the reporting period. Diluted earnings (loss) per share is computed using our net income (loss) and the weighted average number of common shares outstanding, including the effect of the potential issuance of common stock such as stock issuable pursuant to the exercise of stock options and vesting of restricted stock units (“RSUs”) using the treasury stock method when dilutive. We excluded outstanding weighted average stock options of 1.9 million and 1.4 million for the years ended December 31, 2017 and 2016, respectively, from the calculation of diluted earnings per common share because the exercise prices of these stock options were greater than or equal to the average market value of the common stock. These stock options could be included in the calculation in the future if the average market value of the common stock increases and is greater than the exercise price of these stock options. Since we reported a net loss for the years ended December 31, 2017 and 2016, 28,000 and 23,000 outstanding options and RSUs were also excluded from the computation of diluted loss per share since their effect would have been anti-dilutive.
The following table sets forth the computation of basic and diluted net earnings (loss) per share (in thousands, except per share amounts):
|
Year Ended December 31,
|
||||||||
|
2017
|
2016
|
|||||||
|
Net loss
|
(1,526
|
)
|
(15,956
|
)
|
||||
|
Basic:
|
||||||||
|
Weighted-average shares of common stock outstanding
|
18,644
|
18,409
|
||||||
|
Shares used in computing basic net loss per share
|
18,644
|
18,409
|
||||||
|
Basic net loss per share
|
$
|
(0.08
|
)
|
$
|
(0.87
|
)
|
||
|
Diluted:
|
||||||||
|
Weighted-average shares of common stock outstanding
|
18,644
|
18,409
|
||||||
|
Add: Common equivalent shares outstanding
|
—
|
—
|
||||||
|
Shares used in computing diluted net loss per share
|
18,644
|
18,409
|
||||||
|
Diluted net loss per share
|
$
|
(0.08
|
)
|
$
|
(0.87
|
)
|
||
Accumulated Other Comprehensive Loss
The components of accumulated other comprehensive loss, which relate entirely to accumulated foreign currency translation losses associated with our foreign subsidiaries and unrealized losses on investments, consisted of the following (in thousands):
|
Foreign
Currency
Translation
Losses
|
Unrealized
Gains
(Losses) on
Investments
|
Total
|
||||||||||
|
Balance as of December 31, 2016
|
$
|
(2,288
|
)
|
$
|
(41
|
)
|
$
|
(2,329
|
)
|
|||
|
Current-period other comprehensive gain (loss)
|
264
|
(43
|
)
|
221
|
||||||||
|
Balance as of December 31, 2017
|
$
|
(2,024
|
)
|
$
|
(84
|
)
|
$
|
(2,108
|
)
|
|||
Realized gains/losses on investments reclassified from accumulated other comprehensive loss are reported as interest income and other, net in our consolidated statements of operations.
The amounts noted in the consolidated statements of comprehensive loss are shown before taking into account the related income tax impact. The income tax effect allocated to each component of other comprehensive income for each of the periods presented is not significant.
Stock-Based Compensation
We apply the provisions of ASC 718, Compensation - Stock Compensation, which requires the measurement and recognition of compensation expense for all stock-based payment awards, including grants of stock and options to purchase stock, made to employees and directors based on estimated fair values.
Determining Fair Value of Share-Based Payments
Valuation and Attribution Method: Stock-based compensation expense for service-based stock options and employee stock purchase plan (“ESPP”) is estimated at the date of grant based on the fair value of awards using the Black-Scholes-Merton option pricing model. Stock-based compensation expense for RSUs is estimated at the date of grant based on the number of shares granted and the quoted price of the Company’s common stock on the grant date. Stock options vest on a graded schedule; however, we recognize the expense over the requisite service period based on the straight-line method for service-based stock options and the accelerated method for market-based stock options, which is generally four years for stock options, three years or four years for RSUs and six months for ESPP, net of estimated forfeitures. These limitations require that on any date the compensation cost recognized is at least equal to the portion of the grant-date fair value of the award that is vested at that date. The Company estimates pre-vesting forfeitures at the time of grant by analyzing historical data and revises those estimates in subsequent periods if actual forfeitures differ from those estimates. The total expense recognized over the vesting period will only be for those awards that ultimately vest.
Risk-free Interest Rate: We base our risk-free interest rate on the yield currently available on U.S. Treasury zero coupon issues for the expected term of the stock options.
Expected Term: Our expected term represents the period that our stock options are expected to be outstanding and is determined based on historical experience of similar stock options considering the contractual terms of the stock options, vesting schedules and expectations of future employee behavior.
Expected Volatility: Our expected volatility represents the amount by which the stock price is expected to fluctuate throughout the period that the stock option is outstanding. The expected volatility is based on the historical volatility of the Company’s stock.
Expected Dividend: We use a dividend yield of zero, as we have never paid cash dividends and do not expect to pay dividends in the future.
The fair value of our stock-based awards was estimated using the following weighted average assumptions for the years ended December 31, 2017 and 2016:
|
Stock Option Plan
|
Employee Stock Purchase Plan
|
|||||||||||||||
|
2017
|
2016
|
2017
|
2016
|
|||||||||||||
|
Risk-free interest rate
|
1.71
|
%
|
0.9
|
%
|
0.5
|
%
|
0.5
|
%
|
||||||||
|
Expected term (in years)
|
3.0
|
3.9
|
0.5
|
0.5
|
||||||||||||
|
Volatility
|
41.2
|
%
|
48.3
|
%
|
39.0
|
%
|
46.7
|
%
|
||||||||
|
Expected dividend
|
0
|
%
|
0
|
%
|
0
|
%
|
0
|
%
|
||||||||
|
Weighted average grant-date fair value
|
$
|
0.68
|
$
|
0.32
|
$
|
0.39
|
$
|
0.24
|
||||||||
We recorded the following stock-based compensation expense for the fiscal years ended December 31, 2017 and 2016 (in thousands):
|
For the Year Ended December 31,
|
||||||||
|
2017
|
2016
|
|||||||
|
Stock-based compensation expense related to grants of:
|
||||||||
|
Stock options
|
$
|
144
|
$
|
387
|
||||
|
ESPP
|
21
|
40
|
||||||
|
RSU
|
265
|
1,560
|
||||||
|
$
|
430
|
$
|
1,987
|
|||||
|
Stock-based compensation expense recognized in:
|
||||||||
|
Cost of service
|
$
|
109
|
$
|
172
|
||||
|
Cost of software and others
|
4
|
5
|
||||||
|
Research and development
|
78
|
400
|
||||||
|
Sales and marketing
|
59
|
172
|
||||||
|
General and administrative
|
180
|
1,238
|
||||||
|
$
|
430
|
$
|
1,987
|
|||||
Cash provided by (used in) from the issuance of common stock, net of repurchase of common stock and cash settlement in stock split, was $25,000 and ($42,000) for the years ended December 31, 2017 and 2016, respectively.
Income Taxes
Income taxes are accounted for under the asset and liability method. Under this method, deferred tax assets and liabilities are recognized for the estimated future tax consequences attributable to differences between the financial statement carrying amounts of existing assets and liabilities and their respective tax bases, and operating losses and tax credit carryforwards. Deferred tax assets and liabilities are measured using enacted tax rates in effect for the year in which those temporary differences are expected to be reversed or settled. The effect on deferred tax assets and liabilities of a change in tax rates is recognized in the consolidated statements of operations in the period that includes the enactment date. A valuation allowance is recorded to reduce the carrying amounts of deferred tax assets, if it is more likely than not, that such assets will not be realized. On December 22, 2017, the Tax Cuts and Jobs Act was enacted. This law substantially amended the Internal Revenue Code, including reducing the U.S. corporate tax rates. Upon enactment, the Company’s deferred tax asset and related valuation allowance decreased by $22.7 million to $44.1 million. As the deferred tax asset is fully allowed for, this change in rates had no impact on the Company’s financial position or results of operations.
Warranties and Indemnifications
We generally provide a refund period on sales, during which refunds may be granted to consumers under certain circumstances, including our inability to resolve certain support issues. For our partnerships, the refund period varies by partner, but is generally between 5-14 days. For referral programs and direct transactions, the refund period is generally 5 days. For the majority of our end-user software products, we provide a 30-day money back guarantee. For all channels, we recognize revenue net of refunds and cancellations during the period. Refunds and cancellations have not been material to date.
We generally agree to indemnify our customers against legal claims that our end-user software products infringe certain third-party intellectual property rights. As of December 31, 2017, we were not required to make any payment resulting from infringement claims asserted against our customers and have not recorded any related accruals.
Fair Value Measurements
ASC 820, Fair Value Measurements and Disclosures, defines fair value, establishes a framework for measuring fair value under generally accepted accounting principles and enhances disclosures about fair value measurements. Fair value is defined under ASC 820 as the exchange price that would be received for an asset or paid to transfer a liability (an exit price) in the principal or most advantageous market for the asset or liability in an orderly transaction between market participants on the measurement date. Valuation techniques used to measure fair value ASC 820 must maximize the use of observable inputs and minimize the use of unobservable inputs. The standard describes a fair value hierarchy based on three levels of inputs, of which the first two are considered observable and the last unobservable, that may be used to measure fair value, which are the following:
| ● |
Level 1 - Quoted prices in active markets for identical assets or liabilities.
|
| ● |
Level 2 - Inputs other than Level 1 that are observable, either directly or indirectly, such as quoted prices for similar assets or liabilities; quoted prices in markets that are not active; or other inputs that are observable or can be corroborated by observable market data for substantially the full term of the assets or liabilities.
|
| ● |
Level 3 - Unobservable inputs that are supported by little or no market activity and that are significant to the fair value of the assets or liabilities.
|
The following table represents our fair value hierarchy for our financial assets (cash equivalents and investments) measured at fair value on a recurring basis as of December 31, 2017 and 2016 (in thousands):
|
As of December 31, 2017
|
Level 1
|
Level 2
|
Level 3
|
Total
|
||||||||||||
|
Money market funds
|
$
|
10,642
|
$
|
—
|
$
|
—
|
$
|
10,642
|
||||||||
|
Certificates of deposit
|
—
|
1,206
|
—
|
1,206
|
||||||||||||
|
Commercial paper
|
—
|
2,493
|
—
|
2,493
|
||||||||||||
|
Corporate notes and bonds
|
—
|
22,769
|
—
|
22,769
|
||||||||||||
|
U.S. government agency securities
|
—
|
4,715
|
—
|
4,715
|
||||||||||||
|
Total
|
$
|
10,642
|
$
|
31,183
|
$
|
—
|
$
|
41,825
|
||||||||
|
As of December 31, 2016
|
Level 1
|
Level 2
|
Level 3
|
Total
|
||||||||||||
|
Money market funds
|
$
|
9,297
|
$
|
—
|
$
|
—
|
$
|
9,297
|
||||||||
|
Certificates of deposit
|
—
|
1,273
|
—
|
1,273
|
||||||||||||
|
Commercial paper
|
—
|
4,989
|
—
|
4,989
|
||||||||||||
|
Corporate notes and bonds
|
—
|
19,317
|
—
|
19,317
|
||||||||||||
|
U.S. government agency securities
|
—
|
10,940
|
—
|
10,940
|
||||||||||||
|
Total
|
$
|
9,297
|
$
|
36,519
|
$
|
—
|
$
|
45,816
|
||||||||
For short-term investments, measured at fair value using Level 2 inputs, we review trading activity and pricing for these investments as of the measurement date. When sufficient quoted pricing for identical securities is not available, we use market pricing and other observable market inputs for similar securities obtained from various third party data providers. These inputs either represent quoted prices for similar assets in active markets or have been derived from observable market data. Our policy is that the end of our quarterly reporting period determines when transfers of financial instruments between levels are recognized.
Segment Information
The Company reports its operations as a single operating segment and has a single reporting unit. Our Chief Operating Decision Maker (“CODM”), our Chief Executive Officer, manages our operations on a consolidated basis for purposes of allocating resources. When evaluating performance and allocating resources, the CODM reviews financial information presented on a consolidated basis.
Revenue from customers located outside the United States was less than 1% of total for the years ended December 31, 2017 and 2016.
For the year ended December 31, 2017, Comcast accounted for approximately 65% of our total revenue. For the year ended December 31, 2016, Comcast and Office Depot accounted for approximately 60% and 15%, respectively, of our total revenue. There were no other customers that accounted for 10% or more of our total revenue in any of the periods presented.
Long-lived assets are attributed to the geographic location in which they are located. We include in long-lived assets all tangible assets. Long-lived assets by geographic areas are as follows (in thousands):
|
December 31,
|
||||||||
|
2017
|
2016
|
|||||||
|
United States
|
$
|
1,132
|
$
|
1,681
|
||||
|
India
|
-
|
23
|
||||||
|
Philippines
|
1
|
2
|
||||||
|
Total
|
$
|
1,133
|
$
|
1,706
|
||||
Recent Accounting Pronouncements
Revenue Recognition
In May 2014, the FASB issued ASU 2014-09, Revenue from Contracts with Customers (Topic 606), which provides guidance for revenue recognition and has been further clarified and amended in 2015 and 2016. ASU 2014-09 is a comprehensive new revenue recognition model requiring a company to recognize revenue to depict the transfer of goods or services to customers at an amount reflecting the consideration it expects to receive in exchange for those goods or services. In doing so, companies will need to use more judgment and make more estimates than under current U.S. GAAP. These may include identifying performance obligations in the contract, estimating the amount of variable consideration to include in the transaction price and allocating the transaction price to each separate performance obligation. ASU 2014-09 is effective in the first quarter of 2018. In adopting ASU 2014-09, companies may use either a full retrospective approach or a modified retrospective approach. The Company has selected the modified retrospective approach under which the Company will not restate the prior financial statements presented. This guidance requires a company to provide additional disclosures of the amount by which each financial statement line item is affected in the current reporting period during 2018 as compared to the guidance that was in effect before the change, and an explanation of the reasons for significant changes, if any. We have finalized our analysis and the adoption of this guidance will not have a material impact on our consolidated financial statements and our internal controls over financial reporting.
Income taxes
In March 2016, the FASB issued ASU No. 2016-09, Compensation – Stock Compensation (Topic 718), Improvements to Employee Share-Based Payment Accounting, which includes multiple provisions intended to simplify various aspects of the accounting for share-based payments. Excess tax benefits for share-based payments will be recorded as a reduction of income taxes and reflected in operating cash flows upon the adoption of this ASU. Excess tax benefits were previously recorded in equity and as a financing activity under the prior rules. ASU 2016-09 was effective for annual and interim reporting periods beginning after December 15, 2016. Because of the company’s valuation allowance position, the adoption of this guidance, effective January 1, 2017, did not result in an adjustment to retained earnings as of December 31, 2016.
In October 2016, the FASB issued ASU No. 2016-16, Income Taxes - Intra-Entity Transfers of Assets Other Than Inventory (Topic 740), which requires entities to recognize the income tax consequences of an intra-entity transfer of an asset other than inventory when the transaction occurs as opposed to deferring tax consequences and amortizing them into future periods. This update is effective for annual and interim periods beginning after December 15, 2017, with early adoption permitted. A modified retrospective approach with a cumulative-effect adjustment directly to retained earnings at the beginning of the period of adoption is required. The Company does not expect the adoption of this standard to have a material impact on its consolidated financial position or results of operations.
Lease
In February 2016, the FASB issued ASU No. 2016-02, Leases (Topic 842), which provides guidance for accounting for leases. Under ASU 2016-02, the Company will be required to recognize the assets and liabilities for the rights and obligations created by leased assets. ASU 2016-02 is effective for fiscal years, and interim periods within those fiscal years, beginning after December 15, 2018. We are currently evaluating the impact of the adoption of ASU 2016-02 on our consolidated financial statements. While we have not yet quantified the impact, we may be required to recognize certain assets and liabilities for our leases which would result in a change to interest expense and depreciation and amortization expenses while reducing rent expense upon adoption.
Restricted cash
In November 2016, the FASB issued ASU No. 2016-18, Statement of Cash Flows (Topic 230): Restricted Cash (“ASU 2016-18”), which enhances and clarifies the guidance on the classification and presentation of restricted cash in the statement of cash flows. The Company will adopt ASU 2016-18 in its first quarter of 2019 utilizing the retrospective transition method. Currently, the Company’s restricted cash balance is not significant.
Financial Instruments
In January 2016, The FASB issued ASU No. 2016-01, Financial Instruments - Recognition and Measurement of Financial Assets and Financial Liabilities (Topic 825). ASU No. 2016-01 revises the classification and measurement of investments in certain equity investments and the presentation of certain fair value changes for certain financial liabilities measured at fair value. ASU No. 2016-01 requires the change in fair value of many equity investments to be recognized in net income. The Company will adopt ASU 2016-01 in its first quarter of 2019 utilizing the modified retrospective transition method. Based on the composition of the Company’s investment portfolio, the adoption of ASU 2016-01 is not expected to have a material impact on its consolidated financial statements.
Note 2. Warrants
On October 25, 2010, we entered into a Support Services Agreement (the “Customer Agreement”) with Comcast Cable Communications Management, LLC (“Comcast”) under which Support.com provides technology support services to customers of Comcast in exchange for fees. In connection with the Customer Agreement, Support.com and Comcast entered into a Warrant Agreement, under which Support.com agreed to issue to Comcast warrants to purchase up to 975,000 shares of Support.com common stock in the future in the event that Comcast meets specified sales milestones under the Customer Agreement. Each warrant, if issued, would have an exercise price per share of $14.8494 and a term of three years from issuance. On September 27, 2011, the Company and Comcast amended the Warrant Agreement to extend the expiration date for the performance milestones while maintaining the previously agreed revenue thresholds. The warrants were valued as they were earned, and the resulting value was recorded as a charge against revenue in the period in which the performance milestone was met and the warrant was earned. During the third and fourth quarters of 2013, the performance milestones for the first and second tranche of warrants were met, respectively. Therefore, we issued to Comcast warrants to purchase a total of 163,333 shares of our common stock (warrants to purchase 55,333 shares were issued on September 30, 2013 and warrants to purchase 108,000 shares were issued on December 31, 2013) and recorded warrant-related charges of $777,000 against revenue for the year ended December 31, 2013. The first tranche, consisting of warrants to purchase 55,333 shares, and the second tranche, consisting of warrants to purchase 108,000 shares expired on September 30, 2016 and December 31, 2016, respectively. The right to receive the final tranche expired on March 31, 2014 due to the termination of the Customer Agreement on such date.
Note 3. Property and Equipment
Property and equipment are stated at cost, less accumulated depreciation, and consist of the following as of December 31, 2017 and 2016 (in thousands):
|
December 31,
|
||||||||
|
2017
|
2016
|
|||||||
|
Computer equipment and software
|
$
|
6,935
|
$
|
7,145
|
||||
|
Furniture and office equipment
|
142
|
165
|
||||||
|
Leasehold improvements
|
348
|
359
|
||||||
|
Construction in progress
|
—
|
—
|
||||||
|
7,425
|
7,669
|
|||||||
|
Accumulated depreciation
|
(6,292
|
)
|
(5,963
|
)
|
||||
|
$
|
1,133
|
$
|
1,706
|
|||||
Depreciation expense was $628,000 and $720,000 for the years ended December 31, 2017 and 2016, respectively.
Note 4. Intangible Assets
Amortization expense related to intangible assets was $16,000 and $1.0 million for the years ended December 31, 2017and 2016, respectively.
In December 2006, we acquired the use of a toll-free telephone number for cash consideration of $250,000. This asset has an indefinite useful life. The intangible asset is tested for impairment annually or more often if events or changes in circumstances indicate that the carrying value may not be recoverable.
The following table summarizes the components of intangible assets (in thousands):
|
Non-
compete
|
Partner
Relationships
|
Customer
Base
|
Technology
Rights
|
Tradenames
|
Indefinite
Life
Intangibles
|
Total
|
||||||||||||||||||||||
|
As of December 31, 2017
|
||||||||||||||||||||||||||||
|
Gross carrying value
|
$
|
593
|
$
|
145
|
$
|
641
|
$
|
5,330
|
$
|
760
|
$
|
250
|
$
|
7,719
|
||||||||||||||
|
Accumulated amortization
|
(593
|
)
|
(145
|
)
|
(641
|
)
|
(5,330
|
)
|
(760
|
)
|
—
|
(7,469
|
)
|
|||||||||||||||
|
Net carrying value
|
$
|
—
|
$
|
—
|
$
|
—
|
$
|
—
|
$
|
—
|
$
|
250
|
$
|
250
|
||||||||||||||
|
As of December 31, 2016
|
||||||||||||||||||||||||||||
|
Gross carrying value
|
$
|
593
|
$
|
145
|
$
|
641
|
$
|
5,330
|
$
|
760
|
$
|
250
|
$
|
7,719
|
||||||||||||||
|
Accumulated amortization
|
(581
|
)
|
(145
|
)
|
(637
|
)
|
(5,330
|
)
|
(760
|
)
|
—
|
(7,453
|
)
|
|||||||||||||||
|
Net carrying value
|
$
|
12
|
$
|
—
|
$
|
4
|
$
|
—
|
$
|
—
|
$
|
250
|
$
|
266
|
||||||||||||||
As of December 31, 2017, all intangible assets have been fully amortized with the exception of the indefinite-life intangibles.
Note 5. Commitments and Contingencies
Lease commitments
Headquarters office lease. On April 25, 2017, we entered into a sublease and master landlord consent agreement for our headquarters office facility, covering approximately 6,283 square feet and located in Sunnyvale, California. The lease is scheduled to expire on March 31, 2018.
Other facility leases. We lease our facilities under non-cancelable operating lease agreements, which expire at various dates through December 2020.
Total facility rent expense pursuant to all operating lease agreements was $567,000 and $620,000 for the years ended December 31, 2017 and 2016, respectively.
As of December 31, 2017, minimum payments due under all non-cancelable lease agreements were as follows (in thousands):
|
Years ending December 31,
|
Operating Leases
|
|||
|
2018
|
$
|
86
|
||
|
2019
|
15
|
|||
|
2020
|
15
|
|||
|
Total minimum lease and principal payments
|
$
|
116
|
||
Legal contingencies
On October 11, 2016 the Wage and Hour Division of the U.S. Department of Labor (“DOL”) notified the Company that it would be conducting an audit of the Company relating to compliance with the Fair Labor Standards Act (“FLSA”). The DOL indicated that the focus of the audit is directed to compliance with overtime requirements related to our technology specialists who work from home providing technical support services. The audit commenced on October 20, 2016 and was resolved by settlement agreement on January 18, 2018. Pursuant to the settlement agreement, as of December 31, 2017, the Company accrued $30,000 in back wages and related liquidated damages to some of our current and former employees.
On December 20, 2016 the Federal Trade Commission (“FTC”) issued a Civil Investigative Demand, or CID, to the Company requiring the Company to produce certain documents and materials and to answer certain interrogatories relating to PC Healthcheck, a software program provided by the Company to certain third parties prior to December 31, 2016. Since issuing the CID, the FTC has sought additional written and testimonial evidence from the Company. The Company has cooperated with the investigation from its inception and provided all of the requested information. On March 9, 2018, the FTC notified the Company that the FTC was willing to engage in settlement discussions. At this time it is difficult to predict the timing, and the likely outcome, of these matters. The possible range of outcomes include the filing by the FTC of a contested civil complaint and further discussions leading to a settlement which would likely include a monetary payment and injunctive and other relief. If discussions with the FTC do not progress to a mutually agreeable outcome, it is likely that litigation will ensue. Although we are confident in our legal position, litigation outcomes by their very nature are difficult to predict and there can be no assurance of a particular outcome. The outcome of these matters with the FTC, whether by mutual resolution or through litigation, could have a material adverse impact on the Company’s business operations, its results of operations or its financial condition. The Company is currently unable to estimate a range of potential loss, if any, and has not accrued any amounts with respect to any potential monetary payments relating to this matter. Legal costs associated with this action may be material and will be expensed as incurred.
On January 17, 2017 the Consumer Protection Division of the Office of Attorney General, State of Washington (“Washington AG”), issued a Civil Investigative Demand to the Company requiring the Company to produce certain documents and materials and to answer certain interrogatories relating to PC Healthcheck. The Washington AG has not alleged a factual basis underlying the issuance of the Civil Investigative Demand. On May 30, 2017, the Consumer Protection Division of the Office of Attorney General, State of Texas (“Texas AG”), issued a Civil Investigative Demand to the Company requiring the Company to produce certain documents and materials and to answer certain interrogatories relating to PC Healthcheck. The Texas AG has not alleged a factual basis underlying the issuance of the Civil Investigative Demand. The Company is in the process of responding to these Civil Investigative Demands and cooperating with the FTC, Washington AG and Texas AG with respect to these matters.
We are also subject to other routine legal proceedings, as well as demands, claims and threatened litigation, that arise in the normal course of our business, potentially including assertions that we may be infringing patents or other intellectual property rights of others. We currently do not believe that the ultimate amount of liability, if any, for any pending claims of any type (alone or combined) will materially affect our financial position, results of operations or cash flows. The ultimate outcome of any litigation is uncertain, however, any unfavorable outcomes could have a material negative impact on our financial condition and operating results. Regardless of outcome, litigation can have an adverse impact on us because of defense costs, negative publicity, diversion of management resources and other factors.
Guarantees
We have identified guarantees in accordance with ASC 450, Contingencies. This guidance stipulates that an entity must recognize an initial liability for the fair value, or market value, of the obligation it assumes under the guarantee at the time it issues such a guarantee, and must disclose that information in its interim and annual financial statements. We have entered into various service level agreements with our partners, in which we may guarantee the maintenance of certain service level thresholds. Under some circumstances, if we do not meet these thresholds, we may be liable for certain financial costs. We evaluate costs for such guarantees under the provisions of ASC 450. We consider such factors as the degree of probability that we would be required to satisfy the liability associated with the guarantee and the ability to make a reasonable estimate of the resulting cost. We incurred zero costs as a result of such obligations during the years ended December 31, 2017 and 2016, respectively. We have not accrued any liabilities related to such obligations in the consolidated financial statements as of December 31, 2017 and 2016.
Note 6. Restructuring Obligations and Charges
Severance
For the year ended December 31, 2017, the Company recorded $86,000 of severance and benefit related costs, included in restructuring costs in the consolidated statement of operations, related to cost reduction efforts, principally in the Company’s subsidiary India office. As of December 31, 2017, all of these costs have been paid.
For the year ended December 31, 2016, the Company recorded $1,033,000 of severance and benefit related costs, respectively, included in restructuring costs in the consolidated statement of operations related to cost reduction efforts. As of December 31, 2016, $983,000 of severance and benefit related costs had been paid and the remaining $50,000 was paid during the first quarter of 2017.
Relocation
For the year ended December 31, 2017, the Company recorded $42,000 of relocation costs included in restructuring related costs in the consolidated statement of operations, related to the relocation of several employees from the Company’s subsidiary India office to US corporate headquarters. As of December 31, 2017, $42,000 of these costs have been paid.
Contract Terminations
For the year ended December 31, 2016, the Company recorded $113,000 of contract termination costs included in restructuring related costs in the consolidated statement of operations, related to the termination of contracts as a result of cost reduction efforts. As of December 31, 2016, approximately $31,000 of unpaid costs are included in accrued liabilities in the consolidated balance sheet and were subsequently paid during the first quarter of 2017.
|
Relocation
|
Contract
Terminations
|
Severance
|
Total
|
|||||||||||||
|
Restructuring obligations, December 31, 2016
|
$
|
--
|
$
|
31
|
$
|
50
|
$
|
81
|
||||||||
|
Restructuring costs incurred
|
42
|
-
|
86
|
128
|
||||||||||||
|
Cash payments
|
(42
|
)
|
(31
|
)
|
(136
|
)
|
(209
|
)
|
||||||||
|
Restructuring obligations, December 31, 2017
|
$
|
-
|
$
|
-
|
$
|
-
|
$
|
-
|
||||||||
Note 7. Other Accrued Liabilities
Other accrued liabilities consist of the following (in thousands):
|
As of December 31,
|
||||||||
|
2017
|
2016
|
|||||||
|
Accrued expenses
|
$
|
462
|
$
|
842
|
||||
|
Self-insurance accruals
|
679
|
911
|
||||||
|
Customer deposits
|
-
|
556
|
||||||
|
Restructuring obligations
|
-
|
81
|
||||||
|
Other accrued liabilities
|
189
|
106
|
||||||
|
Total other accrued liabilities
|
$
|
1,330
|
$
|
2,496
|
||||
Note 8. Stockholders’ Equity
Equity Compensation Plan
We adopted the amended and restated 2010 Equity and Performance Incentive Plan (the “2010 Plan”), effective as of February 8, 2010. Under the 2010 Plan, the number of shares of Common Stock that may be issued will not exceed in the aggregate 1,666,666 shares of Common Stock plus the number of shares of Common Stock relating to prior awards under the 2000 Omnibus Equity Incentive Plan that expire, are forfeited or are cancelled after the adoption of the 2010 Plan, subject to adjustment as provided in the 2010 Plan. Pursuant to an approval from the Company’s shareholders, the number of shares of Common Stock that may be issued under the 2010 Plan was increased by 750,000 shares of Common Stock in May 2013 and 333,333 shares in June 2016. No grants will be made under the 2010 Plan after the tenth anniversary of its effective date. Under our 2010 Plan, as of December 31, 2017, there were approximately 1.4 million shares available for grant.
We adopted the 2014 Inducement Award Plan (the “Inducement Plan”), effective as of May 13, 2014. Under the Inducement Plan, the number of shares of Common Stock that may be issued will not exceed in the aggregate 666,666 shares of Common Stock. Under our Inducement Plan, as of December 31, 2017, there were approximately 458,000 shares available for grant.
Stock Options
The following tables represent stock option activity for the years ended December 31, 2017 and 2016:
|
Number of
Shares
|
Weighted
Average
Exercise Price
per Share
|
Weighted
Average
Remaining
Contractual
Term (in years)
|
Aggregate
Intrinsic Value
(in thousands)
|
|||||||||||||
|
Outstanding options at December 31, 2015
|
1,223,156
|
$
|
8.22
|
6.66
|
$
|
0
|
||||||||||
|
Granted
|
663,431
|
$
|
2.51
|
|||||||||||||
|
Exercised
|
(185
|
)
|
$
|
2.51
|
||||||||||||
|
Forfeited
|
(504,559
|
)
|
$
|
7.12
|
||||||||||||
|
Outstanding options at December 31, 2016
|
1,381,843
|
$
|
14.85
|
4.95
|
$
|
50
|
||||||||||
|
Granted
|
430,500
|
$
|
2.29
|
|||||||||||||
|
Exercised
|
(0
|
)
|
$
|
-
|
||||||||||||
|
Forfeited
|
(1,080,153
|
)
|
$
|
5.90
|
||||||||||||
|
Outstanding options at December 31, 2017
|
732,190
|
$
|
3.72
|
8.17
|
$
|
56
|
||||||||||
|
Options vested and expected to vest
|
679,822
|
$
|
3.83
|
8.06
|
$
|
50
|
||||||||||
|
Exercisable at December 31, 2017
|
231,039
|
$
|
6.72
|
5.15
|
$
|
3
|
||||||||||
A summary of additional information related to the options outstanding as of December 31, 2017 under the 2010 and 2014 Plans are as follows:
|
Option Plans Range of Exercise Prices
|
Number of Outstanding Options
|
Weighted Average Remaining Contractual Life
|
Weighted Average Exercise Price
|
|||||||||||
|
$
|
2.29 - $2.29
|
428,013
|
9.83
|
$
|
2.29
|
|||||||||
|
$
|
2.51-$2.51
|
115,438
|
8.13
|
$
|
2.51
|
|||||||||
|
$
|
2.52-$5.10
|
74,784
|
7.67
|
$
|
2.84
|
|||||||||
|
$
|
6.30-$11.73
|
73,805
|
2.13
|
$
|
7.86
|
|||||||||
|
$
|
12.48-$15.33
|
9,963
|
3.26
|
$
|
13.02
|
|||||||||
|
$
|
15.51-$18.39
|
30,187
|
2.46
|
$
|
17.73
|
|||||||||
|
732,190
|
||||||||||||||
The aggregate intrinsic value in the table above represents the total pre-tax intrinsic value that would have been received by the option holders had they all exercised their options on December 31, 2017 and 2016. This amount will change based on the fair market value of our stock. The total aggregate intrinsic value of options exercised under our stock option plans was $0 for each of the years ended December 31, 2017 and 2016. The total fair value of options vested during 2017 and 2016 was $32,000 and $1.3 million, respectively.
During the first quarter of 2017, as a result of the resignation of the Company’s Chief Financial Officer (CFO), 50,000 total market-based stock options granted in 2014 and 2016 were forfeited. Previously recognized Stock-based compensation expense of approximately $58,000 was reversed in the first quarter of 2017, related to the portion of those market-based grants unvested at the time of the CFO’s resignation.
At December 31, 2017, there was $798,000 of unrecognized compensation cost related to stock options which is expected to be recognized over a weighted average period of 2.65 years.
Employee Stock Purchase Plan
In the second quarter of 2011, to advance the interests of the Company and its stockholders by providing an incentive to attract, retain and reward eligible employees and by motivating such persons to contribute to the growth and profitability of the Company, the Company’s Board of Directors and stockholders approved a new Employee Stock Purchase Plan and reserved 1,000,000 shares of our common stock for issuance effective as of May 15, 2011. The ESPP continues in effect for ten (10) years from its effective date unless terminated earlier by the Company. The ESPP consists of six-month offering periods during which employees may enroll in the plan. The purchase price on each purchase date shall not be less than eighty-five percent (85%) of the lesser of (a) the fair market value of a share of stock on the offering date of the offering period, or (b) the fair market value of a share of stock on the purchase date.
A total of 28,018 shares and 42,268 shares were issued under the ESPP during the years ended December 31, 2017 and 2016, respectively.
As of December 31, 2017, approximately 110,234 shares remain available for grant under the ESPP.
Restricted Stock Units
The following table represents RSU activity for the years ended December 31, 2017 and 2016:
|
Number of
Shares |
Weighted
Average Grant-Date Fair Value per Share |
Weighted
Average Remaining Contractual Term (in years)
|
Aggregate
Intrinsic Value (in thousands) |
|||||||||||||
|
Outstanding RSUs at December 31, 2015
|
565,965
|
$
|
6.75
|
1.41
|
$
|
1,715
|
||||||||||
|
Awarded
|
203,449
|
$
|
2.65
|
|||||||||||||
|
Released
|
(270,132
|
)
|
$
|
7.14
|
||||||||||||
|
Forfeited
|
(147,361
|
)
|
$
|
5.57
|
||||||||||||
|
Outstanding RSUs at December 31, 2016
|
351,921
|
$
|
4.59
|
1.06
|
$
|
908
|
||||||||||
|
Awarded
|
102,880
|
$
|
2.43
|
|||||||||||||
|
Released
|
(153,714
|
)
|
$
|
3.45
|
||||||||||||
|
Forfeited
|
(164,758
|
)
|
$
|
5.78
|
||||||||||||
|
Outstanding RSUs at December 31, 2017
|
136,329
|
$
|
2.80
|
0.80
|
$
|
329
|
||||||||||
At December 31, 2017, there was $206,000 of unrecognized compensation cost related to RSUs which is expected to be recognized over a weighted average period of 0.8 years.
Stock Repurchase Program
On April 27, 2005, our Board of Directors authorized the repurchase of up to 666,666 outstanding shares of our common stock. As of December 31, 2017, the maximum number of shares remaining that can be repurchased under this program was 602,467. The Company does not intend to repurchase shares without a pre-approval from its Board of Directors.
Stockholder Rights Agreement and Tax Benefits Preservation Plan
On April 20, 2016, our Board approved an amendment to the Company’s Rights Agreement, dated as of October 13, 2015 (the “Original Rights Agreement”), by and between the Company and Computershare Trust Company, N.A., as rights agent (the “Rights Agent”). The amendment, which was subsequently executed on that date by the Company and the Rights Agent, changed the Final Expiration Date of the rights under the Original Rights Agreement (the “Original Rights”) from the close of business on October 10, 2016 to the close of business on April 20, 2016. As a result, the Original Rights have expired and the Original Rights Agreement has been terminated.
Also, on April 20, 2016, our Board approved and adopted a Section 382 Tax Benefits Preservation Plan, dated as of April 20, 2016, by and between the Company and Computershare Trust Company, N.A., as Rights Agent (the “Section 382 Tax Benefits Preservation Plan”). Pursuant to the Section 382 Tax Benefits Preservation Plan, the Board declared a dividend of one preferred share purchase right (each, a “Right”) for each outstanding share of common stock, par value $0.0001, of the Company (the “Common Stock”). The dividend is distributable on May 3, 2016 to stockholders of record as of the close of business on May 3, 2016. Subject to the terms, provisions and conditions of the Section 382 Tax Benefits Preservation Plan, if the Rights become exercisable, each Right would initially represent the right to purchase from the Company one one-thousandth of a share (a “Unit”) of a newly-designated series of preferred stock, Series B Junior Participating Preferred Stock, par value $0.0001 per share, of the Company (the “Series B Preferred Stock”) for a purchase price of $3.00 (the “Purchase Price”). If issued, each Unit of Series B Preferred Stock would give the stockholder approximately the same dividend, voting and liquidation rights as does one share of the Common Stock. However, prior to exercise, a Right does not give its holder any rights as a stockholder of the Company, including, without limitation, any dividend, voting or liquidation rights. Until the rights become exercisable, they will not be evidenced by separate certificates and will trade automatically with shares of the Common Stock.
Our Board adopted the Section 382 Tax Benefits Preservation Plan in an effort to diminish the risk that the Company’s ability to utilize its net operating loss carryovers (collectively, the “NOLs”) to reduce potential future federal income tax obligations may become substantially limited. Under the Internal Revenue Code of 1986, as amended (the “Code”), and the regulations promulgated thereunder by the U.S. Treasury Department, these NOLs may be “carried forward” in certain circumstances to offset any current and future taxable income and thus reduce federal income tax liability, subject to certain requirements and restrictions. However, if the Company experiences an “ownership change,” within the meaning of Section 382 of the Code (“Section 382”), its ability to utilize the NOLs may be substantially limited, and the timing of the usage of the NOLs could be substantially delayed, which could therefore significantly impair the value of those assets. Section 382 and the Treasury regulations thereunder make the Company’s commercial risk from a Section 382 limitation triggering event particularly acute given the relative size of its current cash on hand to its market capitalization. As applied to the Company’s current cash position and current market capitalization, if the Company was to currently experience an ownership change, it would be subject to Section 382’s “non-business asset” limitation which would result in the Company permanently losing all $141 million of its NOLs.
The Section 382 Tax Benefits Preservation Plan is intended to act as a deterrent to any person or group acquiring beneficial ownership of 4.99% or more of the outstanding Common Stock without the approval of the Board (such person, an “Acquiring Person”). A person who acquires, without the approval of the Board, beneficial ownership (other than as a result of repurchases of stock by the Company, dividends or distributions by the Company or certain inadvertent actions by stockholders) of 4.99% or more of the outstanding Common Stock (including any ownership interest held by that person's Affiliates and Associates as defined under the Section 382 Tax Benefits Preservation Plan) could be subject to significant dilution. Stockholders who beneficially own 4.99% or more of the outstanding Common Stock prior to the first public announcement by the Company of the Board’s adoption of the Section 382 Tax Benefits Preservation Plan will not trigger the Section 382 Tax Benefits Preservation Plan so long as they do not acquire beneficial ownership of additional shares of the Common Stock (other than pursuant to a dividend or distribution paid or made by the Company on the outstanding shares of Common Stock or pursuant to a split or subdivision of the outstanding shares of Common Stock) at a time when they still beneficially own 4.99% or more of such stock. In addition, the Board retains the sole discretion to exempt any person or group from the penalties imposed by the Section 382 Tax Benefits Preservation Plan.
In the event that a person becomes an Acquiring Person, each holder of a Right, other than Rights that are or, under certain circumstances, were beneficially owned by the Acquiring Person (which will thereupon become void), will thereafter have the right to receive upon exercise of a Right and payment of the Purchase Price, and subject to the terms, provisions and conditions of the Section 382 Tax Benefits Preservation Plan, a number of shares of the Common Stock having a market value of two times the Purchase Price.
Note 9. Income Taxes
The components of our Loss before income taxes are as follows (in thousands):
|
Year Ended December 31,
|
||||||||
|
2017
|
2016
|
|||||||
|
United States
|
$
|
(1,541
|
)
|
$
|
(16,463
|
)
|
||
|
Foreign
|
619
|
530
|
||||||
|
Total
|
$
|
(922
|
)
|
$
|
(15,933
|
)
|
||
The provision for income taxes from continuing operations consisted of the following (in thousands):
|
Year Ended December 31,
|
||||||||
|
Current:
|
2017
|
2016
|
||||||
|
Federal
|
$
|
(79
|
)
|
$
|
—
|
|||
|
State
|
13
|
3
|
||||||
|
Foreign
|
85
|
287
|
||||||
|
Total Current
|
$
|
19
|
$
|
290
|
||||
|
Deferred
|
||||||||
|
Federal
|
$
|
—
|
$
|
—
|
||||
|
State
|
—
|
—
|
||||||
|
Foreign
|
585
|
17
|
||||||
|
Total Deferred
|
$
|
585
|
$
|
17
|
||||
|
Provision for income taxes
|
$
|
604
|
$
|
307
|
||||
The reconciliation of the Federal statutory income tax rate to our effective income tax rate is as follows (in thousands):
|
Year Ended December 31,
|
||||||||
|
2017
|
2016
|
|||||||
|
Provision at Federal statutory rate
|
$
|
(322
|
)
|
$
|
(5,517
|
)
|
||
|
State taxes
|
13
|
3
|
||||||
|
Permanent differences/other
|
581
|
156
|
||||||
|
Tax Cuts and Jobs Act of 2017 Rate Change
|
22,714
|
-
|
||||||
|
Stock-based compensation
|
365
|
1,157
|
||||||
|
Federal valuation allowance (used) provided
|
(22,747
|
)
|
4,508
|
|||||
|
Provision for income taxes
|
$
|
604
|
$
|
307
|
||||
Deferred income taxes reflect the net tax effects of temporary differences between the carrying amounts of assets and liabilities for financial reporting purposes and the amounts used for income tax purposes. Significant components of our deferred tax assets and liabilities are as follows (in thousands):
|
December 31,
|
||||||||
|
2017
|
2016
|
|||||||
|
Deferred Tax Assets
|
||||||||
|
Fixed assets
|
$
|
64
|
$
|
133
|
||||
|
Deferred revenue
|
-
|
39
|
||||||
|
Accruals and reserves
|
147
|
324
|
||||||
|
Stock options
|
196
|
945
|
||||||
|
Net operating loss carryforwards
|
35,254
|
48,852
|
||||||
|
Federal and state credits
|
3,461
|
3,320
|
||||||
|
Foreign credits
|
165
|
156
|
||||||
|
Intangible assets
|
2,442
|
4,167
|
||||||
|
Research and development expense
|
2,542
|
4,347
|
||||||
|
Gross deferred tax assets
|
44,271
|
62,283
|
||||||
|
Valuation allowance
|
(44,100
|
)
|
(62,079
|
)
|
||||
|
Total deferred tax assets
|
171
|
204
|
||||||
|
Deferred Tax Liabilities
|
(543
|
)
|
—
|
|||||
|
Net deferred tax asset/liabilities
|
(372
|
)
|
204
|
|||||
ASC 740, Income Taxes, provides for the recognition of deferred tax assets if realization of such assets is more likely than not to occur. Based on management’s review of both the positive and negative evidence, which includes our historical operating performance, reported cumulative net losses since inception and difficulty in accurately forecasting its results, the Company has concluded that it is not more likely than not that the Company will be able to realize all the Company’s U.S. deferred tax assets. Therefore, the Company has provided a full valuation allowance against its U.S. deferred tax assets.
Based on management’s review of both positive and negative evidence, which includes the historical operating performance of our Canadian subsidiary, the Company has concluded that it is more likely than not that the Company will be able to realize a portion of the Company’s Canadian deferred tax assets. Therefore, the Company has a partial valuation allowance on Canadian deferred tax assets. There is no valuation allowance against the Company’s Indian deferred tax assets. The Company reassesses the need for its valuation allowance on a quarterly basis.
Based on management’s review discussed above, the realization of deferred tax assets is dependent on improvements over present levels of pre-tax income. Until the Company is consistently profitable in the U.S., it will not realize its deferred tax assets.
On December 22, 2017, the Tax Cuts and Jobs Act of 2017 (“Tax Act”) was signed into law making significant changes to the Internal Revenue Code. Changes include, but are not limited to, a corporate tax rate decrease from 35% to 21% effective for tax years beginning after December 31, 2017, the transition of U.S international taxation from a worldwide tax system to a territorial system, and a one-time transition tax on the mandatory deemed repatriation of cumulative foreign earnings as of December 31, 2017. The Company has calculated its best estimate of the impact of the Tax Act in its year end income tax provision in accordance with its understanding of the Tax Act and guidance available as of the date of this filing. The Company has evaluated these changes and, as a result of the decrease in tax rate, has recorded a provisional decrease to net deferred tax assets of $22.7 million with a corresponding decrease to valuation allowance.
Due to the complexities involved in accounting for the recently enacted Tax Act, the U.S. Securities and Exchange Commission’s Staff Accounting Bulletin (“SAB”) 118 requires that the Company include in its financial statements a reasonable estimate of the impact of the Tax Act on earnings to the extent such estimate has been determined. Pursuant to the SAB118, the Company is allowed a measurement period of up to one year after the enactment date of the Tax Act to finalize the recording of the related tax impacts. The final impact of the Company from the Tax Act may differ from the aforementioned estimates due to the complexity of calculating and supporting with primary evidence, changes in interpretations of the Tax Act, future legislative action to address questions that arise because of the Tax Act, changes in accounting standards for income taxes on related interpretations in response to the Tax Act, or any updates or changes to estimate the Company has utilized to calculate the reasonable estimate. The Company will continue to evaluate the impact of the Tax Act and will record any resulting tax adjustments during 2018.
Beginning in 2018, the Tax Act provides a 100% deduction for dividends received from 10-percent owned foreign corporations by U.S. corporate shareholders, subject to a one-year holding period. Although dividend income is now exempt from U.S. federal tax in the hands of the U.S. corporate shareholders, companies must still apply the guidance of ASC 740-30-25-18 to account for the tax consequences of outside basis differences and other tax impacts of their investments in non-U.S. subsidiaries. Deferred income taxes have not been provided on the cumulative undistributed earnings of foreign subsidiaries except for a change in assertion at December 31, 2017 for Support.com India Private Ltd. The amount of cumulative undistributed Indian subsidiary’s earnings at December 31, 2017 for which the Company is changing its assertion under ASC 740-30-25 is $2.67 million. Under the Tax Cuts and Jobs Act of 2017, all foreign subsidiaries’ accumulated earnings through December 31, 2017 has been included in U.S. taxable income. As such, the only tax related to the Indian subsidiary remittance would be a dividend distribution tax of $543,000.
The Transition Tax on unrepatriated foreign earnings is a tax on previously untaxed accumulated and current earnings and profits (“E&P”) of the Company’s foreign subsidiaries. To determine the amount of the Transition Tax, the Company must determine, among other factors, the amount of post-1986 E&P of its foreign subsidiaries, as well as the amount of non-U.S. income taxes paid on such earnings. The Company was able to make a reasonable estimate of its previously untaxed accumulated and current earnings and profits and has concluded that such amount is an accumulated deficit; therefore, no Transition Tax results.
The net valuation allowance decreased and increased by approximately $18.0 million and $4.8 million during the years ended December 31, 2017 and 2016, respectively. As of December 31, 2017, the Company had Federal and state net operating loss carryforwards of approximately $141.0 million and $72.1 million, respectively. The Federal net operating loss and credit carryforwards will expire at various dates beginning in 2020 through 2037, if not utilized. The state net operating loss carryforwards will expire at various dates beginning in 2018 through 2037, if not utilized. As a result of the adoption of ASU 2016-09 in fiscal 2017, the Company recorded a cumulative effect adjustment to increase deferred tax assets and a corresponding increase to valuation allowance from stock-based compensation which had not been previously recognized. As such there was no cumulative effect to retained earnings adjustment required.
The Company also had Federal and state research and development credit carryforwards of approximately $2.8 million and $2.4 million, respectively. The federal credits expire in varying amounts between 2020 and 2031. The state research and development credit carryforwards do not have an expiration date.
Utilization of net operating loss carryforwards and credits may be subject to substantial annual limitation or could be lost due to the ownership change limitations provided by the Internal Revenue Code of 1986, as amended and similar state provisions. The annual limitation may result in the expiration of net operating losses and credits before utilization.
ASC 740-10 clarifies the accounting for uncertainties in income taxes by prescribing guidance for the recognition, de-recognition and measurement in financial statements of income tax positions taken in previously filed tax returns or tax positions expected to be taken in tax returns, including a decision whether to file or not to file in a particular jurisdiction. ASC 740-10 requires the disclosure of any liability created for unrecognized tax benefits. The application of ASC 740-10 may also affect the tax bases of assets and liabilities and therefore may change or create deferred tax liabilities or assets.
A reconciliation of the beginning and ending amount of unrecognized tax benefits is as follows (in thousands):
|
Year Ended December 31,
|
||||||||
|
2017
|
2016
|
|||||||
|
Balance at beginning of year
|
$
|
2,285
|
$
|
2,368
|
||||
|
Increase related to prior year tax positions
|
26
|
8
|
||||||
|
Decrease related to prior year tax positions
|
—
|
(4
|
)
|
|||||
|
Increase related to current year tax positions
|
—
|
82
|
||||||
|
Settlements with tax authorities
|
(82
|
)
|
—
|
|||||
|
Decrease related to lapse of statute of limitations
|
—
|
(169
|
)
|
|||||
|
Balance at end of year
|
$
|
2,229
|
$
|
2,285
|
||||
The Company’s total amounts of unrecognized tax benefits that, if recognized, that would affect its tax rate are $0.2 million and $0.3 million as of December 31, 2017 and 2016, respectively.
The Company’s policy is to include interest and penalties related to unrecognized tax benefits within its provision for (benefit from) income taxes. The Company had $158,000 accrued for payment of interest and penalties related to unrecognized tax benefits as of December 31, 2017. The Company had $176,000 accrued for payment of interest and penalties related to unrecognized tax benefit as of December 31, 2016.
As of December 31, 2017, the amount of recognized tax benefit where it is reasonably possible that a significant change may occur in the next 12 months is approximately $133,000. The change would result from a settlement with the tax authorities in a foreign jurisdiction.
The Company files federal, state and foreign income tax returns in jurisdictions with varying statutes of limitations. Due to its net operating loss carryforwards, the Company’s income tax returns generally remain subject to examination by federal and most state authorities. In our foreign jurisdictions, the 2008 through 2017 tax years remain subject to examination by their respective tax authorities.
We are required to make periodic filings in the jurisdictions where we are deemed to have a presence for tax purposes. We have undergone audits in the past and have paid assessments arising from these audits. Our India entity was issued notices of income tax assessment pertaining to the 2004-2009 fiscal years. The notices claimed that the transfer price used in our inter-company agreements resulted in understated income in our Indian entity. During the fourth quarter of 2014, the Company re-evaluated the probability of its tax position and recorded an ASC 740-10 reserve related to India transfer pricing. As of December 31, 2017, the ASC 740-10 reserve for India transfer pricing totals $272,000. The Company’s tax position related to India has not changed in 2017 aside from an additional $3,000 increase to the reserve representing accrued interest. Separately, the Company settled its Advanced Pricing Agreement with the Indian tax authorities on July 25, 2017. As a result of this settlement, the Company no longer records an ASC 740-10 reserve related to the APA.
We may be subject to other income tax assessments in the future. We evaluate estimated expenses that could arise from those assessments in accordance with ASC 740-10. We consider such factors as the degree of probability of an unfavorable outcome and the ability to make a reasonable estimate on the amount of expenses. We record the estimated liability amount of those assessments that meet the definition of an uncertain tax position under ASC 740-10.
Note 10. Related Party Transactions
During the second quarter of 2016, the Independent Committee of the Board of Directors approved the reimbursement of $425,000 of proxy contest costs to VIEX Capital Advisors, LLC (“VIEX Capital”), a beneficial owner holding approximately 5.9% of the Company’s voting stock. A member of the Company’s Board of Directors is also managing member of VIEX Capital. As of December 31, 2016, the full amount of the reimbursement has been paid.
As disclosed in the Company’s current report on Form 8-K filed on September 18th 2017, the Company changed its independent registered public accountants effective for the fiscal year ending December 31, 2017. There were no disagreements or reportable events related to the change in accountants.
Disclosure controls and procedures.
We maintain “disclosure controls and procedures,” as such term is defined in Rule 13a-15(e) under the Exchange Act, that are designed to ensure that information required to be disclosed by us in reports that we file or submit under the Exchange Act are recorded, processed, summarized, and reported within the time periods specified in Securities and Exchange Commission rules and forms, and that such information is accumulated and communicated to our management, including our Chief Executive Officer (“CEO”) and Chief Financial Officer (“CFO”), as appropriate, to allow timely decisions regarding required disclosure. In designing and evaluating our disclosure controls and procedures, management recognized that disclosure controls and procedures, no matter how well conceived and operated, can provide only reasonable, not absolute, assurance that the objectives of the disclosure controls and procedures are met. Our disclosure controls and procedures have been designed to meet reasonable assurance standards. Additionally, in designing disclosure controls and procedures, our management necessarily was required to apply its judgment in evaluating the cost-benefit relationship of possible disclosure controls and procedures. The design of any disclosure controls and procedures also is based in part on certain assumptions about the likelihood of future events, and there can be no assurance that any design will succeed in achieving its stated goals under all potential future conditions. Based on an evaluation of the effectiveness of disclosure controls and procedures, our CEO and CFO have concluded that as of the end of the period covered by this Form 10-K our disclosure controls and procedures as defined under Exchange Act Rules 13a-15(e) and 15d-15(e) were effective to provide reasonable assurance that information required to be disclosed in our Exchange Act reports is recorded, processed, summarized and reported within the time periods specified by the Securities and Exchange Commission and is accumulated and communicated to management, including the CEO and CFO, as appropriate to allow timely decisions regarding required disclosure.
Changes in Internal Control over Financial Reporting
There have been no changes in our internal control over financial reporting during the fourth quarter of 2017 that have materially affected, or are reasonably likely to materially affect, our internal control over financial reporting.
Our management is responsible for establishing and maintaining adequate internal control over financial reporting, as such term is defined in Exchange Act Rules 13a-15(f). Our internal control system is designed to provide reasonable assurance to our management and Board of Directors regarding the preparation and fair presentation of published financial statements. All internal control systems, no matter how well designed, have inherent limitations. Therefore, even those systems determined to be effective can provide only reasonable assurance with respect to financial statement preparation and presentation.
Under the supervision and with the participation of our management, including our CEO and CFO, we conducted an evaluation of the effectiveness of our internal control over financial reporting based on the framework in Internal Control—Integrated Framework issued by the Committee of Sponsoring Organizations of the Treadway Commission (2013 framework). As part of this evaluation, management established an internal control project team, engaged outside consultants and adopted a project work plan to document and assess the adequacy of our internal control over financial reporting, address any control deficiencies that were identified, and to validate through testing that the controls are functioning as documented. Based on the results of this evaluation, our management has concluded that our internal control over financial reporting was effective as of December 31, 2017 to provide reasonable assurance regarding the reliability of financial reporting and the preparation of financial statements for external reporting purposes in accordance with generally accepted accounting principles. We reviewed the results of management’s assessment with the Audit Committee of Support.com’s Board of Directors.
This report does not include an auditors' report on the effectiveness of internal control over financial reporting due to SEC rules that exempt smaller reporting companies such as Support.com from providing such a report.
|
/s/ RICHARD A. BLOOM
|
|
|
RICHARD A. BLOOM
Interim President and Chief Executive Officer |
|
/s/ RICHARD A. BLOOM
|
|
|
RICHARD A. BLOOM
Principal Financial Officer
|
None.
PART III
The information required by Item 10 of Form 10-K with respect to Item 401 of Regulation S-K regarding our directors is incorporated herein by reference from the information contained in the section entitled “Directors and Nominees” in our definitive Proxy Statement for the 2017 Annual Meeting of Stockholders (the “Proxy Statement”), a copy of which will be filed with the Securities and Exchange Commission.
The information required by Item 10 of Form 10-K with respect to Item 401 of Regulation S-K regarding our executive officers is incorporated herein by reference from the information contained in the section entitled “Executive Compensation and Related Information” in our definitive Proxy Statement.
The information required by Item 10 of Form 10-K with respect to Item 405 of Regulation S-K regarding section 16(a) beneficial ownership compliance is incorporated by reference from the information contained in the section entitled “Section 16(a) Beneficial Ownership Compliance” in our Proxy Statement.
We have adopted a Code of Ethics and Business Conduct for Employees, Officers and Directors which is applicable to all of our directors, executive officers and employees, including our Chief Executive Officer and Chief Financial Officer (our principal executive officer and principal financial and accounting officer, respectively). The Code of Ethics and Business Conduct for Employees, Officers and Directors is available on our website at http://www.support.com/about/investor-relations/corporategovernance. A copy of the Code of Ethics and Business Conduct for Employees, Officers and Directors will be provided without charge to any person who requests it by writing to Support.com, Inc., Investor Relations, 1200 Crossman Ave., Ste 210, Sunnyvale, CA 94089, or telephoning 1-650-556-9440. We will disclose on our website amendments to or waivers from our Code of Ethics and Business Conduct applicable to our directors or executive officers, including our Chairman, our Chief Executive Officer and our Chief Financial Officer, in accordance with all applicable laws and regulations.
The information required by Item 10 of Form 10-K with respect to Items 407(c)(3), 407(d)(4) and 407(d)(5) of Regulation S-K is incorporated by reference from the information contained in the sections entitled “Director Nominations,” “Corporate Governance” and “Committees of the Board of Directors” in our Proxy Statement.
The information required by Item 11 of Form 10-K is incorporated herein by reference from the information contained in the sections entitled “Executive Compensation and Related Information,” “Director Compensation,” “Compensation Committee Report” and “Compensation Committee Interlocks and Insider Participation” in our Proxy Statement.
| ITEM 12. |
SECURITY OWNERSHIP OF CERTAIN BENEFICIAL OWNERS AND MANAGEMENT AND RELATED STOCKHOLDER MATTERS.
|
The information required by Item 12 of Form 10-K with respect to Item 201 of Regulation S-K regarding securities authorized for issuance under equity compensation plans and Item 403 of Regulation S-K regarding security ownership of certain beneficial owners and management is incorporated herein by reference from the information contained in the section entitled “Security Ownership of Certain Beneficial Owners and Management” in the Proxy Statement.
The information required by Item 13 of Form 10-K is incorporated herein by reference from the information contained in the sections entitled “Certain Relationships and Related Transactions,” “Compensation Committee Interlocks and Insider Participation” and “Director Independence” in our Proxy Statement.
The information required by Item 14 of Form 10-K is incorporated herein by reference from the information contained in the sections entitled “Principal Accountant Fees and Services” and “Audit Committee Pre-Approval Policies and Procedures” in our Proxy Statement.
PART IV
| (a) |
The following documents are filed as part of this report:
|
| (1) |
Financial Statements—See Index to the Consolidated Financial Statements and Supplementary Data in Item 8 of this report.
|
| (2) |
Financial Statement Schedules.
|
Schedule II—Valuation and qualifying accounts was omitted as the required disclosures are included in Note 1 to the Consolidated Financial Statements.
All other schedules are omitted since the information required is not applicable or is shown in the Consolidated Financial Statements or notes thereto.
| (3) |
Exhibits—See in Item 15(b) of this report.
|
| (b) |
Exhibits.
|
|
Exhibit
|
Description of Document
|
|
|
3.1
|
Restated Certificate of Incorporation, as amended (incorporated by reference to Exhibit 3.1 of Support.com’s annual report on Form 10-K for the year ended December 31, 2001)
|
|
|
3.2
|
Certificate of Amendment to Support.com’s Amended and Restated Certificate of Incorporation (incorporated by reference to Exhibit 3.1 of Support.com’s current report on Form 8-K filed with the SEC on June 23, 2009)
|
|
|
3.3
|
Certificate of Designation of Series A Junior Participating Preferred Stock of Support.com (incorporated by reference to Exhibit 3.1 of Support.com’s current report on Form 8-K filed with the SEC on October 14, 2015)
|
|
|
3.4
|
Amended and Restated Bylaws (incorporated by reference to Exhibit 3.1 of Support.com’s current report on Form 8-K filed with the SEC on February 5, 2016)
|
|
|
3.5
|
Certificate of Designation of Series B Junior Participating Preferred Stock, as filed with the Secretary of State of Delaware on April 21, 2016 (incorporated by reference to Exhibit 3.1 of Support.com’s current report on Form 8-K filed with the SEC on April 21, 2016)
|
|
|
3.6
|
Certificate of Amendment to the Restated Certificate of Incorporation of the Company effective January 20, 2017, filed on January 13, 2017 (incorporated by reference to Exhibit 3.1 of Support.com’s current report on Form 8-K filed with the SEC on January 13, 2017
|
|
|
4.1
|
Form of Common Stock Certificate (incorporated by reference to Exhibit 4.1 of Support.com’s quarterly report on Form 10-Q for the quarter ended June 30, 2002)
|
|
|
4.2
|
Rights Agreement with Computershare Trust Company, N.A., dated October 13, 2015 (incorporated by reference to Exhibit 4.1 of Support.com’s current report on Form 8-K filed with the SEC on October 14, 2015).
|
|
|
4.3
|
Section 382 Tax Benefits Preservation Plan, dated as of April 20, 2016, by and between Support.com, Inc. and Computershare Trust Company, N.A., as Rights Agent (incorporated by reference to Exhibit 4.1 of Support.com’s current report on Form 8-K filed with the SEC on April 21, 2016)
|
|
|
4.4
|
Amendment No. 1, dated as of April 20, 2016, to the Rights Agreement, dated as of October 13, 2015, by and between Support.com, Inc. and Computershare Trust Company, N.A., as Rights Agent (incorporated by reference to Exhibit 4.2 to Support.com’s Form 8-A/A filed with the SEC on April 21, 2016)
|
|
|
4.5
|
Certificate of Elimination of the Series A Preferred Stock filed with the Secretary of State of the State of Delaware on April 21, 2016 (incorporated by reference to Exhibit 4.3 to Support.com’s Form 8-A/A filed with the SEC on April 21, 2016)
|
|
|
4.6
|
Support.com, Inc. Second Amended and Restated 2010 Equity and Performance Incentive Plan (incorporated by reference to Support.com's proxy statement on Schedule 14a, filed with the SEC on May 12, 2016)
|
|
10.1*
|
Support.com’s amended and restated 2010 Equity and Incentive Compensation Plan (incorporated by reference to Exhibit 4.1 of Support.com’s current report on Form 8-K filed with the SEC on May 21, 2010)
|
|
|
10.2*
|
Support.com’s 2011 Employee Stock Purchase Plan (incorporated by reference to Annex A of Support.com’s definitive proxy statement for Support.com’s 2011 annual meeting of stockholders)
|
|
|
10.3*
|
Support.com’s 2014 Inducement Award Plan (incorporated by reference to Exhibit 10.2 of Support.com’s current report on Form 8-K filed with the SEC on May 19, 2014)
|
|
|
10.4*
|
Form of Directors’ and Officers’ Indemnification Agreement (incorporated by reference to Exhibit 10.4 of Support.com’s registration statement on Form S-1 filed with the SEC on February 18, 2000)
|
|
|
10.5*
|
Form of Stock Option Grant Notification for Officers and Employees (incorporated by reference to Exhibit 10.1(a) of Support.com’s quarterly report on Form 10-Q filed on November 5, 2009).
|
|
|
10.6
|
Sublease Agreement with TYCO Healthcare Group LP dated June 7, 2012 (incorporated by reference to Exhibit 10.1 of Support.com’s quarterly report on form 10-Q filed with the SEC on August 8, 2012).
|
|
|
10.7
|
Master Services Agreement Call Handling Services between Comcast and Support.com, effective as of October 1, 2013 (incorporated by reference to Exhibit 10.19 of Support.com’s annual report on Form 10-K filed with the SEC on March 7, 2014) (1)
|
|
|
10.8
|
Statement of Work Number 1 to Master Services Agreement Call Handling Services between Comcast and Support.com, effective as of October 1, 2013 (incorporated by reference to Exhibit 10.20 of Support.com’s annual report on Form 10-K filed with the SEC on March 7, 2014) (1)
|
|
|
10.9
|
Change Management Form Number 1 under Statement of Work Number 1 to Master Services Agreement Call Handling Services between Comcast and Support.com, effective as of December 22, 2013 (incorporated by reference to Exhibit 10.24 of Support.com’s annual report on Form 10-K filed with the SEC on March 7, 2014 (1)
|
|
|
10.10
|
Amendment Number 1 to Statement of Work Number 1 to Master Services Agreement Call Handling Services between Comcast and Support.com, effective as of December 31, 2013 (incorporated by reference to Exhibit 10.21 of Support.com’s annual report on Form 10-K filed with the SEC on March 7, 2014)
|
|
|
10.11
|
Statement of Work Number 2 to Master Services Agreement Call Handling Services between Comcast and Support.com, effective as of December 31, 2013 (incorporated by reference to Exhibit 10.22 of Support.com’s annual report on Form 10-K filed with the SEC on March 7, 2014) (1)
|
|
|
10.12
|
Statement of Work Number 3 to Master Services Agreement Call Handling Services between Comcast and Support.com, effective as of March 21, 2014 (incorporated by reference to Exhibit 10.3 of Support.com’s quarterly report on Form 10-Q filed with the SEC on May 8, 2014) (1)
|
|
|
10.13
|
Change Management Form Number 2 under Statement of Work Number 1 to Master Services Agreement Call Handling Services between Comcast and Support.com, effective as of February 27, 2014 (incorporated by reference to Exhibit 10.1 of Support.com’s quarterly report on Form 10-Q filed with the SEC on May 8, 2014) (1)
|
|
|
10.14
|
Change Management Form Number 3 under Statement of Work Number 1 to Master Services Agreement Call Handling Services between Comcast and Support.com, effective as of March 4, 2014 (incorporated by reference to Exhibit 10.2 of Support.com’s quarterly report on Form 10-Q filed with the SEC on May 8, 2014) (1)
|
|
|
10.15
|
First Change Management Form to Statement of Work Number 3 to Master Services Agreement Call Handling Services between Comcast and Support.com, effective as of June 4, 2014 (incorporated by reference to Exhibit 10.1 of Support.com’s current report on Form 8-K filed with the SEC on June 11, 2014)
|
|
|
10.16
|
Reseller Agreement between Comcast and Support.com, effective as of June 6, 2014 (incorporated by reference to Exhibit 10.1 of Support.com’s current report on Form 8-K filed with the SEC on June 18, 2014) (1)
|
|
|
10.17
|
Change Management Form Number 4 under Statement of Work Number 1 to Master Services Agreement Call Handling Services between Comcast and Support.com, effective as of September 17, 2014 (incorporated by reference to Exhibit 10.1 of Support.com’s current report on Form 8-K filed with the SEC on October 6, 2014) (1)
|
|
|
10.18
|
Change Management Form Number 5 under Statement of Work Number 1 to Master Services Agreement Call Handling Services between Comcast and Support.com, effective as of September 18, 2014 (incorporated by reference to Exhibit 10.2 of Support.com’s current report on Form 8-K filed with the SEC on October 6, 2014) (1)
|
|
10.19
|
Statement of Work Number 4 to Master Services Agreement Call Handling Services between Comcast and Support.com, effective as of February 6, 2015 (incorporated by reference to Exhibit 10.1 of Support.com’s current report on Form 8-K filed with the SEC on February 18, 2015) (1)
|
|
|
10.20
|
Compensatory Arrangement between Support.com and Jim Stephens for his term as Executive Chairman and Interim CEO commencing March 25, 2014 incorporated by reference to Support.com’s current report on Form 8-K filed with the SEC on March 14, 2014
|
|
|
10.21
|
Change Management Form Number 6 under Statement of Work Number 3 to Master Services Agreement Call Handling Services between Comcast and Support.com, effective as of April 6, 2015 (incorporated by reference to Exhibit 10.2 of Support.com’s current report on Form 8-K filed with the SEC on April 9, 2015) (1)
|
|
|
10.22
|
Amendment Number 1 to Statement of Work Number 3 to Master Services Agreement Call Handling Services between Comcast and Support.com, effective as of June 2, 2015 (incorporated by reference to Exhibit 10.2 of Support.com’s current report on Form 8-K filed with the SEC on July 2, 2015)
|
|
|
10.23
|
Change Management Form Number 6 under Statement of Work Number 1 to Master Services Agreement Call Handling Services between Comcast and Support.com, effective as of November 18, 2015 (incorporated by reference to Exhibit 10.1 of Support.com’s current report on Form 8-K filed with the SEC on November 24, 2015) (1)
|
|
|
10.24
|
Change Management Form Number 7 under Statement of Work Number 3 to Master Services Agreement Call Handling Services between Comcast and Support.com, effective as of November 18, 2015 (incorporated by reference to Exhibit 10.2 of Support.com’s current report on Form 8-K filed with the SEC on November 24, 2015) (1)
|
|
|
10.25
|
Form of Directors’ and Officers’ Indemnification Agreement (incorporated by reference to Exhibit 10.1 of Support.com’s current report on Form 8-K filed with the SEC on December 10, 2015).
|
|
|
10.26
|
Change Management Form Number 1 to Master Services Agreement Call Handling Services between Comcast and Support.com, effective as of December 15, 2015 (incorporated by reference to Exhibit 10.1 of Support.com’s current report on Form 8-K filed with the SEC on December 16, 2015) (1)
|
|
|
10.27
|
Amendment to Master Services Agreement Call Handling Services between Comcast and Support.com, Inc. effective as of May 23, 2016 (incorporated by reference to Exhibit 10.1 of Support.com’s current report on Form 8-K filed with the SEC on May 26, 2016)
|
|
|
10.28
|
Change Management Form #8 to Statement of Work #1, between Comcast and Company, signed June 2, 2016 (incorporated by reference to Exhibit 10.1 of Support.com’s current report on Form 8-K filed with the SEC on June 7, 2016) (1)
|
|
|
10.29
|
Change Management Form #8 to Statement of Work #3, between Comcast and Company, signed June 2, 2016 (incorporated by reference to Exhibit 10.2 of Support.com’s current report on Form 8-K filed with the SEC on June 7, 2016) (1)
|
|
|
10.30
|
Change Management Form #9 to Statement of Work #3, between Comcast and Support.com, signed July 13, 2016 (incorporated by reference to Exhibit 10.1 of Support.com’s current report on Form 8-K filed with the SEC on July 29, 2016) (1)
|
|
|
10.31
|
Separation Agreement and General Release, dated October 31, 2016, by and between Support.com, Inc. and Elizabeth M. Cholawsky (incorporated by reference to Exhibit 10.1 of Support.com’s current report on Form 8-K filed with the SEC on November 1, 2016)
|
|
|
10.32
|
Change Management Form #7 to Statement of Work #1, between Comcast and Company, signed December 9, 2016 (incorporated by reference to Exhibit 10.1 of Support.com’s current report on Form 8-K filed with the SEC on December 20, 2016) (1)
|
|
|
10.33
|
Change Management Form #10 to Statement of Work #3, between Comcast and Support.com, signed December 9, 2016 (incorporated by reference to Exhibit 10.2 of Support.com’s current report on Form 8-K filed with the SEC on December 20, 2016) (1)
|
|
|
10.34
|
Lease Agreement between HCP LS Redwood City, LLC and the Company dated December 20, 2016 (incorporated by reference to Exhibit 10.36 of Support.com’s annual report on Form 10-K filed with the SEC on March 7, 2017)
|
|
|
10.35*
|
Employment Offer Letter between Rick Bloom and Support.com, Inc., dated December 21, 2016 and effective as of October 28, 2016 ((incorporated by reference to Exhibit 10.1 of Support.com’s current report on Form 8-K filed with the SEC on December 22, 2016)
|
|
|
10.36
|
Change Management Form #11 to Statement of Work #3, between Comcast and Company, signed February 6, 2017 (incorporated by reference to Exhibit 10.1 of Support.com’s Form 8-K filed with the SEC on February 10, 2017) (1)
|
|
|
21.1
|
Subsidiaries of Support.com, Inc.
|
|
23.1
|
Consent of Independent Registered Public Accounting Firm
|
|
|
24.1
|
Power of Attorney (see the signature page of this Form 10-K)
|
|
|
31.1
|
Chief Executive Officer Section 302 Certification.
|
|
|
31.2
|
Chief Financial Officer Section 302 Certification.
|
|
|
32.1
|
Statement of the Chief Executive Officer under 18 U.S.C. § 1350(2)
|
|
|
32.2
|
Statement of the Chief Financial Officer under 18 U.S.C. § 1350(2)
|
|
|
101.INS
|
XBRL Instance Document
|
|
|
101.SCH
|
XBRL Taxonomy Extension Schema
|
|
|
101.CAL
|
XBRL Taxonomy Extension Calculation Linkbase
|
|
|
101.DEF
|
XBRL Taxonomy Extension Definition Linkbase
|
|
|
101.LAB
|
XBRL Taxonomy Extension Label Linkbase
|
|
|
101.PRE
|
XBRL Taxonomy Extension Presentation Linkbase
|
| * |
Denotes an executive or director compensation plan or arrangement.
|
| (1) |
Confidential treatment has been requested for portions of this exhibit.
|
| (2) |
The material contained in Exhibit 32.1 and 32.2 shall not be deemed “filed” with the SEC and is not to be incorporated by reference into any filing of the Company under the Securities Act of 1933 or the Securities Exchange Act of 1934, whether made before or after the date hereof irrespective of any general incorporation language contained in such filing, except to the extent that the registrant specifically incorporates it by reference.
|
| c) |
Financial Statement Schedules.
|
No schedules have been filed because the information required to be set forth therein is not applicable or is shown in the financial statements or related notes included as part of this report.
Pursuant to the requirements of the Section 13 or 15(d) of the Securities Exchange Act of 1934, the Registrant has duly caused this report to be signed on its behalf by the undersigned, thereunto duly authorized, on this 15th day of March, 2018.
|
SUPPORT.COM, INC.
|
||
|
By:
|
/s/ RICHARD A. BLOOM
|
|
|
Richard A. Bloom
|
||
| Interim President and Chief Executive Officer | ||
POWER OF ATTORNEY
KNOW ALL PERSONS BY THESE PRESENTS, that each person whose signature appears below constitutes and appoints Rick Bloom and each of them individually, as his or her attorney-in-fact, each with full power of substitution, for him or her in any and all capacities, to sign any and all amendments to this Report on Form 10-K, and to file the same, with exhibits thereto and other documents in connection therewith, with the Securities and Exchange Commission, hereby ratifying and confirming all that said attorney-in-fact, or his or her substitute, may do or cause to be done by virtue hereof.
Pursuant to the requirements of the Securities Exchange Act of 1934, this report has been signed below by the following persons on behalf of the registrant in the capacities and on the dates indicated:
| Signature | Title | Date |
|
/s/ Richard A. Bloom
|
Interim President and Chief Executive Officer and
|
March 22, 2018
|
|
Interim President and Chief Executive
|
Director | |
| Officer |
(Principal Executive Officer)
|
|
|
/s/ Richard A. Bloom
|
Principal Financial Officer
|
March 22, 2018
|
|
Richard A. Bloom
|
(Principal Accounting Officer) | |
|
/s/ JOSHUA E. SCHECHTER
|
Chairman of the Board of Directors
|
March 22, 2018
|
|
Joshua E. Schechter
|
||
|
/s/ ERIC SINGER
|
Director
|
March 22, 2018
|
|
Eric Singer
|
||
|
/s/ BRADLEY L. RADOFF
|
Director
|
March 22, 2018
|
|
Bradley L. Radoff
|
||
|
/s/ BRIAN J. KELLEY
|
Director
|
March 22, 2018
|
|
Brian J. Kelley
|
|
Exhibit
|
Description of Document
|
|
|
Restated Certificate of Incorporation, as amended (incorporated by reference to Exhibit 3.1 of Support.com’s annual report on Form 10-K for the year ended December 31, 2001)
|
||
|
Certificate of Amendment to Support.com’s Amended and Restated Certificate of Incorporation (incorporated by reference to Exhibit 3.1 of Support.com’s current report on Form 8-K filed with the SEC on June 23, 2009)
|
||
|
Certificate of Designation of Series A Junior Participating Preferred Stock of Support.com (incorporated by reference to Exhibit 3.1 of Support.com’s current report on Form 8-K filed with the SEC on October 14, 2015)
|
||
|
Amended and Restated Bylaws (incorporated by reference to Exhibit 3.1 of Support.com’s current report on Form 8-K filed with the SEC on February 5, 2016)
|
||
|
Certificate of Designation of Series B Junior Participating Preferred Stock, as filed with the Secretary of State of Delaware on April 21, 2016 (incorporated by reference to Exhibit 3.1 of Support.com’s current report on Form 8-K filed with the SEC on April 21, 2016)
|
||
|
Certificate of Amendment to the Restated Certificate of Incorporation of the Company effective January 20, 2017, filed on January 13, 2017 (incorporated by reference to Exhibit 3.1 of Support.com’s current report on Form 8-K filed with the SEC on January 13, 2017
|
||
|
Form of Common Stock Certificate (incorporated by reference to Exhibit 4.1 of Support.com’s quarterly report on Form 10-Q for the quarter ended June 30, 2002)
|
||
|
Rights Agreement with Computershare Trust Company, N.A., dated October 13, 2015 (incorporated by reference to Exhibit 4.1 of Support.com’s current report on Form 8-K filed with the SEC on October 14, 2015).
|
||
|
Section 382 Tax Benefits Preservation Plan, dated as of April 20, 2016, by and between Support.com, Inc. and Computershare Trust Company, N.A., as Rights Agent (incorporated by reference to Exhibit 4.1 of Support.com’s current report on Form 8-K filed with the SEC on April 21, 2016)
|
||
|
Amendment No. 1, dated as of April 20, 2016, to the Rights Agreement, dated as of October 13, 2015, by and between Support.com, Inc. and Computershare Trust Company, N.A., as Rights Agent (incorporated by reference to Exhibit 4.2 to Support.com’s Form 8-A/A filed with the SEC on April 21, 2016)
|
||
|
Certificate of Elimination of the Series A Preferred Stock filed with the Secretary of State of the State of Delaware on April 21, 2016 (incorporated by reference to Exhibit 4.3 to Support.com’s Form 8-A/A filed with the SEC on April 21, 2016)
|
||
|
Support.com, Inc. Second Amended and Restated 2010 Equity and Performance Incentive Plan (incorporated by reference to Support.com's proxy statement on Schedule 14a, filed with the SEC on May 12, 2016)
|
||
|
Support.com’s amended and restated 2010 Equity and Incentive Compensation Plan (incorporated by reference to Exhibit 4.1 of Support.com’s current report on Form 8-K filed with the SEC on May 21, 2010)
|
||
|
Support.com’s 2011 Employee Stock Purchase Plan (incorporated by reference to Annex A of Support.com’s definitive proxy statement for Support.com’s 2011 annual meeting of stockholders)
|
||
|
Support.com’s 2014 Inducement Award Plan (incorporated by reference to Exhibit 10.2 of Support.com’s current report on Form 8-K filed with the SEC on May 19, 2014)
|
||
|
Form of Directors’ and Officers’ Indemnification Agreement (incorporated by reference to Exhibit 10.4 of Support.com’s registration statement on Form S-1 filed with the SEC on February 18, 2000)
|
||
|
Form of Stock Option Grant Notification for Officers and Employees (incorporated by reference to Exhibit 10.1(a) of Support.com’s quarterly report on Form 10-Q filed on November 5, 2009).
|
||
|
Sublease Agreement with TYCO Healthcare Group LP dated June 7, 2012 (incorporated by reference to Exhibit 10.1 of Support.com’s quarterly report on form 10-Q filed with the SEC on August 8, 2012).
|
||
|
Master Services Agreement Call Handling Services between Comcast and Support.com, effective as of October 1, 2013 (incorporated by reference to Exhibit 10.19 of Support.com’s annual report on Form 10-K filed with the SEC on March 7, 2014) (1)
|
||
|
Statement of Work Number 1 to Master Services Agreement Call Handling Services between Comcast and Support.com, effective as of October 1, 2013 (incorporated by reference to Exhibit 10.20 of Support.com’s annual report on Form 10-K filed with the SEC on March 7, 2014) (1)
|
|
Change Management Form Number 1 under Statement of Work Number 1 to Master Services Agreement Call Handling Services between Comcast and Support.com, effective as of December 22, 2013 (incorporated by reference to Exhibit 10.24 of Support.com’s annual report on Form 10-K filed with the SEC on March 7, 2014 (1)
|
||
|
Amendment Number 1 to Statement of Work Number 1 to Master Services Agreement Call Handling Services between Comcast and Support.com, effective as of December 31, 2013 (incorporated by reference to Exhibit 10.21 of Support.com’s annual report on Form 10-K filed with the SEC on March 7, 2014)
|
||
|
Statement of Work Number 2 to Master Services Agreement Call Handling Services between Comcast and Support.com, effective as of December 31, 2013 (incorporated by reference to Exhibit 10.22 of Support.com’s annual report on Form 10-K filed with the SEC on March 7, 2014) (1)
|
||
|
Statement of Work Number 3 to Master Services Agreement Call Handling Services between Comcast and Support.com, effective as of March 21, 2014 (incorporated by reference to Exhibit 10.3 of Support.com’s quarterly report on Form 10-Q filed with the SEC on May 8, 2014) (1)
|
||
|
Change Management Form Number 2 under Statement of Work Number 1 to Master Services Agreement Call Handling Services between Comcast and Support.com, effective as of February 27, 2014 (incorporated by reference to Exhibit 10.1 of Support.com’s quarterly report on Form 10-Q filed with the SEC on May 8, 2014) (1)
|
||
|
Change Management Form Number 3 under Statement of Work Number 1 to Master Services Agreement Call Handling Services between Comcast and Support.com, effective as of March 4, 2014 (incorporated by reference to Exhibit 10.2 of Support.com’s quarterly report on Form 10-Q filed with the SEC on May 8, 2014) (1)
|
||
|
First Change Management Form to Statement of Work Number 3 to Master Services Agreement Call Handling Services between Comcast and Support.com, effective as of June 4, 2014 (incorporated by reference to Exhibit 10.1 of Support.com’s current report on Form 8-K filed with the SEC on June 11, 2014)
|
||
|
Reseller Agreement between Comcast and Support.com, effective as of June 6, 2014 (incorporated by reference to Exhibit 10.1 of Support.com’s current report on Form 8-K filed with the SEC on June 18, 2014) (1)
|
||
|
Change Management Form Number 4 under Statement of Work Number 1 to Master Services Agreement Call Handling Services between Comcast and Support.com, effective as of September 17, 2014 (incorporated by reference to Exhibit 10.1 of Support.com’s current report on Form 8-K filed with the SEC on October 6, 2014) (1)
|
||
|
Change Management Form Number 5 under Statement of Work Number 1 to Master Services Agreement Call Handling Services between Comcast and Support.com, effective as of September 18, 2014 (incorporated by reference to Exhibit 10.2 of Support.com’s current report on Form 8-K filed with the SEC on October 6, 2014) (1)
|
||
|
Statement of Work Number 4 to Master Services Agreement Call Handling Services between Comcast and Support.com, effective as of February 6, 2015 (incorporated by reference to Exhibit 10.1 of Support.com’s current report on Form 8-K filed with the SEC on February 18, 2015) (1)
|
||
|
Compensatory Arrangement between Support.com and Jim Stephens for his term as Executive Chairman and Interim CEO commencing March 25, 2014 incorporated by reference to Support.com’s current report on Form 8-K filed with the SEC on March 14, 2014
|
||
|
Change Management Form Number 6 under Statement of Work Number 3 to Master Services Agreement Call Handling Services between Comcast and Support.com, effective as of April 6, 2015 (incorporated by reference to Exhibit 10.2 of Support.com’s current report on Form 8-K filed with the SEC on April 9, 2015) (1)
|
||
|
Amendment Number 1 to Statement of Work Number 3 to Master Services Agreement Call Handling Services between Comcast and Support.com, effective as of June 2, 2015 (incorporated by reference to Exhibit 10.2 of Support.com’s current report on Form 8-K filed with the SEC on July 2, 2015)
|
||
|
Change Management Form Number 6 under Statement of Work Number 1 to Master Services Agreement Call Handling Services between Comcast and Support.com, effective as of November 18, 2015 (incorporated by reference to Exhibit 10.1 of Support.com’s current report on Form 8-K filed with the SEC on November 24, 2015) (1)
|
||
|
Change Management Form Number 7 under Statement of Work Number 3 to Master Services Agreement Call Handling Services between Comcast and Support.com, effective as of November 18, 2015 (incorporated by reference to Exhibit 10.2 of Support.com’s current report on Form 8-K filed with the SEC on November 24, 2015) (1)
|
|
Form of Directors’ and Officers’ Indemnification Agreement (incorporated by reference to Exhibit 10.1 of Support.com’s current report on Form 8-K filed with the SEC on December 10, 2015).
|
||
|
Change Management Form Number 1 to Master Services Agreement Call Handling Services between Comcast and Support.com, effective as of December 15, 2015 (incorporated by reference to Exhibit 10.1 of Support.com’s current report on Form 8-K filed with the SEC on December 16, 2015) (1)
|
||
|
Amendment to Master Services Agreement Call Handling Services between Comcast and Support.com, Inc. effective as of May 23, 2016 (incorporated by reference to Exhibit 10.1 of Support.com’s current report on Form 8-K filed with the SEC on May 26, 2016)
|
||
|
Change Management Form #8 to Statement of Work #1, between Comcast and Company, signed June 2, 2016 (incorporated by reference to Exhibit 10.1 of Support.com’s current report on Form 8-K filed with the SEC on June 7, 2016) (1)
|
||
|
Change Management Form #8 to Statement of Work #3, between Comcast and Company, signed June 2, 2016 (incorporated by reference to Exhibit 10.2 of Support.com’s current report on Form 8-K filed with the SEC on June 7, 2016) (1)
|
||
|
Change Management Form #9 to Statement of Work #3, between Comcast and Support.com, signed July 13, 2016 (incorporated by reference to Exhibit 10.1 of Support.com’s current report on Form 8-K filed with the SEC on July 29, 2016) (1)
|
||
|
Separation Agreement and General Release, dated October 31, 2016, by and between Support.com, Inc. and Elizabeth M. Cholawsky (incorporated by reference to Exhibit 10.1 of Support.com’s current report on Form 8-K filed with the SEC on November 1, 2016)
|
||
|
Change Management Form #7 to Statement of Work #1, between Comcast and Company, signed December 9, 2016 (incorporated by reference to Exhibit 10.1 of Support.com’s current report on Form 8-K filed with the SEC on December 20, 2016) (1)
|
||
|
Change Management Form #10 to Statement of Work #3, between Comcast and Support.com, signed December 9, 2016 (incorporated by reference to Exhibit 10.2 of Support.com’s current report on Form 8-K filed with the SEC on December 20, 2016) (1)
|
||
|
Lease Agreement between HCP LS Redwood City, LLC and the Company dated December 20, 2016 (incorporated by reference to Exhibit 10.36 of Support.com’s annual report on Form 10-K filed with the SEC on March 7, 2017)
|
||
|
Employment Offer Letter between Rick Bloom and Support.com, Inc., dated December 21, 2016 and effective as of October 28, 2016 ((incorporated by reference to Exhibit 10.1 of Support.com’s current report on Form 8-K filed with the SEC on December 22, 2016)
|
||
|
Change Management Form #11 to Statement of Work #3, between Comcast and Company, signed February 6, 2017 (incorporated by reference to Exhibit 10.1 of Support.com’s Form 8-K filed with the SEC on February 10, 2017) (1)
|
||
|
Subsidiaries of Support.com, Inc.
|
||
|
Consent of Independent Registered Public Accounting Firm
|
||
|
24.1
|
Power of Attorney (see the signature page of this Form 10-K)
|
|
|
Chief Executive Officer Section 302 Certification.
|
||
|
Chief Financial Officer Section 302 Certification.
|
||
|
Statement of the Chief Executive Officer under 18 U.S.C. § 1350(2)
|
||
|
Statement of the Chief Financial Officer under 18 U.S.C. § 1350(2)
|
||
|
101.INS
|
XBRL Instance Document
|
|
|
101.SCH
|
XBRL Taxonomy Extension Schema
|
|
|
101.CAL
|
XBRL Taxonomy Extension Calculation Linkbase
|
|
|
101.DEF
|
XBRL Taxonomy Extension Definition Linkbase
|
|
|
101.LAB
|
XBRL Taxonomy Extension Label Linkbase
|
|
|
101.PRE
|
XBRL Taxonomy Extension Presentation Linkbase
|
| * |
Denotes an executive or director compensation plan or arrangement.
|
| (1) |
Confidential treatment has been requested for portions of this exhibit.
|
| (2) |
The material contained in Exhibit 32.1 and 32.2 shall not be deemed “filed” with the SEC and is not to be incorporated by reference into any filing of the Company under the Securities Act of 1933 or the Securities Exchange Act of 1934, whether made before or after the date hereof irrespective of any general incorporation language contained in such filing, except to the extent that the registrant specifically incorporates it by reference.
|
| (c) |
Financial Statement Schedules.
|
No schedules have been filed because the information required to be set forth therein is not applicable or is shown in the financial statements or related notes included as part of this report.
67