Attached files
| file | filename |
|---|---|
| EX-23.5 - EX-23.5 - ConvergeOne Holdings, Inc. | d507706dex235.htm |
| EX-23.4 - EX-23.4 - ConvergeOne Holdings, Inc. | d507706dex234.htm |
| EX-23.3 - EX-23.3 - ConvergeOne Holdings, Inc. | d507706dex233.htm |
| EX-23.2 - EX-23.2 - ConvergeOne Holdings, Inc. | d507706dex232.htm |
| EX-4.3 - EX-4.3 - ConvergeOne Holdings, Inc. | d507706dex43.htm |
Table of Contents
As filed with the U.S. Securities and Exchange Commission on March 22, 2018
Registration No. 333-
UNITED STATES
SECURITIES AND EXCHANGE COMMISSION
Washington, D.C. 20549
FORM S-1
REGISTRATION STATEMENT
UNDER
THE SECURITIES ACT OF 1933
ConvergeOne Holdings, Inc.
(Exact name of registrant as specified in our charter)
| Delaware | 7372 | 81-4619427 | ||
| (State or Other Jurisdiction of Incorporation or Organization) |
(Primary Standard Industrial Classification Code Number) |
(I.R.S. Employer Identification No.) |
3344 Highway 149
Eagan, MN 55121
(888) 321-6227
(Address, including zip code, and telephone number, including area code, of registrant’s principal executive offices)
John A. McKenna, Jr.
President and Chief Executive Officer,
and Chairman of the Board
ConvergeOne Holdings, Inc.
3344 Highway 149
Eagan, MN 55121
(888) 321-6227
(Name, address, including zip code, and telephone number, including area code, of agent for service)
Copies to:
Mehdi Khodadad
John T. McKenna
Alan Hambelton
Cooley LLP
3175 Hanover Street
Palo Alto, CA 94304
Approximate date of commencement of proposed sale to the public: As soon as practicable after the effective date of this registration statement
If any of the securities being registered on this Form are to be offered on a delayed or continuous basis pursuant to Rule 415 under the Securities Act of 1933 check the following box: ☒
If this Form is filed to register additional securities for an offering pursuant to Rule 462(b) under the Securities Act, please check the following box and list the Securities Act registration statement number of the earlier effective registration statement for the same offering. ☐
If this Form is a post-effective amendment filed pursuant to Rule 462(c) under the Securities Act, check the following box and list the Securities Act registration statement number of the earlier effective registration statement for the same offering. ☐
If this Form is a post-effective amendment filed pursuant to Rule 462(d) under the Securities Act, check the following box and list the Securities Act registration statement number of the earlier effective registration statement for the same offering. ☐
Indicate by check mark whether the registrant is a large accelerated filer, an accelerated filer, a non-accelerated filer, a smaller reporting company, or an emerging growth company. See the definitions of “large accelerated filer,” “accelerated filer,” “smaller reporting company,” and “emerging growth company” in Rule 12b-2 of the Exchange Act.
| Large accelerated filer |
☐ |
Accelerated filer | ☐ | |||||
| Non-accelerated filer |
☒ |
(Do not check if a smaller reporting company) | Smaller reporting company | ☐ | ||||
| Emerging growth company |
☒ |
If an emerging growth company, indicate by check mark if the registrant has elected not to use the extended transition period for complying with any new or revised financial accounting standards provided pursuant to Section 7(a)(2)(B) of the Securities Act. ☐
Calculation of Registration Fee
|
| ||||||||
| Title of Each Class of Securities to be Registered |
Amount to be Registered(1) |
Proposed Maximum Offering Price Per Security |
Proposed Maximum Aggregate Offering Price |
Amount of Registration Fee | ||||
| Common stock, $0.0001 par value per share |
22,189,750 | $ 8.545(2) | $189,611,414 | $23,607 | ||||
| Warrants to purchase common stock |
311,250 | $ 0.955(3) | — (5) | — (5) | ||||
| Common stock, $0.0001 par value per share, underlying the Warrants |
8,936,249 | $12.455(4) | $111,300,982 | $13,857 | ||||
| Total |
$300,912,396 | $37,464 | ||||||
|
| ||||||||
|
| ||||||||
| (1) | In the event of a stock split, stock dividend or other similar transaction involving the registrant’s common stock, in order to prevent dilution, the number of shares of common stock registered hereby shall be automatically increased to cover the additional common shares in accordance with Rule 416(a) under the Securities Act. |
| (2) | Estimated solely for the purpose of calculating the registration fee in accordance with Rule 457(c) under the Securities Act. The price per share and aggregate offering price are based on the average of the high and low prices of the Registrant’s common stock on March 16, 2018, as reported on the Nasdaq Capital Market. |
| (3) | Estimated in accordance with Rule 457(c) under the Securities Act. The price per share is based on the average of the high and low prices of the Registrant’s warrants on March 16, 2018, as reported on the Nasdaq Capital Market. |
| (4) | Estimated solely for the purpose of calculating the registration fee in accordance with Rule 457(i) under the Securities Act. The price per share is based upon (a) the exercise price per warrant of $11.50 per share plus (b) the average of the high and low prices of the Registrant’s warrants on March 16, 2018 as reported on the Nasdaq Capital Market. |
| (5) | No separate fee due in accordance with Rule 457(i). |
The Registrant hereby amends this Registration Statement on such date or dates as may be necessary to delay its effective date until the Registrant shall file a further amendment which specifically states that this Registration Statement shall thereafter become effective in accordance with Section 8(a) of the Securities Act of 1933, as amended, or until the Registration Statement shall become effective on such date as the Securities and Exchange Commission acting pursuant to said Section 8(a), may determine.
Table of Contents
The information in this prospectus is not complete and may be changed. The selling stockholders may not sell these securities until the registration statement filed with the Securities and Exchange Commission is effective. This prospectus is not an offer to sell these securities and is not soliciting an offer to buy these securities in any state where the offer or sale is not permitted.
Subject to Completion, Dated March 22, 2018
PRELIMINARY PROSPECTUS

30,814,749 Shares of Common Stock
311,250 Warrants to Purchase Common Stock
The selling stockholders named in this prospectus (the “Selling Stockholders”) may offer and sell from time to time up to 22,189,750 shares of our common stock, par value $0.0001 per share, and warrants to purchase up to 311,250 shares of common stock, consisting of:
| • | up to 17,959,375 shares of common stock issued in a private placement pursuant to subscription agreements entered into on November 30, 2017 (the “PIPE Shares”); |
| • | up to 3,919,125 shares of common stock (the “Founders Shares”) issued in a private placement to Forum Investors I, LLC (the “Sponsor”) and subsequently distributed to the Sponsor’s members; |
| • | up to 311,250 warrants to purchase shares of common stock issued in a private placement to the Sponsor (the “Placement Warrants”) and subsequently distributed to the Sponsor’s members; and |
| • | up to 311,250 shares of common stock issuable upon exercise of the Placement Warrants. |
In addition, this prospectus relates to the offer and sale of up to 8,624,999 shares of common stock that are issuable by us upon the exercise of outstanding warrants that were previously registered (the “Public Warrants”).
The selling stockholders may offer, sell or distribute all or a portion of the securities hereby registered publicly or through private transactions at prevailing market prices or at negotiated prices. We will not receive any of the proceeds from such sales of the shares of common stock or warrants, except with respect to amounts received by us upon the exercise of the warrants. We will bear all costs, expenses and fees in connection with the registration of these securities, including with regard to compliance with state securities or “blue sky” laws. The selling stockholders will bear all commissions and discounts, if any, attributable to their sale of shares of common stock or warrants. See “Plan of Distribution” beginning on page 104 of this prospectus.
We are an “emerging growth company” as defined in Section 2(a) of the Securities Act of 1933, as amended, and are subject to reduced public company reporting requirements. This prospectus complies with the requirements that apply to an issuer that is an emerging growth company.
Our common stock and warrants are listed on the Nasdaq Capital Market under the symbols “CVON” and “CVONW”, respectively. On March 21, 2018, the last reported sales price of our common stock was $8.73 per share and the last reported sales price of our warrants was $0.96 per warrant.
Investing in our securities involves a high degree of risk. You should review carefully the risks and uncertainties described under the heading “Risk Factors” beginning on page 5 of this prospectus, and under similar headings in any amendment or supplements to this prospectus.
Neither the Securities and Exchange Commission nor any state securities commission has approved or disapproved of these securities or passed upon the adequacy or accuracy of this prospectus. Any representation to the contrary is a criminal offense.
, 2018
Table of Contents
You should rely only on the information contained in this prospectus, any supplement to this prospectus or in any free writing prospectus, filed with the Securities and Exchange Commission. Neither we nor the selling stockholders have authorized anyone to provide you with additional information or information different from that contained in this prospectus filed with the Securities and Exchange Commission. We take no responsibility for, and can provide no assurance as to the reliability of, any other information that others may give you. The selling stockholders are offering to sell, and seeking offers to buy, our securities only in jurisdictions where offers and sales are permitted. The information contained in this prospectus is accurate only as of the date of this prospectus, regardless of the time of delivery of this prospectus or any sale of our securities. Our business, financial condition, results of operations and prospects may have changed since that date.
For investors outside the United States: Neither we nor the selling stockholders, have done anything that would permit this offering or possession or distribution of this prospectus in any jurisdiction where action for that purpose is required, other than in the United States. Persons outside the United States who come into possession of this prospectus must inform themselves about, and observe any restrictions relating to, the offering of our securities and the distribution of this prospectus outside the United States.
To the extent there is a conflict between the information contained in this prospectus, on the one hand, and the information contained in any document incorporated by reference filed with the Securities and Exchange Commission before the date of this prospectus, on the other hand, you should rely on the information in this prospectus. If any statement in a document incorporated by reference is inconsistent with a statement in another document incorporated by reference having a later date, the statement in the document having the later date modifies or supersedes the earlier statement.
i
Table of Contents
SPECIAL NOTE REGARDING FORWARD-LOOKING STATEMENTS
This prospectus contains forward-looking statements within the meaning of Section 27A of the Securities Act and Section 21E of the Securities Exchange Act of 1934. Forward-looking statements provide our current expectations or forecasts of future events. Forward-looking statements include statements about our expectations, beliefs, plans, objectives, intentions, assumptions and other statements that are not historical facts. The words “anticipates,” “believe,” “continue,” “could,” “estimate,” “expect,” “intends,” “may,” “might,” “plan,” “possible,” “potential,” “predicts,” “project,” “should,” “would” and similar expressions may identify forward-looking statements, but the absence of these words does not mean that a statement is not forward-looking. Forward-looking statements in this prospectus include, but are not limited to, statements about our:
| • | ability to grow and retain our client base; |
| • | ability to provide effective client support and induce our clients to renew and upgrade the technology offerings and services we provide for them; |
| • | ability to expand our sales organization to address effectively existing and new markets that we intend to target; |
| • | ability to forecast and maintain an adequate rate of revenue growth and appropriately plan our expenses; |
| • | expectations regarding future expenditures; |
| • | future mix of revenue and effect on gross margins; |
| • | attraction and retention of qualified employees and key personnel; |
| • | ability to compete effectively in a competitive industry; |
| • | ability to protect and enhance our corporate reputation and brand; |
| • | expectations concerning our relationships and actions with our technology partners and other third parties; |
| • | impact from future regulatory, judicial, and legislative changes in our industry; |
| • | ability to locate and acquire complementary technologies or services and integrate those into our business; and |
| • | future arrangements with, or investments in, other entities or associations. |
These forward-looking statements are based on information available as of the date of this prospectus, and current expectations, forecasts and assumptions, and involve a number of risks and uncertainties. Accordingly, forward-looking statements should not be relied upon as representing our views as of any subsequent date, and we do not undertake any obligation to update forward-looking statements to reflect events or circumstances after the date they were made, whether as a result of new information, future events or otherwise, except as may be required under applicable securities laws.
In addition, statements that we “believe” and similar statements reflect our beliefs and opinions on the relevant subject. These statements are based upon information available to such party as of the date of this prospectus, and while we believe such information forms a reasonable basis for such statements, such information may be limited or incomplete, and these statements should not be read to indicate that we have conducted an exhaustive inquiry into, or review of, all potentially available relevant information. These statements are inherently uncertain and investors are cautioned not to unduly rely upon these statements.
You should not place undue reliance on these forward-looking statements. As a result of a number of known and unknown risks and uncertainties, our actual results or performance may be materially different from those expressed or implied by these forward-looking statements.
ii
Table of Contents
In this document:
“Business Combination” means the business combination between C1 Investment Corp. and Forum Merger Corporation, consummated on February 22, 2018.
“C1” means C1 Investment Corp.
“Clearlake” means Clearlake Capital Group, L.P., together with its affiliates and related persons.
“Forum” means Forum Merger Corporation.
“Forum IPO” means Forum’s initial public offering.
“Founders Shares” means Class F common stock purchased by Sponsor on December 28, 2016 which, upon the closing of the Business Combination, converted on a one-for-one basis into common stock.
“Merger Agreement” means the Merger Agreement, dated as of November 30, 2017, by and among Forum Merger Corporation, FMC Merger Subsidiary Corp., FMC Merger Subsidiary LLC, C1 Investment Corp. and Clearlake Capital Management III, L.P.
“PIPE Investment” refers to the sale of shares of common stock in a private placement whereby certain investors committed to purchase 17,959,375 shares of common stock for an aggregate purchase price of $143,675,000.
“PIPE Shares” means the shares of common stock sold in the PIPE Investment.
“Placement Warrants” means warrants to purchase shares of common stock issued in a private placement to Sponsor and subsequently distributed to the Sponsor’s members.
“Sponsor” means Forum Investors I, LLC.
“warrants” means the “Placement Warrants” and the “Public Warrants.”
1
Table of Contents
The following summary highlights selected information contained elsewhere in this prospectus and does not contain all of the information that you should consider in making your investment decision. Before investing in our common stock, you should carefully read this entire prospectus, including our financial statements and the related notes included in this prospectus and the information set forth under the headings “Risk Factors” and “Management’s Discussion and Analysis of Financial Condition and Results of Operations.” The “Company,” “ConvergeOne” “we,” “our,” “us” or similar terms mean ConvergeOne Holdings, Inc. and our consolidated subsidiaries.
General
We are a leading IT services provider of collaboration and technology solutions for large and medium enterprises. We serve clients through our comprehensive engagement model which includes the full lifecycle of services from consultation and design through implementation, optimization, and ongoing support. Approximately 46% and 51% of our total revenue in 2016 and 2017, respectively, was derived from our services offerings, which include professional and managed, cloud, and maintenance services. Our deep technical expertise enables us to deliver complex, multi-vendor solutions across a number of delivery models, including on-premise and in private, hybrid, C1 Cloud, and public cloud environments. We served over 3,400, 3,700, and 7,200 clients in 2015, 2016, and 2017, respectively, which includes clients served in 2017 by companies we acquired in 2017. From 2015 to 2017, we served 57% of the Fortune 100, 43% of the Fortune 500, and 36% of the Fortune 1000, which includes clients served in the same period by companies we acquired in 2017.
Through our leading professional services capabilities, we design thousands of solutions each year across our core technology markets: (i) collaboration and (ii) enterprise networking, data center, cloud, and security, each of which is complemented by our industry-leading managed, cloud, and maintenance services. Managed, cloud, and maintenance services typically have multi-year contractual terms with high renewal rates and accounted for 29% and 33% of our total revenue in 2016 and 2017, respectively. Through our relationships with more than 300 leading and next-generation technology partners, our engineers deliver optimal services and solutions to clients regardless of their existing infrastructure.
Collaboration technology is essential to modern business, enabling workforce mobility and driving globalization through connectivity across any device. Collaboration solutions create significant competitive advantages through enhanced productivity, innovative ways of working together, and omni-channel customer engagement models. With our more than 20-year focus on collaboration solutions, we believe we will benefit from the rapid growth of this market. We derived approximately 68% and 66% of our total revenue in 2016 and 2017, respectively, from our services and technology offerings in the collaboration market.
Our technical expertise and client-centric culture have led to long-standing and expanding client relationships. Our top 100 clients, based on 2017 revenue, excluding the impact of our 2017 acquisitions, had an average tenure of more than nine years. We generated 91% and 93% of our total revenue in 2016 and 2017, respectively, from clients we served in a prior year, excluding the impact of our 2017 acquisitions. Our Net Promoter Score (“NPS”) of 61 in 2016 was more than twice the technology vendor industry average of 30. NPS is a commonly used industry measure of customers’ overall satisfaction. According to this third-party survey, 86% of our clients indicated that they are “highly likely” to recommend us to other businesses and organizations.
Corporate Information
We were incorporated in Delaware in November 2016 as a blank check company under the name Forum Merger Corporation. Our principal executive offices are located at 3344 Highway 149, Eagan, Minnesota 55121, and our telephone number is (888) 321-6227. Our corporate website address is www.convergeone.com. Information contained on or accessible through our website is not a part of this prospectus, and the inclusion of our website address in this prospectus is an inactive textual reference only.
2
Table of Contents
On February 22, 2018, C1 Investment Corp. and Forum consummated the transactions contemplated by the Agreement and Plan of Merger, dated November 30, 2017, following the approval at the special meeting of the stockholders of Forum held on February 20, 2018. In connection with the closing of the Business Combination, we changed our name from Forum Merger Corporation to ConvergeOne Holdings, Inc.
ConvergeOne is a trademark of ConvergeOne, Inc., our wholly-owned subsidiary. The ConvergeOne logos are trademarks of ConvergeOne Holdings Corp., our wholly-owned subsidiary. We do not intend our use or display of other companies’ trade names or trademarks to imply a relationship with, or endorsement or sponsorship of us by, any other companies.
3
Table of Contents
The Offering
| Securities offered by the selling stockholders |
We are registering the resale by the selling stockholders named in this prospectus, or their permitted transferees, of an aggregate of 22,189,750 shares of common stock and warrants to purchase 311,250 shares of common stock, which includes: |
| • | up to 17,959,375 PIPE Shares; |
| • | up to 3,919,125 Founders Shares; and |
| • | up to 311,250 shares of common stock issuable upon exercise of the Placement Warrants. |
| In addition, we are registering 8,624,999 shares of common stock issuable upon exercise of the Public Warrants that were previously registered. |
| Sponsor Earnout Letter and Lock-Up Letter |
An aggregate of 2,156,250 of the Founder Shares are subject to forfeiture in the event that the Earnout Payments are not achieved, and may not be sold until such time. Such shares are also subject to 180-day lock-up agreement; provided, that if the volume-weighted average price of our common stock for 15 trading days is at least $12.50 per share, then 25% of such shares will be released from the lock-up agreement, but will remain subject to forfeiture and may not be sold. See the section titled “Certain Relationships and Related Person Transactions—Sponsor Earnout Letter and Lock-Up Letter” |
Terms of the offering
| The selling stockholders will determine when and how they will dispose of the shares of common stock and warrants registered under this prospectus for resale. |
| Shares outstanding prior to the offering |
As of March 1, 2018, we had 69,700,001 shares of common stock issued and outstanding. |
| Shares outstanding after the offering |
78,636,250 shares of common stock (assuming the exercise for cash of warrants to purchase 8,936,249 shares of common stock). |
| Use of proceeds |
We will not receive any of the proceeds from the sale of the warrants or shares of common stock by the selling stockholders except with respect to amounts received by us due to the exercise of the warrants. We expect to use the proceeds received from the exercise of the warrants, if any, for working capital and general corporate purposes. |
| Nasdaq ticker symbol |
Our common stock and warrants are listed on the Nasdaq Capital Market under the symbols “CVON” and “CVONW”, respectively. |
For additional information concerning the offering, see “Plan of Distribution” beginning on page 104.
4
Table of Contents
Investing in our securities involves a high degree of risk. You should consider carefully the risks and uncertainties described below, together with all of the other information in this prospectus, including our consolidated financial statements and related notes, before deciding whether to purchase any of our securities. If any of these risks actually occur, it could harm our business, financial condition, results of operations and cash flows and our prospects. In that event, the price of our securities could decline and you could lose part or all of your investment.
Risks Related to Our Business and Industry
Our results of operations and ability to grow could be negatively affected if we cannot adapt and expand our technology offerings and services in response to ongoing market changes.
The collaboration and technology solutions business and markets are characterized by rapid technological change, evolving industry standards, changing client preferences, and new product and service introductions. Our success depends on our ability to continue to develop and implement technology offerings and services that anticipate or timely respond to rapid and continuing changes in technology and industry developments and offerings by new technology providers to serve the evolving needs of our clients. Examples of areas of significant change in the industry include cloud, software-defined infrastructure, virtualization, security, mobility, data analytics, and Internet of Things, or IoT, the continued shift from maintenance to managed services and ultimately to cloud-based services, as-a-service solutions, security, and information technology automation. In addition, enterprises are continuing to shift from on-premise, hardware infrastructure to software-centric hosted solutions. Technological developments such as these may materially affect the cost and use of technology and services by our clients and could affect the nature of how our revenue is generated. These technologies, and others that may emerge, could reduce and, over time, replace some of our current business. In addition, clients may delay spending under existing contracts and engagements and may delay entering into new contracts while they evaluate new technologies. If we do not sufficiently invest in new technology, industry developments, and our personnel, or evolve and expand our business at sufficient speed and scale, or if we do not make the right strategic investments to respond to these developments and successfully drive innovation, our technology offerings and services, our results of operations, and our ability to develop and maintain a competitive advantage and to continue to grow could be negatively affected.
In addition, if we are unable to keep up with changes in technology and new hardware, software, and services offerings, for example, by providing the appropriate training to our account managers, sales technology specialists, engineers, and consultants to enable them to effectively sell and deliver such new offerings to clients, our business, results of operations, or financial condition could be adversely affected.
Our business depends on our technology partner relationships and the availability of their products.
We have relationships with over 100 technology partners, including Avaya, Cisco, Dell, IBM, Interactive Intelligence, and Microsoft. Our business depends on the sale and installation of a variety of hardware and software that we purchase for resale from technology partners, which include original equipment manufacturers, or OEMs, software publishers, and wholesale distributors. We are authorized by our technology partners to sell all or some of their technology offerings via direct marketing activities. Our authorization with each technology partner is subject to specific terms and conditions regarding but not limited to, sales channel restrictions, product return privileges, price protection policies, purchase discounts, and technology partner programs and funding, including purchase rebates, sales volume rebates, purchasing incentives, and cooperative advertising reimbursements. However, we do not have long-term contracts with many of our technology partners and many of these arrangements are terminable upon notice by either party. Material changes to the agreements with our technology partners, including changes to purchase discounts and rebate programs, or our failure to timely react to such changes, could have an adverse effect on our business, results of operations, or financial condition.
The priorities and objectives of our partners may differ from ours. As most of our relationships are non-exclusive, our partners are not prohibited from competing with us or forming closer or preferred
5
Table of Contents
arrangements with our competitors. From time to time, technology partners may terminate or limit our right to sell some or all of their technology offerings or change the terms and conditions or reduce or discontinue the incentives that they offer us. For example, there is no assurance that, as our technology partners continue to sell directly to customers and through resellers, they will not limit or curtail the availability of their products to solutions providers like us. Any such termination or limitation or the implementation of such changes could have a negative impact on our business, results of operations, or financial condition.
In addition, our success is dependent on our ability to develop relationships with and sell hardware, software, and services from new emerging vendors, including vendors that we have not historically represented in the marketplace. To the extent that a vendor’s offering that is highly in demand is not available to us to provide in one or more client channels, and there is not a competitive offering from another vendor that we are authorized to sell in such client channels, or we are unable to develop relationships with new technology providers or companies that we have not historically represented, our business, results of operations, or financial condition could be adversely impacted.
In addition, the termination of key technology partner relationships as a result of the sale, spin-off, combination, bankruptcy, or other similar circumstances of any of our technology partners and/or certain of their business units, including any such sale to or combination with a vendor with whom we do not currently have a commercial relationship or whose products we do not sell, could have an adverse impact on our business, results of operations, or financial condition.
We rely on a small number of key vendors for a significant portion of our technology offerings revenue.
Although we purchase from a diverse vendor base, in 2017, products manufactured by Avaya and Cisco represented 21% and 39%, respectively, of our technology offerings revenue. The loss of, or change in business relationship with, either of these or any other key technology partners, the diminished availability or quality of their products, or backlogs for their products leading to manufacturer allocation, could reduce the supply and increase the cost of products we sell and negatively impact our competitive position. In addition, we rely on one distributor that supplies a significant portion of our Avaya products and the termination of this distributor relationship could negatively impact our business.
Avaya, which was our largest vendor as a percentage of our technology offerings revenue in 2015 and 2016, filed for reorganization under Chapter 11 in January 2017, filed its preliminary plan of reorganization in April 2017 and had its Chapter 11 plan of reorganization approved by the Bankruptcy Court in November 2017. As a result of Avaya’s restructuring, new or existing clients may elect to delay purchasing decisions with respect to Avaya technology offerings or may choose to replace existing Avaya technology offerings with the technology offerings of other vendors. Although we have partner relationships with a diverse vendor base, new or existing clients may elect to purchase such alternative technology offerings from a provider other than us or such alternative technology offerings may have lower margins. Delays in customer purchasing decisions, or an election by our clients to purchase alternative technology offerings from us or from other providers, could result in lower revenues and gross profits or margins or otherwise have an adverse effect on our business, although we cannot estimate the impact at this time.
If we are unable to expand or renew sales to existing clients, or attract new clients, our growth could be slower than we expect and our business may be harmed.
Our future growth depends upon expanding sales and renewals of our technology offerings and services with existing clients. Our clients may not purchase our technology offerings and services, or our clients may reduce their purchasing volumes, if we do not demonstrate the value proposition for their investment, and we may not be able to replace existing clients with new clients. In addition, our clients may not renew their contracts with us on the same terms, or at all, because of dissatisfaction with our service. If our clients do not renew their contracts, our revenue may grow more slowly than expected, may not grow at all, or may decline. Additionally, increasing incremental sales to our current client base may require increasingly sophisticated and costly sales efforts that are targeted at senior management. We plan to continue expanding our sales efforts but we may be
6
Table of Contents
unable to hire qualified sales personnel, may be unable to successfully train those sales personnel that we are able to hire, and sales personnel may not become fully productive on the timelines that we have projected, or at all. Additionally, although we dedicate significant resources to sales and marketing programs, these sales and marketing programs may not have the desired effect and may not expand sales. We cannot assure you that our efforts will increase sales to existing clients or additional revenue. If our efforts to upsell to our clients are not successful, our future growth may be limited.
Our ability to achieve significant growth in revenue in the future will also depend upon our ability to attract new clients. This may be particularly challenging where an organization has already invested substantial personnel and financial resources to integrate competing technology offerings and services into its business, as such organization may be reluctant or unwilling to invest in new technology offerings and services. If we fail to attract new clients and maintain and expand those client relationships, our revenue may grow more slowly than expected and our business may be harmed.
Demand for our technology offerings and services could be adversely affected by volatile, negative, or uncertain economic conditions and the effects of these conditions on our clients’ businesses.
Our revenue and profitability depend on the demand for our technology offerings and services, which could be negatively affected by numerous factors, many of which are beyond our control. Volatile, negative, or uncertain economic conditions affect our clients’ businesses and the markets we serve. Such economic conditions in our markets have undermined, and could in the future undermine, business confidence in our markets and cause our clients to reduce or defer their spending on new technology offerings and services, or may result in clients reducing, delaying or eliminating spending under existing contracts with us, which would negatively affect our business. Growth in the markets we serve could be at a slow rate, or could stagnate or contract, in each case for an extended period of time. Ongoing economic volatility and uncertainty and changing demand patterns affect our business in a number of other ways, including making it more difficult to accurately forecast client demand and effectively build our revenue and resource plans.
Economic volatility and uncertainty is particularly challenging because it may take some time for the effects and changes in demand patterns resulting from these and other factors to manifest themselves in our business and results of operations. Changing demand patterns from economic volatility and uncertainty could have a significant negative impact on our business, results of operations, or financial condition.
Substantial competition could reduce our market share and significantly harm our financial performance.
Our current competition includes:
| • | in-house IT departments; |
| • | global service providers and integrators; |
| • | local and regional providers; |
| • | resellers; and |
| • | equipment manufacturers. |
We expect the competitive landscape in which we compete to continue to change as new technologies are developed. While innovation can help our business as it creates new offerings for us to sell and provide complementary services, it can also disrupt our business model and create new and stronger competitors. For instance, while cloud-based solutions present an opportunity for us, cloud-based solutions and technologies that deliver technology solutions as a service could increase the amount of sales directly to clients rather than through solutions providers like us, or could reduce the amount of hardware we sell, leading to a reduction in our technology offerings revenue and/or profitability. In addition, some of our hardware and software technology partners sell, and could intensify their efforts to sell, their products directly to our clients. Moreover, traditional
7
Table of Contents
OEMs have increased their services capabilities through mergers and acquisitions with service providers, which could potentially increase competition in the market to provide comprehensive technology solutions to clients. If any of these trends becomes more prevalent, it could adversely affect our business, results of operations, or financial condition.
We focus on offering a high level of service to gain new clients and retain existing clients. To the extent we face increased competition to gain and retain clients, we may be required to reduce prices, increase advertising expenditures, or take other actions that could adversely affect our business, results of operations, or financial condition. Additionally, some of our competitors may reduce their prices in an attempt to stimulate sales, which may require us to reduce prices. This would require us to sell a greater number of products and services to achieve the same level of revenue and gross profit. If such a reduction in prices occurs and we are unable to attract new clients and sell increased quantities of products and services, our sales growth and profitability could be adversely affected.
Our future results will depend on our ability to continue to focus our resources and manage costs effectively.
We are continually implementing productivity measures and focusing on measures intended to further improve cost efficiency. We may be unable to realize all expected cost savings in connection with these efforts within the expected time frame, or at all, and we may incur additional and/or unexpected costs to realize them. Further, we may not be able to sustain any achieved savings in the future. Future results will depend on the success of these efforts.
If we are unable to control costs, we may incur losses, which could decrease our operating margins and significantly reduce or eliminate our profits. Our future profitability will depend on our ability to manage costs or increase productivity. An inability to effectively manage costs could adversely impact our business, results of operations, or financial condition.
Our profitability could suffer if we are not able to manage large and complex projects and complete fixed-price, fixed-timeframe contracts on budget and on time.
Our profitability and operating results are dependent on the scale of our projects and the prices we are able to charge for our technology offerings and services. We perform a significant portion of our work through fixed-price contracts, in which we assume full control of the project team and manage all facets of execution. As a significant portion of our projects are on a fixed-price model, we may be unable to accurately estimate the appropriate project price and successfully manage such projects. Although we use specified technical processes and our past experience to reduce the risks associated with estimating, planning, and performing fixed-price and fixed-timeframe projects, we face the risk of cost overruns, completion delays, and wage inflation in connection with these projects. If we fail to accurately estimate the resources or time required for a project or future rates of wage inflation, or if we fail to perform contractual obligations within the contractual timeframe, our profitability could suffer.
The challenges of managing larger and more complex projects include:
| • | maintaining high-quality control and process execution standards; |
| • | maintaining planned resource utilization rates on a consistent basis; |
| • | maintaining productivity levels and implementing necessary process improvements; |
| • | controlling project costs; |
| • | maintaining close client contact and high levels of client satisfaction; |
| • | recruiting and retaining sufficient numbers of skilled IT professionals; and |
| • | maintaining effective client relationships. |
8
Table of Contents
In addition, large and complex projects may involve multiple engagements or stages, and there is a risk that a client may choose not to retain us for additional stages or may cancel or delay additional planned engagements. Such cancellations or delays may make it difficult to plan our project resource requirements, and may result in lower profitability levels than we anticipated upon commencing engagements.
Our investments in new services and technologies may not be successful.
We continue to invest in new services and technologies, including cloud, software-defined infrastructure, virtualization, security, mobility, data analytics, and IoT. The complexity of these solutions, our learning curve in developing and supporting them, and significant competition in the markets for these solutions could make it difficult for us to market and implement these solutions successfully. Additionally, there is a risk that our clients may not adopt these solutions widely, which would prevent us from realizing expected returns on these investments. Even if these solutions are successful in the market, they still rely on third-party hardware and software and our ability to meet stringent service levels. If we are unable to deploy these solutions successfully or profitably, it could adversely impact our business, results of operations, or financial condition.
If we lose any of our key personnel, or are unable to attract and retain the talent required for our business, our business could be disrupted and our financial performance could suffer.
Our success is heavily dependent upon our ability to attract, develop, engage, and retain key personnel to manage and grow our business, including our key executive, management, sales, services, and technical personnel.
Our future success will depend to a significant extent on the efforts of our executive officers: John A. McKenna, Jr., our President, Chief Executive Officer and Chairman of the Board; John F. Lyons, our President, Field Organization; Paul K. Maier, our President, Services Organization; and Jeffrey E. Nachbor, our Chief Financial Officer, as well as the continued service and support of other key employees. Our future success also will depend on our ability to attract and retain highly skilled technology specialists, engineers, and consultants, for whom the market is extremely competitive. All of our officers and key employees are at-will employees, meaning that they can terminate their employment with us at any time. Further, we do not maintain “key man” life insurance policies for any of our officers or key employees.
Our inability to attract, develop, and retain key personnel could have an adverse effect on our relationships with our technology partners and clients and adversely affect our ability to expand our offerings of technology offerings and services. Moreover, our inability to train our sales, services, and technical personnel effectively to meet the rapidly changing technology needs of our clients could cause a decrease in the overall quality and efficiency of such personnel. Such consequences could adversely affect our business, results of operations, or financial condition.
Our ability to attract and retain business and personnel may depend on our reputation in the marketplace.
We believe our brand name and our reputation in the marketplace are important corporate assets that help distinguish our technology offerings and services from those of competitors and also contribute to our ability to recruit and retain talented personnel, in particular our engineers and consulting professionals. However, our corporate reputation is potentially susceptible to material damage by events such as disputes with clients, cybersecurity breaches, service outages, internal control deficiencies, delivery failures, or compliance violations. Similarly, our reputation could be damaged by actions or statements of current or former clients, directors, employees, competitors, vendors, partners, our joint ventures or joint venture partners, adversaries in legal proceedings, legislators, or government regulators, as well as members of the investment community or the media. There is a risk that negative information about us, even if based on rumor or misunderstanding, could adversely affect our business. Damage to our reputation could be difficult, expensive and time-consuming to repair, could make potential or existing clients reluctant to select us for new engagements, resulting in a loss of business, and could adversely affect our recruitment and retention efforts. Damage to our reputation could also reduce the value and effectiveness of our brand name and could reduce investor confidence in us, adversely affecting our share price.
9
Table of Contents
We have experienced rapid internal growth as well as growth through acquisitions in recent periods. If we fail to manage our growth effectively, or our business does not grow as expected, our operating results may suffer.
Our headcount and operations have grown substantially. We had approximately 2,185 employees as of December 31, 2017, as compared with approximately 1,349 employees as of December 31, 2015. This growth has placed, and will continue to place, a significant strain on our operational, financial, and management infrastructure. We anticipate further increases in headcount will be required to support increases in our technology offerings and continued expansion. To manage this growth effectively, we must continue to improve our operational, financial, and management systems and controls by, among other things:
| • | effectively attracting, training, and integrating a large number of new employees, particularly technical personnel and members of our management and sales teams; |
| • | further improving our key business systems, processes, and information technology infrastructure to support our business needs; |
| • | enhancing our information and communication systems to ensure that our employees are well-coordinated and can effectively communicate with each other and our clients; and |
| • | improving our internal control over financial reporting and disclosure controls and procedures to ensure timely and accurate reporting of our operational and financial results. |
If we fail to manage our expansion or implement our new systems, or if we fail to implement improvements or maintain effective internal controls and procedures, our costs and expenses may increase more than expected and we may not expand our client base, increase renewal rates, enhance our existing applications, develop new applications, satisfy our clients, respond to competitive pressures, or otherwise execute our business plan. If we are unable to manage our growth, our operating results likely will be harmed.
Future acquisitions could disrupt our business and may divert management’s attention, and if unsuccessful, harm our business.
We may choose to expand by making additional acquisitions that could be material to our business. We have in the past made several acquisitions of complementary businesses, including Arrow Systems Integration, Inc., in 2018, RGTS, Strategic Products and Services, Annese & Associates, Inc. and AOS in 2017 and SIGMAnet, MSN Communications, and Sunturn in 2015. Acquisitions involve many risks, including the following:
| • | an acquisition may negatively affect our results of operations and financial condition because it may require us to incur charges or assume substantial debt or other liabilities, may cause adverse tax consequences or unfavorable accounting treatment, may expose us to claims and disputes by third parties, including intellectual property claims and disputes, or may not generate sufficient financial return to offset additional costs and expenses related to the acquisition; |
| • | we may encounter difficulties or unforeseen expenditures in integrating the business, technologies, products, personnel, or operations of any company that we acquire, particularly if key personnel of the acquired company decide not to work for us; |
| • | an acquisition may disrupt our ongoing business, divert resources, increase our expenses, or distract our management; |
| • | an acquisition may result in a delay or reduction of client purchases for both us and the company we acquired due to client uncertainty about continuity and effectiveness of service from either company; |
| • | we may encounter difficulties in, or may be unable to, successfully sell any acquired technology offerings or services; |
10
Table of Contents
| • | an acquisition may involve the entry into geographic or business markets in which we have little or no prior experience or where competitors have stronger market positions; |
| • | the challenges inherent in effectively managing an increased number of employees in diverse locations; |
| • | the potential strain on our financial and managerial controls and reporting systems and procedures; |
| • | the potential known and unknown liabilities associated with an acquired company; |
| • | our use of cash to pay for acquisitions would limit other potential uses for our cash; |
| • | if we incur additional debt to fund such acquisitions, such debt may subject us to additional material restrictions on our ability to conduct our business as well as additional financial maintenance covenants; |
| • | the risk of impairment charges related to potential write-downs of acquired assets or goodwill in future acquisitions; |
| • | to the extent that we issue a significant amount of equity or equity-linked securities in connection with future acquisitions, existing stockholders may be diluted and earnings per share may decrease; and |
| • | managing the varying intellectual property protection strategies and other activities of an acquired company. |
We may not succeed in addressing these or other risks or any other problems encountered in connection with the integration of any acquired business. The inability to integrate successfully the business, technologies, products, personnel, or operations of any acquired business, or any significant delay in achieving integration, could harm our business, results of operations, or financial condition.
We may not be able to recognize revenue in the period in which our services are performed, which may cause our margins to fluctuate.
Our services are performed under both time-and-material and fixed-price contract arrangements. All revenue is recognized pursuant to applicable accounting standards. We recognize revenue from professional services, which includes the design, configuration, installation, and integration of business communication and data systems, as the services are performed and all obligations have been substantially met. Our failure to meet all the obligations, or otherwise meet a client’s expectations, may result in our having to record the cost related to the performance of services in the period that services were rendered, but delay the timing of revenue recognition to a future period in which all obligations have been met.
We may experience quarterly fluctuations in our operating results due to a number of factors, which makes our future results difficult to predict and could cause our operating results to fall below expectations.
Our quarterly operating results have fluctuated in the past and we expect them to fluctuate in the future due to a variety of factors, many of which are outside of our control. As a result, our past results may not be indicative of our future performance, and comparing our operating results on a period-to-period basis may not be meaningful. In addition to the other risks described herein, factors that may affect our quarterly operating results include:
| • | changes in spending on collaboration and technology offerings and services by our current or prospective clients; |
| • | pricing our technology offerings and services effectively so that we are able to attract and retain clients without compromising our operating results; |
| • | attracting new clients and increasing our existing clients’ use of our technology offerings and services; |
| • | the mix between wholesale and retail maintenance new contracts and renewals; |
11
Table of Contents
| • | client renewal rates and the amounts for which agreements are renewed; |
| • | seasonality and its effect on client demand; |
| • | awareness of our brand; |
| • | changes in the competitive dynamics of our market, including consolidation among competitors or clients and the introduction of new technologies and technology enhancements; |
| • | changes to the commission plans, quotas, and other compensation-related metrics for our sales representatives; |
| • | the amount and timing of payment for operating expenses, particularly sales and marketing expense; |
| • | our ability to manage our existing business and future growth, domestically and internationally; |
| • | unforeseen costs and expenses related to the expansion of our business, operations, and infrastructure, including disruptions in our hosting network infrastructure and privacy and data security; and |
| • | general economic and political conditions in our domestic and international markets. |
We may not be able to accurately forecast the amount and mix of future technology offerings and services, size or duration of contracts, revenue, and expenses and, as a result, our operating results may fall below our estimates.
We could be held liable for damages or our reputation could suffer from security breaches or disclosure of confidential information or personal data.
We are dependent on IT networks and systems to process, transmit, and securely store electronic information and to communicate among our locations and with our clients. Through our cloud technology offerings, we process, transmit, and store electronic information of our clients. Security breaches of this infrastructure could lead to shutdowns or disruptions of our systems and potential loss or unauthorized disclosure of confidential information or data, including personal data. In addition, many of our engagements involve projects that are critical to the operations of our clients’ businesses. The theft and/or unauthorized use or publication of our, or our clients’, confidential information or other proprietary business information as a result of such an incident could adversely affect our competitive position and reduce marketplace acceptance of our services. Any failure in the networks or computer systems used by us or our clients could result in a claim for substantial damages against us and significant reputational harm, regardless of our responsibility for the failure.
In addition, we often have access to or are required to manage, utilize, collect, and store sensitive or confidential client or employee data, including personal data. As a result, we are subject to numerous U.S. and non-U.S. laws and regulations designed to protect this information, such as the European Union Directive on Data Protection and various U.S. federal and state laws governing the protection of personal data. If any person, including any of our employees, negligently disregards or intentionally breaches controls or procedures with which we are responsible for complying with respect to such data, or otherwise mismanages or misappropriates that data, or if unauthorized access to or disclosure of data in our possession or control occurs, we could be subject to liability and penalties in connection with any violation of applicable privacy laws and/or criminal prosecution, as well as significant liability to our clients or our clients’ customers for breaching contractual confidentiality and security provisions or privacy laws. These risks will increase as we continue to grow our cloud-based offerings and services and store and process increasingly large amounts of our clients’ confidential information and data and host or manage parts of our clients’ businesses, especially in industries involving particularly sensitive data such as the financial services industry and the healthcare industry. The loss or unauthorized disclosure of sensitive or confidential client or employee data, including personal data, whether through breach of computer systems, systems failure, employee negligence, fraud or misappropriation, or otherwise, could damage our reputation and cause us to lose clients. Similarly, unauthorized access to or through
12
Table of Contents
our information systems and networks or those we develop or manage for our clients, whether by our employees or third parties, could result in negative publicity, legal liability, and damage to our reputation, which could in turn harm our business, results of operations, or financial condition.
If we cause disruptions in our clients’ businesses or provide inadequate service, our clients may have claims for substantial damages against us, which could cause us to lose clients, have a negative effect on our corporate reputation, and adversely affect our results of operations.
If we make errors in the course of delivering services to our clients or fail to consistently meet our service level obligations or other service requirements of our clients, these errors or failures could disrupt our client’s business, which could result in a reduction in our revenue or a claim for substantial damages against us. In addition, a failure or inability by us to meet a contractual requirement could subject us to penalties, cause us to lose clients or damage our brand or corporate reputation, and limit our ability to attract new business.
The services we provide are often critical to our clients’ businesses. Certain of our client contracts require us to comply with security obligations including maintaining network security and backup data, ensuring our network is virus-free, maintaining business continuity planning procedures, and verifying the integrity of employees that work with our clients by conducting background checks. Any failure in a client’s system, failure of our data center, cloud or other offerings, or breach of security relating to the services we provide to the client could damage our reputation or result in a claim for substantial damages against us. Any significant failure of our equipment or systems, or any major disruption to basic infrastructure in the locations in which we operate, such as power and telecommunications, could impede our ability to provide services to our clients, have a negative impact on our reputation, cause us to lose clients, and adversely affect our results of operations.
Under our client contracts, our liability for breach of our obligations is in some cases limited pursuant to the terms of the contract. Such limitations may be unenforceable or otherwise may not protect us from liability for damages. In addition, certain liabilities, such as claims of third parties for which we may be required to indemnify our clients, are generally not limited under our contracts. The successful assertion of one or more large claims against us in amounts greater than those covered by our current insurance policies could harm our business, results of operations, or financial condition. Even if such assertions against us are unsuccessful, we may incur reputational harm and substantial legal fees.
The length and unpredictability of the sales cycle for our technology offerings and services could delay new sales and cause our revenue and cash flows for any given quarter to fail to meet our projections or market expectations.
The sales cycle between our initial contact with a potential client and the signing of a contract to provide technology offerings and services varies. As a result of the variability and length of the sales cycle, we have a limited ability to forecast the timing of sales. A delay in or failure to complete transactions could harm our business and financial results, and could cause our financial results to vary significantly from quarter to quarter. Our sales cycle varies widely, reflecting differences in our potential clients’ decision-making processes, procurement requirements, and budget cycles, and is subject to significant risks over which we have little or no control, including:
| • | our clients’ budgetary constraints and priorities; |
| • | the timing of our clients’ budget cycles; and |
| • | the length and timing of clients’ approval processes. |
Reliance on shipments at the end of the quarter could cause our revenue for the applicable period to fall below expected levels. Our profitability depends, in part, on the volume of technology offerings and services sold, and we may be unable to achieve increases in our profit margins in the future.
As a result of client purchasing patterns and the efforts of our client engagement team to meet or exceed their performance objectives, we have historically generated a substantial portion of revenue during the last few
13
Table of Contents
weeks of each quarter. If expected revenue at the end of any quarter is delayed for any reason, including the failure of anticipated purchase orders to materialize, our inability to ship and demonstrate clients’ receipt of products prior to quarter-end to fulfill purchase orders received near the end of the quarter, our failure to manage inventory to meet demand, our inability to release new products on schedule, or any failure of our systems related to order review and processing, our revenue for that quarter could fall below our expectations, which could adversely impact our business, results of operations, or financial condition.
Seasonality may cause fluctuations in our revenue and profitability.
We believe there are significant seasonal factors that cause us to record higher revenue in some quarters compared to others. We believe this variability is largely due to our clients’ and technology partners’ fiscal year ends, as well as budgetary and spending patterns of our clients. For example, we have historically generated a higher portion of our sales in the second half of each year, at which point our cost of revenue and commission expense increases relative to any increase in revenue. The increased cost of revenue and commission expense, and other impacts of seasonality, may affect profitability in a given quarter. Our growth rate may have made seasonal fluctuations more difficult to detect. If our growth rate slows over time, seasonal or cyclical variations in our operations may become more pronounced, and our business, results of operations, or financial position may be adversely affected.
Our work with government clients exposes us to additional risks inherent in the government contracting environment.
We provide IT services to various government agencies, including federal, state, and local government entities. For 2016 and 2017, approximately 7% and 10%, respectively, of our total revenue was derived from sales to federal, state, and local governments. While our sales to public sector clients are diversified across various agencies and departments, changes in law, regulation, or the political climate, or an across-the-board change in government spending policies, including budget cuts at the federal level, could result in our public sector clients reducing their purchases and terminating their service contracts, which could adversely impact our business, results of operations, or financial condition.
Furthermore, we derive a substantial portion of our government contracts revenue from contracts awarded through competitive procurement processes, which can impose substantial costs upon us to prepare for and participate in competitions. Moreover, there is no assurance that our proposal will be selected for any future opportunity and even where we are awarded a contract, the award may be subject to protest by competitors, which may require the contracting agency or department to suspend our performance pending the outcome of the protest.
In addition, government contracts often contain additional audit rights, termination for convenience provisions, compliance, and disclosure obligations, and are subject to heightened reputational and contractual risks compared to contracts with commercial clients, including the risk of False Claims Act prosecutions and/or suspensions or debarment proceedings. The additional obligations and risks could affect not only our business with the particular government entities involved, but also our business with other entities of the same or other governmental bodies or with certain commercial clients, and could adversely impact our business, results of operations, or financial condition.
Our technology offerings and services could infringe upon the intellectual property rights of others or we might lose our ability to utilize the intellectual property of others.
We cannot be sure that our brand, technology offerings, and services, including, for example, the software solutions of others that we offer to our clients, do not infringe on the intellectual property rights of third parties, and these third parties could claim that we or our clients are infringing upon their intellectual property rights. These claims could harm our reputation, cause us to incur substantial costs or prevent us from offering some services or solutions in the future, or require us to rebrand. Any related proceedings could require us to expend significant resources over an extended period of time. In most of our contracts, we agree to indemnify our clients
14
Table of Contents
for expenses and liabilities resulting from claimed infringements of the intellectual property rights of third parties. In some instances, the amount of these indemnities could be greater than the revenue we receive from the client. Any claims or litigation in this area, regardless of merit, could be time-consuming and costly, damage our reputation, and/or require us to incur additional costs to obtain the right to continue to offer a service or solution to our clients. If we cannot secure this right at all or on reasonable terms, or, alternatively, substitute a non-infringing technology, our business, results of operations, or financial condition could be harmed. Similarly, if we are unsuccessful in defending a trademark claim, we could be forced to re-brand, which could harm our business, results of operations, or financial condition. Additionally, in recent years, individuals and firms have purchased intellectual property assets where their sole or primary purpose is to assert claims of infringement against technology providers and clients that use such technology. Any such action naming us or our clients could be costly to defend or lead to an expensive settlement or judgment against us. Moreover, such an action could result in an injunction being ordered against our client or our own services or operations, causing further damages.
If we are unable to protect our intellectual property rights from unauthorized use or infringement by third parties, our business could be adversely affected.
Our success depends, in part, upon our ability to protect our proprietary methodologies and other intellectual property. Existing laws offer only limited protection of our intellectual property rights, and the protection in some countries in which we operate or may operate in the future may be very limited. We rely upon a combination of confidentiality policies, nondisclosure and other contractual arrangements, and trade secret, copyright, and trademark laws to protect our intellectual property rights. These laws are subject to change at any time and could further limit our ability to protect our intellectual property. There is uncertainty concerning the scope of available intellectual property protection for software and business methods, which are fields in which we rely on intellectual property laws to protect our rights. The validity and enforceability of any intellectual property right we obtain may be challenged by others and, to the extent we have enforceable intellectual property rights, those intellectual property rights may not prevent competitors from reverse engineering our proprietary information or independently developing technology offerings and services similar to or duplicative of ours. Further, the steps we take in this regard might not be adequate to prevent or deter infringement or other misappropriation of our intellectual property by competitors, former employees or other third parties, and we might not be able to detect unauthorized use of, or take appropriate and timely steps to enforce, our intellectual property rights. Enforcing our rights might also require considerable time, money, and oversight, and we may not be successful in enforcing our rights.
If we are unable to collect our receivables from, or bill our unbilled services to, our clients, our business, results of operations, or financial condition could be adversely affected.
Our business depends on our ability to successfully obtain payment from our clients of the amounts they owe us for technology offerings sold or services performed. We typically evaluate the financial condition of our clients and usually bill and collect on relatively short cycles. We maintain allowances against receivables and unbilled services. Actual losses on client balances could differ from those that we currently anticipate and, as a result, we might need to adjust our allowances. There is no guarantee that we will accurately assess the creditworthiness of our clients. Macroeconomic conditions could also result in financial difficulties for our clients, including limited access to the credit markets, insolvency, or bankruptcy, and, as a result, could cause clients to delay payments to us, request modifications to their payment arrangements that could increase our receivables balance, or default on their payment obligations to us. Timely collection of client balances also depends on our ability to complete our contractual commitments and bill and collect our contracted revenue. If we are unable to meet our contractual requirements, we might experience delays in collection of and/or be unable to collect our client balances, and if this occurs, our business, results of operations, or financial condition could be adversely affected. In addition, if we experience an increase in the time to bill and collect for our services, our cash flows could be adversely affected.
15
Table of Contents
Increased costs of labor and employee health and welfare benefits may adversely impact our results of operations.
Given our large number of employees, labor-related costs represent a significant portion of our expenses. Salaries, wages, benefits, commissions, and other labor compensation costs excluding bonus and payroll tax for our full-time employees amounted to $133 million in 2017, which represented approximately 62% of our selling, general and administrative expenses and approximately 10% of our cost of revenue. An increase in labor costs, for example, as a result of increased competition for skilled labor, or employee benefit costs, such as health care costs or otherwise, could adversely impact our business, results of operations, or financial condition.
We rely on third-party companies to perform certain of our obligations to clients, which could impact our business if not performed.
We deliver and manage mission-critical software, systems and network solutions for our clients. We also offer certain services, such as implementation, installation, and deployment services, to our clients through various third-party providers who are engaged to perform these services on our behalf. We are also required, as a component of some of our contracts with our OEM partners, to utilize their engineers as part of our solutions. In addition, we support approximately 150 multinational clients through our Aura and Unified Comms alliances, offering access to more than 50 IT service providers in approximately 60 countries and enabling us to offer our managed services internationally. If we or our third-party services providers, including our alliance service providers, fail to provide high-quality services to our clients, or if such services result in a disruption of our clients’ businesses, we could be subject to legal claims, proceedings, and liability.
The interruption of the flow of products from suppliers could disrupt our supply chain.
A significant portion of the products we sell are manufactured or purchased by our technology partners outside of the United States, primarily in Asia. Political, social, or economic instability in Asia, or in other regions in which our technology partners purchase or manufacture the products we sell, could cause disruptions in trade, including exports to the United States. Other events that could also cause disruptions to our supply chain include:
| • | the imposition of additional trade law provisions or regulations or changes to existing trade laws provisions or regulations; |
| • | the imposition of additional duties, tariffs, and other charges on imports and exports; |
| • | foreign currency fluctuations; |
| • | natural disasters or other adverse occurrences at, or affecting, any of our suppliers’ facilities; |
| • | restrictions on the transfer of funds; |
| • | the financial instability or bankruptcy of manufacturers; and |
| • | significant labor disputes, such as strikes. |
We cannot predict whether the countries in which the products we sell are purchased or manufactured, or may be purchased or manufactured in the future, will be subject to new or additional trade restrictions or sanctions imposed by the U.S. or foreign governments, including the likelihood, type or effect of any such restrictions. Trade restrictions, including new or increased tariffs or quotas, embargoes, sanctions, safeguards, and customs restrictions against the products we sell, as well as foreign labor strikes and work stoppages or boycotts, could increase the cost or reduce the supply of product available to us and adversely affect our business, results of operations, or financial condition. In addition, our exports are subject to regulations and noncompliance with these requirements could have a negative effect on our business, results of operations, or financial condition.
16
Table of Contents
Our global operations are subject to complex risks, some of which might be beyond our control.
Our clients have operations across South America, Europe, Australia, and Asia. Although international revenue currently represents a small portion of our business, our revenue from clients outside of the United States may expand in the future as we expand our international presence. As a result, we may be subject to risks inherently associated with international operations, including risks associated with foreign currency exchange rate fluctuations, difficulties in enforcing intellectual property and/or contractual rights, the burdens of complying with a wide variety of foreign laws and regulations, potentially adverse tax consequences, tariffs, quotas, and other barriers, potential difficulties in collecting accounts receivable, international hostilities, terrorism, and natural disasters. Expansion of international operations also increases the likelihood of potential or actual violations of domestic and international anticorruption laws, such as the Foreign Corrupt Practices Act, or of U.S. and international export control and sanctions regulations. We may also face difficulties integrating any new facilities in different countries into our existing operations, as well as integrating employees that we hire in different countries into our existing corporate culture. If we are unable to manage the risks of our global operations, our business, results of operations, or financial condition could be adversely affected.
Changes in accounting rules could adversely affect our future financial results.
We prepare our financial statements in conformity with generally accepted accounting principles, or U.S. GAAP. These accounting principles are subject to interpretation by the Financial Accounting Standards Board, the SEC, the American Institute of Certified Public Accountants, and various other bodies formed to interpret and create appropriate accounting policies. Technology offerings and services, and the manner in which they are bundled, are technologically complex and the characterization of these technology offerings and services requires judgment to apply revenue recognition policies. Any mischaracterization of these technology offerings and services could result in misapplication of revenue recognition policies. Future periodic assessments required by current or new accounting standards may result in non-cash changes and/or changes in presentation or disclosure. In addition, any change in accounting standards may influence our clients’ decision to purchase from us or to finance transactions with us, which could adversely impact our business, results of operations, or financial condition.
Risks Related to Our Indebtedness
We face risks related to our substantial indebtedness.
As of December 31, 2017, we had total outstanding debt of $582 million. Our substantial leverage could adversely affect our ability to raise additional capital to fund our operations, limit our ability to react to changes in the economy or our industry, expose us to interest rate risk associated with our variable rate debt, and prevent us from meeting our obligations under our credit facilities. Substantially all of our assets are secured by our credit facilities. Our substantial indebtedness could have important consequences to us, including:
| • | making it more difficult for us to satisfy our obligations with respect to our debt, and any failure to comply with the obligations under our debt instruments, including restrictive covenants, could result in an event of default under the agreements governing our indebtedness, increasing our vulnerability to general economic and industry conditions; |
| • | reducing the benefits we expect to receive from our recent and any future acquisition transactions; |
| • | requiring a substantial portion of our cash flow from operations to be dedicated to the payment of principal and interest on our debt, thereby reducing our ability to use our cash flow to fund our operations, capital expenditures, selling and marketing efforts, product development, future business opportunities, and other purposes; |
| • | exposing us to the risk of increased interest rates as substantially all of our borrowings are at variable rates; |
17
Table of Contents
| • | restricting us from making strategic acquisitions and from pursuing certain business opportunities; |
| • | limiting our ability to obtain additional financing for working capital, capital expenditures, product development, debt service requirements, acquisitions, and general corporate or other purposes; and |
| • | limiting our flexibility and ability to plan for, or adjust to, changing market conditions and placing us at a competitive disadvantage compared to our competitors who may be less highly leveraged. |
The occurrence of any one of these events could have an adverse effect on our business, results of operations, financial condition, and ability to satisfy our obligations under our indebtedness.
Despite our high indebtedness level, we and our subsidiaries may still be able to incur significant additional amounts of debt, which could further exacerbate the risks associated with our substantial indebtedness.
We and our subsidiaries may be able to incur substantial additional indebtedness in the future. Although the agreements governing our indebtedness contain restrictions on the incurrence of additional indebtedness, these restrictions are subject to a number of significant qualifications and exceptions and, under certain circumstances, the amount of indebtedness that could be incurred in compliance with these restrictions could be substantial.
Our debt agreements impose significant operating and financial restrictions on us and our subsidiaries that may prevent us from pursuing certain business opportunities and restrict our ability to operate our business.
The credit agreements governing our credit facilities contain covenants that restrict us and our subsidiaries’ ability to take various actions, such as:
| • | incur additional indebtedness and make guarantees; |
| • | create liens on assets; |
| • | engage in mergers or consolidations; |
| • | sell assets, including sale and leaseback transactions; |
| • | make fundamental changes; |
| • | pay dividends and distributions or repurchase our capital stock; |
| • | make investments, loans and advances, including acquisitions; |
| • | engage in certain transactions with affiliates; |
| • | make changes in the nature of our business and organizational documents; and |
| • | make prepayments of junior debt. |
The restrictions in the credit agreements governing our credit facilities also limit our ability to plan for or react to market conditions, meet capital needs, or otherwise restrict our activities or business plans and adversely affect our ability to finance our operations, enter into acquisitions or to engage in other business activities that could be in our interest.
To service our indebtedness and other cash needs, we require a significant amount of cash. Our ability to generate cash depends on many factors beyond our control.
Our ability to satisfy our debt obligations and to fund any planned capital expenditures, dividends, and other cash needs will depend in part upon the future financial and operating performance of our subsidiaries and upon our ability to renew or refinance borrowings. We cannot assure you that our business will generate cash flow from operations, or that we will be able to draw under our revolving credit facilities or otherwise, in an amount
18
Table of Contents
sufficient to fund our liquidity needs, including the payment of principal and interest on our indebtedness. Prevailing economic conditions and financial, business, competitive, legislative, regulatory, and other factors, many of which are beyond our control, will affect our ability to make these payments.
If we are unable to make payments, refinance our debt or obtain new financing under these circumstances, we may consider other options, including:
| • | sales of assets; |
| • | sales of equity; |
| • | reduction or delay of capital expenditures, strategic acquisitions, investments, and alliances; or |
| • | negotiations with our lenders to restructure the applicable debt. |
These alternative measures may not be successful and may not permit us to meet our scheduled debt service obligations. Our ability to restructure or refinance our debt will depend on the condition of the capital markets and our financial condition at such time. Any refinancing of our debt could be at higher interest rates and may require us to comply with more onerous covenants, which could further restrict our business operations. In addition, the terms of the credit agreements governing the credit facilities may restrict us from adopting some of these alternatives. In the absence of sufficient cash flow from operating results and other resources, we could face substantial liquidity problems and could be required to dispose of material assets or operations to meet our debt service and other obligations. We may not be able to consummate those dispositions for fair market value, or at all. Furthermore, any proceeds that we could realize from any such dispositions may not be adequate to meet our debt service obligations then due. Our inability to generate sufficient cash flow to satisfy our debt obligations, or to refinance our indebtedness on commercially reasonable terms or at all, could adversely impact our business, results of operation, and financial condition.
Any decline in the ratings of our corporate credit could adversely affect our ability to access capital.
Any decline in the ratings of our corporate credit or any indications from the rating agencies that their ratings on our corporate credit are under surveillance or review with possible negative implications could adversely impact our ability to access capital.
We are subject to fluctuations in interest rates.
Borrowings under our credit facilities are subject to variable rates of interest and expose us to interest rate risk. For example, assuming the revolving portion of our credit facilities is fully drawn along with the outstanding term loan balance as of December 31, 2017, on a pro forma basis, each 0.5% change in assumed blended interest rates would result in an approximately $2.9 million change in annual interest expense on indebtedness. At present, we do not have any existing interest rate swap agreements, which involve the exchange of floating for fixed rate interest payments to reduce interest rate volatility. However, we may decide to enter into such swaps in the future. If we do, we may not maintain interest rate swaps with respect to all of our variable rate indebtedness and any swaps we enter into may not fully mitigate our interest rate risk, may prove disadvantageous, or may create additional risks.
Our only significant asset is ownership of our subsidiaries and such ownership may not be sufficient to pay dividends or make distributions or loans to enable us to pay any dividends on our Common Stock.
We have no direct operations and no significant assets other than the ownership of our subsidiaries. We will depend on our subsidiaries for distributions, loans and other payments to generate the funds necessary to meet our financial obligations, including our expenses as a publicly traded company, and to pay any dividends with respect to our common stock. In addition, there are legal and contractual restrictions in agreements governing current and future indebtedness of our subsidiaries, as well as the financial condition and operating requirements of our subsidiaries. The earnings from, or other available assets of, our subsidiaries, may not be sufficient to pay dividends or make distributions or loans to enable us to pay any dividends on our common stock or satisfy our other financial obligations.
19
Table of Contents
If securities or industry analysts do not publish or cease publishing research or reports about us, our business, or our market, or if they change their recommendations regarding our securities adversely, the price and trading volume of our securities could decline.
The trading market for our securities will be influenced by the research and reports that industry or securities analysts may publish about us, our business, our market, or our competitors. Securities and industry analysts do not currently, and may never, publish research on us. If no securities or industry analysts commence coverage of us, our stock price and trading volume would likely be negatively impacted. If any of the analysts who may cover us change their recommendation regarding our stock adversely, or provide more favorable relative recommendations about our competitors, the price of our securities would likely decline. If any analyst who may cover us were to cease coverage of us or fail to regularly publish reports on it, we could lose visibility in the financial markets, which could cause our stock price or trading volume to decline.
Exercise of warrants for common stock would increase the number of shares eligible for future resale in the public market and result in dilution to our stockholders.
As of March 1, 2018, we had warrants to purchase 8,624,999 shares of common stock outstanding. Each whole warrant is exercisable to purchase one share of common stock at $11.50 per share. To the extent such warrants are exercised, additional shares of common stock will be issued, which will result in dilution to the then-existing holders of common stock and increase the number of shares eligible for resale in the public market. Sales of substantial numbers of such shares in the public market could adversely affect the market price of our common stock.
We may redeem the unexpired warrants prior to their exercise at a time that is disadvantageous to warrant holders, thereby making such warrants worthless.
We have the ability to redeem outstanding warrants at any time prior to their expiration, at a price of $0.01 per warrant, provided that the last reported sales price of the common stock equals or exceeds $18.00 per share for any 20 trading days within a 30 trading-day period ending on the third trading day prior to the date we send the notice of redemption to the warrant holders. If and when the warrants become redeemable, we may exercise our redemption right even if we are unable to register or qualify the underlying securities for sale under all applicable state securities laws. Redemption of the outstanding warrants could force (i) to exercise your warrants and pay the exercise price therefor at a time when it may be disadvantageous for you to do so, (ii) to sell your warrants at the then-current market price when you might otherwise wish to hold your warrants or (iii) to accept the nominal redemption price which, at the time the outstanding warrants are called for redemption, is likely to be substantially less than the market value of your warrants. None of the Placement Warrants and warrants underlying the units issuable upon conversion of working capital loan will be redeemable by us so long as they are held by their initial purchasers or their permitted transferees.
Anti-takeover provisions contained in our amended and restated certificate of incorporation and amended and restated bylaws, as well as provisions of Delaware law, could impair a takeover attempt.
Our certificate of incorporation contains provisions that may discourage unsolicited takeover proposals that stockholders may consider to be in their best interests. These provisions may make more difficult the removal of management and may discourage transactions that otherwise could involve payment of a premium over prevailing market prices for our securities.
20
Table of Contents
Risks Related to our Corporate Governance
We are a “controlled company” within the meaning of the applicable Nasdaq rules and, as a result, qualify for exemptions from certain corporate governance requirements. If we rely on these exemptions, our stockholders will not have the same protections afforded to stockholders of companies that are subject to such requirements.
Clearlake controls a majority of the voting power of our outstanding common stock. Under Nasdaq rules, a company of which more than 50% of the voting power for the election of directors is held by an individual, group or another company is a “controlled company” and may elect not to comply with certain corporate governance requirements, including the requirement:
| • | that a majority of the board of directors consist of independent directors; |
| • | for an annual performance evaluation of the nominating and corporate governance and compensation committees; |
| • | that we have a nominating and corporate governance committee that is composed entirely of independent directors with a written charter addressing the committee’s purpose and responsibilities; and |
| • | that we have a compensation committee that is composed entirely of independent directors with a written charter addressing the committee’s purpose and responsibility. |
We may use these exemptions now or in the future. As a result, our stockholders may not have the same protections afforded to stockholders of companies that are subject to all of the Nasdaq corporate governance requirements.
Clearlake has a significant degree of control of us and their interests may conflict with ours or yours in the future.
Investment funds associated with or designated by Clearlake have a significant degree of control over the election of the members of our board of directors and thereby may control our policies and operations, including the appointment of management, future issuances of our common stock or other securities, the payment of dividends, if any, on our common stock, the incurrence or modification of debt by us, amendments to our Charter and Bylaws, and the entering into of extraordinary transactions, and their interests may not in all cases be aligned with your interests. In addition, Clearlake may have an interest in pursuing acquisitions, divestitures, and other transactions that, in our judgment, could enhance our profitability, even though such transactions might involve risks to you. For example, Clearlake could cause us to make acquisitions that increase our indebtedness. Clearlake may direct us to make significant changes to our business operations and strategy, including with respect to, among other things, sales of assets, employee headcount levels, and initiatives to reduce costs and expenses.
As of March 1, 2018, Clearlake holds 54.7% of our common stock. So long as Clearlake continues to own a significant amount of the outstanding shares of our common stock, even if such amount is less than 50%, Clearlake will continue to be able to strongly influence or effectively control our decisions. In addition, so long as Clearlake continues to maintain this ownership, it will be able effectively to determine the outcome of all matters requiring stockholder approval and will be able to cause or prevent a change of control or a change in the composition of our board of directors and could preclude any unsolicited acquisition of us. The concentration of ownership could deprive our stockholders of an opportunity to receive a premium for our shares of common stock as part of a sale.
In the event of a conflict between our interests and the interests of Clearlake we have adopted policies and procedures, specifically a Code of Business Conduct and Ethics and a Related Person Transactions Policy, to identify, review, consider and approve such conflicts of interest. In general, if an affiliate of a director, executive
21
Table of Contents
officer or significant stockholder, including Clearlake, intends to engage in a transaction involving us, such director, executive officer or significant stockholder must report such transaction for consideration and approval by our audit committee. We cannot provide assurances that our efforts and policies to eliminate the potential impacts of conflicts of interest will be effective.
Our certificate of incorporation provides that the Court of Chancery of the State of Delaware and the federal district courts of the United States of America will be the exclusive forums for substantially all disputes between us and our stockholders, which could limit our stockholders’ ability to obtain a favorable judicial forum for disputes with us or our directors, officers, or employees.
Our certificate of incorporation provides that the Court of Chancery of the State of Delaware is the exclusive forum for:
| • | any derivative action or proceeding brought on our behalf; |
| • | any action asserting a breach of fiduciary duty; |
| • | any action asserting a claim against us arising under the Delaware General Corporation Law, our certificate of incorporation or our bylaws; and |
| • | any action asserting a claim against us that is governed by the internal-affairs doctrine. |
Our certificate of incorporation provides that the federal district courts of the United States of America will be the exclusive forum for resolving any complaint asserting a cause of action arising under the Securities Act.
These exclusive forum provisions may limit a stockholder’s ability to bring a claim in a judicial forum that it finds favorable for disputes with us or our directors, officers, or other employees, which may discourage lawsuits against us and our directors, officers, and other employees. If a court were to find either exclusive forum provision in our certificate of incorporation to be inapplicable or unenforceable in an action, it may incur additional costs associated with resolving the dispute in other jurisdictions, which could harm our business.
Risks Related to Our Common Stock
Our stock price may be volatile and may decline regardless of our operating performance.
Our stock price is likely to be volatile. The trading prices of the securities of companies in our industry have been highly volatile. As a result of this volatility, investors may not be able to sell their common stock at or above their purchase price. The market price of our common stock and warrants may fluctuate significantly in response to numerous factors, many of which are beyond our control, including:
| • | actual or anticipated fluctuations in our revenue and other operating results, including as a result of the addition or loss of any number of clients; |
| • | announcements by us or our competitors of significant technical innovations, acquisitions, strategic partnerships, joint ventures, or capital commitments; |
| • | the financial projections we may provide to the public, any changes in these projections or our failure to meet these projections; |
| • | failure of securities analysts to initiate or maintain coverage of us, changes in ratings and financial estimates and the publication of other news by any securities analysts who follow our company, or our failure to meet these estimates or the expectations of investors; |
| • | changes in operating performance and stock market valuations of our competitors or companies in similar industries; |
| • | the size of our public float; |
22
Table of Contents
| • | price and volume fluctuations in the trading of our common stock and warrants and in the overall stock market, including as a result of trends in the economy as a whole; |
| • | new laws or regulations or new interpretations of existing laws or regulations applicable to our business or industry, including data privacy and data security; |
| • | lawsuits threatened or filed against us for claims relating to intellectual property, employment issues, or otherwise; |
| • | changes in our board of directors or management; |
| • | short sales, hedging, and other derivative transactions involving our common stock; |
| • | sales of large blocks of our common stock including sales by our executive officers, directors, and significant stockholders; and |
| • | other events or factors, including changes in general economic, industry and market conditions, and trends, as well as any natural disasters that may affect our operations. |
In addition, the stock markets have experienced extreme price and volume fluctuations that have affected and continue to affect the market prices of equity securities of many companies in our industry. Stock prices of such companies have fluctuated in a manner unrelated or disproportionate to the operating performance of those companies.
In the past, stockholders have instituted securities class action litigation following periods of market volatility. If we were to become involved in securities litigation, it could subject us to substantial costs, divert resources and the attention of management, and harm our business.
Future sales of shares by existing stockholders could cause our stock price to decline.
Sales of a substantial number of shares of our common stock in the public market could occur at any time. These sales, or the perception in the market that the holders of a large number of shares of common stock intend to sell shares, could reduce the market price of our common stock. In addition, certain holders of our common stock and warrants have “piggy-back” registration rights with respect to registration statements we file. The presence of these additional shares of common stock trading in the public market may have an adverse effect on the market price of our securities.
If securities or industry analysts do not publish research or reports about our business, or if they downgrade our common stock, the price of our common stock could decline.
The trading market for our common stock depends, in part, on the research and reports that securities or industry analysts publish about us or our business. We do not have any control over these analysts. If one or more of the analysts who cover us downgrade our stock or publish inaccurate or unfavorable research about our business, our stock price would likely decline. In addition, if our operating results fail to meet the forecast of analysts, our stock price would likely decline. If one or more of these analysts cease coverage of our company or fail to publish reports on us regularly, demand for our common stock could decrease, which might cause our stock price and trading volume to decline.
We are an “emerging growth company” and the reduced disclosure requirements applicable to emerging growth companies may make our common stock less attractive to investors.
We are an “emerging growth company,” as defined in the Jumpstart Our Businesses Startups Act of 2012 (the “JOBS Act”), and we may take advantage of certain exemptions from various reporting requirements that are applicable to other public companies that are not “emerging growth companies” including, but not limited to, not being required to comply with the auditor attestation requirements of Section 404 of the Sarbanes-Oxley Act, reduced financial disclosure obligations, reduced disclosure obligations regarding executive compensation in our periodic reports and proxy statements, and exemptions from the requirements of holding a nonbinding advisory
23
Table of Contents
vote on executive compensation and any golden parachute payments not previously approved. As an “emerging growth company” under the JOBS Act, we have elected to delay the adoption of new or revised accounting pronouncements applicable to public companies until such pronouncements are made applicable to private companies.
We may take advantage of these provisions until we are no longer an “emerging growth company.” We would cease to be an “emerging growth company” upon the earliest to occur of: the last day of the fiscal year in which we have more than $1.07 billion in annual revenue; the date we qualify as a “large accelerated filer,” with at least $700 million of equity securities held by non-affiliates; the issuance, in any three-year period, by us of more than $1.0 billion in non-convertible debt securities; or December 31, 2022. We anticipate that we will cease to be an “emerging growth company” on December 31, 2018. The information that we provide our security holders may be different than you might get from other public companies in which you hold equity interests. We cannot predict if investors will find our common stock less attractive because we may rely on these exemptions. If some investors find our common stock less attractive as a result, there may be a less active trading market for our common stock and our stock price may be more volatile.
We will incur increased costs and demands upon management as a result of complying with the laws and regulations affecting public companies, particularly after we are no longer an “emerging growth company,” which could adversely affect our business, results of operations, or financial condition.
After we cease to be an “emerging growth company,” we will incur greater legal, accounting, and other expenses than we previously incurred. We are subject to the reporting requirements of the Securities Exchange Act, the Sarbanes-Oxley Act, the Dodd-Frank Wall Street Reform and Consumer Protection Act, and the rules and regulations of The Nasdaq Stock Market LLC. These requirements have increased and will continue to increase our legal, accounting, and financial compliance costs and have made and will continue to make some activities more time consuming and costly. For example, we expect these rules and regulations to make it more difficult and more expensive for us to obtain director and officer liability insurance, and we may be required to accept reduced policy limits and coverage or incur substantially higher costs to maintain the same or similar coverage. As a result, it may be more difficult for us to attract and retain qualified individuals to serve on our board of directors or as our executive officers. After we are no longer an “emerging growth company”, or sooner if we choose not to take advantage of certain exemptions set forth in the JOBS Act, we expect to incur significant expenses and devote substantial management effort toward ensuring compliance with the auditor attestation requirements of Section 404 of the Sarbanes-Oxley Act. In that regard, we will need to hire additional accounting and financial staff with appropriate public company experience and technical accounting knowledge.
24
Table of Contents
Unless otherwise indicated, information contained in this prospectus concerning our industry and the market in which we operate, including our general expectations and market position, market opportunity, and market size, is based on information from various sources including the independent industry publications set forth below, and is subject to a number of assumptions and limitations. We believe the information from the industry publication and other third-party sources included in this prospectus is reliable. The content of the below sources, except to the extent specifically set forth in this prospectus, does not constitute a portion of this prospectus and is not incorporated herein.
| • | IDC, Worldwide and Regional Public IT Cloud Services Forecast, 2016-2020, dated as of December 2016, which we refer to herein as “IDC-Cloud Services.” |
| • | IDC, Worldwide Black Book (Standard Edition), dated as of December 2017, which we refer to herein as “IDC-Blackbook”. |
| • | IDC, Worldwide Endpoint Security Forecast, 2016-2020, dated as of October 2016, which we refer to herein as “IDC-Endpoint Security”. |
| • | IDC, Worldwide Enterprise Network Infrastructure Forecast, 2017-2021, dated as of May 2017, which we refer to herein as “IDC-Network Infrastructure”. |
| • | IDC, Worldwide Identity and Access Management Forecast, 2017-2021, dated as of August 2017, which we refer to herein as “IDC-Access Management”. |
| • | IDC, Worldwide IT Security Products Forecast, 2017-2020: Comprehensive Security Products Forecast Review, dated as of March 2017, which we refer to herein as “IDC-IT Security Products”. |
| • | IDC, Worldwide Messaging Security Forecast, 2017-2020: Continued Migration to the Cloud, dated as of March 2017, which we refer to herein as “IDC-Messaging Security”. |
| • | IDC, Worldwide Network Security Forecast, 2017-2021, dated as of September 2017, which we refer to herein as “IDC-Network Security”. |
| • | IDC, Worldwide Security and Vulnerability Management Forecast, 2016-2020: Enterprises Continue Focus on Security Operations, dated as of December 2016, which we refer to herein as “IDC-Vulnerability Management”. |
| • | IDC, Worldwide Specialized Threat Analysis and Protection Forecast, 2016-2020: Enterprises Modernize Security Infrastructure, dated as of December 2016, which we refer to herein as “IDC-Specialized Threat”. |
| • | IDC, Worldwide Unified Communications and Collaboration Forecast, 2017-2021, dated as of May 2017, which we refer to herein as “IDC-2017 UC&C”. |
| • | IDC, Worldwide Web Security Forecast, 2016-2020: Extending Protection to Cloud Resources, dated as of December 2016, which we refer to herein as “IDC-Web Security”. |
The industry in which we operate is subject to a high degree of uncertainty and risk due to a variety of factors, including those described in the section titled “Risk Factors” and elsewhere in this prospectus. These and other factors could cause results to differ materially from those expressed in the estimates made by the independent parties and by us.
25
Table of Contents
All the securities offered in this prospectus are being sold by the selling stockholders. We will not receive any proceeds from the sale of securities by the selling stockholders except with respect to amounts received by us upon the cash exercise of the warrants. We expect to use the proceeds received from the exercise of the warrants, if any, for working capital and general corporate purposes.
MARKET PRICE OF OUR SECURITIES
Forum’s Class A common stock and warrants were previously listed on the Nasdaq Capital Market under the symbols “FMCI” and “FMCIW”, respectively. Forum’s Class A common stock and warrants each commenced separate public trading on May 2, 2017. Upon the closing of the Business Combination on February 22, 2018, the Class A common stock was renamed common stock. Since February 23, 2018, our common stock and warrants have been listed on the Nasdaq Capital Market under the symbols “CVON” and “CVONW”, respectively.
The following table includes the high and low bid prices for our common stock and warrants for the periods presented.
| Common Stock | Warrants | |||||||||||||||
| Period |
High | Low | High | Low | ||||||||||||
| 2018: |
||||||||||||||||
| First Quarter(1) |
$ | 10.83 | $ | 8.01 | $ | 0.98 | $ | 0.65 | ||||||||
| 2017: |
||||||||||||||||
| Fourth Quarter |
$ | 10.66 | $ | 9.67 | $ | 0.7489 | $ | 0.28 | ||||||||
| Third Quarter |
$ | 9.75 | $ | 9.50 | $ | 0.4799 | $ | 0.21 | ||||||||
| Second Quarter(2) |
$ | 9.75 | $ | 9.65 | $ | 0.61 | $ | 0.391 | ||||||||
| (1) | Through March 21, 2018. |
| (2) | Commencing on May 2, 2017. |
We have adopted a stated dividend policy and will use our commercially reasonable efforts to declare and pay a dividend in such amount as to provide an annual dividend yield to our stockholders of at least 1%, subject to the determination by our board of directors that (i) such dividend payment is permitted by applicable law and (ii) we and our subsidiaries, on a consolidated basis, have a sufficient amount of unrestricted cash to make such dividend payment and still satisfy our respective existing liabilities and have sufficient reserves for future contingencies or future needs of our business and that of our subsidiaries.
26
Table of Contents
SELECTED CONSOLIDATED FINANCIAL AND OTHER DATA
The following tables summarize our consolidated financial and other data. We have derived the consolidated statements of operations data for the years ended December 31, 2017, 2016 and 2015 and the consolidated balance sheet data as of December 31, 2017 and 2016 from our audited consolidated financial statements included elsewhere in this prospectus. Our historical results are not necessarily indicative of the results that may be expected in any future period.
You should read this data together with our consolidated financial statements and related notes included elsewhere in this prospectus and the section titled “Management’s Discussion and Analysis of Financial Condition and Results of Operations.”
| Year Ended December 31, | ||||||||||||
| 2017 | 2016 | 2015 | ||||||||||
| (in thousands, except per share data) | ||||||||||||
| Consolidated Statements of Operations Data: |
||||||||||||
| Revenue |
||||||||||||
| Technology offerings |
$ | 453,106 | $ | 439,804 | $ | 297,481 | ||||||
| Services |
465,820 | 375,805 | 303,983 | |||||||||
|
|
|
|
|
|
|
|||||||
| Total revenue |
918,926 | 815,609 | 601,464 | |||||||||
|
|
|
|
|
|
|
|||||||
| Gross profit |
||||||||||||
| Technology offerings |
104,676 | 106,722 | 77,104 | |||||||||
| Services |
169,809 | 142,522 | 116,342 | |||||||||
|
|
|
|
|
|
|
|||||||
| Total gross profit |
274,485 | 249,244 | 193,446 | |||||||||
| Total operating expenses |
249,815 | 202,742 | 162,731 | |||||||||
|
|
|
|
|
|
|
|||||||
| Operating income |
24,670 | 46,502 | 30,715 | |||||||||
| Interest expense and other, net |
52,039 | 31,437 | 23,118 | |||||||||
| Income tax (benefit) expense |
(19,348) | 6,716 | 3,574 | |||||||||
|
|
|
|
|
|
|
|||||||
| Net (loss) income |
$ | (8,021) | $ | 8,349 | $ | 4,023 | ||||||
|
|
|
|
|
|
|
|||||||
| Net (loss) income per share attributable to Class A common stockholders, basic and diluted(1) |
$ | (0.09 | ) | $ | 0.09 | $ | 0.04 | |||||
|
|
|
|
|
|
|
|||||||
| Weighted-average common shares used in computing basic and diluted net income (loss) per share attributable to Class A common stockholders(1) |
89,778 | 89,862 | 89,866 | |||||||||
|
|
|
|
|
|
|
|||||||
27
Table of Contents
| (1) | See Notes 1 and 9 to our consolidated financial statements for an explanation of the method used to calculate basic and diluted net income (loss) per common share attributable to common stockholders. |
| Year Ended December 31, | ||||||||||||
| 2017 | 2016 | 2015 | ||||||||||
| (as a percentage of total revenue) |
||||||||||||
| Revenue Mix and Gross Margin: | ||||||||||||
| Revenue |
||||||||||||
| Technology offerings |
49.3 | % | 53.9 | % | 49.5 | % | ||||||
| Services |
50.7 | 46.1 | 50.5 | |||||||||
|
|
|
|
|
|
|
|||||||
| Total revenue |
100.0 | % | 100.0 | % | 100.0 | % | ||||||
|
|
|
|
|
|
|
|||||||
| Gross margin |
||||||||||||
| Technology offerings |
23.1 | % | 24.3 | % | 25.9 | % | ||||||
| Services |
36.5 | 37.9 | 38.3 | |||||||||
| Total gross margin |
29.9 | 30.6 | 32.2 | |||||||||
| As of December 31 | ||||||||
| 2017 | 2016 | |||||||
| (in thousands) | ||||||||
| Consolidated Balance Sheet Data: | ||||||||
| Cash |
$ | 13,475 | $ | 9,632 | ||||
| Working capital(1) |
56,510 | 31,269 | ||||||
| Total assets |
920,741 | 636,260 | ||||||
| Total debt, including current portion and excluding unamortized debt issuance cost |
582,325 | 404,138 | ||||||
| Total liabilities |
915,100 | 623,500 | ||||||
| Total stockholders’ equity |
5,641 | 12,760 | ||||||
| (1) | We define working capital as current assets minus current liabilities. |
Non-GAAP Financial Measures
| Year Ended December 31, | ||||||||||||
| 2017 | 2016 | 2015 | ||||||||||
| (dollars in thousands) | ||||||||||||
| Other Financial Data: |
||||||||||||
| Adjusted Revenue(1) |
$ | 921,955 | $ | 815,912 | $ | 603,719 | ||||||
| Adjusted EBITDA(2) |
$ | 82,568 | $ | 83,785 | $ | 62,809 | ||||||
| Adjusted Net Income(3) |
$ | 35,133 | $ | 34,488 | $ | 24,358 | ||||||
| (1) | Adjusted Revenue is a non-GAAP financial measure. We believe that Adjusted Revenue provides supplemental information with respect to its revenue associated with our ongoing performance. We define Adjusted Revenue as total revenue adjusted to exclude non-cash acquisition accounting adjustments to revenue as a result of our acquisitions. The reconciliation of revenue, the most directly comparable financial measure calculated and presented in accordance with GAAP, to Adjusted Revenue for each of the periods presented is as follows. See “—Use of Non-GAAP Financial Measures” below for additional information. |
| Year Ended December 31, | ||||||||||||
| 2017 | 2016 | 2015 | ||||||||||
| (in thousands) | ||||||||||||
| Revenue |
$ | 918,926 | $ | 815,609 | $ | 601,464 | ||||||
| Acquisition accounting adjustments |
3,029 | 303 | 2,255 | |||||||||
|
|
|
|
|
|
|
|||||||
| Adjusted Revenue |
$ | 921,955 | $ | 815,912 | $ | 603,719 | ||||||
|
|
|
|
|
|
|
|||||||
| (2) | Adjusted EBITDA is a non-GAAP financial measure. We believe Adjusted EBITDA provides helpful information with respect to our operating performance as viewed by management, including a view of our business that is not dependent on (i) the impact of its capitalization structure and (ii) items that are not part of our day-to-day operations. We define Adjusted EBITDA as net income (loss) plus (1) total depreciation and amortization, (2) interest expense and other, net, and (3) income tax expense (benefit), as further |
28
Table of Contents
| adjusted to eliminate non-cash stock-based compensation expense, acquisition accounting adjustments, transaction costs, and other one-time nonrecurring costs. The reconciliation of net income (loss), the most directly comparable financial measure calculated and presented in accordance with GAAP, to Adjusted EBITDA for each of the periods presented is as follows. See “—Use of Non-GAAP Financial Measures” below for additional information. |
| Year Ended December 31, | ||||||||||||
| 2017 | 2016 | 2015 | ||||||||||
| (in thousands) | ||||||||||||
| Net income (loss) |
$ | (8,021 | ) | $ | 8,349 | $ | 4,023 | |||||
| Depreciation and amortization(a) |
36,373 | 28,570 | 23,858 | |||||||||
| Interest expense and other, net |
52,039 | 31,437 | 23,118 | |||||||||
| Income tax (benefit) expense |
(19,348 | ) | 6,716 | 3,574 | ||||||||
|
|
|
|
|
|
|
|||||||
| EBITDA |
61,043 | 75,072 | 54,573 | |||||||||
| Stock-based compensation expense |
1,287 | 1,057 | 233 | |||||||||
| Acquisition accounting adjustments(b) |
2,982 | (457 | ) | (829 | ) | |||||||
| Transaction costs(c) |
14,071 | 6,055 | 5,678 | |||||||||
| Other costs(d) |
3,185 | 2,058 | 3,154 | |||||||||
|
|
|
|
|
|
|
|||||||
| Adjusted EBITDA |
$ | 82,568 | $ | 83,785 | $ | 62,809 | ||||||
|
|
|
|
|
|
|
|||||||
| (a) | Depreciation and amortization equals the sum of (1) depreciation and amortization included in total operating expenses and (2) depreciation and amortization included in total cost of revenue within our consolidated financial statements. |
| (b) | Acquisition accounting adjustments include charges associated with non-cash acquisition accounting fair value adjustments to deferred revenue and deferred customer support costs. |
| (c) | Transaction costs of (1) $5.7 million for 2015 include acquisition-related expenses of $1.2 million related to employee retention bonuses, $2.1 million related to transaction-related professional fees, including legal, accounting, tax, and advisory fees, and $2.4 million of one-time acquisition-related integration costs, (2) $6.1 million for 2016 include acquisition-related expenses of $1.1 million related to employee retention bonuses, $0.7 million related to transaction-related professional fees and expenses, including legal, accounting, tax, and advisory fees, and $4.3 million of one-time acquisition-related integration costs, and (3) $14.1 million for 2017 include acquisition-related expenses of $6.5 million related to transaction-related professional fees and expenses, including legal, accounting, tax, and advisory fees, and $7.6 million of one-time acquisition-related integration costs. |
| (d) | Other costs of (1) $3.2 million for 2015 include expenses of $1.6 million related to one-time severance and related legal expenses, $1.5 million related to payments to Clearlake for advisory and consulting services pursuant to its management and monitoring services agreement which was terminated in connection with the Business Combination, and $0.1 million payments to certain members of our board of directors for their services, (2) $2.1 million for 2016 include $0.5 million related to one-time severance and related legal expenses, $1.5 million related to payments to Clearlake for advisory and consulting services pursuant to its management and monitoring services agreement, and $0.1 million payments to certain members of our board of directors for their services, and (3) $3.2 million for 2017 include expenses of $1.4 million related to one-time severance and related legal expenses and $1.8 million related to payments to Clearlake for advisory and consulting services pursuant to its management and monitoring services agreement. |
29
Table of Contents
| (3) | Adjusted Net Income is a non-GAAP financial measure, which management uses in this prospectus and in its evaluation of past performance, trends, and prospects for the future. We believe that Adjusted Net Income is utilized by investors and other interested parties as a measure of its comparative operating performance period-over-period that considers the impact of certain items that do not directly correlate to our ongoing operating performance and that vary significantly from period to period, such as the interest expense associated with its outstanding debt, as well as the impact of depreciation on its fixed assets and income taxes. We define Adjusted Net Income as net income (loss) adjusted to exclude (i) amortization of acquisition-related intangible assets, (ii) amortization of debt issuance costs, (iii) non-cash stock-based compensation expense, (iv) costs related to debt refinancing, (v) acquisition accounting adjustments, (vi) transaction costs, (vii) other costs, and (viii) the income tax impact associated with the foregoing items. The reconciliation of net income (loss), the most directly comparable financial measure calculated and presented in accordance with GAAP, to Adjusted Net Income for each of the periods presented is as follows. See “—Use of Non-GAAP Financial Measures” below for additional information. |
| Year Ended December 31, | ||||||||||||
| 2017 | 2016 | 2015 | ||||||||||
| (in thousands) | ||||||||||||
| Net income (loss) |
$ | (8,021 | ) | $ | 8,349 | $ | 4,023 | |||||
| Amortization of intangible assets |
26,445 | 22,456 | 20,247 | |||||||||
| Amortization of debt issuance costs |
2,596 | 2,412 | 2,028 | |||||||||
| Stock-based compensation expense |
1,287 | 1,057 | 233 | |||||||||
| Costs related to debt refinancing(a) |
15,997 | 4,486 | — | |||||||||
| Acquisition accounting adjustments(b) |
2,982 | (457 | ) | (829 | ) | |||||||
| Transaction costs(c) |
14,071 | 6,055 | 5,678 | |||||||||
| Other costs(d) |
3,185 | 2,058 | 3,154 | |||||||||
| Income tax impact of adjustments(e) |
(23,409 | ) | (11,928 | ) | (10,176 | ) | ||||||
|
|
|
|
|
|
|
|||||||
| Adjusted Net Income |
$ | 35,133 | $ | 34,488 | $ | 24,358 | ||||||
|
|
|
|
|
|
|
|||||||
| (a) | Costs related to debt refinancing in (1) 2016 include $1.8 million in financing transaction costs, $1.5 million in debt extinguishment losses, and a $1.2 million write-off of unamortized debt issuance costs and (2) 2017 consists of $2.3 million in financing transaction costs, $3.4 million in debt extinguishment losses and a $10.3 million write-off of unamortized debt issuance cost. |
| (b) | Acquisition accounting adjustments include charges associated with non-cash acquisition accounting fair value adjustments to deferred revenue and deferred customer support costs. |
| (c) | Transaction costs of (1) $5.7 million for 2015 include acquisition-related expenses of $1.2 million related to employee retention bonuses, $2.1 million related to transaction-related professional fees, including legal, accounting, tax, and advisory fees, and $2.4 million of one-time acquisition-related integration costs, (2) $6.1 million for 2016 include acquisition-related expenses of $1.1 million related to employee retention bonuses, $0.7 million related to transaction-related professional fees and expenses, including legal, accounting, tax, and advisory fees, and $4.3 million of one-time acquisition-related integration costs, and (3) $14.1 million for 2017 include acquisition-related expenses of $6.5 million related to transaction-related professional fees and expenses, including legal, accounting, tax, and advisory fees, and $7.6 million of one-time acquisition-related integration costs. |
| (d) | Other costs of (1) $3.2 million for 2015 include expenses of $1.6 million related to one-time severance and related legal expenses, $1.5 million related to payments to Clearlake for advisory and consulting services pursuant to its management and monitoring services agreement which was terminated in connection with the Business Combination, and $0.1 million to certain members of our board of directors for their services, (2) $2.1 million for 2016 include $0.5 million related to one-time severance and related legal expenses, $1.5 million related to payments to Clearlake for advisory and consulting services pursuant to its management and monitoring services agreement, and $0.1 million to certain members of our board of directors for their services, and (3) $3.2 million for 2017 include expenses of $1.4 million related to one-time severance and related legal expenses and $1.8 million related to payments to Clearlake for advisory and consulting services pursuant to its management and monitoring services agreement. |
| (e) | Income tax impact of adjustments includes an estimated tax impact of the adjustments to net income (loss) at our average statutory tax rate of 40.0%, except for the impact of tax-deductible goodwill and intangible assets resulting from certain historical acquisitions. |
30
Table of Contents
Use of Non-GAAP Financial Measures
Adjusted Revenue, Adjusted EBITDA, and Adjusted Net Income should be considered in addition to, not as a substitute for, or superior to, financial measures calculated in accordance with GAAP. They are not measurements of our financial performance under GAAP and should not be considered as alternatives to revenue or net income (loss), as applicable, or any other performance measures derived in accordance with GAAP and may not be comparable to other similarly titled measures of other businesses. Adjusted Revenue, Adjusted EBITDA, and Adjusted Net Income have limitations as analytical tools and you should not consider them in isolation or as a substitute for analysis of our operating results as reported under GAAP. Some of these limitations include:
| • | non-cash compensation is and will remain a key element of our overall long-term incentive compensation package, although we exclude it as an expense when evaluating its ongoing operating performance for a particular period; |
| • | Adjusted EBITDA and Adjusted Net Income do not reflect the impact of certain cash charges resulting from matters we consider not to be indicative of its ongoing operations; and |
| • | other companies in our industry may calculate Adjusted Revenue, Adjusted EBITDA, and Adjusted Net Income, differently than it does, limiting their usefulness as comparative measures. |
We compensate for these limitations to Adjusted Revenue, Adjusted EBITDA, and Adjusted Net Income by relying primarily on its GAAP results and using Adjusted Revenue, Adjusted EBITDA, and Adjusted Net Income only for supplemental purposes. Adjusted EBITDA and Adjusted Net Income include adjustments for items that may occur in future periods. However, we believe these adjustments are appropriate because the amounts recognized can vary significantly from period to period, do not directly relate to the ongoing operations of our business, and complicate comparisons of its internal operating results and operating results of other peer companies over time. For example, it is useful to exclude non-cash, stock-based compensation expenses because the amount of such expenses in any specific period may not directly correlate to the underlying performance of our business operations and these expenses can vary significantly across periods due to timing of new stock-based awards. We also exclude certain discrete, unusual, one-time, or non-cash costs, including transaction costs, and the income tax impact of adjustments in order to facilitate a more useful period-over-period comparison of its financial performance. Each of the normal recurring adjustments and other adjustments described in this paragraph help management with a measure of our operating performance over time by removing items that are not related to day-to-day operations or are non-cash expenses. See our historical consolidated financial statements included elsewhere in this prospectus for our GAAP results.
31
Table of Contents
MANAGEMENT’S DISCUSSION AND ANALYSIS OF FINANCIAL CONDITION
AND RESULTS OF OPERATIONS
The following discussion and analysis of our financial condition and results of operations should be read in conjunction with our consolidated financial statements and related notes that appear elsewhere in this prospectus. In addition to historical consolidated financial information, the following discussion contains forward-looking statements that reflect our plans, estimates and beliefs. Our actual results could differ materially from those discussed in the forward-looking statements. Factors that could cause or contribute to these differences include those discussed below and elsewhere particularly in the section titled “Risk Factors” and elsewhere in this prospectus.
Prior to February 22, 2018, we were known as Forum Merger Corporation. On February 22, 2018, we completed the Business Combination, with C1 Investment Corp., a private company. For accounting purposes, Forum Merger Corporation was deemed to be the acquired entity in the Merger.
Overview
We are a leading IT services provider of collaboration and technology solutions for large and medium enterprises. We serve clients through our comprehensive engagement model which includes the full lifecycle of services from consultation and design through implementation, optimization, and ongoing support. Our deep technical expertise enables us to deliver complex, multi-vendor solutions across a number of delivery models, including on-premise and in private, hybrid, C1 Cloud, and public cloud environments. We served over 7,200, 3,700 and 3,400 clients in 2017, 2016, and 2015, respectively, which includes clients served in 2017 by companies we acquired in 2017 and 2015. From 2015 to 2017, we served 57% of the Fortune 100, 43% of the Fortune 500, and 36% of the Fortune 1000, which includes clients served in the same period by companies we acquired in 2017 and 2015.
Our technical expertise and client-centric culture have led to long-standing and expanding client relationships. With more than 1,300 highly skilled engineers and consulting professionals and approximately 330 sales professionals, we are able to deliver customized services and technology offerings to address the specific needs of our clients. Additionally, among our top 100 clients based on 2017 revenue, we have an average tenure of more than nine years. We generated 93% and 91% of our total revenue in 2017 and 2016, respectively, from clients we served in a prior year, excluding the impact of our 2017 acquisitions.
We design thousands of solutions each year across our core technology markets: (i) collaboration and (ii) enterprise networking, data center, cloud, and security. Collaboration is primarily comprised of software-centric unified communications technology, which enables communication anywhere on any device, and our customer engagement applications which deliver a personalized and omni-channel experience for our clients’ end customers. Our other core technology markets, enterprise networking, data center, cloud, and security, focus on the critical software and hardware IT infrastructure to enable our clients to securely process and store the applications and information they need to conduct their business. Our solutions are a combination of our professional services and technology offerings and are complemented by our industry-leading managed, cloud, and maintenance services.
For 2017, 2016, and 2015, 51%, 46%, and 51% of our total revenue, respectively, was derived from professional and managed, cloud, and maintenance services and 49%, 54%, and 49% was derived from technology offerings. For 2017, 2016, and 2015, 66%, 68%, and 82% of our total revenue, respectively, was derived from our services and technology offerings in the collaboration market. The remaining 34%, 32%, and 18% of our total revenue, respectively, was derived from our enterprise networking, data center, cloud, and security services and technology offerings. In 2015, we acquired SIGMAnet, MSN, and Sunturn. Our 2015 acquisitions have been fully integrated into our operations. In 2017, we acquired Annese & Associates, Inc. (“Annese”) Annese, SPS Holdco, LLC (“SPS”) Rockefeller Group Technology Solutions, Inc., (“RGTS”) and AOS, Inc., (“AOS”), which significantly affect comparability of our 2016 and 2017 results of operations and metrics. Please see the section below titled “Recent Acquisitions” for further information regarding these acquisitions.
32
Table of Contents
Services
In 2017, 2016, and 2015, 34%, 38%, and 37% of our services revenue, respectively, came from professional services and 66%, 62%, and 63%, respectively, was derived from managed, cloud, and maintenance services. For 2017, 2016, and 2015, services in the collaboration market comprised 82%, 85%, and 95%, respectively, of our services revenue.
Technology Offerings
For 2017, 2016, and 2015, 50%, 53%, and 70% of our technology offerings revenue, respectively, was generated by technology offerings in the collaboration market.
Our Corporate History
Since our founding in 1993, our client-centric culture has defined how we operate. We have worked, since the beginning, to deliver innovative multi-vendor services and solutions to solve our clients’ IT challenges and to help them grow. Our business model has driven our internal organic growth while at the same time allowing us to add capabilities and vendor relationships through both internal investments and acquisitions.
In June 2014, we were acquired by Clearlake, a private investment firm with a sector-focused approach.
Recent Acquisitions
In March 2018, we acquired Arrow Systems Integration, Inc. or ASI, for cash consideration of $30.7 million. The acquisition increases our collaboration business.
In December 2017, we acquired AOS for cash consideration of $65.9 million. The acquisition increases our presence in the Midwest and broadens our portfolio of collaboration services and solutions capabilities.
In September 2017, we acquired RGTS for cash consideration of $20.9 million. The acquisition increases our presence in the New York City market and brings additional capabilities in collaboration and cloud.
In August 2017, we acquired SPS for cash consideration of $51.1 million. The acquisition brought additional solutions and services capabilities in collaboration and video.
In July 2017, we acquired Annese for cash consideration of $24.5 million plus additional contingent consideration of up to $4.0 million. The Annese acquisition brought additional solutions and service capabilities in enterprise networking, security, collaboration, and cloud, backed by four decades of experience and expertise.
We made three strategic acquisitions in 2015 for an aggregate consideration of $66.8 million net of cash received. We acquired Sunturn to expand our core collaboration solutions and fully integrated the business as of July 31, 2015, at which time we no longer prepared standalone financial statements for Sunturn. The MSN and SIGMAnet acquisitions significantly expanded our broader enterprise networking capabilities as well as our collaboration, cloud, and security offerings, and have been fully integrated.
Factors Affecting our Operating Performance
We believe the following trends and factors may have an impact on our operating performance:
Evolution of cloud-based collaboration solutions. Within the broader unified communications and customer engagement market, cloud and hosted solutions are expected to grow faster than on-premise solutions as organizations increasingly look for scalable, agile, and mobile-enabled solutions while simultaneously seeking to reduce capital costs. As a result, enterprises are shifting from on-premise, hardware infrastructure to software-centric hosted and cloud solutions. Given our ability to deliver collaboration and other technology offerings over private, hybrid, C1 Cloud, and public cloud environments, we believe we are well positioned to benefit from these trends and expect these trends to drive growth in our managed, cloud, and maintenance services business,
33
Table of Contents
which typically have multi-year contractual terms and high renewal rates. We calculate renewal rate as the annual contract value (“ACV”) of contracts renewed as a percentage of the total ACV up for renewal in an applicable period. This can result in a renewal rate greater than 100% in the event that a contract renews at a higher value than the expiring contract value. Additionally, we exclude customer bankruptcies, site closures, short term contracts and other adjustments in the calculation of the renewal rate.
Growing complexity of technology solutions and expansion of our services business mix. Due to increased technology and vendor complexity, we are seeing an increased demand for multi-vendor IT solutions. As a result, enterprises are increasingly seeking the assistance of IT service providers who have the expertise to consult, design, integrate, and manage their technology solutions and platforms. Given our technical expertise, leading managed, cloud, and maintenance services, and customized services approach, we expect that our services offerings will comprise a higher percentage of our revenue in the future, which would have a favorable impact on our gross margins.
Our ability to increase penetration of our existing, long-standing clients. Our future growth will depend in part on our ability to expand sales of our services and solutions to our existing clients. For 2017 and 2016, 93% and 91%, respectively, of our total revenue was derived from clients we served in a prior year, excluding the impact of our 2017 acquisitions. We believe we are well positioned to identify new opportunities to expand or sell new services and solutions to our existing clients. For 2016 and 2015, 68% and 82% of our total revenue, respectively, came from collaboration solutions, and we believe there are additional opportunities to sell our other technology offerings, including enterprise networking, data center, cloud, and security into our existing client base. In addition, we believe there is opportunity to further penetrate our existing client base with our managed, cloud, and maintenance services.
Customer adoption of our expanding technology offerings and services. We plan to continue to invest in the development of our innovative and client-centric services and solutions. As technology becomes increasingly complex and clients look to reduce their capital cost, we believe our clients will transition from maintenance to managed services, and ultimately to cloud services. Most recently, we added advanced monitoring capabilities for our managed services platform, developed our own cloud hosted capabilities, and, through acquisitions, significantly bolstered our security technical expertise, offering end-to-end network and data security services and solutions to our clients. We believe that customer adoption of our cloud and security technology offerings and managed and hosted services can drive growth in our business over time.
Continue to maintain relationships with key technology partners. Through our leading professional services capabilities, we design thousands of solutions a year for our clients across our core technology markets: (i) collaboration and (ii) enterprise networking, data center, cloud, and security. We are vendor agnostic, as we enjoy strong relationships with more than 300 leading and next-generation technology partners. In order to retain access to the best-of-breed solutions and offer the latest technology solutions, we need to continue to maintain our relationships with existing key technology partners and develop new relationships.
Impact of Avaya Restructuring. Avaya, which was one of our largest vendors as a percentage of our technology offerings revenue in 2017, 2016, and 2015, filed for reorganization under Chapter 11 in January 2017, filed its preliminary plan of reorganization in April 2017, and had its Chapter 11 plan of reorganization approved by the Bankruptcy Court in November 2017. As a result of Avaya’s restructuring, new or existing clients have, in some cases, elected to delay purchasing decisions with respect to Avaya technology offerings or have chosen to replace existing Avaya technology offerings with the technology offerings of other vendors. Delays in customer purchasing decisions, or an election by our clients to purchase alternative technology offerings from us or from other providers, has resulted in decreased technology offerings revenue in 2017, and could result in lower revenues and gross profits or margins or otherwise have an adverse effect on our business in the future. Management continues to evaluate the impact that Avaya’s reorganization has had on our results of operations and financial condition.
34
Table of Contents
Key Business Metrics
Our management regularly monitors certain financial measures to track the progress of our business against internal goals and targets. We believe that the most important of these measures include Adjusted Revenue, Gross Margin, Adjusted EBITDA, Adjusted Net Income, and Services Revenue as a Percentage of Total Revenue.
| Year Ended December 31, |
||||||||||||
| 2017 | 2016 | 2015 | ||||||||||
| (in thousands) | ||||||||||||
| Total Revenue |
$ | 918,926 | $ | 815,609 | $ | 601,464 | ||||||
| Adjusted Revenue |
921,955 | 815,912 | 603,719 | |||||||||
| Services mix: |
||||||||||||
| Professional services revenue as a percentage of total revenue |
17% | 17% | 19% | |||||||||
| Managed, cloud, and maintenance services revenue as a percentage of total revenue |
33% | 29% | 32% | |||||||||
|
|
|
|
|
|
|
|||||||
| Services revenue as a percentage of total revenue |
51% | 46% | 51% | |||||||||
|
|
|
|
|
|
|
|||||||
| Gross Margin |
30% | 31% | 32% | |||||||||
| Net (loss) income |
$ | (8,021 | ) | $ | 8,349 | $ | 4,023 | |||||
| Adjusted Net Income |
35,133 | 34,488 | 24,358 | |||||||||
| Adjusted EBITDA |
82,568 | 83,785 | 62,809 | |||||||||
Adjusted Revenue
Adjusted Revenue is a non-GAAP financial measure. We believe that Adjusted Revenue provides supplemental information with respect to our revenue activity associated with our ongoing operations. We define Adjusted Revenue as total revenue adjusted to exclude non-cash acquisition accounting adjustments to revenue as a result of our acquisitions.
For more information about Adjusted Revenue and a reconciliation of Adjusted Revenue to total revenue, the most directly comparable financial measure calculated and presented in accordance with GAAP, see the section titled “Selected Consolidated Financial and Other Data—Use of Non-GAAP Financial Measures.”
Adjusted EBITDA
Adjusted EBITDA is a non-GAAP financial measure. Management uses Adjusted EBITDA (1) to compare our operating performance on a consistent basis, (2) to calculate incentive compensation for our employees, (3) for planning purposes including the preparation of our internal annual operating budget, (4) to evaluate the performance and effectiveness of our operational strategies, and (5) to assess compliance with various metrics associated with the agreements governing our indebtedness. Accordingly, we believe that Adjusted EBITDA provides useful information to investors and others in understanding and evaluating our operating performance in the same manner as management.
We define Adjusted EBITDA as net income (loss) plus (a) total depreciation and amortization, (b) interest expense and other, net, and (c) income tax expense, as further adjusted to eliminate non-cash stock-based compensation expense, acquisition accounting adjustments, transaction costs, and other one-time nonrecurring costs. We do not believe these adjustments are indicative of our ongoing performance. For more information about Adjusted EBITDA and a reconciliation of net income (loss), the most directly comparable financial measure calculated and presented in accordance with GAAP, to Adjusted EBITDA, see the section titled “Selected Consolidated Financial and Other Data—Use of Non-GAAP Financial Measures.”
35
Table of Contents
Services Revenue as a Percentage of Total Revenue
Our professional services involve the consultation, design, integration and implementation, application development, and program management of customized solutions for core technology markets. We view professional services as a percentage of revenue as a key measure in the successful execution of our operating strategies of leading client engagements with professional services and the profitability of our business.
We provide comprehensive managed, cloud, and maintenance services to our clients across our core technology markets. Given these services typically have multi-year contractual terms, with high renewal rates, we view managed, cloud, and maintenance services as a percentage of revenue as a key measure of our revenue visibility and profitability of our business.
Adjusted Net Income
Adjusted Net Income is a non-GAAP financial measure which management uses in this prospectus and in our evaluation of past performance, trends, and prospects for the future. Management uses Adjusted Net Income (1) to compare our operating performance on a consistent basis, (2) for planning purposes, including the preparation of our internal annual operating budget, and (3) to evaluate the performance and effectiveness of our operational strategies. Accordingly, we believe that Adjusted Net Income provides useful information to investors and others in understanding and evaluating our operating performance in the same manner as management. We believe that Adjusted Net Income is utilized by investors and other interested parties as a measure of our comparative operating performance period-over-period that considers the impact of certain items that do not directly correlate to our ongoing operating performance and that vary significantly from period to period, such as the interest expense associated with our outstanding debt, as well as the impact of depreciation on our fixed assets and income taxes. We define Adjusted Net Income as net income (loss) adjusted to exclude (a) amortization of acquisition-related intangible assets, (b) amortization of debt issuance costs, (c) non-cash stock-based compensation expense, (d) costs related to debt refinancing, (e) acquisition accounting adjustments, (f) transaction costs, (g) other costs, and (h) the income tax impact associated with the foregoing items. We do not believe these adjustments are indicative of our ongoing performance. For more information about Adjusted Net Income and a reconciliation of net income (loss), the most directly comparable financial measure calculated and presented in accordance with GAAP, to Adjusted Net Income, see the section titled “Selected Consolidated Financial and Other Data—Use of Non-GAAP Financial Measures.”
Components of Results of Operations
There are a number of factors that impact the revenue and margin profile of the services and technology offerings we provide, including, but not limited to, solution and technology complexity, technical expertise requiring the combination of products and types of services provided, as well as other elements that may be specific to a particular client solution.
Revenue
Our revenue consists of the sale of our technology offerings and services. We separately present technology offerings and services revenue, along with the associated cost of revenue, in our consolidated statements of operations.
Technology Offerings Revenue
Technology offerings revenue includes revenue from the sale of hardware and software products and is generally recognized on a gross basis with the selling price to the client recorded as revenue because we act as the primary obligor under these contracts. Revenue is generally recognized when the title and risk of loss are passed to the customer, there is persuasive evidence of an arrangement for sale, the sales price is fixed and
36
Table of Contents
determinable, and collectability is reasonably assured. Hardware and software items can be delivered to our clients in a variety of ways including shipping from our facilities, via drop-shipment by the vendor or distributor, or via electronic delivery for software licenses.
Services Revenue
Services revenue includes:
Revenue for Professional Services. Revenue for professional services is generally recognized when professional services are performed and all obligations have been substantially met. The majority of professional services revenue is fixed price.
Revenue for Managed, Cloud, and Maintenance Services. Revenue for managed and cloud services is generally recognized on a straight-line basis over the contractual term of the arrangements, which is consistent with the timing of services rendered. Revenue from the sale of third-party retail maintenance contracts is recognized net of the related cost of revenue. In third-party retail maintenance contracts, all services are provided by third-party providers and, as a result, we are acting as an agent and not considered the primary obligor. As we are under no obligation to perform additional services, revenue is recognized at the time of sale. Revenue from the sale of third-party wholesale maintenance contracts is recognized on a gross basis at the time of sale with the selling price to the client recorded as revenue and the acquisition cost recorded as cost of revenue. Based upon the evaluation of indicators for gross and net reporting, we have concluded that we are acting as a principal in these contracts.
Cost of Revenue, Gross Profit, and Gross Margin
Technology Offerings Gross Profit
Technology offerings gross profit is equal to technology offerings revenue less the acquisition cost of the product, recorded as cost of revenue, net of technology partners and distributor rebates. Technology offerings gross profit is impacted by the complexity of hardware and software sold in our solutions, as well as the mix of product type with generally higher gross profits coming from the sale of collaboration products.
Services Gross Profit
Services gross profit is equal to services revenue less cost of revenue associated with services.
Professional Services Gross Profit. Cost of revenue associated with professional services includes the compensation, benefits, and other costs associated with our delivery and project management engineering team, as well as costs charged by third-party contractors. Costs associated with our delivery and project management engineering team are generally recognized as incurred. Costs charged by third-party contractors are initially deferred as prepaid expense and generally recorded as cost of revenue when the professional service project is complete or when contractual milestones have been achieved. As a result, our services gross profit may fluctuate from period to period.
Managed, Cloud, and Maintenance Services Gross Profit. Compensation, benefits, and other costs associated with our managed and in-house maintenance services engineering team, costs charged by subcontractors, and costs of running our three Network Operations Centers, or NOCs, are recorded as cost of revenue as incurred. These costs include depreciation of certain equipment and software utilized in our NOCs in support of our managed, cloud, and maintenance services contracts. We incur external costs associated with professional and managed services, primarily related to purchasing maintenance support contracts with third-party manufacturers and software licenses, which are generally prepaid. These costs, associated with maintenance contracts where we have an obligation to perform services, are incurred specifically to assist us in rendering services to our customers and are recorded as deferred customer support contract costs at the time the costs are incurred. The costs are amortized to expense as a cost of revenue—services on a straight-line basis over the period during which we fulfill our performance obligation. Third-party wholesale maintenance services cost
37
Table of Contents
of revenue is the acquisition cost from technology partners. In addition, our managed, cloud, and maintenance services gross profit is impacted by the mix of wholesale versus retail third-party maintenance revenue and the average contractual length of the third-party maintenance agreements.
Services gross profit is generally impacted by our ability to negotiate longer term managed and cloud contracts with our clients, maintaining a high contract renewal rate, effectively managing our service level agreements, or SLAs, resolving a large percentage of the incidents in-house, increasing utilization rates of our NOC engineers, and timing of revenue recognition. Our services gross profit is impacted by our ability to deliver on fixed-price professional services engagements within scope, and our ability to keep our delivery engineers utilized.
Gross margin measures our gross profit as a percentage of revenue. Gross margin is generally impacted by changes in the mix of product type sold as well as the mix of services versus technology offerings revenue, with generally higher gross margins coming from the sale of collaboration products and services revenue.
Operating Expenses
Our operating expenses include sales and marketing expenses, general and administrative expenses, transaction costs, and depreciation and amortization.
Sales and Marketing Expense. Sales and marketing expense is comprised of compensation, commission expense, variable incentive pay, and benefits related to our sales personnel, along with travel expenses, other employee related costs including stock-based compensation, and expenses related to marketing programs and events. Commission expenses are largely driven by gross margin performance and are generally paid to the sales personnel when the solutions revenue has been collected from the client.
General and Administrative Expense. General and administrative expense is comprised of compensation and benefits of administrative personnel, including variable incentive pay and stock-based compensation, and other administrative costs such as facilities expenses, professional fees, and travel expenses.
Transaction Costs. We present transaction costs as a separate line item within operating expenses based on it being a material cost that varies period to period. Transaction costs include acquisition-related expenses, including integration costs, employee retention bonuses, severance charges, advisory and due diligence fees, and transaction-related legal and accounting due diligence costs. Transaction costs for the year ended December 31, 2017 include the write-off of previously capitalized deferred offering costs.
Depreciation and Amortization Expense. Depreciation expense relates to our fixed assets except for assets used in cost of revenue. Amortization expense relates to intangible assets we acquired in our business acquisitions.
Interest Expense and Other, Net
Interest expense and other, net includes interest expense associated with our outstanding debt and costs associated with the refinancing of our debt, which includes debt extinguishment losses. We also may seek to finance strategic acquisitions in the future with the proceeds from additional debt incurrences, which may have an impact on our interest expense.
Income Tax Expense (Benefit)
We are subject to U.S. federal income taxes, state income taxes net of federal income tax effect, and nondeductible expenses. Our effective tax rate will vary depending on permanent nondeductible expenses and other factors.
38
Table of Contents
Results of Operations
The following tables set forth our consolidated financial data in dollar amounts and as a percentage of total revenue.
| Year Ended December 31, |
||||||||||||
| 2017 | 2016 | 2015 | ||||||||||
| (in thousands) | ||||||||||||
| Revenue: |
||||||||||||
| Technology offerings |
$ | 453,106 | $ | 439,804 | $ | 297,481 | ||||||
| Services |
465,820 | 375,805 | 303,983 | |||||||||
|
|
|
|
|
|
|
|||||||
| Total revenue |
918,926 | 815,609 | 601,464 | |||||||||
|
|
|
|
|
|
|
|||||||
| Cost of revenue: |
||||||||||||
| Technology offerings |
348,430 | 333,082 | 220,377 | |||||||||
| Services |
296,011 | 233,283 | 187,641 | |||||||||
|
|
|
|
|
|
|
|||||||
| Total cost of revenue |
644,441 | 566,365 | 408,018 | |||||||||
|
|
|
|
|
|
|
|||||||
| Gross profit: |
||||||||||||
| Technology offerings |
104,676 | 106,722 | 77,104 | |||||||||
| Services |
169,809 | 142,522 | 116,342 | |||||||||
|
|
|
|
|
|
|
|||||||
| Total gross profit |
274,485 | 249,244 | 193,446 | |||||||||
|
|
|
|
|
|
|
|||||||
| Operating expenses: |
||||||||||||
| Sales and marketing |
139,469 | 128,733 | 96,578 | |||||||||
| General and administrative |
61,367 | 40,262 | 36,955 | |||||||||
| Transaction costs |
14,071 | 6,055 | 5,678 | |||||||||
| Depreciation and amortization |
34,908 | 27,692 | 23,520 | |||||||||
|
|
|
|
|
|
|
|||||||
| Total operating expenses |
249,815 | 202,742 | 162,731 | |||||||||
|
|
|
|
|
|
|
|||||||
| Operating income |
24,670 | 46,502 | 30,715 | |||||||||
|
|
|
|
|
|
|
|||||||
| Other (income) expense |
||||||||||||
| Interest income |
(105 | ) | (11 | ) | (26 | ) | ||||||
| Interest expense |
52,057 | 31,438 | 23,072 | |||||||||
| Other expense, net |
87 | 10 | 72 | |||||||||
|
|
|
|
|
|
|
|||||||
| Interest expense and other, net |
52,039 | 31,437 | 23,118 | |||||||||
|
|
|
|
|
|
|
|||||||
| (Loss) income before income taxes |
(27,369 | ) | 15,065 | 7,597 | ||||||||
| Income tax (benefit) expense |
(19,348 | ) | 6,716 | 3,574 | ||||||||
|
|
|
|
|
|
|
|||||||
| Net (loss) income |
$ | (8,021 | ) | $ | 8,349 | $ | 4,023 | |||||
|
|
|
|
|
|
|
|||||||
| Year Ended December 31, | ||||||||||||
| 2017 | 2016 | 2015 | ||||||||||
| Revenue: |
||||||||||||
| Technology offerings |
49.3 | % | 53.9 | % | 49.5 | % | ||||||
| Services |
50.7 | % | 46.1 | % | 50.5 | % | ||||||
|
|
|
|
|
|
|
|||||||
| Total revenue |
100.0 | % | 100.0 | % | 100.0 | % | ||||||
|
|
|
|
|
|
|
|||||||
| Gross Margin: |
||||||||||||
| Technology offerings |
23.1 | % | 24.3 | % | 25.9 | % | ||||||
| Services |
36.5 | % | 37.9 | % | 38.3 | % | ||||||
| Total gross margin |
29.9 | % | 30.6 | % | 32.2 | % | ||||||
39
Table of Contents
Year Ended December 31, 2017 Compared to the Year Ended December 31, 2016
Revenue
| Year Ended December 31, |
Change | |||||||||||||||
| 2017 | 2016 | Amount | % | |||||||||||||
| (in thousands) | ||||||||||||||||
| Technology offerings |
$ | 453,106 | $ | 439,804 | $ | 13,302 | 3.0 | % | ||||||||
| Services |
465,820 | 375,805 | 90,015 | 24.0 | % | |||||||||||
|
|
|
|
|
|
|
|||||||||||
| Total revenue |
$ | 918,926 | $ | 815,609 | $ | 103,317 | 12.7 | % | ||||||||
|
|
|
|
|
|
|
|||||||||||
| Technology offerings as a percentage of total revenue |
49.3 | % | 53.9 | % | ||||||||||||
| Services as a percentage of total revenue |
50.7 | % | 46.1 | % | ||||||||||||
Total revenue increased $103.3 million, or 12.7%, to $918.9 million in 2017 from $815.6 million in 2016. The revenue increase was primarily driven by the $90.0 million growth in our services and by a $13.3 million growth in technology offerings.
Technology offerings revenue increased $13.3 million, or 3.0%, to $453.1 million in 2017 from $439.8 million in 2016. The technology offerings revenue increase was partially offset by a decline in sales in the collaboration market as a result of Avaya filing for bankruptcy in January 2017. Avaya’s bankruptcy filing has caused some of our clients to delay collaboration technology offerings purchasing decisions as Avaya worked through their bankruptcy. Avaya is one of our significant collaboration partners thus causing a decline in our collaboration technology offerings revenue. Technology offerings revenue from the Annese, SPS, RGTS and AOS acquisitions accounted for $66.9 million in 2017.
Services revenue increased $90.0 million, or 24.0%, to $465.8 million in 2017 from $375.8 million in 2016. The services revenue growth was primarily driven by acquisitions and revenue growth for managed, cloud, and maintenance services due to new contracts. Services revenue from the Annese, SPS, RGTS and AOS acquisitions accounted for $82.1 million in 2017.
Revenue by Core Technology Market
| Year Ended December 31, |
Change | |||||||||||||||
| 2017 | 2016 | Amount | % | |||||||||||||
| (in thousands) | ||||||||||||||||
| Collaboration revenue: |
||||||||||||||||
| Technology offerings |
$ | 227,981 | $ | 232,357 | $ | (4,376 | ) | (1.9 | )% | |||||||
| Services |
381,715 | 319,208 | 62,507 | 19.6 | % | |||||||||||
|
|
|
|
|
|
|
|||||||||||
| Total collaboration revenue |
$ | 609,696 | $ | 551,565 | $ | 58,131 | 10.5 | % | ||||||||
|
|
|
|
|
|
|
|||||||||||
| Enterprise networking, data center, cloud, and security revenue |
||||||||||||||||
| Technology offerings |
$ | 225,125 | $ | 207,447 | $ | 17,678 | 8.5 | % | ||||||||
| Services |
84,105 | 56,597 | 27,508 | 48.6 | % | |||||||||||
|
|
|
|
|
|
|
|||||||||||
| Total enterprise networking, data center, cloud, and security revenue |
$ | 309,230 | $ | 264,044 | $ | 45,186 | 17.1 | % | ||||||||
|
|
|
|
|
|
|
|||||||||||
| Total revenue |
$ | 918,926 | $ | 815,609 | $ | 103,317 | 12.7 | % | ||||||||
|
|
|
|
|
|
|
|||||||||||
Collaboration
Collaboration revenue increased $58.1 million, or 10.5%, to $609.7 million for 2017 from $551.6 million for 2016. Of the increase, $62.5 million was the result of an increase in services revenue offset by a $4.4 million decrease in technology offerings revenue. The increase in collaboration services revenue of $62.5 million is due
40
Table of Contents
to a $69.0 million increase in services revenue from the SPS, Annese and RGTS acquisitions offset by a decrease due to delayed purchasing decisions and timing of contract renewals for some large customers related to the Avaya bankruptcy, which we do not believe will impact our future revenues or financial position. The decrease in collaboration technology revenue of $4.4 million was due to clients’ delayed purchasing decisions related to the Avaya bankruptcy offset by $26.9 million from the SPS, Annese and RGTS acquisitions.
Enterprise, Networking, Data Center, Cloud, and Security
Enterprise, networking, data center, cloud, and security revenue increased $45.2 million, or 17.1%, to $309.2 million for 2017 from $264.0 million for 2016. Of the increase, $31.0 million was the result of an increase in revenue primarily related to the Annese acquisition.
Cost of Revenue, Gross Profit, and Gross Margin
| Year Ended December 31, |
Change | |||||||||||||||
| 2017 | 2016 | Amount | % | |||||||||||||
| (in thousands) | ||||||||||||||||
| Cost of revenue |
||||||||||||||||
| Technology offerings |
$ | 348,430 | $ | 333,082 | $ | 15,348 | 4.6 | % | ||||||||
| Services |
296,011 | 233,283 | 62,728 | 26.9 | % | |||||||||||
|
|
|
|
|
|
|
|||||||||||
| Total cost of revenue |
$ | 644,441 | $ | 566,365 | $ | 78,076 | 13.8 | % | ||||||||
|
|
|
|
|
|
|
|||||||||||
| Gross profit |
||||||||||||||||
| Technology offerings |
$ | 104,676 | $ | 106,722 | $ | (2,046 | ) | (1.9 | )% | |||||||
| Services |
169,809 | 142,522 | 27,287 | 19.1 | % | |||||||||||
|
|
|
|
|
|
|
|||||||||||
| Total gross profit |
$ | 274,485 | $ | 249,244 | $ | 25,241 | 10.1 | % | ||||||||
|
|
|
|
|
|
|
|||||||||||
| Gross Margin |
||||||||||||||||
| Technology offerings |
23.1 | % | 24.3 | % | ||||||||||||
| Services |
36.5 | % | 37.9 | % | ||||||||||||
| Total gross margin |
29.9 | % | 30.6 | % | ||||||||||||
Total gross profit increased $25.2 million, or 10.1%, to $274.5 million for 2017 from $249.2 million for 2016. Total gross margin decreased 70 basis points to 29.9% of total revenue for 2017 from 30.6% for 2016. Total gross profit from the Annese, SPS, RGTS and AOS acquisitions accounted for $47.1 million for 2017.
Technology offerings gross margin decreased 120 basis points to 23.1% for 2017 from 24.3% for 2016. Technology offerings gross margins decreased primarily due to a shift in product mix from the collaboration market to the enterprise, networking, data center, cloud, and security market, which generally has lower gross margins.
Services gross margin decreased 140 basis points as a percentage of services revenue to 36.5% for 2017 from 37.9% for 2016, primarily due to the declining mix of higher margin collaboration services revenue.
Operating Expenses
| Year Ended December 31, |
Change | |||||||||||||||
| 2017 | 2016 | Amount | % | |||||||||||||
| (in thousands) | ||||||||||||||||
| Sales and marketing |
$ | 139,469 | $ | 128,733 | $ | 10,736 | 8.3 | % | ||||||||
| General and administrative |
61,367 | 40,262 | 21,105 | 52.4 | % | |||||||||||
| Transaction costs |
14,071 | 6,055 | 8,016 | 132.4 | % | |||||||||||
| Depreciation and amortization |
34,908 | 27,692 | 7,216 | 26.1 | % | |||||||||||
|
|
|
|
|
|
|
|||||||||||
| Total operating expenses |
$ | 249,815 | $ | 202,742 | $ | 47,073 | 23.2 | % | ||||||||
|
|
|
|
|
|
|
|||||||||||
41
Table of Contents
Sales and Marketing Expense
Sales and marketing expense increased $10.7 million, or 8.3%, to $139.5 million for 2017 from $128.7 million for 2016. The increase in sales and marketing expense was primarily driven by $18.9 million of additional expenses for operations of acquired businesses in 2017 offset by reductions in salaries and benefits of $6.6 million, reduced commissions and bonuses of $0.6 million, reduced professional fees of $0.5 million and $0.5 million reduction in other expenses.
General and Administrative Expense
General and administrative expense increased $21.1 million, or 52.4%, to $61.4 million for 2017 from $40.3 million for 2016. The increase was primarily due to an $11.2 million increase in salaries and benefits, a $2.8 million increase in office expenses, a $2.5 million increase in other expenses, a $2.5 million increase in professional fees and a $1.8 million increase in commissions and bonuses. General and administrative expenses from acquisitions was $15.6 million for 2017.
Transaction Costs
Transaction costs increased $8.0 million, or 132.4%, to $14.1 million for 2017 from $6.1 million for 2016. The increase was due to $5.7 million of additional transaction-related professional fees and expenses, including legal, accounting, tax, and advisory fees, $1.4 million of additional one-time acquisition-related integration costs and $0.9 million of additional employee retention bonuses. Transaction costs for 2017 include the write-off of $2.8 million of previously capitalized deferred offering costs.
Depreciation and Amortization
Depreciation and amortization expense increased $7.2 million, or 26.1%, to $34.9 million for 2017 from $27.7 million for 2016. The increase was primarily due to purchases of property and equipment and an increase in amortization due to recent acquisitions.
Interest Expense and Other, Net
| Year Ended December 31, |
Change | |||||||||||||||
| 2017 | 2016 | Amount | % | |||||||||||||
| (in thousands) | ||||||||||||||||
| Interest expense and other, net |
$ | 52,039 | $ | 31,437 | $ | 20,602 | 65.5 | % | ||||||||
Interest expense and other, net increased $20.6 million, or 65.5%, to $52.0 million for 2017 from $31.4 million for 2016. The net increase was primarily the result of higher interest expense associated with increased debt balances as a result of borrowings used to partially pay for our recent acquisitions in addition to non-recurring, interest expense related to extinguishment costs incurred related to the debt refinancing of $13.5 million.
Income Tax (Benefit) Expense
| Year Ended December 31, |
Change | |||||||||||||||
| 2017 | 2016 | Amount | % | |||||||||||||
| (in thousands) | ||||||||||||||||
| Income tax (benefit) expense |
$ | (19,348 | ) | $ | 6,716 | $ | (26,063 | ) | (388.1 | )% | ||||||
The effective tax rate increased to 70.7% for 2017 from 44.6% for 2016. The increase in the effective rate for 2017 is primarily the result of a one-time non-cash tax benefit of $9.8 million related to federal tax reform changes permanently reducing the corporate income tax rate to 21% from 35% effective January 1, 2018, offset by the negative impact of nondeductible expenses on the overall tax benefit on loss before income taxes for 2017.
42
Table of Contents
Year Ended December 31, 2016 Compared to the Year Ended December 31, 2015
Revenue
| Year Ended December 31, |
Change | |||||||||||||||
| 2016 | 2015 | Amount | % | |||||||||||||
| (in thousands) | ||||||||||||||||
| Technology offerings |
$ | 439,804 | $ | 297,481 | $ | 142,323 | 47.8% | |||||||||
| Services |
375,805 | 303,983 | 71,822 | 23.6% | ||||||||||||
|
|
|
|
|
|
|
|||||||||||
| Total revenue |
$ | 815,609 | $ | 601,464 | $ | 214,145 | 35.6% | |||||||||
|
|
|
|
|
|
|
|||||||||||
| Technology offerings as a percentage of total revenue |
53.9% | 49.5% | ||||||||||||||
| Services as a percentage of total revenue |
46.1% | 50.5% | ||||||||||||||
Total revenue increased $214.1 million, or 35.6%, to $815.6 million in 2016 from $601.5 million in 2015. Revenue from the MSN and SIGMAnet acquisitions accounted for $244.1 million and $69.3 million of our revenue in 2016 and 2015, respectively. Excluding the impact of the MSN and SIGMAnet acquisitions, but including the impact of the Sunturn acquisition, our total revenue was $571.5 million and $532.2 million in 2016 and 2015, respectively. We have not excluded the impact of the Sunturn acquisition as it was fully integrated into our operations during 2015. The revenue growth, excluding the impact of the MSN and SIGMAnet acquisitions, of $39.3 million was primarily driven by the $7.1 million growth in our technology offerings and the $32.2 million growth in services.
Technology offerings revenue increased $142.3 million, or 47.8%, to $439.8 million in 2016 from $297.5 million in 2015. Revenue from the MSN and SIGMAnet acquisitions accounted for $198.4 million and $63.2 million of our technology offerings revenue in 2016 and 2015, respectively. Excluding the impact of the MSN and SIGMAnet acquisitions, but including the impact of the Sunturn acquisition, our technology offerings revenue was $241.4 million and $234.3 million in 2016 and 2015, respectively. The revenue growth, excluding the impact of the MSN and SIGMAnet acquisitions, of $7.1 million was primarily driven by growth of our collaboration solutions due to higher demand from existing clients and new clients.
Services revenue increased $71.8 million, or 23.6%, to $375.8 million in 2016 from $304.0 million in 2015. Revenue from the MSN and SIGMAnet acquisitions accounted for $45.8 million and $6.2 million of our services revenue in 2016 and 2015, respectively. Excluding the impact of the MSN and SIGMAnet acquisitions, but including the impact of the Sunturn acquisition, our services revenue was $330.0 million and $297.8 million in 2016 and 2015, respectively. The revenue growth, excluding the impact of the MSN and SIGMAnet acquisitions, of $32.2 million was related to a $9.6 million increase in professional services primarily due to higher demand for our professional services, in particular from our collaboration clients, as well as higher contractual revenue of $22.6 million associated with our managed, cloud, and maintenance services primarily driven by continued demand for managed services and private cloud services from our collaboration clients.
43
Table of Contents
Revenue by Core Technology Market
| Year Ended December 31, |
Change | |||||||||||||||
| 2016 | 2015 | Amount | % | |||||||||||||
| (in thousands) | ||||||||||||||||
| Collaboration revenue: |
||||||||||||||||
| Technology offerings |
$ | 232,357 | $ | 207,202 | $ | 25,155 | 12.1% | |||||||||
| Services |
319,208 | 288,167 | 31,041 | 10.8% | ||||||||||||
|
|
|
|
|
|
|
|||||||||||
| Total collaboration revenue |
$ | 551,565 | $ | 495,369 | $ | 56,196 | 11.3% | |||||||||
|
|
|
|
|
|
|
|||||||||||
| Enterprise networking, data center, cloud, and security revenue |
||||||||||||||||
| Technology offerings |
$ | 207,447 | $ | 90,279 | $ | 117,168 | 129.8% | |||||||||
| Services |
56,597 | 15,816 | 40,781 | 257.8% | ||||||||||||
|
|
|
|
|
|
|
|||||||||||
| Total enterprise networking, data center, cloud, and security revenue |
264,044 | 106,095 | 157,949 | 148.9% | ||||||||||||
|
|
|
|
|
|
|
|||||||||||
| Total revenue |
$ | 815,609 | $ | 601,464 | $ | 214,145 | 35.6% | |||||||||
|
|
|
|
|
|
|
|||||||||||
Collaboration
Collaboration revenue increased $56.2 million, or 11.3%, to $551.6 million in 2016 from $495.4 million in 2015. Of the increase, $25.2 million was the result of an increase of technology offerings revenue, and $31.0 million was the result of an increase in services revenue from the collaboration market.
The increase of $25.2 million in technology offerings revenue was driven by revenue growth, excluding the impact of the MSN and SIGMAnet acquisitions, of $16.7 million due to additional client demand for our technology offerings in the collaboration market and $8.5 million related to revenue from the MSN and SIGMAnet acquisitions. Our services revenue increase of $31.0 million in the collaboration market was driven by revenue growth, excluding the impact of the MSN and SIGMAnet acquisitions, of which $28.5 million was due to higher demand for our professional services, as well as higher contractual revenue associated with our managed, cloud, and maintenance services, and $2.5 million related to revenue from the MSN and SIGMAnet acquisitions.
Enterprise Networking, Data Center, Cloud, and Security
Enterprise networking, data center, cloud, and security revenue increased $157.9 million, or 148.9%, to $264.0 million in 2016 from $106.1 million in 2015. Of the increase, $117.2 million was the result of an increase of our enterprise networking, data center, cloud, and security technology offerings revenue and $40.7 million was the result of an increase in our enterprise networking, data center, cloud, and security services revenue.
Our enterprise networking, data center, cloud, and security technology offerings revenue increase of $117.2 million was primarily due to an increase related to revenue from the MSN and SIGMAnet acquisitions. Our enterprise networking, data center, cloud, and security services revenue increase of $40.7 million was primarily due to a $37.0 million increase in revenue related to the MSN and SIGMAnet acquisitions. Revenue growth, excluding the impact of the MSN and SIGMAnet acquisitions, of $3.7 million was primarily due to an increase in demand for our professional services and maintenance services.
44
Table of Contents
Cost of Revenue, Gross Profit, and Gross Margin
| Year Ended December 31, |
Change | |||||||||||||||
| 2016 | 2015 | Amount | % | |||||||||||||
| (in thousands) | ||||||||||||||||
| Cost of revenue |
||||||||||||||||
| Technology offerings |
$ | 333,082 | $ | 220,377 | $ | 112,705 | 51.1 | % | ||||||||
| Services |
233,283 | 187,641 | 45,642 | 24.3 | % | |||||||||||
|
|
|
|
|
|
|
|||||||||||
| Total cost of revenue |
$ | 566,365 | $ | 408,018 | $ | 158,347 | 38.8 | % | ||||||||
|
|
|
|
|
|
|
|||||||||||
| Gross profit |
||||||||||||||||
| Technology offerings |
$ | 106,722 | $ | 77,104 | $ | 29,618 | 38.4 | % | ||||||||
| Services |
142,522 | 116,342 | 26,180 | 22.5 | % | |||||||||||
|
|
|
|
|
|
|
|||||||||||
| Total gross profit |
$ | 249,244 | $ | 193,446 | $ | 55,798 | 28.8 | % | ||||||||
|
|
|
|
|
|
|
|||||||||||
| Gross Margin |
||||||||||||||||
| Technology offerings |
24.3 | % | 25.9 | % | ||||||||||||
| Services |
37.9 | % | 38.3 | % | ||||||||||||
| Total gross margin |
30.6 | % | 32.2 | % | ||||||||||||
Total gross profit increased $55.8 million, or 28.8%, to $249.2 million in 2016 from $193.5 million in 2015, primarily as a result of an increase in total cost of revenue of 38.8% between periods. Total gross margin decreased 160 basis points to 30.6% of total revenue in 2016 from 32.2% in 2017. The decrease in total gross margin was primarily due to a decrease in our services revenue as a percentage of total revenue and a decrease in our collaboration revenue as a percentage of total revenue primarily due to our MSN and SIGMAnet acquisitions. Excluding the impact of the acquisitions, our gross margin would have been 32.6% in 2016.
Technology offerings gross margin decreased 160 basis points to 24.3% in 2016 from 25.9% in 2015. The decrease in technology offerings gross margin was primarily due to an increase in total sales in our lower margin enterprise networking, data center, cloud, and security core technology markets due to the MSN and SIGMAnet acquisitions. Excluding the impact of the acquisitions, our technology offerings gross margin would have been 26.4% in 2016, an increase of 50 basis points primarily due to a shift in product mix to higher margin collaboration services.
Services gross margin decreased 40 basis points to 37.9% in 2016 from 38.3% in 2015 primarily due to an increase in revenue of our managed, cloud, and maintenance services offset by lower professional services margin from the MSN and SIGMAnet acquisitions. Excluding the impact of the acquisitions, our services gross margin would have been 38.2% in 2016.
Operating Expenses
| Year Ended December 31, |
Change | |||||||||||||||
| 2016 | 2015 | Amount | % | |||||||||||||
| (in thousands) | ||||||||||||||||
| Sales and marketing |
$ | 128,733 | $ | 96,578 | $ | 32,155 | 33.3 | % | ||||||||
| General and administrative |
40,262 | 36,955 | 3,307 | 8.9 | % | |||||||||||
| Transaction costs |
6,055 | 5,678 | 377 | 6.6 | % | |||||||||||
| Depreciation and amortization |
27,692 | 23,520 | 4,172 | 17.7 | % | |||||||||||
|
|
|
|
|
|
|
|||||||||||
| Total operating expense |
$ | 202,742 | $ | 162,731 | $ | 40,011 | 24.6 | % | ||||||||
|
|
|
|
|
|
|
|||||||||||
Sales and Marketing Expense
Sales and marketing expense increased $32.1 million, or 33.3%, to $128.7 million in 2016 from $96.6 million in 2015. Incremental sales and marketing expense from the MSN and SIGMAnet acquisitions
45
Table of Contents
accounted for $22.2 million. The $22.2 million increase was primarily related to higher personnel-related costs of $12.1 million, $8.5 million of sales commissions and bonuses related to higher gross profits and $1.6 million of marketing, meetings and travel, professional fees and office expenses. Sales and marketing expense growth, excluding acquisitions, of $9.9 million was driven by $4.2 million of higher personnel-related expenses related to an increase in sales personnel, $4.2 million of commissions and bonuses due to improved performance, and $1.5 million of marketing, meetings and travel, and professional fees.
General and Administrative Expense
General and administrative expense increased $3.3 million, or 8.9%, to $40.3 million in 2016 from $37.0 million in 2015. General and administrative expense increased $4.5 million due to MSN and SIGMAnet acquisitions, partially offset by a decrease in expenses of $1.2 million due to continued cost management.
Transaction Costs
Transaction costs increased $0.4 million, or 6.6%, to $6.1 million in 2016 from $5.7 million in 2015, primarily due to acquisition-related integration costs.
Depreciation and Amortization
Depreciation and amortization expense increased $4.2 million, or 17.7%, to $27.7 million in 2016 from $23.5 million in 2015, primarily due to $3.2 million in higher amortization expense associated with acquired intangible assets related to our MSN and SIGMAnet acquisitions, offset by a $1.0 million reduction for assets that are fully amortized. Depreciation expense increased $2.0 million as a result of property and equipment acquired related to the MSN and SIGMAnet acquisitions and purchases in 2016.
Interest Expense and Other, Net
| Year Ended December 31, |
Change | |||||||||||||||
| 2016 | 2015 | Amount | % | |||||||||||||
| (in thousands) | ||||||||||||||||
| Interest expense and other, net |
$ | 31,437 | $ | 23,118 | $ | 8,319 | 36.0 | % | ||||||||
Interest expense and other, net increased $8.3 million, or 36.0%, to $31.4 million in 2016 from $23.1 million in 2015. The net increase was primarily due to the refinancing of our debt, which resulted in higher interest expense associated with increased debt balances as a result of borrowings used to pay for the October 2016 cash distribution to stockholders. In addition, interest expense in 2016 included $4.5 million in costs associated with the refinancing of our debt, consisting of $1.8 million in transaction costs, $1.5 million in debt extinguishment losses, and a $1.2 million write-off of unamortized debt issuance costs.
Income Tax Expense
| Year Ended December 31, |
Change | |||||||||||||||
| 2016 | 2015 | Amount | % | |||||||||||||
| (in thousands) | ||||||||||||||||
| Income tax expense |
$ | 6,716 | $ | 3,574 | $ | 3,142 | 87.9 | % | ||||||||
Income tax expense increased $3.1 million, to $6.7 million in 2016 from $3.6 million in 2015, primarily due to an increase in the pre-tax income offset by a lower effective tax rate. The effective tax rate decreased to 44.6% in 2016 from 47.0% in 2015, as a result of lower state income taxes as a percentage of taxable income and the effect of an acquisition accounting adjustment, offset partially by an increase in the effect of higher nondeductible expenses and other items.
Liquidity and Capital Resources
As of December 31, 2017, we had $13.5 million of cash. We believe our cash, cash flows from operations and availability of borrowings will be sufficient to support our planned operations for at least the next 12 months.
46
Table of Contents
We finance our operations and capital expenditures through a combination of internally generated cash from operations and from borrowings under our revolver. Our long-term needs primarily include meeting debt service requirements, working capital requirements, and capital expenditures. We may also pursue strategic acquisition opportunities that may impact our future cash requirements. There are a number of factors that may negatively impact our available sources of funds in the future including the ability to generate cash from operations and borrow on our debt facilities. The amount of cash generated from operations is dependent upon factors such as the successful execution of our business strategies and general economic conditions. The amount of cash available for borrowings under our various debt facilities is dependent on our ability to maintain sufficient collateral and general financial conditions in the marketplace.
We may opportunistically raise debt capital, subject to market and other conditions, to refinance our existing capital structure at a lower cost of capital. Additionally, as part of our growth strategies, we may also raise debt capital for strategic alternatives and general corporate purposes. If additional financing is required from outside sources, we may not be able to raise it on terms acceptable to us or at all. If we are unable to raise additional capital when desired, our business, operating results, and financial condition may be adversely affected.
Indebtedness
In June 2014, we entered into a $190 million first lien term loan, an $80 million second lien term loan, and a $25 million undrawn revolver. In May 2015, we borrowed an additional $50 million as an incremental facility to partially fund our 2015 acquisitions. In October 2016, we amended the credit agreements governing our first lien term loan, second lien term loan, and revolver to, among other things, permit a $90 million shareholder distribution and increase the maximum borrowing availability of our revolver by $40 million to $65 million. In March 2017, we entered into an incremental term loan joinder agreement to increase our first lien term loan commitments in an aggregate amount of $50 million to fund future acquisitions and provide working capital. We borrowed $10 million under the new agreement for working capital purposes in March 2017.
In June 2017, we paid off the existing first and second lien credit agreements including the revolving line-of-credit commitment in its entirety and entered into a new financing arrangement. We entered into a $430 million term loan agreement with a maturity date in June 2024. In July 2017, we borrowed an additional $75 million as an incremental term loan to partially fund our acquisitions, which also matures in June 2024. In October 2017, we borrowed an additional $60 million as an incremental term loan, which also matures in June 2024. In addition, in June 2017, we entered into a revolving loan agreement that provides a loan facility of $150 million and amended and restated the existing floorplan arrangement to extend credit in the form of floorplan advances, up to $150 million.
A portion of the proceeds of the term loan were used to repay the previously existing first and second lien credit agreements and debt issuance costs. Remaining proceeds will be used for working capital needs and general corporate purposes. Please see section titled “Description of Indebtedness” for further information.
In February 2018, the revolver agreement was amended to increase the revolving loan facility amount to $200 million. The revolver agreement matures in June 2022.
The outstanding borrowing on the revolver as of March 19, 2018 was $100 million. Of that amount, $54 million was used for the Business Combination, $35 million was used for the acquisition of ASI and the remainder was used for normal working capital purposes.
47
Table of Contents
Liquidity
We generally fund our short- and long-term liquidity needs through a combination of cash on hand, cash flows generated from operations, and available borrowings under our revolving credit facility. Our management regularly monitors certain liquidity measures to monitor performance. We believe that the most important of those measures include net debt and available liquidity.
| Year Ended December 31, |
||||||||||||
| 2017 | 2016 | 2015 | ||||||||||
| (in thousands) | ||||||||||||
| Net debt |
$ | 568,850 | $ | 394,506 | $ | 311,465 | ||||||
| Available liquidity |
91,153 | 74,632 | 30,307 | |||||||||
Net Debt
We define net debt as total debt less cash. The following table presents our calculation of net debt as of the dates indicated:
| Year Ended December 31, |
||||||||||||
| 2017 | 2016 | 2015 | ||||||||||
| (in thousands) | ||||||||||||
| Long term debt, net of debt issuance costs and current maturities |
$ | 566,424 | $ | 388,964 | $ | 314,508 | ||||||
| Plus unamortized debt issuance costs |
10,249 | 11,850 | 9,860 | |||||||||
| Plus current maturities of term debt |
5,652 | 3,324 | 2,404 | |||||||||
|
|
|
|
|
|
|
|||||||
| Total debt |
582,325 | 404,138 | 326,772 | |||||||||
| Less cash |
13,475 | 9,632 | 15,307 | |||||||||
|
|
|
|
|
|
|
|||||||
| Net debt |
$ | 568,850 | $ | 394,506 | $ | 311,465 | ||||||
|
|
|
|
|
|
|
|||||||
Available Liquidity
We calculate our available liquidity as a sum of cash from our consolidated balance sheet plus the amount available and unutilized on our revolving credit facilities.
The following table presents our calculation of available liquidity as of the dates indicated:
| Year Ended December 31, |
||||||||||||
| 2017 | 2016 | 2015 | ||||||||||
| (in thousands) | ||||||||||||
| Cash |
$ | 13,475 | $ | 9,632 | $ | 15,307 | ||||||
| Unutilized revolver |
77,678 | 65,000 | 15,000 | |||||||||
|
|
|
|
|
|
|
|||||||
| Available liquidity |
$ | 91,153 | $ | 74,632 | $ | 30,307 | ||||||
|
|
|
|
|
|
|
|||||||
Cash Flows
The following table shows our cash flows for 2017, 2016 and 2015:
| Year Ended December 31, |
||||||||||||
| 2017 | 2016 | 2015 | ||||||||||
| (in thousands) | ||||||||||||
| Operating activities |
$ | (6,524 | ) | $ | 22,856 | $ | 14,470 | |||||
| Investing activities |
(152,439 | ) | (9,025 | ) | (72,523 | ) | ||||||
| Financing activities |
162,806 | (19,506 | ) | 56,298 | ||||||||
48
Table of Contents
Operating Activities
Net cash provided by operating activities consists of net income (loss) adjusted for noncash items, such as: depreciation and amortization of property and equipment and intangible assets, deferred income taxes, stock-based compensation, amortization of debt issuance costs, losses on extinguishments of debt or disposals of property and equipment, and for changes in net working capital assets and liabilities. Generally, the most significant factor relates to nondeductible book amortization expense associated with intangible assets. The timing between the conversion of our receivables into cash from our customers and disbursements to our vendors is the primary driver of changes in our working capital.
Net cash used in operating activities for 2017 was $6.5 million. This was primarily attributable to net income (loss) before depreciation and amortization of $28.3 million partially offset by several working capital component changes that aggregate to a net $46.8 million use of cash for operating activities. The most significant working capital component changes relate to: (1) a $7.6 million decrease in accounts payable and accrued expenses due to a decrease in the days outstanding as well as changes in the timing of purchases and (2) a $38.7 million increase in accounts receivable due to an increase in revenue and days sales outstanding.
Net cash provided by operating activities for 2016 was $22.9 million. This was primarily attributable to net income before depreciation and amortization of $36.9 million partially offset by several working capital component changes that aggregate to a net $16.2 million use of cash for operating activities. The most significant working capital component changes relate to: (1) an $11.1 million decrease in accounts payable and accrued expenses due to a decrease in the days outstanding as well as changes in the timing of purchases and (2) a $5.5 million increase in accounts receivable driven by increased revenue in 2016 as compared to 2015. A $2.7 million loss on the extinguishment of debt related to our debt refinancing also increased net cash provided by operating activities for 2016.
Net cash provided by operating activities for 2015 was $14.5 million. This was primarily attributable to net income before depreciation and amortization of $27.9 million partially offset by several working capital component changes that aggregate to a net $12.9 million use of cash for operating activities. The most significant working capital component change relates to a $32.1 million increase in accounts receivable due to significantly higher revenue in 2015 as compared to 2014 and an increase in the days outstanding during 2015. Several other related working capital components changed significantly due to the increase in revenue in 2015, including a $12.9 million increase in accounts payable and accrued expenses due to significantly higher purchasing volume to support the revenue growth, as well as higher accrued compensation due to increased headcount as a result of the three acquisitions during 2015, and a corresponding increase in inventory of $3.7 million. The significant increases in our revenue and related cost of services during 2015 as compared to 2014 was due to both our acquisition growth and our organic growth which resulted in a $10.3 million increase in deferred revenue and a $7.7 million increase in prepaid expenses and deferred customer support contracts.
Investing Activities
Net cash used in investing activities for 2017 was $152.4 million, primarily due to business acquisitions net of cash acquired of $142.9 million and $9.5 million of capital expenditures.
Net cash used in investing activities for 2016 was $9.0 million, primarily due to the purchase of equipment of $9.3 million.
Net cash used in investing activities for 2015 was $72.5 million, primarily due to the acquisition of businesses of $67.0 million and the purchase of equipment of $5.5 million.
Financing Activities
Net cash provided by financing activities for 2017 was $162.8 million and was primarily related to proceeds, net of discount, from the refinancing of term loans of $570.0 million offset by the repayment of the
49
Table of Contents
existing first and second lien term loans of $416.8 million. $20.0 million was also provided by proceeds from the revolving credit agreements, which was partially offset by a $3.3 million payment of extinguishment charges for repayment of the existing loans, a $6.6 million payment of deferred financing costs for the new term loan and $0.4 million for repurchase of our common stock.
Net cash used in financing activities for 2016 was $19.5 million and was primarily related to a $10.0 million net payment on our revolving credit facility, $2.6 million of principal payments on our first lien term loan, and payment of $5.4 million of costs and charges related to our debt refinancing. An $89.9 million cash distribution to stockholders was paid in 2016, which was funded by proceeds from the October 2016 increase to the first lien term loan.
Net cash provided by financing activities for 2015 was $56.3 million and was primarily related to a $49.8 million increase in our first lien term loan as a result of the $50.0 million of borrowings under our first lien term loan in May 2015 to fund acquisitions, $20.0 million borrowings on the revolver, partially offset by $10.0 million of payments on the revolver and $2.3 million of principal payments on our first lien term loan.
Contractual Obligations and Commitments
Contractual obligations are cash that we are obligated to pay as part of certain contracts that we have entered during the course of business. Below is a table that shows the projected outlays as of December 31, 2017:
| Payments due by Period: | ||||||||||||||||||||
| Total | < 1 Year | 1-3 Years | 4-5 Years | > 5 Years | ||||||||||||||||
| (in thousands) | ||||||||||||||||||||
| Term loan facility |
$ | 562,325 | $ | 5,652 | $ | 11,304 | $ | 11,304 | $ | 534,065 | ||||||||||
| Revolving line-of-credit |
20,000 | — | — | — | 20,000 | |||||||||||||||
| Interest |
230,496 | 36,632 | 72,255 | 70,679 | 50,930 | |||||||||||||||
| Operating leases |
29,784 | 8,176 | 10,639 | 7,005 | 3,964 | |||||||||||||||
|
|
|
|
|
|
|
|
|
|
|
|||||||||||
| Total |
$ | 842,605 | $ | 50,460 | $ | 94,198 | $ | 88,988 | $ | 608,959 | ||||||||||
|
|
|
|
|
|
|
|
|
|
|
|||||||||||
Off-Balance Sheet Arrangements
During 2017, 2016 and 2015 we did not have any relationships with any entities or financial partnerships, such as structured finance or special purpose entities established for the purpose of facilitating off-balance sheet arrangements or other purposes.
Seasonality
Our results are affected by the budget cycles of our client base which generally result in stronger sales in the second half of the year. We believe this variability is largely due to our clients’ and technology partners’ fiscal year ends, as well as budgetary and spending patterns of our clients. As a result of our historically higher portion of sales in the second half of each year, our cost of revenue and commission expense increase during such periods relative to any increase in revenue. The increased cost of revenue and commission expense, and other impacts of seasonality, may affect profitability in a given quarter.
Qualitative and Quantitative Disclosures About Market Risk
Interest Rate Risk
Interest rates are highly sensitive to many factors, including U.S. fiscal and monetary policies and domestic and international economic and political considerations, as well as other factors beyond our control. Interest rate risk is the exposure to loss resulting from changes in the level of interest rates and the spread between different interest rates. We are exposed to market risk from changes in interest rates on debt, which bears interest at variable rates. Our debt has floating interest rates. We are exposed to changes in the level of interest rates and to
50
Table of Contents
changes in the relationship or spread between interest rates for our floating rate debt. Our floating rate debt requires payments based on variable interest rates such as the federal funds rate, prime rate, eurocurrency rate, and LIBOR. Therefore, increases in interest rates may reduce our net income or increase our net loss by increasing the cost of debt. As of December 31, 2017, we had $568.9 million of total debt subject to variable interest rates. Based on the amount outstanding as of December 31, 2017, if the interest rate on our borrowings were to increase by 50 or 100 basis points over a twelve month period, our annual interest cost on borrowings subject to variable interest rates would increase or decrease by $2.9 million or $5.7 million, respectively.
Critical Accounting Policies and Estimates
Our management’s discussion and analysis of financial condition and results of operations is based on our consolidated financial statements which have been prepared in accordance with accounting principles generally accepted in the United States of America. In preparing our financial statements, we make estimates, assumptions, and judgments that can have a significant impact on our reported revenue, results of operations, and net income or loss, as well as on the value of certain assets and liabilities on our balance sheet during and as of the reporting periods. These estimates, assumptions, and judgments are necessary because future events and their effects on our results and the value of our assets cannot be determined with certainty, and are made based on our historical experience and on other assumptions that we believe to be reasonable under the circumstances. These estimates may change as new events occur or additional information is obtained, and we may periodically be faced with uncertainties, the outcomes of which are not within our control and may not be known for a prolonged period of time. Because the use of estimates is inherent in the financial reporting process, actual results could differ from those estimates.
The critical accounting estimates, assumptions, and judgments that we believe have the most significant impact on our consolidated financial statements are described below.
Revenue Recognition
Products, installation, and maintenance services are typically sold as a bundled arrangement containing multiple deliverables of new and/or refurbished hardware, software, and professional services associated with installing, maintaining, and managing the business communications systems. Revenue from multiple-element arrangements is allocated to the various elements based on the relative selling price of the elements, and each element is considered a separate accounting unit, with recognition of revenue based on the criteria met for the individual element of the multiple-element arrangement. When available, we use vendor-specific objective evidence (VSOE) to determine the selling price of a unit of accounting. If VSOE does not exist, we use third-party evidence of the selling price for similar products and services. For units of accounting in which there is no VSOE or third-party evidence of selling price, we use the best estimate of selling price using a cost plus margin approach.
Technology Offerings Revenue
Revenue for hardware and software. We sell communication products, which consist of hardware and essential software. We do not provide post-contract customer support for software or incur software development costs. The software and hardware are necessary to deliver the essential functionality of the communication products. Revenue from the sale of hardware and software products is generally recognized on a gross basis with the sales price to the customer recorded as revenue and the acquisition cost of the product recorded as cost of revenue, net of certain partner funding. Revenue is recognized when the title and risk of loss are passed to the customer, there is persuasive evidence of an arrangement for sale, the sales price is fixed and determinable, and collectability is reasonably assured. Hardware and software items can be delivered to customers in a variety of ways including as physical products shipped from our warehouses, via drop-shipment by the vendor or distributor, or via electronic delivery for software licenses.
We maintain an estimate for sales returns and credit losses based on historical experience. Our technology partners typically provide warranties to our customers on equipment sold.
51
Table of Contents
Services Revenue
Revenue for Professional Services. We recognize revenue from professional services, which includes the design, configuration, installation, and integration of business communication and data systems, as the services are performed and all obligations have been substantially met.
Revenue for Managed, Cloud, and Maintenance Services. We recognize revenue for managed services, which are for agreements of one year or greater for more than one service offering, on a straight-line basis over the term of the arrangement, which is consistent with the timing of services rendered. We incur external costs associated with professional and managed services, primarily related to purchasing maintenance support contracts with third party manufacturers and software licenses, which are generally prepaid. These costs, associated with maintenance contracts where we have an obligation to perform services, are incurred specifically to assist us in rendering services to customers and are recorded as deferred customer support contract costs at the time the costs are incurred. The costs are amortized to expense as a cost of revenue—services on a straight-line basis over the period during which we fulfill our performance obligation.
We consider the principal versus agent accounting guidance to determine if we are the primary obligor in the arrangement and if revenue should be recognized gross or net of the associated costs. Applying the principal versus agent accounting guidance is a matter of judgment based on consideration of several factors and indicators.
Revenue from the sale of third-party retail maintenance contracts is recognized net of the related cost of revenue. In third-party retail maintenance contracts, all services are provided by third-party providers and as a result we concluded that we are acting as an agent and are not considered the primary obligor. As we are under no obligation to perform additional services, revenue is recognized at the time of sale.
Revenue from the sale of third-party wholesale maintenance contracts is recognized on a gross basis at the time of sale with the selling price to the client recorded as revenue and the acquisition cost recorded as cost of revenue. Based upon the evaluation of indicators for net and gross reporting, we concluded that we are acting as a principal in these contracts.
Impairment of Assets
Finite-life intangible assets include customer relationships, trademarks, noncompetition agreements, and internally developed software. These intangible assets are amortized over the estimated period during which the asset is expected to contribute directly or indirectly to future cash flows.
We review our long-lived assets for impairment whenever events or circumstances exist that indicate the carrying amount of an asset or asset group may not be recoverable. The recoverability of long-lived assets is measured by a comparison of the carrying amount of the asset or asset group to the future undiscounted cash flows expected to be generated by that asset group. If the asset or asset group is considered to be impaired, an impairment loss would be recorded to adjust the carrying amounts to the estimated fair value. Management has determined that no impairment of long-lived assets exists, and accordingly, no adjustments to the carrying amounts of our long-lived assets has been made for the periods presented.
Goodwill
We record goodwill when the purchase price of a business acquisition exceeds the fair value of net tangible and identifiable intangible assets acquired in a business acquisition. Goodwill is assessed for impairment annually, or more frequently when events or changes in circumstances indicate that the fair value of a reporting unit has more likely than not declined below our carrying value. We have determined that we operate our business in one operating segment and one reporting unit and have selected October 1 as the date to perform our annual impairment test.
We perform either a qualitative or quantitative assessment to determine if the fair value of our reporting unit exceeds the carrying value. The qualitative goodwill impairment assessment requires evaluating factors to
52
Table of Contents
determine whether it is more likely than not that the fair value of a reporting unit is less than our carrying amount. As part of our goodwill qualitative assessment process, we evaluate various factors that are specific to the reporting unit that include, but are not limited to, macroeconomic conditions, industry and market considerations, and our overall financial performance.
When performing the quantitative assessment to calculate the fair value of a reporting unit, we consider both comparative market multiples as well as estimated discounted cash flows for the reporting unit. The significant estimates and assumptions include, but are not limited to, revenue growth rates, operating margins, and future economic and market conditions. The discount rates are based upon the reporting unit’s weighted-average cost of capital. If an impairment is identified, the second step is to measure the impairment loss by comparing the implied fair value of goodwill with the carrying value of the goodwill for the reporting unit.
We performed our annual test in 2017 using a quantitative assessment and determined that it was not more likely than not that the fair value of our reporting unit was less than the carrying amount. We believe the quantitative factors considered in the impairment analysis are reasonable, however, significant changes in any one of our assumptions could produce a different result and result in impairment charges that could be material to our consolidated financial statements.
Stock-based Compensation
We measure and recognize stock-based compensation expense for all stock-based awards made to employees and directors based on the fair value of the awards as of the date they were each granted and the corresponding expense is recognized over the requisite service period of the awards, both for stock options and restricted stock grants. We measure and recognize stock-based compensation expense for all stock-based awards to non-employees based on the fair value of the award, which is re-measured at the end of each reporting period until vested, and the corresponding expense is recognized over the requisite service period.
We use the Black-Scholes option pricing model to determine the fair value of stock-based awards. The model utilizes the value of our common stock as well as assumptions regarding the award’s expected life, risk-free interest rate, expected volatility of the underlying stock, and expected dividends. The specific assumptions we use include the following:
Fair value of common stock—prior to the closing of the Business Combination, management primarily used periodic valuation studies obtained from a third-party valuation firm to determine the fair value of our common stock. In performing our valuation analysis, the valuation firm used information provided by management and a number of assumptions based on market and economic conditions. As a publicly traded company, we will determine the fair value of each share of underlying common stock based on the closing price of our common stock as reported on Nasdaq on the date of grant.
Expected term—we estimate the expected term using the simplified method due to the lack of historical data regarding the expected life of the awards. The simplified method calculates the expected term as the mid-point between the vesting date and the contractual expiration date of the award.
Risk-free interest rate—we use interest rates based on U.S. Treasury yields in effect at the time of grant over the expected term of the award.
Expected volatility—we use the average of the historical volatility of public companies in industries similar to ours.
Dividends—we have historically not paid dividends.
We use judgment in evaluating the factors used in the Black-Scholes pricing model. As a result, if factors change, stock-based compensation expense could be significantly different in the future.
53
Table of Contents
Stock-based compensation expense is classified as sales and marketing expense or general and administrative expense consistent with other compensation expense associated with the award recipient. We have not capitalized stock-based employee compensation cost or recognized any tax benefits related to these costs.
Partner Funding
We receive payments and credits from vendors for various programs, including rebates, volume incentive programs, and shared marketing expense programs. Each program varies in length and has varying conditions or achievement targets that determine the amount of consideration we are eligible to receive. We estimate and recognize the amount of vendor consideration earned when it is probable and reasonably estimable using the information available or historical data. Changes in estimates of the consideration earned could have a material effect on results of operations and cash flows. We recognize vendor consideration as a reduction of either cost of revenue for rebates and volume incentives or operating expenses for shared marketing expenses or marketing development fund programs based on the nature of the consideration earned.
Business Combinations
We account for business combinations and acquisitions using the acquisition method. The acquisition method requires that the total purchase price of the acquired entity be allocated to the assets acquired and liabilities assumed based on their fair values at the acquisition date. The assets acquired include the analysis and recognition of intangible assets such as customer relationships, trade names, developed technology, and contractual rights and the liabilities assumed include contractual commitments and contingencies. Any premium paid over the fair value of the net assets and liabilities acquired is recorded as goodwill in connection with a business combination. The results of operations for an acquired entity are included in the consolidated financial statements from the date of acquisition.
Recently Adopted Accounting Pronouncements
In January 2017, the Financial Accounting Standards Board (“FASB”) issued Accounting Standards Update (“ASU”) 2017-03, Accounting Changes and Error Corrections (Topic 250) and Investments-Equity Method and Joint Ventures (Topic 323): Amendments to SEC Paragraphs Pursuant to Staff Announcements at the September 22, 2016 and November 17, 2016 EITF Meetings. This ASU amends the FASB Accounting Standards Codification (“ASC” or “the Codification”) for SEC staff announcements made at recent Emerging Issues Task Force meetings and is effective immediately. The new guidance is intended to provide clarity in relation to the disclosure of the impact that ASU 2014-09 and ASU 2016-02 will have on our consolidated financial statements when adopted. Registrants are required to disclose the effect that recently issued accounting standards will have on their financial statements when adopted in a future period. In cases where a registrant cannot reasonably estimate the impact of the adoption, then additional qualitative disclosures should be considered. The ASU incorporates these SEC staff views into ASC 250 and adds references to that guidance in the transition paragraphs of ASU 2014-09 and ASU 2016-02, which are defined below. We believe our disclosures below regarding the impact of recently issued accounting standards to be adopted in a future period are aligned with the guidance in the ASU.
On January 1, 2017, we adopted ASU 2015-11, Inventory (Topic 330): Simplifying the Measurement of Inventory, which restricts the valuation of inventory to the lower of cost or net realizable value, which is the estimated selling price in the ordinary course of business less reasonably predictable costs of completion, disposal and transportation. The adoption of ASU 2015-11 did not have a material impact on the consolidated financial statements.
On January 1, 2017, we adopted ASU 2016-09, Compensation—Stock Compensation (Topic 718): Improvements to Employee Share-Based Payment Accounting, which provides areas for simplification in the accounting for share-based payment transactions. Areas included for simplification include, but are not limited to, accounting for income taxes, classification of excess tax benefits on the statement of cash flows, forfeitures and minimum statutory withholding. We elected to continue estimating forfeitures of share-based awards. The adoption of ASU 2016-09 did not have a material impact on the consolidated financial statements.
54
Table of Contents
In January 2017, the FASB issued ASU 2017-04, Intangibles – Goodwill and Other: Simplifying the Test for Goodwill Impairment to simplify the subsequent measurement of goodwill by eliminating Step 2 of the goodwill impairment test. If a reporting unit fails Step 1 of the goodwill impairment test, entities are no longer required to compute the implied fair value of goodwill following the same procedure that would be required in determining the fair value of assets acquired and liabilities assumed in a business combination. Instead, the guidance requires an entity to perform its annual or interim goodwill impairment test by comparing the fair value of a reporting unit with its carrying amount and to recognize an impairment charge for the amount by which the carrying amount exceeds the reporting unit’s fair value. We concluded that ASU 2017-04 is preferable to the current guidance due to efficiency, since ASU 2017-04 eliminates the requirement to determine the fair value of individual assets and liabilities of a reporting unit to measure goodwill impairment. We early adopted this guidance as of the beginning of the fourth quarter of fiscal 2017. The guidance is applied prospectively and the adoption of this standard did not have any impact on the consolidated financial statements.
Recently Issued Accounting Pronouncements Not Yet Adopted
In May 2014, the FASB issued ASU 2014-09, Revenue from Contracts with Customers (Topic 606), which outlines a single, comprehensive model for accounting for revenue from contracts with customers, requiring an entity to recognize the amount of revenue to which it expects to be entitled for the transfer of promised goods or services to customers. The updated standard will replace most existing revenue recognition guidance in U.S. GAAP when it becomes effective and permits the use of either a full retrospective or retrospective with cumulative effect transition method. In August 2015, the FASB issued ASU 2015-14, Revenue from Contracts with Customers (Topic 606): Deferral of the Effective Date, which defers the effective date of ASU 2014-09 by one year, making it effective for annual reporting periods beginning after December 15, 2018 and interim periods within that fiscal year, with early adoption permitted.
The FASB has issued the following additional ASUs to amend the guidance in ASU 2014-09, all of which have effective dates concurrent with the effective date of ASU 2014-09:
| (1) | In March 2016, the FASB issued ASU 2016-08, Revenue from Contracts with Customers (Topic 606): Principal versus Agent Considerations (Reporting Revenue Gross versus Net), which clarifies the implementation guidance on principal versus agent considerations within the new revenue recognition standard. |
| (2) | In April 2016, the FASB issued ASU 2016-10, Revenue from Contracts with Customers (Topic 606): Identifying Performance Obligations and Licensing, which enhances the guidance around identifying performance obligations in customer contracts within the new revenue recognition standard. |
| (3) | In May 2016, the FASB issued ASU 2016-12, Revenue from Contracts with Customers (Topic 606): Narrow-scope Improvements and Practical Expedients, which provides additional guidance around certain areas of the new revenue recognition standard. These areas include, but are not limited to, assessing the collectability criterion, presentation of sales taxes and accounting for noncash consideration. |
| (4) | In December 2016, the FASB issued ASU 2016-20, Technical Corrections and Improvements to Topic 606, Revenue from Contracts with Customers, which provides additional guidance around narrow areas of the new revenue recognition standard. These areas include, but are not limited to, contract costs and modifications and remaining performance obligations. |
We do not intend to early adopt the new revenue recognition guidance and therefore all of the ASUs noted above will be effective for us for the year ending December 31, 2019. We expect to begin evaluating the effect of the revenue recognition ASUs during the second quarter of 2018. The evaluation will include selecting a transition method for these revenue recognition ASUs and determining the effect that the updated standards will have on the historical and future consolidated financial statements.
55
Table of Contents
In February 2016, the FASB issued ASU 2016-02, Leases (Topic 842), which changes the accounting for leases in order to increase transparency and comparability among organizations by recognizing lease assets and lease liabilities on the balance sheet and disclosing key information about leasing arrangements. The guidance in this ASU supersedes the leasing guidance in Topic 840, Leases. Under the new guidance, lessees are required to recognize lease assets and lease liabilities on the balance sheet for all leases with terms longer than 12 months. Leases will be classified as either finance or operating, with classification affecting the pattern of expense recognition in the income statement. The standard has an effective date for fiscal years beginning after December 15, 2019 and interim periods within those fiscal years, with early adoption permitted. A modified retrospective transition approach is required for lessees for capital and operating leases existing at, or entered into after, the beginning of the earliest comparative period presented in the financial statements, with certain practical expedients available. We do not currently intend to early adopt the new leasing guidance and therefore ASU 2016-02 will be effective for us for the year ending December 31, 2020. If we lose emerging growth company status in 2018, the standard will be effective for us for the year ending December 31, 2019. We have not yet begun to evaluate the effect of the new guidance on the consolidated financial statements.
In August 2016, the FASB issued ASU 2016-15, Statement of Cash Flows (Topic 230): Classification of Certain Receipts and Cash Payments, to address diversity in practice regarding the presentation of eight specific cash flow situations. These situations include, but are not limited to, debt prepayment and debt extinguishment costs and contingent consideration payments made after a business combination. The standard has an effective date for fiscal years beginning after December 15, 2018, and interim periods within those fiscal years, with early adoption permitted. We are currently evaluating the impact that the standard will have on the consolidated financial statements.
In January 2017, the FASB issued ASU 2017-01, Business Combinations (Topic 805): Clarifying the Definition of a Business, to clarify the definition of a business and add guidance to assist entities with evaluating whether transactions should be accounted for as acquisitions (or disposals) of assets or businesses. The standard has an effective date for annual periods beginning after December 15, 2018, and interim periods within those annual periods, with early adoption permitted. We are currently evaluating the impact that the standard will have on the consolidated financial statements.
In May 2017, the FASB issued ASU No. 2017-09, Compensation – Stock Compensation (Topic 718): Scope of Modification Accounting, which clarifies that modification accounting is required only if the fair value, the vesting conditions, or the classification of the award (as equity or liability) changes as a result of the changes in terms or conditions. ASU 2017-09 is effective for fiscal years beginning after December 15, 2017, and interim periods within those annual periods, with early adoption permitted. The amendments in this standard should be applied prospectively to an award modified on or after the adoption date. We are currently evaluating the impact that the standard will have on the consolidated financial statements, but do not believe this update will have a significant impact.
56
Table of Contents
ConvergeOne
ConvergeOne is a leading IT services provider of collaboration and technology solutions for large and medium enterprises. We serve clients through our comprehensive engagement model which includes the full lifecycle of services from consultation and design through implementation, optimization, and ongoing support. Approximately 46% and 51% of our total revenue in 2016 and 2017 respectively, was derived from our services offerings, which include professional and managed, cloud, and maintenance services. ConvergeOne’s deep technical expertise enables it to deliver complex, multi-vendor solutions across a number of delivery models, including on-premise and in private, hybrid, C1 Cloud, and public cloud environments. We served over 3,400, 3,700, and 7,200 clients in 2015, 2016 and 2017, respectively, which includes clients served in 2017 by companies we acquired in 2017. From 2015 to 2017, we served 57% of the Fortune 100, 43% of the Fortune 500, and 36% of the Fortune 1000, which includes clients served in the same period by companies we acquired in 2017.
Through our leading professional services capabilities, we design thousands of solutions each year across our core technology markets: (i) collaboration and (ii) enterprise networking, data center, cloud, and security, each of which is complemented by our industry-leading managed, cloud, and maintenance services. Managed, cloud, and maintenance services typically have multi-year contractual terms with high renewal rates and accounted for 29% and 34% of our total revenue in 2016 and 2017, respectively. Through our relationships with more than 300 leading and next-generation technology partners, our engineers deliver optimal services and solutions to clients regardless of their existing infrastructure.
Collaboration technology is essential to modern business, enabling workforce mobility and driving globalization through connectivity across any device. Collaboration solutions create significant competitive advantages through enhanced productivity, innovative ways of working together, and omni-channel customer engagement models. With our more than 20-year focus on collaboration solutions, we believe we will benefit from the rapid growth of this market. We derived approximately 68% and 66% of our total revenue in 2016 and 2017, respectively, from services and technology offerings in the collaboration market.
We believe we are well positioned to capture opportunities resulting from major IT trends. As a result of the increased demand for software-centric and multi-vendor solutions, the process of designing, integrating, and managing these solutions has become significantly more complex. At the same time, businesses are seeking to adopt technologies across a range of delivery methods as they increasingly migrate their infrastructure to the cloud. Enterprises are looking to IT service providers that have the technical expertise and relationships with leading technology partners to deliver these new technologies across any consumption model.
Our technical expertise and client-centric culture have led to long-standing and expanding client relationships. With more than 1,300 highly skilled engineers and consulting professionals and approximately 330 sales professionals, we are able to deliver customized services and technology offerings to address the specific needs of our clients. Additionally, among our top 100 clients based on 2017 revenue, excluding the impact of our 2017 acquisitions, we have an average tenure of more than nine years. We generated 91% and 93% of our total revenue in 2016 and 2017, respectively, from clients we served in a prior year, excluding the impact of our 2017 acquisitions.
Our services-driven approach has generated industry-leading customer satisfaction rates. According to a third-party conducted survey, our Net Promoter Score, or NPS, of 61 in 2016 was more than twice the technology vendor industry average of 30. NPS is a commonly used industry measure of customers’ overall satisfaction. Our NPS highlights our ability to differentiate us from competitors through our overall quality of service and technical expertise. Additionally, in this survey 86% of our clients indicated that they are “highly likely” to recommend us to other businesses and organizations.
During 2016 and 2017, we served over 3,700 and 7,200 clients, respectively, which includes clients served in 2017 by companies we acquired in 2017. Our client base is diversified across large and medium enterprises
57
Table of Contents
and across industry verticals. In 2016, our top 10 and top 25 clients accounted for 17% and 29% of total revenue, respectively, and our largest client represented approximately 4% of total revenue. In 2017, our top 10 and top 25 clients accounted for 10% and 16% of total revenue, respectively, and our largest client represented approximately 2% of total revenue. Our top 100 clients accounted for 54% and 29% of our total revenue in 2016 and 2017, respectively.
Our Market
We participate in a rapidly evolving IT market, which has been driven by numerous technological advancements, including cloud, software-defined infrastructure, virtualization, security, mobility, data analytics, and IoT. These secular trends, along with a mobile and global workforce that expects constant connectivity, have resulted in the need for increasingly complex, distributed, and multi-vendor IT environments. Enterprises are increasingly seeking the assistance of IT service providers who have the expertise to consult, design, integrate, and manage their technology solutions and platforms.
According to our analysis based on data from IDC-Blackbook, the global IT market is expected to grow from $3.4 trillion in 2016 to $4.0 trillion in 2021, representing a compound annual growth rate, or CAGR, of 3%. We primarily operate in the North American IT market, which, according to ConvergeOne’s analysis based on data from IDC-Blackbook, is expected to grow from $1.2 trillion to $1.4 trillion, representing a CAGR of 3%.
We are focused on the high-growth collaboration, enterprise networking, data center, cloud, and security solutions markets. These markets are expected to grow in excess of the broader IT market given the pace of technological innovation, the need for enterprises to drive enhanced productivity within their workforce, and the shift from on-premise infrastructure to software-centric hosted and cloud solutions.
Our addressable markets are shown below on a global basis:
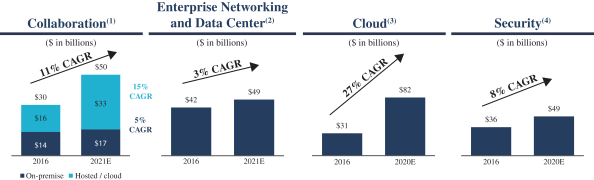
| (1) | IDC-2017 UC&C |
| (2) | IDC-Network Infrastructure |
| (3) | IDC-Cloud Services |
| (4) | IDC-IT Security Products |
Collaboration
The collaboration market consists of both unified communications and customer engagement. Unified communications involves the integration of real-time enterprise communication services such as voice, email, presence, chat/text, video, conferencing technology, messaging, mobility, and bring your own device, or BYOD, to provide a consistent and unified user interface and experience across multiple devices and media types. Customer engagement is comprised of integrated customer relationship management and other self-service applications that enable businesses to connect with customers across any channel and to deliver consistent high-quality service utilizing monitoring, analytics, and workforce optimization capabilities.
58
Table of Contents
Illustrative unified communications environment
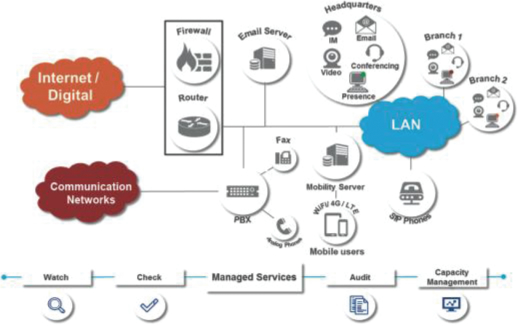
Illustrative customer engagement environment:
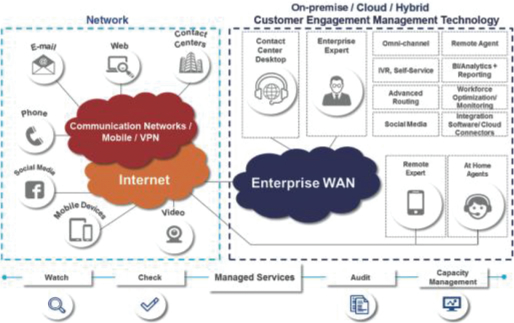
As illustrated above, the unified communications and customer engagement markets are highly complex and require the design, configuration, integration, implementation, and management of multiple, disparate technology systems and vendors to provide an interoperable solution with the full breadth of available features and functionality, and a best-in-class user experience. A customer engagement solution typically comprises products from numerous vendors and may have thousands of possible technology combinations.
59
Table of Contents
This need to integrate new IT solutions and business applications into existing IT infrastructure across multiple vendors and systems is driving increased demand for consulting-led solutions from collaboration services providers. As a result, enterprises are increasingly turning to IT service providers, like our company, to deliver, manage and maintain a fully integrated collaboration solution. IT service providers of collaboration, which offer solutions as part of a service or a cloud environment, are expected to have an advantage over legacy on-premise equipment vendors, according to IDC.
The underlying collaboration market is benefiting from several broader industry trends that are driving increased demand. The modern enterprise’s workforce is both more mobile and global, requiring advanced collaboration capabilities across a range of communication types and devices to drive productivity and improve collaboration both internally and externally. At the same time, enterprises are facing new challenges to effectively engage with their customers, who are demanding more personalized communication and utilizing new channels of engagement. Additionally, the growing complexity of multi-vendor, software-centric solutions is driving the need for advanced managed services.
We believe the collaboration market is in the early stages of the rise of cloud consumption, which is causing businesses to reconsider their deployment strategies for collaboration solutions. According to IDC, hosted and cloud revenue is expected to exceed on-premise revenue in the overall collaboration market in 2016. Businesses are replacing legacy communication systems with Internet-Protocol, or IP, technology that significantly enhances collaboration capabilities, reduces costs, and enables unified communications software applications. We believe this shift will also result in additional services opportunities as enterprises look to IT service providers to help them configure, provision, and manage their software applications in the cloud.
Based on our analysis of IDC-2017 UC&C, we estimate that the global collaboration market will grow from $30 billion in 2016 to $50 billion in 2021, representing a CAGR of 11%. IDC defines collaboration to include IP telephony, IP phones, videoconferencing systems, video as a service, hosted/cloud voice and unified communications, contact center infrastructure and software, mobile collaboration, and collaborative applications.
Within the broader collaboration market, hosted and cloud collaboration solutions are expected to grow the fastest because organizations are increasingly looking for scalable, flexible, and mobile friendly solutions while simultaneously seeking to reduce capital costs. Based on our analysis of IDC-2017 UC&C, we estimate that the hosted and cloud collaboration market will grow more than twice as fast as the on-premise market from 2016 to 2021, with hosted and cloud revenue at $16 billion in 2016 and projected to grow to $33 billion by 2021, representing a CAGR of 15%.
Enterprise Networking and Data Center
The increasing number of public, private, and hybrid cloud deployments is a key growth driver for enterprise networking and data center infrastructure technologies. From the supply-side, the infrastructure required to support cloud deployments necessitates upgraded hardware and ongoing maintenance of old platforms and technologies. At the same time, more business applications are delivered and accessed as a service via the cloud, driving demand for faster speeds and higher bandwidth capacity. For example, enterprises are increasingly utilizing the cloud to back up the vast amounts of data they are amassing from increasing regulatory requirements, business continuity needs, IoT, and big data initiatives, driving demand for additional storage and virtualization technology. These trends are forcing enterprises to refresh both their enterprise networking and data center equipment to meet the demands of a modern IT infrastructure. Based on our analysis of IDC-Network Infrastructure, we estimate that the enterprise networking and data center market (including hardware systems and enterprise WLAN equipment) was $42 billion in 2016 and is projected to grow to $49 billion in 2021, representing a CAGR of 3%.
Cloud
Over the past several years, demand for cloud deployments has grown as enterprises seek scalable, flexible, and cost-effective options for deploying their IT infrastructure. In a public cloud environment, the service
60
Table of Contents
provider supplies the necessary hardware and software infrastructure, and as a result, there is no need for an enterprise to provision or deploy our own resources or allocate IT staff to manage the service. In a private cloud environment, infrastructure is owned and operated by the enterprise or created and managed by a third party for the business’ exclusive use. A hybrid cloud offers some combination of a public and private cloud. Increasingly, enterprises are utilizing a multi-cloud, multi-vendor strategy, which is driving growth across all environments. Based on our analysis of IDC-Cloud Services, we estimate that the global cloud infrastructure services and management market (IaaS and PaaS) was $31 billion in 2016 and is projected to grow to $82 billion in 2020, representing a CAGR of 27%.
Security
The increase in the number of connected devices and the increasing prevalence of cyberattacks in recent years has led to a heightened focus on information security for businesses of all sizes. As cyber security has become a mission-critical priority for IT organizations, increases in budgets have driven spending in the enterprise security market, as follows, based on our analysis of the indicated source:
| • | IDC-IT Security Products estimates that worldwide spending on information security was approximately $36 billion in 2016 and is projected to grow to approximately $49 billion in 2020, representing a CAGR of 8%; |
| • | IDC-Network Security estimates that worldwide spending on network security was approximately $12 billion in 2016 and is projected to grow to $17 billion in 2020, representing a CAGR of 10%; |
| • | IDC-Access Management estimates that worldwide spending on identity and access management was approximately $6 billion in 2016 and is projected to grow to $7 billion in 2020, representing a CAGR of 6%; |
| • | IDC-Endpoint Security estimates that worldwide spending on endpoint security was approximately $9 billion in 2016 and is projected to grow to $10 billion in 2020, representing a CAGR of 4%; |
| • | IDC-Specialized Threat estimates that worldwide spending on specialized threat analysis and protection was approximately $2 billion in 2016 and is projected to grow to $3 billion in 2020, representing a CAGR of 20%; |
| • | IDC-Vulnerability Management estimates that worldwide spending on security and vulnerability management was approximately $5 billion in 2016 and is projected to grow to $9 billion in 2020, representing a CAGR of 14%; |
| • | IDC-Messaging Security estimates that worldwide spending on messaging security was approximately $2.0 billion in 2016 and is projected to grow to $2.1 billion in 2020, representing a CAGR of 2%; and |
| • | IDC-Web Security estimates that worldwide spending on web security was approximately $2 billion in 2016 and is projected to grow to $3 billion in 2020, representing a CAGR of 6%. |
Furthermore, given the complexity of vulnerability detection in today’s dynamic threat landscape, enterprises are increasingly looking to IT service providers with the expertise and resources to design and manage their complex IT security infrastructure to help prevent costly breaches.
We believe we are well positioned within the markets in which we compete. We are a client-centric, services-driven organization with deep technical capabilities. We have a team of over 1,300 engineers and consulting professionals with the capability to consult, design, integrate, operate, and optimize our clients’ solutions in the face of increasing IT complexity. As these markets are highly fragmented, we also benefit from our scale, which we believe positions us well and will allow us to gain market share as well as expand sales with existing enterprise clients.
61
Table of Contents
Competitive Strengths
Leading independent provider of services and solutions in the collaboration market
We are a leading independent provider of services and solutions in the collaboration market. In 2016, 68% of our total revenue came from our services and technology offerings in the collaboration market. Our collaboration clients typically require complex, multi-vendor solutions, which may have thousands of possible technology combinations. We can effectively deliver these solutions given our extensive services and engineering capabilities and strong relationships with more than 300 leading and next-generation technology vendors. Our more than 20-year focus on this market and our scale, deep domain expertise, and technical and consulting expertise differentiate us from other market participants and allow us to deliver leading collaboration solutions to our clients.
Attractive services-driven business model
Approximately 46% and 51% of our total revenue in 2016 and 2017, respectively, was derived from our services offerings, which include professional and managed cloud, and maintenance services. We offer a comprehensive suite of services from consultation and design through implementation, optimization, and ongoing support. In 2016 and 2017, 29% and 34% of our total revenue respectively, was derived from our managed, cloud, and maintenance services. Managed, cloud, and maintenance services in the collaboration market typically have multi-year contractual terms, with high renewal rates of approximately 90% in 2015, 2016, and 2017, excluding the impact of our 2017 acquisitions.
The strength of our services-driven business model is also demonstrated by the fact that 97% of our top 1,000 clients utilized our services in 2017, excluding the impact of our 2017 acquisitions. Our top 1,000 clients accounted for greater than 90% of our total revenue in 2016.
Our technical expertise and client-centric culture have led to long-standing and expanding client relationships as evidenced by our top 100 clients having an average tenure of approximately nine years as of December 31, 2017, excluding the impact of our 2017 acquisitions. We generated 91% and 93% of our total revenue in 2016 and 2017, respectively, from clients it served in a prior year, excluding the impact of our 2017 acquisitions.
Flexible, scalable delivery model with leading managed and cloud service capabilities
We offer flexible delivery models, enabling our clients to consume our services and solutions on-premise or in private, hybrid, C1 Cloud, and public cloud environments. Our on-premise solutions can either be managed by the client or by itself depending on specified need. We believe that our ability to deliver and manage complex multi-vendor solutions across environments and with end-to-end services ensures consistent system performance and ongoing client satisfaction.
We provide enterprise-grade, scalable managed and cloud services. As part of our managed and cloud services, we provide an extensive portfolio of incident avoidance offerings, including our proprietary OnGuard software. Our OnGuard software extends beyond traditional monitoring systems, which are focused on network and application monitoring, to include proactive, capacity, predictive, and preventative monitoring to ensure our clients’ systems are operating effectively. Additionally, we utilize three state-of-the-art Network Operations Centers, or NOCs, which operate 24x7x365 and all of which are SOC 2 Type II compliant and one of which is also PCI compliant, enabling us to support approximately 1,350 clients and securely manage approximately three million end points over multiple time zones and geographies.
Deep technological expertise and proprietary intellectual property to solve our clients’ IT challenges
Our highly skilled team of over 1,300 engineers and consulting professionals has the capabilities and skills necessary to address the complex IT needs of large and medium enterprises across our core technology markets:
62
Table of Contents
(i) collaboration and (ii) enterprise networking, data center, cloud, and security. Our dedicated team of engineers and consulting professionals has an average of seven years of experience with ConvergeOne.
We have been highly successful at identifying new technologies and have a long history of innovation, as evidenced by our C1 Cloud offering and the development of our own proprietary intellectual property. Our proprietary OnGuard software extends beyond traditional monitoring systems, which are focused on network and application monitoring, to include proactive, capacity, predictive, and preventative monitoring, to ensure our clients’ systems operate optimally. We believe this has been a key differentiator in attracting new clients and retaining existing clients. Additionally, within our advanced solutions development team, we have developed custom applications for cloud connectors that tie into numerous business applications, including enterprise resource planning and customer relationship management, many of which help our clients better engage with customers.
Long-standing and expanding enterprise client relationships
We served over 3,400, 3,700, 7,200 clients in 2015, 2016 and 2017, respectively, which includes clients served in 2017 by companies we acquired in 2017. From 2015 to 2017, we served 57% of the Fortune 100, 43% of the Fortune 500, and 36% of the Fortune 1000, which includes clients served in the same period by companies we acquired in 2017. Excluding the impact of our 2017 acquisitions, the average tenure of our top 100 clients was more than nine years as of December 31, 2017, and we generated 91% and 93% of our total revenue during 2016 and 2017, respectively, from clients we served in a prior year, excluding the impact of our 2017 acquisitions. We cultivated these long-standing relationships through our commitment to exceptional client service and strong technical expertise.
Our client-centric approach has also helped drive industry leading customer satisfaction rates. According to a third-party conducted survey, our NPS of 61 for 2016 was more than twice the technology vendor industry average of 30. Our NPS highlights our ability to differentiate us from competitors through our overall quality of service and technical expertise. Additionally, in these surveys, 86% of our clients indicated that they are “highly likely” to recommend us to other businesses and organizations.
Differentiated culture fostering motivated and empowered employees to deliver outstanding service
We cultivate and support a dynamic culture that empowers and motivates our employees to deliver exceptional service to our clients. Our success in motivating and empowering our employees is evidenced by our high levels of customer satisfaction and employee retention rate. We are able to attract and retain our IT professionals through a development-focused work culture that has experienced a retention rate of approximately 90%, for engineers and consultants for 2015 and 2016. The consistency of our workforce also contributes to our high client satisfaction rates relative to our industry peers. According to a third-party conducted survey, our NPS of 61 for 2016 was more than twice the technology vendor industry average of 30. Our NPS highlights our ability to differentiate us from competitors through our overall quality of service and technical expertise.
Growth Strategies
Expand cloud and security services
Cloud and security are among the fastest growing and most complex IT markets. Our cloud and security businesses represent significant growth opportunities as they enhance our existing capabilities and further penetrates our client base. We provide cloud solutions to our clients in four distinct environments: (i) private cloud, (ii) C1 Cloud, (iii) hybrid cloud, and (iv) public cloud. We believe we are well positioned to help our clients with their cloud migration strategy given our technical expertise, service capabilities, and multi-vendor expertise. We provide end-to-end network and data security solutions to our clients that combine multiple trusted security technologies into a single platform. Additionally, we provide disaster recovery plans that support every level of our clients’ enterprise from before the event occurs all the way through to the aftermath.
63
Table of Contents
Deepen existing client relationships
We believe we are well positioned to identify new opportunities or enhance existing services and solutions within our existing clients. In 2016 and 2017, 68% and 66% of our total revenue, respectively, came from services and technology offerings in the collaboration market, and we believe there are additional opportunities to sell our services and solutions across our other core technology markets, including enterprise networking, data center, cloud, and security, into our existing client base. In addition, we have the ability to further penetrate our existing client base with our managed, cloud, and maintenance services.
Develop new relationships to expand our client base
We intend to continue to grow our client base by expanding our team of approximately 330 sales professionals. By leveraging our consulting and engineering capabilities and our deep understanding of the underlying technologies, we compete effectively for new clients. We are focused on building our brand to grow within our existing and target end markets where there is strong demand for the services and solutions we provide. In 2016 and 2017, excluding the impact of our 2017 acquisitions, we added 425 and 1,325 new clients, respectively, illustrating the strength of our sales organization and our ability to attract new clients.
Attract, develop, and retain skilled professionals
To support our growth and maintain our competitive position as a leading IT services provider, we plan to grow our highly skilled employee base. Today, we have over 1,300 engineers and consulting professionals and approximately 330 sales professionals with extensive technical expertise. These professionals enable us to use innovative pre-sales strategies, which utilize engineering and consulting expertise to help drive high-value services, and demonstrate competency in developing complex solutions for multi-vendor environments.
Continue to grow our strong domestic footprint and expand internationally
We have a strong and growing presence in the United States and we believe there are significant opportunities for further domestic expansion. Globally, we support approximately 150 multinational clients through our managed services capabilities and our global alliances. We believe there are multiple attractive market opportunities, both domestically and internationally. We will continue to opportunistically expand into new markets.
Add new capabilities and geographic regions through strategic acquisitions
We operate in a fragmented market that offers significant consolidation opportunities. Historically, we have been successful acquiring and integrating companies that have enhanced our offerings and ability to serve our clients. Our recent acquisitions of RGTS, Amese, SPS, and AOS in 2017 and of SIGMAnet, MSN, and Sunturn in 2015 demonstrate our commitment to this strategy and success in integrating acquired companies. We will continue to evaluate strategic acquisitions and partnerships that enhance our capabilities and expand our geographic footprint, both domestically and internationally.
Our Services and Technology Offerings
We provide innovative services and complex, multi-vendor solutions to large and medium enterprises across a variety of delivery models through our dedicated team of over 1,300 highly skilled engineers and consulting professionals. We serve clients through our comprehensive engagement model which includes the full lifecycle of services from consultation and design through implementation, optimization, and ongoing support. Approximately 46% of our total revenue in 2016 was derived from our services offerings, which include professional and managed, cloud, and maintenance services. Through our leading professional services capabilities, we design thousands of solutions each year across our core technology markets: (i) collaboration and (ii) enterprise networking, data center, cloud, and security. Our technology offerings are complemented by our industry-leading managed, cloud, and maintenance services. Our deep technical expertise enables us to deliver
64
Table of Contents
complex, multi-vendor solutions across a number of delivery models, including on-premise and in private, hybrid, C1 Cloud, and public cloud environments. In 2017, excluding the impact of our 2017 acquisitions, 97% of our top 1,000 clients utilized our services.
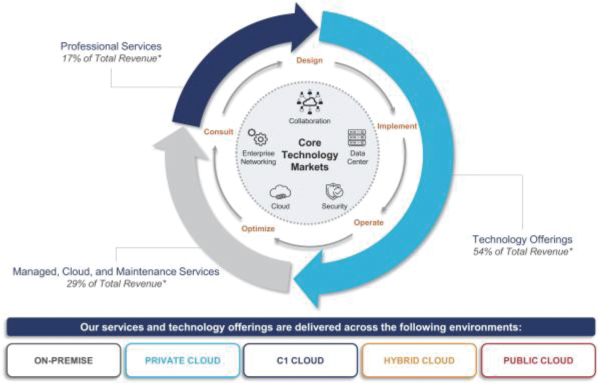
| * | Year ended December 31, 2016. |
Our Services
Approximately 46% and 51% of our total revenue in 2016 and 2017, respectively, was derived from our services offerings, which include professional and managed, cloud, and maintenance services. We provide professional and managed, cloud, and maintenance services across our core technology markets: (i) collaboration and (ii) enterprise networking, data center, cloud, and security.
Professional Services. Professional services involve the consultation, design, integration and implementation, application development, and program management of customized collaboration, enterprise networking, data center, cloud, and security offerings. Working with products acquired from over 100 of the world’s top technology vendors, our engineers are experts at architecting complex IT technology solutions to create custom-designed solutions to meet our clients’ needs. In both 2016 and 2017, 17% of our total revenue was derived from professional services.
Managed, Cloud, and Maintenance Services. Managed, cloud, and maintenance services are contractual services, which typically have multi-year contractual terms and high renewal rates. In 2016 and 2017, 29% and 34%, respectively, of our total revenue came from our managed, cloud, and maintenance services.
Our managed, cloud, and maintenance services include incident-based support, 24x7x365 remote monitoring, Level 3 engineer support, connectivity management, cloud management, parts management, and warranty management. We support approximately 1,350 clients across approximately 9,600 locations in the United States and over 500 locations internationally. We manage approximately three million end points over multiple time zones and geographies. In addition, we provide third-party maintenance to our clients on behalf of our technology partners.
65
Table of Contents
As part of our managed services, we provide an extensive portfolio of incident avoidance offerings, including our proprietary OnGuard software. OnGuard extends beyond traditional monitoring systems, which are focused on network and application monitoring, to include proactive, capacity, predictive, and preventative monitoring to ensure our clients’ systems are operating effectively. We believe this has been a key differentiator in attracting new clients and retaining existing clients. Our monitoring capabilities have also enabled our engineers to identify and quickly address potential issues, leading to an in-house resolution rate for service calls of over 98% for both 2016 and 2017, with less than 2% of calls requiring escalation to our technology partners.
As required by our large and medium enterprise client base, our managed services are designed to be secure and scalable. In May 2016, we successfully completed a SOC 2 Type II audit, validating our security, compliance, and safety-related controls and safeguards for hosting customer data.
We have the capabilities to provide our managed, cloud, and maintenance services on-premise or in private, C1 Cloud, hybrid, and public cloud environments based on the service and security needs of our clients, which differentiates us from other IT solution providers.
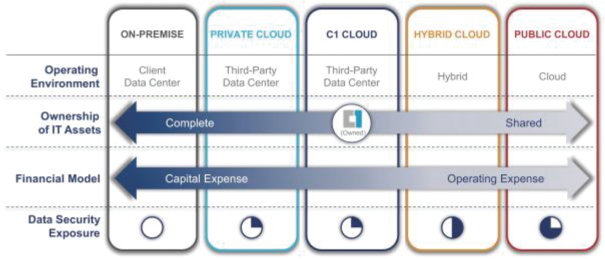
We believe we are well positioned to take advantage of the continued shift from on-premise to cloud as it can offer solutions across multiple delivery models.
Our Technology Offerings
We provide technology offerings to our clients across our core technology markets: (i) collaboration and (ii) enterprise networking, data center, cloud, and security. In 2016 and 2017, 54% and 49%, respectively, of our total revenue came from our technology offerings.
We solve our clients’ complex IT challenges by providing enterprise grade solutions through our deep vendor relationships, comprehensive services, and national network of our more than 1,300 engineers and consulting professionals. We can deliver our technology offerings across a number of delivery models including on-premise, and in private, hybrid, and public clouds as well as our proprietary C1 Cloud, regardless of clients’ existing infrastructure, providing them with flexibility and optionality. Additionally, we can provide our offerings as a managed service.
Our deep technical expertise and end-to-end service capabilities differentiates us from other IT service providers and allows us to provide leading, multi-vendor solutions to solve our clients’ needs. It is our deep services capabilities and technology expertise that have allowed us to create long-term, recurring client relationships. Across our technology offerings it is focused on providing full lifecycle services to ensure the best solution is designed, implemented, maintained, and managed according to our clients’ unique business needs. We
66
Table of Contents
ensure client satisfaction and quality control through our continuous improvement methodology, which incorporates the highest standards in process and information management, including lean six sigma, ITIL / ITSM, SOC2, PCI compliance, analytics, as well as other review, audit, and governance management processes.
Our Core Technology Markets
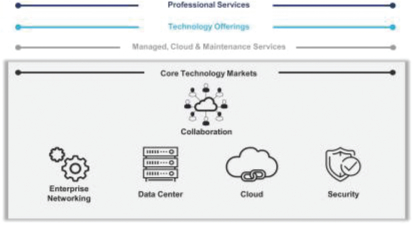
Collaboration
Our collaboration services and technology offerings, which represented 68% of our total revenue in 2016, are primarily comprised of unified communications and customer engagement software. Our unified communications solutions focus on enabling communication anywhere on any device and our customer engagement applications focus on delivering a more personalized and omni-channel experience for our clients’ end customers. With our more than 20-year focus on collaboration solutions, we believe we are well positioned to benefit from the growing complexity of collaboration solutions and the rapid growth of this market. We believe these offerings enhance our clients’ competitiveness, efficiency, and overall customer experience while also addressing the constantly evolving challenges they encounter in an increasingly mobile, global, and connected world.
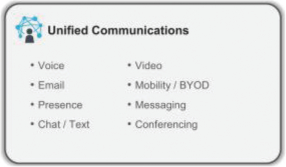
|
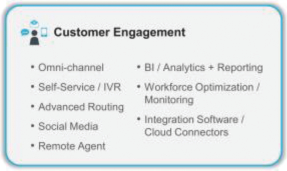
|
We begin each client collaboration engagement with a thorough assessment of the business and system requirements. After identifying the best technology, which typically comprises products from more than ten partners and may have thousands of possible combinations, we implement, integrate, and optimize the necessary network and data center infrastructure assets. As part of this process, we also integrate the new technology with existing enterprise applications, such as ERP and CRM systems, either through custom application development or cloud connectors. Once the offering is deployed, we would then provide ongoing maintenance, management, and optimization services to ensure the solution meets our clients’ needs.
67
Table of Contents
Unified Communications
Our unified communications solutions improve our clients’ collaboration inside and outside their business, as well as enhance customer satisfaction with faster response and service delivery. Select capabilities include:
| • | Our communications applications primarily consist of voice, email, presence, chat / text, and video technologies. |
| • | Our messaging solutions offer comprehensive voice and text messaging capabilities including single mailbox access across any device, visual voicemail, email, text to speech, and notification among others. |
| • | Our mobility and BYOD solutions technology allow for business continuity with the seamless connection of mobile, landline, cellular, and Wi-Fi enabled devices and makes it easy for our clients’ employees to use their devices as extensions of their enterprise network. |
| • | Our conferencing solutions support a broad range of conferencing methods from high definition room systems and desktop, mobile, and tablet-based video conferencing solutions to streaming and recording as well as security services. |
Additionally, our software integration expertise spans across traditional communication applications and custom-built applications that have been tailored to meet the specific business needs of our clients. These applications include all forms of enterprise communication, messaging and collaboration.
Customer Engagement
Our customer engagement solutions enable our clients to deliver their end customers a more personalized experience by enabling communication across any channel, tracking, and analyzing critical business information, monitoring social media while still optimizing their own internal resources. Select capabilities include:
| • | Our omni-channel solutions enable our clients to operate efficiently across channels including inbound client-assisted or self-service voice in addition to a host of non-voice options such as email, text, chat, and social media. |
| • | Our self-service Interactive Voice Recognition, or IVR, and advanced routing solutions provide our clients with the technology they need to quickly address or route questions to the best available solution, either agent or automated tool. |
| • | Our social media solutions provide our clients with the necessary social media monitoring, marketing, and analytics applications to enhance client interactions and experience. |
| • | Our remote agent solutions enable our clients’ remote workforce to effectively collaborate with their clients across all channels including voice, email, video, text, and chat. |
| • | Our end-to-end business intelligence and analytics solutions enable our clients to track, integrate, and analyze customer information to personalize responses and offerings to their end customers. |
| • | Our workforce optimization solutions provide applications that allow client service teams to provide the right level of support and to measure performance based on detailed analytics. |
| • | Our integration software and cloud connector solutions allow the coordination and integration between disparate systems. |
Enterprise Networking, Data Center, Cloud, and Security
In addition to collaboration, we provide services and technology offerings to our clients across enterprise networking, data center, cloud and security, which in aggregate represented 32% and 34% of our total revenue in 2016 and 2017, respectively.
68
Table of Contents
Enterprise Networking
Our enterprise networking technology solutions ensure that our clients have access to cost-effective and innovative networking options, including Network Function Virtualization, or NFV, and Software Defined Networking, or SDN, as well as the capacity and security to securely transmit bandwidth-intensive data, voice, video, and wireless applications.
| • | Our mobile device management offering secures and manages mobile devices, creating an open ecosystem for our clients’ mobility applications across disparate networks. |
| • | Our routing and switching technology offerings primarily includes local-area network, or LAN, switches, with integrated security applications. |
| • | Our wireless offerings include integrated wireless switches and routers, mobile access points, antennas, intrusion prevention, and customized wireless LAN management. |
| • | Our location service applications allow for the tracking of any device anywhere and can be integrated into multiple software applications. |
Data Center
Our data center solutions enable our clients to process and store the applications and information they need to conduct their business. We offer a broad range of server, storage, virtualization, and management solutions to help align our clients’ IT infrastructure with their business objectives. With these solutions, clients can prioritize system resources and allocate resources dynamically, providing greater flexibility and consistency across their IT environments.
| • | Our server and storage solutions include the design, procurement, implementation, management, and optimization of data center infrastructure assets. We also provide server migration and consolidation services and have the ability to dynamically adjust server capacity to meet changing workload demands. |
| • | Our storage management and data management solutions simplify data and storage management capabilities ensure business continuity and efficiency, and reduce costs, while backing up critical business data and providing increased regulation, and security compliance. |
| • | Our virtualization solutions create multiple servers on a single physical server enabling cost reductions and centralized management of disparate systems. |
Cloud
We provide cloud solutions to our clients in four distinct environments: private, C1 Cloud, hybrid, and public cloud. Our cloud technology offerings are supported by end-to-end design, installation, integration, management, and ongoing maintenance services that can be performed by us, the client, or the infrastructure provider based on client needs. We believe we are uniquely positioned to help our clients with their cloud migration strategy given our technical, services, and solution capabilities as well as our ability to efficiently aggregate cloud components into a seamless solution offering.
We offer our clients their own private cloud, which can be implemented within their own firewall, and maintained by their own IT staff or can be implemented in a ConvergeOne data center and managed by our employees based on the clients’ needs. C1 Cloud provides communication, collaboration, and network connectivity in a subscription-based delivery model that combines the benefits of an on-premise solution with the ease of a managed cloud service. The result is a fully customized, delivered, supported, and managed solution which provides the agility of the public cloud with the robust performance and security of a private, dedicated environment. Our hybrid cloud offers the security of our private cloud solution with the ability to scale into public cloud environments based on resource or capacity needs. Our public cloud solution provides the operating expense and scaling benefits of cloud computing in a cost-effective option. With our cloud offerings, clients choose the ownership and managed services models to best meet their needs.
69
Table of Contents
Security
We provide end-to-end network and data security solutions to our clients. We generally begin our client engagements with assessments, followed by an actionable security framework, which can include all or components of infrastructure upgrades and optimization, training, incident response, remediation, and managed security. Our methodologies and holistic architecture protects, detects, and contains threats across the cyber-attack continuum. We provide effective risk reduction through solutions that combine multiple trusted security technologies into a single platform. For example, we provide a range of services and solutions from monitoring to firewalls and threat detection to vulnerability assessments and managed security services that help our clients keep unauthorized visitors from accessing valuable business resources.
Additionally, we provide comprehensive disaster recovery services and solutions including business continuity assessment and planning, to network availability and data continuity, to recovery and crisis management. We also provide FireStorm POV, which is our security assessment tool. FireStorm POV provides visibility into real-time attacks, malware exposure, and network risk through detailed security reports. Our holistic security services and solutions provide the level of defense required by our clients to protect their IT assets.
We employ a client-centric philosophy to solve enterprises’ complex IT needs with innovative technology offerings through a culture of locally empowered employees who deliver best-in-class multi-vendor services and solutions.
Our Clients
Our mission statement, “To create innovative solutions that give clients the experience they deserve”, and our vision dictate how our organization and employees go-to-market. Our approach is built on five key pillars:
| • | client driven; |
| • | start with yes; |
| • | decide locally; |
| • | reach forward; and |
| • | do right. |
Our target clients are large and medium companies with consistent IT spending that are increasingly looking to IT service providers for the necessary technical expertise and partner relationships to deliver solutions across any consumption model. We fill this gap by providing sophisticated collaboration, enterprise networking, data center, cloud and security solutions and full lifecycle services to our clients through our local relationships and strong technical capabilities.
Our clients are primarily large and medium enterprises across the United States. We primarily serve companies located throughout the United States; however, we are capable of supporting our clients internationally as well.
We served over 3,400, 3,700, and 7,200 clients in 2015, 2016, and 2017, respectively, which includes clients served in 2017 by companies we acquired in 2017. From 2015 to 2017, we served 57% of the Fortune 100, 43% of the Fortune 500, and 36% of the Fortune 1,000, which includes clients served in the same period by companies we acquired in 2017. In 2017, we had 16 clients that spent at least $5 million with us and approximately 200 clients that spent at least $1 million with us.
As a result of our diverse client base, we benefit from low client concentration. Our top 10 and 25 clients represented 10% and 16%, respectively, of our total revenue during 2017. Additionally, in 2016, our largest client represented approximately 2% of total revenue.
70
Table of Contents
We believe the contractual nature of our managed and maintenance and hosted services also provides us with revenue visibility as these contracts are typically multi-year in duration with high renewal rates.
Competition
We are a leading multi-vendor IT services provider focused on solving complex collaboration, data, and security challenges through an industry leading engineering team and services offering. Our expertise in collaboration, enterprise networking, data center, cloud, and security, combined with our professional and managed, cloud, and maintenance services capabilities positions us uniquely in the market. We believe we are competitively differentiated by our range of service capabilities and our trusted vendor partnerships, which provide us with the platform to differentiate ourselves from our competitors. Across our solutions, we compete with companies such as Accenture, AT&T, Carousel, CDW, IBM, Optiv, Presidio, and Verizon.
We categorize our competitors as:
| • | In-House IT Departments. Many of the large and medium sized corporate clients we serve have in-house IT departments that are capable of providing the solutions we offer. We believe our technical expertise, vendor relationships and the breadth and depth of our service offerings creates a unique value proposition and frees up these in-house IT resources to work on offerings that are core to their business. |
| • | Global IT Service Providers / Integrators. Global IT service providers can provide collaboration solutions on a large scale; however, lack the specialized solution focus and ability to sell end-to-end solutions. We differentiate ourselves through our targeted focus, technical expertise, local relationships and ability to offer complex end-to-end solutions. |
| • | Local and Regional Providers. Though local and regional providers often have strong local relationships, many of them lack the deep collaboration, enterprise networking, data center, cloud, and security domain expertise and services capabilities. We believe our national footprint, technical and domain expertise, and services capabilities will allow us to continue to take market share from the less established and smaller providers who lack the capabilities to execute on larger, multi-geography projects and the scale and financial strength to invest in next-generation solutions or delivery models. |
| • | Resellers. Rather than focusing principally on product resale, we focus on providing services to our clients through consulting, technical expertise, solution delivery, and ongoing services that allow us to develop long-lasting client relationships. Our lifecycle engagement model focuses on a holistic approach that includes high-value services and end-to-end solutions. |
| • | Equipment Manufacturers. In some cases, equipment manufacturers sell directly to customers. These manufacturers often do not have the service capabilities or vendor agnostic approach to design, integrate, and maintain optimal solutions for customers. |
Employees
Our employees are core to our business and we leverage their long-standing, deep client relationships and strong technical expertise to deliver complex end-to-end, multi-vendor solutions to best meet our clients’ needs. As of December 31, 2017, we had approximately 2,000 employees, including over 1,300 technical engineers and consultants. We employed a direct sales force of approximately 330 professionals as of December 31, 2017. We have a well-educated and long tenured employee base, who have an average of seven years of experience at ConvergeOne. Our employees embrace our five core go-to-market pillars of client driven, start with yes, decide locally, reach forward, and do right. We believe that it is the result of our employee base that we have an NPS of 61 for 2016, long standing client engagements, and strong financial performance. None of our employees are currently covered under any collective bargaining agreements. We believe our relations with our employees are good and we have never experienced a material work stoppage.
71
Table of Contents
Facilities
We lease all of our properties, which function primarily as regional sales and engineering offices. As of December 31, 2017, we leased space in more than 65 buildings across the United States. We believe that our current facilities are adequate to meet our ongoing needs and that, if it requires additional space, we will be able to obtain additional facilities on commercially reasonable terms.
Intellectual Property
Our success depends in part upon our ability to protect our intellectual property. To establish and protect our proprietary rights, we rely on a combination of intellectual property rights, including trademarks, copyrights, trade secret laws, license agreements, confidentiality procedures, employee disclosure and invention assignment agreements, and other contractual rights.
The ConvergeOne trademark and certain variations thereof are registered or are the subject of pending trademark applications in the U.S. ConvergeOne believes our trademarks have significant value and are important factors in our marketing programs. In addition, ConvergeOne owns registrations for domain names, including convergeone.com and certain other domains, for certain of our primary trademarks.
We generally control access to and use of our proprietary software and other confidential information through the use of internal and external controls, including contractual protections with employees, contractors, customers, and partners. Unauthorized parties may still copy or otherwise obtain and use our software and technology, despite our efforts to protect our trade secrets and proprietary rights through intellectual property rights, licenses and confidentiality agreements.
Legal Proceedings
From time to time we may be involved in litigation relating to claims arising out of our operations in the normal course of business. We are not currently a party to any legal proceedings that we believe would have a material adverse effect on our financial position, results of operations, or cash flows and are not aware of any material legal proceedings contemplated by governmental authorities.
72
Table of Contents
Executive Officers and Board of Directors
The following persons are our executive officers and directors as of March 1, 2018.
| Name |
Age | Position(s) | ||||
| John A. McKenna, Jr. |
62 | President and Chief Executive Officer and Chairman of the Board | ||||
| Jeffrey Nachbor |
53 | Chief Financial Officer | ||||
| Paul Maier |
57 | President, Services Organization | ||||
| John F. Lyons |
64 | President, Field Organization | ||||
| David Boris |
57 | Director | ||||
| Richard Katzman |
61 | Director | ||||
| Keith W. F. Bradley(1)(2) |
54 | Director | ||||
| Behdad Eghbali(2) |
41 | Director | ||||
| José E. Feliciano |
44 | Director | ||||
| Christopher Jurasek(1)(3) |
52 | Director | ||||
| Prashant Mehrotra |
40 | Director | ||||
| James Pade(1) |
33 | Director | ||||
| Timothy J. Pawlenty(3) |
57 | Director | ||||
| (1) | Member of the Audit Committee. |
| (2) | Member of the Compensation Committee. |
| (3) | Member of the Nominating and Corporate Governance Committee. |
As used in this section, ConvergeOne refers to both privately-held C1 Investment Corp. prior to the closing of the Business Combination and to ConvergeOne Holdings, Inc. after the closing of the Business Combination. Upon the closing of the Business Combination, the executive officers of C1 Investment Corp. became our executive officers and each member of the board of directors of C1 Investment Corp. became a member of the board of directors of ConvergeOne Holdings, Inc.
John A. McKenna, Jr. has served as our President and Chief Executive Officer and Chairman of the Board since August 2008. From 2000 until 2008, Mr. McKenna served as the Chief Executive Officer of Siemens IT Solutions and Services, Inc., a provider of integrated information technology solutions and services. Mr. McKenna holds a B.A. in history from Trinity College. ConvergeOne believes Mr. McKenna is qualified to serve on our board of directors due to his extensive knowledge of our company and his comprehensive background in information technology.
Jeffrey Nachbor has served as our Chief Financial Officer since September 2013. From 2008 until 2013, Mr. Nachbor served as Senior Vice President of Finance & Chief Accounting Officer of Leap Wireless, a telecommunications company. From September 2005 to March 2008, Mr. Nachbor served as Senior Vice President and Corporate Controller of H&R Block, Inc. From February 2005 until August 2005, Mr. Nachbor served as Chief Financial Officer and Treasurer of Sharper Image Corporation, a consumer electronics retailer. From 2003 to 2005, Mr. Nachbor served as Senior Vice President and Corporate Controller of Staples, Inc., a business supplies and equipment retailer. Mr. Nachbor holds a B.A. in accounting from Old Dominion University, an M.B.A. from University of Kansas, and is a Certified Public Accountant.
Paul Maier has served as our President, Services Organization, since January 2018 and he previously served as ConvergeOne’s President, ConvergeOne Solutions from January 2016 to January 2018, ConvergeOne’s President, ConvergeOne Technologies from June 2014 to January 2016, and ConvergeOne’s Senior Vice President of Product Technology from August 2012 until September 2014. From 2000 to 2012, Mr. Maier served in various roles at Siemens AG, most recently as Vice President, Business Development of the Smart Grid Division from September 2010 to September 2012. Mr. Maier holds a B.A. in business from the Colby College, an M.B.A. from Fairleigh Dickinson University, and completed an executive program at INSEAD in France.
73
Table of Contents
John F. Lyons has served as our President, Field Organization, since January 2018 and he previously served as ConvergeOne’s President, ConvergeOne Enterprise from September 2012 to January 2018. Mr. Lyons served as President of S-1 IT Solutions, ConvergeOne’s wholly-owned subsidiary, from June 2010 until September 2012. From 2005 until 2010, Mr. Lyons served as Senior Vice President and General Manager at Siemens IT Solutions and Services. Effective January 1, 2018, Mr. Lyons will become ConvergeOne’s President, Field Organization. Mr. Lyons holds a B.S. in management from Syracuse University.
David Boris served as Co-Chief Executive Officer and Chief Financial Officer of Forum since its inception in November 2016 and has served as a member of our board of directors since November 2016. He has over 30 years of Wall Street experience in mergers and corporate finance and has been involved in 13 SPAC transactions as an advisor, investment banker and/or board member, including nine business combinations totaling over $3.4 billion. Mr. Boris has been a Director of Pacific Special Acquisition Corp., a SPAC formed by one of the leading independent investment banks in China, since July 2015. In addition, he served as advisor to Limbach Holdings in connection with our merger with 1347 Capital Corp., a SPAC, from 2015 to 2016. From November 2010 to May 2013, Mr. Boris served as Chairman of Primcogent Solutions LLC, leading the board during the period of the company’s preparation to seek reorganization by way of a voluntary bankruptcy petition, which was filed in 2013. Mr. Boris served as a director of Trio Merger Corp., a SPAC, from its inception through its business combination with SAExploration. Mr. Boris served as Senior Managing Director and Head of Investment Banking at Pali Capital, Inc., an investment banking firm, from 2007 to 2010, and was a founding member and Managing Director of Morgan Joseph & Co. Inc., an investment banking firm, from 2001 to 2007, where he was head of both the Financial Sponsors and Media Groups. Mr. Boris served as President of Ladenburg Thalmann Group Inc. from 1999 to 2000, and was also Executive Vice President and Head of Investment Banking at Ladenburg Thalmann & Co. Inc. from 1998 to 2000. In addition, he was a co-founder, director, and a principal stockholder of Brenner Securities Corporation and its successors. Prior to Brenner, Mr. Boris was at Oppenheimer & Company, as a Senior Vice President and Limited Partner. Mr. Boris began his career as a member of the Business Development Group of W.R. Grace & Company, from 1984 to 1985. He is an active member of the Young Presidents’ Organization. Mr. Boris received a M.B.A. from Columbia University Business School and a B.A. from Vassar College, cum laude. We believe Mr. Boris is well qualified to serve as a member of the board due to his wide range of experience in capital market activities as well as his activities in special purpose acquisition companies and asset management.
Richard Katzman has served as a member of our board of directors since November 2016. He is a private investor in early stage companies and a member of the New York Angels investing group, advising and investing in over two dozen startups. He is also an Executive Director and board member of The Noodle Companies, a group of early stage ventures seeking to increase transparency and efficiency in education, based in New York City. Mr. Katzman was President, Chairman & CEO of Kaz, Incorporated, a multinational consumer appliance company, from 1987 until its sale in December 2010. Kaz’s products include humidifiers, vaporizers, digital thermometers, hot/cold therapy, heaters, fans, and air cleaners. Under his leadership, the company grew from $4 million in annual sales to $500 million by expanding our product offerings, developing international distribution, and pioneering brand extension licensing with global power brands Vicks, Honeywell and Braun. Mr. Katzman also co-founded Terra Firma Software, a provider of enterprise solutions and an early developer of Macintosh applications, in 1982. Mr. Katzman is a board member of Brown University’s Entrepreneurship Program, was Executive in Residence for the first cohort of the IE-Brown Executive MBA program in 2011-12 and has been a judge in several business plan competitions. Mr. Katzman was a board member of Princeton Review from its founding in 1982 until 2012, currently serves on the boards of Hudson Opera House, Bard’s Creative Council, and Generation Citizen, and was a trustee of Columbia Memorial Hospital in Hudson, NY. He is also a member of the Young Presidents’ Organization. Mr. Katzman graduated with an A.B. from Brown University and attended the Singularity University Executive Program. We believe Mr. Katzman is well qualified to serve as a member of the board due to his experience in finance and operations.
Keith W.F. Bradley has served as a member of ConvergeOne’s board of directors since September 2014. From May 2016 until December 2016, Mr. Bradley served as Chief Executive Officer of Swiss Watch International Inc. From July 2013 until October 2015, Mr. Bradley served as Chief Executive Officer of Tolt
74
Table of Contents
Solutions, Inc., an information technology and services company. Since December 2015, Mr. Bradley has served as the Executive Chairman of Pomeroy IT Solutions, Inc., an infrastructure management company. From 2000 to 2013, Mr. Bradley served in a variety of roles at Ingram Micro Inc., a global technology and supply chain services company, most recently serving as Senior EVP President, North America. Mr. Bradley holds a B.S. in accounting from Queen’s University Belfast and a Masters in Accounting from Queen’s University Belfast. We believe Mr. Bradley is qualified to serve on our board of directors due to his information technology industry experience and his experience in accounting.
Behdad Eghbali has served as a member of ConvergeOne’s board of directors since May 2014. Mr. Eghbali is managing partner of Clearlake Capital Group, L.P., or Clearlake, which he co-founded in 2006. Previously, Mr. Eghbali served as a private equity investor at TPG Capital, a global private investment firm. Mr. Eghbali holds a B.S. in business administration and management from the University of California, Berkeley. We believe Mr. Eghbali is well qualified to serve on our board of directors due to his investment experience, financial expertise, and his current and former service on the boards of directors of other companies in the information technology industry.
José E. Feliciano has served as a member of ConvergeOne’s board of directors since August 2017. Mr. Feliciano is a Managing Partner and Co-Founder of Clearlake which he co-founded in 2006. Mr. Feliciano is responsible for the day-to-day management of Clearlake, and is primarily focused on investments in the industrials, energy and consumer sectors. Mr. Feliciano currently serves on the boards of directors of Smart Sand, Inc. and several private companies. Mr. Feliciano graduated with High Honors from Princeton University, where he received a B.S. in mechanical & aerospace engineering. He received his M.B.A. from the Graduate School of Business at Stanford University. We believe Mr. Feliciano’s experience as a current and former director of many companies and his financial expertise makes him well qualified to serve on our board of directors.
Christopher Jurasek has served as a member of ConvergeOne’s board of directors since August 2017. Since February 2014, Mr. Jurasek has served as the President and Chief Executive Officer at Calero Software, LLC. From May 2013 to February 2014, Mr. Jurasek served as Executive Vice President of FlowRiver Group. From December 2010 to July 2012, Mr. Jurasek served as President of Wireless and Services at TE Connectivity. From June 2007 to January 2009, Mr. Jurasek served as the Chief Information Officer at ADC. Mr. Jurasek received a B.A. in Business Administration from Bowling Green State University and an M.B.A. from the Kellogg School of Management at Northwestern University. We believe Mr. Jurasek is qualified to serve on our board of directors due to his experience in the information technology industry.
Prashant Mehrotra has served as a member of ConvergeOne’s board of directors since June 2014. Mr. Mehrotra is a partner and has been a private equity investor with Clearlake since 2010. From 2007 to 2010, he was a principal at Silver Lake Partners. From 2005 to 2007 he was a principal at Tennenbaum Capital Partners, LLC. Mr. Mehrotra holds a B.S. and an M.S. in industrial engineering from Stanford University, and an M.B.A. from the Kellogg School of Management at Northwestern University. We believe Mr. Mehrotra is qualified to serve on our board of directors due to his investment experience and his service on the boards of directors of other companies in the information technology industry.
James Pade has served as a member of ConvergeOne’s board of directors since June 2014. Mr. Pade is a principal and has been a private equity investor with Clearlake since 2013. From 2010 until 2012, Mr. Pade was an investment professional at TowerBrook Capital Partners. Mr. Pade holds a B.A. in economics from Stanford University. We believe Mr. Pade is qualified to serve on our board of directors due to his investment experience and his service on the boards of directors of other companies in the information technology industry.
Timothy J. Pawlenty has served as a member of ConvergeOne’s board of directors since February 2015. Since November 2012, Mr. Pawlenty has served as President and Chief Executive Officer of Financial Services Roundtable, an advocacy organization for America’s financial services industry. From January 2011 to November 2012, Mr. Pawlenty served as an independent contractor. Mr. Pawlenty previously served as Governor of the State of Minnesota for two terms from 2003 to 2011. Mr. Pawlenty previously served as a director of Digital River, Inc., a global e-commerce, payments, and marketing services company. Mr. Pawlenty serves as a
75
Table of Contents
member of the board of directors of Smart Sand, Inc. Mr. Pawlenty holds a B.A. in political science from University of Minnesota and a J.D. from the University of Minnesota Law School. We believe Mr. Pawlenty is qualified to serve on our board of directors due to his legal and regulatory experience.
Classified Board of Directors
The board is divided into three classes. At each annual general meeting of stockholders, the successors to directors whose terms then expire will be elected to serve from the time of election and qualification until the third annual meeting following the election. The directors are divided among the three classes as follows:
| • | the Class I directors are Richard Katzman, Keith W.F. Bradley and James Pade, and their terms expire at the annual meeting of stockholders to be held in 2019; |
| • | the Class II directors are David Boris, Timothy J. Pawlenty and Prashant Mehrotra, and their terms expire at the annual meeting of stockholders to be held in 2020; and |
| • | the Class III directors are Behdad Eghbali, José E. Feliciano, John A. McKenna, Jr. and Chris Jurasek, and their terms expire at the annual meeting of stockholders to be held in 2021. |
Any additional directorships resulting from an increase in the number of directors will be distributed among the three classes so that, as nearly as possible, each class will consist of one-third of the directors. The division of the board of directors into three classes with staggered three-year terms may delay or prevent a change of our management or a change in control.
Controlled Company Exception
Affiliates of Clearlake beneficially own shares representing more than 50% of the voting power of our shares eligible to vote in the election of directors. As a result, we are a “controlled company” within the meaning of the Nasdaq listing rules. Under these corporate governance standards, a company of which more than 50% of the voting power is held by an individual, group, or another company is a “controlled company” and may elect to take advantage or exemptions from certain corporate governance standards, including the requirements (1) that a majority of our board of directors consist of independent directors, (2) that our board of directors have a compensation committee that is comprised entirely of independent directors with a written charter addressing the committee’s purpose and responsibilities, and (3) that our board of directors have a nominating and corporate governance committee that is comprised entirely of independent directors with a written charter addressing the committee’s purpose and responsibilities.
Our stockholders may not have the same protections afforded to stockholders of Nasdaq-listed companies that are subject to all of these corporate governance requirements. In the event that we cease to be a “controlled company” and our shares continue to be listed on the Nasdaq, we will be required to comply with these standards and, depending on the board’s independence determination with respect to our then-current directors, it may be required to add additional directors to our board in order to achieve such compliance within the applicable transition periods.
Director Independence
Under the listing requirements and rules of Nasdaq, independent directors must comprise a majority of a listed company’s board of directors. Our board of directors has undertaken a review of the composition of the Board, our committees and the independence of each director. The board of directors has determined that, other than Mr. McKenna by virtue of his position as President and Chief Executive Officer of ConvergeOne, and Mr. Boris by virtue as role as the former Co-Chief Executive Officer, Chief Financial Officer and Vice President of Forum, none of the proposed directors has a relationship that would interfere with the exercise of independent judgment in carrying out the responsibilities of a director and that each is “independent” as that term is defined under the applicable rules and regulations of the SEC and the listing requirements and rules of the Nasdaq. Accordingly, a majority of the directors are independent, as required under applicable Nasdaq rules. In making this determination, our board of directors considered the current and prior relationships that each non-employee
76
Table of Contents
director has with ConvergeOne and all other facts and circumstances our board of directors deemed relevant in determining their independence, including the beneficial ownership of our capital stock by each non-employee director.
Committees of the Board of Directors
Our board of directors has the authority to appoint committees to perform certain management and administration functions. Our board of directors has established an audit committee, a compensation committee, and a nominating and corporate governance committee. The composition and responsibilities of each committee are described below. Members will serve on these committees until their resignation or until otherwise determined by the board of directors. The charters for each of these committees are available on our website at www.convergeone.com. Information contained on or accessible through our website is not a part of this prospectus, and the inclusion of such website address in this prospectus is an inactive textual reference only.
Audit Committee
Our audit committee consists of Messrs. Bradley, Jurasek and Pade. The board of directors has determined that each committee member is independent under the listing standards and Rule 10A-3(b)(1) of the Exchange Act. The chairperson of our audit committee is Mr. Bradley. The board of directors has determined that Mr. Bradley is an “audit committee financial expert” within the meaning of SEC regulations. Our board of directors has also determined that each member of the audit committee has the requisite financial expertise required under the applicable requirements of Nasdaq. In arriving at this determination, the board of directors has examined each audit committee member’s scope of experience and the nature of their employment in the corporate finance sector.
The primary purpose of the audit committee is to discharge the responsibilities of the board of directors with respect to our accounting, financial, and other reporting and internal control practices and to oversee our independent registered accounting firm. Specific responsibilities of our audit committee include:
| • | selecting a qualified firm to serve as the independent registered public accounting firm to audit our financial statements; |
| • | helping to ensure the independence and performance of the independent registered public accounting firm; |
| • | discussing the scope and results of the audit with the independent registered public accounting firm, and reviewing, with management and the independent accountants, our interim and year-end operating results; |
| • | developing procedures for employees to submit concerns anonymously about questionable accounting or audit matters; |
| • | reviewing policies on risk assessment and risk management; |
| • | reviewing related party transactions; |
| • | obtaining and reviewing a report by the independent registered public accounting firm at least annually, that describes the Company’s internal quality-control procedures, any material issues with such procedures, and any steps taken to deal with such issues when required by applicable law; and |
| • | approving (or, as permitted, pre-approving) all audit and all permissible non-audit service to be performed by the independent registered public accounting firm. |
Compensation Committee
The compensation committee consists of Messrs. Eghbali and Bradley. Our board of directors has determined each member is a “non-employee director” as defined in Rule 16b-3 promulgated under the Exchange
77
Table of Contents
Act. The chairperson of the compensation committee is Mr. Eghbali. We are relying upon the exemption for the requirement that we have a compensation committee comprised entirely of independent directors. The primary purpose of the compensation committee is to discharge the responsibilities of the board of directors to oversee our compensation policies, plans and programs and to review and determine the compensation to be paid to our executive officers, directors and other senior management, as appropriate. Specific responsibilities of the compensation committee will include:
| • | reviewing and approving, or recommending that our board of directors approve, the compensation of our executive officers; |
| • | reviewing and recommending to our board of directors the compensation of our directors; |
| • | reviewing and approving, or recommending that our board of directors approve, the terms of compensatory arrangements with our executive officers; |
| • | administering our stock and equity incentive plans; |
| • | selecting independent compensation consultants and assessing whether there are any conflicts of interest with any of the committee’s compensation advisors; |
| • | reviewing and approving, or recommending that our board of directors approve, incentive compensation and equity plans, severance agreements, change-of-control protections and any other compensatory arrangements for our executive officers and other senior management, as appropriate; |
| • | reviewing and establishing general policies relating to compensation and benefits of our employees; and |
| • | reviewing our overall compensation philosophy. |
Nominating and Corporate Governance Committee
Our nominating and corporate governance committee consists of Messrs. Jurasek and Pawlenty. Our board of directors has determined each member is independent under Nasdaq listing standards. The chairperson of our nominating and corporate governance committee is Mr. Pawlenty.
Specific responsibilities of our nominating and corporate governance committee include:
| • | identifying, evaluating and selecting, or recommending that our board of directors approve, nominees for election to our board of directors; |
| • | evaluating the performance of our board of directors and of individual directors; |
| • | reviewing developments in corporate governance practices; |
| • | evaluating the adequacy of our corporate governance practices and reporting; |
| • | reviewing management succession plans; and |
| • | developing and making recommendations to our board of directors regarding corporate governance guidelines and matters. |
Code of Business Conduct and Ethics
We have adopted a Code of Business Conduct and Ethics that applies to all of our employees, officers and directors, including those officers responsible for financial reporting. The Code of Business Conduct and Ethics
78
Table of Contents
is available on our website at www.convergeone.com. Information contained on or accessible through such website is not a part of this prospectus, and the inclusion of the website address in this prospectus is an inactive textual reference only. We will disclose any amendments to the Code of Business Conduct and Ethics, or any waivers of our requirements, on our website to the extent required by the applicable rules and exchange requirements.
Compensation Committee Interlocks and Insider Participation
No member of our compensation committee has ever been an officer or employee of ConvergeOne. None of our executive officers serve, or have served during the last year, as a member of the board of directors, compensation committee, or other board committee performing equivalent functions of any other entity that has one or more executive officers serving as one of our directors or on our compensation committee.
79
Table of Contents
CERTAIN RELATIONSHIPS AND RELATED PERSON TRANSACTIONS
The following is a summary of transactions since January 1, 2016 to which we, Forum and C1, our subsidiary, have been a participant, in which:
| • | the amount involved exceeded or will exceed $120,000; and |
| • | any of our directors, executive officers, or holders of more than 5% of our capital stock, or any member of the immediate family of the foregoing persons, had or will have a direct or indirect material interest, other than compensation and other arrangements that are described in the section titled “Executive Compensation” or that were approved by our compensation committee. |
We believe the terms obtained or consideration that it paid or received, as applicable, in connection with the transactions described below were comparable to terms available or the amounts that would be paid or received, as applicable in arm’s-length transactions.
Forum
Founders Shares
On December 28, 2016, Forum issued an aggregate of 3,593,750 Founders Shares for an aggregate purchase price of $25,000. On April 6, 2017, Forum effectuated a 1.2-for-1 stock dividend of its Class F Common Stock resulting in an aggregate of 4,312,500 Founders Shares outstanding. The Founders Shares automatically converted into common stock upon the consummation of the Business Combination on a one-for-one basis, subject to adjustments.
The 4,312,500 Founders Shares included an aggregate of up to 562,500 shares which were subject to forfeiture by the Sponsor to the extent that the underwriters’ over-allotment option was not exercised in full or in part so that the Sponsor would own, on an as-converted basis, 20.0% of Forum’s issued and outstanding shares after the Forum IPO (excluding the shares underlying the Placement Units (as defined below) and shares issued to EBC). As a result of the underwriters’ election to exercise their over-allotment option in full on April 18, 2017, 562,500 Founders Shares were no longer subject to forfeiture.
Placement Units
Simultaneously with the Forum IPO, the Sponsor purchased an aggregate of 555,000 Units in a private placement (the “Placement Units”) at a price of $10.00 per Unit (or an aggregate purchase price of $5,550,000). In addition, on April 18, 2017, Forum consummated the sale of an additional 67,500 Placement Units at a price of $10.00 per Unit, which were purchased by the Sponsor, generating gross proceeds of $675,000. Each Placement Unit consists of one Placement Share, one Placement Right and one-half of one Placement Warrant. The proceeds from the Placement Units were added to the proceeds from the Forum IPO held in the trust account of Forum.
The Placement Units are identical to the Units sold in the Forum IPO except that the Placement Warrants (i) are not redeemable by Forum and (ii) may be exercised for cash or on a cashless basis, so long as they are held by the initial purchaser or any of its permitted transferees.
Related-Party Advances
During 2017, the Sponsor advanced Forum an aggregate of $250,000 for costs associated with the Forum IPO and for working capital purposes. The advances were non-interest bearing, unsecured and due on demand. As of December 31, 2017, Forum has repaid $231,000 of such advances and $33,000 of advances remained outstanding as of December 31, 2017. During 2018, Forum repaid the $33,000 in advances and as of the closing of the Business Combination all advances had been repaid.
80
Table of Contents
Administrative Services Agreement
In April 2017, Forum entered into an agreement to pay an affiliate of the Sponsor a monthly fee of $10,000 for office space, utilities and administrative support. For 2017, Forum incurred $90,000 in fees for these services, respectively, of which $59,000 was included in accounts payable and accrued expenses at December 31, 2017. During 2018, Forum paid $72,000 pursuant to this agreement and the agreement was terminated upon the closing of the Business Combination.
Related-Party Loans
In order to finance transaction costs in connection with the Business Combination, the Sponsor, Forum’s officers and directors may, but were not obligated to, loan Forum funds from time to time or at any time, as may be required (“Working Capital Loans”). Each Working Capital Loan was evidenced by a promissory note. The Working Capital Loans would either be paid upon consummation of the Business Combination, without interest, or, at the holder’s discretion, up to $1,500,000 of the Working Capital Loans could be converted into Units at a price of $10.00 per Unit. The Units would be identical to the Placement Units. There were no Working Capital Loans outstanding at the time of the closing of the Business Combination.
Sponsor Earnout Letter and Lock-Up Letter
In accordance with the Sponsor Earnout Letter and effective upon the closing of the Business Combination, with respect to the 4,312,500 Founders Shares owned by the Sponsor, the Sponsor (a) forfeited 1,078,125 of such shares upon the closing of the Business Combination and (b) subjected 2,156,250 Sponsor Earnout Shares to potential forfeiture in the event that the Earnout Payments are not achieved with one-third (1/3rd) of the Sponsor Earnout Shares becoming vested and no longer subject to forfeiture upon the Earnout Payment attributable for each Earnout Year being received by ConvergeOne Securityholders (whether in the form of a Regular Earnout Payment, Catchup Earnout Payment or Accelerated Earnout Payment), and in the event of a Change of Control Earnout Payment all of the Sponsor Earnout Shares shall vest and no longer be subject to forfeiture. Any Sponsor Earnout Shares that have not vested on or prior to the date that (i) all earned Earnout Payments have been made and (ii) it is finally determined that ConvergeOne Securityholders are not entitled to or eligible to receive any further Earnout Payments under the Merger Agreement, will be forfeited by the Sponsor after such date. The Sponsor also agreed in the Sponsor Earnout Letter (i) to not transfer any Sponsor Earnout Shares until they have become vested and (ii) on behalf of itself and our members and affiliates to waive any rights that it has under Forum’s amended and restated certificate of incorporation to the adjustment to the conversion ratio of the Founders Shares in connection with the PIPE Investment and/or the closing of the Business Combination and any other rights that the Sponsor and/or our members or affiliates may have had to participate in the PIPE Investment.
In consideration of the agreements by the Sponsor under the Sponsor Earnout Letter, the parties thereto, including Continental, as the escrow agent under the Escrow Agreement, agreed to amend the Escrow Agreement so that in lieu of the escrow and lock-up provisions in the Escrow Agreement effective as of the closing of the Business Combination:
(i) 1,078,125 of the Founders Shares were forfeited and were released from escrow and cancelled;
(ii) 2,156,250 of the Founder Shares are subject to escrow and lock-up for a period from the closing of the Business Combination until 180 days thereafter; provided that if the volume-weighted average price of our common stock for 15 trading days is at least $12.50 per share, then 25% of the Founder Shares will be released from escrow and lock-up under the Escrow Agreement (but still subject to the vesting requirements under the Sponsor Earnout Letter); and
(iii) 1,078,125 of the Founders Shares were released from escrow and are no longer subject to any lock-up restrictions.
81
Table of Contents
Registration Rights
We have entered into agreements which provide certain holders of our securities registration rights with respect to such securities. See the section titled “Description of Capital Stock—Registration Rights” and “—Purchase Option.”
Earnout Payments
Subject to certain terms and conditions set forth in the Merger Agreement, the former stockholders and optionholders of C1 (the “C1 Securityholders”) have the contingent right to receive the Earnout Consideration (as defined in the Merger Agreement) from us, during the calendar years 2018, 2019 and 2020 (each such calendar year, an “Earnout Year” and such three-year calendar period, the “Earnout Period”) if the following requirements are met:
(i) Earnout EBITDA (as defined in, and calculated in accordance with, the Merger Agreement and measured at any applicable measurement date occurring within calendar year 2018) exceeds $144,000,000;
(ii) Earnout EBITDA (as defined in, and calculated in accordance with, the Merger Agreement and measured at any applicable measurement date occurring within calendar year 2019) exceeds $155,000,000; or
(iii) Earnout EBITDA (as defined in, and calculated in accordance with, the Merger Agreement and measured at any applicable measurement date occurring within calendar year 2020) exceeds $165,000,000 (the “Earnout Targets”);
in each case, at any time during the period beginning on and including the closing date of the Business Combination and ending on and including December 31, 2020, then for each Earnout Target that is achieved as of a given measurement date the holders shall receive additional consideration from us (a “Regular Earnout Payment”) of (A) 3,300,000 shares of common stock as adjusted for stock splits, stock dividends, combinations, recapitalizations and the like after the closing (an “Earnout Stock Payment”) and (B) cash in an amount equal to $33,000,000 (an “Earnout Cash Payment”); provided, however, any portion of such Earnout Cash Payment in excess of the Permitted Cash Payment (as defined in the Merger Agreement) will instead be paid by delivery of a number of additional shares of common stock, valued based on our share price at the time such Earnout Payment is otherwise due.
In the event that the applicable Earnout Target is not met for any Earnout Year, the former C1 Securityholders shall not be entitled to receive the Regular Earnout Payment for such Earnout Year; provided, however, the C1 Securityholders will be entitled to receive a Catchup Earnout Payment (as defined in the Merger Agreement) and/or an Accelerated Earnout Payment (as defined in the Merger Agreement) upon satisfaction of certain terms and conditions. In the event that after the Closing and during the Earnout Period there is a Change of Control (as defined in the Merger Agreement), then any Regular Earnout Payments that have not previously been paid (whether or not previously earned) to the C1 Securityholders shall be deemed earned and due to the C1 Securityholders upon such Change of Control.
Notwithstanding the above provisions, each Earnout Payment otherwise payable to the former C1 Securityholders will be reduced by the amount of the Sponsor Earnout Shares (as more fully described above) that become vested in connection with an Earnout Payment by directly reducing each Earnout Stock Payment by the amount of the Sponsor Earnout Shares that have become vested.
Further, notwithstanding the above provisions, the allocation of total merger consideration as between the cash consideration and common stock payable to the former C1 Securityholders shall be adjusted, by decreasing the cash consideration and correspondingly increasing the portion of total merger consideration paid in common stock, if and to the extent necessary to ensure that the former C1 Securityholders receive sufficient common stock such that, when aggregated with common stock previously paid as total merger consideration to the former C1 Securityholders, the amount of common stock is not less than the minimum amount of common stock necessary to satisfy the requirements for qualification as a reorganization under Section 368(a)(1)(A) of the Internal Revenue Code.
82
Table of Contents
C1 Investment Corp
Management and Monitoring Services Agreement
In June 2014, C1 entered into a Management and Monitoring Services Agreement with Clearlake, pursuant to which Clearlake provided C1 advisory services to C1 and receives fees and reimbursements of related out-of-pocket expenses.
Under this agreement, C1 paid Clearlake $1.5 million in each of 2015, 2016 and 2017, for management fees. Prior to the closing of the Business Combination, C1 paid Clearlake $600,000 pursuant to this agreement. Also under this agreement, C1 reimbursed Clearlake $100,000 and $140,000 in 2016 and 2017 respectively, for certain out-of-pocket expenses in connection with certain management and administrative support services provided by Clearlake. In connection with the Business Combination, this agreement was terminated.
Issuances of Securities
In June 2014, C1 issued 85,675,000 shares of Class A common stock at a purchase price of $1.00 per share to Clearlake Capital Partners III (Master), L.P., an entity affiliated with Clearlake, for an aggregate purchase price of $85.7 million. The following members of our board of directors, Behdad Eghbali, Prashant Mehrotra, and James Pade are a co-founder and managing partner, partner, and principal, respectively, of Clearlake.
In June 2014, C1 issued an aggregate of 4,208,258 shares of Class A common stock and 11,674,430 shares of Class B common stock in exchange for shares of common stock of ConvergeOne Holdings Corp. in connection with our acquisition by Clearlake. The following table summarizes shares of common stock issued to our executive officers in connection with such exchange.
| Name |
Shares of ConvergeOne Class A Common Stock |
Shares of ConvergeOne Class B Common Stock |
||||||
| John A. McKenna, Jr. |
1,947,127 | 5,287,333 | ||||||
| Jeffrey Nachbor |
488,368 | 1,163,213 | ||||||
| John F. Lyons |
698,851 | 2,114,933 | ||||||
| Paul Maier |
268,368 | 1,163,213 | ||||||
All of the shares of Class B common stock issued to our executive officers in such exchange were subject to vesting subject to such executive officer’s continued service to C1. Upon the closing of the Business Combination all unvested shares accelerated and vested in full.
Stockholder Rights Agreement
In June 2014, C1 entered into a stockholders agreement with, among others, Clearlake, John A. McKenna, Jr., Jeffrey Nachbor, John F. Lyons, and Paul Maier. Pursuant to this agreement, C1 granted those stockholders rights of first offer on certain stock issuances by C1, rights of first refusal and co-sale, information rights, and required those stockholders to approve a sale transaction if certain conditions were met. Pursuant to this agreement, C1 also granted these stockholders registration rights with respect to their shares of common stock. This agreement was terminated upon the closing of the Business Combination.
83
Table of Contents
Cash Distribution
In October 2016, C1 declared and paid a cash distribution of $89.9 million, or $1.00 per share of common stock then-outstanding. Of such distribution, Clearlake and C1’s executive officers received the following amounts:
| Name |
Amount of Distribution Received |
|||
| Clearlake |
$ | 85,675,000 | ||
| John A. McKenna, Jr.(1) |
1,947,127 | |||
| Jeffrey Nachbor |
488,368 | |||
| John F. Lyons |
698,851 | |||
| Paul Maier |
268,368 | |||
| (1) | Distribution paid to The John Arthur McKenna, Jr. Irrevocable Trust, dated August 27, 2014. Mr. McKenna’s wife is the sole trustee. |
Offer Letters
C1 has entered into offer letters with its executive officers. For more information regarding these offer letters, see the section titled “Executive Compensation of ConvergeOne—Employment and Change in Control Arrangements.” Upon the closing of the Business Combination C1’s executive officers were appointed the executive officers of ConvergeOne.
Equity Grants
C1 has granted stock options to the non-employee members of our board of directors. For a description of these stock options, see the section titled “Executive Officers and Directors of ConvergeOne—2017 Non-Employee Director Compensation.”
Loans
In September 2017, C1 loaned Christopher Jurasek $1.8 million pursuant to a series of promissory notes each with an interest rate of 2.6% per annum, in connection with Mr. Jurasek’s exercise of a stock option to purchase 530,772 shares of C1 common stock. Mr. Jurasek repaid loan prior to the closing of the Business Combination.
Related Party Transaction Policy
Although C1 did not have a written policy for the review and approval of transactions with related persons, its board of directors historically reviewed and approved any transaction where a director or officer had a financial interest, including the transactions described above. Prior to approving such a transaction, the material facts as to a director or officer’s relationship or interest in the agreement or transaction were disclosed to the board of directors. C1’s board of directors took this information into account when evaluating the transaction and in determining whether such transaction was fair to the company and in the best interest of all its stockholders.
Indemnification Agreements
Our amended and restated certificate of incorporation contains provisions limiting the liability of directors, and our amended and restated bylaws provides that we will indemnify the directors and executive officers to the fullest extent permitted under Delaware law. Our amended and restated certificate of incorporation and bylaws will also provide the board of directors with discretion to indemnify the other officers, employees, and agents when determined appropriate by the board of directors. In addition, we have entered into an indemnification agreement with each of our directors and executive officers, which requires us to indemnify them. For more information regarding these agreements, see the section titled “Description of Securities—Limitation on Liability and Indemnification of Directors and Officers.”
84
Table of Contents
Forum
No Forum executive officer received any cash compensation for services rendered to Forum. Commencing on April 6, 2017 through the closing of the Business Combination in February 2018, Forum paid an affiliate of the Sponsor an aggregate fee of $10,000 per month for providing Forum with office space and certain office and secretarial services. Upon the closing of the Business Combination, such payments were discontinued.
Other than the $10,000 per month administrative fee and the repayment of any loans made by the Sponsor to Forum, no compensation or fees of any kind, including finder’s, consulting fees and other similar fees, were paid to the Sponsor, members of Forum’s management team or their respective affiliates, for services rendered prior to or in connection with the Business Combination. However, they received repayment of any loans from the Sponsor, officers and directors for working capital purposes and reimbursement for any out-of-pocket expenses incurred by them in connection with activities on Forum’s behalf, such as identifying potential target businesses, performing business due diligence on suitable target businesses and business combinations as well as traveling to and from the offices, plants or similar locations of prospective target businesses to examine their operations.
C1 Investment Corp.
Our named executive officers, consisting of our principal executive officer and the next two most highly compensated executive officers, for the year ended December 31, 2017, were:
| • | John A. McKenna, Jr., President and Chief Executive Officer, and Chairman of the Board; |
| • | Jeffrey Nachbor, Chief Financial Officer; and |
| • | John F. Lyons, President, ConvergeOne Enterprise. |
Summary Compensation Table
The following table presents all of the compensation paid or awarded to or earned by our named executive officers during 2016 and 2017:
| Name and Principal Position |
Year | Salary | Non-Equity Incentive Plan Compensation(1) |
All Other Compensation |
Total | |||||||||||||||
| John A. McKenna, Jr. |
2017 | $ | 433,125 | $ | 216,974 | $ | 308,849 | (2) | $ | 958,948 | ||||||||||
| President and Chief Executive Officer, Chairman of the Board | 2016 | 450,000 | 210,316 | 38,855 | 699,171 | |||||||||||||||
| Jeffrey Nachbor |
2017 | 336,875 | 168,758 | 224,505 | (3) | 703,138 | ||||||||||||||
| Chief Financial Officer |
2016 | 350,000 | 163,595 | 14,511 | 528,106 | |||||||||||||||
| John F. Lyons |
2017 | 317,625 | 159,114 | 216,023 | (4) | 692,762 | ||||||||||||||
| President, ConvergeOne Enterprise |
2016 | 330,000 | 254,247 | 18,023 | 602,270 | |||||||||||||||
| (1) | Amounts earned in 2017 were paid during 2018 under our incentive compensation program, based on the achievement of company performance goals, including the achievement of EBITDA and revenue targets. |
| (2) | Includes (a) a management incentive fee in the amount of $32,495, (b) the value of company paid premiums of $54 for life insurance, (c) $6,300 safe-harbor matching contributions defined in our 401(k) plan, and (d) a $270,000 transaction bonus. |
| (3) | Includes (a) a management incentive fee in the amount of $8,151, (b) the value of company paid premiums of $54 for life insurance, (c) $6,300 safe-harbor matching contributions defined in our 401(k) plan, and (d) a $210,000 transaction bonus. |
| (4) | Includes (a) a management incentive fee in the amount of $11,663, (b) the value of company paid premiums of $60 for life insurance, (c) $6,300 safe-harbor matching contributions defined in our 401(k) plan, and (d) a $198,000 transaction bonus. |
85
Table of Contents
Outstanding Equity Awards as of December 31, 2017
As of December 31, 2017, our named executive officers did not hold any outstanding equity awards.
Pension Benefits
Our named executive officers did not participate in, or otherwise receive any benefits under, any pension or defined benefit retirement plan sponsored by us in 2017.
Nonqualified Deferred Compensation
Our named executive officers did not participate in, or earn any benefits under, a non-qualified deferred compensation plan sponsored by us during 2017.
Employment and Change in Control Arrangements
In June 2014, each of our executive officers entered into offer letter agreements with ConvergeOne Holdings Corp., our wholly-owned subsidiary. The offer letter agreements generally provide for at-will employment and set forth the executive officer’s initial base salary, discretionary performance bonus target, annual management incentive fee, severance eligibility, eligibility for other employment benefits, and pre-dispute arbitration agreement. Each executive officer also received a one-time signing bonus. In addition, each executive officer also executed a proprietary information, inventions, non-competition, and non-solicitation agreement.
Offer Letters
John A. McKenna, Jr. Mr. McKenna serves as ConvergeOne’s President and Chief Executive Officer, and as the Chairman of ConvergeOne’s Board of Directors. Mr. McKenna’s current base salary is $450,000, and his discretionary annual target performance bonus is 100% of his annual base salary. Mr. McKenna received a signing bonus of $64,989 upon his commencement of employment. He is eligible to earn an annual management incentive fee of $32,495; provided, he remains employed in good standing through the final pay period of the calendar year. In the event ConvergeOne terminates Mr. McKenna’s employment without cause (and other than for death or disability) or Mr. McKenna terminates his employment for good reason, Mr. McKenna will be eligible for the following severance benefits: (1) an amount equal to his annual base salary plus his performance bonus at target, paid in installments for 12 months, and (2) payment of up to 12 months of COBRA premiums for him and his covered dependents. Mr. McKenna must execute an effective and irrevocable general release of claims to receive these benefits. The payment of severance installments and COBRA premiums will be forfeited if Mr. McKenna breaches any agreement with ConvergeOne during the severance payment period. Mr. McKenna’s non-competition restriction extends for one year after employment termination, and he is restricted from soliciting ConvergeOne’s employees, contractors, customers, and potential customers, and hiring ConvergeOne’s employees, for one year following termination.
Jeffrey Nachbor. Mr. Nachbor serves as ConvergeOne’s Chief Financial Officer. Mr. Nachbor’s current base salary is $350,000, and his discretionary annual target performance bonus is 100% of his annual base salary. Mr. Nachbor received a one-time signing bonus of $16,301 upon his commencement of employment. He is eligible to earn an annual management incentive fee of $8,151; provided, that he remains employed in good standing through the final pay period of the calendar year. Mr. Nachbor received a one-time relocation bonus of $75,000 upon the sale of his previous residence in another state. In the event ConvergeOne terminates Mr. Nachbor’s employment without cause (and other than for death or disability) or Mr. Nachbor terminates his employment for good reason, he will be eligible for severance benefits in an amount equal to his annual base salary, paid in installments for 12 months. Mr. Nachbor must execute an effective and irrevocable general release of claims to receive these benefits. The payment of severance installments is forfeited if Mr. Nachbor breaches any agreement with ConvergeOne during the severance payment period. Mr. Nachbor’s non-competition restriction extends for one year after employment termination, and he is restricted from soliciting ConvergeOne’s employees, contractors, customers, and potential customers, and hiring ConvergeOne’s employees, for two years following termination.
86
Table of Contents
John F. Lyons. Mr. Lyons serves as ConvergeOne’s President, Field Organization of ConvergeOne, Inc., ConvergeOne’s wholly owned subsidiary. Mr. Lyons’ current base salary is $330,000, and his discretionary annual target performance bonus is 100% of his annual base salary. Mr. Lyons received a one-time signing bonus of $23,326 upon his commencement of employment. He is eligible to earn an annual management incentive fee of $11,663, provided, he remains employed in good standing through the final pay period of the calendar year. In the event ConvergeOne terminates Mr. Lyons’ employment without cause (and other than for death or disability) or Mr. Lyons terminates his employment for good reason, he will be eligible for severance benefits in an amount equal to his annual base salary, paid in installments for 12 months. Mr. Lyons must execute an effective and irrevocable general release of claims to receive these benefits. The payment of severance installments is forfeited if Mr. Lyons breaches any agreement with ConvergeOne during the severance payment period. Mr. Lyons’ non-competition restriction extends for one year after employment termination, and he is restricted from solicitation of ConvergeOne’s employees, contractors, customers, and potential customers, and hiring ConvergeOne’s employees, for two years following termination.
Equity Benefit Plans
We believe that our ability to grant equity-based awards is a valuable and necessary compensation tool that aligns the long-term financial interests of our employees, consultants, and directors with the financial interests of our stockholders. In addition, we believe that our ability to grant options and other equity-based awards helps us to attract, retain, and motivate employees, consultants, and directors and encourages them to devote their best efforts to our business and financial success. The principal features of our equity incentive plans and 401(k) plan are summarized below. These summaries are qualified in their entirety by reference to the actual text of the plans, which, other than the 401(k) plan, are filed as exhibits to this prospectus.
2018 Equity Incentive Plan
Our 2018 Equity Incentive Plan (the “Equity Incentive Plan”) was approved by our board of directors and stockholders in February 2018, and became effective upon the closing of the Business Combination. The Equity Incentive Plan has following principal features:
| • | Types of Awards. The Equity Incentive Plan provides for the grant of incentive stock options, or ISOs, nonstatutory stock options, or NSOs, stock appreciation rights, restricted stock awards, restricted stock unit awards, performance-based stock awards, and other forms of equity compensation, or collectively, stock awards, all of which may be granted to our employees, including officers, non-employee directors and consultants. Additionally, the Equity Incentive Plan provides for the grant of performance cash awards. ISOs may be granted only to employees. All other awards may be granted to employees, including officers, and to non-employee directors and consultants. |
| • | Shares Available for Awards. Initially, the aggregate number of shares of common stock that may be issued pursuant to stock awards under the Equity Incentive Plan will not exceed 10,000,000 shares. Additionally, the number of shares of common stock reserved for issuance under the Equity Incentive Plan will automatically increase on January 1 of each year, beginning on January 1, 2019 and continuing through and including January 1, 2028, by 4.0% of the total number of shares of common stock outstanding on December 31 of the preceding calendar year, or a lesser number of shares determined by the board of directors. |
| • | Non-Employee Director Compensation. The maximum number of shares of common stock subject to awards granted under the Equity Incentive Plan or any other equity plan maintained by us during any single fiscal year to any non-employee director, taken together with any cash fees paid to the director during the year, will not exceed $600,000 in total value, or $900,000 for the year in which a non-employee director is first appointed or elected to our board of directors. |
| • | Performance Awards. The Equity Incentive Plan permits the grant of performance-based stock and cash awards. The plan administrator can structure such awards so that stock or cash will be issued or paid pursuant to such award only after the achievement of certain performance goals during a designated performance period. |
87
Table of Contents
2018 Employee Stock Purchase Plan
Our 2018 Employee Stock Purchase Plan (the “ESPP”) was approved by our board of directors and stockholders in February 2018, and became effective upon the closing of the Business Combination. The ESPP has the following principal features:
| • | Types of Awards. The ESPP provides a means by which our employees may be given an opportunity to purchase shares of our common stock. The rights to purchase common stock granted under the ESPP are intended to qualify as options issued under an “employee stock purchase plan” as that term is defined in Section 423(b) of the Code. |
| • | Shares Subject to ESPP. Initially, the maximum number of shares of common stock that may be issued under the ESPP is 1,500,000 shares. Additionally, the number of shares of common stock reserved for issuance under the ESPP will automatically increase on January 1 of each year, beginning on January 1, 2019 and continuing through and including January 1, 2028, by the lesser of (i) 1.0% of the total number of shares of common stock outstanding on December 31 of the preceding calendar year, (ii) 1,500,000 shares of common stock; or (iii) a lesser number of shares determined by our board of directors. |
| • | Purchase of Shares; Offerings. The ESPP will be implemented by offerings of rights to purchase common stock to all eligible employees. Our board of directors (or our compensation committee) will determine the duration of each offering period, provided that in no event may an offering period exceed 27 months. Each offering period will have one or more purchase dates, as determined by our board or compensation committee prior to the commencement of the offering period, and may allow eligible employees to purchase shares of common stock at a default purchase price of 95% of the fair market value of a share of common stock on the purchase date; provided that our board or compensation committee may determine a different purchase price prior to the start of an offering period and provided that the purchase price may not be less than the lower of (i) 85% of the fair market value of a share of common stock on the first day of the offering period or (ii) 85% of the fair market value of a share of common stock on the purchase date. |
2014 Equity Incentive Plan
Our board of directors adopted and our stockholders approved the 2014 Plan in June 2014. The 2014 Plan was amended most recently in February 2017. The 2014 Plan provided for the grant of incentive stock options, or ISOs, within the meaning of Section 422 of the Code, to our employees, and for the grant of nonstatutory stock options, or NSOs, restricted stock awards, restricted stock units, stock appreciation rights, and other stock awards to our employees, directors and consultants. Upon the closing of the Business Combination all outstanding stock awards under the 2014 Plan were accelerated and vested in full.
Health and Welfare Benefits
All of our named executive officers are eligible to participate in our employee benefit plans, including our medical, dental, and vision insurance plans, in each case on the same basis as all of our other full-time employees.
401(k) Plan
Our wholly-owned subsidiary, ConvergeOne Holdings Corp., maintains a deferred retirement savings plan intended to qualify for favorable tax treatment under Section 401(a) of the Internal Revenue Code. All of our employees are generally eligible to participate in the 401(k) Plan subject to certain eligibility requirements, including requirements relating to age. Under the 401(k) Plan, each employee may make pre-tax and/or contributions of up to 75% of their eligible compensation up to the current statutorily prescribed annual limit on pre-tax or Roth contributions under the Code. Employees who are 50 years of age or older may contribute additional amounts based on the statutory limits for catch-up contributions. Pre-tax contributions by employees and any employer contributions that we make to the 401(k) Plan and the income earned on those contributions are generally not taxable to employees until withdrawn. Employer contributions that we make to the 401(k) Plan are generally deductible when made. Employee contributions are held in trust as required by law. An employee’s
88
Table of Contents
interest in his or her pre-tax deferrals, including, with the exception of certain discretionary contributions, any matching contributions made by us, is 100% vested when contributed. For 2016, we made $3.0 million in matching contributions.
2017 Non-Employee Director Compensation
Forum
No compensation was paid to any non-employee director of Forum during 2017.
C1 Investment Corp.
The following table sets forth information regarding compensation earned by or paid to the non-employee directors of C1 Investment Corp. during 2017.
| Name |
Fees Earned or Paid in Cash |
Option Awards |
Other Compensation |
Total | ||||||||||||
| Keith W.F. Bradley(1) |
$ | 50,000 | $ | — | $ | — | $ | 50,000 | ||||||||
| Behdad Eghbali(2) |
— | — | — | — | ||||||||||||
| José E. Feliciano |
— | — | — | — | ||||||||||||
| Christopher Jurasek(3) |
18,750 | 883,448 | — | 902,198 | ||||||||||||
| Prashant Mehrotra(4) |
— | — | — | — | ||||||||||||
| Timothy J. Pawlenty(5) |
60,000 | — | — | 60,000 | ||||||||||||
| James Pade(6) |
— | — | — | — | ||||||||||||
| (1) | As of December 31, 2017, Mr. Bradley held 370,108 unvested shares of common stock that Mr. Bradley received upon early exercise of stock options granted to Mr. Bradley. Upon the closing of the Business Combination all unvested shares accelerated and vested in full. |
| (2) | Mr. Eghbali did not hold any equity awards as of December 31, 2017. |
| (3) | In connection with his appointment to the board of directors of C1 in August 2017, Mr. Jurasek was granted a stock option to purchase 530,772 shares of common stock with an exercise price of $3.40 per share. The amount shown in the Option Awards column does not reflect the dollar amount actually received by Mr. Jurasek. Instead, this amount reflects the aggregate grant date fair value of this stock option granted computed in accordance with the provisions of FASB ASC Topic 718. Assumptions used in the calculation of this amount are included in the notes to our consolidated financial statements included in this prospectus. As of December 31, 2017, Mr. Jurasek held 530,772 unvested shares of common stock that Mr. Jurasek received upon early exercise of such stock options. Upon the closing of the Business Combination, all unvested shares accelerated and vested in full. |
| (4) | Mr. Mehrotra did not hold any equity awards as of December 31, 2017. |
| (5) | As of December 31, 2017, Mr. Pawlenty held 422,980 unvested shares of common stock, all of which Mr. Pawlenty received upon early exercise of stock options. Upon the closing of the Business Combination all unvested shares accelerated and vested in full. |
| (6) | Mr. Pade did not hold any equity awards as of December 31, 2017. |
89
Table of Contents
BENEFICIAL OWNERSHIP OF SECURITIES
The following table sets forth information regarding the beneficial ownership of shares of our common stock as of March 1, 2018:
| • | each person known by us to be the beneficial owner of more than 5% of our common stock on March 1, 2018; |
| • | each of our executive officers and directors; and |
| • | all executive officers and directors of as a group. |
Beneficial ownership is determined according to the rules of the SEC, which generally provide that a person has beneficial ownership of a security if he, she or it possesses sole or shared voting or investment power over that security, including options and warrants that are currently exercisable or exercisable within 60 days.
Unless otherwise indicated, we believe that all persons named in the table have sole voting and investment power with respect to all shares of common stock of ConvergeOne beneficially owned by them. Unless otherwise indicated, the business address of each of the individuals is c/o ConvergeOne Holdings, Inc., 3344 Highway 149 Eagan, MN, 55121.
| Beneficial Ownership | ||||||||
| Beneficial Owner |
Number of Shares |
% | ||||||
| Clearlake Capital Partners III (Master) LP(1) |
38,129,813 | 54.7% | ||||||
| John A. McKenna, Jr(2) |
3,219,709 | 4.6 | ||||||
| Jeffrey Nachbor |
735,039 | 1.1 | ||||||
| Paul Maier(3) |
637,127 | * | ||||||
| John F. Lyons |
1,252,279 | 1.8 | ||||||
| David Boris(4) |
886,953 | 1.3 | ||||||
| Richard Katzman(5) |
180,875 | * | ||||||
| Keith W. F. Bradley |
235,310 | * | ||||||
| Behdad Eghbali(1) |
38,129,813 | 54.7 | ||||||
| Jose E. Feliciano(1) |
38,129,813 | 54.7 | ||||||
| Christopher Jurasek |
236,221 | * | ||||||
| Prashant Mehrotra |
— | — | ||||||
| James Pade |
— | — | ||||||
| Timothy J. Pawlenty |
235,310 | * | ||||||
| All directors and executive officers as a group (13 individuals) |
45,748,636 | 65.6 | ||||||
| * | Less than one percent. |
| (1) | Represents shares held by Clearlake Capital Partners III (Master), L.P., a Delaware limited partnership, or CCPIII. CCPIII is managed by Clearlake Capital Management III, L.P., a Delaware limited partnership, or CCMIII. CCMIII’s general partner is Clearlake Capital Group, L.P., whose general partner is CCG Operations, L.L.C., a Delaware limited liability company, or CCG Ops. CCPIII’s general partner is Clearlake Capital Partners III GP, L.P., a Delaware limited partnership, or CCPIII GP. CCPIII GP’s general partner is Clearlake Capital Partners, LLC, a Delaware limited liability company, or CCP. CCP’s managing member is CCG Ops. José E. Feliciano and Behdad Eghbali are managers of CCG Ops and may be deemed to share voting and dispositive power of the shares held of record by CCPIII. The address of Messrs. Feliciano and Eghbali and the entities named in this footnote is c/o Clearlake CapitalGroup, 233 Wilshire Blvd, Suite 800, Santa Monica, CA 90401. |
| (2) | Includes (i) 2,353,137 shares directly held by Mr. McKenna and (ii) 866,572 shares held by The John Arthur McKenna, Jr. Irrevocable Trust, dated August 27, 2014, of which Mr. McKenna’s wife is the sole trustee. |
| (3) | Includes 637,127 shares held by Mr. Maier as trustee of Paul K. Maier Living Trust DTD 1/31/2008. |
| (4) | Includes (i) 12,500 shares issuable upon exercise of a warrant held by Mr. Boris and (ii) 874,453 shares held by Mr. Boris. |
| (5) | Includes (i) 7,500 shares issuable upon the exercise of a warrant held by Mr. Katzman, (ii) 48,375 shares held by Mr. Katzman and (iii) 125,000 shares of common stock held by the Katzman Family LLC of which Richard Katzman is the investment manager. |
90
Table of Contents
The following section summarizes the terms of our material principal indebtedness.
June 2017 Credit Facilities
Senior Secured Term Loan
On June 20, 2017, we and our subsidiary C1 Intermediate Corp. (“Intermediate”), entered into a Term Loan Agreement, or the Term Loan Agreement, with JPMorgan Chase Bank, N.A. as the administrative agent and collateral agent (the “Term Loan Agreement”). The Term Loan Agreement provides for senior secured term loans in an original aggregate principal amount of $430 million, or the Term Loans. A portion of the proceeds of the Term Loans were used to repay the June 2014 Credit Facilities described below and to pay debt issuance costs. The remaining proceeds will be used for working capital needs and general corporate purposes.
Principal installments in the amount of $1,262,500 are due on the last business day of each quarter commencing September 30, 2017, with the remaining outstanding principal amount to be paid on its maturity date of June 20, 2024.
The obligations under the Term Loan Agreement are unconditionally and irrevocably guaranteed by Intermediate and certain of our restricted subsidiaries. In addition, the obligations under the Term Loan Agreement are secured by a first priority lien on substantially all of our assets and each guarantor, except for the assets secured by a first priority lien under the Revolving Loan Credit Agreement discussed below, on which we have granted a second priority lien to secure the obligations under the Term Loan Agreement.
The Term Loan Agreement contains a number of significant restrictive covenants. Such restrictive covenants, among other things, restrict, subject to certain exceptions, our and our restricted subsidiaries’ ability to (i) incur additional indebtedness and make guarantees, (ii) create liens on assets, (iii) pay dividends and distributions or repurchase its capital stock, (iv) make investments, loans and advances, including acquisitions, (v) engage in mergers, consolidations, dissolutions or similar transactions, (vi) sell or otherwise dispose of assets, including sale and leaseback transactions, (vii) engage in certain transactions with affiliates, (viii) enter into certain restrictive agreements, (ix) make changes in the nature of its business, fiscal year and organizational documents, (x) make prepayments or amend the terms of certain junior debt and (xi) enter into certain hedging arrangements. The Term Loan Agreement also contains certain customary representations and warranties, affirmative covenants and events of default, including the occurrence of a Change of Control, as defined in the Term Loan Agreement. If an event of default occurs, the lenders under the Term Loan Agreement will be entitled to take various actions, including the acceleration of amounts due under the Term Loan Agreement and actions permitted to be taken by a secured creditor.
The Term Loan Agreement requires us to prepay outstanding Term Loans, subject to certain exceptions, with (i) commencing with the year ending December 31, 2018, 75% of “excess cash flow” (which percentage steps down to 50% and 0% when we obtains certain consolidated total net leverage ratios), (ii) 100% of the net cash proceeds of all non-ordinary course asset sales or other dispositions of property and (iii) 100% of the net cash proceeds of any incurrence of debt, other than debt permitted to be incurred or issued under the Term Loan Agreement. We are permitted to voluntarily repay outstanding Term Loans at any time without premium or penalty, unless such payment is made prior to June 20, 2018 in connection with a repricing transaction as described in the Term Loan Agreement, in which case we are required to pay a premium of 1% of the Term Loans so prepaid.
The Term Loans bear interest at 3.75% above the alternate base rate or 4.75% above the Eurodollar rate, as described in the Term Loan Agreement. Interest on the Eurodollar rate Term Loans is payable on the last day of the Interest Period, as defined in the Term Loan Agreement, and interest on alternate base rate Term Loans is payable on the last day of each quarter. Borrowings under the Term Loans had an interest rate of 6.45% at December 31, 2017.
91
Table of Contents
On July 28, 2017, we borrowed an additional $75 million of term loans under an incremental amendment to the Term Loan Agreement, which loans are part of the same class of, and on the same terms as, the initial Term Loans. Proceeds from the incremental amendment were used for the Annese & Associates, Inc. acquisition, discussed in Note 2 of the financial statements, and will be used for other acquisitions and general corporate purposes.
On October 25, 2017, we borrowed an additional $60 million of term loans under an incremental amendment to the Term Loan Agreement, which loans are part of the same class of, and on the same terms as, the initial Term Loans. Proceeds from the incremental amendment will be used to repay acquisition indebtedness related to the SPS acquisition and will be used for general corporate purposes.
On January 18, 2018, we amended the Term Loan Agreement to amend certain definitions related to the Business Combination and the restrictive covenant related to dividends and distributions.
Senior Secured Revolving Loan Facility
On June 20, 2017, we and Intermediate entered into a Revolving Loan Credit Agreement, or the Revolver Agreement, with Wells Fargo Commercial Distribution Finance, LLC, or Wells Fargo, as the administrative agent and collateral agent and as Floorplan Funding Agent. The Revolver Agreement provides a senior secured revolving loan facility of $150 million aggregate principal amount of revolving loans and amends and restates the existing floorplan agreement with Wells Fargo in order to extend credit in the form of a floorplan subfacility. In connection with the December 2017 acquisition of AOS, Holdings drew down $30.0 million under the Revolver Agreement. Holdings has repaid $24.0 million of this draw down under the Revolver Agreement, and $6.0 million remains outstanding. The Revolver Agreement matures on June 20, 2022.
The obligations under the Revolver Agreement are unconditionally and irrevocably guaranteed by Intermediate and certain restricted subsidiaries of ConvergeOne. The obligations under the Revolver Agreement are secured by a first priority lien on our receivable accounts, inventory, and deposit and securities accounts, and a second priority lien on substantially all of its other assets. The aggregate principal amount of the revolving loans and floorplan advances is limited to a Borrowing Base as defined by the Revolver Agreement, reduced by outstanding letters of credit. Mandatory prepayments are required in the event that the sum of the outstanding principal amount of the revolving loans, letters of credit and floorplan advances exceeds the lesser of (i) the aggregate revolving commitments of $150 million or (ii) the Borrowing Base, in an amount equal to the excess.
The Revolver Agreement contains a number of significant restrictive covenants. Such restrictive covenants, among other things, restrict, subject to certain exceptions, we and our restricted subsidiaries’ ability to (i) incur additional indebtedness and make guarantees, (ii) create liens on assets, (iii) pay dividends and distributions or repurchase its capital stock, (iv) make investments, loans and advances, including acquisitions, (v) engage in mergers, consolidations, dissolutions or similar transactions, (vi) sell or otherwise dispose of assets, including sale and leaseback transactions, (vii) engage in certain transactions with affiliates, (viii) enter into certain restrictive agreements, (ix) make changes in the nature of its business, fiscal year and organizational documents, (x) make prepayments or amend the terms of certain junior debt and (xi) enter into certain hedging arrangements. The Revolver Agreement also contains certain customary representations and warranties, affirmative covenants and events of default, including the occurrence of a Change of Control, as defined in the Revolver Agreement. If an event of default occurs, the lenders under the Revolver Agreement will be entitled to take various actions, including the acceleration of amounts due under the Revolver Agreement and actions permitted to be taken by a secured creditor.
If the Revolving Exposure, as described in the Revolver Agreement, exceeds the lesser of the revolving loan commitments or the borrowing base, the Revolver Agreement requires us to prepay outstanding Revolving Loans in an aggregate amount equal to such excess. We are permitted to voluntarily repay outstanding Revolving Loans at any time without premium or penalty.
Borrowings under the Revolver Agreement bear interest at rates ranging from 0.25% to 0.75% above the alternate base rate or from 1.25% to 1.75% above the Eurodollar rate as described in the Revolver Agreement, in
92
Table of Contents
each case based on availability under the Revolver Agreement. A commitment fee equal to 0.250% or 0.375% per annum (based on availability under the Revolver Agreement) times the average daily unused amount of the available revolving commitments is payable on the last day of each quarter.
On January 18, 2018, we amended the Revolver Agreement to amend certain definitions related to the Business Combination.
On February 13, 2018, we amended the Revolver Agreement to increase the aggregate revolving commitments from $150 million to $200 million. Concurrent with the amendment to the Revolver Agreement, the aggregate principal amount of floor plan advances credit limit increased from $150 million to $200 million.
June 2014 Credit Facilities
In June 2014, we, Intermediate, and certain of our subsidiaries entered into a First Lien Credit Agreement and a Second Lien Credit Agreement with Credit Suisse AG, Cayman Islands Branch, as administrative agent and collateral agent, the lenders from time to time party thereto, and certain other parties thereto, each agreement as amended (collectively, the “June 2014 Credit Facilities”).
On June 20, 2017, concurrent with entering into the Term Loan Agreement and Revolver Agreement, we terminated the June 2014 Credit Facilities.
93
Table of Contents
Authorized and Outstanding Stock
Our amended and restated certificate of incorporation authorizes the issuance of 1,010,000,000 shares, consisting of 1,000,000,000 shares of common stock, $0.0001 par value per share, and 10,000,000 shares of preferred stock, $0.0001 par value. No shares of preferred stock are currently outstanding.
Common Stock
Voting Power
Except as otherwise required by law or as otherwise provided in any certificate of designation for any series of preferred stock, the holders of common stock possess all voting power for the election of our directors and all other matters requiring stockholder action. Holders of common stock are entitled to one vote per share on matters to be voted on by stockholders.
Dividends
Holders of common stock are entitled to receive such dividends, if any, as may be declared from time to time by our board of directors in our discretion out of funds legally available therefor. In no event will any stock dividends or stock splits or combinations of stock be declared or made on common stock unless the shares of common stock at the time outstanding are treated equally and identically.
Liquidation, Dissolution and Winding Up
In the event of our voluntary or involuntary liquidation, dissolution, distribution of assets or winding-up, the holders of the common stock will be entitled to receive an equal amount per share of all of our assets of whatever kind available for distribution to stockholders, after the rights of the holders of the preferred stock have been satisfied.
Preemptive or Other Rights
There are no sinking fund provisions applicable to the common stock.
Preferred Stock
Our board of directors may, without further action by our stockholders, fix the rights, preferences, privileges and restrictions of up to an aggregate of 10,000,000 shares of preferred stock in one or more series and authorize their issuance. These rights, preferences and privileges could include dividend rights, conversion rights, voting rights, terms of redemption, liquidation preferences, sinking fund terms and the number of shares constituting any series or the designation of such series, any or all of which may be greater than the rights of our common stock. The issuance of our preferred stock could adversely affect the voting power of holders of our common stock and the likelihood that such holders will receive dividend payments and payments upon liquidation. In addition, the issuance of preferred stock could have the effect of delaying, deterring or preventing a change of control or other corporate action. No shares of preferred stock are currently outstanding, and we have no present plan to issue any shares of preferred stock.
Warrants
As of March 1, 2018, there are 8,936,249 warrants outstanding, consisting of 8,624,999 Public Warrants originally sold as part of Units in the Forum IPO and 311,250 Placement Warrants sold as part of the private placement consummated simultaneously with the Forum IPO.
Each whole warrant entitles the registered holder to purchase one share of common stock at a price of $11.50 per share, subject to adjustment as discussed below, at any time commencing on April 12, 2018. Pursuant
94
Table of Contents
to the warrant agreement, a warrantholder may exercise such warrants only for a whole number of shares of common stock. This means that only a whole warrant may be exercised at any given time by a warrantholder. No warrants will be exercisable for cash unless we have an effective and current registration statement covering the shares of common stock issuable upon exercise of the warrants and a current prospectus relating to such shares of common stock. Notwithstanding the foregoing, if a registration statement covering the shares of common stock issuable upon exercise of the Public Warrants is not effective within 90 days following the consummation of the Business Combination, warrant holders may, until such time as there is an effective registration statement and during any period when we shall have failed to maintain an effective registration statement, exercise warrants on a cashless basis pursuant to the exemption provided by Section 3(a)(9) of the Securities Act, provided that such exemption is available. If that exemption, or another exemption, is not available, holders will not be able to exercise their warrants on a cashless basis. In such event, each holder would pay the exercise price by surrendering the warrants for that number of shares of common stock equal to the quotient obtained by dividing (x) the product of the number of shares of common stock underlying warrants, multiplied by the difference between the exercise price of the warrants and the “fair market value” (defined below) by (y) the fair market value. The “fair market value” for this purpose will mean the average reported last sale price of the shares of common stock for the 5 trading days ending on the trading day prior to the date of exercise. The warrants will expire on February 22, 2023, the fifth anniversary of our completion of the Business Combination, at 5:00 p.m., New York City time, or earlier upon redemption or liquidation.
The warrants were issued in registered form under a warrant agreement between Continental, as warrant agent, and us. The warrant agreement provides that the terms of the warrants may be amended without the consent of any holder to cure any ambiguity or correct any defective provision, but requires the approval, by written consent or vote, of the holders of at least 50% of the then outstanding warrants in order to make any change that adversely affects the interests of the registered holders.
The exercise price and number of shares of common stock issuable on exercise of the warrants may be adjusted in certain circumstances including in the event of a stock dividend, extraordinary dividend or our recapitalization, reorganization, merger or consolidation. However, the warrants will not be adjusted for issuances of shares of common stock at a price below their respective exercise prices.
The warrants may be exercised upon surrender of the warrant certificate on or prior to the expiration date at the offices of the warrant agent, with the exercise form on the reverse side of the warrant certificate completed and executed as indicated, accompanied by full payment of the exercise price, by certified or official bank check payable to us, for the number of warrants being exercised. The warrant holders do not have the rights or privileges of holders of shares of common stock and any voting rights until they exercise their warrants and receive shares of common stock. After the issuance of shares of common stock upon exercise of the warrants, each holder will be entitled to one vote for each share held of record on all matters to be voted on by stockholders.
Under the terms of the warrant agreement, we have agreed to use our best efforts to have declared effective a prospectus relating to the shares of common stock issuable upon exercise of the warrants and keep such prospectus current until the expiration of the warrants. However, we cannot assure you that we will be able to do so and, if we do not maintain a current prospectus relating to the shares of common stock issuable upon exercise of the warrants, holders will be unable to exercise their warrants for cash and we will not be required to net cash settle or cash settle the warrant exercise.
Warrant holders may elect to be subject to a restriction on the exercise of their warrants such that an electing warrant holder would not be able to exercise their warrants to the extent that, after giving effect to such exercise, such holder would beneficially own in excess of 9.8% of the shares of common stock outstanding.
No fractional shares will be issued upon exercise of the warrants. If, by reason of any adjustment made pursuant to the warrant agreement, upon exercise of the warrants, a holder would be entitled to receive a fractional interest in a share, we will, upon exercise, round up to the nearest whole number the number of shares of common stock to be issued to the warrant holder.
95
Table of Contents
Redemption
We may call the Public Warrants for redemption, in whole and not in part, at a price of $0.01 per warrant,
| • | at any time during the exercise period, |
| • | upon not less than 30 days’ prior written notice of redemption to each Public Warrant holder, |
| • | if, and only if, the reported last sale price of the shares of common stock equals or exceeds $18.00 per share (as adjusted for stock splits, stock dividends, reorganizations and recapitalizations), for any 20 trading days within a 30 trading day period ending on the third business day prior to the notice of redemption to Public Warrant holders; and |
| • | if, and only if, there is a current registration statement in effect with respect to the shares of common stock underlying the Public Warrants. |
The right to exercise will be forfeited unless the Public Warrants are exercised prior to the date specified in the notice of redemption. On and after the redemption date, a record holder of a Public Warrant will have no further rights except to receive the redemption price for such holder’s Public Warrant upon surrender of such Public Warrant.
The redemption criteria for our Public Warrants have been established at a price which is intended to provide warrant holders a reasonable premium to the initial exercise price and provide a sufficient differential between the then-prevailing share price and the warrant exercise price so that if the share price declines as a result of our redemption call, the redemption will not cause the share price to drop below the exercise price of the Warrants.
If we call the Public Warrants for redemption as described above, our management will have the option to require all holders that wish to exercise warrants to do so on a “cashless basis.” In such event, each holder would pay the exercise price by surrendering the warrants for that number of shares of common stock equal to the quotient obtained by dividing (x) the product of the number of shares of common stock underlying the warrants, multiplied by the difference between the exercise price of the warrants and the “fair market value” (defined below) by (y) the fair market value. The “fair market value” shall mean the average reported last sale price of the shares of common stock for the 5 trading days ending on the third trading day prior to the date on which the notice of redemption is sent to the holders of Public Warrants.
Purchase Option
In connection with the Forum IPO, Forum sold to EBC and its designees, for $100, a UPO to purchase up to a total of 1,125,000 Units exercisable at $10.00 per Unit. The option represents the right to purchase up to 1,237,500 shares of common stock (which includes 112,500 shares which will be issued for the Rights included in the Units) and warrants to purchase 562,500 shares of common stock at $11.50 per share for an aggregate maximum amount of $6,468,750.
The UPO may be exercised for cash or on a cashless basis, at the holder’s option, at any time during the period commencing April 6, 2018 (the first anniversary of the effective date of the registration statement filed in connection with the Forum IPO) and will terminate on April 6, 2022 (the fifth anniversary of the effective date of the registration statement filed in connection with the Forum IPO). Notwithstanding anything to the contrary, neither the UPO nor the Rights or Warrants underlying the UPO are exercisable after April 6, 2022.
The UPO grants to holders demand and “piggy back” rights for periods of five and seven years, respectively, from April 6, 2017 (the effective date of the registration statement filed in connection with the Forum IPO) with respect to the registration under the Securities Act of the securities directly and indirectly issuable upon exercise of the UPO. EBC and/or its designees may only make a demand registration (i) on one occasion and (ii) during the five year period beginning on April 6, 2017, the effective date of the registration statement filed with the SEC for the Forum IPO. We will bear all fees and expenses attendant to registering the securities, other than underwriting commissions, which will be paid for by the holders themselves.
96
Table of Contents
The exercise price and number of Units issuable upon exercise of the UPO may be adjusted in certain circumstances including in the event of a stock dividend, or recapitalization, reorganization, merger or consolidation. However, the UPO will not be adjusted for issuances of common stock at a price below our exercise price. We have no obligation to net cash settle the exercise of the UPO or the Rights or warrants underlying the UPO. The holder of the UPO will not be entitled to exercise the UPO or the Rights or warrants underlying the UPO unless a registration statement covering the securities underlying the UPO is effective or an exemption from registration is available. If the holder is unable to exercise the UPO or underlying Rights or warrants, the UPO, Rights or warrants, as applicable, will expire worthless.
Registration Rights
In April 2017, the Sponsor entered into a registration rights agreement with Forum pursuant to which the Sponsor was granted certain rights relating to the registration of shares of common stock and warrants held by it and its transferees. In February 2018, upon the closing of the Business Combination, we, certain C1 Securityholders, including our executive officers and Clearlake, and the Sponsor entered into an amended and restated registration rights agreement, pursuant to which such parties hold registration rights with respect to shares of common stock issued as merger consideration under the Merger Agreement, including any Earnout Stock Payments, as well as shares of common stock held by the Sponsor and its transferees, or issuable upon the exercise of warrants by the Sponsor. Stockholders holding a majority-in-interest of such registrable securities are entitled to make a written demand for registration under the Securities Act of all or part of their registrable securities. Subject to certain exceptions, such stockholders also have certain “piggy-back” registration rights with respect to registration statements filed by us, as well additional rights to provide for registration of registrable securities on Form S-3 and any similar short-form registration statement that may be available at such time. We will bear the expenses incurred in connection with the filing of any such registration statements described above.
Anti-Takeover Provisions
Certificate of Incorporation and Bylaws
Among other things, our amended and restated certificate of incorporation and amended and restated bylaws:
| • | permit our board of directors to issue up to 10,000,000 shares of preferred stock, with any rights, preferences and privileges as they may designate, including the right to approve an acquisition or other change of control; |
| • | provide that the authorized number of directors may be changed only by resolution of our board of directors; |
| • | provide that, subject to the rights of any series of preferred stock to elect directors, directors may be removed with or without cause, by the holders of at least a majority of our then-outstanding shares of capital stock entitled to vote generally at an election of directors for so long as a fund managed by Clearlake Capital Group, L.P., which, together with our affiliates and related persons, we refer to as Clearlake, holds at least a majority of our then-outstanding shares of capital stock entitled to vote generally at an election of directors, or otherwise with cause by the holders of at least 66 2/3% of all of our then-outstanding shares of the capital stock entitled to vote generally at an election of directors; |
| • | provide that all vacancies, including newly created directorships, may, except as otherwise required by law, be filled by the affirmative vote of a majority of directors then in office, even if less than a quorum; |
| • | provide that any action to be taken by our stockholders may be taken by written consent or electronic transmission pursuant to Section 228 of the Delaware General Corporation Law, so long as Clearlake holds a majority of our then-outstanding capital stock entitled to vote generally at an election of directors; |
97
Table of Contents
| • | provide that stockholders seeking to present proposals before a meeting of stockholders or to nominate candidates for election as directors at a meeting of stockholders must provide advance notice in writing, and also specify requirements as to the form and content of a stockholder’s notice; |
| • | provide that special meetings of our stockholders may be called by the chairperson of our board of directors, our chief executive officer, by our board of directors pursuant to a resolution adopted by a majority of the total number of authorized directors or, for so long as Clearlake holds a majority of our then-outstanding capital stock entitled to vote generally at an election of directors, one or more stockholders that in the aggregate represent a majority of the total votes entitled to be cast at the meeting; |
| • | provide that our board of directors will be divided into three classes of directors, with the classes to be as nearly equal as possible, and with the directors serving three-year terms (see the section titled “Management After the Business Combination”), therefore making it more difficult for stockholders to change the composition of our board of directors; and |
| • | do not provide for cumulative voting rights, therefore allowing the holders of a majority of the shares of common stock entitled to vote in any election of directors to elect all of the directors standing for election, if they should so choose. |
For so long as Clearlake holds at least a majority of our then-outstanding capital stock entitled to vote generally at an election of directors, the amendment of any of these provisions would require approval of the holders of at least a majority of all of our then-outstanding capital stock entitled to vote generally in the election of directors; otherwise, the amendment of any of these provisions would require approval by the holders of at least 66 2/3% of all of our then-outstanding capital stock entitled to vote generally in the election of directors.
The combination of these provisions will make it more difficult for our existing stockholders to replace our board of directors as well as for another party to obtain control of us by replacing our board of directors. Because our board of directors has the power to retain and discharge our officers, these provisions could also make it more difficult for existing stockholders or another party to effect a change in management. In addition, the authorization of undesignated preferred stock makes it possible for our board of directors to issue preferred stock with voting or other rights or preferences that could impede the success of any attempt to change our control.
These provisions are intended to enhance the likelihood of continued stability in the composition of our board of directors and our policies and to discourage coercive takeover practices and inadequate takeover bids. These provisions are also designed to reduce our vulnerability to hostile takeovers and to discourage certain tactics that may be used in proxy fights. However, such provisions could have the effect of discouraging others from making tender offers for our shares and may have the effect of delaying changes in our control or management. As a consequence, these provisions may also inhibit fluctuations in the market price of our stock.
Delaware Anti-Takeover Law
We have opted out of Section 203 of the Delaware General Corporation Law. However, our amended and restated certificate of incorporation contains similar provisions providing that we may not engage in certain “business combinations” with any “interested stockholder” for a three-year period following the time that the stockholder became an interested stockholder, unless:
| • | prior to the date of the transaction, our board of directors approved either the business combination or the transaction which resulted in the stockholder becoming an interested stockholder; |
| • | the interested stockholder owned at least 85% of our voting stock outstanding upon consummation of the transaction, excluding for purposes of determining the number of shares outstanding (1) shares owned by persons who are directors and also officers and (2) shares owned by employee stock plans in which employee participants do not have the right to determine confidentially whether shares held subject to the plan will be tendered in a tender or exchange offer; or |
98
Table of Contents
| • | on or subsequent to the consummation of the transaction, the business combination is approved by our board of directors and authorized at an annual or special meeting of stockholders, and not by written consent, by the affirmative vote of at least 66 2/3% of the outstanding voting stock which is not owned by the interested stockholder. |
Generally, a “business combination” includes a merger, asset or stock sale or other transaction resulting in a financial benefit to the interested stockholder. An interested stockholder is a person who, together with our affiliates and associates, owns or, within three years prior to the determination of interested stockholder status, did own 15% or more of our outstanding voting stock. These provisions may encourage companies interested in acquiring us to negotiate in advance with our board of directors because the stockholder approval requirement would be avoided if our board of directors approves either the business combination or the transaction which results in the stockholder becoming an interested stockholder. These provisions also may have the effect of preventing changes in our board of directors and may make it more difficult to accomplish transactions which stockholders may otherwise deem to be in their best interests.
Our amended and restated certificate of incorporation provides that Clearlake and our affiliates and any of their direct or indirect transferees and any group as to which such persons are a party do not constitute “interested stockholders” for purposes of this provision.
Choice of Forum
Our amended and restated certificate of incorporation provides that the Court of Chancery of the State of Delaware is the exclusive forum for:
| • | any derivative action or proceeding brought on our behalf; |
| • | any action asserting a breach of fiduciary duty; |
| • | any action asserting a claim against us arising under the Delaware General Corporation Law; |
| • | any action regarding our amended and restated certificate of incorporation or our amended and restated bylaws; or |
| • | any action asserting a claim against us that is governed by the internal affairs doctrine. Our amended and restated certificate of incorporation further provides that the federal district courts of the United States of America will be the exclusive forum for resolving any complaint asserting a cause of action arising under the Securities Act. |
99
Table of Contents
On February 22, 2018, we consummated the Business Combination. In connection with the Business Combination, we, among other things, committed to issue 17,959,375 shares of common stock in the PIPE Investment pursuant to subscription agreements entered into prior to the consummation of the Business Combination.
The selling stockholders may offer and sell, from time to time, any or all of the shares of common stock or warrants being offered for resale by this prospectus, which consists of:
| • | up to 17,959,375 PIPE Shares; |
| • | up to 3,919,125 Founders Shares; |
| • | up to 311,250 shares of common stock issuable upon the exercise of Placement Warrants; and |
| • | up to 8,624,999 shares of common stock issuable upon the exercise of Public Warrants. |
The term “selling stockholders” includes the stockholders listed in the table below and their permitted transferees.
An aggregate of 2,156,250 of the Founder Shares are subject to forfeiture in the event that the Earnout Payments are not achieved and may not be sold until such time. Such shares are also subject to 180-day lock-up agreement; provided, that if the volume-weighted average price of our common stock for 15 trading days is at least $12.50 per share, then 25% of such shares will be released from the lock-up agreement, but will remain subject to forfeiture and may not be sold. See the section titled “Certain Relationships and Related Person Transactions—Sponsor Earnout letter and Lock-Up Letter.”
The following table provides, as of the date of this prospectus, information regarding the beneficial ownership of our common stock and warrants of each selling stockholder, the number of shares of common stock and number of warrants that may be sold by each selling stockholder under this prospectus and that each selling stockholder will beneficially own after this offering.
Because each selling stockholder may dispose of all, none or some portion of their securities, no estimate can be given as to the number of securities that will be beneficially owned by a selling stockholder upon termination of this offering. For purposes of the table below, however, we have assumed that after termination of this offering none of the securities covered by this prospectus will be beneficially owned by the selling stockholders and further assumed that the selling stockholders will not acquire beneficial ownership of any additional securities during the offering. In addition, the selling stockholders may have sold, transferred or otherwise disposed of, or may sell, transfer or otherwise dispose of, at any time and from time to time, our securities in transactions exempt from the registration requirements of the Securities Act after the date on which the information in the table is presented.
We may amend or supplement this prospectus from time to time in the future to update or change this selling stockholders list and the securities that may be resold.
100
Table of Contents
Please see the section titled “Plan of Distribution” for further information regarding the stockholders’ method of distributing these shares.
| Shares of Common Stock | Warrants to Purchase Common Stock | |||||||||||||||||||||||||||||||
| Name |
Number Beneficially Owned Prior to Offering(1) |
Number Registered for Sale Hereby |
Number Beneficially Owned After Offering |
Percent Owned After Offering(2) |
Number Beneficially Owned Prior to Offering |
Number Registered for Sale Hereby |
Number Beneficially Owned After Offering |
Percent Owned After Offering(2) |
||||||||||||||||||||||||
| Holders of PIPE Shares |
||||||||||||||||||||||||||||||||
| Meridian Small Cap Growth Fund |
3,750,000 | 3,750,000 | — | — | — | — | — | — | ||||||||||||||||||||||||
| Owl Creek Overseas Master Fund, Ltd. |
2,866,000 | 2,866,000 | — | — | — | — | — | — | ||||||||||||||||||||||||
| Scopia Windmill Fund LP |
2,500,000 | 2,500,000 | — | — | — | — | — | — | ||||||||||||||||||||||||
| Owl Creek II L.P. |
1,718,000 | 1,718,000 | — | — | — | — | — | — | ||||||||||||||||||||||||
| Stephen A. Vogel(3) |
1,940,812 | 937,500 | — | — | — | — | ||||||||||||||||||||||||||
| Belfer Investment Partners, LP |
750,000 | 750,000 | — | — | — | — | — | — | ||||||||||||||||||||||||
| ArrowMark Fundamental Opportunity Fund L.P. |
521,591 | 521,591 | — | — | — | — | — | — | ||||||||||||||||||||||||
| The Merger Fund |
516,989 | 516,989 | — | — | — | — | — | — | ||||||||||||||||||||||||
| Nineteen77 Global Multi-Strategy Alpha Master Limited |
512,050 | 512,050 | — | — | — | — | — | — | ||||||||||||||||||||||||
| Lime Partners LLC |
500,000 | 500,000 | — | — | — | — | — | — | ||||||||||||||||||||||||
| The Neil Goldberg 1995 Irrevocable Trust(3) |
463,750 | 312,500 | — | — | — | — | — | — | ||||||||||||||||||||||||
| JNL/Westchester Capital Event Driven Fund |
430,996 | 430,996 | — | — | — | — | — | — | ||||||||||||||||||||||||
| Schonfeld Strategic 460 Fund LLC |
375,000 | 375,000 | — | — | — | — | — | — | ||||||||||||||||||||||||
| THB Iron Rose LLC |
268,278 | 268,278 | — | — | — | — | — | — | ||||||||||||||||||||||||
| The Lind Family Trust(3) |
257,844 | 125,000 | — | — | — | — | ||||||||||||||||||||||||||
| Owl Creek SRI Master Fund, Ltd. |
210,000 | 210,000 | — | — | — | — | — | — | ||||||||||||||||||||||||
| Owl Creek I, L.P. |
206,000 | 206,000 | — | — | — | — | — | — | ||||||||||||||||||||||||
| WCM Alternatives: Event-Driven Fund |
199,883 | 199,883 | — | — | — | — | — | — | ||||||||||||||||||||||||
| Iron Horse Investments LLC |
188,961 | 188,961 | — | — | — | — | — | — | ||||||||||||||||||||||||
| Kiam Equities Corporation |
125,000 | 125,000 | — | — | — | — | — | — | ||||||||||||||||||||||||
| Katzman Family LLC |
125,000 | 125,000 | — | — | — | — | — | — | ||||||||||||||||||||||||
| David Dickstein(3) |
119,250 | 37,500 | — | — | — | — | ||||||||||||||||||||||||||
| Evee Georgiadis |
125,000 | 125,000 | — | — | — | — | — | — | ||||||||||||||||||||||||
| Nineteen77 Global Multi-Strategy Alpha (Levered) Master Limited |
112,950 | 112,950 | — | — | — | — | — | — | ||||||||||||||||||||||||
| WCM Master Trust |
95,227 | 95,227 | — | — | — | — | — | — | ||||||||||||||||||||||||
| Jonathan May |
93,750 | 93,750 | — | — | — | — | — | — | ||||||||||||||||||||||||
| Leslie May Blauner |
93,750 | 93,750 | — | — | — | — | — | — | ||||||||||||||||||||||||
| Victor Kiam III 2002 Family Trust U/A DTD 06/13/2002 |
31,250 | 31,250 | — | — | — | — | — | — | ||||||||||||||||||||||||
| Irene Moscahlaidis |
31,250 | 31,250 | — | — | — | — | — | — | ||||||||||||||||||||||||
| Lookfar Investments LLC |
28,065 | 28,065 | — | — | — | — | — | — | ||||||||||||||||||||||||
| Intrepid Production Corporation |
21,361 | 21,361 | — | — | — | — | — | — | ||||||||||||||||||||||||
| Kathleen Kay Corkins 2013 Revocable Trust UAD 05/08/13 |
16,562 | 16,562 | — | — | — | — | — | — | ||||||||||||||||||||||||
| Jeffrey K. Vogel |
15,625 | 15,625 | — | — | — | — | — | — | ||||||||||||||||||||||||
| Jon M. Vogel |
15,625 | 15,625 | — | — | — | — | — | — | ||||||||||||||||||||||||
| Sherman C. Vogel |
15,625 | 15,625 | — | — | — | — | — | — | ||||||||||||||||||||||||
| CF Ascent LLC |
14,483 | 14,483 | — | — | — | — | — | — | ||||||||||||||||||||||||
| The Stolper Family Trust UAD |
13,095 | 13,095 | — | — | — | — | — | — | ||||||||||||||||||||||||
| Larsen Family LP |
11,612 | 11,612 | — | — | — | — | — | — | ||||||||||||||||||||||||
| The 2008 Ryan Tanner Bailey Irrevocable Trust UAD 12/08/08 |
9,457 | 9,457 | — | — | — | — | — | — | ||||||||||||||||||||||||
101
Table of Contents
| Shares of Common Stock | Warrants to Purchase Common Stock | |||||||||||||||||||||||||||||||
| Name |
Number Beneficially Owned Prior to Offering(1) |
Number Registered for Sale Hereby |
Number Beneficially Owned After Offering |
Percent Owned After Offering(2) |
Number Beneficially Owned Prior to Offering |
Number Registered for Sale Hereby |
Number Beneficially Owned After Offering |
Percent Owned After Offering(2) |
||||||||||||||||||||||||
| The 2008 Miranda Bailey Irrevocable Trust UAD 12/08/08 |
7,793 | 7,793 | — | — | — | — | — | — | ||||||||||||||||||||||||
| The Merger Fund VL |
6,905 | 6,905 | — | — | — | — | — | — | ||||||||||||||||||||||||
| Thomas H. Bailey |
5,787 | 5,787 | — | — | — | — | — | — | ||||||||||||||||||||||||
| Michael E Herman Revocable Trust UAD |
4,814 | 4,814 | — | — | — | — | — | — | ||||||||||||||||||||||||
| Charles F. Urschel 1970 Trust FBO Wendy U Larsen |
3,456 | 3,456 | — | — | — | — | — | — | ||||||||||||||||||||||||
| The Michael Stolper Living Trust #2 UAD 07/21/10 |
2,844 | 2,844 | — | — | — | — | — | — | ||||||||||||||||||||||||
| Corkins Family Foundation |
2,558 | 2,558 | — | — | — | — | — | — | ||||||||||||||||||||||||
| ArrowMark Colorado Holdings LLC |
1,326 | 1,326 | — | — | — | — | — | — | ||||||||||||||||||||||||
| Kathleen Kay Corkins 2014 Irrevocable Trust for Sylvie UAD 05/23/14 |
1,100 | 1,100 | — | — | — | — | — | — | ||||||||||||||||||||||||
| The 1992 Larsen Grandchildren’s Trust UAD 01/01/92 |
614 | 614 | — | — | — | — | — | — | ||||||||||||||||||||||||
| Ryan Tanner Mckenzie Bailey Non–Exempt Trust UAD 12/08/08 |
352 | 352 | — | — | — | — | — | — | ||||||||||||||||||||||||
| Miranda M. Bailey |
312 | 312 | — | — | — | — | — | — | ||||||||||||||||||||||||
| Miranda Bailey Non–Exempt Trust UAD 12/08/08 |
266 | 266 | — | — | — | — | — | — | ||||||||||||||||||||||||
| Wilder Bailey Lebovich Irrevocable Trust UAD 12/10/09 |
175 | 175 | — | — | — | — | — | — | ||||||||||||||||||||||||
| Golden Rose Lebovich Trust UAD 12/15/11 |
138 | 138 | — | — | — | — | — | — | ||||||||||||||||||||||||
| Total PIPE Shares |
17,959,375 | |||||||||||||||||||||||||||||||
| Holders of Founder Shares and Placement Warrants |
||||||||||||||||||||||||||||||||
| Stephen A. Vogel |
1,940,812 | 1,003,312 | — | — | 30,625 | 30,625 | — | — | ||||||||||||||||||||||||
| David Boris |
886,953 | 886,953 | — | — | 12,500 | 12,500 | — | — | ||||||||||||||||||||||||
| Marshall Kiev |
655,062 | 655,063 | — | — | — | — | — | — | ||||||||||||||||||||||||
| The Neil Goldberg 1995 Irrevocable Trust |
463,750 | 151,250 | — | — | 25,000 | 25,000 | — | — | ||||||||||||||||||||||||
| The Lind Family Trust |
382,844 | 132,844 | — | — | 24,375 | 24,375 | — | — | ||||||||||||||||||||||||
| MK 2016 Trust |
163,765 | 163,766 | — | — | — | — | — | — | ||||||||||||||||||||||||
| The McCloskey Trust |
136,250 | 136,250 | — | — | 25,000 | 25,000 | — | — | ||||||||||||||||||||||||
| APJM Partners, LLC |
136,250 | 136,250 | — | — | 25,000 | 25,000 | — | — | ||||||||||||||||||||||||
| David Dickstein |
119,250 | 81,750 | — | — | 15,000 | 15,000 | — | — | ||||||||||||||||||||||||
| Eric Moscahlaidis Beneficiary Irrevocable Trust |
68,125 | 68,125 | — | — | 12,500 | 12,500 | — | — | ||||||||||||||||||||||||
| Richard David Katzman |
55,875 | 55,875 | — | — | 7,500 | 7,500 | — | — | ||||||||||||||||||||||||
| Gerald B. Shreiber |
54,500 | 54,500 | — | — | 10,000 | 10,000 | — | — | * | |||||||||||||||||||||||
| Pioneer Wine & Spirits of Louisiana, LLC |
54,500 | 54,500 | — | — | 10,000 | 10,000 | — | — | ||||||||||||||||||||||||
| Mitchell S. Kaneff |
54,500 | 54,500 | — | — | 10,000 | 10,000 | — | — | ||||||||||||||||||||||||
| Robert Green |
54,500 | 54,500 | — | — | 10,000 | 10,000 | — | — | ||||||||||||||||||||||||
| Praxis II Partners |
54,500 | 54,500 | — | — | 10,000 | 10,000 | — | — | ||||||||||||||||||||||||
| Iroquois Capital Investment Group LLC |
40,875 | 40,875 | — | — | 7,500 | 7,500 | — | — | ||||||||||||||||||||||||
| David Koenig |
34,063 | 34,063 | — | — | 6,250 | 6,250 | — | — | * | |||||||||||||||||||||||
| Jerry Vinson Elliott |
28,625 | 28,625 | — | — | 2,500 | 2,500 | — | — | ||||||||||||||||||||||||
102
Table of Contents
| Shares of Common Stock | Warrants to Purchase Common Stock | |||||||||||||||||||||||||||||||
| Name |
Number Beneficially Owned Prior to Offering(1) |
Number Registered for Sale Hereby |
Number Beneficially Owned After Offering |
Percent Owned After Offering(2) |
Number Beneficially Owned Prior to Offering |
Number Registered for Sale Hereby |
Number Beneficially Owned After Offering |
Percent Owned After Offering(2) |
||||||||||||||||||||||||
| Steven Berns |
28,625 | 28,625 | — | — | 2,500 | 2,500 | — | — | ||||||||||||||||||||||||
| Final Word Investments LLC |
27,250 | 27,250 | — | — | 5,000 | 5,000 | — | — | ||||||||||||||||||||||||
| Millennium Trust FBO Dale Curtis Hogue, Jr. |
27,250 | 27,250 | — | — | 5,000 | 5,000 | — | — | ||||||||||||||||||||||||
| MSR Advisors, Inc. |
27,250 | 27,250 | — | — | 5,000 | 5,000 | — | — | ||||||||||||||||||||||||
| Wriston Partners I |
27,250 | 27,250 | — | — | 5,000 | 5,000 | — | — | ||||||||||||||||||||||||
| Gary Taffet |
27,250 | 27,250 | — | — | 5,000 | 5,000 | — | — | ||||||||||||||||||||||||
| Gilbert E. Nathan |
27,250 | 27,250 | — | — | 5,000 | 5,000 | — | — | ||||||||||||||||||||||||
| John Katzman |
27,250 | 27,250 | — | — | 5,000 | 5,000 | — | — | ||||||||||||||||||||||||
| Peter A. Nussbaum |
27,250 | 27,250 | — | — | 5,000 | 5,000 | — | — | ||||||||||||||||||||||||
| Iroquois Master Fund Ltd. |
27,250 | 27,250 | — | — | 5,000 | 5,000 | — | — | ||||||||||||||||||||||||
| William K. Luby |
27,250 | 27,250 | — | — | 5,000 | 5,000 | — | — | ||||||||||||||||||||||||
| Equity Trust Custodian FBO Gilbert Nathan IRA |
13,625 | 13,625 | — | — | 2,500 | 2,500 | — | — | ||||||||||||||||||||||||
| Lewis Holdings LLC |
13,625 | 13,625 | — | — | 2,500 | 2,500 | — | — | ||||||||||||||||||||||||
| Mark S. Pollack |
13,625 | 13,625 | — | — | 2,500 | 2,500 | — | — | ||||||||||||||||||||||||
| Vere Investments, LLC |
13,625 | 13,625 | — | — | 2,500 | 2,500 | — | — | ||||||||||||||||||||||||
| Steven Manket |
13,625 | 13,625 | — | — | 2,500 | 2,500 | — | — | ||||||||||||||||||||||||
| Anthony Edward Harris |
6,813 | 6,813 | — | — | 1,250 | 1,250 | — | — | ||||||||||||||||||||||||
| Bruce Edward Roberts |
6,813 | 6,813 | — | — | 1,250 | 1,250 | — | — | ||||||||||||||||||||||||
| Total Founder Shares and Placement Warrants |
3,919,125 | 311,250 | ||||||||||||||||||||||||||||||
| (1) | Includes PIPE Shares, Founder Shares and shares of common stock issuable upon exercise of the warrants included in this table. |
| (2) | Based upon 78,636,250 shares of common stock outstanding, assuming the exercise of all currently outstanding warrants. |
| (3) | Also a holder of Founder Shares and Placement Warrants, which securities, together with the shares issuable upon exercise of the Placement Warrants, are listed separately below. |
103
Table of Contents
The selling stockholders, which as used herein includes donees, pledgees, transferees or other successors-in-interest selling warrants, shares of common stock or interests in shares of common stock received after the date of this prospectus from a selling stockholder as a gift, pledge, partnership distribution or other transfer, may, from time to time, sell, transfer or otherwise dispose of any or all of their warrants, shares of common stock or interests in shares of common stock on any stock exchange, market or trading facility on which the warrants or shares are traded or in private transactions. These dispositions may be at fixed prices, at prevailing market prices at the time of sale, at prices related to the prevailing market price, at varying prices determined at the time of sale, or at negotiated prices.
The selling stockholders may use any one or more of the following methods when disposing of warrants, shares or interests therein:
| • | ordinary brokerage transactions and transactions in which the broker-dealer solicits purchasers; |
| • | block trades in which the broker-dealer will attempt to sell the shares as agent, but may position and resell a portion of the block as principal to facilitate the transaction; |
| • | purchases by a broker-dealer as principal and resale by the broker-dealer for our account; |
| • | an exchange distribution in accordance with the rules of the applicable exchange; |
| • | privately negotiated transactions; |
| • | short sales effected after the date the registration statement of which this prospectus is a part is declared effective by the SEC; |
| • | through the writing or settlement of options or other hedging transactions, whether through an options exchange or otherwise; |
| • | broker-dealers may agree with the selling stockholders to sell a specified number of such shares at a stipulated price per share; |
| • | a combination of any such methods of sale; and |
| • | any other method permitted by applicable law. |
The selling stockholders may, from time to time, pledge or grant a security interest in some or all of the warrants or shares of common stock owned by them and, if they default in the performance of their secured obligations, the pledgees or secured parties may offer and sell the warrants or shares of common stock, from time to time, under this prospectus, or under an amendment to this prospectus under Rule 424(b)(3) or other applicable provision of the Securities Act amending the list of selling stockholders to include the pledgee, transferee or other successors in interest as selling stockholders under this prospectus. The selling stockholders also may transfer the warrants or shares of common stock in other circumstances, in which case the transferees, pledgees or other successors in interest will be the selling beneficial owners for purposes of this prospectus.
In connection with the sale of our warrants, shares of common stock or interests therein, the selling stockholders may enter into hedging transactions with broker-dealers or other financial institutions, which may in turn engage in short sales of the warrants or shares of common stock in the course of hedging the positions they assume. The selling stockholders may also sell warrants or shares of our common stock short and deliver these securities to close out their short positions, or loan or pledge the warrants or common stock to broker-dealers that in turn may sell these securities. The selling stockholders may also enter into option or other transactions with broker-dealers or other financial institutions or the creation of one or more derivative securities which require the delivery to such broker-dealer or other financial institution of warrants or shares offered by this prospectus, which warrants or shares such broker-dealer or other financial institution may resell pursuant to this prospectus (as supplemented or amended to reflect such transaction).
104
Table of Contents
The aggregate proceeds to the selling stockholders from the sale of the warrants or common stock offered by them will be the purchase price of the warrants or common stock less discounts or commissions, if any. Each of the selling stockholders reserves the right to accept and, together with their agents from time to time, to reject, in whole or in part, any proposed purchase of warrants or common stock to be made directly or through agents. We will not receive any of the proceeds from this offering. Upon any exercise of the warrants by payment of cash, however, we will receive the exercise price of the warrants.
The selling stockholders also may resell all or a portion of the warrants or shares in open market transactions in reliance upon Rule 144 under the Securities Act, provided that they meet the criteria and conform to the requirements of that rule.
The selling stockholders and any underwriters, broker-dealers or agents that participate in the sale of the common stock or interests therein may be “underwriters” within the meaning of Section 2(11) of the Securities Act. Any discounts, commissions, concessions or profit they earn on any resale of the shares may be underwriting discounts and commissions under the Securities Act. Selling stockholders who are “underwriters” within the meaning of Section 2(11) of the Securities Act will be subject to the prospectus delivery requirements of the Securities Act.
To the extent required, the warrants or shares of our common stock to be sold, the names of the selling stockholders, the respective purchase prices and public offering prices, the names of any agents, dealer or underwriter, any applicable commissions or discounts with respect to a particular offer will be set forth in an accompanying prospectus supplement or, if appropriate, a post-effective amendment to the registration statement that includes this prospectus.
In order to comply with the securities laws of some states, if applicable, the warrants or common stock may be sold in these jurisdictions only through registered or licensed brokers or dealers. In addition, in some states the warrants or common stock may not be sold unless they have been registered or qualified for sale or an exemption from registration or qualification requirements is available and is complied with.
We have advised the selling stockholders that the anti-manipulation rules of Regulation M under the Exchange Act may apply to sales of warrants or shares in the market and to the activities of the selling stockholders and their affiliates. In addition, to the extent applicable we will make copies of this prospectus (as it may be supplemented or amended from time to time) available to the selling stockholders for the purpose of satisfying the prospectus delivery requirements of the Securities Act. The selling stockholders may indemnify any broker-dealer that participates in transactions involving the sale of the shares against certain liabilities, including liabilities arising under the Securities Act.
We have agreed to indemnify the selling stockholders against liabilities, including liabilities under the Securities Act and state securities laws, relating to the registration of the warrants or shares offered by this prospectus.
We have agreed with the selling stockholders to keep the registration statement of which this prospectus constitutes a part effective until such time as all of the shares covered by this prospectus have been disposed of pursuant to and in accordance with the registration statement or such securities have been withdrawn.
105
Table of Contents
The validity of the securities offered hereby will be passed upon for us by Cooley LLP. Any underwriters or agents will be advised about other issues relating to the offering by counsel to be named in the applicable prospectus supplement.
The consolidated financial statements of C1 Investment Corp. as of December 31, 2016 and December 31, 2017, and for the three years ended December 31, 2017 included in this prospectus have been audited by RSM US LLP (“RSM”), independent registered public accounting firm, as set forth in their report thereon appearing elsewhere herein, and are included in reliance upon such report given on the authority of such firm as experts in accounting and auditing.
The consolidated financial statements of SPS Holdco, LLC as of December 31, 2016 and 2015 and for each of the years in the two-year period ended December 31, 2016 included in this prospectus have been audited by RSM, an independent public accounting firm, as set forth in their report thereon appearing elsewhere herein, and are included in reliance upon such report and upon the authority of such firm as experts in accounting and auditing.
The audited financial statements of Forum Merger Corporation for the period from November 17, 2016 (inception) to December 31, 2016 and the year ended December 31, 2017 included in this prospectus have been so included in reliance on a report of Marcum LLP, an independent registered public accounting firm, appearing elsewhere herein and are included in reliance on such report given upon such firm as experts in auditing and accounting.
Marcum, LLP served as the independent registered public accounting firm for Forum (and its subsidiaries) from its inception through the Closing. The firm of RSM served as the independent registered public accounting firm for privately-held ConvergeOne. Upon the Closing, RSM became the independent registered public accounting firm for the renamed combined entity ConvergeOne. The decision to engage RSM effective upon the closing of the Business Combination was made by the board of directors of Forum on February 20, 2018 because the historical financial statements of ConvergeOne became the historical financial statements of the Combined Entity following the Closing.
Marcum’s report on Forum’s financial statements as of December 31, 2017 and 2016, and for the year ended December 31, 2017 and for the period from November 17, 2016 (inception) to December 31, 2016 did not contain an adverse opinion or disclaimer of opinion, nor were such reports qualified or modified as to uncertainty, audit scope, or accounting principles. During the period of Marcum’s engagement by Forum, and the subsequent interim period preceding Marcum’s dismissal, there were no disagreements with Marcum on any matter of accounting principles or practices, financial statement disclosure, or auditing scope or procedure, which disagreements if not resolved to the satisfaction of Marcum, would have caused it to make a reference to the subject matter of the disagreement in connection with its reports covering such periods. In addition, no “reportable events,” as defined in Item 304(a)(1)(v) of Regulation S-K, occurred within the period of Marcum’s engagement and the subsequent interim period preceding Marcum’s dismissal.
During the period from November 17, 2016 (Forum’s inception) through December 31, 2017 and the subsequent interim period preceding the engagement of RSM, Forum did not consult RSM regarding either: (i) the application of accounting principles to a specified transaction, either completed or proposed; or the type of audit opinion that might be rendered on Forum’s financial statements, and neither a written report was provided to ConvergeOne or oral advice was provided that RSM concluded was an important factor considered by ConvergeOne in reaching a decision as to the accounting, auditing or financial reporting issue; or (ii) any matter that was the subject of a disagreement (as described in Item 304(a)(1)(iv) of Regulation S-K) or a “reportable event” (as described in Item 304(a)(1)(v) of Regulation S-K).
106
Table of Contents
WHERE YOU CAN FIND MORE INFORMATION
We have filed with the SEC a registration statement on Form S-1 under the Securities Act with respect to the shares of common stock offered by this prospectus. This prospectus does not contain all of the information included in the registration statement. For further information pertaining to us and our common stock you should refer to the registration statement and our exhibits. Statements contained in this prospectus concerning any of our contracts, agreements or other documents are not necessarily complete. If a contract or document has been filed as an exhibit to the registration statement, we refer you to the copy of the contract or document that has been filed. Each statement in this prospectus relating to a contract or document filed as an exhibit is qualified in all respects by the filed exhibit.
We are subject to the informational requirements of the Exchange Act and file annual, quarterly and current reports and other information with the SEC. Our filings with the SEC are available to the public on the SEC’s website at http://www.sec.gov. Those filings are also available to the public on, or accessible through, our website under the heading “Investors” at www.convergeone.com. The information we file with the SEC or contained on or accessible through our corporate website or any other website that we may maintain is not part of this prospectus or the registration statement of which this prospectus is a part. You may also read and copy, at SEC prescribed rates, any document we file with the SEC, including the registration statement (and our exhibits) of which this prospectus is a part, at the SEC’s Public Reference Room located at 100 F Street, N.E., Washington D.C. 20549. You can call the SEC at 1-800-SEC-0330 to obtain information on the operation of the Public Reference Room.
107
Table of Contents
CONVERGEONE HOLDINGS, INC.
UNAUDITED PRO FORMA CONDENSED COMBINED FINANCIAL INFORMATION
INTRODUCTION AND BASIS OF PRO FORMA PRESENTATION
On February 22, 2018, C1 Investment Corp. (“C1”) and Forum Merger Corporation (“Forum”) consummated the transactions contemplated by the Agreement and Plan of Merger (as described below) (the “Business Combination”). In connection with the closing of the Business Combination, the registrant changed its name from Forum Merger Corporation to ConvergeOne Holdings, Inc. (“ConvergeOne”).
On December 15, 2017, C1 acquired all of the outstanding stock of AOS, Inc. (“AOS”) and on August 16, 2017, C1 acquired all of the outstanding stock of SPS Holdco, LLC (“SPS”) (the “Acquisitions”) for a combined purchase price of $116,984 funded by borrowings under C1 Investment Corp.’s financing facilities (the “Borrowings”).
References to “Pro Forma Transactions” include the Business Combination, Acquisitions and Borrowings. Refer to Forum Merger Corporation Form S-4 filed with the Securities and Exchange Commission on February 1, 2018.
Agreement and Plan of Merger
On November 30, 2017, Forum entered into an Agreement and Plan of Merger (“Merger Agreement”), by and among Forum, FMC Merger Subsidiary Corp., a newly-formed Delaware corporation and wholly-owned subsidiary of Forum (the “Merger Sub I”), FMC Merger Subsidiary LLC, a newly formed Delaware limited liability company and wholly-owned subsidiary of Forum (the “Merger Sub II”), C1, and Clearlake Capital Management III, L.P., in the capacity as the Seller Representative.
The Agreement provides for a two-step merger: (1) the merger of Merger Sub I with and into C1, with C1 continuing as the surviving corporation (the “Surviving Subsidiary”) and as a wholly-owned subsidiary of Forum (the “First Merger”) and (2) the merger of the Surviving Subsidiary of the First Merger with and into Merger Sub II, ceasing the separate existence of the Surviving Subsidiary (the “Second Merger” and together with the First Merger, the “Business Combination”). Merger Sub II will continue as the surviving entity in the Second Merger, and Merger Sub II, continuing as the surviving entity, shall then be referred to as the Surviving Entity (the “Surviving Entity” and, together with Forum, the “Combined Entity”).
Description of the Merger
Pursuant to the Merger Agreement, the aggregate consideration paid in the Business Combination is equal to an amount equal to (i) the Enterprise Value, as defined in the Merger Agreement, minus (ii) the Closing Net Indebtedness, as defined in the Merger Agreement, (the “Merger Consideration”) plus the contingent right to receive additional consideration based on the performance of the combined company, during the calendar years 2018, 2019 and 2020 (the “Earnout Consideration,” which together with the Merger Consideration, the “Total Consideration”). The Merger Consideration was paid in the form of: (i) cash from Forum and/or the Target Companies in an amount equal to (A) the total cash and cash equivalents of Forum, including funds from the PIPE Investment and Backstop Investment and the remaining funds in the Trust Account, after giving effect to the completion of the Redemption (the “Forum Cash”), plus (B) the Closing Cash, as defined in the Merger Agreement, minus (C) $25,000; and (ii) a number of Forum Common Stock, valued at the Redemption Price, as defined in the Merger Agreement, per share, equal to the Merger Consideration less $25,000.
In connection with the Business Combination, Forum entered into Subscription Agreements with investors to purchase 17,959,375 shares of Class A Common Stock for an amount of $143,675.
The PIPE Investment was predicated on (i) the Sponsor’s agreement to cancel 1,078,125 Founders Shares immediately upon the Closing of the Business Combination; (ii) the Sponsor’s agreement to subject 2,156,250 Founders Shares to forfeiture in the event the earnout provisions of the Merger Agreement are not met by the
108
Table of Contents
CONVERGEONE HOLDINGS, INC.
UNAUDITED PRO FORMA CONDENSED COMBINED FINANCIAL INFORMATION—(Continued)
Combined Entity; and (iii) C1’s agreement to reduce the Merger Consideration by 499,752 shares of Common Stock. In the aggregate, the expected beneficial ownership of the Sponsor and the C1 Securityholders at the Closing was reduced by 3,734,127 shares of Common Stock at an assumed value of $10.10 per share to incentivize the prospective investors to commit to the PIPE Investment. The result was the issuance of 14,225,248 incremental shares to the investors in the PIPE Investment for an aggregate purchase price of $143,675 (and an aggregate issuance of 17,959,375 shares to the investors in the PIPE Investment).
Accounting for the Merger
The Business Combination will be accounted for as a reverse merger in accordance with U.S. GAAP. Under this method of accounting, Forum will be treated as the “acquired” company for financial reporting purposes. This determination was primarily based on C1 Securityholders expecting to have a majority of the voting power of the combined company, C1 comprising the ongoing operations of the combined entity, C1 comprising a majority of the governing body of the combined company, and C1’s senior management comprising the senior management of the combined company. Accordingly, for accounting purposes, the Business Combination will be treated as the equivalent of C1 issuing stock for the net assets of Forum, accompanied by a recapitalization. The net assets of Forum will be stated at historical cost, with no goodwill or other intangible assets recorded. Operations prior to the Business Combination will be those of C1.
Basis of Pro Forma Presentation
The historical financial information has been adjusted to give pro forma effect to events that are related and/or directly attributable to the Pro Forma Transactions, are factually supportable and are expected to have a continuing impact on the results of the combined company. The adjustments presented on the unaudited pro forma condensed combined financial statements have been identified and presented to provide relevant information necessary for an accurate understanding of the combined company upon consummation of the Pro Forma Transactions.
The following unaudited pro forma condensed combined balance sheet as of December 31, 2017 combines the audited historical consolidated balance sheet of C1 as of December 31, 2017 with the audited historical condensed consolidated balance sheet of Forum as of December 31, 2017, giving effect to the Business Combination as if it had been consummated as of that date.
The following unaudited pro forma condensed combined income statement for the year ended December 31, 2017 combines the audited historical consolidated statement of income of C1 for the year ended December 31, 2017 with the audited historical consolidated statement of operations of Forum for the year ended December 31, 2017, giving effect to the Business Combination as if it had occurred as of the beginning of the earliest period presented. In addition, the unaudited pro forma combined statements of income for the year ended December 31, 2017 are presented as if the acquisitions of AOS and SPS, and the Borrowings had taken place as of the beginning of the earliest period presented.
The following unaudited pro forma condensed combined income statement for the year ended December 31, 2016 combines the audited historical consolidated statement of income of C1 for the year ended December 31, 2016 with the audited historical consolidate statement of operations of Forum for the period from November 17, 2016 (inception) through December 31, 2016, giving effect to the Business Combination as if it had occurred as of the beginning of the earliest period presented. In addition, the unaudited pro forma combined statements of income for the year ended December 31, 2016 are presented as if the acquisitions of AOS and SPS, and the Borrowings had taken place as of the beginning of the earliest period presented.
The Acquisitions have been accounted for under the acquisition method of accounting. Under the acquisition method of accounting, the total purchase price presented in the accompanying unaudited pro forma combined financial statements was allocated to the assets acquired and liabilities assumed based on their
109
Table of Contents
CONVERGEONE HOLDINGS, INC.
UNAUDITED PRO FORMA CONDENSED COMBINED FINANCIAL INFORMATION—(Continued)
preliminary estimated fair values. The excess of the purchase price over the total of estimated fair values assigned to tangible and identifiable intangible assets acquired and liabilities assumed is recognized as goodwill. For the purposes of these illustrative pro forma combined financial statements, the entire Borrowings and the related interest expense, using current interest rates, were included in the pro forma adjustments.
The unaudited pro forma combined financial information is based on estimates and assumptions which have been made solely for purposes of developing such pro forma information.
The unaudited pro forma combined financial statements are presented for illustrative purposes only and, therefore, are not necessarily indicative of the operating results and financial position that might have been achieved had the Pro Forma Transactions occurred as of an earlier date, nor are they necessarily indicative of operating results and financial position that may occur in the future. In conjunction with the acquisitions of AOS and SPS future restructuring expenses and transaction costs may be incurred that are not included in these pro forma combined financial statements. Additionally, debt balances may be paid down faster than the stated terms, which would reduce interest expense from the amounts included in the pro forma adjustments. C1 and Forum have not had any historical relationship prior to the Business Combination. Accordingly, no pro forma adjustments were required to eliminate activities between the companies.
Included in the shares outstanding and weighted average shares outstanding as presented in the pro forma condensed combined financial statements are 47,124,494 shares of Common Stock issued to C1 Securityholders.
As a result of the Business Combination, C1 owns approximately 68.2% of Forum Common Stock to be outstanding immediately after the Business Combination, Forum stockholders own approximately 5.8% of Forum Common Stock and the PIPE investors own approximately 26.0% of Forum Common Stock, based on the number of shares of Forum Common Stock outstanding as of December 31, 2017 (in each case, not giving effect to any shares issuable to them upon exercise of warrants).
The historical financial information of C1 was derived from the audited consolidated financial statements of C1 for the years ended December 31, 2017 and 2016, as included elsewhere herein. The historical financial information of Forum was derived from the audited financial statements of Forum for the year ended December 31, 2017 and for the period from November 17, 2016 (inception) through December 31, 2016, included elsewhere herein. The historical financial information of SPS was derived from the unaudited consolidated financial statements of SPS for the six months ended June 30, 2017 and the audited consolidated financial statements of SPS for the year ended December 31, 2016, included elsewhere herein, plus activity for the period from July 1, 2017 to August 15, 2017. SPS results from the date of acquisition to December 31, 2017 are included in C1’s financial statements for the year ended December 31, 2017. The historical financial information of AOS was derived from the unaudited consolidated financial statements of AOS as of and for the nine months ended October 1, 2017 and the audited consolidated financial statements for the year ended December 25, 2016, included elsewhere herein, plus activity for the period from October 2, 2017 to December 14, 2017. AOS results from the date of acquisition to December 31, 2017 are included in C1’s financial statements for the year ended December 31, 2017.
The unaudited pro forma combined financial statements, including the notes thereto, should be read together with Forum’s audited financial statements and related notes, the sections titled “Management’s Discussion and Analysis of Financial Condition and Results of Operations,” and other financial information included in the Forum Merger Corporation Form 10-K filed with the Securities and Exchange Commission on February 20, 2018 and with C1’s audited financial statements and related notes as well as SPS’s and AOS’s audited and unaudited consolidated financial statements included elsewhere herein.
110
Table of Contents
CONVERGEONE HOLDINGS, INC.
UNAUDITED PRO FORMA COMBINED BALANCE SHEET
AS OF DECEMBER 31, 2017
(in thousands)
| (A) C1 Investment Corp. |
(B) Forum |
Pro Forma Merger Adjustments |
Pro Forma Combined |
|||||||||||||||
| Assets |
||||||||||||||||||
| Current Assets |
||||||||||||||||||
| Cash |
$ | 13,475 | $ | 115 | $ | 175,421 | (1) | |||||||||||
| (30,000 | ) | (2) | ||||||||||||||||
| (33 | ) | (3) | ||||||||||||||||
| (172,024 | ) | (4) | ||||||||||||||||
| 131,675 | (5) | |||||||||||||||||
| (170,574 | ) | (6) | ||||||||||||||||
| 51,000 | (9) | |||||||||||||||||
| 1,805 | (7) | $ | 860 | |||||||||||||||
| Trade accounts receivable, less allowances |
289,236 | — | — | 289,236 | ||||||||||||||
| Inventories |
14,717 | — | — | 14,717 | ||||||||||||||
| Prepaid expenses and other current assets |
9,294 | 50 | — | 9,344 | ||||||||||||||
| Deferred customer support contract costs |
35,151 | — | — | 35,151 | ||||||||||||||
| Income tax receivable |
10,576 | — | — | 10,576 | ||||||||||||||
|
|
|
|
|
|
|
|
|
|||||||||||
| Total current assets |
372,449 | 165 | (12,730 | ) | 359,884 | |||||||||||||
|
|
|
|
|
|
|
|
|
|||||||||||
| Other Assets |
||||||||||||||||||
| Cash and marketable securities held in Trust Account |
— | 175,421 | (175,421 | ) | (1) | — | ||||||||||||
| Goodwill |
331,456 | — | — | 331,456 | ||||||||||||||
| Finite-life intangibles, net |
173,642 | — | — | 173,642 | ||||||||||||||
| Property and equipment, net |
36,659 | — | — | 36,659 | ||||||||||||||
| Deferred customer support contract costs, noncurrent |
3,915 | — | — | 3,915 | ||||||||||||||
| Non-current income tax receivable |
2,620 | — | — | 2,620 | ||||||||||||||
|
|
|
|
|
|
|
|
|
|||||||||||
| Total other assets |
548,292 | 175,421 | (175,421 | ) | 548,292 | |||||||||||||
|
|
|
|
|
|
|
|
|
|||||||||||
| Total assets |
$ | 920,741 | $ | 175,586 | $ | (188,151 | ) | $ | 908,176 | |||||||||
|
|
|
|
|
|
|
|
|
|||||||||||
| Liabilities and Stockholders’ Equity (Deficit) |
||||||||||||||||||
| Current Liabilities |
||||||||||||||||||
| Current maturities of long-term debt |
$ | 5,652 | $ | — | $ | — | $ | 5,652 | ||||||||||
| Advances from related parties |
— | 33 | (33 | ) | (3) | — | ||||||||||||
| Accounts payable |
157,778 | 213 | 157,991 | |||||||||||||||
| Customer deposits |
22,498 | — | — | 22,498 | ||||||||||||||
| Accrued compensation |
34,522 | — | — | 34,522 | ||||||||||||||
| Accrued other |
27,362 | — | — | 27,362 | ||||||||||||||
| Income tax payable |
— | 222 | — | 222 | ||||||||||||||
| Deferred revenue |
68,127 | — | — | 68,127 | ||||||||||||||
|
|
|
|
|
|
|
|
|
|||||||||||
| Total current liabilities |
315,939 | 468 | (33 | ) | 316,374 | |||||||||||||
|
|
|
|
|
|
|
|
|
|||||||||||
| Long-Term Liabilities |
||||||||||||||||||
| Long-term debt, net of debt issuance costs and current maturities |
566,424 | — | 51,000 | (9) | 617,424 | |||||||||||||
| Deferred income taxes |
18,056 | — | — | 18,056 | ||||||||||||||
| Long-term income tax payable |
1,563 | — | — | 1,563 | ||||||||||||||
| Deferred revenue and other long-term liabilities |
13,118 | — | — | 13,118 | ||||||||||||||
|
|
|
|
|
|
|
|
|
|||||||||||
| Total long-term liabilities |
599,161 | — | 51,000 | 650,161 | ||||||||||||||
|
|
|
|
|
|
|
|
|
|||||||||||
| Commitments and Contingencies |
||||||||||||||||||
| Common stock subject to redemption |
— | 170,118 | (170,118 | ) | (4) | — | ||||||||||||
| Stockholders’ Equity (Deficit) |
— | |||||||||||||||||
| Common stock |
10 | 1 | 2 | (4) | ||||||||||||||
| 1 | (5) | |||||||||||||||||
| (5 | ) | (6) | 9 | |||||||||||||||
| Subscription receivable from related parties |
(1,805 | ) | — | 1,805 | (7) | |||||||||||||
| (12,000 | ) | (5) | (12,000 | ) | ||||||||||||||
| Additional paid-in capital |
13,459 | 4,704 | (4,000 | ) | (2) | |||||||||||||
| (1,908 | ) | (4) | ||||||||||||||||
| 143,674 | (5) | |||||||||||||||||
| (170,274 | ) | (6) | ||||||||||||||||
| 4,048 | (8) | |||||||||||||||||
| 10,297 | (10) | — | ||||||||||||||||
| Retained earnings (accumulated deficit) |
(6,023 | ) | 295 | (26,000 | ) | (2) | ||||||||||||
| (295 | ) | (6) | ||||||||||||||||
| (4,048 | ) | (8) | ||||||||||||||||
| (10,297 | ) | (10) | (46,368 | ) | ||||||||||||||
|
|
|
|
|
|
|
|
|
|||||||||||
| Total stockholders’ equity (deficit) |
5,641 | 5,000 | (69,000 | ) | (58,359 | ) | ||||||||||||
|
|
|
|
|
|
|
|
|
|||||||||||
| Total liabilities and stockholders’ equity (deficit) |
$ | 920,741 | $ | 175,586 | $ | (188,151 | ) | $ | 908,176 | |||||||||
|
|
|
|
|
|
|
|
|
|||||||||||
See accompanying notes to unaudited pro forma combined financial statements.
111
Table of Contents
Pro Forma Adjustments to the Unaudited Condensed Combined Balance Sheet
(in thousands, except share data)
| (A) | As reported in C1’s audited consolidated financial statements for the year ended December 31, 2017, as included elsewhere herein. The SPS and AOS purchase price and the estimated fair value of the assets acquired and liabilities assumed at the date of acquisition are included in C1’s financial statements for the year ended December 31, 2017. |
| (B) | Derived from the audited consolidated balance sheet of Forum as of December 31, 2017, as included elsewhere herein. |
Pro Forma Merger Adjustments
| (1) | To reflect the release of cash from investments held in the trust account. |
| (2) | To reflect the payment of estimated legal, financial advisory and other professional fees related to the Business Combination, assumes that $4,000 of those fees are related to the capital raised and therefore offset equity raised. |
| (3) | To record repayment of advances from related parties. |
| (4) | To reflect the redemption of 16,940,909 shares for cash of $172,024 after giving effects to payments to redeeming stockholders based on the consummation of the Business Combination. |
| (5) | To reflect the PIPE Investment issuance of 17,959,375 shares of Class A Common Stock for proceeds of $143,675. Of the total proceeds, $12,000 was deferred and is expected to be received within 30 days of the closing of the Business Combination. |
| (6) | To reflect recapitalization of C1 through the contribution of all the share capital in C1 to Forum, the payment of $170,574 of cash consideration and the issuance of 47,624,246 shares of Common Stock and the elimination of the historical retained earnings of Forum, the accounting acquiree. |
| (7) | To reflect the payment for C1’s subscriptions receivable. |
| (8) | To record a one-time stock-based compensation expense for options vested upon consummation of the Business Combination. C1 recorded post-combination compensation expense of $4,048 related to the effects of the immediate vesting of all outstanding stock and stock options which occurred upon the closing of the Merger. This amount is excluded from the unaudited pro forma condensed combined statements of income because it is a charge directly attributable to the Merger that will not have a continuing impact on C1’s operations; however, the amount is reflected as a reduction to retained earnings in the unaudited pro forma balance sheet. |
| (9) | To record additional borrowings to fund the closing of the Business Combination. |
| (10) | To reclassify negative additional paid-in capital to accumulated deficit. |
112
Table of Contents
CONVERGEONE HOLDINGS, INC.
UNAUDITED PRO FORMA COMBINED STATEMENT OF INCOME
YEAR ENDED DECEMBER 31, 2017
(in thousands, except share and per share data)
| (A) C1 Investment Corp. |
(B) SPS Holdco, LLC. |
(C) AOS, Inc. |
Pro Forma Acquisition Adjustments |
(D) Forum |
Pro Forma Merger Adjustments |
Pro Forma Combined |
||||||||||||||||||||||||||||||
| Total revenue |
$ | 918,926 | $ | 168,460 | $ | 165,144 | $ | — | $ | — | $ | 1,252,530 | ||||||||||||||||||||||||
| Total cost of revenue |
644,441 | 121,222 | 124,451 | — | — | 890,114 | ||||||||||||||||||||||||||||||
|
|
|
|
|
|
|
|
|
|
|
|
|
|
|
|||||||||||||||||||||||
| Total gross profit |
274,485 | 47,238 | 40,693 | — | — | — | 362,416 | |||||||||||||||||||||||||||||
| Total operating expenses |
249,815 | 62,934 | 36,856 | 3,198 | (1 | ) | 676 | (3,757 | ) | (6 | ) | |||||||||||||||||||||||||
| (660 | ) | (2 | ) | 349,062 | ||||||||||||||||||||||||||||||||
|
|
|
|
|
|
|
|
|
|
|
|
|
|
|
|||||||||||||||||||||||
| Operating income (loss) |
24,670 | (15,696 | ) | 3,837 | (2,538 | ) | (676 | ) | 3,757 | 13,354 | ||||||||||||||||||||||||||
| Other (income) expense |
||||||||||||||||||||||||||||||||||||
| Interest income |
(105 | ) | (1 | ) | — | — | (1,196 | ) | 1,196 | (7 | ) | (106 | ) | |||||||||||||||||||||||
| Interest expense |
52,057 | 4,960 | 1 | 5,258 | (3 | ) | — | 2,295 | (8 | ) | 64,571 | |||||||||||||||||||||||||
| Other expense, net |
87 | — | — | — | — | 87 | ||||||||||||||||||||||||||||||
|
|
|
|
|
|
|
|
|
|
|
|
|
|
|
|||||||||||||||||||||||
| Interest expense and other, net |
52,039 | 4,959 | 1 | 5,258 | (1,196 | ) | 3,491 | 64,552 | ||||||||||||||||||||||||||||
|
|
|
|
|
|
|
|
|
|
|
|
|
|
|
|||||||||||||||||||||||
| (Loss) income before income taxes |
(27,369 | ) | (20,655 | ) | 3,836 | (7,796 | ) | 520 | 266 | (51,198 | ) | |||||||||||||||||||||||||
| Income tax (benefit) expense |
(19,348 | ) | 80 | — | 1,437 | (4 | ) | 222 | (311 | ) | (9 | ) | (17,919 | ) | ||||||||||||||||||||||
|
|
|
|
|
|
|
|
|
|
|
|
|
|
|
|||||||||||||||||||||||
| Net (loss) income |
$ | (8,021 | ) | $ | (20,735 | ) | $ | 3,836 | $ | (9,233 | ) | $ | 298 | $ | 577 | $ | (33,279 | ) | ||||||||||||||||||
|
|
|
|
|
|
|
|
|
|
|
|
|
|
|
|||||||||||||||||||||||
| Weighted average shares outstanding, basic |
5,045,566 | 63,945,835 | (10 | ) | 68,991,401 | |||||||||||||||||||||||||||||||
|
|
|
|
|
|
|
|||||||||||||||||||||||||||||||
| Basic net loss per share |
$ | (0.11 | ) | $ | (0.48 | ) | ||||||||||||||||||||||||||||||
|
|
|
|
|
|||||||||||||||||||||||||||||||||
| Weighted average shares outstanding, diluted |
5,045,566 | 63,945,835 | (10 | ) | 68,991,401 | |||||||||||||||||||||||||||||||
|
|
|
|
|
|
|
|||||||||||||||||||||||||||||||
| Diluted net loss per share |
$ | (0.11 | ) | $ | (0.48 | ) | ||||||||||||||||||||||||||||||
|
|
|
|
|
|||||||||||||||||||||||||||||||||
See accompanying notes to unaudited pro forma combined financial statements.
113
Table of Contents
CONVERGEONE HOLDINGS, INC.
UNAUDITED PRO FORMA COMBINED STATEMENT OF INCOME
YEAR ENDED DECEMBER 31, 2016
(in thousands, except share and per share data)
| (A) C1 Investment Corp. |
(E) SPS Holdco, LLC. |
(F) AOS, Inc. |
Pro Forma Acquisition Adjustments |
(G) Forum |
Pro Forma Merger Adjustments |
Pro Forma Combined |
||||||||||||||||||||||||||||||
| Total revenue |
$ | 815,609 | $ | 321,464 | $ | 177,347 | $ | — | $ | — | $ | 1,314,420 | ||||||||||||||||||||||||
| Total cost of revenue |
566,365 | 220,876 | 132,540 | — | — | 919,781 | ||||||||||||||||||||||||||||||
|
|
|
|
|
|
|
|
|
|
|
|
|
|
|
|||||||||||||||||||||||
| Total gross profit |
249,244 | 100,588 | 44,807 | — | — | — | 394,639 | |||||||||||||||||||||||||||||
| Operating expenses |
202,742 | 97,816 | 41,075 | 1,364 | (1 | ) | 2 | (419 | ) | (6 | ) | 342,580 | ||||||||||||||||||||||||
| Impairment of Goodwill |
— | 70,861 | — | (70,861 | ) | (5 | ) | — | — | |||||||||||||||||||||||||||
|
|
|
|
|
|
|
|
|
|
|
|
|
|
|
|||||||||||||||||||||||
| Total operating expenses |
202,742 | 168,677 | 41,075 | (69,497 | ) | 2 | (419 | ) | 342,580 | |||||||||||||||||||||||||||
|
|
|
|
|
|
|
|
|
|
|
|
|
|
|
|||||||||||||||||||||||
| Operating income (loss) |
46,502 | (68,089 | ) | 3,732 | 69,497 | (2 | ) | 419 | 52,059 | |||||||||||||||||||||||||||
| Other (income) expense |
||||||||||||||||||||||||||||||||||||
| Interest income |
(11 | ) | (29 | ) | — | — | — | (40 | ) | |||||||||||||||||||||||||||
| Interest expense |
31,438 | 6,157 | 1 | 947 | (3 | ) | — | 2,295 | (8 | ) | 40,838 | |||||||||||||||||||||||||
| Other expense, net |
10 | — | — | — | — | 10 | ||||||||||||||||||||||||||||||
|
|
|
|
|
|
|
|
|
|
|
|
|
|
|
|||||||||||||||||||||||
| Interest expense and other, net |
31,437 | 6,128 | 1 | 947 | — | 2,295 | 40,808 | |||||||||||||||||||||||||||||
|
|
|
|
|
|
|
|
|
|
|
|
|
|
|
|||||||||||||||||||||||
| Income (loss) before income taxes |
15,065 | (74,217 | ) | 3,731 | 68,550 | (2 | ) | (1,876 | ) | 11,251 | ||||||||||||||||||||||||||
| Income tax expense (benefit) |
6,716 | 167 | — | (1,030 | ) | (4 | ) | — | (1,915 | ) | (9 | ) | 3,938 | |||||||||||||||||||||||
|
|
|
|
|
|
|
|
|
|
|
|
|
|
|
|||||||||||||||||||||||
| Income (loss) from continuing operations |
8,349 | (74,384 | ) | 3,731 | 69,580 | (2 | ) | 39 | 7,313 | |||||||||||||||||||||||||||
| Loss from discontinued operations |
— | — | (3,235 | ) | — | — | — | (3,235 | ) | |||||||||||||||||||||||||||
|
|
|
|
|
|
|
|
|
|
|
|
|
|
|
|||||||||||||||||||||||
| Net income (loss) |
$ | 8,349 | $ | (74,384 | ) | $ | 496 | $ | 69,580 | $ | (2 | ) | $ | 39 | $ | 4,078 | ||||||||||||||||||||
|
|
|
|
|
|
|
|
|
|
|
|
|
|
|
|||||||||||||||||||||||
| Weighted average shares outstanding, basic |
3,125,000 | 65,303,335 | (10 | ) | 68,428,335 | |||||||||||||||||||||||||||||||
|
|
|
|
|
|||||||||||||||||||||||||||||||||
| Basic net income per share |
$ | 0.00 | $ | 0.06 | ||||||||||||||||||||||||||||||||
|
|
|
|
|
|||||||||||||||||||||||||||||||||
| Weighted average shares outstanding, diluted |
3,125,000 | 67,103,335 | (10 | ) | 70,228,335 | |||||||||||||||||||||||||||||||
|
|
|
|
|
|||||||||||||||||||||||||||||||||
| Diluted net income per share |
$ | 0.00 | $ | 0.06 | ||||||||||||||||||||||||||||||||
|
|
|
|
|
|||||||||||||||||||||||||||||||||
See accompanying notes to unaudited pro forma combined financial statements.
114
Table of Contents
Pro Forma Adjustments to the Unaudited Condensed Combined Statements of Income (in thousands, except share data)
| (A) | As reported in C1’s audited consolidated financial statements for the year ended December 31, 2017 and 2016, as included elsewhere herein |
| (B) | Derived from the unaudited consolidated financial statements of SPS Holdco, LLC for the six month period ended June 30, 2017, as included elsewhere herein, plus activity for the period from July 1, 2017 to August 15, 2017. SPS results from the date of acquisition to December 31, 2017 are included in C1’s financial statements for the year ended December 31, 2017. |
| (C) | Derived from the unaudited consolidated financial statements of AOS, Inc. for the nine month period ended October 1, 2017, as included elsewhere herein, plus activity for the period from October 2, 2017 to December 14, 2017. AOS results from the date of acquisition to December 31, 2017 are included in C1’s financial statements for the year ended December 31, 2017. |
| (D) | Derived from the audited consolidated financial statements of Forum for the year ended December 31, 2017, as included elsewhere herein. |
| (E) | Derived from the consolidated financial statements of SPS Holdco, LLC for the year ended December 31, 2016, as included elsewhere herein. |
| (F) | Derived from the consolidated financial statements of AOS, Inc. for the year ended December 25, 2016, as included elsewhere herein. |
| (G) | Derived from the audited statements of operations of Forum for the period from November 17, 2016 (inception) through December 31, 2016 as included elsewhere herein. |
Pro Forma SPS and AOS Acquisition Adjustments
| (1) | To eliminate SPS’s and AOS’s historical amortization of identifiable intangibles and record the amortization of identifiable intangibles resulting from the acquisition of SPS and AOS. |
| (2) | To eliminate transaction costs incurred in the year ended December 31, 2017 resulting from the acquisition of SPS and AOS. |
| (3) | To eliminate SPS’s and AOS’s historical interest expense and to record the increase in interest expense, which includes the amortization of the deferred financing fees. The interest expense is calculated based on the Term Loans interest rate of 6.09% and Revolving Loan Facility of 4.5% at September 30, 2017, resulting from the borrowings under C1 financing facilities to fund the purchase price. The impact on interest expense of a 1% change in interest rates would be approximately $1,170 for each of the years ended December 31, 2017 and 2016. |
| (4) | To reflect the income tax effect of the pro forma adjustments and Acquisitions using C1’s historical operating effective rate of 34.3% and 44.6% for the years ended December 31, 2017 and 2016, respectively. |
| (5) | To reverse the impairment of goodwill recorded by SPS as a result of eliminating historical goodwill. |
Pro Forma Merger Adjustments
| (6) | Represents an adjustment to eliminate direct, incremental offering costs which are reflected in the historical financial statements of C1 in the amount of $3,757 and $419 for the years ended December 31, 2017 and 2016, respectively. There were no such amounts recorded for Forum for the years ended December 31, 2017 and 2016. |
| (7) | Represents an adjustment to eliminate interest income on marketable securities held in the trust account as of the beginning of the period. |
115
Table of Contents
Pro Forma Adjustments to the Unaudited Condensed Combined Statements of Income (in thousands, except share data)—(Continued)
| (8) | To record interest expense on additional borrowings to fund the closing of the Business Combination. The interest expense is calculated based on the Revolving Loan Facility of 4.5% at December 31, 2017. The impact on interest expense of a 1% change in interest rates would be approximately $510 for each of the years ended December 31, 2017 and 2016. |
| (9) | To record normalized blended statutory income tax benefit rate of 35.0% for pro forma financial presentation purposes. |
| (10) | As the Business Combination is being reflected as if it had occurred at the beginning of the period presented, the calculation of weighted average shares outstanding for basic and diluted net income (loss) per share assumes that the shares issuable relating to the Business Combination and the PIPE investors have been outstanding for the entire period presented. If the maximum number of shares are redeemed, this calculation is retroactively adjusted to eliminate such shares for the entire period. Weighted average common shares outstanding—basic and diluted are calculated as follows: |
| Year Ended December 31, | ||||||||
| 2017 | 2016 | |||||||
| Weighted average shares calculation, basic |
||||||||
| Forum weighted average public shares outstanding |
5,045,566 | 3,125,000 | ||||||
| Forum Sponsor shares |
— | 562,500 | ||||||
| Forum public shares |
— | 309,091 | ||||||
| Forum Sponsor private placement shares |
— | 622,500 | ||||||
| Sponsor shares |
— | 172,500 | ||||||
| Forum rights converted to shares |
1,787,250 | 1,787,250 | ||||||
| Forum shares subject to redemption reclassified to equity |
309,091 | — | ||||||
| Forum shares cancelled and subject to forfeiture |
(3,234,375 | ) | (3,234,375 | ) | ||||
| Shares issued to PIPE investors |
17,959,375 | 17,959,375 | ||||||
| Forum shares issued in Business Combination |
47,124,494 | 47,124,494 | ||||||
|
|
|
|
|
|||||
| Weighted average shares outstanding |
68,991,401 | 68,428,335 | ||||||
|
|
|
|
|
|||||
| Percent of shares owned by C1 holders |
68.3% | 68.9% | ||||||
| Percent of shares owned by PIPE investors |
26.0% | 26.2% | ||||||
| Percent of shares owned by Forum |
5.7% | 4.9% | ||||||
| Year Ended December 31, | ||||||||
| 2017 | 2016 | |||||||
| Weighted average shares calculation, basic |
||||||||
| Existing C1 holders |
47,124,494 | 47,124,494 | ||||||
| PIPE investors |
17,959,375 | 17,959,375 | ||||||
| Forum holders |
3,907,532 | 3,344,466 | ||||||
|
|
|
|
|
|||||
| Weighted average shares, basic |
68,991,401 | 68,428,335 | ||||||
|
|
|
|
|
|||||
116
Table of Contents
Pro Forma Adjustments to the Unaudited Condensed Combined Statements of Income (in thousands, except share data)—(Continued)
| Year Ended December 31, | ||||||||
| 2017 | 2016 | |||||||
| Weighted average shares calculation, diluted |
||||||||
| Forum shares issued in Business Combination |
47,124,494 | 47,124,494 | ||||||
| Shares issued to PIPE investors |
17,959,375 | 17,959,375 | ||||||
| Forum holders |
3,907,532 | 3,344,466 | ||||||
| Unit purchase options |
— | 1,800,000 | ||||||
| Weighted average shares outstanding |
68,991,401 | 70,228,335 | ||||||
| Percent of shares owned by C1 holders |
68.3% | 67.1% | ||||||
| Percent of shares owned by PIPE investors |
26.0% | 25.6% | ||||||
| Percent of shares owned by Forum |
5.7% | 7.3% | ||||||
| Year Ended December 31, | ||||||||
| 2017 | 2016 | |||||||
| Weighted average shares calculation, diluted |
||||||||
| Existing C1 holders |
47,124,494 | 47,124,494 | ||||||
| PIPE investors |
17,959,375 | 17,959,375 | ||||||
| Forum holders |
3,907,532 | 5,144,466 | ||||||
|
|
|
|
|
|||||
| Weighted average shares, diluted |
68,991,401 | 70,228,335 | ||||||
|
|
|
|
|
|||||
The computation of diluted loss per share for the year ended December 31, 2017 excludes the effect of (1) 1,125,000 shares of Common Stock, warrants to purchase 562,500 shares of Common Stock and rights that convert into 112,500 shares of Common Stock in the UPO (as defined in the Forum Merger Corporation Form S-4 filed with the Securities and Exchange Commission on February 1, 2018) and (2) warrants to purchase 8,936,250 shares of common stock because the inclusion of any of these securities would be anti-dilutive.
The computation of diluted loss per share for the year ended December 31, 2016 excludes the effect of warrants to purchase 8,936,250 shares of Common Stock because the inclusion of these securities would be anti-dilutive.
117
Table of Contents
C1 INVESTMENT CORP.
CONSOLIDATED FINANCIAL STATEMENTS
YEARS ENDED DECEMBER 31, 2017, 2016 AND 2015
| Page | ||||
| F-2 | ||||
| F-3 | ||||
| F-4 | ||||
| F-5 | ||||
| F-6 | ||||
| F-7 | ||||
FORUM MERGER CORPORATION
CONSOLIDATED FINANCIAL STATEMENTS
PERIOD FROM NOVEMBER 17, 2016 (INCEPTION) TO DECEMBER 31, 2016
AND THE YEAR ENDED DECEMBER 31, 2017
| Page | ||||
| F-43 | ||||
| F-44 | ||||
| F-45 | ||||
| F-46 | ||||
| F-47 | ||||
| F-48 | ||||
SPS HOLDCO, LLC AND SUBSIDIARIES
CONSOLIDATED FINANCIAL REPORT
YEARS ENDED DECEMBER 31, 2016 AND 2015
AND SIX MONTHS ENDED JUNE 30, 2017
| Page | ||||
| F-66 | ||||
| F-67 | ||||
| F-68 | ||||
| F-69 | ||||
| F-70 | ||||
| F-71 | ||||
AOS, INC. AND SUBSIDIARIES
YEAR ENDED DECEMBER 25, 2016 AND DECEMBER 27, 2015
| Page | ||||
| F-82 | ||||
| F-84 | ||||
| F-85 | ||||
| F-86 | ||||
| F-87 | ||||
| F-88 | ||||
AOS, INC. AND SUBSIDIARIES
NINE MONTHS ENDED OCTOBER 1, 2017
| Page | ||||
| F-102 | ||||
| F-103 | ||||
| F-104 | ||||
| F-105 | ||||
| F-106 | ||||
F-1
Table of Contents
REPORT OF INDEPENDENT REGISTERED PUBLIC ACCOUNTING FIRM
Board of Directors
C1 Investment Corp. and Subsidiaries
Opinion on the Financial Statements
We have audited the accompanying consolidated balance sheets of C1 Investment Corp. and Subsidiaries (the Company) as of December 31, 2017 and 2016, and the related consolidated statements of income, stockholders’ equity and cash flows for each of the three years in the period ended December 31, 2017, and the related notes to the consolidated financial statements (collectively, the financial statements). In our opinion, the financial statements present fairly, in all material respects, the financial position of the Company as of December 31, 2017 and 2016, and the results of its operations and its cash flows for each of the three years in the period ended December 31, 2017 in conformity with accounting principles generally accepted in the United States of America.
Basis for Opinion
These financial statements are the responsibility of the Company’s management. Our responsibility is to express an opinion on the Company’s financial statements based on our audits. We are a public accounting firm registered with the Public Company Accounting Oversight Board (United States) (PCAOB) and are required to be independent with respect to the Company in accordance with U.S. federal securities laws and the applicable rules and regulations of the Securities and Exchange Commission and the PCAOB.
We conducted our audits in accordance with the auditing standards of the PCAOB and in accordance with auditing standards generally accepted in the United States of America. Those standards require that we plan and perform the audit to obtain reasonable assurance about whether the financial statements are free of material misstatement, whether due to error or fraud. The Company is not required to have, nor were we engaged to perform, an audit of its internal control over financial reporting. As part of our audits we are required to obtain an understanding of internal control over financial reporting but not for the purpose of expressing an opinion on the effectiveness of the Company’s internal control over financial reporting. Accordingly, we express no such opinion.
Our audits included performing procedures to assess the risks of material misstatement of the financial statements, whether due to error or fraud, and performing procedures that respond to those risks. Such procedures included examining, on a test basis, evidence regarding the amounts and disclosures in the financial statements. Our audits also included evaluating the accounting principles used and significant estimates made by management, as well as evaluating the overall presentation of the financial statements. We believe that our audits provide a reasonable basis for our opinion.
/s/ RSM US LLP
We have served as the Company’s auditor since 2005.
Minneapolis, Minnesota
March 19, 2018
F-2
Table of Contents
CONSOLIDATED BALANCE SHEETS
(in thousands, except share data)
| As of December 31, |
||||||||
| 2017 | 2016 | |||||||
| Assets | ||||||||
| Current Assets |
||||||||
| Cash |
$ | 13,475 | $ | 9,632 | ||||
| Trade accounts receivable, less allowances |
289,236 | 180,160 | ||||||
| Inventories |
14,717 | 12,127 | ||||||
| Prepaid expenses and other current assets |
9,294 | 3,373 | ||||||
| Deferred customer support contract costs |
35,151 | 19,779 | ||||||
| Income tax receivable |
10,576 | — | ||||||
|
|
|
|
|
|||||
| Total current assets |
372,449 | 225,071 | ||||||
|
|
|
|
|
|||||
| Other Assets |
||||||||
| Goodwill |
331,456 | 258,570 | ||||||
| Finite-life intangibles, net |
173,642 | 134,620 | ||||||
| Property and equipment, net |
36,659 | 15,355 | ||||||
| Deferred customer support contract costs, noncurrent |
3,915 | 805 | ||||||
| Non-current income tax receivable |
2,620 | — | ||||||
| Deferred offering costs |
— | 1,839 | ||||||
|
|
|
|
|
|||||
| Total other assets |
548,292 | 411,189 | ||||||
|
|
|
|
|
|||||
| Total assets |
$ | 920,741 | $ | 636,260 | ||||
|
|
|
|
|
|||||
| Liabilities and Stockholders’ Equity |
||||||||
| Current Liabilities |
||||||||
| Current maturities of long-term debt |
$ | 5,652 | $ | 3,324 | ||||
| Accounts payable |
157,778 | 95,824 | ||||||
| Customer deposits |
22,498 | 14,144 | ||||||
| Accrued compensation |
34,522 | 23,382 | ||||||
| Accrued other |
27,362 | 11,101 | ||||||
| Income tax payable |
— | 4,151 | ||||||
| Deferred revenue |
68,127 | 41,876 | ||||||
|
|
|
|
|
|||||
| Total current liabilities |
315,939 | 193,802 | ||||||
|
|
|
|
|
|||||
| Long-Term Liabilities |
||||||||
| Long-term debt, net of debt issuance costs and current maturities |
566,424 | 388,964 | ||||||
| Deferred income taxes |
18,056 | 37,841 | ||||||
| Long-term income tax payable |
1,563 | 1,567 | ||||||
| Deferred revenue and other long-term liabilities |
13,118 | 1,326 | ||||||
|
|
|
|
|
|||||
| Total long-term liabilities |
599,161 | 429,698 | ||||||
|
|
|
|
|
|||||
| Commitments and Contingencies |
||||||||
| Stockholders’ Equity |
||||||||
| Class A common stock, $0.0001 par value; 106,000,000 shares authorized; 89,766,294 shares issued and outstanding as of December 31, 2017; 89,862,276 shares issued and outstanding as of December 31, 2016 |
9 | 9 | ||||||
| Class B convertible common stock, $0.0001 par value; 16,000,000 nonvoting shares authorized; 14,830,683 nonvoting shares issued and outstanding as of December 31, 2017; 14,701,748 nonvoting shares issued and outstanding as of December 31, 2016 |
1 | 1 | ||||||
| Subscription receivable from related party |
(1,805 | ) | — | |||||
| Additional paid-in capital |
13,459 | 10,367 | ||||||
| (Accumulated deficit) retained earnings |
(6,023 | ) | 2,383 | |||||
|
|
|
|
|
|||||
| Total stockholders’ equity |
5,641 | 12,760 | ||||||
|
|
|
|
|
|||||
| Total liabilities and stockholders’ equity |
$ | 920,741 | $ | 636,260 | ||||
|
|
|
|
|
|||||
See accompanying notes to consolidated financial statements.
F-3
Table of Contents
CONSOLIDATED STATEMENTS OF INCOME
(in thousands, except per share data)
| Year Ended December 31, |
||||||||||||
| 2017 | 2016 | 2015 | ||||||||||
| Revenue |
||||||||||||
| Technology offerings |
$ | 453,106 | $ | 439,804 | $ | 297,481 | ||||||
| Services |
465,820 | 375,805 | 303,983 | |||||||||
|
|
|
|
|
|
|
|||||||
| Total revenue |
918,926 | 815,609 | 601,464 | |||||||||
|
|
|
|
|
|
|
|||||||
| Cost of revenue |
||||||||||||
| Technology offerings |
348,430 | 333,082 | 220,377 | |||||||||
| Services |
296,011 | 233,283 | 187,641 | |||||||||
|
|
|
|
|
|
|
|||||||
| Total cost of revenue |
644,441 | 566,365 | 408,018 | |||||||||
|
|
|
|
|
|
|
|||||||
| Gross profit |
||||||||||||
| Technology offerings |
104,676 | 106,722 | 77,104 | |||||||||
| Services |
169,809 | 142,522 | 116,342 | |||||||||
|
|
|
|
|
|
|
|||||||
| Total gross profit |
274,485 | 249,244 | 193,446 | |||||||||
|
|
|
|
|
|
|
|||||||
| Operating expenses |
||||||||||||
| Sales and marketing |
139,469 | 128,733 | 96,578 | |||||||||
| General and administrative |
61,367 | 40,262 | 36,955 | |||||||||
| Transaction costs |
14,071 | 6,055 | 5,678 | |||||||||
| Depreciation and amortization |
34,908 | 27,692 | 23,520 | |||||||||
|
|
|
|
|
|
|
|||||||
| Total operating expenses |
249,815 | 202,742 | 162,731 | |||||||||
|
|
|
|
|
|
|
|||||||
| Operating income |
24,670 | 46,502 | 30,715 | |||||||||
|
|
|
|
|
|
|
|||||||
| Other (income) expense |
||||||||||||
| Interest income |
(105 | ) | (11 | ) | (26 | ) | ||||||
| Interest expense |
52,057 | 31,438 | 23,072 | |||||||||
| Other expense, net |
87 | 10 | 72 | |||||||||
|
|
|
|
|
|
|
|||||||
| Interest expense and other, net |
52,039 | 31,437 | 23,118 | |||||||||
|
|
|
|
|
|
|
|||||||
| (Loss) income before income taxes |
(27,369 | ) | 15,065 | 7,597 | ||||||||
| Income tax (benefit) expense |
(19,348 | ) | 6,716 | 3,574 | ||||||||
|
|
|
|
|
|
|
|||||||
| Net (loss) income |
$ | (8,021 | ) | $ | 8,349 | $ | 4,023 | |||||
|
|
|
|
|
|
|
|||||||
| Net (loss) income per share attributable to Class A common stockholders, basic and diluted |
$ | (0.09 | ) | $ | 0.09 | $ | 0.04 | |||||
|
|
|
|
|
|
|
|||||||
| Cash dividends per share of Class A common stock |
$ | — | $ | 1.00 | $ | — | ||||||
|
|
|
|
|
|
|
|||||||
See accompanying notes to consolidated financial statements.
F-4
Table of Contents
CONSOLIDATED STATEMENTS OF STOCKHOLDERS’ EQUITY
(in thousands, except share data)
| Class A Common Stock |
Class B Common Stock |
Subscription Receivable |
Additional Paid-in Capital |
Retained Earnings (Accumulated Deficit) |
Total | |||||||||||||||||||||||||||
| Shares | Amount | Shares | Amount | |||||||||||||||||||||||||||||
| Balance at December 31, 2014 |
89,883,258 | $ | 9 | 13,142,461 | $ | 1 | $ | — | $ | 90,007 | $ | (1,052) | $ | 88,965 | ||||||||||||||||||
| Common shares issued upon exercise of options |
— | — | 1,961,124 | — | — | 20 | — | 20 | ||||||||||||||||||||||||
| Repurchase of shares |
(20,982) | — | (401,837) | — | — | (25) | — | (25) | ||||||||||||||||||||||||
| Stock-based compensation expense |
— | — | — | — | — | 233 | — | 233 | ||||||||||||||||||||||||
| Net income |
— | — | — | — | — | — | 4,023 | 4,023 | ||||||||||||||||||||||||
|
|
|
|
|
|
|
|
|
|
|
|
|
|
|
|
|
|||||||||||||||||
| Balance at December 31, 2015 |
89,862,276 | 9 | 14,701,748 | 1 | — | 90,235 | 2,971 | 93,216 | ||||||||||||||||||||||||
| Stock-based compensation expense |
— | — | — | — | — | 1,057 | — | 1,057 | ||||||||||||||||||||||||
| Dividends paid |
— | — | — | — | — | (80,925) | (8,937) | (89,862) | ||||||||||||||||||||||||
| Net income |
— | — | — | — | — | — | 8,349 | 8,349 | ||||||||||||||||||||||||
|
|
|
|
|
|
|
|
|
|
|
|
|
|
|
|
|
|||||||||||||||||
| Balance at December 31, 2016 |
89,862,276 | 9 | 14,701,748 | 1 | — | 10,367 | 2,383 | 12,760 | ||||||||||||||||||||||||
| Common shares issued upon exercise of options |
— | — | 530,772 | — | (1,805) | 1,805 | — | — | ||||||||||||||||||||||||
| Repurchase of shares |
(95,982) | — | (401,837) | — | — | — | (385) | (385) | ||||||||||||||||||||||||
| Stock-based compensation expense |
— | — | — | — | — | 1,287 | — | 1,287 | ||||||||||||||||||||||||
| Net loss |
— | — | — | — | — | — | (8,021) | (8,021) | ||||||||||||||||||||||||
|
|
|
|
|
|
|
|
|
|
|
|
|
|
|
|
|
|||||||||||||||||
| Balance at December 31, 2017 |
89,766,294 | $ | 9 | 14,830,683 | $ | 1 | $ | (1,805) | $ | 13,459 | $ | (6,023) | $ | 5,641 | ||||||||||||||||||
|
|
|
|
|
|
|
|
|
|
|
|
|
|
|
|
|
|||||||||||||||||
See accompanying notes to consolidated financial statements.
F-5
Table of Contents
CONSOLIDATED STATEMENTS OF CASH FLOWS
(in thousands)
| Year Ended December 31, |
||||||||||||
| 2017 | 2016 | 2015 | ||||||||||
| Cash Flows from Operating Activities |
||||||||||||
| Net (loss) income |
$ | (8,021 | ) | $ | 8,349 | $ | 4,023 | |||||
| Adjustments to reconcile net (loss) income to net cash (used in) provided by operating activities: |
||||||||||||
| Depreciation of property and equipment in operating expenses |
8,462 | 5,236 | 3,273 | |||||||||
| Depreciation of property and equipment in cost of revenue |
1,465 | 878 | 338 | |||||||||
| Amortization of finite-life intangibles |
26,445 | 22,456 | 20,247 | |||||||||
| Deferred income taxes |
(8,011 | ) | (4,065 | ) | (2,917 | ) | ||||||
| Amortization of debt issuance costs |
2,596 | 2,412 | 2,028 | |||||||||
| Loss on extinguishment of debt |
13,638 | 2,747 | — | |||||||||
| Stock-based compensation expense |
1,287 | 1,057 | 233 | |||||||||
| Other |
2,383 | 17 | 97 | |||||||||
| Changes in assets and liabilities, net of business acquisitions in 2017 and 2015: |
||||||||||||
| Trade accounts receivable |
(38,661 | ) | (5,536 | ) | (32,145 | ) | ||||||
| Inventories |
9,913 | (780 | ) | (3,665 | ) | |||||||
| Prepaid expenses, deferred customer support contract costs and other |
(3,576 | ) | (1,490 | ) | (7,652 | ) | ||||||
| Income tax receivable |
(11,408 | ) | 17 | 4,419 | ||||||||
| Accounts payable and accrued expenses |
(7,558 | ) | (11,112 | ) | 12,928 | |||||||
| Customer deposits |
(1,090 | ) | 920 | (2,384 | ) | |||||||
| Income tax payable |
(4,253 | ) | (257 | ) | 5,301 | |||||||
| Deferred revenue and other long-term liabilities |
9,865 | 2,007 | 10,346 | |||||||||
|
|
|
|
|
|
|
|||||||
| Net cash (used in) provided by operating activities |
(6,524 | ) | 22,856 | 14,470 | ||||||||
|
|
|
|
|
|
|
|||||||
| Cash Flows from Investing Activities |
||||||||||||
| Purchases of property and equipment |
(9,514 | ) | (9,272 | ) | (5,476 | ) | ||||||
| Acquisitions of businesses, net of cash acquired |
(142,925 | ) | 247 | (67,047 | ) | |||||||
|
|
|
|
|
|
|
|||||||
| Net cash used in investing activities |
(152,439 | ) | (9,025 | ) | (72,523 | ) | ||||||
|
|
|
|
|
|
|
|||||||
| Cash Flows from Financing Activities |
||||||||||||
| Proceeds from term notes, less discount |
569,988 | 88,650 | 49,750 | |||||||||
| Dividends paid |
— | (89,862 | ) | — | ||||||||
| Proceeds from revolving credit agreement |
114,000 | 42,000 | 20,000 | |||||||||
| Repayment of revolving credit agreement |
(94,000 | ) | (52,000 | ) | (10,000 | ) | ||||||
| Repurchase of common stock |
(385 | ) | — | (25 | ) | |||||||
| Payment of deferred financing costs |
(6,630 | ) | (3,966 | ) | (1,168 | ) | ||||||
| Payment of extinguishment charges |
(3,353 | ) | (1,470 | ) | — | |||||||
| Deferred offering costs |
— | (224 | ) | — | ||||||||
| Payment on long-term debt |
(416,814 | ) | (2,634 | ) | (2,279 | ) | ||||||
| Proceeds received from stock option exercises |
— | — | 20 | |||||||||
|
|
|
|
|
|
|
|||||||
| Net cash provided by (used in) financing activities |
162,806 | (19,506 | ) | 56,298 | ||||||||
|
|
|
|
|
|
|
|||||||
| Net increase (decrease) in cash |
3,843 | (5,675 | ) | (1,755 | ) | |||||||
| Cash |
||||||||||||
| Beginning |
9,632 | 15,307 | 17,062 | |||||||||
|
|
|
|
|
|
|
|||||||
| Ending |
$ | 13,475 | $ | 9,632 | $ | 15,307 | ||||||
|
|
|
|
|
|
|
|||||||
| Supplemental disclosures of cash flow information |
||||||||||||
| Interest paid |
$ | 37,035 | $ | 27,650 | $ | 20,870 | ||||||
|
|
|
|
|
|
|
|||||||
| Income taxes paid |
$ | 4,343 | $ | 11,017 | $ | 2,812 | ||||||
|
|
|
|
|
|
|
|||||||
| Supplemental disclosures of noncash investing and financing activities |
||||||||||||
| Deferred offering costs in accounts payable and accrued expenses |
$ | — | $ | 1,615 | $ | — | ||||||
|
|
|
|
|
|
|
|||||||
| Deferred financing costs in accounts payable and accrued expenses |
$ | — | $ | 363 | $ | — | ||||||
|
|
|
|
|
|
|
|||||||
| Property and equipment purchases financed with accounts payable |
$ | 123 | $ | 235 | $ | 170 | ||||||
|
|
|
|
|
|
|
|||||||
| Contingent consideration for business acquisition |
$ | 956 | $ | — | $ | — | ||||||
|
|
|
|
|
|
|
|||||||
| Stock option exercise with promissory note |
$ | 1,805 | $ | — | $ | — | ||||||
|
|
|
|
|
|
|
|||||||
See accompanying notes to consolidated financial statements.
F-6
Table of Contents
Notes to the Consolidated Financial Statements
1. Nature of Business and Summary of Significant Accounting Policies
Description of the Company
C1 Investment Corp. and its wholly owned subsidiary, C1 Intermediate Corp., are Delaware corporations that were incorporated to complete the 2014 acquisition of ConvergeOne Holdings Corp. (“Holdings”) and its consolidated subsidiaries by Clearlake Capital Group, L.P. (“Clearlake”).
Holdings is the parent company of ConvergeOne, Inc. (“ConvergeOne”), formerly North American Communications Resource, Inc. (“NACR”), Annese & Associates, Inc. (“Annese”), SPS Holdco, LLC. (“SPS”), RGTS, Inc. (“RGTS”) and AOS, Inc. (“AOS”).
On May 16, 2015, ConvergeOne Solutions, Inc. (“Solutions”) was formed as a wholly owned subsidiary of Holdings. On May 19, 2015, NACR acquired all issued and outstanding stock of Sunturn, Inc. (“Sunturn”), and Solutions acquired all issued and outstanding stock of MSN Communications, Inc. (“MSN”). On December 4, 2015, Solutions acquired all issued and outstanding stock of SIGMAnet, Inc. (“SIGMAnet”). On December 31, 2015, the Company executed a series of mergers designed to simplify its legal structure. Sunturn was merged into NACR; and Solutions was merged into NACR. On January 1, 2016, NACR’s name was legally changed to ConvergeOne, Inc. SIGMAnet was merged into ConvergeOne, Inc. on March 31, 2017.
ConvergeOne acquired all issued and outstanding stock of Annese on July 14, 2017, all issued and outstanding stock of SPS on August 16, 2017, all issued and outstanding stock of Rockefeller Group Technology Solutions, Inc. on September 15, 2017 and all issued and outstanding stock of AOS On December 15, 2017. These business acquisitions are described in Note 2—Business Acquisitions.
Immediately following the acquisition of Rockefeller Group Technology Solutions, Inc., the name of the company was legally changed to RGTS, Inc. and the separate legal entities were merged into one of two surviving companies, either RGTS, Inc. the parent company or RGT Utilities, Inc.
References to “the Company,” “we,” “us,” “our,” and similar words refer to C1 Investment Corp. and all of the consolidated subsidiaries, unless specifically noted otherwise.
Merger
On November 30, 2017, the Company signed an Agreement and Plan of Merger (“Merger”) with Forum Merger Corporation (“Forum”), whereby a subsidiary of Forum and the Company shall consummate a merger, pursuant to which the subsidiary shall be merged with and into the Company, following which the separate corporate existence of the subsidiary shall cease and the Company shall continue as the surviving corporation (the “Business Combination”). On February 22, 2018, the transactions contemplated by the Merger were consummated. In connection with the Merger, the name of the surviving corporation was changed to ConvergeOne Holdings, Inc.
The Business Combination will be accounted for as a reverse merger in accordance with U.S. GAAP. Under this method of accounting, Forum will be treated as the “acquired” company for financial reporting purposes. This determination was primarily based on the Company Securityholders expecting to have a majority of the voting power of the combined company, the Company comprising the ongoing operations of the combined entity, the Company comprising a majority of the governing body of the combined company, and the Company’s senior management comprising the senior management of the combined company. Accordingly, for accounting purposes, the Business Combination will be treated as the equivalent of the Company issuing stock for the net assets of Forum, accompanied by a recapitalization. The net assets of Forum will be stated at historical cost, with no goodwill or other intangible assets recorded. Operations prior to the Business Combination will be those of the Company.
F-7
Table of Contents
C1 INVESTMENT CORP.
Notes to the Consolidated Financial Statements—(Continued)
Nature of Business
The Company is a leading IT services provider of collaboration and technology solutions for large and medium enterprises. The Company serves clients through its comprehensive engagement model which includes the full lifecycle of services from consultation through implementation, optimization, and ongoing support services. The Company provides innovative and sophisticated services, including professional and managed, cloud and maintenance services, and complex multi-vendor technology offerings to its clients. The Company’s core technology markets are (1) collaboration and (2) enterprise networking, data center, cloud, and security.
Principles of Consolidation
The consolidated financial statements have been prepared in accordance with accounting principles generally accepted in the United States (“U.S. GAAP”) and include the accounts of the parent company, C1 Investment Corp., and its wholly owned subsidiaries. All significant intercompany accounts and transactions have been eliminated in the consolidation.
Use of Estimates
The preparation of the Company’s consolidated financial statements in conformity with U.S. GAAP requires management to make estimates and assumptions that affect the reported amounts of assets and liabilities and disclosure of contingent assets and liabilities at the date of the financial statements and the reported amounts of revenues and expenses during the reporting period. Actual results could differ from those estimates. Estimates are used when accounting for items and matters including, but not limited to, revenue recognition, the fair value of assets acquired and liabilities assumed in business combinations, evaluation of goodwill and long-lived assets for impairment, stock-based compensation, partner funding, income tax measurement, and provisions for doubtful accounts.
Significant Accounting Policies
A summary of the Company’s significant accounting policies follows:
Revenue Recognition
Products, installation and maintenance services are typically sold as a bundled arrangement containing multiple deliverables of new and/or refurbished hardware, software and professional services associated with installing, maintaining and managing the business communications systems. Revenue from multiple-element arrangements is allocated to the various elements based on the relative selling price of the elements, and each element is considered a separate accounting unit, with recognition of revenue based on the criteria met for the individual element of the multiple-element arrangement. When available, the Company uses vendor-specific objective evidence, or VSOE, to determine the selling price of a unit of accounting. If VSOE does not exist, the Company uses third-party evidence of the selling price for similar products and services. For units of accounting in which there is no VSOE or third-party evidence of selling price, the best estimate of selling price is used. The Company determines best estimate of selling price using a cost plus margin approach.
Technology Offerings Revenue
Revenue for hardware and software: The Company sells communication products, which consist of hardware and essential software. The software and hardware are necessary to deliver the essential functionality of the communication products. Revenue from the sale of hardware and software products is generally recognized on a gross basis with the sales price to the customer recorded as revenue and the acquisition cost of the product recorded as cost of revenue, net of certain partner funding. Revenue is recognized when the title and risk of loss are passed to the customer, there is persuasive evidence of an arrangement for sale, the sales price is fixed and
F-8
Table of Contents
C1 INVESTMENT CORP.
Notes to the Consolidated Financial Statements—(Continued)
determinable, and collectability is reasonably assured. Hardware and software items can be delivered to customers in a variety of ways including physical products shipped from our warehouses, via drop-shipment by the vendor or distributor or via electronic delivery for software licenses.
The Company maintains an estimate for sales returns and credit losses based on historical experience. The Company’s vendor partners provide limited warranties to our customers on equipment sold.
Sales Taxes. The Company records sales and use taxes collected from customers for remittance to governmental authorities on a net basis within the Company’s consolidated statements of income.
Shipping and Freight. Shipping and freight costs billed to customers are recognized within revenue with the related shipping and freight costs incurred by the Company recorded as a cost of revenue.
Services Revenue
Revenue for Professional Services. Revenue from professional services, which includes the design, configuration, installation and integration of business communication and data systems, is recognized as the services are performed or as all obligations have been substantially met.
Revenue for Managed, Cloud and Maintenance Services. Revenue for managed services, which are for agreements of one year or greater for more than one service offering, is recognized on a straight-line basis over the term of the arrangement, which is consistent with the timing of services rendered. Payments received and billings in advance for these services are initially recorded as deferred revenue and recognized over the period services are provided. The Company incurs external costs associated with professional and managed services, primarily related to purchasing maintenance support contracts with third party manufacturers and software licenses, which are generally prepaid. These costs, associated with maintenance contracts where we have an obligation to perform services, are incurred specifically to assist the Company in rendering services to its customers and are recorded as deferred customer support contract costs at the time the costs are incurred. The costs are amortized to expense as a cost of revenue—services on a straight-line basis over the period during which the Company fulfills its performance obligation.
The Company considers the principal versus agent accounting guidance to determine if the Company is the primary obligor in the arrangement and if revenue should be recognized gross or net of the associated costs. Applying the principal versus agent accounting guidance is a matter of judgment based on consideration of several factors and indicators.
Revenue from the sale of third-party retail maintenance contracts is recognized net of the related cost of revenue. In third-party retail maintenance contracts, all services are provided by third-party providers and, as a result, the Company concluded that it is acting as an agent and is not considered the primary obligor. As the Company is under no obligation to perform additional services, revenue is recognized net at the time of sale.
Revenue from the sale of third-party wholesale maintenance contracts is recognized on a gross basis at the time of sale with the selling price to the customer recorded as revenue and the acquisition cost recorded as cost of revenue. Based upon the evaluation of indicators for net and gross reporting, the Company has concluded that it is acting as a principal in these contracts.
Cash
The Company maintains its cash in bank deposit and money market accounts that, at times, may exceed federally insured limits. The Company has not experienced any losses in such accounts. The Company’s cash management program utilizes zero balance accounts and overnight money market investments. The Company does not have any compensating balance requirements.
F-9
Table of Contents
C1 INVESTMENT CORP.
Notes to the Consolidated Financial Statements—(Continued)
Trade Accounts Receivable
Accounts receivable are carried at the original invoice amount less an estimate made for doubtful receivables. Management determines the allowances by regularly evaluating individual customer receivables and considering a customer’s financial condition and credit history. Accounts receivable are written off when deemed uncollectible. Recoveries of accounts receivable previously written off are recorded when received.
Inventories
Inventories, consisting primarily of communication products, are valued at the lower of cost, determined by the specific-identification method and average cost, or market. The Company evaluates inventories for excess, aging, obsolescence or other factors that affect net realizable value. Write-downs have historically not been material for any of the periods presented.
Property and Equipment
Property and equipment are stated at cost. Depreciation is computed using straight-line and accelerated methods over estimated useful lives of five to ten years for furniture, fixtures and equipment, and three years for software. Leasehold improvements are depreciated over the shorter of the estimated useful life of the asset or the lease term.
Depreciation of certain equipment and software directly utilized in support of cloud and managed services contracts is included in cost of service revenue within the Company’s consolidated statements of income. All other depreciation and amortization are recorded in depreciation and amortization within operating expenses in the Company’s consolidated statements of income.
Finite-life Intangible Assets
Finite-life intangible assets include customer relationships, trademarks, noncompetition agreements, and internally developed software. These intangible assets are amortized over the estimated period during which the asset is expected to contribute directly or indirectly to future cash flows.
Impairment of Long-lived Assets
The Company reviews its long-lived assets for impairment whenever events or circumstances exist that indicate the carrying amount of an asset or asset group may not be recoverable. The recoverability of long-lived assets is measured by a comparison of the carrying amount of the asset or asset group to the future undiscounted cash flows expected to be generated by that asset group. If the asset or asset group is considered to be impaired, an impairment loss would be recorded to adjust the carrying amounts to the estimated fair value. Management has determined that no impairment of long-lived assets exists, and accordingly, no adjustments to the carrying amounts of the Company’s long-lived assets have been made for the periods presented.
Goodwill
The Company records goodwill when the purchase price of a business acquisition exceeds the fair value of net tangible and identifiable intangible assets acquired in a business acquisition. Goodwill is assessed for impairment annually, or more frequently when events or changes in circumstances indicate that the fair value of a reporting unit has more likely than not declined below its carrying value. The Company has determined that it operates its business in one operating segment and one reporting unit and has selected October 1 as the date to perform its annual impairment test.
The Company performs either a qualitative or quantitative assessment to determine if the fair value of its reporting unit exceeds its carrying value. The qualitative goodwill impairment assessment requires evaluating
F-10
Table of Contents
C1 INVESTMENT CORP.
Notes to the Consolidated Financial Statements—(Continued)
factors to determine whether it is more likely than not that the fair value of a reporting unit is less than its carrying amount. As part of our goodwill qualitative assessment process, we evaluate various factors that are specific to the reporting unit that include, but are not limited to, macroeconomic conditions, industry and market considerations and the overall financial performance of the Company.
When performing the quantitative assessment to calculate the fair value of a reporting unit, we consider both comparative market multiples as well as estimated discounted cash flows for the reporting unit. The significant estimates and assumptions include, but are not limited to, revenue growth rates, operating margins, and future economic and market conditions. The discount rates are based upon the reporting unit’s weighted average cost of capital. If an impairment is identified, the next step is to measure the impairment loss by comparing the implied fair value of goodwill with the carrying value of the goodwill for the reporting unit.
The Company performed its annual test in 2017 using a quantitative assessment and determined that it was not more likely than not that the fair value of its reporting unit was less than its carrying amount. The Company believes the quantitative factors considered in the impairment analysis are reasonable, however, significant changes in any one of our assumptions could produce a different result and result in impairment charges that could be material to its consolidated financial statements.
Debt Issuance Costs
Debt issuance costs arising from the Company’s borrowings and credit agreements are amortized using the effective interest rate method over the term of the related debt financing. See Note 6—Debt. Debt issuance costs are presented on a net basis along with the associated debt obligation in the consolidated balance sheets.
Deferred Offering Costs
The Company capitalizes certain legal, accounting and other third-party fees that are directly associated with in-process equity financings as other assets until such financings are consummated. After consummation of the equity financing, these costs are recorded in stockholders’ equity as a reduction of additional paid-in capital generated as a result of the offering. As of December 31, 2016, the Company had recorded $1,839,000 of deferred offering costs in connection with an equity financing process. The deferred offering costs were expensed as a charge to operating expense in the statement of income in 2017 in conjunction with the signing of the Merger agreement with Forum.
Income Taxes
Income taxes are provided using an asset and liability method. Deferred income tax assets and liabilities are computed for differences between the financial statement and tax basis of assets and liabilities that will result in taxable or deductible amounts in the future based on enacted tax laws and rates applicable to the periods in which the differences are expected to affect taxable income. Valuation allowances are established when, in the opinion of management, it is more likely than not that some portion or all of the deferred tax assets will not be realized. Deferred tax assets and liabilities are adjusted for the effects of changes in tax laws and rates on the date of enactment. Management’s estimate of the income tax rates utilized in the calculation of the deferred income tax balances is based on historical taxable income of the Company, expected future taxable income and corresponding rates.
The Company’s operations involve dealing with uncertainties and judgments in the application of complex tax regulations in a multitude of jurisdictions. The Company reports a liability for unrecognized tax benefits resulting from uncertain tax positions taken or expected to be taken in a tax return based on its estimate of whether, and the extent to which, additional taxes will be due. The Company recognizes interest and penalties, if any, related to unrecognized tax benefits in income tax expense.
F-11
Table of Contents
C1 INVESTMENT CORP.
Notes to the Consolidated Financial Statements—(Continued)
See Note 15—Income Taxes for further discussion on the enactment of the legislation commonly referred to as the Tax Cuts and Jobs Act and the impact to the Company’s provision for income taxes.
Transaction Costs
The Company presents transaction costs as a separate line item within operating expenses based on it being a material cost that varies from period to period. Transaction costs include acquisition-related expenses, including integration costs, employee retention bonuses, severance charges, advisory and due diligence fees, and transaction-related legal and accounting due diligence costs. Transaction costs for the year ended December 31, 2017 include the write-off of previously capitalized deferred offering costs.
Advertising Costs
The Company expenses advertising costs as incurred. During the years ended December 31, 2017, 2016 and 2015, advertising costs were $1,935,000, $1,903,000 and $1,312,000, respectively. These amounts were offset by partner funding earned pursuant to shared marketing expense programs recorded as a reduction of selling and administrative expenses.
Product Warranty
The Company provides limited warranties for replacement of defective products for customers who purchase certain types of maintenance support. The Company has not incurred any significant costs associated with these warranties.
Contingencies
From time to time, the Company may be involved in legal matters such as contractual disputes, employment matters, personal injury or property damage claims. While the outcome of such litigation is never certain, management believes the outcomes will not have a material adverse effect on the consolidated financial statements.
Stock-based Compensation
The Company measures and recognizes stock-based compensation expense for all stock-based awards made to employees and directors based on the fair value of the awards as of the date they were each granted and the corresponding expense is recognized over the requisite service period of the awards, both for stock options and restricted stock grants. The Company measures and recognizes stock-based compensation expense for all stock-based awards to non-employees based on the fair value of the award, which is re-measured at the end of each reporting period until vested, and the corresponding expense is recognized over the requisite service period.
The Company uses the Black-Scholes option pricing model to determine the fair value of stock-based awards. The model utilizes the value of the Company’s common stock as well as assumptions regarding the award’s expected life, risk-free interest rate, expected volatility of the underlying stock, and expected dividends. The specific assumptions the Company uses include the following:
Fair value of the Company’s common stock. The fair value of the Company’s common stock has historically been determined by management primarily using periodic valuation studies obtained from a third-party valuation firm. In performing its valuation analysis, the valuation firm uses information provided by management and a number of assumptions based on market and economic conditions.
Expected term. We estimate the expected term using the simplified method due to the lack of historical data regarding the expected life of the awards. The simplified method calculates the expected term as the mid-point between the vesting date and the contractual expiration date of the award.
F-12
Table of Contents
C1 INVESTMENT CORP.
Notes to the Consolidated Financial Statements—(Continued)
Risk-free interest rate. We use interest rates based on U.S. Treasury yields in effect at the time of grant over the expected term of the award.
Expected volatility. We use the average of the historical volatility of public companies in industries similar to the Company.
Dividends. Based on expected annual dividend payout.
The Company uses judgment in evaluating the factors used in the Black-Scholes pricing model. As a result, if factors change, stock-based compensation expense could be significantly different in the future.
Stock-based compensation expense is classified as sales and marketing expense or general and administrative expense consistent with other compensation expense associated with the award recipient. The Company has not capitalized stock-based employee compensation cost or recognized any significant tax benefits related to these costs.
Partner Funding
The Company receives payments and credits from vendors for various programs, including rebates, volume incentive programs and shared marketing expense programs. Each program varies in length and has varying conditions or achievement targets that determine the amount of consideration the Company is eligible to receive. The Company estimates and recognizes the amount of vendor consideration earned when it is probable and reasonably estimable using the information available or historical data. The Company recognizes vendor consideration as a reduction of either cost of revenue for rebates and volume incentives or operating expenses for shared marketing expenses or marketing development fund programs based on the nature of the consideration earned.
Business Combinations
The Company accounts for business combinations and acquisitions using the acquisition method. The acquisition method requires that the total purchase price of the acquired entity be allocated to the assets acquired and liabilities assumed based on their fair values at the acquisition date. The assets acquired include the analysis and recognition of intangible assets such as customer relationships, trade names, developed technology and contractual rights and the liabilities assumed include contractual commitments and contingencies. Any premium paid over the fair value of the net assets and liabilities acquired is recorded as goodwill in connection with a business combination. The results of operations for an acquired entity are included in the consolidated financial statements from the date of acquisition.
Fair Value Measurements
Fair value is defined under U.S. GAAP as the price that would be received to sell an asset or paid to transfer a liability in the principal or most advantageous market for the asset or liability in an orderly transaction between market participants at the measurement date. U.S. GAAP also provides a fair value hierarchy for valuation inputs to prioritize the inputs into three levels based on the extent to which inputs used in measuring fair value are observable in the market. Each fair value measurement is reported in one of the three levels, which is determined by the lowest level input that is significant to the fair value measurement in its entirety. These levels are:
Level 1: Inputs are quoted prices in active markets for identical assets or liabilities.
Level 2: Inputs are quoted prices in active markets for similar assets or liabilities, or quoted prices for identical or similar assets or liabilities in markets that are not active, or inputs other than quoted prices that are observable or can be corroborated by observable market data for the asset or liability.
F-13
Table of Contents
C1 INVESTMENT CORP.
Notes to the Consolidated Financial Statements—(Continued)
Level 3: Inputs are unobservable for the asset or liability and are supported by little or no market activity. These fair values are determined using pricing models for which the assumptions utilize management’s estimates or market participant assumptions.
For those financial instruments with no quoted market prices available, fair value is estimated using present value calculations or other valuation methods, as well as management’s best judgment with respect to current economic conditions, including discount rates and estimates of future cash flows.
Other Comprehensive Income (Loss)
The Company did not have any components of other comprehensive income (loss) for any of the periods presented.
Net Income (Loss) Per Share
Basic net income (loss) per share is computed using the two-class method, which includes the weighted-average number of shares of Class A common stock and participating Class B convertible common stock outstanding during the period. In applying the two-class method, net income (loss) is allocated to both participating classes of common stock based on their respective weighted-average shares outstanding for the period. Diluted net income (loss) per share is computed using the weighted-average number of shares of common stock and dilutive potential shares of common stock outstanding during the period. Dilutive potential shares of common stock outstanding includes the dilutive effect of in-the-money service-only condition stock options. The dilutive effect of such equity-classified awards is calculated based on the average share price for each period using the treasury stock method. Under the treasury stock method, the amount the employee must pay for exercising stock options and the amount of compensation cost for future service that the Company has not yet recognized are collectively assumed to be used to repurchase shares.
Reportable Segments
Segment information is required to be presented in accordance with a “management approach,” which is the approach used by a Company’s chief operating decision-maker when reviewing operating segment information to make decisions, allocate resources and assess performance. An operating segment is defined as a component of the Company (1) that engages in business activities from which it may earn revenue and incur expense, (2) whose operating results are regularly reviewed by the Company’s chief operating decision maker to make decisions about resources to be allocated to the segment and assess its performance, and (3) for which discrete financial information is available. The Company has determined that it operates its business in one operating segment—see Note 16—Segment Reporting.
Recently Adopted Accounting Pronouncements
In January 2017, the Financial Accounting Standards Board (“FASB”) issued Accounting Standards Update (“ASU”) 2017-03, Accounting Changes and Error Corrections (Topic 250) and Investments-Equity Method and Joint Ventures (Topic 323): Amendments to SEC Paragraphs Pursuant to Staff Announcements at the September 22, 2016 and November 17, 2016 EITF Meetings. This ASU amends the FASB Accounting Standards Codification (“ASC” or “the Codification”) for SEC staff announcements made at recent Emerging Issues Task Force meetings and is effective immediately. The new guidance is intended to provide clarity in relation to the disclosure of the impact that ASU 2014-09 and ASU 2016-02 will have on our consolidated financial statements when adopted. Registrants are required to disclose the effect that recently issued accounting standards will have on their financial statements when adopted in a future period. In cases where a registrant cannot reasonably estimate the impact of the adoption, then additional qualitative disclosures should be considered. The ASU incorporates these SEC staff views into ASC 250 and adds references to that guidance in the transition paragraphs of ASU 2014-09 and ASU 2016-02,
F-14
Table of Contents
C1 INVESTMENT CORP.
Notes to the Consolidated Financial Statements—(Continued)
which are defined below. The Company believes its disclosures below regarding the impact of recently issued accounting standards to be adopted in a future period are aligned with the guidance in the ASU.
On January 1, 2017, the Company adopted ASU 2015-11, Inventory (Topic 330): Simplifying the Measurement of Inventory, which restricts the valuation of inventory to the lower of cost or net realizable value, which is the estimated selling price in the ordinary course of business less reasonably predictable costs of completion, disposal and transportation. The adoption of ASU 2015-11 did not have a material impact on the consolidated financial statements.
On January 1, 2017, the Company adopted ASU 2016-09, Compensation—Stock Compensation (Topic 718): Improvements to Employee Share-Based Payment Accounting, which provides areas for simplification in the accounting for share-based payment transactions. Areas included for simplification include, but are not limited to, accounting for income taxes, classification of excess tax benefits on the statement of cash flows, forfeitures and minimum statutory withholding. We elected to continue estimating forfeitures of share-based awards. The adoption of ASU 2016-09 did not have a material impact on the consolidated financial statements.
In January 2017, the FASB issued ASU 2017-04, Intangibles—Goodwill and Other: Simplifying the Test for Goodwill Impairment to simplify the subsequent measurement of goodwill by eliminating Step 2 of the goodwill impairment test. If a reporting unit fails Step 1 of the goodwill impairment test, entities are no longer required to compute the implied fair value of goodwill following the same procedure that would be required in determining the fair value of assets acquired and liabilities assumed in a business combination. Instead, the guidance requires an entity to perform its annual or interim goodwill impairment test by comparing the fair value of a reporting unit with its carrying amount and to recognize an impairment charge for the amount by which the carrying amount exceeds the reporting unit’s fair value. The Company concluded that ASU 2017-04 is preferable to the current guidance due to efficiency, since ASU 2017-04 eliminates the requirement to determine the fair value of individual assets and liabilities of a reporting unit to measure goodwill impairment. The Company early adopted this guidance as of the beginning of the fourth quarter of fiscal 2017. The guidance is applied prospectively and the adoption of this standard did not have any impact on the consolidated financial statements.
Recently Issued Accounting Pronouncements Not Yet Adopted
In May 2014, the FASB issued ASU 2014-09, Revenue from Contracts with Customers (Topic 606), which outlines a single, comprehensive model for accounting for revenue from contracts with customers, requiring an entity to recognize the amount of revenue to which it expects to be entitled for the transfer of promised goods or services to customers. The updated standard will replace most existing revenue recognition guidance in U.S. GAAP when it becomes effective and permits the use of either a full retrospective or retrospective with cumulative effect transition method. In August 2015, the FASB issued ASU 2015-14, Revenue from Contracts with Customers (Topic 606): Deferral of the Effective Date, which defers the effective date of ASU 2014-09 by one year, making it effective for annual reporting periods beginning after December 15, 2018 and interim periods within that fiscal year, with early adoption permitted.
The FASB has issued the following additional ASUs to amend the guidance in ASU 2014-09, all of which have effective dates concurrent with the effective date of ASU 2014-09:
| (1) | In March 2016, the FASB issued ASU 2016-08, Revenue from Contracts with Customers (Topic 606): Principal versus Agent Considerations (Reporting Revenue Gross versus Net), which clarifies the implementation guidance on principal versus agent considerations within the new revenue recognition standard. |
| (2) | In April 2016, the FASB issued ASU 2016-10, Revenue from Contracts with Customers (Topic 606): Identifying Performance Obligations and Licensing, which enhances the guidance around identifying performance obligations in customer contracts within the new revenue recognition standard. |
F-15
Table of Contents
C1 INVESTMENT CORP.
Notes to the Consolidated Financial Statements—(Continued)
| (3) | In May 2016, the FASB issued ASU 2016-12, Revenue from Contracts with Customers (Topic 606): Narrow-scope Improvements and Practical Expedients, which provides additional guidance around certain areas of the new revenue recognition standard. These areas include, but are not limited to, assessing the collectability criterion, presentation of sales taxes and accounting for noncash consideration. |
| (4) | In December 2016, the FASB issued ASU 2016-20, Technical Corrections and Improvements to Topic 606, Revenue from Contracts with Customers, which provides additional guidance around narrow areas of the new revenue recognition standard. These areas include, but are not limited to, contract costs and modifications and remaining performance obligations. |
The Company does not intend to early adopt the new revenue recognition guidance and therefore all of the ASUs noted above will be effective for us for the year ending December 31, 2019. The Company expects to begin evaluating the effect of the revenue recognition ASUs during the second quarter of 2018. The evaluation will include selecting a transition method for these revenue recognition ASUs and determining the effect that the updated standards will have on the historical and future consolidated financial statements.
In February 2016, the FASB issued ASU 2016-02, Leases (Topic 842), which changes the accounting for leases in order to increase transparency and comparability among organizations by recognizing lease assets and lease liabilities on the balance sheet and disclosing key information about leasing arrangements. The guidance in this ASU supersedes the leasing guidance in Topic 840, Leases. Under the new guidance, lessees are required to recognize lease assets and lease liabilities on the balance sheet for all leases with terms longer than 12 months. Leases will be classified as either finance or operating, with classification affecting the pattern of expense recognition in the income statement. The standard has an effective date for fiscal years beginning after December 15, 2019 and interim periods within those fiscal years, with early adoption permitted. A modified retrospective transition approach is required for lessees for capital and operating leases existing at, or entered into after, the beginning of the earliest comparative period presented in the financial statements, with certain practical expedients available. The Company does not currently intend to early adopt the new leasing guidance and therefore ASU 2016-02 will be effective for us for the year ending December 31, 2020. The Company has not yet begun to evaluate the effect of the new guidance on the consolidated financial statements.
In August 2016, the FASB issued ASU 2016-15, Statement of Cash Flows (Topic 230): Classification of Certain Receipts and Cash Payments, to address diversity in practice regarding the presentation of eight specific cash flow situations. These situations include, but are not limited to, debt prepayment and debt extinguishment costs and contingent consideration payments made after a business combination. The standard has an effective date for fiscal years beginning after December 15, 2018, and interim periods within those fiscal years, with early adoption permitted. The Company is currently evaluating the impact that the standard will have on the consolidated financial statements.
In January 2017, the FASB issued ASU 2017-01, Business Combinations (Topic 805): Clarifying the Definition of a Business, to clarify the definition of a business and add guidance to assist entities with evaluating whether transactions should be accounted for as acquisitions (or disposals) of assets or businesses. The standard has an effective date for annual periods beginning after December 15, 2018, and interim periods within those annual periods, with early adoption permitted. The Company is currently evaluating the impact that the standard will have on the consolidated financial statements.
In May 2017, the FASB issued ASU No. 2017-09, Compensation—Stock Compensation (Topic 718): Scope of Modification Accounting, which clarifies that modification accounting is required only if the fair value, the vesting conditions, or the classification of the award (as equity or liability) changes as a result of the changes in terms or conditions. ASU 2017-09 is effective for fiscal years beginning after December 15, 2017, and interim periods within those annual periods, with early adoption permitted. The amendments in this standard should be
F-16
Table of Contents
C1 INVESTMENT CORP.
Notes to the Consolidated Financial Statements—(Continued)
applied prospectively to an award modified on or after the adoption date. The Company is currently evaluating the impact that the standard will have on the consolidated financial statements, but does not believe this update will have a significant impact.
2. Business Acquisitions
Acquisitions were accounted for as business combinations and the assets acquired and liabilities assumed were recognized based on the estimated fair values at the acquisition date as determined by the Company’s management, using information currently available and current assumptions as to projections of future events and operating performance, and consideration of market conditions.
2017 Acquisitions
Annese & Associates, Inc.
On July 14, 2017, the Company, through its subsidiary ConvergeOne, acquired Annese & Associates, Inc. (“Annese”) for cash consideration of $24,483,000 plus additional consideration of up to $4,000,000, contingent upon the achievement of certain gross profit targets for the twelve months ending June 30, 2018. The Company incurred transaction costs of $778,000 related to the acquisition and included the amount in transaction costs on the consolidated statements of income for the year ended December 31, 2017.
The Company estimated the fair value of the contingent consideration to be approximately $956,000, based upon information currently available and current assumptions as to projections of future events and operating performance, and consideration of market conditions. Payment of the additional consideration, if any, is due during the third quarter of 2018. As of December 31, 2017, the fair value of contingent consideration of $956,000 is included in Accrued other liabilities in the Consolidated Balance Sheets.
Based on the fair value measurement of the assets acquired and liabilities assumed, the Company paid a premium over the fair value of the net tangible and identified intangible assets acquired, resulting in goodwill of approximately $9,906,000. The purchase price of the Annese acquisition was finalized in December 2017 resulting in a decrease of $1,550,000. The premium paid is attributed to Annese’s presence in the business communications industry and its growth potential. Goodwill recognized is deductible for income tax purposes.
Since the acquisition date of July 14, 2017, $36,385,000 of revenue and $1,648,000 of net income are included in the accompanying consolidated statements of income for the year ended December 31, 2017.
As a result of the acquisition, a portion of the consideration, approximately $2,776,000, was placed in an escrow account. The funds in the escrow account are to secure the sellers’ and the Company’s indemnification obligations in the purchase agreement and for any post-closing purchase price adjustments. On December 18, 2017, the purchase price escrow of $200,000 was released to the Company. The remaining funds held in escrow of $2,576,000 after settlement of indemnification claims of the buyer will be paid to the sellers at a future date and are included in cash consideration paid in the table below.
The fair value of accounts receivable was adjusted for approximately $2,323,000 for amounts not expected to be collected.
SPS Holdco, LLC
On August 16, 2017, the Company, through its subsidiary ConvergeOne, acquired SPS Holdco, LLC (“SPS”) for cash consideration of $51,125,000. The Company incurred transaction costs of $581,000 related to the acquisition and included the amount in transaction costs on the consolidated statements of income for the year ended December 31, 2017.
F-17
Table of Contents
C1 INVESTMENT CORP.
Notes to the Consolidated Financial Statements—(Continued)
Based on the fair value measurement of the assets acquired and liabilities assumed, the Company paid a premium over the fair value of the net tangible and identified intangible assets acquired, resulting in goodwill of approximately $18,834,000. The purchase price of the SPS acquisition was finalized in December 2017 resulting in a decrease of $8,000,000. The premium paid is attributed to SPS’s presence in the business communications industry and its growth potential. Goodwill recognized is deductible for income tax purposes.
Since the acquisition date of August 16, 2017, $91,576,000 of revenue and $1,410,000 of net loss are included in the accompanying consolidated statements of income for the year ended December 31, 2017.
As a result of the acquisition, a portion of the consideration, approximately $8,000,000, was placed in an escrow account for any post-closing purchase price adjustments. On December 18, 2017, the full amount of the escrow of $8,000,000 was released to the Company.
The fair value of accounts receivable was adjusted for approximately $3,148,000 for amounts not expected to be collected.
Rockefeller Group Technology Solutions, Inc.
On September 15, 2017, the Company, through its subsidiary ConvergeOne, acquired Rockefeller Group Technology Solutions, Inc. (“RGTS”) for cash consideration of $20,862,000. The Company incurred transaction costs of $612,000 related to the acquisition and included the amount in transaction costs on the consolidated statements of income for the year ended December 31, 2017.
Based on the fair value measurement of the assets acquired and liabilities assumed, the Company paid a premium over the fair value of the net tangible and identified intangible assets acquired, resulting in goodwill of approximately $5,471,000. The purchase price of the RGTS acquisition was finalized in January 2018 resulting in an increase of $10,000. The premium paid is attributed to RGTS’s presence in the business communications industry and its growth potential. Goodwill recognized is deductible for income tax purposes.
Since the acquisition date of September 15, 2017, $8,242,000 of revenue and $192,000 of net income are included in the accompanying consolidated statements of income for the year ended December 31, 2017.
As a result of the acquisition, a portion of the consideration, approximately $2,200,000, was placed in an escrow account. The total escrow is included in cash consideration paid in the table below. The funds in the escrow account are to secure the sellers’ and the Company’s indemnification obligations in the purchase agreement and for any post-closing purchase price adjustments. In January 2018, the purchase price escrow of $600,000 was released to the sellers. The remaining funds held in escrow after settlement of indemnification claims of the buyer will be paid to the sellers at a future date and are included in cash consideration paid in the table below.
The fair value of accounts receivable was adjusted for approximately $565,000 for amounts not expected to be collected.
AOS, Inc.
On December 15, 2017, the Company, through its subsidiary ConvergeOne, acquired AOS, Inc. (“AOS”) for cash consideration of $65,859,000. The Company incurred transaction costs of $459,000 related to the acquisition and included the amount in transaction costs on the consolidated statements of income for the year ended December 31, 2017.
The acquisition fair value measurement is preliminary and subject to completion of the valuation of AOS and further management reviews and assessments of the preliminary fair value of the assets acquired and liabilities assumed. The adjustments arising from the completion of the outstanding matters may materially affect
F-18
Table of Contents
C1 INVESTMENT CORP.
Notes to the Consolidated Financial Statements—(Continued)
the preliminary purchase accounting. The purchase price allocation will be finalized as soon as practicable within the measurement period, but not later than one year following the acquisition date.
Based on the preliminary fair value measurement of the assets acquired and liabilities assumed, the Company paid a premium over the fair value of the net tangible and identified intangible assets acquired, resulting in preliminary goodwill of approximately $40,460,000. The premium paid is attributed to AOS’s presence in the business communications industry and its growth potential. Goodwill recognized is deductible for income tax purposes.
Since the acquisition date of December 15, 2017, $12,802,000 of revenue and $1,275,000 of net income are included in the accompanying consolidated statements of income for the year ended December 31, 2017.
As a result of the acquisition, a portion of the consideration, approximately $1,945,000, was placed in an escrow account. The total escrow is included in cash consideration paid in the table below. The funds in the escrow account are to secure the sellers’ and the Company’s indemnification obligations in the purchase agreement and for any post-closing purchase price adjustments. The funds held in escrow after settlement of indemnification claims of the buyer will be paid to the sellers at a future date.
The fair value of accounts receivable was adjusted for approximately $500,000 for amounts not expected to be collected.
The following summarizes the fair value of the assets acquired and liabilities assumed (in thousands) for acquisitions completed in 2017:
| Annese | SPS | RGTS | AOS | Total | ||||||||||||||||
| Assets Acquired: |
||||||||||||||||||||
| Cash |
$ | 92 | $ | 8,426 | $ | — | $ | 10,886 | $ | 19,404 | ||||||||||
| Trade accounts receivable |
12,321 | 34,543 | 1,685 | 22,321 | 70,870 | |||||||||||||||
| Inventories |
3,161 | 6,264 | 20 | 3,057 | 12,502 | |||||||||||||||
| Prepaid expenses |
2,492 | 1,823 | 1,501 | 645 | 6,461 | |||||||||||||||
| Deferred customer support contract costs |
— | 14,366 | — | — | 14,366 | |||||||||||||||
| Deferred income taxes |
1,326 | 10,448 | — | — | 11,774 | |||||||||||||||
| Property and equipment |
960 | 15,146 | 4,394 | 1,417 | 21,917 | |||||||||||||||
| Goodwill |
9,906 | 18,834 | 5,471 | 40,460 | 74,671 | |||||||||||||||
| Customer relationships |
7,418 | 25,985 | 8,131 | 19,300 | 60,834 | |||||||||||||||
| Trademarks |
514 | 804 | — | 1,350 | 2,668 | |||||||||||||||
| Noncompetition agreements |
— | — | 465 | 1,500 | 1,965 | |||||||||||||||
|
|
|
|
|
|
|
|
|
|
|
|||||||||||
| Total assets acquired |
38,190 | 136,639 | 21,667 | 100,936 | 297,432 | |||||||||||||||
|
|
|
|
|
|
|
|
|
|
|
|||||||||||
| Liabilities Assumed: |
||||||||||||||||||||
| Accounts payable and accrued expenses |
(11,135 | ) | (51,376 | ) | (805 | ) | (33,210 | ) | (96,526 | ) | ||||||||||
| Customer deposits |
(29 | ) | (7,547 | ) | — | (1,867 | ) | (9,443 | ) | |||||||||||
| Deferred revenue |
(1,587 | ) | (26,591 | ) | — | — | (28,178 | ) | ||||||||||||
|
|
|
|
|
|
|
|
|
|
|
|||||||||||
| Total liabilities assumed |
(12,751 | ) | (85,514 | ) | (805 | ) | (35,077 | ) | (134,147 | ) | ||||||||||
|
|
|
|
|
|
|
|
|
|
|
|||||||||||
| Net assets acquired |
$ | 25,439 | $ | 51,125 | $ | 20,862 | $ | 65,859 | $ | 163,285 | ||||||||||
|
|
|
|
|
|
|
|
|
|
|
|||||||||||
The expected lives of the acquired amortizable intangible assets are five years for customer relationships, two years for trademarks and 2-3 years for noncompetition agreements. See Note 10 for further discussion of the fair value of the acquired tangible and intangible assets.
Deferred income tax assets acquired relate primarily to deferred revenue.
F-19
Table of Contents
C1 INVESTMENT CORP.
Notes to the Consolidated Financial Statements—(Continued)
The fair value measurements for AOS are preliminary including the fair value of tangible assets, intangible assets subject to amortization, goodwill, liabilities assumed, and deferred income taxes. The fair value measurements for Annese, SPS and RGTS were final at December 31, 2017, with the exception of the fair value of accounts receivable, inventory excess and obsolescence reserves, accrued expenses, and deferred income taxes. We expect the fair value measurement process to be completed no later than one year from the acquisition date. Purchase price and fair value adjustments to preliminary amounts were made during the fourth quarter of 2017 as follows:
| Annese | SPS | RGTS | ||||||||||
| Net assets acquired as at September 30, 2017 |
$ | 30,033 | $ | 59,125 | $ | 20,852 | ||||||
| Purchase price and fair value adjustments: |
||||||||||||
| Increase (decrease): |
||||||||||||
| Current assets |
(480 | ) | (4,710 | ) | (206 | ) | ||||||
| Property and equipment |
— | (5,209 | ) | 31 | ||||||||
| Goodwill |
(7,803 | ) | (4,594 | ) | (3,715 | ) | ||||||
| Intangible assets |
2,193 | 4,899 | 4,000 | |||||||||
| (Increase) decrease: |
||||||||||||
| Current liabilities |
170 | (8,834 | ) | (100 | ) | |||||||
| Deferred income taxes |
1,326 | 10,448 | — | |||||||||
|
|
|
|
|
|
|
|||||||
| (4,594 | ) | (8,000 | ) | 10 | ||||||||
|
|
|
|
|
|
|
|||||||
| Net assets acquired as at December 31, 2017 |
$ | 25,439 | $ | 51,125 | $ | 20,862 | ||||||
|
|
|
|
|
|
|
|||||||
Unaudited Pro-Forma Information
Following are the supplemental consolidated results of the Company on an unaudited pro forma basis, as if the 2017 acquisitions had been consummated on January 1, 2016 for the year ended December 31, 2016 and 2017 (in thousands):
| Year Ended December 31, |
||||||||
| 2017 | 2016 | |||||||
| Revenue |
$ | 1,307,148 | $ | 1,414,520 | ||||
| Net (loss) income |
$ | (21,915 | ) | $ | 3,960 | |||
These pro forma results were based on estimates and assumptions, which the Company believes are reasonable. They are not the results that would have been realized had the Company been a combined company during the periods presented and are not necessarily indicative of consolidated results of operations in future periods. The pro forma results include adjustments primarily related to purchase accounting adjustments.
2015 Acquisitions
SIGMAnet, Inc.
On December 4, 2015, the Company, through its subsidiary Solutions, acquired SIGMAnet for cash consideration of $47,851,000. The acquisition was accounted for as a business combination. Accordingly, the purchase price was allocated to the assets acquired and liabilities assumed based on the estimated fair values at the acquisition date as determined by the Company’s management, using information currently available and current assumptions as to projections of future events and operating performance, and consideration of market conditions.
The Company paid a premium over the fair value of the net tangible and identified intangible assets acquired, resulting in goodwill recorded of $27,820,000. The premium paid is attributed to SIGMAnet’s presence in the business communications industry and its growth potential. Goodwill recognized is deductible for income
F-20
Table of Contents
C1 INVESTMENT CORP.
Notes to the Consolidated Financial Statements—(Continued)
tax purposes. The results of the acquisition are included in the accompanying consolidated statements of income from the acquisition date forward.
As of December 31, 2015, the purchase price was allocated on a preliminary basis to the tangible and identifiable intangible assets acquired and the liabilities assumed based on the estimated fair values at the acquisition date, as determined by the Company’s management, based upon information currently available, current assumptions as to future operations, and consideration of market conditions. Due to the timing of the acquisition, the Company did not complete the final purchase price allocation until 2016. Adjustments to the preliminary amounts during the measurement period, which were the result of information that existed as of the acquisition date, were recognized prospectively. The adjustments resulted in an increase in goodwill of $13,634,000, a decrease in finite-life intangibles of $12,567,000, a decrease in tangible assets of $1,345,000, and an increase in accounts payable and accrued expenses of $787,000. The impact on the consolidated statement of income was a decrease in cost of revenue of $157,000 and a decrease in operating expenses of $60,000 and an increase in income before income taxes of $217,000.
As a result of the acquisition, a portion of the consideration, $2,925,000, was placed in an escrow account. All of the escrow was released to the sellers in 2016 and is included in cash consideration paid in the table below.
The fair value of accounts receivable was adjusted for approximately $2,202,000 for amounts not expected to be collected.
Sunturn, Inc.
On May 19, 2015, the Company, through its subsidiary NACR, acquired all of the outstanding stock of Sunturn for cash consideration of $8,744,000. The acquisition was accounted for as a business combination. Accordingly, the purchase price has been allocated to the assets acquired and liabilities assumed based on the estimated fair values at the acquisition date as determined by the Company’s management, using information currently available and current assumptions as to projections of future events and operating performance, and consideration of market conditions.
The Company paid a premium over the fair value of the net tangible and identified intangible assets acquired, resulting in goodwill recorded of $2,813,000. The premium paid is attributed to Sunturn’s presence in the business communications industry and its growth potential. Goodwill recognized is deductible for income tax purposes. The results of the acquisition are included in the accompanying consolidated statements of income from the acquisition date forward.
During 2016, the Company settled the working capital adjustment provision of the purchase agreement with the sellers resulting in an increase in goodwill of $650,000.
The fair value of accounts receivable was adjusted for approximately $95,000 for amounts not expected to be collected.
MSN Communications, Inc.
On May 19, 2015, the Company, through its subsidiary Solutions, acquired all of the outstanding stock of MSN for cash consideration of $18,817,000. The acquisition was accounted for as a business combination. Accordingly, the purchase price has been allocated to the assets acquired and liabilities assumed based on the estimated fair values at the acquisition date as determined by the Company’s management, using information currently available and current assumptions as to projections of future events and operating performance, and consideration of market conditions.
The Company paid a premium over the fair value of the net tangible and identified intangible assets acquired, resulting in goodwill recorded of $6,971,000. The premium paid is attributed to MSN’s presence in the
F-21
Table of Contents
C1 INVESTMENT CORP.
Notes to the Consolidated Financial Statements—(Continued)
business communications industry and its growth potential. Goodwill recognized is deductible for income tax purposes. The results of the acquisition are included in the accompanying consolidated statements of income from the acquisition date forward.
During 2016, the Company settled the working capital adjustment provision of the purchase agreement with the sellers resulting in an increase in goodwill of $172,000, which was accounted for prospectively. In addition, the Company finalized the fair value determination of accounts payable and accrued expenses as of the acquisition date, which was accounted for prospectively. The final determination of accounts payable and accrued expenses resulted in a decrease in goodwill of $237,000.
The fair value of accounts receivable was adjusted for approximately $805,000 for amounts not expected to be collected.
The following summarizes the estimated fair value of the assets acquired and liabilities assumed (in thousands) for acquisitions completed in 2015:
| Sigmanet | Sunturn | MSN | Total | |||||||||||||
| Assets Acquired: |
||||||||||||||||
| Cash |
$ | 6,537 | $ | 1,038 | $ | 1,035 | $ | 8,610 | ||||||||
| Trade accounts receivable |
27,206 | 5,899 | 17,459 | 50,564 | ||||||||||||
| Inventories |
1,055 | — | — | 1,055 | ||||||||||||
| Prepaid expenses |
167 | 144 | 191 | 502 | ||||||||||||
| Deferred income taxes |
363 | — | — | 363 | ||||||||||||
| Property and equipment |
1,973 | 312 | 700 | 2,985 | ||||||||||||
| Goodwill |
27,820 | 2,813 | 6,971 | 37,604 | ||||||||||||
| Customer relationships |
10,336 | 4,482 | 11,493 | 26,311 | ||||||||||||
| Trademarks |
1,842 | 199 | 757 | 2,798 | ||||||||||||
| Noncompetition agreements |
164 | 86 | 351 | 601 | ||||||||||||
|
|
|
|
|
|
|
|
|
|||||||||
| Total assets acquired |
77,463 | 14,973 | 38,957 | 131,393 | ||||||||||||
|
|
|
|
|
|
|
|
|
|||||||||
| Liabilities Assumed: |
||||||||||||||||
| Accounts payable and accrued expenses |
(28,462 | ) | (5,429 | ) | (17,818 | ) | (51,709 | ) | ||||||||
| Customer deposits |
(1,072 | ) | (800 | ) | (2,322 | ) | (4,194 | ) | ||||||||
| Deferred revenue |
(78 | ) | — | — | (78 | ) | ||||||||||
|
|
|
|
|
|
|
|
|
|||||||||
| Total liabilities assumed |
(29,612 | ) | (6,229 | ) | (20,140 | ) | (55,981 | ) | ||||||||
|
|
|
|
|
|
|
|
|
|||||||||
| Net assets acquired |
$ | 47,851 | $ | 8,744 | $ | 18,817 | $ | 75,412 | ||||||||
|
|
|
|
|
|
|
|
|
|||||||||
3. Trade Accounts Receivable
The following is a roll forward of our allowance for doubtful accounts (in thousands):
| December 31, | ||||||||||||
| 2017 | 2016 | 2015 | ||||||||||
| Balance at beginning of period |
$ | 1,024 | $ | 383 | $ | 150 | ||||||
| Amounts expensed |
1,006 | 1,090 | 353 | |||||||||
| Deductions(1) |
(550 | ) | (449 | ) | (120 | ) | ||||||
|
|
|
|
|
|
|
|||||||
| Balance at end of period |
$ | 1,480 | $ | 1,024 | $ | 383 | ||||||
|
|
|
|
|
|
|
|||||||
| (1) | Deductions include actual accounts written off, net of recoveries. |
F-22
Table of Contents
C1 INVESTMENT CORP.
Notes to the Consolidated Financial Statements—(Continued)
4. Property and Equipment
Property and equipment and accumulated depreciation is as follows (in thousands):
| Estimated Useful Lives |
December 31, | |||||||||||
| 2017 | 2016 | |||||||||||
| Furniture, fixtures and equipment |
Five to 10 years | $ | 31,858 | $ | 10,413 | |||||||
| Software |
3 years | 21,172 | 14,265 | |||||||||
| Leasehold improvements |
|
Lesser of life or lease term |
|
3,855 | 1,755 | |||||||
|
|
|
|
|
|||||||||
| 56,885 | 26,433 | |||||||||||
| Less accumulated depreciation |
(20,226 | ) | (11,078 | ) | ||||||||
|
|
|
|
|
|||||||||
| $ | 36,659 | $ | 15,355 | |||||||||
|
|
|
|
|
|||||||||
5. Goodwill and Finite-Life Intangible Assets
Goodwill
The changes in the carrying amount of goodwill is as follows (in thousands):
| December 31, | ||||||||||||
| 2017 | 2016 | 2015 | ||||||||||
| Balance at beginning of period |
$ | 258,570 | $ | 244,351 | $ | 220,966 | ||||||
| Acquisitions |
74,671 | — | 23,385 | |||||||||
| Measurement period adjustments |
— | 14,219 | — | |||||||||
| Other |
(1,785 | ) | — | — | ||||||||
|
|
|
|
|
|
|
|||||||
| Balance at end of period |
$ | 331,456 | $ | 258,570 | $ | 244,351 | ||||||
|
|
|
|
|
|
|
|||||||
During the year ended December 31, 2016, goodwill increased by $14,219,000 associated with measurement period adjustments to acquisitions made in 2015. During the year ended December 31, 2017, goodwill increased by $74,671,000 associated with acquisitions made in 2017 including measurement period adjustments for those acquisitions. Measurement period adjustments were recorded prospectively under ASU 2015-16. See Note 2—Business Acquisitions for further discussion.
Finite-life Intangibles
In connection with business acquisitions the Company acquired certain customer relationships, trademarks, noncompetition agreements, and internally developed software. The Company’s management determined, based upon information available at the time of acquisition and on certain assumptions as to future operations and market considerations, the values of the finite-life intangibles as follows: trademarks, using the relief from royalty method; and customer relationships, noncompetition agreements and internally developed software using, in part, a discounted cash flow method. The amortization periods were estimated by management, considering both the economic and legal lives, as well as the expected period of benefit.
F-23
Table of Contents
C1 INVESTMENT CORP.
Notes to the Consolidated Financial Statements—(Continued)
Finite-life intangible assets consist of the following (in thousands):
| Useful Life (Years) |
Weighted-Average Remaining Life (Years)(1) |
|||||||||||||||
| December 31, | ||||||||||||||||
| 2017 | 2016 | |||||||||||||||
| Customer relationships |
$ | 208,451 | $ | 147,617 | 5-10 | 5.4 | ||||||||||
| Trademarks |
38,546 | 35,878 | 2-10 | 6.0 | ||||||||||||
| Noncompetition agreements |
6,241 | 4,276 | 1-5 | 4.4 | ||||||||||||
| Internally developed software |
541 | 541 | 10 | 6.8 | ||||||||||||
|
|
|
|
|
|||||||||||||
| 253,779 | 188,312 | |||||||||||||||
| Less accumulated amortization |
(80,137 | ) | (53,692 | ) | ||||||||||||
|
|
|
|
|
|||||||||||||
| Finite-life intangibles, net |
$ | 173,642 | $ | 134,620 | ||||||||||||
|
|
|
|
|
|||||||||||||
| (1) | As of December 31, 2017 |
During the years ended December 31, 2017, 2016 and 2015, aggregate amortization expense was $26,445,000, $22,456,000, and $20,247,000, respectively. Based on the recorded intangible assets at December 31, 2017, estimated amortization expense is expected to be as follows (in thousands):
| Years Ending December 31, |
||||
| 2018 |
$ | 34,747 | ||
| 2019 |
34,535 | |||
| 2020 |
31,190 | |||
| 2021 |
28,062 | |||
| 2022 |
23,869 | |||
| 2023 and thereafter |
21,239 | |||
|
|
|
|||
| Total |
$ | 173,642 | ||
|
|
|
|||
6. Debt
Long-term debt consists of the following (in thousands):
| December 31, | ||||||||
| 2017 | 2016 | |||||||
| Revolving line-of-credit |
$ | 20,000 | $ | — | ||||
| Term loan facility |
562,325 | — | ||||||
| First lien term loan |
— | 324,138 | ||||||
| Second lien term loan |
— | 80,000 | ||||||
|
|
|
|
|
|||||
| Total long-term debt |
582,325 | 404,138 | ||||||
| Less unamortized original issue discount |
(5,623 | ) | (2,761 | ) | ||||
| Less unamortized deferred financing costs |
(4,626 | ) | (9,089 | ) | ||||
|
|
|
|
|
|||||
| Total long-term debt, net of debt issuance costs |
572,076 | 392,288 | ||||||
| Less current maturities |
(5,652 | ) | (3,324 | ) | ||||
|
|
|
|
|
|||||
| Long-term debt, net |
$ | 566,424 | $ | 388,964 | ||||
|
|
|
|
|
|||||
F-24
Table of Contents
C1 INVESTMENT CORP.
Notes to the Consolidated Financial Statements—(Continued)
June 2017 Credit Facilities
Senior Secured Term Loan
On June 20, 2017, Holdings and our subsidiary, and direct corporate parent of Holdings, C1 Intermediate Corp. (“Intermediate”) entered into a Term Loan Agreement (the “Term Loan Agreement”) with JPMorgan Chase Bank, N.A. as the administrative agent and collateral agent. The Term Loan Agreement provides for senior secured term loans in the aggregate principal amount of $430,000,000 (the “Term Loans”). A portion of the proceeds of the Term Loans were used to repay the June 2014 Credit Facilities described below and to pay debt issuance costs. The remaining proceeds will be used for working capital needs and general corporate purposes.
Principal installments in the amount of $1,413,000 are due on the last business day of each quarter, commencing September 30, 2017, with the remaining outstanding principal amount to be paid on its maturity date of June 20, 2024.
The obligations under the Term Loan Agreement are unconditionally and irrevocably guaranteed by Intermediate and certain restricted subsidiaries of Holdings. In addition, the obligations under the Term Loan Agreement are secured by a first priority lien on substantially all assets of Holdings and each guarantor, except for the assets secured by a first priority lien under the Revolving Loan Credit Agreement discussed below, on which the Company has granted a second priority lien to secure the obligations under the Term Loan Agreement. In connection with the Term Loan Agreement, Intermediate, Holdings and its restricted subsidiaries are subject to various restrictive covenants, including, among other things, restrictions on dividends. In January, 2018, the Term Loan Agreement was amended to further define restricted payments and other terms in connection with the proposed Merger with Forum. Prepayments of principal are required under the agreement based upon a calculation of excess cash flows commencing with the year ending December 31, 2018.
The Company is permitted to repay outstanding Term Loans at any time without premium or penalty, unless such payment is made prior to June 20, 2018 in connection with a repricing transaction as described in the Term Loan Agreement, in which case the Company is required to pay a premium of 1% of the Term Loans so prepaid.
The Term Loans bear interest at 3.75% above the alternate base rate or 4.75% above the Eurodollar rate as described in the agreement. Interest on the Eurodollar rate Term Loans is payable on the last day of the Interest Period, as defined in the Term Loan Agreement, and interest on alternate base rate Term Loans is payable on the last day of each quarter. Borrowings under the Term Loans had an interest rate of 6.45% at December 31, 2017.
The Company incurred financing transaction costs of approximately $4,778,000 and an original issue discount of $4,300,000 related to the Term Loan Agreement which the Company will amortize over the term of the credit agreement.
In July, 2017, Holdings borrowed an additional $75,000,000 of term loans under an incremental amendment to the Term Loan Agreement, which loans are part of the same class of, and on the same terms as, the initial Term Loans. Proceeds from the incremental amendment were used for the Annese and SPS acquisitions, discussed in Note 2.
In October, 2017, Holdings borrowed an additional $60,000,000 of term loans under an incremental amendment to the Term Loan Agreement, which loans are part of the same class of, and on the same terms as, the initial Term Loans. Proceeds from the incremental amendment were used to acquire AOS, discussed in Note 2—Business Acquisitions.
The Company incurred financing transaction costs of approximately $2,208,000 and an original issue discount of $713,000 related to the incremental term loan joinder agreements. The Company expensed
F-25
Table of Contents
C1 INVESTMENT CORP.
Notes to the Consolidated Financial Statements—(Continued)
$1,793,000 of direct issuance costs incurred within interest expense on the consolidated statement of income and will amortize $1,128,000 over the remaining term of the credit agreement.
Senior Secured Revolving Loan Facility
On June 20, 2017, Holdings and Intermediate entered into a Revolving Loan Credit Agreement (the “Revolver Agreement”) with Wells Fargo Commercial Distribution Finance, LLC (“Wells Fargo”) as the administrative agent and collateral agent and as Floorplan Funding Agent. The Revolver Agreement provides a senior secured revolving loan facility of $150,000,000 aggregate principal amount of revolving loans and amends and restates the existing floorplan agreement with Wells Fargo in order to extend credit in the form of a floorplan subfacility. The Revolver Agreement matures on June 20, 2022.
The obligations under the Revolver Agreement are unconditionally and irrevocably guaranteed by Intermediate and certain restricted subsidiaries of Holdings. The obligations under the Revolver Agreement are secured by a first priority lien on the receivable accounts, inventory, and deposit and securities accounts, and a second priority lien on substantially all of the other assets of Holdings and each guarantor. The aggregate principal amount of the revolving loans and floorplan advances is limited to a Borrowing Base as defined by the Revolver Agreement, reduced by outstanding letters of credit. Mandatory prepayments are required in the event that the sum of the outstanding principal amount of the revolving loans, letter of credit and floorplan advances exceeds the less of (i) the aggregate revolving commitments of $150,000,000 or (ii) the Borrowing Base, in an amount equal to the excess.
The Revolver Agreement contains a number of covenants including, among other things, requirements to maintain certain financial ratios and restrictions on dividends. If the Revolving Exposure, as described in the Revolver Agreement, exceeds the less of the revolving loan commitments or the borrowing base, the Revolver Agreement requires the Company to prepay outstanding Revolving Loans in an aggregate amount equal to such excess. The Company is permitted to repay outstanding Revolving Loans at any time without premium or penalty.
Borrowings under the Revolver Agreement bear interest at rates ranging from 0.25% to 0.75% above the alternate base rate or from 1.25% to 1.75% above the Eurodollar rate as described in the Revolver Agreement, in each case based on availability under the Revolver Agreement as of such interest payment date. A commitment fee equal to 0.250% or 0.375% per annum (based on availability under the Revolver Agreement) times the average daily unused amount of the available revolving commitments is payable on the last day of each quarter.
At December 31, 2017, the Borrowing Base was $150,000,000. There were no letters of credit outstanding, the outstanding balance on the revolver was $20,000,000 and the outstanding floorplan balance was $32,322,000; therefore, the maximum borrowing available was $97,678,000 at December 31, 2017.
The Company incurred financing transaction costs of approximately $927,000 related to the Revolver Agreement which the Company will amortize over the term of the agreement.
June 2014 Credit Facilities
In June 2014, Holdings, Intermediate and certain subsidiaries of Holdings obtained financing from a loan syndication with several lenders and entered into first and second lien credit agreements containing a revolving line-of-credit commitment and two term loans totaling $270,000,000. Principal installments were due quarterly through June 17, 2020 on the first lien term loan; the second lien term loan was payable in full on June 17, 2021. The revolving line-of-credit commitment had a maximum borrowing availability of $25,000,000, which was reduced by outstanding letters of credit, through June 17, 2019, if any. In May 2015, Holdings borrowed an additional $50,000,000 under an incremental joinder agreement related to the first lien term loan.
F-26
Table of Contents
C1 INVESTMENT CORP.
Notes to the Consolidated Financial Statements—(Continued)
Borrowings under the credit agreements were secured by substantially all assets of Holdings, Intermediate and each guarantor. In connection with the credit agreements, Holdings, Intermediate and each guarantor were subject to various restrictive covenants, including, among other things, requirements to maintain certain financial ratios and restrictions on dividends. Prepayments of principal were required under the agreements for the first lien and second lien term loans based upon a calculation of excess cash flows commencing with the year ending December 31, 2015. There were no prepayments of principal required at December 31, 2015 or 2016.
Advances under the revolving line of credit bore interest at 4.00% (applicable margin) above the base rate or 5.00% above the Eurocurrency rate as defined in the agreement. Borrowings under the first and second lien term loans bore interest at 4.00% and 7.00%, respectively, above the base rate or 5.00% and 8.00%, respectively, above the Eurocurrency rate as defined in the agreement. Interest is payable on the last day of the interest period as defined in the agreements.
In October 2016, the first and second lien credit agreements including the revolving line-of-credit commitment were amended. Holdings borrowed an additional $90,000,000 on the first lien term loan. Interest on borrowings under the first and second lien term loans increased to 4.375% and 8.00%, respectively, above the base rate or 5.375% and 9.00%, respectively, above the Eurocurrency rate as defined in the agreements. Principal installments on the first lien term loan increased to $831,000 payable quarterly through June 17, 2020. The maximum borrowing availability of the revolver increased $40,000,000 to $65,000,000. There was no change in the maturity dates. The additional funds borrowed were used to pay dividends to Class A Common stockholders as discussed in Note 7—Stockholders’ Equity (Deficit).
Certain lenders did not participate in the amendment to the credit agreements, therefore the amendment was accounted for as a debt modification with respect to amounts that remained in the syndicate and debt extinguishment with respect to the amounts that exited the syndicate. In accordance with the applicable accounting guidance for debt modification and extinguishment, and for interest costs accounting, the Company expensed $1,470,000 in extinguishment costs incurred, the remaining unamortized debt issuance costs of $989,000 and the remaining unamortized original issue discount of $288,000 relating to the amounts that exited the syndicate and amounts considered “substantially different.” The Company reported these expenses within interest expense on the consolidated statement of income for the year ended December 31, 2016.
The Company incurred financing transaction costs of approximately $6,068,000 related to the amendments and an original issue discount $1,350,000. In accordance with the accounting for debt modification, the Company expensed $1,739,000 of direct issuance costs incurred within interest expense on the consolidated statement of income and will amortize $5,679,000 over the remaining term of the credit agreement.
In March 2017, the Company entered into an incremental term loan joinder agreement with its lender to increase the first lien term loan commitments in an aggregate amount of $50,000,000, subject to various terms and conditions. The interest rates, security agreement, restrictive covenants, and maturity date was the same as the outstanding first lien term loans. There was a commitment fee for the unused portion of the incremental term loan.
The Company incurred financing transaction costs of approximately $703,000 related to the incremental term loan joinder agreement. The Company expensed $556,000 of direct issuance costs incurred within interest expense on the consolidated statement of income and will amortize $147,000 over the remaining term of the credit agreement.
The Company made an initial $10,000,000 draw under the new agreement for working capital purposes in March 2017 and received proceeds of $9,353,000, net of related fees and expenses.
Borrowings under the first and second lien term loans had interest rates of 6.00% and 9.00%, respectively, at December 31, 2015. Borrowings under the first and second lien term loans had interest rates of 6.375% and 10.00%, respectively, at December 31, 2016. The interest rate on the revolving line-of-credit balance was 6.00% as of December 31, 2015 and 2016, but can vary depending upon whether the Company elects to use the
F-27
Table of Contents
C1 INVESTMENT CORP.
Notes to the Consolidated Financial Statements—(Continued)
Eurocurrency rate or the base rate. A commitment fee is charged at 0.50% on the amount by which the revolving line-of-credit commitment exceeds the outstanding line-of-credit balance. There were no letters of credit outstanding at either December 31, 2015 or 2016; therefore, the maximum borrowing available was $25,000,000 at December 31, 2015 and $65,000,000 at December 31, 2016.
On June 20, 2017, concurrent with entering into the Term Loan Agreement and Revolver Agreement, we terminated the June 2014 Credit Facilities including the first and second lien credit agreements containing a revolving line-of-credit commitment. We accounted for this termination as debt extinguishment and in accordance with the applicable accounting guidance for debt modification and extinguishment, and for interest costs accounting, the Company expensed $3,353,000 in extinguishment costs incurred, the remaining unamortized debt issuance costs of $2,388,000 and the remaining unamortized original issue discount of $7,897,000 relating to the June 2014 Credit Facilities. The Company reported these expenses within interest expense on the consolidated statement of income for the year ended December 31, 2017.
Floor Planning Facilities
In February 2016, a distribution financing agreement was signed with GE Commercial Distribution Finance Corporation (“GE”), for financing inventory purchases. The agreement provided for a $10,000,000 credit limit collateralized by certain accounts receivable balances. Advances under the agreement must be paid within 60 days or by the end of the free flooring period (which ranges from 45-90 days) to avoid interest charges. Any balances not paid within the terms would accrue interest at prime rate but not less than 4.25% plus 0.50%. In March 2016, Wells Fargo & Company purchased GE and a new agreement was signed with Wells Fargo Commercial Distribution Finance, LLC (“Wells Fargo”), in April 2016 with a base credit line of $20,000,000. The outstanding balance at December 31, 2016 was $9,677,000 and is included in accounts payable on the consolidated balance sheets.
In March 2017, the Company amended and restated the foregoing existing floor planning facilities with Wells Fargo pursuant to an amended and restated inventory financing agreement. The agreement allowed for the purchase of inventory up to certain limitations of eligible accounts receivable and inventory balances. Advances under the agreement are collateralized by accounts receivable and inventory subject to the agreement. The facility available to the Company under the agreement is a discretionary facility with a former base credit line of up to $65,000,000. Advances under the agreement must have been paid within 60 days or by the end of the free flooring period (which ranges from 45-90 days) to avoid interest charges. Any balances not paid within the terms would accrue interest at the prime rate but not less than 4.25% plus 0.50%.
On June 20, 2017, concurrent with entering into the Revolver Agreement, the Company amended and restated the foregoing existing floor planning facilities with Wells Fargo to extend credit in the form of floorplan advances up to an aggregate principal amount of $150,000,000. If advances under the agreement are not paid within 60 days or by the end of the free flooring period (which ranges from 45-90 days), the floorplan advance automatically converts to a revolving loan subject to terms under the Revolver Agreement.
The outstanding balance of floorplan advances at December 31, 2017 was $32,322,000 and is included in accounts payable on the consolidated balance sheets.
Debt Issuance Costs
The Company amortizes original issue discount and deferred financing costs (debt issuance cost) using the effective interest method over the life of the related instrument, and such amortization is included in interest expense in the consolidated statements of income.
F-28
Table of Contents
C1 INVESTMENT CORP.
Notes to the Consolidated Financial Statements—(Continued)
Debt issuance costs are as follows (in thousands):
| Revolving Line of Credit |
Term Loan | First Lien Term Loan |
Second Lien Term Loan |
Total | ||||||||||||||||
| Balance as of December 31, 2014 |
$ | 321 | $ | — | $ | 6,873 | $ | 3,276 | $ | 10,470 | ||||||||||
| Additions |
— | 1,418 | — | 1,418 | ||||||||||||||||
| Amortization |
(72 | ) | (1,449 | ) | (507 | ) | (2,028 | ) | ||||||||||||
|
|
|
|
|
|
|
|
|
|
|
|||||||||||
| Balance as of December 31, 2015 |
249 | — | 6,842 | 2,769 | 9,860 | |||||||||||||||
| Additions |
2,393 | — | 2,567 | 719 | 5,679 | |||||||||||||||
| Extinguishment |
— | — | (35 | ) | (1,242 | ) | (1,277 | ) | ||||||||||||
| Amortization |
(253 | ) | — | (1,675 | ) | (484 | ) | (2,412 | ) | |||||||||||
|
|
|
|
|
|
|
|
|
|
|
|||||||||||
| Balance as of December 31, 2016 |
2,389 | — | 7,699 | 1,762 | 11,850 | |||||||||||||||
| Additions |
927 | 10,206 | 147 | — | 11,280 | |||||||||||||||
| Extinguishment |
(1,933 | ) | — | (6,775 | ) | (1,577 | ) | (10,285 | ) | |||||||||||
| Amortization |
(554 | ) | (786 | ) | (1,071 | ) | (185 | ) | (2,596 | ) | ||||||||||
|
|
|
|
|
|
|
|
|
|
|
|||||||||||
| Balance as of December 31, 2017 |
$ | 829 | $ | 9,420 | $ | — | $ | — | $ | 10,249 | ||||||||||
|
|
|
|
|
|
|
|
|
|
|
|||||||||||
Long-term Debt Maturities
The approximate future principal payments on long-term debt at December 31, 2017, is as follows (in thousands):
| Years Ending December 31, |
Debt | |||
| 2018 |
$ | 5,652 | ||
| 2019 |
5,652 | |||
| 2020 |
5,652 | |||
| 2021 |
5,652 | |||
| 2022 |
5,652 | |||
| 2023 and thereafter |
534,065 | |||
|
|
|
|||
| Total |
562,325 | |||
| Revolving line-of-credit |
20,000 | |||
| Less unamortized debt issuance costs |
(10,249 | ) | ||
|
|
|
|||
| Total debt |
$ | 572,076 | ||
|
|
|
|||
7. Stockholders’ Equity (Deficit)
The Company has two classes of common stock authorized, Class A and Class B.
Voting
Except as otherwise expressly provided in the Company’s Amended and Restated Certificate of Incorporation, or the Restated Certificate, each holder of Class A Common Stock is entitled to one vote per share. Except as provided by law and in the event of any increase or decrease in the number of authorized shares of Class B Common Stock, the holders of Class B Common Stock have no voting rights.
Conversion
Each share of Class B Common Stock will automatically convert into one share of Class A Common Stock immediately prior to the closing of a firmly underwritten public offering, or a Public Offering, of the Company’s
F-29
Table of Contents
C1 INVESTMENT CORP.
Notes to the Consolidated Financial Statements—(Continued)
common stock. Class B Common Stock will continue to be subject to vesting conditions as discussed below. Upon such automatic conversion, any declared and unpaid dividends shall be paid in accordance with the Restated Certificate.
Dividends
The holders of the Class A Common Stock are entitled to receive dividends in preference to the holders of the Class B Common Stock until the holders of the Class A Common Stock have received at least $1.00 per share (as adjusted for any stock dividends, combinations, splits, recapitalizations and the like with respect to such shares), or the Original Issue Price. After the payment of the Class A preferential dividends, the holders of the Class A Common Stock and Class B Common Stock are entitled to share equally, on a per share basis, in all dividends declared by the Board of Directors.
On October 17, 2016, the Board of Directors declared a dividend payable to Class A Common stockholders in the cumulative amount of approximately $89,862,000. The dividend was paid in conjunction with the amendment to the first and second lien credit agreements and thus, permitted by the lenders. The dividends paid exceeded the Company’s retained earnings at the time of declaration by $80,925,000 and, as a result, the excess was recorded as a reduction to paid-in-capital. As a result of such dividend, the holders of the Class A Common Stock are no longer entitled to receive any preferential dividends or preferential amounts in the event of any liquidation, dissolution, winding up or change of control transaction.
Restricted Class B Common Stock
In June 2014, we issued 11,674,430 shares of Class B Common Stock to employees and members of the Board of Directors in connection with the acquisition of Holdings. These shares are subject to vesting and the shares are subject to a repurchase right held by us, as further described below. These shares of Class B Common Stock were issued to each holder as 50% Tranche 1 shares, 25% Tranche 2 shares and 25% Tranche 3 shares.
The shares of Class B Common Stock were valued at the estimated fair value at the time of issuance and are being amortized as compensation expense on a straight-line basis over the period in which they are earned by the individuals. The grant-date fair value of our awards was calculated using the Black-Scholes option-pricing model with the weighted-average assumptions listed in Note 8—Stock-based Compensation.
The fair value of the common stock has historically been determined by management, in part, based upon periodic valuation studies obtained from a third party valuation firm. In performing our valuation, the valuation firm engaged in discussions with management, analyzed historical and forecasted financial statements, and reviewed corporate documents. In addition, these valuation studies were based on a number of assumptions, including industry, general economic and market conditions that could reasonably be evaluated at the time of the valuation.
Tranche 1 shares vest over a five-year period; 40% vest on the two-year anniversary of issuance, and the balance vest ratably over the remaining three-year period, subject to the holder’s continuous service to the Company as of such vesting date. In the event of a change in control and if the holder’s employment with the Company is terminated without cause or the holder resigns for good reason within 24 months following the change in control, the vesting of 100% of the Tranche 1 shares will accelerate.
Tranche 2 shares vest on the day prior to the ten-year anniversary of issuance, subject to the holder’s continuous service to the Company as of such vesting date. Subject to the holder’s continuous service to the Company as of the date immediately prior to such event, the vesting of 100% of the Tranche 2 shares will accelerate in the event of any change in control or Public Offering Sale in which Clearlake receives gross proceeds in such transaction in consideration for the shares of Class A Common Stock held by Clearlake that
F-30
Table of Contents
C1 INVESTMENT CORP.
Notes to the Consolidated Financial Statements—(Continued)
exceeds two times the amount of paid-in capital received by the Company from Clearlake, plus any accrued and unpaid dividends, less any declared and paid cash dividends with respect to the Class A Common Stock issued to Clearlake. Public Offering Sale shall mean the consummated sale of shares of the Company by Clearlake for its own account pursuant to the Public Offering, together with all consummated secondary sales and/or public offerings of the Company’s shares by Clearlake.
Tranche 3 shares vest on the day prior to the ten-year anniversary of issuance, subject to the holder’s continuous service to the Company as of such vesting date. Subject to the holder’s continuous service to the Company as of the date immediately prior to such event, the vesting of 100% of the Tranche 3 shares will accelerate in the event of any change in control or Public Offering Sale in which Clearlake receives gross proceeds in such transaction in consideration for the shares of Class A Common Stock held by Clearlake that exceeds 2.5 times the amount of paid-in capital received by the Company from Clearlake, plus any accrued and unpaid dividends, less any declared and paid cash dividends with respect to the Class A Common Stock issued to Clearlake.
Upon the termination of continuous service of a holder, other than termination by the Company without cause, the holder’s death or permanent disability, or resignation by holder following certain reductions in salary, the Company may repurchase the Class B shares held by such holder at a price of $0.01 per share.
Upon the termination of continuous service of a holder by the Company with cause, the Company may repurchase the Class B shares held by such holder at a price of $0.01 per share.
Upon the termination of continuous service of a holder by the Company without cause, following the holder’s death or permanent disability, or resignation by holder following certain reductions in salary, the Company may repurchase the unvested Class B shares at a price of $0.01 per share and the Company may repurchase the vested Class B shares at a price equal to the fair market value of such shares.
Upon closing of the Merger on February 22, 2018, all of the Company’s shares of Class B Common Stock became fully vested and exercisable.
Restricted Class A Common Stock
In June 2014, the Company issued 4,208,258 shares of Class A Common Stock to employees and members of the Board of Directors in connection with the acquisition of Holdings. These shares are subject to a repurchase right held by us.
Upon the termination of continuous service of a holder, other than termination by the Company without cause, the holder’s death or permanent disability, or resignation by holder following certain reductions in salary, the Company may repurchase the Class A shares held by such holder at a price of $1.00 per share.
Upon the termination of continuous service of a holder by the Company with cause, the Company may repurchase the Class A shares held by such holder at a price of $1.00 per share.
Upon the termination of continuous service of a holder by the Company without cause, following the holder’s death or permanent disability, or resignation by holder following certain reductions in salary, the Company may repurchase the Class A shares at a price equal to $1.00 per share, plus 5% of $1.00 per share measured per annum (on a non-compounding basis) measured from the issuance date through such termination date.
The repurchase right with respect to the Class A shares shall lapse and terminate immediately following a public offering or change in control.
F-31
Table of Contents
C1 INVESTMENT CORP.
Notes to the Consolidated Financial Statements—(Continued)
See Note 8—Stock-based Compensation regarding a summary of shares vested during the periods presented in the financial statements.
8. Stock-based Compensation
The Company’s 2014 Equity Incentive Plan, or the Plan, provides for the issuance of incentive stock options, nonqualified stock options, stock appreciation rights, restricted shares, and other awards.
Pursuant to the Plan, the Company issued options to purchase Class B Common Stock in 2014 to management employees in connection with the acquisition of Holdings. Additional options were issued to employees, consultants and non-employee members of the Board of Directors in 2017, 2016 and 2015. All options are subject to vesting and subject to future services to be rendered to the Company.
Certain of the options allow for early exercise, and the shares acquired via early exercise of the options are subject to continued vesting and a repurchase right held by us.
As of December 31, 2017 and 2016, there were 5,517,524 shares and 4,952,155 shares of Class B Common Stock reserved for issuance under the Plan, respectively. As of December 31, 2017 and 2016, 5,517,524 shares and 4,902,155 shares, net of forfeitures were granted, respectively. As of December 31, 2017, there are no shares remaining for future grants.
Options
The Company’s option awards are typically issued with one of three vesting schedules: Tranche 1, Tranche 2 and Tranche 3.
Tranche 1 options vest and become exercisable over a five-year period; 40% vest on the two-year anniversary of issuance, and the balance vest ratably over the remaining three-year period, subject to the holder’s continuous service to the Company as of such vesting date.
Tranche 2 options vest and become exercisable on the day prior to the ten-year anniversary of issuance, subject to the holder’s continuous service to the Company as of such vesting date. Subject to the holder’s continuous service to the Company as of the date immediately prior to such event, the vesting of 100% of the Tranche 2 shares will accelerate in the event of any change in control or Public Offering Sale in which Clearlake receives gross proceeds in such transaction in consideration for the shares of Class A Common Stock held by Clearlake that exceeds two times the amount of paid-in capital received by the Company from Clearlake, plus any accrued and unpaid dividends, less any declared and paid cash dividends with respect to the Class A Common Stock issued to Clearlake.
Tranche 3 options vest and become exercisable on the day prior to the ten-year anniversary of issuance, subject to the holder’s continuous service to the Company as of such vesting date. Subject to the holder’s continuous service to the Company as of the date immediately prior to such event, the vesting of 100% of the Tranche 3 shares will accelerate in the event of any change in control or Public Offering Sale in which Clearlake receives gross proceeds in such transaction in consideration for the shares of Class A Common Stock held by Clearlake that exceeds 2.5 times the amount of paid-in capital received by the Company from Clearlake, plus any accrued and unpaid dividends, less any declared and paid cash dividends with respect to the Class A Common Stock issued to Clearlake.
Upon closing of the Merger on February 22, 2018, all of the Company’s options to purchase shares of Class B Common Stock became fully vested and exercisable.
Equity awards were valued at their estimated fair value at the time of issuance and are being amortized as compensation expense on a straight-line basis over the period in which they are earned by the individuals. The
F-32
Table of Contents
C1 INVESTMENT CORP.
Notes to the Consolidated Financial Statements—(Continued)
grant-date fair value of our option grants was calculated using the Black-Scholes option-pricing model with the following weighted-average assumptions:
| Year Ended December 31, |
||||||||
| 2017 | 2016 | |||||||
| Expected life (in years) |
8.8 | 8.6 | ||||||
| Expected volatility |
42.8 | % | 43.1 | % | ||||
| Dividend yield |
0.0 | % | 0.0 | % | ||||
| Risk-free interest rate |
2.1 | % | 2.1 | % | ||||
As of December 31, 2017 and 2016, outstanding Tranche 1 options to purchase Class B common stock issued to certain employees and directors were 261,000 and 219,000, respectively, of which 95,000 were vested as of December 31, 2017.
As of December 31, 2017 and 2016, options to purchase Class B Common Stock that only vest upon the Company experiencing a change of control or Public Offering Sale and provide a return of value when Clearlake achieves an exit return target, or otherwise cliff vest after 10 years from issuance, as described above, were 1,266,000 and 1,254,000, respectively.
A summary of the stock option activity is presented below (in thousands, except per share amounts):
| Shares Underlying Options |
Weighted- Average Exercise Price |
Weighted- Average Grant-Date Fair Value |
Aggregate Intrinsic Value(1) |
Weighted- Average Remaining Contract Term (Years) |
||||||||||||||||
| Balance at January 1, 2015 |
1,864 | $ | 0.01 | $ | 0.15 | $ | — | 9.9 | ||||||||||||
| Granted |
1,057 | 0.01 | 0.15 | |||||||||||||||||
| Forfeited |
(210 | ) | 0.01 | 0.15 | ||||||||||||||||
| Exercised |
(1,961 | ) | 0.01 | 0.15 | ||||||||||||||||
|
|
|
|||||||||||||||||||
| Balance at December 31, 2015 |
750 | 0.01 | 0.15 | $ | 1,208 | 8.8 | ||||||||||||||
| Granted |
773 | 1.62 | 0.82 | |||||||||||||||||
| Forfeited |
(50 | ) | 1.62 | 0.87 | ||||||||||||||||
|
|
|
|||||||||||||||||||
| Balance at December 31, 2016 |
1,473 | 0.80 | 0.48 | $ | 3,829 | 8.5 | ||||||||||||||
| Granted |
616 | 3.40 | 1.63 | |||||||||||||||||
| Forfeited |
(30 | ) | 0.01 | 0.15 | ||||||||||||||||
| Exercised |
(531 | ) | 3.40 | 1.66 | ||||||||||||||||
|
|
|
|||||||||||||||||||
| Balance at December 31, 2017 |
1,528 | $ | 0.96 | $ | 0.54 | $ | 7,319 | 7.6 | ||||||||||||
|
|
|
|||||||||||||||||||
| Fully vested and expected to vest at December 31, 2017 |
1,479 | $ | 0.93 | $ | 0.52 | $ | 7,124 | 7.6 | ||||||||||||
| Exercisable at December 31, 2017 |
95 | $ | 1.62 | $ | 0.66 | $ | 169 | 8.1 | ||||||||||||
| (1) | Aggregate intrinsic value represents the difference between the estimated fair value of the underlying common stock and the exercise price of outstanding, in-the-money options at the date of measurement. |
The table above includes approximately 529,000 options granted to a non-employee in January 2015 for services rendered, all of which were early exercised during the year ended December 31, 2015.
F-33
Table of Contents
C1 INVESTMENT CORP.
Notes to the Consolidated Financial Statements—(Continued)
The activity of the unvested options is presented below (in thousands, except per share amounts):
| Shares Underlying Options |
Weighted- Average Grant- Date Fair Value Per Option |
|||||||
| Balance at January 1, 2015 |
1,864 | $ | 0.15 | |||||
| Granted |
1,057 | 0.15 | ||||||
| Vested |
— | |||||||
| Forfeited |
(210 | ) | 0.15 | |||||
| Exercised |
(1,961 | ) | 0.15 | |||||
|
|
|
|||||||
| Balance at December 31, 2015 |
750 | 0.15 | ||||||
| Granted |
773 | 0.82 | ||||||
| Vested |
(15 | ) | 0.65 | |||||
| Forfeited |
(50 | ) | 0.87 | |||||
|
|
|
|||||||
| Balance at December 31, 2016 |
1,458 | 0.47 | ||||||
| Granted |
616 | 1.63 | ||||||
| Vested |
(80 | ) | 0.66 | |||||
| Exercised |
(531 | ) | 1.66 | |||||
|
|
|
|||||||
| Balance at December 31, 2017 |
1,463 | $ | 0.52 | |||||
|
|
|
|||||||
Class B Common Stock
As of December 31, 2017 and 2016, 7,415,336 shares of Class B Common Stock vest upon the Company experiencing a change of control or Public Offering and provide a return of value when Clearlake achieves an exit return target, or otherwise cliff vest after 10 years from issuance, as described above.
The activity for Class B common stock is presented below (in thousands, except per share amounts):
| Shares | Weighted- Average Grant- Date Fair Value Per Share |
|||||||
| Unvested and outstanding at January 1, 2015 |
13,142 | $ | 0.15 | |||||
| Granted or issued |
1,961 | 0.15 | ||||||
| Vested |
— | |||||||
| Repurchased |
(401 | ) | 0.15 | |||||
|
|
|
|||||||
| Unvested and outstanding at December 31, 2015 |
14,702 | |||||||
| Vested |
(2,835 | ) | 0.15 | |||||
|
|
|
|||||||
| Unvested and outstanding at December 31, 2016 |
11,867 | 0.15 | ||||||
| Granted |
531 | 1.66 | ||||||
| Vested |
(1,402 | ) | 0.15 | |||||
| Repurchased |
(402 | ) | 0.15 | |||||
|
|
|
|||||||
| Unvested and outstanding at December 31, 2017 |
10,594 | $ | 0.23 | |||||
|
|
|
|||||||
The table above includes approximately 529,000 shares issued to a non-employee upon early exercise of his stock options during the year ended December 31, 2015. Of these shares, 158,618 and 105,745 were vested as of December 31, 2017 and 2016, respectively.
F-34
Table of Contents
C1 INVESTMENT CORP.
Notes to the Consolidated Financial Statements—(Continued)
Expense
During the years ended December 31, 2017, 2016 and 2015, total estimated fair value of share awards and options granted to purchase Class B Common Stock was $1,000,000, $636,000, and $88,000, respectively. Compensation expense recognized for equity awards for the years ended December 31, 2017, 2016 and 2015, was $1,289,000, $1,057,000 and $233,000, respectively. At December 31, 2017, there was $4,048,000, of unrecognized expense related to nonvested equity awards. Upon closing of the Merger on February 22, 2018, the full amount of unrecognized stock-compensation expense was recognized.
Included within compensation expense are amounts related to a 2015 non-employee stock option grant, which is re-measured at the end of each reporting period until all options are vested, which accounted for $835,000, $538,000, and $8,000, during the years ended December 31, 2017, 2016 and 2015, respectively. The increase in 2017 and 2016 is due to an increase in the underlying fair value of the Company’s common stock, one of the specific assumptions used as an input to the Black-Scholes pricing model, which is updated quarterly for the re-measurement of the non-employee stock options. The fair value of the Company’s common stock increased during 2017 and 2016 as a result of the integration of several acquisitions made in 2017 and 2015 and growth in gross profit and revenues. At December 31, 2017, there was $1,655,000 of unrecognized expense related to non-employee nonvested equity awards which was recognized upon closing of the Merger on February 22, 2018.
9. Net Income (Loss) per Share
The Company applies the two-class method of computing net income (loss) per share in which net income (loss) is allocated to the two classes of common stock in the same fashion as dividends are distributed. The holders of the Class A Common Stock are entitled to receive dividends in preference to the holders of the Class B Common Stock as discussed above. After the payment of the Class A preferential dividends, the holders of the Class A and Class B Common Stock are entitled to share equally, on a per share basis, in all dividends declared by the Board of Directors. As a result of the cash dividend paid in October 2016, the holders of the Class A Common Stock are no longer entitled to receive any preferential dividends or preferential amounts in the event of any liquidation, dissolution, winding up or change of control transaction. Shares of Class B Common Stock are considered participating securities subsequent to the dividend payment in October 2016 for computation of net income (loss) per share.
Prior to October 2016, holders of Class B Common Stock did not participate as they were not entitled to receive dividends since holders of Class A Common Stock had not received the full preferential dividends. Class A common stockholders received their preferential dividend of $89,862,000 in October 2016 resulting in an excess dividend above earnings and a theoretical net loss attributable solely to Class A common stockholders of $81,513,000 for the year ended December 31, 2016. Class B common stockholders do not participate in a loss.
F-35
Table of Contents
C1 INVESTMENT CORP.
Notes to the Consolidated Financial Statements—(Continued)
The following is a reconciliation of the weighted-average number of shares used to compute basic and diluted net income (loss) per share (in thousands, except per share amounts):
| Year Ended December 31, |
||||||||||||
| 2017 | 2016 | 2015 | ||||||||||
| Numerator : |
||||||||||||
| Net income (loss) attributable to Class A common stockholders |
$ | (8,021 | ) | $ | 8,349 | $ | 4,023 | |||||
| Denominator: |
||||||||||||
| Weighted-average Class A common shares—basic |
89,778 | 89,862 | 89,866 | |||||||||
| Effect of dilutive securities: |
||||||||||||
| Stock options and non-vested shares |
— | — | — | |||||||||
|
|
|
|
|
|
|
|||||||
| Weighted-average Class A common shares—diluted |
89,778 | 89,862 | 89,866 | |||||||||
|
|
|
|
|
|
|
|||||||
| Net income (loss) per share attributable to Class A common stockholders, basic and diluted |
$ | (0.09 | ) | $ | 0.09 | $ | 0.04 | |||||
|
|
|
|
|
|
|
|||||||
Had the distributions been made in prior years, the net income per share for the year ended December 31, 2016, considering both A and B common stock, would have been $0.09. There were no Class A dilutive securities for the years ended December 31, 2017 and 2016.
10. Fair Value Measurements
For certain of the Company’s financial instruments, including cash, accounts receivables, accounts payable, and accrued expenses, the carrying value approximates fair value due to the short-term maturities of these instruments.
Contingent consideration resulting from the acquisition of Annese on July 14, 2017, is recorded at fair value of approximately $956,000 as of December 31, 2017. The fair value of the contingent consideration liability was estimated using significant other unobservable inputs (Level 3 of the fair value hierarchy) based upon a risk-adjusted present value of the expected payments by us.
The fair value of the Company’s long-term debt as of December 31, 2017 and 2016 approximates the carrying value of $582,325,000 and, $404,138,000 respectively. The Company uses significant other unobservable inputs to estimate fair value (Level 3 of the fair value hierarchy) of long-term debt based on the present value of future cash flows, interest rates, maturities and collateral requirements available for companies with similar credit ratings.
For certain of the Company’s nonfinancial assets, including goodwill, intangible assets and property and equipment, the Company may be required to assess the fair values of these assets, on a recurring or nonrecurring basis, and record an impairment if the carrying value exceeds the fair value. In determining the fair value of these assets, the Company may use a combination of valuation methods, which include Level 3 inputs. For the periods presented, there were no impairment charges. See Notes 1—Nature of Business and Summary of Significant Accounting Policies and 5—Goodwill and Finite-Life Intangible Assets for additional information regarding the Company’s determination of fair value regarding goodwill and indefinite-lived intangible assets.
In conjunction with the acquisitions discussed in Note 2—Acquisitions, the Company used a combination of valuation methods which include Level 3 inputs in determining the fair values of the assets and liabilities acquired as well as the fair value of the consideration transferred.
F-36
Table of Contents
C1 INVESTMENT CORP.
Notes to the Consolidated Financial Statements—(Continued)
11. Major Vendors and Economic Dependence
The Company has numerous technology partners whose communication products are purchased and resold. Although the Company purchases from a diverse vendor base, products manufactured by two of our vendors, Avaya Inc. (“Avaya”) and Cisco Systems, Inc., represented 21% and 39%, respectively, of the Company’s technology offerings revenue for the year ended December 31, 2017, 30% and 29%, respectively, for the year ended December 31, 2016, and 41% and 25%, respectively, for the year ended December 31, 2015. Avaya related revenue represented 23%, 27% and 33% of the Company’s total consolidated revenue for the years ended December 31, 2017, 2016 and 2015, respectively.
Avaya filed for reorganization under Chapter 11 in January, 2017. Avaya successfully completed a balance sheet restructuring and emerged from bankruptcy proceedings in the fourth quarter of 2017. In January, 2018, Avaya successfully completed an initial public offering and their stock began trading publically. Management continues to evaluate the impact that Avaya’s reorganization has had on the Company’s results of operations and financial condition.
The Company has one distributor that supplies a significant portion of its Avaya communication products. At December 31, 2017 and 2016, the Company owed $28,000,000 and $27,000,000, respectively, to this distributor.
12. Operating Leases
The Company leases office and warehouse space and vehicles under operating lease agreements that expire on various dates through 2026.
Approximate future minimum annual rental commitments under these operating leases as of December 31, 2017 are as follows (in thousands):
| Years Ending December 31, |
Amount | |||
| 2018 |
$ | 8,176 | ||
| 2019 |
5,978 | |||
| 2020 |
4,661 | |||
| 2021 |
3,830 | |||
| 2022 |
3,175 | |||
| 2023 and thereafter |
3,964 | |||
|
|
|
|||
| Total |
$ | 29,784 | ||
|
|
|
|||
Rent expense was $5,402,000, $4,648,000 and $3,360,000 for the years ended December 31, 2017, 2016 and 2015, respectively.
13. Employee Benefit Plans
The Company sponsors defined contribution plans for substantially all employees. Annual Company contributions under the plans are discretionary. Company contribution expense during the years ended December 31, 2017, 2016 and 2015 was $4,009,000, $2,965,000 and $2,400,000, respectively.
14. Employment Contracts and Bonus Plans
The Company has entered into employment contracts with certain officers that require an annual salary plus a bonus amount based on meeting certain business plan and financial objectives. In addition, the agreements contain provisions for severance payments under certain termination conditions.
F-37
Table of Contents
C1 INVESTMENT CORP.
Notes to the Consolidated Financial Statements—(Continued)
15. Income Taxes
On December 22, 2017, H.R. 1, originally known as the Tax Cuts and Jobs Act (“Tax Legislation”) was signed into law making significant changes to the Internal Revenue Code. Changes include, but are not limited to, a permanent reduction of the U.S. corporate income tax rate from 35% to 21% effective January 1, 2018. For the year ended December 31, 2017, the enactment of the Tax Legislation resulted in a one-time non-cash tax benefit of $9,812,000 related to the re-measurement of net U.S. deferred tax liabilities at the lower enacted corporate tax rate. The Company is not materially impacted by any other Tax Legislation changes for the year ended December 31, 2017.
The provision for income taxes charged to operations consists of the following (in thousands):
| Year Ended December 31, |
||||||||||||
| 2017 | 2016 | 2015 | ||||||||||
| Current |
||||||||||||
| Federal |
$ | (10,689 | ) | $ | 9,535 | $ | 5,170 | |||||
| State |
(611 | ) | 1,246 | 1,321 | ||||||||
|
|
|
|
|
|
|
|||||||
| (11,300 | ) | 10,781 | 6,491 | |||||||||
| Deferred |
||||||||||||
| Federal |
(7,374 | ) | (2,445 | ) | (2,595 | ) | ||||||
| State |
(674 | ) | (1,620 | ) | (322 | ) | ||||||
|
|
|
|
|
|
|
|||||||
| (8,048 | ) | (4,065 | ) | (2,917 | ) | |||||||
|
|
|
|
|
|
|
|||||||
| $ | (19,348 | ) | $ | 6,716 | $ | 3,574 | ||||||
|
|
|
|
|
|
|
|||||||
The following schedule reconciles the differences between the U.S. federal income taxes at the U.S. statutory rate and our income tax expense (in thousands):
| Year Ended December 31, |
||||||||||||||||||||||||
| 2017 | 2016 | 2015 | ||||||||||||||||||||||
| Statutory federal income tax rate |
$ | (9,579 | ) | 35.0% | $ | 5,273 | 35.0% | $ | 2,659 | 35.0% | ||||||||||||||
| Increase (decrease) in income taxes resulting from: |
||||||||||||||||||||||||
| State income taxes, net of federal income tax effect |
(896 | ) | 3.3 | 857 | 5.7 | 567 | 7.4 | |||||||||||||||||
| Nondeductible expenses |
786 | (2.9 | ) | 858 | 5.7 | 280 | 3.7 | |||||||||||||||||
| Deferred rate change |
(31 | ) | 0.1 | 370 | 2.4 | — | — | |||||||||||||||||
| Acquisition accounting adjustment |
— | — | (351 | ) | (2.3 | ) | — | — | ||||||||||||||||
| Federal tax reform deferred tax impact |
(9,812 | ) | 35.9 | — | — | — | — | |||||||||||||||||
| Other |
184 | (0.7 | ) | (291 | ) | (1.9 | ) | 68 | 0.9 | |||||||||||||||
|
|
|
|
|
|
|
|
|
|
|
|
|
|||||||||||||
| Effective tax rate |
$ | (19,348 | ) | 70.7% | $ | 6,716 | 44.6% | $ | 3,574 | 47.0% | ||||||||||||||
|
|
|
|
|
|
|
|
|
|
|
|
|
|||||||||||||
F-38
Table of Contents
C1 INVESTMENT CORP.
Notes to the Consolidated Financial Statements—(Continued)
Deferred income tax assets and liabilities consist of the following components (in thousands):
| December 31, | ||||||||
| 2017 | 2016 | |||||||
| Deferred Tax Assets: |
||||||||
| Trade accounts receivable |
$ | 658 | $ | 619 | ||||
| Inventories |
184 | 262 | ||||||
| Other deferred tax assets |
584 | 494 | ||||||
| Accrued compensation |
2,590 | 2,960 | ||||||
| Deferred revenue |
4,449 | 1,786 | ||||||
| Debt financing costs |
— | 382 | ||||||
| Net operating loss carryforwards |
2,014 | 1,885 | ||||||
|
|
|
|
|
|||||
| Total deferred tax assets |
10,479 | 8,388 | ||||||
|
|
|
|
|
|||||
| Deferred Tax Liabilities: |
||||||||
| Prepaid expenses and deferred customer support contract costs |
3,438 | 4,009 | ||||||
| Other |
68 | 132 | ||||||
| Property and equipment |
3,459 | 2,872 | ||||||
| Goodwill and finite-life intangibles |
21,570 | 39,216 | ||||||
|
|
|
|
|
|||||
| Total deferred tax liabilities |
28,535 | 46,229 | ||||||
|
|
|
|
|
|||||
| Total net deferred tax liabilities |
$ | (18,056 | ) | $ | (37,841 | ) | ||
|
|
|
|
|
|||||
Certain of the Company’s historical net operating losses are subject to Internal Revenue Code Section 382 limitations which have been considered in determining the amount of available net operating loss carryforwards. At December 31, 2017, the Company has federal net operating loss carryforwards of $4.3 million that begin to expire in 2031 if not utilized. The Company also has $19.3 million of various state operating loss carryforwards at December 31, 2017, that begin to expire in 2020 if not utilized.
Uncertain Tax Positions
The Company recognizes the tax effects of an uncertain tax position only if it is more likely than not to be sustained based solely upon its technical merits at the reporting date. The unrecognized tax benefit is the difference between the tax benefit recognized and the tax benefit claimed on the Company’s income tax return. The Company has reviewed its prior year returns and believes that all material tax positions in the current and prior years have been analyzed and properly accounted for and that the risk that additional material uncertain tax positions have not been identified is remote.
A reconciliation of the beginning and ending amounts of the gross unrecognized income tax benefit is as follows (in thousands):
| December 31, | ||||||||||||
| 2017 | 2016 | 2015 | ||||||||||
| Balance at beginning of period |
$ | 1,456 | $ | 1,331 | $ | 1,331 | ||||||
| Additions for tax position of current year |
353 | 364 | 333 | |||||||||
| Additions for tax position of prior years |
— | 125 | — | |||||||||
| Redutions due to statute of limitations lapse |
(364 | ) | (364 | ) | (333 | ) | ||||||
| Settlements |
— | — | — | |||||||||
|
|
|
|
|
|
|
|||||||
| Balance at end of period |
$ | 1,445 | $ | 1,456 | $ | 1,331 | ||||||
|
|
|
|
|
|
|
|||||||
F-39
Table of Contents
C1 INVESTMENT CORP.
Notes to the Consolidated Financial Statements—(Continued)
The Company’s federal income tax returns for the periods ended December 31, 2014 and 2015 are currently under examination by the IRS and it is reasonably possible that the amount of unrecognized tax benefits will change in the next 12 months as a result. If we were to prevail on all unrecognized tax benefits recorded, $1,392,000 of the $1,445,000 reserve would benefit the effective tax rate. In addition, the reversal of accrued penalties and interest would also benefit the effective tax rate. Interest and penalties associated with unrecognized tax benefits are recorded within income tax expense. During the years ended December 31, 2017, 2016 and 2015, we recorded a net expense from accrued penalties and interest of $6,000, $111,000 and $0, respectively. As of December 31, 2017 and 2016, total accrued interest and penalties were $117,000 and $111,000, respectively.
The Company’s federal income tax returns remain open to examination for 2014 through 2016 and certain of the Company’s state income tax returns remain open to examination for 2013 through 2016.
| 16. | Segment Reporting |
Management has concluded that our chief operating decision maker (CODM) consists of both its chief executive officer and chief financial officer. The Company’s CODMs collectively review the entire organization’s consolidated results as a whole on a monthly basis to evaluate performance and make resource allocation decisions. Management views the Company’s operations and manages its business as one operating segment.
Geographic Areas
Sales to customers outside of the United States are not material for any of the periods presented. Additionally, the Company does not have long-lived assets outside of the United States.
Revenue by Technology Market
The following table presents total technology offerings revenue and services revenue by technology market, based on the Company’s internal classification of revenue (in thousands):
| Year Ended December 31, |
||||||||||||
| 2017 | 2016 | 2015 | ||||||||||
| Technology Offerings |
||||||||||||
| Collaboration |
$ | 227,981 | $ | 232,357 | $ | 207,202 | ||||||
| Enterprise Networking, Data Center, Cloud and Security |
225,125 | 207,447 | 90,279 | |||||||||
|
|
|
|
|
|
|
|||||||
| $ | 453,106 | $ | 439,804 | $ | 297,481 | |||||||
|
|
|
|
|
|
|
|||||||
| Services |
||||||||||||
| Collaboration |
$ | 381,715 | $ | 319,208 | $ | 288,167 | ||||||
| Enterprise Networking, Data Center, Cloud and Security |
84,105 | 56,597 | 15,816 | |||||||||
|
|
|
|
|
|
|
|||||||
| $ | 465,820 | $ | 375,805 | $ | 303,983 | |||||||
|
|
|
|
|
|
|
|||||||
| Total |
||||||||||||
| Collaboration |
$ | 609,696 | $ | 551,565 | $ | 495,369 | ||||||
| Enterprise Networking, Data Center, Cloud and Security |
309,230 | 264,044 | 106,095 | |||||||||
|
|
|
|
|
|
|
|||||||
| Total |
$ | 918,926 | $ | 815,609 | $ | 601,464 | ||||||
|
|
|
|
|
|
|
|||||||
F-40
Table of Contents
C1 INVESTMENT CORP.
Notes to the Consolidated Financial Statements—(Continued)
17. Related-Party Transactions
The Company has a management agreement with Clearlake, a stockholder of the Company. Under the terms of the agreement, the Company is required to pay Clearlake a quarterly management fee not to exceed $375,000. For years ended December 31, 2017, 2016 and 2015, the expense under the agreement was $1,500,000, of which $375,000 was included in accrued expenses at December 31, 2017 and 2016, respectively. The Company paid consulting fees of $140,000 and $100,000 to Clearlake in the year ended December 31, 2017 and 2016, respectively, related to debt refinancing.
On August 17, 2017, the Company granted 530,772 options to purchase the Company’s Class B Common Stock to a newly appointed board member. On September 25, 2017, the board member early exercised the options for a total exercise price of $1,805,000 with payment in the form of a Recourse Promissory Note. The note bears interest at 2.6% and is due and payable in full upon the earliest of (i) September 25, 2027, (ii) the date on which the first registration statement is filed with the United States Securities and Exchange Commission under the Securities Act of 1933, as amended, offering securities of the Company to the public, (iii) the dissolution or liquidation of the Company, and (iv) within 10 days after the date on which the individual is no longer a director of the Company.
18. Quarterly Financial Data (Unaudited)
| Quarters Ended | ||||||||||||||||
| Dec. 31, | Sept. 30, | June 30, | Mar. 31, | |||||||||||||
| (In thousands, except per share amounts) | 2017 | 2017 | 2017 | 2017 | ||||||||||||
| Total revenue |
$ | 299,226 | $ | 245,412 | $ | 191,322 | $ | 182,966 | ||||||||
| Gross profit |
92,482 | 70,923 | 57,787 | 53,293 | ||||||||||||
| Operating income |
2,627 | 6,834 | 12,132 | 3,077 | ||||||||||||
| Net income (loss) |
5,164 | 1,303 | (11,367 | ) | (3,121 | ) | ||||||||||
| Net income (loss) per share attributable to Class A common stockholders, basic and diluted |
$ | 0.06 | $ | 0.01 | $ | (0.13 | ) | $ | (0.03 | ) | ||||||
| Cash dividends per share of Class A common stock |
$ | — | $ | — | $ | — | $ | — | ||||||||
| Quarters Ended | ||||||||||||||||
| Dec. 31, | Sept. 30, | June 30, | Mar. 31, | |||||||||||||
| (In thousands, except per share amounts) | 2016 | 2016 | 2016 | 2016 | ||||||||||||
| Total revenue |
$ | 210,528 | $ | 213,381 | $ | 209,875 | $ | 181,825 | ||||||||
| Gross profit |
68,969 | 64,277 | 61,171 | 54,827 | ||||||||||||
| Operating income |
16,140 | 14,986 | 10,835 | 4,541 | ||||||||||||
| Net income (loss) |
2,163 | 4,698 | 2,501 | (1,013 | ) | |||||||||||
| Net income (loss) per share attributable to Class A common stockholders, basic and diluted |
$ | 0.03 | $ | 0.05 | $ | 0.03 | $ | (0.01 | ) | |||||||
| Cash dividends per share of Class A common stock |
$ | 1.00 | $ | — | $ | — | $ | — | ||||||||
19. Subsequent Events
In preparing the consolidated financial statements as of and for the year ended December 31, 2017, the Company evaluated subsequent events for recognition and measurement purposes through March 19, 2018, the date the independent auditors’ report was originally issued and the audited consolidated financial statements were available for issuance.
F-41
Table of Contents
C1 INVESTMENT CORP.
Notes to the Consolidated Financial Statements—(Continued)
Senior Secured Revolving Loan Facility
On February 13, 2018, the Company amended the Revolver Agreement to increase the aggregate revolving commitments from $150,000,000 to $200,000,000 and incurred financing transaction costs of $287,000. Concurrent with the amendment to the Revolver Agreement, the aggregate principal amount of floor plan advances credit limit increased from $150,000,000 to $200,000,000.
Arrow Systems Integration, Inc.
On March 1, 2018, the Company, through its subsidiary ConvergeOne, acquired Arrow Systems Integration, Inc. (“ASI”) for cash consideration of $30,655,000. The acquisition will be accounted for as a business combination with the purchase price allocated to the assets acquired and liabilities assumed based on the estimated fair values at the acquisition date as determined by the Company’s management, using information currently available and current assumptions as to projections of future events and operating performance, and consideration of market conditions. Any premium paid over the fair value of the net tangible and identified intangible assets acquired will result in goodwill. Due to the timing of the acquisition, the fair value of asset acquired and liabilities assumed has not yet been determined and therefore the acquisition accounting is not complete. The Company will include the preliminary purchase price allocation in the first quarter of 2018 and finalize the purchase price allocation as soon as practicable within the measurement period, but not later than one year following the acquisition date. The results of the acquisition will be included in the consolidated statements of income from the closing date forward.
F-42
Table of Contents
REPORT OF INDEPENDENT REGISTERED PUBLIC ACCOUNTING FIRM
To the Shareholders and Board of Directors of
Forum Merger Corporation and Subsidiaries
Opinion on the Consolidated Financial Statements
We have audited the accompanying consolidated balance sheets of Forum Merger Corporation and Subsidiaries (the “Company”) as of December 31, 2017 and 2016, the related consolidated statements of operations, stockholders’ equity and cash flows for the year ended December 31, 2017 and for the period from November 17, 2016 (inception) through December 31, 2016, and the related notes (collectively referred to as the “consolidated financial statements”). In our opinion, the consolidated financial statements present fairly, in all material respects, the consolidated financial position of the Company as of December 31, 2017 and 2016, and the consolidated results of its operations and its cash flows for the year ended December 31, 2017 and for the period from November 17, 2016 (inception) through December 31, 2016, in conformity with accounting principles generally accepted in the United States of America.
Explanatory Paragraph—Going Concern
The accompanying consolidated financial statements have been prepared assuming that the Company will continue as a going concern. As discussed in Note 1 to the consolidated financial statements, its business plan is dependent on the completion of a business combination and the Company’s cash and working capital as of December 31, 2017 are not sufficient to complete its planned activities for the upcoming year. These conditions raise substantial doubt about the Company’s ability to continue as a going concern. Management’s plans in regard to these matters are also described in Note 1. The consolidated financial statements do not include any adjustments that might result from the outcome of this uncertainty.
Basis for Opinion
These consolidated financial statements are the responsibility of the Company’s management. Our responsibility is to express an opinion on the Company’s consolidated financial statements based on our audits. We are a public accounting firm registered with the Public Company Accounting Oversight Board (United States) (“PCAOB”) and are required to be independent with respect to the Company in accordance with the U.S. federal securities laws and the applicable rules and regulations of the Securities and Exchange Commission and the PCAOB.
We conducted our audits in accordance with the standards of the PCAOB. Those standards require that we plan and perform the audit to obtain reasonable assurance about whether the consolidated financial statements are free of material misstatement, whether due to error or fraud. The Company is not required to have, nor were we engaged to perform, an audit of its internal control over financial reporting. As part of our audit we are required to obtain an understanding of internal control over financial reporting but not for the purpose of expressing an opinion on the effectiveness of the Company’s internal control over financial reporting. Accordingly, we express no such opinion.
Our audits included performing procedures to assess the risks of material misstatement of the consolidated financial statements, whether due to error or fraud, and performing procedures that respond to those risks. Such procedures included examining, on a test basis, evidence regarding the amounts and disclosures in the consolidated financial statements. Our audit also included evaluating the accounting principles used and significant estimates made by management, as well as evaluating the overall presentation of the consolidated financial statements. We believe that our audits provides a reasonable basis for our opinion.
Marcum LLP
/s/ Marcum LLP
We have served as the Company’s auditor since 2016.
New York, NY
February 20, 2018
F-43
Table of Contents
FORUM MERGER CORPORATION
| December 31, 2017 |
December 31, 2016 |
|||||||
| ASSETS |
||||||||
| Current Assets |
||||||||
| Cash |
$ | 115,240 | $ | 25,000 | ||||
| Prepaid expenses |
49,359 | — | ||||||
|
|
|
|
|
|||||
| Total Current Assets |
164,599 | 25,000 | ||||||
| Cash and marketable securities held in Trust Account |
175,421,495 | — | ||||||
| Deferred offering costs |
— | 13,491 | ||||||
|
|
|
|
|
|||||
| Total Assets |
$ | 175,586,094 | $ | 38,491 | ||||
|
|
|
|
|
|||||
| LIABILITIES AND STOCKHOLDERS’ EQUITY |
||||||||
| Current liabilities |
||||||||
| Accounts payable and accrued expenses |
$ | 212,572 | $ | 2,092 | ||||
| Income taxes payable |
222,480 | — | ||||||
| Advances from related parties |
32,776 | 13,491 | ||||||
|
|
|
|
|
|||||
| Total Liabilities |
467,828 | 15,583 | ||||||
|
|
|
|
|
|||||
| Commitments |
||||||||
| Common stock subject to possible redemption, 16,728,509 and -0- shares at redemption value as of December 31, 2017 and 2016, respectively |
170,118,265 | — | ||||||
| Stockholders’ Equity |
||||||||
| Preferred stock, $0.0001 par value; 1,000,000 authorized; none issued and outstanding |
— | — | ||||||
| Class A Common stock, $0.0001 par value; 40,000,000 shares authorized; 1,316,491 and -0- shares issued and outstanding (excluding 16,728,509 and -0- shares subject to possible redemption) as of December 31, 2017 and 2016, respectively |
132 | — | ||||||
| Class F Common stock, $0.0001 par value; 5,000,000 shares authorized; 4,312,500 shares issued and outstanding as of December 31, 2017 and 2016 |
431 | 431 | ||||||
| Additional paid-in capital |
4,703,748 | 24,569 | ||||||
| Retained earnings/(Accumulated deficit) |
295,690 | (2,092 | ) | |||||
|
|
|
|
|
|||||
| Total Stockholders’ Equity |
5,000,001 | 22,908 | ||||||
|
|
|
|
|
|||||
| TOTAL LIABILITIES AND STOCKHOLDERS’ EQUITY |
$ | 175,586,094 | $ | 38,491 | ||||
|
|
|
|
|
|||||
The accompanying notes are an integral part of the consolidated financial statements.
F-44
Table of Contents
FORUM MERGER CORPORATION
CONSOLIDATED STATEMENTS OF OPERATIONS
| December 31, 2017 |
For the period from November 7, 2016 (inception) through December 31, 2016 |
|||||||
| Operating costs |
$ | 676,233 | $ | 2,092 | ||||
|
|
|
|
|
|||||
| Loss from operations |
(676,233 | ) | (2,092 | ) | ||||
|
|
|
|
|
|||||
| Other income: |
||||||||
| Interest income |
1,196,495 | — | ||||||
|
|
|
|
|
|||||
| Income (loss) before provision for income taxes |
520,262 | (2,092 | ) | |||||
| Provision for income taxes |
(222,480 | ) | — | |||||
|
|
|
|
|
|||||
| Net income (loss) |
$ | 297,782 | $ | (2,092 | ) | |||
|
|
|
|
|
|||||
| Weighted average shares outstanding, basic and diluted (1) |
5,045,566 | 3,125,000 | ||||||
|
|
|
|
|
|||||
| Basic and diluted net loss per common share(2) |
$ | (0.11 | ) | $ | (0.00 | ) | ||
|
|
|
|
|
|||||
| (1) | Excludes an aggregate of up to 16,728,509 shares subject to redemption at December 31, 2017 and an aggregate of 562,500 shares that were subject to forfeiture at December 31, 2016 to the extent that the underwriters’ over-allotment was not exercised in full. |
| (2) | Net loss per common share—basic and diluted excludes interest income attributable to common stock subject to redemption of $853,482 for the year ended December 31, 2017. |
The accompanying notes are an integral part of the consolidated financial statements.
F-45
Table of Contents
FORUM MERGER CORPORATION CONSOLIDATED STATEMENT OF CHANGES IN STOCKHOLDERS’ EQUITY
| Class A Common Stock |
Class F Common Stock |
Additional Paid-in Capital |
Retained earnings/ (Accumulated Deficit) |
Total Stockholders’ Equity |
||||||||||||||||||||||||
| Shares | Amount | Shares | Amount | |||||||||||||||||||||||||
| Balance—November 17, 2016 (inception) |
— | $ | — | — | $ | — | $ | — | $ | — | $ | — | ||||||||||||||||
| Issuance of common stock to initial stockholder |
— | — | 4,312,500 | 431 | 24,569 | — | 25,000 | |||||||||||||||||||||
| Net loss |
— | — | — | — | — | (2,092 | ) | (2,092 | ) | |||||||||||||||||||
|
|
|
|
|
|
|
|
|
|
|
|
|
|
|
|||||||||||||||
| Balance—December 31, 2016 |
— | — | 4,312,500 | 431 | 24,569 | (2,092 | ) | 22,908 | ||||||||||||||||||||
| Sale of 17,250,000 Units, net of underwriting discount and offering expenses |
17,250,000 | 1,725 | — | — | 168,570,851 | — | 168,572,576 | |||||||||||||||||||||
| Sale of 622,500 Placement Units |
622,500 | 62 | — | — | 6,224,938 | — | 6,225,000 | |||||||||||||||||||||
| Issuance of Representative Shares |
172,500 | 17 | — | — | (17 | ) | — | — | ||||||||||||||||||||
| Common stock subject to redemption |
(16,728,509 | ) | (1,672 | ) | — | — | (170,116,593 | ) | — | (170,118,265 | ) | |||||||||||||||||
| Net income |
— | — | — | — | — | 297,782 | 297,782 | |||||||||||||||||||||
|
|
|
|
|
|
|
|
|
|
|
|
|
|
|
|||||||||||||||
| Balance—December 31, 2017 |
1,316,491 | $ | 132 | 4,312,500 | $ | 431 | $ | 4,703,748 | $ | 295,690 | $ | 5,000,001 | ||||||||||||||||
|
|
|
|
|
|
|
|
|
|
|
|
|
|
|
|||||||||||||||
The accompanying notes are an integral part of the consolidated financial statements.
F-46
Table of Contents
FORUM MERGER CORPORATION
CONSOLIDATED STATEMENTS OF CASH FLOWS
| December 31, 2017 |
For the Period from November 17, 2016 (inception) through December 31, 2016 |
|||||||
| Cash Flows from Operating Activities: |
||||||||
| Net income (loss) |
$ | 297,782 | $ | (2,092 | ) | |||
| Adjustments to reconcile net income (loss) to net cash used in operating activities: |
||||||||
| Interest earned on marketable securities held in Trust Account |
(1,196,495 | ) | — | |||||
| Changes in operating assets and liabilities: |
||||||||
| Prepaid expenses |
(49,359 | ) | — | |||||
| Accounts payable and accrued expenses |
210,480 | 2,092 | ||||||
| Income taxes payable |
222,480 | — | ||||||
|
|
|
|
|
|||||
| Net cash used in operating activities |
(515,112 | ) | — | |||||
|
|
|
|
|
|||||
| Cash Flows from Investing Activities: |
||||||||
| Investment of cash in Trust Account |
(174,225,000 | ) | — | |||||
|
|
|
|
|
|||||
| Net cash used in investing activities |
(174,225,000 | ) | — | |||||
|
|
|
|
|
|||||
| Cash Flows from Financing Activities: |
||||||||
| Proceeds from issuance of common stock to initial stockholder |
— | 25,000 | ||||||
| Proceeds from sale of Units, net of underwriting discounts paid |
169,050,000 | — | ||||||
| Proceeds from sale of Placement Units |
6,225,000 | — | ||||||
| Advances from related parties |
250,361 | 13,491 | ||||||
| Repayment of advances from related parties |
(231,076 | ) | — | |||||
| Payment of offering costs |
(463,933 | ) | (13,491 | ) | ||||
|
|
|
|
|
|||||
| Net cash provided by financing activities |
174,830,352 | 25,000 | ||||||
|
|
|
|
|
|||||
| Net Change in Cash |
90,240 | 25,000 | ||||||
| Cash—Beginning |
25,000 | — | ||||||
|
|
|
|
|
|||||
| Cash—Ending |
$ | 115,240 | $ | 25,000 | ||||
|
|
|
|
|
|||||
| Non-cash investing and financing activities: |
||||||||
| Offering costs charged to additional paid in capital |
$ | 217,612 | $ | — | ||||
|
|
|
|
|
|||||
| Initial classification of common stock subject to redemption |
$ | 169,819,829 | $ | — | ||||
|
|
|
|
|
|||||
| Change in value of common stock subject to possible redemption |
$ | 298,436 | $ | — | ||||
|
|
|
|
|
|||||
The accompanying notes are an integral part of the consolidated financial statements.
F-47
Table of Contents
NOTE 1. DESCRIPTION OF ORGANIZATION AND BUSINESS OPERATIONS
Forum Merger Corporation (the “Company”), is a blank check company incorporated in Delaware on November 17, 2016. The Company was formed for the purpose of acquiring, through a merger, capital stock exchange, asset acquisition, stock purchase, reorganization, recapitalization, exchangeable share transaction or other similar business transaction, one or more operating businesses or assets (a “Business Combination”). The Company has two wholly-owned subsidiaries, FMC Merger Subsidiary Corp., which was incorporated in Delaware on November 27, 2017 (“Merger Sub I”), and FMC Merger Subsidiary LLC, which was incorporated in Delaware on November 27, 2017 (“Merger Sub II”).
At December 31, 2017, the Company had not yet commenced operations. All activity through December 31, 2017 relates to the Company’s formation and its Initial Public Offering, which is described below, and identifying a target company for a Business Combination and activities in connection with the proposed acquisition of C1 Investment Corp. (“C1”), as described in Note 8.
The registration statements for the Company’s initial public offering (“Initial Public Offering”) were declared effective on April 6, 2017. On April 12, 2017, the Company consummated the Initial Public Offering of 15,000,000 units (“Units” and, with respect to the Class A common stock included in the Units being offered, the “Public Shares”), generating gross proceeds of $150,000,000, which is described in Note 4.
Simultaneously with the closing of the Initial Public Offering, the Company consummated the sale of 555,000 units (the “Placement Units”) at a price of $10.00 per Unit in a private placement to the Company’s sponsor, Forum Investor I, LLC (the “Sponsor”), generating gross proceeds of $5,550,000, which is described in Note 5. In addition, at the closing of the Initial Public Offering, the Company issued 150,000 shares of Class A common stock (the “Representative Shares”) to the underwriter and certain other related parties.
Following the closing of the Initial Public Offering on April 12, 2017, an amount of $151,500,000 ($10.10 per Unit) from the net proceeds of the sale of the Units in the Initial Public Offering and the Placement Units was placed in a trust account (“Trust Account”) and invested in U.S. government securities, within the meaning set forth in Section 2(a)(16) of the Investment Company Act of 1940, as amended (the “Investment Company Act”), with a maturity of 180 days or less or in any open-ended investment company that holds itself out as a money market fund selected by the Company meeting the conditions of paragraphs (d)(2), (d)(3) and (d)(4) of Rule 2a-7 of the Investment Company Act, as determined by the Company, until the earlier of: (i) the consummation of a Business Combination or (ii) the distribution of the Trust Account, as described below.
On April 18, 2017, in connection with the underwriters’ exercise of their over-allotment option in full, the Company consummated the sale of an additional 2,250,000 Units, and the sale of an additional 67,500 Placement Units at $10.00 per Unit, generating total gross proceeds of $23,175,000. In addition, the Company issued an additional 22,500 Representative Shares to the underwriters for no additional consideration (see Note 4 and Note 5). Following the closing, an additional $22,725,000 of net proceeds ($10.10 per Unit) was placed in the Trust Account, resulting in $174,225,000 ($10.10 per Unit) held in the Trust Account).
Transaction costs amounted to $3,927,424, consisting of $3,450,000 of underwriting fees and $477,424 of Initial Public Offering costs. As of December 31, 2017, $115,240 of cash was held outside of the Trust Account and was available for working capital purposes.
The Company’s management has broad discretion with respect to the specific application of the net proceeds of its Initial Public Offering and Placement Units, although substantially all of the net proceeds are intended to be applied generally toward consummating a Business Combination. The Company’s initial Business Combination must be with one or more target businesses that together have a fair market value equal to at least 80% of the balance in the Trust Account (net of taxes payable) at the time of the signing of a definitive agreement in connection with a Business Combination. However, the Company will only complete a Business Combination if the post-Business Combination company owns or acquires 50% or more of the outstanding voting securities of the target or otherwise acquires a controlling interest in the target sufficient for it not to be required
F-48
Table of Contents
to register as an investment company under the Investment Company Act. There is no assurance that the Company will be able to successfully effect a Business Combination.
The Company will provide its stockholders with the opportunity to redeem all or a portion of their Public Shares upon the completion of a Business Combination either (i) in connection with a stockholder meeting called to approve the Business Combination or (ii) by means of a tender offer. The decision as to whether the Company will seek stockholder approval of a Business Combination or conduct a tender offer will be made by the Company, solely in its discretion. The public stockholders will be entitled to redeem their Public Shares for a pro rata portion of the amount then on deposit in the Trust Account ($10.10 per share, plus any pro rata interest earned on the funds held in the Trust Account and not previously released to the Company to pay its tax obligations). The Company will proceed with a Business Combination if the Company has net tangible assets of at least $5,000,001 upon such consummation of a Business Combination and, if the Company seeks stockholder approval, a majority of the outstanding shares voted are voted in favor of the Business Combination. If a stockholder vote is not required by law and the Company does not decide to hold a stockholder vote for business or other legal reasons, the Company will, pursuant to its Amended and Restated Certificate of Incorporation, conduct the redemptions pursuant to the tender offer rules of the Securities and Exchange Commission (“SEC”), and file tender offer documents with the SEC prior to completing a Business Combination. If, however, a stockholder approval of the transaction is required by law, or the Company decides to obtain stockholder approval for business or other legal reasons, the Company will offer to redeem shares in conjunction with a proxy solicitation pursuant to the proxy rules and not pursuant to the tender offer rules. If the Company seeks stockholder approval in connection with a Business Combination, the Sponsor has agreed to vote its Founder Shares (as defined in Note 6), Placement Shares (as defined in Note 5) and any Public Shares held by it in favor of approving a Business Combination. Additionally, each public stockholder may elect to redeem their Public Shares irrespective of whether they vote for or against the proposed transaction.
If the Company seeks stockholder approval of a Business Combination and it does not conduct redemptions in connection with a Business Combination pursuant to the tender offer rules, the Company’s Amended and Restated Certificate of Incorporation provides that a public stockholder, together with any affiliate of such stockholder or any other person with whom such stockholder is acting in concert or as a “group” (as defined under Section 13 of the Securities Exchange Act of 1934, as amended (the “Exchange Act”)), will be restricted from redeeming its shares with respect to an aggregate of 20% or more of the Class A common stock sold in the Initial Public Offering.
The Company will have until 24 months from the closing of the Initial Public Offering to consummate its Business Combination (the “Combination Period”). If the Company is unable to consummate a Business Combination within the Combination Period, the Company will (i) cease all operations except for the purposes of winding up of its affairs; (ii) as promptly as reasonably possible but no more than ten business days thereafter, redeem 100% of the outstanding Public Shares, at a per-share price, payable in cash, equal to the aggregate amount then on deposit in the Trust Account, including interest earned (net of taxes payable and up to $100,000 of dissolution expenses), divided by the number of then outstanding Public Shares, which redemption will completely extinguish public stockholders’ rights as stockholders (including the right to receive further liquidation distributions, if any), subject to applicable law, and (iii) as promptly as reasonably possible following such redemption, subject to the approval of the remaining stockholders and the Company’s board of directors, proceed to commence a voluntary liquidation and thereby a formal dissolution of the Company, subject in each case to its obligations to provide for claims of creditors and the requirements of applicable law.
The Sponsor has agreed to (i) waive its conversion rights with respect to its Founder Shares, Placement Shares and Public Shares in connection with the consummation of a Business Combination, (ii) to waive its rights to liquidating distributions from the Trust Account with respect to its Founder Shares and Placement Shares if the Company fails to consummate a Business Combination within the Combination Period and (iii) not to propose an amendment to the Company’s Amended and Restated Certificate of Incorporation that would affect the substance or timing of the Company’s obligation to redeem 100% of its Public Shares if the Company does not complete a Business Combination, unless the Company provides the public stockholders with the opportunity
F-49
Table of Contents
to redeem their shares in conjunction with any such amendment. However, the Sponsor will be entitled to liquidating distributions with respect to any Public Shares acquired if the Company fails to consummate a Business Combination or liquidates within the Combination Period. In the event of such distribution, it is possible that the per share value of the residual assets remaining available for distribution (including Trust Account assets) will be less than the $10.10 per Unit in the Initial Public Offering. In order to protect the amounts held in the Trust Account, the Sponsor has agreed to be liable to the Company if and to the extent any claims by a vendor for services rendered or products sold to the Company, or a prospective target business with which the Company has discussed entering into a transaction agreement, reduce the amount of funds in the Trust Account. This liability will not apply with respect to any claims by a third party who executed a waiver of any right, title, interest or claim of any kind in or to any monies held in the Trust Account or to any claims under the Company’s indemnity of the underwriters of the Initial Public Offering against certain liabilities, including liabilities under the Securities Act of 1933, as amended (the “Securities Act”). Moreover, in the event that an executed waiver is deemed to be unenforceable against a third party, the Sponsor will not be responsible to the extent of any liability for such third party claims. The Company will seek to reduce the possibility that the Sponsor will have to indemnify the Trust Account due to claims of creditors by endeavoring to have all vendors, service providers (other than the Company’s independent auditors), prospective target businesses or other entities with which the Company does business, execute agreements with the Company waiving any right, title, interest or claim of any kind in or to monies held in the Trust Account.
NOTE 2. LIQUIDITY AND GOING CONCERN
As of December 31, 2017, the Company had $115,240 in its operating bank account, $175,421,495 in cash and securities held in the Trust Account to be used for a Business Combination or to repurchase or redeem its common stock in connection therewith and a working capital deficit of $303,229. As of December 31, 2017, approximately $1,196,000 of the amount on deposit in the Trust Account represented interest income, which is available to pay the Company’s tax obligations. Through December 31, 2017, the Company has not withdrawn any funds from the interest earned on the Trust Account.
Until the consummation of a Business Combination, the Company will be using the funds not held in the Trust Account for identifying and evaluating prospective acquisition candidates, performing due diligence on prospective target businesses, paying for travel expenditures, selecting the target business to acquire, and structuring, negotiating and consummating the Business Combination.
The Company may need to raise additional capital through loans or additional investments from the Sponsor, officers, directors, or third parties. None of the officers or directors, the Sponsor or third parties is under any obligation to advance funds to, or to invest in, the Company. Accordingly, the Company may not be able to obtain additional financing. If the Company is unable to raise additional capital, it may be required to take additional measures to conserve liquidity, which could include, but not necessarily be limited to, curtailing operations, suspending the pursuit of a potential transaction, and reducing overhead expenses. The Company cannot provide any assurance that new financing will be available to it on commercially acceptable terms, if at all. These conditions raise substantial doubt about the Company’s ability to continue as a going concern through March 2019. These consolidated financial statements do not include any adjustments relating to the recovery of the recorded assets or the classification of the liabilities that might be necessary should the Company be unable to continue as a going concern.
NOTE 3. SUMMARY OF SIGNIFICANT ACCOUNTING POLICIES
Basis of presentation
The accompanying consolidated financial statements are presented in conformity with accounting principles generally accepted in the United States of America (“GAAP”) and pursuant to the rules and regulations of the SEC.
F-50
Table of Contents
Principles of Consolidation
The accompanying consolidated financial statements include the accounts of the Company and its wholly-owned subsidiaries. All significant intercompany balances and transactions have been eliminated in consolidation.
Emerging growth company
The Company is an “emerging growth company,” as defined in Section 2(a) of the Securities Act of 1933, as amended, (the “Securities Act”), as modified by the Jumpstart Our Business Startups Act of 2012, (the “JOBS Act”), and it may take advantage of certain exemptions from various reporting requirements that are applicable to other public companies that are not emerging growth companies including, but not limited to, not being required to comply with the auditor attestation requirements of Section 404 of the Sarbanes-Oxley Act, reduced disclosure obligations regarding executive compensation in its periodic reports and proxy statements, and exemptions from the requirements of holding a nonbinding advisory vote on executive compensation and stockholder approval of any golden parachute payments not previously approved.
Further, Section 102(b)(1) of the JOBS Act exempts emerging growth companies from being required to comply with new or revised financial accounting standards until private companies (that is, those that have not had a Securities Act registration statement declared effective or do not have a class of securities registered under the Exchange Act) are required to comply with the new or revised financial accounting standards. The JOBS Act provides that a company can elect to opt out of the extended transition period and comply with the requirements that apply to non-emerging growth companies but any such election to opt out is irrevocable. The Company has elected not to opt out of such extended transition period which means that when a standard is issued or revised and it has different application dates for public or private companies, the Company, as an emerging growth company, can adopt the new or revised standard at the time private companies adopt the new or revised standard. This may make comparison of the Company’s consolidated financial statements with another public company which is neither an emerging growth company nor an emerging growth company which has opted out of using the extended transition period difficult or impossible because of the potential differences in accounting standards used.
Use of estimates
The preparation of consolidated financial statements in conformity with GAAP requires management to make estimates and assumptions that affect the reported amounts of assets and liabilities and disclosure of contingent assets and liabilities at the date of the consolidated financial statements and the reported amounts of revenues and expenses during the reporting period.
Making estimates requires management to exercise significant judgment. It is at least reasonably possible that the estimate of the effect of a condition, situation or set of circumstances that existed at the date of the consolidated financial statements, which management considered in formulating its estimate, could change in the near term due to one or more future confirming events. Accordingly, the actual results could differ significantly from those estimates.
Cash and cash equivalents
The Company considers all short-term investments with an original maturity of three months or less when purchased to be cash equivalents. The Company did not have any cash equivalents as of December 31, 2017 and 2016.
Cash and marketable securities held in Trust Account
At December 31, 2017, the assets held in the Trust Account were held in cash and U.S. Treasury Bills.
F-51
Table of Contents
Common stock subject to possible redemption
The Company accounts for its common stock subject to possible redemption in accordance with the guidance in Accounting Standards Codification (“ASC”) Topic 480 “Distinguishing Liabilities from Equity.” Common stock subject to mandatory redemption (if any) is classified as a liability instrument and is measured at fair value. Conditionally redeemable common stock (including common stock that features redemption rights that are either within the control of the holder or subject to redemption upon the occurrence of uncertain events not solely within the Company’s control) is classified as temporary equity. At all other times, common stock is classified as stockholders’ equity. The Company’s common stock features certain redemption rights that are considered to be outside of the Company’s control and subject to occurrence of uncertain future events. Accordingly, at December 31, 2017, common stock subject to possible redemption is presented as temporary equity, outside of the stockholders’ equity section of the Company’s balance sheet.
Offering costs
Offering costs consist of legal, accounting, underwriting fees and other costs incurred through the balance sheet date that are directly related to the Initial Public Offering. Offering costs amounting to $3,927,424 were charged to stockholders’ equity upon the completion of the Initial Public Offering.
Income taxes
The Company complies with the accounting and reporting requirements of ASC Topic 740 “Income Taxes,” which requires an asset and liability approach to financial accounting and reporting for income taxes. Deferred income tax assets and liabilities are computed for differences between the financial statement and tax bases of assets and liabilities that will result in future taxable or deductible amounts, based on enacted tax laws and rates applicable to the periods in which the differences are expected to affect taxable income. Valuation allowances are established, when necessary, to reduce deferred tax assets to the amount expected to be realized.
ASC Topic 740 prescribes a recognition threshold and a measurement attribute for the financial statement recognition and measurement of tax positions taken or expected to be taken in a tax return. For those benefits to be recognized, a tax position must be more-likely-than-not to be sustained upon examination by taxing authorities. The Company recognizes accrued interest and penalties related to unrecognized tax benefits as income tax expense. As of December 31, 2017 and 2016, there were no unrecognized tax benefits and no amounts accrued for interest and penalties. The Company is currently not aware of any issues under review that could result in significant payments, accruals or material deviation from its position.
The Company may be subject to potential examination by federal, state and city taxing authorities in the areas of income taxes. These potential examinations may include questioning the timing and amount of deductions, the nexus of income among various tax jurisdictions and compliance with federal, state and city tax laws. The Company’s management does not expect that the total amount of unrecognized tax benefits will materially change over the next twelve months.
On December 22, 2017 the U.S. Tax Cuts and Jobs Act of 2017 (“Tax Reform”) was signed into law. As a result of Tax Reform, the U.S. statutory tax rate was lowered from 35% to 21% effective January 1, 2018, among other changes. ASC Topic 740 requires companies to recognize the effect of tax law changes in the period of enactment; therefore, the Company was required to revalue its deferred tax assets and liabilities at December 31, 2017 at the new rate. The SEC issued Staff Accounting Bulletin No. 118 (“SAB 118”) to address the application of GAAP in situations when a registrant does not have the necessary information available, prepared, or analyzed (including computations) in reasonable detail to complete the accounting for certain tax effects of Tax Reform. The ultimate impact may differ from this provisional amount, possibly materially, as a result of additional analysis, changes in interpretations and assumptions the Company has made, additional regulatory guidance that may be issued, and actions the Company may take as a result of Tax Reform.
F-52
Table of Contents
Net loss per common share
The Company complies with accounting and disclosure requirements ASC Topic 260, “Earnings Per Share.” Net loss per common share is computed by dividing net loss by the weighted average number of common shares outstanding for the period. The Company applies the two-class method in calculating earnings per share. Shares of common stock subject to possible redemption at December 31, 2017, which are not currently redeemable and are not redeemable at fair value, have been excluded from the calculation of basic income per share since such shares, if redeemed, only participate in their pro rata share of the Trust Account earnings. The Company has not considered the effect of (1) warrants sold in the Initial Public Offering and private placement to purchase 8,936,250 shares of Class A common stock, (2) rights sold in the Initial Public Offering and private placement that convert into 1,787,250 shares of Class A common stock, and (3) 1,125,000 shares of Class A common stock, warrants to purchase 562,500 shares of Class A common stock and rights that convert into 112,500 shares of Class A common stock in the unit purchase option sold to the underwriter, in the calculation of diluted income per share, since the exercise of the warrants and the conversion of the rights into shares of common stock is contingent upon the occurrence of uncertain future events. As a result, diluted income per common share is the same as basic income per common share for the periods.
Reconciliation of net income (loss) per common share
The Company’s net income (loss) is adjusted for the portion of income that is attributable to common stock subject to redemption, as these shares only participate in the income of the Trust Account and not the losses of the Company. Accordingly, basic and diluted income (loss) per common share is calculated as follows:
| Year ended December 31, 2017 |
For the Period from November 17, 2016 (inception) through December 31, 2016 |
|||||||
| Net income (loss) |
$ | 297,782 | $ | (2,092 | ) | |||
| Less: Income attributable to common stock subject to redemption |
(853,482 | ) | — | |||||
|
|
|
|
|
|||||
| Adjusted net loss |
$ | (555,700 | ) | $ | (2,092 | ) | ||
|
|
|
|
|
|||||
| Weighted average shares outstanding, basic and diluted |
5,045,566 | 3,125,000 | ||||||
|
|
|
|
|
|||||
| Basic and diluted net loss per common share |
$ | (0.11 | ) | $ | (0.00 | ) | ||
|
|
|
|
|
|||||
Concentration of credit risk
Financial instruments that potentially subject the Company to concentration of credit risk consist of a cash account in a financial institution which, at times may exceed the Federal depository insurance coverage of $250,000. At December 31, 2017, the Company had not experienced losses on this account and management believes the Company is not exposed to significant risks on such account.
Fair value of financial instruments
The fair value of the Company’s assets and liabilities, which qualify as financial instruments under ASC Topic 820, “Fair Value Measurements and Disclosures,” approximates the carrying amounts represented in the accompanying balance sheets, primarily due to their short-term nature.
Recently issued accounting standards
Management does not believe that any recently issued, but not yet effective, accounting pronouncements, if currently adopted, would have a material effect on the Company’s consolidated financial statements.
F-53
Table of Contents
NOTE 4. INITIAL PUBLIC OFFERING
Pursuant to the Initial Public Offering, the Company sold 17,250,000 Units at a purchase price of $10.00 per Unit, inclusive of 2,250,000 Units sold to the underwriters on April 18, 2017 upon the underwriters’ election to fully exercise their over-allotment option. Each Unit consists of one share of Class A common stock, one right (“Public Right”) and one-half of one warrant (“Public Warrant”). Each Public Right will convert into one-tenth (1/10) of one share of Class A common stock upon consummation of a Business Combination (see Note 9). Each whole Public Warrant entitles the holder to purchase one share of Class A common stock at an exercise price of $11.50 (see Note 9). No fractional Public Warrants will be issued upon separation of the Units and only whole Public Warrants trade.
NOTE 5. PRIVATE PLACEMENT
Simultaneously with the Initial Public Offering, the Sponsor purchased an aggregate of 555,000 Placement Units at a price of $10.00 per Unit, (or an aggregate purchase price of $5,550,000). In addition, on April 18, 2017, the Company consummated the sale of an additional 67,500 Placement Units at a price of $10.00 per Unit, which were purchased by the Sponsor, generating gross proceeds of $675,000. Each Placement Unit consists of one share of Class A common stock (“Placement Share”), one right (“Placement Right”) and one-half of one warrant (each, a “Placement Warrant”) to purchase one share of the Class A common stock at an exercise price of $11.50 per share. The proceeds from the Placement Units were added to the proceeds from the Initial Public Offering held in the Trust Account. If the Company does not complete a Business Combination within the Combination Period, the proceeds of the sale of the Placement Units will be used to fund the redemption of the Public Shares (subject to the requirements of applicable law) and the Placement Rights and Placement Warrants will expire worthless.
The Placement Units are identical to the Units sold in the Initial Public Offering except that the Placement Warrants (i) are not redeemable by the Company and (ii) may be exercised for cash or on a cashless basis, so long as they are held by the initial purchaser or any of its permitted transferees. In addition, the Placement Units and their component securities may not be transferable, assignable or salable until 30 days after the consummation of a Business Combination, subject to certain limited exceptions.
NOTE 6. RELATED PARTY TRANSACTIONS
Founder Shares
On December 28, 2016, the Company issued an aggregate of 3,593,750 shares of Class F common stock to the Sponsor (“Founder Shares”) for an aggregate purchase price of $25,000. The Founder Shares will automatically convert into Class A common stock upon the consummation of a Business Combination on a one-for-one basis, subject to adjustments, as described in Note 9. On April 6, 2017, the Company effectuated a 1.2-for-1 stock dividend of its Class F common stock resulting in an aggregate of 4,312,500 Founder Shares outstanding. All share and per share amounts have been retroactively restated to reflect the stock dividend.
The 4,312,500 Founder Shares included an aggregate of up to 562,500 shares which were subject to forfeiture by the Sponsor to the extent that the underwriters’ over-allotment option was not exercised in full or in part so that the Sponsor would own, on an as-converted basis, 20.0% of the Company’s issued and outstanding shares after the Initial Public Offering (excluding the Placement Shares and Representative Shares). As a result of the underwriters’ election to exercise their over-allotment option in full on April 18, 2017, 562,500 Founder Shares are no longer subject to forfeiture.
The Sponsor has agreed that, subject to certain limited exceptions, 50% of its Founder Shares will not be transferred, assigned or sold until one year after the date of the consummation of a Business Combination or earlier if, subsequent to a Business Combination, the last sales price of the Company’s common stock equals or exceeds $12.50 per share (as adjusted for stock splits, stock dividends, reorganizations and recapitalizations) for any 20 trading days within any 30-trading day period commencing 150 days after a Business Combination, and
F-54
Table of Contents
the remaining 50% of its Founder Shares will not be transferred, assigned or sold until one year after the date of the consummation of a Business Combination.
Related Party Advances
For the year ended December 31, 2017, the Sponsor advanced the Company an aggregate of $250,361 for costs associated with the Initial Public Offering and for working capital purposes. The advances are non-interest bearing, unsecured and due on demand. As of December 31, 2017, the Company has repaid $231,076 of such advances. There were $32,776 and $13,491 of advances outstanding as of December 31, 2017 and 2016, respectively.
Administrative Services Agreement
The Company entered into an agreement whereby, commencing on April 7, 2017 through the earlier of the consummation of a Business Combination or the Company’s liquidation, the Company will pay an affiliate of the Sponsor a monthly fee of $10,000 for office space, utilities and administrative support. For the year ended December 31, 2017, the Company incurred $90,000 in fees for these services, respectively, of which $58,685 is included in accounts payable and accrued expenses in the accompanying balance sheet at December 31, 2017.
Related Party Loans
In order to finance transaction costs in connection with a Business Combination, the Sponsor, the Company’s officers and directors may, but are not obligated to, loan the Company funds from time to time or at any time, as may be required (“Working Capital Loans”). Each Working Capital Loan would be evidenced by a promissory note. The Working Capital Loans would either be paid upon consummation of a Business Combination, without interest, or, at the holder’s discretion, up to $1,500,000 of the Working Capital Loans may be converted into Units at a price of $10.00 per Unit. The Units would be identical to the Placement Units. There were no Working Capital Loans outstanding as of December 31, 2017.
NOTE 7. COMMITMENTS AND CONTINGENCIES
Contingent Transaction Fee Arrangements
The Company has entered into a fee arrangement with a service provider pursuant to which certain fees incurred by the Company in connection with a potential Business Combination will be deferred and become payable only if the Company consummates a Business Combination. If a Business Combination does not occur, the Company will not be required to pay these contingent fees. As of December 31, 2017, the amount of these contingent fees was approximately $868,270. To the extent the Merger (as defined in Note 8) or another Business Combination is consummated, the Company anticipates incurring a significant amount of additional costs. There can be no assurances that the Company will complete the Merger or any other Business Combination.
Registration Rights
Pursuant to a registration rights agreement entered into on April 6, 2017, the holders of the Founder Shares, Placement Units (and their underlying securities), Representative Shares, the underlying securities in the unit purchase option, and any Units that may be issued upon conversion of the Working Capital Loans (and their underlying securities) are entitled to registration rights. The holders of a majority of these securities are entitled to make up to three demands, excluding short form demands, that the Company register such securities. In addition, the holders have certain “piggy-back” registration rights with respect to registration statements filed subsequent to the completion of a Business Combination and rights to require the Company to register for resale such securities pursuant to Rule 415 under the Securities Act. However, the registration rights agreement provides that the Company will not permit any registration statement filed under the Securities Act to become effective until termination of the applicable lock-up period. The Company will bear the expenses incurred in connection with the filing of any such registration statements.
F-55
Table of Contents
Underwriters Agreement
Business Combination Marketing Agreement
The Company has engaged EarlyBirdCapital, Inc. (“EBC”) as an advisor in connection with a Business Combination to assist the Company in holding meetings with its shareholders to discuss a potential Business Combination and the target business’ attributes, introduce the Company to potential investors that are interested in purchasing securities, assist the Company in obtaining shareholder approval for the Business Combination and assist the Company with its press releases and public filings in connection with a Business Combination. The Company will pay EBC a cash fee for such services upon the consummation of a Business Combination in an amount equal to $6,037,500 (exclusive of any applicable finders’ fees which might become payable). The Company will have the right to pay up to 25% of such amount to EBC in shares of restricted stock (valued at $10.10 per share) or to another FINRA member firm retained by the Company to assist the Company in connection with a Business Combination.
NOTE 8. C1 MERGER AGREEMENT
On November 30, 2017, the Company entered into an Agreement and Plan of Merger (the “Merger Agreement”), by and among the Company, FMC Merger Subsidiary Corp., a Delaware corporation (“Merger Sub I”) and a wholly-owned subsidiary of the Company, FMC Merger Subsidiary LLC, a Delaware limited liability company and a wholly-owned subsidiary of the Company (“Merger Sub II,” and together with Merger Sub I, the “Merger Subs”), C1 Investment Corp., a Delaware corporation, (“C1”), and Clearlake Capital Management III, L.P., in the capacity thereunder as the representative for C1’s securityholders (the “Seller Representative”).
The Merger Agreement provides for a two-step merger: (i) the merger of Merger Sub I with and into C1 (the “First Merger”), with C1 continuing as the surviving corporation (the “Surviving Corporation”) and as a wholly-owned subsidiary of the Company; and (ii) the merger of the Surviving Corporation with and into Merger Sub II (the “Second Merger” and together with the First Merger, the “C1 Business Combination”), with Merger Sub II continuing as the surviving entity (the “Surviving Entity”) in the Second Merger. Subject to the terms and conditions set forth in the Merger Agreement, at the effective time of the First Merger (the “Effective Time”): (a) all shares of C1’s Class A Common Stock and Class B Common Stock (the “C1 Company Stock”) issued and outstanding immediately prior to the Effective Time will be converted into the right to receive the Total Consideration (as defined below) along with the holders of options to purchase Company Stock (“C1 Company Options”), with each holder of C1 Company Stock and C1 Company Options being entitled to receiving its pro rata share of the Total Consideration; (b) each outstanding option, warrant or other right to subscribe or purchase any C1 Company Stock or securities convertible into or exchange for, or that otherwise confer on the holder any right to acquire any C1 Company Stock, if not exercised or converted prior to such time, will be cancelled, retired and terminated and cease to represent a right to acquire, be exchanged for or convert into shares of C1 Company Stock or if exercised prior to such time, will have the resulting shares of C1 Company Stock issued upon such exercise treated as outstanding shares of C1 Company Stock; and (c) each outstanding C1 Company Option that is unvested as of the Effective Time will become fully vested and exercisable as of the Effective Time (each such C1 Company Option subject to such accelerated vesting, an “Accelerated Option”) and holders of all C1 Company Options, including Accelerated Options, will receive (x) their pro rata portion of the Merger Consideration (as defined below) minus the per-share exercise price of such Accelerated Option and (y) their pro rata share of the Earnout Payments (as defined below), except that holders of Accelerated Options will only receive their pro rata portion of the Earnout Payments if they continue to be employed on the date that it is paid.
Merger Consideration
The aggregate consideration to be paid pursuant to the Merger Agreement to holders of C1 Company Stock and C1 Company Option (together, the “Company Securityholders”) will be an amount equal to (the “Merger Consideration”): (i) $1,137,000,000, minus (ii) the indebtedness of C1 and its subsidiaries (the “Target Companies”), plus (iii) the cash of the Target Companies, together with the amount of any C1 transaction
F-56
Table of Contents
expenses that are paid prior to the closing of the C1 Business Combination (the “Closing”), and plus (iv) the cash amount paid and indebtedness incurred by the Target Companies for any business acquisitions that they make between the signing of the Merger Agreement and the Closing (the “Net Acquisition Amount”). Additionally, Company Securityholders will have the contingent right to receive additional consideration from the Company based on the performance of the Company and its subsidiaries, including the Surviving Entity, for the calendar years 2018, 2019 and 2020, as described below (the “Earnout Payments” and, together with the Merger Consideration, the “Total Consideration”).
The Merger Consideration will consist of cash and stock. The cash portion of the Merger Consideration (“Cash Consideration”) will include cash from the Company and/or the Target Companies (the “Cash Consideration”) in an amount equal to (A) the total cash and cash equivalents of the Company (the “Forum Cash”), including funds from a concurrent private placement equity investment (the “PIPE Investment”) expected to be consummated at the Closing and the remaining funds in the Trust Account, after giving effect to the redemption by the Company of its shares of Class A Common Stock (“Forum Common Shares”) from its public stockholders (the “Redemption”), plus (B) the cash of the Target Companies to the extent that they are permitted to be distributed pursuant to the existing credit facilities of the Target Companies (“Permitted Cash”), minus (C) $25,000,000. The stock portion of the Merger Consideration will include a number of Forum Common Shares, valued at a price per share equal to the price paid to holders of Forum Common Shares in the Redemption (the “Redemption Price”), determined by subtracting the Cash Consideration and the Deferred Payment (as defined below) from the Merger Consideration (the “Stock Consideration” and, together with the Cash Consideration and the Earnout Payments, the “Total Consideration”). There will also be a deferred cash payment of $12,000,000 after the Closing (the “Deferred Payment”) in connection with a portion of the PIPE Investment that will close after the C1 Business Combination. Notwithstanding the foregoing, Seller Representative, in its sole discretion, may increase the Stock Consideration and reduce the Cash Consideration to ensure the Company Securityholders collectively own at least 50.1% of the issued and outstanding Forum Common Shares upon consummation of the C1 Business Combination.
The Merger Consideration will be paid at the Closing based on estimates and will be subject to a post-closing adjustment, except that if the adjustment in either direction is less than $2,000,000, no adjustment or payments will be made. Any such true-up adjustments will be paid by delivery of Forum Common Shares valued at the Redemption Price, with the Company delivering additional shares to Company Securityholders if the finally determined Merger Consideration is higher than the estimated Merger Consideration delivered at closing, and the Company Securityholders forfeiting Forum Common Shares on a pro rata basis if the finally determined Merger Consideration is less than the estimated Merger Consideration delivered at closing.
Following the consummation of the C1 Business Combination, subject to certain terms and conditions set forth in the Merger Agreement, Company Securityholders will have the contingent right to receive the Earnout Payments from the Company in connection with the calendar years 2018, 2019 and 2020 (each such calendar year, an “Earnout Year” and such three-year calendar period, the “Earnout Period”).
In the event that (i) the trailing four quarter EBITDA as of the end of any fiscal quarter after the Closing within calendar year 2018 exceeds $144,000,000 (the “2018 Target”), (ii) the trailing four quarter EBITDA as of the end of any fiscal quarter within calendar year 2019 exceeds $155,000,000 (the “2019 Target”), or (iii) the trailing four quarter EBITDA as of the end of any fiscal quarter within calendar year 2019 exceeds $165,000,000 (the “2020 Target” and together with the 2018 Target and 2019 Target, the “Earnout Targets”), then for each Earnout Target that is achieved as of a given Measurement Date, the Company Securityholders shall receive additional consideration (a “Regular Earnout Payment”) of (A) 3,300,000 Forum Common Shares (an “Earnout Stock Payment”) and (B) cash in an amount equal to $33,000,000 (an “Earnout Cash Payment”).
In the event an Earnout Target is not met in the applicable Earnout Year, but the Earnout Target is achieved for a subsequent Earnout Year, the Company Securityholders will be entitled to receive the Regular Earnout Payments for any Earnout Years in which the Earnout Target was not previously achieved, payable at the same time as the Regular Earnout Payment for such Earnout Year (each such payment, a “Catchup Earnout Payment”).
F-57
Table of Contents
In the event an Earnout Target for a future Earnout Year is achieved in the current Earnout Year, then the Company Securityholders will be entitled to receive in addition to and at the same time as the Regular Earnout Payment for the current Earnout Year, the Regular Earnout Payment for such future Earnout Year (each such payment, an “Accelerated Earnout Payment”). In the event that there is a Change of Control (as defined in the Merger Agreement) during the Earnout Period, then any Regular Earnout Payments that have not previously been paid (whether or not earned) shall be deemed earned and due to the Company Securityholders upon such Change of Control (such payment, a “Change of Control Earnout Payment” and collectively with the Regular Earnout Payments, Catchup Earnout Payments and Accelerated Earnout Payments, the “Earnout Payments”). In any event, the Company Securityholders will not be entitled to receive more than one Earnout Payment attributable to each Earnout Year.
If at the time any Earnout Payment is due, such Earnout Payment exceeds either (a) the amount of cash available for distribution pursuant to the credit facilities of the Target Companies or (b) the amount of cash that can be paid without causing the ratio of the consolidated debt of the Target Companies to EBITDA (assuming full payment of the Earnout Cash Payment) to exceed 4.5 to 1, then the amount of the cash consideration will be reduced to an amount of cash that can be paid without exceeding such limits and any shortfall (the “Earnout Cash Payment Shortfall”) will at the option of the Seller Representative either (i) be paid by delivery of an additional number of Forum Common Shares determined based on the trailing 20 trading day volume-weighted average price as of the end of the Measurement Date on which the Earnout Payment was achieved (the “Earnout Cash Payment Shortfall Shares”) or (ii) defer the payment of the Earnout Cash Payment Shortfall until the following Measurement Date. If the Earnout Cash Payment Shortfall is deferred, then the Seller Representative will have the option on each succeeding Measurement Date until the end of the Earnout Period to elect to be paid the Earnout Cash Payment Shortfall Shares (which will still be valued based on the trailing 20 trading day volume-weighted average price as of the end of the Measurement Date on which the original applicable Earnout Payment was achieved) in full satisfaction of the Earnout Cash Payment Shortfall or to continue to defer payment of the Earnout Cash Payment Shortfall. At the end of the Earnout Period, any remaining Earnout Cash Payment Shortfall shall automatically be converted into the Earnout Cash Payment Shortfall Shares.
Notwithstanding the above provisions, each Earnout Payment otherwise payable to the Company Securityholders will be reduced by the amount of the Sponsor Earnout Shares (as more fully described below) that become vested in connection with an Earnout Payment by directly reducing each Earnout Stock Payment by the amount of the Sponsor Earnout Shares that have become vested.
The Company, C1, and the Merger Subs have each made representations, warranties and covenants in the Merger Agreement that are customary for transactions of this nature.
Further, notwithstanding the above provisions, the allocation of Total Consideration as among cash and Forum Common Shares payable to Company Securityholders shall be adjusted, by decreasing the cash portion and correspondingly increasing the portion of Total Consideration paid in Forum Common Shares, if and to the extent necessary to ensure that the Company Securityholders receive sufficient Forum Common Shares such that, when aggregated with Forum Common Shares previously paid as Total Consideration to the Company Securityholders (if any), the amount of Forum Common Shares is not less than the minimum amount of Forum Common Shares necessary to satisfy the requirements for qualification as a reorganization under Section 368(a)(1)(A) of the Code.
Conditions to Consummation of the C1 Business Combination
The consummation of the C1 Business Combination is subject to various conditions, including the following mutual conditions of the parties unless waived: (i) the approval of the Merger Agreement by the requisite vote of the Company’s stockholders and C1’s stockholders; (ii) expiration of the applicable waiting period under any antitrust laws, including the Hart-Scott-Rodino Antitrust Improvements Act of 1976, as amended; (iii) receipt of requisite regulatory approval, (iv) no law or order preventing or prohibiting the C1 Business Combination or the other transactions contemplated by the Merger Agreement or the Closing; (v) the Company having at least
F-58
Table of Contents
$5,000,001 in net tangible assets as of the Closing, after giving effect to the completion of the Redemption and the PIPE Investment;(vi), the consummation of the PIPE Investment, (vii) the election or appointment of members to Forum’s board of directors in accordance with the Merger Agreement; and (viii) the effectiveness of the registration statement filed in connection with the C1 Business Combination.
Private Placement
In connection with the C1 Business Combination, the Company entered into subscription agreements with the investors named therein (the “PIPE Investors”), pursuant to which the Company agreed to issue and sell to the PIPE Investors 17,959,375 Forum Common Shares, for an aggregate purchase price of $143,675,000, immediately prior to closing of the Merger (except for the portion relating to the Deferred Payment) (the “PIPE Investment”).
The PIPE Investment is conditioned on the concurrent closing of the C1 Business Combination and other customary closing conditions. The proceeds from the PIPE Investment will be used to fund a portion of the cash consideration for the C1 Business Combination.
Registration Rights Agreement
At the Closing, the Company, the Sponsor, and certain Company Securityholders will enter into an amended and restated registration rights agreement (the “Registration Rights Agreement”) amending and restating the registration rights agreement entered into by the Sponsor and the Company at the time of the Company’s Initial Public Offering. Under the Registration Rights Agreement, the Company Securityholders will hold registration rights that obligate the Company to register all or any portion of the Forum Common Shares issued as merger consideration under the Merger Agreement and the Sponsor will hold similar registration rights with respect to its Forum common stock and common stock underlying its Forum warrants. Holders of a majority-in-interest of all such registrable securities will be entitled to certain demand registration rights, as well as the right to registered the resale of their registrable securities on Form S-3 if eligible, and each holder of registrable securities will have “piggyback” registration rights.
Voting Agreement
Simultaneously with the execution of the Merger Agreement, the Company and C1 entered into a voting agreement (the “Voting Agreement”) with C1’s largest stockholder, Clearlake Capital Partners III (Master), L.P. (“Clearlake”), which owns a majority of C1’s outstanding capital stock. Pursuant to the Voting Agreement, Clearlake agreed, among other things, to vote all of its shares of C1 Company Stock in favor of the Merger Agreement and related transactions and to otherwise take certain other actions in support of the Merger Agreement and related transactions. The Voting Agreement prevents transfers of the C1 Company Stock held by Clearlake between the date of the Voting Agreement and the date of the special meeting of the Company’s stockholders to approve the C1 Business Combination.
Sponsor Earnout Letter and Amendment to Escrow Agreement
In accordance with the letter agreement entered into on November 30, 2017 (the “Sponsor Earnout Letter”), by and among the “ Sponsor, the Company, C1, Continental Stock Transfer & Trust Company and EBC, and Seller Representative, the Sponsor has agreed that effective upon the Closing, with respect to the Founder Shares owned by the Sponsor, the Sponsor will (a) forfeit 1,078,125 of the Founder Shares and (b) subject 2,156,250 of the Founder Shares (the “Sponsor Earnout Shares”) to potential forfeiture in the event that the Earnout Payments are not achieved by Company Securityholders. Subject to certain limited exceptions, the Sponsor Earnout Shares will be subject to lock-up from the Closing until 180 days thereafter; provided that if the volume-weighted average price of Forum Common Shares for 15 trading days is at least $12.50 per share, then 25% of the Sponsor Earnout Shares will be released from escrow immediately (but still subject to the vesting requirements under the Sponsor Earnout Letter).
F-59
Table of Contents
The Sponsor also agreed in the Sponsor Earnout Letter, on behalf of itself and its members and affiliates, to waive any rights that it has under the Company’s amended and restated certificate of incorporation to the adjustment to the conversion ratio of the Founder Shares in connection with the PIPE Investment.
In consideration of the agreements by the Sponsor under the Sponsor Earnout Letter, the remaining 1,078,125 Founder Shares will be released from escrow and no longer be subject to any lock-up restrictions effective as of the Closing. the Company will seek shareholder approval for the transactions contemplated by the Sponsor Earnout Letter in connection with the C1 Business Combination.
Lock-Up Agreements
At the Closing, each Company Securityholder will enter into a lock-up agreement with the Company, and agree that, subject to certain limited exceptions, from the Closing until 180 days thereafter (or if earlier, the date on which the Company consummates a liquidation, merger, share exchange or other similar transaction with an unaffiliated third party that results in all of the Company’s stockholders having the right to exchange either equity holdings in the Company for cash, securities or other property), such Company Securityholder shall be subject to the lock-up restriction contained therein. However, if the volume-weighted average price of Forum Common Shares for 15 trading days is at least $12.50 per share, then the lock-up period for 25% of the securities covered by the lock-up agreement that are then held by the Company Securityholder will immediately expire thereafter.
NOTE 9. STOCKHOLDERS’ EQUITY
Preferred Stock—The Company is authorized to issue 1,000,000 shares of preferred stock with a par value of $0.0001 per share with such designation, rights and preferences as may be determined from time to time by the Company’s Board of Directors. At December 31, 2017 and 2016, there were no shares of preferred stock issued or outstanding.
Class A Common Stock—The Company is authorized to issue 40,000,000 shares of Class A common stock with a par value of $0.0001 per share. Holders of the Company’s Class A common stock are entitled to one vote for each share. At December 31, 2017 and 2016, there were 1,316,491 and -0- shares of Class A common stock issued and outstanding, respectively (excluding 16,728,509 and -0- shares of common stock subject to possible redemption).
At the closing of the Initial Public Offering, the Company issued the underwriter and its designees 150,000 Representative Shares for no additional consideration. In addition, on April 18, 2017, as a result of the underwriters’ election to exercise their over-allotment option in full, the Company issued an additional 22,500 Representative Shares to the underwriters for no additional consideration. The Company accounted for the Representative Shares as an expense of the Initial Public Offering, resulting in a charge directly to stockholders’ equity. The Company determined the fair value of Representative Shares to be $1,725,000 based upon the offering price of the Units of $10.00 per Unit. The underwriter has agreed not to transfer, assign or sell any such shares until the completion of a Business Combination. In addition, the underwriter and its designees have agreed (i) to waive their redemption rights with respect to such shares in connection with the completion of a Business Combination and (ii) to waive their rights to liquidating distributions from the Trust Account with respect to such shares if the Company fails to complete a Business Combination within the Combination Period.
The shares have been deemed compensation by FINRA and are therefore subject to a lock-up for a period of 180 days pursuant to Rule 5110(g)(1) of FINRA’s NASD Conduct Rules. Pursuant to FINRA Rule 5110(g)(1), these securities will not be the subject of any hedging, short sale, derivative, put or call transaction that would result in the economic disposition of the securities by any person for a period of 180 days immediately following the date of the Initial Public Offering, nor may they be sold, transferred, assigned, pledged or hypothecated for a period of 180 days immediately following the Initial Public Offering except to any underwriter and selected dealer participating in the Proposed Offering and their bona fide officers or partners.
F-60
Table of Contents
Class F Common Stock—The Company is authorized to issue 5,000,000 shares of Class F common stock with a par value of $0.0001 per share. Holders of the Company’s Class F common stock are entitled to one vote for each share. At December 31, 2017 and 2016, there were 4,312,500 shares of Class F common stock issued and outstanding.
The shares of Class F common stock will automatically convert into shares of Class A common stock at the time of a Business Combination on a one-for-one basis, subject to adjustment as follows. In the case that additional shares of Class A common stock, or equity-linked securities, are issued or deemed issued in excess of the amounts offered in the Initial Public Offering in connection with the closing of a Business Combination, the ratio at which shares of Class F common stock shall convert into shares of Class A common stock will be adjusted so that the number of shares of Class A common stock issuable upon conversion of all shares of Class F common stock will equal, in the aggregate, on an as-converted basis, 20% of the total number of all shares of common stock outstanding upon completion of the Initial Public Offering plus all shares of Class A common stock and equity-linked securities issued or deemed issued in connection with a Business Combination, excluding any shares or equity-linked securities issued, or to be issued, to any seller in a Business Combination or pursuant to Units (and their underlying securities) issued to the Sponsor upon conversion of Working Capital Loans, after taking into account any shares of Class A common stock redeemed in connection with a Business Combination. In connection with the shares issued pursuant to the PIPE Investment, our sponsor has forfeited its anti-dilution protection with respect to the founders’ shares.
Holders of Class A common stock and Class F common stock will vote together as a single class on all matters submitted to a vote of stockholders except as required by law.
Rights—Each holder of a right will receive one-tenth (1/10) of one share of common stock upon consummation of a Business Combination, even if the holder of such right redeemed all shares held by it in connection with a Business Combination. No fractional shares will be issued upon exchange of the rights. No additional consideration will be required to be paid by a holder of rights in order to receive its additional shares upon consummation of a Business Combination as the consideration related thereto has been included in the Unit purchase price paid for by investors in the Initial Public Offering. If the Company enters into a definitive agreement for a Business Combination in which the Company will not be the surviving entity, the definitive agreement will provide for the holders of rights to receive the same per share consideration the holders of the common stock will receive in the transaction on an as-converted into common stock basis and each holder of a right will be required to affirmatively covert its rights in order to receive 1/10 share underlying each right (without paying additional consideration). The shares issuable upon exchange of the rights will be freely tradable (except to the extent held by affiliates of the Company).
If the Company is unable to complete a Business Combination within the Combination Period and the Company liquidates the funds held in the Trust Account, holders of rights will not receive any of such funds with respect to their rights, nor will they receive any distribution from the Company’s assets held outside of the Trust Account with respect to such rights, and the rights will expire worthless. Further, there are no contractual penalties for failure to deliver securities to the holders of the rights upon consummation of a Business Combination. Additionally, in no event will the Company be required to net cash settle the rights. Accordingly, the rights may expire worthless.
Warrants—Public Warrants may only be exercised for a whole number of shares. No fractional shares will be issued upon exercise of the Public Warrants. The Public Warrants will become exercisable on the later of (a) 30 days after the completion of a Business Combination or (b) 12 months from the closing of the Initial Public Offering; provided in each case that the Company has an effective registration statement under the Securities Act covering the shares of common stock issuable upon exercise of the Public Warrants and a current prospectus relating to them is available. The Company has agreed that as soon as practicable, but in no event later than 20 business days after the closing of a Business Combination, the Company will use its best efforts to file with the SEC a registration statement for the registration, under the Securities Act, of the shares of Class A common stock issuable upon exercise of the Public Warrants. The Company will use its best efforts to cause the
F-61
Table of Contents
same to become effective and to maintain the effectiveness of such registration statement, and a current prospectus relating thereto, until the expiration of the Public Warrants in accordance with the provisions of the warrant agreement. Notwithstanding the foregoing, if a registration statement covering the shares of Class A common stock issuable upon exercise of the Public Warrants is not effective within a specified period following the consummation of Business Combination, warrant holders may, until such time as there is an effective registration statement and during any period when the Company shall have failed to maintain an effective registration statement, exercise warrants on a cashless basis pursuant to the exemption provided by Section 3(a)(9) of the Securities Act, provided that such exemption is available. If that exemption, or another exemption, is not available, holders will not be able to exercise their warrants on a cashless basis. The Public Warrants will expire five years after the completion of a Business Combination or earlier upon redemption or liquidation.
The Private Warrants will be identical to the Public Warrants underlying the Units being sold in the Initial Public Offering, except that the Private Warrants and the Class A common stock issuable upon the exercise of the Private Warrants will not be transferable, assignable or salable until 30 days after the completion of a Business Combination, subject to certain limited exceptions. Additionally, the Placement Warrants will be exercisable on a cashless basis and be non-redeemable so long as they are held by the initial purchasers or their permitted transferees. If the Placement Warrants are held by someone other than the initial purchasers or their permitted transferees, the Placement Warrants will be redeemable by the Company and exercisable by such holders on the same basis as the Public Warrants.
The Company may redeem the Public Warrants (except with respect to the Placement Warrants):
| • | in whole and not in part; |
| • | at a price of $0.01 per warrant; |
| • | at any time during the exercise period; |
| • | upon a minimum of 30 days’ prior written notice of redemption; and |
| • | if, and only if, the last sale price of the Company’s Class A common stock equals or exceeds $18.00 per share for any 20 trading days within a 30-trading day period ending on the third trading day prior to the date on which the Company sends the notice of redemption to the warrant holders. |
| • | If, and only if, there is a current registration statement in effect with respect to the shares of Class A common stock underlying such warrants. |
If the Company calls the Public Warrants for redemption, management will have the option to require all holders that wish to exercise the Public Warrants to do so on a “cashless basis,” as described in the warrant agreement.
The exercise price and number of shares of Class A common stock issuable upon exercise of the warrants may be adjusted in certain circumstances including in the event of a stock dividend, or recapitalization, reorganization, merger or consolidation. However, the warrants will not be adjusted for issuance of Class A common stock at a price below its exercise price. Additionally, in no event will the Company be required to net cash settle the warrants. If the Company is unable to complete a Business Combination within the Combination Period and the Company liquidates the funds held in the Trust Account, holders of warrants will not receive any of such funds with respect to their warrants, nor will they receive any distribution from the Company’s assets held outside of the Trust Account with the respect to such warrants. Accordingly, the warrants may expire worthless.
Unit Purchase Option
On April 6, 2017, the Company sold to the underwriter (and/or its designees), for $100, an option to purchase up to 1,125,000 Units exercisable at $10.00 per Unit (or an aggregate exercise price of $11,250,000)
F-62
Table of Contents
commencing on the later of the first anniversary of the effective date of the registration statement related to the Initial Public Offering and the consummation of a Business Combination. The unit purchase option may be exercised for cash or on a cashless basis, at the holder’s option, and expires five years from the effective date of the registration statement related to the Initial Public Offering. The Units issuable upon exercise of this option are identical to those offered in the Initial Public Offering. The Company accounted for the unit purchase option, inclusive of the receipt of $100 cash payment, as an expense of the Initial Public Offering resulting in a charge directly to stockholders’ equity. The Company estimated the fair value of this unit purchase option to be approximately $3,782,546 (or $3.36 per Unit) using the Black-Scholes option-pricing model. The fair value of the unit purchase option granted to the underwriters was estimated as of the date of grant using the following assumptions: (1) expected volatility of 35%, (2) risk-free interest rate of 1.81% and (3) expected life of five years. The option and such units purchased pursuant to the option, as well as the common stock underlying such units, the rights included in such units, the common stock that is issuable for the rights included in such units, the warrants included in such units, and the shares underlying such warrants, have been deemed compensation by FINRA and are therefore subject to a 180-day lock-up pursuant to Rule 5110(g)(1) of FINRA’s NASDAQ Conduct Rules. Additionally, the option may not be sold, transferred, assigned, pledged or hypothecated for a one-year period (including the foregoing 180-day period) following the date of Initial Public Offering except to any underwriter and selected dealer participating in the Initial Public Offering and their bona fide officers or partners. The option grants to holders demand and “piggy back” rights for periods of five and seven years, respectively, from the effective date of the registration statement with respect to the registration under the Securities Act of the securities directly and indirectly issuable upon exercise of the option. The Company will bear all fees and expenses attendant to registering the securities, other than underwriting commissions which will be paid for by the holders themselves. The exercise price and number of units issuable upon exercise of the option may be adjusted in certain circumstances including in the event of a stock dividend, or the Company’s recapitalization, reorganization, merger or consolidation. However, the option will not be adjusted for issuances of ordinary shares at a price below its exercise price.
NOTE 10. INCOME TAX
The Company’s net deferred tax assets are as follows:
| December 31, 2017 |
||||
| Deferred tax asset |
||||
| Business combination search expenses |
$ | 27,815 | ||
|
|
|
|||
| Total deferred tax assets |
27,815 | |||
| Valuation allowance |
(27,815 | ) | ||
|
|
|
|||
| Deferred tax asset, net of allowance |
$ | — | ||
|
|
|
|||
The income tax provision (benefit) consists of the following:
| Year Ended December 31, 2017 |
||||
| Federal |
||||
| Current |
$ | 222,480 | ||
| Deferred |
(27,815 | ) | ||
| State |
||||
| Current |
$ | — | ||
| Deferred |
— | |||
| Change in valuation allowance |
27,815 | |||
|
|
|
|||
| Income tax provision |
$ | 222,480 | ||
|
|
|
|||
F-63
Table of Contents
As of December 31, 2017, the Company did not have any U.S. federal and state net operating loss carryovers (“NOLs”) available to offset future taxable income. In accordance with Section 382 of the Internal Revenue Code, deductibility of the Company’s NOLs may be subject to an annual limitation in the event of a change in control as defined under the regulations.
In assessing the realization of the deferred tax assets, management considers whether it is more likely than not that some portion of all of the deferred tax assets will not be realized. The ultimate realization of deferred tax assets is dependent upon the generation of future taxable income during the periods in which temporary differences representing net future deductible amounts become deductible. Management considers the scheduled reversal of deferred tax liabilities, projected future taxable income and tax planning strategies in making this assessment. After consideration of all of the information available, management believes that significant uncertainty exists with respect to future realization of the deferred tax assets and has therefore established a full valuation allowance. For the year ended December 31, 2017, the change in the valuation allowance was $27,815.
A reconciliation of the federal income tax rate to the Company’s effective tax rate at December 31, 2017 is as follows:
| Year Ended December 31, 2017 |
||||
| Statutory federal income tax rate |
(34.0 | )% | ||
| State taxes, net of federal tax benefit |
0.0 | % | ||
| Deferred tax liability rate change |
(3.3 | )% | ||
| Meals and entertainment |
(0.1 | )% | ||
| Change in valuation allowance |
(5.3 | )% | ||
|
|
|
|||
| Income tax provision (benefit) |
(42.7 | )% | ||
|
|
|
|||
The Company files income tax returns in the U.S. federal jurisdiction in various state and local jurisdictions and is subject to examination by the various taxing authorities. The Company considers New York to be a significant state tax jurisdiction.
NOTE 11. FAIR VALUE MEASUREMENTS
The Company follows the guidance in ASC 820 for its financial assets and liabilities that are re-measured and reported at fair value at each reporting period, and non-financial assets and liabilities that are re-measured and reported at fair value at least annually.
The fair value of the Company’s financial assets and liabilities reflects management’s estimate of amounts that the Company would have received in connection with the sale of the assets or paid in connection with the transfer of the liabilities in an orderly transaction between market participants at the measurement date. In connection with measuring the fair value of its assets and liabilities, the Company seeks to maximize the use of observable inputs (market data obtained from independent sources) and to minimize the use of unobservable inputs (internal assumptions about how market participants would price assets and liabilities). The following fair value hierarchy is used to classify assets and liabilities based on the observable inputs and unobservable inputs used in order to value the assets and liabilities:
Level 1: Quoted prices in active markets for identical assets or liabilities. An active market for an asset or liability is a market in which transactions for the asset or liability occur with sufficient frequency and volume to provide pricing information on an ongoing basis.
Level 2: Observable inputs other than Level 1 inputs. Examples of Level 2 inputs include quoted prices in active markets for similar assets or liabilities and quoted prices for identical assets or liabilities in markets that are not active.
F-64
Table of Contents
Level 3: Unobservable inputs based on our assessment of the assumptions that market participants would use in pricing the asset or liability.
The following table presents information about the Company’s assets that are measured at fair value on a recurring basis at December 31, 2017 and 2016, and indicates the fair value hierarchy of the valuation inputs the Company utilized to determine such fair value:
| Description |
Level | December 31, 2017 |
December 31, 2016 |
|||||||||
| Assets: |
||||||||||||
| Cash and marketable securities held in Trust Account |
1 | $ | 175,421,495 | $ | — | |||||||
NOTE 12. SUBSEQUENT EVENTS
The Company evaluates subsequent events and transactions that occur after the balance sheet date up to the date that the consolidated financial statements were issued. Based upon this review, the Company did not identify any subsequent events that would have required adjustment or disclosure in the consolidated financial statements.
F-65
Table of Contents
To the Members
SPS Holdco, LLC
Report on the Financial Statements
We have audited the accompanying consolidated financial statements of SPS Holdco, LLC and its subsidiaries (the Company), which comprise the consolidated balance sheets as of December 31, 2016 and 2015, and the related consolidated statements of operations, members’ equity and cash flows for the years then ended, and the related notes to the consolidated financial statements (collectively, the financial statements).
Management’s Responsibility for the Financial Statements
Management is responsible for the preparation and fair presentation of these financial statements in accordance with accounting principles generally accepted in the United States of America; this includes the design, implementation and maintenance of internal control relevant to the preparation and fair presentation of financial statements that are free from material misstatement, whether due to fraud or error.
Auditor’s Responsibility
Our responsibility is to express an opinion on these financial statements based on our audits. We conducted our audits in accordance with auditing standards generally accepted in the United States of America. Those standards require that we plan and perform the audit to obtain reasonable assurance about whether the financial statements are free from material misstatement.
An audit involves performing procedures to obtain audit evidence about the amounts and disclosures in the financial statements. The procedures selected depend on the auditor’s judgment, including the assessment of the risks of material misstatement of the financial statements, whether due to fraud or error. In making those risk assessments, the auditor considers internal control relevant to the entity’s preparation and fair presentation of the financial statements in order to design audit procedures that are appropriate in the circumstances, but not for the purpose of expressing an opinion on the effectiveness of the entity’s internal control. Accordingly, we express no such opinion. An audit also includes evaluating the appropriateness of accounting policies used and the reasonableness of significant accounting estimates made by management, as well as evaluating the overall presentation of the financial statements.
We believe that the audit evidence we have obtained is sufficient and appropriate to provide a basis for our audit opinion.
Opinion
In our opinion, the financial statements referred to above present fairly, in all material respects, the financial position of SPS Holdco, LLC and its subsidiaries as of December 31, 2016 and 2015, and the results of their operations and their cash flows for the years then ended in accordance with accounting principles generally accepted in the United States of America.
/s/ RSM US LLP
New York, New York
November 10, 2017
F-66
Table of Contents
SPS Holdco, LLC and Subsidiaries
| As of December 31, |
As of June 30, 2017 |
|||||||||||
| 2015 | 2016 | |||||||||||
| (unaudited) | ||||||||||||
| Assets | ||||||||||||
| Current assets: |
||||||||||||
| Cash and cash equivalents |
$ | 3,822,828 | $ | 7,737,230 | $ | 5,088,479 | ||||||
| Restricted cash |
414,450 | 214,061 | 26,480 | |||||||||
| Accounts receivable, net of allowance for doubtful accounts of $1,076,877 and $1,166,877 as of December 31, 2015 and 2016 and $1,299,967 as of June 30, 2017 (unaudited) |
78,343,192 | 62,489,261 | 37,665,238 | |||||||||
| Inventory, net |
14,552,762 | 11,214,600 | 5,639,714 | |||||||||
| Prepaid expenses |
6,532,738 | 10,093,951 | 10,463,618 | |||||||||
|
|
|
|
|
|
|
|||||||
| Total current assets |
103,665,970 | 91,749,103 | 58,883,529 | |||||||||
|
|
|
|
|
|
|
|||||||
| Property and equipment, net |
15,676,193 | 19,554,127 | 21,211,127 | |||||||||
|
|
|
|
|
|
|
|||||||
| Other assets: |
||||||||||||
| Security deposits |
388,352 | 444,125 | 442,596 | |||||||||
| Goodwill |
143,129,550 | 71,916,000 | 71,916,000 | |||||||||
| Intangible assets, net |
36,497,163 | 27,540,657 | 24,363,255 | |||||||||
|
|
|
|
|
|
|
|||||||
| Total other assets |
180,015,065 | 99,900,782 | 96,721,851 | |||||||||
|
|
|
|
|
|
|
|||||||
| $299,357,228 | $211,204,012 | $176,816,507 | ||||||||||
|
|
|
|
|
|
|
|||||||
| Liabilities and Members’ Equity |
||||||||||||
| Current liabilities: |
||||||||||||
| Accounts payable |
28,457,305 | 38,800,776 | 32,526,395 | |||||||||
| Accrued compensation |
8,108,849 | 9,522,931 | 854,039 | |||||||||
| Other accrued expenses |
23,275,823 | 15,637,251 | 6,687,209 | |||||||||
| Deferred revenue, current portion |
28,734,547 | 17,789,122 | 19,033,254 | |||||||||
| Sales tax payable |
1,044,829 | 1,218,566 | 468,657 | |||||||||
| Long-term debt, current portion |
4,370,417 | 68,596,273 | 69,039,932 | |||||||||
| Line of credit |
— | 6,935,620 | 9,424,346 | |||||||||
| Due to shareholder |
287,500 | — | — | |||||||||
| Customer deposits |
3,181,431 | 4,433,426 | 3,735,591 | |||||||||
|
|
|
|
|
|
|
|||||||
| Total current liabilities |
97,460,701 | 162,933,965 | 141,769,423 | |||||||||
| Long-term liabilities: |
||||||||||||
| Long-term debt, net of current portion and debt discount |
67,708,975 | — | — | |||||||||
| Line of credit |
10,500,000 | — | — | |||||||||
| Capital lease obligations, net of current portion |
159,632 | 17,221 | 13,201 | |||||||||
| Deferred revenue, net of current portion |
3,571,357 | 2,652,718 | 2,221,716 | |||||||||
|
|
|
|
|
|
|
|||||||
| Total liabilities |
179,400,665 | 165,603,904 | 144,004,340 | |||||||||
|
|
|
|
|
|
|
|||||||
| Members’ equity |
119,956,563 | 45,600,108 | 32,812,166 | |||||||||
|
|
|
|
|
|
|
|||||||
| $ | 299,357,228 | $ | 211,204,012 | $ | 176,816,506 | |||||||
|
|
|
|
|
|
|
|||||||
See notes to consolidated financial statements.
F-67
Table of Contents
SPS Holdco, LLC and Subsidiaries
Consolidated Statements of Operations
| Year Ended December 31, |
Six Months Ended June 30, |
|||||||||||||||
| 2015 | 2016 | 2016 | 2017 | |||||||||||||
| (unaudited) | ||||||||||||||||
| Net sales |
||||||||||||||||
| Product |
$ | 112,560,718 | $ | 120,093,980 | $ | 54,186,039 | $ | 45,587,707 | ||||||||
| Services |
197,519,930 | 201,370,199 | 99,202,595 | 91,007,593 | ||||||||||||
|
|
|
|
|
|
|
|
|
|||||||||
| Total net sales |
310,080,648 | 321,464,179 | 153,388,634 | 136,595,300 | ||||||||||||
| Cost of goods sold |
||||||||||||||||
| Product |
90,950,126 | 95,071,566 | 45,183,897 | 36,983,107 | ||||||||||||
| Services |
120,573,756 | 125,804,757 | 60,386,112 | 61,263,915 | ||||||||||||
|
|
|
|
|
|
|
|
|
|||||||||
| Total cost of sales |
211,523,882 | 220,876,323 | 105,570,009 | 98,247,022 | ||||||||||||
|
|
|
|
|
|
|
|
|
|||||||||
| Gross profit |
98,556,766 | 100,587,856 | 47,818,625 | 38,348,278 | ||||||||||||
| Operating expenses: |
||||||||||||||||
| Selling, general and administrative expenses |
80,151,622 | 86,074,608 | 40,111,664 | 42,460,746 | ||||||||||||
| Depreciation and amortization |
11,682,124 | 11,740,829 | 5,826,197 | 5,082,007 | ||||||||||||
| Impairment of goodwill |
— | 70,861,416 | — | — | ||||||||||||
|
|
|
|
|
|
|
|
|
|||||||||
| Operating expenses |
91,833,746 | 168,676,853 | 45,937,861 | 47,542,753 | ||||||||||||
|
|
|
|
|
|
|
|
|
|||||||||
| Operating income (loss) |
6,723,020 | (68,088,997 | ) | 1,880,764 | (9,194,475 | ) | ||||||||||
|
|
|
|
|
|
|
|
|
|||||||||
| Other income (expense): |
||||||||||||||||
| Interest income |
557 | 29,061 | 27,199 | 650 | ||||||||||||
| Interest expense |
(5,915,156 | ) | (6,156,737 | ) | (2,782,644 | ) | (3,721,967 | ) | ||||||||
|
|
|
|
|
|
|
|
|
|||||||||
| (5,914,599 | ) | (6,127,676 | ) | (2,755,445 | ) | (3,721,317 | ) | |||||||||
|
|
|
|
|
|
|
|
|
|||||||||
| Income (loss) before provision for state income taxes |
808,421 | (74,216,673 | ) | (874,681 | ) | (12,915,792 | ) | |||||||||
| Provision for state income taxes |
395,405 | 167,622 | 126,025 | 76,480 | ||||||||||||
|
|
|
|
|
|
|
|
|
|||||||||
| Net income (loss) |
$ | 413,016 | $ | (74,384,295 | ) | $ | (1,000,706 | ) | $ | (12,992,272 | ) | |||||
|
|
|
|
|
|
|
|
|
|||||||||
See notes to consolidated financial statements.
F-68
Table of Contents
SPS Holdco, LLC and Subsidiaries
Consolidated Statements of Members’ Equity
| Common | Accumulated | Notes Receivable | Total | |||||||||||||||||
| Units | Amount | Earnings | for Stock | Members’ Equity | ||||||||||||||||
| Balance, January 1, 2015 |
115,507,173 | $ | 113,225,924 | $ | 5,735,018 | $ | — | $ | 118,960,942 | |||||||||||
| Repurchase of common units - shareholder |
(250,000 | ) | (287,500 | ) | — | — | (287,500 | ) | ||||||||||||
| Issuance of common units |
500,000 | 500,000 | — | — | 500,000 | |||||||||||||||
| Note receivable issued in exchange for common units |
400,000 | 400,000 | (400,000 | ) | — | |||||||||||||||
| Unit based compensation |
— | — | 370,105 | — | 370,105 | |||||||||||||||
| Net income |
— | — | 413,016 | — | 413,016 | |||||||||||||||
|
|
|
|
|
|
|
|
|
|
|
|||||||||||
| Balance, December 31, 2015 |
116,157,173 | 113,838,424 | 6,518,139 | (400,000 | ) | 119,956,563 | ||||||||||||||
| Repurchase of common units and forgiveness of note receivable - related party |
(400,000 | ) | (400,000 | ) | — | 400,000 | — | |||||||||||||
| Repurchase of common units - shareholder |
(100,000 | ) | (100,000 | ) | — | — | (100,000 | ) | ||||||||||||
| Note receivable issued in exchange for common units |
86,957 | 86,957 | 13,043 | (100,000 | ) | — | ||||||||||||||
| Unit based compensation |
— | — | 127,840 | — | 127,840 | |||||||||||||||
| Net loss |
— | — | (74,384,295 | ) | — | (74,384,295 | ) | |||||||||||||
|
|
|
|
|
|
|
|
|
|
|
|||||||||||
| Balance, December 31, 2016 |
115,744,130 | $ | 113,425,381 | $ | (67,725,273 | ) | $ | (100,000 | ) | $ | 45,600,108 | |||||||||
| Unit based compensation |
— | — | 204,330 | — | 204,330 | |||||||||||||||
| Net loss |
— | — | (12,992,272 | ) | — | (12,992,272 | ) | |||||||||||||
|
|
|
|
|
|
|
|
|
|
|
|||||||||||
| Balance, June 30, 2017 (unaudited) |
115,744,130 | $ | 113,425,381 | $ | (80,513,215 | ) | $ | (100,000 | ) | $ | 32,812,166 | |||||||||
|
|
|
|
|
|
|
|
|
|
|
|||||||||||
See notes to consolidated financial statements.
F-69
Table of Contents
SPS Holdco, LLC and Subsidiaries
Consolidated Statements of Cash Flows
| Year Ended December 31, |
Six Months Ended June 30, |
|||||||||||||||
| 2015 | 2016 | 2016 | 2017 | |||||||||||||
| (unaudited) | ||||||||||||||||
| Cash flows from operating activities: |
||||||||||||||||
| Net income (loss) |
$ | 413,016 | $ | (74,384,295 | ) | $ | (1,000,706 | ) | $ | (12,992,272 | ) | |||||
| Adjustments to reconcile net income (loss) to net cash provided by operating activities: |
||||||||||||||||
| Depreciation and amortization |
14,781,611 | 14,719,584 | 7,237,746 | 6,371,358 | ||||||||||||
| Accretion of debt discount |
618,112 | 887,299 | 309,056 | 309,056 | ||||||||||||
| Bad debt (recoveries) expense |
(663,614 | ) | 502,464 | 40,000 | — | |||||||||||
| Unit based compensation |
370,105 | 127,840 | 63,920 | 204,330 | ||||||||||||
| Impairment of goodwill |
— | 70,861,416 | — | — | ||||||||||||
| Other non cash items |
— | — | 301,550 | — | ||||||||||||
| Change in operating assets and liabilities, net of acquisitions: |
||||||||||||||||
| Decrease in restricted cash |
48,190 | 200,389 | 20,570 | 187,581 | ||||||||||||
| (Increase) decrease in accounts receivable |
(12,739,019 | ) | 15,223,671 | 30,213,548 | 24,824,023 | |||||||||||
| (Increase) decrease in inventory |
(3,028,038 | ) | 3,338,162 | 1,837,715 | 5,574,886 | |||||||||||
| Increase in prepaid expenses |
(102,432 | ) | (3,561,213 | ) | (4,966,709 | ) | (369,667 | ) | ||||||||
| Increase (decrease) in accounts payable |
6,915,484 | 10,343,471 | (3,762,157 | ) | (6,274,379 | ) | ||||||||||
| Decrease in accrued expenses and sales tax payable |
(4,436,808 | ) | (6,050,752 | ) | (10,496,317 | ) | (18,368,843 | ) | ||||||||
| Increase (decrease) in deferred revenue |
2,684,583 | (11,864,064 | ) | (7,152,332 | ) | 813,130 | ||||||||||
| Increase (decrease) in customer deposits |
39,926 | 1,251,995 | 1,444,790 | (697,835 | ) | |||||||||||
|
|
|
|
|
|
|
|
|
|||||||||
| Net cash provided by (used in) operating activities |
4,901,116 | 21,595,967 | 14,090,674 | (418,632 | ) | |||||||||||
|
|
|
|
|
|
|
|
|
|||||||||
| Cash flows from investing activities: |
||||||||||||||||
| Purchase of equipment |
(9,357,466 | ) | (9,641,013 | ) | (6,345,290 | ) | (4,716,364 | ) | ||||||||
| Increase in purchase price consideration - Adcap |
— | 479,930 | 479,930 | — | ||||||||||||
| Increase in security deposits and other |
(76,586 | ) | (55,773 | ) | 21,925 | 1,529 | ||||||||||
| Cash paid for acquisitions |
(18,205,274 | ) | — | — | — | |||||||||||
|
|
|
|
|
|
|
|
|
|||||||||
| Net cash used in investing activities |
(27,639,326 | ) | (9,216,856 | ) | (5,843,435 | ) | (4,714,835 | ) | ||||||||
|
|
|
|
|
|
|
|
|
|||||||||
| Cash flows from financing activities: |
||||||||||||||||
| Principal payment of debt and capital leases |
(6,681,877 | ) | (8,077,209 | ) | (2,153,353 | ) | (4,020 | ) | ||||||||
| Proceeds from issuance of holder units |
500,000 | — | — | — | ||||||||||||
| Proceeds from (payments of) line of credit |
10,500,000 | — | (5,000,000 | ) | 2,488,736 | |||||||||||
| Repurchase of units |
— | (387,500 | ) | (287,500 | ) | — | ||||||||||
|
|
|
|
|
|
|
|
|
|||||||||
| Net cash provided by (used in) financing activities |
4,318,123 | (8,464,709 | ) | (7,440,853 | ) | 2,484,716 | ||||||||||
|
|
|
|
|
|
|
|
|
|||||||||
| Net (decrease) increase in cash and cash equivalents |
(18,420,087 | ) | 3,914,402 | 806,384 | (2,648,751 | ) | ||||||||||
| Cash and cash equivalents: |
||||||||||||||||
| Beginning |
22,242,915 | 3,822,828 | 3,822,828 | 7,737,230 | ||||||||||||
|
|
|
|
|
|
|
|
|
|||||||||
| Ending |
$ | 3,822,828 | $ | 7,737,230 | $ | 4,629,212 | $ | 5,088,479 | ||||||||
|
|
|
|
|
|
|
|
|
|||||||||
| Supplemental disclosures of cash flow information: |
||||||||||||||||
| Cash paid during the year for: |
||||||||||||||||
| Interest |
$ | 5,942,860 | $ | 5,090,280 | $ | 2,825,704 | $ | 736,704 | ||||||||
|
|
|
|
|
|
|
|
|
|||||||||
| Income taxes |
$ | 590,816 | $ | 103,371 | $ | — | $ | — | ||||||||
|
|
|
|
|
|
|
|
|
|||||||||
| Summary of Noncash Items: |
||||||||||||||||
| Issuance of note payable in exchange for common units |
$ | 287,500 | $ | 100,000 | $ | — | $ | — | ||||||||
|
|
|
|
|
|
|
|
|
|||||||||
| Acquisition of equipment under capital leases |
$ | 180,454 | $ | — | $ | — | $ | — | ||||||||
|
|
|
|
|
|
|
|
|
|||||||||
| Supplemental disclosures of non-cash financing activities: |
||||||||||||||||
| Acquisition of ExtraTeam, Inc: |
||||||||||||||||
| Working capital assets acquired |
$ | 3,299,144 | $ | — | $ | — | $ | — | ||||||||
| Property and equipment |
155,697 | — | — | — | ||||||||||||
| Security deposits |
10,000 | — | — | — | ||||||||||||
| Intangible assets, subject to amortization |
1,000,000 | — | — | — | ||||||||||||
| Goodwill |
7,286,171 | — | — | — | ||||||||||||
| Working capital liabilities assumed |
(3,410,710 | ) | — | — | — | |||||||||||
|
|
|
|
|
|
|
|
|
|||||||||
| $ | 8,340,302 | $ | — | $ | — | $ | — | |||||||||
|
|
|
|
|
|
|
|
|
|||||||||
| Acquisition of AdCap Network Systems, Inc.: |
||||||||||||||||
| Working capital assets acquired |
$ | 3,076,876 | $ | — | $ | — | $ | — | ||||||||
| Property and equipment |
332,887 | — | — | — | ||||||||||||
| Security deposits |
11,689 | — | — | — | ||||||||||||
| Intangible assets, subject to amortization |
1,200,000 | — | — | — | ||||||||||||
| Goodwill |
7,456,398 | — | — | — | ||||||||||||
| Working capital liabilities assumed |
(3,296,749 | ) | — | — | — | |||||||||||
|
|
|
|
|
|
|
|
|
|||||||||
| $ | 8,781,101 | $ | — | $ | — | $ | — | |||||||||
|
|
|
|
|
|
|
|
|
|||||||||
See notes to consolidated financial statements.
F-70
Table of Contents
SPS Holdco, LLC and Subsidiaries
Notes to Consolidated Financial Statements
Note 1. Summary of Significant Accounting Policies
Organization and principal business activity: SPS Holdco, LLC is a holding company, the principal asset of which consists of all of the outstanding stock of Strategic Products and Services, LLC, the wholly owned subsidiary. Strategic Products and Services, LLC and its wholly owned subsidiary, Providea Conferencing, LLC, provides integrated communications equipment and services for voice solutions and data networking applications. SPS Holdco, LLC is headquartered in Parsippany, New Jersey. Through its headquarters and remote offices, it services locations both domestically and internationally.
Basis of presentation: The accompanying consolidated financial statements include the accounts of SPS Holdco, LLC and its wholly owned subsidiary, Strategic Products and Services, LLC, and its wholly owned subsidiary, Providea Conferencing, LLC (collectively, the Company). Intercompany balances and transactions have been eliminated in consolidation.
Unaudited Interim Financial Information: The accompanying interim consolidated balance sheet as of June 30, 2017 and the consolidated statements of operations, and cash flows for the six months ended June 30, 2016 and 2017, and the consolidated statement of members’ equity for the six months ended June 30, 2017 and the related footnote disclosures, or collectively, the unaudited interim consolidated financial statements, are unaudited. The unaudited interim consolidated financial statements have been prepared on a basis consistent with the annual consolidated financial statements and, in the opinion of management, reflect all adjustments necessary to present fairly its consolidated financial position as of June 30, 2017 and its results of operations and cash flows for the six months ended June 30, 2016 and 2017. The results for the six months ended June 30, 2016 and 2017 are not necessarily indicative of the results expected for the full fiscal year or any other period.
Inventory: Inventory, which consists entirely of finished goods, is stated at the lower of cost (determined by the average-cost method) or market.
Depreciation and amortization: Property and equipment is recorded at cost. The Company utilizes the straight-line method of depreciation based on the estimated useful lives of the respective assets ranging from 3 to 10 years. Leasehold improvements are amortized over the shorter of the estimated useful lives or the life of the related lease.
Goodwill: The Company’s goodwill was recorded as a result of the Company’s business combinations. The Company has recorded these business combinations using acquisition accounting. The Company tests its recorded goodwill for impairment on an annual basis at October 1, or more often if indicators of potential impairment exist, by determining if the carrying value of each reporting unit exceeds its estimated fair value. Factors that could trigger an interim impairment test include, but are not limited to, underperformance relative to historical or projected future operating results, significant changes in the manner of use of the acquired assets and the Company’s overall business and significant negative industry or economic trends. During 2015, the Company determined that no impairment of goodwill existed because the estimated fair value of its reporting unit exceeded its carrying amount. During 2016, the Company recorded an impairment charge of $70,861,416. There were no impairment losses recorded during the six months ended June 30, 2017 (unaudited).
Intangible assets subject to amortization: Intangible assets consist of trade names and trademarks, customer relationships, customer backlog and noncompete agreements, which are being amortized over the estimated useful life of each, which range from 6 months to 15 years. The Company reviews for possible impairment whenever circumstances indicate the carrying value of the assets may not be recoverable. A loss is recognized in the consolidated statements of income if it is determined that an impairment exists based on expected future undiscounted cash flows. The amount of the impairment is the excess of the carrying amount of the impaired asset over its fair value. There were no impairment losses recorded during the years ended December 31, 2016 and 2015 or the six months ended June 30, 2017 (unaudited).
F-71
Table of Contents
SPS Holdco, LLC and Subsidiaries
Notes to Consolidated Financial Statements
Note 1. Summary of Significant Accounting Policies—(Continued)
Revenue recognition: The Company recognizes systems sales revenue upon shipment of the equipment and installation services revenue upon completion of the installation of the system. Services revenue earned from maintenance contracts is recognized ratably over the term of the underlying contract on a straight-line basis. Deferred revenue is comprised primarily of the unearned portion of maintenance revenues paid in advance. Third-party costs associated with servicing these maintenance contracts are netted against deferred revenue in the consolidated balance sheets. These costs are expensed ratably over the term of the underlying contracts.
The Company recognizes revenue from managed service arrangements whereby the Company provides monthly maintenance and on-site technical support. Revenue is recognized monthly as services are provided.
The Company enters into multiple deliverable arrangements, which may include various combinations of products, installation services, maintenance contracts and managed services. Most product and service deliverables qualify as separate units of accounting and can be sold on a standalone basis. A deliverable constitutes a separate unit of accounting when it has standalone value and, where return rights exist, delivery or performance of the undelivered items is considered probable and substantially within the Company’s control. Most of the Company’s solutions have both software and non-software components that function together to deliver the products’ essential functionality. For these multiple deliverable arrangements, the Company allocates revenue to the deliverables based on their relative selling prices. To the extent that a deliverable is subject to specific guidance on whether and/or how to allocate the consideration in a multiple deliverable arrangement, that deliverable is accounted for in accordance with such specific guidance. The Company limits the amount of revenue recognition for delivered items to the amount that is not contingent on the future delivery of products or services or meeting other future performance obligations.
The Company allocates revenue based on a selling price hierarchy of vendor-specific objective evidence, third-party evidence, and then selling price. Vendor-specific objective evidence is based on the price charged when the deliverable is sold separately. Third-party evidence is based on largely interchangeable competitor products or services in standalone sales to similarly situated customers. As the Company is unable to reliably determine what competitors products’ selling prices are on a standalone basis, the Company is not typically able to determine third-party evidence. Estimated selling price is based on the Company’s best estimates of what the selling prices of deliverables would be if they were sold regularly on a standalone basis. Estimated selling price is established considering multiple factors including, but not limited to, pricing practices in different geographies and through different sales channels, major product and services groups, and customer classifications.
The Company considers the principal versus agent accounting guidance to determine if the Company is the primary obligor in the arrangement and if revenue should be recognized gross or net of the associated costs. Applying the principal versus agent accounting guidance is a matter of judgment based on consideration of several factors and indicators.
Revenue from the sale of third-party retail maintenance contracts is recognized net of the related cost of revenue. In third-party retail maintenance contracts, all services are provided by third-party providers and, as a result, the Company concluded that it is acting as an agent and is not considered the primary obligor. As the Company is under no obligation to perform additional services, revenue is recognized net at the time of sale.
Revenue from the sale of third-party wholesale maintenance contracts is recognized on a gross basis over the life of the contract with the selling price to the customer recorded as revenue and the acquisition cost recorded as cost of revenue. Based upon the evaluation of indicators for net and gross reporting, the Company has concluded that it is acting as a principal in these contracts.
Use of estimates: The preparation of financial statements in conformity with accounting principles generally accepted in the United States of America requires management to make estimates and assumptions that
F-72
Table of Contents
SPS Holdco, LLC and Subsidiaries
Notes to Consolidated Financial Statements
Note 1. Summary of Significant Accounting Policies—(Continued)
affect the reported amounts of assets and liabilities at the date of the financial statements and the reported amounts of revenue and expenses during the period. Actual results could differ from those estimates.
Income taxes: The Company is a limited liability company and, as such, is taxed as a partnership and the members separately account for their pro-rata shares of the Company’s income for federal and state income tax purposes. In addition, the Company is required to pay franchise tax and unincorporated business tax in the local jurisdictions.
The Company follows the accounting standard on accounting for uncertainty in income taxes ASC 740-10, which addresses the determination of whether tax benefits claimed or expected to be claimed on a tax return should be recorded in the financial statements. Under this guidance, the Company may recognize the tax benefit from an uncertain tax position only if it is more likely than not that the tax position will be sustained on examination by taxing authorities, based on the technical merits of the position. The tax benefits recognized in the financial statements from such a position are measured based on the largest benefit that has a greater than 50 percent likelihood of being realized upon ultimate settlement. The guidance on accounting for uncertainty in income taxes also addresses derecognition, classification, interest and penalties on income taxes, and accounting in interim periods. The Company recognizes interest and penalties, if any, in its provision for income taxes.
Cash and cash equivalents: The Company considers all highly liquid investments with a maturity of three months or less at time of purchase to be cash equivalents. The Company maintains its cash and cash equivalents at financial institutions. The combined account balances at several institutions exceed Federal Deposit Insurance Corporation (FDIC) insurance coverage and, as a result, there is a concentration of credit risk related to amounts on deposit in excess of FDIC insurance coverage.
Shipping costs: Shipping costs of approximately $1,747,000 and $1,671,500 and are included in cost of goods sold for the years ended December 31, 2015 and 2016, respectively. Shipping costs of approximately $472,000 and $245,000 are included in cost of goods sold for the six months ended June 30, 2016 and 2017 (unaudited), respectively.
Customer deposits: The Company recognizes sales upon delivery and installation of equipment. Customer deposits are monies advanced by customers in advance of installation.
Financing costs: Costs incurred to secure long-term debt are recorded as a discount on the debt and amortized as a component of interest expense using the effective interest method over the term of the associated debt.
Advertising: Total advertising costs for the years ended December 31, 2015 and 2016 were each approximately $1,250,000. Total advertising costs for the six months ended June 30, 2016 and 2017(unaudited) were each approximately $625,000.
Recently issued accounting pronouncement: In January 2017, the Financial Accounting Standards Board (FASB) issued Accounting Standards Update (ASU) 2017-01, Business Combinations: Clarifying the Definition of a Business. The amendment clarifies the definition of a business with the objective of adding guidance to assist entities with evaluating whether transactions should be accounted for as acquisitions (or disposals) of assets or businesses. ASU 2017-01 is effective for fiscal years beginning after December 15, 2017, and interim periods within those fiscal years, with early adoption permitted. The Company is currently assessing the impact that ASU 2017-01 will have on the Company’s consolidated financial statements.
In August 2016, the FASB issued ASU 2016-15, Statement of Cash Flows – Classification of Certain Cash Receipts and Cash Payments. The amendments in this update provide specific guidance on the eight cash flow
F-73
Table of Contents
SPS Holdco, LLC and Subsidiaries
Notes to Consolidated Financial Statements
Note 1. Summary of Significant Accounting Policies—(Continued)
classification issues included in the amendments in this update. The guidance will be effective for fiscal years beginning after December 15, 2018. Early adoption is permitted for annual and interim periods. The Company is currently assessing the impact that ASU 2016-15 will have on the Company’s consolidated financial statements.
In March 2016, the FASB issued ASU 2016-09, Improvements to Employee Share-Based Payment Accounting. The update simplifies several aspects of the accounting for share-based payment transactions, including the income tax consequences, classification of awards as either equity or liabilities, and classification on the statement of cash flows. ASU 2016-09 is effective for fiscal years beginning after December 15, 2017, and interim periods beginning after December 15, 2018. Early adoption is permitted. The Company is currently assessing the impact that ASU 2016-09 will have on the Company’s consolidated financial statements.
In February 2016, the FASB issued ASU 2016-02, Leases (Topic 842). The guidance in this ASU supersedes the leasing guidance in Topic 840, Leases. Under the new guidance, lessees are required to recognize lease assets and lease liabilities on the balance sheet for all leases with terms longer than 12 months. Leases will be classified as either finance or operating, with classification affecting the pattern of expense recognition in the income statement. The new standard is effective for fiscal years beginning after December 15, 2019, including interim periods within those fiscal years. A modified retrospective transition approach is required for lessees for capital and operating leases existing at, or entered into after, the beginning of the earliest comparative period presented in the financial statements, with certain practical expedients available. The Company is currently evaluating the impact of the pending adoption of the new standard on its consolidated financial statements.
In July 2015, the FASB issued ASU 2015-11, Inventory (Topic 330): Simplifying the Measurement of Inventory. The amendments in the ASU require entities that measure inventory using the first-in, first-out or average cost methods to measure inventory at the lower of cost and net realizable value. Net realizable value is defined as estimated selling price in the ordinary course of business less reasonably predictable costs of completion, disposal and transportation. This ASU will be effective for the Company for fiscal years beginning after December 15, 2016. Early adoption of ASU 2015-11 is permitted. The Company is currently evaluating the effects adoption of this guidance will have on its consolidated financial statements.
In April, 2015, the FASB issued ASU 2015-03, Interest—Imputation of Interest—Simplifying the Presentation of Debt Issuance Costs, which requires that debt issuance costs related to a recognized debt liability be presented in the balance sheet as a direct deduction from the carrying amount of that debt liability, consistent with debt discounts. The recognition and measurement guidance for debt issuance costs are not affected by this ASU. This ASU is effective for financial statements issued for fiscal years beginning after December 15, 2015, and interim periods within fiscal years beginning after December 15, 2016. The Company does not believe this standard will have a material impact on the Company’s consolidated financial position or results of its operations.
In May 2014, the FASB issued ASU No. 2014-09, Revenue from Contracts with Customers. ASU 2014-09 requires an entity to recognize the amount of revenue to which it expects to be entitled for the transfer of promised goods or services to customers. ASU 2014-09 will replace most existing revenue recognition guidance in U.S. Generally Accepted Accounting Principles (U.S. GAAP) when it becomes effective and permits the use of either a full retrospective or retrospective with cumulative effect transition method. In August 2015, the FASB issued ASU 2015-14 which defers the effective date of ASU 2014-09 one year making it effective for annual reporting periods beginning after December 15, 2018. The Company is evaluating the effect that the standard will have on its consolidated financial statements and related disclosures. The Company has not yet selected a transition method nor has it determined the effect of the standard on its ongoing financial reporting.
F-74
Table of Contents
SPS Holdco, LLC and Subsidiaries
Notes to Consolidated Financial Statements
Note 2. Acquisitions
ExtraTeam, Inc: On March 2, 2015, Strategic Products and Services, LLC acquired certain assets and assumed certain liabilities of ExtraTeam, Inc. (ExtraTeam) through an asset acquisition for a purchase price of $8,500,000 prior to working capital adjustments of $150,698. The aggregate purchase consideration was funded with cash consideration of $8,340,302. Located in Pleasanton, California, ExtraTeam provides computer network solutions and consulting services for businesses to ensure secure and efficient access to their information and technology systems. The acquisition allows for the Company to broaden its geographic reach and strengthen existing partner relationships.
This acquisition was accounted for as a business combination and, accordingly, the aggregate purchase price was allocated to the underlying assets and liabilities based upon their respective fair value at the date of acquisition. The excess of the cost over the fair value of the net assets acquired is $7,286,171 and is recorded as goodwill. Acquisition costs of approximately $220,000 are included in selling, general and administrative expenses in the consolidated statements of income for the year ended December 31, 2015. Goodwill is deductible for income tax purposes.
The following table summarizes the estimated fair value of the assets acquired at the date of the acquisition:
| Working capital assets acquired |
$ | 3,299,144 | ||
| Property and equipment |
155,697 | |||
| Security deposits |
10,000 | |||
| Intangible assets, subject to amortization |
1,000,000 | |||
| Goodwill |
7,286,171 | |||
| Working capital liabilities assumed |
(3,410,710 | ) | ||
|
|
|
|||
| $ | 8,340,302 | |||
|
|
|
AdCap Network Systems, Inc: On October 15, 2015, Strategic Products and Services, LLC acquired certain assets and assumed certain liabilities of AdCap Network Systems, Inc. (AdCap) for an aggregate purchase price of approximately $8,800,000. The aggregate purchase consideration was funded with cash consideration. This acquisition was accounted for as a business combination and, accordingly, the aggregate purchase price was allocated to the underlying assets and liabilities based upon their respective fair value at the date of acquisition. The excess of the cost over the fair value of the net assets acquired is $7,456,398 and is recorded as goodwill. Acquisition costs of approximately $400,000 are included in selling, general and administrative expenses in the consolidated statements of income for the year ended December 31, 2015. Goodwill is deductible for income tax purposes.
The following table summarizes the estimated fair value of the assets acquired at the date of the acquisition:
| Cash Consideration |
$ | 8,781,101 | ||
|
|
|
|||
| Working capital assets acquired |
$ | 3,076,876 | ||
| Property and equipment |
332,887 | |||
| Security deposits |
11,689 | |||
| Intangible assets, subject to amortization |
1,200,000 | |||
| Goodwill |
7,456,398 | |||
| Working capital liabilities assumed |
(3,296,749 | ) | ||
|
|
|
|||
| $ | 8,781,101 | |||
|
|
|
IPV Gateways Inc: On November 27, 2015, Strategic Products and Services , LLC acquired certain customer relationship assets of IPV Gateways Inc (IPV) in exchange for cash consideration of approximately
F-75
Table of Contents
SPS Holdco, LLC and Subsidiaries
Notes to Consolidated Financial Statements
Note 2. Acquisitions—(Continued)
$1,100,000. The transaction is being treated as an asset purchase with the consideration included in customer relationships within intangible assets in the consolidated balance sheets at December 31, 2015.
Note 3. Accounts Receivable
The Company carries its accounts receivable at cost less an allowance for doubtful accounts. On a periodic basis, the Company evaluates its accounts receivable and establishes an allowance for doubtful accounts based on the history of past write-offs and collections, and current conditions.
Note 4. Inventory
Inventory, net, consists of the following:
| As of December 31, |
As of June 30, 2017 |
|||||||||||
| 2015 | 2016 | |||||||||||
| (unaudited) | ||||||||||||
| Inventory |
$ | 14,802,762 | $ | 12,700,589 | $ | 7,572,513 | ||||||
| Less reserve for obsolescence |
250,000 | 1,485,989 | 1,932,799 | |||||||||
|
|
|
|
|
|
|
|||||||
| $ | 14,552,762 | $ | 11,214,600 | $ | 5,639,714 | |||||||
|
|
|
|
|
|
|
|||||||
Note 5. Property and Equipment
Property and equipment consists of the following:
| As of December 31, |
As of June 30, 2017 |
|||||||||||
| 2015 | 2016 | |||||||||||
| (unaudited) | ||||||||||||
| Company vehicles |
$ | 80,132 | $ | 26,581 | $ | 15,614 | ||||||
| Office furniture and fixtures |
1,616,128 | 1,945,926 | 1,942,799 | |||||||||
| Computer systems development |
4,984,382 | 6,547,434 | 8,217,720 | |||||||||
| Equipment |
30,925,325 | 37,532,285 | 40,051,489 | |||||||||
| Construction in progress |
81,550 | — | 530,000 | |||||||||
| Leasehold improvements |
538,062 | 1,814,366 | 1,814,365 | |||||||||
|
|
|
|
|
|
|
|||||||
| 38,225,579 | 47,866,592 | 52,571,987 | ||||||||||
| Less accumulated depreciation and amortization |
22,549,386 | 28,312,465 | 31,360,860 | |||||||||
|
|
|
|
|
|
|
|||||||
| $ | 15,676,193 | $ | 19,554,127 | $ | 21,211,127 | |||||||
|
|
|
|
|
|
|
|||||||
Depreciation and amortization expense on property and equipment was approximately $4,784,000 and $5,763,000 for the years ended December 31, 2015 and 2016, respectively. Depreciation and amortization expense on property and equipment was approximately $2,625,000 and $5,059,000 for the six months ended June 30, 2016 and 2017 (unaudited), respectively.
F-76
Table of Contents
SPS Holdco, LLC and Subsidiaries
Notes to Consolidated Financial Statements
Note 6. Goodwill
The following table summarizes the changes in goodwill:
| As of December 31, |
As of June 30, 2017 |
|||||||||||
| 2015 | 2016 | |||||||||||
| (unaudited) | ||||||||||||
| Beginning of year, gross amount |
$ | 128,386,981 | $ | 143,129,550 | $ | 71,916,000 | ||||||
| Acquisitions |
14,742,569 | — | — | |||||||||
| Measurement period adjustments |
— | (352,134 | ) | — | ||||||||
| Impairment charge |
— | (70,861,416 | ) | — | ||||||||
|
|
|
|
|
|
|
|||||||
| End of year, net carrying amount |
$ | 143,129,550 | $ | 71,916,000 | $ | 71,916,000 | ||||||
|
|
|
|
|
|
|
|||||||
The Company tests its recorded goodwill for impairment on an annual basis at October 1 using significant other unobservable inputs (Level 3 of the fair value hierarchy) including historical or projected future operating results, significant changes in the manner of use of the acquired assets and the Company’s overall business and, significant negative industry or economic trends. At December 31, 2016, the Company recorded an impairment charge of $70,861,416.
Note 7. Intangible Assets
The following is a summary of amortizable intangibles:
| Cost | Amortization Through June 30, 2017 |
Net Carrying Value, June 30, 2017 |
||||||||||
| (unaudited) | ||||||||||||
| Trade names |
$ | 24,800,000 | $ | 11,612,639 | $ | 13,187,361 | ||||||
| Customer relationships |
52,683,871 | 41,641,310 | 11,042,561 | |||||||||
| Customer backlog |
2,200,000 | 2,200,000 | — | |||||||||
| Noncompete agreements |
2,400,000 | 2,266,667 | 133,333 | |||||||||
|
|
|
|
|
|
|
|||||||
| $ | 82,083,871 | $ | 57,720,616 | $ | 24,363,255 | |||||||
|
|
|
|
|
|
|
|||||||
| Cost | Amortization Through December 31, 2016 |
Net Carrying Value, December 31, 2016 |
||||||||||
| Trade names |
$ | 24,800,000 | $ | 10,616,390 | $ | 14,183,610 | ||||||
| Customer relationships |
52,683,871 | 39,593,491 | 13,090,380 | |||||||||
| Customer backlog |
2,200,000 | 2,200,000 | — | |||||||||
| Noncompete agreements |
2,400,000 | 2,133,333 | 266,667 | |||||||||
|
|
|
|
|
|
|
|||||||
| $ | 82,083,871 | $ | 54,543,214 | $ | 27,540,657 | |||||||
|
|
|
|
|
|
|
|||||||
| Cost | Amortization Through December 31, 2015 |
Net Carrying Value, December 31, 2015 |
||||||||||
| Trade names |
$ | 24,800,000 | $ | 8,469,722 | $ | 16,330,278 | ||||||
| Customer relationships |
52,683,871 | 33,183,653 | 19,500,218 | |||||||||
| Customer backlog |
2,200,000 | 2,200,000 | — | |||||||||
| Noncompete agreements |
2,400,000 | 1,733,333 | 666,667 | |||||||||
|
|
|
|
|
|
|
|||||||
| $ | 82,083,871 | $ | 45,586,708 | $ | 36,497,163 | |||||||
|
|
|
|
|
|
|
|||||||
F-77
Table of Contents
SPS Holdco, LLC and Subsidiaries
Notes to Consolidated Financial Statements
Note 7. Intangible Assets—(Continued)
Trade names, customer backlog and noncompete agreements are amortized using the straight-line method over the estimated useful life ranging from 6 months to 15 years. Customer relationships have been assigned a useful life ranging from 5 years to 10 years and are being amortized using accelerated methods.
Future amortization expense related to intangible assets is as follows:
| Year ending December 31 (unaudited): |
||||
| 2017 (remaining 6 months) |
$ | 3,514,633 | ||
| 2018 |
5,017,433 | |||
| 2019 |
3,811,683 | |||
| 2020 |
2,862,145 | |||
| 2021 |
1,875,299 | |||
| 2022 |
1,531,208 | |||
| Thereafter |
5,750,854 | |||
|
|
|
|||
| $ | 24,363,255 | |||
|
|
|
Note 8. Long-Term Debt
The Company has a credit agreement with Madison Capital Funding, LLC (Madison Capital), which has been periodically amended. In June 2014, in connection with a prepayment on the debt, the Company amended its credit agreement, which at the time had a principal loan balance of $80,958,141. The amended interest rate was adjusted to 5.5% per annum. The loan is payable in quarterly installments of $1,124,419 beginning in June 30, 2014 with the final balloon payment due October 19, 2018. The loan agreement requires, among other things, mandatory prepayments for excess cash flows and maintenance by the Company of minimum ratios of fixed charge coverage, total debt to EBITDA, and capital expenditures. All debt financing costs are treated as a debt discount and reduce the long-term portion of the debt. The debt discount is accreted back to the principal through interest expense over the life of the loan. Interest expense for the years ended December 31, 2015 and 2016 was approximately $5,915,000 and $6,157,000, respectively. Interest expense for the six months ended June 30, 2016 and 2017 (unaudited) was approximately $2,783,000 and $3,722,000, respectively.
The Company also has a revolving line of credit with Madison Capital which bears interest at 7.25% per annum and had an original maturity date of October 19, 2018.
On August 16, 2017, the debt was repaid as part of the transaction with ConvergeOne, Inc. (see note 13).
The following tables show the breakdown of debt:
| As of December 31, |
As of June 30, 2017 |
|||||||||||
| 2015 | 2016 | |||||||||||
| (unaudited) | ||||||||||||
| Line of Credit |
$ | 10,500,000 | $ | 6,935,620 | $ | 9,424,346 | ||||||
| Madison Capital debt |
74,297,086 | 69,926,669 | 69,039,932 | |||||||||
|
|
|
|
|
|
|
|||||||
| 84,797,086 | 76,862,289 | 78,464,278 | ||||||||||
| Less: |
||||||||||||
| Current portion |
(14,870,417 | ) | (75,531,893 | ) | (77,846,551 | ) | ||||||
| Discount on debt, net |
(2,217,694 | ) | (1,330,396 | ) | (617,727 | ) | ||||||
|
|
|
|
|
|
|
|||||||
| $ | 67,708,975 | $ | — | $ | — | |||||||
|
|
|
|
|
|
|
|||||||
F-78
Table of Contents
SPS Holdco, LLC and Subsidiaries
Notes to Consolidated Financial Statements
Note 9. Risk of Concentration
The Company sells communications systems under a dealer agreement with Avaya, Inc. (Avaya). In 2016 and 2015, a majority of the Company’s communications equipment sales were Avaya products purchased from ScanSource Catalyst. The Company sells conferencing systems under dealer agreements with Cisco Systems, Inc. (Cisco) and Polycom, Inc. (Polycom). In 2016, a majority of the Company’s conferencing equipment sales were Cisco and Polycom products purchased either from these dealers or their primary vendors.
Avaya filed for reorganization under Chapter 11 on January 19, 2017. As a result of this, new or existing customers may elect to delay purchasing decisions with respect to Avaya technology. Delays in customer purchasing decisions, or an election by the Company’s customers to purchase alternative technology offerings from the Company or its competitors, could result in lower revenues, gross profits or gross margins. The Bankruptcy Court approved Avaya’s plan of reorganization and Avaya emerged from bankruptcy proceedings in the fourth quarter of 2017. Management continues to evaluate the impact that Avaya’s reorganization has had on the Company’s results of operations and financial condition.
Note 10. Members’ Equity
The Company’s equity is divided into three classes of units, consisting of units of Preferred Membership Interests (Preferred Units), units of Common Membership Interests (Common Units) and units of Junior Membership Interests (Junior Performance Units). The total units authorized are (i) 100,000,000 Preferred Units, of which none were issued and outstanding on December 31, 2016 and 2015, respectively, (ii) 118,700,000 Common Units, of which 115,744,130 and 116,157,173 were issued and outstanding on December 31, 2016 and 2015, respectively, and (iii) 13,000,000 Junior Performance Units were authorized.
In March 2015, the Company sold 500,000 common units to an employee at a purchase price of $1.00 per share for an aggregate purchase price of $500,000.
In October 2015, the Company sold 400,000 common units to an employee at a purchase price of $1.00 per share for an aggregate purchase price of $400,000. In connection with this sale, the Company issued a note receivable to the employee for $400,000 and the note bears interest at 4.00% per annum. The note receivable is due in October 2025. The note receivable has been recorded as contra-equity in the Company’s consolidated statements of members’ equity as of December 31, 2015.
On December 31, 2015, the Company agreed to repurchase 250,000 Common Units from an existing shareholder for $287,500. The Company repaid the shareholder in 2016. At December 31, 2015, the repurchase price is recorded as due to shareholder on the consolidated balance sheets.
In February 2016, the Company sold 86,957 common units to an employee at a purchase price of $1.15 per share for an aggregate purchase price of $100,000. In connection with this sale, the Company issued a note receivable to the employee for $100,000 and the note bears interest at 1.80% per annum. The note receivable is due in February 2024. The note receivable has been recorded as contra-equity in the Company’s consolidated statements of members’ equity as of December 31, 2016.
In July 2016, the Company repurchased 400,000 Common Units from an existing shareholder in exchange for the cancellation of the principal balance of the note receivable of $400,000.
In August 2016, the Company repurchased 100,000 Common Units from an existing shareholder for $100,000.
Preferred units: The Preferred Unit original issue price is equal to $1.00. No holder of Preferred Units shall be entitled to vote on any matter submitted to a vote of its members. Preferred Unitholders are entitled to a 10% Preferred Yield per annum.
F-79
Table of Contents
SPS Holdco, LLC and Subsidiaries
Notes to Consolidated Financial Statements
Note 10. Members’ Equity—(Continued)
Common units: The Common Unit original issue price is equal to $1.00. Subject to the applicable provisions of the Unitholder Agreement, the holders of the Common Units shall have the general right to vote for all purposes, including the election of directors of the Board of Directors. Each holder of Common Units shall be entitled to one vote for each unit held. There shall be no cumulative voting.
Junior performance units: From time to time, Junior Performance Units may be awarded to the extent authorized by the board of directors. No capital contribution will be required to be made by the holders of the Junior Performance Units. The Junior Performance Units shall be unvested at issuance and shall vest 20% ratably through the fifth anniversary of their issuance provided that (i) upon the initial public offering of the Company on or prior to the fifth anniversary of the Issue Date, an additional 20% of the Junior Performance Units shall vest and (ii) upon a Change of Control, all unvested Junior Performance Units shall immediately vest. As of December 31, 2015 and 2016, respectively, 7,179,766 and 8,679,684 awards had been issued. As of December 31, 2015, approximately 4,239,000 units had vested. Compensation expense related to these awards for the years ended December 31, 2015 and 2016 was approximately $370,000 and $128,000, respectively. Total unrecognized compensation expense related to these awards at December 31, 2015 and 2016 was approximately $660,000 and $201,000, respectively.
Note 11. Commitments and Contingencies
Operating leases: The Company leases office and warehouse space in various locations.
The following is a schedule of future minimum rental payments required for all noncancelable operating leases that have remaining lease terms in excess of one year at December 31, 2016 (the last of which expires in 2026) are approximately:
Operating Leases:
| Year ending December 31 (unaudited): |
||||
| 2017 (remaining 6 months) |
$ | 1,159,000 | ||
| 2018 |
1,620,000 | |||
| 2019 |
1,068,000 | |||
| 2020 |
635,000 | |||
| 2021 |
310,000 | |||
| 2022 |
318,000 | |||
| Thereafter |
1,075,000 | |||
|
|
|
|||
| $ | 6,185,000 | |||
|
|
|
Certain equipment is leased on a short-term or month-to-month basis. Certain leases have annual rentals that increase over the period of the lease. For financial statement purposes, rent expense is being recorded on a straight-line basis over the lease terms. Accordingly, deferred rent consists of deferred rent credits for the excess of the straight-line rent over the amount payable pursuant to the leases. Deferred rent of approximately $250,000 and $500,000 at December 31, 2015 and 2016, respectively is included in accrued expenses on the balance sheets. Deferred rent of approximately $487,000 at June 30, 2017 (unaudited) is included in accrued expenses on the balance sheets. Rent expense under all operating leases for years ended December 31, 2015 and 2016 was approximately $2,315,000 and $2,585,000, respectively. Rent expense under all operating leases for the six months ended June 30, 2016 and 2017 (unaudited) was approximately $1,567,000 and $1,134,000, respectively.
Capital Leases: As of December 31, 2016, the Company has capital lease obligations of approximately $17,000 from equipment leases assumed in the transactions noted in Note 2. These leases mature at various times through 2018.
F-80
Table of Contents
SPS Holdco, LLC and Subsidiaries
Notes to Consolidated Financial Statements
Note 12. Employee Benefit Plan
The Company has a 401(k) deferred income plan covering substantially all eligible employees over 21 years of age. Employees may voluntarily contribute from 1% to 15% of their annual salaries and the Company will match 25% of the first 6% of the employees’ contribution. Total employee benefit plan expense for years ended December 31, 2015 and 2016 was approximately $406,000 and $497,000, respectively. Total employee benefit plan expense for six months ended June 30, 2016 and 2017 (unaudited) was approximately $203,000 and $249,000, respectively.
Note 13. Subsequent Events
The Company has evaluated subsequent events through February 26, 2018, which is the date the consolidated financial statements were available to be issued.
On May 17, 2017, the Company entered into a Forbearance Agreement with Madison Capital as a result of certain specified events of default on their credit agreement. The Forbearance Agreement was scheduled to expire on September 30, 2017. Included within the terms of the Forbearance Agreement is a sale covenant
On August 16, 2017, the Company entered into a merger agreement with ConvergeOne, Inc. to sell the outstanding units of the Company for a base purchase price of $70,000,000 subject to certain purchase price adjustments. As a result of the transaction, the outstanding debt with Madison Capital was repaid and the Forbearance Agreement was terminated.
F-81
Table of Contents

Board of Directors
AOS, Inc. and Subsidiaries
Overland Park, Kansas
We have audited the accompanying consolidated financial statements of AOS, Inc. and Subsidiaries, which comprise the consolidated balance sheets as of December 25, 2016 and December 27, 2015, and the related consolidated statements of operations, stockholders’ equity and cash flows for the years then ended, and the related notes to the consolidated financial statements.
Management’s Responsibility for the Financial Statements
Management is responsible for the preparation and fair presentation of these consolidated financial statements in accordance with accounting principles generally accepted in the United States of America; this includes the design, implementation and maintenance of internal control relevant to the preparation and fair presentation of consolidated financial statements that are free from material misstatement, whether due to fraud or error.
Auditor’s Responsibility
Our responsibility is to express an opinion on these consolidated financial statements based on our audits. We conducted our audits in accordance with auditing standards generally accepted in the United States of America. Those standards require that we plan and perform the audit to obtain reasonable assurance about whether the consolidated financial statements are free from material misstatement.
An audit involves performing procedures to obtain audit evidence about the amounts and disclosures in the consolidated financial statements. The procedures selected depend on the auditor’s judgment, including the assessment of the risks of material misstatement of the consolidated financial statements, whether due to fraud or error. In making those risk assessments, the auditor considers internal control relevant to the entity’s preparation and fair presentation of the consolidated financial statements in order to design audit procedures that are appropriate in the circumstances, but not for the purpose of expressing an opinion on the effectiveness of the entity’s internal control. Accordingly, we express no such opinion. An audit also includes evaluating the appropriateness of accounting policies used and the reasonableness of significant accounting estimates made by management, as well as evaluating the overall presentation of the consolidated financial statements.
We believe that the audit evidence we have obtained is sufficient and appropriate to provide a basis for our audit opinion.

F-82
Table of Contents
Board of Directors
AOS, Inc. and Subsidiaries
Page 2
Opinion
In our opinion, the consolidated financial statements referred to above present fairly, in all material respects, the financial position of AOS, Inc. and Subsidiaries as of December 25, 2016 and December 27, 2015, and the results of their operations and their cash flows for the years then ended in accordance with accounting principles generally accepted in the United States of America.
Other Matter
In our reports dated April 13, 2016 and March 21, 2017, we expressed a qualified opinion on the 2015 and 2016 financial statements, respectively. The basis for a qualified opinion was limited to a departure from accounting standards generally accepted in the United States of America. Accounting principles generally accepted in the United States of America require an evaluation of the recoverability of the carrying value of long-lived assets whenever events or circumstances indicate the carrying amount may not be recoverable. As described in Note 2, the Company has changed its method of accounting and restated its 2015 and 2016 consolidated financial statements to conform with accounting principles generally accepted in the United States of America. Accordingly, our present opinion on the restated 2015 and 2016 consolidated financial statements, as presented herein, is different from that expressed in our previous report.
Emphasis of Matter
As discussed in Note 2 to the consolidated financial statements, in 2017, the entity was required to retrospectively apply the impact of previously adopted accounting standards for which the Company is no longer eligible (Private Company Council standards), which materially impacted previously issued financial statements. Our opinion is not modified with respect to this matter.

Kansas City, Missouri
March 21, 2017, except for Note 2, as to which the date is February 9, 2018
F-83
Table of Contents
AOS, Inc. and Subsidiaries
December 25, 2016 and December 27, 2015
| 2016 | 2015 | |||||||
| (Restated) | (Restated) | |||||||
| Assets |
||||||||
| Current Assets |
||||||||
| Cash and cash equivalents |
$ | 9,953,783 | $ | 7,882,097 | ||||
| Accounts receivable, trade, net of allowance; 2016—$375,532, 2015—$765,710 |
26,365,786 | 29,531,665 | ||||||
| Receivable for sale of AOScloud, LLC |
300,000 | — | ||||||
| Returned goods receivable |
800,274 | 1,045,337 | ||||||
| Inventories |
1,788,622 | 2,485,609 | ||||||
| Prepaid expenses |
573,852 | 725,501 | ||||||
|
|
|
|
|
|||||
| Current assets—continuing operations |
39,782,317 | 41,670,209 | ||||||
| Current assets—discontinued operations |
135,587 | 2,984,991 | ||||||
|
|
|
|
|
|||||
| Total current assets |
39,917,904 | 44,655,200 | ||||||
|
|
|
|
|
|||||
| Property, Equipment and Software, Net |
2,177,476 | 2,312,499 | ||||||
|
|
|
|
|
|||||
| Other Assets |
||||||||
| Goodwill, net |
2,665,422 | 2,665,422 | ||||||
| Intangible assets, net |
545,700 | 659,120 | ||||||
| Other |
71,817 | 85,304 | ||||||
|
|
|
|
|
|||||
| Total other assets |
3,282,939 | 3,409,846 | ||||||
|
|
|
|
|
|||||
| Non-current assets—continuing operations |
5,460,415 | 5,722,345 | ||||||
| Non-current assets—discontinued operations |
18,240 | 4,183,952 | ||||||
|
|
|
|
|
|||||
| Total non-current assets |
5,478,655 | 9,906,297 | ||||||
|
|
|
|
|
|||||
| Total assets |
$ | 45,396,559 | $ | 54,561,497 | ||||
|
|
|
|
|
|||||
| Liabilities and Stockholders’ Equity |
||||||||
| Current Liabilities |
||||||||
| Accounts payable |
$ | 22,273,061 | $ | 24,554,254 | ||||
| Current maturities of long-term debt |
— | 1,190 | ||||||
| Accrued compensation expense |
4,616,881 | 3,974,793 | ||||||
| Accrued expenses |
2,303,779 | 2,870,544 | ||||||
| Deferred lease incentives |
163,618 | 131,769 | ||||||
| Deferred revenue |
2,246,464 | 2,671,171 | ||||||
|
|
|
|
|
|||||
| Current liabilities—continuing operations |
31,603,803 | 34,203,721 | ||||||
| Current liabilities—discontinued operations |
90,170 | 1,799,952 | ||||||
|
|
|
|
|
|||||
| Total current liabilities |
31,693,973 | 36,003,673 | ||||||
|
|
|
|
|
|||||
| Deferred Lease Incentives |
1,108,458 | 1,173,438 | ||||||
|
|
|
|
|
|||||
| Deferred Revenue |
— | 343,053 | ||||||
|
|
|
|
|
|||||
| Non-current liabilities—continuing operations |
1,108,458 | 1,516,491 | ||||||
| Non-current liabilities—discontinued operations |
— | 375,992 | ||||||
|
|
|
|
|
|||||
| Total non-current liabilities |
1,108,458 | 1,892,483 | ||||||
|
|
|
|
|
|||||
| Total liabilities |
32,802,431 | 37,896,156 | ||||||
|
|
|
|
|
|||||
| Stockholders’ Equity |
||||||||
| Common stock, $1 par value; 100,000 shares authorized, 1,197 shares issued and outstanding |
1,197 | 1,197 | ||||||
| Additional paid-in capital |
9,905,404 | 9,905,404 | ||||||
| Retained earnings |
2,687,527 | 6,758,740 | ||||||
|
|
|
|
|
|||||
| Total stockholders’ equity |
12,594,128 | 16,665,341 | ||||||
|
|
|
|
|
|||||
| Total liabilities and stockholders’ equity |
$ | 45,396,559 | $ | 54,561,497 | ||||
|
|
|
|
|
|||||
See Notes to Consolidated Financial Statements
F-84
Table of Contents
AOS, Inc. and Subsidiaries
Consolidated Statements of Operations
Years Ended December 25, 2016 and December 27, 2015
| 2016 | 2015 | |||||||
| (Restated) | (Restated) | |||||||
| Revenue |
||||||||
| Hardware sales |
$ | 143,708,752 | $ | 166,872,121 | ||||
| Engineering services |
26,362,400 | 29,851,371 | ||||||
| Third-party warranty |
6,454,899 | 11,476,430 | ||||||
| Other revenue |
820,788 | 1,295,116 | ||||||
|
|
|
|
|
|||||
| Total revenue |
177,346,839 | 209,495,038 | ||||||
| Cost of Sales |
132,539,774 | 155,975,164 | ||||||
|
|
|
|
|
|||||
| Gross Profit |
44,807,065 | 53,519,874 | ||||||
| Operating Expenses |
41,074,901 | 43,871,993 | ||||||
|
|
|
|
|
|||||
| Operating Income |
3,732,164 | 9,647,881 | ||||||
| Other Expense |
||||||||
| Interest expense |
(1,357 | ) | (120,338 | ) | ||||
|
|
|
|
|
|||||
| Income from Continuing Operations |
3,730,807 | 9,527,543 | ||||||
| Discontinued Operations (Notes 11 and 12 ) |
||||||||
| Loss from discontinued operations |
(3,235,264 | ) | (12,883,610 | ) | ||||
|
|
|
|
|
|||||
| Net Income (Loss) |
$ | 495,543 | $ | (3,356,067 | ) | |||
|
|
|
|
|
|||||
See Notes to Consolidated Financial Statements
F-85
Table of Contents
Consolidated Statements of Stockholders’ Equity
Years Ended December 25, 2016 and December 27, 2015
| Common Stock |
Additional Paid-in Capital |
Retained Earnings |
Total Stockholders’ Equity |
|||||||||||||
| (Restated) | ||||||||||||||||
| Balance, December 29, 2014, as Previously Reported |
$ | 1,197 | $ | 9,905,404 | $ | 12,157,130 | $ | 22,063,731 | ||||||||
| Adjustment applicable to the year ended December 29, 2014 |
— | — | 970,040 | 970,040 | ||||||||||||
|
|
|
|
|
|
|
|
|
|||||||||
| Balance, December 29, 2014, as Restated |
1,197 | 9,905,404 | 13,127,170 | 23,033,771 | ||||||||||||
| Distributions |
— | — | (3,012,363 | ) | (3,012,363 | ) | ||||||||||
| Net loss |
— | — | (3,356,067 | ) | (3,356,067 | ) | ||||||||||
|
|
|
|
|
|
|
|
|
|||||||||
| Balance, December 27, 2015 |
1,197 | 9,905,404 | 6,758,740 | 16,665,341 | ||||||||||||
| Distributions |
— | — | (4,566,756 | ) | (4,566,756 | ) | ||||||||||
| Net income |
— | — | 495,543 | 495,543 | ||||||||||||
|
|
|
|
|
|
|
|
|
|||||||||
| Balance, December 25, 2016 |
$ | 1,197 | $ | 9,905,404 | $ | 2,687,527 | $ | 12,594,128 | ||||||||
|
|
|
|
|
|
|
|
|
|||||||||
See Notes to Consolidated Financial Statements
F-86
Table of Contents
AOS, Inc. and Subsidiaries
Consolidated Statements of Cash Flows
Years Ended December 25, 2016 and December 27, 2015
| 2016 | 2015 | |||||||
| (Restated) | (Restated) | |||||||
| Operating Activities |
||||||||
| Net income (loss) |
$ | 495,543 | $ | (3,356,067 | ) | |||
| Items not requiring (providing) cash |
||||||||
| Depreciation and amortization |
2,479,884 | 3,831,552 | ||||||
| Goodwill and intangible impairment loss |
— | 2,800,667 | ||||||
| Property, equipment and software impairment loss |
— | 3,934,812 | ||||||
| (Gain) loss on sale of property and equipment |
361,839 | (238,112 | ) | |||||
| Loss on sale of AOScloud, LLC |
434,295 | — | ||||||
| Deferred lease incentives |
(193,894 | ) | (169,191 | ) | ||||
| Changes in |
||||||||
| Accounts receivable, trade |
4,640,196 | 8,570,899 | ||||||
| Returned goods receivable |
245,063 | (257,751 | ) | |||||
| Inventories |
699,507 | 155,326 | ||||||
| Prepaid expenses |
365,341 | 714,854 | ||||||
| Other assets |
22,784 | (23,881 | ) | |||||
| Accounts payable, trade |
(2,723,394 | ) | 12,332,011 | |||||
| Accrued expenses |
(305,238 | ) | (1,575,853 | ) | ||||
| Deferred revenue |
(826,653 | ) | 547,440 | |||||
|
|
|
|
|
|||||
| Net cash provided by operating activities |
5,695,273 | 27,266,706 | ||||||
|
|
|
|
|
|||||
| Investing Activities |
||||||||
| Purchase of property and equipment |
(477,116 | ) | (980,339 | ) | ||||
| Proceeds from the sale of AOScloud, LLC |
1,700,000 | — | ||||||
| Proceeds from the sale of property and equipment |
2,300 | 474,225 | ||||||
|
|
|
|
|
|||||
| Net cash provided by (used in) investing activities |
1,225,184 | (506,114 | ) | |||||
|
|
|
|
|
|||||
| Financing Activities |
||||||||
| Net repayments to shareholders |
— | (2,759,186 | ) | |||||
| Net repayments under floor plan financing |
— | (18,832,150 | ) | |||||
| Repayment of capital lease obligations |
(1,392,793 | ) | (1,742,411 | ) | ||||
| Dividends paid |
(4,458,808 | ) | (3,012,363 | ) | ||||
|
|
|
|
|
|||||
| Net cash used in financing activities |
(5,851,601 | ) | (26,346,110 | ) | ||||
|
|
|
|
|
|||||
| Increase in Cash and Cash Equivalents |
1,068,856 | 414,482 | ||||||
| Cash and Cash Equivalents, Beginning of Year |
8,884,927 | 8,470,445 | ||||||
|
|
|
|
|
|||||
| Cash and Cash Equivalents, End of Year |
$ | 9,953,783 | $ | 8,884,927 | ||||
|
|
|
|
|
|||||
| Reconciliation of Cash and Cash Equivalents |
||||||||
| Cash and cash equivalents of continuing operations |
$ | 9,953,783 | $ | 7,882,097 | ||||
| Cash and cash equivalents of discontinued operations |
— | 1,002,830 | ||||||
|
|
|
|
|
|||||
| $9,953,783 | $8,884,927 | |||||||
|
|
|
|
|
|||||
| Supplemental Cash Flows Information |
||||||||
| Interest paid |
$ | 64,115 | $ | 575,673 | ||||
| Capital lease obligation incurred for equipment |
123,228 | 511,195 | ||||||
| Leasehold improvements provided by landlord |
160,763 | — | ||||||
| Receivable for sale of AOScloud, LLC |
300,000 | — | ||||||
| Distributions declared |
107,948 | — | ||||||
See Notes to Consolidated Financial Statements
F-87
Table of Contents
AOS, Inc. and Subsidiaries
Notes to Consolidated Financial Statements
December 25, 2016 and December 27, 2015
Note 1: Nature of Operations and Summary of Significant Accounting Policies
Nature of Operations
AOS, Inc. was incorporated in Nevada on January 1, 2006. Its wholly-owned subsidiaries include: Alexander Open Systems, Inc. that was incorporated in Kansas on September 1, 1992; AOS, LLC that was organized in Missouri on January 31, 2005; AOSNC, LLC that was organized in Nebraska on August 26, 2005; eTek Global, Inc., a Kansas Corporation, that was acquired on June 3, 2011; and AOScloud, LLC, that was organized in Kansas on July 3, 2012.
Alexander Open Systems, Inc., AOS, LLC and AOSNC, LLC design, sell, install and service computer network systems. eTek Global, Inc. designs intranet portals using the SharePoint system. AOScloud, LLC provides data center-based hosting solutions. The Companies’ primary customers are state and local governments, medical, legal, school districts and universities as well as large corporate accounts located throughout the Midwest.
As discussed in Note 11, in 2015 the Companies ceased the operations of its Texas division and has reported the activity for 2015 and 2016 as discontinued operations in the consolidated statements of operations. As discussed in Note 12, in 2016 the Companies sold virtually all of the assets of AOScloud, LLC and has reported the activity for 2015 and 2016 as discontinued operations in the consolidated statements of operations. The Companies applied the provisions of ASU 2014-08, Presentation of Financial Statements (Topic 205) and Property, Plant and Equipment (Topic 360): Reporting Discontinued Operations and Disclosures of Disposals of Components of an Entity, for the discontinued operations disclosures.
Principles of Consolidation
The consolidated financial statements include the accounts of AOS, Inc. and its wholly-owned subsidiaries (the Companies). All significant intercompany balances and transactions have been eliminated in consolidation.
Fiscal Year
The Companies operate on a fiscal year based on 52- or 53-week periods ending on the last Sunday in December. Both fiscal years ended December 25, 2016 and December 27, 2015 were 52 weeks.
Use of Estimates
The preparation of financial statements in conformity with accounting principles generally accepted in the United States of America requires management to make estimates and assumptions that affect the reported amounts of assets and liabilities and disclosure of contingent assets and liabilities at the date of the consolidated financial statements and the reported amounts of revenues and expenses during the reporting period. Actual results could differ from those estimates.
Revenue Recognition
The Companies recognize revenue, net of sales taxes, when all of the following are present: persuasive evidence of an arrangement exists, delivery has occurred or services have been rendered, fee to the customer is fixed or determinable and collectability is reasonably assured.
The Companies enter into short-term contracts to install computer systems, whereby the contract is generally completed within the same year that the contract began. Services primarily relate to design and installment of hardware. These services are charged to customers based upon time and material or a predetermined agreed upon fixed fee. Revenue related to services is recognized based on hours spent. For
F-88
Table of Contents
AOS, Inc. and Subsidiaries
Notes to Consolidated Financial Statements
December 25, 2016 and December 27, 2015
contracts with anticipated services less than 40 hours, revenue is recognized as time is accrued on the services performed. For contracts with anticipated services greater than 40 hours, which generally require a Project Manager to oversee, revenue is recognized on a proportional performance basis. Management determines billing amounts the last week of each fiscal month based on the fixed contract amount and the proportion of the project completed. The proportion is based on hours worked on the project to date versus the total hours budgeted for the project.
Revenue associated with hardware sales is recognized based on the sales terms. Sales terms usually are stated as F.O.B. destination, and delivery is not deemed to have occurred until the point in time when the product is received by the customer.
Revenue is recognized from software sales when the customers acquire the right to use or copy software under license, provided that all revenue recognition criteria have been met.
The sale of hardware and software products may also include the provision of services, and the associated contracts may contain multiple elements. If services are performed in conjunction with a hardware or software sale, revenue is recognized for each portion of the arrangement that is attributable to the items as they are delivered or the services are performed. The selling price is determined in a manner that is consistent with that used to determine the price to sell the deliverable on a standalone basis.
The Companies sell certain third-party service contracts for which the sale is evaluated whether it should be recorded as a gross sale or a net sale. If the Companies act as a principal in the transaction and assume the risks and rewards of ownership, the sale is recorded gross, and the entire selling price is recorded in sales and the cost to the third-party provider is recorded in cost of goods sold. If the Companies are acting as an agent or broker, the sale is recorded net, and the cost to the third-party provider is recorded as a reduction of sales and there are no cost of goods sold. Net sales are presented within Third-Party Warranty and Engineering Services in the consolidated statements of operations.
Shipping and Handling Costs
Freight billed to customers is considered sales revenue and the related freight costs as cost of sales.
Advertising
Advertising costs are expensed when incurred. Advertising costs were $899,736 and $967,079 for the years ended December 25, 2016 and December 27, 2015, respectively. Advertising costs are offset by cooperative rebates received from vendors, which were $461,951 and $866,583 for the years ended December 25, 2016 and December 27, 2015, respectively.
Cash and Cash Equivalents
The Companies consider all liquid investments with original maturities of three months or less to be cash equivalents. At December 25, 2016 and December 27, 2015, cash equivalents consisted primarily of money market accounts with brokers and certificates of deposit.
At December 25, 2016, the Companies’ cash accounts exceeded federally insured limits by approximately $10,315,000.
Accounts Receivable
Accounts receivable are stated at the amount billed to customers. The Companies provide an allowance for doubtful accounts, which is based upon a review of outstanding receivables, historical collection information and
F-89
Table of Contents
AOS, Inc. and Subsidiaries
Notes to Consolidated Financial Statements
December 25, 2016 and December 27, 2015
existing economic conditions. Accounts receivable are ordinarily due 30 days after the issuance of the invoice. Accounts past due more than 120 days are considered delinquent. Delinquent receivables are written off based on individual credit evaluation and specific circumstances of the customer.
Returned Goods Receivable
Returned goods receivable are stated at the amount due from vendors for customer returns of product. Customer returns and reorders are processed and executed by the Companies while credit from the vendors is in process.
Inventories
Inventories consist primarily of hardware in transit and prepaid inventory. Inventories are stated at lower of cost or market. Cost of inventory has been determined using the first-in, first-out (FIFO) method.
Property, Equipment and Software
Property, equipment and software acquisitions are stated at cost less accumulated depreciation and amortization. Depreciation and amortization are charged to expense using straight-line or accelerated methods over the estimated useful life of each asset. Assets under capital lease obligations and leasehold improvements are amortized over the shorter of the lease term or their respective estimated useful lives.
The estimated useful lives for each major depreciable classification of property and equipment and software are as follows:
| Software |
3 years | |
| Computer equipment |
3-5 years | |
| Furniture and fixtures |
7-10 years | |
| Leasehold improvements |
Lease life | |
| Automobiles |
5 years |
Long-lived Asset Impairment
The Companies evaluate the recoverability of the carrying value of long-lived assets whenever events or circumstances indicate the carrying amount may not be recoverable. If a long-lived asset is tested for recoverability and the undiscounted estimated future cash flows expected to result from the use and eventual disposition of the asset is less than the carrying amount of the asset, the asset cost is adjusted to fair value and an impairment loss is recognized as the amount by which the carrying amount of a long-lived asset exceeds its fair value.
Impairment on long-lived tangible assets of $0 and $3,934,812 was recognized during the years ended December 25, 2016 and December 27, 2015, respectively.
Goodwill
Goodwill is evaluated annually for impairment or more frequently if impairment indicators are present. A qualitative assessment is performed to determine whether the existence of events or circumstances leads to a determination that it is more likely than not the fair value is less than the carrying amount, including goodwill. If, based on the evaluation, it is determined to be more likely than not that the fair value is less than the carrying value, then goodwill is tested further for impairment. If the implied fair value of goodwill is lower than its carrying amount, a goodwill impairment is indicated and goodwill is written down to its implied fair value. No
F-90
Table of Contents
AOS, Inc. and Subsidiaries
Notes to Consolidated Financial Statements
December 25, 2016 and December 27, 2015
goodwill impairment losses were recognized during the year ended December 25, 2016. Goodwill impairment losses during the year ended December 27, 2015 were $2,282,796. Subsequent increases in goodwill value are not recognized in the consolidated financial statements.
Intangible Assets
Intangible assets include domain name, contracted customers and customer relationships. These assets are amortized using the straight-line method. The domain name is amortized over one and a half years; the contracted customer intangibles are amortized over the life of the contracts (three years) and the customer relationships are amortized over nine years. Such assets are periodically evaluated as to the recoverability of their carrying values. There were no impairment losses recognized for the year ended December 25, 2016. During the year ended December 27, 2015, impairment losses on finite-lived intangible assets totaled $517,881.
Incentive Payments
The Companies receive third-party manufacturer incentives that result in a price reduction on equipment sold to the Companies’ customers. The Companies record these incentives as a reduction of cost of sales. For the years ended December 25, 2016 and December 27, 2015, the Companies recorded $5,313,223 and $6,548,762, respectively, in incentive payments.
Deferred Revenue
The Companies sell certain services under arrangements that permit customers to prepay for services to be provided. These prepayments are deferred and recognized over the periods in which the services are performed.
Income Taxes
The stockholders of AOS, Inc. and all of its subsidiaries are either limited liability companies or corporations where the respective stockholders have elected to be taxed as an “S” Corporation under provisions of the Internal Revenue Code or similar section of the state income tax law for the year ended December 25, 2016. Therefore, taxable income or loss is reported to the individual stockholders and members for inclusion in their respective tax returns and no provision for federal and state income taxes is included in these statements.
Effective January 1, 2015, eTek converted to an “S” Corporation and, therefore, no provision for federal and state income taxes is included as of and for the years ended December 25, 2016 and December 27, 2015.
The Companies recognize interest and penalties on income taxes as a component of income tax expense.
Self-Insurance
The Companies have elected to self-insure certain costs related to employee health benefit programs. Costs resulting from noninsured losses are charged to income when incurred. The Companies purchased insurance that limits their exposure for individual claims and that limits their aggregate exposure.
Taxes Collected from Customers and Remitted to Governmental Authorities
Taxes collected from customers and remitted to governmental authorities are presented in the accompanying consolidated statements of operations on a net basis.
Reclassifications
Certain reclassifications have been made to the 2015 financial statements to conform to the 2016 financial statement presentation. These reclassifications had no effect on net earnings.
F-91
Table of Contents
AOS, Inc. and Subsidiaries
Notes to Consolidated Financial Statements
December 25, 2016 and December 27, 2015
Note 2: Restatement
The Company did not quantify and record an impairment loss on the property, equipment and software related to its AOScloud, LLC subsidiary at December 27, 2015. The impairment loss was recorded in 2016 when certain assets of the subsidiary were sold to a third party. Fiscal years 2016 and 2015 have been restated for the error. In addition, on December 15, 2017, the Company was acquired and required to report goodwill as a non-amortizable asset, whereas in prior years, goodwill was valued under the provisions of ASU 2014-02—Intangibles—Goodwill and Other (Topic 350): Accounting for Goodwill (a consensus of the Private Company Council), which allowed goodwill to be amortized over a 10 year useful life. The new method of accounting was required as the Company meets the definition of a public business entity as of December 15, 2017 and comparative financial statements of prior years have been adjusted to apply the new method retrospectively. These restatements increased previously reported income for the year ended December 25, 2016 by $4,201,355 and reduced previously reported income for the year ended December 27, 2015 by $4,105,226. The following financial statement line items for fiscal years 2016 and 2015 were affected by the change in accounting principle.
| As Restated | 2016 As Previously Reported |
Effect of Change |
||||||||||
| Consolidated Statement of Operations |
||||||||||||
| Loss from Discontinued Operations |
$ | 3,235,264 | $ | 7,170,076 | $ | (3,934,812 | ) | |||||
| Operating Expenses |
41,074,901 | 41,341,444 | (266,543 | ) | ||||||||
| Consolidated Balance Sheet |
||||||||||||
| Retained Earnings |
2,687,527 | 1,621,358 | 1,066,169 | |||||||||
| Goodwill, net |
2,665,422 | 1,599,253 | 1,066,169 | |||||||||
| Consolidated Statement of Cash Flows |
||||||||||||
| Net Income |
495,543 | (3,705,812 | ) | 4,201,355 | ||||||||
| Depreciation and Amortization |
2,479,884 | 2,746,427 | (266,543 | ) | ||||||||
| Loss on Sale of AOScloud, LLC |
434,295 | 4,369,107 | (3,934,812 | ) | ||||||||
| As Restated | 2015 As Previously Reported |
Effect of Change |
||||||||||
| Consolidated Statement of Operations |
||||||||||||
| Loss from Discontinued Operations |
$ | 12,883,610 | $ | 8,492,239 | $ | 4,391,371 | ||||||
| Operating Expenses |
43,871,993 | 44,158,138 | (286,145 | ) | ||||||||
| Consolidated Balance Sheet |
||||||||||||
| Non-current Assets—Discontinued Operations |
4,183,952 | 8,118,764 | (3,934,812 | ) | ||||||||
| Retained Earnings |
6,758,740 | 9,893,926 | (3,135,186 | ) | ||||||||
| Goodwill, net |
2,665,422 | 1,865,796 | 799,626 | |||||||||
| Consolidated Statement of Cash Flows |
||||||||||||
| Net Income (Loss) |
(3,356,067 | ) | 749,159 | (4,105,226 | ) | |||||||
| Depreciation and Amortization |
3,831,552 | 4,345,977 | (514,425 | ) | ||||||||
| Goodwill and Intangible Impairment Loss |
2,800,677 | 2,115,838 | 684,839 | |||||||||
| Property, Equipment and Software Impairment Loss |
3,934,812 | — | 3,934,812 | |||||||||
F-92
Table of Contents
AOS, Inc. and Subsidiaries
Notes to Consolidated Financial Statements
December 25, 2016 and December 27, 2015
Note 3: Related Party Transactions
The Companies lease office space under operating leases with Optober Investments I, LLC and Optober Investments III, LLC (“collectively, Optober”). Both entities are related parties that are 100 percent owned by a minority shareholder. For the years ended December 25, 2016 and December 27, 2015, the Companies paid $845,302 and $1,325,113, respectively, to the related parties included in rent expense. In 2016, the operating leases with Optober was discontinued.
Note 4: Property, Equipment and Software
Property, equipment and software consist of the following at December 25, 2016 and December 27, 2015:
| 2016 | 2015 | |||||||
| (Restated) | ||||||||
| Software |
$ | 1,112,146 | $ | 2,051,139 | ||||
| Computer equipment |
2,326,856 | 16,287,353 | ||||||
| Furniture and fixtures |
1,811,766 | 2,257,017 | ||||||
| Leasehold improvements |
2,020,429 | 1,998,821 | ||||||
| Automobiles |
49,545 | 54,125 | ||||||
|
|
|
|
|
|||||
| Total cost |
7,320,742 | 22,648,455 | ||||||
| Accumulated depreciation and amortization |
(5,130,786 | ) | (12,386,516 | ) | ||||
| Accumulated impairment |
— | (3,934,812 | ) | |||||
|
|
|
|
|
|||||
| 2,189,956 | 6,327,127 | |||||||
| Less: Property, equipment and software -discontinued operations |
12,480 | 4,014,628 | ||||||
|
|
|
|
|
|||||
| Property, equipment and software—continuing operations |
$ | 2,177,476 | $ | 2,312,499 | ||||
|
|
|
|
|
|||||
Depreciation and amortization expense on the above property, equipment and software for the years ended December 25, 2016 and December 27, 2015 was $2,366,464 and $3,445,821, respectively.
F-93
Table of Contents
AOS, Inc. and Subsidiaries
Notes to Consolidated Financial Statements
December 25, 2016 and December 27, 2015
Note 5: Acquired Intangible Assets and Goodwill
The carrying basis and accumulated amortization of recognized intangible assets at December 25, 2016 and December 27, 2015 were:
| 2016 (Restated) |
2015 (Restated) |
|||||||||||||||||||||||
| Gross Carrying Amount |
Accumulated Amortization |
Accumulated Impairment Loss |
Gross Carrying Amount |
Accumulated Amortization |
Accumulated Impairment Loss |
|||||||||||||||||||
| Amortized intangible assets |
||||||||||||||||||||||||
| Domain name |
$ | — | $ | — | $ | — | $ | 57,000 | $ | 57,000 | $ | — | ||||||||||||
| Contracted customers |
— | — | — | 1,148,000 | 1,148,000 | — | ||||||||||||||||||
| Customer relationships |
1,020,780 | 475,080 | — | 1,926,000 | 748,999 | 517,881 | ||||||||||||||||||
|
|
|
|
|
|
|
|
|
|
|
|
|
|||||||||||||
| Total amortized intangible assets |
1,020,780 | 475,080 | — | 3,131,000 | 1,953,999 | 517,881 | ||||||||||||||||||
|
|
|
|
|
|
|
|
|
|
|
|
|
|||||||||||||
| Goodwill |
2,665,422 | — | — | 4,948,218 | — | 2,282,796 | ||||||||||||||||||
|
|
|
|
|
|
|
|
|
|
|
|
|
|||||||||||||
| Less: Amortized and intangible assets and goodwill—discontinued operations |
— | — | — | 4,393,016 | 1,592,339 | 2,800,677 | ||||||||||||||||||
|
|
|
|
|
|
|
|
|
|
|
|
|
|||||||||||||
| Amortized and intangible assets and goodwill—continuing operations |
$ | 3,686,202 | $ | 475,080 | $ | — | $ | 3,686,202 | $ | 361,660 | $ | — | ||||||||||||
|
|
|
|
|
|
|
|
|
|
|
|
|
|||||||||||||
Amortization expense recorded for the years ended December 25, 2016 and December 27, 2015 was $113,420 and $405,333, respectively. Estimated amortization expense for each of the next five years is:
| 2017 |
$ | 113,420 | ||
| 2018 |
113,420 | |||
| 2019 |
113,420 | |||
| 2020 |
113,420 | |||
| 2021 |
92,020 |
The changes in the gross carrying amount of goodwill for the years ended December 25, 2016 and December 27, 2015 were:
| Balance as of December 28, 2014 |
$ | 4,948,218 | ||
| Impairment losses |
(2,282,796 | ) | ||
|
|
|
|||
| Balance as of December 27, 2015 |
2,665,422 | |||
|
|
|
|||
| Balance as of December 25, 2016 |
$ | 2,665,422 | ||
|
|
|
Goodwill is allocated to several components within the Company. Due to continued decreased financial performance, and projected operating losses and negative cash flows, the goodwill assigned to AOScloud, LLC, (Cloud) was considered for potential impairment for the year ended December 27, 2015. A goodwill impairment loss of $2,282,796 and an other intangible asset impairment loss of $517,881 was recorded in the year ended December 27, 2015, within the consolidated financial statements of Cloud.
Note 6: Operating Leases
Noncancellable operating leases for branch sales offices and certain office furniture and equipment expire in various years through 2023. These leases generally contain renewal options for various periods and require the
F-94
Table of Contents
AOS, Inc. and Subsidiaries
Notes to Consolidated Financial Statements
December 25, 2016 and December 27, 2015
Companies to pay all executory costs (property taxes, maintenance and insurance). Lease incentives received by the Companies such as free rent periods, escalating rent provisions and leasehold improvement allowances are deferred and amortized on a straight-line basis over the term of the respective lease agreements, and are recorded as a reduction of rent expense. At December 25, 2016 and December 27, 2015, the Companies accrued $1,272,076 and $1,305,207, respectively, for the deferral of the benefit received for free rent periods, future escalating rent payments and leasehold improvement allowances. These amounts are included in deferred lease incentives on the accompanying consolidated balance sheets.
Future minimum lease payments at December 25, 2016, were:
| 2017 |
$ | 1,687,814 | ||
| 2018 |
1,373,590 | |||
| 2019 |
1,263,605 | |||
| 2020 |
985,799 | |||
| 2021 |
836,816 | |||
| Thereafter |
525,446 | |||
|
|
|
|||
| Total |
$ | 6,673,070 | ||
|
|
|
Total rent expense under operating leases for the years ended December 25, 2016 and December 27, 2015 were $2,833,221 and $3,369,270, respectively.
Note 7: Lines of Credit
At December 25, 2016 and December 27, 2015, the Companies have a $45,000,000 line of credit from Castle Pines Capital, LLC. At both December 25, 2016 and December 27, 2015, there was $0 borrowed against this line. The balance is payable on demand and has two components. The first component is a floor plan financing arrangement whereby the Companies’ inventory purchases can be financed with 30, 45 or 60 day interest-free periods. The Companies classify amounts outstanding under the floor plan financing as accounts payable. The second component of the line of credit consists of an extended pay line, whereby all inventory purchases that are beyond the interest-free term roll into the interest-bearing portion of the line. Interest on this portion of the line is to be paid weekly at the prime rate, plus 1.5 percent (5.25 percent as of December 25, 2016 and 5.00 percent as of December 27, 2015). There were no outstanding balances owed on the extended pay portion of the line of credit as of December 25, 2016 and December 27, 2015. The Companies also classify amounts outstanding under the extended pay line as accounts payable.
This line of credit is collateralized by the Companies’ accounts receivable, all other assets and guarantees by all of its shareholders. All payments received by the Companies on their accounts receivable are directly deposited into a lock-box account so that the Companies can apply payment against the obligation. A power of attorney has been granted to Castle Pines Capital, LLC by the Companies with respect to collections, security interests and related aspects of this agreement.
At December 25, 2016 and December 27, 2015, the credit agreement was subject to the following covenants:
The Companies will at all times maintain on a consolidated basis:
| (A) | A ratio of current assets to current liability of at least 1.00. |
| (B) | Tangible net worth equal to at least $7,000,000. |
| (C) | A maximum funded debt to tangible net worth ratio of no more than 2.50 to 1.00. |
F-95
Table of Contents
AOS, Inc. and Subsidiaries
Notes to Consolidated Financial Statements
December 25, 2016 and December 27, 2015
| (D) | A minimum cumulative fixed coverage charge ratio of 1.25 to 1.00. This ratio will be measured on a trailing 12 month basis at the end of each fiscal month. |
Inventory financed through the floor plan is included in operating activities in the consolidated statements of cash flows.
Note 8: Long-term Debt
| 2016 | 2015 | |||||||
| Various capital leases to a vendor payable monthly, including interest rates ranging from 2.87% to 4.65% based on the lower of the Companies’ incremental borrowing rate or the lessor’s implicit rate. Amounts due on capital leases were paid in 2016. |
$ | — | $ | 831,163 | ||||
| Various capital leases to a vendor payable monthly beginning three months from the date of lease commencement, including interest rates ranging from 4.50% to 5.00% based on the lower of the Companies’ incremental borrowing rate or the lessor’s implicit rate. Amounts due on capital leases were paid in 2016. |
— | 60,101 | ||||||
| Various capital leases to a vendor payable monthly, including interest rates ranging from 6.90% to 7.95% based on the lower of the Companies’ incremental borrowing rate or the lessor’s implicit rate. Amounts due on capital leases were paid in 2016. |
— | 378,301 | ||||||
|
|
|
|
|
|||||
| — | 1,269,565 | |||||||
| Less current maturities |
— | 1,190 | ||||||
|
|
|
|
|
|||||
| Long-term debt |
— | 1,268,375 | ||||||
| Less: Debt—discontinued operations |
— | 1,268,375 | ||||||
|
|
|
|
|
|||||
| Long-term debt—continuing operations |
$ | — | $ | — | ||||
|
|
|
|
|
|||||
Note 9: Profit Sharing Plan
The Companies have established a defined contribution 401(k) profit sharing plan providing benefits for substantially all of their employees. The Companies’ matching contributions for the years ended December 25, 2016 and December 27, 2015 totaled $292,270 and $366,536, respectively.
Note 10: Significant Estimates and Concentrations
Accounting principles generally accepted in the United States of America require disclosure of certain significant estimates and current vulnerabilities due to certain concentrations. Those matters include the following:
Major Suppliers
For the year ended December 25, 2016, two vendors represented 71 percent of total purchases, and for the year ended December 27, 2015, four vendors represented approximately 84 percent of total purchases.
Note 11: Discontinued Operations—Alexander Open Systems, Inc.—Texas
During the year ended December 27, 2015, the Companies adopted ASU 2014-08, Presentation of Financial Statements (Topic 205) and Property, Plant and Equipment (Topic 360): Reporting Discontinued Operations and Disclosures of Disposals of Components of an Entity, relating to the closure of Alexander Open Systems, Inc.’s
F-96
Table of Contents
AOS, Inc. and Subsidiaries
Notes to Consolidated Financial Statements
December 25, 2016 and December 27, 2015
Texas division, a consolidated entity of the Companies. As of December 27, 2015, the Companies elected to discontinue the operations of this division, effective in January 2016, due to poor profitability. The closure of this entity resulted in the discontinuation of any marketing and sales effort in the state of Texas for all product and service offerings, which includes hardware sales and engineering services. The remaining assets were analyzed for impairment with no impairment loss assessed by management. The operations of the discontinued division have been reclassified to include all revenues and expenses of the division in discontinued operations. After the closure of the entity, the remaining assets and liabilities were transferred to Alexander Open Systems, Inc. See below for a reconciliation of the major classes of line items from the consolidated statements of operations and consolidated balance sheets for the years ended December 25, 2016 and December 27, 2015, respectively.
Reconciliation of the Major Classes of Line Items Constituting Loss of Discontinued
Operations that are Disclosed in the Notes to Consolidated Financial Statements to the Loss
of Discontinued Operations that are Presented
in the Consolidated Statements of Operations
| 2016 | 2015 | |||||||
| Major classes of line items constituting loss of discontinued operations |
||||||||
| Total revenues |
$ | 243,702 | $ | 4,172,100 | ||||
| Total cost of sales |
(152,710 | ) | (3,204,486 | ) | ||||
| Operating expenses |
(382,784 | ) | (2,792,620 | ) | ||||
| Other expense—interest expense |
(9,543 | ) | — | |||||
|
|
|
|
|
|||||
| Total loss on discontinued operations that is presented in the condensed consolidated statements of operations |
$ | (301,335 | ) | $ | (1,825,006 | ) | ||
|
|
|
|
|
|||||
F-97
Table of Contents
AOS, Inc. and Subsidiaries
Notes to Consolidated Financial Statements
December 25, 2016 and December 27, 2015
Reconciliation of the Carrying Amounts of Major Classes of Assets and Liabilities of the Discontinued Operation that are Disclosed in the Notes to Consolidated Financial Statements to Total Assets and Liabilities of the Disposal Group that are Presented Separately in the Consolidated Balance Sheets
| 2016 | 2015 | |||||||
| Carrying amounts of major classes of assets included as part of discontinued operations: |
||||||||
| Accounts receivable, trade, net of allowance |
$ | — | $ | 987,347 | ||||
| Inventories |
332 | 2,852 | ||||||
| Prepaid expenses |
— | 1,450 | ||||||
| Property, equipment and software, net |
12,480 | 25,104 | ||||||
| Other noncurrent assets |
5,760 | 15,057 | ||||||
|
|
|
|
|
|||||
| Total major classes of assets of the discontinued operations |
$ | 18,572 | $ | 1,031,810 | ||||
|
|
|
|
|
|||||
| Carrying amounts of major classes of liabilities included as part of discontinued operations: |
||||||||
| Accounts payable |
$ | 9,889 | $ | 192,444 | ||||
| Accrued expenses |
671 | 149,248 | ||||||
| Deferred revenue |
— | 58,893 | ||||||
|
|
|
|
|
|||||
| Total major classes of liabilities of the discontinued operations |
$ | 10,560 | $ | 400,585 | ||||
|
|
|
|
|
|||||
The impact on significant statements of cash flows activities is presented below for each of the years ended December 25, 2016 and December 27, 2015.
| 2016 | 2015 | |||||||
| Significant operating items not involving cash |
||||||||
| Depreciation and amortization |
$ | 8,950 | $ | 20,768 | ||||
Note 12: Discontinued Operations—AOScloud, LLC
As of July 27, 2016, the Companies elected to sell the AOScloud, LLC component, effective on that date, due to continuing operating losses. As part of the discontinuation, all data hosting operations and related services were eliminated. The remaining assets were analyzed for impairment and it was determined there were no material impairment losses. All existing property, equipment and software were included in the asset purchase agreement for a sale price of $2,000,000. The sales agreement also includes a contingent purchase price where the Companies may earn up to $800,000 each year for two years if certain revenue targets are achieved. See below for a reconciliation of the major classes of line items from the consolidated statements of operations and consolidated balance sheets for the years ended December 25, 2016 and December 27, 2015, respectively.
F-98
Table of Contents
AOS, Inc. and Subsidiaries
Notes to Consolidated Financial Statements
December 25, 2016 and December 27, 2015
Reconciliation of the Major Classes of Line Items Constituting Loss of Discontinued
Operations that are Disclosed in the Notes to Consolidated Financial Statements to the Loss
of Discontinued Operations that are Presented
in the Consolidated Statements of Operations
| 2016 | 2015 | |||||||
| (Restated) | (Restated) | |||||||
| Major classes of line items constituting loss of discontinued operations |
||||||||
| Total revenues |
$ | 4,566,659 | $ | 8,736,240 | ||||
| Total cost of sales |
(3,967,845 | ) | (7,256,660 | ) | ||||
| Operating expenses |
(3,479,204 | ) | (5,722,458 | ) | ||||
| Other expense—interest expense |
(53,539 | ) | (80,242 | ) | ||||
| Other expense—goodwill and intangible impairment loss |
— | (2,800,672 | ) | |||||
| Other expense—property, equipment and software impairment loss |
— | (3,934,812 | ) | |||||
|
|
|
|
|
|||||
| Total loss on discontinued operations that is presented in the condensed consolidted statements of operations |
$ | (2,933,929 | ) | $ | (11,058,604 | ) | ||
|
|
|
|
|
|||||
Reconciliation of the Carrying Amounts of Major Classes of Assets and Liabilities
of the Discontinued Operation that are Disclosed in the Notes to Consolidated Financial Statements
to Total Assets and Liabilities of the Disposal Group
that are Presented Separately in the Consolidated Balance Sheets
| 2016 | 2015 | |||||||
| (Restated) | (Restated) | |||||||
| Carrying amounts of major classes of assets included as part of discontinued operations: |
||||||||
| Cash and cash equivalents |
$ | — | $ | 1,002,830 | ||||
| Accounts receivable, trade, net of allowance |
135,255 | 622,225 | ||||||
| Prepaid expenses |
— | 368,287 | ||||||
| Property, equipment and software, net |
— | 3,989,524 | ||||||
| Other noncurrent assets |
— | 154,267 | ||||||
|
|
|
|
|
|||||
| Total major classes of assets of the discontinued operations |
$ | 135,255 | $ | 6,137,133 | ||||
|
|
|
|
|
|||||
| Carrying amounts of major classes of liabilities included as part of discontinued operations: |
||||||||
| Accounts payable |
$ | — | $ | 259,646 | ||||
| Accrued compensation expense |
35,704 | 110,289 | ||||||
| Accrued expenses |
43,906 | 137,049 | ||||||
| Current maturities of long-term debt |
— | 892,383 | ||||||
| Long-term debt |
— | 375,992 | ||||||
|
|
|
|
|
|||||
| Total major classes of liabilities of the discontinued operations |
$ | 79,610 | $ | 1,775,359 | ||||
|
|
|
|
|
|||||
F-99
Table of Contents
AOS, Inc. and Subsidiaries
Notes to Consolidated Financial Statements
December 25, 2016 and December 27, 2015
The impact on significant statements of cash flows activities is presented below for each of the years ended December 25, 2016 and December 27, 2015.
| 2016 | 2015 | |||||||
| (Restated) | (Restated) | |||||||
| Significant operating items not involving cash |
||||||||
| Depreciation and amortization |
$ | 241,761 | $ | 720,460 | ||||
| (Gain) loss on sale of property and equipment |
434,295 | (77,848 | ) | |||||
| Goodwill and intangible impairment loss |
— | 2,800,677 | ||||||
| Property, equipment and software impairment loss |
— | 3,934,812 | ||||||
| Significant investing activities |
||||||||
| Purchase of property and equipment |
$ | 211,330 | $ | 1,288,504 | ||||
| Proceeds from the sale of property and equipment |
— | 123,924 | ||||||
Note 13: Subsequent Events
Subsequent events were evaluated through March 21, 2017, which is the date the consolidated financial statements were initially available to be issued. Subsequent events related to the restatements described in Note 2 have been evaluated through February 9, 2018, which is the date the revised consolidated financial statements were available to be issued.
F-100
Table of Contents
AOS, Inc. and Subsidiaries
Condensed Consolidated Balance Sheets
| As of December 25, 2016 |
As of October 1, 2017 |
|||||||
| (Restated) | (Unaudited) | |||||||
| Assets |
||||||||
| Current Assets |
||||||||
| Cash and cash equivalents |
$ | 9,953,783 | $ | 12,310,704 | ||||
| Accounts receivable, trade, net of allowance; 2016—$375,532, 2017— $304,135 |
26,365,786 | 22,568,609 | ||||||
| Receivable for sale of AOScloud, LLC |
300,000 | — | ||||||
| Returned goods receivable |
800,274 | 894,615 | ||||||
| Inventories |
1,788,622 | 1,001,074 | ||||||
| Prepaid expenses |
573,852 | 528,393 | ||||||
|
|
|
|
|
|||||
| Current assets—continuing operations |
39,782,317 | 37,303,395 | ||||||
| Current assets—discontinued operations |
135,587 | — | ||||||
|
|
|
|
|
|||||
| Total current assets |
39,917,904 | 37,303,395 | ||||||
|
|
|
|
|
|||||
| Property, Equipment and Software, Net |
2,177,476 | 1,565,736 | ||||||
|
|
|
|
|
|||||
| Other Assets |
||||||||
| Goodwill, net |
2,665,422 | 2,665,422 | ||||||
| Intangible assets, net |
545,700 | 460,635 | ||||||
| Other |
71,817 | 150,799 | ||||||
|
|
|
|
|
|||||
| Total other assets |
3,282,939 | 3,276,856 | ||||||
|
|
|
|
|
|||||
| Non-current assets—continuing operations |
5,460,415 | 4,842,592 | ||||||
| Non-current assets—discontinued operations |
18,240 | 20,199 | ||||||
|
|
|
|
|
|||||
| Total non-current assets |
5,478,655 | 4,862,791 | ||||||
|
|
|
|
|
|||||
| Total assets |
$ | 45,396,559 | $ | 42,166,186 | ||||
|
|
|
|
|
|||||
See Notes to Condensed Consolidated Financial Statements
F-101
Table of Contents
AOS, Inc. and Subsidiaries
Condensed Consolidated Balance Sheets
| As of December 25, 2016 |
As of October 1, 2017 |
|||||||
| (Restated) | (Unaudited) | |||||||
| Liabilities and Stockholders’ Equity |
||||||||
| Current Liabilities |
||||||||
| Accounts payable |
$ | 22,273,061 | $ | 17,111,893 | ||||
| Accrued compensation |
4,616,881 | 4,245,604 | ||||||
| Accrued expenses |
2,303,779 | 958,046 | ||||||
| Deferred lease incentives |
163,618 | 163,618 | ||||||
| Deferred revenue |
2,246,464 | 1,817,786 | ||||||
|
|
|
|
|
|||||
| Current liabilities—continuing operations |
31,603,803 | 24,296,947 | ||||||
| Current liabilities—discontinued operations |
90,170 | 4,971 | ||||||
|
|
|
|
|
|||||
| Total current liabilities |
31,693,973 | 24,301,918 | ||||||
|
|
|
|
|
|||||
| Deferred Lease Incentives |
1,108,458 | 948,913 | ||||||
|
|
|
|
|
|||||
| Total non-current liabilities |
1,108,458 | 948,913 | ||||||
|
|
|
|
|
|||||
| Total liabilities |
32,802,431 | 25,250,831 | ||||||
|
|
|
|
|
|||||
| Stockholders’ Equity |
||||||||
| Common stock, $1 par value; 100,000 shares authorized, 1,197 shares issued and outstanding |
1,197 | 1,197 | ||||||
| Additional paid-in capital |
9,905,404 | 9,905,404 | ||||||
| Retained earnings |
2,687,527 | 7,008,754 | ||||||
|
|
|
|
|
|||||
| Total stockholders’ equity |
12,594,128 | 16,915,355 | ||||||
|
|
|
|
|
|||||
| Total liabilities and stockholders’ equity |
$ | 45,396,559 | $ | 42,166,186 | ||||
|
|
|
|
|
|||||
See Notes to Condensed Consolidated Financial Statements
F-102
Table of Contents
AOS, Inc. and Subsidiaries
Condensed Consolidated Statements of Operations
| Year Ended December 25, 2016 |
39 Weeks Ended September 25, 2016 |
40 Weeks Ended October 1, 2017 |
||||||||||
| (Restated) | (Unaudited) | (Unaudited) | ||||||||||
| Revenue |
||||||||||||
| Hardware sales |
$ | 143,708,752 | $ | 105,218,135 | $ | 109,941,870 | ||||||
| Engineering services |
26,362,400 | 19,507,232 | 17,894,561 | |||||||||
| Third-party warranty |
6,454,899 | 4,584,037 | 5,027,553 | |||||||||
| Other revenue |
820,788 | 681,986 | 349,613 | |||||||||
|
|
|
|
|
|
|
|||||||
| Total revenue |
177,346,839 | 129,991,390 | 133,213,597 | |||||||||
|
|
|
|
|
|
|
|||||||
| Cost of Sales |
||||||||||||
| Hardware cost of sales |
115,345,597 | 84,088,937 | 88,525,515 | |||||||||
| Engineering services cost of sales |
16,961,909 | 12,637,852 | 10,765,420 | |||||||||
| Other cost of sales |
232,268 | 191,661 | 158,596 | |||||||||
|
|
|
|
|
|
|
|||||||
| Total cost of sales |
132,539,774 | 96,918,450 | 99,449,531 | |||||||||
|
|
|
|
|
|
|
|||||||
| Gross Profit |
44,807,065 | 33,072,940 | 33,764,066 | |||||||||
| Operating Expenses |
41,074,901 | 31,138,076 | 28,004,991 | |||||||||
|
|
|
|
|
|
|
|||||||
| Operating Income |
3,732,164 | 1,934,864 | 5,759,075 | |||||||||
| Other Expense |
||||||||||||
| Interest expense |
1,357 | 1,357 | 433 | |||||||||
|
|
|
|
|
|
|
|||||||
| Income from Continuing Operations |
3,730,807 | 1,933,507 | 5,758,642 | |||||||||
| Discontinued Operations (Note 10 ) |
||||||||||||
| Loss from discontinued operations |
(3,235,264 | ) | (3,235,264 | ) | (244 | ) | ||||||
|
|
|
|
|
|
|
|||||||
| Net Income (Loss) |
$ | 495,543 | $ | (1,301,757 | ) | $ | 5,758,398 | |||||
|
|
|
|
|
|
|
|||||||
See Notes to Condensed Consolidated Financial Statements
F-103
Table of Contents
AOS, Inc. and Subsidiaries
Condensed Consolidated Statements of Stockholders’ Equity
| Common Stock |
Additional Paid-in Capital |
Retained Earnings |
Total Stockholders’ Equity |
|||||||||||||
| Balance, December 25, 2016 (Restated) |
$ | 1,197 | $ | 9,905,404 | $ | 2,687,527 | $ | 12,594,128 | ||||||||
| Distributions |
— | — | (1,437,171 | ) | (1,437,171 | ) | ||||||||||
| Net income |
— | — | 5,758,398 | 5,758,398 | ||||||||||||
|
|
|
|
|
|
|
|
|
|||||||||
| Balance, October 1, 2017 (Unaudited) |
$ | 1,197 | $ | 9,905,404 | $ | 7,008,754 | $ | 16,915,355 | ||||||||
|
|
|
|
|
|
|
|
|
|||||||||
See Notes to Condensed Consolidated Financial Statements
F-104
Table of Contents
AOS, Inc. and Subsidiaries
Condensed Consolidated Statements of Cash Flows
| Year Ended December 25, 2016 |
39 Weeks Ended September 25, 2016 |
40 Weeks Ended October 1, 2017 |
||||||||||
| (Restated) | (Unaudited) | (Unaudited) | ||||||||||
| Operating Activities |
||||||||||||
| Net income (loss) |
$ | 495,543 | $ | (1,301,757 | ) | $ | 5,758,398 | |||||
| Items not requiring (providing) cash |
||||||||||||
| Depreciation and amortization |
2,479,884 | 2,226,987 | 736,208 | |||||||||
| Loss on sale of property and equipment |
361,839 | 361,839 | 15,084 | |||||||||
| Loss on sale of AOScloud, LLC |
434,295 | 434,295 | — | |||||||||
| Deferred lease incentives |
(193,894 | ) | (154,529 | ) | (159,545 | ) | ||||||
| Changes in |
||||||||||||
| Accounts receivable, trade |
4,640,196 | 4,695,093 | 3,985,860 | |||||||||
| Returned goods receivable |
245,063 | 325,785 | (94,341 | ) | ||||||||
| Inventories |
699,507 | 464,803 | 787,548 | |||||||||
| Prepaid expenses |
365,341 | 139,035 | 45,459 | |||||||||
| Other assets |
22,784 | 8,755 | (73,222 | ) | ||||||||
| Accounts payable, trade |
(2,723,394 | ) | (5,169,486 | ) | (5,161,168 | ) | ||||||
| Accrued compensation |
642,088 | 1,781,769 | (371,277 | ) | ||||||||
| Accrued expenses |
(947,326 | ) | (1,664,912 | ) | (1,318,932 | ) | ||||||
| Deferred revenue |
(826,653 | ) | (919,607 | ) | (428,678 | ) | ||||||
|
|
|
|
|
|
|
|||||||
| Net cash provided by operating activities |
5,695,273 | 1,228,070 | 3,721,394 | |||||||||
|
|
|
|
|
|
|
|||||||
| Investing Activities |
||||||||||||
| Purchase of property and equipment |
(477,116 | ) | (450,197 | ) | (55,703 | ) | ||||||
| Proceeds from the sale of AOScloud, LLC |
1,700,000 | 1,700,000 | 300,000 | |||||||||
| Proceeds from the sale of property and equipment |
2,300 | 2,300 | 1,180 | |||||||||
|
|
|
|
|
|
|
|||||||
| Net cash provided by investing activities |
1,225,184 | 1,252,103 | 245,477 | |||||||||
|
|
|
|
|
|
|
|||||||
| Financing Activities |
||||||||||||
| Repayment of capital lease obligations |
(1,392,793 | ) | (1,392,793 | ) | — | |||||||
| Dividends paid |
(4,458,808 | ) | (3,636,510 | ) | (1,609,950 | ) | ||||||
|
|
|
|
|
|
|
|||||||
| Net cash used in financing activities |
(5,851,601 | ) | (5,029,303 | ) | (1,609,950 | ) | ||||||
|
|
|
|
|
|
|
|||||||
| Increase (Decrease) in Cash and Cash Equivalents |
1,068,856 | (2,549,130 | ) | 2,356,921 | ||||||||
| Cash and Cash Equivalents, Beginning of Year |
8,884,927 | 8,884,927 | 9,953,783 | |||||||||
|
|
|
|
|
|
|
|||||||
| Cash and Cash Equivalents, End of Year |
$ | 9,953,783 | $ | 6,335,797 | $ | 12,310,704 | ||||||
|
|
|
|
|
|
|
|||||||
| Supplemental Cash Flows Information |
||||||||||||
| Interest paid |
$ | 64,115 | $ | 64,439 | $ | 433 | ||||||
| Capital lease obligation incurred for equipment |
123,228 | 123,228 | — | |||||||||
| Leasehold improvements provided by landlord |
160,763 | 160,763 | — | |||||||||
| Receivable for sale of AOScloud, LLC |
300,000 | 300,000 | — | |||||||||
| Distributions declared |
107,948 | — | — | |||||||||
See Notes to Condensed Consolidated Financial Statements
F-105
Table of Contents
AOS, Inc. and Subsidiaries
Notes to Condensed Consolidated Financial Statements
October 1, 2017
Note 1: Nature of Operations and Summary of Significant Accounting Policies
Nature of Operations
AOS, Inc. was incorporated in Nevada on January 1, 2006. Its wholly-owned subsidiaries include: Alexander Open Systems, Inc. that was incorporated in Kansas on September 1, 1992; AOS, LLC that was organized in Missouri on January 31, 2005; AOSNC, LLC that was organized in Nebraska on August 26, 2005; eTek Global, Inc., a Kansas Corporation, that was acquired on June 3, 2011; and AOScloud, LLC, that was organized in Kansas on July 3, 2012.
Alexander Open Systems, Inc., AOS, LLC and AOSNC, LLC design, sell, install and service computer network systems. eTek Global, Inc. designs intranet portals using the SharePoint system. AOScloud, LLC provides data center-based hosting solutions. The Company’s primary customers are state and local governments, medical, legal, school districts and universities as well as large corporate accounts located throughout the Midwest.
As discussed in Note 10, in 2015 the Company ceased the operations of its Texas division and has reported the activity for 2015 and 2016 as discontinued operations in the consolidated statements of operations. In 2016 the Company sold virtually all of the assets of AOScloud, LLC and has reported the activity for 2015 and 2016 as discontinued operations in the consolidated statements of operations. The Company applied the provisions of ASU 2014-08, Presentation of Financial Statements (Topic 205) and Property, Plant and Equipment (Topic 360): Reporting Discontinued Operations and Disclosures of Disposals of Components of an Entity, for the discontinued operations disclosures.
Basis of Presentation
The condensed consolidated financial statements of AOS, Inc. and Subsidiaries (collectively, the “Company”) have been prepared in accordance with United States generally accepted accounting principles (“GAAP”) for interim financial information and with the instructions of Regulation S-X. Accordingly, they do not include all of the information and notes required by GAAP for complete financial statements. In the opinion of management, all adjustments (consisting of normal recurring adjustments) considered necessary for the fair presentation have been included. Operating results for the nine months ended October 1, 2017 are not necessarily indicative of the results that may be expected for the year ending December 31, 2017. The condensed consolidated balance sheet of the Company as of December 25, 2016 has been derived from the audited balance sheet of the Company as of that date. Certain information and note disclosures normally included in the Company’s annual financial statements prepared in accordance with GAAP have been condensed or eliminated. These condensed consolidated financial statements should be read in conjunction with the consolidated financial statements and notes thereto included in the Company’s annual financial statements.
Principles of Consolidation
The condensed consolidated financial statements include the accounts of the Company. All significant intercompany balances have been eliminated.
Fiscal Year
The Company operates on a fiscal year based on 52- or 53-week periods ending on the last Sunday in December. Fiscal year ended December 25, 2016 (“FY 2016”) was 52 weeks. Third quarter ended September 25, 2016 (“Q3YTD 2016”) and October 1, 2017 (“Q3YTD 2017”) were 39 and 40 weeks, respectively.
Use of Estimates
The preparation of financial statements in conformity with accounting principles generally accepted in the United States of America requires management to make estimates and assumptions that affect the reported
F-106
Table of Contents
AOS, Inc. and Subsidiaries
Notes to Condensed Consolidated Financial Statements
October 1, 2017
amounts of assets and liabilities and disclosure of contingent assets and liabilities at the date of the consolidated financial statements and the reported amounts of revenues and expenses during the reporting period. Actual results could differ from those estimates.
Revenue Recognition
The Company recognizes revenue, net of sales taxes, when all of the following are present: persuasive evidence of an arrangement exists, delivery has occurred or services have been rendered, fee to the customer is fixed or determinable and collectability is reasonably assured.
The Company entered into short-term contracts to install computer systems, whereby the contract is generally completed within the same year that the contract began. Services primarily relate to design and installment of hardware. These services are charged to customers based upon time and material or a predetermined agreed upon fixed fee. Revenue related to services is recognized based on hours spent. For contracts with anticipated services less than 40 hours, revenue is recognized as time is accrued on the services performed. For contracts with anticipated services greater than 40 hours, which generally require a Project Manager to oversee, revenue is recognized on a proportional performance basis. Management determines billing amounts the last week of each fiscal month based on the fixed contract amount and the proportion of the project completed. The proportion is based on hours worked on the project to date versus the total hours budgeted for the project.
Revenue associated with hardware sales is recognized based on the sales terms. Sales terms usually are stated as F.O.B. destination, and delivery is not deemed to have occurred until the point in time when the product is received by the customer.
Revenue is recognized from software sales when the customers acquire the right to use or copy software under license, provided that all revenue recognition criteria have been met.
The sale of hardware and software products may also include the provision of services, and the associated contracts may contain multiple elements. If services are performed in conjunction with a hardware or software sale, revenue is recognized for each portion of the arrangement that is attributable to the items as they are delivered or the services are performed. The selling price is determined in a manner that is consistent with that used to determine the price to sell the deliverable on a standalone basis.
The Company sells certain third-party service contracts for which the sale is evaluated whether it should be recorded as a gross sale or a net sale. If the Company acts as a principal in the transaction and assume the risks and rewards of ownership, the sale is recorded gross, and the entire selling price is recorded in sales and the cost to the third-party provider is recorded in cost of goods sold. If the Company is acting as an agent or broker, the sale is recorded net, and the cost to the third-party provider is recorded as a reduction of sales and there are no cost of goods sold. Net sales are presented within Third-Party Warranty and Engineering Services in the condensed consolidated statements of operations.
Shipping and Handling Costs
Freight billed to customers is considered sales revenue and the related freight costs as cost of sales.
Advertising
Advertising costs are expensed when incurred. Advertising costs were $573,197, $743,877 and $899,736 for FY 2016, Q3YTD 2016 and Q3YTD 2017, respectively. Advertising costs are offset by cooperative rebates received from vendors, which were $219,259, $461,951 and $219,259 for FY 2016, Q3YTD 2016 and Q3YTD 2017, respectively.
F-107
Table of Contents
AOS, Inc. and Subsidiaries
Notes to Condensed Consolidated Financial Statements
October 1, 2017
Cash and Cash Equivalents
The Company considers all liquid investments with original maturities of three months or less to be cash equivalents. At December 25, 2016 and October 1, 2017, cash equivalents consisted primarily of money market accounts with brokers and certificates of deposit.
Accounts Receivable
Accounts receivable are stated at the amount billed to customers. The Company provides an allowance for doubtful accounts, which is based upon a review of outstanding receivables, historical collection information and existing economic conditions. Accounts receivable are ordinarily due 30 days after the issuance of the invoice. Accounts past due more than 120 days are considered delinquent. Delinquent receivables are written off based on individual credit evaluation and specific circumstances of the customer.
Returned Goods Receivable
Returned goods receivable are stated at the amount due from vendors for customer returns of product. Customer returns and reorders are processed and executed by the Company while credit from the vendors is in process.
Inventories
Inventories consist primarily of hardware in transit and prepaid inventory. Inventories are stated at lower of cost or market. Cost of inventory has been determined using the first-in, first-out (FIFO) method.
Property, Equipment and Software
Property, equipment and software acquisitions are stated at cost less accumulated depreciation and amortization. Depreciation and amortization are charged to expense using straight-line or accelerated methods over the estimated useful life of each asset. Assets under capital lease obligations and leasehold improvements are amortized over the shorter of the lease term or their respective estimated useful lives.
The estimated useful lives for each major depreciable classification of property and equipment and software are as follows:
| Software |
3 years | |||
| Computer equipment |
3-5 years | |||
| Furniture and fixtures |
7-10 years | |||
| Leasehold improvements |
Lease life | |||
| Automobiles |
5 years |
Long-lived Asset Impairment
The Company evaluates the recoverability of the carrying value of long-lived assets whenever events or circumstances indicate the carrying amount may not be recoverable. If a long-lived asset is tested for recoverability and the undiscounted estimated future cash flows expected to result from the use and eventual disposition of the asset is less than the carrying amount of the asset, the asset cost is adjusted to fair value and an impairment loss is recognized as the amount by which the carrying amount of a long-lived asset exceeds its fair value.
No asset impairments on long-lived tangible assets were recognized during the periods presented.
Goodwill
Goodwill is evaluated annually for impairment or more frequently if impairment indicators are present. A qualitative assessment is performed to determine whether the existence of events or circumstances leads to a
F-108
Table of Contents
AOS, Inc. and Subsidiaries
Notes to Condensed Consolidated Financial Statements
October 1, 2017
determination that it is more likely than not the fair value is less than the carrying amount, including goodwill. If, based on the evaluation, it is determined to be more likely than not that the fair value is less than the carrying value, then goodwill is tested further for impairment. If the implied fair value of goodwill is lower than its carrying amount, a goodwill impairment is indicated and goodwill is written down to its implied fair value. No goodwill impairment losses were recognized during the periods presented.
Intangible Assets
Intangible assets include domain name, contracted customers and customer relationships. These assets are amortized using the straight-line method. The domain name is amortized over one and a half years; the contracted customer intangibles are amortized over the life of the contracts (three years) and the customer relationships are amortized over nine years. Such assets are periodically evaluated as to the recoverability of their carrying values. No impairment losses were recognized during the periods presented.
Incentive Payments
The Company receives third-party manufacturer incentives that result in a price reduction on equipment sold to the Company’s customers. The Company records these incentives as a reduction of cost of sales. For FY 2016, Q3YTD 2016 and Q3YTD 2017, the Company recorded $3,912,832, $4,117,303 and $5,313,223, respectively, in incentive payments.
Deferred Revenue
The Company sells certain services under arrangements that permit customers to prepay for services to be provided. These prepayments are deferred and recognized over the periods in which the services are performed.
Income Taxes
The stockholders of AOS, Inc. and all of its subsidiaries are either limited liability companies or corporations where the respective stockholders have elected to be taxed as an “S” Corporation under provisions of the Internal Revenue Code or similar section of the state income tax law for the year ended December 25, 2016. Therefore, taxable income or loss is reported to the individual stockholders and members for inclusion in their respective tax returns and no provision for federal and state income taxes is included in these statements.
The Company recognizes interest and penalties on income taxes as a component of income tax expense.
Self-Insurance
The Company has elected to self-insure certain costs related to employee health benefit programs. Costs resulting from noninsured losses are charged to income when incurred. The Company purchased insurance that limits their exposure for individual claims and that limits their aggregate exposure.
Taxes Collected from Customers and Remitted to Governmental Authorities
Taxes collected from customers and remitted to governmental authorities are presented in the accompanying consolidated statements of operations on a net basis.
Reclassifications
Certain reclassifications have been made to the 2016 financial statements to conform to the 2017 financial statement presentation. These reclassifications had no effect on net earnings.
Note 2: Restatement
The Company did not quantify and record an impairment loss on the property, equipment and software related to its AOScloud, LLC subsidiary at December 27, 2015. The impairment loss was recorded in 2016 when
F-109
Table of Contents
AOS, Inc. and Subsidiaries
Notes to Condensed Consolidated Financial Statements
October 1, 2017
certain assets of the subsidiary were sold to a third party. Fiscal years 2015 and 2016 have been restated for the error. In addition to the restatement for the error above, on December 15, 2017, the Company was acquired and required to report goodwill as a non-amortizable asset, whereas in prior years, goodwill was valued under the provisions of ASU 2014-02—Intangibles—Goodwill and Other (Topic 350): Accounting for Goodwill (a consensus of the Private Company Council), which allowed goodwill to be amortized over a 10 year useful life. The new method of accounting was required as the Company meets the definition of a public business entity as of December 15, 2017 and comparative financial statements of prior years have been adjusted to apply the new method retrospectively. This restatement increased previously reported income for the year ended December 25, 2016 by $4,201,355 and reduced previously reported income for the year ended December 27, 2015 by $4,105,226. The following financial statement line items for fiscal year 2016 were affected by the change in accounting principle.
| As Restated | 2016 As Previously Reported |
Effect of Change |
||||||||||
| Consolidated Statement of Operations |
||||||||||||
| Loss from Discontinued Operations |
$ | 3,235,264 | $ | 7,170,076 | $ | (3,934,812 | ) | |||||
| Operating Expenses |
41,074,901 | 41,341,444 | (266,543 | ) | ||||||||
| Consolidated Balance Sheet |
||||||||||||
| Retained Earnings |
2,687,527 | 1,621,358 | 1,066,169 | |||||||||
| Goodwill, net |
2,665,422 | 1,599,253 | 1,066,169 | |||||||||
| Consolidated Statement of Cash Flows |
||||||||||||
| Net Income (Loss) |
495,543 | (3,705,812 | ) | 4,201,355 | ||||||||
| Depreciation and Amortization |
2,479,884 | 2,746,427 | (266,543 | ) | ||||||||
| Loss on sale of AOScloud, LLC |
434,295 | 4,369,107 | (3,934,812 | ) | ||||||||
Note 3: Related Party Transactions
The Company leased office space under operating leases with Optober Investments I, LLC and Optober Investments III, LLC (“collectively, Optober”). Both entities are related parties that are 100 percent owned by a minority shareholder. For FY 2016 and Q3YTD 2016, the Company paid $845,302 and $845,302, respectively, to the related parties included in rent expense. In 2016, the operating leases with Optober were discontinued.
Note 4: Property, Equipment and Software
Property, equipment and software consist of the following at December 25, 2016 and October 1, 2017:
| As of December 25, 2016 |
As of October 1, 2017 |
|||||||
| (Unaudited) | ||||||||
| Software |
$ | 1,112,146 | $ | 1,078,985 | ||||
| Computer equipment |
2,326,856 | 2,394,193 | ||||||
| Furniture and fixtures |
1,811,766 | 1,685,246 | ||||||
| Leasehold improvements |
2,020,429 | 1,944,137 | ||||||
| Automobiles |
49,545 | 49,545 | ||||||
|
|
|
|
|
|||||
| Total cost |
7,320,742 | 7,152,106 | ||||||
| Accumulated depreciation and amortization |
(5,130,786 | ) | (5,566,171 | ) | ||||
|
|
|
|
|
|||||
| 2,189,956 | 1,585,935 | |||||||
| Less: Property, equipment and software—discontinued operations |
12,480 | 20,199 | ||||||
|
|
|
|
|
|||||
| Property, equipment and software—continuing operations |
$ | 2,177,476 | $ | 1,565,736 | ||||
|
|
|
|
|
|||||
F-110
Table of Contents
AOS, Inc. and Subsidiaries
Notes to Condensed Consolidated Financial Statements
October 1, 2017
Depreciation and amortization expense on the above property, equipment and software for FY 2016, Q3YTD 2016 and Q3YTD 2017 was $651,145, $2,141,922 and $651,143, respectively.
Note 5: Acquired Intangible Assets and Goodwill
The carrying basis and accumulated amortization of recognized intangible assets at December 25, 2016 and October 1, 2017 were:
| 2016 (Restated) |
2017 (Unaudited) |
|||||||||||||||||||||||
| Gross Carrying Amount |
Accumulated Amortization |
Accumulated Impairment Loss |
Gross Carrying Amount |
Accumulated Amortization |
Accumulated Impairment Loss |
|||||||||||||||||||
| Amortized intangible assets |
||||||||||||||||||||||||
| Customer relationships |
$ | 1,020,780 | $ | 475,080 | $ | — | $ | 1,020,780 | $ | 560,145 | $ | — | ||||||||||||
|
|
|
|
|
|
|
|
|
|
|
|
|
|||||||||||||
| Total amortized intangible assets |
1,020,780 | 475,080 | — | 1,020,780 | 560,145 | — | ||||||||||||||||||
|
|
|
|
|
|
|
|
|
|
|
|
|
|||||||||||||
| Goodwill |
2,665,422 | — | — | 2,665,422 | — | — | ||||||||||||||||||
|
|
|
|
|
|
|
|
|
|
|
|
|
|||||||||||||
| Amortized and intangible assets and goodwill—continuing operations |
$ | 3,686,202 | $ | 475,080 | $ | — | $ | 3,686,202 | $ | 560,145 | $ | — | ||||||||||||
|
|
|
|
|
|
|
|
|
|
|
|
|
|||||||||||||
Amortization expense recorded for FY 2016, Q3YTD 2016 and Q3YTD 2017 was $113,420, $85,065 and $85,065, respectively. Estimated amortization expense for each of the next five years is:
| 2017 |
$ | 28,354 | ||
| 2018 |
113,420 | |||
| 2019 |
113,420 | |||
| 2020 |
113,420 | |||
| 2021 |
92,021 |
Note 6: Operating Leases
Noncancellable operating leases for branch sales offices and certain office furniture and equipment expire in various years through 2023. These leases generally contain renewal options for various periods and require the Company to pay all executory costs (property taxes, maintenance and insurance). Lease incentives received by the Company such as free rent periods, escalating rent provisions and leasehold improvement allowances are deferred and amortized on a straight-line basis over the term of the respective lease agreements, and are recorded as a reduction of rent expense. At December 25, 2016 and October 1, 2017, the Company accrued $1,112,530 and $1,272,076, respectively, for the deferral of the benefit received for free rent periods, future escalating rent payments and leasehold improvement allowances. These amounts are included in deferred lease incentives on the accompanying condensed consolidated balance sheets.
F-111
Table of Contents
AOS, Inc. and Subsidiaries
Notes to Condensed Consolidated Financial Statements
October 1, 2017
Future minimum lease payments at October 1, 2017 were:
| 2017 |
$ | 439,464 | ||
| 2018 |
1,552,923 | |||
| 2019 |
1,470,897 | |||
| 2020 |
1,416,016 | |||
| 2021 |
1,301,739 | |||
| 2022 |
1,200,192 | |||
| Thereafter |
78,339 | |||
|
|
|
|||
| Total |
$ | 7,459,570 | ||
|
|
|
Total rent expense under operating leases for FY 2016, Q3YTD 2016 and Q3YTD 2017 were $1,255,094, $2,393,756 and $2,833,221, respectively.
Note 7: Lines of Credit
At December 25, 2016 and October 1, 2017, the Company has a $45,000,000 line of credit from Castle Pines Capital, LLC. At both December 25, 2016 and October 1, 2017, there was $0 borrowed against this line. The balance is payable on demand and has two components. The first component is a floor plan financing arrangement whereby the Company’s inventory purchases can be financed with 30, 45 or 60 day interest-free periods. The Company classifies amounts outstanding under the floor plan financing as accounts payable. The second component of the line of credit consists of an extended pay line, whereby all inventory purchases that are beyond the interest-free term roll into the interest-bearing portion of the line. Interest on this portion of the line is to be paid weekly at the prime rate, plus 1.5 percent (5.25 percent as of December 25, 2016 and 5.75 percent as of October 1, 2017). There were no outstanding balances owed on the extended pay portion of the line of credit as of December 25, 2016 and October 1, 2017. The Company also classify amounts outstanding under the extended pay line as accounts payable.
This line of credit is collateralized by the Company’s accounts receivable, all other assets and guarantees by all of its shareholders. All payments received by the Company on their accounts receivable are directly deposited into a lock-box account so that the Company can apply payment against the obligation. A power of attorney has been granted to Castle Pines Capital, LLC by the Company with respect to collections, security interests and related aspects of this agreement.
At December 25, 2016 and October 1, 2017, the credit agreement was subject to the following covenants:
The Company will at all times maintain on a consolidated basis:
| (A) | A ratio of current assets to current liability of at least 1.00. |
| (B) | Tangible net worth equal to at least $7,000,000. |
| (C) | A maximum funded debt to tangible net worth ratio of no more than 2.50 to 1.00. |
| (D) | A minimum cumulative fixed coverage charge ratio of 1.25 to 1.00. This ratio will be measured on a trailing 12 month basis at the end of each fiscal month. |
Inventory financed through the floor plan is included in operating activities in the condensed consolidated statements of cash flows.
Note 8: Profit Sharing Plan
The Company has established a defined contribution 401(k) profit sharing plan providing benefits for substantially all of their employees. The Company’s matching contributions for FY 2016, Q3YTD 2016 and Q3YTD 2017 totaled $204,328, $228,840 and $292,270, respectively.
F-112
Table of Contents
AOS, Inc. and Subsidiaries
Notes to Condensed Consolidated Financial Statements
October 1, 2017
Note 9: Significant Estimates and Concentrations
Accounting principles generally accepted in the United States of America require disclosure of certain significant estimates and current vulnerabilities due to certain concentrations. Those matters include the following:
Major Suppliers
For FY 2016, two vendors represented 71 percent of total company purchases, and for Q3YTD 2017 three vendors represented approximately 82 percent of total company purchases.
Note 10: Discontinued Operations
As of December 27, 2015, the Company elected to discontinue the operations of its Texas division, effective in January 2016, due to poor profitability. The closure of this entity resulted in the discontinuation of any marketing and sales effort in the state of Texas for all product and service offerings, which includes hardware sales and engineering services. The remaining assets were analyzed for impairment with no impairment loss assessed by management. The operations of the discontinued division have been reclassified to include all revenues and expenses of the division in discontinued operations. After the closure of the entity, the remaining assets and liabilities were transferred to Alexander Open Systems, Inc. See below for a reconciliation of the major classes of line items from the condensed consolidated statements of operations and condensed consolidated balance sheets for FY 2016 and Q3YTD 2017.
Reconciliation of the Major Classes of Line Items Constituting Loss of Discontinued
Operations that are Disclosed in the Notes to Condensed Consolidated Financial Statements to the Loss
of Discontinued Operations that are Presented
in the Condensed Consolidated Statements of Operations
| December 25, 2016 | September 25, 2016 | |||||||
| (Restated) | (Unaudited) | |||||||
| Major classes of line items constituting loss of discontinued operations |
||||||||
| Total revenues |
$ | 243,702 | $ | 243,702 | ||||
| Total cost of sales |
(152,710 | ) | (152,710 | ) | ||||
| Operating expenses |
(382,784 | ) | (382,784 | ) | ||||
| Other expense—interest expense |
(9,543 | ) | (9,543 | ) | ||||
|
|
|
|
|
|||||
| Total loss on discontinued operations that is presented in the condensed consolidated statements of operations |
$ | (301,335 | ) | $ | (301,335 | ) | ||
|
|
|
|
|
|||||
F-113
Table of Contents
AOS, Inc. and Subsidiaries
Notes to Condensed Consolidated Financial Statements
October 1, 2017
Reconciliation of the Carrying Amounts of Major Classes of Assets and Liabilities
of the Discontinued Operation that are Disclosed in the Notes to Condensed Consolidated Financial Statements
to Total Assets and Liabilities of the Disposal Group
that are Presented Separately in the Condensed Consolidated Balance Sheets
| December 25, 2016 | October 1, 2017 | |||||||
| (Restated) | ||||||||
| Carrying amounts of major classes of assets included as part of discontinued operations: |
||||||||
| Inventories |
$ | 332 | $ | — | ||||
| Property, equipment and software, net |
12,480 | 20,199 | ||||||
| Other noncurrent assets |
5,760 | — | ||||||
|
|
|
|
|
|||||
| Total major classes of assets of the discontinued operations |
$ | 18,572 | $ | 20,199 | ||||
|
|
|
|
|
|||||
| Carrying amounts of major classes of liabilities included as part of discontinued operations: |
||||||||
| Accounts payable |
$ | 9,889 | $ | — | ||||
| Accrued expenses |
671 | — | ||||||
|
|
|
|
|
|||||
| Total major classes of liabilities of the discontinued operations |
$ | 10,560 | $ | — | ||||
|
|
|
|
|
|||||
There were no significant statement of cash flows activities for the year ended December 25, 2016 nor the periods ended October 1, 2017 and September 25, 2016.
As of July 27, 2016, the Company elected to sell the AOScloud, LLC component, effective on that date, due to continuing operating losses. As part of the discontinuation, all data hosting operations and related services were eliminated. The remaining assets were analyzed for impairment and it was determined there were no material impairment losses. All existing property, equipment and software were included in the asset purchase agreement for a sale price of $2,000,000. The sales agreement also includes a contingent purchase price where the Company may earn up to $800,000 each year for two years if certain revenue targets are achieved. See below for a reconciliation of the major classes of line items from the condensed consolidated statements of operations and condensed consolidated balance sheet for the year ended December 25, 2016.
Reconciliation of the Major Classes of Line Items Constituting Loss of Discontinued
Operations that are Disclosed in the Notes to Condensed Consolidated Financial Statements to the Loss
of Discontinued Operations that are Presented
in the Condensed Consolidated Statements of Operations
| December 25, 2016 | September 25, 2016 | |||||||
| (Restated) | (Unaudited) | |||||||
| Major classes of line items constituting loss of discontinued operations |
||||||||
| Total revenues |
$ | 4,566,659 | $ | 4,566,659 | ||||
| Total cost of sales |
(3,967,845 | ) | (3,967,845 | ) | ||||
| Operating expenses |
(3,479,204 | ) | (3,479,204 | ) | ||||
| Other expense—interest expense |
(53,539 | ) | (53,539 | ) | ||||
|
|
|
|
|
|||||
| Total loss on discontinued operations that is presented in the condensed consolidated statements of operations |
$ | (2,933,929 | ) | $ | (2,933,929 | ) | ||
|
|
|
|
|
|||||
F-114
Table of Contents
AOS, Inc. and Subsidiaries
Notes to Condensed Consolidated Financial Statements
October 1, 2017
Reconciliation of the Carrying Amounts of Major Classes of Assets and Liabilities
of the Discontinued Operation that are Disclosed in the Notes to Condensed Consolidated Financial Statements
to Total Assets and Liabilities of the Disposal Group
that are Presented Separately in the Condensed Consolidated Balance Sheets
| December 25, 2016 | ||||
| (Restated) | ||||
| Carrying amounts of major classes of assets included as part of discontinued operations: |
||||
| Accounts receivable, trade, net of allowance |
$ | 135,255 | ||
|
|
|
|||
| Total major classes of assets of the discontinued operations |
$ | 135,255 | ||
|
|
|
|||
| Carrying amounts of major classes of liabilities included as part of discontinued operations: |
||||
| Accrued compensation expense |
$ | 35,704 | ||
| Accrued expenses |
43,906 | |||
|
|
|
|||
| Total major classes of liabilities of the discontinued operations |
$ | 79,610 | ||
|
|
|
|||
The impact on significant statement of cash flow activities is presented below for the year ended December 25, 2016 and the period ended September 25, 2016. There were no significant cash flow activities for the period ended October 1, 2017.
| December 25, 2016 | September 25, 2016 | |||||||
| (Restated) | (Unaudited) | |||||||
| Significant operating items not involving cash |
||||||||
| Depreciation and amortization |
$ | 241,761 | $ | 241,761 | ||||
| Loss on sale of property and equipment |
434,295 | 434,295 | ||||||
| Significant investing activities |
||||||||
| Purchase of property and equipment |
$ | 211,330 | $ | 211,330 | ||||
Note 11: Subsequent Events
Subsequent events have been evaluated through February 9, 2018, which is the date the condensed consolidated financial statements were available to be issued.
On December 15, 2017, the Company entered into a stock purchase agreement with ConvergeOne, Inc. to sell all the outstanding shares of common stock of the Company for a base purchase price of $64,500,000 subject to certain purchase price adjustments.
F-115
Table of Contents
PART II—INFORMATION NOT REQUIRED IN PROSPECTUS
| Item 13. | Other Expenses of Issuance and Distribution. |
The following table sets forth all costs and expenses, other than underwriting discounts and commissions, paid or payable by us in connection with the sale of the common stock being registered. All amounts shown are estimates except for the Securities and Exchange Commission, or SEC, registration fee and Financial Industry Regulatory Authority, or FINRA, fee.
| Amount Paid or to be Paid |
||||
| SEC registration fee |
$ | 37,464 | ||
| FINRA fee |
45,682 | |||
| Legal fees and expenses |
200,000 | |||
| Accounting fees and expenses |
50,000 | |||
| Transfer agent and registrar fees and expenses |
15,000 | |||
| Miscellaneous fees and expenses |
51,854 | |||
|
|
|
|||
| Total |
$ | 400,000 | ||
|
|
|
|||
Discounts, concessions, commissions and similar selling expenses attributable to the sale of shares of common stock covered by this prospectus will be borne by the selling stockholders. We will pay all expenses (other than discounts, concessions, commissions and similar selling expenses) relating to the registration of the shares with the Securities and Exchange Commission, as estimated in the table above.
| Item 14. | Indemnification of Directors and Officers. |
Section 145 of the Delaware General Corporation Law authorizes a court to award, or a corporation’s board of directors to grant, indemnity to directors and officers in terms sufficiently broad to permit such indemnification under certain circumstances for liabilities, including reimbursement for expenses incurred, arising under the Securities Act of 1933, as amended, or the Securities Act.
Our amended and restated certificate of incorporation provides for indemnification of our directors, officers, employees and other agents to the maximum extent permitted by the Delaware General Corporation Law, and our bylaws provide for indemnification of our directors, officers, employees and other agents to the maximum extent permitted by the Delaware General Corporation Law.
In addition, we have entered into indemnification agreements with our directors, officers, and some employees containing provisions which are in some respects broader than the specific indemnification provisions contained in the Delaware General Corporation Law. The indemnification agreements will require us, among other things, to indemnify our directors against certain liabilities that may arise by reason of their status or service as directors and to advance their expenses incurred as a result of any proceeding against them as to which they could be indemnified.
| Item 15. | Recent Sales of Unregistered Securities. |
In February 2018, we issued an aggregate of 10,459,375 shares of Class A common stock to 54 accredited investors immediately prior to the closing of the Business Combination. The sale and issuance was made in reliance on Rule 506 of Registration D under the Securities Act of 1933, as amended. We paid the placement agents an aggregate fee of $2.2 million.
II-1
Table of Contents
| Item 16. | Exhibits and Financial Statement Schedules. |
| (a) | The following exhibits are filed as part of this Registration Statement: |
II-2
Table of Contents
II-3
Table of Contents
II-4
Table of Contents
| Incorporated by Reference | ||||||||||
| Exhibit |
Description of Document |
Schedule/Form |
File Number |
Exhibit |
Filing Date | |||||
| 10.30 |
Form of Subscription Agreement | Form 8-K | 001-38053 | 10.3 | December 1, 2017 | |||||
| 10.31 |
Form of Lock-Up Agreement | Form 8-K | 001-38053 | 10.4 | December 1, 2017 | |||||
| 16.1 |
Letter re Change in Certifying Accountant |
Form 8-K | 001-38053 | 16.1 | February 26, 2018 | |||||
| 21.1 |
List of Subsidiaries | Form 8-K | 001-38053 | 21.1 | February 26, 2018 | |||||
| 23.1*** |
Consent of Cooley LLP | |||||||||
| 23.2** |
Consent of RSM US LLP, independent registered public accounting firm | |||||||||
| 23.3** |
Consent of RSM US LLP, independent auditor | |||||||||
| 23.4** |
Consent of Marcum LLP, independent registered public accounting firm | |||||||||
| 23.5** |
Consent of BKD LLP, independent auditor | |||||||||
| 101.1NS*** |
XBRL Instance Document | |||||||||
| 101.SCH*** |
XBRL Taxonomy Extension Schema Document | |||||||||
| 101.CAL*** |
XBRL Taxonomy Extension Calculation Linkbase Document | |||||||||
| 101.DEF*** |
XBRL Taxonomy Extension Definition Linkbase Document | |||||||||
| 101.LAB*** |
XBRL Taxonomy Extension Labels Linkbase Document | |||||||||
| 101.PRE*** |
XBRL Taxonomy Extension Presentation Linkbase Document | |||||||||
| * | The annexes, schedules, and certain exhibits to the Agreement and Plan of Merger have been omitted pursuant to Item 601(b)(2) of Regulation S-K. ConvergeOne hereby agrees to furnish supplementally a copy of any omitted annex, schedule or exhibit to the Commission upon request. |
| ** | Filed herewith. |
| *** | To be filed by amendment. |
| † | Indicates a management contract or compensatory plan, contract or arrangement. |
| †† | Confidential treatment has been granted for certain provisions omitted from this Exhibit pursuant to Rule 406 promulgated under the Securities Act. The omitted information has been filed separately with the Securities and Exchange Commission. |
| Item 17. | Undertakings. |
| (a) | The undersigned registrant hereby undertakes as follows: |
| (1) | To file, during any period in which offers or sales are being made, a post-effective amendment to this registration statement: |
| i. | To include any prospectus required by Section 10(a)(3) of the Securities Act of 1933; |
| ii. | To reflect in the prospectus any facts or events arising after the effective date of the registration statement (or the most recent post-effective amendment thereof) which, individually or in the aggregate, represent a fundamental change in the information set forth in the registration statement. Notwithstanding the foregoing, any increase or decrease in volume of securities offered (if the total dollar value of securities offered would not exceed that which was registered) and any |
II-5
Table of Contents
| deviation from the low or high end of the estimated maximum offering range may be reflected in the form of prospectus filed with the Commission pursuant to Rule 424(b) if, in the aggregate, the changes in volume and price represent no more than 20 percent change in the maximum aggregate offering price set forth in the “Calculation of Registration Fee” table in the effective registration statement; |
| iii. | To include any material information with respect to the plan of distribution not previously disclosed in the registration statement or any material change to such information in the registration statement. |
| (2) | That, for the purpose of determining any liability under the Securities Act of 1933, each such post-effective amendment shall be deemed to be a new registration statement relating to the securities offered therein, and the offering of such securities at that time shall be deemed to be the initial bona fide offering thereof. |
| (3) | To remove from registration by means of a post-effective amendment any of the securities being registered which remain unsold at the termination of the offering. |
| (4) | That, for the purpose of determining liability under the Securities Act of 1933 to any purchaser, each prospectus filed pursuant to Rule 424(b) as part of a registration statement relating to an offering, other than registration statements relying on Rule 430B or other than prospectuses filed in reliance on Rule 430A, shall be deemed to be part of and included in the registration statement as of the date it is first used after effectiveness. Provided, however, that no statement made in a registration statement or prospectus that is part of the registration statement or made in a document incorporated or deemed incorporated by reference into the registration statement or prospectus that is part of the registration statement will, as to a purchaser with a time of contract of sale prior to such first use, supersede or modify any statement that was made in the registration statement or prospectus that was part of the registration statement or made in any such document immediately prior to such date of first use. |
| (5) | That, for the purpose of determining any liability under the Securities Act of 1933 to any purchaser in the initial distribution of the securities, the undersigned registrant undertakes that in a primary offering of securities of the undersigned registrant pursuant to this registration statement, regardless of the underwriting method used to sell the securities to the purchaser, if the securities are offered or sold to such purchaser by means of any of the following communications, the undersigned registrant will be a seller to the purchaser and will be considered to offer or sell such securities to such purchaser: |
| i. | Any preliminary prospectus or prospectus of the undersigned registrant relating to the offering required to be filed pursuant to Rule 424; |
| ii. | Any free writing prospectus relating to the offering prepared by or on behalf of the undersigned registrant or used or referred to by the undersigned registrant; |
| iii. | The portion of any other free writing prospectus relating to the offering containing material information about the undersigned registrant or our securities provided by or on behalf of the undersigned registrant; and |
| iv. | Any other communication that is an offer in the offering made by the undersigned registrant to the purchaser. |
| (6) | That prior to any public reoffering of the securities registered hereunder through use of a prospectus which is a part of this registration statement, by any person or party who is deemed to be an underwriter within the meaning of Rule 145(c), the issuer undertakes that such reoffering prospectus will contain the information called for by the applicable registration form with respect to reofferings by persons who may be deemed underwriters, in addition to the information called for by the other items of the applicable form. |
II-6
Table of Contents
| (7) | That every prospectus: (i) that is filed pursuant to the immediately preceding paragraph, or (ii) that purports to meet the requirements of Section 10(a)(3) of the Act and is used in connection with an offering of securities subject to Rule 415, will be filed as a part of an amendment to the registration statement and will not be used until such amendment is effective, and that, for purposes of determining any liability under the Securities Act of 1933, each such post-effective amendment shall be deemed to be a new registration statement relating to the securities offered therein, and the offering of such securities at that time shall be deemed to be the initial bona fide offering thereof. |
| (8) | Insofar as indemnification for liabilities arising under the Securities Act of 1933 may be permitted to directors, officers and controlling persons of the undersigned pursuant to the foregoing provisions, or otherwise, the undersigned has been advised that in the opinion of the SEC such indemnification is against public policy as expressed in the Securities Act and is, therefore, unenforceable. In the event that a claim for indemnification against such liabilities (other than the payment by the undersigned of expenses incurred or paid by a director, officer or controlling person of the undersigned in the successful defense of any action, suit or proceeding) is asserted by such director, officer or controlling person in connection with the securities being registered, the undersigned will, unless in the opinion of our counsel the matter has been settled by controlling precedent, submit to a court of appropriate jurisdiction the question whether such indemnification by it is against public policy as expressed in the Act and will be governed by the final adjudication of such issue. |
| (b) | The undersigned registrant hereby undertakes to respond to requests for information that is incorporated by reference into the prospectus pursuant to Item 4, 10(b), 11, or 13 of this form, within one business day of receipt of such request, and to send the incorporated documents by first class mail or other equally prompt means. This includes information contained in documents filed subsequent to the effective date of the registration statement through the date of responding to the request. |
| (c) | The undersigned registrant hereby undertakes to supply by means of a post-effective amendment all information concerning a transaction, and the company being acquired involved therein, that was not the subject of and included in the registration statement when it became effective. |
II-7
Table of Contents
SIGNATURES
Pursuant to the requirements of the Securities Act of 1933, as amended, the Registrant certifies that it has reasonable grounds to believe that it meets all of the requirements for filing on Form S-1 and has duly caused this Registration Statement to be signed on its behalf by the undersigned, thereunto duly authorized, in the City of Eagan, State of Minnesota, on this 21st day of March, 2018.
| CONVERGEONE HOLDINGS, INC. | ||
| By: | /S/ JOHN A. MCKENNA, JR. | |
| John A. McKenna, Jr. President, Chief Executive Officer and Chairman of the Board | ||
POWER OF ATTORNEY
KNOW ALL PERSONS BY THESE PRESENTS, that each person whose signature appears below constitutes and appoints John A. McKenna, Jr. and Jeffrey Nachbor, and each of them, as his or her true and lawful attorneys-in-fact and agents, each with the full power of substitution, for him or her and in their name, place or stead, in any and all capacities, to sign any and all amendments to this Registration Statement (including post-effective amendments), and to sign any registration statement for the same offering covered by this Registration Statement that is to be effective upon filing pursuant to Rule 462(b) promulgated under the Securities Act, and all post-effective amendments thereto, and to file the same, with all exhibits thereto and other documents in connection therewith, with the Securities and Exchange Commission, granting unto said attorneys-in-fact and agents, and each of them, full power and authority to do and perform each and every act and thing requisite and necessary to be done in connection therewith, as fully to all intents and purposes as he or she might or could do in person, hereby ratifying and confirming all that said attorneys-in-fact and agents or any of them, or his, her or their substitute or substitutes, may lawfully do or cause to be done by virtue hereof.
Pursuant to the requirements of the Securities Act of 1933, this registration statement has been signed by the following persons in the capacities and on the dates indicated.
| Signature |
Title |
Date | ||
| /S/ JOHN A. MCKENNA, JR. John A. McKenna, Jr. |
President and Chief Executive Officer and Chairman of the Board (Principal Executive Officer) |
March 21, 2018 | ||
| /S/ JEFFREY NACHBOR Jeffrey Nachbor |
Chief Financial Officer (Principal Financial and Accounting Officer) |
March 21, 2018 | ||
| /S/ DAVID BORIS David Boris |
Director | March 21, 2018 | ||
| /S/ KEITH W.F. BRADLEY Keith W.F. Bradley |
Director | March 21, 2018 | ||
| /S/ BEHDAD EGHBALI Behdad Eghbali |
Director | March 21, 2018 | ||
| /S/ JOSÉ E. FELICIANO José E. Feliciano |
Director | March 21, 2018 | ||
Table of Contents
| Signature |
Title |
Date | ||
| /S/ CHRISTOPHER JURASEK Christopher Jurasek |
Director | March 21, 2018 | ||
| /S/ RICHARD KATZMAN Richard Katzman |
Director | March 21, 2018 | ||
| /S/ PRASHANT MEHROTRA Prashant Mehrotra |
Director | March 21, 2018 | ||
| /S/ JAMES PADE James Pade |
Director | March 21, 2018 | ||
| /S/ TIMOTHY J. PAWLENTY Timothy J. Pawlenty |
Director | March 21, 2018 | ||