Attached files
| file | filename |
|---|---|
| EX-99.1 - EX-99.1 - ASV HOLDINGS, INC. | asv-ex991_8.htm |
| 8-K - 8-K - ASV HOLDINGS, INC. | asv-8k_20180322.htm |

ASV Holdings, Inc. Q4 and Full Year 2017 Earnings Conference Call March 22, 2018 EXHIBIT 99.2
This presentation contains forward-looking statements. In some cases, you can identify forward-looking statements by terminology such as “may,” “should,” “expects,” “plans,” “anticipates,” “believes,” “estimates,” “predicts,” “potential,” “intends” or “continue,” and other similar expressions that are predictions of or indicate future events and future trends, or the negative of these terms or other comparable terminology. Forward-looking statements in this presentation include, without limitation: (1) projections of revenue, earnings, capital structure and other financial items, (2) statements of our plans and objectives, (3) statements regarding the capabilities and capacities of our business operations, (4) statements of expected future economic conditions and the effect on us and on dealers or OEM customers, (5) expected benefits of our cost reduction measures, and (6) assumptions underlying statements regarding us or our business. Our actual results may differ from information contained in these forward looking-statements for many reasons, including those described in the section entitled “Risk Factors” in our Registration Statement on Form S-1 (SEC File No. 333-216912), which was filed in connection with our initial public offering and our Form 10-K and are available on our EDGAR page at www.sec.gov. These statements are only current predictions and are subject to known and unknown risks, uncertainties and other factors that may cause our or our industry’s actual results, levels of activity, performance or achievements to be materially different from those anticipated by the forward-looking statements. We discuss many of these risks in greater detail under the heading “Risk Factors” and elsewhere in the Registration Statement on Form S-1. You should not rely upon forward-looking statements as predictions of future events. Although we believe that the expectations reflected in the forward-looking statements are reasonable, we cannot guarantee future results, levels of activity, performance or achievements. Except as required by law, after the date of this presentation, we are under no duty to update or revise any of the forward-looking statements, whether as a result of new information, future events or otherwise. We obtained the industry, market and competitive position data in this presentation from our own internal estimates and research as well as from industry and general publications and research surveys and studies conducted by third parties. While we believe that each of these studies and publications is reliable, we have not independently verified market and industry data from third-party sources. While we believe our internal company research is reliable and the market definitions we use are appropriate, neither such research nor these definitions have been verified by any independent source. We from time to time refer to various non-GAAP financial measures in this presentation. We believe that this information is useful to understanding our operating results by excluding certain items that may not be indicative of our core operating results and business outlook. Reference to these non-GAAP financial measures should not be considered as a substitute for, or superior to, results that are presented in a manner consistent with GAAP. Rather, the non-GAAP financial information should be considered in addition to results that are presented in a manner consistent with GAAP. A reconciliation of non-GAAP financial measures referred to in this presentation is provided in the tables at the conclusion of this presentation. Forward-Looking Statements & Non – GAAP Financial Measures
2017 was a year of significant change and strategic development designed to achieve more efficient “independent status”. Growth in Fourth quarter and full year in distribution and machine sales Fourth quarter sales + 21.5%, Year over year revenue growth of 18.8% Machine sales revenue growth: Q4+39%, full year +32% Dealer / rental locations at 222 at December 31 2017, compared to 133 a year ago Adjusted EBITDA margin on incremental sales of 23% in Q4 and 15% in the year, and cash flow generation of $7.5 million in 2017. Balance sheet improvement - 2017 net debt reduction of $16.5 million, including $10.4 million net IPO proceeds. December 2017 refinancing lowers average cost of debt to 5.3%. Our key markets in North America and Australia remain strong with ASV sales performance outpacing general market growth. Summary
North America Market Factors Housing Market*: Privately-owned housing starts in January 2018 were at a seasonally adjusted annual rate of 1,326,000. This is 9.7 percent above the revised December 2017 estimate of 1,209,000, and is 7.3 percent above the January 2017 rate of 1,236,000. U.S. Construction Spending*:Total Construction spending during January 2018 was estimated at a seasonally adjusted annual rate of $1,262.8 billion flat with the revised December 2017 estimate of $1,262.7 billion. The January figure is 3.2 percent above the January 2017 estimate of $1,223.5 billion. Rental Market**: 2017 rental penetration index at 53.0%, flat with 2016. Forecastfrom ARA Rental Market Monitor™ five-year forecast updated in February, total rental revenue in the U.S. is expected to grow by 4.5 percent in 2018 to reach $51.5 billion, 5.6 percent in 2019, 5 percent in 2020 and 4.4 percent in 2021. CAGR of 4.3% to 2020. Australia: *** 2018 GDP growth 0f 2.8% in 2018. The economy will continue growing at a robust pace. Business investment outside the housing and mining sectors will pick up. The strengthening labor market and household incomes will sustain private consumption, and inflation and wages will pick up gradually. Industry & Market Overview Source: *US Census Bureau: ** American Rental Association (ARA) ***OECD Economic Forecast Summary November 2017 SAAR: “Seasonally adjusted annual rate”
Adding distribution and penetrating rental – foundation for growth 222 dealer and rental account locations 12/31/17 (133 @ 12/31/16) Added 6 new Australian locations in 2017 Machine sales to rental only locations increased 43% in 2017 Good pipeline of prospects to continue expansion New machine sales Machine revenues increase 39% in Q4-17 compared to Q4-16, and 32% year over year ASV branded machine sales at 97% of machine sales in 2017 – we have now replaced the previous distribution network Other Dealer systems converted to ASV – control the brand Relocation of aftermarket parts distribution to focus on improving customer service and lowering operating costs Refinanced credit facility in December 2017 – lowers interest cost ASV Strategic Growth Drivers
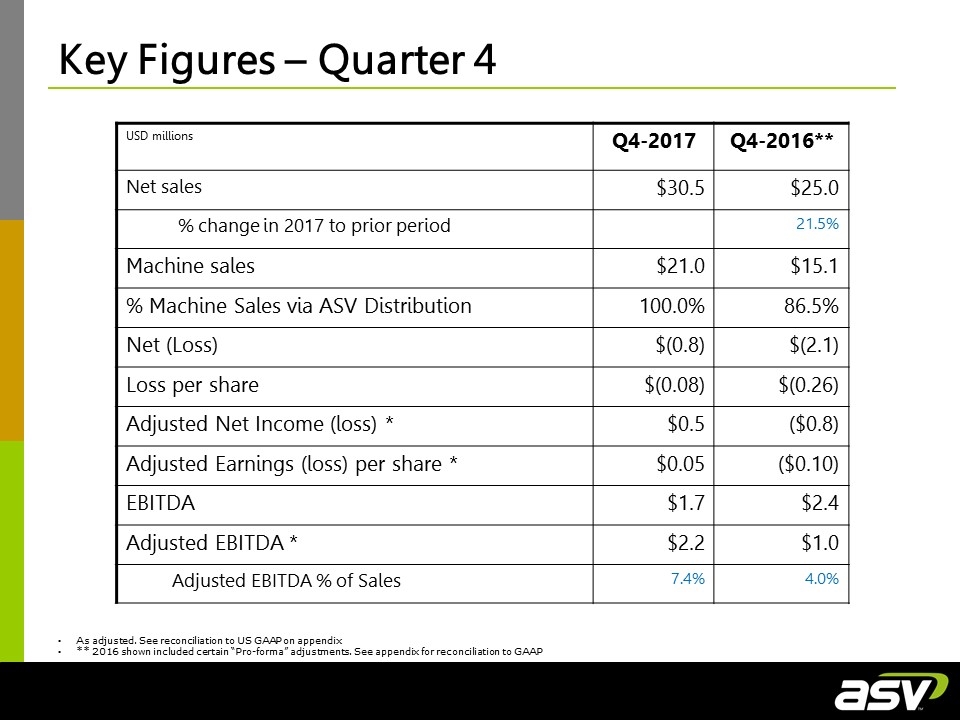
USD millions Q4-2017 Q4-2016** Net sales $30.5 $25.0 % change in 2017 to prior period 21.5% Machine sales $21.0 $15.1 % Machine Sales via ASV Distribution 100.0% 86.5% Net (Loss) $(0.8) $(2.1) Loss per share $(0.08) $(0.26) Adjusted Net Income (loss) * $0.5 ($0.8) Adjusted Earnings (loss) per share * $0.05 ($0.10) EBITDA $1.7 $2.4 Adjusted EBITDA * $2.2 $1.0 Adjusted EBITDA % of Sales 7.4% 4.0% As adjusted. See reconciliation to US GAAP on appendix ** 2016 shown included certain “Pro-forma” adjustments. See appendix for reconciliation to GAAP Key Figures – Quarter 4
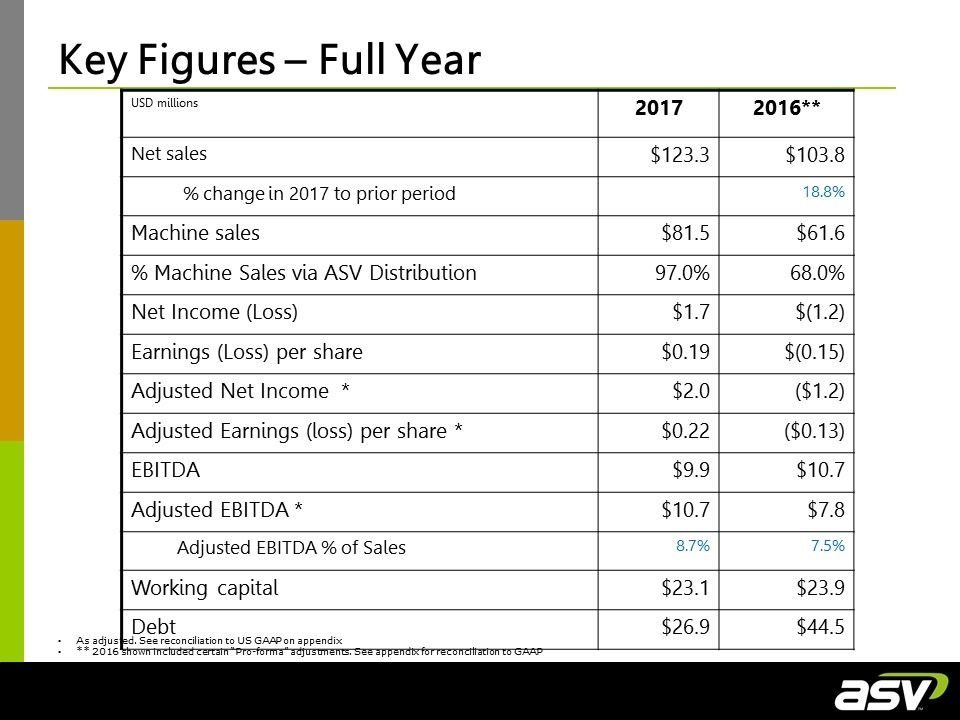
USD millions 2017 2016** Net sales $123.3 $103.8 % change in 2017 to prior period 18.8% Machine sales $81.5 $61.6 % Machine Sales via ASV Distribution 97.0% 68.0% Net Income (Loss) $1.7 $(1.2) Earnings (Loss) per share $0.19 $(0.15) Adjusted Net Income * $2.0 ($1.2) Adjusted Earnings (loss) per share * $0.22 ($0.13) EBITDA $9.9 $10.7 Adjusted EBITDA * $10.7 $7.8 Adjusted EBITDA % of Sales 8.7% 7.5% Working capital $23.1 $23.9 Debt $26.9 $44.5 As adjusted. See reconciliation to US GAAP on appendix ** 2016 shown included certain “Pro-forma” adjustments. See appendix for reconciliation to GAAP Key Figures – Full Year
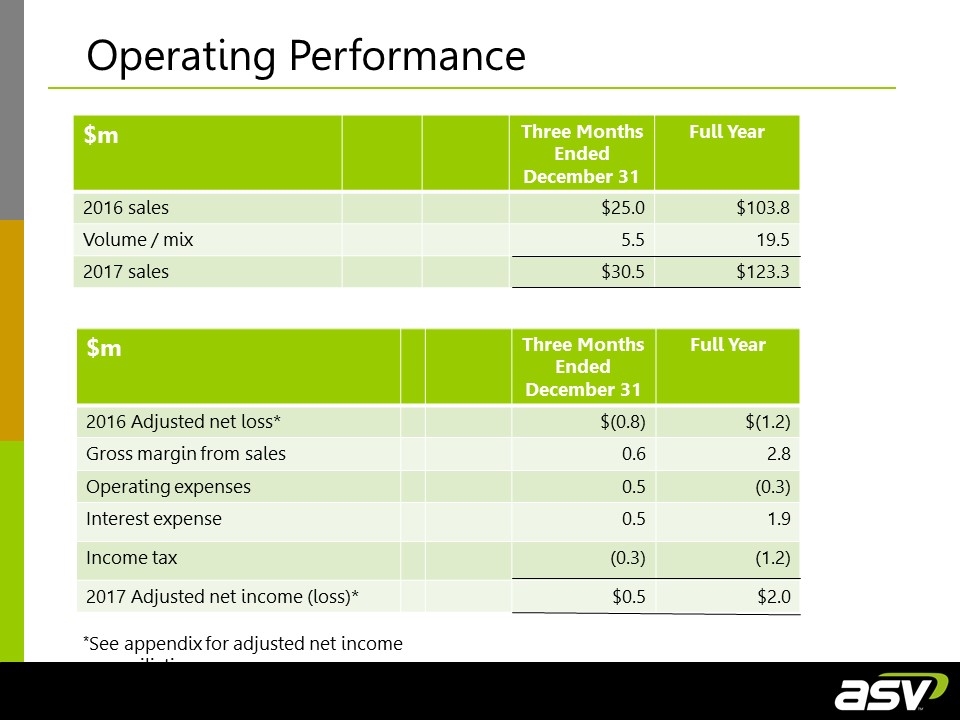
“Focused manufacturer of engineered lifting equipment” $m Three Months Ended December 31 Full Year 2016 sales $25.0 $103.8 Volume / mix 5.5 19.5 2017 sales $30.5 $123.3 $m Three Months Ended December 31 Full Year 2016 Adjusted net loss* $(0.8) $(1.2) Gross margin from sales 0.6 2.8 Operating expenses 0.5 (0.3) Interest expense 0.5 1.9 Income tax (0.3) (1.2) 2017 Adjusted net income (loss)* $0.5 $2.0 Operating Performance *See appendix for adjusted net income reconciliation
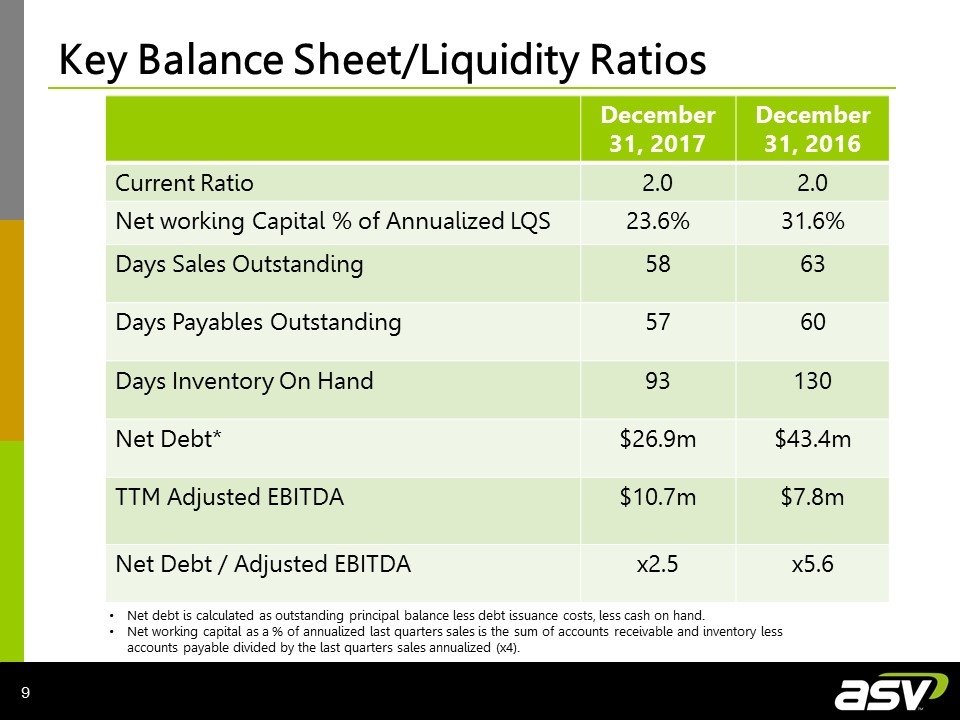
Key Balance Sheet/Liquidity Ratios December 31, 2017 December 31, 2016 Current Ratio 2.0 2.0 Net working Capital % of Annualized LQS 23.6% 31.6% Days Sales Outstanding 58 63 Days Payables Outstanding 57 60 Days Inventory On Hand 93 130 Net Debt* $26.9m $43.4m TTM Adjusted EBITDA $10.7m $7.8m Net Debt / Adjusted EBITDA x2.5 x5.6 Net debt is calculated as outstanding principal balance less debt issuance costs, less cash on hand. Net working capital as a % of annualized last quarters sales is the sum of accounts receivable and inventory less accounts payable divided by the last quarters sales annualized (x4).
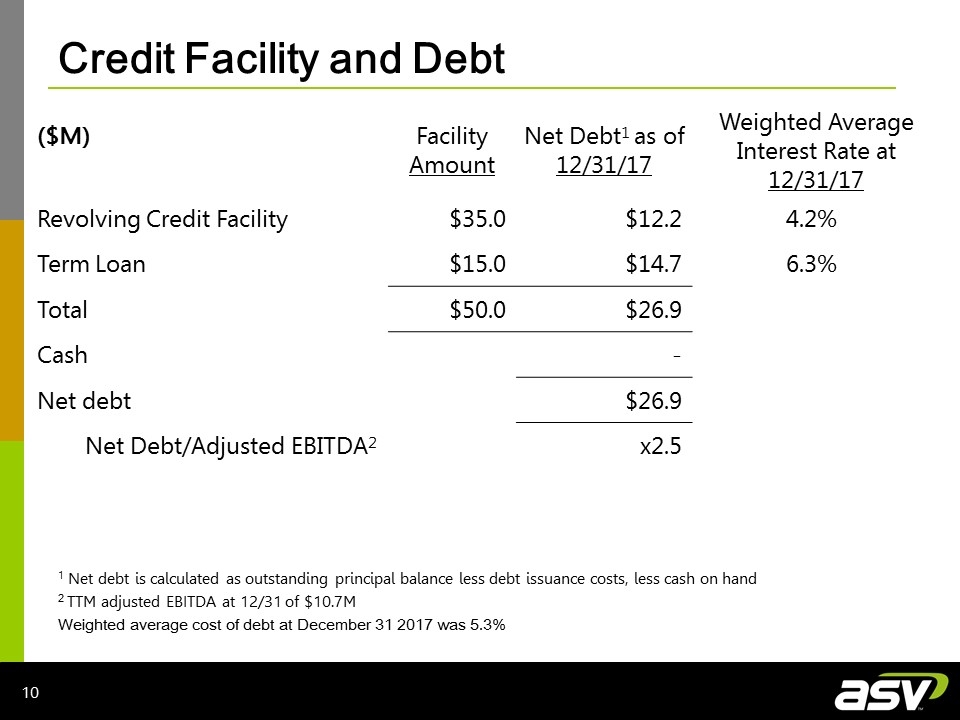
Credit Facility and Debt 1 Net debt is calculated as outstanding principal balance less debt issuance costs, less cash on hand 2 TTM adjusted EBITDA at 12/31 of $10.7M Weighted average cost of debt at December 31 2017 was 5.3% ($M) Facility Amount Net Debt1 as of 12/31/17 Weighted Average Interest Rate at 12/31/17 Revolving Credit Facility $35.0 $12.2 4.2% Term Loan $15.0 $14.7 6.3% Total $50.0 $26.9 Cash - Net debt $26.9 Net Debt/Adjusted EBITDA2 x2.5

Appendix
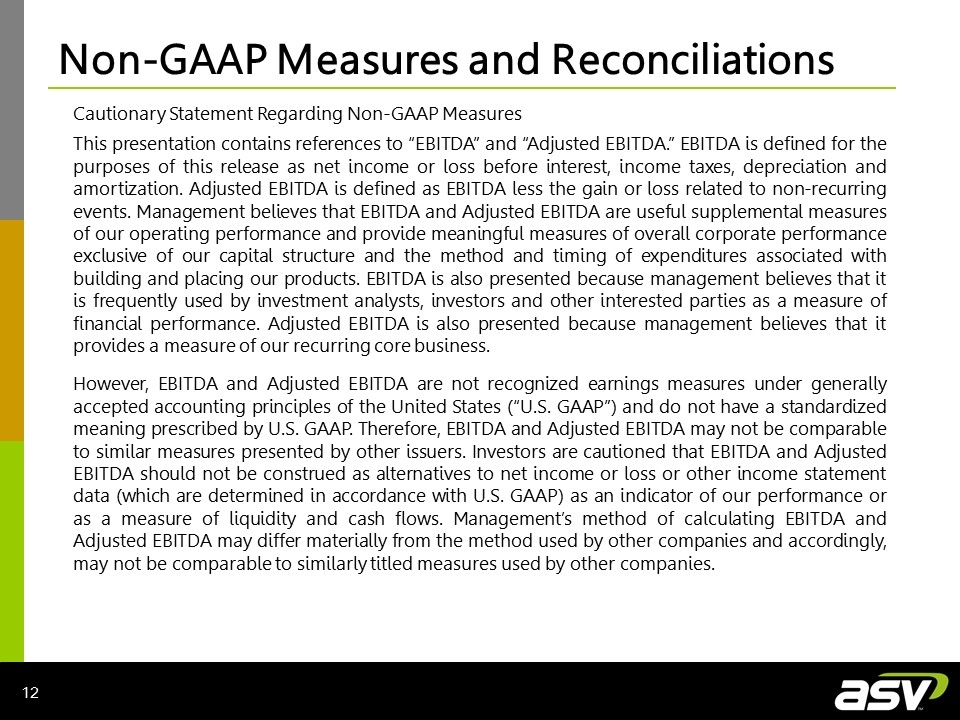
Non-GAAP Measures and Reconciliations Cautionary Statement Regarding Non-GAAP Measures This presentation contains references to “EBITDA” and “Adjusted EBITDA.” EBITDA is defined for the purposes of this release as net income or loss before interest, income taxes, depreciation and amortization. Adjusted EBITDA is defined as EBITDA less the gain or loss related to non-recurring events. Management believes that EBITDA and Adjusted EBITDA are useful supplemental measures of our operating performance and provide meaningful measures of overall corporate performance exclusive of our capital structure and the method and timing of expenditures associated with building and placing our products. EBITDA is also presented because management believes that it is frequently used by investment analysts, investors and other interested parties as a measure of financial performance. Adjusted EBITDA is also presented because management believes that it provides a measure of our recurring core business. However, EBITDA and Adjusted EBITDA are not recognized earnings measures under generally accepted accounting principles of the United States (“U.S. GAAP”) and do not have a standardized meaning prescribed by U.S. GAAP. Therefore, EBITDA and Adjusted EBITDA may not be comparable to similar measures presented by other issuers. Investors are cautioned that EBITDA and Adjusted EBITDA should not be construed as alternatives to net income or loss or other income statement data (which are determined in accordance with U.S. GAAP) as an indicator of our performance or as a measure of liquidity and cash flows. Management’s method of calculating EBITDA and Adjusted EBITDA may differ materially from the method used by other companies and accordingly, may not be comparable to similarly titled measures used by other companies.
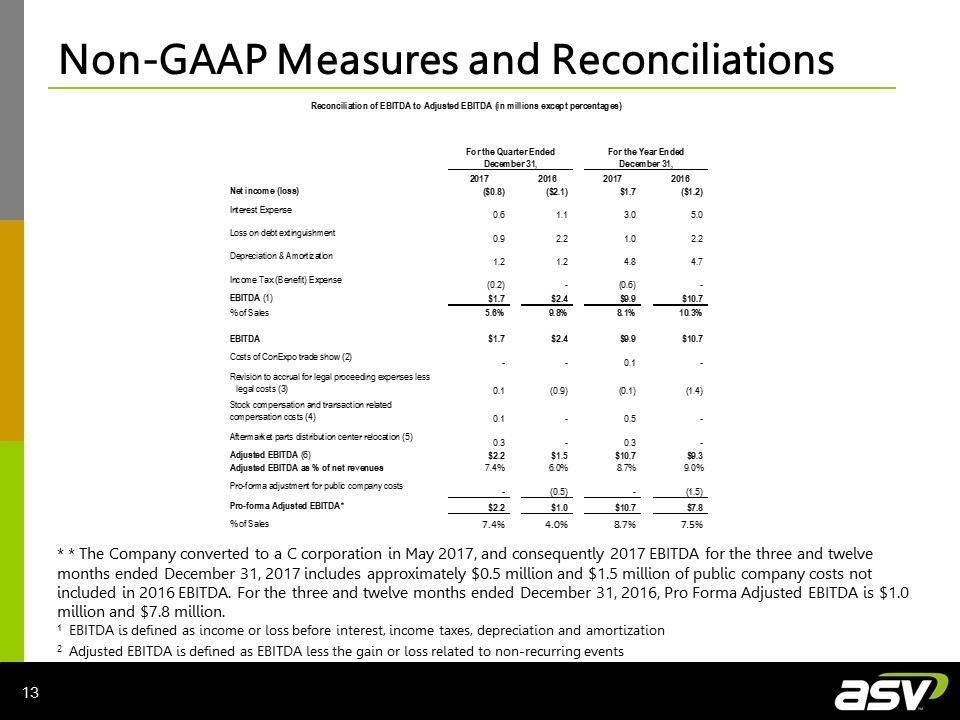
Non-GAAP Measures and Reconciliations 1 EBITDA is defined as income or loss before interest, income taxes, depreciation and amortization 2 Adjusted EBITDA is defined as EBITDA less the gain or loss related to non-recurring events * * The Company converted to a C corporation in May 2017, and consequently 2017 EBITDA for the three and twelve months ended December 31, 2017 includes approximately $0.5 million and $1.5 million of public company costs not included in 2016 EBITDA. For the three and twelve months ended December 31, 2016, Pro Forma Adjusted EBITDA is $1.0 million and $7.8 million.
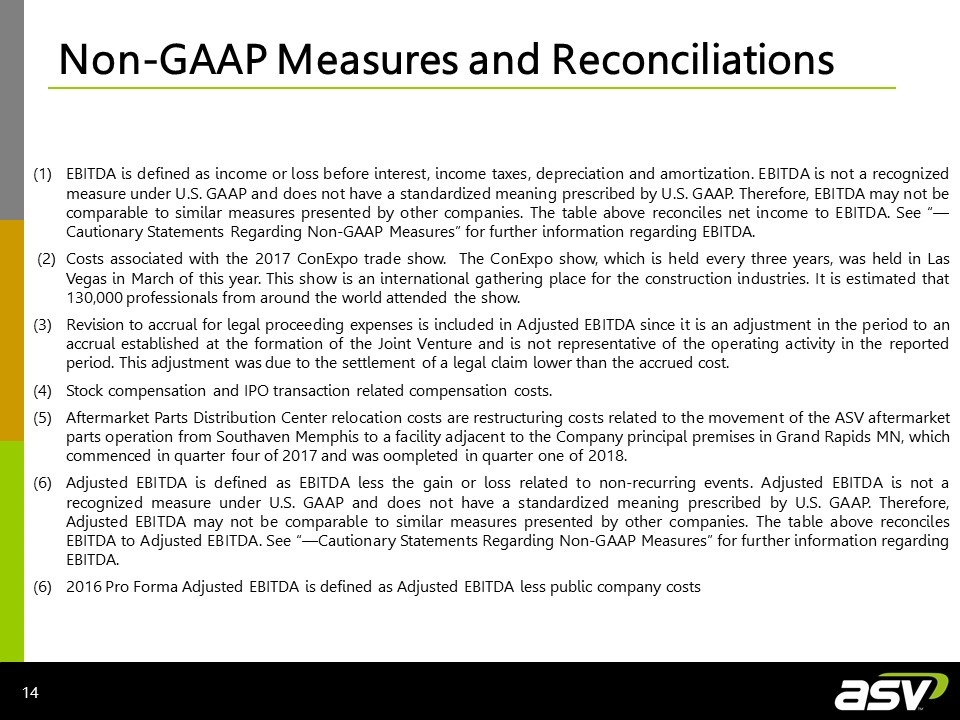
Non-GAAP Measures and Reconciliations (1)EBITDA is defined as income or loss before interest, income taxes, depreciation and amortization. EBITDA is not a recognized measure under U.S. GAAP and does not have a standardized meaning prescribed by U.S. GAAP. Therefore, EBITDA may not be comparable to similar measures presented by other companies. The table above reconciles net income to EBITDA. See “—Cautionary Statements Regarding Non-GAAP Measures” for further information regarding EBITDA. (2)Costs associated with the 2017 ConExpo trade show. The ConExpo show, which is held every three years, was held in Las Vegas in March of this year. This show is an international gathering place for the construction industries. It is estimated that 130,000 professionals from around the world attended the show. (3)Revision to accrual for legal proceeding expenses is included in Adjusted EBITDA since it is an adjustment in the period to an accrual established at the formation of the Joint Venture and is not representative of the operating activity in the reported period. This adjustment was due to the settlement of a legal claim lower than the accrued cost. (4)Stock compensation and IPO transaction related compensation costs. (5)Aftermarket Parts Distribution Center relocation costs are restructuring costs related to the movement of the ASV aftermarket parts operation from Southaven Memphis to a facility adjacent to the Company principal premises in Grand Rapids MN, which commenced in quarter four of 2017 and was oompleted in quarter one of 2018. (6)Adjusted EBITDA is defined as EBITDA less the gain or loss related to non-recurring events. Adjusted EBITDA is not a recognized measure under U.S. GAAP and does not have a standardized meaning prescribed by U.S. GAAP. Therefore, Adjusted EBITDA may not be comparable to similar measures presented by other companies. The table above reconciles EBITDA to Adjusted EBITDA. See “—Cautionary Statements Regarding Non-GAAP Measures” for further information regarding EBITDA. (6)2016 Pro Forma Adjusted EBITDA is defined as Adjusted EBITDA less public company costs
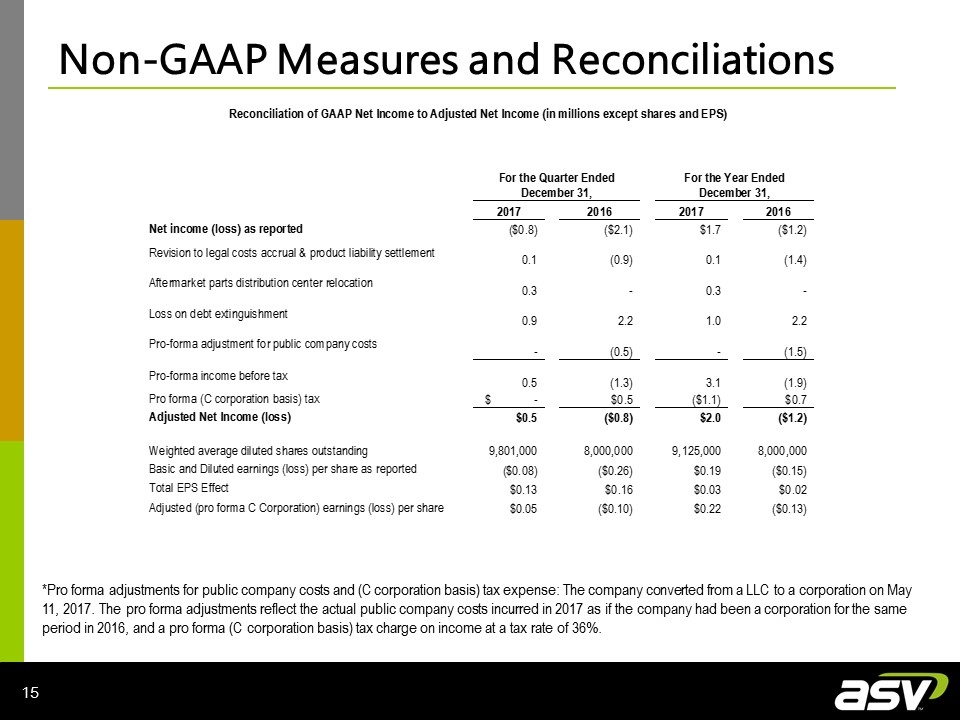
Non-GAAP Measures and Reconciliations *Pro forma adjustments for public company costs and (C corporation basis) tax expense: The company converted from a LLC to a corporation on May 11, 2017. The pro forma adjustments reflect the actual public company costs incurred in 2017 as if the company had been a corporation for the same period in 2016, and a pro forma (C corporation basis) tax charge on income at a tax rate of 36%.

ASV Holdings, Inc. Q4-2017 Earnings Conference Call March 22, 2018 At ASV Holdings, Inc. Andrew Rooke, Chairman & C.E.O. 1-218-327-5389 Contact: At Darrow Associates, Inc. Peter Seltzberg, IR for ASV 1-516-419-9915
