Attached files
| file | filename |
|---|---|
| EX-31.2 - EX-31.2 - Keurig Dr Pepper Inc. | a2234917zex-31_2.htm |
| EX-31.1 - EX-31.1 - Keurig Dr Pepper Inc. | a2234917zex-31_1.htm |
UNITED STATES
SECURITIES AND EXCHANGE COMMISSION
Washington, D.C. 20549
FORM 10-K/A
ý |
ANNUAL REPORT PURSUANT TO SECTION 13 or 15 (d) OF THE SECURITIES EXCHANGE ACT OF 1934 |
|
For the fiscal year ended: December 31, 2017 |
||
or |
||
o |
TRANSITION REPORT PURSUANT TO SECTION 13 or 15 (d) OF THE SECURITIES EXCHANGE ACT OF 1934 |
|
For the transition period from to |
||
Commission file number: 001-33829

(Exact name of registrant as specified in its charter)
| Delaware (State or other jurisdiction of incorporation or organization) |
98-0517725 (I.R.S. employer identification number) |
5301 Legacy Drive, Plano, Texas (Address of principal executive offices) |
75024 (Zip Code) |
Registrant's telephone number, including area code:
(972) 673-7000
Securities registered pursuant to Section 12(b) of the Act:
| Title of Each Class |
Name of Each Exchange on Which Registered |
|
|---|---|---|
COMMON STOCK, $.01 par value |
NEW YORK STOCK EXCHANGE |
Securities registered pursuant to Section 12(g) of the Act: None
Indicate by check mark if the registrant is a well-known seasoned issuer, as defined in Rule 405 of the Securities Act.
Yes þ No o
Indicate by check mark if the registrant is not required to file reports pursuant to Section 13 or Section 15(d) of the Act.
Yes o No þ
Indicate by check mark whether the registrant (1) has filed all reports required to be filed by Section 13 or 15(d) of the Securities Exchange Act of 1934 during the preceding 12 months (or for such shorter period that the registrant was required to file such reports), and (2) has been subject to such filing requirements for the past 90 days.
Yes þ No o
Indicate by check mark whether the registrant has submitted electronically and posted on its corporate Web site, if any, every Interactive Data File required to be submitted and posted pursuant to Rule 405 of Regulation S-T (§ 232.405 of this chapter) during the preceding 12 months (or for such shorter period that the registrant was required to submit and post such files).
Yes þ No o
Indicate by check mark if disclosure of delinquent filers pursuant to Item 405 of Regulation S-K (§ 229.405 of this chapter) is not contained herein, and will not be contained, to the best of registrant's knowledge, in definitive proxy or information statements incorporated by reference in Part III of this Form 10-K or any amendment to this Form 10-K.
þ
Indicate by check mark whether the registrant is a large accelerated filer, an accelerated filer, a non-accelerated filer, smaller reporting company or emerging growth company. See the definitions of "large accelerated filer", "accelerated filer", "smaller reporting company" and "emerging growth company" in Rule 12b-2 of the Exchange Act:
| Large accelerated filer þ | Accelerated filer o | |
| Non-accelerated filer (do not check if a smaller reporting company) o | Smaller reporting company o | |
| Emerging reporting company o |
If an emerging growth company, indicate by checkmark if the registrant has elected not to use the extended transition period for complying with any new or revised financial accounting standards provided pursuant to Section 13(a) of the Exchange Act.
o
Indicate by check mark whether the registrant is a shell company (as defined in Rule 12b-2 of the Act).
Yes o No þ
The aggregate market value of the common equity held by non-affiliates of the registrant (assuming for these purposes, but without conceding, that all executive officers and directors are "affiliates" of the registrant) as of June 30, 2017, the last business day of the registrant's most recently completed second fiscal quarter, was $16,544,425,098 (based onthe closing sales price of the registrant's common stock on that date as reported on the New York Stock Exchange). As of February 8, 2018, there were 179,744,078 shares of the registrant's common stock, par value $0.01 per share, outstanding.
DOCUMENTS INCORPORATED BY REFERENCE
None.
DR PEPPER SNAPPLE GROUP, INC.
FORM 10-K/A
For the Year Ended December 31, 2017
TABLE OF CONTENTS
2
This Amendment No. 1 on Form 10-K/A (the "Amendment") amends the Annual Report on Form 10-K of Dr Pepper Snapple Group, Inc., a Delaware corporation ("DPSG," the "Company" or "we"), for the fiscal year ended December 31, 2017, originally filed with the Securities and Exchange Commission (the "SEC") on February 14, 2018 (the "Original Filing"). This Amendment is being filed to amend (i) Part III of the Original Filing to include the information required by and not included in Part III of the Original Filing (which was previously omitted from the Original Filing in reliance on General Instruction G(3) to Form 10-K, which permits the information required by Part III of Form 10-K to be incorporated by reference in the Form 10-K from the Company's definitive proxy statement if such proxy statement is filed no later than 120 days after the end of the Company's fiscal year) and (ii) Part IV of the Original Filing to add certain new certifications, as required by Rule 12b-15 under the Securities Exchange Act of 1934, as amended (the "Exchange Act"), and in accordance with Rule 13a-14(a) under the Exchange Act. Because no financial statements have been included in this Amendment and this Amendment does not contain or amend any disclosure with respect to Items 307 and 308 of Regulation S-K, paragraphs 3, 4 and 5 of the certifications have been omitted.
On January 29, 2018, DPSG entered into an Agreement and Plan of Merger (the "Merger Agreement") by and among DPSG, Maple Parent Holdings Corp. ("Maple Parent") and Salt Merger Sub, Inc. ("Merger Sub"), whereby Merger Sub will be merged with and into Maple Parent, the indirect owner of Keurig Green Mountain, Inc. ("Keurig"), a leading producer of specialty coffee and innovative single serve brewing systems, with Maple Parent surviving the merger as a wholly-owned subsidiary of DPSG and the holders of the common stock of Maple Parent immediately prior to the effective time of the merger will receive newly-issued shares of DPSG common stock (the "Acquisition Shares") constituting approximately 87% of our outstanding common stock, on a fully diluted basis following the closing of the merger (the "Merger"). In addition, we will declare a special cash dividend equal to $103.75 per share of DPSG common stock (subject to any withholding of taxes required by law), payable to our stockholders as of the close of business on the business day immediately preceding the closing date of the Merger (such special cash dividend, together with the Merger, the "Transactions"). The completion of the Transactions requires the approval by the holders of DPSG's common stock of (i) an amendment to the DPSG certificate of incorporation to increase the number of authorized shares of common stock and to change DPSG's name to "Keurig Dr Pepper Inc." and (ii) the issuance of the Acquisition Shares pursuant to the Merger Agreement (collectively, the "Stockholder Approvals"). DPSG expects to seek the Stockholder Approvals at its annual meeting of stockholders to be scheduled. On March 8, 2018, DPSG filed a preliminary proxy statement with the Securities and Exchange Commission (the "SEC"), which contains a more detailed description of the Merger Agreement and the Transactions.
3
Except as described above, no other changes have been made to the Original Filing. The Original Filing continues to speak as of the date of the Original Filing, and we have not updated the disclosures contained therein to reflect any events that occurred at a date subsequent to the filing of the Original Filing other than as expressly indicated in this Amendment. Accordingly, this Amendment should be read in conjunction with the Original Filing and our other filings made with the SEC on or subsequent to February 14, 2018.
4
Item 10. Directors, Executive Officers and Corporate Governance.
Directors
Set forth below is detailed biographical information for each of our directors and a summary of the qualifications and skills demonstrated by each director's experience (ages are as of March 19, 2018).
David E. Alexander
Mr. Alexander, age 64, has served as one of our directors since November 2011. Mr. Alexander has served as Chairman of the Audit Committee since March 2013. Mr. Alexander served in various positions with Ernst & Young L.L.P. between 1975 and 2011. From 2002 until his retirement in 2011, he served as Vice Chairman and Southwest Region Managing Partner and was a member of the firm's Americas and U.S. Executive Boards and Global Management Group. Since 2003, Mr. Alexander has served as a member of the executive board of Southern Methodist University's Cox School of Business. From 2009 until 2012, Mr. Alexander served as a national trustee on the board of Boys & Girls Clubs of America and as a board member of the American Heart Association. Mr. Alexander is a member of the Board of Governors of the Dallas Country Club, where he serves as a member of the Budget and Finance Committee and Preston Trail Golf Club Board of Directors, where he is a member of the Budget and Finance Committee.
Mr. Alexander has extensive leadership experience as a vice chairman and regional managing partner at a "Big Four" accounting firm, financial acumen and risk management experience developed through his experience in public accounting. He has been designated by the Corporate Governance and Nominating Committee as a financial expert under SEC regulations.
Antonio Carrillo
Mr. Carrillo, age 51, has served as one of our directors since February 2015. Mr. Carrillo will become the President and Chief Executive Officer of an infrastructure company that is being spun off by Trinity Industries, Inc. in the second half of 2018. He served as Chief Executive Officer of Mexichem, S.A.B. since June 2012 to February 2018. Previously, Mr. Carrillo served as Group President (and other executive positions) with Trinity Industries, Inc. from 1996 to May 2012. Mr. Carrillo has served on the board of directors of Trinity Industries, Inc. since September 2014.
Mr. Carrillo has extensive leadership experience as a chief executive officer, group president and other executive level positions in public companies, financial acumen and risk management experience developed through his chief executive officer and other executive
5
officer experience and public company board experience. He has been designated by the Corporate Governance and Nominating Committee as a financial expert under SEC regulations.
José M. Gutiérrez
Mr. Gutiérrez, age 56, has served as one of our directors since September 2016. He served in various senior level positions at AT&T Inc. from 1991 until his retirement in September 2016, including: Senior Executive Vice President, Executive Operations, AT&T Services, Inc. from December 2014 until his retirement; President of AT&T Wholesale Solutions from 2012 to 2014; President and Chief Executive Officer of AT&T Advertising Solutions from 2010 to 2012; President of AT&T Global Enterprise Solutions from 2008 to 2010; and President and Chief Executive Officer of AT&T Southwest from 2006 to 2008. Mr. Gutiérrez has served on the board of directors of Denny's Corporation since January 2013 and currently serves on the Finance and Audit Committee and Executive Compensation Committee and previously served on the Corporate Governance and Nominating Committee. He also serves as a member of the Strategic Development Board at University of Missouri's Trulaske College of Business.
Mr. Gutiérrez has extensive leadership experience as a senior officer in a large public company, financial acumen and risk management experience developed through his experience in public accounting and his executive experience heading large business units of a publicly traded company, as well as public company board experience (including audit committee, executive compensation committee and corporate governance and nominating committee experience).
Pamela H. Patsley
Ms. Patsley, age 61 has served as one of our directors since April 2008. From January 2009 until her retirement in February 2018 she served in various roles at MGI: from January 2016 until retirement she served as Executive Chairman of MGI, but in that role had no executive officer responsibilities; from September 2009 to December 2015 she served as Executive Chairman and Chief Executive Officer; and she served as Executive Chairman from January 2009 to September 2009. Previously, Ms. Patsley served as Senior Executive Vice President of First Data Corporation from 2000 to 2007 and President of First Data International from 2002 to 2007. She retired from those positions in 2007. From 1991 to 2000, she served as President and Chief Executive Officer of Paymentech, Inc., prior to its acquisition by First Data. Ms. Patsley also previously served as Chief Financial Officer of First USA, Inc. In addition to her Chairman's role at MGI, Ms. Patsley has served on the board of directors of Texas Instruments Incorporated since 2004 to present, where she formerly served as chair of the Audit Committee, and since January 2017 has served on the board of directors of Hilton Grand Vacations, Inc., where she is Chairman of the
6
Audit Committee. Ms. Patsley served on the board of directors of Molson Coors Brewing Company from 1996 to 2009; Pegasus Solutions, Inc. from 2002 to 2006; and Paymentech, Inc. from 1995 to 1999.
Ms. Patsley has extensive leadership experience as a chairman and chief executive officer, chief financial officer and other executive level positions in public companies, financial acumen and risk management experience developed through her experience in public accounting and her chief executive officer and chief financial officer experience, and extensive public company board experience (including audit committee chairperson experience). She has been designated by the Corporate Governance and Nominating Committee as a financial expert under SEC regulations.
Ronald G. Rogers
Mr. Rogers, age 69, has served as one of our directors since May 2008. Mr. Rogers served in various positions with Bank of Montreal between 1972 and 2005. From 2002 until his retirement in 2005, he served as Deputy Chair, Enterprise Risk & Portfolio Management, BMO Financial Group, and from 1994 to 2002 he served as Vice Chairman, Personal & Commercial Client Group.
Mr. Rogers has extensive senior level executive leadership experience, substantial banking experience, financial acumen developed from his banking experience and experience in enterprise risk management.
Wayne R. Sanders
Mr. Sanders, age 70, has served as the Chairman of our Board of Directors (the "Board") and as chairman of the Corporate Governance and Nominating Committee since May 2008. Mr. Sanders served as the Chairman and the Chief Executive Officer of Kimberly-Clark Corporation from 1992 until his retirement in 2003. Mr. Sanders has served on the board of directors of Texas Instruments Incorporated since 1997, where he currently serves as Lead Director and Chairman of the Corporate Governance and Nominating Committee and previously served on the Audit Committee and Compensation Committee. He previously served on the board of Belo Corporation from 2003 to 2013 and as a director of Adolph Coors Company. Mr. Sanders is also a Life Member of the Board of Directors and a National Trustee and Governor of the Boys & Girls Clubs of America and was an Emeritus Trustee of the Marquette University Board of Trustees.
Mr. Sanders, the Chairman of the Board, has extensive leadership experience as a board chairman, chief executive officer and other executive level positions in a public company, financial acumen developed through his extensive executive experience, operational and marketing experience, consumer product company experience and significant public company board experience (including audit and compensation committee chairmanship experience).
7
In February 2018, the Board waived the mandatory retirement provision of our Corporate Governance Guidelines as it relates to Mr. Sanders and agreed he should continue as Chairman until the closing of the Merger or, if the Merger Agreement is terminated, to the date of the next annual meeting of DPSG.
Dunia A. Shive
Ms. Shive, age 57, has served as a director since November 18, 2014. Ms. Shive served as Senior Vice President of TEGNA Inc., formerly Gannett Co., Inc., a broadcast and digital media company, from 2013 until her retirement in June 2017. She previously served as President and Chief Executive Officer of Belo Corp. from 2008 to 2013, which was acquired by Gannett Co., Inc. in 2013. She joined Belo Corp. in 1993 and served as Chief Financial Officer and various other leadership positions prior to her election as President and Chief Executive Officer. Ms. Shive has served on the board of directors of Trinity Industries, Inc. from March 2014 to present, where she is a member of the Audit Committee and Finance Committee. She served on the board of directors of Belo Corp. from 2008 to 2013. She is also a trustee of Parks for Downtown Dallas Foundation (formerly the Belo Foundation) and a former member of the Associated Press board of directors, where she served as chair of the audit committee.
Ms. Shive has extensive leadership experience as president, chief executive officer and chief financial officer in a public company, financial acumen from her chief financial officer and public accounting experience and broad public company board experience.
M. Anne Szostak
Ms. Szostak, age 67, has served as one of our directors since May 2008. Ms. Szostak has served as chairperson of our Compensation Committee since March 2012. Since 2004, Ms. Szostak has operated a consulting firm under the name Szostak Partners that advises executive officers on strategic and human resource issues. From 1998 until her retirement in 2004, she served as Corporate Executive Vice President and Director—Human Resources and Diversity of FleetBoston Financial Corporation (now Bank of America). She also served as Chairman and Chief Executive Officer of Fleet Bank—Rhode Island from 2001 to 2003. Ms. Szostak has served as a director of Tupperware Brands Corporation since 2000, where she serves on the Audit Committee and previously served on the Compensation and Nominating and Governance Committees, and IDEXX Laboratories since 2012, where she is chair of the Compensation Committee and serves on the Audit Committee. She previously served on the board of directors of ChoicePoint Corporation from 2005 to 2008, on the board of directors for Spherion Corporation from 2005 to 2011 and on the board of directors of Belo Corp. from 2004 to 2013. Ms. Szostak is currently a member of the Board of Trustees of Bryant University, Trustee Emerita of Colby College, Life Governor and Chairperson Emeritus of the Boys & Girls Clubs of America, and
8
serves on various committees of Care New England and Women and Infants' Hospital of Rhode Island. She is the former Chairperson of the Board of Women and Infants' Hospital of Rhode Island.
Ms. Szostak has extensive senior level executive leadership experience with a Fortune 100 company, experience as a chief executive officer of two major bank subsidiaries of public companies, substantial banking experience, significant human resource experience, experience in risk management and significant experience on other public company boards (including compensation committee chairperson and audit and corporate governance and nominating committee experience).
Larry D. Young
Mr. Young, age 63, has served as one of our directors since DPSG's formation in October 2007. Mr. Young has served as our President and Chief Executive Officer since October 2007. From October 2007 to May 2008, Mr. Young also served as President and Chief Executive Officer of CSAB. Mr. Young joined CSAB as President and Chief Operating Officer of the Bottling Group segment and Head of Supply Chain in 2006 after the acquisition of DPSUBG. He served as President and Chief Executive Officer of DPSUBG since 2005. From 1997 to 2005, Mr. Young served as President and Chief Operating Officer of Pepsi-Cola General Bottlers, Inc. and Executive Vice President of Corporate Affairs at PepsiAmericas, Inc.
Mr. Young, our Chief Executive Officer, has extensive senior level executive experience as our Chief Executive Officer, and chief operating officer, over 40 years of experience in the beverage industry and substantial sales and marketing experience.
Process
The Board is responsible for approving candidates for the Board. The Corporate Governance and Nominating Committee is responsible for the identification of candidates for the Board and making director recommendations to the Board. The Corporate Governance and Nominating Committee will also consider director nominations by a stockholder made pursuant to the procedures set forth in our Amended and Restated By-Laws relating to stockholder nominations.
Qualifications
The Corporate Governance and Nominating Committee seeks director candidates (including any candidate who may be recommended by a stockholder) who have certain personal and professional attributes, including:
- •
- sound personal and professional integrity;
9
- •
- an inquiring and independent mind;
- •
- willingness to devote the required time to carrying out the duties and responsibilities of Board membership;
- •
- commitment to serve on the Board for several years to develop knowledge about DPSG's businesses; and
- •
- willingness to represent the best interests of all stockholders and observe the fiduciary duties that a director owes to the stockholders.
In addition, a director candidate must have, when considered with the collective experience of other Board members, appropriate qualifications and skills that have been developed through extensive business experience, including the following:
- •
- practical wisdom and mature judgment;
- •
- leadership;
- •
- interpersonal skills;
- •
- financial acumen;
- •
- broad training and experience at the policy-making level in business, finance and accounting, government, education or technology; and
- •
- expertise (including industry expertise) that is useful to DPSG and complementary to the background and experience of other Board members, so that an optimal balance of Board members can be achieved and maintained.
Diversity
In accordance with our Corporate Governance Guidelines described in Item 13 below, diversity of viewpoints, as well as gender and ethnic diversity, are characteristics considered by the Corporate Governance and Nominating Committee in making recommendations for nominations. The Board has not adopted any policy on diversity with respect to our directors, but it seeks a balance of experience among the directors so that the Board as a whole has experience and training from different disciplines (including operations, accounting, finance, risk management, marketing and human resources) and different industries (including the beverage industry, consumer products and finance) which creates the balance sought.
10
Other than Mr. Young, who is a director and whose business experience is summarized above, the following is a summary of the business experience of our executive officers (ages are as of March 19, 2018):
Jaxie S. Alt, Executive Vice President, Human Resources, age 45, has served as our Executive Vice President, Human Resources since June 2017. Previously, Ms. Alt served in various capacities in marketing since joining DPSG in 2001, including as Senior Vice President, Marketing from November 2012 to June 2017 and Vice President, Media from September 2011 to November 2012.
James L. Baldwin, Executive Vice President, General Counsel, age 56, has served as our Executive Vice President, General Counsel and Secretary since DPSG's spin-off in May 2008. From July 2003 to May 2008, he served as Executive Vice President and General Counsel of CSAB. From June 2002 to July 2003, he served as Senior Vice President and General Counsel of Dr Pepper/Seven Up, Inc., from August 1998 to June 2002 as General Counsel of Mott's LLP and from March 1997 to August 1998 as Vice President and Assistant General Counsel of Dr Pepper/Seven Up, Inc.
Rodger L. Collins, President, Packaged Beverages, age 59, has served as our President, Packaged Beverages since February 2009. Prior to that, Mr. Collins served in various executive capacities with us and CSAB, including President of Bottling Group Sales and Finished Goods Sales (September 2008 - February 2009), President of Sales for the Bottling Group (October 2007 - September 2008), Midwest Division President for the Bottling Group (January 2005 - October 2007), and Regional Vice President (October 2001 - December 2004).
Martin M. Ellen, Executive Vice President, Chief Financial Officer, age 64, joined DPSG in April 2010 as our Executive Vice President, Finance and transitioned into the role of Executive Vice President, Chief Financial Officer in May 2010. Prior to joining DPSG, Mr. Ellen had served as Senior Vice President—Finance and Chief Financial Officer at Snap-on Incorporated since 2002, where he had responsibility for all of the financial operations at this global, publicly traded company. Mr. Ellen has served on the Board of Directors of Eagle Materials Inc. since 2013 and is currently Chairman of the Audit Committee.
Philip L. Hancock, Executive Vice President, Chief Executive Officer, Bai Brands, age 49, has served as our Executive Vice President, Chief Executive Officer, Bai Brands since June 2017. Previously, Mr. Hancock served as Executive Vice President, Human Resources from February 2013 until June 2017. From March 2012 to February 2013, Mr. Hancock served as Senior Vice President, Human Resources, from February 2010 to March 2012 as Senior Vice President, Procurement, from January 2008 to February 2010 as Senior Vice President, Regional Manufacturing and from January 2007 to
11
January 2008 as Vice President of Manufacturing Development. Prior to joining DPSG in January 2007, Mr. Hancock was a Senior Associate at McKinsey & Company for approximately two years and served as an officer in the United States Army for approximately 11 years.
Derry L. Hobson, Executive Vice President, Supply Chain, age 67, has served as our Executive Vice President of Supply Chain since DPSG's spin-off in May 2008. From October 2007 to May 2008 Mr. Hobson served as the Executive Vice President of Supply Chain of CSAB. Mr. Hobson joined CSAB as Senior Vice President of Manufacturing in 2006 through the acquisition of DPSUBG, where he had been Executive Vice President since 1999.
James J. Johnston, Jr., President, Beverage Concentrates and Latin America Beverages, age 61, has served as our President, Beverage Concentrates and Latin America Beverages since September 2009. Prior to that, Mr. Johnston served in various executive capacities with us and CSAB, including President, Beverage Concentrates (November 2008 - September 2009), President of Concentrate Sales (September 2008 - November 2008), President of Finished Goods and Concentrate Sales (October 2007 - September 2008), Executive Vice President of Sales (January 2005 - October 2007), Executive Vice President of Strategy (December 2003 - January 2005), and Senior Vice President of Licensing (October 1997 - December 2003).
David J. Thomas, Ph.D., Executive Vice President, Research & Development, age 56, has served as our Executive Vice President, Research and Development since December 2010. From DPSG's spin-off in May 2008 until December 2010, Dr. Thomas served as our Senior Vice President, Research & Development. From November 2006 to May 2008, Dr. Thomas served as the Senior Vice President, Research & Development for CSAB. Dr. Thomas served as Vice President—Global Product Development for Gerber Products from July 2005 until October 2006. Dr. Thomas holds a Ph.D. Degree in Food Science, with an emphasis in Flavor Biochemistry, from the University of Wisconsin-Madison.
James R. Trebilcock, Executive Vice President, Chief Commercial Officer, age 60, has served as our Chief Commercial Officer since January 2016, From September 2008 to January 2016 he served as our Executive Vice President, Marketing. From DPSG's spin-off in May 2008 to September 2008, Mr. Trebilcock served as our Senior Vice President—Marketing. From February 2003 to May 2008, Mr. Trebilcock served as the Senior Vice President—Consumer Marketing of CSAB. Mr. Trebilcock held various positions in CSAB and its predecessor businesses since July 1987.
During our fiscal year ended December 31, 2017, the Audit Committee was comprised of Mr. Alexander (Chairman), Mr. Carrillo and Ms. Patsley. Each of the directors who
12
served as an Audit Committee member in 2017 is "independent," in accordance with applicable laws and regulations and as defined in the current NYSE listing standards. Upon consideration of the attributes of an audit committee financial expert as set forth in SEC regulations, the Board determined that Mr. Alexander, Mr. Carrillo and Ms. Patsley possess those attributes through their experience, and each was designated as an audit committee financial expert.
The Audit Committee is responsible for reviewing and approving an audit committee report included as part of this Amendment and assisting the Board's oversight of:
- •
- the quality and integrity of DPSG's financial statements and related disclosure (including the quality, adequacy and effectiveness of our
internal controls);
- •
- DPSG's compliance with all legal and regulatory requirements;
- •
- the independent registered public accountant's performance, qualifications and independence; and
- •
- the performance of DPSG's internal audit function.
The Audit Committee has selected Deloitte as our independent registered public accounting firm for fiscal year 2018. On May 20, 2015, the Board approved the restated audit committee charter ("Audit Committee Charter"), a copy of which is available on our website at www.drpeppersnapplegroup.com under the Investors—Corporate Governance—Committee Charters—Audit Committee Charter captions.
Code of Conduct
We are dedicated to earning the trust of our customers and investors, and our actions are guided by the principles of honesty, trustworthiness, integrity, dependability and respect. The Board has adopted a Code of Conduct that applies to all employees and directors. Our Code of Conduct is posted on our website at www.drpeppersnapplegroup.com under the Investors—Corporate Governance—Code of Conduct captions. We intend to satisfy the disclosure requirement under Item 5.05 of Form 8-K or applicable NYSE rules regarding any amendment to, or waiver from, a provision of the Code of Conduct for our senior financial officers, including the Chief Executive Officer, if any, either by posting such information on our website at www.drpeppersnapplegroup.com under the Investors—Corporate Governance captions or by filing a Current Report on Form 8-K with the SEC.
13
SECTION 16(A) BENEFICIAL OWNERSHIP REPORTING COMPLIANCE
Section 16(a) of the Exchange Act requires our directors, certain officers and persons who beneficially own more than 10% of our outstanding common stock to file with the SEC initial reports of ownership and reports of changes in ownership of our common stock held by such persons. These persons are also required to furnish us with copies of all forms they file under this regulation. To our knowledge, based solely on a review of the copies of such reports furnished to us and without further inquiry, during 2017 all required forms for our current filing persons were filed on time.
14
Item 11. Executive Compensation.
COMPENSATION DISCUSSION AND ANALYSIS
Program Design
Our executive pay programs are competitive with our peers in the beverage and consumer packaged goods industry. Program design supports our strategy, attracts and retains talent, ensures pay-for-performance alignment and incorporates best practices when appropriate.
| | | | Key Compensation Design Features | |||||||
| | | | | | | | | | | |
| | ü Significant majority of compensation is at-risk, in the form of MIP and long-term incentive ("LTI") grants of PSUs, restricted share units ("RSUs") and options |
|||||||||
| | | | | | | | | | | |
| | | | ü Annual and long-term incentive metrics map directly to our approach for generating stockholder value |
|||||||
| | | | | | | | | | | |
| | | | ü Total compensation opportunity is positioned competitively |
|||||||
| | | | ü Incentive plan structure supports the strategy of seeking profitable growth, prudent capital management and returning cash to stockholders |
|||||||
| | | | ü Compensation mix favors long-term incentives relative to peer group |
|||||||
| | | | ü Equity awards are used to align the interests of management and stockholders over the long term |
|||||||
| | | | ü Stockholder alignment is further enhanced through our stock ownership guidelines |
|||||||
| | | | ü Incentive plans use a balanced mix of metrics to capture the totality of corporate performance and prevent unbalanced incentives due to too few metrics |
|||||||
| | ||||||||||
|
For incentive compensation purposes we measure ourselves on the following core drivers of our business, which are directly impacted by our executives. |
|
||||||||
| | ||||||||||
| | | | | | | | | | | |
| | | Metrics | Incentive Plan | |||||||
| | | • Net Sales and Income from Operations (Core Earnings) à |
• Annual Incentive Plan (MIP) |
|||||||
| | | | | | | | | | | |
|
|
|
• Net Income (Core Earnings) and Free Cash Flow (Core) à |
• Performance Share Units (PSUs) |
||||||
| | | | | | | | | | | |
15
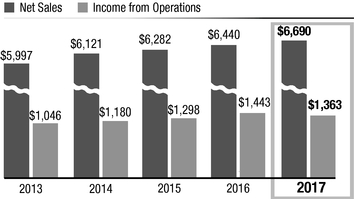
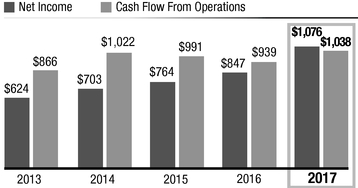
2017 WAS A RECORD YEAR
2017 Net Sales, Cash Flow from Operations and Net Income reached their highest point in the last five years. Income from Operations in 2017 remained near record levels.
Our historical performance relative to these metrics is presented below ($ millions):
| Key MIP Metric Components | Key PSU Metric Components | |
|
|
Figures presented above are as reported in the Company's Form 10-K for the applicable fiscal year. These metrics as used in our MIP and PSU plans are subject to various adjustments in order to more accurately measure and reward the Company's core performance. Discussions of MIP and PSU performance and payouts on pages 27 and 33, respectively, are based on non-GAAP measures. Reconciliation of GAAP to non-GAAP measures are presented in Appendix A to this Amendment.
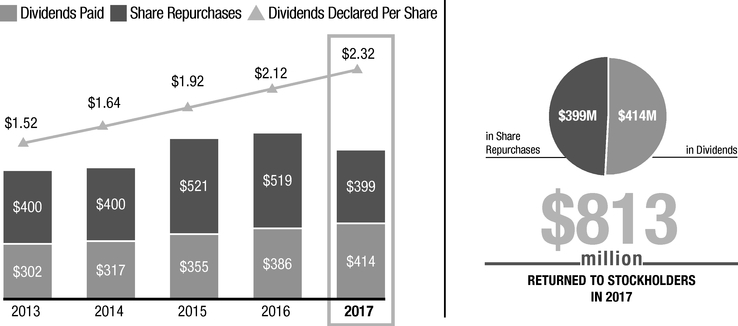
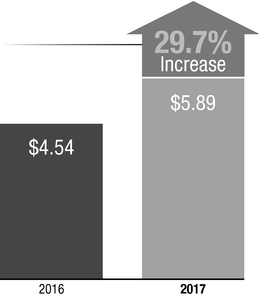
RECORD DIVIDENDS PAID IN 2017
Our sustained successful execution enabled us to return profits to stockholders by increasing dividends and repurchasing shares. In 2017, we paid out a record amount in dividends and continued with our robust stock repurchase program. Over the past five years, we have paid out over $1.7B in dividends and repurchased $2.2B of stock.
Funds Returned to Stockholders
($ Millions)
16
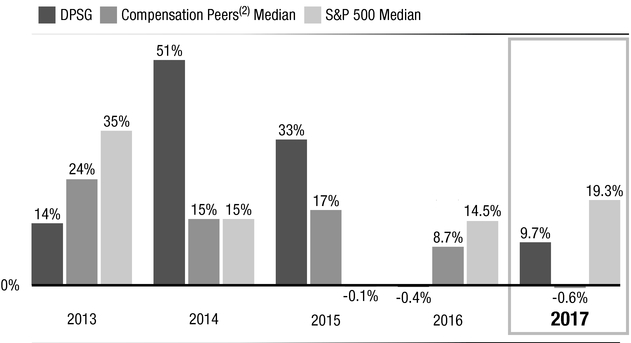
TSR PERFORMANCE WAS MIXED IN 2017,
LONG-TERM RETURNS REMAINED ABOVE EXTERNAL BENCHMARKS
2017 TSR(1) outperformed compensation peers, but lagged the S&P 500. However, when viewed as a long-term investment, DPSG stock returns were above median of both compensation peers and the S&P 500 over the trailing 3 and 5 year periods.
DPSG Total Stockholder Return (TSR)
In addition to the performance results already noted, we're pleased to report the following improvements:
| Earnings Per Share (EPS), on a Fully Diluted Basis | ||
|
||
- (1)
- TSR is total shareholder return, which is stock price growth assuming dividend reinvestment.
- (2)
- Compensation peers are as defined on page 24 of this Amendment.
17
Key Compensation Policies
The Board and the Compensation Committee have adopted various policies and programs that enhance compensation governance and strengthen stockholder alignment:
| INCENTIVE PLAN DESIGN | ||
What We Do 
|
What We Don't Do 
|
|
ü Balanced mix of performance metrics resulting in a holistic view of company performance ü Challenging MIP performance goals ü MIP and PSU programs are designed with the intent to qualify for a 162(m) deduction as performance-based compensation |
× No uncapped incentive plans × No purely formulaic bonus plans — Compensation Committee is able to exercise negative discretion with respect to payouts × No guaranteed bonuses or discretionary awards made outside of structured incentive plan framework |
|
| EQUITY AWARD RELATED PRACTICES | ||
What We Do
|
What We Don't Do
|
|
ü Multi-year vesting of equity awards ü Challenging PSU performance goals ü rTSR modifier used to prevent significant disconnects between rTSR and PSU payouts |
× No option grants below fair market value × No under-water option repricing or exchange permitted without stockholder approval × No dividend equivalents on unearned PSUs |
|
| COMPENSATION GOVERNANCE, RISK MITIGATION, AND SEVERANCE |
||
What We Do
|
What We Don't Do
|
|
ü Stringent insider trading policies, which include anti-hedging provisions ü Robust stock ownership guidelines ü Incentive compensation clawback policy ü Tally sheets reviewed as part of the compensation setting process ü Majority of compensation is at-risk and is long-term in nature ü Annual corporate and individual performance assessments for all members of the Executive Leadership Team (ELT) ü Independent Board Chairman and Compensation Committee composed entirely of outside, independent directors ü Compensation Committee uses an independent compensation consultant |
× No active Supplemental Executive Retirement Plans (SERPs) × No benchmarking of executive pay to a peer group of mostly larger companies × No excessive perquisites × No change-in-control (CIC) severance in excess of 3X base and bonus × No future excise tax gross-ups beyond the current participants in the CIC severance plan |
|
18
Say-on-Pay Vote and Program Changes
The annual Say-on-Pay vote in the Annual Meeting which occurred in May 2017 passed with over 90% of the votes cast (i.e., votes cast "for" or "against") in favor of the resolution. The Compensation Committee considers this to be a strong indicator of support for current program design and the changes implemented beginning in 2015. The changes listed below were implemented based on stockholder feedback solicited in response to the 2015 vote:
- •
- Weighting of PSUs in the LTI program increased by 10% to 50% of total. RSUs were reduced by 10% to 30% of
total;
- •
- A relative TSR (rTSR) modifier metric was added to the existing PSU program;
- •
- The Company committed to not providing 280G excise tax gross-ups on change-in-control benefits to future
executives beyond the current six participants; and
- •
- CEO stock ownership guideline was increased to six times salary.
19
Incentive payouts reflect the Company's performance, with the MIP paying out at 50% to 94% of target, and PSUs at 81% of target.
Performance Focus of Compensation Programs
The majority of target total compensation in 2017 was at-risk in the form of MIP and long-term incentives (PSUs, RSUs and options). Participants' payouts vary based on MIP and PSU performance relative to goals, as well as our stock price and dividend growth.
Target Compensation Mix and Purpose of Each Element
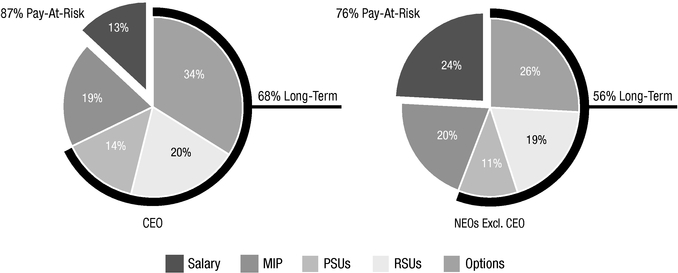
The table below provides details on 2017 target compensation for our NEOs.
| | | | | | | | | | | | | | | | | | |
|
$ 000'S |
|
|
|
|
|
|
|
|
|||||||||
|---|---|---|---|---|---|---|---|---|---|---|---|---|---|---|---|---|---|
| | | | | | | | | | | | | | | | | | |
|
NAME |
TITLE |
SALARY |
MIP TARGET (%) |
TARGET CASH(1) |
PSUs(2) |
RSUs |
OPTIONS |
TARGET TOTAL |
|||||||||
| | | | | | | | | | | | | | | | | | |
Larry D. Young |
Pres. and CEO | $1,150 | 150% | $2,875 | $3,000 | $1,800 | $1,200 | $8,875 | |||||||||
| | | | | | | | | | | | | | | | | | |
Martin M. Ellen |
CFO | 624 | 90% | 1,186 | 780 | 468 | 312 | 2,746 | |||||||||
| | | | | | | | | | | | | | | | | | |
Rodger L. Collins |
Pres., Packaged Beverages | 627 | 85% | 1,160 | 725 | 435 | 290 | 2,610 | |||||||||
| | | | | | | | | | | | | | | | | | |
James J. Johnston |
Pres., Beverage Concentrates and Latin America Beverages | 627 | 85% | 1,160 | 725 | 435 | 290 | 2,610 | |||||||||
| | | | | | | | | | | | | | | | | | |
Phillip L. Hancock(3),(4) |
CEO, Bai Brands | 500 | 75% | 875 | 433 | 509 | 173 | 1,990 | |||||||||
| | | | | | | | | | | | | | | | | | |
- (1)
- Target cash is the sum of salary and MIP target.
- (2)
- PSU values shown are based on the closing stock price of $94.62 on March 2, 2017, the date of grant. Consistent with past practice, the Company used the grant date stock price for determining the number of PSUs to grant. PSU values shown in the "Stock Awards" column of the Summary Compensation table (page 42), and the Grants of Plan Based Awards table (page 44) are based on the grant date fair value (accounting value) of PSUs determined under GAAP. The accounting value of each PSU as of the grant date was $98.48. Accounting value of PSUs exceeded the grant date stock price due to the rTSR modifier, with the resulting valuation positioning the accounting value approximately 4.1% above the grant date stock price.
- (3)
- Mr. Hancock's salary, MIP target and target cash reflect compensation applicable to Mr. Hancock's position as CEO, Bai Brands, effective on June 19, 2017.
- (4)
- Mr. Hancock's long-term incentive grants consisted of the regular cycle awards on March 2, 2017 and a promotional grant on July 7, 2017. March 2, 2017 grants were awarded when Mr. Hancock held the role of EVP, Human Resources. Upon promotion to CEO, Bai Brands, Mr. Hancock received an RSU grant of $249,928.
20
Key components of our executive officer compensation program and each component's role are described below.
| | | | | | | | | |
|
PAY ELEMENT |
|
ROLE IN OUR COMPENSATION PROGRAM |
||||||
|---|---|---|---|---|---|---|---|---|
| | | | | | | | | |
Salary |
| | | • Attract and retain talent |
||||
|
| | | • Provide liquidity |
||||
| | | | | | | | | |
Bonus (MIP) |
| | | • Drive achievement of key business results on an annual basis |
||||
|
| | | • Instill a team mindset by tying a significant percentage of annual cash compensation to common corporate goals |
||||
| | | | | | | | | |
PSUs |
| Our LTI vehicles, which collectively constitute a majority of total direct compensation, share the following characteristics: | | • Focus participants on measures that drive our stock price over the long-term and that participants can impact — net income, cash flow from operations and prudent capital management • Align to our Rapid Continuous Improvement (RCI) philosophy by focusing on continuous growth in net income and cash flow from operations |
||||
| | | | | | | | | |
RSUs |
• Align interests of executives to stockholders • Retain key talent • Tie the value ultimately realized to performance |
• Retain executives during periods of macro-economic or industry instability • Replicate the stockholder experience through a direct connection between stock price growth and realized pay |
||||||
| | | | | | | | | |
Options |
• Provide a leveraged incentive for driving stock price growth • Allow executives to realize rewards for results achieved over the long-term by utilizing the 10 year option term |
|||||||
| | | | | | | | | |
Benefits and Perquisites |
• Constitute a minor portion of compensation while maximizing executives' focus on company operations |
|||||||
| | | | | | | | | |
In 2017, the Compensation Committee reviewed our executive compensation program to determine how well pay structure and amounts aligned with our strategic objectives and desired competitive positioning. Overall, the Compensation Committee believes the program remains aligned with our key objectives.
21
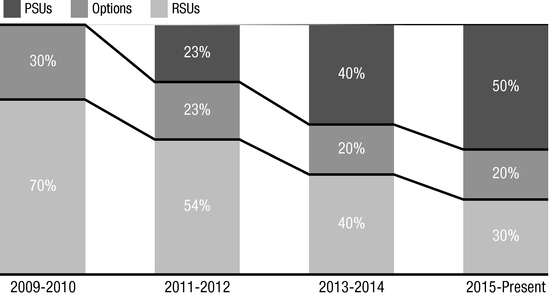
LTI Design Evolution
Since going public our compensation program has continuously evolved to reflect a greater focus on achieving performance goals to which management has line-of-sight. This evolution is most evident in the changes in our LTI mix (allocation of LTI grant value by vehicle): RSUs declined from 70% to 30% between 2009 and 2015, and PSUs increased from 23% to 50% between 2011 and 2015. Beginning with the 2015 PSU grant, our PSU program design was updated by adding an rTSR modifier to the internal Return (iR) metric. For 2017 PSU grant we made further modifications to the iR metric in order to simplify and realign program design to our priorities.
Pay-for-Performance Alignment
As illustrated below, our CEO's 2017 compensation (and that of other executive officers) is highly sensitive to achievement of MIP and PSU performance goals, as well as stock price at vest.
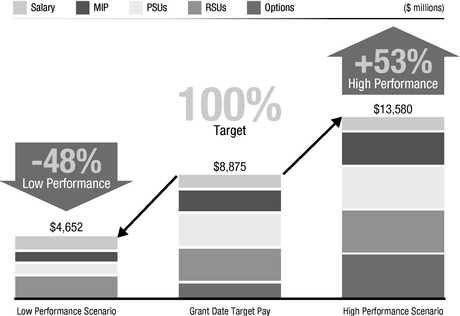
Performance assumptions used to demonstrate the sensitivity of pay to performance are meant for illustrative purposes only and are listed below:
| | | | | |
|
ASSUMPTIONS |
MIP & PSU PAYOUTS |
STOCK PRICE |
||
|---|---|---|---|---|
| | | | | |
Low Performance |
50% of Target | $75.70 (Grant Price–20%) | ||
| | | | | |
High Performance |
150% of Target | $113.54 (Grant Price + 20%) | ||
| | | | | |
22
Competitive Pay Positioning
In making 2017 compensation decisions, the Compensation Committee reviewed market data on compensation paid to similarly-situated executives in our peer group during 2016, along with the performance of those peers in comparison to our performance. In determining pay positioning for executive officers, the Compensation Committee takes the following considerations into account:
Factors Driving Competitive Pay Positioning of Executives
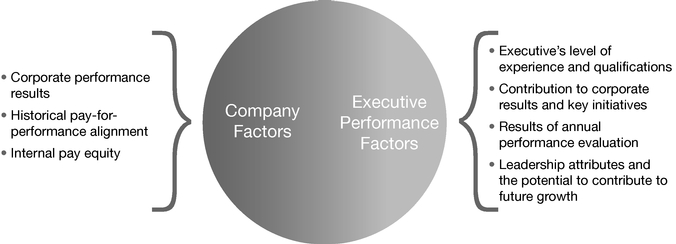
Approximate compensation opportunity positioning in 2017 was as follows:
| | | |
|
PAY COMPONENT NEO PAY POSITIONING |
NEO PAY POSITIONING |
|
|---|---|---|
| | | |
| Salary | Median | |
| | | |
| Target Cash (Salary + Bonus Target) | Median | |
| | | |
| Total Target Direct (Target Cash + LTI) | Designed to approximate market median if performance relative to PSU goals is near market median levels | |
| | | |
23
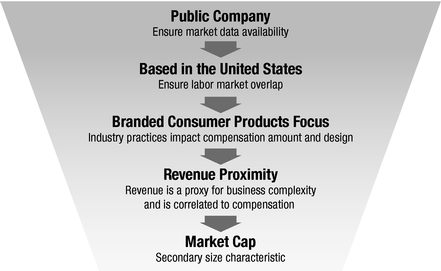
PEER GROUP DEVELOPMENT — COMPENSATION PROGRAM BENCHMARKING
In 2016, our Compensation Committee, with the assistance of Mercer HR Services, LLC, its outside executive compensation consultant ("Mercer"), reviewed potential peers. Peer companies were selected and used to calibrate our executive compensation program for 2017. Our peers are companies operating in similar industries with whom we are most likely to exchange talent at the executive officer level. We used the following criteria to select compensation peers:
Peer Group Filtering Criteria and Rationale
Based on the peer selection methodology outlined above, the Compensation Committee approved the following peer companies ("Compensation Peers") to use as a benchmark in the Compensation Committee's 2017 executive compensation decisions:
| | | | | |
| Brown-Forman Corporation | General Mills, Inc. | Molson Coors Brewing Company | ||
| | | | | |
| Campbell Soup Company | The Hershey Company | Pinnacle Foods, Inc. | ||
| | | | | |
| The Clorox Company | Hormel Foods Corporation | Post Holdings, Inc. | ||
| | | | | |
| ConAgra Foods, Inc. | The J. M. Smucker Company | Treehouse Foods, Inc. | ||
| | | | | |
| Constellation Brands, Inc. | Kellogg Company | | ||
| | | | | |
| Dean Foods Company | McCormick & Company, Incorporated | |||
| | | | | |
The Compensation Committee made two changes to the peer group at the time of its review:
- •
- Added Pinnacle Foods, Post Holdings, and Treehouse Foods based on industry focus and size proximity
- •
- Removed Keurig Green Mountain and WhiteWave Foods due to acquisition and subsequent stock exchange delisting
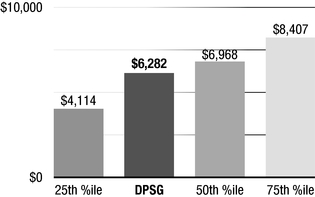
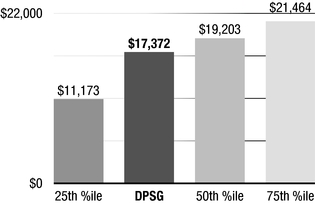
In 2016, when the peers discussed were selected, Mercer advised the Compensation Committee that DPSG's revenue and market cap approximated peer medians based on data shown below ($ amounts in millions):
| Peer Group Net Sales | Peer Group Market Cap | |
|
|
24
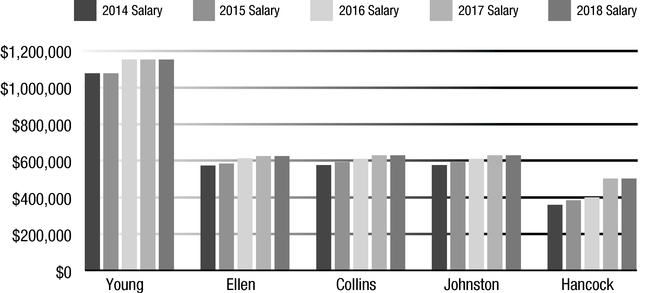
Salary adjustments are made annually based on individual performance, promotions, changes in responsibilities and market movement.
Salary increases in recent years have been modest, with the CEO receiving one increase since 2014.
| |
|
|
|
|
|
|
|
|
|
||||||||||
|---|---|---|---|---|---|---|---|---|---|---|---|---|---|---|---|---|---|---|---|
| | | | | | | | | | | | | | | | | | | | |
|
NAME |
2014 SALARY |
INCREASE |
2015 SALARY |
INCREASE |
2016 SALARY |
INCREASE |
2017 SALARY |
INCREASE |
2018 SALARY |
||||||||||
| | | | | | | | | | | | | | | | | | | | |
Larry D. Young |
$1,075,000 | 0% | $1,075,000 | 7.0% | $1,150,000 | 0% | $1,150,000 | 0% | $1,150,000 | ||||||||||
| | | | | | | | | | | | | | | | | | | | |
Martin M. Ellen |
571,000 | 2.0% | 582,500 | 5.0% | 611,500 | 2.0% | 623,750 | 0% | 623,750 | ||||||||||
| | | | | | | | | | | | | | | | | | | | |
Rodger L. Collins |
574,000 | 3.0% | 591,000 | 3.0% | 608,500 | 3.0% | 626,755 | 0% | 626,755 | ||||||||||
| | | | | | | | | | | | | | | | | | | | |
James J. Johnston |
574,000 | 3.0% | 591,000 | 3.0% | 608,500 | 3.0% | 626,755 | 0% | 626,755 | ||||||||||
| | | | | | | | | | | | | | | | | | | | |
Phillip L. Hancock |
357,000 | 7.0% | 382,000 | 4.2% | 398,000 | 25.6% | 500,000 | 0% | 500,000 | ||||||||||
| | | | | | | | | | | | | | | | | | | | |
Average Merit Increase |
3.0% | 4.4% | 2.2% | 0% | |||||||||||||||
| | | | | | | | | | | | | | | | | | | | |
New salaries generally become effective in April of each year. Values shown above reflect new salaries following the April increases, with the exception of Mr. Hancock's 2017 increase. Mr. Hancock's 2017 increase of 25.6% is the product of a 3% merit increase in his prior role of EVP, Human Resources effective April 2017, and a 22% promotional increase effective July 2017 when he assumed the role of CEO, Bai Brands. Mr. Hancock's promotional increase was excluded from average merit increase percentage shown for 2017.
Salary increases for our NEOs in 2014 through 2018 were made by the Compensation Committee, considering the level of salary relative to key comparators, as well as company and individual performance. As a result of these actions, the salaries for all NEOs are near the median of our peer group.
The MIP is our annual cash incentive program designed to reward achievement of pre-established Net Sales and Income from Operations goals.
Plan Metrics: Performance metrics and associated weightings for each NEO are shown below:
| |
|
|
||
|---|---|---|---|---|
| | | | | |
|
METRIC |
CEO, CFO, CEO, BAI BRANDS |
BUSINESS UNIT PRESIDENTS |
||
| | | | | |
Consolidated Net Sales |
40% | 40% | ||
| | | | | |
Consolidated Income from Operations |
60% | 30% | ||
| | | | | |
Segment Operating Profit |
— | 30% | ||
| | | | | |
25
Performance Targets: Target performance was set above 2016 levels after accounting for anticipated negative currency impact, and was judged to be challenging, yet achievable in light of industry dynamics.
| | | | | | | |
|
CORPORATE METRICS |
PERFORMANCE CONDITION AND ASSOCIATED PAYOUT |
PERFORMANCE GOAL (in millions) |
GOAL SETTING CONTEXT |
|||
|---|---|---|---|---|---|---|
| | | | | | | |
|
Threshold (25%) | $6,529 | Targeted 4.5% net sales growth vs. 2016 results, including the Bai acquisition and net of anticipated negative 1% foreign currency impact. Incentive plan targets were set against the backdrop of declining Carbonated Soft
Drinks (CSD) volumes in the U.S. and Canadian markets and uncertanties in the Mexico economy. |
|||
| | | | | | | |
Net Sales |
Target (100%) | $6,731 | ||||
| | | | | | | |
|
Maximum (200%) | $6,933 | ||||
| | | | | | | |
|
Threshold (25%) | $1,332 | Targeted 2.4% annual income from operations growth vs. 2016 results, including the Bai acquisition and net of anticipated negative 2% foreign currency impact. |
|||
| | | | | | | |
Income From Operations |
Target (100%) | $1,417 | ||||
| | | | | | | |
|
Maximum (200%) | $1,502 | ||||
| | | | | | | |
| | | | | | | |
|
SEGMENT OPERATING PROFIT METRICS |
PERFORMANCE CONDITION AND ASSOCIATED PAYOUT |
PERFORMANCE GOAL (in millions) |
|
|||
|---|---|---|---|---|---|---|
| | | | | | | |
|
Threshold (25%) | $887 | ||||
| | | | | | | |
Beverage Concentrate and |
Target (100%) | $944 | ||||
| | | | | | | |
Latin America Beverages |
Maximum (200%) | $1,001 | ||||
| | | | | | | |
|
Threshold (25%) | $695 | ||||
| | | | | | | |
Packaged Beverages |
Target (100%) | $739 | ||||
| | | | | | | |
|
Maximum (200%) | $783 | ||||
| | | | | | | |
26
WHY NET SALES AND INCOME FROM OPERATIONS?
We believe that Net Sales and Income from Operations are simple, high-level reflections of our goals as a business — grow top line and profits. The 60/40 weighting of profit and net sales objectives for the CEO, CFO, and CEO, Bai Brands, creates necessary balance between investing to drive future net sales growth and managing expenses to drive profits in the present. Business Unit Presidents have a different metric mix to drive results and accountability for the business units they oversee.
The moderate bias towards profit weighting recognizes the realities of falling demand within the CSD industry while striking an appropriate balance between acting as a motivator and holding participants accountable for growing the top line.
MIP Pay-for-Performance Alignment
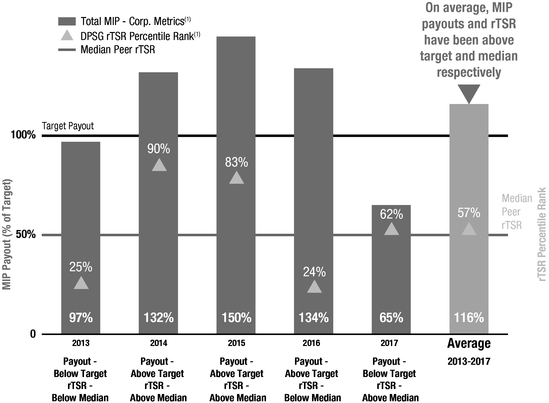
NEO performance targets for net sales and income from operations metrics require meaningful, yet achievable "stretch" performance in order to earn a target payout. Over the last five years that the current plan design has been in place, our MIP payouts averaged 16% above target.
MIP — Historical Payouts (Consolidated Metrics) and Pay-for-Performance
- (1)
- rTSR is relative to compensation peer group.
MIP PAYOUTS — ALIGNMENT TO STOCKHOLDER RETURNS
While the average year-by-year TSR ranking is just above median, the aggregate TSR ranking over the entire 5 year period is in the top quartile of peers
27
In recent years MIP payouts were driven by mixed net sales performance and above target profits, reflecting the following:
| |
|---|
| |
|
INDUSTRY REVENUE AND CURRENCY EXCHANGE RATES CHALLENGES |
| |
| Significant revenue headwinds due to unfavorable shifts in consumer behavior and preferences |
| |
| DPSG's challenges in achieving organic revenue growth against these headwinds |
| |
| Positive impact of our strong performance in Mexico has been significantly reduced due to Mexican Peso weakness |
| |
|
MADE UP FOR THROUGH EXECUTION EXCELLENCE |
| |
| Sales volumes increased by partnering with allied brands in high growth categories; and in the case of Bai Brands, acquiring a high growth brand |
| |
| Our strong profitability performance partially offset the revenue weakness in the CSD segment |
| |
| Efficiency gains driven by our Rapid Continuous Improvement (RCI) initiatives allowed us to meet and exceed profitability targets |
| |
Results for Fiscal Year 2017
In fiscal year 2017 the target financial goal at the corporate level, the fiscal year 2017 results ("Results") (against which the targets are measured as determined by the Compensation Committee) and the payout percentages were as follows (in millions):
| |
|
|
|
||||
|---|---|---|---|---|---|---|---|
| | | | | | | | |
|
METRIC |
TARGET (100%) |
RESULTS |
PAYOUT PERCENTAGE |
||||
| | | | | | | | |
Net Sales |
$6,731 | $6,690 | 85.0% | ||||
| | | | | | | | |
Income from Operations |
$1,417 | $1,363 | (1) | 52.2% | |||
| | | | | | | | |
Segment Operating Profit (SOP): |
| | | ||||
| | | | | | | | |
Beverage Concentrates and Latin America Beverages |
$944 | $970 | (1) | 146.4% | |||
| | | | | | | | |
Packaged Beverages |
$739 | $693 | (1) | 0.0% | |||
| | | | | | | | |
- (1)
- The Target amounts and Results reflected in these columns and used to calculate the payout are based on Core Earnings. Core Earnings is defined as results, as reported, adjusted for the unrealized mark-to-market impact of commodity and interest rate derivatives not designated as hedges under U.S. GAAP and certain items that are excluded for comparison to prior year periods. A reconciliation of Income from Operations and SOP to the results used for the MIP determination is included as Appendix A to this Amendment.
Refer to the Appendix A to this Amendment for a Reconciliation of Core Earnings to GAAP financials.
2017 Payout Calculation: The actual awards are calculated based on year-end salary and are shown below:
| |
|
|
|
|
|
|
|||||||
|---|---|---|---|---|---|---|---|---|---|---|---|---|---|
| | | | | | | | | | | | | | |
|
NAME |
2017 YEAR END SALARY ($) |
MIP TARGET (%)(1) |
MIP TARGET ($) |
MIP PAYOUT (%)(2) |
% OF YEAR IN ROLE |
MIP PAYOUT ($) |
|||||||
| | | | | | | | | | | | | | |
Young |
$1,150,000 | 150% | $1,725,000 | 65.3% | 100% | $1,126,598 | |||||||
| | | | | | | | | | | | | | |
Ellen |
624,000 | 90% | 561,600 | 65.3% | 100% | 366,781 | |||||||
| | | | | | | | | | | | | | |
Collins |
627,000 | 85% | 532,950 | 49.7% | 100% | 264,610 | |||||||
| | | | | | | | | | | | | | |
Johnston |
627,000 | 85% | 532,950 | 93.6% | 100% | 498,628 | |||||||
| | | | | | | | | | | | | | |
Hancock(3) (EVP, HR) |
409,500 | 70% | 286,650 | 65.3% | 47% | 89,244 | |||||||
| | | | | | | | | | | | | | |
Hancock(3) (CEO, Bai Brands) |
500,000 | 75% | 375,000 | 65.3% | 53% | 128,163 | |||||||
| | | | | | | | | | | | | | |
- (1)
- MIP Target % is multiplied times the 2017 Year End Salary to determine MIP Target.
- (2)
- MIP Payout % is multiplied times the MIP Target to determine MIP Payout.
- (3)
- In accordance with the terms of our MIP plan. Mr. Hancock's bonus payout is based on his ending salary and MIP target in each of the roles he served in during 2017.
28
WHY THREE LTI VEHICLES?
We use a mix of three different LTI vehicles — PSUs, RSUs, and options — to align executive pay outcomes to stockholder returns. Each of the LTI vehicles carries its own unique advantages and our "portfolio" approach to LTI allows us to capture the benefits of each one.
In addition to motivating executives to grow the stock price, using three vehicles creates the appropriate balance between the various performance objectives, which are aligned with stockholder interests:
| |
|
|
||
|---|---|---|---|---|
| | | | | |
|
LTI VEHICLE |
INCENTIVE OBJECTIVE |
EXPLANATION |
||
| | | | | |
| PSUs | Execute against clearly defined financial objectives | PSU awards require achievement of a combination of net income growth and cash flow yield to secure a payout | ||
| | | | | |
| RSUs |
Retention during periods of macro-economic or industry specific distress Shareholder alignment |
RSUs will retain some tangible value even during periods of falling stock prices and low MIP and PSU payouts Participants experience same stock price changes as investors |
||
| | | | | |
| Options | Take prudent risks to grow the stock price | Leveraged vehicle that magnifies participant's gains when stock price appreciates | ||
| | | | | |
2017 LTI Vehicle Details
Our 2017 LTI award details are outlined below. The Compensation Committee believes that these awards to NEOs will focus attention on building stockholder value over the long-term, reinforce the importance of their roles as stewards of the business, and help to retain the executives.
The following provides more detail about the various award programs:
| |
|
|
|
|||
|---|---|---|---|---|---|---|
| | | | | | | |
|
LTI VEHICLES |
LTI MIX |
BRIEF DESCRIPTION |
VESTING AND EXERCISE RESTRICTIONS |
|||
| | | | | | | |
| PSUs | 50% | • PSU represents an opportunity to receive one share of stock • PSUs are credited with dividend equivalents reinvested on dividend payment date • Dividend equivalents are paid only on PSU shares that vest based on performance |
• PSUs vest based on achievement against pre-determined performance targets • Performance period is 3 years, with cliff vesting |
|||
| | | | | | | |
| RSUs | 30% | • RSU represents an opportunity to receive one share of stock • RSUs are credited with dividend equivalents reinvested on dividend payment date |
• Cliff vesting after 3 years |
|||
| | | | | | | |
| Options | 20% | • Exercise price is equal to the closing market price of our common stock on the grant date • Repricing of outstanding awards is prohibited without stockholder approval |
• Pro-rata vesting over 3 years • Option may be exercised up to 10 years from grant |
|||
| | | | | | | |
RSUs vest 100% after 3 years, compared to 33% per year for options, in order to better reflect the retention objective of RSUs.
29
PSU Program — Internal Return Measurement Structure and Results
Our Internal Return (iR) performance measure, which is the primary measure used for the PSU program, is summarized below.
2015 PSU Cycle (2015-2017 Fiscal Years)
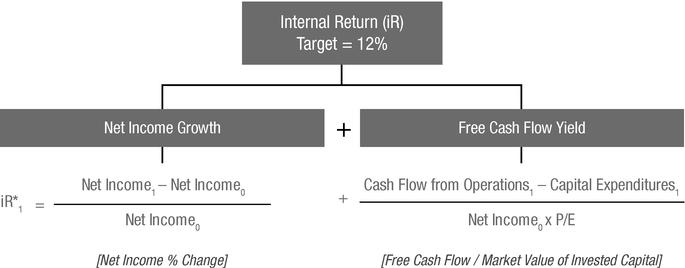
- *
- 0 and 1 subscripts refer to prior year (0) and current year (1) financials. Net Income, Cash Flow from Operations and Free Cash Flow are calculated on a Core basis, adjusted for certain items. For detailed definitions of the terms used in the Internal Return calculation refer to Appendix A to this Amendment.
| | | | | | | | | | | | | |
|
IR YEAR |
FY COMPARISON |
NET INCOME GROWTH (A) |
|
FREE CASH FLOW YIELD (B) |
|
INTERNAL RETURN (A+B) |
||||||
|---|---|---|---|---|---|---|---|---|---|---|---|---|
| | | | | | | | | | | | | |
iR1 |
2015 vs. 2014 | 7.71% | 7.04% | 14.75% | ||||||||
| | | | | | | | | | | | | |
iR2 |
2016 vs. 2015 | 6.27% | 6.36% | 12.63% | ||||||||
| | | | | | | | | | | | | |
iR3 |
2017 vs. 2016 | –2.02% | + | 6.14% | = | 4.12% | ||||||
| | | | | | | | | | | | | |
|
Average | 3.99% | 6.51% | 10.50% | ||||||||
| | | | | | | | | | | | | |
The average Internal Return of 10.50% resulted in a payout of 81.25% of target based on the leverage structure shown above.
- •
- Net Income (NI), Cash Flow from Operations (CFFO) and Capital Expenditures (CapEx) are updated annually
during each three-year performance cycle.
- •
- Each three-year PSU performance period has a fixed P/E ratio. The P/E is fixed as of the end of the year immediately preceding the first year of each performance period.
30
PSU Plan Design Analysis
| |
|
|
|---|---|---|
| | | |
|
PLAN DESIGN ASPECT |
IMPACT ON PARTICIPANTS' INCENTIVES |
|
| | | |
| Annual resetting of NI in the NI Growth and Free Cash Flow (Core) (FCF) Yield denominators | • Requires continuous improvement in the numerator (NI Growth and FCF) to achieve target performance in a rising earnings scenario, which has been the case during the life of this program |
|
| | | |
| Free Cash Flow (Core) yield denominator (NI × P/E) simulates market value of invested capital at cycle start | • Fixing P/E and NI in the year before the performance period starts focuses participants on the variables directly within their control |
|
| | | |
| Embedding continuous improvement requirement in iR performance measurement | • Supports our initiative to quickly increase profitability through efficiency gains |
|
| | | |
| Calculating results based on a three-year average | • Ensure that performance during every year of the cycle impacts results |
|
| | | |
Internal Return as the PSU Metric
WHY INTERNAL RETURN?
Correlation analysis between TSR and various performance metrics demonstrated that over long periods iR has the highest correlation with TSR out of an exhaustive list of metrics.
iR also provides for direct management line-of-sight to the performance being measured — earnings growth, conversion of earnings into cash, and conservative capital management.
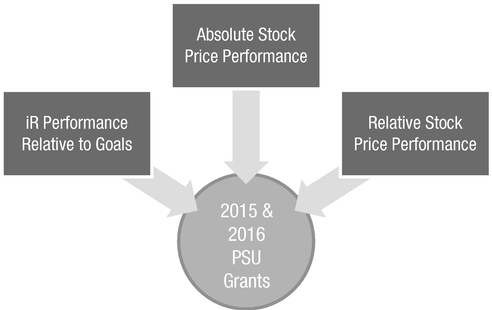
At a high-level, the iR formula is a close approximation of our stockholder value creation process:
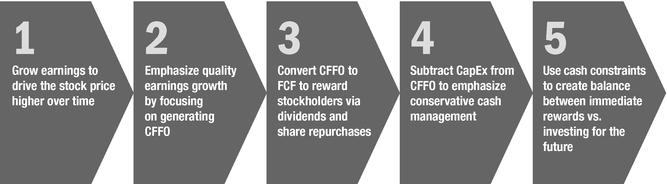
31
Role of Internal Return in Performance Measurement Framework
We believe that corporate performance is too complex to be assessed through a single metric, or type of metric, and requires a holistic view. When evaluating incentive plan design we view the MIP and LTI plans as complementary elements of our total compensation package. In designing our incentive plans we strive to reflect this balanced perspective and have largely achieved that goal.
BALANCED PERFORMANCE MEASUREMENT
Our incentive plan metrics (MIP and PSUs):
- •
- Draw on three financial statements (Income, Cash Flow and Balance Sheet)
- •
- Account for both absolute and relative stock price performance (PSUs, RSUs and Options)
- •
- Cover interlocking performance periods ranging from 1 year (MIP) to 3 years (PSUs and RSUs), and up to 10 years (Option term)
PSU Goal Setting and Leverage Structure
PSU iR goals at threshold, target and maximum were set based on historical performance data collected from peer companies and the S&P 500 over both the relatively recent past (since 2000) and a longer, multi-decade period.
| |
|
|
|
|
||||
|---|---|---|---|---|---|---|---|---|
| | | | | | | | | |
| |
|
|
CORRESPONDING PERFORMANCE LEVEL IN EXTERNAL MARKET | |||||
| |
iR TARGET |
|
||||||
|
PERFORMANCE CONDITION |
PAYOUT |
PEERS |
S&P 500 |
|||||
| | | | | | | | | |
Threshold |
8% | 50% | Below Median | Below Median | ||||
| | | | | | | | | |
Target |
12% | 100% | 50th to 60th Percentile | Median | ||||
| | | | | | | | | |
Maximum |
16% | 200% | 65th to 75th Percentile | 65th to 75th Percentile | ||||
| | | | | | | | | |
Applying historical data for future periods was judged as reasonable in light of near-term performance expectations since program inception.
Commencing in 2015, relative stock price performance, as measured by rTSR, became a modifier of PSU payouts. In 2017, the Free Cash Flow (Core) yield component of iR was eliminated. In its place we used a Free Cash Flow (Core) modifier that reduces payouts if free cash flow lags profits. Starting with the 2018 grant the cash flow measurement was removed to further simplify the program. See discussion of both changes on page 35.
OUR PSU GOALS ARE CHALLENGING
- •
- Historical data, on which our goals are based, covered periods of significantly higher GDP growth both in the U.S. and globally
relative to current norms, and
- •
- Above-median performance, relative to peer historical norms, is required to earn a target payout
32
PSUs Pay-for-Performance
PSU cycles pay out in February following the end of the performance period. Given the long-term nature of this program and the associated goal setting approach, pay-for-performance alignment can only be adequately judged over time. Over the last 5 years we have observed strong directional alignment between payouts and TSR compared to our peers.
PSUs — Historical Payouts and Pay-for-Performance
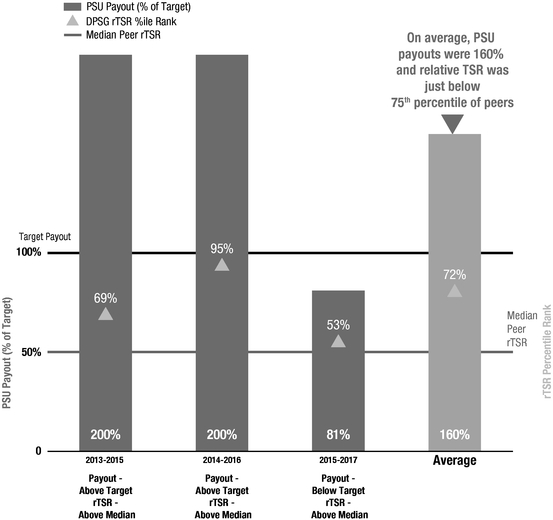
PSUs Earned By NEOs — 2015 to 2017 Cycle
| |
|
|
|
||||
|---|---|---|---|---|---|---|---|
| | | | | | | | |
|
NAME |
PSUs GRANTED(1) |
PAYOUT (%) |
SHARES EARNED(2) |
||||
| | | | | | | | |
Larry D. Young |
40,682 | | 81.25% | 33,054 | |||
| | | | | | | | |
Martin M. Ellen |
9,874 | 81.25% | 8,022 | ||||
| | | | | | | | |
Rodger L. Collins |
9,153 | | 81.25% | 7,436 | |||
| | | | | | | | |
James J. Johnston |
9,153 | 81.25% | 7,436 | ||||
| | | | | | | | |
Phillip L. Hancock |
5,373 | | 81.25% | 4,365 | |||
| | | | | | | | |
- (1)
- Includes dividend equivalent accrued through December 31, 2017 ex-dividend dates.
- (2)
- Rounded down to nearest whole share.
33
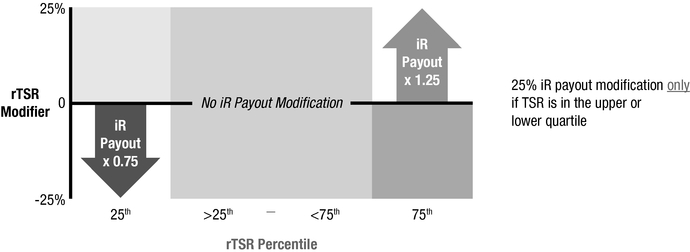
Addition of rTSR modifier to PSUs
Beginning with the 2015 PSU grant (2015-2017 performance cycle), we added a rTSR modifier to the existing iR design. The modifier functions as follows:
- •
- If rTSR at the end of the three-year PSU cycle falls between the 25th and
75th percentiles of our peers, participants will receive a payout based solely on iR performance
- •
- 25% rTSR modifier is triggered only for cycles when rTSR is either in the bottom or top quartile of TSR peers
The rTSR peer group was selected based on the same criteria as used for our compensation peer group as well as likely competitors for investor funds operating in the same or related industries. Based on these considerations, the 2015 PSU rTSR peer group included all of the compensation peers in place at the time of the grant and the following companies:
| | | |
| PepsiCo, Inc. | Monster Beverage Corporation | |
| | | |
| The Coca-Cola Company | Coca-Cola Bottling Co. Consolidated | |
| | | |
| Coca-Cola Enterprises, Inc. | National Beverage Corp. | |
| | | |
| Cott Corporation | ||
| | | |
WHY rTSR AS A MODIFIER AND NOT A STAND-ALONE METRIC?
- •
- Ensure that iR remains our core metric with line-of-sight and clear operational goals for participants
- •
- Reinforce the importance of iR as our core metric by using the iR payout as a starting point for calculating the magnitude of rTSR modification
rTSR for the 2015-2017 PSU performance period was between the 25th and 75th percentile of peers, therefore, in accordance with the terms of our plan, rTSR modifier was not applied.
Role of rTSR Modifier in the PSU Program
We added a rTSR modifier to our PSU program to prevent significant disconnects between PSU payouts and TSR results and to introduce a more balanced performance perspective.
34
Under our design the value of PSU payouts to participants is impacted by the following factors:
Summary of 2017 and 2018 Program Changes
Starting with 2017 grants, we've made a simplification to the program. The Free Cash Flow (Core)1 yield component was eliminated. In its place we used a cash flow governor, which will reduce payouts by 25% of amount earned, if Free Cash Flow (Core) falls below 95% of Net Income1 over the performance period.
Program simplification was based on the following considerations:
- •
- Conversion of earnings into cash has reached a steady state, but the Company wishes to ensure participants
remain focused on maintaining an efficient cash conversion rate
- •
- Correlation between TSR and Net Income growth only slightly trails the correlation between iR and TSR
The threshold of 95% allows management the necessary capital expenditure flexibility to reinvest in the business to ensure its long-term success. The 95% threshold is not a target, but rather the cash conversion level below which payout reductions are imposed.
For 2018 grants we further simplified the program by eliminating the cash flow governor. While efficient cash flow conversion remains an important priority to fund dividends and share repurchases, our stock price and the rTSR modifier already make PSU, RSU and stock option outcomes highly sensitive to changes in cash flow generation.
- 1
- Free Cash Flow and Net Income are calculated on a Core Earnings basis, adjusted for certain items
35
Our benefit and perquisites programs are based upon an assessment of competitive market factors and a determination of what is needed to attract and retain high caliber executives. The business rationale for providing these benefits and perquisites is to minimize distractions that can arise from complex financial planning and security needs, travel logistics and health related problems.
Our primary benefits for executive officers include participation in our broad-based retirement and health and welfare plans.
We provide our NEOs with the following executive level benefits and perquisites:
| |
|
|
|---|---|---|
| | | |
|
BENEFITS/PERQUISITES |
EXPLANATION |
|
| | | |
| Supplemental Savings Plan | The only nonqualified deferred compensation plan sponsored by us for NEOs is the Supplemental Savings Plan (SSP), a non-tax qualified defined contribution plan. | |
The SSP is for employees who are actively enrolled in the Savings Incentive Plan (SIP) and whose deferrals under the SIP are limited by the Code compensation limitations. Employees may elect to defer up to 75% of their base salary over the compensation limit (established in the Code) to the SSP, and we match 100% of the first 4% of base salary that is contributed by employees. All SSP funds, including company contributions, are immediately fully vested. |
||
| | | |
| Executive Service Allowance | All NEOs receive an annual allowance that can be used to obtain financial planning and tax preparation services and other related benefits. Executives pay tax on this allowance. | |
| | | |
| Automobile Allowance | The automobile allowance benefit gives eligible executives an opportunity to use their car for both business and personal use in an efficient manner. Executives pay tax on this allowance. | |
| | | |
| Executive Long-term Disability | Supplemental to our group disability program, the executive long-term disability program provides a benefit of up to 60% of total target compensation, up to a maximum amount of $30,000 per month. Total target compensation equals the sum of base pay and cash incentive compensation. | |
| | | |
| Annual Physicals | Our NEOs have the opportunity to undergo executive physicals on an annual basis to identify and treat health conditions at an early stage, maximizing the chance of a quick recovery. | |
| | | |
| Personal Corporate Aircraft Use | For security and efficiency reasons the CEO uses the corporate aircraft for all air travel. The NEOs do not use the corporate aircraft for personal travel, unless approved by the CEO. | |
| | | |
36
We have severance protections addressing termination upon a CIC, non-CIC related involuntary termination, death, disability and retirement. Benefits upon these key termination events are summarized below, with detailed descriptions provided in "Historical Executive Compensation Information — Post-Termination Compensation" beginning on page 49.
PURPOSE OF SEVERANCE PROTECTIONS
We believe severance benefits remove potential challenges to maximizing stockholder value by enabling DPSG to accomplish the following:
- •
- Provide a competitive benefit when attempting to recruit executives externally
- •
- Address a major risk for external candidates considering joining a new employer, particularly one focused on an industry facing significant headwinds
- •
- Focus executives on the best interests of stockholders, in the event of a change-in-control, despite the pending transaction posing significant career uncertainty
Based on feedback from certain stockholders in 2014, the Company has committed to not expanding CIC excise tax gross-up protections beyond the current six participants.
ROLE OF THE COMPENSATION COMMITTEE
The Compensation Committee establishes and monitors our overall compensation strategy and is responsible for setting the compensation of the CEO and all other executive officers in consultation with the other independent directors. The Chairperson of the Compensation Committee also regularly reports on committee actions to the Board of Directors.
For a more complete description of the responsibilities of the Compensation Committee, see the charter for the Compensation Committee posted on our website at www.drpeppersnapplegroup.com under the Investors — Corporate Governance — Committee Charters — Compensation Committee Charter captions.
ROLE OF COMPENSATION CONSULTANT
The Compensation Committee has retained Mercer as its outside executive compensation consultant to advise on executive compensation matters. Mercer regularly attends Compensation Committee meetings and reports directly to the Committee on matters relating to compensation for our executive officers, including the CEO. The Company also uses Mercer for other services that are unrelated to executive compensation. If the Company wishes to engage Mercer on a significant project, then management will review the proposed engagement with the Compensation Committee prior to Mercer's engagement by the Company.
The CEO develops preliminary compensation recommendations for our executive officers (other than the CEO) and provides these recommendations to the Compensation Committee. Management is responsible for the administration of the compensation programs once Compensation Committee decisions are finalized.
37
COMPENSATION GOVERNANCE POLICIES AND PROVISIONS
Equity Award Procedures
We have established equity award procedures to develop a consistent practice for granting equity-based awards. Under these procedures, the Board, with respect to equity awards to non-executive directors, and the Compensation Committee, with respect to employee awards, may grant equity awards at its first regularly-scheduled meeting in each calendar year (or at any special meeting, so long as this special meeting occurs on or before March 2 of each calendar year). The effective date of these equity awards will be March 2 (or if not a NYSE trading day, the first NYSE trading day after March 2). The Compensation Committee may also make equity awards to new hires, employees receiving promotions, employees receiving retention grants and persons becoming employees as a result of an acquisition at any regularly scheduled meeting or at any special meeting called for that purpose.
The Board may also make equity awards to persons who become new directors at any regularly scheduled meeting or at any special meeting called for that purpose. The Special Award Committee may make awards to employees at any time, but the effective date of such awards is the first business day of the next succeeding month after the Special Award Committee selects employees for awards. Awards by the Special Award Committee are also governed by the limitations established by the Compensation Committee.
Our equity award procedures require that the exercise or grant price of an equity award equal the closing market price of our common stock on the effective date of the award. Our procedures also set forth the procedural and control requirements for granting equity awards.
Executive Stock Ownership Guidelines
In 2010, the Company adopted stock ownership requirements, as described below. Executives may be required to retain at least 50% of net, after-tax vested RSUs and PSUs until the ownership requirement is met.
| | | | | | | |
|
EXECUTIVE |
OWNERSHIP REQUIREMENT |
TIME TO COMPLY |
TYPES OF OWNERSHIP COUNTED TOWARD REQUIREMENT |
|||
|---|---|---|---|---|---|---|
| | | | | | | |
CEO |
6X salary | Later of 5 years after | • Shares owned directly | |||
CFO, Business Unit Presidents |
4X salary | becoming subject to | • Unvested RSUs | |||
Other EVPs |
3X salary | guideline or 12/31/2015 | ||||
| | | | | | | |
Each calendar year, executive ownership is valued based on the average daily closing stock price. All of our NEOs met these requirements as of the record date. There are varying ownership multiples required for other officers of the Company.
Tally Sheets
The Compensation Committee reviews tally sheets annually, prior to making compensation decisions for the upcoming year. Tally sheets provide a concise summary of the various compensation elements, demonstrate the performance sensitivity of our compensation program, and quantify the value of unvested equity and severance benefits under key termination scenarios.
Insider Trading Policy
Our Insider Trading Policy prohibits employees from trading our securities or securities of any other company when the employee possesses or has knowledge of material information that is not generally known or available to the public about the Company or such other company. Among other provisions, the Insider Trading Policy also prohibits directors, officers and employees from entering into hedge transactions which would normally be entered into if an investor thought the market price for the shares was going to decline.
38
Clawback Policy
In 2011, the Compensation Committee approved a Clawback Policy (the "Clawback Policy") in advance of regulations to be promulgated by the NYSE under the Investor Protection and Securities Reform Act of 2010. If necessary, the provisions of the Clawback Policy will be reconsidered when the final regulations are published. The Clawback Policy may be triggered by a financial restatement (other than to comply with changes in applicable accounting principles), or commission of fraud or willful misconduct by an incentive award recipient. If triggered, the policy provides for recovery of incentive compensation paid in excess of the incentive compensation that would have been paid based on the restated financials, or recovery of incentives paid during the period of fraud or willful misconduct. The Company may also seek any additional equitable or legal remedies under facts which give rise to a claim by the Company under the Clawback Policy.
Tax Treatment
Under Section 162(m) of the Internal Revenue Code of 1986, as amended (the "Code"), as in effect prior to the passage of the Tax Cuts and Jobs Act of 2017, compensation paid to the CEO and the other three most highly paid executives (excluding the Chief Financial Officer) is deductible only if the compensation is less than $1 million or the compensation is performance based. The applicable performance-based awards granted under the MIP and the Omnibus Stock Incentive Plan of 2009 are designed with the intent to comply with Section 162(m) of the code and be fully tax deductible for us. However, the Compensation Committee reserves the right to decide to pay executive officers amounts that may not be deductible under Section 162(m), if the Compensation Committee determines that decision is in the best interests of the Company and its stockholders.
At the request of our Compensation Committee, in 2017 Mercer reviewed the Company's compensation programs and related governance provisions and practices in connection with the preparation of this Amendment to determine if disclosure was required under Item 402(s) of SEC Regulation S-K.
Mercer concluded that DPSG compensation programs are aligned to the interests of its stockholders, provide for appropriate pay for performance alignment, contain numerous risk mitigating features and do not promote unnecessary and excessive risk. Based on Mercer's assessment, the Compensation Committee believes that the Company's compensation programs do not provide incentives for excessive risk-taking and, therefore, do not encourage employees to take unreasonable risks relating to the Company's business.
39
REPORT OF THE COMPENSATION COMMITTEE ON EXECUTIVE COMPENSATION
Ms. Szostak (Chairperson) and Ms. Shive served on the Compensation Committee for all of 2017; Ms. Roché retired from the Board in 2017, but served on the Compensation Committee until February 28, 2017; and Mr. Gutiérrez served on the Compensation Committee from March 1, 2017 through the remainder of 2017. In fulfilling its responsibilities, the Compensation Committee reviewed and discussed with management the Compensation Discussion and Analysis set forth in this Amendment.
In reliance on the review and discussions referred to above, the Compensation Committee recommended to the Board that the Compensation Discussion and Analysis be included in this Amendment.
| Submitted by the Compensation Committee of the Board |
||
M. Anne Szostak, Chairperson José M. Gutiérrez Dunia A. Shive |
THE ABOVE REPORT OF THE COMPENSATION COMMITTEE WILL NOT BE DEEMED TO BE SOLICITING MATERIAL OR TO BE FILED WITH OR INCORPORATED BY REFERENCE INTO ANY FILING BY US UNDER THE SECURITIES ACT OF 1933 OR THE EXCHANGE ACT, EXCEPT TO THE EXTENT THAT WE SPECIFICALLY INCORPORATE SUCH REPORT BY REFERENCE.
40
COMPENSATION COMMITTEE INTERLOCKS
Ms. Szostak (Chairperson) served on the Compensation Committee for all of 2017. Ms. Roché retired from the Board in May 2017, but served on the Compensation Committee until February 28, 2017. Mr. Gutiérrez served on the Compensation Committee from March 1, 2017 through the remainder of 2017. No person who was a member of the Compensation Committee during any part of 2017 was an officer or employee of ours or any of our subsidiaries. None of our executive officers served on the board of directors or on the compensation committee of any other entity, for which any officers of such other entity served either on our Board or on our Compensation Committee.
41
HISTORICAL EXECUTIVE COMPENSATION INFORMATION
The executive compensation disclosure contained in this section reflects compensation information for 2017 for our Named Executive Officers ("NEOs").
The following table sets forth information regarding the compensation earned by NEOs in fiscal years 2015, 2016 and 2017.
Name and Principal Position
|
Year | Salary ($) |
Bonus ($) |
Stock Awards ($)(1) |
Option Award ($)(2) |
Non-Equity Incentive Plan Compensation ($)(3) |
Change In Pension Value And Nonqualified Deferred Compensation Earnings ($)(4) |
All Other Compensation ($)(5) |
Total ($) |
|||||||||||||||||||
|---|---|---|---|---|---|---|---|---|---|---|---|---|---|---|---|---|---|---|---|---|---|---|---|---|---|---|---|---|
Larry D. Young |
2017 | $ | 1,150,000 | — | $ | 4,922,265 | $ | 1,199,997 | $ | 1,126,598 | $ | 37,356 | $ | 484,931 | $ | 8,921,147 | ||||||||||||
President & CEO |
2016 | 1,132,692 | — | 4,799,884 | 1,199,993 | 2,314,605 | 16,052 | 468,404 | 9,931,631 | |||||||||||||||||||
|
2015 | 1,075,000 | — | 4,799,916 | 1,199,992 | 2,421,814 | 39,795 | 379,721 | 9,916,238 | |||||||||||||||||||
Martin M. Ellen |
2017 |
$ |
620,635 |
— |
$ |
1,279,761 |
$ |
311,998 |
$ |
366,781 |
— |
$ |
135,121 |
$ |
2,714,296 |
|||||||||||||
Chief Financial |
2016 | 604,808 | — | 1,223,058 | 305,793 | 738,460 | — | 146,618 | 3,018,737 | |||||||||||||||||||
Officer |
2015 | 579,846 | — | 1,164,953 | 291,241 | 787,371 | — | 115,734 | 2,939,145 | |||||||||||||||||||
Rodger L. Collins |
2017 |
$ |
622,731 |
— |
$ |
1,189,522 |
$ |
289,991 |
$ |
264,610 |
— |
$ |
128,079 |
$ |
2,494,933 |
|||||||||||||
Pres. Packaged |
2016 | 604,462 | — | $ | 1,159,960 | $ | 290,000 | $ | 663,134 | — | 128,192 | 2,845,747 | ||||||||||||||||
Beverages |
2015 | 609,154 | (6) | — | 1,079,892 | 269,998 | 812,551 | — | 119,942 | 2,891,537 | ||||||||||||||||||
James J. Johnston |
2017 |
$ |
622,019 |
— |
$ |
1,189,522 |
$ |
289,991 |
$ |
498,629 |
$ |
93,897 |
$ |
210,860 |
$ |
2,904,918 |
||||||||||||
Pres. Beverage |
2016 | 604,462 | — | 1,159,960 | 290,000 | 714,546 | 43,553 | 201,500 | 3,014,020 | |||||||||||||||||||
Concentrates & |
2015 | 587,077 | — | 1,079,892 | 269,998 | 683,648 | 77,691 | 176,794 | 2,875,100 | |||||||||||||||||||
Latin America |
||||||||||||||||||||||||||||
Beverages |
||||||||||||||||||||||||||||
Phillip L. Hancock(7) |
2017 |
$ |
451,519 |
— |
$ |
959,430 |
$ |
172,991 |
$ |
217,407 |
— |
$ |
373,359 |
$ |
2,174,706 |
|||||||||||||
CEO, Bai Brands |
||||||||||||||||||||||||||||
- (1)
- The
amounts reported in the Stock Awards column reflect the grant date fair value associated with awards of DPSG RSUs and DPSG PSUs to each of the NEOs (amounts do
not include any DPSG RSUs and DPSG PSUs that have been paid as dividend equivalents subsequent to the date of the award). The value of the DPSG PSUs awarded is subject to the achievement of certain
performance criteria over a three-year performance period (see "Compensation Discussion and Analysis—Long-Term Incentive Awards" beginning on page 29.). Even though the awards may be
forfeited, the amounts do not reflect this contingency. Assumptions used to calculate these amounts (disregarding forfeiture assumptions) are included in Note 9 "Stock-Based Compensation," to
our Consolidated Financial Statements, which are included in Item 8 of the Original Filing. For further information on the stock awards granted in fiscal year 2017, see "—Grants of
Plan-Based Awards" beginning on page 44.
- (2)
- The
amounts reported in the Option Awards column represent the grant date fair value associated with option grants to each of the NEOs. Even though the awards may be
forfeited, the amounts do not reflect this contingency. Assumptions used to calculate these amounts (disregarding forfeiture assumptions) are included in Note 9 "Stock-Based Compensation" to
our Consolidated Financial Statements, which are included in Item 8 of the Original Filing. For further information on the stock option grants awarded in fiscal year 2017, see
"—Grants of Plan-Based Awards" on page 44.
- (3)
- The
amounts reported in the Non-Equity Incentive Plan Compensation column reflect the amounts earned by each NEO under the Company's MIP.
- (4)
- The
amounts reported in the Nonqualified Deferred Compensation Earnings column represent an estimate of the aggregate annual change in the actuarial present value of
accumulated benefits under the Personal Pension Account Plan and the Pension Equalization Plan (as applicable), as described in more detail in the "—Pension Benefits" beginning on
page 46. The change in the actuarial present value of the accumulated benefits under the plans was determined in accordance with GAAP. Assumptions used to calculate these amounts are included
in Note 6 "Employee Benefit Plans" to our Consolidated Financial Statements, which are included in Item 8 of the Original Filing.
- (5)
- Amounts reported in the All Other Compensation column reflect other compensation for each NEO, including, but not limited to, (i) the incremental cost to the Company of all perquisites and other personal benefits, (ii) the amount of any tax reimbursements, (iii) the amounts contributed by the Company to the tax-qualified defined contribution plans and non-tax qualified contribution plans and (iv) the amount of any insurance premiums paid by the Company.
42
- (6)
- 2015
payroll cycle for Mr. Collins contained 27 paychecks instead of the usual 26 paychecks. The additional paycheck resulted from the acceleration of a
payroll date of 1/1/2016 to 12/31/2015 in order to avoid a delayed funds disbursement due to 1/1/2016 being a bank holiday. Absent this infrequent acceleration, Mr. Collins salary for the year
would have been $587,077.
- (7)
- Mr. Hancock was not an NEO in 2016 or 2015. In accordance with the SEC disclosure requirements, Mr. Hancock's compensation disclosure is provided only for the year in which he was an NEO.
"All Other Compensation" for fiscal year 2017 is summarized as follows:
Name
|
Automobile Allowance ($) |
Service Allowance ($) |
Disability Income Premiums ($)(a) |
Company Contributions ($)(b) |
Corporate Aircraft ($)(c) |
Relocation Assistance ($)(d) |
Executive Physicals ($) |
Total ($) |
|||||||||||||||||
|---|---|---|---|---|---|---|---|---|---|---|---|---|---|---|---|---|---|---|---|---|---|---|---|---|---|
Larry D. Young |
35,100 | 24,000 | 7,421 | 380,498 | 37,912 | — | — | 484,931 | |||||||||||||||||
Martin M. Ellen |
31,200 | 20,000 | 10,460 | 59,578 | 9,946 | — | 3,937 | 135,121 | |||||||||||||||||
Rodger L. Collins |
28,600 | 19,000 | 8,608 | 67,398 | 1,631 | — | 2,842 | 128,079 | |||||||||||||||||
James J. Johnston |
28,600 | 19,000 | 5,107 | 156,952 | 1,201 | — | — | 210,860 | |||||||||||||||||
Phillip L. Hancock |
24,700 | 14,000 | 6,780 | 41,066 | 1,564 | 285,249 | — | 373,359 | |||||||||||||||||
- (a)
- Includes
the gross-up for taxes to be paid by the NEO on the premium that was included in the NEO's income.
- (b)
- The
amounts reported in the Company Contributions column represent our contributions to the tax-qualified defined contribution plans and non-tax qualified defined
contribution plans. The contributions to the tax qualified defined contribution plans for 2017 are as follows: $33,270 for Mr. Young, $18,900 for Messrs. Ellen, Collins and Hancock and
$35,970 for Mr. Johnston. The contributions to the non-tax qualified defined contributions plans for 2017 are as follows: $347,228 for Mr. Young, $40,678 for Mr. Ellen, $48,498
for Mr. Collins, $120,982 for Mr. Johnston, and $22,166 for Mr. Hancock.
- (c)
- For
SEC purposes, the cost of personal use of a corporate aircraft is calculated based on the aggregate incremental cost to the Company. We calculated the aggregate
incremental cost using estimated variable costs of operating the aircraft. Fixed costs which do not change based on usage, such as pilot salaries, depreciation of aircraft and cost of maintenance are
excluded.
- (d)
- Payment made to Mr. Hancock to assist with his relocation from Plano, TX, where Company headquarters are based, to New Jersey, where Bai Brands is based.
43
The following table sets forth information regarding equity plan awards and non-equity incentive plan awards by us to our NEOs in fiscal year 2017. For a discussion of the material terms of these awards, see "Compensation Discussion and Analysis—Long-Term Incentive Awards" beginning on page 29 and "—Summary Compensation Table" beginning on page 42.
| |
|
|
|
|
|
|
|
All Other Stock Awards: Number of Shares of Stock or Units (#)(3) |
All Other Options Awards: Number of Securities Underlying Option (#)(4) |
|
|
|||||||||||||||||||||||
|---|---|---|---|---|---|---|---|---|---|---|---|---|---|---|---|---|---|---|---|---|---|---|---|---|---|---|---|---|---|---|---|---|---|---|
| |
|
Estimated Future Payouts Under Non-Equity Incentive Plan Awards(1) |
Estimated Future Payouts Under Equity Incentive Plan Awards(2) |
Exercise or Base Price of Option Awards ($/Sh)(5) |
Grant Date Fair Value of Stock and Option Awards |
|||||||||||||||||||||||||||||
Name
|
Grant Date |
Threshold ($) |
Target ($) |
Maximum ($) |
Threshold (#) |
Target (#) |
Maximum (#) |
|||||||||||||||||||||||||||
Larry Young |
$ | 431,250 | $ | 1,725,000 | $ | 3,450,000 | ||||||||||||||||||||||||||||
|
3/2/2017 | 19,023 | $ | 1,799,956 | ||||||||||||||||||||||||||||||
|
3/2/2017 | 15,852 | 31,705 | 63,410 | $ | 3,122,308 | ||||||||||||||||||||||||||||
|
3/2/2017 | 120,616 | $ | 94.62 | $ | 1,199,997 | ||||||||||||||||||||||||||||
Martin Ellen |
$ | 140,400 | $ | 561,600 | $ | 1,123,200 | ||||||||||||||||||||||||||||
|
3/2/2017 | 4,946 | $ | 467,991 | ||||||||||||||||||||||||||||||
|
3/2/2017 | 4,121 | 8,243 | 16,486 | $ | 811,771 | ||||||||||||||||||||||||||||
|
3/2/2017 | 31,360 | $ | 94.62 | $ | 311,998 | ||||||||||||||||||||||||||||
Rodger Collins |
$ | 133,238 | $ | 532,950 | $ | 1,065,900 | ||||||||||||||||||||||||||||
|
3/2/2017 | 4,597 | $ | 434,968 | ||||||||||||||||||||||||||||||
|
3/2/2017 | 3,831 | 7,662 | 15,324 | $ | 754,554 | ||||||||||||||||||||||||||||
|
3/2/2017 | 29,148 | $ | 94.62 | $ | 289,991 | ||||||||||||||||||||||||||||
James Johnston |
$ | 133,238 | $ | 532,950 | $ | 1,065,900 | ||||||||||||||||||||||||||||
|
3/2/2017 | 4,597 | $ | 434,968 | ||||||||||||||||||||||||||||||
|
3/2/2017 | 3,831 | 7,662 | 15,324 | $ | 754,554 | ||||||||||||||||||||||||||||
|
3/2/2017 | 29,148 | $ | 94.62 | $ | 289,991 | ||||||||||||||||||||||||||||
Phillip L. Hancock |
$ | 83,221 | $ | 332,882 | $ | 665,765 | ||||||||||||||||||||||||||||
|
3/2/2017 | 2,742 | $ | 259,448 | ||||||||||||||||||||||||||||||
|
3/2/2017 | 2,285 | 4,570 | 9,140 | $ | 450,054 | ||||||||||||||||||||||||||||
|
3/2/2017 | 17,388 | $ | 94.62 | $ | 172,991 | ||||||||||||||||||||||||||||
|
7/7/2017 | 2,800 | $ | 249,928 | ||||||||||||||||||||||||||||||
- (1)
- The
amounts reported in the Estimated Future Payouts Under Non-Equity Incentive Plan Awards column represent the potential payouts of annual cash incentive awards
granted to our NEOs in fiscal year 2017 under the MIP subject to the achievement of certain performance measures. The actual amount of the awards made to the NEOs and paid in cash is included in the
Non-Equity Incentive Plan Compensation column of the Summary Compensation Table.
- (2)
- Subject
to the achievement of certain performance criteria, represents the potential number of shares that may be issued to the NEO pursuant to the grant of DPSG PSU
awards made in fiscal year 2017 under the Omnibus Stock Incentive Plan of 2009 (see "Compensation Discussion and Analysis—Long-Term Incentive Awards" beginning on page 29.)
- (3)
- Represents
the number of shares subject to DPSG RSU awards made in fiscal year 2017 under the Omnibus Stock Incentive Plan of 2009. The DPSG RSU awards vest three
years from the grant date.
- (4)
- Represents
the number of shares subject to stock option grants made in fiscal year 2017 under the Omnibus Stock Incentive Plan of 2009. All options granted in fiscal
year 2017 to NEOs have a term of ten years from the grant date and vest one-third on the first, second and third anniversaries of the grant date, contingent on the NEO continuing his employment with
the Company through each date.
- (5)
- Represents the exercise price for the option awards, which were determined based on the closing market price of a share of our common stock on the date of grant.
For FY 2017, the annual total compensation for FY 2017 was $8,921,147 for our CEO, and $42,689 for the median employee. The resulting ratio of our CEO's pay to the pay of our Median Employee for FY 2017 is 209 to 1.
The median employee was identified using the gross annual compensation as of December 31, 2017 for all active employees on that date. The calculation of CEO's annual total compensation, used to determine the pay ratio, utilized the same methodology as that of "Total Compensation" shown for our CEO in the "Summary Compensation Table" on page 42 of this Amendment.
Our calculation includes all employees as of December 31, 2017. We applied FY2017 average exchange rates to compensation paid in Canadian and Mexican currencies—USD:MXN exchange rate of 18.913, and USD:CAD exchange rate of 1.298.
44
Outstanding Equity Awards at Fiscal Year End
The following table sets forth information regarding exercisable and unexercisable stock options and vested and unvested equity awards held by each NEO as of December 31, 2017. All such awards relate to shares of our common stock.
| |
Option Awards(1) | Stock Awards(2) | |||||||||||||||||||||||||||||
|---|---|---|---|---|---|---|---|---|---|---|---|---|---|---|---|---|---|---|---|---|---|---|---|---|---|---|---|---|---|---|---|
Name
|
Grant Date |
Number of Securities Underlying Unexercised Options (#) Exercisable |
Number of Securities Underlying Unexercised Options (#) Unexercisable |
Equity Incentive Plan Awards: Number of Securities Underlying Unexercised Unearned Options (#) |
Option Exercise Price ($) |
Option Expiration Date |
Number of Shares or Units of Stock That Have Not Vested (#)(3) |
Market Value of Shares or Units of Stock That Have Not Vested ($)(3) |
Equity Incentive Plan Awards: Number of Unearned Shares, Units or Other Rights That Have Not Vested(4)(#) |
Equity Incentive Plan Awards: Market or Payout Value of Unearned Shares, Units or Other Rights That Have Not Vested(4)($) |
|||||||||||||||||||||
Larry Young |
3/2/2015 | 86,768 | 43,383 | $ | 79.20 | 3/2/2025 | 24,409 | $ | 2,369,138 | 40,682 | $ | 3,948,595 | |||||||||||||||||||
|
3/2/2016 | 40,297 | 80,592 | $ | 91.98 | 3/2/2026 | 20,533 | $ | 1,992,933 | 34,222 | $ | 3,321,587 | |||||||||||||||||||
|
3/2/2017 | — | 120,616 | $ | 94.62 | 3/2/2027 | 19,505 | $ | 1,893,155 | 32,509 | $ | 3,155,324 | |||||||||||||||||||
Martin Ellen |
3/3/2014 |
29,224 |
— |
$ |
51.68 |
3/3/2024 |
— |
— |
— |
— |
|||||||||||||||||||||
|
3/2/2015 | 21,059 | 10,529 | $ | 79.20 | 3/2/2025 | 5,924 | $ | 574,983 | 9,873 | $ | 958,273 | |||||||||||||||||||
|
3/2/2016 | 10,270 | 20,536 | $ | 91.98 | 3/2/2026 | 5,231 | $ | 507,721 | 8,720 | $ | 846,363 | |||||||||||||||||||
|
3/2/2017 | — | 31,360 | $ | 94.62 | 3/2/2027 | 5,071 | $ | 492,191 | 8,452 | $ | 820,351 | |||||||||||||||||||
Rodger Collins |
3/3/2014 |
46,551 |
— |
$ |
51.68 |
3/3/2024 |
— |
— |
— |
— |
|||||||||||||||||||||
|
3/2/2015 | 19,523 | 9,761 | $ | 79.20 | 3/2/2025 | 5,491 | $ | 532,956 | 9,152 | $ | 888,293 | |||||||||||||||||||
|
3/2/2016 | 9,739 | 19,476 | $ | 91.98 | 3/2/2026 | 4,962 | $ | 481,612 | 8,270 | $ | 802,686 | |||||||||||||||||||
|
3/2/2017 | — | 29,148 | $ | 94.62 | 3/2/2027 | 4,713 | $ | 457,444 | 7,856 | $ | 762,503 | |||||||||||||||||||
James Johnston |
3/3/2014 |
46,551 |
— |
$ |
51.68 |
3/3/2024 |
— |
— |
— |
— |
|||||||||||||||||||||
|
3/2/2015 | 19,523 | 9,761 | $ | 79.20 | 3/2/2025 | 5,491 | $ | 532,956 | 9,152 | $ | 888,293 | |||||||||||||||||||
|
3/2/2016 | 9,739 | 19,476 | $ | 91.98 | 3/2/2026 | 4,962 | $ | 481,612 | 8,270 | $ | 802,686 | |||||||||||||||||||
|
3/2/2017 | — | 29,148 | $ | 94.62 | 3/2/2027 | 4,713 | $ | 457,444 | 7,856 | $ | 762,503 | |||||||||||||||||||
Phillip L. Hancock |
3/4/2013 |
16,763 |
— |
$ |
43.82 |
3/4/2023 |
— |
— |
— |
— |
|||||||||||||||||||||
|
3/3/2014 | 22,413 | — | $ | 51.68 | 3/3/2024 | — | — | — | — | |||||||||||||||||||||
|
3/2/2015 | 11,460 | 5,730 | $ | 79.20 | 3/2/2025 | 3,223 | $ | 312,824 | 5,373 | $ | 521,503 | |||||||||||||||||||
|
3/2/2016 | 5,710 | 11,416 | $ | 91.98 | 3/2/2026 | 2,908 | $ | 282,250 | 4,847 | $ | 470,450 | |||||||||||||||||||
|
3/2/2017 | — | 17,388 | $ | 94.62 | 3/2/2027 | 2,811 | $ | 272,836 | 4,686 | $ | 454,823 | |||||||||||||||||||
|
7/7/2017 | — | — | — | — | 2,835 | $ | 275,165 | — | — | |||||||||||||||||||||
- (1)
- Stock
options vest over a period of three years with one-third becoming exercisable on each anniversary of the grant date.
- (2)
- DPSG
RSUs vest on the third anniversary of the award date. Based on the achievement of certain performance measures, DPSG PSUs vest at the end of a three-year plan
period.
- (3)
- Share
amounts include outstanding DPSG RSUs and dividend equivalent units (including fractional shares) attributable to such DPSG RSUs. Market value is determined by
multiplying the total number of shares or other rights awarded under an equity incentive plan that have not vested times $97.06, the closing price of a share of our common stock on the NYSE on
December 29, 2017.
- (4)
- Share amounts include outstanding DPSG PSUs and dividend equivalent units (including fractional shares) attributable to such DPSG PSUs. Market value is determined by multiplying the total number of shares or other rights awarded under an equity incentive plan that have not vested times $97.06, the closing price of a share of our common stock on the NYSE on December 29, 2017.
Options Exercised and Stock Vested
The following table sets forth information regarding stock options that were exercised by our NEOs and stock awards made to our NEOs that have vested during fiscal year 2017.
| |
Option Awards | Stock Awards | |||||||||||
|---|---|---|---|---|---|---|---|---|---|---|---|---|---|
| |
Number of Shares Acquired on Exercise (#) |
Value Realized on Exercise ($) |
Number of Shares Acquired on Vesting (#)(1) |
Value Realized on Vesting ($) |
|||||||||
Larry Young |
195,733 | $ | 8,807,678 | 149,840 | $ | 14,192,387 | |||||||
Martin Ellen |
10,000 | $ | 412,825 | 35,648 | $ | 3,376,418 | |||||||
Rodger Collins |
39,017 | $ | 1,976,925 | 33,712 | $ | 3,193,050 | |||||||
James Johnston |
— | — | 33,712 | $ | 3,193,050 | ||||||||
Phillip L. Hancock |
— | — | 16,230 | $ | 1,537,237 | ||||||||
- (1)
- Represents the shares vested on the vesting date. Shares were withheld from issuance to cover taxes.
45
The following table sets forth information regarding pension benefits accrued by each NEO who participates in our defined benefit plans and supplemental contractual arrangements for 2017.
| |
Plan Name | Number of Years of Credited Service (#)(1) |
Present Value of Accumulated Benefit ($)(2) |
Payments During Last Fiscal Year ($) |
||||||||
|---|---|---|---|---|---|---|---|---|---|---|---|---|
Larry Young |
Personal Pension Account Plan | 2.67 | 62,278 | — | ||||||||
|
Pension Equalization Plan | 2.67 | 458,946 | — | ||||||||
James Johnston |
Personal Pension Account Plan | 16.09 | 508,100 | — | ||||||||
|
Pension Equalization Plan | 16.09 | 621,700 | — | ||||||||
- (1)
- Pay
and future service credits were frozen as of December 31, 2008 for our personal pension account plan (the "PPA Plan") and our pension equalization plan
(the "PEP"). For further information, see "—Personal Pension Account Plan ('PPA Plan')" below and "—Pension Equalization Plan ('PEP')" on page 47. Each of
Mr. Young's and Mr. Johnston's years of service with us prior to the date the PPA Plan and the PEP were frozen is the same as the number of years of credited service under each of the
PPA Plan and the PEP.
- (2)
- The actuarial present value of benefits accumulated under the respective plans is calculated in accordance with the assumptions included in Note 6 "Employee Benefit Plans," to our audited Consolidated Financial Statements, which are included in Item 8 of the Original Filing. These amounts assume that each NEO retires at age 65. The discount rate used to determine the present value of accumulated benefits is 3.70%. The present values assume no pre-retirement mortality and utilize the RP2014 healthy white collar male and female tables, with generational projection using Scale MP-2017.
Personal Pension Account Plan ("PPA Plan")
NEOs, other than Messrs. Ellen, Collins and Hancock are provided with retirement benefits under the PPA Plan, a tax-qualified defined benefit pension plan covering full-time and part-time employees with at least one year of service who were actively employed (other than employees of a predecessor company) as of December 31, 2006. The PPA Plan was closed to employees who were hired after December 31, 2006. Further, as of December 31, 2008, all future pay and service credits to the PPA Plan have been frozen. However, the PPA Plan does provide a minimum annual interest credit on individual account balances of 5%.
Participants fully vest in their retirement benefits after three years of service or upon attaining age 65. Participants are also eligible for early retirement benefits if they separate from service on or after attaining age 55 with 10 years of service. Participants who leave the Company before they are fully vested in their retirement benefit forfeit their accrued benefit under the PPA Plan.
The Code places limitations on compensation and pension benefits for tax-qualified defined benefit plans such as the PPA Plan. We have established a non-qualified supplemental defined benefit pension program (our Pension Equalization Plan), as discussed below, to restore some of the pension benefits limited by the Code.
46
Pension Equalization Plan ("PEP")
We sponsor the PEP, an unfunded, non-tax qualified excess defined benefit plan covering key employees who were actively employed as of December 31, 2006 and whose base salary exceeded certain statutory limits imposed by the Code. As with the PPA Plan, the PEP was closed to employees who were hired after December 31, 2006 and as of December 31, 2008, all future pay and service credits to the PEP have been frozen. However, the PEP does provide a minimum annual interest credit on individual account balances of 5%.
The purpose of the PEP is to restore to PEP participants any PPA Plan benefits that are limited by statutory restrictions imposed by the Code that are taken into consideration when determining their PPA Plan benefits. Participants fully vest in their benefits under the PEP after three years of service. Participants who voluntarily resign from service before they are vested in their benefits under the PEP forfeit their unvested accrued benefit. Participants who are terminated without "cause" or resign for "good reason" are entitled to have their unvested accrued benefits under the PEP automatically vested.
As of December 31, 2009, NEOs (other than Messrs. Ellen, Collins and Hancock who do not participate in the PPA Plan) have vested in their accrued benefits under the PPA Plan. Since Messrs. Ellen, Collins and Hancock are not participants in the PPA Plan, they receive no benefits under the PEP.
Savings Incentive Plan ("SIP")
The SIP, a tax-qualified 401(k) defined contribution plan, permits participants to contribute up to 75% of their base salary in the SIP within certain statutory limitations under the Code and we match 100% of the first 4% of base salary, on a per paycheck basis, that is contributed to the SIP by a participant. Employees participating in the SIP are always fully vested in their, as well as our, contributions to the plan. Participants self-direct the investment of their account balances among various mutual funds. In 2017, all of our NEOs participated in the SIP.
Also as part of the SIP, we offer an enhanced defined contribution component (the "EDC") on a tax-qualified basis to the SIP plan account. The EDC provides a contribution equal to 3% of eligible compensation to individual accounts annually. EDC contributions are 100% vested after three years of service with the Company.
Supplemental Savings Plan ("SSP")
The SSP is a nonqualified deferred compensation plan sponsored by the Company for our employees, and is a non-tax qualified defined contribution plan. The SSP is for employees who are actively enrolled in the SIP and whose deferrals under the SIP are limited by Code compensation limitations. Employees may elect to defer up to 75% of their base salary over the Code compensation limit to the SSP, and we match 100% of the first 4% of base salary, on a per paycheck basis, that is contributed by these employees. Employees participating in the SSP are always fully vested in their, as well as our, contributions to the plan. Participants self-direct the investment of their account balances among various mutual funds. In 2017 all of our NEOs participated in the SSP.
Also as part of the SSP, we offer an enhanced defined contribution component (the "Non-qualified EDC") on a non-tax qualified basis to the SSP plan account. The Non-qualified EDC provides a contribution equal to 3% of eligible compensation over statutory pay limits to individual accounts annually. The Non-qualified EDC contributions are 100% vested after three years of service with the Company or prior affiliates.
47
The SSP also offers our employees the opportunity to defer up to 100% of their annual bonus. Participants will make yearly elections on payout options of bonus deferrals under the plan. Vesting is immediate and the participant has multiple distribution options available during each annual enrollment period. Participants self-direct the investment of their account balances among various mutual funds.
The SSP is unfunded with respect to the Company's obligation to pay any balances in the SSP. A participant's rights to receive any payment from the SSP shall be no greater than the rights of an unsecured general creditor of the Company.
The following table sets forth information regarding the nonqualified deferred compensation under the SSP for each NEO in fiscal year 2017.
Non-Qualified Deferred Compensation
Name
|
Executive Contributions In Last Fiscal Year ($)(1) |
Registrant Contributions In Last Fiscal Year ($)(2) |
Aggregate Earnings In Last Fiscal Year ($)(3) |
Aggregate Withdrawals/ Distributions ($) |
Aggregate Balance At Last Fiscal Year End ($)(4) |
|||||||||||
|---|---|---|---|---|---|---|---|---|---|---|---|---|---|---|---|---|
Larry Young |
$ | 2,392,212 | $ | 347,228 | $ | 2,003,636 | — | $ | 12,949,422 | |||||||
Martin Ellen |
$ | 367,566 | $ | 40,678 | $ | 186,402 | — | $ | 1,611,525 | |||||||
Rodger Collins |
$ | 358,996 | $ | 48,498 | $ | 565,274 | — | $ | 4,465,053 | |||||||
James Johnston |
$ | 419,281 | $ | 120,982 | $ | 298,327 | — | $ | 2,688,330 | |||||||
Phillip L. Hancock |
$ | 7,261 | $ | 22,166 | $ | 61,439 | — | $ | 323,631 | |||||||
- (1)
- Aggregate
amount of contributions made by our NEOs to the SSP in fiscal year 2017.
- (2)
- Aggregate
amount of the Company's contributions to the NEOs' accounts under the SSP in fiscal year 2017. The amounts reported in this column are included in
executive compensation of the NEO reported in the Summary Compensation Table.
- (3)
- Aggregate
amount of earnings credited to the NEOs' accounts under the SSP in fiscal year 2017. The amounts reported in this column are not included in executive
compensation of the NEO reported in the Summary Compensation Table. For Mr. Collins amount reported also include earnings ($3,900) under a legacy Cadbury deferred compensation plan, frozen to
new entrants and benefit accrual in 2006.
- (4)
- The amounts in this column that were reported as executive compensation in the Summary Compensation Table for fiscal years prior to (and not including) 2017 were as follows: $1,746,203 for Mr. Young; $159,007 for Mr. Ellen; $273,258 for Mr. Collins; and $631,822 for Mr. Johnston. Mr. Ellen and Mr. Hancock were not NEOs in certain of those prior years and the amounts reflected in this footnote do not reflect any executive compensation that would have been included in the Summary Compensation Table if they had been an NEO in those prior years in which they were not an NEO. For Mr. Collins amount reported also includes balances ($184,437 for Mr. Collins) under a legacy Cadbury defined contribution plan, frozen to new entrants and benefit accrual in 2006.
48
Not included in the table above are the Non-qualified EDC Contributions funded in February, 2018, which are as follows:
Larry Young |
$ | 334,909 | ||
Martin Ellen |
$ | 32,523 | ||
Rodger Collins |
$ | 30,326 | ||
James Johnston |
$ | 111,464 | ||
Phillip L. Hancock |
$ | 16,496 |
This section outlines potential payments to our NEOs upon the occurrence of various termination events as of December 31, 2017 and does not reflect the impact of the Transactions. The impact of the Transactions upon the compensation of our NEOs will be reflected in the definitive proxy statement that we will prepare and file with the SEC and mail to our stockholders in connection with the Stockholder Approvals.
Severance Pay Plan For Executives
All of our NEOs participate in the Severance Pay Plan, which benefits include:
- (1)
- Lump
sum severance payment equal to the following multiples of salary and bonus target in the year of termination: Mr. Young—2.5X,
Mr. Ellen—2.25X, Messrs. Collins and Johnston—2.0X, and Mr. Hancock—1.5X
- (2)
- Lump sum cash payment equal to their MIP payment, pro-rated through the employment termination date and based on the actual performance targets achieved for the year in which such termination of employment occurred and payable when such awards are paid under the plan to all employees.
Under the Severance Pay Plan, all of our NEOs are entitled to outplacement services and continuation of health care benefits, at same premiums as when employed by the Company, for up to 18 months following termination.
All of our NEOs have signed a non-compete agreement, which provides each will not, for a period of one year after termination of employment, (i) become engaged with companies that are in competition with us, including, but not limited to, a predetermined list of companies or (ii) solicit or attempt to entice away any of our employees or customers.
Omnibus Stock Incentive Plan of 2009
The Omnibus Stock Incentive Plan of 2009, and the associated award agreements governing the terms of RSU, PSU and option awards issued under the plan, contain provisions specifying the treatment of unvested awards upon an eligible retirement event. Retirement eligibility is defined as age 65, or age 55 with 10 years of service with the Company. As of December 31, 2017 Messrs. Young, Collins, and Johnston satisfied the retirement eligibility criteria. Award agreements provide that upon a retirement, eligible participants' unvested awards will be accelerated on a pro-rata basis, determined based on the number of days employed during the vesting period. Awards granted within six months of the retirement event are forfeited.
Per the terms of the award agreements, retirement eligible participants may also choose to provide DPSG with a "Six Month Irrevocable Notice of Retirement," in which case unvested equity awards would continue to vest per the original vesting schedule. PSUs would be paid out based on the original vesting schedule and actual performance relative to targets. Participants electing this option would not receive regular cycle equity awards during the six month notice period.
49
Award agreements also provide for the following treatment upon a change-in-control and other termination events:
- •
- Upon a change-in-control, the vesting of RSUs, PSUs and options is accelerated. PSU awards are accelerated at target performance levels.
- •
- Upon an involuntary termination, or termination due to disability a pro-rata portion of unvested RSUs, PSUs and options is vested. Pro-rata
portion of PSUs is vested based on actual performance through the end of the performance cycle, and made available to terminated executives at the same time as for other participants. Pro-ration of
unvested RSUs, PSUs and options is based on the length of time employed during the vesting period for RSUs and options, and the performance period for PSUs.
- •
- Upon death, all unvested RSUs and options vest. Also, a pro-rated number of PSUs is vested at target level of performance.
Management Incentive Plan ("MIP")
DPSG's MIP provides for the following treatment upon death, disability and retirement:
- •
- Upon death, MIP is paid out at target; and
- •
- Upon disability or retirement, MIP is pro-rated for length of service during the year and paid out based on actual performance through the full performance cycle
The Compensation Committee approved the CIC Plan in February 2009. The CIC Plan generally provides that a payment will be made to a plan participant if there is a change in control of DPSG and, within two years after the change in control, the participant's employment is terminated or the participant voluntarily terminates his employment under certain adverse circumstances, including a significant adverse change in responsibilities of his position. At the time the CIC Plan was approved, the Compensation Committee approved the inclusion of six executive officers in the CIC Plan, including three of the NEOs. When Mr. Ellen became Chief Financial Officer in 2010 he was added to the CIC Plan (and the then retiring chief financial officer was removed). The levels of payments and benefits available upon termination were set as follows:
- (a)
- Mr. Young,
as Chief Executive Officer, is entitled to a payment equal to 3.0 times the sum of his base salary, plus his target annual bonus (MIP);
- (b)
- Mr. Ellen,
as Chief Financial Officer, is entitled to a payment equal to 2.75 times the sum of his base salary, plus his target annual bonus (MIP);
- (c)
- Mr. Collins
and Mr. Johnston would each be entitled to a payment equal to 2.5 times the sum of their respective base salary, plus their respective
target annual bonus (MIP); and
- (d)
- Mr. Hancock, as a non-participant in the CIC Plan, would receive the same benefits as described in the Severance Pay Plan For Executives section above.
CIC Plan participants whose parachute payments, as defined under IRC §280G, exceed the excise tax threshold by 10% or less, will have their benefits reduced to eliminate imposition of the tax under the terms of the CIC Plan. CIC Plan participants whose parachute payments exceed the excise tax threshold by more than 10% will receive an excise tax gross-up payment under the terms of the CIC Plan.
In addition, plan participants also receive other benefits, including payment of their MIP at target prorated to the date of termination, benefit continuation for the number of years equal to their
50
payment multiplier, payment of unvested and vested qualified and non-qualified pension benefits and outplacement services.
The Compensation Committee did not include any additional officers in the CIC Plan in 2017 and will not provide excise tax gross-ups to future participants in the CIC Plan.
Tables of Potential Payments and Assumptions
The following tables below outline the potential payments to Mr. Young, Mr. Ellen, Mr. Collins, Mr. Johnston and Mr. Hancock upon the occurrence of various termination events, including "termination without cause" or "for good reason" or "termination due to death or disability" or "retirement" or "retirement with six months' notice." Also, the table reflects potential payments related to change-in-control and subsequent qualified termination within a specified window. The following assumptions apply with respect to the tables below and any termination of employment of an NEO:
- •
- The tables include estimates of amounts that would have been paid to NEOs in the event their employment is terminated involuntarily without
Disqualifying Conditions on December 31, 2017. The employment of these NEOs did not actually terminate on December 31, 2017, and as a result, the NEOs did not receive any of the amounts
shown in the tables below. The actual amounts to be paid to a NEO in connection with a termination event can only be determined at the time of such termination event;
- •
- The tables assume that the price of a share of our common stock is $97.06 per share, the closing market price per share on the NYSE on
December 29, 2017;
- •
- Each NEO is entitled to receive amounts earned during the term of his employment regardless of the manner of termination. These amounts include
accrued base salary, accrued vacation time and other employee benefits to which the NEO was entitled on the date of termination, and are not shown in the tables below;
- •
- Retirement with six months' notice scenario is not shown in the table. Under this termination event payments received would be equal to the value of the "Accelerated Equity Payments" upon a CIC related termination
Name
|
Compensation Element | Retirement | Death | Disability | Termination Without Cause or For Good Reason |
Termination Without Cause or For Good Reason Following CIC |
||||||||||||
|---|---|---|---|---|---|---|---|---|---|---|---|---|---|---|---|---|---|---|
Larry D. Young |
Severance Payments | $ | — | $ | — | $ | — | $ | 7,187,500 | $ | 8,625,000 | |||||||
|
Lump Sum 2017 MIP Payment | $ | 1,126,598 | 1,725,000 | 1,126,598 | 1,126,598 | 1,725,000 | |||||||||||
|
Medical, Dental and Vision Benefits Continuation | — | — | — | 16,908 | 33,816 | ||||||||||||
|
Outplacement Services | — | — | — | 43,600 | 43,600 | ||||||||||||
|
Accelerated Equity Payments: | |||||||||||||||||
|
RSUs |
3,956,011 | 6,217,567 | 3,956,011 | 3,956,011 | 6,217,567 | ||||||||||||
|
PSUs |
3,922,531 | 6,433,529 | 3,922,531 | 3,922,531 | 10,362,805 | ||||||||||||
|
Stock Options | 899,235 | 1,478,531 | 899,235 | 899,235 | 1,478,531 | ||||||||||||
| | | | | | | | | | | | | | | | | | | |
|
TOTAL |
$ | 9,904,375 | $ | 15,854,627 | $ | 9,904,375 | $ | 17,152,383 | $ | 28,486,319 | |||||||
| | | | | | | | | | | | | | | | | | | |
| | | | | | | | | | | | | | | | | | | |
| | | | | | | | | | | | | | | | | | | |
51
Name
|
Compensation Element | Retirement | Death | Disability | Termination Without Cause or For Good Reason |
Termination Without Cause or For Good Reason Following CIC |
||||||||||||
|---|---|---|---|---|---|---|---|---|---|---|---|---|---|---|---|---|---|---|
Martin Ellen |
Severance Payments | $ | — | $ | — | $ | — | $ | 2,667,600 | $ | 3,260,400 | |||||||
|
Lump Sum 2017 MIP Payment | — | 561,600 | 366,781 | 366,781 | 561,600 | ||||||||||||
|
Medical, Dental and Vision Benefits Continuation | — | — | — | 16,908 | 30,998 | ||||||||||||
|
Outplacement Services | — | — | — | 7,250 | 7,250 | ||||||||||||
|
Accelerated Equity Payments: | |||||||||||||||||
|
RSUs |
— | 1,565,481 | 983,261 | 983,261 | 1,565,481 | ||||||||||||
|
PSUs |
— | 1,606,125 | 964,671 | 964,671 | 2,609,264 | ||||||||||||
|
Stock Options | — | 368,895 | 221,722 | 221,722 | 368,895 | ||||||||||||
| | | | | | | | | | | | | | | | | | | |
|
TOTAL |
$ | — | $ | 4,102,101 | $ | 2,536,435 | $ | 5,228,193 | $ | 8,403,888 | |||||||
| | | | | | | | | | | | | | | | | | | |
| | | | | | | | | | | | | | | | | | | |
| | | | | | | | | | | | | | | | | | | |
Name
|
Compensation Element | Retirement | Death | Disability | Termination Without Cause or For Good Reason |
Termination Without Cause or For Good Reason Following CIC |
||||||||||||
|---|---|---|---|---|---|---|---|---|---|---|---|---|---|---|---|---|---|---|
Rodger Collins |
Severance Payments | $ | — | $ | — | $ | — | $ | 2,319,900 | $ | 2,899,875 | |||||||
|
Lump Sum 2017 MIP Payment | 264,610 | 532,950 | 264,610 | 264,610 | 532,950 | ||||||||||||
|
Medical, Dental and Vision Benefits Continuation | — | — | — | 16,908 | 28,180 | ||||||||||||
|
Outplacement Services | — | — | — | 7,250 | 7,250 | ||||||||||||
|
Accelerated Equity Payments: | |||||||||||||||||
|
RSUs |
$ | 918,407 | 1,463,180 | 918,407 | 918,407 | 1,463,180 | |||||||||||
|
PSUs |
$ | 894,687 | 1,501,475 | 894,687 | 894,687 | 2,438,730 | |||||||||||
|
Stock Options | $ | 206,527 | 344,400 | 206,527 | 206,527 | 344,400 | |||||||||||
| | | | | | | | | | | | | | | | | | | |
|
TOTAL |
$ | 2,284,231 | $ | 3,842,005 | $ | 2,284,231 | $ | 4,628,289 | $ | 7,714,565 | |||||||
| | | | | | | | | | | | | | | | | | | |
| | | | | | | | | | | | | | | | | | | |
| | | | | | | | | | | | | | | | | | | |
Name
|
Compensation Element | Retirement | Death | Disability | Termination Without Cause or For Good Reason |
Termination Without Cause or For Good Reason Following CIC |
||||||||||||
|---|---|---|---|---|---|---|---|---|---|---|---|---|---|---|---|---|---|---|
James Johnston |
Severance Payments | $ | — | $ | — | $ | — | $ | 2,319,900 | $ | 2,899,875 | |||||||
|
Lump Sum 2017 MIP Payment | 498,629 | 532,950 | 498,629 | 498,629 | 532,950 | ||||||||||||
|
Medical, Dental and Vision Benefits Continuation | — | — | — | 16,908 | 28,180 | ||||||||||||
|
Outplacement Services | — | — | — | 7,250 | 7,250 | ||||||||||||
|
Accelerated Equity Payments: | |||||||||||||||||
|
RSUs |
$ | 918,407 | 1,463,180 | 918,407 | 918,407 | 1,463,180 | |||||||||||
|
PSUs |
$ | 894,687 | 1,501,475 | 894,687 | 894,687 | 2,438,730 | |||||||||||
|
Stock Options | $ | 206,527 | 344,400 | 206,527 | 206,527 | 344,400 | |||||||||||
| | | | | | | | | | | | | | | | | | | |
|
TOTAL |
$ | 2,518,250 | $ | 3,842,005 | $ | 2,518,250 | $ | 4,862,308 | $ | 7,714,565 | |||||||
| | | | | | | | | | | | | | | | | | | |
| | | | | | | | | | | | | | | | | | | |
| | | | | | | | | | | | | | | | | | | |
52
Name
|
Compensation Element | Retirement | Death | Disability | Termination Without Cause or For Good Reason |
Termination Without Cause or For Good Reason Following CIC |
||||||||||||
|---|---|---|---|---|---|---|---|---|---|---|---|---|---|---|---|---|---|---|
Phillip L. Hancock |
Severance Payments | $ | — | $ | — | $ | — | $ | 1,312,500 | $ | 1,312,500 | |||||||
|
Lump Sum 2017 MIP Payment | — | 375,000 | 217,407 | 217,407 | 375,000 | ||||||||||||
|
Medical, Dental and Vision Benefits Continuation | — | — | — | $ | 23,715 | $ | 23,715 | ||||||||||
|
Outplacement Services | — | — | — | 7,250 | 7,250 | ||||||||||||
|
Accelerated Equity Payments: | |||||||||||||||||
|
RSU |
— | 1,136,184 | 539,967 | 539,967 | 1,136,184 | ||||||||||||
|
PSUs |
— | 883,349 | 526,925 | 526,925 | 1,438,041 | ||||||||||||
|
Stock Options | — | 202,758 | 121,385 | 121,385 | 202,758 | ||||||||||||
| | | | | | | | | | | | | | | | | | | |
|
TOTAL |
$ | — | $ | 2,597,291 | $ | 1,405,684 | $ | 2,749,149 | $ | 4,495,448 | |||||||
| | | | | | | | | | | | | | | | | | | |
| | | | | | | | | | | | | | | | | | | |
| | | | | | | | | | | | | | | | | | | |
Securities Authorized for Issuance Under Equity Compensation Plans
The following table summarizes certain information related to our equity award plans as of December 31, 2017.
Plan Category
|
Number of Securities to be Issued Upon Exercise of Outstanding Options, Warrants and Rights |
Weighted Average Exercise Price of Outstanding Options, Warrants And Rights |
Number of Securities Remaining Available for Future Issuance Under Equity Compensation Plans (Excluding Securities Reflected in Initial Column)(2) |
|||||||
|---|---|---|---|---|---|---|---|---|---|---|
Equity Compensation Plans approved by stockholders— Omnibus Stock Incentive Plan of 2009(1) |
2,699,678 | $ | 42.08 | 9,145,712 | ||||||
Note: DPSG has no Equity Compensation Plans not approved by stockholders.
- (1)
- Net
of cancellations, 5,000,994 DPSG RSUs, 1,276,336 DPSG PSUs and 4,576,958 options have been granted under the Omnibus Stock Incentive Plan of 2009. The options
have a weighted average exercise price of $82.83 per share and weighted average remaining contractual term of 7.76 years. DPSG RSUs and DPSG PSUs have no exercise price, thus reducing the
weighted average exercise price presented above.
- (2)
- Represents awards authorized for future grants under the Omnibus Stock Incentive Plan of 2009.
53
Non-employee directors receive compensation from us for their services on the Board and its committees. Mr. Young, our only executive director, does not receive compensation for his services as a director. In our fiscal year ended December 31, 2017, we compensated our non-employee directors as follows: an annual cash retainer of $100,000 and an annual equity award of DPSG RSUs with a value of $145,000. In addition, the Chairman of the Board, the chairperson of the Audit Committee and the chairperson of the Compensation Committee received an additional annual equity award of DPSG RSUs with a value of $140,000, $30,000 and $25,000, respectively. All of the DPSG RSUs granted to directors vest three years from the date of grant.
Director compensation paid in our fiscal year ended December 31, 2017 was as follows:
Director Compensation in DPSG's Fiscal Year Ended December 31, 2017
| NAME | FEES EARNED OR PAID IN CASH ($)(1) |
STOCK AWARDS ($)(2)(3) |
OPTION AWARDS ($) |
NON-EQUITY INCENTIVE PLAN COMPENSATION ($) |
CHANGE IN PENSION VALUE AND NONQUALIFIED DEFERRED COMPENSATION EARNINGS ($) |
ALL OTHER COMPENSATION ($) |
TOTAL ($) |
|||||||||||
|---|---|---|---|---|---|---|---|---|---|---|---|---|---|---|---|---|---|---|
Wayne R. Sanders |
100,000 | 285,000 | — | — | — | 22,272(4) | 407,222 | |||||||||||
David E. Alexander |
100,000 | 175,000 | — | — | — | — | 275,000 | |||||||||||
M. Anne Szostak |
100,000 | 170,000 | — | — | — | — | 270,000 | |||||||||||
Antonio Carrillo |
100,000 | 145,000 | — | — | — | — | 245,000 | |||||||||||
Pamela H. Patsley |
100,000 | 145,000 | — | — | — | — | 245,000 | |||||||||||
José M. Gutiérrez |
100,000 | 145,000 | — | — | — | — | 245,000 | |||||||||||
Ronald G. Rogers |
100,000 | 145,000 | — | — | — | — | 245,000 | |||||||||||
Dunia A. Shive |
100,000 | 145,000 | — | — | — | — | 245,000 | |||||||||||
Joyce M. Roché(5) |
50,000 | — | — | — | — | — | 50,000 | |||||||||||
- (1)
- The amounts reported in the Fees Earned or Paid in Cash column reflect fees earned in 2017.
54
- (2)
- The
amounts reported in the Stock Awards column reflect the grant date fair value associated with each respective director's RSUs granted under the Omnibus Stock
Incentive Plan of 2009. Even though the RSUs may be forfeited, the amounts reported do not reflect this contingency.
- (3)
- The following table shows the aggregate number of outstanding RSUs for each non-employee director as of December 31, 2017. All of these awards vest three years from their respective grant dates.
| NAME | DPSG RSUs(a) |
|
|---|---|---|
Wayne R. Sanders |
8,830 | |
David E. Alexander |
5,890 | |
M. Anne Szostak |
5,711 | |
Antonio Carrillo |
4,816 | |
José M. Gutiérrez |
2,299 | |
Pamela H. Patsley |
4,816 | |
Ronald G. Rogers |
4,816 | |
Dunia A. Shive |
4,816 |
- (a)
- The amounts reported in the RSUs column also include dividend equivalent units earned under the Omnibus Stock Incentive Plan of 2009, including dividend equivalent units with a record date prior to December 31, 2017.
- (4)
- The
amount reported in the All Other Compensation column represents the personal use of the corporate aircraft by Mr. Sanders. For SEC purposes, the cost of
personal use of a corporate aircraft is calculated based on the aggregate incremental cost to us. We calculated the aggregate incremental cost using estimated variable costs of operating the aircraft.
Fixed costs which do not change based on usage, such as pilot salaries, depreciation of aircraft and cost of maintenance, are excluded.
- (5)
- Ms. Roché retired from the Board after the Annual Meeting on May 18, 2017 in accordance with the retirement policy under the Corporate Governance Guidelines.
Based on a study performed by Mercer, the total non-employee director compensation in 2017 approximates our compensation peer group median.
The Board believes that the directors should have a meaningful ownership interest in DPSG. Effective November 1, 2015, or, if a director is elected after November 1, 2010, within five years after the date of such election, the Stock Ownership Guidelines require non-executive directors to own shares of DPSG's common stock having a value equal to a minimum of four times their respective annual cash retainer. All of the directors to whom these guidelines apply had met these guidelines as of
55
December 31, 2017. Satisfaction of the guidelines is not yet required of Ms. Shive, who joined the Board in November 2014; Mr. Carrillo, who joined the Board in February 2015; and Mr. Gutiérrez, who joined the Board in September 2016.
Item 12. Security Ownership of Certain Beneficial Owners and Management and Related Stockholder Matters.
CERTAIN BENEFICIAL OWNERS OF OUR COMMON STOCK
The following table sets forth, as of March 15, 2018, certain information with respect to the shares of our common stock beneficially owned by (i) stockholders known to us to own more than 5% of the outstanding shares of our common stock, (ii) each of our directors and Named Executive Officers and (iii) all of our executive officers and directors as a group. Unless otherwise noted below, the address of each beneficial owner listed in the table below is Dr Pepper Snapple Group, Inc., 5301 Legacy Drive, Plano, Texas 75024.
56
| NAME | AMOUNT OF BENEFICIAL OWNERSHIP OF COMMON STOCK |
PERCENT OF CLASS | ||
|---|---|---|---|---|
BENEFICIAL OWNERS OF MORE THAN 5% OF OUR COMMON STOCK |
||||
BlackRock, Inc.(1) |
20,528,958 | 11.4% | ||
The Vanguard Group.(2) |
18,453,448 | 10.22% | ||
JPMORGAN CHASE & CO.(3) |
10,509,246 | 5.8% | ||
Cedar Rock Capital Limited(4) |
10,064,225 | 5.6% | ||
T. ROWE PRICE ASSOCIATES, INC.(5) |
9,384,576 | 5.1% | ||
SECURITY OWNERSHIP OF MANAGEMENT DIRECTORS: |
||||
Wayne R. Sanders |
37,211 | * | ||
David E. Alexander(6) |
15,961 | * | ||
Antonio Carrillo |
1,233 | * | ||
José M. Gutiérrez(7) |
— | * | ||
Pamela H. Patsley |
15,713 | * | ||
Ronald G. Rogers(8) |
16,232 | * | ||
Dunia A. Shive |
2,916 | * | ||
M. Anne Szostak(9) |
18,240 | * | ||
NAMED EXECUTIVE OFFICERS |
||||
Larry D. Young(10) |
487,366 | * | ||
Martin M. Ellen(10)(11) |
170,457 | * | ||
Rodger L. Collins(10) |
215,327 | * | ||
James J. Johnston(10) |
128,741 | * | ||
Phillip L. Hancock(10) |
80,796 | * | ||
All other Executive Officers (5 persons)(10) |
266,222 | * | ||
All Executive Officers and Directors as a Group (18 persons)(10) |
1,456,415 | * |
- *
- Less
than 1%.
- (1)
- Based
on a Schedule 13G/A filed by the stockholder with the SEC on January 19, 2018. Such stockholder has indicated that it beneficially owns
20,528,958 shares, has sole voting power with respect to 18,043,106 shares and has sole dispositive power with respect to 20,528,958 shares. The address of such stockholder is 55 East
52nd Street, New York, NY 10055.
- (2)
- Based on a Schedule 13G/A filed by the stockholder with the SEC on February 9, 2018. Such stockholder has indicated that it beneficially owns 18,453,448 shares, has sole voting power with respect to 257,929 shares, has shared voting power with respect to 71,306 shares, has sole dispositive power with respect to 18,128,383 shares and has shared dispositive power with respect
57
to 325,065 shares. The address of such stockholder is 100 Vanguard Blvd., Malvern, PA 19355.
- (3)
- Based
on a Schedule 13G filed by the stockholder with the SEC on January 9. 2018. Such stockholder has indicated that it beneficially owns 10,509,246
shares, has sole voting power with respect to 9,915,814 shares, has shared voting power with respect to 88,449 shares, has sole dispositive power with respect to 10,409,638 shares and has shared
dispositive power with respect to 99,208 shares. The address of such stockholder is 270 Park Avenue, New York, NY 10017.
- (4)
- Based
on a Schedule 13G/A filed by the stockholder with the SEC on February 14, 2018. Such stockholder has indicated that it beneficially owns
10,064,225 shares, has shared voting power and has shared dispositive power with respect to 10,064,225 shares. The address of such stockholder is c/o Meteora Partners LLP,
1st Floor, 64 North Row, London W1K 7DA, United Kingdom.
- (5)
- Based
on a Schedule 13G/A filed by the stockholder with the SEC on February 14, 2018. Such stockholder has indicated that it beneficially owns
9,384,576 shares, has sole voting power with respect to 2,534,446 shares and has sole dispositive power with respect to 9,384,576 shares. The address of such stockholder is 100 E. Pratt Street,
Baltimore, MD 21202.
- (6)
- The
shares shown are owned by The David and Sandra Alexander Revocable Trust, and Mr. Alexander has a pecuniary interest in the trust.
- (7)
- Mr. Gutiérrez
joined the Board in September 2016 and presently owns no shares of common stock, but has received DPSG RSU awards which have not
vested.
- (8)
- Keint-He
Winery and Vineyards, Ltd., an Ontario, Canada corporation in which Mr. Rogers has a pecuniary interest, owns all of these shares.
- (9)
- These
shares are owned by the M. Anne Szostak Trust. Ms. Szostak has a pecuniary interest in the trust.
- (10)
- Includes the following shares related to stock options, granted under the Omnibus Stock Incentive Plan of 2009, that the Named Executive Officers and
58
other executive officers have the right to exercise as of March 15, 2018 or will have the right to exercise within 60 days after March 15, 2018.
| |
Exercisable Options |
|
|---|---|---|
Larry D. Young |
250,950 | |
Martin M. Ellen |
91,804 | |
Rodger L. Collins |
105,028 | |
James L. Johnston |
105,028 | |
Phillip L. Hancock |
73,590 | |
Other Executive Officers |
116,117 |
- (11)
- These shares are owned by Martin Robin Partners, L.P., a limited partnership in which Mr. Ellen has a pecuniary interest.
Item 13. Certain Relationships and Related Transactions, and Director Independence.
DPSG has adopted a Related Person Transactions Policy which governs any transaction or proposed transaction involving any of our directors, nominees for director, or executive officers (or any immediate family members of the foregoing) and in which DPSG was or is to be a participant and in which the amount involved exceeds $120,000. Under this Related Person Transactions Policy, the related person is to notify the General Counsel of the details of the transaction and the Board will review those transactions involving a director or director nominee and the Audit Committee will review those transactions involving executive officers. The Board or Audit Committee, as applicable, will approve only those transactions that are in, or are not inconsistent with, the best interests of DPSG and its stockholders, as the Board or Audit Committee, as applicable, determines in good faith. There were no related party transactions considered by the Board or Audit Committee in 2017. In addition, our Code of Conduct governs the actions of our directors and employees, including conflicts of interest. See Item 10 above.
Director Independence and Corporate Governance Guidelines
Corporate Governance Guidelines
On May 17, 2017, the Board adopted revised corporate governance guidelines ("Corporate Governance Guidelines"). The Corporate Governance Guidelines include, among other things:
- •
- a requirement that the Board will have an Audit Committee, a Compensation Committee and a Corporate Governance and Nominating Committee, each comprised solely of independent directors;
59
- •
- a requirement that the Board annually assess the performance of the Chief Executive Officer;
- •
- Board stewardship of our Code of Conduct and Insider Trading Policy;
- •
- assessment of Board and director performance;
- •
- the Board's responsibility for reviewing and overseeing the process regarding succession planning of DPSG's Chief Executive Officer and senior
management;
- •
- the power of the Board and each committee to retain outside advisors; and
- •
- our Categorical Standards of Director Independence.
In February 2018, DPSG's Board of Directors waived the mandatory retirement provision in the Corporate Governance Guidelines as it relates to Mr. Sanders and agreed that he should continue as Chairman of the Board until the closing of the Merger or, if the Merger Agreement is terminated, until the next annual meeting of DPSG.
Our Corporate Governance Guidelines are available on our website at www.drpeppersnapplegroup.com under the Investors—Corporate Governance—Corporate Governance Guidelines captions. The information provided on our website is not incorporated herein by reference unless expressly stated herein as such.
Director Independence
In connection with the adoption of the Corporate Governance Guidelines, the Board has adopted our categorical standards of director independence ("Categorical Standards of Director Independence"), which are attached as Annex A to our Corporate Governance Guidelines. The Categorical Standards of Director Independence are consistent with the independence standards set forth in Section 303A.02 of the NYSE listing standards. In February 2018, the Board considered the slate of nominees for director and determined that each of David E. Alexander, Antonio Carrillo, José M. Gutiérrez, Pamela H. Patsley, Ronald G. Rogers, Wayne R. Sanders, Dunia A. Shive and M. Anne Szostak is independent and has no material relationship with DPSG.
OTHER CORPORATE GOVERNANCE INFORMATION
Executive Sessions and Lead Independent Director
In compliance with the requirements of the NYSE, our Corporate Governance Guidelines require the non-employee directors to meet at least twice annually in
60
regularly scheduled executive sessions. Mr. Sanders, as lead independent director, presides over non-employee director executive sessions. Five (5) executive sessions were held in 2017.
Attendance at Annual Meeting
It is our policy that all directors attend the annual meeting of stockholders. We anticipate that all members of the Board will be present at the annual meeting. Each director attended the annual meeting of stockholders held on May 18, 2017.
Board Leadership and Role in Risk Oversight
The Chairman of the Board and the Chief Executive Officer titles are currently held by different persons. Mr. Sanders, as the Chairman of the Board, is also the lead independent director. Mr. Young is our Chief Executive Officer.
In May 2008, DPSG became a stand-alone company as the result of a spin-off by Cadbury, plc, which held CSAB. At that time, it was decided to separate the Chairman of the Board and the Chief Executive Officer positions. Most important among the considerations was that separation of the Chairman of the Board and the Chief Executive Officer positions would allow our Chief Executive Officer, to direct his energy towards operational issues and the Chairman of the Board to focus on governance and other related issues of our new publicly held company. At this time, DPSG continues to believe that separating the Chairman of the Board and the Chief Executive Officer positions enhances the independence of the Board, provides independent business counsel for the Chief Executive Officer and facilitates discussion among Board members.
The Board has overall responsibility for oversight of risk and has delegated to the Audit Committee the responsibility for the risk oversight process and oversight of financial and compliance risks. DPSG reports to the Audit Committee at each regularly scheduled meeting on risk management and the activities of the committee that oversees DPSG's enterprise and risk management functions. The Audit Committee reports to the Board on its delegated responsibilities regarding risks. The Compensation Committee is responsible for the assessment of risk in DPSG's compensation programs and reports to the Board on that assessment (see "Compensation Discussion and Analysis—Compensation Risk Assessment" in Item 11 above).
Communications with the Board
Any interested party may communicate with the Board, the Chairman of the Board (who is the lead independent director and presiding director of executive sessions) or the non-employee directors as a group on a Board-related issue by submitting an e-mail through DPSG's website at www.drpeppersnapplegroup.com under the
61
Investors—Corporate Governance—Contact the Board captions or by sending a written communication to: Corporate Secretary, Dr Pepper Snapple Group, Inc., 5301 Legacy Drive, Plano, Texas 75024. Relevant communications will be distributed to the Board, or to any individual director or directors as appropriate, depending on the facts and circumstances outlined in the communication. Communications that are unrelated to the duties and responsibilities of the Board will not be forwarded, such as sponsorship requests, licensing requests, annual report requests, business solicitations, advertisements, new product suggestions, brand and product comments and job inquiries. Any communication that is screened as described above will be made available to any director upon his or her request.
Item 14. Principal Accountant Fees and Services.
INDEPENDENT REGISTERED PUBLIC ACCOUNTING FIRM'S FEES
Fees for professional services provided by our independent registered public accounting firm in each of the last two fiscal years, in each of the following categories, were as follows:
| (in 000's) |
2017 | 2016 | ||
|---|---|---|---|---|
Audit Fees(1) |
$3,650 | $3,472 | ||
Audit-Related Fees |
— | — | ||
Tax Fees |
— | — | ||
All Other Fees |
— | — | ||
Total Fees |
$3,650 | $3,472 |
- (1)
- These amounts represent fees of Deloitte for the audit of our annual consolidated financial statements, the review of financial statements included in our quarterly Form 10-Q reports, the audit of internal controls over financial reporting, services rendered in connection with acquisitions and debt offerings and the services that an independent auditor would customarily provide in connection with statutory requirements, regulatory filings, and similar engagements for the fiscal year, such as comfort letters, consents and assistance with review of documents filed with the SEC. Audit Fees also include advice about accounting matters that arose in connection with or as a result of the audit or the review of periodic consolidated financial statements and statutory audits that non-U.S. jurisdictions require. For purposes of this schedule, fees billed from non-U.S. jurisdictions in the currencies of such jurisdictions have been converted to U.S. dollars as of the date of the approval of such fees.
The Audit Committee approved all of our independent registered public accounting firm's audit engagements for our fiscal year ended December 31, 2017. All audit and non-audit services provided to us by our independent registered public accounting firm are required to be pre-approved by the Audit Committee in accordance with the policies and procedures set forth in the current Audit Committee Charter, available on our website at www.drpeppersnapplegroup.com under the Investors—Corporate Governance—Committee Charters—Audit Committee Charter captions.
62
ITEM 15. EXHIBITS, FINANCIAL STATEMENT SCHEDULES
The following financial statements are included in Part II, Item 8, "Financial Statements and Supplementary Data," in this Annual Report on Form 10-K:
- •
- Consolidated Statements of Income for the years ended December 31, 2017, 2016 and 2015
- •
- Consolidated Statements of Comprehensive Income for the years ended December 31, 2017, 2016 and 2015
- •
- Consolidated Balance Sheets as of December 31, 2017 and 2016
- •
- Consolidated Statements of Cash Flows for the years ended December 31, 2017, 2016 and 2015
- •
- Consolidated Statements of Changes in Stockholders' Equity for the years ended December 31, 2017, 2016 and 2015
- •
- Notes to Consolidated Financial Statements for the years ended December 31, 2017, 2016 and 2015
Schedules are omitted because they are not required or applicable, or the required information is included in the Consolidated Financial Statements or related notes.
See Exhibit Index.
63
The exhibits listed in the exhibit index of the Original Filing and the exhibits listed in the exhibit index of this Amendment are filed with, or incorporated by reference in, this Amendment.
The following additional exhibits are filed with this Amendment:
64
Pursuant to the requirements of Section 13 or 15(d) of the Securities Exchange Act of 1934, the registrant has duly caused this report to be signed on its behalf by the undersigned, thereunto duly authorized.
|
Dr Pepper Snapple Group, Inc. | |||
|
By: |
/s/ Martin M. Ellen |
||
|
Name: |
Martin M. Ellen |
||
Date: March 19, 2018 |
Title: |
Executive Vice President and Chief Financial Officer |
||
APPENDIX A
RECONCILIATION OF CERTAIN FINANCIAL MEASURES USED IN COMPENSATION
MIP CORE EARNINGS RECONCILIATION TO GAAP FINANCIALS
| (in millions) |
Income From Operations |
SOP—Beverage Concentrates And Latin America Beverages |
SOP—Packaged Beverages |
|||||||
|---|---|---|---|---|---|---|---|---|---|---|
As Reported |
$ | 1,388 | $ | 927 | $ | 691 | ||||
Mark to Market(a) |
(23 | ) | — | — | ||||||
Transition and Integration Expenses(b) |
23 | — | 5 | |||||||
Workforce Reduction Costs(c) |
3 | — | — | |||||||
Net Reallocation of SOP Between Packaged Beverages and Beverage Concentrates(d) |
— | 43 | (43 | ) | ||||||
Acquired Core Bai SOP Loss in Packaged Beverages(e) |
— | — | 40 | |||||||
Gain on Investment in Bai(f) |
(28 | ) | — | — | ||||||
| | | | | | | | | | | |
Results |
$ | 1,363 | $ | 970 | $ | 693 | ||||
| | | | | | | | | | | |
| | | | | | | | | | | |
| | | | | | | | | | | |
- (a)
- Unrealized
mark-to-market impact of commodity derivatives and interest rate derivatives not designated as hedges in accordance with GAAP.
- (b)
- Transition
and Integration Expenses related to the Bai Brands merger.
- (c)
- Restructuring
charges associated with a limited workforce reduction, which will be primarily paid during 2018.
- (d)
- The
MIP of certain persons in the Business Concentrates segment and Packaged Beverages segment are in part based on financial metrics of certain elements of the
other segment. For purposes of reconciling the "as reported" SOP to the SOP used in calculating the MIP, a reallocation of SOP is necessary to account for these certain elements.
- (e)
- The
MIP of certain persons in the Packaged Beverages segment excludes financial metrics of the acquired Bai Brands business. For purposes of reconciling the "as
reported" SOP to the SOP used in calculating the MIP, the SOP of acquired Bai brands is excluded.
- (f)
- The Compensation Committee, at Management's request, has excluded the gain realized upon the acquisition of Bai Brands by the Company on its investment in Bai prior to acquisition.
A-1
APPENDIX A
DEFINITION OF TERMS FOR INTERNAL RETURN PSU CALCULATION
Financial Term
|
Definition For PSU Program | |
|---|---|---|
Net Income, Cash Flow from Operations, Capital Expenditures |
Net income (reflected as "Net Income"), Cash Flow from Operations (reflected as "Net Cash provided by operating activities") and Capital Expenditures (reflected as "Purchase of property, plant and equipment") will be reported in the Company's Form 10-K (in the captions reflected in parenthesis above) for the applicable year. Net Income is adjusted for the unrealized mark-to-market impact of commodity derivatives and certain items that are excluded for comparison to prior year periods as indicated in Appendix A. For purposes of the internal return PSU calculation, Core Earnings is further adjusted to remove the revenue amortization related to the license transactions with PepsiCo, Inc. in 2009 and with The Coca-Cola Company in 2010, and the associated tax expense. | |
P/E |
P/E will be determined by dividing (i) the Average Closing Market Price (as hereafter defined) by (ii) the Diluted Earnings per share, ex-items, for the calendar year ended on December 31, 2014 as indicated in the Company's earnings release for that calendar year. The resulting number will be the P/E to be used in the determination of the Cash Flow Yield for the Plan Period. |
|
Average Closing Market Price |
The Average Closing Market Price shall be calculated by dividing (i) the closing market price of the Company's common stock on the NYSE on the 15th day of each calendar month of the calendar year immediately preceding the first Plan Year (or if the 15th day of the calendar month is not a day on which the NYSE is open for trading, then the closing market price on the first day after the 15th day of the month that the NYSE is open for trading) by (ii) twelve (12). |
A-2
APPENDIX A
PSU CORE EARNINGS RECONCILIATION TO GAAP
| (in millions) |
2017 | 2016 | 2015 | |||||||
|---|---|---|---|---|---|---|---|---|---|---|
Net Income, as reported: |
$ | 1,076 | $ | 847 | $ | 764 | ||||
Mark to Market(a) |
(24 | ) | (40 | ) | 5 | |||||
Items affecting comparability: |
||||||||||
—BAI Acquisition Costs(b) |
23 | 8 | — | |||||||
—Extinguishment Gain—Multi-Employer(c) |
— | (21 | ) | — | ||||||
—Extinguishment Loss—Debt(d) |
62 | 31 | — | |||||||
—Litigation Provision(e) |
— | — | 2 | |||||||
—Brand Impairment(f) |
— | — | 7 | |||||||
—Separation Related(g) |
— | — | — | |||||||
—Pension Annuity Purchase(h) |
— | — | — | |||||||
—Workforce Reduction Costs(i) |
3 | — | — | |||||||
—Impact of the Tax Cuts and Jobs reform Act (the "TCJA")(j) |
(297 | ) | — | — | ||||||
—Tax impact of adjusting items(k) |
(21 | ) | (6 | ) | (5 | ) | ||||
| | | | | | | | | | | |
Core Earnings |
822 | 819 | 773 | |||||||
—Coca-Cola and PepsiCo revenue amortization(l) |
(64 | ) | (64 | ) | (64 | ) | ||||
—Tax impact |
25 | 25 | 25 | |||||||
—Tax benefit from change in accounting for share based payment awards(m) |
(19 | ) | — | — | ||||||
| | | | | | | | | | | |
Core Earnings, as adjusted |
$ | 764 | $ | 780 | $ | 734 | ||||
| | | | | | | | | | | |
| | | | | | | | | | | |
| | | | | | | | | | | |
- (a)
- The
unrealized mark-to-market impact of commodity derivatives and interest rate derivatives not designated as hedges in accordance with U.S. GAAP.
- (b)
- Transitions
and integration costs related to the Bai Brands merger.
- (c)
- Gain
on the extinguishment of a multi-employer withdrawal liability.
- (d)
- The
loss on early extinguishment of debt related to the completion of a tender offer for our 2018 Notes and 2038 Notes and the redemption of our remaining 2018 Notes
in 2017 and the loss on early extinguishment of debt related to the redemption of a portion of our 2018 Notes in 2016.
- (e)
- Adjustments
to a previously disclosed legal provision.
- (f)
- Non-cash
brand impairment charge for Garden Cocktail.
- (g)
- Separation-related
charges, primarily the completion of the IRS audit.
- (h)
- Settlement
charge related to the purchase of annuities for certain participants receiving benefits in our U.S. defined benefit pension plans.
- (i)
- Restructuring
charges associated with a limited workforce reduction, which will be primarily paid during 2018.
- (j)
- On December 22, 2017, the federal government enacted the legislation commonly referred to as the Tax Cuts and Jobs Act. Under the TCJA, our U.S. federal statutory tax rate will be reduced from 35% to 21%, beginning in 2018, with some related business deductions and credits either reduced or eliminated. As a result, we have recognized an income tax benefit of $297 million, primarily driven by the revaluation of our deferred tax liabilities.
A-3
- (k)
- The
tax impact of the above adjusting items and an income tax benefit driven by a restructuring of the ownership of our Canadian business in 2016.
- (l)
- Revenue
amortization related to the license transactions with PepsiCo, Inc. in 2009 and with The Coca-Cola Company in 2010.
- (m)
- As of January 1, 2017, the Company adopted Accounting Standards Update 2016-09 ("ASU 2016-09"), Compensation—Stock Compensation (Topic 718): Improvements to Employee Share Based Payment Accounting. Beginning in 2017, one of the primary impacts of adoption of ASU 2016-09 was the recognition of excess tax benefits for our stock awards in the provision for income taxes rather than additional paid-in capital.
A-4
APPENDIX A
PSU FREE CASH FLOW (CORE) RECONCILIATION TO GAAP
| (in millions) |
2017 | 2016 | 2015 | |||||||
|---|---|---|---|---|---|---|---|---|---|---|
Cash Flow From Operations, as reported(n) |
$ | 1,038 | $ | 961 | $ | 1,014 | ||||
Items affecting comparability(o) |
||||||||||
—BAI Transition and integrations Expenses(b) |
21 | — | — | |||||||
—Extinguishment Gain—Multi-Employer(c) |
— | 35 | — | |||||||
—Litigation Provision(e) |
— | — | 2 | |||||||
—Tax impact of adjusting items(p) |
(4 | ) | (1 | ) | (1 | ) | ||||
—Tax benefit from change in accounting for share based payment awards(n) |
(19 | ) | (22 | ) | (23 | ) | ||||
—Tax Benefit from Extinguishment Loss—Debt(d) |
(21 | ) | — | — | ||||||
| | | | | | | | | | | |
Cash Flow from Operations (Core) |
1,015 | 973 | 992 | |||||||
—Purchase of property, plant and equipment |
(202 | ) | (180 | ) | (179 | ) | ||||
| | | | | | | | | | | |
Free Cash Flow (Core) |
$ | 813 | $ | 793 | $ | 813 | ||||
| | | | | | | | | | | |
| | | | | | | | | | | |
| | | | | | | | | | | |
- (n)
- For
the years ended December 31, 2017, 2016, and 2015, excess tax benefits on stock based compensation were reclassified from financing activities to
operating activities to conform to the current year presentation as a result of the adoption of Accounting Standards Update 2016-09 ("ASU 2016-09"), Compensation—Stock Compensation (Topic
718): Improvements to Employee Share Based Payment Accounting.
- (o)
- The
following items represent the cash inflows and outflows of the items affecting comparability in the calculation of Core Earnings, which impact cash flow from
operations, as reported.
- (p)
- The tax impact of adjusting items represents the cash inflows and outflows from tax authorities in the period related to items affecting comparability in the calculation of Core Earnings, which impact cash flow from operations, as reported.
A-5