Attached files
UNITED STATES
SECURITIES AND EXCHANGE COMMISSION
Washington, D.C. 20549
FORM 10-K
(Mark One)
☒ANNUAL REPORT PURSUANT TO SECTION 13 OR 15(d) OF THE SECURITIES EXCHANGE ACT OF 1934
For the fiscal year ended December 31, 2017.
OR
☐TRANSITION REPORT PURSUANT TO SECTION 13 OR 15(d) OF THE SECURITIES EXCHANGE ACT OF 1934
For the transition period from to
Commission file number 001-38066
Select Energy Services, Inc.
(Exact name of registrant as specified in its charter)
|
Delaware |
|
81‑4561945 |
|
(State or Other Jurisdiction of Incorporation or Organization) |
|
(I.R.S. Employer Identification No.) |
|
|
|
|
|
515 Post Oak Boulevard, Suite 200 Houston, Texas |
|
77027 |
|
(Address of Principal Executive Offices) |
|
(Zip Code) |
Registrant’s telephone number, including area code (713) 235-9500
Securities registered pursuant to Section 12(b) of the Act:
|
Title of each class |
|
Name of each exchange on which registered |
|
|
|
|
|
Class A Common Stock $0.01 par value |
|
New York Stock Exchange |
Securities registered pursuant to Section 12(g) of the Act:
NONE
Indicate by check mark if the registrant is a well-known seasoned issuer, as defined in Rule 405 of the Securities Act.
|
Yes ☐ |
|
No ☑ |
Indicate by check mark if the registrant is not required to file reports pursuant to Section 13 or Section 15(d) of the Act.
|
Yes ☐ |
|
No ☑ |
Indicate by check mark whether the registrant (1) has filed all reports required to be filed by Section 13 or 15(d) of the Securities Exchange Act of 1934 during the preceding 12 months (or for such shorter period that registrant was required to file such reports), and (2) has been subject to such filing requirements for the past 90 days.
|
Yes ☑ |
|
No ☐ |
Indicate by check mark whether the registrant has submitted electronically and posted on its corporate Website, if any, every Interactive Data File required to be submitted and posted pursuant to Rule 405 of Regulation S-T (§232.405 of this chapter) during the preceding 12 months (or for such shorter period that the registrant was required to submit and post such files).
|
Yes ☑ |
|
No ☐ |
Indicate by check mark if disclosure of delinquent filers pursuant to Item 405 of Regulation S-K (§299.405 of this chapter) is not contained herein, and will not be contained, to the best of the registrant’s knowledge, in definitive proxy or information statements incorporated by reference in Part III of this Form 10-K or any amendment to this Form 10-K. ☐
Indicate by check mark whether the registrant is a large accelerated filer, an accelerated filer, a non-accelerated filer, a smaller reporting company or an emerging growth company. See the definitions of “large accelerated filer,” “accelerated filer,” “smaller reporting company” and “emerging growth company” in Rule 12b-2 of the Exchange Act.
|
Large accelerated filer |
☐ |
Accelerated filer |
☐ |
|
Non-accelerated filer (Do not check if a smaller reporting company) |
☑ |
Smaller reporting company |
☐ |
|
Emerging growth company |
☑ |
|
|
If an emerging growth company, indicate by check mark if the registrant has elected not to use the extended transition period for complying with any new or revised financial accounting standards provided pursuant to Section 13(a) of the Exchange Act. ☐
Indicate by check mark whether the registrant is a shell company (as defined by Rule 12b-2 of the Exchange Act).
|
Yes ☐ |
|
No ☑ |
The aggregate market value of the voting and non-voting common stock held by non-affiliates of the registrant computed as of June 30, 2017 (the last business day of the registrant’s most recent completed second fiscal quarter) based on the closing price of the Class A common stock on the New York Stock Exchange was $322.1 million. There were 59,290,665, 6,731,839 and 40,331,989 shares of the registrant’s Class A, Class A-2 and Class B common stock, respectively, outstanding as of March 15, 2018.
Documents Incorporated by Reference:
Portions of the registrant’s definitive proxy statement for the 2018 annual meeting of stockholders, to be filed no later than 120 days after the end of the fiscal year, are incorporated by reference into Part III of this Annual Report on Form 10-K.
1
CAUTIONARY NOTE REGARDING FORWARD-LOOKING STATEMENTS
The information in this Annual Report on Form 10-K includes “forward‑looking statements” within the meaning of Section 27A of the Securities Act of 1933, as amended (the “Securities Act”), and Section 21E of the Securities Exchange Act of 1934, as amended (the “Exchange Act”). All statements, other than statements of historical fact, included in this Annual Report regarding our strategy, future operations, financial position, risks, estimated revenues and losses, projected costs, prospects, plans and objectives of management are forward‑looking statements. When used in this Annual Report, the words “could,” “believe,” “anticipate,” “intend,” “estimate,” “expect,” “project,” “preliminary,” “forecast” and similar expressions or variations are intended to identify forward‑looking statements, although not all forward‑looking statements contain such identifying words. When considering forward‑looking statements, you should keep in mind the cautionary statements included in this Annual Report. These forward‑looking statements are based on management’s current belief, based on currently available information, as to the outcome and timing of future events. Important factors that could cause actual results to differ materially from those in the forward‑looking statements include, but are not limited to, those summarized below:
•the ultimate outcome and results of integrating our operations with the operations of Rockwater (as defined herein);
•the effects of our business combination with Rockwater, including the combined company’s future financial condition, results of operations, strategy and plans;
•potential adverse reactions or changes to business relationships resulting from the completion of the Rockwater Merger (as defined herein);
•expected benefits from the Rockwater Merger and the ability of the combined company to realize those benefits;
•the results of any merger‑related litigation, settlements and investigations;
•the level of capital spending by U.S. and Canadian oil and gas companies;
•trends and volatility in oil and gas prices;
•demand for our services;
•regional impacts to our business, including our key infrastructure assets within the Bakken;
•our level of indebtedness and our ability to comply with covenants contained in our Credit Agreement (as defined herein) or future debt instruments;
•our access to capital to fund expansions, acquisitions and our working capital needs and our ability to obtain debt or equity financing on satisfactory terms;
•our safety performance;
•the impact of current and future laws, rulings and governmental regulations, including those related to hydraulic fracturing, accessing water, disposing of wastewater and various environmental matters;
•our ability to retain key management and employees;
•the impacts of competition on our operations;
2
•our ability to hire and retain skilled labor;
•delays or restrictions in obtaining permits by us or our customers;
•constraints in supply or availability of equipment used in our business;
•the impacts of advancements in drilling and well service technologies;
•changes in global political or economic conditions, generally, and in the markets we serve;
•accidents, weather, seasonality or other events affecting our business; and
•the other risks identified in this Annual Report including, without limitation, those under the headings “Item 1A. Risk Factors,” “Item 1. Business,” “Item 7. Management’s Discussion and Analysis of Financial Condition and Results of Operations” (“MD&A”) and “Item 13. Certain Relationships and Related Transactions, and Director Independence.”
These factors are not necessarily all of the important factors that could cause actual results to differ materially from those expressed in any of our forward‑looking statements. Other unknown or unpredictable factors also could have material adverse effects on our future results. Our future results will depend upon various other risks and uncertainties, including those described elsewhere in this Annual Report. Readers are cautioned not to place undue reliance on forward‑looking statements, which speak only as of the date hereof. We undertake no obligation to update or revise any forward‑looking statements after the date they are made, whether as a result of new information, future events or otherwise. All forward‑looking statements attributable to us are qualified in their entirety by this cautionary statement.
References Within This Annual Report
As used in Part I of this Annual Report on Form 10-K, unless the context otherwise requires, references to the ”Company,” ”we,” ”our,” ”us” or similar expressions refer (1) for time periods prior to our December 2016 private placement of 16,100,000 shares of our Class A-1 common stock at $20.00 per share (the “Select 144A Offering”) and the related corporate reorganization transactions to Select Energy Services, LLC (“Select LLC”) and SES Holdings, LLC (“SES Holdings”) and their consolidated subsidiaries, (2) for time periods after the Select 144A Offering and the related corporate reorganization transactions and prior to the Rockwater Merger and the related corporate reorganization transactions, to Select Energy Services, Inc. (“Select Inc.”) and its consolidated subsidiaries and (3) after the Rockwater Merger and the related corporate reorganization transactions, to Select Inc. and its consolidated subsidiaries, including those subsidiaries acquired in the Rockwater Merger. Additionally, prior to the consummation of the Rockwater Merger and the related corporate reorganization transactions, “Rockwater” refers to Rockwater Energy Solutions, Inc. and its consolidated subsidiaries and “Rockwater LLC” refers to Rockwater Energy Solutions, LLC and its consolidated subsidiaries. Following the consummation of Rockwater Merger and the related corporate reorganization transactions “Rockwater” refers to Select Energy Solutions (RW), Inc. and its consolidated subsidiaries and “Rockwater LLC” refers to Rockwater Energy Solutions, LLC and its consolidated subsidiaries.
3
We are a leading provider of total water management and chemical solutions to the unconventional oil and gas industry in the United States and Western Canada. We were formed as a Delaware corporation in November 2016. Within the major shale plays in the United States, we believe we are a market leader in sourcing, transfer (both by permanent pipeline and temporary hose) and temporary containment of water prior to its use in drilling and completion activities associated with hydraulic fracture stimulation or “fracking,” which we collectively refer to as “pre‑frac water services”. In addition, we provide testing and flowback services immediately following the well completion. In most of our areas of operations, we also provide additional complementary water‑related services that support oil and gas well completion and production activities, including monitoring, treatment, hauling, water recycling and disposal. We also manufacture a full suite of specialty chemicals used in well completions, and we provide chemicals needed by our customers to help increase oil and gas production and lower costs over the extended life of a typical well. We have historically generated a substantial majority of our revenues through providing total water solutions to our customers, and we believe we are the only company that provides total water solutions together with complementary chemical products and related expertise, which we believe gives us a unique competitive advantage in our industry.
Water is essential to the development and completion of unconventional oil and gas wells, where producers rely on fracking to stimulate the production of oil and gas from dense subsurface rock formations. The volume of water required to economically produce tight oil and gas reserves in the United States and Canada has grown more than tenfold over the past five years. Water and related services comprise a large and growing portion of our customers’ drilling and completion costs. In support of new well development, we source, transfer, provide containment of and treat the water used by our customers in the well completion process. The fracking process involves the injection of large volumes of water and proppant (typically sand) together with chemicals under high pressure, through a cased and cemented wellbore into targeted subsurface formations thousands of feet below ground to fracture the surrounding rock. Our completion chemicals are blended with water to improve the transport and placement of proppant in targeted zones within the producing formation. The induced fractures near the wellbore allow hydrocarbons to flow into the wellbore for extraction. Our team of chemists and research and development personnel work with our customers to optimize the frac fluid system. Up to fifty percent of the water pumped into the well during the fracking process returns as “flowback” during the first several weeks following the well completion process, and a large percentage of the remainder, plus pre‑existing water in the formation, is recovered as produced water over the life of the well. This flowback and produced water must be captured, contained and either disposed of in an environmentally safe manner, or treated and recycled for reuse in subsequent frack jobs. We provide services that support the operator’s management of flowback and produced water. After the fracking process is completed, we provide a variety of services related to the initial phase of the flowback and production operations that complement the longer‑term oil and gas production activities, including designing and executing chemical treatment programs to improve well productivity, extend the useful life of wells and reduce production costs.
4
The diagram below illustrates the primary water solutions and oilfield chemicals services we provide during the completion and production cycle of a horizontal well:
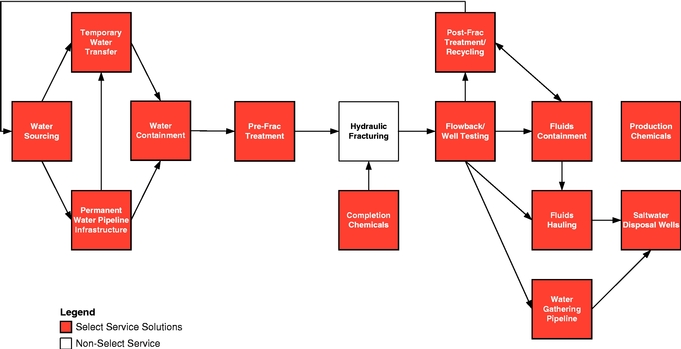
As the development of unconventional reservoirs has evolved over the past decade, the total volumes of water required in the fracking process have grown dramatically. Management estimates that the completion of a horizontal well in 2009 required an average of approximately 75,000 barrels of water or approximately 575 tank truck loads. Today, current horizontal well completions can require in excess of 500,000 barrels per well or roughly 3,850 tank truck loads. Multi‑well pad completions can require in excess of 5 million barrels of water per pad, or the equivalent of 38,500 tank truck loads. Significant mechanical, logistical, environmental and safety issues related to the transfer and subsequent containment of such large volumes via tank truck have resulted in tank trucks no longer representing a viable solution for the transport of frack water. Accordingly, E&P companies have shifted their pre-frac operational focus away from traditional tank truck operators and small, local water service providers, to larger, regional and national players, like us, who have the expertise, technology and scale to provide high quality, reliable, comprehensive and environmentally sound water services.
The total volumes of flowback and produced water are even greater―by some estimates, the U.S. oil and gas industry today produces over 20 billion barrels of water per year and this volume is likely to grow. We believe the industry will increasingly turn to companies like us to help cost effectively manage produced water in an environmentally responsible way.
We believe our broad geographic footprint, comprehensive suite of water services, inventory of water sources and permanent and temporary pipeline infrastructure position us to be a leading provider of water solutions in all of the shale plays that we serve. We have well‑established field operations in what we believe to be core areas of many of the most active shale plays in the United States and Canada, including the Permian Basin, SCOOP/STACK, Bakken, Eagle Ford, Haynesville, Marcellus, Utica, Rockies (DJ/Niobrara, Powder River and Uinta), other Mid‑Continent (“MidCon”) basins (Woodford, Barnett, Fayetteville, Granite Wash and Mississippian) and Western Canada. Our broad footprint enables us to service the majority of current domestic unconventional drilling and completions activity. We estimate that over 80% of all currently active U.S. onshore horizontal rigs are operating in our primary service areas and anticipate that the vast majority of rigs that will be deployed in the near‑ to medium‑term will be situated in these areas. In particular, we have established a strong position in the Permian Basin, which is presently our largest operating region,
5
and where producers are continuing to invest significant capital as commodity prices continue to recover from recent lows.
We seek to be a comprehensive provider of total water management and chemical solutions for our customers in most of our areas of operations. We have the capability to provide all of the pre-frac water services and many of the complementary chemicals our customers require in their drilling and completion activities, including the sourcing, transferring, containing, treatment, testing and monitoring of water. We also offer various complementary water‑related services that support oil and gas completion and production activities, including well testing, flowback, post-frac fluid hauling, pipeline gathering, treatment, recycling and disposal of water. In addition, we develop and manufacture a full suite of production chemicals used to enhance performance over the life of a well.
On the pre-frac side our Water Solutions segment’s inventory of water sources is a key competitive advantage that enables us to offer our customers reliable access to the volume of water essential for fracking operations. Water sources are often difficult to locate, acquire and permit, particularly in the quantities needed for multi‑well pad development programs. We have spent years obtaining strategic water sources and have secured permits or long‑term access rights to approximately 1.5 billion barrels of water annually from hundreds of sources, including large scale sources such as the Brazos, Missouri, Navasota, Ohio, Rio Grande, Sabine, San Antonio and Washita Rivers. In the Bakken, for example, we believe we have established a market leading position by securing three governmental permits which enable us to withdraw up to 100 million barrels of water annually from the Missouri River and Lake Sakakawea in North Dakota. Fresh water access cannot be easily replicated on Lake Sakakawea today as there are multiple environmental and regulatory conditions that must be met before an industrial water intake location can be built. New permits will also not be granted within 25 miles of an intake location associated with an existing permit. We have three of the five existing permits off Lake Sakakawea. In addition to surface water rights, groundwater resources are a key component of our extensive water portfolio. These sources have been secured or developed within our Water Solutions group and are designed with dedicated containment and transfer logistics to offer a complete water management solution. The first step in procuring a water source is identifying an area of interest based on anticipated drilling and completion activity as a result of lease activity, applications for permits and industry sources. After a specific water source is identified, we perform an assessment of the particular prospective source, including confirming availability, regulatory status, and any limitations on potential water rights. We use our AquaView® technology to quantify volumes and flow rates to verify current and potential water availability and volumes. After confirming the relevant ownership information, we begin negotiations with the applicable landowner or holder of the water rights. After finalizing the agreements and access rights, our team will obtain necessary regulatory approvals, permits and rights‑of‑way as needed based on the regulatory authorities involved and individual circumstances. Going forward, we believe that our expertise and relationships in water sourcing will provide us with a competitive advantage in identifying and securing additional sources of water. Additionally, water is increasingly becoming sourced through the reuse of produced or flowback water from existing wells that has been subjected to various treatment or fresh water blending options. We have a dedicated team of individuals focused on developing water treatment and reuse services to our customers and although water reuse has been a relatively small percentage of our revenue to‑date, we believe demands for our water reuse services will increase as water demands increase, regulatory restrictions increase, disposal options decrease, water treatment costs decline and operators reevaluate the reuse of treated flowback and produced water in their completion programs.
We also manage the transfer of water from the source, between containments and ultimately to the wellsite for well completion. We have invested significant capital in temporary pipe, including approximately 1,400 miles of lay‑flat hose, and other related assets. Our lay‑flat hose provides a flexible water transfer solution and can be customized to fit a specific project. After the completion of a project, lay‑flat hose can be quickly and cost‑effectively removed and redeployed for a new project. These investments enable us to provide our customers with temporary water transfer systems that have substantially lower risk of leaks or spills compared to many alternative temporary piping options. We believe our expansive inventory of lay‑flat hose, in combination with our customers’ preference for this temporary water transfer method, positions us to be a market leader for this class of water transfer services. To support our water sourcing and transfer services, we have also made significant investments in strategic permanent pipelines that provide reliable and cost effective water delivery. Our most significant pipeline assets are located in the Bakken and allow us to take advantage of our water permits in that region. Our Bakken pipelines consist of two active underground pipeline systems, the Charlson and the Iverson systems, in McKenzie County, North Dakota that can currently deliver up to 62 million barrels of fresh water per year. We are in the process of developing a third underground pipeline to support Williams
6
County and western Mountrail County in North Dakota that would allow us to fully utilize our annual water rights in this region. We have signed long‑term contracts supported by Areas of Mutual Interest with major Bakken producers that we believe will use a significant portion of our current pipeline capacity. We have also made investments outside of the Bakken, including our pipeline serving the SCOOP area of Oklahoma, the “Pecan Hill Pipeline,” and our pipeline serving the Haynesville, the “IP Pipeline.” Additionally, with the GRR Acquisition (as defined below) we acquired rights to a vast array of fresh, brackish and effluent water sources with access to significant volumes of water annually and water transport infrastructure, including over 1,200 miles of temporary and permanent pipeline infrastructure and related storage facilities and pumps, all located in the northern Delaware Basin portion of the Permian Basin.
In addition to water sourcing and transfer, our Water Solutions segment offers various complementary water‑related services that support oil and gas completion and production activities. Before and during the completion phase of a well, along with water sourcing and transfer, we offer water containment, monitoring and treatment solutions. Following the completion process, we provide flowback and well testing services, flowback and produced water hauling, pipeline gathering and disposal services and water treatment and recycling solutions relating to the potential reuse of flowback and produced water for new well completions. We support our customers across the life cycle of a well from completion to production and our comprehensive technical expertise related to water solutions management uniquely positions us relative to other water solutions providers to provide our customers comprehensive service solutions designed to maximize well performance, reduce costs and increase efficiencies while reducing the environmental impacts of their resource development.
Our Oilfield Chemicals segment develops, manufactures and provides a full suite of chemicals utilized in hydraulic fracturing, stimulation, cementing and well completions, including polymers that create viscosity, crosslinkers, friction reducers, surfactants, buffers, breakers and other chemical technologies, to leading pressure pumping service companies in the United States. Our production chemicals solutions, which can be applied to producing wells throughout their producing lives, are applied to underperforming wells in order to enhance well performance and reduce production costs through the use of production treating chemicals, corrosion and scale monitoring, chemical inventory management, well failure analysis and lab services. Our product lines support the full range of fluid systems utilized primarily in the completion and development of unconventional resources. The use of automated communications systems combined with direct‑to‑wellsite delivery ensures seamless product availability for our customers, while our chemical expertise enables us to deliver a customized suite of products to meet customers’ technical and economical product needs. Our expertise in frac chemistry also positions us to support our customers in developing programs to reuse produced and flowback water as an alternative to disposal. In addition to our product offering, we provide inventory management services, including procurement, warehousing and delivery services. We have two primary manufacturing facilities in Texas, five regional distribution centers and 29 heavy chemical transport trucks and provide products to our customers in all major U.S. shale basins. Rockwater will also have the first in-basin manufacturing facility of emulsion polymers (friction reducers) in our industry. The in-basin manufacturing facility is strategically located in the Permian Basin which will provide a strategic advantage of being able to reduce our overall costs of raw materials that can now be delivered directly to the basin by rail.
We also offer our customers various ancillary services through our Wellsite Services segment. Through our subsidiary, Peak Oilfield Services, LLC (“Peak”), we provide workforce accommodations and surface rental equipment supporting oil and gas drilling, completion and production operations. Through our subsidiary, Affirm Oilfield Services, LLC (“Affirm”), we provide crane and logistics services, wellsite and pipeline construction and various field services. Operating under Rockwater LLC, we also offer sand hauling and logistics services in the Rockies and Bakken regions, as well as water transfer, containment, fluids hauling and other rental services in Western Canada. We provide our Wellsite Services to a wide range of customers in many of the most active shale plays or basins in the United States and Canada.
7
We maintain a culture that prioritizes safety, the environment and our relationship with the communities in which we operate. We place a strong emphasis on the safe execution of our operations, including safety training for our employees and the development of a variety of safety programs designed to make us a market leader in safety standards. Further, our safety recognition program incentivizes employees throughout our organization to focus on conducting operations in accordance with our strict safety standards. In addition, we work closely with federal, state and local governments and community organizations to help ensure that our operations comply with legal requirements and community standards. We believe that our customers will select their service providers based in part on the quality of their safety and compliance records, and therefore, we will continue to make significant investments to be a market
leader in this area.
Recent Developments
Rockwater Merger
On November 1, 2017, we completed the transactions (the “Rockwater Merger”) contemplated by the Agreement and Plan of Merger, dated as of July 18, 2017 (the “Merger Agreement”), by and among us, SES Holdings, Raptor Merger Sub, Inc., a Delaware corporation and our wholly owned subsidiary, Raptor Merger Sub, LLC, a Delaware limited liability company and an indirect wholly owned subsidiary of SES Holdings, Rockwater and Rockwater LLC. Pursuant to the Merger Agreement, we combined with Rockwater in a stock‑for‑stock transaction in which we issued approximately 25.9 million shares of our Class A common stock, 6.7 million shares of our Class A‑2 common stock and 4.4 million shares of our Class B common stock to the former holders of Rockwater common stock and a unit‑for‑unit transaction in which SES Holdings issued approximately 37.3 million common units in SES Holdings (each, an “SES Holdings LLC Unit”) to the former holders of units in Rockwater LLC (each, a “Rockwater LLC Unit”).
Rockwater was incorporated as a Delaware corporation in March 2017. Prior to the Rockwater Merger, Rockwater was a holding company whose sole material asset consisted of a membership interest in Rockwater LLC. Rockwater’s predecessor corporation was formed as a Delaware corporation in June 2011 and converted into Rockwater LLC in March 2017.
Resource Water Acquisition
On September 15, 2017, we completed our acquisition (the “Resource Water Acquisition”) of Resource Water Transfer Services, L.P. and certain other affiliated assets (collectively, “Resource Water”). Resource Water provides water transfer services to E&P operators in West Texas and East Texas. Resource Water’s assets include 24 miles of layflat hose as well as numerous pumps and ancillary equipment required to support water transfer operations. Resource Water has longstanding customer relationships across its operating regions which are viewed as strategic to our water solutions business.
Initial Public Offering
On April 20, 2017, the registration statement on Form S‑1 (File No. 333‑216404) relating to our initial public offering (the “IPO”) was declared effective by the SEC. The IPO closed on April 26, 2017, at which time we issued and sold 8,700,000 shares of Class A common stock at a price to the public of $14.00 per share. We received cash proceeds of approximately $114.2 million from this transaction, net of underwriting discounts and commissions. On May 10, 2017, the underwriters exercised in full their option to purchase an additional 1,305,000 shares of Class A common stock at a price to the public of $14.00 per share. We received cash proceeds of approximately $17.1 million, net of underwriting discounts and commissions and estimated offering expenses, from the sale of such additional shares pursuant to the underwriters’ option. We incurred costs of approximately $2.8 million related to the IPO.
Crescent Merger
On March 31, 2017, Rockwater acquired Crescent Companies, LLC (‘‘Crescent’’), a company that provides water and fluid management solutions to E&P companies principally in the Mid Continent, Marcellus/Utica, Eagle Ford and Permian basins (the ‘‘Crescent Merger’’). A majority of Crescent’s revenue is derived from providing total water and fluid management solutions. The consideration for the Crescent Merger consisted of equity securities and the repayment of Crescent’s outstanding indebtedness, which was approximately $39.3 million, using borrowings under
8
Rockwater’s credit facility. Rockwater issued 4,105,998 shares of Rockwater Class A Common Stock and Rockwater LLC issued 5,693,258 Rockwater LLC Units and an equivalent number of shares of Rockwater Class B Common Stock to the owners of Crescent.
GRR Acquisition
On March 10, 2017, we completed our acquisition (the “GRR Acquisition”) of Gregory Rockhouse Ranch, Inc. and certain other affiliated entities and assets (collectively, the “GRR Entities”). The GRR Entities provide water and water‑related services to E&P companies in the Permian Basin and own and have rights to a vast array of fresh, brackish and effluent water sources with access to significant volumes of water annually and water transport infrastructure, including over 1,200 miles of temporary and permanent pipeline infrastructure and related storage facilities and pumps, all located in the northern Delaware Basin portion of the Permian Basin. The total consideration we paid for this acquisition was $59.6 million, with $53.0 million paid in cash, $5.5 million paid in shares of Class A common stock, subject to customary post‑closing adjustments, and $1.1 million in assumed tax liabilities to the sellers. We funded the cash portion of the consideration for the GRR Acquisition with $19.0 million of cash on hand and $34.0 million of borrowings under our Previous Credit Facility (as defined below), which we repaid with a portion of the net proceeds of the IPO. We believe this acquisition has significantly enhanced our position in the Permian Basin.
9
Description of Business Segments
Following the completion of the Rockwater Merger, we offer our services through the following three operating segments: (i) Water Solutions, (ii) Oilfield Chemicals and (iii) Wellsite Services.
Water Solutions
Our Water Solutions segment is operated primarily under our subsidiary, Select LLC, and provides water‑related services to customers that include major integrated oil companies and independent oil and natural gas producers. These services include: the sourcing of water; the transfer of the water to the wellsite through permanent pipeline infrastructure and temporary hose; the containment of fluids off‑ and on‑location; measuring and monitoring of water; the filtering and treatment of fluids, well testing and handling of flowback and produced formation water; and the transportation and recycling or disposal of drilling, completion and production fluids.
Service Lines
Our Water Solutions operating segment is divided into the following service lines:
•Water Sourcing. Our water sourcing service line helps E&P companies source water used for drilling and completion operations from our surface, ground and industrial water sources. Specifically, through a portfolio of contracts with and permits from regulatory bodies, corporations and individual landowners, we have secured rights to approximately 1.5 billion barrels of water annually from hundreds of sources, a number which varies over time, including large scale sources such as the Brazos, Missouri, Navasota, Ohio, Rio Grande, Sabine, San Antonio and Washita Rivers. In the Bakken, we have three governmental permits that enable us to withdraw up to 100 million barrels of water annually from the Missouri River and Lake Sakakawea in North Dakota. Fresh water access cannot be easily replicated on Lake Sakakawea today as there are multiple environmental and regulatory conditions that must be met before an industrial water intake location can be built. New permits will also not be granted within 25 miles of an intake location associated with an existing permit. We have three of the five existing permits off Lake Sakakawea. Additionally, the recently acquired GRR Entities have rights to a vast array of fresh, brackish and effluent water sources with access to significant volumes of water annually. In addition to primary frac water sourcing, we also source brine water and other completion fluids.
•Water Transfer. Our water transfer service line provides high‑volume, high‑rate water transfer services through permanent pipeline systems and temporary pipe systems. This service is utilized to transfer water from a source to a containment location on or off the wellsite, from the containment directly to the well to support completion operations, and, in certain circumstances, directly from the source to the well. Our assets include more than 110 miles of operational underground pipeline, approximately 1,400 miles of lay‑flat hose and approximately 1,000 high‑rate water transfer pumps. Additionally, the recently acquired GRR Entities own significant water transport infrastructure, including over 1,200 miles of temporary and permanent pipeline infrastructure and related storage facilities and pumps, all located in the northern Delaware Basin portion of the Permian Basin. The Rockwater Merger added Rockwater’s sizable fleet of small and large diameter pipe and hose and pumps to our water transfer service line and extended our water transfer service capabilities across North America. Our permanent pipeline systems are located in the Bakken, the SCOOP and the Haynesville, as described in more detail below.
•Bakken: We have invested over $30.0 million in the Charlson Pipeline and the Iverson Pipeline in the Bakken located in McKenzie County, North Dakota, and we are developing a third pipeline system that will serve Williams County and western Mountrail County. The Charlson pipeline system is located on the eastern side of McKenzie County, North Dakota, and consists of 32 miles of operational pipeline. The Iverson pipeline system is located in eastern McKenzie County, North Dakota, and consists of 58 miles of operational pipeline. Of the approximately 90 miles of underground pipeline systems, we own 38 miles and have contractual rights to access the remaining 52 miles. The development of the third permit began in late 2017 and will allow us to utilize 100 million barrels of fresh water per year across the three systems.
10
•SCOOP: Through our interest in a joint venture with Access Midstream (subsequently merged with Williams Partners), we own a nine‑mile, underground fresh water delivery pipeline in Grady County, Oklahoma in what we believe to be the core of the SCOOP, with an additional 23 miles of sour gas pipeline that can be subsequently converted to deliver fresh water. The source for this pipeline system originates from the Washita River, a reliable water source in an otherwise dry and drought‑prone region of Oklahoma. We are currently permitted by the Oklahoma Water Resources Board to withdraw 10.8 million barrels of water per year from the river, in excess of the pipeline’s current physical throughput capacity of 9.2 million barrels per year.
•Haynesville: We own an approximately 12‑mile underground fresh water delivery pipeline in De Soto Parish, Louisiana, which transports effluent from a pump station at International Paper’s Mansfield Plant Outfall No. 1 to five delivery points within the Holly Field for use in fracking operations. The IP Pipeline is located in what we believe is the core acreage of the Haynesville shale.
Our lay‑flat hose provides a flexible water transfer solution and can be customized to fit a specific project. After the completion of a project, lay‑flat hose can be quickly and cost‑effectively removed and redeployed for a new project, including projects in different geographic regions. Lay‑flat hose has a significantly lower risk of spills than most other types of temporary jointed‑pipe as a result of the strength and durability of the hose as well as the secure nature of any coupling joints used to connect multiple sections of hose. We believe the average length of lay‑flat hose used in a project is approximately 5 miles, but the length can vary from as little as a few hundred feet to as much as 75 miles for a comprehensive water management program. Our lay‑flat hose consists of 8 inch, 10 inch and 12 inch diameter segments. Depending on the requirements of a project, lay‑flat hose may run from a water source directly to a containment area or wellsite or from containment area to containment area. Our customers generally prefer lay‑flat hose to alternative temporary piping options due to the cost‑effectiveness, customizability and reduced risk of spills.
•Water Containment. We are the largest provider of high‑capacity above ground storage tanks (“ASTs”) in North America with an inventory offering water storage capacity between 4,500 and 60,000 barrels per tank with remote monitoring capability in every major U.S. basin and Western Canada. Our ASTs provide a low cost containment alternative to frac tanks and support our water treatment and reuse strategy that we bundle with our water transfer and water reuse services to provide enhanced water management solutions to our customers. A 40,000 barrel AST can be delivered by three trucks and be installed in half a day, and replaces 80 500‑barrel frac tanks. Our modular tank design allows for 20 different tank configurations to meet each customer’s individual needs, and we also offer nested tanks for complete secondary containment.
•Water Treatment and Recycling. Our water treatment and recycling service line works with oil and gas producers to treat water utilized in the drilling, completion and production processes. Additionally, we offer recycling services for the reuse of flowback, produced or otherwise impaired water for reuse in new well completions. Specifically, we offer water treatment and recycling solutions ranging from basic filtration solutions to the application of chemical disinfection and more advanced technologies, including oil removal, iron removal and the removal of other contaminants. These solutions are offered through in‑house equipment and expertise, as well as with outside strategic relationships and investments.
•Well Testing and Flowback. Our well testing and flowback service line provides highly trained personnel and state‑of‑the‑art equipment and technologies to perform a multitude of services relating to the completion and production of oil, gas, condensate and water, including frac support, frac plug drill‑out, flowback, well testing and lease operating. These services are critical to the completion and production phase of a well, as it provides the customer with initial well productivity data which ultimately impacts a reservoir’s capacity to produce hydrocarbons, such as oil, gas and condensate. Our traditional well testing and hydraulic equipment can service a multitude of operational scenarios, such as high and low temperature, high and low pressure, high hydrogen sulfide concentration and high volume. Currently, we own approximately 280 equipment spreads to support this broad range of services.
11
•Fluid Hauling. Our fluid hauling service line transports and stores water and various drilling, completion and production fluids utilizing our fleet of vacuum trucks, winch trucks, hydrovac trucks, and related assets, such as frac tanks. Currently, we own and lease approximately 200 tractors and own approximately 990 frac tanks.
•Fluid Disposal. We own 18 salt water disposal (“SWD”) wells with a daily maximum permitted disposal volume of approximately 300,000 bpd. Our SWD wells are located in the Eagle Ford (6), Permian (4), Haynesville (3), Marcellus (2), MidCon (2) and Rockies (1) regions.
Geographic Areas of Operation
We offer our Water Solutions services in most of the major unconventional shale plays in the continental U.S., as illustrated by a “✓” in the chart below.
|
|
Geographic Region |
|||||||
|
Services Provided |
Permian |
MidCon |
Bakken |
Eagle Ford |
Marcellus / |
Haynesville |
Rockies |
|
|
Water Sourcing |
✓ |
✓ |
✓ |
✓ |
✓ |
✓ |
✓ |
|
|
Water Transfer |
✓ |
✓ |
✓ |
✓ |
✓ |
✓ |
✓ |
|
|
Water Containment |
✓ |
✓ |
✓ |
✓ |
✓ |
✓ |
✓ |
|
|
Water Monitoring |
✓ |
✓ |
✓ |
✓ |
✓ |
✓ |
✓ |
|
|
Water Treatment and Recycling |
✓ |
✓ |
— |
✓ |
✓ |
✓ |
✓ |
|
|
Well Testing and Flowback |
✓ |
✓ |
* |
✓ |
✓ |
✓ |
✓ |
|
|
Fluid Hauling |
✓ |
✓ |
✓ |
✓ |
* |
✓ |
✓ |
|
|
Frac Tanks |
✓ |
✓ |
✓ |
✓ |
* |
✓ |
✓ |
|
|
Fluid Disposal |
✓ |
✓ |
— |
✓ |
✓ |
✓ |
✓ |
|
*In these regions, we have retained facilities but are not currently conducting operations.
Customers
Our Water Solutions customers primarily include major integrated and independent U.S. and international oil and gas producers.
Competition
Many large domestic and international oilfield services companies offer some water‑oriented and environmental services, though these are generally ancillary to their core businesses. As a result, the water solutions industry is highly fragmented and our main competitors are typically smaller or mid‑sized and often private service providers that focus on water solutions and logistical services across a narrow geographic range. We seek to differentiate ourselves from our competitors by delivering the highest‑quality services and equipment possible, coupled with superior execution and operating efficiency in a safe working environment.
Oilfield Chemicals
Our Oilfield Chemicals segment is operated primarily under our subsidiary, Rockwater LLC, and develops, manufactures and provides a full suite of chemicals utilized in hydraulic fracturing, stimulation, cementing and well completions, including polymers that create viscosity, crosslinkers, friction reducers, surfactants, buffers, breakers and other chemical technologies, to leading pressure pumping service companies in the United States. We also provide
12
production chemicals solutions, which are applied to underperforming wells in order to enhance well performance and reduce production costs through the use of production treating chemicals, corrosion and scale monitoring, chemical inventory management, well failure analysis and lab services.
Service Lines
Our Oilfield Chemicals segment is divided into the following services lines:
•Completion Chemicals. Our completion chemicals service line develops, manufactures and provides a full suite of chemicals utilized in hydraulic fracturing, stimulation, cementing and well completions, including polymers that create viscosity, crosslinkers, friction reducers, surfactants, buffers, breakers and other chemical technologies, to leading pressure pumping service companies in the United States. Our product lines support the three major types of well completions (cross‑linked gel frac, linear fracs and slickwater fracs). We can provide 24/7/365 time‑critical logistical support to our customers. Our warehousing and service include inventory management with computerized tracking and monthly reporting. The use of automated communications systems combined with direct‑to‑wellsite delivery ensures seamless product availability for our customers, while our chemical expertise enables us to deliver a customized suite of products to meet customers’ technical and economical product needs. Our expertise in frac chemistry positions us to support our customers in the ever changing ways of how wells are completed with our wide range of manufactured products. We have two primary manufacturing facilities in Texas, five regional distribution centers and 29 heavy chemical transport trucks and provide products to our customers in all major U.S. shale basins.
•Production Chemicals. In our production chemicals service line, we analyze underperforming wells and design engineered chemical solutions to enhance production and well performance and reduce production costs. These chemical solutions include: production treating chemicals for use in oil and gas production; ancillary oilfield services including corrosion and scale monitoring, chemical inventory management and well failure analysis; and lab services. In the Permian, our centrally located lab provides complete water and bacteria analysis through the well life cycle beginning with frac water through the production cycle. Our strategy is to provide basin‑specific production chemicals solutions to operating companies that lower costs and increase production. Our solutions help customers avoid scaling and corrosion, hydrogen sulfide issues and paraffin build‑up. This service line differentiates our overall utility to operators by allowing us to manage the entire well life cycle. Our production chemicals service line complements our Water Solutions segment due to the pull‑through sales ability in the overlapping customer base, and it also complements our completion chemicals service line because we can advise customers on the completion fluid systems best suited for a well when it transitions from completion to production. We have two primary manufacturing facilities in Texas and one in Oklahoma. We serve the Permian, Eagle Ford and Mid‑Continent basins and offer analytical services, lab and field support through 23 field locations.
•Specialty Chemicals. Our specialty chemicals service line manufactures and distributes chemicals that are formulated specifically for the coiled tubing industry. We offer a complete line of fracturing, acid and coiled tubing products. We manufacture the emulsion polymers, xanthan gels and corrosion inhibitors that support the coil tubing operations.
13
Geographic Areas of Operation
We provide Oilfield Chemicals services in most of the major unconventional shale plays in the continental U.S. In the chart below, a “✓” indicates that we offer the service line in the indicated geographic region.
|
|
Geographic Region |
|||||||
|
Services Provided |
Permian |
MidCon |
Bakken |
Eagle Ford |
Marcellus / |
Haynesville |
Rockies |
|
|
Completion Chemicals |
✓ |
✓ |
✓ |
✓ |
✓ |
✓ |
✓ |
|
|
Production Chemicals |
✓ |
✓ |
— |
✓ |
— |
✓ |
— |
|
|
Specialty Chemicals |
✓ |
✓ |
— |
✓ |
— |
— |
— |
|
Customers
Our Oilfield Chemicals customers primarily include oilfield services companies, including pressure pumpers, and major integrated and independent U.S. and international oil and gas producers.
Competition
Our Oilfield Chemical segment has a variety of different competitors, from companies that are pure distributors of commodities and specialty chemicals, to large manufacturers. What makes Rockwater unique is that we offer a distribution arm as well as the ability to manufacture in-basin. We believe that the principal competitive factors in the markets we serve are technical expertise, equipment capacity, work force competency, efficiency, safety record, reputation, experience and price. Additionally, projects are often awarded on a bid basis, which tends to create a highly competitive environment. We seek to differentiate ourselves from our competitors by delivering the highest‑quality services and equipment possible, coupled with superior execution and operating efficiency in a safe working environment.
Wellsite Services
Our Wellsite Services segment provides a number of services across the U.S. and Canada and is operated primarily under our subsidiaries Peak, Affirm and Rockwater LLC. Peak provides workforce accommodations and surface rental equipment supporting drilling, completion and production operations to the U.S. onshore oil and gas industry. Affirm provides oil and gas operators with a variety of services, including crane and logistics services, wellsite and pipeline construction and field services. Operating under Rockwater LLC, we also offer sand hauling and logistics services in the Rockies and Bakken regions as well as water transfer, containment, fluids hauling and other rental services in Western Canada.
Service Lines
Our Wellsite Services segment is divided into the following service lines:
•Accommodations and Rentals. Our accommodations and rentals service line, operating under our subsidiary, Peak, provides workforce accommodations and surface rental equipment supporting drilling, completion and production operations to support onshore oil and gas activity. The services provided include fully furnished office and living quarters, fresh water supply and wastewater removal, portable power generation and light plants, internet, phone, intercom, surveillance and monitoring services and other long‑term rentals supporting field personnel.
•Wellsite Completion and Construction Services. Our wellsite completion and construction services service line, operating under our subsidiary, Affirm, supports our Water Solutions segment and provides oil and gas operators and midstream companies with a variety of services, including crane and logistics services,
14
wellsite and pipeline construction and field services. These services are performed to establish, maintain and improve production throughout the productive life of an oil or gas well, or to otherwise facilitate other services performed on a well.
•Sand Hauling. Our sand hauling service line, operating under our subsidiary, Rockwater LLC, provides proppant storage, transport, transloading, and sand and proppant supply and transportation logistics through our fleet of trucks.
•Canada Fluids Logistics. Our Canadian operations, operating under Rockwater Energy Solutions Canada, Inc., a subsidiary of Rockwater LLC, provide comprehensive fluids logistics through our fleet of tank trucks, vacuum trucks, hydro‑vac trucks, hot oilers, winch trucks and pressure trucks. Additionally, we provide water transfer, containment and other rental services throughout Western Canada.
Geographic Areas of Operation
We provide Wellsite Services in most of the major unconventional shale plays in the continental U.S. and in Western Canada. In the chart below, a “✓” indicates that we offer the service line in the indicated geographic region.
|
|
Geographic Region |
||||||||
|
Services Provided |
Permian |
MidCon |
Bakken |
Eagle Ford |
Marcellus / |
Haynesville |
Rockies |
Western |
|
|
Accommodations & Rentals |
✓ |
✓ |
— |
✓ |
✓ |
✓ |
✓ |
— |
|
|
Wellsite Completion & Construction Services |
✓ |
✓ |
— |
✓ |
✓ |
✓ |
✓ |
— |
|
|
Sand Hauling |
— |
— |
✓ |
— |
— |
— |
✓ |
— |
|
|
Canada Fluids Logistics |
— |
— |
— |
— |
— |
— |
— |
✓ |
|
Customers
Our Wellsite Services customers include major integrated and independent U.S. and international oil and gas producers, as well as midstream and other oilfield services companies.
Competition
Historically, our competition has varied significantly by service line. The market for accommodations and rentals has been serviced by a relatively fragmented competitor base ranging from small local companies and privately‑owned regional service companies to large private and public companies operating across diverse geographies. Our main competitors in the market for wellsite completion and construction services are typically smaller or mid‑sized, and often private, service providers that focus on construction and field services across a narrow geographic range. Our competitors in the market for sand hauling are typically regionally focused smaller or mid‑sized service providers. Our primary competitors in our Canadian operations are regionally focused smaller or mid‑sized service providers. We seek to differentiate ourselves from our competitors by delivering the highest‑quality services and equipment possible, coupled with superior execution and operating efficiency in a safe working environment.
Significant Customer
There were no customers that accounted for 10.0% or more of our consolidated revenues for the years ended December 31, 2017 and 2016. For the year ended December 31, 2015, one of our customers accounted for approximately 10.6% of our total consolidated revenues.
15
Sales and Marketing
Our sales activities are directed through a network of sales representatives and business development personnel, which provides us coverage at both the corporate and field level of our customers. Sales representatives work closely with local operations managers to target potential opportunities through strategic focus and planning. Customers are identified as targets based on their drilling and completion activity, geographic location, and economic viability. Direction of the sales team is conducted through multiple weekly meetings and daily reporting. Our sales strategy is also supported by a proprietary database that we have developed based upon current rig and permit activity and the location of our strategic water sources.
Our marketing activities are performed by an internal marketing group with input from a steering committee. Our strategy is based on building a national brand though multiple media outlets including our website, blog and social media accounts, radio, print and billboard advertisements, and various industry‑specific conferences, publications and lectures.
Engineered Water Solutions
Our Engineered Water Solutions group is comprised of professionals with significant technical and project development experience. The team consists of professionals with advanced degrees and experience in areas as diverse as geology, geography, petroleum and chemical engineering, computer science, environmental science, geographic information systems and regulatory affairs. This group has been designed to help customers develop and execute water solutions for wide‑scale development projects, with our professionals integrating themselves into our customers’ operations teams at the outset of the planning process.
Environmental and Occupational Safety and Health Matters
Our water‑related and wellsite completion and construction operations in support of oil and gas exploration, development and production activities pursued by our customers are subject to stringent and comprehensive federal, state, provincial and local laws and regulations in the United States and Western Canada governing occupational safety and health, the discharge of materials into the environment and environmental protection. Numerous governmental entities, including the U.S. Environmental Protection Agency (the “EPA”) and analogous state agencies, have the power to enforce compliance with these laws and regulations and the permits issued under them, often requiring difficult and costly actions. These laws and regulations may, among other things (i) require the acquisition of permits to take fresh water from surface water and groundwater, construct pipelines or containment facilities, drill wells and other regulated activities; (ii) restrict the types, quantities and concentration of various substances that can be released into the environment or injected into non‑producing formations; (iii) limit or prohibit our operations on certain lands lying within wilderness, wetlands and other protected areas; (iv) require remedial measures to mitigate pollution from former and ongoing operations; (v) impose specific safety and health criteria addressing worker protection; and (vi) impose substantial liabilities for pollution resulting from our operations. Any failure to comply with these laws and regulations may result in the assessment of sanctions, including administrative, civil and criminal penalties, the imposition of investigatory, remedial or corrective action obligations or the incurrence of capital expenditures; the occurrence of delays in the permitting or performance of projects; and the issuance of orders enjoining performance of some or all of our operations in a particular area.
The trend in United States and Canadian environmental regulation in recent years has been typically to place more restrictions and limitations on activities that may affect the environment, and thus any changes in environmental laws and regulations or re‑interpretation of enforcement policies that result in more stringent and costly construction, completion or water management activities, or waste handling, storage transport, disposal, or remediation requirements could have a material adverse effect on our financial position and results of operations. We may be unable to pass on such increased compliance costs to our customers. Moreover, accidental releases or spills may occur in the course of our operations, and we cannot assure you that we will not incur significant costs and liabilities as a result of such releases or spills, including any third‑party claims for damage to property, natural resources or persons. Our customers may also incur increased costs or delays or restrictions in permitting or operating activities as a result of more stringent
16
environmental laws and regulations, which may result in a curtailment of exploration, development or production activities that would reduce the demand for our services.
United States Operations
The following is a summary of the more significant existing environmental and occupational safety and health laws, as amended from time to time, to which our operations in the United States are subject and for which compliance may have a material adverse impact on our capital expenditures, results of operations or financial position.
Hazardous substances and wastes. The Resource Conservation and Recovery Act (“RCRA”), and comparable state statutes, regulate the generation, transportation, treatment, storage, disposal and cleanup of hazardous and non‑hazardous wastes. Pursuant to rules issued by the EPA, the individual states administer some or all of the provisions of RCRA, sometimes in conjunction with their own, more stringent requirements. Drilling fluids, produced waters, and most of the other wastes associated with the exploration, development, and production of oil or gas, if properly handled, are currently exempt from regulation as hazardous waste under RCRA, and instead are regulated under RCRA’s less stringent non‑hazardous waste provisions, state laws or other federal laws. However, it is possible that certain oil and gas drilling and production wastes now classified as non‑hazardous could be classified as hazardous wastes in the future. For example, following the filing of a lawsuit in the U.S. District Court for the District of Columbia in May 2016 by several non‑governmental environmental groups against the EPA for the agency’s failure to timely assess its RCRA Subtitle D criteria regulations for oil and gas wastes, the EPA and the environmental groups entered into an agreement that was finalized in a consent decree issued by the District Court in December 2016. Under the decree, the EPA is required to propose no later than March 15, 2019, a rulemaking for revision of certain Subtitle D criteria regulations pertaining to oil and gas wastes or sign a determination that revision of the regulations is not necessary. If the EPA proposes a rulemaking for revised oil and gas waste regulations, the Consent Decree requires that the EPA take final action following notice and comment rulemaking no later than July 15, 2021. A loss of the RCRA exclusion for drilling fluids, produced waters and related wastes could result in an increase in our and our oil and gas producing customers’ costs to manage and dispose of generated wastes, which could have a material adverse effect on our and our customers’ results of operations and financial position. In the course of our operations, we generate some amounts of ordinary industrial wastes, such as paint wastes, waste solvents and waste oils that may be regulated as hazardous wastes.
Wastes containing naturally occurring radioactive materials (“NORM”) may also be generated in connection with our operations. Certain processes used to produce oil and gas may enhance the radioactivity of NORM, which may be present in oilfield wastes. NORM is subject primarily to individual state radiation control regulations. In addition, NORM handling and management activities are governed by regulations promulgated by the Occupational Safety and Health Administration (“OSHA”). These state and OSHA regulations impose certain requirements concerning worker protection, the treatment, storage and disposal of NORM waste, the management of waste piles, containers and tanks containing NORM, as well as restrictions on the uses of land with NORM contamination.
The Comprehensive Environmental Response, Compensation and Liability Act (“CERCLA”), also known as the Superfund law, and comparable state laws impose liability, without regard to fault or legality of conduct, on classes of persons considered to be responsible for the release of a “hazardous substance” into the environment. These persons include the current and past owner or operator of the site where the hazardous substance release occurred and anyone who disposed or arranged for the disposal of a hazardous substance released at the site. Under CERCLA, such persons may be subject to joint and several, strict liability for the costs of cleaning up the hazardous substances that have been released into the environment, for damages to natural resources and for the costs of certain health studies. CERCLA also authorizes the EPA and, in some instances, third parties to act in response to threats to the public health or the environment and to seek to recover from the responsible classes of persons the costs they incur. In addition, neighboring landowners and other third parties may file claims for personal injury and property damage allegedly caused by the hazardous substances released into the environment. We generate materials in the course of our operations that may be regulated as hazardous substances.
We currently own, lease, or operate numerous properties that have been used for activities supporting oil and gas exploration, development and production for a number of years. Although we believe that we have utilized operating and waste disposal practices that were standard in the industry at the time, hazardous substances, wastes, or petroleum
17
hydrocarbons may have been released on, under or from the properties owned or leased by us, or on, under or from other locations, including off‑site locations, where we conduct services for our customers or where such substances have been taken for treatment or disposal. In addition, some of our properties have been operated by third parties or by previous owners or operators whose treatment and disposal of hazardous substances, wastes, or petroleum hydrocarbons was not under our control. These properties and the substances disposed or released on, under or from them may be subject to CERCLA, RCRA and analogous state laws. Under such laws, we could be required to undertake response actions or corrective measures, which could include removal of previously disposed substances and wastes, cleanup of contaminated property or performance of remedial operations to prevent future contamination, the costs of which could be material.
Water discharges and use. The Federal Water Pollution Control Act, also known as the Clean Water Act (“CWA”), and analogous state laws, impose restrictions and strict controls with respect to the discharge of pollutants, including spills and leaks of oil and hazardous substances, into state waters and waters of the United States. The discharge of pollutants into regulated waters is prohibited, except in accordance with the terms of a permit issued by the EPA or an analogous state agency. Spill prevention, control and countermeasure plan requirements imposed under the CWA require appropriate containment berms and similar structures to help prevent the contamination of navigable waters in the event of a petroleum hydrocarbon tank spill, rupture or leak. In addition, the CWA and analogous state laws require individual permits or coverage under general permits for discharges of storm water runoff from certain types of facilities.
The CWA also prohibits the discharge of dredge and fill material in regulated waters, including wetlands, unless authorized by permit. In June 2015, the EPA and the U.S. Army Corps of Engineers (the “Corps”) published a final rule attempting to clarify the federal jurisdictional reach over waters of the United States, but legal challenges to this rule followed, and the rule was stayed nationwide by the U.S. Sixth Circuit Court of Appeals in October 2015 pending resolution of the court challenges. In January 2017, the U.S. Supreme Court accepted review of the rule to determine whether jurisdiction rests with the federal district or appellate courts, and, in a decision issued on January 22, 2018, held that legal challenges of the rule must be heard at the district rather than appellate court level. Additionally, following the issuance of a presidential executive order to review the rule, the EPA and the Corps proposed a rulemaking in June 2017 to repeal the June 2015 rule. The EPA and the Corps also announced their intent to issue a new rule defining the CWA’s jurisdiction. On February 6, 2018, the EPA and Corps published a final rule specifying that the contested June 2015 rule would not take effect until February 6, 2020. As a result, future implementation of the June 2015 rule is uncertain at this time. To the extent this rule or a revised rule expands the scope of the CWA’s jurisdiction, we could face increased costs and delays with respect to obtaining permits for dredge and fill activities in wetland areas in connection with any expansion activities. Federal and state regulatory agencies can impose administrative, civil and criminal penalties for non‑compliance with discharge permits or other requirements of the CWA and analogous state laws and regulations.
The Oil Pollution Act of 1990 (“OPA”) amends the CWA and sets minimum standards for prevention, containment and cleanup of oil spills in waters of the United States. The OPA applies to vessels, offshore facilities, and onshore facilities, including E&P facilities that may affect waters of the United States. Under OPA, responsible parties including owners and operators of onshore facilities may be held strictly liable for oil cleanup costs and natural resource damages as well as a variety of public and private damages that may result from oil spills. The OPA also requires owners or operators of certain onshore facilities to prepare Facility Response Plans for responding to a worst‑case discharge of oil into waters of the United States.
Salt water disposal wells and induced seismicity. Salt water disposal via underground injection is regulated pursuant to the Underground Injection Control (“UIC”) program established under the U.S. Safe Drinking Water Act (the “SDWA”) and analogous state and local laws and regulations. The UIC program includes requirements for permitting, testing, monitoring, record keeping and reporting of injection well activities, as well as a prohibition against the migration of fluid containing any contaminant into underground sources of drinking water. State regulations require a permit from the applicable regulatory agencies to operate underground injection wells. Although we monitor the injection process of our wells, any leakage from the subsurface portions of the injection wells could cause degradation of fresh groundwater resources, potentially resulting in suspension of our UIC permit, issuance of fines and penalties from governmental agencies, incurrence of expenditures for remediation of the affected resource and imposition of liability by
18
third‑parties claiming damages for alternative water supplies, property and personal injuries. A change in UIC disposal well regulations or the inability to obtain permits for new disposal wells in the future may affect our ability to dispose of produced waters and other substances, which could affect our business.
Furthermore, in response to recent seismic events near underground disposal wells used for the disposal by injection of produced water resulting from oil and gas activities, federal and some state agencies are investigating whether such wells have caused increased seismic activity, and some states have restricted, suspended or shut down the use of such disposal wells. In response to these concerns, regulators in some states have imposed, or are considering imposing, additional requirements in the permitting of produced water disposal wells or otherwise to assess any relationship between seismicity and the use of such wells. For example, Oklahoma issued new rules for wastewater disposal wells in 2014 that imposed certain permitting and operating restrictions and reporting requirements on disposal wells in proximity to faults and also, from time to time, has developed and implemented plans directing certain wells where seismic incidents have occurred to restrict or suspend disposal well operations. The Texas Railroad Commission adopted similar rules in 2014. In December 2016, the Oklahoma Corporation Commission’s Oil and Gas Conservation Division and the Oklahoma Geological Survey released well completion seismicity guidance, which requires operators to take certain prescriptive actions, including an operator’s planned mitigation practices, following certain unusual seismic activity within 1.25 miles of hydraulic fracturing operations. In addition, the Oklahoma Corporation Commission’s Oil and Gas Conservation Division issued an order in February 2017 limiting future increases in the volume of oil and natural gas wastewater injected below ground into the Arbuckle formation in an effort to reduce the number of earthquakes in the state, and imposed further reductions in the Edmonds area of the state in August 2017. In addition, ongoing lawsuits allege that disposal well operations have caused damage to neighboring properties or otherwise violated state and federal rules regulating waste disposal. The adoption and implementation of any new laws, regulations or directives that restrict our ability to dispose of wastewater gathered from our customers by limiting volumes, disposal rates, disposal well locations or otherwise, or requiring us to shut down disposal wells, could have a material adverse effect on our business, financial condition, and results of operations.
Hydraulic fracturing activities. As noted, hydraulic fracturing involves the injection of water, sand or other proppants and chemical additives under pressure into targeted geological formations to fracture the surrounding rock and stimulate production. Hydraulic fracturing is currently generally exempt from regulation under the UIC program established under the SDWA. Hydraulic fracturing is regulated by state oil and gas commissions or similar agencies.
However, several federal agencies have asserted regulatory authority over certain aspects of the process. For example, in 2014, the EPA asserted regulatory authority pursuant to the SDWA’s UIC program over hydraulic fracturing activities involving the use of diesel and issued guidance covering such activities. Additionally, in June 2016, the EPA published an effluent limit guideline final rule prohibiting the discharge of wastewater from onshore unconventional oil and gas extraction facilities to publicly owned wastewater treatment plants and, in 2014, published an Advance Notice of Proposed Rulemaking regarding the Toxic Substances Control Act (“TSCA”) reporting of the chemical substances and mixtures used in hydraulic fracturing. Also, the Bureau of Land Management (“BLM”) published a final rule in 2015 that established new or more stringent standards relating to hydraulic fracturing on federal and American Indian lands. However, in June 2016, a Wyoming federal judge struck down this final rule, finding that the BLM lacked authority to promulgate the rule, the BLM appealed this decision to the U.S. Court of Appeals for the Tenth Circuit in July 2016, the appellate court issued a ruling in September 2017 to vacate the Wyoming trial court decision and dismiss the lawsuit challenging the 2015 rule in response to the BLM’s issuance of a proposed rulemaking to rescind the 2015 rule and, in December 2017, the BLM published a final rule rescinding the 2015 rule. In January 2018, litigation challenging the BLM’s recission of the 2015 rule was brought in federal court. In January 2018, litigation challenging the BLM’s recissionof the 2015 rule was brought in federal court.
From time to time, legislation has been introduced, but not enacted, in Congress to provide for federal regulation of hydraulic fracturing and to require disclosure of the chemicals used in the fracturing process. In the event that new federal restrictions on the hydraulic‑fracturing process are adopted in areas where we or our customers conduct business, we or our customers may incur additional costs or permitting requirements to comply with such federal requirements that may be significant in nature and our customers could experience added delays or curtailment in their exploration, development, or production activities, which would in turn reduce the demand for our services.
19
Moreover, some states and local governments have adopted, and other governmental entities are considering adopting, regulations that could impose more stringent permitting, disclosure and well‑construction requirements on hydraulic fracturing operations, including states where we or our customers operate. For example, Texas, Oklahoma, California, Ohio, Pennsylvania and North Dakota, among others, have adopted regulations that impose new or more stringent permitting, disclosure, disposal and well‑construction requirements on hydraulic fracturing operations. States could also elect to prohibit high volume hydraulic fracturing altogether, following the approach taken by the State of New York. In addition to state laws, local land use restrictions, such as city ordinances, may restrict drilling in general and/or hydraulic fracturing in particular, as certain local governments in California have done. Other states, such as Texas, Oklahoma and Ohio have taken steps to limit the authority of local governments to regulate oil and gas development.
In December 2016, the EPA released its final report on the potential impacts of hydraulic fracturing on drinking water resources. The final report concluded that “water cycle” activities associated with hydraulic fracturing may impact drinking water resources “under some circumstances,” noting that the following hydraulic fracturing water cycle activities and local‑ or regional‑scale factors are more likely than others to result in more frequent or more severe impacts: water withdrawals for fracturing in times or areas of low water availability; surface spills during the management of fracturing fluids, chemicals or produced water; injection of fracturing fluids into wells with inadequate mechanical integrity; injection of fracturing fluids directly into groundwater resources; discharge of inadequately treated fracturing wastewater to surface waters; and disposal or storage of fracturing wastewater in unlined pits. The EPA’s study report did not find a direct link between the action of hydraulically fracturing the well itself and contamination of groundwater resources. Increased regulation and attention given to the hydraulic fracturing process could lead to greater opposition to oil and gas production activities using hydraulic fracturing techniques. Additional legislation or regulation could also lead to operational delays or increased operating costs for our customers in the production of oil and gas, including from the developing shale plays, or could make it more difficult to perform hydraulic fracturing. The adoption of any federal, state or local laws or the implementation of regulations regarding hydraulic fracturing could potentially cause a decrease in the completion of new oil and gas wells and an associated decrease in demand for our services, increased compliance costs and time, which could have a material adverse effect on our liquidity, consolidated results of operations, and consolidated financial condition.
Air Emissions. The U.S. Clean Air Act (“CAA”) and comparable state laws restrict the emission of air pollutants from many sources through air emissions standards, construction and operating permit programs and the imposition of other compliance standards. These laws and regulations may require us to obtain pre‑approval for the construction or modification of certain projects or facilities expected to produce or significantly increase air emissions, obtain and strictly comply with stringent air permit requirements or utilize specific equipment or technologies to control emissions of certain pollutants. The need to obtain permits has the potential to delay our projects as well as our customers’ development of oil and gas projects. Over the next several years, we or our customers may incur certain capital expenditures for air pollution control equipment or other air emissions‑related issues. For example, in 2015, the EPA issued a final rule under the CAA, lowering the National Ambient Air Quality Standard (“NAAQS”) for ground‑level ozone from the current standard of 75 parts per million to 70 parts per million under both the primary and secondary standards to provide requisite protection of public health and welfare, respectively. The EPA published a final rule on November 16, 2017 that issued area designations with respect to ground-level ozone for approximately 85% of the U.S. counties as either “attainment/unclassifiable” or “unclassifiable” that became effective on January 18, 2018, and is expected to issue attainment or non-attainment designations for the remaining areas of the U.S. not addressed in the November 2017 final rule in the first half of 2018. Reclassification of areas or imposition of more stringent standards may make it more difficult to construct new facilities or modify existing facilities in these newly designated non‑attainment areas. Also, states are expected to implement more stringent requirements as a result of this new final rule, which could apply to our and our customers’ operations. In another example, in June 2016, the EPA published a final rule updating federal permitting regulations for stationary sources in the oil and natural gas industry by defining and clarifying the meaning of the term “adjacent” for determining when separate surface sites and the equipment at those sites will be aggregated for permitting purposes. Compliance with these or other air pollution control and permitting requirements has the potential to delay the development of oil and natural gas projects and increase our or our customers’ costs of development and production, which costs could reduce demand for our services and have a material adverse impact on our business and results of operations.
20
Climate Change. In response to findings that emissions of carbon dioxide, methane and other greenhouse gases (“GHGs”) present an endangerment to public health and the environment, the EPA has adopted regulations under existing provisions of the CAA that, among other things, establish Prevention of Significant Deterioration (“PSD”) construction and Title V operating permit reviews for certain large stationary sources that emit certain principal, or “criteria,” pollutants. Facilities required to obtain PSD permits for their GHG emissions also will be required to meet “best available control technology” standards. In addition, the EPA has adopted rules requiring the monitoring and annual reporting of GHG emissions from oil and gas production, processing, transmission and storage facilities in the United States.
Congress has from time to time considered legislation to reduce emissions of GHGs but there has not been significant activity in the form of adopted legislation to reduce GHG emissions at the federal level in recent years. In the absence of such federal climate legislation, a number of state and regional efforts have emerged that are aimed at tracking and/or reducing GHG emissions through the completion of GHG emissions inventories and by means of cap and trade programs that typically require major sources of GHG emissions to acquire and surrender emission allowances in return for emitting those GHGs. The EPA has also developed strategies for the reduction of methane emissions, including emissions from the oil and gas industry. For example, in June 2016, the EPA published New Source Performance Standards (“NSPS”) Subpart OOOOa requirements to reduce methane and volatile organic compound (“VOC”) emissions from certain new, modified and reconstructed equipment and processes in the oil and gas source category, including production, processing, transmission and storage activities. These Subpart OOOOa standards will expand previously issued NSPS published by the EPA in 2012, and known as Subpart OOOO, by using certain equipment‑specific emissions control practices. However, the Quad OOOOa standards have been subject to attempts by the EPA to stay portions of those standards, and the agency proposed rulemaking in June 2017 to stay the requirements for a period of two years and revisit implementation of Subpart OOOOa in its entirety. The EPA has not yet published a final rule, and, as a result of these developments, EPA’s 2016 standards are currently in effect, but future implementation of the 2016 standards is uncertain at this time. Because of the long‑term trend toward increasing regulation, however, future federal GHG regulations of the oil and natural gas industry remain a possibility. Furthermore, in June 2017, the BLM published a final rule that established, among other things, requirements to reduce methane emissions arising from venting, flaring and leakage from oil and gas production activities on onshore federal and American Indian lands. However, on December 8, 2017, the BLM published a final rule to temporarily suspend or delay certain requirements contained in the November 2016 final rule until January 17, 2019, including those requirements relating to venting, flaring and leakage from oil and gas production activities. On February 22, 2018, the U.S. District Court for the Northern District of California enjoined the delay of certain requirements contained in the November 2016 rule. As a result, the November 2016 rule, as originally proumulgated, is in effect. Also, on February 22, 2018, the BLM published a proposed rule that would generally re-establish the requirements that the November 2016 rule replaced. Litigation regarding the November 2016 rule is ongoing and uncertainty exists with respect to future implementation of the rule. However, given the long‑term trend towards increasing regulation, future federal GHG regulations of the oil and gas industry remain a possibility.
Additionally, in December 2015, the United States joined the international community at the 21st Conference of the Parties of the United Nations Framework Convention on Climate Change in Paris, France that proposed an agreement, requiring member countries to review and “represent a progression” in their intended nationally determined contributions, which set GHG emission reduction goals every five years beginning in 2020. This agreement was signed by the United States in April 2016 and entered into force in November 2016; however, the GHG emission reductions called for by the Paris Agreement are not binding. In August 2017, the U.S. Department of State officially informed the United Nations of the intent of the United States to withdraw from the Paris Agreement. The Paris Agreement provides for a four‑year exit process beginning when it took effect in November 2016, which would result in an effective exit date of November 2020. The United States’ adherence to the exit process and/or the terms on which the United States may re‑enter the Paris Agreement or a separately negotiated agreement are unclear at this time.
Although it is not possible at this time to predict how new laws or regulations in the United States or any legal requirements imposed by the Paris Agreement on the United States, should it not withdraw from the agreement, that may be adopted or issued to address GHG emissions would impact our business, any such future laws, regulations or other legal requirements imposing reporting or permitting obligations on, or limiting emissions of GHGs from, our or our customers’ equipment and operations could require us or our customers to incur costs to reduce emissions of GHGs
21
associated with operations as well as result in delays or restrictions in the ability to permit GHG emissions from new or modified sources. In addition, substantial limitations on GHG emissions could adversely affect demand for the oil and gas our customers produce, which could reduce demand for our services. Moreover, activists concerned about the potential effects of climate change have directed their attention at sources of funding for fossil-fuel energy companies, which has resulted in certain financial institutions, funds and other sources of capital restricting or eliminating their investment in oil and natural gas activities. Ultimately, this could make it more difficult to secure funding for exploration and production activities. Notwithstanding potential risks related to climate change, the International Energy Agency estimates that global energy demand will continue to rise and will not peak until after 2040 and that oil and gas will continue to represent a substantial percentage of global energy use over that time. Finally, it should be noted that increasing concentrations of GHGs in the Earth’s atmosphere may produce climate changes that have significant physical effects, such as increased frequency and severity of storms, floods, droughts and other climatic events. If any such effects were to occur, they could have an adverse effect on our and our customers’ operations.
Endangered Species. The federal Endangered Species Act (the “ESA”) restricts activities that may affect endangered or threatened species or their habitats. Similar protections are offered to migratory birds under the federal Migratory Bird Treaty Act (the “MBTA”). To the extent species that are listed under the ESA or similar state laws, or are protected under the MBTA, live in the areas where we or our oil and gas producing customers operate, our and our customers’ abilities to conduct or expand operations and construct facilities could be limited or be forced to incur material additional costs. Moreover, our customers’ drilling activities may be delayed, restricted, or precluded in protected habitat areas or during certain seasons, such as breeding and nesting seasons. Some of our operations and the operations of our customers are located in areas that are designated as habitats for protected species. In addition, as a result of one or more settlements entered into by the U.S. Fish & Wildlife Service (the “FWS”), the agency is required to make a determination on the listing of numerous other species as endangered or threatened under the ESA pursuant to specific timelines. The designation of previously unidentified endangered or threatened species could indirectly cause us to incur additional costs, cause our or our oil and gas producing customers’ operations to become subject to operating restrictions or bans and limit future development activity in affected areas. The FWS and similar state agencies may designate critical or suitable habitat areas that they believe are necessary for the survival of threatened or endangered species. Such a designation could materially restrict use of or access to federal, state, and private lands.
Chemical Safety. We are subject to a wide array of laws and regulations governing chemicals, including the regulation of chemical substances and inventories, such as TSCA in the United States and the Canadian Environmental Protection Act in Canada. These laws and regulations change frequently, and have the potential to limit or ban altogether the types of chemicals we may use in our products, as well as result in increased costs related to testing, storing, and transporting our products prior to providing them to our customers. For example, in June 2016, President Obama signed into law the Frank R. Lautenberg Chemical Safety for the 21st Century Act (the “Lautenberg Act”), which substantially revised TSCA. Amongst other items, the Lautenberg Act eliminated the cost‑benefit approach to analyzing chemical safety concerns with a health‑based safety standard and requires all chemicals in commerce, including those “grandfathered” under TSCA, to undergo a safety review. The Lautenberg Act also requires safety findings before a new chemical can enter the market. Although it is not possible at this time to predict how EPA will implement and interpret the new provisions of the Lautenberg Act, or how legislation or new regulations that may be adopted pursuant to these regulatory and legislative efforts would impact our business, any new restrictions on the development of new products, increases in regulation, or disclosure of confidential, competitive information could have an adverse effect on our operations and our cost of doing business.
Furthermore, governmental, regulatory and societal demands for increasing levels of product safety and environmental protection could result in increased pressure for more stringent regulatory control with respect to the chemical industry. In addition, these concerns could influence public perceptions regarding our products and operations, the viability of certain products, our reputation, the cost to comply with regulations, and the ability to attract and retain employees. Moreover, changes in environmental, health and safety regulations could inhibit or interrupt our operations, or require us to modify our facilities or operations. Accordingly, environmental or regulatory matters may cause us to incur significant unanticipated losses, costs or liabilities, which could reduce our profitability.
Occupational Safety and Health and other legal requirements. We are subject to the requirements of the Federal Occupational Safety and Health Act and comparable state statutes whose purpose is to protect the health and safety of workers. In addition, the OSHA’s hazard communication standard, the EPA’s Emergency Planning and Community Right‑to‑Know Act and comparable state regulations and any implementing regulations require that we
22
organize and/or disclose information about hazardous materials used or produced in our United States operations and that this information be provided to employees, state and local governmental authorities and citizens. We have an internal program of inspection designed to monitor and enforce compliance with worker safety requirements.
In addition, as part of the services we provide, we operate as a motor carrier and therefore are subject to regulation by the U.S. Department of Transportation (“U.S. DOT”) and analogous U.S. state agencies. These regulatory authorities exercise broad powers, governing activities such as the authorization to engage in motor carrier operations, regulatory safety, and hazardous materials labeling, placarding and marking. There are additional regulations specifically relating to the trucking industry, including testing and specification of equipment and product handling requirements. The trucking industry is subject to possible regulatory and legislative changes that may affect the economics of the industry by requiring changes in operating practices or by changing the demand for common or contract carrier services or the cost of providing truckload services. From time to time, various legislative proposals are introduced, including proposals to increase federal, state or local taxes on motor fuels, among other things, which may increase our costs or adversely impact the recruitment of drivers. We cannot predict whether, or in what form, any increase in such taxes applicable to us will be enacted.
Western Canadian Operations
Environmental regulation in Canada, including the Western Canadian provinces of Alberta and British Columbia, is carried out at both the federal and provincial levels. Unless the exploration and production of hydrocarbon resources is occurring on federal lands, such as lands held by First Nations, national parks, national defense lands or offshore, the main oversight over the extraction of natural resources falls within provincial jurisdiction. However, the federal government has shared oversight over assessing whether substances are toxic to both humans and the environment and the control of the use of such substances pursuant to the Canadian Environmental Protection Act. In addition, the Transportation of Dangerous Goods Act, administered by Transport Canada, regulates road, rail, air and marine transportation of fracturing fluids, produced water, fracturing fluid waste and flowback. The following is a summary of the more significant environmental regulations in Alberta and British Columbia, Canada, as amended from time to time, to which our operations in Canada are subject and for which compliance may have a material adverse impact on our capital expenditures, results of operations or financial position.
Hydraulic fracturing activities. Operations related to water, stimulation, and fracturing fluids in support of oil and gas exploration, development and production are subject to provincial environmental regulations. Currently, our operations occur in the western provinces of Alberta and British Columbia. In Alberta, the Alberta Energy Regulator (“AER”) has jurisdiction over the Environmental Protection and Enhancement Act, and associated regulations and Directives, as well as parts of the Water Act, relating to the extraction of hydrocarbons. In particular, the AER has regulatory directives relating to groundwater protection, wellbore integrity, noise and light impacts, air quality and induced seismicity. The AER’s Directives require licensees conducting hydraulic fracturing to report amounts and sources of water and chemicals used in each job. The type and volume of all additives used in fracturing fluids must also be submitted to the AER. Licensees in Alberta are also subject to stringent storage and drilling waste management requirements. Companies who own and operate permanent facilities are subject to additional regulations.
In British Columbia, the British Columbia Oil and Gas Commission (the “BCOGC”) is the provincial regulatory body responsible for overseeing oil and gas operations. Like Alberta, British Columbia has developed a single‑window approach to administer the provisions of wide ranging acts and regulations which include the regulation of the exploration, development, transportation and reclamation of oil and gas activities. The regulation of hydraulic fracturing in British Columbia is conducted under numerous provincial acts and technical regulations. The BCOGC administers British Columbia’s main legislative framework relating to oil and gas, the Oil and Gas Activities Act, and its associated regulations which regulate public safety and environmental protection related to hydraulic fracturing, such as the Drilling and Production Regulation and the Environmental Protection and Management Regulation. Further, other specific provisions of the Water Act, the Petroleum and Natural Gas Act, the Heritage Conservation Act, the Land Act and the Environmental Management Act also regulate elements of hydraulic fracturing. Fracture Fluid Reports are required to be submitted and are publicly searchable online. Chemical disclosure including trade name, supplier, purpose, ingredients and volume of water with injected ingredients must be submitted to an online database.
23
Water usage. Besides the AER, the other major legislative and regulatory requirements in Alberta related to our operations in Western Canada fall under the administration of the Alberta Environment and Parks ministry. Environment and Parks oversees parts of the Water Act and the Water Conservation and Allocation Policy for Oilfield Injection for long‑term water injection projects for the recovery of oil, requiring industry to seek deep saline groundwater and technological alternatives to minimize use of fresh water. While this policy is applicable to conventional water flooding and oil sands in‑situ operations, expanding the policy to apply water conservation principles to subsectors of the upstream oil and gas industry, including hydraulic fracturing, has been proposed. In British Columbia, the Water Sustainability Act came into effect in 2016 and has resulted in changes to surface water and groundwater allocation, requiring authorizations to be obtained to use groundwater for anything other than domestic use. The BCOGC has recently strengthened regulations relating to induced seismicity due to hydraulic fracturing based on two reports and continues to conduct monitoring and research in order to adequately respond and mitigate this issue.
Induced seismicity. Due to increased seismicity believed to be associated with hydraulic fracturing, in 2015 the AER released new guidelines requiring new seismic monitoring and reporting requirements for hydraulic fracturing. The BCOGC completed two reports on seismic events related to hydraulic fracturing, and has imposed mitigation measures, including regulations to shut down industry operations if seismic activity reaches a certain threshold.
Climate change. The Canadian federal government, as well as the provincial governments have either proposed or have instituted a carbon tax in response to the global push to combat climate change. While a carbon tax in British Columbia has been in place since 2008, which is currently $30 per tonne of carbon dioxide equivalent, as of January 1, 2017, Alberta has instituted a provincial carbon tax of $20 per tonne, rising to $30 per tonne in 2018. The federal government has proposed a minimum price on carbon, beginning in 2018 at $10 per tonne, rising to $50 per tonne in 2022, which will be implemented by the federal government if the provinces do not already have an equivalent framework in place. The carbon tax will have a significant impact on energy intensive businesses.
The Government of Alberta also announced in 2015 that under its Climate Leadership Plan, the province will have zero emissions from coal‑fired electricity by 2030. As approximately 55% of Alberta’s electricity in being produced from coal‑fired generators, natural gas‑fired electricity is expected to increase significantly to fill this gap. Oil and gas producers will be required to reduce methane emissions associated with their facilities by 45% by 2025 and a cap of 100 megatonnes per year of carbon emissions from oil sands production has been imposed. The federal government also announced that it intends to virtually eliminate the use of coal‑fired electricity by 2030, which currently accounts for 11% of Canada’s electricity capacity.
Seasonality
Our results of operations have historically reflected seasonal tendencies, typically in the fourth quarter, relating to holiday seasons, inclement winter weather and the conclusion of our customers’ annual drilling and completions capital expenditure budgets during which we typically experience declines in our operating results. In a stable commodity price and operations environment, October has historically been our most active month, with notable declines in November and December for the reasons described above.
Intellectual Property
Protection of our products and processes is important to our businesses. We own numerous patents and, where appropriate, we file patent applications for new products and technologies. For example, we use our AquaView® technology to quantify volumes and flow rates to verify current and potential water availability and volumes when analyzing a new water source. We also currently own six U.S. patents relating to completions technology including borate cross‑linkers, slurry monitoring systems and others. We also have a robust program to seek patents on new developments. We are currently seeking patents on eight new technologies, including a water treatment process and a proprietary water analytics and automation tool, as well as creating fracturing fluids with produced water, evaporation methodologies, cross‑linker/breaker mechanisms and liquid distribution metering systems. We hold numerous patents and, while a presumption of validity exists with respect to issued U.S. patents, we cannot assure that any of our patents will not be challenged, invalidated, circumvented or rendered unenforceable. Furthermore, we cannot assure the issuance of any pending patent application, or that if patents do issue, that these patents will provide meaningful protection against competitors or against competitive technologies. Additionally, our competitors or other third parties may obtain patents that restrict or preclude our ability to lawfully produce or sell our products in a competitive manner.
24
We also rely upon unpatented proprietary know‑how, continuing technological innovation and trade secrets to develop and maintain our competitive position. There can be no assurance, however, that confidentiality and other agreements into which we enter and have entered will not be breached, that these agreements will provide meaningful protection for our trade secrets or proprietary know‑how, or that adequate remedies will be available in the event of an unauthorized use or disclosure of such trade secrets and know‑how. In addition, there can be no assurance that others will not obtain knowledge of these trade secrets through independent development or other access by legal means.
We also own a number of trademarks, which we use in connection with our businesses. In addition to protections through federal registration, we also rely on state common law protections to protect our brand. There can be no assurance that the trademark registrations will provide meaningful protection against the use of similar trademarks by competitors, or that the value of our trademarks will not be diluted.
Because of the breadth and nature of our intellectual property rights and our business, we do not believe that any single intellectual property right (other than certain trademarks for which we intend to maintain the applicable registrations) is material to our business. Moreover, we do not believe that the termination of intellectual property rights expected to occur over the next several years, either individually or in the aggregate, will materially adversely affect our business, financial condition or results of operations.
Risk Management and Insurance
Our operations are subject to hazards inherent in the oil and gas industry, including accidents, blowouts, explosions, craterings, fires, oil spills and hazardous materials spills. These conditions can cause:
•personal injury or loss of life;
•damage to, or destruction of property, the environment and wildlife; and
•the suspension of our or our customers’ operations.
In addition, claims for loss of oil and gas production and damage to formations can occur in the well services industry. If a serious accident were to occur at a location where our equipment and services are being used, it could result in us being named as a defendant in lawsuits asserting large claims.
Because our business involves the transportation of heavy equipment and materials, we may also experience traffic accidents which may result in spills, property damage and personal injury.
Despite our efforts to maintain high safety standards, from time to time, we have suffered accidents, and there is a risk that we will experience accidents in the future. In addition to the property and personal losses from these accidents, the frequency and severity of these incidents affect our operating costs and insurability, and our relationship with customers, employees and regulatory agencies. In particular, in recent years many of our large customers have placed an increased emphasis on the safety records of their service providers. Any significant increase in the frequency or severity of these incidents, or the general level of compensatory payments, could adversely affect the cost of, or our ability to obtain, workers’ compensation and other forms of insurance, and could have other material adverse effects on our financial condition and results of operations.
We maintain insurance coverage of types and amounts that we believe to be customary in the industry including workers’ compensation, employer’s liability, sudden & accidental pollution, umbrella, comprehensive commercial general liability, business automobile and property and equipment physical damage insurance. Our insurance coverage may be inadequate to cover our liabilities. In addition, we may not be able to maintain adequate insurance in the future at rates we consider reasonable and commercially justifiable or on terms as favorable as our current arrangements.
We enter into master service agreements (“MSAs”) with each of our customers. Our MSAs delineate our and our customer’s respective indemnification obligations with respect to the services we provide. Generally, under our
25
MSAs, including those relating to our Water Solutions and Related Services, Oilfield Chemical Product Sales, Accommodations and Rentals and Completion and Construction Services, we assume responsibility for pollution or contamination originating above the surface from our equipment or handling of the equipment of others. However, our customers assume responsibility for all other pollution or contamination that may occur during operations, including that which may result from seepage or any other uncontrolled flow of drilling fluids. The assumed responsibilities include the control, removal and clean‑up of any pollution or contamination. In such cases, we may be exposed to additional liability if we are grossly negligent or commit willful acts causing the pollution or contamination. Generally, our customers also agree to indemnify us against claims arising from the personal injury or death of the customers’ employees or those of the customers’ other contractors, in the case of our hydraulic fracturing operations, to the extent that such employees are injured by such operations, unless the loss is a result of our gross negligence or willful misconduct. Similarly, we generally agree to indemnify our customers for liabilities arising from personal injury to or death of any of our employees or employees of any of our subcontractors, unless resulting from the gross negligence or willful misconduct of our customer. The same principals apply to mutual indemnification for loss or destruction of customer‑owned property or equipment, except such indemnification is not limited in an instance of gross negligence or willful misconduct. Losses arising from catastrophic events, such as blowouts, are generally the responsibility of the customer. However, despite this general allocation of risk, we may be unsuccessful in enforcing contractual terms, incur an unforeseen liability that is not addressed by the scope of the contractual provisions or be required to enter into an MSA with terms that vary from our standard allocations of risk, as described above. Consequently, we may incur substantial losses that could materially and adversely affect our financial condition and results of operations.
Employees
As of December 31, 2017, we had approximately 5,100 employees and no unionized labor. We believe we have good relations with our employees.
Available Information
We file or furnish annual, quarterly and current reports and other documents with the SEC under the Exchange Act. The public may read and copy any materials we file with the SEC at the SEC’s Public Reference Room at 100 F Street, NE, Washington, D.C. 20549, on official business days during the hours of 10 a.m. to 3 p.m. The public may obtain information on the operation of the Public Reference Room by calling the SEC at 1-800-SEC-0330. The SEC also maintains an internet website at www.sec.gov that contains reports, proxy and information statements and other information regarding issuers, including us, that file electronically with the SEC.
We also make available free of charge through our website, www.selectenergyservices.com, electronic copies of certain documents that we file with the SEC, including our Annual Reports on Form 10-K, Quarterly Reports on Form 10-Q, Current Reports on Form 8-K and amendments to those reports filed or furnished pursuant to Section 13(a) or 15(d) of the Exchange Act as soon as reasonably practicable after we electronically file such material with, or furnish it to, the SEC. Information on our website is not a part of this Form 10-K.
The following risks could affect our financial performance or could cause actual results to differ materially from estimates contained in our forward-looking statements. We may encounter risks in addition to those described below. Additional risks and uncertainties not currently known to us, or that we currently deem to be immaterial, may also impair or adversely affect our business, results of operation, financial condition and prospects.
26
Risks Related to Our Business
Our business depends on capital spending by the oil and gas industry in the United States and Western Canada, and reductions in capital spending could have a material adverse effect on our liquidity, results of operations and financial condition.
Our business is directly affected by our customers’ capital spending to explore for, develop and produce oil and gas in the United States and Canada. The significant decline in oil and gas prices that began in the fourth quarter of 2014 caused a reduction in the exploration, development and production activities of most of our customers and their spending on our services in 2015 and 2016, as well as a reduction in the rates we charged and the utilization of our assets. In 2017, our clients modestly increased their spending as compared to 2016 levels, and we expect continued increases in 2018. However, if oil and gas prices again decline, our customers may cancel or curtail their spending on our services. Reduced discovery rates of new oil and gas reserves in our market areas as a result of decreased capital spending may also have a negative long‑term impact on our business, even in an environment of stronger oil and gas prices, to the extent the reduced number of wells for us to service more than offsets increasing completion activity and intensity. Any of these conditions or events could adversely affect our operating results. If a recovery does not materialize and our customers fail to increase their capital spending, it could have a material adverse effect on our liquidity, results of operations and financial condition.
Industry conditions are influenced by numerous factors over which we have no control, including:
•the domestic and foreign economic conditions and supply of and demand for oil and gas;
•the level of prices, and expectations about future prices, of oil and gas;
•the level of global oil and gas exploration and production;
•governmental regulations, including the policies of governments regarding the exploration for and production and development of their oil and gas reserves;
•taxation and royalty charges;
•political and economic conditions in oil and gas producing countries;
•actions by the members of Organization of Petroleum Exporting Countries with respect to oil production levels and announcements of potential changes in such levels;
•global weather conditions and natural disasters;
•worldwide political, military and economic conditions;
•the cost of producing and delivering oil and gas;
•the discovery rates of new oil and gas reserves;
•activities by non‑governmental organizations to limit certain sources of funding for the energy sector or restrict the exploration, development and production of oil and gas;
•the ability of oil and gas producers to access capital;
•technical advances affecting energy consumption; and
•the potential acceleration of development of alternative fuels.
27
If oil prices or gas prices were to decline, the demand for our services could be adversely affected.
The demand for our services is primarily determined by current and anticipated oil and gas prices and the related levels of capital spending and drilling activity in the areas in which we have operations. Volatility or weakness in oil prices or gas prices (or the perception that oil prices or gas prices will decrease) affects the spending patterns of our customers and may result in the drilling of fewer new wells or lower production spending on existing wells. This, in turn, could lead to lower demand for our services and may cause lower rates and lower utilization of our assets. If oil prices decline or gas prices decline, or if the recent increase in drilling activity reverses, the demand for our services and our results of operations could be materially and adversely affected.
Prices for oil and gas historically have been extremely volatile and are expected to continue to be volatile. During the past three years, the posted West Texas Intermediate (“WTI”) price for oil has ranged from a low of $26.19 per Bbl in February 2016 to a high of $107.95 per Bbl in June 2014. During 2017, WTI prices ranged from $42.48 to $60.46 per Bbl. If the prices of oil and gas reverse their recent increases or decline, our operations, financial condition, cash flows and level of expenditures may be materially and adversely affected.
We have developed certain key infrastructure assets in the Bakken area of North Dakota, making us vulnerable to risks associated with conducting business in this region.
We have secured three governmental permits that enable us to withdraw water from the Missouri River and Lake Sakakawea in North Dakota and have developed and expect to develop in the future significant water infrastructure related to these permits.
Because of the key nature of these permits and water infrastructure within the Bakken, the success and profitability of our business may be disproportionately exposed to factors impacting this region. These factors include, among others: (i) the prices of, and associated costs to produce, crude oil and gas from wells in the Bakken and other regional supply and demand factors (including the generally higher cost nature of production in the Bakken compared to other major shale plays and the pricing differentials that exist in the Bakken because of transportation constraints); (ii) the amount of exploration, development and production activities of our Bakken customers and their spending on our services; (iii) our ability to keep and maintain our governmental water permits; (iv) the cost of operations and the prices we can charge our customers in this region; and (v) the availability of equipment, supplies, and labor. Although we currently have secured key permits for water in this region, if we were to lose our water rights for any reason, including termination by the government upon the occurrence of a material breach, including nonpayment and default in performance, unexpected adverse environmental impacts, or our competitors were able to secure equivalent rights, our business could be materially harmed. In addition, our operations in the Bakken field may be adversely affected by severe weather events such as floods, blizzards, ice storms and tornadoes. For the years ended December 31, 2017, 2016 and 2015, our Bakken operations represented 10.4%, 9.6% and 5.5%, respectively, of our revenues. The concentration of our water permits and significant infrastructure assets in North Dakota also increases our exposure to changes in local laws and regulations, including those designed to protect wildlife, and unexpected events that may occur in this region such as seismic events, industrial accidents or labor difficulties. Any of the risks described above could have an adverse effect on our financial condition, results of operations and cash flows.
Restrictions on the ability to procure water or changes in water sourcing requirements could decrease the demand for our water‑related services.
Our business includes water transfer for use in our customers’ oil and gas E&P activities. Our access to the water we supply may be limited due to reasons such as prolonged drought or our inability to acquire or maintain water sourcing permits or other rights. In addition, some state and local governmental authorities have begun to monitor or restrict the use of water subject to their jurisdiction for hydraulic fracturing to ensure adequate local water supply. For instance, some states require E&P companies to report certain information regarding the water they use for hydraulic fracturing and to monitor the quality of groundwater surrounding some wells stimulated by hydraulic fracturing. In British Columbia, new regulations relating to the use of water under the Water Sustainability Act came into effect on February 29, 2016. This Act requires authorizations to be obtained to use groundwater for anything other than domestic use. The estimated 20,000 existing non‑domestic groundwater users must be brought into the licensing scheme. In
28
addition, anyone who diverts water must make beneficial use of that water, meaning they must use the water as efficiently as practicable, and for the purposes specified by the license or approval. In Alberta, AER monitors water withdrawals, and may suspend water withdrawals during a low flow period or drought to protect the integrity of the water system. Further, in Alberta, the Water Conservation and Allocation Policy for Oilfield Injection may be expanded to include hydraulic fracturing activities under the proposed Water Conservation Policy for Upstream Oil and Gas Operations. If this policy is expanded to include hydraulic fracturing, licensees will come under increased scrutiny surrounding their water use. Groundwater and surface water available for licensing may be limited and in water‑short areas of Alberta, projects may be delayed until new technology or alternative water sources become available to protect non‑saline water resources. It is unclear if or when this policy may be implemented. Any such decrease in the availability of water, or demand for water services, could adversely affect our business and results of operations.
We have operated at a loss in the past, and there is no assurance of our profitability in the future.
Historically, we have experienced periods of low demand for our services and have incurred operating losses. In the future, we may not be able to reduce our costs, increase our revenues or reduce our debt service obligations sufficient to achieve or maintain profitability and generate positive operating income. Under such circumstances, we may incur further operating losses and experience negative operating cash flow.
Fuel conservation measures could reduce demand for oil and natural gas which would in turn reduce the demand for our services.
Fuel conservation measures, alternative fuel requirements and increasing consumer demand for alternatives to oil and natural gas could reduce demand for oil and natural gas. The impact of the changing demand for oil and natural gas may have a material adverse effect on our business, financial condition, prospects, results of operations and cash flows. Additionally, the increased competitiveness of alternative energy sources (such as wind, solar, geothermal, tidal, fuel cells and biofuels) could reduce demand for hydrocarbons and therefore for our services, which would lead to a reduction in our revenues.
Failure to successfully combine our business with the business from Rockwater may adversely affect our future results.
The consummation of the Rockwater Merger involves potential risks, including, without limitation, the failure to realize expected profitability, growth or accretion; the incurrence of liabilities or other compliance costs related to environmental or regulatory matters, including potential liabilities that may be imposed without regard to fault or the legality of conduct; diversion of management’s attention from our existing businesses; and the incurrence of unanticipated liabilities and costs for which indemnification is unavailable or inadequate. If these risks or other unanticipated liabilities were to materialize, any desired benefits of the Rockwater Merger may not be fully realized, if at all, and our future financial performance and results of operations could be negatively impacted.
The growth of our business through acquisitions may expose us to various risks, including those relating to difficulties in identifying suitable, accretive acquisition opportunities and integrating businesses, assets and personnel, as well as difficulties in obtaining financing for targeted acquisitions and the potential for increased leverage or debt service requirements.
As a component of our business strategy, we intend to pursue selected, accretive acquisitions of complementary assets, businesses and technologies. Acquisitions involve numerous risks, including:
•unanticipated costs and assumption of liabilities and exposure to unforeseen liabilities of the acquired business, including but not limited to environmental liabilities;
•difficulties in integrating the operations and assets of the acquired business and the acquired personnel;
•limitations on our ability to properly assess and maintain an effective internal control environment over an acquired business;
29
•potential losses of key employees and customers of the acquired business;
•risks of entering markets in which we have limited prior experience; and
•increases in our expenses and working capital requirements.
In evaluating acquisitions, we generally prepare one or more financial cases based on a number of business, industry, economic, legal, regulatory and other assumptions applicable to the proposed transaction. Although we expect a reasonable basis will exist for those assumptions, the assumptions will generally involve current estimates of future conditions. Realization of many of the assumptions will be beyond our control. Moreover, the uncertainty and risk of inaccuracy associated with any financial projection will increase with the length of the forecasted period. Some acquisitions may not be accretive in the near term, and will be accretive in the long term only if we are able to timely and effectively integrate the underlying assets and such assets perform at or near the levels anticipated in our acquisition projections.
The process of integrating an acquired business may involve unforeseen costs and delays or other operational, technical and financial difficulties and may require a significant amount time and resources. Our failure to incorporate the acquired business and assets into our existing operations successfully or to minimize any unforeseen operational difficulties could have a material adverse effect on our financial condition and results of operations. Furthermore, there is intense competition for acquisition opportunities in our industry. Competition for acquisitions may increase the cost of, or cause us to refrain from, completing acquisitions.
In addition, we may not have sufficient capital resources to complete any additional acquisitions. We may incur substantial indebtedness to finance future acquisitions and also may issue equity, debt or convertible securities in connection with such acquisitions. Debt service requirements could represent a significant burden on our results of operations and financial condition and the issuance of additional equity or convertible securities could be dilutive to our existing stockholders. Furthermore, we may not be able to obtain additional financing on satisfactory terms. Even if we have access to the necessary capital, we may be unable to continue to identify suitable acquisition opportunities, negotiate acceptable terms or successfully acquire identified targets.
Our Credit Agreement subjects us to various financial and other restrictive covenants. These restrictions may limit our operational or financial flexibility and could subject us to potential defaults under our Credit Agreement.
Our Credit Agreement subjects us to significant financial and other restrictive covenants, including restrictions on our ability to consolidate or merge with other companies, conduct asset sales, incur additional indebtedness, grant liens, issue guarantees, make investments, loans or advances, pay dividends and enter into certain transactions with affiliates.
Our Credit Agreement contains certain financial covenants, including the maintenance of a fixed charge coverage ratio of at least 1.0 to 1.0 at any time availability under the Credit Agreement is less than the greater of (i) 10% of the lesser of (A) the maximum revolver amount and (B) the then‑effective borrowing base and (ii) $15.0 million and continuing through and including the first day after such time that availability under the Credit Agreement has equaled or exceeded the greater of (i) 10% of the lesser of (A) the maximum revolver amount and (B) the then‑effective borrowing base and (ii) $15.0 million for 60 consecutive calendar days. Our ability to comply with such financial condition tests can be affected by events beyond our control and we may not be able to do so. Our scheduled maturity date is November 1, 2022. In addition, the Credit Agreement restricts SES Holdings’ and Select LLC’s ability to make distributions on, or redeem or repurchase, its equity interests, except for certain distributions, including distributions of cash so long as, both at the time of the distribution and after giving effect to the distribution, no default exists under the Credit Agreement and either (a) excess availability at all times during the preceding 30 consecutive days, on a pro forma basis and after giving effect to such distribution, is not less than the greater of (1) 25% of the lesser of (A) the maximum revolver amount and (B) the then‑effective borrowing base and (2) $37.5 million or (b) if SES Holdings’ fixed charge coverage ratio is at least 1.0 to 1.0 on a pro forma basis, and excess availability at all times during the preceding 30 consecutive days, on a pro forma basis and after giving effect to such distribution, is not less than the greater of (1) 20% of the lesser of (A) the maximum revolver amount and (B) the then‑effective borrowing base and (2) $30.0 million. For
30
additional information regarding our Credit Agreement, please read “Item 7. Management’s Discussion and Analysis of Financial Condition and Results of Operations—Liquidity and Capital Resources—Credit Agreement.”
If we are unable to remain in compliance with the covenants of our Credit Agreement, then the lenders may declare all amounts outstanding under the Credit Agreement to be immediately due and payable. Any such acceleration could have a material adverse effect on our financial condition and results of operations.
We may incur additional indebtedness or issue additional equity securities to execute our long‑term growth strategy, which may reduce our profitability or result in significant dilution to our stockholders.
Constructing and maintaining water infrastructure used in the oil and gas industry requires significant capital. We may require additional capital in the future to develop and construct water sourcing, transfer and other related infrastructure to execute our growth strategy. For the years ended December 31, 2017, 2016 and 2015, we incurred $108.3 million, $36.3 million and $48.7 million, respectively, in capital expenditures. Historically, we have financed these investments through cash flows from operations, our IPO, external borrowings and capital contributions from the existing owners of outstanding membership interests in SES Holdings prior to the Select 144A Offering and the related reorganization (the “Legacy Owners”) and certain of the Legacy Owners who received shares of our Class A common stock in exchange for their SES Holdings LLC Units received in connection with the corporate reorganization transactions related to the Select 144A Offering (the “Contributing Legacy Owners”). These sources of capital may not be available to us in the future. If we are unable to fund capital expenditures for any reason, we may not be able to capture available growth opportunities and any such failure could have a material adverse effect on our results of operations and financial condition. If we incur additional indebtedness or issue additional equity securities, our profitability may be reduced and our stockholders may experience significant dilution.
Significant price volatility or interruptions in supply of our raw materials may result in increased costs that we may be unable to pass on to our customers, which could reduce profitability.
We purchase a substantial portion of our raw materials from third‑party suppliers and the cost of these raw materials represents a substantial portion of our operating expenses. The prices of the raw materials that we purchase from third parties are cyclical and volatile. Our supply agreements provide us only limited protection against price volatility as they are entered into either on a short‑term basis or are longer‑term volume contracts, which provide for market‑based pricing renegotiated several times per year. While we attempt to match cost increases with corresponding product price increases, we are not always able to raise product prices immediately or at all. Timing differences between raw material prices, which may change daily, and contract product prices, which in many cases are negotiated only monthly or less often, have had and may continue to have a negative effect on our cash flow. Any cost increase that we are not able to pass on to our customers could have a material adverse effect on our business, results of operations, financial condition and liquidity.
There are several raw materials for which there are only a limited number of suppliers or a single supplier. To mitigate potential supply constraints, we enter into supply agreements with particular suppliers, evaluate alternative sources of supply and evaluate alternative technologies to avoid reliance on limited or sole‑source suppliers. Where supply relationships are concentrated, particular attention is paid by the parties to ensure strategic intentions are aligned to facilitate long‑term planning. If certain of our suppliers are unable to meet their obligations under present supply agreements, we may be forced to pay higher prices to obtain the necessary raw materials from other sources and we may not be able to increase prices for our finished products to recoup the higher raw materials costs. Any interruption in the supply of raw materials could increase our costs or decrease our revenue, which could reduce our cash flow. The inability of a supplier to meet our raw material needs could have a material adverse effect on our financial statements and results of operations.
The number of sources for and availability of certain raw materials is also specific to the particular geographical region in which a facility is located. Political and economic instability in the countries from which we purchase our raw material supplies could adversely affect their availability. In addition, if raw materials become unavailable within a geographic area from which they are now sourced, then we may not be able to obtain suitable or cost effective substitutes. We may also experience higher operating costs such as energy or transportation costs, which could affect our
31
profitability. We may not always be able to increase our selling prices to offset the impact of any higher productions costs or reduced production levels, which could reduce our earnings and decrease our liquidity.
We may be subject to claims for personal injury and property damage, which could materially adversely affect our financial condition, results of operations and cash available for distribution.
We operate with most of our customers under MSAs. We endeavor to allocate potential liabilities and risks between the parties in the MSAs. Generally, under our MSAs, including those relating to our services, we assume responsibility for, including control and removal of, pollution or contamination which originates above surface and originates from our equipment or services. Our customer generally assumes responsibility for, including control and removal of, all other pollution or contamination which may occur during operations, including that which may result from seepage or any other uncontrolled flow of drilling fluids. We may have liability in such cases if we are negligent or commit willful acts. Generally, our customers also agree to indemnify us against claims arising from their employees’ personal injury or death to the extent that, in the case of our operations, their employees are injured or their properties are damaged by such operations, unless resulting from our gross negligence or willful misconduct. Similarly, we generally agree to indemnify our customers for liabilities arising from personal injury to or death of any of our employees, unless resulting from gross negligence or willful misconduct of the customer. In addition, our customers generally agree to indemnify us for loss or destruction of customer‑owned property or equipment and in turn, we agree to indemnify our customers for loss or destruction of property or equipment we own. Losses due to catastrophic events, such as blowouts, are generally the responsibility of the customer. However, despite this general allocation of risk, we might not succeed in enforcing such contractual allocation, might incur an unforeseen liability falling outside the scope of such allocation or may be required to enter into an MSA with terms that vary from the above allocations of risk. As a result, we may incur substantial losses which could materially and adversely affect our financial condition, results of operations and cash available for distribution.
We are subject to environmental and occupational health and safety laws and regulations that may expose us to significant liabilities for penalties, damages or costs of remediation or compliance.
Our operations and the operations of our customers are subject to federal, provincial, state and local laws and regulations in the United States and Western Canada relating to protection of natural resources and the environment, health and safety aspects of our operations and waste management, including the transportation and disposal of waste and other materials. These laws and regulations may impose numerous obligations on our operations and the operations of our customers, including the acquisition of permits to take fresh water from surface and underground sources, construct pipelines or containment facilities, drill wells or conduct other regulated activities, the incurrence of capital expenditures to mitigate or prevent releases of materials from our facilities or from customer locations where we are providing services, the imposition of substantial liabilities for pollution resulting from our operations, and the application of specific health and safety criteria addressing worker protection. Any failure on our part or the part of our customers to comply with these laws and regulations could result in restrictions on operations, assessment of administrative, civil and criminal penalties, revocation of permits and issuance of corrective action orders requiring the performance of investigatory, remedial or curative activities.
Our business activities present risks of incurring significant environmental costs and liabilities, including costs and liabilities resulting from our handling of oilfield and other wastes, because of air emissions and wastewater discharges related to our operations, and due to historical oilfield industry operations and waste disposal practices. Our businesses include the operation of oilfield waste disposal injection wells that pose risks of environmental liability, including leakage from the wells to surface or subsurface soils, surface water or groundwater. In addition, private parties, including the owners of properties upon which we perform services and facilities where our wastes are taken for reclamation or disposal, also may have the right to pursue legal actions to enforce compliance as well as to seek damages for non‑compliance with environmental laws and regulations or for personal injury or property or natural resource damages. Some environmental laws and regulations may impose strict liability, which means that in some situations we could be exposed to liability as a result of our conduct that was lawful at the time it occurred or the conduct of, or conditions caused by, prior operators or other third parties. Remedial costs and other damages arising as a result of environmental laws and costs associated with changes in environmental laws and regulations could be substantial and could have a material adverse effect on our liquidity, consolidated results of operations and consolidated financial condition.
32
Laws and regulations protecting the environment generally have become more stringent in recent years and are expected to continue to do so, which could lead to material increases in costs for future environmental compliance and remediation. Changes in existing laws or regulations, or the adoption of new laws or regulations, could delay or curtail exploratory or developmental drilling for oil and gas and could limit well servicing opportunities. We may not be able to recover some or any of our costs of compliance with these laws and regulations from insurance.
Unsatisfactory safety performance may negatively affect our customer relationships and, to the extent we fail to retain existing customers or attract new customers, adversely impact our revenues.
Our ability to retain existing customers and attract new business is dependent on many factors, including our ability to demonstrate that we can reliably and safely operate our business and stay current on constantly changing rules, regulations, training and laws. Existing and potential customers consider the safety record of their service providers to be of high importance in their decision to engage third‑party servicers. If one or more accidents were to occur at one of our operating sites, the affected customer may seek to terminate or cancel its use of our facilities or services and may be less likely to continue to use our services, which could cause us to lose substantial revenues. Further, our ability to attract new customers may be impaired if they elect not to purchase our third‑party services because they view our safety record as unacceptable. In addition, it is possible that we will experience numerous or particularly severe accidents in the future, causing our safety record to deteriorate. This may be more likely as we continue to grow, if we experience high employee turnover or labor shortage, or add inexperienced personnel.
Federal, state, provincial and local legislative and regulatory initiatives in the United States and Western Canada related to hydraulic fracturing could result in operating restrictions or delays in the drilling and completion of oil and gas wells that may reduce demand for our services and could have a material adverse effect on our liquidity, consolidated results of operations and consolidated financial condition.
Hydraulic fracturing is an important and common practice that is used to stimulate production of hydrocarbons from dense subsurface rock formations. The process involves the injection of water, sand or other proppants and chemical additives under pressure into targeted geological formations to fracture the surrounding rock and stimulate production. In the United States, hydraulic fracturing is currently generally exempt from regulation under the SDWA’s UIC program and is typically regulated by state oil and gas commissions or similar agencies.
However, several federal agencies in the United States have asserted regulatory authority over certain aspects of the process. For example, in 2014, the EPA asserted regulatory authority pursuant to the SDWA’s UIC program over hydraulic fracturing activities involving the use of diesel and issued guidance covering such activities. Additionally, in June 2016, the EPA published an effluent limit guideline final rule prohibiting the discharge of wastewater from onshore unconventional oil and gas extraction facilities to publicly owned wastewater treatment plants and, in 2014, issued a prepublication of its Advance Notice of Proposed Rulemaking regarding the TSCA reporting of the chemical substances and mixtures used in hydraulic fracturing. Also, the BLM published a final rule in 2015 that established new or more stringent standards relating to hydraulic fracturing on federal and American Indian lands. However, in June 2016, a Wyoming federal judge struck down this final rule, finding that the BLM lacked authority to promulgate the rule, the BLM appealed this decision to the U.S. Court of Appeals for the Tenth Circuit in July 2016, the appellate court issued a ruling in September 2017 to vacate the Wyoming trial court decision and dismiss the lawsuit challenging the 2015 rule in response to the BLM’s issuance of a proposed rulemaking to rescind the 2015 rule and, in December 2017, the BLM published a final rule rescinding the 2015 rule. In January 2018, litigation challenging the BLM’s recission of the 2015 rule was brought in federal court. In January 2018, litigation challenging the BLM’s recission of the 2015 rule was brought in federal court. From time to time, legislation has been introduced, but not enacted, in Congress to provide for federal regulation of hydraulic fracturing and to require disclosure of the chemicals used in the fracturing process. In the event that new federal restrictions on the hydraulic‑fracturing process are adopted in areas where we or our customers conduct business, we or our customers may incur additional costs or permitting requirements to comply with such federal requirements that may be significant in nature and, in the case of our customers, could experience added delays or curtailment in the pursuit of exploration, development, or production activities, which would in turn reduce the demand for our services.
Moreover, some states and local governments have adopted, and other governmental entities are considering adopting, regulations that could impose more stringent permitting, disclosure and well‑construction requirements on
33
hydraulic fracturing operations, including states where we or our customers operate. For example, Texas, Oklahoma, California, Ohio, Pennsylvania and North Dakota, among others, have adopted regulations that impose new or more stringent permitting, disclosure, disposal and well construction requirements on hydraulic fracturing operations. States could also elect to prohibit high volume hydraulic fracturing altogether, following the approach taken by the State of New York. In addition, in light of concerns about seismic activity being triggered by the injection of produced waste waters into underground disposal wells, certain regulators are also considering additional requirements related to seismic safety for hydraulic fracturing activities. For example, the Oklahoma Corporation Commission released well completion seismicity guidelines in December 2016 for operators in the SCOOP and STACK that call for hydraulic fracturing operations to be suspended following earthquakes of certain magnitudes in the vicinity. In addition, the Oklahoma Corporation Commission’s Oil and Gas Conservation Division issued an order in February 2017 limiting future increases in the volume of oil and natural gas wastewater injected into the ground in an effort to reduce the number of earthquakes in the state, and imposed further reductions in the Edmonds area of the state in August 2017. In addition to state laws, local land use restrictions, such as city ordinances, may restrict drilling in general and/or hydraulic fracturing in particular, as certain local governments in California have done. Other states, such as Texas, Oklahoma and Ohio have taken steps to limit the authority of local governments to regulate oil and gas development.
In December 2016, the EPA released its final report on the potential impacts of hydraulic fracturing on drinking water resources. The final report concluded that “water cycle” activities associated with hydraulic fracturing may impact drinking water resources “under some circumstances,” noting that the following hydraulic fracturing water cycle activities and local‑ or regional‑scale factors are more likely than others to result in more frequent or more severe impacts: water withdrawals for fracturing in times or areas of low water availability; surface spills during the management of fracturing fluids, chemicals or produced water; injection of fracturing fluids into wells with inadequate mechanical integrity; injection of fracturing fluids directly into groundwater resources; discharge of inadequately treated fracturing wastewater to surface waters; and disposal or storage of fracturing wastewater in unlined pits.
While hydraulic fracturing in Alberta and British Columbia, Canada has been occurring for decades, due to concerns over environmental impacts including water usage, wastewater disposal and contamination, and induced seismicity, the AER in Alberta and the BCOGC in British Columbia continue to conduct ongoing review of rules and regulations of the industry. The AER has moved to require water use measurement and sourcing details for all fractured wells in Alberta, fracture fluid chemical disclosure, limited trade secret protection and prescribed setbacks for shallow fracturing near water wells.
Increased regulation and attention given to the hydraulic fracturing process could lead to greater opposition to oil and gas production activities using hydraulic fracturing techniques. Additional legislation or regulation could also lead to operational delays or increased operating costs for our customers in the production of oil and gas, including from the developing shale plays, or could make it more difficult to perform hydraulic fracturing. The adoption of any federal, state or local laws or the implementation of regulations regarding hydraulic fracturing could potentially cause a decrease in the completion of new oil and gas wells and an associated decrease in demand for our services and increased compliance costs and time, which could have a material adverse effect on our liquidity, consolidated results of operations, and consolidated financial condition.
Climate change legislation or regulations in the United States and Western Canada restricting or regulating emissions of greenhouse gases could result in increased operating costs and reduced demand for our field services.
In the United States, in response to findings that emissions of carbon dioxide, methane and other GHGs present an endangerment to public health and the environment, the EPA has adopted regulations under existing provisions of the CAA that, among other things, establish the PSD construction and Title V operating permit reviews for certain large stationary sources that emit certain principal, or “criteria,” pollutants. Facilities required to obtain PSD permits for their GHG emissions also will be required to meet “best available control technology” standards. In addition, the EPA has adopted rules requiring the monitoring and annual reporting of GHG emissions from oil and gas production, processing, transmission and storage facilities in the United States.
The U.S. Congress has from time to time considered legislation to reduce emissions of GHGs but there has not been significant activity in the form of adopted legislation to reduce GHG emissions at the federal level in recent years.
34
In the absence of such federal climate legislation, a number of state and regional efforts have emerged that are aimed at tracking and/or reducing GHG emissions through the completion of GHG emissions inventories and by means of cap and trade programs that typically require major sources of GHG emissions to acquire and surrender emission allowances in return for emitting those GHGs. The EPA has also developed strategies for the reduction of methane emissions, including emissions from the oil and gas industry. For example, in June 2016, the EPA published NSPS, known as Subpart OOOOa, that require certain new, modified or reconstructed facilities in the oil and natural gas sector to reduce methane gas and VOC emissions. These Subpart OOOOa standards will expand previously issued NSPS published by the EPA in 2012, and known as Subpart OOOO, by using certain equipment‑specific emissions control practices. However, the Quad OOOOa standards have been subject to attempts by the EPA to stay portions of those standards, and the agency proposed rulemaking in June 2017 to stay the requirements for a period of two years and revisit implementation of Subpart OOOOa in its entirety. The EPA has not yet published a final rule, and, as a result of these developments, EPA’s 2016 standards are currently in effect, but future implementation of the 2016 standards is uncertain at this time. Because of the long‑term trend toward increasing regulation, however, future federal GHG regulations of the oil and natural gas industry remain a possibility. Furthermore, in June 2017, the BLM published a final rule that established, among other things, requirements to reduce methane emissions arising from venting, flaring and leakage from oil and gas production activities on onshore federal and American Indian lands. However, on December 8, 2017, the BLM published a final rule to temporarily suspend or delay certain requirements contained in the November 2016 final rule until January 17, 2019, including those requirements relating to venting, flaring and leakage from oil and gas production activities. On February 22, 2018, the U.S. District Court for the Northern District of California enjoined the delay of certain requirements contained in the November 2016 rule. As a result, the November 2016 rule, as originally proumulgated, is in effect. Also, on February 22, 2018, the BLM published a proposed rule that would generally re-establish the requirements that the November 2016 rule replaced. Litigation regarding the November 2016 rule is ongoing and uncertainty exists with respect to future implementation of the rule. However, given the long‑term trend towards increasing regulation, future federal GHG regulations of the oil and gas industry remain a possibility. Furthermore, the EPA passed a new rule, known as the Clean Power Plan, to limit GHGs from power plants. While the U.S. Supreme Court issued a stay in February 2016, preventing implementation during the pendency of legal challenges to the rule in court, should the stay be lifted and legal challenges prove unsuccessful, then it could reduce demand for the oil and gas our customers produce, which could reduce the demand for our services, depending on the methods used to implement the rule. On October 10, 2017, the EPA issued a proposed rulemaking to repeal the Clean Power Plan. The public comment period on the proposed rulemaking ended on December 15, 2017.
Additionally, in December 2015, the United States joined the international community at the 21st Conference of the Parties of the United Nations Framework Convention on Climate Change in Paris, France that proposed an agreement, requiring member countries to review and “represent a progression” in their intended nationally determined contributions, which set GHG emission reduction goals every five years beginning in 2020. This agreement was signed by the United States in April 2016 and entered into force in November 2016. This agreement does not create any binding obligations for nations to limit their GHG emissions, but rather includes pledges to voluntarily limit or reduce future emissions. In August 2017, the U.S. Department of State officially informed the United Nations of the intent of the United States to withdraw from the Paris Agreement. The Paris Agreement provides for a four‑year exit process beginning when it took effect in November 2016, which would result in an effective exit date of November 2020. The United States’ adherence to the exit process and/or the terms on which the United States may re‑enter the Paris Agreement or a separately negotiated agreement are unclear at this time.
In Canada, significant climate change initiatives are ongoing at both the provincial and federal levels. Prime Minister Justin Trudeau announced in late 2016 that provinces have until 2018 to impose a carbon pricing scheme or else a federally mandated price will be imposed. The price would be set at $10 per tonne of carbon dioxide in 2018, rising $10 each year, to $50 per tonne by 2022. The provincial government in Alberta, as of January 1, 2017, has implemented a carbon tax at a rate of $20 per tonne in 2017, rising to $30 per tonne in 2018. While British Columbia adopted a carbon tax in 2008, with the final scheduled increase occurring in 2012 at $30 per tonne, under the federal carbon tax, British Columbia’s carbon tax will be required to increase in 2021. In addition, Canada signed the Paris Agreement in April 2016, which could lead to additional regulation of GHG emissions.
Although it is not possible at this time to predict how new laws or regulations in the United States or Canada or any legal requirements imposed by the Paris Agreement on the United States, should it not withdraw from the
35
agreement, or Canada that may be adopted or issued to address GHG emissions would impact our business, any such future laws, regulations or other legal requirements imposing reporting or permitting obligations on, or limiting emissions of GHGs from, our or our customers’ equipment and operations could require us or our customers to incur costs to reduce emissions of GHGs associated with operations as well as delays or restrictions in the ability to permit GHG emissions from new or modified sources. In addition, substantial limitations on GHG emissions could adversely affect demand for the oil and gas our customers produce, which could reduce demand for our services. Moreover, activists concerned about the potential effects of climate change have directed their attention at sources of funding for fossil-fuel energy companies, which has resulted in certain financial institutions, funds and other sources of capital restricting or eliminating their investment in oil and natural gas activities. Ultimately, this could make it more difficult to secure funding for exploration and production activities. Notwithstanding potential risks related to climate change, the International Energy Agency estimates that global energy demand will continue to rise and will not peak until after 2040 and that oil and gas will continue to represent a substantial percentage of global energy use over that time.
Finally, it should be noted that increasing concentrations of GHGs in the Earth’s atmosphere may produce climate changes that have significant physical effects, such as increased frequency and severity of storms, floods, droughts and other climatic events. If any such effects were to occur, they could have an adverse effect on our and our customers’ operations.
Legislation or regulatory initiatives intended to address seismic activity associated with oilfield disposal wells could restrict our ability to dispose of produced water gathered from our customers and, accordingly, could have a material adverse effect on our business.
We dispose of wastewater gathered from oil and gas producing customers that results from their drilling and production operations pursuant to permits issued to us by government authorities overseeing such disposal activities. While these permits are issued pursuant to existing laws and regulations, these legal requirements are subject to change, which could result in the imposition of more stringent permitting or operating constraints or new monitoring and reporting requirements owing to, among other things, concerns of the public or governmental authorities regarding such disposal activities.
One such concern relates to recent seismic events in the United States near underground disposal wells used for the disposal by injection of produced water resulting from oil and gas activities. Developing research suggests that the link between seismic activity and wastewater disposal may vary by region, and that only a very small fraction of the tens of thousands of injection wells have been suspected to be, or have been, the likely cause of induced seismicity. In March 2016, the United States Geological Survey identified six states with the most significant hazards from induced seismicity, including Oklahoma, Kansas, Texas, Colorado, New Mexico and Arkansas. The United States Geological Survey also noted the potential for induced seismicity in Ohio and Alabama. In response to concerns regarding induced seismicity, regulators in some states have imposed, or are considering imposing, additional requirements in the permitting of produced water disposal wells or otherwise to assess any relationship between seismicity and the use of such wells. For example, Oklahoma issued new rules for wastewater disposal wells in 2014 that imposed certain permitting and operating restrictions and reporting requirements on disposal wells in proximity to faults and also, from time to time, has developed and implemented plans directing certain wells where seismic incidents have occurred to restrict or suspend disposal well operations. In particular, the Oklahoma Corporation Commission released well completion seismicity guidelines in December 2016 for operators in the SCOOP and STACK that call for hydraulic fracturing operations to be suspended following earthquakes of certain magnitudes in the vicinity. In addition, the Oklahoma Corporation Commission’s Oil and Gas Conservation Division issued an order in February 2017 limiting future increases in the volume of oil and natural gas wastewater injected into the ground in an effort to reduce the number of earthquakes in the state and imposed further reductions in the Edmonds area of the state in August 2017. The Texas Railroad Commission adopted similar rules in 2014. In addition, ongoing lawsuits allege that disposal well operations have caused damage to neighboring properties or otherwise violated state and federal rules regulating waste disposal. These developments could result in additional regulation and restrictions on the use of injection wells. Increased regulation and attention given to induced seismicity could lead to greater opposition to oil and gas activities utilizing injection wells for waste disposal. The adoption and implementation of any new laws, regulations or directives that restrict our ability to dispose of wastewater gathered from our customers by limiting, volumes, disposal rates, disposal well locations or otherwise, or requiring us to shut down disposal wells, could have a material adverse effect on our business, financial condition and results of operations.
36
The Endangered Species Act and Migratory Bird Treaty Act in the United States and similar legislation applicable in Western Canada govern both our and our oil and gas producing customers’ operations and additional restrictions may be imposed in the future, which constraints could have an adverse impact on our ability to expand some of our existing operations or limit our customers’ ability to develop new oil and gas wells.
In the United States, the ESA restricts activities that may affect endangered or threatened species or their habitats. Similar protections are offered to migratory birds under the MBTA. To the extent species that are listed under the ESA or similar state laws, or are protected under the MBTA, live in the areas where we or our oil and gas producing customers’ operate, both our and our customers’ abilities to conduct or expand operations and construct facilities could be limited or be forced to incur material additional costs. Moreover, our customers’ drilling activities may be delayed, restricted or precluded in protected habitat areas or during certain seasons, such as breeding and nesting seasons. Some of our operations and the operations of our customers are located in areas that are designated as habitats for protected species.
In addition, as a result of one or more settlements approved by the FWS, the agency is required to make a determination on the listing of numerous other species as endangered or threatened under the ESA by the end of the FWS’ 2017 fiscal year. The designation of previously unidentified endangered or threatened species could indirectly cause us to incur additional costs, cause our or our oil and gas producing customers’ operations to become subject to operating restrictions or bans, and limit future development activity in affected areas. The FWS and similar state agencies may designate critical or suitable habitat areas that they believe are necessary for the survival of threatened or endangered species. Such a designation could materially restrict use of or access to federal, state and private lands.
In Canada, the Migratory Birds Convention Act (“MBCA”) prohibits the release of substances that can harm migratory birds in waters used by them, and gives the federal government the authority to develop regulations to protect migratory birds, and their habitats, including nests. Oil and gas development projects must comply with provisions of the MBCA, as well as the federal Species at Risk Act. Alberta and British Columbia each have a provincial Wildlife Act, which impose restrictions to prevent wildlife species from disappearing that could impact oil and gas operations and reduce demand for our services.
Our chemical products are subject to stringent chemical control laws that could result in increased costs on our business.
We are subject to a wide array of laws and regulations governing chemicals, including the regulation of chemical substances and inventories, such as the TSCA in the United States and the Canadian Environmental Protection Act in Canada. These laws and regulations change frequently, and have the potential to limit or ban altogether the types of chemicals we may use in our products, as well as result in increased costs related to testing, storing, and transporting our products prior to providing them to our customers. For example, in June 2016, President Obama signed into law the Lautenberg Act, which substantially revised TSCA. Among other items, the Lautenberg Act eliminated the cost‑benefit approach to analyzing chemical safety concerns with a health‑based safety standard and requires all chemicals in commerce, including those “grandfathered” under TSCA, to undergo a safety review. The Lautenberg Act also requires safety findings before a new chemical can enter the market. Although it is not possible at this time to predict how EPA will implement and interpret the new provisions of the Lautenberg Act, or how legislation or new regulations that may be adopted pursuant to these regulatory and legislative efforts would impact our business, any new restrictions on the development of new products, increases in regulation, or disclosure of confidential, competitive information could have an adverse effect on our operations and our cost of doing business.
Furthermore, governmental, regulatory and societal demands for increasing levels of product safety and environmental protection could result in increased pressure for more stringent regulatory control with respect to the chemical industry. In addition, these concerns could influence public perceptions regarding our products and operations, the viability of certain products, our reputation, the cost to comply with regulations, and the ability to attract and retain employees. Moreover, changes in environmental, health and safety regulations could inhibit or interrupt our operations, or require us to modify our facilities or operations. Accordingly, environmental or regulatory matters may cause us to incur significant unanticipated losses, costs or liabilities, which could reduce our profitability.
37
Disruptions in production at our chemical manufacturing facilities may have a material adverse impact on our business, results of operations and/or financial condition.
Chemical manufacturing facilities in our industry are subject to outages and other disruptions. Any serious disruption at any of our facilities could impair our ability to use our facilities and have a material adverse impact on our revenue and increase our costs and expenses. Alternative facilities with sufficient capacity may not be available, may cost substantially more or may take a significant time to increase production or qualify with our customers, any of which could negatively impact our business, results of operations and/or financial condition. Long‑term production disruptions may cause our customers to seek alternative supply which could further adversely affect our profitability.
Unplanned production disruptions may occur for external reasons including natural disasters, weather, disease, strikes, transportation interruption, government regulation, political unrest or terrorism, or internal reasons, such as fire, unplanned maintenance or other manufacturing problems. Any such production disruption could have a material impact on our operations, operating results and financial condition.
In addition, we rely on a number of vendors, suppliers, and in some cases sole‑source suppliers, service providers, toll manufacturers and collaborations with other industry participants to provide us with chemicals, feedstocks and other raw materials, along with energy sources and, in certain cases, facilities that we need to operate our business. If the business of these third parties is disrupted, some of these companies could be forced to reduce their output, shut down their operations or file for bankruptcy protection. If this were to occur, it could adversely affect their ability to provide us with the raw materials, energy sources or facilities that we need, which could materially disrupt our operations, including the production of certain of our chemical products. Moreover, it could be difficult to find replacements for certain of our business partners without incurring significant delays or cost increases. All of these risks could have a material adverse effect on our business, results of operations, financial condition and liquidity.
While we maintain business recovery plans that are intended to allow us to recover from natural disasters or other events that could disrupt our business, we cannot provide assurances that our plans would fully protect us from the effects of all such disasters or from events that might increase in frequency or intensity due to climate change. In addition, insurance may not adequately compensate us for any losses incurred as a result of natural or other disasters. In areas prone to frequent natural or other disasters, insurance may become increasingly expensive or not available at all.
We operate in a highly competitive industry, which may intensify as our competitors expand their operations that may cause us to lose market share and could negatively affect our ability to expand our operations.
The water solutions business is highly competitive and includes numerous small companies capable of competing effectively in our markets on a local basis. Some of our competitors have a similarly broad geographic scope, as well as greater financial and other resources than we do, while others focus on specific basins only and may have local competitive cost efficiencies as a result. Additionally, there may be new companies that enter the water solutions business or our existing and potential customers may develop their own water solutions businesses. Our ability to maintain current revenue and cash flows, and our ability to expand our operations, could be adversely affected by the activities of our competitors and our customers. If our competitors substantially increase the resources they devote to the development and marketing of competitive services or substantially decrease the prices at which they offer their services, we may be unable to effectively compete. If our existing and potential customers develop their own water solutions businesses, we may not be able to effectively replace that revenue. All of these competitive pressures could have a material adverse effect on our business, results of operations and financial condition.
The oil and gas industry is intensely competitive, and we compete with other companies that have greater resources than us. Many of our larger competitors provide a broader base of services on a regional, national or worldwide basis. These companies may have a greater ability to continue oilfield service activities during periods of low commodity prices, to contract for equipment, to secure trained personnel, to secure contracts and permits and to absorb the burden of present and future federal, state, provincial, local and other laws and regulations (as applicable). Any inability to compete effectively with larger companies could have a material adverse impact on our financial condition and results of operations.
38
We may be unable to implement price increases or maintain existing prices on our core services.
We periodically seek to increase the prices on our services to offset rising costs and to generate higher returns for our stockholders. However, we operate in a very competitive industry and as a result, we are not always successful in raising, or maintaining, our existing prices. Additionally, during periods of increased market demand, a significant amount of new service capacity, including new well service rigs, fluid hauling trucks and coiled tubing units, may enter the market, which also puts pressure on the pricing of our services and limits our ability to increase prices.
Even when we are able to increase our prices, we may not be able to do so at a rate that is sufficient to offset such rising costs. In periods of high demand for oilfield services, a tighter labor market may result in higher labor costs. During such periods, our labor costs could increase at a greater rate than our ability to raise prices for our services. Also, we may not be able to successfully increase prices without adversely affecting our activity levels. The inability to maintain our pricing and to increase our pricing as costs increase could have a material adverse effect on our business, financial position and results of operations.
Our operations involve risks that may increase our operating costs, which could reduce our profitability.
Although we take precautions to enhance the safety of our operations and minimize the risk of disruptions, our operations are subject to hazards inherent in the manufacturing and marketing of chemical and other products. These hazards include: chemical spills, pipeline leaks and ruptures, storage tank leaks, discharges or releases of toxic or hazardous substances or gases and other hazards incident to the manufacturing, processing, handling, transportation and storage of hazardous chemicals. We are also potentially subject to other hazards, including natural disasters and severe weather; explosions and fires; transportation problems, including interruptions, spills and leaks; mechanical failures; unscheduled downtimes; labor difficulties; remediation complications; and other risks. Many potential hazards can cause bodily injury and loss of life, severe damage to or destruction of property and equipment and environmental damage, and may result in suspension of operations and the imposition of civil or criminal penalties and liabilities. Furthermore, we are subject to present and future claims with respect to workplace exposure, exposure of contractors on our premises as well as other persons located nearby, workers’ compensation and other matters.
We maintain property, business interruption, products liability and casualty insurance policies which we believe are in accordance with customary industry practices, as well as insurance policies covering other types of risks, including pollution legal liability insurance, but we are not fully insured against all potential hazards and risks incident to our business. Each of these insurance policies is subject to customary exclusions, deductibles and coverage limits, in accordance with industry standards and practices. As a result of market conditions, premiums and deductibles for certain insurance policies can increase substantially and, in some instances, certain insurance may become unavailable or available only for reduced amounts of coverage. If we were to incur a significant liability for which we were not fully insured, it could have a material adverse effect on our business, results of operations, financial condition and liquidity.
In addition, we are subject to various claims and litigation in the ordinary course of business. We are a party to various pending lawsuits and proceedings. For more information, see “Item 3. Legal Proceedings.”
Our success depends on key members of our management, the loss of any of whom could disrupt our business operations.
We depend to a large extent on the services of some of our executive officers. The loss of the services of one or more of our key executives could increase our exposure to the other risks described in this “Risk Factors” section. We do not maintain key man insurance on any of our personnel other than John D. Schmitz, our Executive Chairman.
Our industry has experienced a high rate of employee turnover. Any difficulty we experience replacing or adding personnel could have a material adverse effect on our liquidity, results of operations and financial condition.
We are dependent upon the available labor pool of skilled employees and may not be able to find enough skilled labor to meet our needs, which could have a negative effect on our growth. We are also subject to the Fair Labor Standards Act, which governs such matters as minimum wage, overtime and other working conditions. Our services
39
require skilled workers who can perform physically demanding work. As a result of our industry volatility, including the recent and pronounced decline in drilling activity, as well as the demanding nature of the work, many workers have left the oilfield services section to pursue employment in different fields. If we are unable to retain or meet growing demand for skilled technical personnel, our operating results and our ability to execute our growth strategies may be adversely affected.
Delays or restrictions in obtaining permits by us for our operations or by our customers for their operations could impair our business.
In most states, our operations and the operations of our oil and gas producing customers require permits from one or more governmental agencies in order to perform drilling and completion activities, secure water rights, construct impoundments tanks and operate pipelines or trucking services. In the United States, such permits are typically issued by state agencies, but federal and local governmental permits may also be required. Similarly, in Canada, permits are generally issued by provincial agencies. However, federal permits are required for certain activities, such as where a project occurs on lands under federal jurisdiction. Where projects occur on unoccupied Crown lands, treaty lands or in proximity to Reserves, project proponents may face significant delays due to challenges from First Nations people because First Nations have constitutionally guaranteed rights to hunt, trap and fish. Project proponents must conduct adequate consultation with affected First Nations, and projects may encounter lengthy delays if court challenges are made in regards to inadequate consultation. The requirements for such permits vary depending on the location where such drilling and completion, and pipeline and gathering, activities will be conducted. As with all governmental permitting processes, there is a degree of uncertainty as to whether a permit will be granted, the time it will take for a permit to be issued, the conditions that may be imposed in connection with the granting of the permit and whether the permit may be terminated. In addition, some of our customers’ drilling and completion activities may take place on federal land or Native American lands, requiring leases and other approvals from the federal government or Native American tribes to conduct such drilling and completion activities. Under certain circumstances, federal agencies may cancel proposed leases for federal lands and refuse to grant or delay required approvals. Therefore, our customers’ operations in certain areas of the United States may be interrupted or suspended for varying lengths of time, causing a loss of revenue to us and adversely affecting our results of operations in support of those customers.
In the future we may face increased obligations relating to the closing of our wastewater disposal facilities and may be required to provide an increased level of financial assurance to guarantee that the appropriate closure activities will occur for a wastewater disposal facility.
Obtaining a permit to own or operate wastewater disposal facilities generally requires us to establish performance bonds, letters of credit or other forms of financial assurance to address remediation and closure obligations. As we acquire additional wastewater disposal facilities or expand our existing wastewater disposal facilities, these obligations will increase. Additionally, in the future, regulatory agencies may require us to increase the amount of our closure bonds at existing wastewater disposal facilities. Moreover, actual costs could exceed our current expectations, as a result of, among other things, federal, state or local government regulatory action, increased costs charged by service providers that assist in closing wastewater disposal facilities and additional environmental remediation requirements. Increased regulatory requirements regarding our existing or future wastewater disposal facilities, including the requirement to pay increased closure and post‑closure costs or to establish increased financial assurance for such activities could substantially increase our operating costs and cause our available cash that we have to distribute to our unitholders to decline.
Constraints in the supply of equipment used in providing services to our customers and replacement parts for such could affect our ability to execute our growth strategies.
Equipment used in providing services to our customers is normally readily available. Market conditions could trigger constraints in the supply chain of certain equipment or replacement parts for such equipment, which could have a material adverse effect on our business. The majority of our risk associated with supply chain constraints occurs in those situations where we have a relationship with a single supplier for a particular resource.
40
If we are unable to fully protect our intellectual property rights, we may suffer a loss in our competitive advantage or market share.
We do not have patents or patent applications relating to many of our proprietary chemicals. If we are not able to maintain the confidentiality of our trade secrets, or if our competitors are able to replicate our technology or services, our competitive advantage would be diminished. We also cannot assure you that any patents we may obtain in the future would provide us with any significant commercial benefit or would allow us to prevent our competitors from employing comparable technologies or processes.
Technology advancements in well service technologies, including those involving recycling of saltwater or the replacement of water in fracturing fluid, could have a material adverse effect on our business, financial condition and results of operations.
The oilfield services industry is characterized by rapid and significant technological advancements and introductions of new products and services using new technologies. The saltwater disposal industry is subject to the introduction of new waste treatment and disposal techniques and services using new technologies including those involving recycling of saltwater, some of which may be subject to patent protection. As competitors and others use or develop new technologies or technologies comparable to ours in the future, we may lose market share or be placed at a competitive disadvantage. For example, some oil and gas producers are focusing on developing and utilizing non‑water fracturing techniques, including those utilizing propane, carbon dioxide or nitrogen instead of water. Further, we may face competitive pressure to implement or acquire certain new technologies at a substantial cost. Some of our competitors may have greater financial, technical and personnel resources than we do, which may allow them to gain technological advantages or implement new technologies before we can. Additionally, we may be unable to implement new technologies or products at all, on a timely basis or at an acceptable cost. New technology could also make it easier for our customers to vertically integrate their operations or reduce the amount of waste produced in oil and gas drilling and production activities, thereby reducing or eliminating the need for third‑party disposal. Limits on our ability to effectively use or implement new technologies may have a material adverse effect on our business, financial condition and results of operations.
We may be adversely affected by uncertainty in the global financial markets and a worldwide economic downturn.
Our future results may be impacted by uncertainty caused by a worldwide economic downturn, continued volatility or deterioration in the debt and equity capital markets, inflation, deflation or other adverse economic conditions that may negatively affect us or parties with whom we do business resulting in a reduction in our customers’ spending and their non‑payment or inability to perform obligations owed to us, such as the failure of customers to honor their commitments or the failure of major suppliers to complete orders. Additionally, credit market conditions may change slowing our collection efforts as customers may experience increased difficulty in obtaining requisite financing, potentially leading to lost revenue and higher than normal accounts receivable. In the event of the financial distress or bankruptcy of a customer, we could lose all or a portion of such outstanding accounts receivable associated with that customer. Further, if a customer was to enter into bankruptcy, it could also result in the cancellation of all or a portion of our service contracts with such customer at significant expense to us.
The current global economic environment may adversely impact our ability to issue debt. Any economic uncertainty may cause institutional investors to respond to their borrowers by increasing interest rates, enacting tighter lending standards or refusing to refinance existing debt upon its maturity or on terms similar to the expiring debt. However, due to the above listed factors, we cannot be certain that additional funding will be available if needed and, to the extent required, on acceptable terms.
Our operations are subject to inherent risks, some of which are beyond our control. These risks may be self‑insured, or may not be fully covered under our insurance policies.
Our operations are subject to hazards inherent in the oil and gas industry, such as, but not limited to, accidents, blowouts, explosions, craterings, fires, oil spills and releases of drilling, completion or fracturing fluids or wastewater into the environment. These conditions can cause:
41
•disruption in operations;
•substantial repair or remediate costs;
•personal injury or loss of human life;
•significant damage to or destruction of property, plant and equipment;
•environmental pollution, including groundwater contamination;
•impairment or suspension of operations; and
•substantial revenue loss.
The occurrence of a significant event or adverse claim in excess of the insurance coverage that we maintain or that is not covered by insurance could have a material adverse effect on our liquidity, consolidated results of operations and consolidated financial condition. Any interruption in our services due to pipeline breakdowns or necessary maintenance or repairs could reduce sales revenues and earnings. In addition, claims for loss of oil and gas production and damage to formations can occur in the well services industry. Litigation arising from a catastrophic occurrence at a location where our equipment and services are being used may result in our being named as a defendant in lawsuits asserting large claims.
We do not have insurance against all foreseeable risks, either because insurance is not available or because of the high premium costs. The occurrence of an event not fully insured against or the failure of an insurer to meet its insurance obligations could result in substantial losses. In addition, we may not be able to maintain adequate insurance in the future at rates we consider reasonable. Insurance may not be available to cover any or all of the risks to which we are subject, or, even if available, it may be inadequate, or insurance premiums or other costs could rise significantly in the future so as to make such insurance prohibitively expensive.
The deterioration of the financial condition of our customers could adversely affect our business.
During times when the gas or crude oil markets weaken, our customers are more likely to experience financial difficulties, including being unable to access debt or equity financing, which could result in a reduction in our customers’ spending for our services. In addition, in the course of our business we hold accounts receivable from our customers. In the event of the financial distress or bankruptcy of a customer, we could lose all or a portion of such outstanding accounts receivable associated with that customer. Further, if a customer was to enter into bankruptcy, it could also result in the cancellation of all or a portion of our service contracts with such customer at significant expense or loss of expected revenues to us.
We may be required to take write‑downs of the carrying values of our long‑lived assets and finite‑lived intangible assets.
We evaluate our long‑lived assets, such as property and equipment, and finite‑lived intangible assets for impairment whenever events or changes in circumstances indicate that their carrying value may not be recoverable. Recoverability is measured by a comparison of their carrying amount to the estimated undiscounted cash flows to be generated by those assets. Based on specific market factors and circumstances at the time of prospective impairment reviews and the continuing evaluation of development plans, economics and other factors, we may be required to write down the carrying value of our long‑lived and finite‑lived intangible assets. For the year ended December 31, 2017, we did not record an impairment on our long‑lived assets or an impairment on our finite‑lived intangible assets.
We may be required to take a write‑down of the carrying value of goodwill.
We conduct our annual goodwill impairment assessment during the fourth quarter of each year, or more frequently if an event or circumstance indicates that they carrying value of reporting unit may exceed the fair value.
42
When possible impairment is indicated, we value the implied goodwill to compare it with the carrying amount of goodwill. If the carrying amount of goodwill exceeds its implied fair value, an impairment charge is recorded. The fair value of goodwill is based on estimates and assumptions applied by us such as revenue growth rates, operating margins, weighted‑average costs of capital, market multiples, and future market conditions and as affected by numerous factors, including the general economic environment and levels of exploration and production activity of oil and gas companies, our financial performance and trends, and our strategies and business plans, among others. As a result of this annual impairment assessment, we may be required to write down the carrying value of goodwill. For the year ended December 31, 2017, we did not record an impairment on goodwill.
Seasonal weather conditions and natural disasters could severely disrupt normal operations and harm our business.
Our water solutions operations are located primarily in the southern, mid‑western and eastern United States. We also have fluids management operations in Western Canada. Certain of these areas are adversely affected by seasonal weather conditions, primarily in the winter and spring. During periods of heavy snow, ice or rain, we may be unable to move our equipment between locations, thereby reducing our ability to provide services and generate revenues. In particular, in Canada, wet weather and the spring thaw may make the ground unstable. Consequently, municipalities and provincial transportation departments enforce road bans that restrict the movement of rigs and other heavy equipment, thereby reducing activity levels. The timing and length of the road bans depend on weather conditions leading to the spring thaw and during the thawing period. Additionally, certain oil and gas producing areas are located in areas that are inaccessible other than during the winter months, because the ground surrounding the drilling sites in these areas consists of swampy terrain known as muskeg. Rigs and other necessary equipment cannot cross this terrain to reach the drilling site until the muskeg freezes. Additionally, extended drought conditions in our operating regions could impact our ability to source sufficient water for our customers or increase the cost for such water. As a result, a natural disaster or inclement weather conditions could severely disrupt the normal operation of our business and adversely impact our financial condition and results of operations.
We are subject to cyber security risks. A cyber incident could occur and result in information theft, data corruption, operational disruption and/or financial loss.
The oil and gas industry has become increasingly dependent on digital technologies to conduct certain processing activities. For example, we depend on digital technologies to perform many of our services and to process and record financial and operating data. At the same time, cyber incidents, including deliberate attacks or unintentional events, have increased. The U.S. government has issued public warnings that indicate that energy assets might be specific targets of cyber security threats. Our technologies, systems and networks, and those of our vendors, suppliers and other business partners, may become the target of cyberattacks or information security breaches that could result in the unauthorized release, gathering, monitoring, misuse, loss or destruction of proprietary and other information, or other disruption of business operations. In addition, certain cyber incidents, such as surveillance, may remain undetected for an extended period. Our systems and insurance coverage for protecting against cyber security risks may not be sufficient. As cyber incidents continue to evolve, we may be required to expend additional resources to continue to modify or enhance our protective measures or to investigate and remediate any vulnerability to cyber incidents. Our insurance coverage for cyberattacks may not be sufficient to cover all the losses we may experience as a result of such cyberattacks.
A terrorist attack or armed conflict could harm our business.
The occurrence or threat of terrorist attacks in the United States, Canada or other countries, anti‑terrorist efforts and other armed conflicts involving the United States, Canada or other countries, including continued hostilities in the Middle East, may adversely affect the United States, Canada and global economies and could prevent us from meeting our financial and other obligations. If any of these events occur, the resulting political instability and societal disruption could reduce overall demand for oil and gas, potentially putting downward pressure on demand for our services and causing a reduction in our revenues. Oil and gas related facilities could be direct targets of terrorist attacks, and our operations could be adversely impacted if infrastructure integral to our customers’ operations is destroyed or damaged. Costs for insurance and other security may increase as a result of these threats, and some insurance coverage may become more difficult to obtain, if available at all.
43
We engage in transactions with related parties and such transactions present possible conflicts of interest that could have an adverse effect on us.
We have entered into a significant number of transactions with related parties. Related party transactions create the possibility of conflicts of interest with regard to our management. Such a conflict could cause an individual in our management to seek to advance his or her economic interests above ours. Further, the appearance of conflicts of interest created by related party transactions could impair the confidence of our investors. Our board of directors regularly reviews these transactions. Notwithstanding this, it is possible that a conflict of interest could have a material adverse effect on our liquidity, results of operations and financial condition.
The adoption of more stringent trucking legislation or regulations may increase our costs and could have a material adverse effect on our liquidity, consolidated results of operations, and consolidated financial condition.
In connection with the services we provide in the United States and Canada, we operate as a motor carrier and therefore are subject to regulation by the U.S. DOT and analogous U.S. state agencies, and by Transport Canada and analogous provincial agencies. These regulatory authorities exercise broad powers, governing activities such as the authorization to engage in motor carrier operations and regulatory safety. There are additional regulations specifically relating to the trucking industry, including testing and specification of equipment and product handling requirements. The trucking industry is subject to possible legislative and regulatory changes that may affect the economics of the industry by requiring changes in operating practices or by changing the demand for common or contract carrier services or the cost of providing truckload services. Some of these possible changes include increasingly stringent environmental regulations and changes in the regulations that govern the amount of time a driver may drive in any specific period, onboard black box recorder devices or limits on vehicle weight and size.
In the United States, interstate motor carrier operations are subject to safety requirements developed and implemented by the U.S. DOT. Intrastate motor carrier operations often are subject to state safety regulations that mirror federal regulations. Such matters as weight and dimension of equipment are also subject to federal and state laws and regulations. In Canada, as the Canadian government continues to develop and propose regulations relating to fuel quality, engine efficiency and GHG emissions, we may experience an increase in costs related to truck purchases and maintenance, impairment of equipment productivity, a decrease in the residual value of vehicles, unpredictable fluctuations in fuel prices and an increase in operating expenses. Increased truck traffic may contribute to deteriorating road conditions in some areas where our operations are performed. Our operations, including routing and weight restrictions, could be affected by road construction, road repairs, detours and state and local regulations and ordinances restricting access to certain roads. In addition, proposals to increase taxes, including taxes on motor fuels, are also made from time to time, and any such increase would increase our operating costs. Also, local regulation of permitted routes and times on specific roadways could adversely affect our operations. We cannot predict whether, or in what form, any legislative or regulatory changes or municipal ordinances applicable to our logistics operations will be enacted and to what extent any such legislation or regulations could increase our costs or otherwise adversely affect our business or operations.
From time to time, various legislative proposals are introduced, including proposals to increase federal, state or local taxes, including taxes on motor fuels, which may increase our costs or adversely affect the recruitment of drivers. Management cannot predict whether, or in what form, any increase in such taxes applicable to us will be enacted. We may be required to increase operating expenses or capital expenditures in order to comply with any new laws, regulations or other restrictions.
44
Disruptions in the transportation services of trucking companies transporting wastewater and other oilfield products could have a material adverse effect on our results.
We use trucks to transport some produced water to our wastewater disposal facilities, as well as to transport sand in the Rockies and Bakken areas. In recent years, certain states, such as North Dakota and Texas, and state counties have increased enforcement of weight limits on trucks used to transport raw materials on their public roads. It is possible that the states, counties and cities in which we operate our business may modify their laws to further reduce truck weight limits or impose curfews or other restrictions on the use of roadways. Such legislation and enforcement efforts could result in delays in, and increased costs to, transport produced water to our wastewater disposal facilities or to transport sand, which may either increase our operating costs or reduce the amount of produced water transported to our facilities or sand hauled for our customers. Such developments could decrease our operating margins or amounts of produced water or sand and thereby have a material adverse effect on our results of operations and financial condition.
A significant increase in fuel prices may adversely affect our transportation costs, which could have a material adverse effect on our results of operations and financial condition.
Fuel is one of our significant operating expenses, and a significant increase in fuel prices could result in increased transportation costs. The price and supply of fuel is unpredictable and fluctuates based on events such as geopolitical developments, supply and demand for oil and gas, actions by oil and gas producers, war and unrest in oil producing countries and regions, regional production patterns and weather concerns. A significant increase in fuel prices could increase the price of, and therefore reduce demand for, our services, which could affect our results of operations and financial condition.
Our Canadian operations subject us to currency translation risk, which could cause our results of operations and financial condition to fluctuate significantly from period to period.
A portion of our revenue is derived from our Canadian activities and operations. As a result, we translate the results of our operations and financial condition of our Canadian operations into U.S. dollars. Therefore, our reported results of operations and financial condition are subject to changes in the exchange rate between the two currencies. Fluctuations in foreign currency exchange rates could affect our revenue, expenses and operating margins. As we continue to expand our international operations, we become more exposed to the effects of fluctuations in currency exchange rates. Currently, we do not hedge our exposure to changes in foreign exchange rates.
Risks Related to our Class A Common Stock
We do not expect to pay any dividends to the holders of the Class A common stock in the foreseeable future and the availability and timing of future dividends, if any, is uncertain.
We currently intend to retain future earnings, if any, to finance the expansion of our business, including the repayment of our debt, and do not expect to declare or pay any dividends on our Class A common stock in the foreseeable future. Our Credit Agreement places certain restrictions on the ability of us and our subsidiaries to pay dividends. Consequently, your only opportunity to achieve a return on your investment in us will be if you sell your Class A common stock at a price greater than you paid for it. There is no guarantee that the price of our Class A common stock that will prevail in the market will ever exceed the price that you pay. We may amend our Credit Agreement or enter into new debt arrangements that also prohibit or restrict our ability to pay dividends on our Class A common stock.
Subject to such restrictions, our board of directors will determine the amount and timing of stockholder dividends, if any, that we may pay in future periods. In making this determination, our directors will consider all relevant factors, including the amount of cash available for dividends, capital expenditures, covenants, prohibitions or limitations with respect to dividends, applicable law, general operational requirements and other variables. We cannot predict the amount or timing of any future dividends you may receive, and if we do commence the payment of dividends, we may be unable to pay, maintain or increase dividends over time. Therefore, you may not be able to realize any return on your investment in our Class A common stock for an extended period of time, if at all. Please read “Item 5. Market for
45
Registrant’s Common Equity, Related Stockholder Matters and Issuer Purchases of Equity Securities—Dividend Policy.”
If certain conditions are not met, Special Dividends may accrue on the outstanding shares of our Class A-2 common stock which would be dilutive to the holders of our Class A common stock and Class B common stock.
If we fail to cause a resale shelf registration statement for the benefit of the holders of our Class A-2 common stock to go effective by March 31, 2018 as currently anticipated, Special Dividends (as defined in our amended and restated certificate of incorporation) will accrue with respect to the outstanding shares of our Class A-2 common stock. Special Dividends are non-cash dividends that are payable only in additional shares of Class A-2 common stock, resulting in dilution to the holders of our Class A common stock and Class B common stock that may be substantial. The holders of Class A-2 common stock will be given the benefit of any accrued Special Dividends for purposes of (i) voting at any meeting of stockholders (for so long as shares of Class A-2 common stock remain issued and outstanding), (ii) the receipt of any dividends declared on our common stock (other than Special Dividends) and (iii) the sale or transfer of shares of Class A-2 common stock, such that the right to receive any accrued and unpaid Special Dividends shall be transferred with and unseverable from the shares of Class A-2 common stock on which such Special Dividends accrue. Such Special Dividends will be issuable upon the occurrence of certain events; once issued, such shares will be convertible into shares of Class A common stock on the same terms and conditions as the Class A-2 common stock.
If we fail to develop or maintain an effective system of internal controls, we may not be able to accurately report our financial results or prevent fraud. As a result, current and potential stockholders could lose confidence in our financial reporting, which would harm our business and the trading price of our Class A common stock.
Effective internal controls are necessary for us to provide reliable financial reports, prevent fraud and operate successfully as a public company. We are not currently required to comply with the SEC’s rules implementing Section 404 of the Sarbanes‑Oxley Act of 2002 (“Sarbanes-Oxley”) and therefore are not required to make a formal assessment of the effectiveness of our internal controls over financial reporting for that purpose. If we cannot provide reliable financial reports or prevent fraud, our reputation and operating results would be harmed. We cannot be certain that our efforts to develop and maintain our internal controls will be successful, that we will be able to maintain adequate controls over our financial processes and reporting in the future or that we will be able to comply with our obligations under Sections 302 and 404 of Sarbanes‑Oxley. Any failure to develop or maintain effective internal controls, or difficulties encountered in implementing or improving our internal controls, could harm our operating results or cause us to fail to meet our reporting obligations. Ineffective internal controls could also cause investors to lose confidence in our reported financial information, which would likely have a negative effect on the trading price of our Class A common stock.
Since we are an “emerging growth company,” we are not required to comply with certain disclosure requirements that are applicable to other public companies and we cannot be certain if the reduced disclosure requirements applicable to emerging growth companies will make our Class A common stock less attractive to investors.
We are an “emerging growth company,” as defined in the Jumpstart Our Business Startups Act of 2012 (the “JOBS Act”) and we may take advantage of certain exemptions from various reporting requirements that are applicable to public companies, including, but not limited to, longer phase‑in periods for the adoption of new or revised financial accounting standards, not being required to comply with the auditor attestation requirements of Section 404 of Sarbanes‑Oxley, reduced disclosure obligations regarding executive compensation in our periodic reports and proxy statements, and exemptions from the requirements of holding a nonbinding advisory vote on executive compensation and stockholder approval of any golden parachute payments not previously approved. We intend to take advantage of all of the reduced reporting requirements and exemptions, including the longer phase‑in periods for the adoption of new or revised financial accounting standards under Section 107 of the JOBS Act, until we are no longer an emerging growth company. Our election to use the phase‑in periods permitted by this election may make it difficult to compare our financial statements to those of non‑emerging growth companies and other emerging growth companies that have opted out of the longer phase‑in periods under Section 107 of the JOBS Act and who will comply with new or revised financial accounting standards. If we were to subsequently elect instead to comply with these public company effective dates, such election would be irrevocable pursuant to Section 107 of the JOBS Act.
46
We cannot predict if investors will find our Class A common stock less attractive because we will rely on these exemptions. If some investors find our Class A common stock less attractive as a result, there may be a less active trading market for our Class A common stock and our Class A common stock price may be more volatile. Under the JOBS Act, “emerging growth companies” can delay adopting new or revised accounting standards until such time as those standards apply to private companies.
We will remain an emerging growth company for up to five years, although we will lose that status sooner if we have more than $1.07 billion of revenues in a fiscal year, have more than $700 million in market value of our common stock held by non-affiliates as of any June 30 or issue more than $1.0 billion of non-convertible debt over a rolling three-year period.
Future sales of our equity securities, or the perception that such sales may occur, may depress our share price, and any additional capital raised through the sale of equity or convertible securities may dilute your ownership in us.
Subject to certain limitations and exceptions, SES Legacy Holdings, LLC (“Legacy Owner Holdco”) and its permitted transferees may exchange their SES Holdings LLC Units (together with a corresponding number of shares of Class B common stock) for shares of Class A common stock (on a one-for-one basis, subject to conversion rate adjustments for stock splits, stock dividends and reclassification and other similar transactions) and then sell those shares of Class A common stock. Additionally, we may in the future issue our previously authorized and unissued securities. We are authorized to issue 350 million shares of Class A common stock, 40 million shares of Class A-2 common stock, 150 million shares of Class B common stock and 50 million shares of preferred stock with such designations, preferences and rights as determined by our board of directors. The potential issuance of such additional shares of equity securities will result in the dilution of the ownership interests of the holders of our Class A common stock and may create downward pressure on the trading price, if any, of our Class A common stock.
In addition, Legacy Owner Holdco, Crestview Partners II SES Investment B, LLC, the SCF Group (as defined below) and WDC Aggregate LLC (collectively, the “Registration Rights Holders”), who collectively own approximately 60.5 million shares of our common stock, are party to a registration rights agreement which provides, among other things, for parties to that agreement to demand registration of all or a portion of their shares and to initiate or participate in certain underwritten offerings. Parties to such registration rights agreement may exercise their rights under such agreement in their sole discretion, and sales pursuant to such rights may be material in amount and occur at any time.
In connection with the closing of the Rockwater Merger, Rockwater assigned, and we assumed Rockwater’s rights and obligations under a registration rights agreement entered into by and between Rockwater and FBR Capital Markets & Co. Under such assumed registration rights agreement, we agreed, at our expense, to file with the SEC a shelf registration statement registering for resale shares of our Class A common stock into which the outstanding shares of our Class A-2 common stock are convertible, and to cause such registration statement to be declared effective by the SEC as soon as practicable but in any event by March 31, 2018.
The registration rights of the Registration Rights Holders and the holders of our Class A-2 common stock and the sales of substantial amounts of our Class A common stock following the effectiveness of registration statements for the benefit of such holders, or the perception that these sales may occur, could cause the market price of our Class A common stock to decline and impair our ability to raise capital. We also may grant additional registration rights in connection with any future issuance of our capital stock.
We cannot predict the size of future issuances of our Class A common stock or securities convertible into Class A common stock or the effect, if any, that future issuances and sales of shares of our Class A common stock will have on the market price of our Class A common stock. Sales of substantial amounts of our Class A common stock (including shares issued in connection with an acquisition), or the perception that such sales could occur, may adversely affect prevailing market prices of our Class A common stock.
47
If securities or industry analysts do not publish research or reports about our business, if they adversely change their recommendations regarding our Class A common stock or if our operating results do not meet their expectations, the share price for our Class A common stock could decline.
The trading market for our Class A common stock will be influenced by the research and reports that industry or securities analysts publish about us or our business. If one or more of these analysts cease coverage of us or fail to publish reports on us regularly, we could lose visibility in the financial markets, which in turn could cause the price or trading volume of our Class A common stock to decline. Moreover, if one or more of the analysts who cover us downgrades our Class A common stock or if our operating results do not meet their expectations, the share price of our Class A common stock could decline.
Provisions in our amended and restated certificate of incorporation and amended and restated bylaws and Delaware law may discourage a takeover attempt even if a takeover might be beneficial to our stockholders.
Provisions contained in our Third Amended and Restated Certificate of Incorporation and our Amended and Restated Bylaws, which we refer to herein as our “amended and restated certificate of incorporation” and “amended and restated bylaws,” respectively, could make it more difficult for a third party to acquire us. Provisions of our amended and restated certificate of incorporation and amended and restated bylaws impose various procedural and other requirements, which could make it more difficult for stockholders to effect certain corporate actions. For example, our amended and restated certificate of incorporation authorizes our board of directors to determine the rights, preferences, privileges and restrictions of unissued series of preferred stock without any vote or action by our stockholders. Thus, our board of directors can authorize and issue shares of preferred stock with voting or conversion rights that could adversely affect the voting or other rights of holders of our capital stock. These rights may have the effect of delaying or deterring a change of control of our company. Additionally, our amended and restated bylaws establish limitations on the removal of directors and on the ability of our stockholders to call special meetings and include advance notice requirements for nominations for election to our board of directors and for proposing matters that can be acted upon at stockholder meetings. These provisions could limit the price that certain investors might be willing to pay in the future for shares of our Class A common stock.
In addition, certain change of control events have the effect of accelerating the payment due under our Tax Receivable Agreements (as defined herein), which could be substantial and accordingly serve as a disincentive to a potential acquirer of our company. See “—Risks Related to Our Organizational Structure—In certain cases, payments under the Tax Receivable Agreements may be accelerated and/or significantly exceed the actual benefits, if any, we realize in respect of the tax attributes subject to the Tax Receivable Agreements.”
Legacy Owner Holdco controls a significant percentage of our voting power.
Legacy Owner Holdco beneficially owns 89.2% of our Class B common stock and the Class B common stock represents approximately 33.9% of our outstanding voting capital stock. In addition, certain of our directors are currently employed by Crestview Advisors, L.L.C. (“Crestview Partners”), our private equity sponsor and, through Crestview Partners II GP, L.P. (“Crestview GP”), the manager of funds that hold the largest equity interest in Legacy Owner Holdco. Other funds controlled by Crestview GP also have an interest in our currently outstanding shares of our Class A common stock, representing an additional 3.6% of our outstanding voting capital. Collectively, these holders control approximately 37.4% of our voting shares. Holders of Class A common stock, Class A‑2 common stock and Class B common stock generally will vote together as a single class on all matters presented to our stockholders for their vote or approval. Consequently, Legacy Owner Holdco will be able to strongly influence all matters that require approval by our stockholders, including the election and removal of directors, changes to our organizational documents and approval of acquisition offers and other significant corporate transactions, regardless of whether other stockholders believe that a transaction is in their own best interests. This concentration of ownership will limit your ability to influence corporate matters, and as a result, actions may be taken that you may not view as beneficial.
48
Our amended and restated certificate of incorporation contains a provision renouncing our interest and expectancy in certain corporate opportunities, which could adversely affect our business or prospects.
Our amended and restated certificate of incorporation provides that, to the fullest extent permitted by applicable law, we renounce any interest or expectancy in any business opportunity that involves any aspect of the energy business or industry and that may be from time to time presented to any member of (i) Legacy Owner Holdco; Crestview Partners II SES Investment, LLC (‘‘Crestview Holdings A’’); any funds, limited partnerships or other investment entities or vehicles managed by Crestview Partners or controlled by Crestview GP; B-29 Investments, LP; Sunray Capital, LP; Proactive Investments, LP and their respective affiliates, other than us (collectively, the ‘‘SES Group’’); (ii) SCF-VI, L.P., SCF-VII, L.P. and SCF-VII(A), L.P. and their respective affiliates, other than us (collectively, the ‘‘SCF Group’’); (iii) the other entities (existing and future) that participate in the energy industry and in which the SES Group and SCF Group own substantial equity interests (the ‘‘Portfolio Companies’’) or (iv) any director or officer of the corporation who is also an employee, partner, member, manager, officer or director of any member of the SES Group, the SCF Group or the Portfolio Companies, including our Executive Chairman, John D. Schmitz, our director, David C. Baldwin, and our Executive Vice President, Business Strategy, Cody Ortowski, even if the opportunity is one that we might
reasonably have pursued or had the ability or desire to pursue if granted the opportunity to do so. Mr. Schmitz controls both B-29 Investments, LP and Sunray Capital, LP and is a direct and indirect beneficiary of these provisions in our amended and restated certificate of incorporation. Our amended and restated certificate of incorporation further provides that no such person or party shall be liable to us by reason of the fact that such person pursues any such business opportunity, or fails to offer any such business opportunity to us.
As a result, any member of the SES Group, SCF Group or the Portfolio Companies or any director or officer of the corporation who is also an employee, partner, member, manager, officer or director of any member of the SES Group, SCF Group or the Portfolio Companies may become aware, from time to time, of certain business opportunities, such as acquisition opportunities, and may direct such opportunities to other businesses in which they have invested, in which case we may not become aware of or otherwise have the ability to pursue such opportunity. Further, such businesses may choose to compete with us for these opportunities. As a result, by renouncing our interest and expectancy in any business opportunity that may be from time to time presented to any member of the SES Group, SCF Group or the Portfolio Companies or any director or officer of the corporation who is also an employee, partner, member, manager, officer or director of any member of the SES Group, SCF Group or the Portfolio Companies, our business or prospects could be adversely affected if attractive business opportunities are procured by such parties for their own benefit rather than for ours. See “Item 13. Certain Relationships and Related Transactions, and Director Independence.”
A significant reduction by Crestview GP or the SCF Group of either of their respective ownership interests in us could adversely affect us.
We believe that Crestview GP’s and the SCF Group’s beneficial ownership interests in us provides each with an economic incentive to assist us to be successful. Neither Crestview GP nor the SCF Group is subject to any obligation to maintain its ownership interest in us and either may elect at any time to sell all or a substantial portion of or otherwise reduce its ownership interest in us. If either Crestview GP or the SCF Group sells all or a substantial portion of its ownership interest in us, it may have less incentive to assist in our success and its affiliate(s) that are expected to serve as members of our board of directors may resign. Such actions could adversely affect our ability to successfully implement our business strategies which could adversely affect our cash flows or results of operations.
We may issue preferred stock whose terms could adversely affect the voting power or value of our Class A common stock.
Our amended and restated certificate of incorporation authorizes us to issue, without the approval of our stockholders, one or more classes or series of preferred stock having such designations, preferences, limitations and relative rights, including preferences over our Class A common stock respecting dividends and distributions, as our board of directors may determine. The terms of one or more classes or series of preferred stock could adversely impact the voting power or value of our Class A common stock. For example, we might grant holders of preferred stock the right to elect some number of our directors in all events or on the happening of specified events or the right to veto
49
specified transactions. Similarly, the repurchase or redemption rights or liquidation preferences we might assign to holders of preferred stock could affect the residual value of the Class A common stock.
Our amended and restated certificate of incorporation designates the Court of Chancery of the State of Delaware as the sole and exclusive forum for certain types of actions and proceedings that may be initiated by our stockholders, which could limit our stockholders’ ability to obtain a favorable judicial forum for disputes with us or our directors, officers, employees or agents.
Our amended and restated certificate of incorporation provides that, unless we consent in writing to the selection of an alternative forum, the Court of Chancery of the State of Delaware will, to the fullest extent permitted by applicable law, be the sole and exclusive forum for (i) any derivative action or proceeding brought on our behalf, (ii) any action asserting a claim of breach of a fiduciary duty owed by any of our directors, officers, employees or agents to us or our stockholders, (iii) any action asserting a claim against us or any director or officer or other employee or agent of ours arising pursuant to any provision of the Delaware General Corporation Law, our amended and restated certificate of incorporation or our amended and restated bylaws, or (iv) any action asserting a claim against us or any director or officer or other employee or agent of ours that is governed by the internal affairs doctrine, in each such case subject to such Court of Chancery having personal jurisdiction over the indispensable parties named as defendants therein. To the fullest extent permitted by law, any person or entity purchasing or otherwise acquiring any interest in shares of our capital stock will be deemed to have notice of, and consented to, the provisions of our amended and restated certificate of incorporation described in the preceding sentence. This choice of forum provision may limit a stockholder’s ability to bring a claim in a judicial forum that it finds favorable for disputes with us or our directors, officers, employees or agents, which may discourage such lawsuits against us and such persons. Alternatively, if a court were to find these provisions of our amended and restated certificate of incorporation inapplicable to, or unenforceable in respect of, one or more of the specified types of actions or proceedings, we may incur additional costs associated with resolving such matters in other jurisdictions, which could adversely affect our business, financial condition or results of operations.
Risks Related to Our Organizational Structure
We are a holding company. Our sole material asset is our equity interest in SES Holdings, and accordingly, we are dependent upon distributions and payments from SES Holdings to pay taxes, make payments under the Tax Receivable Agreements and cover our corporate and other overhead expenses.
We are a holding company and have no material assets other than our equity interest in SES Holdings. We have no independent means of generating revenue. To the extent SES Holdings has available cash, we intend to cause SES Holdings to make (i) generally pro rata distributions to its unitholders, including us, in an amount at least sufficient to allow us to pay our taxes and to make payments under the Tax Receivable Agreements that we entered into in connection with our restructuring at the Select 144A Offering and any subsequent tax receivable agreements that we may enter into in connection with future acquisitions and (ii) non‑pro rata payments to us to reimburse us for our corporate and other overhead expenses. We will be limited, however, in our ability to cause SES Holdings and its subsidiaries to make these and other distributions or payments to us due to certain limitations, including the restrictions under our Credit Agreement and the cash requirements and financial condition of SES Holdings. To the extent that we need funds and SES Holdings or its subsidiaries are restricted from making such distributions or payments under applicable law or regulations or under the terms of their financing arrangements or are otherwise unable to provide such funds, our liquidity and financial condition could be adversely affected.
We will be required to make payments under the Tax Receivable Agreements for certain tax benefits we may claim, and the amounts of such payments could be significant.
In connection with our restructuring at the Select 144A Offering, we entered into two tax receivable agreements (the “Tax Receivable Agreements”) with certain affiliates of the then-holders of SES Holdings LLC Units (the “TRA Holders”) which generally provide for the payment by us to the TRA Holders of 85% of the net cash savings, if any, in U.S. federal, state and local income and franchise tax that we actually realize (computed using simplifying assumptions to address the impact of state and local taxes) or are deemed to realize in certain circumstances as a result of certain tax basis increases, net operating losses available to us as a result of certain reorganization transactions entered into in connection with the Select 144A Offering, and certain tax benefits attributable to imputed interest. We will retain the benefit of the remaining 15% of these cash savings.
50
The term of each Tax Receivable Agreement commenced upon the completion of the Select 144A Offering and will continue until all tax benefits that are subject to such Tax Receivable Agreement have been utilized or expired, unless we exercise our right to terminate the Tax Receivable Agreements (or the Tax Receivable Agreements are terminated due to other circumstances, including our breach of a material obligation thereunder or certain mergers or other changes of control) and we make the termination payment specified in the Tax Receivable Agreements. In addition, payments we make under the Tax Receivable Agreements will be increased by any interest accrued from the due date (without extensions) of the corresponding tax return. In the event that the Tax Receivable Agreements are not terminated and we have sufficient taxable income to utilize all of the tax benefits subject to the Tax Receivable Agreements, the payments due under the Tax Receivable Agreement entered into with Legacy Owner Holdco and Crestview GP are expected to commence in late 2018 and to continue for 20 years after the date of the last exchange of SES Holdings LLC Units, and the payments due under the Tax Receivable Agreement entered into with an affiliate of the Contributing Legacy Owners are expected to commence in late 2019 and to continue for 25 taxable years following the Select 144A Offering.
The payment obligations under the Tax Receivable Agreements are our obligations and not obligations of SES Holdings, and we expect that the payments we will be required to make under the Tax Receivable Agreements will be substantial. Estimating the amount and timing of payments that may become due under the Tax Receivable Agreements is by its nature imprecise. For purposes of the Tax Receivable Agreements, cash savings in tax generally will be calculated by comparing our actual tax liability (using the actual applicable U.S. federal income tax rate and an assumed combined state and local income and franchise tax rate) to the amount we would have been required to pay had we not been able to utilize any of the tax benefits subject to the Tax Receivable Agreements. The amounts payable, as well as the timing of any payments, under the Tax Receivable Agreements are dependent upon future events and significant assumptions, including the timing of the exchanges of SES Holdings LLC Units, the market price of our Class A common stock at the time of each exchange (since such market price will determine the amount of tax basis increases resulting from the exchange), the extent to which such exchanges are taxable transactions, the amount of the exchanging unitholder’s tax basis in its SES Holdings LLC Units at the time of the relevant exchange, the depreciation and amortization periods that apply to the increase in tax basis, the amount of net operating losses available to us as a result of reorganization transactions entered into in connection with the Select 144A Offering, the amount and timing of taxable income we generate in the future, the U.S. federal income tax rate then applicable, and the portion of our payments under the Tax Receivable Agreements that constitute imputed interest or give rise to depreciable or amortizable tax basis.
Certain of the TRA Holders’ rights under the Tax Receivable Agreements are transferable in connection with a permitted transfer of SES Holdings LLC Units or if the TRA Holder no longer holds SES Holdings LLC Units. The payments under the Tax Receivable Agreements are not conditioned upon the continued ownership interest in either SES Holdings or us of any holder of rights under the Tax Receivable Agreements. See “Item 13. Certain Relationships and Related Transactions, and Director Independence.”
In certain cases, payments under the Tax Receivable Agreements may be accelerated and/or significantly exceed the actual benefits, if any, we realize in respect of the tax attributes subject to the Tax Receivable Agreements.
If we elect to terminate the Tax Receivable Agreements early or they are terminated early due to our failure to honor a material obligation thereunder or due to certain mergers, asset sales, other forms of business combinations or other changes of control, our obligations under the Tax Receivable Agreements would accelerate and we would be required to make an immediate payment equal to the present value of the anticipated future payments to be made by us under the Tax Receivable Agreements (determined by applying a discount rate of the lesser of 6.50% per annum, compounded annually, or one‑year London Interbank Offered Rate (“LIBOR”) plus 100 basis points); and such payment is expected to be substantial. The calculation of anticipated future payments will be based upon certain assumptions and deemed events set forth in the Tax Receivable Agreements, including (i) the assumption that we have sufficient taxable income to fully utilize the tax benefits covered by the Tax Receivable Agreements, (ii) the assumption that any SES Holdings LLC Units (other than those held by us) outstanding on the termination date are exchanged on the termination date and (iii) certain loss or credit carryovers will be utilized in the taxable year that includes the termination date. Any early termination payment may be made significantly in advance of the actual realization, if any, of the future tax benefits to which the termination payment relates.
51
As a result of either an early termination or a “change of control” (as defined in the Tax Receivable Agreements, as amended), we could be required to make payments under the Tax Receivable Agreements that exceed our actual cash tax savings under the Tax Receivable Agreements. In these situations, our obligations under the Tax Receivable Agreements could have a substantial negative impact on our liquidity and could have the effect of delaying, deferring or preventing certain mergers, asset sales or other forms of business combinations or changes of control. For example, if the Tax Receivable Agreements were terminated on December 31, 2017, the estimated termination payments would have been approximately $98.9 million (calculated using a discount rate equal to the lesser of 6.50% per annum, compounded annually, or one-year LIBOR plus 100 basis points, applied against an undiscounted liability of $130.6 million, based upon the last reported closing sale price of our Class A common stock on December 31, 2017) in the aggregate. The foregoing number is merely an estimate and the actual payment could differ materially. There can be no assurance that we will be able to finance our obligations under the Tax Receivable Agreements.
Payments under the Tax Receivable Agreements will be based on the tax reporting positions that we will determine. The TRA Holders will not reimburse us for any payments previously made under the Tax Receivable Agreements if any tax benefits that have given rise to payments under the Tax Receivable Agreements are subsequently disallowed, except that excess payments made to the TRA Holders will be netted against payments that would otherwise be made to the TRA Holders, if any, after our determination of such excess. As a result, in such circumstances, we could make payments that are greater than our actual cash tax savings, if any, and may not be able to recoup those payments, which could adversely affect our liquidity. See “Item 13. Certain Relationships and Related Transactions, and Director Independence.”
If SES Holdings were to become a publicly traded partnership taxable as a corporation for U.S. federal income tax purposes, we and SES Holdings might be subject to potentially significant tax inefficiencies, and we would not be able to recover payments previously made by us under the Tax Receivable Agreements even if the corresponding tax benefits were subsequently determined to have been unavailable due to such status.
We intend to operate such that SES Holdings does not become a publicly traded partnership taxable as a corporation for U.S. federal income tax purposes. A “publicly traded partnership” is a partnership, the interests of which are traded on an established securities market or are readily tradable on a secondary market or the substantial equivalent thereof. Under certain circumstances, exchanges of SES Holdings LLC Units for shares of our Class A common stock or cash pursuant to the Eighth Amended and Restated Limited Liability Company Agreement of SES Holdings (the “SES Holdings LLC Agreement”) or other transfers of SES Holdings LLC Units could cause SES Holdings to be treated as a publicly traded partnership. Applicable U.S. Treasury regulations provide for certain safe harbors from treatment as a publicly traded partnership, and we intend to operate such that exchanges or other transfers of SES Holdings LLC Units qualify for one or more such safe harbors. For example, we intend to limit the number of unitholders of SES Holdings and Legacy Owner Holdco, and the SES Holdings LLC Agreement, provides for limitations on the ability of unitholders of SES Holdings to transfer their SES Holdings LLC Units and will provide us, as managing member of SES Holdings, with the right to impose restrictions (in addition to those already in place) on the ability of unitholders of SES Holdings to exchange their SES Holdings LLC Units pursuant to the SES Holdings LLC Agreement to the extent we believe it is necessary to ensure that SES Holdings will continue to be treated as a partnership for U.S. federal income tax purposes. If SES Holdings were to become a publicly traded partnership, significant tax inefficiencies might result for us and for SES Holdings. In addition, we may not be able to realize tax benefits covered under the Tax Receivable Agreements, and we would not be able to recover any payments previously made by us under the Tax Receivable Agreements, even if the corresponding tax benefits (including any claimed increase in the tax basis of SES Holdings’ assets) were subsequently determined to have been unavailable.
Legacy Owner Holdco and the Legacy Owners may have interests that conflict with holders of shares of our Class A common stock.
Legacy Owner Holdco owns approximately 33.9% of the outstanding SES Holdings LLC Units. Because it holds a portion of its ownership interest in our business in the form of direct ownership interests in SES Holdings rather than through us, Legacy Owner Holdco may have conflicting interests with holders of shares of Class A common stock. For example, Legacy Owner Holdco may have different tax positions from us, and decisions we make in the course of running our business, such as with respect to mergers, asset sales, other forms of business combinations or other changes
52
in control, may affect the timing and amount of payments that are received by the TRA Holders under the Tax Receivable Agreements. See “Item 13. Certain Relationships and Related Transactions, and Director Independence.”
Our ability to use Rockwater’s net operating loss carryforwards may be limited.
As of December 31, 2017, Rockwater had approximately $105.9 million of U.S. federal net operating loss carryforwards (“NOLs”), which will begin to expire in 2035, approximately $77.4 million of state NOLs which will begin to expire in 2020, and approximately $14.5 million of foreign NOLs, which will begin to expire in 2035. Utilization of these NOLs depends on many factors, including our future income, which cannot be assured. In addition, Section 382 of the Internal Revenue Code of 1986, as amended (the “Code”), generally imposes an annual limitation on the amount of NOLs that may be used to offset taxable income when a corporation has undergone an “ownership change” (as determined under Section 382 of the Code). An ownership change generally occurs if one or more stockholders (or groups of stockholders) who are each deemed to own at least 5% of the relevant corporation’s stock change their ownership by more than 50 percentage points over their lowest ownership percentage within a rolling three‑year period. In the event that an ownership change has occurred, or were to occur, utilization of the NOLs would be subject to an annual limitation under Section 382 of the Code, determined by multiplying the value of the relevant corporation’s stock at the time of the ownership change by the applicable long‑term tax‑exempt rate as defined in Section 382 of the Code, and potentially increased for certain gains recognized within five years after the ownership change if we have a net built‑in gain in our assets at the time of the ownership change. Any unused annual limitation may be carried over to later years until they expire. Rockwater experienced an ownership change in connection with the Rockwater Merger. As a result, some or all of our U.S. federal, state or foreign NOLs could expire before they can be used. In addition, future ownership changes or changes to the U.S. tax laws could limit our ability to utilize our NOLs. To the extent we are not able to offset our future income with our NOLs, this would adversely affect our operating results and cash flows if we attain profitability.
Future regulations relating to and interpretations of recently enacted U.S. federal income tax legislation may vary from our current interpretation of such legislation.
The U.S. federal income tax legislation recently enacted in Public Law No. 115-97, commonly referred to as the Tax Cuts and Jobs Act, is highly complex and subject to interpretation. The presentation of our financial condition and results of operations is based upon our current interpretation of the provisions contained in the Tax Cuts and Jobs Act. In the future, the Treasury Department and the Internal Revenue Service are expected to release regulations relating to and interpretive guidance of the legislation contained in the Tax Cuts and Jobs Act. Any significant variance of our current interpretation of such legislation from any future regulations or interpretive guidance could result in a change to the presentation of our financial condition and results of operations and could negatively affect our business.
ITEM 1B. UNRESOLVED STAFF COMMENTS
None.
We lease space for our principal executive offices in Houston, Texas. We also lease local office space in the countries in which we operate. Additionally, we own and lease numerous, storage facilities, trucking facilities and sales and administrative offices throughout the geographic area in which we operate. In connection with our Oilfield Chemicals segment, we own and lease, three primary manufacturing facilities in Texas and 5 regional distribution centers to provide products to our customers in all major U.S. shale basins. Our leased properties are subject to various lease terms and expirations
We believe all properties that we currently occupy are suitable for their intended uses. We believe that our current facilities are sufficient to conduct our operations. However, we continue to evaluate the purchase or lease of additional properties or the sale or consolidation of our properties, as our business requires.
53
The following table shows our active owned and leased properties categorized by geographic region as of December 31, 2017:
|
Region |
|
Office, Repair & Service and Other |
|
Manufacturing |
|
Operational Field Services Facilities |
|
United States |
|
|
|
|
|
|
|
Owned |
|
1 |
|
3 |
|
28 |
|
Leased |
|
8 |
|
- |
|
66 |
|
Canada |
|
|
|
|
|
|
|
Owned |
|
3 |
|
- |
|
- |
|
Leased |
|
- |
|
- |
|
14 |
|
Total |
|
12 |
|
3 |
|
108 |
We are not currently a party to any legal proceedings that, if determined adversely against us, individually or in the aggregate, would have a material adverse effect on our financial position, results of operations or cash flows. We are, however, named defendants in certain lawsuits, investigations and claims arising in the ordinary course of conducting our business, including certain environmental claims and employee‑related matters, and we expect that we will be named defendants in similar lawsuits, investigations and claims in the future. While the outcome of these lawsuits, investigations and claims cannot be predicted with certainty, we do not expect these matters to have a material adverse impact on our business, results of operations, cash flows or financial condition. We have not assumed any liabilities arising out of these existing lawsuits, investigations and claims.
In December 2016, Rockwater was notified by the U.S. Attorney’s Office for the Middle District of Pennsylvania that it is being investigated for altering emissions control systems on several of its vehicles. We are cooperating with the investigation and have determined that mechanics servicing our vehicle fleet may have installed software on certain vehicles and modified a few other vehicles to deactivate or bypass the factory‑installed emissions control systems. At present, it appears that 31 vehicles in Pennsylvania were modified in this manner, apparently to improve vehicle performance and reliability. As a result of a company‑wide investigation undertaken voluntarily and in cooperation with the U.S. Department of Justice, we have determined that approximately 30 additional company vehicles outside of Pennsylvania may have been altered. As of the date of the initiation of the investigation, we operated approximately 1,400 vehicles in the U.S., and the modified vehicles constituted less than 5% of our fleet at such time. We are unable to predict at this time whether any administrative, civil or criminal charges will be brought against us, although we have learned that at least one employee, a service shop supervisor, may be the target of a criminal investigation, and it is possible that other individuals or we could become targets. We are cooperating with the U.S. Department of Justice in all aspects of the investigation and have instituted procedures to ensure that our mechanics do not tamper with or bypass any emissions control systems when they are performing vehicle maintenance, and we have also reached an agreement with the U.S. Department of Justice providing for either the restoration or removal from service of those vehicles that were modified. Although we are unable to predict the outcome of this investigation, we note that in similar circumstances, the EPA has imposed fines of up to $7,200 per altered vehicle and has also required the responsible party to disgorge any financial benefit that it may have derived.
ITEM 4. MINE SAFETY DISCLOSURE
Not applicable.
54
ITEM 5. MARKET FOR REGISTRANT’S COMMON EQUITY, RELATED STOCKHOLDER MATTERS AND ISSUER PURCHASES OF EQUITY SECURITIES
Price Range of Common Stock and Dividends
Our Class A common stock began trading on the New York Stock Exchange (the “NYSE”) under the ticker symbol “WTTR” on April 21, 2017. Prior to that, there was no public market for our common stock. The table below sets forth, for the periods indicated, the high and low sales prices per share of our Class A common stock since April 21, 2017, our first trading date.
|
|
|
WTTR share |
|
Dividends |
|
|||||
|
|
|
High |
|
Low |
|
Per Share |
|
|||
|
2017 |
|
|
||||||||
|
Second Quarter (1) |
|
$ |
16.60 |
|
$ |
11.38 |
|
$ |
0.00 |
|
|
Third Quarter |
|
$ |
17.25 |
|
$ |
11.22 |
|
$ |
0.00 |
|
|
Fourth Quarter |
|
$ |
18.44 |
|
$ |
14.44 |
|
$ |
0.00 |
|
|
(1) |
For the period from April 21, 2017 through June 30, 2017. |
On March 15, 2018, the closing price of our Class A common stock was $13.63. As of March 15, 2018, there were 59,290,665 shares of our Class A common stock outstanding, held of record by 147 holders, 40,331,989 shares of our Class B common stock outstanding, held by seven holders and 6,731,839 shares of our Class A-2 common stock outstanding, held by three holders. The foregoing numbers of holders of our common stock do not include DTC participants or beneficial owners holding shares through nominee names.
Dividend Policy
We have not paid dividends to holders of our Class A common stock. We do not anticipate declaring or paying any cash dividends to holders of our Class A common stock in the foreseeable future. We currently intend to retain future earnings, if any, to finance the expansion of our business. Our future dividend policy is within the discretion of our board of directors and will depend upon then-existing conditions, including our results of operations and financial condition, capital requirements, business prospects, statutory and contractual restrictions on our ability to pay dividends, including restrictions contained in our Credit Agreement and other factors our board of directors may deem relevant.
Holders of shares of our Class A-2 common stock issued in connection with the Rockwater Merger are entitled to receive Special Dividends that will accrue and be payable only in additional shares of Class A-2 common stock if certain conditions are not met. For additional information, please read "Item 1A. Risk Factors—If certain conditions are not met, Special Dividends may accrue on the outstanding shares of our Class A-2 common stock which would be dilutive to the holders of our Class A common stock and Class B common stock.”
55
Unregistered Sales of Equity Securities and Use of Proceeds
Unregistered Sales of Equity Securities
On November 1, 2017, in connection with the closing of the Rockwater Merger and pursuant to the Merger Agreement, we issued 26,246,115 shares of Class A common stock, 6,731,845 shares of Class A‑2 common stock and 4,356,477 shares of Class B common stock (along with a corresponding number of SES Holdings LLC Units) to the former stockholders of Rockwater. At the same time, we issued approximately 37,334,437 SES Holdings LLC Units to the former holders of Rockwater LLC Units. These issuances of our common stock did not involve any underwriters, underwriting discounts or commissions or a public offering. We believe these issuances were exempt from registration pursuant to Section 4(a)(2) of the Securities Act and Rule 506 of Regulation D promulgated thereunder based on representations to us from each former Rockwater stockholder to support such exemption, including with respect to each former Rockwater stockholder’s status as an “accredited investor” (as that term is defined in Rule 501(a) of Regulation D promulgated under Section 4(a)(2) of the Securities Act). The shares of Class A‑2 common stock will automatically convert into shares of our Class A common stock on a one‑for‑one basis upon the effectiveness of a shelf registration statement registering such shares for resale. The shares of SES Holdings LLC Units (along with the corresponding number of Class B common stock) are convertible into shares of Class A common stock upon the satisfaction of certain conditions.
On October 31, 2017, following the distribution by Legacy Owner Holdco of SES Holdings LLC Units and shares of our Class B common stock in redemption of certain of its members (the “SES Redeemed Legacy Holders”), we exercised our right to require an exchange by such SES Redeemed Legacy Holders, pursuant to which SES Holdings distributed 2,487,029 shares of our Class A common stock to such SES Redeemed Legacy Holders in exchange for 2,487,029 SES Holdings LLC Units. This issuance of Class A common stock did not involve any underwriters, underwriting discounts or commissions or a public offering. We believe this issuance was exempt from registration pursuant to Section 4(a)(2) of the Securities Act. In connection with the exchange, the 2,487,029 shares of Class B common stock were cancelled.
Issuer Purchases of Equity Securities
Neither we nor any affiliated purchaser repurchased any of our equity securities during the period covered by this Annual Report on Form 10‑K.
ITEM 6. SELECTED FINANCIAL DATA
The following table presents our selected historical data for the periods and as of the dates indicated. The statement of operations data for the years ended December 31, 2017, 2016 and 2015 and balance sheet data as of December 31, 2017 and 2016 were derived from our audited historical consolidated financial statements. The historical selected financial data should be read in conjunction with “Item 7. Management’s Discussion and Analysis of Financial Condition and Results of Operations” and the historical consolidated financial statements and related notes thereto included in “Item 8. Financial Statements and Supplementary Data.”
56
|
|
|
Year Ended December 31, |
|||||||
|
|
|
2017 |
|
2016 |
|
2015 |
|||
|
|
|
(in thousands) |
|||||||
|
Revenue |
|
|
|
|
|
|
|
|
|
|
Water solutions and related services |
|
$ |
546,043 |
|
$ |
241,455 |
|
$ |
427,496 |
|
Accommodations and rentals |
|
|
53,888 |
|
|
27,151 |
|
|
52,948 |
|
Wellsite completion and construction services |
|
|
50,974 |
|
|
33,793 |
|
|
55,133 |
|
Oilfield chemical product sales |
|
|
41,586 |
|
|
— |
|
|
— |
|
Total revenue |
|
|
692,491 |
|
|
302,399 |
|
|
535,577 |
|
Costs of revenue |
|
|
|
|
|
|
|
|
|
|
Water solutions and related services |
|
|
411,215 |
|
|
200,399 |
|
|
332,411 |
|
Accommodations and rentals |
|
|
41,885 |
|
|
22,019 |
|
|
37,957 |
|
Wellsite completion and construction services |
|
|
42,942 |
|
|
29,089 |
|
|
48,356 |
|
Oilfield chemical product sales |
|
|
37,024 |
|
|
— |
|
|
— |
|
Depreciation and amortization |
|
|
101,645 |
|
|
95,020 |
|
|
104,608 |
|
Total costs of revenue |
|
|
634,711 |
|
|
346,527 |
|
|
523,332 |
|
Gross profit (loss) |
|
|
57,780 |
|
|
(44,128) |
|
|
12,245 |
|
Operating expenses |
|
|
|
|
|
|
|
|
|
|
Selling, general and administrative |
|
|
82,403 |
|
|
34,643 |
|
|
56,548 |
|
Depreciation and amortization |
|
|
1,804 |
|
|
2,087 |
|
|
3,104 |
|
Impairment of goodwill and other intangible assets |
|
|
— |
|
|
138,666 |
|
|
21,366 |
|
Impairment of property and equipment |
|
|
— |
|
|
60,026 |
|
|
— |
|
Lease abandonment costs |
|
|
3,572 |
|
|
19,423 |
|
|
— |
|
Total operating expenses |
|
|
87,779 |
|
|
254,845 |
|
|
81,018 |
|
Loss from operations |
|
|
(29,999) |
|
|
(298,973) |
|
|
(68,773) |
|
Other income (expense) |
|
|
|
|
|
|
|
|
|
|
Interest expense, net |
|
|
(6,629) |
|
|
(16,128) |
|
|
(13,689) |
|
Foreign currency gains, net |
|
|
281 |
|
|
— |
|
|
— |
|
Other income, net |
|
|
369 |
|
|
629 |
|
|
893 |
|
Loss before tax expense |
|
|
(35,978) |
|
|
(314,472) |
|
|
(81,569) |
|
Tax benefit (expense) |
|
|
851 |
|
|
524 |
|
|
(324) |
|
Net loss from continuing operations |
|
|
(35,127) |
|
|
(313,948) |
|
|
(81,893) |
|
Net income from discontinued operations, net of tax |
|
|
— |
|
|
— |
|
|
21 |
|
Net loss |
|
|
(35,127) |
|
|
(313,948) |
|
|
(81,872) |
|
Less: net loss attributable to Predecessor |
|
|
— |
|
|
306,481 |
|
|
80,891 |
|
Less: net loss attributable to noncontrolling interests |
|
|
18,311 |
|
|
6,424 |
|
|
981 |
|
Net loss attributable to Select Energy Services, Inc. |
|
$ |
(16,816) |
|
$ |
(1,043) |
|
$ |
— |
|
Allocation of net loss attributable to: |
|
|
|
|
|
|
|
|
|
|
Class A stockholders |
|
$ |
(12,560) |
|
$ |
(199) |
|
|
|
|
Class A-1 stockholders |
|
|
(3,691) |
|
|
(844) |
|
|
|
|
Class A-2 stockholders |
|
|
(565) |
|
|
— |
|
|
|
|
Class B stockholders |
|
|
— |
|
|
— |
|
|
|
|
|
|
$ |
(16,816) |
|
$ |
(1,043) |
|
|
|
|
Weighted average shares outstanding: |
|
|
|
|
|
|
|
|
|
|
Class A—Basic & Diluted |
|
|
24,612,853 |
|
|
3,802,972 |
|
|
|
|
Class A-1—Basic & Diluted |
|
|
7,233,973 |
|
|
16,100,000 |
|
|
|
|
Class A-2—Basic & Diluted |
|
|
1,106,605 |
|
|
— |
|
|
|
|
Class B—Basic & Diluted |
|
|
38,768,156 |
|
|
38,462,541 |
|
|
|
|
|
|
|
|
|
|
|
|
|
|
|
Net loss per share attributable to common stockholders: |
|
|
|
|
|
|
|
|
|
|
Class A—Basic & Diluted |
|
$ |
(0.51) |
|
$ |
(0.05) |
|
|
|
|
Class A-1—Basic & Diluted |
|
$ |
(0.51) |
|
$ |
(0.05) |
|
|
|
|
Class A-2—Basic & Diluted |
|
$ |
(0.51) |
|
$ |
— |
|
|
|
|
Class B—Basic & Diluted |
|
$ |
— |
|
$ |
— |
|
|
|
|
|
|
|
|
|
|
|
|
|
|
|
Statement of Cash Flow Data: |
|
|
|
|
|
|
|
|
|
|
Net cash provided by (used in): |
|
|
|
|
|
|
|
|
|
|
Operating activities |
|
$ |
(2,899) |
|
$ |
5,131 |
|
$ |
151,999 |
|
Investing activities |
|
|
(156,731) |
|
|
(26,955) |
|
|
(38,703) |
|
Financing activities |
|
|
122,397 |
|
|
45,560 |
|
|
(107,348) |
|
Balance Sheet Data (at period end): |
|
|
|
|
|
|
|
|
|
|
Cash and cash equivalents |
|
$ |
2,774 |
|
$ |
40,041 |
|
$ |
16,305 |
|
Total assets |
|
|
1,356,368 |
|
|
405,066 |
|
|
650,248 |
|
Long-term liabilities |
|
|
107,806 |
|
|
23,974 |
|
|
256,923 |
|
Other Financial Data: |
|
|
|
|
|
|
|
|
|
|
|
|
(unaudited) |
|||||||
|
EBITDA(1) |
|
$ |
74,100 |
|
$ |
(201,237) |
|
$ |
39,853 |
|
Adjusted EBITDA(1) |
|
|
117,262 |
|
|
16,944 |
|
|
65,539 |
57
(1)We define EBITDA as net income/(loss), plus interest expense, taxes, and depreciation and amortization. We define Adjusted EBITDA as EBITDA plus/(minus) loss/(income) from discontinued operations, plus any impairment charges or asset write‑offs pursuant to accounting principles generally accepted in the United States (“GAAP”), plus/(minus) non‑cash losses/(gains) on the sale of assets or subsidiaries, non‑recurring compensation expense, non‑cash compensation expense, and non‑recurring or unusual expenses or charges, including severance expenses, transaction costs, or facilities‑related exit and disposal‑related expenditures, plus/(minus) foreign currency losses/(gains) and plus any inventory write-down. Our board of directors, management and investors use EBITDA and Adjusted EBITDA to assess our financial performance because it allows them to compare our operating performance on a consistent basis across periods by removing the effects of our capital structure (such as varying levels of interest expense), asset base (such as depreciation and amortization) and non‑recurring items outside the control of our management team. We present EBITDA and Adjusted EBITDA because we believe they provide useful information regarding the factors and trends affecting our business in addition to measures calculated under GAAP.
EBITDA and Adjusted EBITDA each have limitations as an analytical tool and should not be considered as alternatives to net income, operating income, cash flow from operating activities or any other measure of financial performance presented in accordance with GAAP. Other companies in our industry may calculate EBITDA or Adjusted EBITDA differently, limiting its usefulness as a comparative measure.
The following table shows a reconciliation of (i) EBITDA and Adjusted EBITDA, as applicable, to the most directly comparable GAAP measure, net loss.
|
|
|
Year Ended December 31, |
|||||||
|
|
|
2017 |
|
2016 |
|
2015 |
|||
|
|
|
(in thousands) |
|||||||
|
Net loss |
|
$ |
(35,127) |
|
$ |
(313,948) |
|
$ |
(81,872) |
|
Interest expense |
|
|
6,629 |
|
|
16,128 |
|
|
13,689 |
|
Tax (benefit) expense |
|
|
(851) |
|
|
(524) |
|
|
324 |
|
Depreciation and amortization |
|
|
103,449 |
|
|
97,107 |
|
|
107,712 |
|
EBITDA |
|
|
74,100 |
|
|
(201,237) |
|
|
39,853 |
|
Net income from discontinued operations |
|
|
— |
|
|
— |
|
|
(21) |
|
Impairment |
|
|
— |
|
|
198,692 |
|
|
21,366 |
|
Lease abandonment costs |
|
|
3,572 |
|
|
19,423 |
|
|
— |
|
Non-recurring severance expenses (1) |
|
|
4,161 |
|
|
886 |
|
|
3,200 |
|
Non-recurring transaction costs (2) |
|
|
10,179 |
|
|
(236) |
|
|
2,790 |
|
Non-cash compensation expenses |
|
|
7,691 |
|
|
(487) |
|
|
(889) |
|
Non-cash (gain) loss on sale of subsidiaries and other assets |
|
|
1,740 |
|
|
(97) |
|
|
(760) |
|
Non-recurring phantom equity and IPO-related compensation |
|
|
12,537 |
|
|
— |
|
|
— |
|
Foreign currency gains |
|
|
(281) |
|
|
— |
|
|
— |
|
Other non-recurring charges |
|
|
3,563 |
|
|
— |
|
|
— |
|
Adjusted EBITDA |
|
$ |
117,262 |
|
$ |
16,944 |
|
$ |
65,539 |
|
(1) |
For 2017, these costs are associated with severance incurred in connection with the Rockwater Merger. For 2016 and 2015, these costs are associated with the reduction in headcount as a result of the industry downturn. |
|
(2) |
For 2017, these costs are primarily associated with the Rockwater Merger and GRR Acquisition. For 2016 and 2015, these transaction costs are associated with our evaluation and negotiation of various transactions that never materialized. |
58
ITEM 7. MANAGEMENT’S DISCUSSION AND ANALYSIS OF FINANCIAL CONDITION AND RESULTS OF OPERATIONS
The following discussion and analysis of our financial condition and results of operations should be read in conjunction with our consolidated financial statements and related notes thereto in “Item 8. Financial Statements and Supplementary Data”. This discussion and analysis contains forward-looking statements based upon our current expectations that involve risks and uncertainties. Our actual results may differ materially from those anticipated in these forward-looking statements as a result of various factors as described under “Cautionary Note Regarding Forward-Looking Statements” and “Item 1A. Risk Factors.” We assume no obligation to update any of these forward‑looking statements.
Overview
We are a leading provider of total water management and chemical solutions to the unconventional oil and gas industry in the United States and Western Canada. Within the major shale plays in the United States, we believe we are a market leader in sourcing, transfer (both by permanent pipeline and temporary hose) and temporary containment of water prior to its use in drilling and completion activities associated with hydraulic fracturing or “fracking,” which we collectively refer to as “pre‑frac water services,” as well as testing and flowback services immediately following the well completion. In most of our areas of operations, we also provide additional complementary water‑related services that support oil and gas well completion and production activities including monitoring, treatment, hauling and water recycling and disposal. We also develop and manufacture a full suite of specialty chemicals used in well completions and production chemicals used to enhance performance over the life of a well. Our services are necessary to establish and maintain production of oil and gas over the productive life of a well. Water and related services are increasingly important as oil and gas E&P companies have increased the complexity and completion intensity of horizontal wells (including the use of longer horizontal wellbore laterals, tighter spacing of frac stages in the laterals and increased water, proppant and chemical use per foot of lateral) in order to improve production and recovery of hydrocarbons. We have historically generated a substantial majority of our revenues through providing total water solutions to our customers, and we believe we are the only company that provides total water solutions together with complementary chemical products and related expertise, which we believe gives us a unique competitive advantage in our industry.
Rockwater Merger
On November 1, 2017, we completed the Rockwater Merger in which we combined with Rockwater. Rockwater was a provider of comprehensive water management solutions to the oil and gas industry in the United States and Canada. Rockwater and its subsidiaries provided water sourcing, transfer, testing, monitoring, treatment and storage; site and pit surveys; flowback and well testing; water reuse services; water testing; and fluids logistics. Rockwater also developed and manufactured a full suite of specialty chemicals used in well completions, and production chemicals used to enhance performance over the life of a well. The total consideration for the Rockwater Merger was $620.2 million, in which we issued 25.9 million shares of our Class A common stock, 6.7 million shares of our Class A-2 common stock and 4.4 million shares of our Class B common to the former holders of Rockwater common stock and a unit-for-unit transaction in which SES Holdings issued approximately 37.3 million SES Holdings LLC Units to the former holders of units in Rockwater LLC.
Resource Water Acquisition
On September 15, 2017, we completed our acquisition of Resource Water. Resource Water provides water transfer services to E&P operators in West Texas and East Texas. Resource Water’s assets include 24 miles of layflat hose as well as numerous pumps and ancillary equipment required to support water transfer operations. Resource Water has longstanding customer relationships across its operating regions which are viewed as strategic to our water solutions business.
59
GRR Acquisition
On March 10, 2017, we completed our acquisition of the GRR Entities. The GRR Entities provide water and water‑related services to E&P companies in the Permian Basin and own and have rights to a vast array of fresh, brackish and effluent water sources with access to significant volumes of water annually and water transport infrastructure, including over 900 miles of temporary and permanent pipeline infrastructure and related storage facilities and pumps, all located in the northern Delaware Basin portion of the Permian Basin. The total consideration we paid for this acquisition was approximately $59.6 million, with $53.0 million paid in cash, $5.5 million paid in shares of Class A common stock, subject to customary post‑closing adjustments, and $1.1 million in assumed tax liabilities to the sellers. We funded the cash portion of the consideration for the GRR Acquisition with $19.0 million of cash on hand and $34.0 million of borrowings under our Previous Credit Facility, which we repaid with a portion of the net proceeds of the IPO. We believe this acquisition has significantly enhanced our position in the Permian Basin.
Going forward, we intend to pursue selected, accretive acquisitions of complementary assets, businesses and technologies, including water transfer infrastructure, and believe we are well positioned to capture attractive opportunities due to our market position, customer relationships and industry experience and expertise.
Our Segments
Following the completion of the Rockwater Merger, we offer our services through the following three operating segments: (i) Water Solutions, (ii) Oilfield Chemicals and (iii) Wellsite Services.
•Water Solutions. Our Water Solutions segment is operated primarily under our subsidiary, Select LLC, and provides water‑related services to customers that include major integrated oil companies and independent oil and natural gas producers. These services include: the sourcing of water; the transfer of the water to the wellsite through permanent pipeline infrastructure and temporary hose; the containment of fluids off‑ and on‑location; measuring and monitoring of water; the filtering and treatment of fluids, well testing and handling of flowback and produced formation water; and the transportation and recycling or disposal of drilling, completion and production fluids.
•Oilfield Chemicals. Our Oilfield Chemicals segment is operated primarily under our subsidiary, Rockwater LLC, and develops, manufactures and provides a full suite of chemicals utilized in hydraulic fracturing, stimulation, cementing and well completions, including polymers that create viscosity, crosslinkers, friction reducers, surfactants, buffers, breakers and other chemical technologies, to leading pressure pumping service companies in the United States. We also provide production chemicals solutions, which are applied to underperforming wells in order to enhance well performance and reduce production costs through the use of production treating chemicals, corrosion and scale monitoring, chemical inventory management, well failure analysis and lab services.
•Wellsite Services. Our Wellsite Services segment provides a number of services across the U.S. and Canada and is operated primarily under our subsidiaries Peak, Affirm and Rockwater LLC. Peak provides workforce accommodations and surface rental equipment supporting drilling, completion and production operations to the U.S. onshore oil and gas industry. Affirm provides oil and gas operators with a variety of services, including crane and logistics services, wellsite and pipeline construction and field services. Operating under Rockwater LLC, we also offer sand hauling and logistics services in the Rockies and Bakken regions as well as water transfer, containment, fluids hauling and other rental services in Western Canada.
How We Generate Revenue
We currently generate a significant majority of our revenue through our Water Solutions segment, specifically through total water management associated with hydraulic fracturing. We generate our revenue through customer agreements with fixed pricing terms but no guaranteed throughput amounts. While we have some long‑term pricing
60
arrangements, most of our water and water‑related services are priced based on prevailing market conditions, giving due consideration to the specific requirements of the customer.
We also generate revenue through our Oilfield Chemicals segment, which provides completion, specialty chemicals and production chemicals, and our Wellsite Services segment, which provides workforce accommodations and related rentals; a variety of wellsite completion and construction services, including wellsite construction, pipeline construction, field services and well services; sand hauling and fluids logistics services; and water transfer, fluids hauling, containment and rentals services in Canada. We invoice the majority of our Oilfield Chemicals customers for services provided under such segment based on the quantity of chemicals used or pursuant to short‑term contracts as the customer’s needs arise. We invoice the majority of our customers for services under our Wellsite Services segments on a per job basis or pursuant to short‑term contracts as the customer’s needs arise.
Costs of Conducting Our Business
The principal expenses involved in conducting our business are labor costs, equipment costs (including depreciation, repair and maintenance and leasing costs), raw materials and water sourcing costs and fuel costs. Our fixed costs are relatively low and a large portion of the costs we incur in our business are only incurred when we provide water, water‑related services, chemicals and chemical‑related services to our customers.
Labor costs associated with our employees represent the most significant costs of our business. We incurred labor costs of $259.6 million, $140.3 million and $235.8 million for the years ended December 31, 2017, 2016 and 2015, respectively. Our labor costs for the year ended December 31, 2017 included $12.5 million of non-recurring costs related to a payout on our phantom equity units and IPO success bonuses. The majority of our recurring labor costs are variable and are incurred only while we are providing water and water-related services. We also incur costs to employ personnel to sell and supervise our services and perform maintenance on our assets which are not directly tied to our level of business activity. We also incur selling, general and administrative costs for compensation of our administrative personnel at our field sites and in our corporate headquarters.
We incur significant equipment costs in connection with the operation of our business, including depreciation, repair and maintenance and leasing costs. We incurred equipment costs of $153.4 million, $111.8 million and $145.1 million for the years ended December 31, 2017, 2016 and 2015, respectively. Our depreciation costs are expected to increase over the next few years as a result of the Rockwater Merger.
We incur significant transportation cost associated with our service lines, including fuel and freight. We incurred fuel costs of $39.7 million, $17.3 million and $31.2 million for the years ended December 31, 2017, 2016 and 2015, respectively. Fuel prices impact our transportation costs, which affect the pricing and demand of our services, and have an impact on our results of operations.
We incur raw material costs in manufacturing our chemical products, as well as water sourcing costs in connection with obtaining strategic and reliable water sources to provide repeatable water volumes to our customers. We incurred raw material costs of $32.0 million from Rockwater’s operations from the date of the Rockwater Merger on November 1, 2017 to December 31, 2017. We incurred water sourcing costs of $45.3 million, $21.9 million and $27.6 million for the years ended December 31, 2017, 2016 and 2015, respectively.
Public Company Costs
General and administrative expenses related to being a publicly traded company include: Exchange Act reporting expenses; expenses associated with compliance with Sarbanes‑Oxley; expenses associated with maintaining our listing on the NYSE; incremental independent auditor fees; incremental legal fees; investor relations expenses; registrar and transfer agent fees; incremental director and officer liability insurance costs; and director compensation. We expect that general and administrative expenses related to being a publicly traded company will increase in future periods. Costs incurred by us for corporate and other overhead expenses will be reimbursed by SES Holdings pursuant to the SES Holdings LLC Agreement.
61
How We Evaluate Our Operations
We use a variety of operational and financial metrics to assess our performance. Among other measures, management considers each of the following:
•Revenue;
•Gross Profit;
•EBITDA; and
•Adjusted EBITDA.
Revenue
We analyze our revenue and assess our performance by comparing actual monthly revenue to our internal projections. We also assess incremental changes in revenue compared to incremental changes in direct operating costs, and selling, general and administrative expenses across our operating segments to identify potential areas for improvement, as well as to determine whether segments are meeting management’s expectations.
Gross Profit
To measure our financial performance, we analyze our gross profit, which we define as revenues less direct operating expenses (including depreciation and amortization expenses). We believe gross profit is a meaningful metric because it provides insight on profitability and true operating performance based on the historical cost basis of our assets. We also compare gross profit to prior periods and across segments to identify underperforming segments.
EBITDA and Adjusted EBITDA
We view EBITDA and Adjusted EBITDA as important indicators of performance. We define EBITDA as net income/(loss), plus interest expense, taxes, and depreciation and amortization. We define Adjusted EBITDA as EBITDA plus/(minus) loss/(income) from discontinued operations, plus any impairment charges or asset write‑offs pursuant to GAAP, plus/(minus) non‑cash losses/(gains) on the sale of assets or subsidiaries, non‑recurring compensation expense, non‑cash compensation expense, and non‑recurring or unusual expenses or charges, including severance expenses, transaction costs, or facilities‑related exit and disposal‑related expenditures, plus/(minus) foreign currency losses/(gains) and plus any inventory write-down. See “—Comparison of Non‑GAAP Financial Measures” for more information and a reconciliation of EBITDA and Adjusted EBITDA to net income (loss), the most directly comparable financial measure calculated and presented in accordance with GAAP.
Factors Affecting the Comparability of Our Results of Operations to Our Historical Results of Operations
Our future results of operations may not be comparable to our historical results of operations for the periods presented, primarily for the reasons described below.
Acquisition Activity
As described above, we are continuously evaluating potential investments, particularly in water transfer, infrastructure and other water‑related services. To the extent we consummate acquisitions, any incremental revenues or expenses from such transactions would not be included in our historical results of operations.
62
Rockwater Merger
On November 1, 2017, we completed the Rockwater Merger whereby we acquired the business, assets and operations of Rockwater. Our historical financial statements for periods prior to November 1, 2017 do not include the results of operations of Rockwater.
Resource Water Acquisition
On September 15, 2017, we completed our acquisition of Resource Water. Our historical financial statements for periods prior to September 15, 2017 do not include the results of operations of Resource Water.
GRR Acquisition
On March 10, 2017, we completed our acquisition of GRR Entities. Our historical financial statements for periods prior to March 10, 2017 do not include the results of operations of the GRR Entities.
Impact of Industry Conditions on Our Operating Results
Demand for oilfield services depends substantially on drilling, completion and production activity by E&P companies, which, in turn, depends largely upon the current and anticipated profitability of developing oil and natural gas reserves. Beginning in the second half of 2014, oil prices began a rapid and significant decline that continued through the first half of 2016. This decline led to a significant contraction on demand for oilfield services and significantly and negatively impacted our operating results. Beginning in the third quarter of 2016, oil prices began to recover, as did demand for our services. In the discussion of our operating results below, we reference the fluctuations in industry conditions in connection with certain changes in our results of operations.
63
Results of Operations
The following tables set forth our results of operations for the periods presented, including revenue by segment.
Year Ended December 31, 2017 Compared to the Year Ended December 31, 2016
|
|
|
Year ended December 31, |
|
Change |
|
|||||||
|
|
|
2017 |
|
2016 |
|
Dollars |
|
Percentage |
|
|||
|
|
|
|
(in thousands) |
|
|
|
|
|
|
|||
|
Revenue |
|
|
|
|
|
|
|
|
|
|
|
|
|
Water solutions |
|
$ |
528,309 |
|
$ |
241,455 |
|
$ |
286,854 |
|
118.8 |
% |
|
Oilfield chemicals |
|
|
41,586 |
|
|
— |
|
|
41,586 |
|
NM |
|
|
Wellsite services |
|
|
122,596 |
|
|
60,944 |
|
|
61,652 |
|
101.2 |
% |
|
Total revenue |
|
|
692,491 |
|
|
302,399 |
|
|
390,092 |
|
129.0 |
% |
|
|
|
|
|
|
|
|
|
|
|
|
|
|
|
Costs of revenue |
|
|
|
|
|
|
|
|
|
|
|
|
|
Water solutions |
|
|
395,887 |
|
|
200,399 |
|
|
195,488 |
|
97.5 |
% |
|
Oilfield chemicals |
|
|
37,024 |
|
|
— |
|
|
37,024 |
|
NM |
|
|
Wellsite services |
|
|
100,155 |
|
|
51,108 |
|
|
49,047 |
|
96.0 |
% |
|
Depreciation and amortization |
|
|
101,645 |
|
|
95,020 |
|
|
6,625 |
|
7.0 |
% |
|
Total costs of revenue |
|
|
634,711 |
|
|
346,527 |
|
|
288,184 |
|
83.2 |
% |
|
Gross profit (loss) |
|
|
57,780 |
|
|
(44,128) |
|
|
101,908 |
|
NM |
|
|
|
|
|
|
|
|
|
|
|
|
|
|
|
|
Operating expenses |
|
|
|
|
|
|
|
|
|
|
|
|
|
Selling, general and administrative |
|
|
82,403 |
|
|
34,643 |
|
|
47,760 |
|
137.9 |
% |
|
Depreciation and amortization |
|
|
1,804 |
|
|
2,087 |
|
|
(283) |
|
(13.6) |
% |
|
Impairment of goodwill and other intangible assets |
|
|
— |
|
|
138,666 |
|
|
(138,666) |
|
NM |
|
|
Impairment of property and equipment |
|
|
— |
|
|
60,026 |
|
|
(60,026) |
|
NM |
|
|
Lease abandonment costs |
|
|
3,572 |
|
|
19,423 |
|
|
(15,851) |
|
(81.6) |
% |
|
Total operating expenses |
|
|
87,779 |
|
|
254,845 |
|
|
(167,066) |
|
(65.6) |
% |
|
Loss from operations |
|
|
(29,999) |
|
|
(298,973) |
|
|
268,974 |
|
(90.0) |
% |
|
|
|
|
|
|
|
|
|
|
|
|
|
|
|
Other income (expense) |
|
|
|
|
|
|
|
|
|
|
|
|
|
Interest expense, net |
|
|
(6,629) |
|
|
(16,128) |
|
|
9,499 |
|
(58.9) |
% |
|
Foreign currency gains, net |
|
|
281 |
|
|
— |
|
|
281 |
|
NM |
|
|
Other income, net |
|
|
369 |
|
|
629 |
|
|
(260) |
|
(41.3) |
% |
|
Loss before tax expense |
|
|
(35,978) |
|
|
(314,472) |
|
|
278,494 |
|
(88.6) |
% |
|
Tax benefit |
|
|
851 |
|
|
524 |
|
|
327 |
|
62.4 |
% |
|
Net loss |
|
$ |
(35,127) |
|
$ |
(313,948) |
|
$ |
278,821 |
|
(88.8) |
% |
Revenue
Our revenue increased $390.1 million, or 129.0%, to $692.5 million for the year ended December 31, 2017 compared to $302.4 million for the year ended December 31, 2016. The increase was primarily attributable to an increase in our Water Solutions segment revenues of $286.8 million. The increase in revenue was primarily attributable to an increase in demand for our services as a result of a rise in completion activities, as well as the Rockwater Merger which contributed $128.9 million of total revenue from November 1, 2017 to December 31, 2017. For the year ended December 31, 2017, our Water Solutions, Oilfield Chemicals and Wellsite Services segments constituted 76.3%, 6.0% and 17.7% of our total revenue, respectively, compared to 79.8%, 0.0% and 20.2%, respectively, for the year ended December 31, 2016. The revenue increase by operating segment was as follows:
Water Solutions. Revenue increased $286.8 million, or 118.8%, to $528.3 million for the year ended December 31, 2017 compared to $241.5 million for the year ended December 31, 2016. The increase was primarily attributable to an increase in the demand for our services as a result of a rise in completion activities and an increase in
64
average annual rig count of 72.2%, as well as the Rockwater Merger during the year ended December 31, 2017 compared to year ended December 31, 2016. The Rockwater Merger contributed $69.6 million of revenue from November 1, 2017 to December 31, 2017. Additionally, the GRR Acquisition contributed $35.2 million of revenue for the year ended December 31, 2017.
Oilfield Chemicals. Revenue from our oilfield chemicals relates to the Rockwater Merger from November 1, 2017 to December 31, 2017.
Wellsite Services. Revenue increased $61.7 million, or 101.3%, to $122.6 million for the year ended December 31, 2017 compared to $60.9 million for the year ended December 31, 2016. The increase was primarily attributable to an increase in the demand for our services as a result of a rise in completion activities and an increase in average annual rig count of 72.2%, as well as the Rockwater Merger during the year ended December 31, 2017 compared to year ended December 31, 2016. The Rockwater Merger contributed $17.7 million of revenue from November 1, 2017 to December 31, 2017.
Costs of Revenue
Cost of revenue increased $288.2 million, or 83.2%, to $634.7 million for the year ended December 31, 2017 compared to $346.5 million for the year ended December 31, 2016. The increase was largely attributable to higher salaries and wages due to an increase in employee headcount, outside services, rentals and materials as a result of increased demand for our services due to the overall increase in drilling, completion and production activities, particularly in our Water Solutions segment. The cost of revenue increase by operating segment was as follows:
Water Solutions. Cost of revenue increased $195.5 million, or 97.6%, to $395.9 million for the year ended December 31, 2017 compared to $200.4 million for the year ended December 31, 2016. The results for the year ended December 31, 2017 includes $55.7 million of costs associated with Rockwater’s operations from the date of the Rockwater Merger on November 1, 2017 to December 31, 2017. Excluding Rockwater’s operations, the remaining increase was partly attributable to an increase in salaries and wages of $47.6 million as a result of a 53.7% increase in average headcount during the year ended December 31, 2017 as compared to the prior year period. The increase was also attributable to an increase in materials and supplies expense of $33.4 million, contract labor expense of $25.9 million, equipment rental and maintenance expense of $17.3 million and bulk and retail fuel expense of $11.4 million, offset by a decrease in allocated facility costs of $3.5 million.
Oilfield Chemicals. Cost of revenue from our oilfield chemicals relates to the Rockwater merger from November 1, 2017 to December 31, 2017. These cost primarily related to raw material costs incurred in manufacturing our chemical products.
Wellsite Services. Cost of revenue increased $49.1 million, or 96.1%, to $100.2 million for the year ended December 31, 2017 compared to $51.1 million for the year ended December 31, 2016. The results for the year ended December 31, 2017 include $15.3 million of costs associated with Rockwater’s operations from the date of the Rockwater Merger on November 1, 2017 to December 31, 2017. Excluding Rockwater’s operations, the remaining increase was partially attributable to an increase in salaries and wages of $10.6 million resulting from a 48.0% increase in average headcount during the year ended December 31, 2017 as compared to the prior year period. This increase in labor workforce also resulted in a $5.3 million increase of certain labor support costs including fuel and repair and maintenance expenses. The cost of revenue increase was also partly attributable to increases in outside services, equipment rentals and variable supplies expense totaling $17.0 million resulting from increased demand for services.
Depreciation and Amortization. Depreciation and amortization expense increased $6.6 million, or 6.9%, to $101.6 million for the year ended December 31, 2017 compared to $95.0 million for the year ended December 31, 2016. The increase was primarily attributable to $9.2 million of additional depreciation from assets acquired in the Rockwater Merger from November 1, 2017 to December 31, 2017, offset by decreases resulting from certain assets becoming fully depreciated or being impaired during 2016.
65
Gross Profit (Loss)
Gross profit (loss) improved by $101.9 million, to a gross profit of $57.8 million for the year ended December 31, 2017 compared to gross loss of $44.1 million for the year ended December 31, 2016 as a result of factors described above.
Selling, General and Administrative Expenses
Selling, general and administrative expenses increased $47.8 million, or 138.2%, to $82.4 million for the year ended December 31, 2017 compared to $34.6 million for the year ended December 31, 2016. The results for the year ended December 31, 2017 reflects Rockwater’s operations from November 1, 2017 to December 31, 2017. This overall increase was primarily due to a payout on our phantom equity units and IPO success bonuses of $12.5 million, a $10.5 million increase in legal and professional fees, primarily related to the Rockwater Merger, GRR Acquisition and other deal costs, a $7.4 million increase in equity-based compensation largely relating to the replacement of previous Rockwater equity-based awards, $4.4 million for administrative and labor costs associated with Rockwater during the period, and a $12.3 million increase in other administrative and labor costs, largely related to our new status as a public company during the year ended December 31, 2017 as compared to the prior year period.
Impairment
There were no impairment losses recorded during the year ended December 31, 2017. Due to significant reductions in oil and gas prices and rig counts during early 2016, we determined there were triggering events requiring an assessment of the recoverability of goodwill. This assessment resulted in our recognition of an impairment loss in 2016 of $137.5 million related to goodwill and $60.0 million related to long‑lived assets in our Water Solutions segment, $1.0 million related to goodwill and less than $0.1 million related to other intangible assets in our Wellsite Services.
Lease Abandonment Costs
Due to depressed industry conditions and a resulting reduction in the need for facilities, we decided to close certain facilities beginning in the third quarter of 2016. As a result of continuing costs related to certain facilities that are no longer in use, we recorded $3.6 million of lease abandonment costs during the year ended December 31, 2017. We recorded $19.4 million of lease abandonment costs during the year ended December 31, 2016.
Interest Expense
The decrease in interest expense of $9.5 million, or 58.9%, during the year ended December 31, 2017 compared to the year ended December 31, 2016 was due to the completion of the Select 144A Offering on December 20, 2016 and the completion of the IPO on April 26, 2017. We used a portion of the net proceeds from the Select 144A Offering to repay all outstanding borrowings and a portion of the net proceeds from the IPO to repay all of our subsequent outstanding indebtedness related to GRR Acquisition.
Net Loss
Net loss decreased by $278.8 million to $35.1 million for the year ended December 31, 2017 compared to $313.9 million for the year ended December 31, 2016 largely as a result of the factors described above.
66
Year Ended December 31, 2016 Compared to Year Ended December 31, 2015
|
|
|
Year ended December 31, |
|
Change |
|
|||||||
|
|
|
2016 |
|
|
2015 |
|
Dollars |
|
Percentage |
|
||
|
|
|
|
(in thousands) |
|
|
|
|
|
|
|||
|
Revenue |
|
|
|
|
|
|
|
|
|
|
|
|
|
Water solutions |
$ |
241,455 |
$ |
427,496 |
$ |
(186,041) | (43.5) |
% |
||||
|
Oilfield chemicals |
|
|
— |
|
|
— |
|
|
— |
|
NM |
|
|
Wellsite services |
|
|
60,944 |
|
|
108,081 |
|
|
(47,137) |
|
(43.6) |
% |
|
Total revenue |
302,399 |
535,577 |
(233,178) | (43.5) |
% |
|||||||
|
|
|
|
|
|
|
|
|
|
|
|
|
|
|
Costs of revenue |
|
|
|
|
|
|
|
|
|
|
|
|
|
Water solutions |
200,399 |
332,411 |
(132,012) |
(39.7) |
% |
|||||||
|
Oilfield chemicals |
|
|
— |
|
|
— |
|
|
— |
|
NM |
|
|
Wellsite services |
|
|
51,108 |
|
|
86,313 |
|
|
(35,205) |
|
(40.8) |
% |
|
Depreciation and amortization |
|
|
95,020 |
|
|
104,608 |
|
|
(9,588) |
|
(9.2) |
% |
|
Total costs of revenue |
|
|
346,527 |
|
|
523,332 |
|
|
(176,805) |
|
(33.8) |
% |
|
Gross profit (loss) |
|
|
(44,128) |
|
|
12,245 |
|
|
(56,373) |
|
NM |
|
|
|
|
|
|
|
|
|
|
|
|
|
|
|
|
Operating expenses |
|
|
|
|
|
|
|
|
|
|
|
|
|
Selling, general and administrative |
|
|
34,643 |
|
|
56,548 |
|
|
(21,905) |
|
(38.7) |
% |
|
Depreciation and amortization |
|
|
2,087 |
|
|
3,104 |
|
|
(1,017) |
|
(32.8) |
% |
|
Impairment of goodwill and other intangible assets |
|
|
138,666 |
|
|
21,366 |
|
|
117,300 |
|
549.0 |
% |
|
Impairment of property and equipment |
|
|
60,026 |
|
|
— |
|
|
60,026 |
|
NM |
|
|
Lease abandonment costs |
|
|
19,423 |
|
|
— |
|
|
19,423 |
|
NM |
|
|
Total operating expenses |
|
|
254,845 |
|
|
81,018 |
|
|
173,827 |
|
214.6 |
% |
|
Loss from operations |
|
|
(298,973) |
|
|
(68,773) |
|
|
(230,200) |
|
334.7 |
% |
|
|
|
|
|
|
|
|
|
|
|
|
|
|
|
Other income (expense) |
|
|
|
|
|
|
|
|
|
|
|
|
|
Interest expense, net |
|
|
(16,128) |
|
|
(13,689) |
|
|
(2,439) |
|
17.8 |
% |
|
Other income, net |
|
|
629 |
|
|
893 |
|
|
(264) |
|
(29.6) |
% |
|
Loss before tax expense |
|
|
(314,472) |
|
|
(81,569) |
|
|
(232,903) |
|
285.5 |
% |
|
Tax benefit (expense) |
|
|
524 |
|
|
(324) |
|
|
848 |
|
(261.7) |
% |
|
Net loss |
|
$ |
(313,948) |
|
$ |
(81,893) |
|
$ |
(232,055) |
|
283.4 |
% |
Revenue
Our revenue decreased $233.2 million, or 43.5%, to $302.4 million for the year ended December 31, 2016 compared to $535.6 million for the year ended December 31, 2015. The decrease was primarily attributable to a decrease in our Water Solutions segment revenues of $186.0 million. For the year ended December 31, 2016, our Water Solutions and Wellsite Services segments constituted 79.8% and 20.2% of our total revenue, respectively, compared to 79.8% and 20.2%, respectively, for the year ended December 31, 2015. The revenue decrease by operating segment was as follows:
Water Solutions. Revenue decreased $186.0 million, or 43.5%, to $241.5 million for the year ended December 31, 2016 compared to $427.5 million for the year ended December 31, 2015. The decrease was primarily attributable to a decline in completion activities and a decrease in average annual rig count of 48.0% during 2016 compared to 2015 due to a low commodity price environment. Of the total decrease in revenue, $84.6 million, or 19.8% was attributable to our top five customers from 2015 as rig counts for these customers decreased in excess of 52.0% over the period, leading to a decline in demand for water‑related services. The abandonment of eight yards resulted in a reduction in revenues of $32.5 million from the prior period and the consolidation of certain facilities with significant reductions in activity resulted in a decline in revenues of $46.1 million.
67
Wellsite Services. Revenue decreased $47.2 million, or 43.6%, to $60.9 million for the year ended December 31, 2016 compared to $108.1 million for the year ended December 31, 2015. The revenue decrease was primarily attributable to decreases in demand for equipment rentals due to a decline in average annual rig count of approximately 48.0%, as well as a decrease in our wellsite trailer rental day rate. During 2016, rates for wellsite trailer rental service, which include rentals of trailers, generators, light plants, and sewer services decreased approximately 37.0% compared to 2015. Due to activity declines, we also closed certain facilities, which further contributed to a decrease in revenue of $4.0 million during 2016.
Additionally, we also experienced decreases in the wellsite and pipeline construction and field services revenue streams of $8.4 million and $8.2 million, respectively, as drilling and production activity declined due to a low commodity price environment and decreasing rig counts. Additionally, within our crane and logistics services revenue stream, the heavy haul equipment rental service was closed during 2016, causing a decrease of $4.2 million in revenues.
Cost of Revenue
Cost of revenue decreased $176.8 million, or 33.8%, to $346.5 million for the year ended December 31, 2016 compared to $523.3 million for the year ended December 31, 2015. The decrease was largely attributable to lower salaries and wages due to a reduction in employee headcount as a result of the decline in demand for our services resulting from the overall reduction in drilling, completion and production activities, particularly in our Water Solutions segment. The cost of revenue decrease by operating segment was as follows:
Water Solutions. Cost of revenue decreased $132.0 million, or 39.7%, to $200.4 million for the year ended December 31, 2016 compared to $332.4 million for the year ended December 31, 2015. The decrease was primarily attributable to a decrease in salaries and wages of $54.8 million as a result of a reduction in headcount of approximately 19.0% during the year ended December 31, 2016 as compared to the prior year. The decrease was also attributable to a decrease in equipment rental and maintenance expense of $14.8 million, materials and supplies expense of $13.4 million, contract labor expense of $12.1 million, bulk and retail fuel expense of $9.2 million, and fresh water expense of $5.6 million. The reduction in fuel and maintenance‑related expenses were largely attributable to a reduction of 33.0% in the average number of trucks and tractors in our fleet.
Wellsite Services. Cost of revenue decreased $35.2 million, or 40.8%, to $51.1 million for the year ended December 31, 2016 compared to $86.3 million for the year ended December 31, 2015. The decrease was primarily attributable to a decrease in salaries and wages of $15.0 million resulting from a reduction in headcount of approximately 42.9% during the year ended December 31, 2016 as compared to the prior year. The remainder of the decrease was attributable to decreases in variable costs, including contract labor expense of $2.5 million, bulk and retail fuel expense of $3.9 million, insurance expense of $3.0 million, equipment rental and maintenance expense of $4.6 million, and materials expense of $1.7 million.
Depreciation and Amortization. Depreciation and amortization expense decreased $9.6 million, or 9.2%, to $95.0 million for the year ended December 31, 2016 compared to $104.6 million for the year ended December 31, 2015. The decrease was primarily attributable to assets becoming fully depreciated or being subject to impairment during 2016.
Gross Profit (Loss)
Gross profit decreased $56.3 million to a loss of $44.1 million for the year ended December 31, 2016 compared to profit of $12.2 million for the year ended December 31, 2015 as a result of factors described above.
Selling, General and Administrative Expenses
The decrease in selling, general, and administrative expenses of $21.9 million, or 38.7%, to $34.6 million for the year ended December 31, 2016 compared to $56.5 million for the year ended December 31, 2015 was primarily due to a decrease in salaries and wages due to a reduction in average headcount of 38.0% during the year ended December 31, 2016 as compared to the prior year period. The decrease was also attributable to partial or complete closings of certain regional offices during 2016.
68
Impairment
Due to significant reductions in oil and gas prices and rig counts, we recognized an impairment loss of $20.1 million related to goodwill and $1.3 million related to intangible assets in our Water Solutions segment in the consolidated statement of operations for the year ended December 31, 2015. Additionally, due to further declines in industry activity and in oil and gas prices during early 2016, we determined there were additional triggering events requiring an assessment of the recoverability of goodwill. This assessment resulted in an impairment loss of $137.5 million related to goodwill and $60.0 million related to long‑lived assets in our Water Solutions segment, $1.0 million related to goodwill and $0.1 million related to other intangible assets in our Wellsite Services segment was recognized in the consolidated statements of operations for the year ended December 31, 2016. Refer to “—Critical Accounting Policies and Estimates” for additional detail and discussion.
Lease Abandonment Costs
Due to depressed industry conditions and a resulting reduction in the need for facilities, during the year ended December 31, 2016, we recorded $19.4 million of lease abandonment costs related to certain facilities that were no longer in use. No lease abandonment costs were incurred during the year ended December 31, 2015.
Interest Expense
The increase in interest expense of $2.4 million, or 17.8%, during the year ended December 31, 2016 compared to the year ended December 31, 2015 was due to an increase in interest rates as a result of the amendment to our Previous Credit Facility in October 2015 as a result of the factors described above.
Net Loss
Net loss increased by $232.0 million to $313.9 million for the year ended December 31, 2016 compared to $81.9 million for the year ended December 31, 2015.
Comparison of Non‑GAAP Financial Measures
We view EBITDA and Adjusted EBITDA as important indicators of performance. We define EBITDA as net income (loss), plus interest expense, taxes, and depreciation and amortization. We define Adjusted EBITDA as EBITDA plus/(minus) loss/(income) from discontinued operations, plus any impairment charges or asset write‑offs pursuant to GAAP, plus/(minus) non‑cash losses/(gains) on the sale of assets or subsidiaries, non‑recurring compensation expense, non‑cash compensation expense, and non‑recurring or unusual expenses or charges, including severance expenses, transaction costs, or facilities‑related exit and disposal‑related expenditures, plus/(minus) foreign currency losses/(gains) and plus any inventory write-down.
Our board of directors, management and investors use EBITDA and Adjusted EBITDA to assess our financial performance because it allows them to compare our operating performance on a consistent basis across periods by removing the effects of our capital structure (such as varying levels of interest expense), asset base (such as depreciation and amortization) and items outside the control of our management team. We present EBITDA and Adjusted EBITDA because we believe they provide useful information regarding the factors and trends affecting our business in addition to measures calculated under GAAP.
Note Regarding Non‑GAAP Financial Measures
EBITDA and Adjusted EBITDA are not financial measures presented in accordance with GAAP. We believe that the presentation of these non‑GAAP financial measures will provide useful information to investors in assessing our financial performance and results of operations. Net income is the GAAP measure most directly comparable to EBITDA and Adjusted EBITDA. Our non‑GAAP financial measures should not be considered as alternatives to the most directly comparable GAAP financial measure. Each of these non‑GAAP financial measures has important limitations as an analytical tool due to exclusion of some but not all items that affect the most directly comparable GAAP financial
69
measures. You should not consider EBITDA or Adjusted EBITDA in isolation or as substitutes for an analysis of our results as reported under GAAP. Because EBITDA and Adjusted EBITDA may be defined differently by other companies in our industry, our definitions of these non‑GAAP financial measures may not be comparable to similarly titled measures of other companies, thereby diminishing their utility. For further discussion, please see “Item 6. Selected Financial Data.”
The following tables present a reconciliation of EBITDA and Adjusted EBITDA to our net loss, which is the most directly comparable GAAP measure for the periods presented:
|
|
|
Year Ended December 31, |
|||||||
|
|
|
2017 |
|
2016 |
|
2015 |
|||
|
|
|
(in thousands) |
|||||||
|
Net loss |
|
$ |
(35,127) |
|
$ |
(313,948) |
|
$ |
(81,872) |
|
Interest expense |
|
|
6,629 |
|
|
16,128 |
|
|
13,689 |
|
Tax (benefit) expense |
|
|
(851) |
|
|
(524) |
|
|
324 |
|
Depreciation and amortization |
|
|
103,449 |
|
|
97,107 |
|
|
107,712 |
|
EBITDA |
|
|
74,100 |
|
|
(201,237) |
|
|
39,853 |
|
Net income from discontinued operations |
|
|
— |
|
|
— |
|
|
(21) |
|
Impairment |
|
|
— |
|
|
198,692 |
|
|
21,366 |
|
Lease abandonment costs |
|
|
3,572 |
|
|
19,423 |
|
|
— |
|
Non-recurring severance expenses (1) |
|
|
4,161 |
|
|
886 |
|
|
3,200 |
|
Non-recurring transaction costs (2) |
|
|
10,179 |
|
|
(236) |
|
|
2,790 |
|
Non-cash compensation expenses |
|
|
7,691 |
|
|
(487) |
|
|
(889) |
|
Non-cash (gain) loss on sale of subsidiaries and other assets |
|
|
1,740 |
|
|
(97) |
|
|
(760) |
|
Non-recurring phantom equity and IPO-related compensation |
|
|
12,537 |
|
|
— |
|
|
— |
|
Foreign currency gains |
|
|
(281) |
|
|
— |
|
|
— |
|
Other non-recurring charges |
|
|
3,563 |
|
|
— |
|
|
— |
|
Adjusted EBITDA |
|
$ |
117,262 |
|
$ |
16,944 |
|
$ |
65,539 |
|
(1) |
For 2017, these costs are associated with severance incurred in connection with the Rockwater Merger. For 2016 and 2015, these costs are associated with the reduction in headcount as a result of the industry downturn. |
|
(2) |
For 2017, these costs are primarily associated with the Rockwater Merger and GRR Acquisition. For 2016 and 2015, these transaction costs are associated with our evaluation and negotiation of various transactions that never materialized. |
EBITDA was $74.1 million for the year ended December 31, 2017 compared to $(201.2) million for the year ended December 31, 2016. Adjusted EBITDA was $117.3 million for the year ended December 31, 2017 compared to $16.9 million for the year ended December 31, 2016. The increases in EBITDA and Adjusted EBITDA resulted from an increase in our revenues and gross profit, as discussed above.
EBITDA was $(201.2) million for the year ended December 31, 2016 compared to $39.9 million for the year ended December 31, 2015. Adjusted EBITDA was $16.9 million for the year ended December 31, 2016 compared to $65.5 million for the year ended December 31, 2015. The decrease in EBITDA resulted from decreases in revenue and gross profit, as well as impairment charges recorded during the year ended December 31, 2016 as discussed above. The decrease in Adjusted EBITDA resulted from decreases in revenue and gross profit, as discussed above.
Liquidity and Capital Resources
Overview
Our primary sources of liquidity to date have been capital contributions from our members, the net proceeds from the Select 144A Offering, the net proceeds from the IPO, borrowings under our Previous Credit Facility and cash flows from operations. Our primary uses of capital have been capital expenditures to support organic growth and fund
70
acquisitions. Depending upon market conditions and other factors, we may also issue debt and equity securities if needed.
We intend to finance most of our capital expenditures, contractual obligations and working capital needs with cash generated from operations and borrowings from our Credit Agreement. For a discussion of the Credit Agreement, see “—Credit Agreement” below. We believe that our operating cash flow and available borrowings under our Credit Agreement will be sufficient to fund our operations for at least the next twelve months.
On December 20, 2016, we completed the Select 144A Offering for net proceeds of $297.2 million. We contributed all of these net proceeds to SES Holdings in exchange for SES Holdings LLC Units. SES Holdings used the net proceeds to repay a portion of its outstanding indebtedness and for general corporate purposes.
On April 26, 2017, we completed the IPO for net proceeds of approximately $111.4 million, net of underwriting discounts and commissions and estimated offering expenses. We contributed all of these net proceeds to SES Holdings in exchange for SES Holdings LLC Units. SES Holdings used the net proceeds to repay borrowings incurred under our Previous Credit Facility to fund the cash portion of the purchase price of the GRR Acquisition, for the cash settlement of outstanding phantom unit awards at SES Holdings and for capital expenditures. On May 10, 2017, we received cash proceeds of approximately $17.1 million, net of underwriting discounts and commissions and estimated offering expenses, from the exercise in full by the underwriters of our IPO of their option to purchase additional shares of our Class A common stock. We used the net proceeds from the underwriters’ option exercise for general corporate purposes, including funding additional capital expenditures.
At December 31, 2017, cash and cash equivalents totaled $2.8 million. In addition to cash and cash equivalents, we had approximately $167.3 million of available borrowing capacity under our Credit Agreement as of December 31, 2017. As of March 15, 2018, the borrowing base under the Credit Agreement was $261.1 million, the outstanding borrowings totaled $75.0 million and the outstanding letters of credit totaled $19.8 million. At the same date, the available borrowing capacity under the Credit Agreement was $166.3 million.
Cash Flows
The following table summarizes our cash flows for the periods indicated:
Cash Flow Changes Between the Years Ended December 31, 2017 and 2016
|
|
|
Year ended December 31, |
|
Dollar Change |
|
Percentage Change |
||||||
|
|
|
2017 |
|
2016 |
|
|
|
|
|
|||
|
|
|
(in thousands) |
|
|
|
|
|
|
||||
|
Net cash (used in) provided by operating activities |
|
$ |
(2,899) |
|
$ |
5,131 |
|
$ |
(8,030) |
|
NM |
|
|
Net cash used in investing activities |
|
|
(156,731) |
|
|
(26,955) |
|
|
(129,776) |
|
481.5 |
% |
|
Net cash provided by financing activities |
|
|
122,397 |
|
|
45,560 |
|
|
76,837 |
|
168.7 |
% |
|
Subtotal |
|
$ |
(37,233) |
|
$ |
23,736 |
|
|
|
|
|
|
|
Effect of exchange rate changes on cash and cash equivalents |
|
|
(34) |
|
|
— |
|
|
(34) |
|
NM |
|
|
Net increase (decrease) in cash |
|
$ |
(37,267) |
|
$ |
23,736 |
|
|
|
|
|
|
Operating Activities. Net cash used in operating activities was $2.9 million for the year ended December 31, 2017, compared to net cash provided by operating activities of $5.1 million for the year ended December 31, 2016. The $8.0 million decrease in net cash provided by operating activities was primarily attributable to increases in accounts receivable and working capital during the year ended December 31, 2017 in response to growth in revenues driven by recovering demand for our services as compared to the prior year period.
Investing Activities. Net cash used in investing activities was $156.7 million for the year ended December 31, 2017, compared to $27.0 million for the year ended December 31, 2016. The $129.7 million increase in net cash used in investing activities was primarily due to net cash used for acquisitions of $65.5 million and by higher capital
71
expenditures during the year ended December 31, 2017 of $62.4 million as compared to the year ended December 31, 2016.
Financing Activities. Net cash provided by financing activities was $122.4 million for the year ended December 31, 2017, compared to cash provided by financing activities of $45.6 million for the year ended December 31, 2016. The $76.8 million increase in net cash provided by financing activities was primarily due to $128.5 million in net proceeds received from the issuance of shares in the IPO, including exercise of the over-allotment option.
Cash Flow Changes Between the Years Ended December 31, 2016 and 2015
|
|
|
December 31, |
|
Dollar Change |
|
Percentage Change |
||||||
|
|
|
2016 |
|
2015 |
|
|
|
|
|
|||
|
|
|
(in thousands) |
|
|
|
|
|
|
||||
|
Net cash provided by operating activities |
|
$ |
5,131 |
|
$ |
151,999 |
|
$ |
(146,868) |
|
(96.6) |
% |
|
Net cash used in investing activities |
|
|
(26,955) |
|
|
(38,703) |
|
|
11,748 |
|
(30.4) |
% |
|
Net cash (used in) provided by financing activities |
|
|
45,560 |
|
|
(107,348) |
|
|
152,908 |
|
NM |
|
|
Net increase in cash |
|
$ |
23,736 |
|
$ |
5,948 |
|
|
|
|
|
|
|
Effect of exchange rate changes on cash and cash equivalents |
|
|
— |
|
|
75 |
|
|
(75) |
|
NM |
|
|
Net increase in cash |
|
$ |
23,736 |
|
$ |
6,023 |
|
|
|
|
|
|
Operating Activities. Net cash provided by operating activities was $5.1 million for the year ended December 31, 2016, compared to $152.0 million for the year ended December 31, 2015. The $146.9 million decrease in cash from operating activities was primarily attributable to an increase in net loss adjusted for non‑cash intangible and fixed asset impairment charges and decreases in accounts receivable and accounts payable and accrued liabilities during the period. These changes are primarily the result of the low commodity prices and decreased demand for our services.
Investing Activities. Net cash used in investing activities was $27.0 million for the year ended December 31, 2016, compared to $38.7 million for the year ended December 31, 2015. The $11.7 million decrease in net cash used in investing activities was primarily due to increased cash proceeds from the sale of property and equipment during the year ended December 31, 2015. Overall cash outflow for purchases of property and equipment also decreased during the year ended December 31, 2016. During the year ended December 31, 2016, we incurred capital expenditures of approximately $16.2 million to terminate equipment leases and purchase vehicles formerly subject to such leases.
Financing Activities. Net cash provided by financing activities was $45.6 million for the year ended December 31, 2016, compared to cash used in financing activities of $107.4 million for the year ended December 31, 2015. The $153.0 million change in cash from financing activities was primarily due to net proceeds from the Select 144A Offering completed on December 20, 2016 of approximately $297.2 million and predecessor member contributions of approximately $23.5 million, offset by an increase in net repayments on long‑term debt of approximately $168.5 million during the year ended December 31, 2016.
Credit Agreement
Our previous credit facility (the “Previous Credit Facility”), originally executed in May 2011, was amended over time. Effective December 20, 2016, we amended the Previous Credit Facility to extend the maturity date from February 28, 2018 to February 28, 2020 and reduce the revolving line of credit to $100.0 million. On November 1, 2017, in connection with the closing of the Rockwater Merger (the “Closing”), SES Holdings and Select LLC (the “Borrower”), entered into a $300.0 million senior secured revolving credit facility (the “Credit Agreement”), by and among SES Holdings, as parent, Select LLC, as Borrower, and certain of SES Holdings’ subsidiaries, as guarantors, and each of the lenders party thereto and Wells Fargo Bank, N.A., as administrative agent, issuing lender and swingline lender (the “Administrative Agent”). The Credit Agreement also has a sublimit of $40.0 million for letters of credit and a sublimit of $30.0 million for swingline loans. Subject to obtaining commitments from existing or new lenders, we have the option to increase the maximum amount under the Credit Agreement by $150.0 million during the first three years
72
following the Closing. The maturity date of Credit Facility was also extended from February 28, 2020 to November 1, 2022.
In connection with our entry into the Credit Agreement, the obligations of SES Holdings and Select LLC under the Previous Credit Facility were repaid in full and the Previous Credit Facility was terminated.
The Credit Agreement permits extensions of credit up to the lesser of $300.0 million and a borrowing base that is determined by calculating the amount equal to the sum of (i) 85.0% of the Eligible Billed Receivables (as defined in the Credit Agreement), plus (ii) 75.0% of Eligible Unbilled Receivables (as defined in the Credit Agreement), provided that this amount will not equal more than 35.0% of the borrowing base, plus (iii) the lesser of (A) the product of 70.0% multiplied by the value of Eligible Inventory (as defined in the Credit Agreement) at such time and (B) the product of 85.0% multiplied by the Net Recovery Percentage (as defined in the Credit Agreement) identified in the most recent Acceptable Appraisal of Inventory (as defined in the Credit Agreement), multiplied by the value of Eligible Inventory at such time, provided that this amount will not equal more than 30.0% of the borrowing base, minus (iv) the aggregate amount of Reserves (as defined in the Credit Agreement), if any, established by the Administrative Agent from time to time, including, if any, the amount of the Dilution Reserve (as defined in the Credit Agreement). The borrowing base is calculated on a monthly basis pursuant to a borrowing base certificate delivered by the Borrower to the Administrative Agent.
Borrowings under the Credit Agreement bear interest, at Select LLC’s election, at either the (a) one‑, two‑, three‑ or six‑month LIBOR (“Eurocurrency Rate”) or (b) the greatest of (i) the federal funds rate plus 0.5%, (ii) the one‑month Eurocurrency Rate plus 1.0% and (iii) the Administrative Agent’s prime rate (the “Base Rate”), in each case plus an applicable margin, and interest shall be payable monthly in arrears. The applicable margin for Eurocurrency Rate loans ranges from 1.50% to 2.00% and the applicable margin for Base Rate loans ranges from 0.50% to 1.00%, in each case, depending on Select LLC’s average excess availability under the Credit Agreement. The applicable margin for Eurocurrency Rate loans will be 1.75% and the applicable margin for Base Rate loans will be 0.75% until June 30, 2018. During the continuance of a bankruptcy event of default, automatically and during the continuance of any other default, upon the Administrative Agent’s or the required lenders’ election, all outstanding amounts under the Credit Agreement will bear interest at 2.00% plus the otherwise applicable interest rate.
The obligations under the Credit Agreement are guaranteed by SES Holdings and certain of the subsidiaries of SES Holdings and Select LLC and secured by a security interest in substantially all of the personal property assets of SES Holdings, Select LLC and their domestic subsidiaries.
The Credit Agreement contains certain customary representations and warranties, affirmative and negative covenants and events of default. If an event of default occurs and is continuing, the lenders may declare all amounts outstanding under the Credit Agreement to be immediately due and payable.
In addition, the Credit Agreement restricts SES Holdings’ and Select LLC’s ability to make distributions on, or redeem or repurchase, its equity interests, except for certain distributions, including distributions of cash so long as, both at the time of the distribution and after giving effect to the distribution, no default exists under the Credit Agreement and either (a) excess availability at all times during the preceding 30 consecutive days, on a pro forma basis and after giving effect to such distribution, is not less than the greater of (1) 25.0% of the lesser of (A) the maximum revolver amount and (B) the then‑effective borrowing base and (2) $37.5 million or (b) if SES Holdings’ fixed charge coverage ratio is at least 1.0 to 1.0 on a pro forma basis, and excess availability at all times during the preceding 30 consecutive days, on a pro forma basis and after giving effect to such distribution, is not less than the greater of (1) 20.0% of the lesser of (A) the maximum revolver amount and (B) the then‑effective borrowing base and (2) $30.0 million. Additionally, the Credit Agreement generally permits Select LLC to make distributions required under its existing Tax Receivable Agreements.
The Credit Agreement also requires SES Holdings to maintain a fixed charge coverage ratio of at least 1.0 to 1.0 at any time availability under the Credit Agreement is less than the greater of (i) 10.0% of the lesser of (A) the maximum revolver amount and (B) the then‑effective borrowing base and (ii) $15.0 million and continuing through and including the first day after such time that availability under the Credit Agreement has equaled or exceeded the greater of
73
(i) 10.0% of the lesser of (A) the maximum revolver amount and (B) the then‑effective borrowing base and (ii) $15.0 million for 60 consecutive calendar days.
We were in compliance with all debt covenants as of December 31, 2017.
Off‑Balance Sheet Arrangements
At December 31, 2017, we had no material off balance sheet arrangements, except for operating leases. As such, we are not exposed to any material financing, liquidity, market or credit risk that could arise if we had engaged in such financing arrangements.
Contractual Obligations
The table below provides estimates of the timing of future payments that we are obligated to make based on agreements in place at December 31, 2017.
|
|
|
Payments Due by Period |
|||||||||||||
|
Contractual Obligations |
|
Year 1 |
|
Years 2-3 |
|
Years 4-5 |
|
More than 5 years |
|
Total |
|||||
|
|
|
(in thousands) |
|||||||||||||
|
Credit Agreement (1) |
|
$ |
— |
|
$ |
— |
|
$ |
75,000 |
|
$ |
— |
|
$ |
75,000 |
|
Estimated interest payments |
|
|
4,442 |
|
|
8,884 |
|
|
8,142 |
|
|
— |
|
|
21,468 |
|
Operating lease obligations |
|
|
24,527 |
|
|
22,069 |
|
|
15,764 |
|
|
30,824 |
|
|
93,184 |
|
Capital lease obligations |
|
|
2,088 |
|
|
1,165 |
|
|
89 |
|
|
— |
|
|
3,342 |
|
Total |
|
$ |
31,057 |
|
$ |
32,118 |
|
$ |
98,995 |
|
$ |
30,824 |
|
$ |
192,994 |
(1)As of March 15, 2018, the borrowing base under the Credit Agreement was $261.1 million, the outstanding borrowings totaled $75.0 million and the outstanding letters of credit totaled $19.8 million. The Credit Agreement matures on November 1, 2022. For a description of our Credit Agreement, please read “Management’s Discussion and Analysis of Financial Condition and Results of Operations—Liquidity and Capital Resources.”
Tax Receivable Agreements
We intend to fund any obligation under the Tax Receivable Agreements with cash from operations or borrowings under our Credit Agreement. With respect to obligations under each of our Tax Receivable Agreements (except in cases where we elect to terminate the Tax Receivable Agreements early, the Tax Receivable Agreements are terminated early due to certain mergers or other changes of control or we have available cash but fail to make payments when due), generally we may elect to defer payments due under the Tax Receivable Agreements if we do not have available cash to satisfy our payment obligations under the Tax Receivable Agreements or if our contractual obligations limit our ability to make these payments. Any such deferred payments under the Tax Receivable Agreements generally will accrue interest. On July 18, 2017, our board of directors approved amendments to each of the Tax Receivable Agreements, which amendments revised the definition of “change of control” for purposes of the Tax Receivable Agreements and acknowledged that the Rockwater Merger would not result in a change of control.
We intend to account for any amounts payable under the Tax Receivable Agreements in accordance with Accounting Standards Codification (“ASC”) Topic 450, Contingent Consideration. For further discussion regarding such an acceleration and its potential impact, please read “Item 1A. Risk Factors—Risks Related to Our Organizational Structure—In certain cases, payments under the Tax Receivable Agreements may be accelerated and/or significantly exceed the actual benefits, if any, we realize in respect of the tax attributes subject to the Tax Receivable Agreements.”
We completed an initial assessment of the amount of any liability under the Tax Receivable Agreements required under the provisions of ASC 450 in connection with preparing the Selected Consolidated Financial Statements. We determined that there was no resulting liability related to the Tax Receivable Agreements arising from the corporate reorganization and related transactions completed in connection with the Select 144A Offering as the associated deferred tax assets are fully offset by a valuation allowance. The corporate reorganization represented a reorganization of entities under common control transaction that is recorded based on the historical carrying amounts of affected assets and
74
liabilities in accordance with ASC 805‑50, Business Combinations—Related Issues. Under that guidance, any difference between consideration paid (in this case, the liability under the Tax Receivable Agreements) and the carrying amount of the assets and liabilities received is recognized within equity.
The initial liability will be adjusted at each reporting date through charges or credits in the statement of operations. We concluded that accounting by analogy to the accounting treatment specified in ASC 740‑20‑45‑11(g) for subsequent changes in a valuation allowance established against deferred tax assets that arose due to a change in tax basis in connection with a transaction with stockholders, which is recorded in the statement of operations. We believe that analogy is appropriate given the direct relationship between the amount of any estimated tax savings to be realized and the recognition and measurement of the liability under the Tax Receivable Agreements.
Critical Accounting Policies and Estimates
The preparation of consolidated financial statements in conformity with GAAP requires management to make estimates and assumptions that affect the reported amounts of assets and liabilities and disclosures about any contingent assets and liabilities at the date of the financial statements and the reported amounts of revenues and expenses during the reporting period. Actual results could differ from those estimates. Our critical accounting policies are described below to provide a better understanding of how we develop our assumptions and judgments about future events and related estimations and how they can impact our financial statements. The following accounting policies involve critical accounting estimates because they are dependent on our judgment and assumptions about matters that are inherently uncertain.
We base our estimates on historical experience and on various other assumptions we believe to be reasonable according to the current facts and circumstances, the results of which form the basis for making judgments about the carrying values of assets and liabilities that are not readily apparent from other sources. Estimates and assumptions about future events and their effects are subject to uncertainty and, accordingly, these estimates may change as new events occur, as more experience is acquired, as additional information is obtained, and as the business environment in which we operate changes. We believe the current assumptions, judgments and estimates used to determine amounts reflected in our consolidated financial statements are appropriate, however, actual results may differ under different conditions. This discussion and analysis should be read in conjunction with our consolidated financial statements and related notes included in this Annual Report.
Emerging Growth Company Status: Under the JOBS Act, we are an “emerging growth company,” or an “EGC,” which allows us to have an extended transition period for complying with new or revised accounting standards pursuant to Section 107(b) of the JOBS Act. We intend to take advantage of all of the reduced reporting requirements and exemptions, including the longer phase‑in periods for the adoption of new or revised financial accounting standards under Section 107 of the JOBS Act until we are no longer an emerging growth company. Our election to use the phase‑in periods permitted by this election may make it difficult to compare our financial statements to those of non‑emerging growth companies and other emerging growth companies that have opted out of the longer phase‑in periods under Section 107 of the JOBS Act and who will comply with new or revised financial accounting standards. If we were to subsequently elect to immediately comply with these public company effective dates, such election would be irrevocable pursuant to Section 107 of the JOBS Act.
Goodwill and other intangible assets: The purchase price of acquired businesses is allocated to its identifiable assets and liabilities based upon estimated fair values as of the acquisition date. Goodwill and other intangible assets are initially recorded at their fair values. Goodwill represents the excess of the purchase price of acquisitions over the fair value of the net assets acquired in a business combination. Our goodwill at December 31, 2017 and 2016, totaled $273.4 million and $12.2 million, respectively. Goodwill and other intangible assets not subject to amortization are tested for impairment annually or more frequently if events or changes in circumstances indicate that the asset might be impaired. Intangible assets with finite useful lives are amortized either on a straight‑line basis over the asset’s estimated useful life or on a basis that reflects the pattern in which the economic benefits of the intangible assets are realized.
Impairment of goodwill, long‑lived assets and intangible assets: Long‑lived assets, such as property and equipment and finite‑lived intangible assets, are evaluated for impairment whenever events or changes in circumstances
75
indicate that their carrying value may not be recoverable. Recoverability is measured by a comparison of their carrying amount to the estimated undiscounted cash flows to be generated by those assets. If the undiscounted cash flows are less than the carrying amount, we record impairment losses for the excess of their carrying value over the estimated fair value. Fair value is determined, in part, by the estimated cash flows to be generated by those assets. Our cash flow estimates are based upon, among other things, historical results adjusted to reflect our best estimate of future market rates, utilization levels, and operating performance. Development of future cash flows also requires management to make assumptions and to apply judgment, including timing of future expected cash flows, using the appropriate discount rates, and determining salvage values. The estimate of fair value represents our best estimates of these factors based on current industry trends and reference to market transactions, and is subject to variability. Assets are generally grouped at the lowest level of identifiable cash flows. We operate within the oilfield service industry, and the cyclical nature of the oil and gas industry that we serve and our estimates of the period over which future cash flows will be generated, as well as the predictability of these cash flows, can have a significant impact on the estimated fair value of these assets and, in periods of prolonged down cycles, may result in impairment charges. Changes to our key assumptions related to future performance, market conditions and other economic factors could adversely affect our impairment valuation.
There were no impairment losses recorded during the year ended December 31, 2017. During 2015, due to certain economic factors surrounding the decreases in oil prices and rig count that ultimately led to a decline in the oilfield services industry we recorded an impairment loss of $1.3 million related to other intangible assets and is included in the consolidated statements of operations for the year ended December 31, 2015. This impairment related to certain customer relationships within our Water Solutions segment. During 2016, due to further declines in oil prices and the overall industry we recognized an impairment loss of $60.0 million related to long‑lived assets in our Water Solutions segment and $0.1 million related to other intangible assets in our Wellsite Services segment and are included in the consolidated statements of operations for the year ended December 31, 2016.
We conduct our annual goodwill impairment tests in the fourth quarter of each year, and whenever impairment indicators arise, by examining relevant events and circumstances which could have a negative impact on our goodwill such as macroeconomic conditions, industry and market conditions, cost factors that have a negative effect on earnings and cash flows, overall financial performance, acquisitions and divestitures and other relevant entity-specific events. If a qualitative assessment indicates that it is more likely than not that the fair value of a reporting unit is less than its carrying amount, then we would be required to perform a quantitative impairment test for goodwill using a two-step approach. In the first step, the fair value of each reporting unit is determined and compared to the reporting unit’s carrying value, including goodwill. To determine the fair value of the reporting unit, we use an income approach, which provides an estimated fair value based on the present value of expected future cash flows. We discount the resulting future cash flows using weighted average cost of capital calculations based on the capital structures of publicly traded peer companies. Our reporting units are based on our organizational and reporting structure.
If the fair value of a reporting unit is less than its carrying value, the second step of the goodwill impairment test is performed to measure the amount of impairment, if any. In the second step, the fair value of the reporting unit is allocated to the assets and liabilities of the reporting unit as if it had been acquired in a business combination and the purchase price was equivalent to the fair value of the reporting unit. The excess of the fair value of the reporting unit over the amounts assigned to its assets and liabilities is referred to as the implied fair value of goodwill. If the implied fair value of goodwill at the reporting unit level is less than its carrying value, an impairment loss is recorded to the extent that the implied fair value of goodwill at the reporting unit is less than its carrying value. Application of the goodwill impairment test requires judgment, including the identification of reporting units, allocation of assets (including goodwill) and liabilities to reporting units and determining the fair value. The determination of reporting unit fair value relies upon certain estimates and assumptions that are complex and are affected by numerous factors, including the general economic environment and levels of E&P activity of oil and gas companies, our financial performance and trends and our strategies and business plans, among others. Unanticipated changes, including immaterial revisions, to these assumptions could result in a provision for impairment in a future period. Given the nature of these evaluations and their application to specific assets and time frames, it is not possible to reasonably quantify the impact of changes in these assumptions.
Although we believe the historical assumptions and estimates we have made are reasonable and appropriate, different assumptions and estimates could materially impact our reported financial results. During 2015, due to certain
76
economic factors surrounding industry declines, we recognized a goodwill impairment loss of $20.1 million related to our Water Solutions segment and is included in the consolidated statements of operations for the year ended December 31, 2015. During 2016, due to further declines in oilfield services activity, we recognized goodwill impairment loss of $137.5 million related to our Water Solutions segment and $1.0 million related to our Wellsite Services segment and are included in the consolidated statements of operations for the year ended December 31, 2016.
Revenue recognition: We recognize revenue when it is realized or realizable and earned. Revenues are considered realized or realizable and earned when: (i) persuasive evidence of an arrangement exists, (ii) delivery has occurred or services have been rendered, (iii) the seller’s price to the buyer is fixed or determinable, and (iv) collectability is reasonably assured. Services are typically priced on a throughput, day‑rate, hourly‑rate, or per‑job basis depending on the type of services provided. Our services are generally governed by a service agreement or other persuasive evidence of an arrangement that includes fixed or determinable fees and do not generally include right of return provisions or other significant post‑delivery obligations. Collectability is reasonably assured based on the establishment of appropriate credit qualification prior to services being rendered. Revenue generated by each of our revenue streams is outlined as follows:
Water Solutions and Related Services— We provide water‑related services to customers, including the sourcing and transfer of water; the containment of fluids; measuring and monitoring of water; the filtering and treatment of fluids, well testing and handling, transportation, and recycling or disposal of fluids. Operating under Rockwater LLC, we also offer sand hauling and logistics services in the Rockies and Bakken regions as well as water transfer, containment, and fluids hauling in Western Canada. Revenue from water solutions is primarily based on a per‑barrel price or other throughput metric as specified in the contract. We recognize revenue from water solutions when services are performed.
Our agreements with our customers are often referred to as “price sheets” and sometimes provide pricing for multiple services. However, these agreements generally do not authorize the performance of specific services or provide for guaranteed throughput amounts. As customers are free to choose which services, if any, to use based on our price sheet, we price our separate services on the basis of their standalone selling prices. Customer agreements generally do not provide for performance‑, cancellation‑, termination‑, or refund‑type provisions. Services based on price sheets with customers are generally performed under separately‑issued “work orders” or “field tickets” as services are requested. Of our Water Solutions service lines, only sourcing and transfer of water are consistently provided as part of the same arrangement. In these instances, revenue for both sourcing and transfer are recognized concurrently when delivered.
Accommodations and Rentals—We provide workforce accommodations and surface rental equipment. Accommodation services include trailer housing and mobile home units for field personnel. Equipment rentals are related to the accommodations and include generators, sewer and water tanks, and communication systems. Revenue from accommodations and equipment rental is typically recognized on a day-rate basis.
Wellsite Completion and Construction Services—We provide crane and logistics services, wellsite and pipeline construction, and field services. Revenue for heavy-equipment rental is typically recognized on a day-rate basis. Construction or field personnel revenue is based on hourly rates or on a per-job basis as services are performed.
Oilfield Chemical Product Sales—We develop, manufacture and market a full suite of chemicals utilized in hydraulic fracturing, stimulation, cementing and well completions, including polymers that create viscosity, crosslinkers, friction reducers, surfactants, buffers, breakers and other chemical technologies, to leading pressure pumping service companies in the United States. We also provide production chemicals solutions, which are applied to underperforming wells in order to enhance well performance and reduce production costs through the use of production treating chemicals, corrosion and scale monitoring, chemical inventory management, well failure analysis and lab services.
77
Oilfield Chemicals products are generally sold under sales agreements based upon purchase orders or contracts with our customers that do not include right of return provisions or other significant post‑delivery obligations. Our products are produced in a standard manufacturing operation, even if produced to our customer’s specifications. The prices of products are fixed and determinable and are established in price lists or customer purchases orders. We recognize revenue from product sales when title passes to the customer, the customer assumes risks and rewards of ownership, collectability is reasonably assured, and delivery occurs as directed by our customer.
Self‑insurance: We self‑insure, through deductibles and retentions, up to certain levels for losses related to general liability, workers’ compensation and employer’s liability, and vehicle liability. Our exposure (i.e. the retention or deductible) per occurrence is $1.0 million for general liability, $1.0 million for workers’ compensation and employer’s liability, and $1.0 million for vehicle liability. Rockwater’s deductibles and retentions are $0.1 million for general liability, $0.8 million for workers’ compensation and $0.5 million for auto liability and all policies will be combined with the renewal of Select’s policies effective May 1, 2018. We also have an excess loss policy over these coverages with a limit of $100.0 million in the aggregate. Rockwater’s excess coverage has a limit of $50.0 million. Management regularly reviews its estimates of reported and unreported claims and provide for losses through reserves. We use actuarial estimates to record our liability for future periods. If the number of claims or the costs associated with those claims were to increase significantly over our estimates, additional charges to earnings could be necessary to cover required payments. As of December 31, 2017, we estimate the range of exposure to be from $14.0 million to $15.9 million and have recorded liabilities of $14.9 million which represents management’s best estimate of probable loss related to workers’ compensation and employer’s liability, and vehicle liability. Aditionally, we have recorded $1.1 million in general liabilities at December 31, 2017. Prior to June 1, 2016, we were self‑insured for group medical claims subject to a deductible of $0.3 million for large claims. As of June 1, 2016, we are fully‑insured for group medical.
In connection with the Rockwater Merger we maintain a separate group medical program for certain employees where medical claims are subject to a deductible of $0.3 million for large claims. We are currently in negotiations for a single benefit plan that will be effective June 2018, that will consider multiple options.
Equity‑based compensation: We account for equity-based awards by measuring the awards at the date of grant and recognizing the grant-date fair value as an expense using either straight-line or accelerated attribution, depending on the specific terms of the award agreements over the requisite service period, which is usually equivalent to the vesting period. We expense awards with graded-vesting service conditions on a straight-line basis. Prior to our IPO, we did not have a listed price with which to calculate fair value. Therefore, prior to our IPO, we historically and consistently calculated fair value using a market approach, taking into consideration peer group analysis of publicly traded companies.
Stock options have been granted with an exercise price equal to or greater than the fair market value of its underlying equity instrument as of the date of grant. Prior to our IPO, we historically valued our equity on a quarterly basis using a market approach that included a comparison to publicly traded peer companies using earnings multiples based on their market values and a discount for lack of marketability. We utilized the Black‑Scholes model to determine fair value, which incorporates assumptions to value stock‑based awards. The risk‑free interest rate was based on the U.S. Treasury yield curve in effect for the expected term of the option at the time of grant. Because there had been no market for our equity prior to our IPO, we considered the historic volatility of publicly traded peer companies when determining the volatility factor. The expected life of the options was based on a formula considering the vesting period and term of the options awarded. During the year ended December 31, 2017, we granted 455,126 stock options with a grant date fair value of $3.6 million. During the year ended December 31, 2016, we granted 204,245 stock options, on an adjusted basis, with a grant date fair value of $0.4 million. No stock options were granted during the year ended December 31, 2015.
Restricted stock awards are based on the fair value of the award on the grant date and are recognized based on the vesting requirements that have been satisfied during the period. The grant-date fair value of our restricted stock awards is determined using our stock price on the grant date. During the year ended December 31, 2017, we granted 41,117 in restricted stock awards with a grant date fair value of $19.91. No restricted stock awards were granted during the year ended December 31, 2016 and 2015.
78
Our phantom awards were cash‑settled awards that were contingent upon meeting certain equity returns and a liquidation event. As a result of the cash‑settlement feature of these awards, we considered these awards to be liability awards, which were measured at fair value at each reporting date and the pro rata vested portion of the award was recognized as a liability to the extent that the performance condition was deemed probable. Prior to May 5, 2017, we settled our outstanding phantom unit awards for an aggregate amount equal to $7.8 million as a result of the completion of our IPO, which constituted a liquidity event with respect to such phantom unit awards. Based on the fair market value of a share of our Class A common stock on the date of our IPO of $14.00, the cash payment with respect to each phantom unit was approximately $5.53 before employer taxes.
Under the Merger Agreement, all outstanding Rockwater equity-based awards were replaced by us and converted into our equivalent replacement awards. The portion of the replacement award that is attributable to pre-combination service by the employee is included in the measure of consideration transferred to acquire Rockwater. The remaining fair value of the replacement awards will be recognized as equity-based compensation expense over the remaining vesting period. Total equity-based compensation expense recognized related to Rockwater’s equity-based awards that were replaced by us and converted into our equivalent equity-based awards during the year ended December 31, 2017 was $5.2 million.
Recent Accounting Pronouncements
Recent accounting pronouncements: In May 2014, the Financial Accounting Standards Board (the “FASB”) issued an accounting standards update (“ASU”) on a comprehensive new revenue recognition standard that will supersede ASC 605, Revenue Recognition. ASU 2014-09, Revenue from Contracts with Customers, creates a framework under which an entity will allocate the transaction price to separate performance obligations and recognize revenue when each performance obligation is satisfied. Under the new standard, entities will be required to use judgment and make estimates, including identifying performance obligations in a contract, estimating the amount of variable consideration to include in the transaction price, allocating the transaction price to each separate performance obligation, and determining when an entity satisfies its performance obligations. The standard allows for either “full retrospective” adoption, meaning that the standard is applied to all of the periods presented with a cumulative catch‑up as of the earliest period presented, or “modified retrospective” adoption, meaning the standard is applied only to the most current period presented in the financial statements with a cumulative catch‑up as of the current period. In August 2015, the FASB decided to defer the original effective date by one year to be effective for annual reporting periods beginning after December 15, 2018, and interim reporting periods within annual reporting periods beginning after December 15, 2019 for emerging growth companies. In accordance with the JOBS Act we are afforded the extended transition period and are not required to adopt the ASU until January 1, 2019. We are currently evaluating whether the adoption of the ASU will have a material impact that on our consolidated financial statements and related disclosures, and internal controls over financial reporting and have not yet determined the method by which we will adopt the standard.
In July 2015, the FASB issued ASU No. 2015-11, Inventory (Topic 330): Simplifying the Measurement of Inventory, which provides that an entity that measures inventory by using first-in, first-out or average cost should measure inventory at the lower of cost and net realizable value, rather than at the lower of cost or market. Net realizable value is the estimated selling prices of such inventory in the ordinary course of business, less reasonably predictable costs of completion, disposal, and transportation. As an EGC utilizing the extended transition period for new accounting pronouncements, the requirements in this update are effective during annual periods beginning after December 15, 2016, and interim periods within fiscal years beginning after December 15, 2017. The amendments in this update should be applied prospectively with earlier application permitted as of the beginning of an interim or annual reporting period. We prospectively adopted this guidance during the year ended December 31, 2017. The adoption of this update did not have a material impact on our consolidated financial statements.
In November 2015, the FASB issued ASU 2015‑17, Balance Sheet Classification of Deferred Taxes, which amends existing guidance on income taxes to require the classification of all deferred tax assets and liabilities as noncurrent on the balance sheet. As an EGC utilizing the extended transition period for new accounting pronouncements, this pronouncement is effective for annual reporting periods beginning after December 15, 2017, and interim periods within annual periods beginning after December 15, 2018, and may be applied either prospectively or retrospectively. We adopted this guidance during the year ended December 31, 2017. As our deferred tax assets and
79
liabilities are all noncurrent, the adoption did not result in a change to our consolidated financial statements and related disclosures.
In February 2016, the FASB issued ASU 2016‑02, Leases, which introduces a lessee model that brings most leases on the balance sheet. The new standard also aligns many of the underlying principles of the new lessor model with those in the current accounting guidance as well as the FASB’s new revenue recognition standard. However, the ASU eliminates the use of bright‑line tests in determining lease classification as required in the current guidance. The ASU also requires additional qualitative disclosures along with specific quantitative disclosures to better enable users of financial statements to assess the amount, timing, and uncertainty of cash flows arising from leases. As an EGC utilizing the extended transition period for new accounting pronouncements, this pronouncement is effective for annual reporting periods beginning after December 15, 2019, and interim periods within fiscal years beginning after December 15, 2020, using a modified retrospective approach. Early adoption is permitted. We are currently evaluating the impact that the new accounting guidance will have on our consolidated financial statements and related disclosures.
In March 2016, the FASB issued ASU 2016-09, Improvements to Employee Share-Based Payment Accounting, which is intended to simplify several aspects of the accounting for share-based payment award transactions. As an EGC utilizing the extended transition period for new accounting pronouncements, this pronouncement is effective for annual reporting periods beginning after December 15, 2017, and interim periods within fiscal years beginning after December 15, 2018. Certain amendments in this update should be applied prospectively, while other amendments in the update should be applied retrospectively, with earlier adoption permitted in any interim or annual period. If we adopt the amendments in an interim period, any adjustments should be reflected as of the beginning of the fiscal year that includes the interim period. If we were to elect to early adopt, then we must adopt all the amendments in the same period. We are currently evaluating the impact that the new accounting guidance will have on our consolidated financial statements and related disclosures.
In August 2016, the FASB issued ASU 2016‑15, Classification of Certain Cash Receipts and Cash Payments, which addresses the classification and presentation of eight specific cash flow issues that currently result in diverse practices. The amendments provide guidance in the presentation and classification of certain cash receipts and cash payments in the statement of cash flows including debt prepayment or debt extinguishment costs, settlement of zero‑coupon debt instruments, contingent consideration payments made after a business combination, proceeds from the settlement of insurance claims, proceeds from the settlement of corporate‑owned life insurance policies, and distributions received from equity method investees. As an EGC utilizing the extended transition period for new accounting pronouncements, this pronouncement is effective for annual reporting periods beginning after December 15, 2018, and interim periods within fiscal years beginning after December 15, 2019. The amendments in this ASU should be applied using a retrospective approach. We are currently evaluating the impact that the new accounting guidance will have on our consolidated financial statements and related disclosures.
In January 2017, the FASB issued ASU 2017‑01, Clarifying the Definition of a Business, with the objective of adding guidance to assist entities with evaluating whether transactions should be accounted for as acquisitions (or disposals) of assets or businesses. As an EGC utilizing the extended transition period for new accounting pronouncements, this pronouncement is effective for annual reporting periods beginning after December 15, 2018, and interim periods within fiscal years beginning after December 15, 2019. The amendments in this ASU should be applied prospectively. We are currently evaluating the impact that the new accounting guidance will have on our consolidated financial statements and related disclosures.
In January 2017, the FASB issued ASU 2017‑04, Simplifying the Test for Goodwill Impairment. This pronouncement removes Step 2 of the goodwill impairment test, which requires a hypothetical purchase price allocation. A goodwill impairment will now be the amount by which a reporting unit’s carrying value exceeds its fair value, not to exceed the carrying amount of goodwill. As an EGC utilizing the extended transition period for new accounting pronouncements, this pronouncement is effective for annual reporting periods beginning after December 15, 2019, and interim periods within fiscal years beginning after December 15, 2019. The amendments in this ASU should be applied prospectively. We are currently evaluating the impact that the new accounting guidance will have on our consolidated financial statements and related disclosures.
80
In May 2017, the FASB issued ASU 2017‑09, Scope of Modification Accounting. This pronouncement provides guidance about which changes to the terms and conditions of a share‑based payment award require an entity to apply modification accounting in ASC 718. As an EGC utilizing the extended transition period for new accounting pronouncements, this pronouncement is effective for annual reporting periods beginning after December 15, 2017, and interim periods within fiscal years beginning after December 15, 2017. Early adoption is permitted, including adoption in any interim period. The pronouncement should be applied prospectively to an award modified on or after the adoption date. We are currently evaluating the impact that the new accounting guidance will have on our consolidated financial statements and related disclosures.
ITEM 7A. QUANTITATIVE AND QUALITATIVE DISCLOSURES ABOUT MARKET RISK
The demand, pricing and terms for oilfield services provided by us are largely dependent upon the level of activity for the U.S. oil and gas industry. Industry conditions are influenced by numerous factors over which we have no control, including, but not limited to: the supply of and demand for oil and gas; the level of prices, and expectations about future prices of oil and gas; the cost of exploring for, developing, producing and delivering oil and gas; the expected rates of declining current production; the discovery rates of new oil and gas reserves; available pipeline and other transportation capacity; weather conditions; domestic and worldwide economic conditions; political instability in oil‑producing countries; environmental regulations; technical advances affecting energy consumption; the price and availability of alternative fuels; the ability of oil and gas producers to raise equity capital and debt financing; and merger and divestiture activity among oil and gas producers.
The level of activity in the U.S. oil and gas industry is volatile. Expected trends in oil and gas production activities may not continue and demand for our services may not reflect the level of activity in the industry. Any prolonged substantial reduction in oil and gas prices would likely affect oil and gas production levels and therefore affect demand for our services. A material decline in oil and gas prices or U.S. activity levels could have a material adverse effect on our business, financial condition, results of operations and cash flows.
Interest Rate Risk
At December 31, 2017, we had approximately $75.0 million outstanding debt under our Credit Agreement. As of March 15, 2018, we had approximately $75.0 million of outstanding borrowings and approximately $166.3 million of available borrowing capacity under our Credit Agreement. Interest is calculated under the terms of our Credit Agreement based on our selection, from time to time, of one of the index rates available to us plus an applicable margin that varies based on certain factors. Assuming no change in the amount outstanding, the impact on interest expense of a 1% increase or decrease in the assumed weighted average interest rate would be approximately $0.8 million per year. We do not currently have or intend to enter into any derivative arrangements to protect against fluctuations in interest rates applicable to our outstanding indebtedness.
Foreign Currency Exchange Risk
We are exposed to fluctuations between the U.S. dollar and the Canadian dollar with regard to the activities of our Canadian subsidiary, acquired in the Rockwater Merger, which has designated the Canadian dollar as its functional currency. As such, future earnings are subject to change due to fluctuations in foreign currency exchange rates when transactions are denominated in currencies other than our functional currencies. We do not currently have or intend to enter into any derivative arrangements to protect against fluctuations in exchange rates applicable to the Canadian dollar.
81
ITEM 8. FINANCIAL STATEMENTS AND SUPPLEMENTARY DATA
The report of our independent registered public accounting firm and our consolidated financial statements and supplementary data are included in this Annual Report beginning on page F-1.
ITEM 9. CHANGES IN AND DISAGREEMENTS WITH ACCOUNTANTS ON ACCOUNTING AND FINANCIAL DISCLOSURE
None.
ITEM 9A. CONTROLS AND PROCEDURES
Disclosure Controls and Procedures
As required by Rule 13a-15(b) under the Exchange Act, we have evaluated, under the supervision and with the participation of management, including our principal executive officer and principal financial officer, the effectiveness of the design and operation of our disclosure controls and procedures (as defined in Rules 13a-15(e) and 15d-15(e) under the Exchange Act) as of the end of the period covered by this Annual Report on Form 10-K. Our disclosure controls and procedures are designed to provide reasonable assurance that the information required to be disclosed by us in reports that we file or submit under the Exchange Act is accumulated and communicated to management, including our principal executive officer and principal financial officer, as appropriate, to allow timely decisions regarding required disclosure and is recorded, processed, summarized and reported within the time periods specified in the rules and forms of the SEC. Based upon that evaluation, our principal executive officer and principal financial officer concluded that our disclosure controls and procedures were effective as of December 31, 2017.
Management’s Annual Report on Internal Control over Financial Reporting
This Annual Report does not include a report of management's assessment regarding internal control over financial reporting due to a transition period established by rules of the Securities and Exchange Commission (“SEC”) for newly public companies. As a public company, we are required to comply with the SEC’s rules implementing Section 302 of Sarbanes-Oxley Act, which require our management to certify financial and other information in our quarterly and annual reports and provide an annual management report on the effectiveness of our internal control over financial reporting. We will not be required to make our first assessment of our internal control over financial reporting under section 404 until our annual report for the fiscal year ending December 31, 2018.
Attestation Report of the Independent Registered Public Accounting Firm
This Annual Report does not include an attestation report of the company's registered public accounting firm due to a transition period established by rules of the SEC for newly public companies.
Changes in Internal Control over Financial Reporting
There were no changes in our internal control over financial reporting during our last quarter of 2017, that materially affected, or are reasonably likely to materially affect, our internal control over financial reporting.
None.
82
ITEM 10.DIRECTORS, EXECUTIVE OFFICERS AND CORPORATE GOVERNANCE
The information required in response to this Item 10 will be set forth in our definitive proxy statement for the 2018 annual meeting of stockholders and is incorporated herein by reference.
ITEM 11.EXECUTIVE COMPENSATION
The information required in response to this Item 11 will be set forth in our definitive proxy statement for the 2018 annual meeting of stockholders and is incorporated herein by reference.
ITEM 12.SECURITY OWNERSHIP OF CERTAIN BENEFICIAL OWNERS AND MANAGEMENT AND RELATED STOCKHOLDER MATTERS
The information required in response to this Item 12 will be set forth in our definitive proxy statement for the 2018 annual meeting of stockholders and is incorporated herein by reference.
ITEM 13.CERTAIN RELATIONSHIPS AND RELATED TRANSACTIONS, AND DIRECTOR INDEPENDENCE
The information required in response to this Item 13 will be set forth in our definitive proxy statement for the 2018 annual meeting of stockholders and is incorporated herein by reference.
ITEM 14.PRINCIPAL ACCOUNTING FEES AND SERVICES
The information required in response to this Item 14 will be set forth in our definitive proxy statement for the 2018 annual meeting of stockholders and is incorporated herein by reference.
ITEM 15.EXHIBITS AND FINANCIAL STATEMENT SCHEDULES
(a)(1) and (a)(2) Financial Statements and Financial Statement Schedules
Our consolidated financial statements are incorporated under Item 8 of this Annual Report. For a listing of these statements and accompanying notes, see “Index to Financial Statements” on Page F-1 of this Annual Report.
(a)(3) Exhibits
The exhibits required to be filed under Item 15 of this Annual Report are set forth below in the Exhibit Index included within this Annual Report.
83
EXHIBIT INDEX
|
|
|
|
|
Exhibit Number |
|
Description |
|
|
|
|
|
2.1 |
|
|
|
|
|
|
|
3.1 |
|
|
|
|
|
|
|
3.2 |
|
|
|
|
|
|
|
4.1 |
|
|
|
|
|
|
|
4.2 |
|
|
|
|
|
|
|
4.3 |
|
|
|
|
|
|
|
4.4 |
|
|
|
|
|
|
|
4.5 |
|
|
|
|
|
|
|
10.1 |
|
|
|
|
|
|
84
|
†10.2 |
|
|
|
|
|
|
|
†10.3 |
|
|
|
|
|
|
|
†10.4 |
|
|
|
|
|
|
|
10.5 |
|
|
|
|
|
|
|
10.6 |
|
|
|
|
|
|
|
10.7 |
|
|
|
|
|
|
|
10.8 |
|
|
|
|
|
|
|
10.9 |
|
|
|
|
|
|
|
10.10 |
|
|
|
|
|
|
|
10.11 |
|
|
|
|
|
|
|
10.12 |
|
|
|
|
|
|
|
10.13 |
|
|
|
|
|
|
|
10.14 |
|
85
|
|
|
|
|
*10.15 |
|
|
|
|
|
|
|
†10.16 |
|
|
|
|
|
|
|
†10.17 |
|
|
|
|
|
|
|
*†10.18 |
|
|
|
|
|
|
|
*†10.19 |
|
|
|
|
|
|
|
*†10.20 |
|
|
|
|
|
|
|
†10.21 |
|
|
|
|
|
|
|
†10.22 |
|
|
|
|
|
|
|
*†10.23 |
|
|
|
|
|
|
|
*†10.24 |
|
|
|
|
|
|
|
*†10.25 |
|
|
|
|
|
|
|
*†10.26 |
|
|
|
|
|
|
|
*21.1 |
|
|
|
|
|
|
|
*23.1 |
|
|
|
|
|
|
|
*23.2 |
|
|
|
|
|
|
|
*31.1 |
|
Certification of the Chief Executive Officer Pursuant to Rule 13a‑14(a)/15d‑14(a). |
|
|
|
|
|
*31.2 |
|
Certification of the Chief Financial Officer Pursuant to Rule 13a‑14(a)/15d‑14(a). |
|
|
|
|
|
*32.1 |
|
|
|
|
|
|
|
*32.2 |
|
86
|
|
|
|
|
*101 |
|
Interactive Data Files |
|
*101.INS |
|
XBRL Instance Document. |
|
*101.SCH |
|
XBRL Taxonomy Extension Schema Document. |
|
*101.CAL |
|
XBRL Taxonomy Extension Calculation Linkbase Document. |
|
*101.DEF |
|
XBRL Taxonomy Extension Definition Linkbase Document. |
|
*101.LAB |
|
XBRL Taxonomy Extension Label Linkbase Document. |
|
*101.PRE |
|
XBRL Taxonomy Extension Presentation Linkbase Document. |
|
|
|
|
*Filed or furnished with this Annual Report on Form 10-K.
†Management contract or compensatory plan or arrangement.
87
SIGNATURES
Pursuant to the requirements of Section 13 or 15(d) of the Securities Exchange Act of 1934, the Company has duly caused this report to be signed on its behalf by the undersigned, thereunto duly authorized.
|
|
Select Energy Services, Inc. |
|
|
|
|
Dated: March 19, 2018 |
/s/ HOLLI C. LADHANI |
|
|
Holli C. Ladhani |
|
|
President, Chief Executive Officer and Director |
|
|
|
Pursuant to the requirements of the Securities Exchange Act of 1934, this report has been signed below by the following persons on behalf of the Company and in the capacities indicated on March 19, 2018.
|
/s/ HOLLI C. LADHANI |
|
President, Chief Executive Officer and Director |
|
Holli C. Ladhani |
|
(Principal Executive Officer) |
|
|
|
|
|
/s/ GARY M. GILLETTE |
|
Chief Financial Officer and Senior Vice President |
|
Gary M. Gillette |
|
(Principal Financial Officer and Principal Accounting Officer) |
|
|
|
|
|
/s/ JOHN D. SCHMITZ |
|
Executive Chairman |
|
John D. Schmitz |
|
|
|
|
|
|
|
/s/ ROBERT V. DELANEY |
|
Director |
|
Robert V. Delaney |
|
|
|
|
|
|
|
/s/ ADAM J. KLEIN |
|
Director |
|
Adam J. Klein |
|
|
|
|
|
|
|
/s/ DAVID C. BALDWIN |
|
Director |
|
David C. Baldwin |
|
|
|
|
|
|
|
/s/ DOUGLAS J. WALL |
|
Director |
|
Douglas J. Wall |
|
|
|
|
|
|
|
/s/ RICHARD A. BURNETT |
|
Director |
|
Richard A. Burnett |
|
|
|
|
|
|
|
/s/ KEITH O. RATTIE |
|
Director |
|
Keith O. Rattie |
|
|
|
|
|
|
|
/s/ DAVID A. TRICE |
|
Director |
|
David A. Trice |
|
|
|
|
|
|
|
|
|
|
|
|
|
|
|
|
|
|
|
|
|
|
|
|
|
|
|
|
|
|
88
INDEX TO FINANCIAL STATEMENTS
SELECT ENERGY SERVICES, INC.
|
|
|
|
|
|
|
|
|
Page(s) |
|
|
|
Select Energy Services, Inc . |
|
|
|
|
|
Annual Financial Statements |
|
|
|
|
|
|
|
F-2 |
|
|
|
|
|
F-3 |
|
|
|
Consolidated Balance Sheets as of December 31, 2017 and 2016 |
|
|
F-4 |
|
|
Consolidated Statements of Operations for the Years Ended December 31, 2017, 2016 and 2015 |
|
|
F-5 |
|
|
|
|
F-6 |
|
|
|
Consolidated Statements of Changes in Equity for the Years Ended December 31, 2017, 2016 and 2015 |
|
|
F-7 |
|
|
Consolidated Statements of Cash Flows for the Years Ended December 31, 2017, 2016 and 2015 |
|
|
F-8 |
|
|
|
|
F-9 |
|
|
F-1
Report of Independent Registered Public Accounting Firm
Board of Directors and Shareholders
Select Energy Services, Inc.
Opinion on the financial statements
We have audited the accompanying consolidated balance sheets of Select Energy Services, Inc. (a Delaware corporation) and subsidiaries (the “Company”) as of December 31, 2017 and 2016, and the related consolidated statements of comprehensive income (loss), changes in equity, and cash flows for the periods then ended, and the related notes (collectively referred to as the “financial statements”). In our opinion, the financial statements present fairly, in all material respects, the financial position of the Company as of December 31, 2017 and 2016, and the results of its operations and its cash flows for the periods then ended, in conformity with accounting principles generally accepted in the United States of America.
Basis for opinion
These financial statements are the responsibility of the Company’s management. Our responsibility is to express an opinion on the Company’s financial statements based on our audits. We are a public accounting firm registered with the Public Company Accounting Oversight Board (United States) (“PCAOB”) and are required to be independent with respect to the Company in accordance with the U.S. federal securities laws and the applicable rules and regulations of the Securities and Exchange Commission and the PCAOB.
We conducted our audits in accordance with the standards of the PCAOB. Those standards require that we plan and perform the audit to obtain reasonable assurance about whether the financial statements are free of material misstatement, whether due to error or fraud. The Company is not required to have, nor were we engaged to perform, an audit of its internal control over financial reporting. As part of our audits we are required to obtain an understanding of internal control over financial reporting but not for the purpose of expressing an opinion on the effectiveness of the Company’s internal control over financial reporting. Accordingly, we express no such opinion.
Our audits included performing procedures to assess the risks of material misstatement of the financial statements, whether due to error or fraud, and performing procedures that respond to those risks. Such procedures included examining, on a test basis, evidence supporting the amounts and disclosures in the financial statements. Our audits also included evaluating the accounting principles used and significant estimates made by management, as well as evaluating the overall presentation of the financial statements. We believe that our audits provide a reasonable basis for our opinion.
/s/ GRANT THORNTON LLP
We have served as the Company’s auditor since 2016.
Dallas, Texas
March 19, 2018
F-2
REPORT OF INDEPENDENT REGISTERED PUBLIC ACCOUNTING FIRM
Board of Directors and Shareholders
Select Energy Services, Inc.
We have audited the accompanying consolidated balance sheet of SES Holdings, LLC and subsidiaries (the "Company") as of December 31, 2015, and the related consolidated statements of operations, comprehensive income (loss), changes in members' capital, and cash flows for the year then ended. These financial statements are the responsibility of the Company's management. Our responsibility is to express an opinion on these financial statements based on our audit.
We conducted our audit in accordance with the standards of the Public Company Accounting Oversight Board (United States). Those standards require that we plan and perform the audit to obtain reasonable assurance about whether the financial statements are free of material misstatement. We were not engaged to perform an audit of the Company's internal control over financial reporting. Our audit included consideration of internal control over financial reporting as a basis for designing audit procedures that are appropriate in the circumstances, but not for the purpose of expressing an opinion on the effectiveness of the Company's internal control over financial reporting. Accordingly, we express no such opinion. An audit also includes examining, on a test basis, evidence supporting the amounts and disclosures in the financial statements, assessing the accounting principles used and significant estimates made by management, as well as evaluating the overall financial statement presentation. We believe that our audit provides a reasonable basis for our opinion.
In our opinion, the consolidated financial statements referred to above present fairly, in all material respects, the financial position of SES Holdings, LLC and subsidiaries as of December 31, 2015, and the results of its operations and cash flows for the year then ended in conformity with accounting principles generally accepted in the United States of America.
/s/ Pannell Kerr Forster of Texas, P.C.
Houston, Texas
November 22, 2016
F-3
SELECT ENERGY SERVICES, INC.
(in thousands, except share data)
|
|
|
As of December 31, |
||||
|
|
|
2017 |
|
2016 |
||
|
Assets |
|
|
|
|
|
|
|
Current assets |
|
|
|
|
|
|
|
Cash and cash equivalents |
|
$ |
2,774 |
|
$ |
40,041 |
|
Accounts receivable trade, net of allowance for doubtful accounts of $2,979 and $2,144, respectively |
|
|
373,633 |
|
|
75,892 |
|
Accounts receivable, related parties |
|
|
7,669 |
|
|
135 |
|
Inventories |
|
|
44,598 |
|
|
1,001 |
|
Prepaid expenses and other current assets |
|
|
17,842 |
|
|
7,586 |
|
Total current assets |
|
|
446,516 |
|
|
124,655 |
|
Property and equipment |
|
|
1,034,995 |
|
|
739,386 |
|
Accumulated depreciation |
|
|
(560,886) |
|
|
(490,519) |
|
Property and equipment, net |
|
|
474,109 |
|
|
248,867 |
|
Goodwill |
|
|
273,421 |
|
|
12,242 |
|
Other intangible assets, net |
|
|
156,066 |
|
|
11,586 |
|
Other assets |
|
|
6,256 |
|
|
7,716 |
|
Total assets |
|
$ |
1,356,368 |
|
$ |
405,066 |
|
Liabilities and Equity |
|
|
|
|
|
|
|
Current liabilities |
|
|
|
|
|
|
|
Accounts payable |
|
$ |
52,579 |
|
$ |
10,796 |
|
Accounts payable and accrued expenses, related parties |
|
|
2,772 |
|
|
648 |
|
Accrued salaries and benefits |
|
|
21,324 |
|
|
2,511 |
|
Accrued insurance |
|
|
12,510 |
|
|
10,338 |
|
Sales tax payable |
|
|
12,931 |
|
|
66 |
|
Accrued expenses and other current liabilities |
|
|
81,112 |
|
|
22,025 |
|
Current portion of capital lease obligations |
|
|
1,965 |
|
|
— |
|
Total current liabilities |
|
|
185,193 |
|
|
46,384 |
|
Accrued lease obligations |
|
|
18,979 |
|
|
15,946 |
|
Other long term liabilities |
|
|
13,827 |
|
|
8,028 |
|
Long-term debt |
|
|
75,000 |
|
|
— |
|
Total liabilities |
|
|
292,999 |
|
|
70,358 |
|
Commitments and contingencies (Note 9) |
|
|
|
|
|
|
|
Class A common stock, $0.01 par value; 350,000,000 shares authorized and 59,182,176 shares issued and outstanding as of December 31, 2017; 250,000,000 shares authorized and 3,802,972 shares issued and outstanding as of December 31, 2016 |
|
|
592 |
|
|
38 |
|
Class A-1 common stock, $0.01 par value; no shares authorized, issued or outstanding as of December 31, 2017; 40,000,000 shares authorized and 16,100,000 shares issued and outstanding as of December 31, 2016 |
|
|
— |
|
|
161 |
|
Class A-2 common stock, $0.01 par value; 40,000,000 shares authorized, 6,731,845 shares issued and outstanding as of December 31, 2017; no shares authorized, issued or outstanding as of December 31, 2016 |
|
|
67 |
|
|
— |
|
Class B common stock, $0.01 par value; 150,000,000 shares authorized and 40,331,989 shares issued and outstanding as of December 31, 2017; 150,000,000 shares authorized and 38,462,541 shares issued and outstanding as of December 31, 2016 |
|
|
404 |
|
|
385 |
|
Preferred stock, $0.01 par value; 50,000,000 shares authorized and no shares issued and outstanding as of December 31, 2017 and 2016 |
|
|
— |
|
|
— |
|
Additional paid-in capital |
|
|
673,141 |
|
|
113,175 |
|
Accumulated deficit |
|
|
(17,859) |
|
|
(1,043) |
|
Accumulated other comprehensive income |
|
|
302 |
|
|
— |
|
Total stockholders’ equity |
|
|
656,647 |
|
|
112,716 |
|
Noncontrolling interests |
|
|
406,722 |
|
|
221,992 |
|
Total equity |
|
|
1,063,369 |
|
|
334,708 |
|
Total liabilities and equity |
|
$ |
1,356,368 |
|
$ |
405,066 |
The accompanying notes to consolidated financial statements are an integral part of these financial statements.
F-4
SELECT ENERGY SERVICES, INC.
CONSOLIDATED STATEMENTS OF OPERATIONS
(in thousands, except share and per share data)
|
|
|
Year Ended December 31, |
|||||||
|
|
|
2017 |
|
2016 |
|
2015 |
|||
|
Revenue |
|
|
|
|
|
|
|
|
|
|
Water solutions and related services |
|
$ |
546,043 |
|
$ |
241,455 |
|
$ |
427,496 |
|
Accommodations and rentals |
|
|
53,888 |
|
|
27,151 |
|
|
52,948 |
|
Wellsite completion and construction services |
|
|
50,974 |
|
|
33,793 |
|
|
55,133 |
|
Oilfield chemical product sales |
|
|
41,586 |
|
|
— |
|
|
— |
|
Total revenue |
|
|
692,491 |
|
|
302,399 |
|
|
535,577 |
|
Costs of revenue |
|
|
|
|
|
|
|
|
|
|
Water solutions and related services |
|
|
411,215 |
|
|
200,399 |
|
|
332,411 |
|
Accommodations and rentals |
|
|
41,885 |
|
|
22,019 |
|
|
37,957 |
|
Wellsite completion and construction services |
|
|
42,942 |
|
|
29,089 |
|
|
48,356 |
|
Oilfield chemical product sales |
|
|
37,024 |
|
|
— |
|
|
— |
|
Depreciation and amortization |
|
|
101,645 |
|
|
95,020 |
|
|
104,608 |
|
Total costs of revenue |
|
|
634,711 |
|
|
346,527 |
|
|
523,332 |
|
Gross profit (loss) |
|
|
57,780 |
|
|
(44,128) |
|
|
12,245 |
|
Operating expenses |
|
|
|
|
|
|
|
|
|
|
Selling, general and administrative |
|
|
82,403 |
|
|
34,643 |
|
|
56,548 |
|
Depreciation and amortization |
|
|
1,804 |
|
|
2,087 |
|
|
3,104 |
|
Impairment of goodwill and other intangible assets |
|
|
— |
|
|
138,666 |
|
|
21,366 |
|
Impairment of property and equipment |
|
|
— |
|
|
60,026 |
|
|
— |
|
Lease abandonment costs |
|
|
3,572 |
|
|
19,423 |
|
|
— |
|
Total operating expenses |
|
|
87,779 |
|
|
254,845 |
|
|
81,018 |
|
Loss from operations |
|
|
(29,999) |
|
|
(298,973) |
|
|
(68,773) |
|
Other income (expense) |
|
|
|
|
|
|
|
|
|
|
Interest expense, net |
|
|
(6,629) |
|
|
(16,128) |
|
|
(13,689) |
|
Foreign currency gains, net |
|
|
281 |
|
|
— |
|
|
— |
|
Other income, net |
|
|
369 |
|
|
629 |
|
|
893 |
|
Loss before tax expense |
|
|
(35,978) |
|
|
(314,472) |
|
|
(81,569) |
|
Tax benefit (expense) |
|
|
851 |
|
|
524 |
|
|
(324) |
|
Net loss from continuing operations |
|
|
(35,127) |
|
|
(313,948) |
|
|
(81,893) |
|
Net income from discontinued operations, net of tax |
|
|
— |
|
|
— |
|
|
21 |
|
Net loss |
|
|
(35,127) |
|
|
(313,948) |
|
|
(81,872) |
|
Less: net loss attributable to Predecessor |
|
|
— |
|
|
306,481 |
|
|
80,891 |
|
Less: net loss attributable to noncontrolling interests |
|
|
18,311 |
|
|
6,424 |
|
|
981 |
|
Net loss attributable to Select Energy Services, Inc. |
|
$ |
(16,816) |
|
$ |
(1,043) |
|
$ |
— |
|
Allocation of net loss attributable to: |
|
|
|
|
|
|
|
|
|
|
Class A stockholders |
|
$ |
(12,560) |
|
$ |
(199) |
|
|
|
|
Class A-1 stockholders |
|
|
(3,691) |
|
|
(844) |
|
|
|
|
Class A-2 stockholders |
|
|
(565) |
|
|
— |
|
|
|
|
Class B stockholders |
|
|
— |
|
|
— |
|
|
|
|
|
|
$ |
(16,816) |
|
$ |
(1,043) |
|
|
|
|
Weighted average shares outstanding: |
|
|
|
|
|
|
|
|
|
|
Class A—Basic & Diluted |
|
|
24,612,853 |
|
|
3,802,972 |
|
|
|
|
Class A-1—Basic & Diluted |
|
|
7,233,973 |
|
|
16,100,000 |
|
|
|
|
Class A-2—Basic & Diluted |
|
|
1,106,605 |
|
|
— |
|
|
|
|
Class B—Basic & Diluted |
|
|
38,768,156 |
|
|
38,462,541 |
|
|
|
|
|
|
|
|
|
|
|
|
|
|
|
Net loss per share attributable to common stockholders: |
|
|
|
|
|
|
|
|
|
|
Class A—Basic & Diluted |
|
$ |
(0.51) |
|
$ |
(0.05) |
|
|
|
|
Class A-1—Basic & Diluted |
|
$ |
(0.51) |
|
$ |
(0.05) |
|
|
|
|
Class A-2—Basic & Diluted |
|
$ |
(0.51) |
|
$ |
— |
|
|
|
|
Class B—Basic & Diluted |
|
$ |
— |
|
$ |
— |
|
|
|
The accompanying notes to consolidated financial statements are an integral part of these financial statements.
F-5
SELECT ENERGY SERVICES, INC.
CONSOLIDATED STATEMENTS OF COMPREHENSIVE INCOME (LOSS)
(in thousands)
|
|
|
Year Ended December 31, |
|||||||
|
|
|
2017 |
|
2016 |
|
2015 |
|||
|
Net loss |
|
$ |
(35,127) |
|
$ |
(313,948) |
|
$ |
(81,872) |
|
Other comprehensive income (loss) |
|
|
|
|
|
|
|
|
|
|
Interest rate derivatives designated as cash flow hedges |
|
|
|
|
|
|
|
|
|
|
Unrealized holding loss arising during period |
|
|
— |
|
|
(106) |
|
|
(277) |
|
Net amount reclassified to earnings |
|
|
— |
|
|
113 |
|
|
338 |
|
Foreign currency translation adjustment, net of tax of $0 |
|
|
302 |
|
|
— |
|
|
— |
|
Net change in unrealized gain |
|
|
302 |
|
|
7 |
|
|
61 |
|
Comprehensive loss |
|
|
(34,825) |
|
|
(313,941) |
|
|
(81,811) |
|
Less: comprehensive loss attributable to Predecessor |
|
|
— |
|
|
306,474 |
|
|
80,830 |
|
Less: comprehensive loss attributable to noncontrolling interests |
|
|
18,154 |
|
|
6,424 |
|
|
981 |
|
Comprehensive loss attributable to Select Energy Services, Inc. |
|
$ |
(16,671) |
|
$ |
(1,043) |
|
$ |
— |
The accompanying notes to consolidated financial statements are an integral part of these financial statements.
F-6
SELECT ENERGY SERVICES, INC.
CONSOLIDATED STATEMENTS OF CHANGES IN EQUITY
(in thousands, except share data)
|
|
|
|
|
|
|
|
Class A |
|
Class A-1 |
|
Class A-2 |
|
Class B |
|
Preferred |
|
|
|
|
|
|
|
Accumulated |
|
|
|
|
|
|
|
|
|
||||||||||||||||
|
|
|
Predecessor |
|
Stockholders |
|
Stockholders |
|
Stockholders |
|
Stockholders |
|
Stockholders |
|
|
|
|
|
|
|
Other |
|
|
|
|
|
|
|
|
|
|||||||||||||||||||
|
|
|
|
|
|
|
|
|
|
Class A |
|
|
|
Class A-1 |
|
|
|
Class A-2 |
|
|
|
Class B |
|
|
|
|
|
|
Additional |
|
|
|
|
Comprehensive |
|
Total |
|
|
|
|
|
|
|||||||
|
|
|
|
|
Members’ |
|
|
|
Common |
|
|
|
Common |
|
|
|
Common |
|
|
|
Common |
|
|
|
Preferred |
|
Paid-In |
|
Accumulated |
|
Income |
|
Stockholders’ |
|
Noncontrolling |
|
|
|
|||||||||||
|
|
|
Units |
|
Capital |
|
Shares |
|
Stock |
|
Shares |
|
Stock |
|
Shares |
|
Stock |
|
Shares |
|
Stock |
|
Shares |
|
Stock |
|
Capital |
|
Deficit |
|
(Loss) |
|
Equity |
|
Interests |
|
Total |
||||||||||||
|
Balance as of December 31, 2015 |
|
38,398,649 |
|
$ |
317,161 |
|
— |
|
$ |
— |
|
— |
|
$ |
— |
|
— |
|
$ |
— |
|
— |
|
$ |
— |
|
— |
|
$ |
— |
|
$ |
— |
|
$ |
— |
|
$ |
(7) |
|
$ |
— |
|
$ |
10,621 |
|
$ |
327,775 |
|
Member contributions |
|
3,866,864 |
|
|
23,519 |
|
— |
|
|
— |
|
— |
|
|
— |
|
— |
|
|
— |
|
— |
|
|
— |
|
— |
|
|
— |
|
|
— |
|
|
— |
|
|
— |
|
|
— |
|
|
— |
|
|
23,519 |
|
Purchase of additional controlling interest |
|
— |
|
|
707 |
|
— |
|
|
— |
|
— |
|
|
— |
|
— |
|
|
— |
|
— |
|
|
— |
|
— |
|
|
— |
|
|
— |
|
|
— |
|
|
— |
|
|
— |
|
|
(1,055) |
|
|
(348) |
|
Noncontrolling interest in subsidiary |
|
— |
|
|
— |
|
— |
|
|
— |
|
— |
|
|
— |
|
— |
|
|
— |
|
— |
|
|
— |
|
— |
|
|
— |
|
|
— |
|
|
— |
|
|
— |
|
|
— |
|
|
138 |
|
|
138 |
|
Equity-based compensation |
|
— |
|
|
317 |
|
— |
|
|
— |
|
— |
|
|
— |
|
— |
|
|
— |
|
— |
|
|
— |
|
— |
|
|
— |
|
|
— |
|
|
— |
|
|
— |
|
|
— |
|
|
— |
|
|
317 |
|
Fair value of interest rate swap |
|
— |
|
|
— |
|
— |
|
|
— |
|
— |
|
|
— |
|
— |
|
|
— |
|
— |
|
|
— |
|
— |
|
|
— |
|
|
— |
|
|
— |
|
|
7 |
|
|
— |
|
|
— |
|
|
7 |
|
Net loss prior to 144A Offering |
|
— |
|
|
(306,481) |
|
— |
|
|
— |
|
— |
|
|
— |
|
— |
|
|
— |
|
— |
|
|
— |
|
— |
|
|
— |
|
|
— |
|
|
— |
|
|
— |
|
|
— |
|
|
(4,407) |
|
|
(310,888) |
|
|
|
|
|
|
|
|
|
|
|
|
|
|
|
|
|
|
|
|
|
|
|
|
|
|
|
|
|
|
|
|
|
|
|
|
|
|
|
|
|
|
|
|
|
|
|
|
|
|
|
Balance prior to reorganization and 144A Offering transactions |
|
42,265,513 |
|
|
35,223 |
|
— |
|
|
— |
|
— |
|
|
— |
|
— |
|
|
— |
|
— |
|
|
— |
|
— |
|
|
— |
|
|
— |
|
|
— |
|
|
— |
|
|
— |
|
|
5,297 |
|
|
40,520 |
|
Reorganization and 144A Offering |
|
(42,265,513) |
|
|
(35,223) |
|
3,802,972 |
|
|
38 |
|
16,100,000 |
|
|
161 |
|
— |
|
|
— |
|
38,462,541 |
|
|
385 |
|
— |
|
|
— |
|
|
331,887 |
|
|
— |
|
|
— |
|
|
332,471 |
|
|
— |
|
|
297,248 |
|
Initial allocation of noncontrolling interest of Select Energy Services, Inc. effective on date of 144A Offering |
|
— |
|
|
— |
|
— |
|
|
— |
|
— |
|
|
— |
|
— |
|
|
— |
|
— |
|
|
— |
|
— |
|
|
— |
|
|
(218,712) |
|
|
— |
|
|
— |
|
|
(218,712) |
|
|
218,712 |
|
|
— |
|
Balance subsequent to reorganization and 144A Offering transactions |
|
— |
|
|
— |
|
3,802,972 |
|
|
38 |
|
16,100,000 |
|
|
161 |
|
— |
|
|
— |
|
38,462,541 |
|
|
385 |
|
— |
|
|
— |
|
|
113,175 |
|
|
— |
|
|
— |
|
|
113,759 |
|
|
224,009 |
|
|
337,768 |
|
Net loss subsequent to reorganization and 144A Offering |
|
— |
|
|
— |
|
— |
|
|
— |
|
— |
|
|
— |
|
— |
|
|
— |
|
— |
|
|
— |
|
— |
|
|
— |
|
|
— |
|
|
(1,043) |
|
|
— |
|
|
(1,043) |
|
|
(2,017) |
|
|
(3,060) |
|
Balance as of December 31, 2016 |
|
— |
|
|
— |
|
3,802,972 |
|
|
38 |
|
16,100,000 |
|
|
161 |
|
— |
|
|
— |
|
38,462,541 |
|
|
385 |
|
— |
|
|
— |
|
|
113,175 |
|
|
(1,043) |
|
|
— |
|
|
112,716 |
|
|
221,992 |
|
|
334,708 |
|
Conversion of Class A-1 to Class A |
|
— |
|
|
— |
|
16,100,000 |
|
|
161 |
|
(16,100,000) |
|
|
(161) |
|
— |
|
|
— |
|
— |
|
|
— |
|
— |
|
|
— |
|
|
— |
|
|
— |
|
|
— |
|
|
— |
|
|
— |
|
|
— |
|
Exchange of shares of Class B common stock and SES Holdings, LLC common units for shares of Class A common stock |
|
— |
|
|
— |
|
2,487,029 |
|
|
25 |
|
— |
|
|
— |
|
— |
|
|
— |
|
(2,487,029) |
|
|
(25) |
|
— |
|
|
— |
|
|
16,298 |
|
|
— |
|
|
— |
|
|
16,298 |
|
|
(16,298) |
|
|
— |
|
Issuance of shares for acquisitions |
|
— |
|
|
— |
|
560,277 |
|
|
6 |
|
— |
|
|
— |
|
— |
|
|
— |
|
— |
|
|
— |
|
— |
|
|
— |
|
|
4,995 |
|
|
— |
|
|
— |
|
|
5,001 |
|
|
4,879 |
|
|
9,880 |
|
Issuance of shares for merger |
|
— |
|
|
— |
|
26,246,115 |
|
|
262 |
|
— |
|
|
— |
|
6,731,845 |
|
|
67 |
|
4,356,477 |
|
|
44 |
|
— |
|
|
— |
|
|
447,242 |
|
|
— |
|
|
— |
|
|
447,615 |
|
|
170,276 |
|
|
617,891 |
|
Issuance of shares for initial public offering |
|
— |
|
|
— |
|
10,005,000 |
|
|
100 |
|
— |
|
|
— |
|
— |
|
|
— |
|
— |
|
|
— |
|
— |
|
|
— |
|
|
87,269 |
|
|
— |
|
|
— |
|
|
87,369 |
|
|
41,135 |
|
|
128,504 |
|
Equity-based compensation |
|
— |
|
|
— |
|
— |
|
|
— |
|
— |
|
|
— |
|
— |
|
|
— |
|
— |
|
|
— |
|
— |
|
|
— |
|
|
4,346 |
|
|
— |
|
|
— |
|
|
4,346 |
|
|
3,345 |
|
|
7,691 |
|
Treasury stock purchase |
|
— |
|
|
— |
|
(19,217) |
|
|
— |
|
— |
|
|
— |
|
— |
|
|
— |
|
— |
|
|
— |
|
— |
|
|
— |
|
|
(184) |
|
|
— |
|
|
— |
|
|
(184) |
|
|
(113) |
|
|
(297) |
|
Noncontrolling interest in subsidiary |
|
— |
|
|
— |
|
— |
|
|
— |
|
— |
|
|
— |
|
— |
|
|
— |
|
— |
|
|
— |
|
— |
|
|
— |
|
|
— |
|
|
— |
|
|
— |
|
|
— |
|
|
(368) |
|
|
(368) |
|
Foreign currency translation adjustment |
|
— |
|
|
— |
|
— |
|
|
— |
|
— |
|
|
— |
|
— |
|
|
— |
|
— |
|
|
— |
|
— |
|
|
— |
|
|
— |
|
|
— |
|
|
302 |
|
|
302 |
|
|
185 |
|
|
487 |
|
Net loss |
|
— |
|
|
— |
|
— |
|
|
— |
|
— |
|
|
— |
|
— |
|
|
— |
|
— |
|
|
— |
|
— |
|
|
— |
|
|
— |
|
|
(16,816) |
|
|
— |
|
|
(16,816) |
|
|
(18,311) |
|
|
(35,127) |
|
Balance as of December 31, 2017 |
|
— |
|
$ |
— |
|
59,182,176 |
|
$ |
592 |
|
— |
|
$ |
— |
|
6,731,845 |
|
$ |
67 |
|
40,331,989 |
|
$ |
404 |
|
— |
|
$ |
— |
|
$ |
673,141 |
|
$ |
(17,859) |
|
$ |
302 |
|
$ |
656,647 |
|
$ |
406,722 |
|
$ |
1,063,369 |
The accompanying notes to consolidated financial statements are an integral part of these financial statements.
F-7
SELECT ENERGY SERVICES, INC.
CONSOLIDATED STATEMENTS OF CASH FLOWS
(in thousands)
|
|
|
Year Ended December 31, |
|||||||
|
|
|
2017 |
|
2016 |
|
2015 |
|||
|
Cash flows from operating activities |
|
|
|
|
|
|
|
|
|
|
Net loss |
|
$ |
(35,127) |
|
$ |
(313,948) |
|
$ |
(81,872) |
|
Adjustments to reconcile net loss to net cash provided by operating activities |
|
|
|
|
|
|
|
|
|
|
Depreciation and amortization |
|
|
103,449 |
|
|
97,107 |
|
|
107,712 |
|
Gain on disposal of property and equipment |
|
|
(2,726) |
|
|
(97) |
|
|
(760) |
|
Gain realized on previously held interest in Rockwater |
|
|
(1,210) |
|
|
— |
|
|
— |
|
Bad debt expense |
|
|
1,542 |
|
|
2,385 |
|
|
3,179 |
|
Amortization of debt issuance costs |
|
|
4,031 |
|
|
3,435 |
|
|
576 |
|
Equity-based compensation |
|
|
7,691 |
|
|
317 |
|
|
692 |
|
Impairment of goodwill and other intangible assets |
|
|
— |
|
|
138,666 |
|
|
21,366 |
|
Impairment of property and equipment |
|
|
— |
|
|
60,026 |
|
|
— |
|
Loss on the sale of business unit |
|
|
— |
|
|
— |
|
|
972 |
|
Other operating items, net |
|
|
(353) |
|
|
(1,619) |
|
|
(2,340) |
|
Changes in operating assets and liabilities |
|
|
|
|
|
|
|
|
|
|
Accounts receivable |
|
|
(100,485) |
|
|
1,290 |
|
|
140,426 |
|
Prepaid expenses and other assets |
|
|
(2,177) |
|
|
1,224 |
|
|
3,112 |
|
Accounts payable and accrued liabilities |
|
|
22,466 |
|
|
16,345 |
|
|
(41,064) |
|
Net cash (used in) provided by operating activities |
|
|
(2,899) |
|
|
5,131 |
|
|
151,999 |
|
Cash flows from investing activities |
|
|
|
|
|
|
|
|
|
|
Acquisitions, net of cash received |
|
|
(65,488) |
|
|
— |
|
|
— |
|
Proceeds received from investments |
|
|
— |
|
|
— |
|
|
830 |
|
Purchase of property, equipment and intangible assets |
|
|
(98,722) |
|
|
(36,290) |
|
|
(54,076) |
|
Proceeds received from sale of business unit |
|
|
— |
|
|
— |
|
|
400 |
|
Proceeds received from sale of property and equipment |
|
|
7,479 |
|
|
9,335 |
|
|
14,143 |
|
Net cash used in investing activities |
|
|
(156,731) |
|
|
(26,955) |
|
|
(38,703) |
|
Cash flows from financing activities |
|
|
|
|
|
|
|
|
|
|
Proceeds from 144A Offering, net of underwriter fees and expenses |
|
|
— |
|
|
297,248 |
|
|
— |
|
Proceeds from revolving line of credit and issuance of long-term debt |
|
|
109,000 |
|
|
27,500 |
|
|
5,000 |
|
Payments on long-term debt |
|
|
(111,000) |
|
|
(298,000) |
|
|
(107,000) |
|
Payment of debt issuance costs |
|
|
(3,442) |
|
|
(4,497) |
|
|
(1,192) |
|
Proceeds from initial public offering |
|
|
140,070 |
|
|
— |
|
|
— |
|
Payments incurred for initial public offering |
|
|
(11,566) |
|
|
— |
|
|
— |
|
Purchase of noncontrolling interests |
|
|
— |
|
|
(348) |
|
|
— |
|
(Distributions to) proceeds from noncontrolling interests |
|
|
(368) |
|
|
138 |
|
|
92 |
|
Purchase of treasury stock |
|
|
(297) |
|
|
— |
|
|
— |
|
Member contributions (distributions) |
|
|
— |
|
|
23,519 |
|
|
(4,248) |
|
Net cash provided by (used in) financing activities |
|
|
122,397 |
|
|
45,560 |
|
|
(107,348) |
|
Effect of exchange rate changes on cash |
|
|
(34) |
|
|
— |
|
|
75 |
|
Net (decrease) increase in cash and cash equivalents |
|
|
(37,267) |
|
|
23,736 |
|
|
6,023 |
|
Cash and cash equivalents, beginning of period |
|
|
40,041 |
|
|
16,305 |
|
|
10,282 |
|
Cash and cash equivalents, end of period |
|
$ |
2,774 |
|
$ |
40,041 |
|
$ |
16,305 |
|
Supplemental cash flow disclosure: |
|
|
|
|
|
|
|
|
|
|
Cash paid for interest |
|
$ |
1,999 |
|
$ |
12,773 |
|
$ |
10,584 |
|
Cash (refunded) paid for taxes |
|
$ |
(54) |
|
$ |
(192) |
|
$ |
2,262 |
|
Supplemental disclosure of noncash investing activities: |
|
|
|
|
|
|
|
|
|
|
Capital expenditures included in accounts payable and accrued liabilities |
|
$ |
11,137 |
|
$ |
1,563 |
|
$ |
936 |
The accompanying notes to consolidated financial statements are an integral part of these financial statements.
F-8
SELECT ENERGY SERVICES, INC.
NOTES TO CONSOLIDATED FINANCIAL STATEMENTS
NOTE 1—BUSINESS AND BASIS OF PRESENTATION
Description of the business: Select Energy Services, Inc. (“Select Inc.” or “the Company”) was incorporated as a Delaware corporation on November 21, 2016. The Company is a holding company whose sole material asset consists of a membership interest in SES Holdings, LLC (“SES Holdings” or the “Predecessor”). Unless otherwise stated or the context otherwise indicates, all references to the “Company” or similar expressions for time periods prior to the reorganization and Select 144A Offering transactions (as defined below) refer to SES Holdings and its subsidiaries. For time periods subsequent to the reorganization and Select 144A Offering transactions, these terms refer to Select Energy Services and its subsidiaries.
On November 1, 2017, the Company completed the transactions in which Select merged with Rockwater Energy Solutions, Inc. (“Rockwater”) and Rockwater LLC in a stock-for-stock transaction (the “Rockwater Merger”). See Note 3—Acquisitions for further discussion.
Select Energy Services is an oilfield services company that provides total water solutions and chemical solutions to the U.S. conventional oil and natural gas industry. The Company provides complementary water-related services that support oil and gas well completion and production activities including containment, monitoring, treatment, flowback and well testing, hauling and water recycling and disposal. The Company also develops and manufactures a full suite of specialty chemicals used in well completions and production chemicals used to enhance performance over the life of a well. These services are necessary to establish and maintain production of oil and gas over the productive life of a well.
The Company also operates a wellsite services group to complement its total water solutions and chemical solutions offering. These services include equipment rental, accommodations, crane and logistics services, wellsite and pipeline construction, field and well services, sand hauling and fluids logistic services. In addition, the Company provides water transfer, fluids hauling, containment and rental services in Canada. The Company conducts its wellsite services activities on a third‑party contractual basis unrelated to its water‑related services.
Reorganization: On December 20, 2016, Select Energy Services completed a private placement (the “Select 144A Offering”) of 16,100,000 shares of Class A‑1 Common Stock, par value $0.01 per share (“Class A-1 Common Stock”) at an offering price of $20.00 per share. In conjunction with the Select 144A Offering, SES Holdings’ then existing Class A and Class B units were converted into a single class of common units (the “SES Holdings LLC Units”) and SES Holdings effected a 10.3583 for 1 unit split. In exchange for the contribution of all net proceeds from the Select 144A Offering to SES Holdings, SES Holdings issued 16,100,000 SES Holdings LLC Units to Select Inc., and Select Inc. became the sole managing member of SES Holdings. Select Inc. issued 38,462,541 shares of Class B Common Stock to the other member of SES Holdings, SES Legacy Holdings, LLC (“Legacy Owner Holdco”) or one share for each SES Holdings LLC Unit held by Legacy Owner Holdco. Select Inc. also acquired 3,802,972 SES Holdings LLC Units from certain legacy owners (the “Contributing Legacy Owners”) in exchange for the issuance of 3,802,972 shares of Class A Common Stock. In connection with the closing of the Select 144A Offering, Class A-1 Common Stock was converted into Class A Common Stock. Refer below for further discussion. Shareholders of Class A Common Stock, and Class B Common Stock vote together as a single class on all matters, subject to certain exceptions in the Company’s amended and restated certificate of incorporation. Holders of Class B Common Stock have voting rights only and are not entitled to an economic interest in Select Inc. based on their ownership of Class B Common Stock. The reorganization transactions were treated as a combination of entities under common control with assets and liabilities transferred at their carrying amounts in a manner similar to a pooling of interests.
Initial Public Offering: On April 26, 2017, the Company completed its initial public offering (“IPO”) of 8,700,000 shares of Class A Common Stock at a price of $14.00 per share. On May 10, 2017, the underwriters of the IPO exercised their over-allotment option to purchase an additional 1,305,000 shares of Class A Common Stock at the IPO price of $14.00 per share. After deducting underwriting discounts and commissions and estimated offering expenses
F-9
payable by it, the Company received $128.5 million of the aggregate net proceeds from the IPO (including the over-allotment option). The Company contributed all of the net proceeds received by it to SES Holdings in exchange for SES Holdings LLC Units. SES Holdings used the net proceeds in the following manner: (i) $34.0 million was used to repay borrowings incurred under the Company’s Previous Credit Facility (as defined and discussed in Note 8) to fund the cash portion of the purchase price of the GRR Acquisition, as defined below, (ii) $7.8 million was used for the cash settlement of outstanding phantom unit awards and (iii) the remaining net proceeds are intended to be used for general corporate purposes, including funding capital expenditures.
Credit Agreement: Concurrent with the Rockwater Merger, the Company entered into a $300.0 million senior revolving credit facility. In addition, the obligations under the Previous Credit Facility (as defined and discussed in Note 8) were repaid in full and the Previous Credit Facility (as defined and discussed in Note 8) was terminated. See Note 8— Debt for further discussion.
Exchange rights: Under the Eighth Amended and Restated Limited Liability Company Agreement of SES Holdings (the “SES Holdings LLC Agreement”), Legacy Owner Holdco and its permitted transferees have the right (an “Exchange Right”) to cause SES Holdings to acquire all or a portion of its SES Holdings LLC Units for, at SES Holdings’ election, (i) shares of Class A Common Stock at an exchange ratio of one share of Class A Common Stock for each SES Holdings LLC Unit exchanged, subject to conversion rate adjustments for stock splits, stock dividends, reclassification and other similar transactions or (ii) cash in an amount equal to the Cash Election Value (as defined within the SES Holdings LLC Agreement) of such Class A Common Stock. Alternatively, upon the exercise of any Exchange Right, Select Inc. has the right (the “Call Right”) to acquire the tendered SES Holdings LLC Units from the exchanging unitholder for, at its election, (i) the number of shares of Class A Common Stock the exchanging unitholder would have received under the Exchange Right or (ii) cash in an amount equal to the Cash Election Value of such Class A Common Stock. In connection with any exchange of SES Holdings LLC Units pursuant to an Exchange Right or Call Right, the corresponding number of shares of Class B Common Stock will be cancelled.
Registration rights: In December 2016, in connection with the closing of the Select 144A Offering, Select Inc. entered into a registration rights agreement with FBR Capital Markets & Co. for the benefit of the investors in the Select 144A Offering. Under this registration rights agreement, the Company agreed, at its expense, to file with the SEC, in no event later than April 30, 2017, a shelf registration statement registering for resale the 16,100,000 shares of Class A Common Stock issuable upon conversion of the Class A‑1 Common Stock sold in the Select 144A Offering plus any additional shares of Class A‑1 Common Stock issued in respect thereof whether by stock dividend, stock distribution, stock split or otherwise, and to use commercially reasonable efforts to cause such registration statement to be declared effective by the SEC as soon as practicable but in any event within 60 days after the closing of the IPO. The Company filed this registration statement with the SEC on April 28, 2017 and this registration statement was declared effective by the SEC on June 13, 2017. Accordingly, each share of Class A‑1 Common Stock outstanding automatically converted into a share of Class A Common Stock on a one‑for‑one basis at that time. In addition, Legacy Owner Holdco has the right, under certain circumstances, to cause the Company to register the shares of Class A Common Stock obtained pursuant to the Exchange Right.
Tax receivable agreements: In connection with the Company’s restructuring at the Select 144A Offering, Select Inc. entered into two tax receivable agreements (the “Tax Receivable Agreements”) with Legacy Owner Holdco and certain other affiliates of the then-holders of SES Holdings LLC Units (collectively, the “TRA Holders”). On July 18, 2017, the Company’s board of directors approved amendments to each of the Tax Receivable Agreements. See Note 13—Related Party Transactions for further discussion.
Basis of presentation: The accompanying consolidated financial statements of the Company have been prepared in accordance with generally accepted accounting principles in the United States (“GAAP”) and pursuant to the rules and regulations of the SEC. The consolidated financial statements include the accounts of the Company and all of its majority‑owned or controlled subsidiaries. All significant intercompany accounts and transactions have been eliminated in consolidation.
F-10
In the opinion of management, all adjustments which are of a normal recurring nature and considered necessary for a fair presentation of the Company’s financial statements have been included in these consolidated financial statements.
The Company’s historical financial statements prior to the Select 144A Offering and reorganization transactions are prepared using SES Holdings’ historical basis in the assets and liabilities, and include all revenues, costs, assets and liabilities attributed to SES Holdings.
For investments in subsidiaries that are not wholly owned, but where the Company exercises control, the equity held by the minority owners and their portion of net income or loss are reflected as noncontrolling interests. Investments in entities in which the Company exercises significant influence over operating and financial policies are accounted for using the equity method, and investments in entities for which the Company does not have significant control or influence are accounted for using the cost method.
Discontinued operations: The Company considers a component of its business to be one that comprises operations and cash flows that can be clearly distinguished, operationally and for financial reporting purposes, from the rest of its business. The operating results of a component of its business that either has been disposed of or is classified as held for sale are presented as discontinued operations when the operations and cash flows of the component have been or will be eliminated from its ongoing operations as a result of the disposal transaction and the Company will not have any significant continuing involvement in the operations of the disposed component.
Segment reporting: The Company has three operating and reportable segments. Operating segments are defined as components of an enterprise for which separate financial information is evaluated regularly by the chief operating decision maker in deciding how to allocate resources and assess performance. As a result of the Rockwater Merger, the Company reorganized its reporting structure and aligned its segments and underlying businesses to execute on the strategies of the combined company. The Company’s revised operating and reportable segments are Water Solutions, Oilfield Chemicals and Wellsite Services. Accordingly, prior period segment information has been retrospectively revised as of December 31, 2016 and for the years ended December 31, 2016 and 2015. Corporate and other expenses that do not individually meet the criteria for segment reporting are reported separately as Corporate.
Reclassifications: Certain reclassifications have been made to the Company’s prior period consolidated financial information in order to conform to the current year presentation. These presentation changes did not impact the Company’s consolidated net income, total assets, total liabilities or total stockholders’ equity.
NOTE 2—SIGNIFICANT ACCOUNTING POLICIES
Use of estimates: The preparation of consolidated financial statements in conformity with GAAP requires management to make estimates and assumptions that affect the reported amounts of assets and liabilities and disclosure of contingent assets and liabilities at the date of the financial statements and the reported amounts of revenues and expenses during the reporting period. Actual results could differ from those estimates.
On an ongoing basis, the Company evaluates its estimates, including those related to recoverability of long‑lived assets and intangibles, useful lives used in depreciation and amortization, uncollectible accounts receivable, income taxes, self‑insurance liabilities, share‑based compensation and contingent liabilities. The Company bases its estimates on historical and other pertinent information that are believed to be reasonable under the circumstances. The accounting estimates used in the preparation of the consolidated financial statements may change as new events occur, as more experience is acquired, as additional information is obtained and as the Company’s operating environment changes.
Cash and cash equivalents: The Company considers all highly liquid investments with an original maturity of three months or less to be cash equivalents.
Accounts receivable and allowance for doubtful accounts: Accounts receivable are stated at the invoiced amount, or the earned but not yet invoiced amount, net of an allowance for doubtful accounts. The Company establishes
F-11
an allowance for doubtful accounts based on the review of several factors, including historical collection experience, current aging status of the customer accounts and financial condition of its customers. Accounts receivable are written off when a settlement is reached for an amount less than the outstanding historical balance or when the Company determines that it is probable the balance will not be collected.
The change in allowance for doubtful accounts is as follows:
|
|
|
For the year ended December 31, |
|||||||
|
|
|
2017 |
|
2016 |
|
2015 |
|||
|
|
|
(in thousands) |
|||||||
|
Balance at beginning of year |
|
$ |
2,144 |
|
$ |
2,351 |
|
$ |
3,169 |
|
Provisions for bad debts, included in selling, general and administrative |
|
|
1,542 |
|
|
2,385 |
|
|
3,179 |
|
Uncollectible receivables written off |
|
|
(707) |
|
|
(2,592) |
|
|
(3,997) |
|
Balance at end of year |
|
$ |
2,979 |
|
$ |
2,144 |
|
$ |
2,351 |
Concentrations of credit and customer risk: Financial instruments that potentially subject the Company to concentrations of credit risk consist principally of cash and cash equivalents and trade accounts receivable. The amounts held in financial institutions periodically exceed the federally insured limit. Management believes that the financial institutions are financially sound and the risk of loss is minimal. The Company minimizes its exposure to counterparty credit risk by performing credit evaluations and ongoing monitoring of the financial stability of its customers. There were no customers that accounted for more than 10.0% of the Company’s consolidated revenues for the years ended December 31, 2017 and 2016. During 2015, Anadarko Petroleum Corporation (“Anadarko”) accounted for 10.6% of the Company’s consolidated revenues; these revenues related to the Water Solutions and Wellsite Services segments.
Inventories: The Company values its inventories at lower of cost or net realizable value. Inventory costs are determined under the weighted-average method. Inventory costs primarily consist of chemicals and materials available for resale and parts and consumables used in operations.
Debt issuance costs: Debt issuance costs consist of costs directly associated with obtaining credit with financial institutions. These costs are recorded as a direct deduction from the carrying value of the associated debt liability and are generally amortized on a straight‑line basis over the life of the credit agreement, which approximates the effective‑interest method. During the year ended December 31, 2017, the Company expensed unamortized debt issuance costs of $2.9 million upon repayment and termination of the Previous Credit Facility (as defined and discussed in Note 8). In connection with the entry into the Credit Agreement, the Company incurred debt issuance cost of $3.4 million. Amortization expense for debt issuance costs was $4.0 million, $3.4 million and $3.2 million for the years ended December 31, 2017, 2016 and 2015, respectively, and is included in interest expense in the consolidated statements of operations.
Property and equipment: Property and equipment are stated at cost less accumulated depreciation.
Depreciation (and amortization of capital lease assets) is calculated on a straight line basis over the estimated useful life of each asset as noted below:
|
Asset Classification |
|
Useful Life (years) |
|
Land |
|
Indefinite |
|
Buildings and leasehold improvements |
|
30 or lease term |
|
Vehicles and equipment |
|
4 - 7 |
|
Machinery and equipment |
|
2 - 15 |
|
Computer equipment and software |
|
3 - 4 |
|
Office furniture and equipment |
|
7 |
|
Disposal wells |
|
7 - 10 |
|
Helicopters |
|
7 |
F-12
Depreciation expense related to the Company’s property and equipment, including amortization of property under capital leases was $92.6 million, $88.2 million and $98.3 million for the years ended December 31, 2017, 2016 and 2015, respectively.
Expenditures for additions to property and equipment and major replacements are capitalized when they significantly increase the functionality or extend the useful life of the asset. Gains and losses on dispositions, maintenance, repairs and minor replacements are included in the consolidated statements of operations as incurred. See Note 6—Property and Equipment for further discussion.
Business Combination: The Company records business combinations using the acquisition method of accounting. Under the acquisition method of accounting, identifiable assets acquired and liabilities assumed are recorded at their acquisition date fair values. The excess of the purchase price over the estimated fair value is recorded as goodwill. Changes in the estimated fair values of net assets recorded for acquisitions prior to the finalization of more detailed analysis, but not to exceed one year from the date of acquisition, will adjust the amount of the purchase price allocable to goodwill. Measurement period adjustments are reflected in the period in which they occur.
Goodwill and other intangible assets: Goodwill represents the excess of the purchase price of acquisitions over the fair value of the net assets acquired. Goodwill and other intangible assets not subject to amortization are tested for impairment annually or more frequently if events or changes in circumstances indicate that the asset might be impaired. Intangible assets with finite useful lives are amortized either on a straight‑line basis over the asset’s estimated useful life or on a basis that reflects the pattern in which the economic benefits of the intangible assets are realized.
Impairment of goodwill, long‑lived assets and intangible assets: Long‑lived assets, such as property and equipment and finite‑lived intangible assets, are evaluated for impairment whenever events or changes in circumstances indicate that its carrying value may not be recoverable. Recoverability is measured by a comparison of its carrying amount to the estimated undiscounted cash flows to be generated by those assets. If the undiscounted cash flows are less than the carrying amount, the Company records impairment losses for the excess of its carrying value over the estimated fair value. The development of future cash flows and the estimate of fair value represent its best estimates based on industry trends and reference to market transactions and are subject to variability. The Company considers the factors within the fair value analysis to be Level 3 inputs within the fair value hierarchy. Due to certain economic factors related to oil prices and rig counts, during 2015, an impairment loss of $1.3 million related to other intangible assets was recognized within impairment of intangible assets in the consolidated statements of operations. The impairment related to certain intangible assets within the Company’s Water Solutions segment. The Company determined that triggering events existed during 2016 resulting in an evaluation of the recoverability of the carrying value of certain property and equipment. As a result of this evaluation, the Company recorded impairment of property and equipment of $60.0 million related to the Company’s Water Solutions segment and impairment of other intangible assets of $0.1 million related to the Company’s Wellsite Services segment. As a result of this annual impairment test, the Company recorded no impairment of property and equipment during the year ended December 31, 2017. See Note 12—Fair Value Measurement for further discussion.
The Company conducts its annual goodwill impairment tests in the fourth quarter of each year, and whenever impairment indicators arise, by examining relevant events and circumstances which could have a negative impact on its goodwill such as macroeconomic conditions, industry and market conditions, cost factors that have a negative effect on earnings and cash flows, overall financial performance, acquisitions and divestitures and other relevant entity-specific events. If a qualitative assessment indicates that it is more likely than not that the fair value of a reporting unit is less than its carrying amount, then the Company would be required to perform a quantitative impairment test for goodwill using a two-step approach. In the first step, the fair value of each reporting unit is determined and compared to the reporting unit’s carrying value, including goodwill. To determine the fair value of the reporting unit, the Company uses an income approach, which provides an estimated fair value based on the present value of expected future cash flows. The Company discounts the resulting future cash flows using weighted average cost of capital calculations based on the capital structures of publicly traded peer companies. The Company’s reporting units are based on its organizational and reporting structure.
If the fair value of a reporting unit is less than its carrying value, the second step of the goodwill impairment test is performed to measure the amount of impairment, if any. In the second step, the fair value of the reporting unit is
F-13
allocated to the assets and liabilities of the reporting unit as if it had been acquired in a business combination and the purchase price was equivalent to the fair value of the reporting unit. The excess of the fair value of the reporting unit over the amounts assigned to its assets and liabilities is referred to as the implied fair value of goodwill. If the implied fair value of goodwill at the reporting unit level is less than its carrying value, an impairment loss is recorded to the extent that the implied fair value of goodwill at the reporting unit is less than its carrying value. Application of the goodwill impairment test requires judgment, including the identification of reporting units, allocation of assets (including goodwill) and liabilities to reporting units and determining the fair value. The determination of reporting unit fair value relies upon certain estimates and assumptions that are complex and are affected by numerous factors, including the general economic environment and levels of exploration and production (“E&P”) activity of oil and gas companies, the Company’s financial performance and trends and the Company’s strategies and business plans, among others. Unanticipated changes, including immaterial revisions to these assumptions could result in a provision for impairment in a future period. Given the nature of these evaluations and their application to specific assets and time frames, it is not possible to reasonably quantify the impact of changes in these assumptions.
Due to certain economic factors related to oil prices and rig counts during 2015, an impairment loss of $20.1 million related to goodwill was recognized in the consolidated statements of operations for the year ended December 31, 2015. The Company determined that additional triggering events were present during 2016 resulting in a goodwill impairment assessment of $138.5 million, primarily related to the Company’s Water Solutions segment. As a result of the Company’s annual impairment test, no impairment loss was recognized during the year ended December 31, 2017. See Note 7—Goodwill and Other Intangible Assets and Note 12—Fair Value Measurement for further discussion.
Asset retirement obligations: The asset retirement obligation (“ARO”) liability reflects the present value of estimated costs of plugging, site reclamation and similar activities associated with the Company’s salt water disposal wells. The Company utilizes current retirement costs to estimate the expected cash outflows for retirement obligations. The Company also estimates the productive life of the disposal wells, a credit‑adjusted risk‑free discount rate and an inflation factor in order to determine the current present value of this obligation. The Company’s ARO liabilities are included in accrued expenses and other current liabilities and other long term liabilities during the years ended December 31, 2017 and 2016.
The change in asset retirement obligations is as follows:
|
|
|
For the year ended December 31, |
||||
|
|
|
2017 |
|
2016 |
||
|
|
|
(in thousands) |
||||
|
Balance at beginning of year |
|
$ |
1,668 |
|
$ |
1,483 |
|
Accretion expense, included in depreciation and amortization expense |
|
|
178 |
|
|
155 |
|
Change in estimate |
|
|
— |
|
|
30 |
|
Balance at end of year |
|
$ |
1,846 |
|
$ |
1,668 |
Self‑insurance: The Company self‑insures, through deductibles and retentions, up to certain levels for losses related to general liability, workers’ compensation and employer’s liability and vehicle liability. The Company’s exposure (i.e. the retention or deductible) per occurrence is $1.0 million for general liability, $1.0 million for workers’ compensation and employer’s liability and $1.0 million for vehicle liability. Rockwater’s retentions and deductibles are $0.1 million for general liability, $0.8 million for workers’ compensation and $0.5 million for auto liability and all policies will be combined with the renewal of Select’s policies effective May 1, 2018. We also have an excess loss policy over these coverages with a limit of $100.0 million in the aggregate. Rockwater’s excess coverage has limits of $50.0 million. Management regularly reviews its estimates of reported and unreported claims and provide for losses through reserves. Prior to June 1, 2016, the Company was self‑insured for group medical claims subject to a deductible of $0.3 million for large claims. As of June 1, 2016, the Company is fully‑insured for group medical. In connection with the Rockwater Merger, the Company maintains a separate group medical program for certain employees where medical claims are subject to a deductible of $0.3 million for large claims. The Company is currently in negotiations for a single benefit plan that will be effective June 2018, that will consider multiple options.
F-14
Employee benefit plans: The Company sponsors a defined contribution 401(k) Profit Sharing Plan (the “401(k) Plan”) for the benefit of substantially all employees of the Company. The 401(k) Plan allows eligible employees to make tax‑deferred contributions, not to exceed annual limits established by the Internal Revenue Service. Prior to December 4, 2015, the Company made matching contributions of 100% of employee contributions, up to 4% of compensation. These matching contributions were vested immediately. Effective December 4, 2015, the employer match was discontinued for all employees. The Company did not make any matching contributions for the year ended December 31, 2016. Effective July 1, 2017, the Company reinstated matching contributions of 100% of employee contributions, up to 4% of compensation with immediate vesting period for existing employees. Starting July 1, 2017, the vesting schedule for new hires is 25% for the first year, 50% for the second year, 75% for the third year and 100% for the fourth year. The Company’s contributions to the 401(k) Plan were $0.8 million and $1.9 million for the years ended December 31, 2017 and 2015, respectively.
In connection with the Rockwater Merger the Company maintains a separate 401(k) Plan for U.S. employees (the “Rockwater 401(k) Plan”) and a Registered Retirement Savings Plans for Canadian employees for specified eligible Rockwater employees. The Company made employer contributions either at their discretion or as a matching percentage, as defined by the respective plan agreements. The Company made $0.1 million in employer contributions to the Rockwater 401(k) Plan for the year ended December 31, 2017.
Revenue recognition: The Company recognizes revenue when it is realized or realizable and earned. Revenues are considered realized or realizable and earned when: (i) persuasive evidence of an arrangement exists, (ii) delivery has occurred or services have been rendered, (iii) the seller’s price to the buyer is fixed or determinable and (iv) collectability is reasonably assured. Services are typically priced on a throughput, day‑rate, hourly‑rate or per‑job basis depending on the type of services provided. The Company’s services are generally governed by a service agreement or other persuasive evidence of an arrangement that include fixed or determinable fees and do not generally include right of return provisions or other significant post‑delivery obligations. Collectability is reasonably assured based on the establishment of appropriate credit qualification prior to services being rendered. Revenue generated by each of the Company’s revenue streams are outlined as follows:
Water Solutions and Related Services—The Company provides water‑related services to customers, including the sourcing and transfer of water, the containment of fluids, measuring and monitoring of water, the filtering and treatment of fluids, well testing and handling, transportation and recycling or disposal of fluids. Operating under Rockwater LLC, the Company also offers sand hauling and logistics services in the Rockies and Bakken regions as well as water transfer, containment and fluids hauling in Western Canada. Revenue from water solutions is primarily based on a per‑barrel price or other throughput metric as specified in the contract. The Company recognizes revenue from water solutions when services are performed.
The Company’s agreements with its customers are often referred to as “price sheets” and sometimes provide pricing for multiple services. However, these agreements generally do not authorize the performance of specific services or provide for guaranteed throughput amounts. As customers are free to choose which services, if any, to use based on the Company’s price sheet, the Company prices its separate services on the basis of their standalone selling prices. Customer agreements generally do not provide for performance‑, cancellation‑, termination‑, or refund‑type provisions. Services based on price sheets with customers are generally performed under separately‑issued “work orders” or “field tickets” as services are requested. Of the Company’s Water Solutions service lines, only sourcing and transfer of water are consistently provided as part of the same arrangement. In these instances, revenue for both sourcing and transfer are recognized concurrently when delivered.
Accommodations and Rentals—The Company provides workforce accommodations and surface rental equipment. Accommodation services include trailer housing and mobile home units for field personnel. Equipment rentals are related to the accommodations and include generators, sewer and water tanks and communication systems. Revenue from accommodations and equipment rental is typically recognized on a day-rate basis.
F-15
Wellsite Completion and Construction Services—The Company provides crane and logistics services, wellsite and pipeline construction and field services. Revenue for heavy-equipment rental is typically recognized on a day-rate basis. Construction or field personnel revenue is based on hourly rates or on a per-job basis as services are performed.
Oilfield Chemical Product Sales—The Company develops, manufactures and markets a full suite of chemicals utilized in hydraulic fracturing, stimulation, cementing and well completions, including polymers that create viscosity, crosslinkers, friction reducers, surfactants, buffers, breakers and other chemical technologies, to leading pressure pumping service companies in the United States. The Company also provides production chemicals solutions, which are applied to underperforming wells in order to enhance well performance and reduce production costs through the use of production treating chemicals, corrosion and scale monitoring, chemical inventory management, well failure analysis and lab services.
Oilfield Chemicals products are generally sold under sales agreements based upon purchase orders or contracts with customers that do not include right of return provisions or other significant post‑delivery obligations. The Company’s products are produced in a standard manufacturing operation, even if produced to the customer’s specifications. The prices of products are fixed and determinable and are established in price lists or customer purchases orders. The Company recognizes revenue from product sales when title passes to the customer, the customer assumes risks and rewards of ownership, collectability is reasonably assured and delivery occurs as directed by the customer.
Equity‑based compensation: The Company accounts for equity‑based awards by measuring the awards at the date of grant and recognizing the grant‑date fair value as an expense using either straight‑line or accelerated attribution, depending on the specific terms of the award agreements over the requisite service period, which is usually equivalent to the vesting period. The Company expenses awards with graded‑vesting service conditions on a straight‑line basis.
The Company had liability awards that were contingent upon meeting certain equity returns and a liquidation event. These awards were settled in cash during the year ended December 31, 2017. See Note 10—Equity‑based Compensation for further discussion.
Foreign currency: The Company’s functional currency is the U.S. dollar. The Company has Canadian subsidiaries that have designated the Canadian dollar as their functional currency. Assets and liabilities are translated at period-end exchange rates, while revenues and expenses are translated at average rates for the period. The Company follows a practice of settling its intercompany loans; accordingly, the related translation gains and losses are recognized within foreign currency gains (losses) on the accompanying consolidated statements of comprehensive income (loss). Translation adjustments for the asset and liability accounts are included as a separate component of accumulated other comprehensive loss in shareholders’ equity. During the year ended December 31, 2017, the Company incurred foreign currency translation gains of $0.3 million, due to a Canadian subsidiary acquired through Rockwater Merger. During the years ended December 31, 2016 and 2015, the Company did not record foreign currency translations gains or losses.
Currency transaction gains and losses are recorded on a net basis in other income and expense, net, in the accompanying consolidated statements of operations. During the year ended December 31, 2017, the Company reported net foreign currency gains of $0.3 million. During the year ended December 31, 2016 and 2015, the Company did not record foreign currency transaction gains or losses.
Derivatives and hedging: The Company accounts for certain interest rate swaps as cash flow hedges. Management formally assesses both at the hedge’s inception and on an ongoing basis that the derivative will be highly effective in offsetting changes in cash flows of the related hedged items. The fair values of the derivatives are recognized as either assets or liabilities in the consolidated balance sheets. The effective portions of the changes in fair values of the derivative contracts are initially recorded in accumulated other comprehensive income and reclassified into the statement of operations in the period in which earnings are impacted by the hedged items or in the period that the transaction no longer qualifies as a cash flow hedge. The ineffective portion of the gains or losses on the derivative contracts, if any, is recognized in the consolidated statement of operations as it is incurred. See Note 11—Derivative Financial Instruments for further discussion.
F-16
Fair value measurements: The Company measures certain assets and liabilities pursuant to accounting guidance which establishes a three‑tier fair value hierarchy and prioritizes the inputs used in measuring fair value. Level 1 inputs are unadjusted quoted prices in active markets for identical assets or liabilities. Level 2 inputs are quoted prices or other market data for similar assets and liabilities in active markets, or inputs that are observable for the asset or liability, either directly or indirectly through market corroboration, for substantially the full term of the asset or liability. Level 3 inputs are unobservable inputs based upon its own judgment and assumptions used to measure assets and liabilities at fair value. See Note 12—Fair Value Measurement for further discussion.
Income taxes: Select Inc. is subject to U.S. federal, foreign and state income taxes as a corporation. SES Holdings and its subsidiaries, with the exception of certain corporate subsidiaries, are treated as flow‑through entities for U.S. federal income tax purposes and as such, are generally not subject to U.S. federal income tax at the entity level. Rather, the tax liability with respect to their taxable income is passed through to their members or partners. Accordingly, prior to the reorganization in connection with the Select 144A Offering, the Predecessor only recorded a provision for Texas franchise tax and U.S. federal and state provisions for certain corporate subsidiaries as the Predecessor’s taxable income or loss was includable in the income tax returns of the individual partners and members. However, for periods following the reorganization in connection with the Select 144A Offering, Select Inc. recognizes a tax liability on its allocable share of SES Holdings’ taxable income. The state of Texas includes in its tax system a franchise tax applicable to the Company and an accrual for franchise taxes is included in the financial statements when appropriate.
The Company and its subsidiaries account for income taxes under the asset and liability method. Under this method, deferred tax assets and liabilities are recognized for the estimated future tax consequences attributable to differences between the financial statement carrying amounts of existing assets and liabilities and their respective tax basis. Deferred tax assets and liabilities are measured using enacted tax rates in effect for the year in which those temporary differences are expected to be recovered or settled pursuant to the provisions of Accounting Standards Codification (“ASC”) 740, Income Taxes. The effect on deferred tax assets and liabilities of a change in tax rate is recognized in earnings in the period that includes the enactment date. Valuation allowances are established when necessary to reduce deferred tax assets to the amounts more likely than not to be realized.
The determination of the provision for income taxes requires significant judgment, use of estimates and the interpretation and application of complex tax laws. Significant judgment is required in assessing the timing and amounts of deductible and taxable items and the probability of sustaining uncertain tax positions. The benefits of uncertain tax positions are recorded in the Company’s financial statements only after determining a more likely than not probability that the uncertain tax positions will withstand challenge, if any, from taxing authorities. When facts and circumstances change, the Company reassesses these probabilities and records any changes through the provision for income taxes. The Company recognizes interest and penalties relating to uncertain tax provisions as a component of tax expense. The Company identified no material uncertain tax positions as of December 31, 2017 and 2016. See Note 14—Income Taxes for further discussion.
Discontinued operations: During the years ended December 31, 2017 and 2016, there were no activities or cash flows related to discontinued operations.
During the year ended December 31, 2015, the Company completed the liquidation of certain Canadian subsidiaries disposed of during 2014. The results of operations related to discontinued operations consisted of other (income) expense, net in the amount of less than $0.1 million within the consolidated statement of operations for the year ended December 31, 2015.
F-17
The cash flows from discontinued operations were as follows:
|
|
|
Year Ended |
|
|
|
|
December 31, 2015 |
|
|
|
|
(in thousands) |
|
|
Net cash provided by operating activities |
|
$ |
400 |
|
Net cash provided by investing activities |
|
|
679 |
|
Net cash used in financing activities |
|
|
(1,678) |
|
Effect of exchange rate changes on cash |
|
|
75 |
|
Net decrease in cash |
|
$ |
(524) |
Emerging Growth Company status: Under the Jumpstart Our Business Startups Act of 2012 (the “JOBS Act”), the Company is an “emerging growth company,” or an “EGC,” which allows the Company to have an extended transition period for complying with new or revised accounting standards pursuant to Section 107(b) of the JOBS Act. The Company intends to take advantage of all of the reduced reporting requirements and exemptions, including the longer phase‑in periods for the adoption of new or revised financial accounting standards under Section 107 of the JOBS Act until the Company is no longer an emerging growth company. The Company’s election to use the phase‑in periods permitted by this election may make it difficult to compare the Company’s financial statements to those of non‑emerging growth companies and other emerging growth companies that have opted out of the longer phase‑in periods under Section 107 of the JOBS Act and who will comply with new or revised financial accounting standards. If the Company was to subsequently elect to immediately comply with these public company effective dates, such election would be irrevocable pursuant to Section 107 of the JOBS Act.
Recent accounting pronouncements: In May 2014, the Financial Accounting Standards Board (the “FASB”) issued an accounting standards update (“ASU”) on a comprehensive new revenue recognition standard that will supersede ASC 605, Revenue Recognition. ASU 2014-09, Revenue from Contracts with Customers, creates a framework under which an entity will allocate the transaction price to separate performance obligations and recognize revenue when each performance obligation is satisfied. Under the new standard, entities will be required to use judgment and make estimates, including identifying performance obligations in a contract, estimating the amount of variable consideration to include in the transaction price, allocating the transaction price to each separate performance obligation and determining when an entity satisfies its performance obligations. The standard allows for either “full retrospective” adoption, meaning that the standard is applied to all of the periods presented with a cumulative catch‑up as of the earliest period presented, or “modified retrospective” adoption, meaning the standard is applied only to the most current period presented in the financial statements with a cumulative catch‑up as of the current period. In August 2015, the FASB decided to defer the original effective date by one year to be effective for annual reporting periods beginning after December 15, 2018, and interim reporting periods within annual reporting periods beginning after December 15, 2019 for emerging growth companies. In accordance with the JOBS Act the Company is afforded the extended transition period and are not required to adopt the ASU until January 1, 2019. The Company is currently evaluating whether the adoption of the ASU will have a material impact that on its consolidated financial statements and related disclosures, and internal controls over financial reporting and has not yet determined the method by which it will adopt the standard.
In July 2015, the FASB issued ASU No. 2015-11, Inventory (Topic 330): Simplifying the Measurement of Inventory, which provides that an entity that measures inventory by using first-in, first-out or average cost should measure inventory at the lower of cost and net realizable value, rather than at the lower of cost or market. Net realizable value is the estimated selling prices of such inventory in the ordinary course of business, less reasonably predictable costs of completion, disposal and transportation. As an EGC utilizing the extended transition period for new accounting pronouncements, the requirements in this update are effective during annual periods beginning after December 15, 2016, and interim periods within fiscal years beginning after December 15, 2017. The amendments in this update should be applied prospectively with earlier application permitted as of the beginning of an interim or annual reporting period. The Company prospectively adopted this guidance during the year ended December 31, 2017. The adoption of this update did not have a material impact on the Company's consolidated financial statements.
In November 2015, the FASB issued ASU 2015-17, Balance Sheet Classification of Deferred Taxes, which amends existing guidance on income taxes to require the classification of all deferred tax assets and liabilities as
F-18
noncurrent on the balance sheet. As an EGC utilizing the extended transition period for new accounting pronouncements, this pronouncement is effective for annual reporting periods beginning after December 15, 2017, and interim periods within annual periods beginning after December 15, 2018, and may be applied either prospectively or retrospectively. The Company adopted this guidance during the year ended December 31, 2017. As the Company’s deferred tax assets and liabilities are all noncurrent, the adoption did not result in a change to the consolidated financial statements and related disclosures.
In February 2016, the FASB issued ASU 2016-02, Leases, which introduces a lessee model that brings most leases on the balance sheet. The new standard also aligns many of the underlying principles of the new lessor model with those in the current accounting guidance as well as the FASB’s new revenue recognition standard. However, the ASU eliminates the use of bright‑line tests in determining lease classification as required in the current guidance. The ASU also requires additional qualitative disclosures along with specific quantitative disclosures to better enable users of financial statements to assess the amount, timing and uncertainty of cash flows arising from leases. As an EGC utilizing the extended transition period for new accounting pronouncements, this pronouncement is effective for annual reporting periods beginning after December 15, 2019, and interim periods within fiscal years beginning after December 15, 2020, using a modified retrospective approach. Early adoption is permitted. The Company is currently evaluating the impact that the new accounting guidance will have on its consolidated financial statements and related disclosures.
In March 2016, the FASB issued ASU 2016-09, Improvements to Employee Share-Based Payment Accounting, which is intended to simplify several aspects of the accounting for share‑based payment award transactions. As an EGC utilizing the extended transition period for new accounting pronouncements, this pronouncement is effective for annual reporting periods beginning after December 15, 2017, and interim periods within fiscal years beginning after December 15, 2018. Certain amendments in this update should be applied prospectively, while other amendments in the update should be applied retrospectively, with earlier adoption permitted in any interim or annual period. If the Company adopts the amendments in an interim period, any adjustments should be reflected as of the beginning of the fiscal year that includes the interim period. If the Company were to elect to early adopt, then the Company must adopt all the amendments in the same period. The Company is currently evaluating the impact that the new accounting guidance will have on its consolidated financial statements and related disclosures.
In August 2016, the FASB issued ASU 2016-15, Classification of Certain Cash Receipts and Cash Payments, which addresses the classification and presentation of eight specific cash flow issues that currently result in diverse practices. The amendments provide guidance in the presentation and classification of certain cash receipts and cash payments in the statement of cash flows including debt prepayment or debt extinguishment costs, settlement of zero‑coupon debt instruments, contingent consideration payments made after a business combination, proceeds from the settlement of insurance claims, proceeds from the settlement of corporate‑owned life insurance policies and distributions received from equity method investees. As an EGC utilizing the extended transition period for new accounting pronouncements, this pronouncement is effective for annual reporting periods beginning after December 15, 2018, and interim periods within fiscal years beginning after December 15, 2019. The amendments in this ASU should be applied using a retrospective approach. The Company is currently evaluating the impact that the new accounting guidance will have on its consolidated financial statements and related disclosures.
In January 2017, the FASB issued ASU 2017-01, Clarifying the Definition of a Business, with the objective of adding guidance to assist entities with evaluating whether transactions should be accounted for as acquisitions (or disposals) of assets or businesses. As an EGC utilizing the extended transition period for new accounting pronouncements, this pronouncement is effective for annual reporting periods beginning after December 15, 2018, and interim periods within fiscal years beginning after December 15, 2019. The amendments in this ASU should be applied prospectively. The Company is currently evaluating the impact that the new accounting guidance will have on its consolidated financial statements and related disclosures.
In January 2017, the FASB issued ASU 2017-04, Simplifying the Test for Goodwill Impairment. This pronouncement removes Step 2 of the goodwill impairment test, which requires a hypothetical purchase price allocation. A goodwill impairment will now be the amount by which a reporting unit’s carrying value exceeds its fair value, not to exceed the carrying amount of goodwill. As an EGC utilizing the extended transition period for new accounting pronouncements, this pronouncement is effective for annual reporting periods beginning after December 15, 2019, and
F-19
interim periods within fiscal years beginning after December 15, 2019. The amendments in this ASU should be applied prospectively. The Company is currently evaluating the impact that the new accounting guidance will have on its consolidated financial statements and related disclosures.
In May 2017, the FASB issued ASU 2017-09, Scope of Modification Accounting. This pronouncement provides guidance about which changes to the terms and conditions of a share-based payment award require an entity to apply modification accounting in ASC 718. As an EGC utilizing the extended transition period for new accounting pronouncements, this pronouncement is effective for annual reporting periods beginning after December 15, 2017, and interim periods within fiscal years beginning after December 15, 2017. Early adoption is permitted, including adoption in any interim period. The pronouncement should be applied prospectively to an award modified on or after the adoption date. The Company is currently evaluating the impact that the new accounting guidance will have on its consolidated financial statements and related disclosures.
NOTE 3—ACQUISITIONS
Business combinations
Rockwater Merger
On November 1, 2017, the Company completed the Rockwater Merger in which the Company combined with Rockwater. Rockwater is a provider of comprehensive water management solutions and oilfield chemicals to the oil and gas industry in the United States and Canada. The complementary nature of Rockwater’s business operations will create a leading pre-frac and water solutions company across all major U.S. unconventional basins.
Total consideration was $620.2 million based on the closing price of the Company’s shares of Class A Common Stock on November 1, 2017. Consideration transferred consisted of shares of Class A Common Stock, shares of Class A-2 Common Stock, shares of Class B Common Stock, and SES Holdings LLC Units. Consideration transferred also included the Company’s previously held interest in Rockwater, which was acquired as consideration in a sale of assets by Select’s predecessor to Rockwater’s predecessor in 2008 prior to the contribution of those assets to Rockwater and the related conversion of the ownership interests received by Select’s predecessor to ownership interests in Rockwater in 2011, and the fair value of Rockwater’s replaced share-based payments attributed to pre-acquisition service. In addition, the Company’s pre-merger interest in Rockwater was cancelled pursuant to the merger agreement. The pre-merger interest in Rockwater was previously included in other assets in the consolidated balance sheet. It was remeasured to a fair value of $2.3 million, which resulted in a gain of $1.2 million recognized in the fourth quarter of 2017 in other income in the consolidated statement of operations. For the year ended December 31, 2017, the Company expensed $8.9 million of transaction-related costs which are included in selling, general and administrative within the consolidated statement of operations.
The Rockwater Merger was accounted for as a business combination under the acquisition method of accounting. The preliminary allocation of the consideration transferred is based on management’s estimates, judgments and assumptions and are subject to change with the final valuation. This preliminary allocation is subject to being adjusted in the twelve-month period following the transaction date, reflecting significant new information that may be obtained in the future about facts and circumstances that existed as of the transaction date that, if known, would have affected the measurement of the amounts initially recognized. The final allocation of purchase consideration could include changes in the estimated fair value of working capital, property and equipment, intangible assets, other long-term assets, deferred tax liabilities and other long-term liabilities. Adjustments in the purchase price allocation may require a change in the amount allocated to goodwill during the period in which the adjustments are determined.
When determining the fair values of assets acquired and liabilities assumed, management made significant estimates, judgments and assumptions. The Company also engaged third-party valuation experts to assist in the purchase price allocation and the recorded valuation of property and equipment. The Company has received preliminary reports from these experts including estimates, judgments and assumptions for the valuation of the tangible and intangible assets acquired and liabilities assumed. These preliminary reports along with the analysis and expertise of management have formed the basis for the preliminary allocation. Detailed analysis and review of the assets acquired, including confirmation
F-20
of the condition, existence and utility of the assets is currently ongoing. Management believes that the current information provides a reasonable basis for estimating fair values of assets acquired and liabilities assumed. These estimates, judgments and assumptions are subject to change and should be treated as preliminary values as there could be significant changes upon final valuation. Management currently believes that its valuation work and the work of its third party experts will be completed and a final purchase price allocation will be recorded by June 30, 2018. Included in the working capital figure in the table below is accounts receivable acquired with a fair value of $196.9 million, and a gross contractual amount of $199.1 million. The Company expects $2.2 million of the gross contractual amount to be uncollectible. Management estimated that total consideration paid exceeded the fair value of the net assets acquired and liabilities assumed by $247.2 million, which excess was recognized as goodwill. The goodwill recognized was primarily attributable to synergies driven by expanding into new geographies and service offerings, strengthening existing service lines, acquiring an established, trained workforce and expected cost reductions. Goodwill of $231.6 million and $15.6 million was allocated to the Company’s Water Solutions and Oilfield Chemicals segments, respectively.
The following table summarizes the consideration transferred and the estimated fair value of identified assets acquired and liabilities assumed at the date of acquisition:
|
Preliminary purchase price allocation |
|
Amount |
|
|
Consideration transferred |
|
(in thousands) |
|
|
Class A Common Stock (25,914,260 shares) |
|
$ |
423,957 |
|
Class A-2 Common Stock (6,731,845 shares) |
|
|
110,133 |
|
Class B Common Stock (4,356,477 shares) and SES Holdings common units issued (4,356,477 units) |
|
|
71,272 |
|
Fair value of previously held interest in Rockwater |
|
|
2,310 |
|
Fair value of Rockwater share-based awards attributed to pre-acquisition service |
|
|
12,529 |
|
Total consideration transferred |
|
|
620,201 |
|
Less: identifiable assets acquired and liabilities assumed |
|
|
|
|
Working capital |
|
|
146,883 |
|
Property and equipment |
|
|
185,601 |
|
Intangible assets |
|
|
|
|
Customer relationships |
|
|
89,007 |
|
Trademarks and patents |
|
|
31,215 |
|
Non-compete agreements |
|
|
3,810 |
|
Other long-term assets |
|
|
62 |
|
Deferred tax liabilities |
|
|
(408) |
|
Long-term debt |
|
|
(80,555) |
|
Other long-term liabilities |
|
|
(2,650) |
|
Total identifiable net assets acquired |
|
|
372,965 |
|
Goodwill |
|
|
247,236 |
|
Fair value allocated to net assets acquired |
|
$ |
620,201 |
Resource Water Acquisition
On September 15, 2017, the Company completed its acquisition (the “Resource Water Acquisition”) of Resource Water Transfer Services, L.P. and certain other affiliated assets (collectively, “Resource Water”). Resource Water provides water transfer services to E&P operators in West Texas and East Texas. Resource Water’s assets include 24 miles of layflat hose as well as numerous pumps and ancillary equipment required to support water transfer operations. Resource Water has longstanding customer relationships across its operating regions which are viewed as strategic to the Company’s water solutions business.
The total consideration for the Resource Water Acquisition was $9.0 million, with $6.6 million paid in cash and $2.4 million paid in shares of Class A Common Stock valued at $15.17 per share, subject to customary post‑closing adjustments. The Company funded the cash portion of the consideration for the Resource Water Acquisition with $6.6 million of cash on hand. For the year ended December 31, 2017, the Company expensed $0.1 million of related
F-21
transaction-related costs, which are included in selling, general and administrative within the consolidated statement of operations. The Resource Water Acquisition was accounted for as a business combination under the acquisition method of accounting. The preliminary allocation of the consideration transferred was based on management’s estimates, judgments and assumptions. When determining the fair values of assets acquired and liabilities assumed, management made significant estimates, judgments and assumptions. These estimates, judgments and assumptions are subject to change upon final valuation and should be treated as preliminary values. Working capital estimates are based on provisional amounts. Management estimated that total consideration paid exceeded the fair value of the net assets acquired by $1.9 million, which excess was recognized as goodwill. The goodwill recognized was attributable to Resource Water’s assembled workforce as well as synergies related to the Company’s comprehensive water solutions strategy. The goodwill was included in the assets of the Company’s Water Solutions segment. The following table summarizes the consideration transferred and the estimated fair value of identified assets acquired and liabilities assumed at the date of acquisition:
|
Preliminary purchase price allocation |
|
Amount |
|
|
Consideration transferred |
|
(in thousands) |
|
|
Cash paid(1) |
|
$ |
6,586 |
|
Class A Common Stock (156,909 shares) |
|
|
2,380 |
|
Total consideration transferred |
|
|
8,966 |
|
Less: identifiable assets acquired and liabilities assumed |
|
|
|
|
Working capital(1) |
|
|
1,189 |
|
Fixed assets |
|
|
3,485 |
|
Customer relationship intangible assets(1) |
|
|
1,933 |
|
Other intangible assets(1) |
|
|
465 |
|
Total identifiable net assets acquired |
|
|
7,072 |
|
Goodwill |
|
|
1,894 |
|
Fair value allocated to net assets acquired |
|
$ |
8,966 |
|
(1) |
The Company obtained additional information related to the working capital, customer relationship intangible assets and other intangible assets balances which led to a decrease of $0.2 million, an increase of less than $0.1 million and a decrease of less than $0.1 million, respectively. The cash paid was also reduced by $0.1 million when finalizing the purchase price. The combined impact of these changes resulted in a corresponding increase of less than $0.1 million in goodwill. |
GRR Acquisition
On March 10, 2017, the Company completed its acquisition (the “GRR Acquisition”) of Gregory Rockhouse Ranch, Inc. and certain other affiliated entities and assets (collectively, the “GRR Entities”). The GRR Entities provide water and water‑related services to E&P companies in the Permian Basin and own and have rights to a vast array of fresh, brackish and effluent water sources with access to significant volumes of water annually and water transport infrastructure, including over 1,200 miles of temporary and permanent pipeline infrastructure and related storage facilities and pumps, all located in the northern Delaware Basin portion of the Permian Basin.
The total consideration for the GRR Acquisition was $59.6 million, subject to customary post-closing adjustments, with $53.0 million paid in cash, $1.1 million in assumed tax liabilities to the sellers and $5.5 million paid in shares of Class A Common Stock valued at $20.00 per share. The Company funded the cash portion of the consideration for the GRR Acquisition with $19.0 million of cash on hand and $34.0 million of borrowings under the Company’s Previous Credit Facility (as defined and discussed in Note 8). For the year ended December 31, 2017, the Company expensed $1.0 million of transaction-related costs which are included in selling, general and administrative expenses within the consolidated statement of operations. The GRR Acquisition was accounted for as a business combination under the acquisition method of accounting. When determining the fair values of assets acquired and liabilities assumed, management made significant estimates, judgments and assumptions. Management estimated that consideration paid exceeded the fair value of the net assets acquired. Therefore, goodwill of $12.0 million was recorded. The goodwill recognized was primarily attributable to synergies related to the Company’s comprehensive water solutions strategy that are expected to arise from the GRR Acquisition and was attributable to the Company’s Water Solutions segment. The
F-22
assets acquired and liabilities assumed and the results of operations of the acquired business are included in the Company’s Water Solutions segment.
The following table summarizes the consideration transferred and the estimated fair value of identified assets acquired and liabilities assumed at the date of acquisition:
|
Purchase price allocation |
|
Amount |
|
|
Consideration transferred |
|
(in thousands) |
|
|
Cash paid (1) |
|
$ |
53,032 |
|
Class A Common Stock (274,998 shares) |
|
|
5,500 |
|
Assumed liabilities(1) |
|
|
1,106 |
|
Total consideration transferred |
|
|
59,638 |
|
Less: identifiable assets acquired and liabilities assumed |
|
|
|
|
Working capital(1) |
|
|
7,728 |
|
Fixed assets |
|
|
13,225 |
|
Customer relationship intangible assets(1) |
|
|
21,484 |
|
Other intangible assets(1) |
|
|
5,152 |
|
Total identifiable net assets acquired |
|
|
47,589 |
|
Goodwill |
|
|
12,049 |
|
Fair value allocated to net assets acquired |
|
$ |
59,638 |
|
(1) |
The Company obtained additional information related to its cash paid, working capital, customer relationship intangible asset, other intangible asset and assumed tax liabilities to the sellers’ balances which led to an increase of $1.7 million, $1.7 million, less than $0.1 million, less than $0.1 million and $1.1 million, respectively. The combined impact of these changes resulted in a corresponding increase of $1.0 million in goodwill. |
The Rockwater Merger contributed revenue and net income of $128.9 million and $4.1 million, respectively, to the results of the Company from the date of acquisition through December 31, 2017. Resource Water Acquisition contributed revenue and net income of $4.6 million and $1.4 million, respectively, to the results of the Company from the date of acquisition through December 31, 2017. The GRR Acquisition contributed revenue and net income of $35.2 million and $3.2 million, respectively, to the consolidated results of the Company from the date of acquisition through December 31, 2017. The following unaudited consolidated pro forma information is presented as if the Rockwater Merger, the GRR Acquisition and the Resource Water Acquisition had occurred on January 1, 2016:
|
|
|
Pro Forma |
||||
|
|
|
Year ended December 31, |
||||
|
|
|
2017 |
|
2016 |
||
|
|
|
(unaudited) |
||||
|
|
|
(in thousands) |
||||
|
Revenue |
|
$ |
1,263,787 |
|
$ |
698,778 |
|
|
|
|
|
|
|
|
|
Net loss |
|
|
(17,069) |
|
|
(375,133) |
|
Less: net loss attributable to noncontrolling interests(1) |
|
|
6,815 |
|
|
153,970 |
|
Net loss attributable to Select Energy Services, Inc.(1) |
|
$ |
(10,254) |
|
$ |
(221,163) |
|
(1) |
The allocation of net loss attributable to noncontrolling interests and Select Inc. gives effect to the equity structure as of December 31, 2017 as though the Select 144A Offering, the IPO, the Rockwater Merger, the Resource Water Acquisition, the GRR Acquisition and other equity transactions occurred as of January 1, 2016. However, the calculation of pro forma net loss does not give effect to any other pro forma adjustments for the Select 144A Offering or the subsequent IPO. |
The unaudited pro forma amounts above have been calculated after applying the Company’s accounting policies and adjusting the Rockwater Merger, GRR Acquisition and Resource Water Acquisition results to reflect the increase to depreciation and amortization that would have been charged assuming the fair value adjustments to property,
F-23
plant and equipment and intangible assets had been applied from January 1, 2016 and other related pro forma adjustments. The pro forma amounts do not include any potential synergies, cost savings or other expected benefits of the Rockwater Merger, the GRR Acquisition or the Resource Water Acquisition, and are presented for illustrative purposes only and are not necessarily indicative of results that would have been achieved if the Rockwater Merger, the GRR Acquisition and the Resource Water Acquisition had occurred as of January 1, 2016 or of future operating performance.
Asset acquisitions
On November 8, 2017 the Company completed the acquisition of fixed assets from Heritage Environmental Services, LLC (the “Solid Oak Flowback Acquisition”) for $4.9 million in cash, funded entirely with cash on hand. On June 21, 2017 the Company completed the acquisition of fixed assets from Tex-Star Water Services, LLC for $4.2 million in cash, funded entirely with cash on hand.
On May 30, 2017 the Company completed the acquisition of automated manifold intellectual property and related assets from Data Automated Water Systems, LLC (the “DAWS Acquisition”) for $4.0 million. This acquisition was paid with $2.0 million of cash and 128,370 shares of Class A Common Stock valued at $2.0 million. The DAWS Acquisition resulted in fixed assets of $1.8 million, patents of $1.9 million and software of $0.3 million.
NOTE 4—EXIT AND DISPOSAL ACTIVITIES
Due to a reduction in industry activity from 2014, the Company made the decision during the year ended December 31, 2016 to close 15 facilities and consolidate operations for the purpose of improving operating efficiencies. The Company recorded $3.6 million of charges related to exit and disposal activities and reclassified $0.2 million of deferred rent related to accrued lease obligations related to exited facilities during the year ended December 31, 2017. The Company had a remaining balance of $22.6 million, inclusive of a short‑term balance of $3.6 million in accrued expenses and other current liabilities, as of December 31, 2017 related to accrued lease obligations and terminations at exited facilities within its Water Solutions segment. The Company acquired abandoned lease obligations of $2.5 million as a result of the Rockwater Merger. As of December 31, 2017, the Company has completed its exit from underperforming facilities but will continue to make non‑cancelable lease payments for related facilities through the year ended 2027. The Company’s abandonment of these facilities is not a part of a formalized exit plan. The changes in the abandoned lease obligations for the years ended December 31, 2017 and 2016 are as follows:
|
|
|
|
|
|
|
|
|
|
|
|
Acquired abandoned |
|
|
|
|
|
|
|
|
|
|
Provision during the |
|
Usage during the |
|
lease obligations |
|
|
|
|||
|
|
|
Balance as of |
|
year ended |
|
year ended |
|
during the year ended |
|
Balance as of |
|||||
|
|
|
December 31, 2016 |
|
December 31, 2017 |
|
December 31, 2017 |
|
December 31, 2017 |
|
December 31, 2017 |
|||||
|
|
|
(in thousands) |
|||||||||||||
|
Lease obligations and terminations |
|
$ |
18,000 |
|
$ |
3,572 |
|
$ |
2,761 |
|
$ |
2,539 |
|
$ |
21,350 |
|
Reclassification of deferred rent |
|
|
1,069 |
|
|
|
|
|
|
|
|
|
|
|
1,254 |
|
Total |
|
$ |
19,069 |
|
|
|
|
|
|
|
|
|
|
$ |
22,604 |
|
|
|
|
|
|
|
|
|
|
|
|
Acquired abandoned |
|
|
|
|
|
|
|
|
|
|
Provision during the |
|
Usage during the |
|
lease obligations |
|
|
|
|||
|
|
|
Balance as of |
|
year ended |
|
year ended |
|
during the year ended |
|
Balance as of |
|||||
|
|
|
December 31, 2015 |
|
December 31, 2016 |
|
December 31, 2016 |
|
December 31, 2016 |
|
December 31, 2016 |
|||||
|
|
|
(in thousands) |
|||||||||||||
|
Lease obligations and terminations |
|
$ |
— |
|
$ |
19,423 |
|
$ |
1,423 |
|
$ |
— |
|
$ |
18,000 |
|
Reclassification of deferred rent |
|
|
— |
|
|
|
|
|
|
|
|
|
|
|
1,069 |
|
Total |
|
$ |
— |
|
|
|
|
|
|
|
|
|
|
$ |
19,069 |
F-24
NOTE 5—INVENTORIES
Inventories, which are comprised of chemicals and materials available for resale and parts and consumables used in operations, are valued at the lower of cost and net realizable value, with cost determined under the weighted-average method. The significant components of inventory are as follows:
|
|
|
As of December 31, |
||||
|
|
|
2017 |
|
2016 |
||
|
|
|
(in thousands) |
||||
|
Raw materials |
|
$ |
11,462 |
|
$ |
— |
|
Finished goods |
|
|
29,674 |
|
|
1,001 |
|
Materials and supplies |
|
|
3,462 |
|
|
— |
|
|
|
|
44,598 |
|
|
1,001 |
NOTE 6—PROPERTY AND EQUIPMENT
Property and equipment consists of the following as of December 31, 2017 and 2016:
|
|
|
As of December 31, |
||||
|
|
|
2017 |
|
2016 |
||
|
|
|
(in thousands) |
||||
|
Land |
|
$ |
15,286 |
|
$ |
8,593 |
|
Buildings and leasehold improvements |
|
|
99,222 |
|
|
83,352 |
|
Vehicles and equipment |
|
|
70,537 |
|
|
24,114 |
|
Vehicles and equipment - capital lease |
|
|
2,810 |
|
|
— |
|
Machinery and equipment |
|
|
716,064 |
|
|
534,303 |
|
Machinery and equipment - capital lease |
|
|
900 |
|
|
— |
|
Computer equipment and software |
|
|
12,822 |
|
|
11,102 |
|
Office furniture and equipment |
|
|
4,320 |
|
|
4,275 |
|
Disposal wells |
|
|
67,805 |
|
|
67,566 |
|
Helicopters |
|
|
497 |
|
|
497 |
|
Construction in progress |
|
|
44,732 |
|
|
5,584 |
|
|
|
|
1,034,995 |
|
|
739,386 |
|
Less accumulated depreciation and impairment |
|
|
(560,886) |
|
|
(490,519) |
|
Total property and equipment, net |
|
$ |
474,109 |
|
$ |
248,867 |
Long‑lived assets are evaluated for impairment whenever events or changes in circumstances indicate that the carrying amount of an asset may not be recoverable. As a result of declines in industry activity, the Company decided to shut‑in certain disposal wells and abandon certain machinery and equipment and facilities at underperforming yards. As a result of these decisions, the Company evaluated the recoverability of the carrying value of certain property and equipment. The Company utilized a variety of methods to determine if the impairment of the asset was necessary. These methods included the use of long‑term forecasts of the future revenues and costs related to the assets subject to review, estimated salvage value and appraisals. For shut‑in disposal wells, long‑term forecasts of the future revenue and costs related to the assets were utilized to determine the impairment. The Company impaired machinery and equipment to its estimated salvage value, while owned buildings and land related to certain abandoned facilities at underperforming yards were impaired to appraisal values. Leasehold improvements related to leased abandoned facilities were fully impaired to the extent the Company determined there was no future value. As a result of these assessments, in 2016 the Company recorded impairment of property and equipment of $60.0 million related to the Company’s Water Solutions segment. As a result of the annual impairment assessment, no impairment loss was recorded in 2017.
As a result of the Rockwater Merger, the Company acquired various capital leases for certain vehicles, machinery and equipment that expire at various dates during the next five years. Depreciation of assets held under capital lease for the year ended December 31, 2017 was $0.2 million and is included in depreciation and amortization expense in the accompanying consolidated statements of operations. The Company had no capital lease obligations as of December 31, 2016.
F-25
NOTE 7—GOODWILL AND OTHER INTANGIBLE ASSETS
Goodwill is evaluated for impairment on at least an annual basis, or more frequently if indicators of impairment exist. As a result of triggering events during 2015, the Company conducted its goodwill impairment test as of September 30, 2015 and recognized the impairment presented below. The Company determined that additional triggering events were present during the first half of 2016 resulting in an additional impairment assessment also as indicated below. The Company performed its annual goodwill impairment test in the fourth quarter of 2017. The annual impairment tests are based on Level 3 inputs. The changes in the carrying amounts of goodwill by reportable segment for the years ended December 31, 2017 and 2016 are as follows:
|
|
|
|
|
|
|
|
|
|
|
|
|
|
|
|
|
Water |
|
Oilfield |
|
Wellsite |
|
|
|
|||
|
|
|
Solutions |
|
Chemicals |
|
Services |
|
Total |
||||
|
|
|
(in thousands) |
||||||||||
|
Balance as of December 31, 2015 |
|
$ |
137,534 |
|
$ |
— |
|
$ |
13,237 |
|
$ |
150,771 |
|
Impairment |
|
|
(137,534) |
|
|
— |
|
|
(995) |
|
|
(138,529) |
|
Balance as of December 31, 2016 |
|
|
— |
|
|
— |
|
|
12,242 |
|
|
12,242 |
|
Additions |
|
|
245,542 |
|
|
15,637 |
|
|
— |
|
|
261,179 |
|
Balance as of December 31, 2017 |
|
$ |
245,542 |
|
$ |
15,637 |
|
$ |
12,242 |
|
$ |
273,421 |
The components of other intangible assets as of December 31, 2017 and 2016 are as follows:
|
|
|
As of December 31, 2017 |
|
As of December 31, 2016 |
||||||||||||||||||||||
|
|
|
Gross |
|
Accumulated |
|
Net |
|
Gross |
|
Accumulated |
|
Net |
||||||||||||||
|
|
|
Value |
|
Amortization |
|
Value |
|
Value |
|
Amortization |
|
Value |
||||||||||||||
|
|
|
(in thousands) |
|
(in thousands) |
||||||||||||||||||||||
|
Customer relationships |
$ |
169,250 |
$ |
57,836 |
$ |
111,414 |
$ |
56,826 |
$ |
48,236 |
$ |
8,590 |
||||||||||||||
|
Patents and trademarks |
|
|
33,544 |
|
|
414 |
|
|
33,130 |
|
|
369 |
|
|
142 |
|
|
227 |
||||||||
|
Other |
|
|
14,704 |
|
|
3,182 |
|
|
11,522 |
|
|
5,122 |
|
|
2,353 |
|
|
2,769 |
||||||||
|
Total other intangible assets |
|
$ |
217,498 |
|
$ |
61,432 |
|
$ |
156,066 |
|
$ |
62,317 |
|
$ |
50,731 |
|
$ |
11,586 |
||||||||
Intangibles obtained through acquisitions are initially recorded at estimated fair value based on preliminary information that is subject to change until final valuations are obtained. Customer relationships and non‑compete agreements are being amortized over estimated useful lives ranging from five to thirteen years and two to five years, respectively. Other intangible assets primarily relate to certain water rights and patents that are amortized over estimated useful lives ranging from three to ten years.
The Company had $5.3 million and $1.6 million in indefinite-lived water rights as of December 31, 2017 and 2016, respectively. The Company had $23.4 million in indefinite-lived trademarks as of December 31, 2017. No indefinite-lived trademarks were recorded as of December 31, 2016. Indefinite-lived water rights are included within the other component in the tables above. Indefinite-lived trademarks are included in the patents and trademarks component in the table above.
As a result of the Rockwater Merger, the Company obtained customer relationships, patents and non-compete agreements that will be amortized over estimated useful lives of thirteen, ten and three years, respectively, with a weighted-average estimated useful life of 12.4 years. The Company also obtained trademarks totaling $23.4 million that have indefinite lives and will be evaluated periodically for impairment. See Note 3—Acquisitions for further discussion.
F-26
Intangible assets obtained in the GRR Acquisition consisted of customer relationships and non-compete agreements that are being amortized over estimated useful lives of thirteen and five years, respectively, with a weighted-average estimated useful life of 12.5 years. As a result of the GRR Acquisition, the Company also obtained water rights totaling $3.7 million that have indefinite lives and will be evaluated periodically for impairment. Intangible assets obtained in the Resource Water Acquisition consisted of customer relationships and non-compete agreements that are being amortized over estimated useful lives of ten and three years, respectively, with a weighted-average estimated useful life of 8.6 years. See Note 3—Acquisitions for further discussion.
The Company acquired patents of $1.9 million as part of the DAWS Acquisition, which are being amortized over the estimated useful lives of ten years. See Note 3—Acquisitions for further discussion.
Amortization expense of $10.7 million, $8.7 million and $9.3 million was recorded for the years ended December 31, 2017, 2016 and 2015, respectively. Annual amortization of intangible assets for the next five years and beyond is as follows:
|
Year Ending December 31, |
|
Amount |
|
|
|
|
(in thousands) |
|
|
2018 |
|
$ |
13,028 |
|
2019 |
|
|
11,587 |
|
2020 |
|
|
11,268 |
|
2021 |
|
|
10,111 |
|
2022 |
|
|
9,898 |
|
Thereafter |
|
|
71,458 |
NOTE 8—DEBT
Credit facility and revolving line of credit
Select LLC’s previous credit facility (the “Previous Credit Facility”), originally executed in May 2011, has been amended over time. Effective December 20, 2016, the Company amended its Previous Credit Facility to extend the maturity date from February 28, 2018 to February 28, 2020 and reduce the revolving line of credit to $100.0 million. On November 1, 2017, in connection with the Closing (defined below), Select LLC entered into the Credit Agreement (defined below), the obligations of SES Holdings and the Borrower under the Previous Credit Facility were repaid in full and the Previous Credit Facility was terminated.
On November 1, 2017, in connection with the closing of the Rockwater Merger (the “Closing”), SES Holdings and Select LLC, a wholly owned subsidiary of SES Holdings (the “Borrower”), entered into a $300.0 million senior secured revolving credit facility (the “Credit Agreement”), by and among SES Holdings, as parent, Select LLC, as Borrower and certain of SES Holdings’ subsidiaries, as guarantors, each of the lenders party thereto and Wells Fargo Bank, N.A., as administrative agent, issuing lender and swingline lender (the “Administrative Agent”). The Credit Agreement also has a sublimit of $40.0 million for letters of credit and a sublimit of $30.0 million for swingline loans. Subject to obtaining commitments from existing or new lenders, the Company has the option to increase the maximum amount under the Credit Agreement by $150.0 million during the first three years following the closing. The maturity date of the Credit Agreement is the earlier of (a) November 1, 2022, and (b) the earlier termination in whole of the Commitments pursuant to Section 2.1(b) or Article VII of the Credit Agreement.
The Credit Agreement permits extensions of credit up to the lesser of $300.0 million and a borrowing base that is determined by calculating the amount equal to the sum of (i) 85% of the Eligible Billed Receivables (as defined in the Credit Agreement), plus (ii) 75% of Eligible Unbilled Receivables (as defined in the Credit Agreement), provided that this amount will not equal more than 35% of the borrowing base, plus (iii) the lesser of (A) the product of 70% multiplied by the value of Eligible Inventory (as defined in the Credit Agreement) at such time and (B) the product of 85% multiplied by the Net Recovery Percentage (as defined in the Credit Agreement) identified in the most recent Acceptable Appraisal of Inventory (as defined in the Credit Agreement), multiplied by the value of Eligible Inventory at such time, provided that this amount will not equal more than 30% of the borrowing base, minus (iv) the aggregate
F-27
amount of Reserves (as defined in the Credit Agreement), if any, established by the Administrative Agent from time to time, including, if any, the amount of the Dilution Reserve (as defined in the Credit Agreement). The borrowing base is calculated on a monthly basis pursuant to a borrowing base certificate delivered by the Borrower to the Administrative Agent.
Borrowings under the Credit Agreement bear interest, at Select LLC’s election, at either the (a) one-, two-, three- or six-month LIBOR (“Eurocurrency Rate”) or (b) the greatest of (i) the federal funds rate plus 0.5%, (ii) the one-month Eurocurrency Rate plus 1% and (iii) the Administrative Agent’s prime rate (the ”Base Rate”), in each case plus an applicable margin, and interest shall be payable monthly in arrears. The applicable margin for Eurocurrency Rate loans ranges from 1.50% to 2.00% and the applicable margin for Base Rate loans ranges from 0.50% to 1.00%, in each case, depending on Select LLC’s average excess availability under the Credit Agreement. The applicable margin for Eurocurrency Rate loans will be 1.75% and the applicable margin for Base Rate loans will be 0.75% until June 30, 2018. During the continuance of a bankruptcy event of default, automatically and during the continuance of any other default, upon the Administrative Agent’s or the required lenders’ election, all outstanding amounts under the Credit Agreement will bear interest at 2.00% plus the otherwise applicable interest rate.
|
Level |
|
Average Excess Availability |
|
Base Rate Margin |
|
Eurocurrency Rate Margin |
|
|
|
|
|
|
|
|
|
I |
|
< 33% of the commitments |
|
1.00% |
|
2.00% |
|
II |
|
< 66.67% of the commitments and ≥ 33.33% of the commitments |
|
0.75% |
|
1.75% |
|
III |
|
≥ 66.67% of the commitments |
|
0.50% |
|
1.50% |
|
Level |
|
Average Revolver Usage |
|
Unused Line Fee Percentage |
|
|
|
|
|
|
|
I |
|
≥ 50% of the commitments |
|
0.250% |
|
II |
|
< 50% of the commitments |
|
0.375% |
The obligations under the Credit Agreement are guaranteed by SES Holdings and certain of the subsidiaries of SES Holdings and Select LLC and secured by a security interest in substantially all of the personal property assets of SES Holdings, Select LLC and their domestic subsidiaries.
The Credit Agreement contains certain customary representations and warranties, affirmative and negative covenants and events of default. If an event of default occurs and is continuing, the lenders may declare all amounts outstanding under the Credit Agreement to be immediately due and payable.
In addition, the Credit Agreement restricts SES Holdings’ and Select LLC’s ability to make distributions on, or redeem or repurchase, its equity interests, except for certain distributions, including distributions of cash so long as, both at the time of the distribution and after giving effect to the distribution, no default exists under the Credit Agreement and either (a) excess availability at all times during the preceding 30 consecutive days, on a pro forma basis and after giving effect to such distribution, is not less than the greater of (1) 25% of the lesser of (A) the maximum revolver amount and (B) the then-effective borrowing base and (2) $37.5 million or (b) if SES Holdings’ fixed charge coverage ratio is at least 1.0 to 1.0 on a pro forma basis, and excess availability at all times during the preceding 30 consecutive days, on a pro forma basis and after giving effect to such distribution, is not less than the greater of (1) 20% of the lesser of (A) the maximum revolver amount and (B) the then-effective borrowing base and (2) $30.0 million. Additionally, the Credit Agreement generally permits Select LLC to make distributions required under its existing Tax Receivable Agreements.
The Credit Agreement also requires SES Holdings to maintain a fixed charge coverage ratio of at least 1.0 to 1.0 at any time availability under the Credit Agreement is less than the greater of (i) 10% of the lesser of (A) the maximum revolver amount and (B) the then-effective borrowing base and (ii) $15.0 million and continuing through and including the first day after such time that availability under the Credit Agreement has equaled or exceeded the greater of
F-28
(i) 10% of the lesser of (A) the maximum revolver amount and (B) the then-effective borrowing base and (ii) $15.0 million for 60 consecutive calendar days.
Certain lenders party to the Credit Agreement and their respective affiliates have from time to time performed, and may in the future perform, various financial advisory, commercial banking and investment banking services for the Company and its affiliates in the ordinary course of business for which they have received and would receive customary compensation. In addition, in the ordinary course of their various business activities, such parties and their respective affiliates may make or hold a broad array of investments and actively trade debt and equity securities (or related derivative securities) and financial instruments (including bank loans) for their own account and for the accounts of their customers, and such investments and securities activities may involve the Company’s securities and/or instruments.
In addition, certain lenders party to the Previous Credit Facility are lenders under the Credit Agreement.
The Company had $75.0 million outstanding under the revolving line of credit as of December 31, 2017 and no debt outstanding as of December 31, 2016. The weighted‑average interest rate of outstanding borrowings under the revolving line of credit was 3.319% as of December 31, 2017. The borrowing capacity under the revolving line of credit was reduced by outstanding letters of credit of $19.8 million and $16.3 million as of December 31, 2017 and 2016, respectively. The Company’s letters of credit have a variable interest rate between 1.50% and 2.00% based on the Company’s average excess availability as outlined above. The unused portion of the available borrowings under the Credit Agreement was $167.3 million at December 31, 2017.
Debt issuance costs are amortized to interest expense over the life of the debt to which they pertain. In connection with the entry into the Credit Agreement, the Company incurred $3.4 million of debt issuance cost during the year ended December 31, 2017. In connection with amending its Previous Credit Facility, the Company incurred $4.5 million and $1.2 million of debt issuance costs during the years ended December 31, 2016 and 2015, respectively. The Company wrote off unamortized debt issuance cost related to its Previous Credit Facility of $2.9 million in connection with entry into the Credit Agreement. Total unamortized debt issuance costs as of December 31, 2017 and 2016 were $3.3 million and $3.9 million, respectively. As these debt issuance costs relate to a revolving line of credit, they are presented as a deferred charge within other assets on the consolidated balance sheet.
The Company was in compliance with all debt covenants as of December 31, 2017.
F-29
NOTE 9—COMMITMENTS AND CONTINGENCIES
Operating and capital leases
The Company is party to non‑cancelable leases for operating locations, equipment and office space. The Company also has capital leases for trucks, trailers and equipment. Rent under the operating lease agreements is recognized ratably over the lease term. Total expenses incurred under these operating lease agreements for the years ended December 31, 2017, 2016 and 2015 was $19.2 million, $21.6 million and $39.2 million, respectively. In January 2016 the Company bought out vehicle operating leases at a total purchase price of $16.2 million.
The Company has the following operating and capital lease commitments under non‑cancelable lease terms as of December 31, 2017:
|
Year Ending December 31, |
|
Operating Leases(1) |
|
Capital Leases |
|
Total |
|||
|
|
|
(in thousands) |
|||||||
|
2018 |
|
$ |
24,527 |
|
$ |
2,088 |
|
$ |
26,615 |
|
2019 |
|
|
11,748 |
|
|
1,021 |
|
|
12,769 |
|
2020 |
|
|
10,321 |
|
|
144 |
|
|
10,465 |
|
2021 |
|
|
8,195 |
|
|
89 |
|
|
8,284 |
|
2022 |
|
|
7,569 |
|
|
— |
|
|
7,569 |
|
Thereafter |
|
|
30,824 |
|
|
— |
|
|
30,824 |
|
Total minimum lease payments |
|
$ |
93,184 |
|
|
3,342 |
|
$ |
96,526 |
|
Less: imputed interest of 5.9% |
|
|
|
|
|
(158) |
|
|
|
|
Present value of net minimum capital lease payments |
|
|
|
|
|
3,184 |
|
|
|
|
Less: current portion of capital lease obligations |
|
|
|
|
|
(1,965) |
|
|
|
|
Present value of long-term portion of capital lease obligations |
|
|
|
|
$ |
1,219 |
|
|
|
|
(1) |
The Company’s operating lease commitments under non‑cancelable lease terms as of December 31, 2017 include $29.1 million of lease payments related to facilities that are included within the accrual for exit and disposal activities. Refer to Note 4—Exit and Disposal Activities for further discussion. |
Litigation
The Company is subject to a number of lawsuits and claims arising out of the conduct of its business. The ability to predict the ultimate outcome of such matters involves judgments, estimates and inherent uncertainties. Based on a consideration of all relevant facts and circumstances, including applicable insurance coverage, it is not expected that the ultimate outcome of any currently pending lawsuits or claims against the Company will have a material adverse effect on the consolidated financial position, results of operations or cash flows; however, there can be no assurance as to the ultimate outcome of these matters.
Certain subsidiaries acquired in the Rockwater Merger are under investigation by the U.S Attorney's Office for the Middle District of Pennsylvania and the Environmental Protection Agency. It is alleged that certain employees at some of the facilities altered emissions controls systems on 4% of the vehicles in the fleet in violation of the Clean Air Act. The Company is cooperating with the relevant authorities to resolve the matter. At this time no administrative, civil or criminal changes have been brought against the Company and the Company cannot estimate the possible fines and penalties that may be levied against the Company.
General Business Risk
As discussed in Note 1, the substantial majority of the Company’s customers are in the oil and gas industry. The oil and gas industry is currently facing unique challenges due to the continued volatility and depressed state of oil and gas prices.
F-30
NOTE 10—EQUITY‑BASED COMPENSATION
The SES Holdings 2011 Equity Incentive Plan, (“2011 Plan”) was approved by the Predecessor’s board of managers in April 2011. In conjunction with the Select 144A Offering, the Company adopted the Select Energy Services, Inc. 2016 Equity Incentive Plan (as amended from time to time, the “2016 Plan”) for employees, consultants and directors of the Company and its affiliates. Options that were outstanding under the 2011 Plan immediately prior to the Select 144A Offering were cancelled in exchange for new options granted under the 2016 Plan.
On July 18, 2017, the Select Inc. board of directors approved the First Amendment to the 2016 Plan (the “Equity Plan Amendment”), which clarifies the treatment of substitute awards under the 2016 Plan (including substitute awards that may be granted in connection with the Rockwater Merger) and allows for the assumption by the Company of shares eligible under any pre-existing stockholder-approved plan of an entity acquired by the Company or its affiliate (including the Rockwater Energy Solutions Inc. Amended and Restated 2017 Long Term Incentive Plan (the “Rockwater Equity Plan”)), in each case subject to the listing rules of the stock exchange on which Class A Common Stock is listed. The effectiveness of the Equity Plan Amendment was subject to approval by the Company's stockholders and the consummation of the transactions contemplated by the merger agreement for the Rockwater Merger. The Company’s consenting stockholders, who hold a majority of the outstanding common stock of Select Inc., approved the Equity Plan Amendment on July 18, 2017. The Equity Plan Amendment became effective on November 1, 2017 upon the consummation of the Rockwater Merger.
The maximum number of shares initially reserved for issuance under the 2016 Plan was 5,400,400 shares of Class A Common Stock, subject to adjustment in the event of recapitalization or reorganization, or related to forfeitures or the expiration of awards. Stock options are granted with terms not to exceed ten years. After giving effect to the Equity Plan Amendment, the maximum number of shares of Class A Common Stock reserved for issuance under the 2016 Plan is equal to (i) 5,400,400 shares plus (ii) 1,011,087 shares that became available on account of the assumption of the Rockwater Equity Plan, subject to adjustment in the event of recapitalization or reorganization, or related to forfeitures or the expiration of awards. The maximum number of shares described in the preceding sentence does not take into account 2,879,112 shares of Class A Common Stock related to substitute awards that were granted under the 2016 Plan following the conversion of outstanding equity awards originally granted under the Rockwater Equity Plan in accordance with the merger agreement. For additional information on such substitute awards, please see the “Rockwater Awards Replaced in the Merger” section below.
Phantom unit awards granted under the 2011 Plan, upon vesting, entitled each participant with the right to receive an amount of cash based in part on the fair market value of a share of Class A Common Stock on the date of the IPO. Based on the fair market value of a share of Class A Common Stock of $14.00 on the date of the IPO, each participant received a cash payment equal to $5.53 for each phantom unit on May 5, 2017. Refer to “Phantom Unit Awards” for details related to the payments made in respect of outstanding phantom units in connection with the IPO.
Stock option awards
Stock options were granted with an exercise price equal to or greater than the fair market value of a share of Class A Common Stock as of the date of grant. The Company historically valued Class A Common Stock on a quarterly basis using a market approach that includes a comparison to publicly traded peer companies using earnings multiples based on their market values and a discount for lack of marketability. The fair value measurement relies on Level 3 inputs. The estimated fair value of its stock options is expensed over their vesting period, which is generally three years from the applicable date of grant. However, certain awards that were granted during the year ended December 31, 2016 in exchange for cancelled awards were immediately vested and fully exercisable on the date of grant because they were granted in exchange for the cancellation of outstanding options granted under the 2011 Plan that were fully vested and exercisable prior to such cancellation. The Company utilizes the Black‑Scholes model to determine fair value, which incorporates assumptions to value equity‑based awards. The risk‑free interest rate is based on the U.S. Treasury yield curve in effect for the expected term of the option at the time of grant. At the time of grant, there was no public market for the Company’s equity. Therefore, the Company considered the historic volatility of publicly traded peer companies when determining the volatility factor. The expected life of the options was based on a formula considering the vesting period and term of the options awarded, which is generally seven to ten years.
F-31
The table below presents the assumptions used in determining the fair value of stock options granted during the years ended December 31, 2017 and 2016, respectively. The weighted‑average grant date fair value of stock options granted was $7.85 and $1.84 for the years ended December 31, 2017 and 2016, respectively. There were no stock options granted during the year ended December 31, 2015.
|
|
|
For the year ended December 31, |
||||||
|
|
|
2017 |
|
|
2016 |
|
||
|
Underlying equity |
|
$ |
20.00 |
|
|
$ |
6.08 |
|
|
Strike price |
|
$ |
20.00 |
|
|
$ |
14.33 - 20.61 |
|
|
Dividend yield (%) |
|
|
0.0 |
% |
|
|
0.0 |
% |
|
Risk free rate (%) |
|
|
2.0 - 2.7 |
% |
|
|
0.86 |
% |
|
Volatility (%) |
|
|
46.6 - 46.8 |
% |
|
|
63.0 |
% |
|
Expected term (years) |
|
|
4.0 - 6.0 |
|
|
|
5.0 |
|
A summary of the Company’s stock option activity and related information as of and for the year ended December 31, 2017 is as follows:
|
|
|
For the year ended December 31, 2017 |
|||
|
|
|
|
|
Weighted-average |
|
|
|
|
Stock Options |
|
Exercise Price |
|
|
Beginning balance, outstanding |
|
620,721 |
|
$ |
16.50 |
|
Granted |
|
455,126 |
|
|
20.00 |
|
Forfeited |
|
(113,411) |
|
|
19.48 |
|
Ending balance, outstanding |
|
962,436 |
|
$ |
17.80 |
|
Ending balance, exercisable |
|
412,542 |
|
$ |
14.49 |
Aggregate intrinsic value for stock options is based on the difference between the exercise price of the stock options and the quoted closing Class A Common Stock price of $18.24 as of December 31, 2017. The aggregate intrinsic value of stock options outstanding at December 31, 2017 was $1.5 million, with a weighted-average remaining term of 3.4 years. As of December 31, 2017, the total number of in-the-money stock options exercisable was 412,542. The aggregate intrinsic value of stock options exercisable at December 31, 2017 was $1.5 million, with a weighted-average remaining term of 3.4 years.
The Company recognized $1.9 million, $0.3 million and $0.7 million of compensation expense related to stock options during the years ended December 31, 2017, 2016 and 2015, respectively. As of December 31, 2017, there was $0.9 million of unrecognized equity-based compensation expense related to non-vested stock options. This cost is expected to be recognized over a weighted-average period of 1.5 years.
Restricted stock units
The value of the restricted stock units issued was established by the market price on the date of grant and is being recorded as compensation expense ratably over the vesting term which is generally one to three years from the applicable date of grant. The Company recognized compensation expense of $0.5 million for the year ended December 31, 2017 related to the restricted stock units. No compensation expense was recognized during the years ended December 31, 2016
F-32
and 2015 related to restricted stock units. As of December 31, 2017, there was $0.1 million of unrecognized compensation expense with a weighted-average remaining life of 1.4 years related to unvested restricted stock units.
A summary of the Company’s restricted stock unit activity and related information for the year ended December 31, 2017 is as follows:
|
|
|
For the year ended December 31, 2017 |
|||
|
|
|
|
|
Weighted-average |
|
|
|
|
Restricted Stock |
|
Grant Date Fair Value |
|
|
Beginning balance |
|
— |
|
$ |
— |
|
Granted |
|
41,117 |
|
|
19.91 |
|
Forfeited |
|
(10,757) |
|
|
20.00 |
|
Ending balance |
|
30,360 |
|
$ |
19.88 |
Phantom unit awards
The Company’s phantom unit awards were cash-settled awards that were contingent upon meeting certain equity returns and a liquidation event. The settlement amount was based on the fair market value of a share of Class A Common Stock on the date of completion of the IPO, which constituted a liquidation event with respect to such phantom unit awards. As a result of the cash-settlement feature of these awards, the Company considered these awards to be liability awards, which are measured at fair value at each reporting date and the pro rata vested portion of the award is recognized as a liability to the extent that the performance condition is deemed probable. On May 5, 2017, the Company settled its outstanding phantom unit awards for an aggregate amount equal to $7.8 million as a result of the completion of its IPO, which constituted a liquidity event with respect to such phantom unit awards. Based on the fair market value of a share of Class A Common Stock on the date of the IPO of $14.00, the cash payment with respect to each phantom unit was $5.53, before employer taxes. The Company recognized compensation expense of $7.8 million for the year ended December 31, 2017 related to the settlement of its phantom unit awards. No compensation expense was recognized in 2016 or 2015 due to the non-occurrence of the performance condition, which was not considered probable. As of December 31, 2017, all phantom units have been settled.
Rockwater awards replaced in the merger
Under the merger agreement, all outstanding Rockwater equity-based awards were replaced by the Company and converted into Select Inc.’s equivalent replacement awards. See “Rockwater Merger” at Note 3 – Acquisitions for further discussion. The portion of the replacement award that is attributable to pre-combination service by the employee in the amount of $12.5 million is included in the measure of consideration transferred to acquire Rockwater. The remaining fair value of the replacement awards will be recognized as equity-based compensation expense over the remaining vesting period. Total equity-based compensation expense recognized related to Rockwater’s equity-based awards that were replaced by the Company and converted into Select’s equivalent equity-based awards during the year ended December 31, 2017 was $5.2 million which is included in selling, general and administrative within the consolidated statement of operations.
As of December 31, 2017, there was $6.6 million of unrecognized equity-based compensation expense related to restricted stock awards and non-vested stock options that were replaced as a result of the Rockwater Merger. This cost is expected to be recognized over a weighted-average period of 1.4 years. The total fair value of restricted stock awards that vested during the time from the Rockwater Merger through December 31, 2017 was $0.5 million.
The Company estimated the fair value of the replacement stock options using the Company's common stock price and a Black-Scholes model to estimate the value attributable to the Rockwater equity-based awards converted into Select’s equivalent equity-based awards. The table below presents the assumptions used in determining each equity-based award’s fair value. Volatility was calculated using historical trends of the Company's common stock price.
F-33
|
|
|
Assumptions |
||
|
Underlying equity |
|
$ |
16.36 |
|
|
Strike price |
|
$ |
5.68 - 34.41 |
|
|
Dividend yield (%) |
|
|
0.0 |
% |
|
Risk free rate (%) |
|
|
1.1 - 2.2 |
% |
|
Volatility (%) |
|
|
45.0 |
% |
|
Expected term (years) |
|
|
0.0 - 8.4 |
|
A summary of the Company’s replacement stock option activity and related information as of and for the year ended December 31, 2017 is as follows:
|
|
|
|
|
Weighted-average |
|
|
|
|
Stock Options |
|
Exercise Price |
|
|
Outstanding at November 1, 2017 |
|
2,547,258 |
|
$ |
12.75 |
|
Forfeited |
|
(13,759) |
|
|
18.70 |
|
Outstanding at December 31, 2017 |
|
2,533,499 |
|
$ |
12.74 |
|
Exercisable at December 31, 2017 |
|
1,997,785 |
|
$ |
12.71 |
The weighted‑average fair value of replacement stock options granted during the year ended December 31, 2017 was $7.47.
The aggregate intrinsic value of replacement stock options outstanding as of December 31, 2017 was $14.8 million, with a weighted-average remaining term of 5.2 years. As of December 31, 2017, the total number of in-the-money replacement stock options exercisable was 1,997,785. The aggregate intrinsic value of stock options exercisable as of December 31, 2017 was $11.0 million, with a weighted-average remaining term of 4.5 years.
The replacement restricted stock awards as of and for the year ended December 31, 2017 are as follows:
|
|
|
|
|
Weighted-average |
|
|
|
|
|
Restricted Stock |
|
Fair Value |
|
|
|
Non-vested at November 1, 2017 |
|
331,854 |
|
$ |
16.36 |
|
|
Vested |
|
(32,053) |
|
|
16.36 |
|
|
Non-vested at December 31, 2017 |
|
299,801 |
|
$ |
16.36 |
|
NOTE 11—DERIVATIVE FINANCIAL INSTRUMENTS
The Company had variable rate debt outstanding which was subject to interest rate risk based on volatility in underlying interest rates. In April 2013, the Company entered into a pay fixed, receive variable interest rate swap, with an aggregate notional amount of $125.0 million, which the Company designated as a cash flow hedge. The derivative contract matured in April 2016. There was no activity during the year ended December 31, 2017. The change in value and amounts reclassified to interest expense during the years ended December 31, 2016 and 2015, were nominal. The fair value measurement of the interest rate swap agreement was based on Level 2 inputs. See Note 12—Fair Value Measurement for further discussion. The Company did not have any open derivative instruments as of the years ended December 31, 2017 and 2016.
Changes in the fair values of the Company’s derivative instruments are presented on a net basis in the accompanying consolidated statements of operations. There was no activity for the year ended December 31, 2017.
F-34
Changes in the fair value of the Company’s interest rate swap derivative instruments for the years ended December 31, 2016 and 2015 are as follows:
|
|
|
For the year ended |
|
||||
|
|
|
December 31, |
|
||||
|
Derivatives designated as cash flow hedges |
|
2016 |
|
2015 |
|
||
|
|
|
(in thousands) |
|
||||
|
Beginning fair value of interest rate swap derivative instruments |
|
$ |
(7) |
|
$ |
(68) |
|
|
Amount of unrealized losses recognized in OCI |
|
|
(106) |
|
|
(277) |
|
|
Amount of gains reclassified from AOCI to earnings (effective portion) |
|
|
113 |
|
|
338 |
|
|
Net change in fair value of interest rate swap derivative instruments |
|
|
7 |
|
|
61 |
|
|
Ending fair value of interest rate swap derivative instruments |
|
$ |
— |
|
$ |
(7) |
|
NOTE 12—FAIR VALUE MEASUREMENT
The Company utilizes fair value measurements to measure assets and liabilities in a business combination or assess impairment of property and equipment, intangible assets and goodwill. Fair value is defined as the amount at which an asset (or liability) could be bought (or incurred) or sold (or settled) in an orderly transaction between market participants at the measurement date. Further, ASC 820, Fair Value Measurements, establishes a framework for measuring fair value, establishes a fair value hierarchy based on the quality of inputs used to measure fair value and includes certain disclosure requirements. Fair value estimates are based on either (i) actual market data or (ii) assumptions that other market participants would use in pricing an asset or liability, including estimates of risk.
ASC 820 establishes a three‑level valuation hierarchy for disclosure of fair value measurements. The valuation hierarchy categorizes assets and liabilities measured at fair value into one of three different levels depending on the observability of the inputs employed in the measurement. The three levels are defined as follows:
Level 1—Unadjusted quoted prices for identical assets or liabilities in active markets.
Level 2—Quoted prices for similar assets or liabilities in non‑active markets, and inputs that are observable for the asset or liability, either directly or indirectly, for substantially the full term of the financial instrument.
Level 3—Inputs that are unobservable and significant to the fair value measurement (including the Company’s own assumptions in determining fair value).
A financial instrument’s categorization within the valuation hierarchy is based upon the lowest level of input that is significant to the fair value measurement. The Company’s assessment of the significance of a particular input to the fair value measurement in its entirety requires judgment and considers factors specific to the asset or liability. There were no transfers into, or out of, the three levels of the fair value hierarchy for the years ended December 31, 2017, 2016 and 2015.
Assets and liabilities measured at fair value on a recurring basis
The Company estimated the fair value of derivative instruments using the market approach via a model that uses inputs that are observable in the market or can be derived from, or corroborated by, observable data. See Note 11—Derivatives Financial Instruments for further discussion.
Assets and liabilities measured at fair value on a non‑recurring basis
Nonfinancial assets and liabilities measured at fair value on a non‑recurring basis include certain nonfinancial assets and liabilities as may be acquired in a business combination and measurements of goodwill and intangible
F-35
impairment. As there is no corroborating market activity to support the assumptions used, the Company has designated these measurements as Level 3.
Long‑lived assets, such as property and equipment and finite‑lived intangible assets, are evaluated for impairment whenever events or changes in circumstances indicate that its carrying value may not be recoverable. The development of future cash flows and the estimate of fair value represent the Company’s best estimates based on industry trends and reference to market transactions and are subject to variability.
The Company conducts its annual goodwill impairment test in the fourth quarter each year and whenever impairment indicators arise, by examining relevant events and circumstances which could have a negative impact on its goodwill such as macroeconomic conditions, industry and market conditions, cost factors that have a negative effect on earnings and cash flows, overall financial performance, acquisitions and divestitures, and other relevant entity-specific events. If a qualitative assessment indicates that it is more likely than not that the fair value of a reporting unit is less than its carrying amount, then the Company would be required to perform a quantitative impairment test for goodwill using a two-step approach. In the first step, the fair value of each reporting unit is determined and compared to the reporting unit’s carrying value, including goodwill. To determine the fair value of the reporting unit, the Company uses an income approach, which provides an estimated fair value based on the present value of expected future cash flows. The Company discounts the resulting future cash flows using weighted average cost of capital calculations based on the capital structures of publicly traded peer companies. The Company’s reporting units are based on its organizational and reporting structure.
If the fair value of a reporting unit is less than its carrying value, the second step of the goodwill impairment test is performed to measure the amount of impairment, if any. In the second step, the fair value of the reporting unit is allocated to the assets and liabilities of the reporting unit as if it had been acquired in a business combination and the purchase price was equivalent to the fair value of the reporting unit. The excess of the fair value of the reporting unit over the amounts assigned to its assets and liabilities is referred to as the implied fair value of goodwill. If the implied fair value of goodwill at the reporting unit level is less than its carrying value, an impairment loss is recorded to the extent that the implied fair value of goodwill at the reporting unit is less than its carrying value. Application of the goodwill impairment test requires judgment, including the identification of reporting units, allocation of assets (including goodwill) and liabilities to reporting units and determining the fair value. The determination of reporting unit fair value relies upon certain estimates and assumptions that are complex and are affected by numerous factors, including the general economic environment and levels E&P activity of oil and gas companies, the Company’s financial performance and trends and the Company’s strategies and business plans, among others.
The Company’s estimates of fair value have been determined at discrete points in time based on relevant information. These estimates involve uncertainty and cannot be determined with precision. There were no significant changes in valuation techniques or related inputs for the years ended December 31, 2017, 2016 and 2015.
The following table presents information about the Company’s assets measured at fair value on a non‑recurring basis for the years ended December 31, 2016 and 2015.
|
|
|
Fair Value |
|
|
|
|
|
|
|||||||
|
|
|
Measurements Using |
|
Carrying |
|
|
|
||||||||
|
|
|
Level 1 |
|
Level 2 |
|
Level 3 |
|
Value(1) |
|
Impairment |
|||||
|
|
|
(in thousands) |
|||||||||||||
|
Year Ended December 31, 2016 |
|
|
|
|
|
|
|
|
|
|
|
|
|
|
|
|
Goodwill |
|
$ |
— |
|
$ |
— |
|
$ |
— |
|
$ |
138,529 |
|
$ |
138,529 |
|
Intangible Assets |
|
|
— |
|
|
— |
|
|
— |
|
|
137 |
|
|
137 |
|
Fixed Assets |
|
|
— |
|
|
— |
|
|
23,188 |
|
|
83,214 |
|
|
60,026 |
|
Year Ended December 31, 2015 |
|
|
|
|
|
|
|
|
|
|
|
|
|
|
|
|
Goodwill |
|
$ |
— |
|
$ |
— |
|
$ |
— |
|
$ |
20,136 |
|
$ |
20,136 |
|
Intangible Assets |
|
|
— |
|
|
— |
|
|
— |
|
|
1,230 |
|
|
1,230 |
|
(1) |
Amount represents carrying value at the date of assessment. |
F-36
Other fair value considerations
The carrying values of the Company’s current financial instruments, which include cash and cash equivalents, accounts receivable trade and accounts payable, approximate their fair value at December 31, 2017 and 2016 due to the short‑term maturity of these instruments. The carrying value of debt as of December 31, 2017 approximates fair value due to variable market rates of interest. The Company had no outstanding debt as of December 31, 2016. The fair value of debt at December 31, 2017, which is a Level 3 measurement, as estimated based on the Company’s incremental borrowing rates for similar types of borrowing arrangements, when quoted market prices were not available. The estimated fair values of the Company’s financial instruments are not necessarily indicative of the amounts that would be realized in a current market exchange. The consideration transferred and the purchase price allocation of identified assets acquired and liabilities assumed related to the Rockwater Merger, GRR Acquisition and Resource Water Acquisition are based on the Company’s estimate of fair value utilizing Level 3 inputs at the date of acquisition. Refer to Note 3 – Acquisitions for further discussion.
NOTE 13—RELATED PARTY TRANSACTIONS
The Company considers its related parties to be those stockholders who are beneficial owners of more than 5.0% of its common stock, executive officers, members of its board of directors or immediate family members of any of the foregoing persons. The Company has entered into a significant number of transactions with related parties. The Company’s board of directors regularly reviews these transactions; however, the Company’s results of operations may have been different if these transactions were conducted with non‑related parties.
During the year ended December 31, 2017, sales to related parties were $9.0 million. Purchases from related party vendors were $10.4 million during the year ended December 31, 2017. These purchases comprised of $3.8 million relating to purchases of property and equipment, $0.3 million relating to inventory and consumables, $2.7 million relating to rent of certain equipment or other services used in operations and $3.6 million relating to management, consulting and other services.
During the year ended December 31, 2016, sales to related parties were $1.2 million. Purchases from related party vendors were $4.3 million during the year ended December 31, 2016. These purchases comprised $1.0 million relating to purchases of property and equipment, $0.2 million relating to inventory and consumables, $1.1 million relating to rent of certain equipment or other services used in operations and $2.0 million relating to management, consulting and other services.
During the year ended December 31, 2015, sales to related parties were $4.1 million. Purchases from related party vendors were $8.6 million during the year ended December 31, 2015. These purchases comprised $4.0 million relating to purchases of property and equipment, $0.9 million relating to inventory and consumables, $1.0 million relating to rent of certain equipment or other services used in operations and $2.7 million relating to management, consulting and other services.
Tax receivable agreements
In connection with the Select 144A Offering, the Company entered into the Tax Receivable with the TRA Holders.
The first of the Tax Receivable Agreements, which the Company entered into with Legacy Owner Holdco and Crestview GP, generally provides for the payment by the Company to such TRA Holders of 85% of the net cash savings, if any, in U.S. federal, state and local income and franchise tax that the Company actually realizes (computed using simplifying assumptions to address the impact of state and local taxes) or is deemed to realize in certain circumstances in periods after the Select 144A Offering as a result of, as applicable to each such TRA Holder, (i) certain increases in tax basis that occur as a result of the Company’s acquisition (or deemed acquisition for U.S. federal income tax purposes) of all or a portion of such TRA Holder’s SES Holdings LLC Units in connection with the Select 144A Offering or pursuant to the exercise of the Exchange Right or the Company’s Call Right and (ii) imputed interest deemed to be paid by the
F-37
Company as a result of, and additional tax basis arising from, any payments the Company makes under such Tax Receivable Agreement.
The second of the Tax Receivable Agreements, which the Company entered into with an affiliate of the Contributing Legacy Owners and Crestview GP, generally provides for the payment by the Company to such TRA Holders of 85% of the net cash savings, if any, in U.S. federal, state and local income and franchise tax that the Company actually realizes (computed using simplifying assumptions to address the impact of state and local taxes) or is deemed to realize in certain circumstances in periods after the Select 144A Offering as a result of, as applicable to each such TRA Holder, (i) any net operating losses available to the Company as a result of certain reorganization transactions entered into in connection with the Select 144A Offering and (ii) imputed interest deemed to be paid by the Company as a result of any payments the Company makes under such Tax Receivable Agreement.
On July 18, 2017, the Company’s board of directors approved amendments to each of the Tax Receivable Agreements revising the definition of a “change of control” for purposes of the Tax Receivable Agreements and acknowledging that the Merger would not result in such a change of control.
See Note 14—Income Taxes for further discussion of amounts recorded in connection with the Select 144A Offering.
NOTE 14—INCOME TAXES
Select Inc. is subject to U.S. federal, foreign and state income taxes as a corporation. SES Holdings and its subsidiaries, with the exception of certain corporate subsidiaries, are treated as flow‑through entities for U.S. federal income tax purposes and as such, are generally not subject to U.S. federal income tax at the entity level. Rather, the tax liability with respect to their taxable income is passed through to their members or partners. Accordingly, prior to the reorganization in connection with the Select 144A Offering, the Predecessor only recorded a provision for Texas franchise tax and U.S. federal and state provisions for certain corporate subsidiaries as the Predecessor’s taxable income or loss was includable in the income tax returns of the individual partners and members. However, for periods following the reorganization in connection with the Select 144A Offering, Select Inc. recognizes a tax liability on its allocable share of SES Holdings’ taxable income.
The Company’s effective tax rates for the twelve months ended December 31, 2017, 2016 and 2015 were 2.4%, 0.2% and (0.4)% respectively. The effective tax rates for the twelve months ended December 31, 2017 differ from the statutory rate of 35% due to net income allocated to noncontrolling interests, state income taxes, other permanent differences between book and tax accounting and valuation allowances.
The Company recorded income tax expense (benefit) of $(0.9) million, $(0.5) and $0.3 million for the twelve months ended December 31, 2017, 2016 and 2015, respectively.
F-38
The components of the federal and state income tax expense (benefit) are summarized as follows:
|
|
|
For the year ended |
|||||||
|
|
|
December 31, |
|||||||
|
|
|
2017 |
|
2016 |
|
2015 |
|||
|
|
|
(in thousands) |
|||||||
|
Current tax (benefit) expense |
|
|
|
|
|
|
|
|
|
|
Federal income tax |
|
$ |
(338) |
|
$ |
— |
|
$ |
341 |
|
State and local income tax |
|
|
(77) |
|
|
275 |
|
|
836 |
|
Foreign income tax |
|
|
— |
|
|
— |
|
|
— |
|
Total current (benefit) expense |
|
|
(415) |
|
|
275 |
|
|
1,177 |
|
Deferred tax (benefit) expense |
|
|
|
|
|
|
|
|
|
|
Federal income tax |
|
|
(422) |
|
|
(841) |
|
|
(785) |
|
State and local income tax |
|
|
(14) |
|
|
42 |
|
|
(68) |
|
Foreign income tax |
|
|
— |
|
|
— |
|
|
— |
|
Total deferred benefit |
|
|
(436) |
|
|
(799) |
|
|
(853) |
|
Total income tax (benefit) provision |
|
$ |
(851) |
|
$ |
(524) |
|
$ |
324 |
|
Tax (benefit) expense attributable to controlling interests |
|
$ |
(405) |
|
$ |
(179) |
|
$ |
324 |
|
Tax benefit attributable to noncontrolling interests |
|
|
(446) |
|
|
(345) |
|
|
— |
|
Total income tax (benefit) provision |
|
$ |
(851) |
|
$ |
(524) |
|
$ |
324 |
A reconciliation of the Company’s provision for income taxes as reported and the amount computed by multiplying income before taxes, less noncontrolling interest, by the U.S. federal statutory rate of 35%:
|
|
|
For the year ended December 31, |
|
|||||
|
|
|
2017 |
|
|
2016 |
|
||
|
|
|
(in thousands) |
|
|||||
|
Provision calculated at federal statutory income tax rate: |
|
|
|
|
|
|
|
|
|
Loss before taxes |
|
$ |
(35,978) |
|
|
$ |
(314,472) |
|
|
Statutory rate |
|
|
35 |
% |
|
|
35 |
% |
|
Income tax benefit computed at statutory rate |
|
|
(12,592) |
|
|
|
(110,065) |
|
|
Less: noncontrolling interests |
|
|
6,409 |
|
|
|
109,230 |
|
|
Income tax benefit attributable to controlling interests |
|
|
(6,183) |
|
|
|
(835) |
|
|
State and local income taxes, net of federal benefit |
|
|
(91) |
|
|
|
317 |
|
|
Change in enacted tax rate |
|
|
39,166 |
|
|
|
— |
|
|
Change in valuation allowance |
|
|
(33,297) |
|
|
|
339 |
|
|
Income tax benefit attributable to controlling interests |
|
|
(405) |
|
|
|
(179) |
|
|
Income tax benefit attributable to noncontrolling interests |
|
|
(446) |
|
|
|
(345) |
|
|
Total income tax benefit |
|
$ |
(851) |
|
|
$ |
(524) |
|
For the year ended December 31, 2015, the calculation is not applicable as the Company was not subject to federal income taxes prior to the Select 144A Offering, with the exception of certain corporate subsidiaries.
Deferred taxes result from the temporary differences between financial reporting carrying amounts and the tax basis of existing assets and liabilities. As of December 31, 2017 and 2016, the Company had net deferred tax liabilities
F-39
of $0.6 million and $0.6 million, respectively, which are recorded in other long‑term liabilities on the consolidated balance sheets. The principal components of the deferred tax assets (liabilities) are summarized as follows:
|
|
|
For the year ended |
||||
|
|
|
December 31, |
||||
|
|
|
2017 |
|
2016 |
||
|
|
|
(in thousands) |
||||
|
Deferred tax assets |
|
|
|
|
|
|
|
Outside basis difference in SES Holdings |
|
$ |
37,931 |
|
$ |
3,601 |
|
Net operating losses |
|
|
35,243 |
|
|
3,999 |
|
Credits and other carryforwards |
|
|
863 |
|
|
297 |
|
Property and equipment |
|
|
— |
|
|
362 |
|
Intangible assets |
|
|
1,218 |
|
|
— |
|
Stock compensation |
|
|
2,557 |
|
|
— |
|
Other |
|
|
1,340 |
|
|
— |
|
Total deferred tax assets before valuation allowance |
|
|
79,152 |
|
|
8,259 |
|
Valuation allowance |
|
|
(75,886) |
|
|
(7,932) |
|
Total deferred tax assets |
|
|
3,266 |
|
|
327 |
|
Deferred tax liabilities |
|
|
|
|
|
|
|
Property and equipment |
|
|
3,286 |
|
|
— |
|
Intangible assets |
|
|
— |
|
|
811 |
|
Other |
|
|
549 |
|
|
113 |
|
Total deferred tax liabilities |
|
|
3,835 |
|
|
924 |
|
Net deferred tax liabilities |
|
$ |
(569) |
|
$ |
(597) |
For the year ended December 31, 2017, the Company has recorded an increase in valuation allowance of $68.0 million against certain deferred tax assets, primarily driven by the Rockwater Merger and thus the creation of additional federal, state, and foreign net operating loss carryforwards as well as adjustments to the outside basis of the investment in SES Holdings. The Company has assessed the future potential to realize these deferred tax assets and has concluded it is more likely than not that these deferred tax assets will not be realized based on current economic conditions and expectations of the future. As a result, the Company has not recorded a liability for the effect of any associated Tax Receivable Agreement liabilities as the liability is based on the actual cash tax savings, which are not considered probable as of December 31, 2017. See Note 13—Related Party Transactions for further discussion of the Tax Receivable Agreements.
The Tax Cuts and Jobs Act, which was enacted on December 22, 2017, reduced the corporate income tax rate effective January 1, 2018 from 35% to 21%. At December 31, 2017, the Company has not completed its accounting for the tax effects of enactment of the Tax Cuts and Jobs Act; however, it has made reasonable estimates of the effects on its existing deferred tax balances. The Company has remeasured certain deferred federal tax assets and liabilities based on the rates at which they are expected to reverse in the future, which is generally 21%. The Company also estimated the impact related to the one time transition tax with respect to certain subsidiaries acquired in the Rockwater Merger. The provisional amount recognized related to the remeasurement of the deferred federal tax balance under the provisions of SAB 118, was reduced due to an offsetting adjustment to the valuation allowance at December 31, 2017. The Company is still analyzing certain aspects of the Tax Cuts and Jobs Act, and refining its calculations, which could potentially affect the measurement of those balances or potentially give rise to new deferred tax amounts. The Company’s estimates may also be affected in the future as the Company gains a more thorough understanding of the Tax Cuts and Jobs Act, and how the individual states are implementing this new law.
The Company has a U.S. federal net operating loss carryforward of $137.8 million which begin to expire in 2030; state net operating loss carryforwards of $101.7 million primarily in North Dakota, Pennsylvania, Oklahoma and Colorado which expire in various years, starting in 2020; and foreign loss carryforwards of $14.5 million, which begin to expire in 2035. The tax benefits of deferred tax assets are recorded as an asset to the extent that management assesses the utilization of such assets to be more likely than not. When the future utilization of some portion of deferred tax assets is determined not to be more likely than not, a valuation allowance is provided to reduce the recorded tax benefits from such assets. As
F-40
of December 31, 2017, management’s assessment as to the realizability of certain deferred tax assets has resulted in the recording of a valuation allowance to reduce deferred tax assets to the amounts that are considered more likely than not to be realized. Management believes there will be sufficient future taxable income based on the reversal of temporary differences to enable utilization or sustainability of those deferred tax assets that do not have a valuation allowance recorded against them.
Accounting for uncertainty in income taxes prescribes a recognition threshold and measurement methodology for the financial statement recognition and measurement of a tax position taken or expected to be taken in a tax return. As of December 31, 2017 and 2016 there was no material liability or expense for the periods then ended recorded for payments of interest and penalties associated with uncertain tax positions or material unrecognized tax positions and the Company’s unrecognized tax benefits were not material.
Separate federal and state income tax returns are filed for Select Inc., SES Holdings and certain consolidated affiliates. The tax years 2014 through 2016 remain open to examination by the major taxing jurisdictions to which the Company is subject to income tax. Select Inc. and SES Holdings are not currently under any income tax audits. Rockwater Energy Solutions, Inc. is currently under federal audit for the tax years 2012-2015.
NOTE 15—NONCONTROLLING INTERESTS
The Company has ownership interests in multiple subsidiaries that are consolidated within the Company’s financial statements but are not wholly owned. During the years ended December 31, 2017, 2016 and 2015, the Company entered into transactions that impacted its ownership interest in certain of these subsidiaries while maintaining control over such subsidiaries. As a result of the Company’s change in ownership interest in these subsidiaries, the Company reduced its noncontrolling interests and recognized an increase in equity related to transactions with holders of noncontrolling interests. The Company reports a noncontrolling interest representing the common units of SES Holdings held by Legacy Owner Holdco. Changes in Select Inc.’s ownership interest in SES Holdings while it retains its controlling interest are accounted for as equity transactions.
F-41
The following table summarizes the effects of changes in noncontrolling interests on equity for the years ended December 31, 2017, 2016 and 2015:
|
|
|
For the year ended December 31, |
|||||||
|
|
|
2017 |
|
2016 |
|
2015 |
|||
|
|
|
(in thousands) |
|||||||
|
Net loss attributable to Select Energy Services, Inc. and its Predecessor |
|
$ |
(16,816) |
|
$ |
(307,524) |
|
$ |
(80,891) |
|
Transfers from noncontrolling interests: |
|
|
|
|
|
|
|
|
|
|
Decrease in additional paid-in capital as a result of the contribution of proceeds from the Select 144A Offering to SES Holdings, LLC in exchange for common units |
|
|
— |
|
|
(218,712) |
|
|
— |
|
Increase in contributed capital due to purchase of noncontrolling interest |
|
|
— |
|
|
707 |
|
|
— |
|
Decrease in additional paid-in capital as a result of the contribution of net assets acquired to SES Holdings, LLC in exchange for common units |
|
|
(4,879) |
|
|
— |
|
|
— |
|
Decrease in additional paid-in capital as a result of the contribution of net assets from the Rockwater Merger to SES Holdings, LLC in exchange for common units |
|
|
(170,276) |
|
|
— |
|
|
— |
|
Decrease in additional paid-in capital as a result of the contribution of proceeds from the IPO to SES Holdings, LLC in exchange for common units |
|
|
(41,135) |
|
|
— |
|
|
— |
|
Increase in additional paid-in capital as a result of the repurchase of common units of SES Holdings, LLC |
|
|
113 |
|
|
— |
|
|
— |
|
Change to equity from net loss attributable to Select Energy Services, Inc. and its Predecessor and transfers from noncontrolling interests |
|
$ |
(232,993) |
|
$ |
(525,529) |
|
$ |
(80,891) |
F-42
NOTE 16—EARNINGS PER SHARE
Earnings per share are based on the amount of income allocated to the shareholders and the weighted‑average number of shares outstanding during the period for each class of common stock. The Company’s outstanding restricted stock and stock options are not included in the calculation of diluted weighted-average shares outstanding for the periods presented as the effect is antidilutive.
Earnings related to periods prior to the reorganization and Select 144A Offering are attributable to the Predecessor. The following table presents the Company’s calculation of basic and diluted earnings per share for the years ended December 31, 2017, 2016 and 2015 (dollars in thousands, except share and per share amounts):
|
|
|
For the year ended December 31, |
|||||||
|
|
|
2017 |
|
2016 |
|
2015 |
|||
|
Net loss |
|
$ |
(35,127) |
|
$ |
(313,948) |
|
$ |
(81,872) |
|
Net loss attributable to Predecessor |
|
|
— |
|
|
306,481 |
|
|
80,891 |
|
Net loss attributable to noncontrolling interests |
|
|
18,311 |
|
|
6,424 |
|
|
981 |
|
Net loss attributable to Select Energy Services, Inc. |
|
$ |
(16,816) |
|
$ |
(1,043) |
|
$ |
— |
|
Allocation of net loss attributable to: |
|
|
|
|
|
|
|
|
|
|
Class A stockholders |
|
$ |
(12,560) |
|
$ |
(199) |
|
|
|
|
Class A-1 stockholders |
|
|
(3,691) |
|
|
(844) |
|
|
|
|
Class A-2 stockholders |
|
|
(565) |
|
|
— |
|
|
|
|
Class B stockholders |
|
|
— |
|
|
— |
|
|
|
|
|
|
$ |
(16,816) |
|
$ |
(1,043) |
|
|
|
|
Weighted average shares outstanding: |
|
|
|
|
|
|
|
|
|
|
Class A-Basic & Diluted |
|
|
24,612,853 |
|
|
3,802,972 |
|
|
|
|
Class A-1-Basic & Diluted |
|
|
7,233,973 |
|
|
16,100,000 |
|
|
|
|
Class A-2-Basic & Diluted |
|
|
1,106,605 |
|
|
— |
|
|
|
|
Class B-Basic & Diluted |
|
|
38,768,156 |
|
|
38,462,541 |
|
|
|
|
Net loss per share attributable to common stockholders: |
|
|
|
|
|
|
|
|
|
|
Class A-Basic & Diluted |
|
$ |
(0.51) |
|
$ |
(0.05) |
|
|
|
|
Class A-1-Basic & Diluted |
|
$ |
(0.51) |
|
$ |
(0.05) |
|
|
|
|
Class A-2-Basic & Diluted |
|
$ |
(0.51) |
|
$ |
— |
|
|
|
|
Class B-Basic & Diluted |
|
$ |
— |
|
$ |
— |
|
|
|
NOTE 17—SEGMENT INFORMATION
Select Inc. is an oilfield services company that provides solutions to the North American onshore oil and natural gas industry. The Company’s services are offered through three operating segments. Operating segments are defined as components of an enterprise for which separate financial information is evaluated regularly by the chief operating decision maker (“CODM”) in deciding how to allocate resources and assess performance. The Company’s chief operating decision maker assesses performance and allocates resources on the basis of the three reportable segments. Corporate and other expenses that do not individually meet the criteria for segment reporting are reported separately as Corporate. Each operating segment reflects a reportable segment led by separate managers that report directly to the Company’s CODM. The Company’s CODM assesses performance and allocates resources on the basis of the following three reportable segments:
Water Solutions—The Water Solutions segment provides water‑related services to customers that include major integrated oil companies and independent oil and natural gas producers. These services include: the sourcing of water; the transfer of the water to the wellsite through permanent pipeline infrastructure and temporary pipe; the containment of fluids off‑ and on‑location; measuring and monitoring of water; the filtering and treatment of fluids, well testing and handling of flowback and produced formation water; and the transportation and recycling or disposal of drilling, completion and production fluids.
F-43
Oilfield Chemicals—The Oilfield Chemicals segment develops, manufactures and provides a full suite of chemicals utilized in hydraulic fracturing, stimulation, cementing and well completions, including polymer slurries, crosslinkers, friction reducers, buffers, breakers and other chemical technologies, to leading pressure pumping service companies in the United States.
Wellsite Services—The Wellsite Completion and Construction Services segment provides oil and natural gas operators with a variety of services, including providing workforce accommodations and surface rental equipment, crane and logistics services, wellsite and pipeline construction and field services. These services are performed to establish, maintain and improve production throughout the productive life of an oil or gas well or to otherwise facilitate other services performed on a well.
Financial information by segment for the years ended December 31, 2017, 2016 and 2015 is as follows:
|
|
|
For the year ended December 31, 2017 |
||||||||||
|
|
|
|
|
|
Income (loss) |
|
Depreciation and |
|
Capital |
|||
|
|
|
Revenue |
|
before taxes |
|
Amortization |
|
Expenditures |
||||
|
|
|
(in thousands) |
||||||||||
|
Water solutions |
|
$ |
528,997 |
|
$ |
17,424 |
|
$ |
82,056 |
|
$ |
87,123 |
|
Oilfield chemicals |
|
|
41,586 |
|
|
663 |
|
|
2,040 |
|
|
3,063 |
|
Wellsite services |
|
|
123,964 |
|
|
(6,527) |
|
|
17,550 |
|
|
18,091 |
|
Eliminations |
|
|
(2,056) |
|
|
— |
|
|
— |
|
|
— |
|
Income from operations |
|
|
|
|
|
11,560 |
|
|
|
|
|
|
|
Corporate |
|
|
— |
|
|
(41,559) |
|
|
1,803 |
|
|
— |
|
Interest expense, net |
|
|
— |
|
|
(6,629) |
|
|
— |
|
|
— |
|
Other income, net |
|
|
— |
|
|
650 |
|
|
— |
|
|
— |
|
|
|
$ |
692,491 |
|
$ |
(35,978) |
|
$ |
103,449 |
|
$ |
108,277 |
|
|
|
For the year ended December 31, 2016 |
||||||||||
|
|
|
|
|
|
Income (loss) |
|
Depreciation and |
|
Capital |
|||
|
|
|
Revenue |
|
before taxes |
|
Amortization |
|
Expenditures |
||||
|
|
|
(in thousands) |
||||||||||
|
Water solutions |
|
$ |
241,766 |
|
$ |
(282,019) |
|
$ |
81,051 |
|
$ |
34,458 |
|
Oilfield chemicals |
|
|
— |
|
|
— |
|
|
— |
|
|
— |
|
Wellsite services |
|
|
61,461 |
|
|
(15,038) |
|
|
16,056 |
|
|
1,868 |
|
Eliminations |
|
|
(828) |
|
|
— |
|
|
— |
|
|
— |
|
Loss from operations |
|
|
|
|
|
(297,057) |
|
|
|
|
|
|
|
Corporate |
|
|
— |
|
|
(1,916) |
|
|
— |
|
|
— |
|
Interest expense, net |
|
|
— |
|
|
(16,128) |
|
|
— |
|
|
— |
|
Other income, net |
|
|
— |
|
|
629 |
|
|
— |
|
|
— |
|
|
|
$ |
302,399 |
|
$ |
(314,472) |
|
$ |
97,107 |
|
$ |
36,326 |
|
|
|
For the year ended December 31, 2015 |
||||||||||
|
|
|
|
|
|
Income (loss) |
|
Depreciation and |
|
Capital |
|||
|
|
|
Revenue |
|
before taxes |
|
Amortization |
|
Expenditures |
||||
|
|
|
(in thousands) |
||||||||||
|
Water solutions |
|
$ |
427,592 |
|
$ |
(52,757) |
|
$ |
89,271 |
|
$ |
34,724 |
|
Oilfield chemicals |
|
|
— |
|
|
— |
|
|
— |
|
|
— |
|
Wellsite services |
|
|
109,976 |
|
|
(3,489) |
|
|
18,177 |
|
|
13,962 |
|
Eliminations |
|
|
(1,991) |
|
|
— |
|
|
— |
|
|
— |
|
Loss from operations |
|
|
|
|
|
(56,246) |
|
|
|
|
|
|
|
Corporate |
|
|
— |
|
|
(12,527) |
|
|
264 |
|
|
— |
|
Interest expense, net |
|
|
— |
|
|
(13,689) |
|
|
— |
|
|
— |
|
Other income, net |
|
|
— |
|
|
893 |
|
|
— |
|
|
— |
|
|
|
$ |
535,577 |
|
$ |
(81,569) |
|
$ |
107,712 |
|
$ |
48,686 |
F-44
Total assets by segment as of December 31, 2017 and 2016 is as follows:
|
|
|
As of December 31, |
||||
|
|
|
2017 |
|
2016 |
||
|
|
|
(in thousands) |
||||
|
Water solutions |
|
$ |
994,159 |
|
$ |
324,171 |
|
Oilfield chemicals |
|
|
186,333 |
|
|
— |
|
Wellsite services |
|
|
151,272 |
|
|
68,868 |
|
Corporate |
|
|
24,604 |
|
|
12,027 |
|
|
|
$ |
1,356,368 |
|
$ |
405,066 |
Revenue by groups of similar products and services are as follows:
|
|
|
For the year ended December 31, |
|||||||
|
|
|
2017 |
|
2016 |
|
2015 |
|||
|
|
|
(in thousands) |
|||||||
|
Water sourcing and transfer(1) |
|
$ |
371,352 |
|
$ |
144,659 |
|
$ |
230,354 |
|
Well testing and flowback |
|
|
90,075 |
|
|
37,582 |
|
|
75,820 |
|
Fluid hauling and disposal |
|
|
84,616 |
|
|
59,214 |
|
|
121,322 |
|
Oilfield chemicals(2) |
|
|
41,586 |
|
|
— |
|
|
— |
|
Accommodations and rentals |
|
|
53,888 |
|
|
27,151 |
|
|
52,948 |
|
Wellsite completion and construction services |
|
|
50,974 |
|
|
33,793 |
|
|
55,133 |
|
|
|
$ |
692,491 |
|
$ |
302,399 |
|
$ |
535,577 |
|
(1) |
Includes water sourcing, water transfer, containment, water monitoring and water treatment and recycling services. |
|
(2) |
Includes completion, production and specialty chemicals. |
The Company attributes revenue to the United States and Canada based on the location where services are performed or the destination of the products or equipment sold or rented. Long-lived assets consist of property and equipment and are attributed to the United States and Canada based on the physical location of the asset at the end of the period. The Company’s revenue attributed to the United States was $680.9 million or 98.3% of total revenue. The Company’s revenue attributed to Canada was $11.6 million or 1.7% of total revenue. The Company’s net long-lived assets attributed to the United States was $451.7 million or 95.3% of total net long-lived assets. The Company’s net long-lived assets attributed to Canada was $22.4 million or 4.7% of total net long-lived assets.
F-45
NOTE 18—QUARTERLY RESULTS OF OPERATIONS (UNAUDITED)
|
|
|
2017 |
||||||||||
|
|
|
First |
|
Second |
|
Third |
|
Fourth |
||||
|
|
|
Quarter |
|
Quarter |
|
Quarter |
|
Quarter |
||||
|
|
|
(in thousands) |
||||||||||
|
Revenue |
|
$ |
99,925 |
|
$ |
134,449 |
|
$ |
153,880 |
|
$ |
304,237 |
|
Gross profit (loss) |
|
|
(242) |
|
|
12,254 |
|
|
19,509 |
|
|
26,259 |
|
Income (loss) from operations |
|
|
(12,508) |
|
|
(11,909) |
|
|
2,457 |
|
|
(8,039) |
|
Net income (loss) |
|
|
(12,280) |
|
|
(10,490) |
|
|
2,593 |
|
|
(14,950) |
|
Net income (loss) attributable to Select Energy Services, Inc. |
|
|
(4,172) |
|
|
(4,216) |
|
|
1,224 |
|
|
(9,652) |
|
Net income (loss) per share attributable to common stockholders: |
|
|
|
|
|
|
|
|
|
|
|
|
|
Class A-Basic & Diluted |
|
$ |
(0.21) |
|
$ |
(0.16) |
|
$ |
0.04 |
|
$ |
(0.18) |
|
Class A-1-Basic & Diluted |
|
$ |
(0.21) |
|
$ |
(0.16) |
|
$ |
— |
|
$ |
— |
|
Class A-2-Basic & Diluted |
|
$ |
— |
|
$ |
— |
|
$ |
— |
|
$ |
(0.18) |
|
Class B-Basic & Diluted |
|
$ |
— |
|
$ |
— |
|
$ |
— |
|
$ |
— |
|
|
|
2016 |
||||||||||
|
|
|
First |
|
Second |
|
Third |
|
Fourth |
||||
|
|
|
Quarter |
|
Quarter |
|
Quarter |
|
Quarter |
||||
|
|
|
(in thousands) |
||||||||||
|
Revenue |
|
$ |
78,839 |
|
$ |
62,919 |
|
$ |
73,907 |
|
$ |
86,734 |
|
Gross loss |
|
|
(11,937) |
|
|
(17,299) |
|
|
(8,970) |
|
|
(5,922) |
|
Loss from operations |
|
|
(21,551) |
|
|
(224,822) |
|
|
(31,266) |
|
|
(21,334) |
|
Net loss |
|
|
(25,793) |
|
|
(228,238) |
|
|
(35,204) |
|
|
(24,713) |
|
Net loss attributable to Select Energy Services, Inc.(1) |
|
|
— |
|
|
— |
|
|
— |
|
|
(1,043) |
|
Net loss per share attributable to common stockholders(1): |
|
|
|
|
|
|
|
|
|
|
|
|
|
Class A-Basic & Diluted |
|
$ |
— |
|
$ |
— |
|
$ |
— |
|
$ |
(0.05) |
|
Class A-1-Basic & Diluted |
|
$ |
— |
|
$ |
— |
|
$ |
— |
|
$ |
(0.05) |
|
Class B-Basic & Diluted |
|
$ |
— |
|
$ |
— |
|
$ |
— |
|
$ |
— |
|
(1) |
Earnings related to periods prior to the Select 144A Offering and the related reorganization are attributable to the Company’s predecessor. There is no income allocated to the Company and no earnings per share information prior to the reorganization related to the Select 144A Offering. |
NOTE 19—SUBSEQUENT EVENTS
On January 24, 2018, the Company pursuant to the Rockwater Registration Rights Agreement, filed with the SEC a shelf registration statement registering for resale 6,721,294 shares of Class A Common Stock into which the outstanding shares of Class A-2 Common Stock are convertible. At the effective time of the Rockwater Merger each share of Rockwater Class A-1 common stock, $0.01 par value per share, then outstanding was converted into the right to receive a number of shares of the Company’s Class A-2 Common Stock equal to the exchange ratio. Upon the effectiveness of the registration statement, each share of Class A-2 Common Stock will convert automatically into a share of Class A Common Stock on a one-for-one basis and no shares of Class A-2 Common Stock will be outstanding.
F-46